Article

Detecting Glacier Dynamics During 2016–2024 Using Planet Imagery in the Upper Zarafshon River Basin, Tajikistan


1
Key Laboratory of Ecological Safety and Sustainable Development in Arid Lands, Xinjiang Institute of Ecology and Geography, Chinese Academy of Sciences, Urumqi 830011, China
2
University of Chinese Academy of Sciences, Beijing 100049, China
3
State Scientific Institution “Center for the Study of Glaciers of the National Academy of Sciences of Tajikistan”, Dushanbe 734025, Tajikistan
4
Research Center for Ecology and Environment of Central Asia, Dushanbe 734063, Tajikistan
*
Author to whom correspondence should be addressed.
Remote Sens. 2026, 18(9), 1293; https://doi.org/10.3390/rs18091293
Submission received: 2 April 2026 / Revised: 20 April 2026 / Accepted: 21 April 2026 / Published: 24 April 2026

Highlights

What are the main findings?
  • We present a morphological marker-tracking approach using high-resolution PlanetScope and Gaofen-2 imagery to quantify glacier surface velocity and supraglacial lake evolution on debris-covered glaciers.
  • We provide an integrated assessment (2016–2024) of glacier retreat, heterogeneous surface displacement (119–614 m), and supraglacial lake expansion (~88,000 to ~150,000 m2) in the Upper Zarafshon River Basin.
What are the implications of the main findings?
  • The proposed methodology enables detailed monitoring of debris-covered glaciers and supraglacial lakes in Tajikistan.
  • The observed glacier retreat and lake expansion are associated with recent regional warming and precipitation variability and may influence downstream hydrological regimes.

Abstract

The Upper Zarafshon River Basin (UZRB) in Tajikistan hosts numerous glaciers, of which the Zarafshon glacier is the largest and most important source of meltwater for both Tajikistan and Uzbekistan. In this study, we analyzed glacier retreat, surface displacement, and the evolution of supraglacial features from 2016 to 2024 using multi-temporal, high-resolution satellite imagery from Gaofen-2 and PlanetScope (80 cm and 3 m spatial resolution). We selected five representative glaciers-№ 168, 178, 185, 202, and 203 based on their size (greater than 1 km2) and hydrological significance. Our comprehensive investigation of the glaciers in 2024 includes data on glacier area, length, supraglacial lakes, and morphological classification. The results show a decrease in total glacier area from 254.1 km2 in 2016 to 252.8 km2 in 2024. Surface movement patterns, derived from visual and geomorphological assessments, reveal spatially heterogeneous displacement, especially in debris-covered areas. Supraglacial lakes and ponds showed dynamic changes, with the most significant expansion in 2022, driven by increased surface melt and subglacial hydrological reorganization. These findings highlight the need for ongoing glacier monitoring in the Zarafshon River Basin (ZRB) due to the significant implications that cryospheric changes hold for regional hydrology, water security, and the frequency of climate-induced natural hazards.

1. Introduction

Glaciers serve as sensitive indicators of climate change, and their variations provide significant evidence of both regional and global environmental transformations [1,2]. In Central Asia (CA), glaciers are essential solid reservoirs that help regulate seasonal river runoff, supporting agriculture, hydropower, and local communities, especially during the arid summer months when meltwater is crucial for maintaining river discharge [3]. The Upper Zarafshon River Basin (UZRB), situated in the Pamir-Alay mountain system of northwestern Tajikistan, is an important glacierized catchment that supplies water to downstream regions of Tajikistan and Uzbekistan. However, like many Central Asian mountain ranges, this basin has experienced significant glacier retreat over recent decades due to rising air temperatures and changes in precipitation patterns. The reduction in glacier extent and mass has significant implications for water security, geomorphological processes, and natural hazards in the region [4,5]. Beyond the glacier retreat, glaciers are undergoing notable changes in surface dynamics and supraglacial morphology. Features such as debris cover, supraglacial lakes, meltwater channels, and crevasses are becoming more prevalent, significantly influencing the glacier surface energy balance, melt rates, and ice flow velocity [6,7]. Therefore, monitoring these supraglacial features, along with measurements of glacier retreat and surface movement, is essential for understanding the mechanisms behind glacier changes and predicting their hydrological consequences.
As one of the most vital transboundary rivers in Central Asia, the Zarafshon River is predominantly fed by snow and glacier melt, and contributes the majority of its flow to downstream agricultural water resources in Uzbekistan [8]. The Zarafshon glacier is the source of the Zarafshon River, and the USSR glacier inventory lists 1272 glaciers covering 132.6 km2, many of which are small and climatically sensitive [9]. More recent observations indicate significant shrinkage, affecting not only water availability but also the timing and magnitude of river discharge [10]. However, detailed investigations of individual glacier dynamics, particularly those related to surface displacement and supraglacial processes, remain limited [11]. Such processes, including supraglacial lake formation and the expansion of debris cover, have become increasingly relevant indicators of glacier instability and intensified surface melting in the alpine regions of Tajikistan [12,13].
Currently, numerous remote sensing techniques are applied to derive glacier surface velocities at regional to global scales. The use of satellite imagery to measure glacier velocity began in the 1980s with the manual identification of persistent surface features (e.g., crevasses) displaced between pairs of satellite images [14,15]. By the 1990s, template-matching algorithms (i.e., normalized cross-correlation) were developed to systematically measure displacement fields from image pairs for investigations of glacier flow [16,17]. This progress led to the development of several open-source software packages for feature tracking, including COSI-Corr (Co-registration of Optically Sensed Images and Correlation) [18,19,20], which is also incorporated as an add-on module in ENVI. Other widely applied approaches include Differential Interferometry of Synthetic Aperture Radar (D-InSAR) imagery [21], D-InSAR feature-tracking techniques [22], MATLAB-based ImGRAFT [23], Python-based PyCorr [19], and Glacier Image Velocimetry (GIV) [24]. In addition, stake deployment on glacier surfaces is commonly used in glaciological studies, as it enables monitoring of ice flow across defined transects [25,26,27]. More recently, the autonomous Repeat Image Feature Tracking (autoRIFT) package [20,28] has been used to generate the ITS_LIVE dataset described in this paper. After decades of algorithm development and remote sensing data acquisition, several significant efforts have produced large-scale ice velocity mosaics, enabling a new wave of advances in glaciological observation and modeling [29].
The primary objective of this study is to advance the scientific understanding of glacier dynamics in the UZRB through a comprehensive multi-temporal analysis spanning 2016–2024. Specifically, we aim to: (1) compile a detailed 2024 glacier inventory that includes topographic parameters and supraglacial debris characteristics; (2) quantify spatiotemporal changes in glacier area and length across seven hydrologically significant glaciers; and (3) assess the evolution of supraglacial features, including lakes and debris-covered zones, in relation to climatic variability. By integrating multi-source remote sensing data with in-depth glaciological analysis, this study provides critical insights into the ongoing cryospheric transformations within a climatically sensitive mountain basin. Ultimately, the findings aim to inform sustainable water resource management and climate adaptation strategies across Central Asia’s high-mountain regions.

2. Study Area

We selected the Upper Zarafshon River Basin (UZRB) as the study area (Figure 1c). The Zarafshon River Basin within Tajikistan covers approximately 12,000 km2 [30], which originates from the Zarafshon Glacier at the junction of the Turkestan and Zarafshon mountain ranges and flows westward for about 300 km [31]. The UZRB is located in the narrow mountain valleys carved through the western Pamir-Alay ranges. The study area has a continental semi-arid climate, with hot-dry summers in the lower valleys and cold conditions in the upper mountainous regions. From 1944 to 2024, the study area exhibits a mean annual air temperature of 4.5 °C and an average annual precipitation of approximately 329.7 mm. Precipitation is strongly seasonal, with a pronounced maximum in May (58 mm) and an extreme minimum in January (~11.1 mm). July and August are the warmest months, with a mean temperature of 15.1 °C, whereas January is the coldest, averaging −6.9 °C. Most precipitation falls as snow during winter and spring, sustaining accumulation zones, while rapid summer warming intensifies ablation, especially over debris-covered glacier tongues and lower-elevation sectors [32].
The glaciated terrain is marked by steep relief and a continental climate, with elevations ranging from 2750 m to >5000 meter above sea level (m.a.s.l). Firn lines typically lie between 3800 m and 4300 m, contributing to glaciers’ high sensitivity to temperature increases, as many ice bodies lie below the equilibrium line altitude. Glaciers are primarily concentrated in two major sub-basins: Mastchoh and Fonyaghnob. This study focuses on the Mastchoh sub-basin, which contains the region’s largest and most dynamic glacier system, including the main Zarafshon glacier.

3. Data Source

Remote Sensing and Auxiliary Data

To capture spatial and temporal variability in glacier extent and supraglacial features, this study integrates high-resolution satellite imagery and digital elevation datasets. PlanetScope imagery with a spatial resolution of 3 m and Gaofen-2 (GF-2) multispectral data provide sub-meter to 0.80 m spatial resolution (Table 1). Cloud-free late-summer scenes from 2016 to 2024 were systematically selected to minimize snow interference. Additionally, glacier surface velocity was obtained from the Inter-Mission Time Series of Land Ice Velocity and Elevation (ITS_LIVE) dataset (https://nsidc.org/apps/itslive/; accessed on 10 January 2025). ITS_LIVE provides spatially distributed annual glacier velocity fields derived from Landsat 5-9 and Sentinel-1/2 imagery using automated feature-tracking algorithms. In this study, ITS_LIVE velocity fields for 2018 were extracted for the investigated glacier and used as an independent reference dataset to evaluate the reliability and physical consistency of the displacement patterns derived from PlanetScope-based morphological tracking. These datasets enable precise delineation of glacier boundaries, supraglacial debris, and meltwater features, forming the basis for multi-temporal analysis of glacier change [33]. Reference points (RPs) were extracted from GF-2 images at 0.80 m resolution using ArcGIS Pro (v. 3.4.0). Selecting RPs proved challenging due to potential landscape changes over time, as discussed in [34]. Rock outcrops proved reliable RPs, providing stable and clearly identifiable reference features. Initially relying on 3-4 RPs, we iteratively refined the georeferencing process by identifying additional RPs, thereby reducing error [35].
Topographic characterization relied on multiple Digital Elevation Model (DEM) sources. The ALOS (Advanced Land Observing Satellite) PALSAR (Phased Array type L-band SAR) data (https://www.eorc.jaxa.jp/ALOS/en/aw3d30/index.htm, accessed on 20 October 2025) provide high-accuracy elevation, slope, and aspect for detailed surface morphology and flow dynamics analyses, distributed by the Consortium for Spatial Information (CSI) of the Consultative Group on International Agricultural Research (CGIAR) [36]; https://search.asf.alaska.edu/, accessed on 13 September 2025, offers a broader basin-scale context. These DEMs are essential for quantifying glacier surface gradients, assessing controls on mass balance, and interpreting supraglacial processes.
Historical glacier outlines and classifications were obtained from the Randolph Glacier Inventory (RGI v6.0, https://www.glims.org/RGI/, accessed on 27 June 2025) and the USSR Glacier Inventory (1982) [9], providing baseline datasets for multi-temporal comparisons. We obtained glacier characteristics in the study area from PlanetScope imagery and ALOS/PALSAR elevation data, and manually digitized glacier outlines and areas in ArcGIS. This dataset enabled precise mapping of glacier boundaries and accurate measurement of glacier extent, supporting thorough assessments of glacier evolution and supraglacial dynamics over time.
Long-term meteorological observations were acquired from the Dehavz meteorological station (70°11′40.35″E, 39°26′51.32″N), provided by the Agency for Hydrometeorology of the Committee for Environmental Protection under the Government of the Republic of Tajikistan (https://meteo.tj/en, accessed on 5 August 2025). Records from 1944 to 2024 include monthly and annual mean temperature and precipitation.

4. Methodology

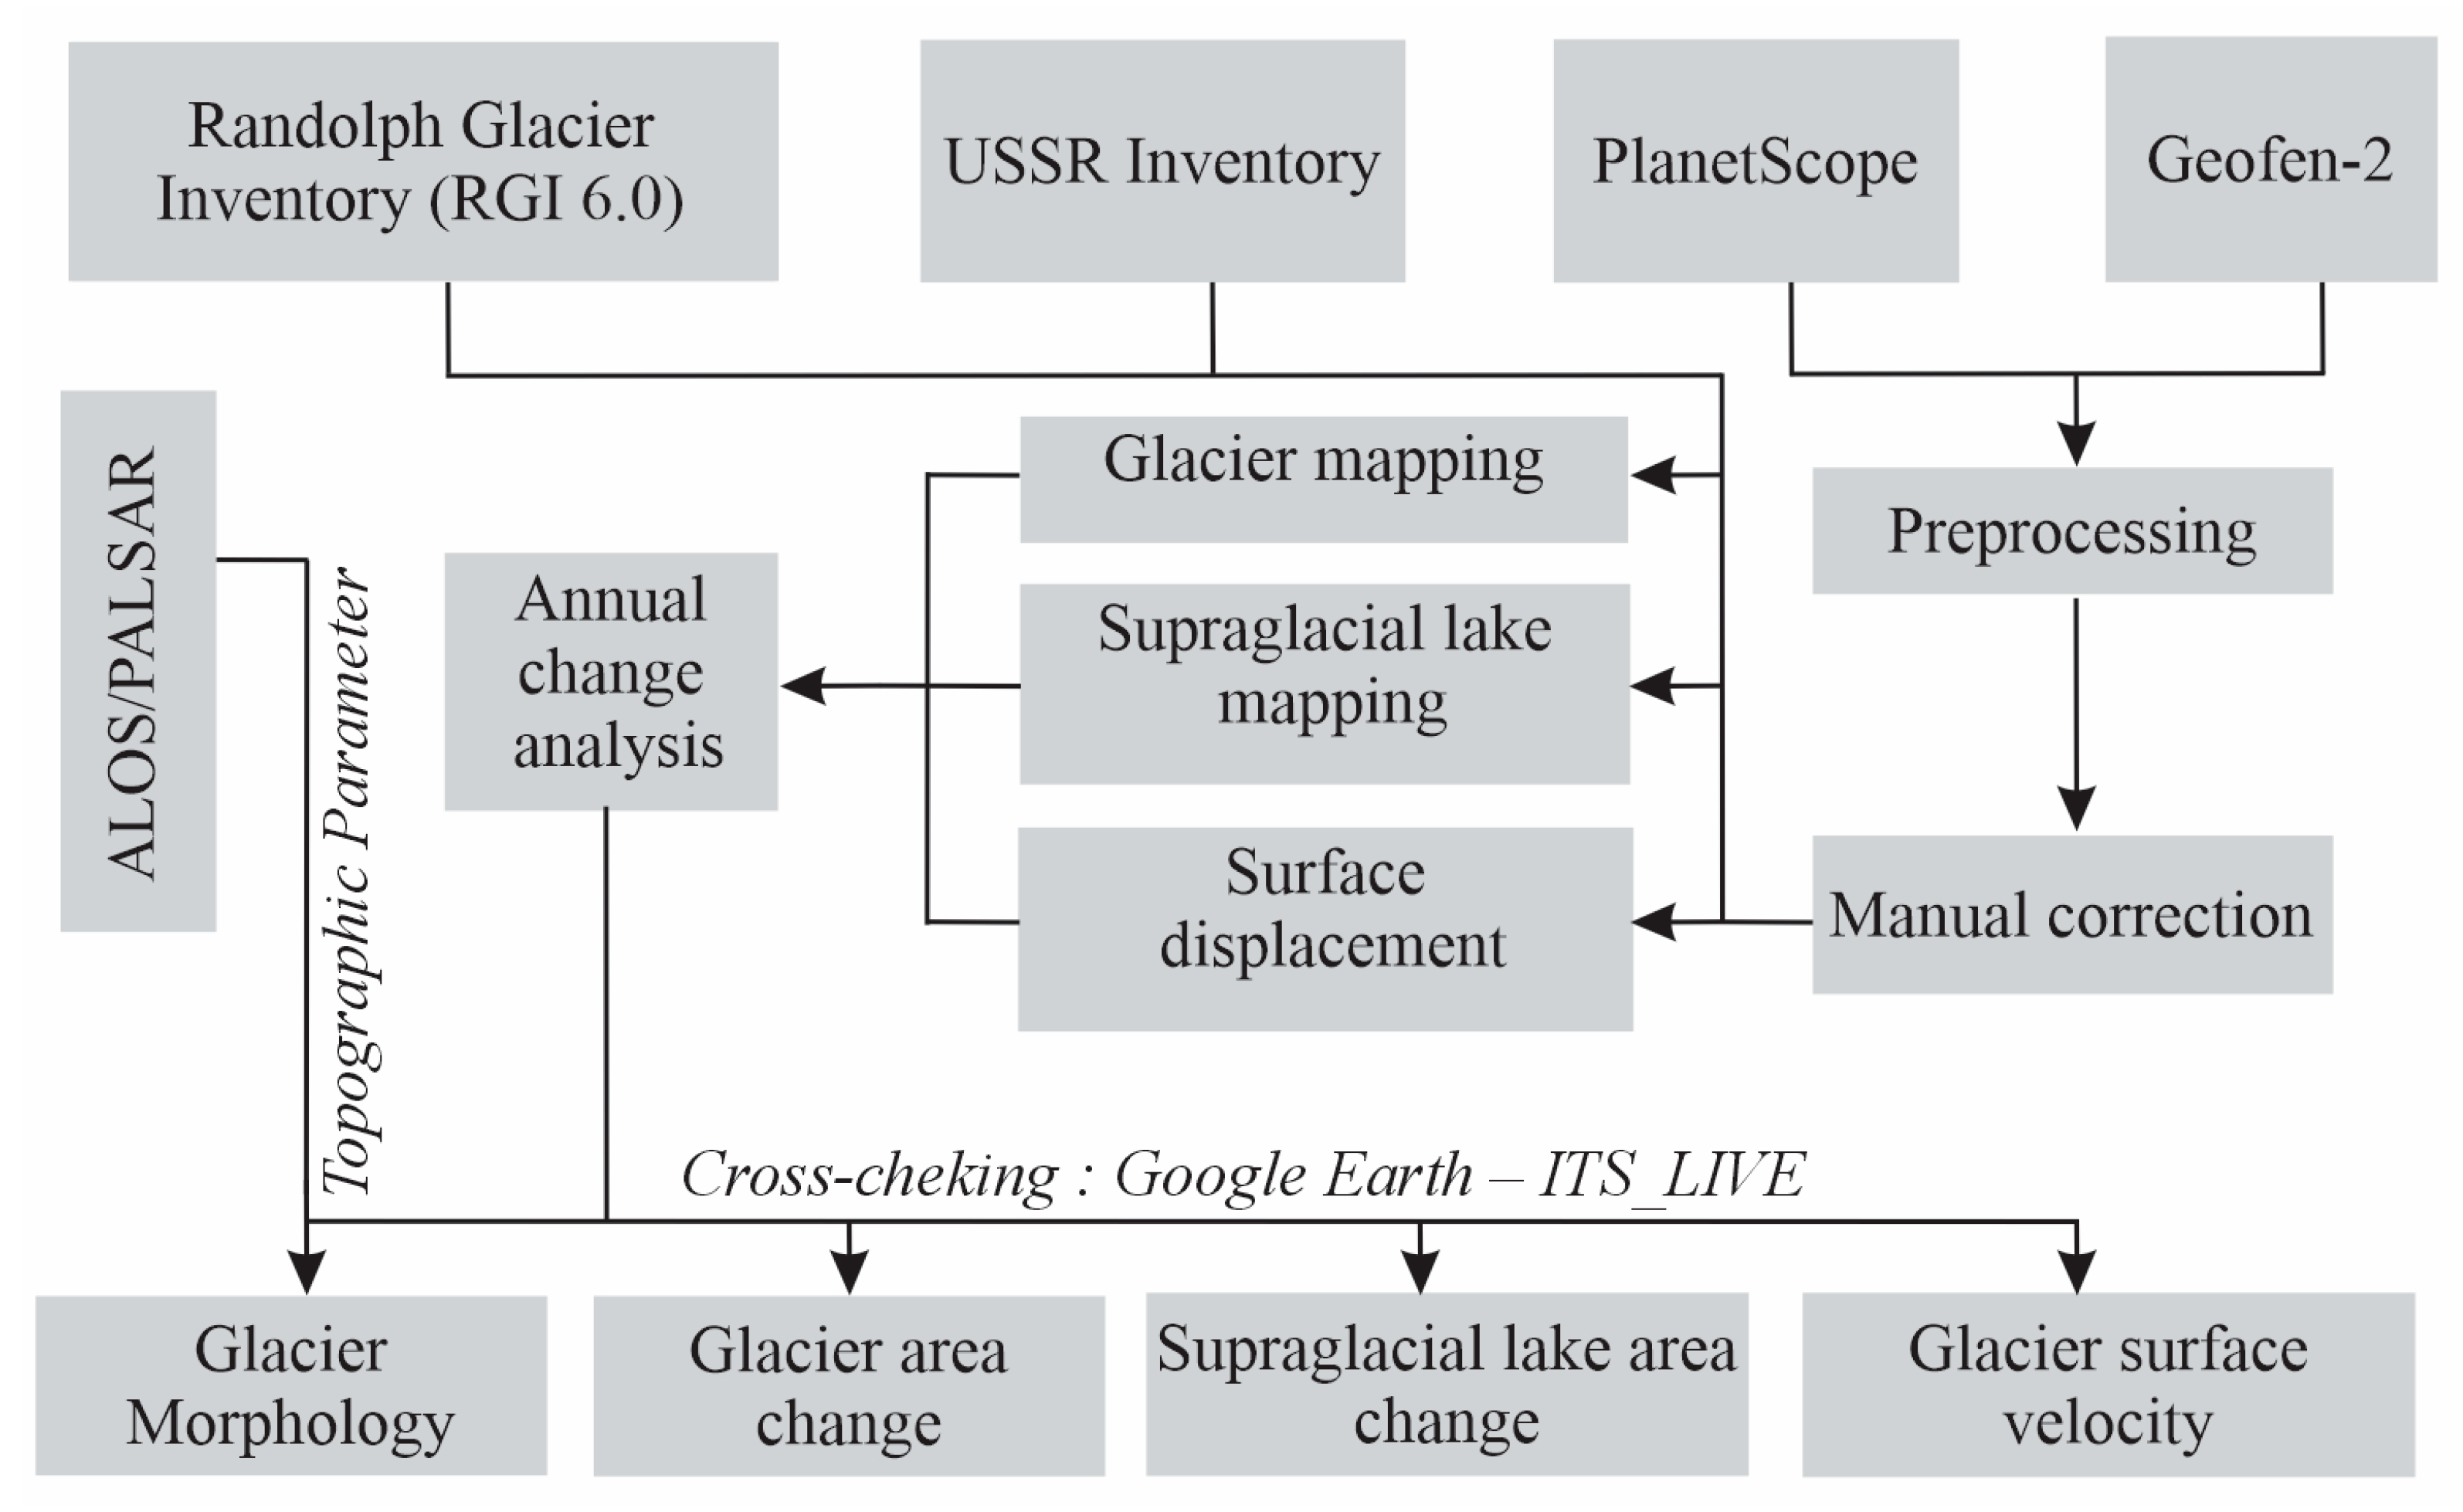
The methodological framework of this study comprised four main components: (1) delineation and refinement of glacier outlines from co-registered high-resolution optical imagery; (2) estimation of glacier surface displacement and annual velocity by tracking persistent supraglacial markers; (3) extraction of supraglacial lakes and analysis of their centroid displacement; and (4) statistical analysis of glacier changes in relation to climatic variability. We further evaluated the reliability of the derived results through uncertainty assessment and validation using independent reference data (Figure 2).

4.1. Glacier Outline Delineation

Glacier areas were delineated manually in ArcGIS through visual interpretation of high-resolution satellite imagery, with sequential image comparisons to improve identification of glacier margins in debris-covered and shadowed areas. Glacier boundaries within the river basin were refined using visualization techniques, including false-color composites (NIR-Red-Green), to better distinguish between glacier ice, debris-covered ice, and supraglacial lakes. Additionally, hillshade models derived from digital elevation models (DEMs), enhanced visual interpretation, facilitating identification of glacier margins in areas with complex topography and shadow effects [37]. As inventory-based or automated delineation methods may introduce uncertainties in areas characterized by debris cover, complex surface morphology, and terrain-induced shadows [38,39,40], manual refinement of glacier outlines was performed based on observable surface features to improve the representation of glacier margins.
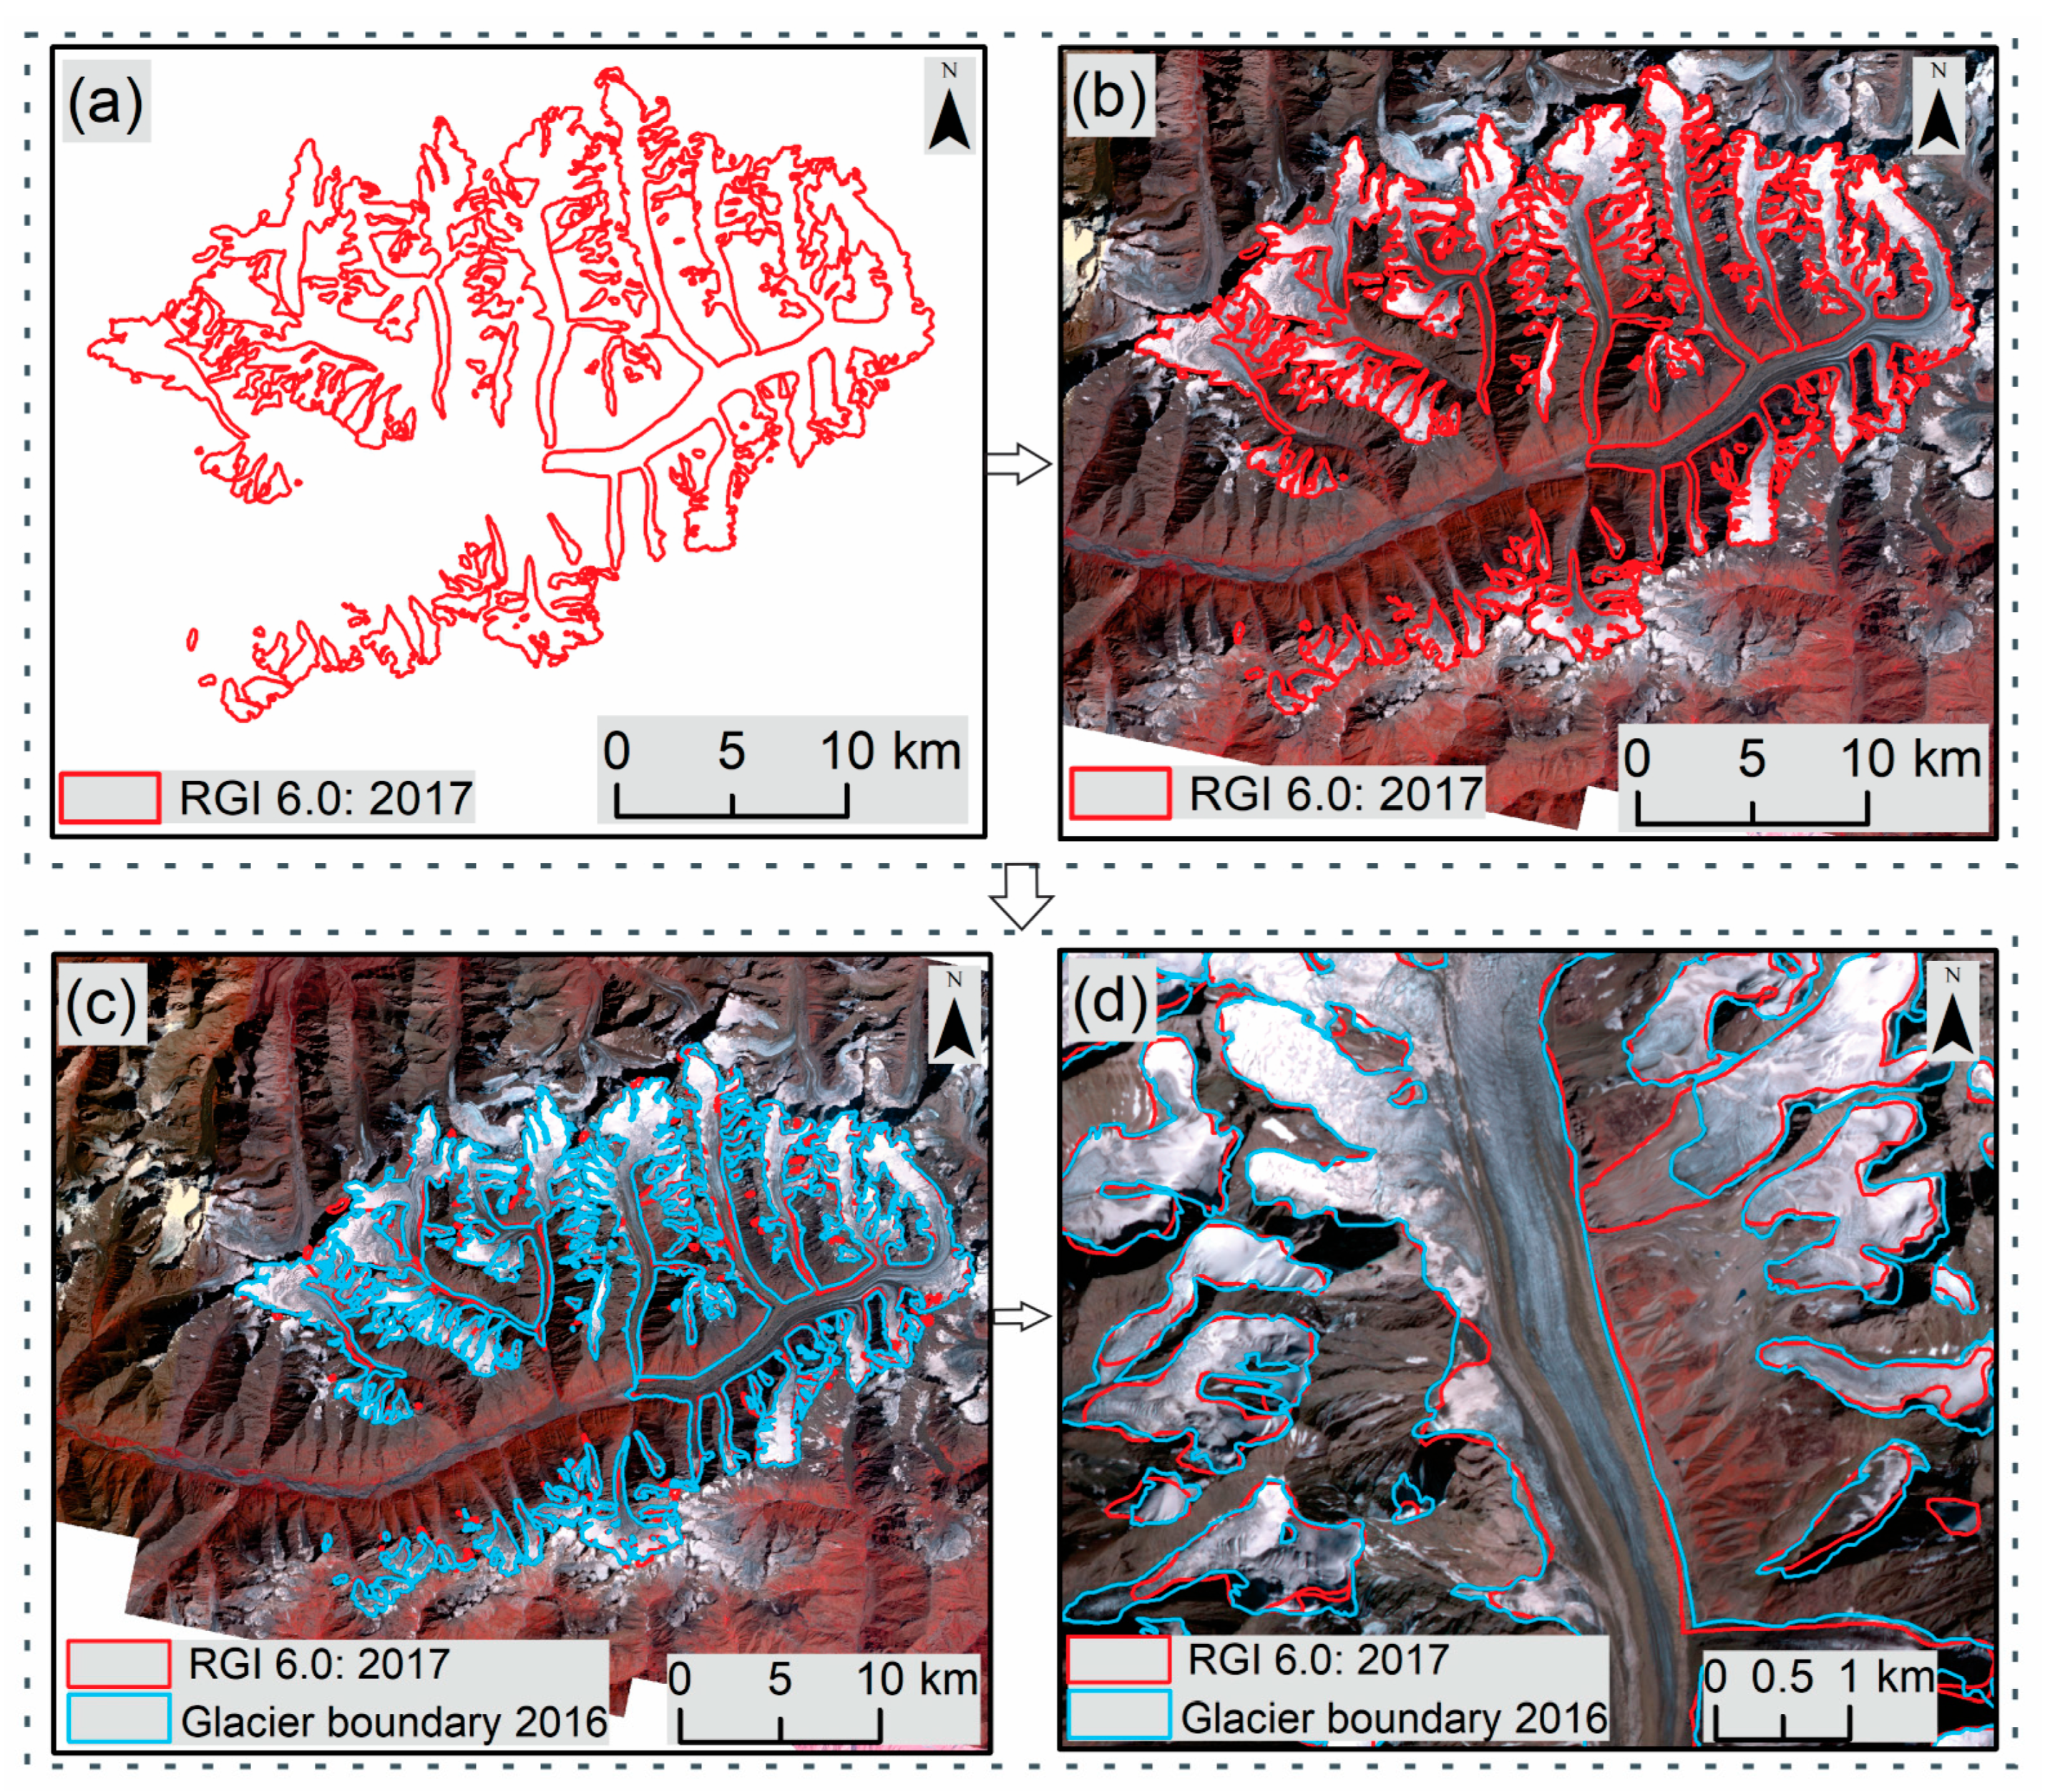
Glacier outlines from the RGI served as the initial baseline boundaries for the study area (Figure 3). These outlines provided a reliable reference for determining glacier extent and identifying glacierized regions in the satellite imagery. Subsequently, the RGI-derived boundaries were refined through manual delineation based on visual interpretation of high-resolution PlanetScope imagery. To identify individual glaciers, we extracted the glacier inventory IDs (identification numbers) from the USSR Glacier Inventory (1982) [9]. These IDs were then used, together with geomorphic characteristics, to separate the mapped glacier extents derived from PlanetScope imagery and the RGI individual glacier units.
To account for potential mapping uncertainties, positional and areal errors associated with the manually corrected glacier boundaries were estimated using a half-pixel error approach based on the satellite imagery’s spatial resolution [41,42]. In addition, the refined glacier outlines were visually cross-checked against Google Earth imagery to ensure spatial consistency and the reliability of the final glacier delineation [39,43].

4.2. Glacier Surface Velocity Estimation

Glacier surface velocity on the debris-covered Zarafshon Glacier was quantified using a morphological marker-tracking approach applied to high-resolution PlanetScope and Gaofen-2 imagery. Stable supraglacial features, including persistent supraglacial lakes and ponds, debris bands, large boulders, moraine ridges, and long-lived crevasse clusters, were manually identified and tracked across successive annual images, following established approaches [44,45,46]. Only features that remained clearly identifiable, morphologically stable, and spatially consistent between image pairs were selected. To ensure reliable tracking, we excluded features influenced by seasonal snow cover, shadows, deformation, or glacier loss from the analysis reliability. This approach is particularly suitable for debris-covered glaciers, where conventional automated feature-tracking methods are limited by surface heterogeneity. The applied morphological marker-tracking approach represents a semi-manual adaptation of classical feature-tracking techniques, specifically designed for debris-covered glacier surfaces where automated correlation-based methods are often unreliable due to low texture contrast and surface heterogeneity. The methodological framework explicitly links feature displacement measurements to glacier kinematics, enabling quantitative estimates of surface velocity under debris-covered conditions where conventional correlation-based methods are less effective.
Surface displacement (D) was calculated as the horizontal Euclidean distance between the positions of the same marker identified in two co-registered PlanetScope images:
D   =   x 2   x 1 2 +   y 2   y 1 2
where (x1, y1) and (x2, y2) are the coordinates of the same marker in the first and second images, respectively. D represents the total horizontal displacement of the marker along the glacier surface. Glacier surface velocity (V) was then derived as:
V = D Δ t 365
where Δt is expressed in days, and the factor 365 converts the displacement rate to annual velocity (m yr−1) [47]. This approach assumes predominantly horizontal glacier motion, while vertical displacement is considered negligible over the annual observation interval.
All images were co-registered using stable reference points located on non-glacierized terrain, primarily bedrock outcrops, to minimize geometric distortions. Residual misregistration is expected to be within one pixel (~3 m), corresponding to the spatial resolution of PlanetScope imagery. This positional uncertainty propagates into the displacement measurements and may introduce velocity uncertainties of ~1 m yr−1, depending on the temporal interval between observations.
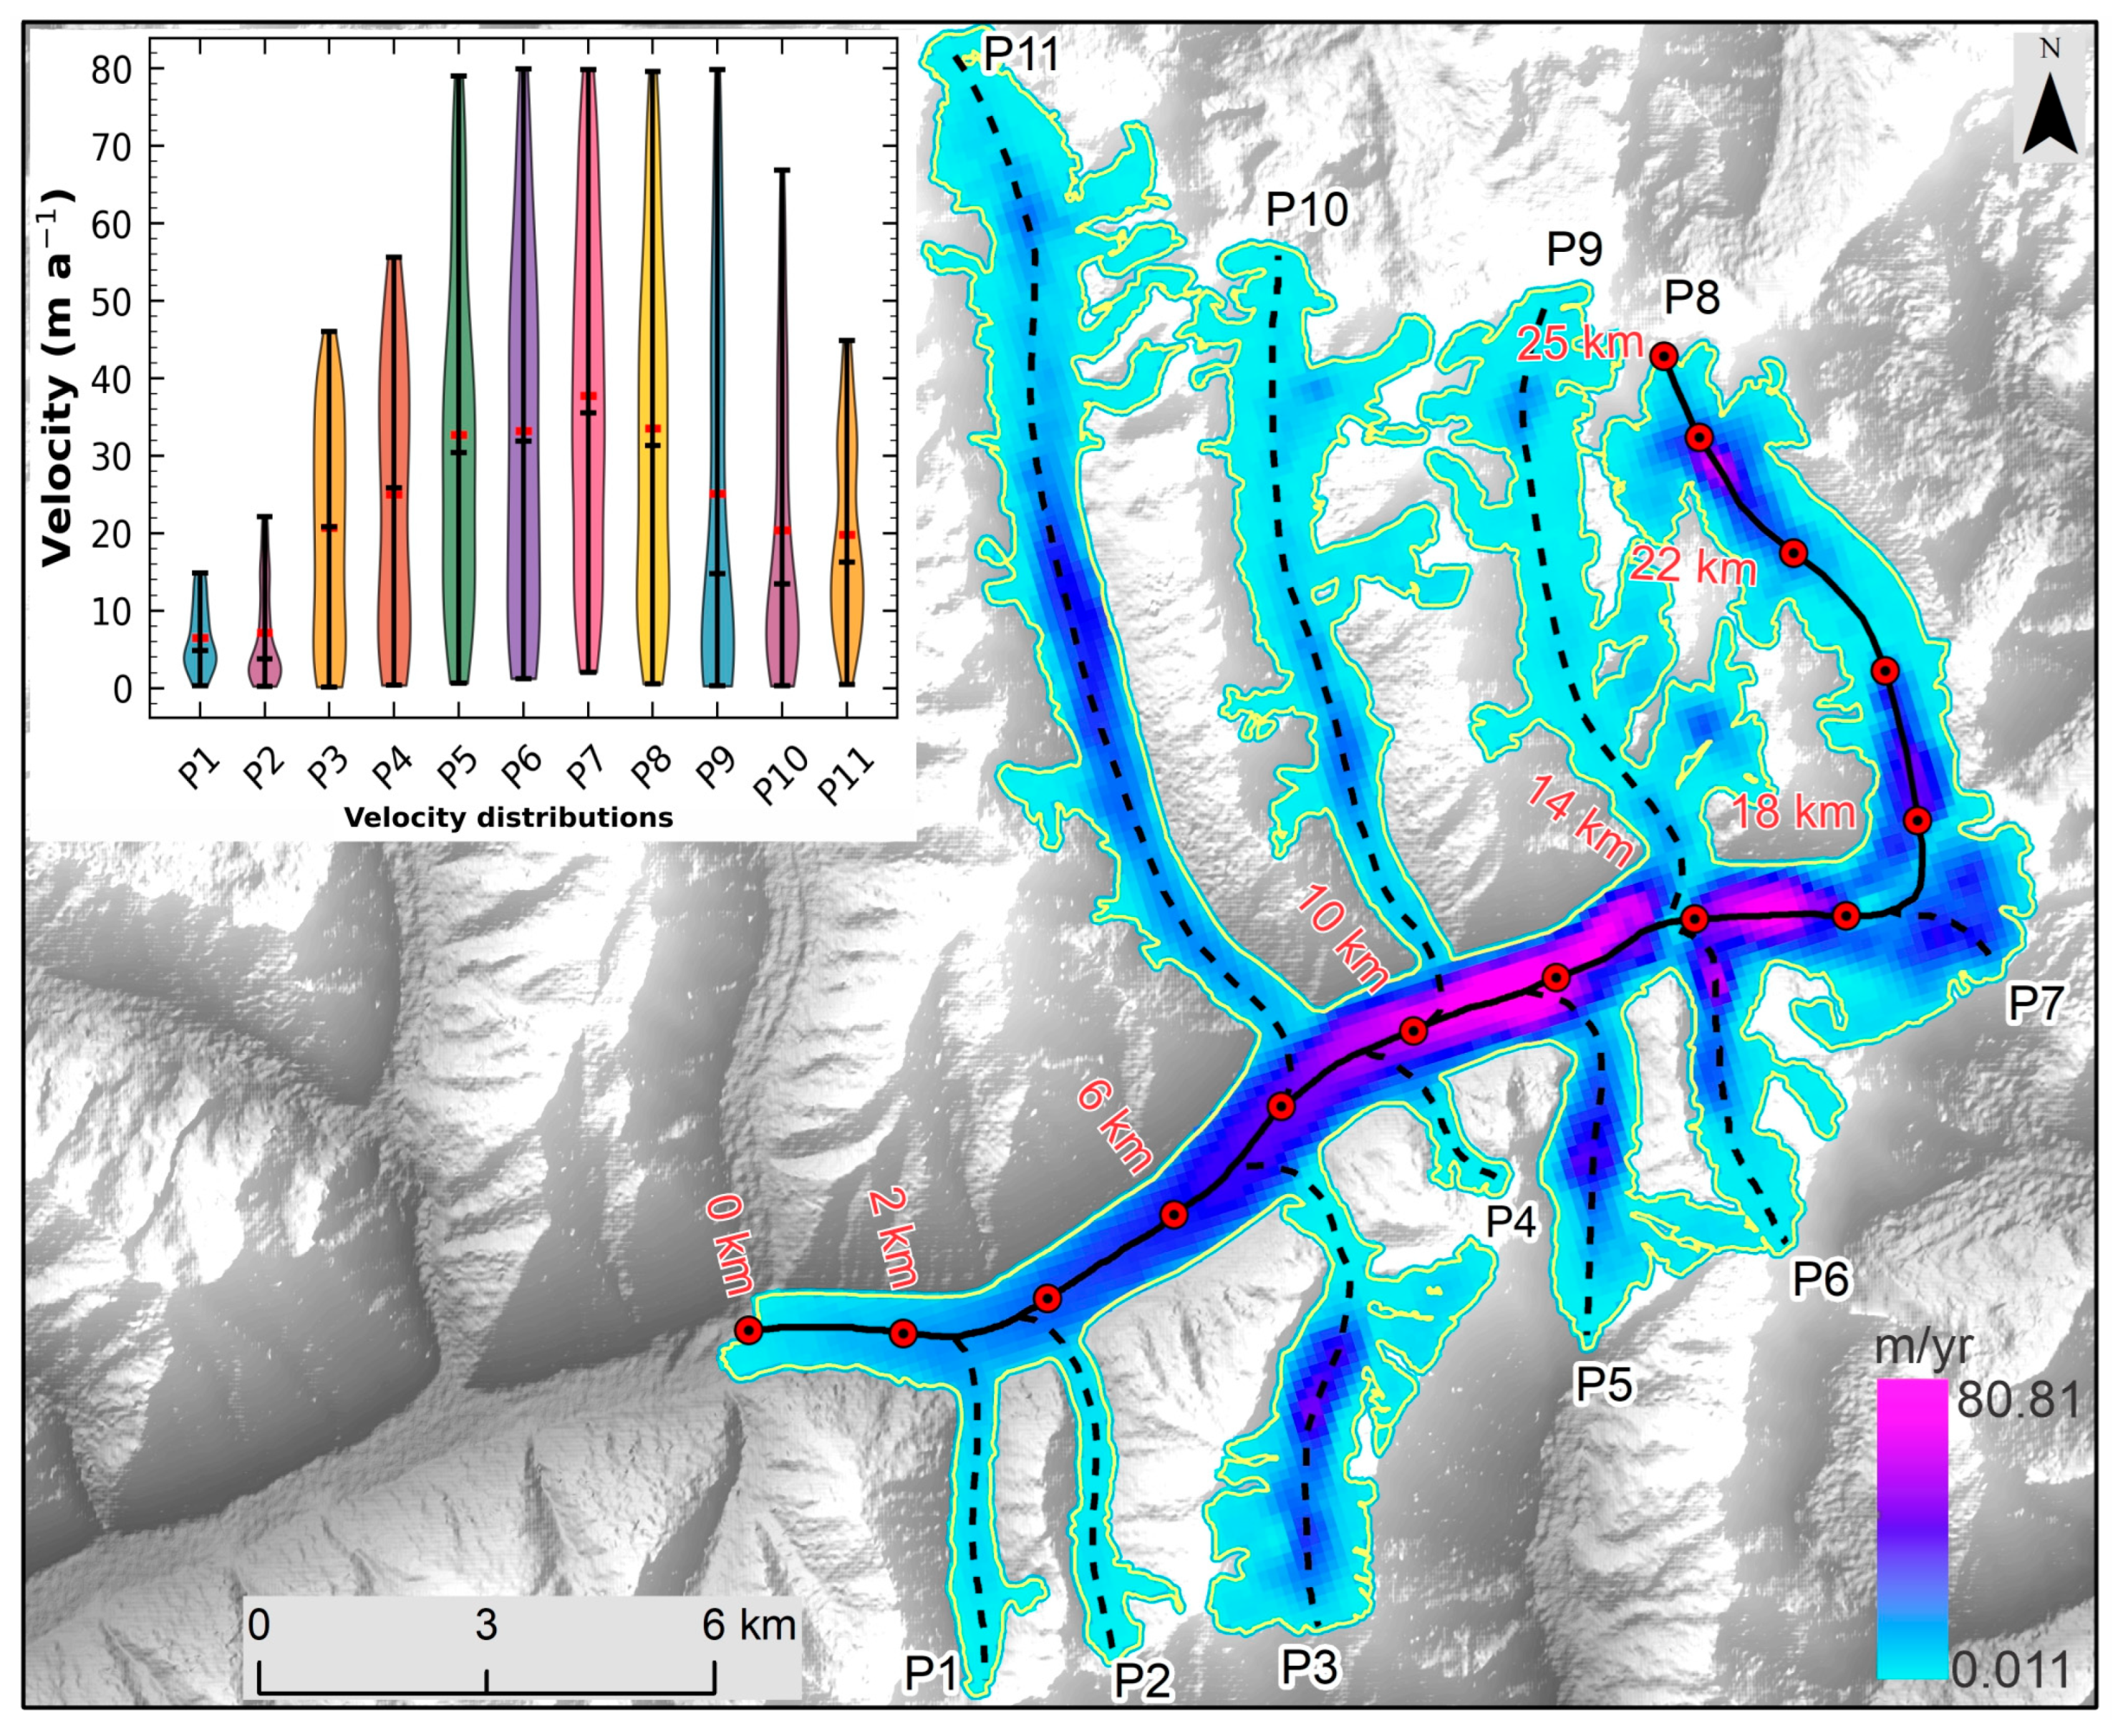
To assess the reliability of the derived velocities, a comparison was conducted with the ITS_LIVE (2018) velocity datasets (Figure S1a,b). A total of 31 corresponding points were selected along the main glacier trunk, and PlanetScope-derived velocities were compared with ITS_LIVE values extracted at the same locations. The comparison shows strong agreement between the two datasets (R2 = 0.813) (Figure S1), indicating a high level of consistency between manual marker tracking and satellite-derived velocity products, and supporting the reliability of the adopted methodology.
Overall uncertainty in velocity estimation arises from image co-registration, manual feature identification, and temporal sampling intervals. However, by restricting measurements to stable, clearly identifiable features and validating results against independent datasets, the derived velocity fields are considered robust for capturing the spatial patterns of glacier surface motion.

4.3. Supraglacial Lake Displacement and Glacier Surface Motion

Glacier surface motion can be quantified by tracking persistent surface features advected by the flowing ice. For example, supraglacial lakes have been observed to migrate downstream in accordance with glacier movement, illustrating the advection of passive surface features by ice motion [48]. Previous studies have shown that stable supraglacial lakes are transported by glacier surface motion [49]. Consequently, when supraglacial lakes remain morphologically coherent and are not affected by drainage or reformation, their horizontal displacement rates serve as a robust and physically consistent proxy for local glacier surface velocity. This approach is analogous to established feature-tracking methodologies that estimate glacier velocity using sequential satellite imagery [50,51].
Supraglacial lakes were identified using the normalized difference water index (NDWI), which detects water surfaces by their relatively low reflectance in the near-infrared region compared with surrounding ice and debris [52,53]. Initial lake extents were extracted using NDWI-based threshold classification, with thresholds adjusted for each image to account for variations in illumination conditions, surface properties, and sensor characteristics. The extracted lake boundaries were subsequently refined through manual visual inspection, particularly in areas affected by terrain shadow, debris cover, or mixed pixels [41,54]. Final lake outlines were cross-checked against the original multispectral imagery to ensure mapping consistency and accuracy.
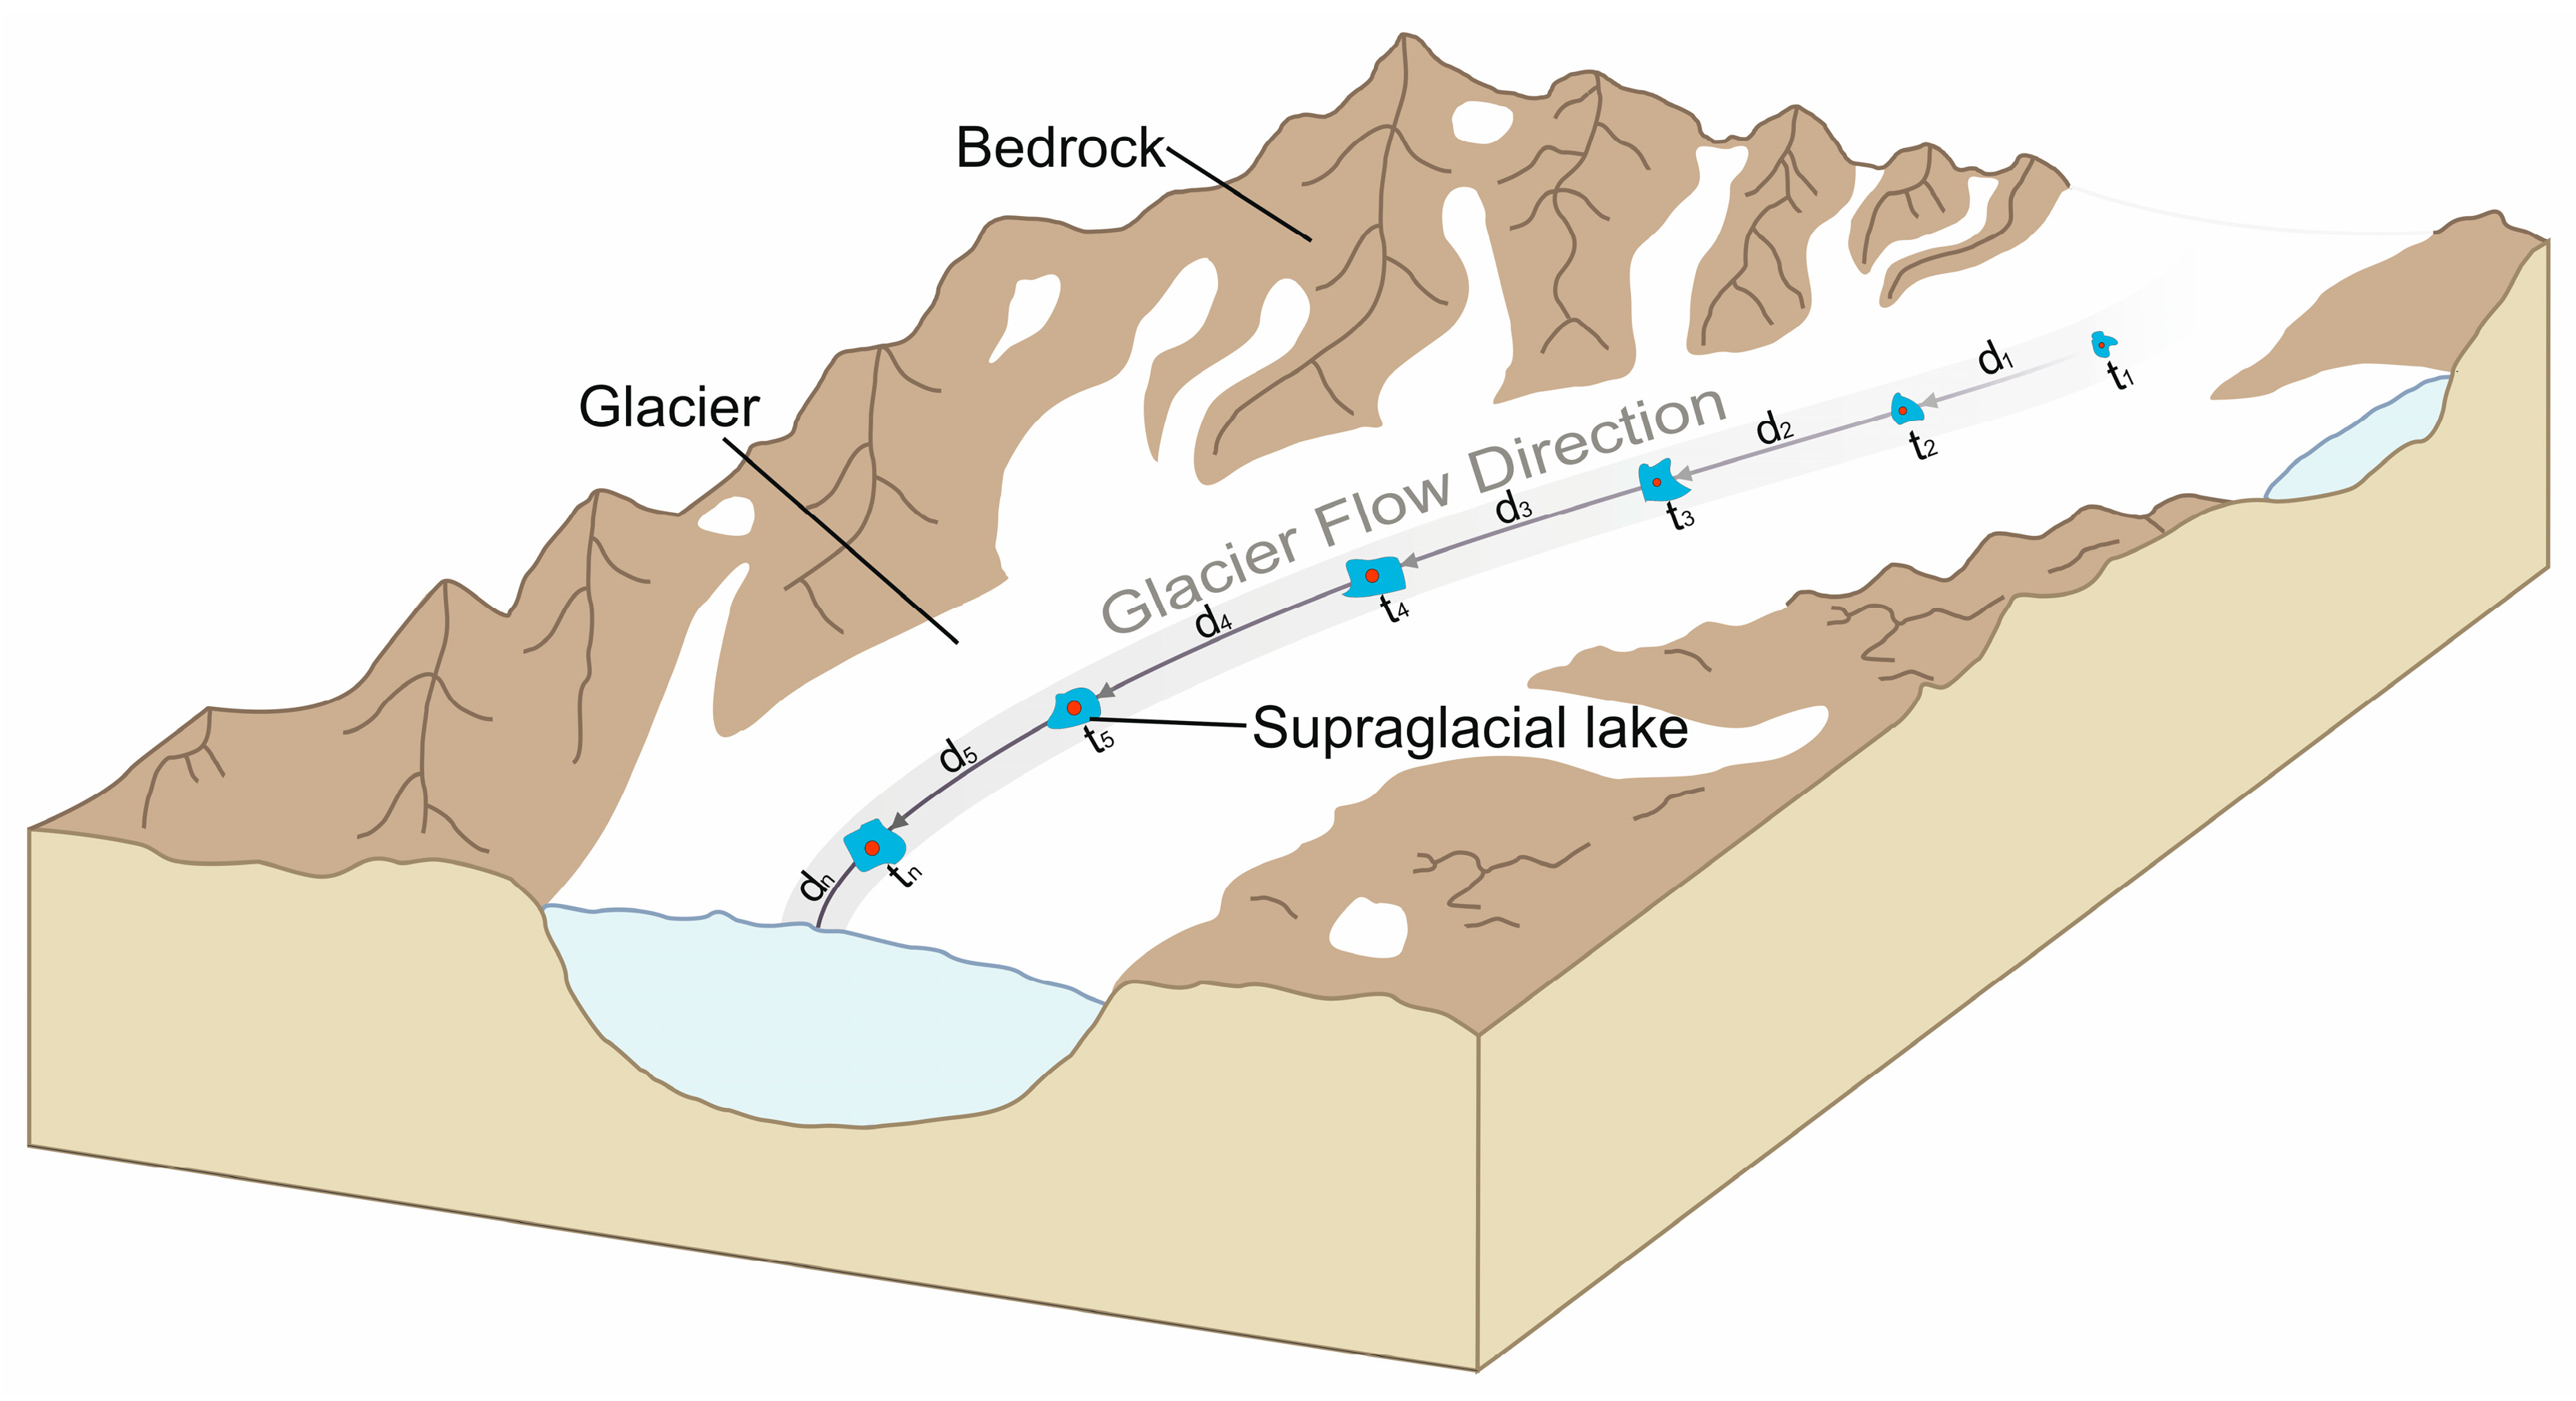
To quantify glacier surface motion, we tracked the displacement of supraglacial lake centroids between successive observations. We analyzed the spatial positions of these lakes with respect to the inferred direction of glacier surface flow, determined from surface morphological features and sequential satellite imagery (see Figure 4). We observed persistent supraglacial lakes migrating downstream over time, indicating the advection of surface ice from the accumulation zone toward the glacier terminus. We quantified the displacement of lake centroids between successive observations, and glacier surface velocity was calculated as follows:
V glacier = d 1 + d 2 +   ...   d n 1 t n t 1
where Vglacier represents the glacier surface velocity, while d denotes the downstream displacement distance of supraglacial lake centroids between consecutive observation times, and t corresponds to the acquisition time of satellite imagery. This approach assumes predominantly horizontal ice motion and neglects vertical displacement, which is considered negligible over annual timescales.
This approach provides a qualitative proxy for glacier surface motion, provided that supraglacial lakes remain morphologically stable and are not affected by drainage or deformation. To ensure consistency in displacement measurements, we excluded lakes affected by rapid drainage, fragmentation, or seasonal changes.

4.4. Climate Analysis

Monthly meteorological records from the Dehavz station, covering the period from 1944 to 2024, were utilized to assess both long-term and recent climatic variability in the Upper Zarafshan River Basin. Based on these observations, we transferred the monthly records to annual air temperature and total annual precipitation. We analyzed the temporal trends in both variables over the entire observation period (1944–2024) and a more recent subperiod (2016–2024) to separate background climatic trends from contemporary hydroclimatic changes.
We quantified the magnitudes of these trends using Ordinary Least Squares (OLS) linear regression, with regression slopes expressed in °C per year (°C yr−1) for air temperature and millimeters per year (mm yr−1) for precipitation. Additionally, we also evaluated the statistical significance of monotonic trends in temperature and precipitation series using the nonparametric Mann–Kendall trend test. These analyses aimed to identify the direction and rate of long-term climatic changes at the Dehavz meteorological station and to characterize recent changes pertinent to the ongoing evolution of glaciers in the Upper Zarafshan River Basin.

5. Results

5.1. Glacier Changes Characteristics (2016–2024)

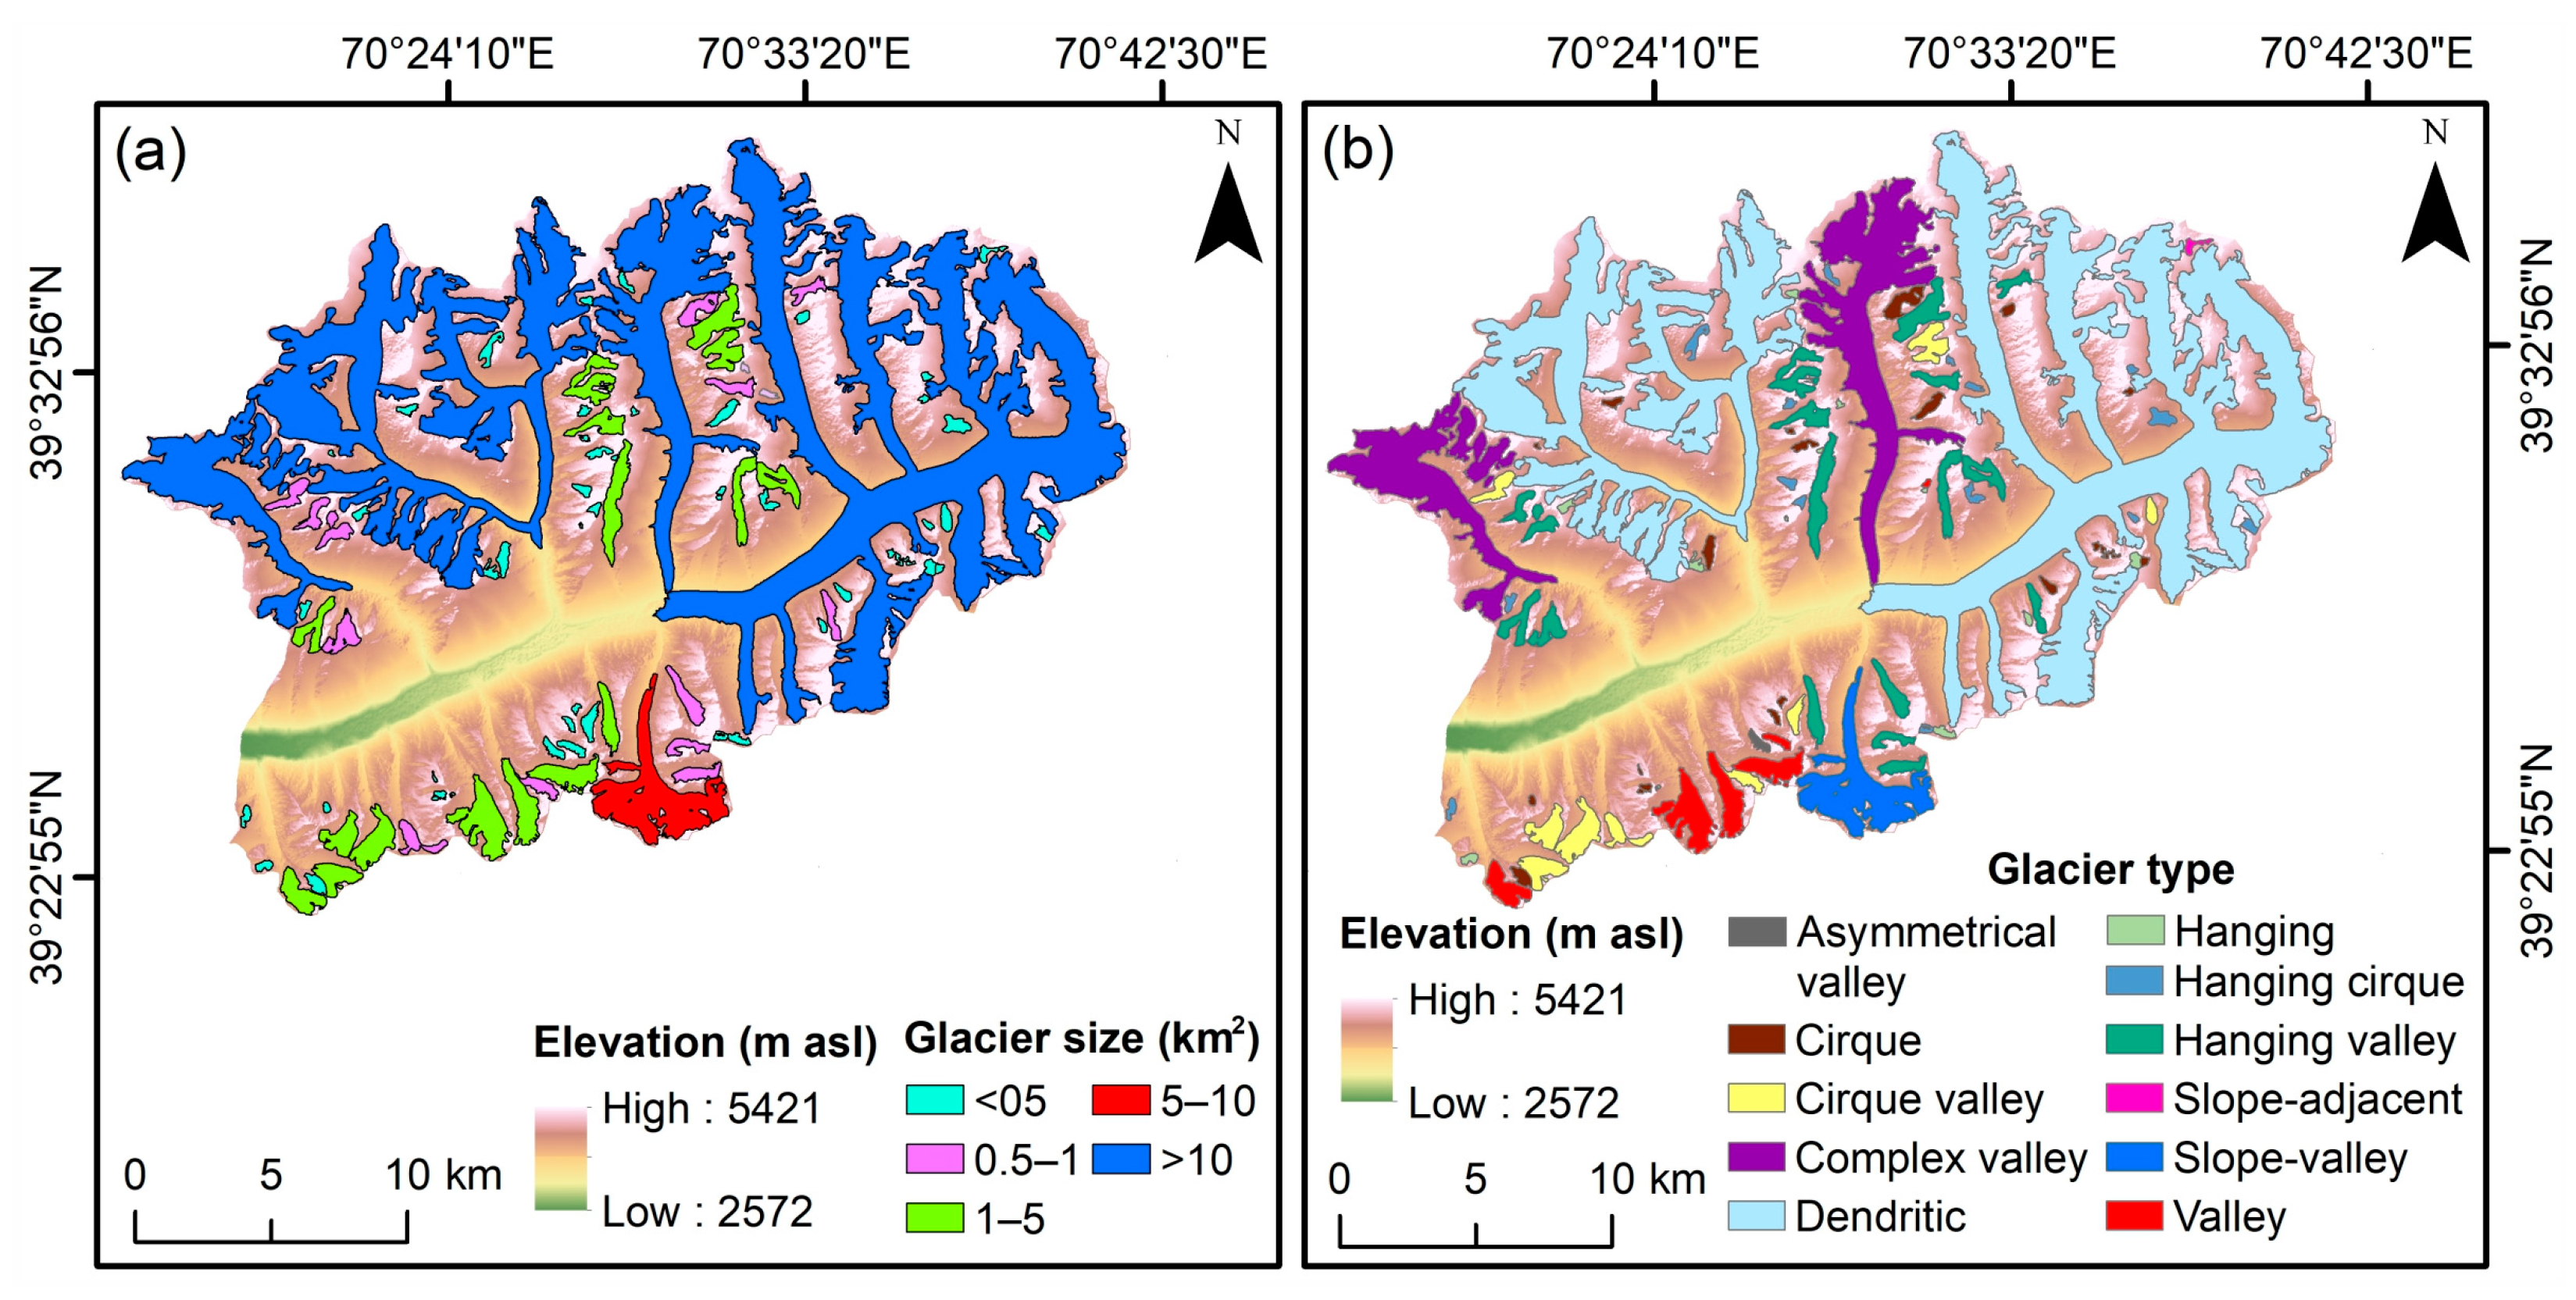
The basin hosts 87 glaciers covering 254.11 km2 in 2016. This pattern underscores the critical role of larger glaciers in sustaining the basin’s ice reserves, whereas the numerical prevalence of smaller glaciers emphasizes their vulnerability to climatic perturbations. Glaciers are categorized into five classes: <0.5 km2, 0.5–1 km2, 1–5 km2, 5–10 km2, and >10 km2 (Figure 5a). Larger glaciers are concentrated in the high-altitude eastern and central valleys, whereas smaller glaciers tend to occur along peripheral ridges and at lower elevations. The morphological classification of glaciers in the study area is based on their form and valley characteristics. Glacier types include cirque, hanging cirque, valley, slope–valley, complex valley, and asymmetrical valley (Figure 5b).
Visual inspection of PlanetScope time series revealed notable surface displacement on several large valley glaciers, particularly between 2016 and 2020 on glaciers No. 202 and No. 203. Some glaciers exhibited asymmetric flow, with eastern margins advancing faster than western edges, likely driven by variations in debris cover, basal conditions, or subsurface hydrology. Although no complete glacier surges were observed, localized slight accelerations were recorded on at least two glaciers between 2020 and 2022.
Dendritic glaciers comprise the largest share of the glacierized area (161.49 km2; 63.57%) (Figure 5b). Slope–valley glaciers are the second-largest category (33.37 km2; 13.14%), followed by hanging valley (17.22 km2; 6.78%) and complex glaciers (16.82 km2; 6.62%). Cirque–valley glaciers cover 8.31 km2 (3.27%), valley glaciers 8.35 km2 (3.29%), and cirque glaciers 3.75 km2 (1.48%). Hanging cirque and hanging glaciers account for 2.88 km2 (1.13%) and 1.36 km2 (0.54%), respectively. The remaining glacier types, including asymmetrical (0.27 km2; 0.11%) and slope-adjacent (0.23 km2; 0.09%), each contribute less than one percent of the total glacierized area. Overall, glacier shrinkage in the basin mirrors broader Central Asian trends, reflecting the combined effects of rising temperatures and declining snow accumulation.
The results indicate that glacier area loss varies considerably by geomorphological type (Figure S2a). Dendritic and complex valley glaciers exhibit the highest total area loss (up to 0.47 km2), whereas cirque and valley-type glaciers show relatively smaller changes. This suggests that glacier systems with more complex geometries and larger catchment areas are more sensitive to climatic forcing.
Glacier area loss also shows a clear dependence on geographic aspect (Figure S2b). Southeast- and southwest-facing glaciers experience the greatest area reductions (0.37 and 0.22 km2, respectively), which can be attributed to higher incoming solar radiation and greater melt energy than in other orientations. In contrast, northeast-facing glaciers exhibit the least area loss, indicating reduced sensitivity to solar radiation.
The relationship between glacier area and slope shows a moderate negative correlation (R2 = 0.593; Figure S3b), suggesting that larger glaciers tend to occur on gentler slopes, whereas steeper slopes are generally associated with smaller glacier extents. This reflects the influence of terrain geometry on ice accumulation and flow stability.
In contrast, the relationship between glacier area and elevation is weak (R2 = 0.054; Figure S3d), suggesting that elevation alone is not a dominant control on glacier size or distribution within the study area. Although elevation influences climatic conditions, its effect appears secondary to that of slope and geomorphological setting.
Overall, these results demonstrate that local geomorphological characteristics and slope conditions strongly control the evolution of glacier morphology in the Upper Zarafshon River Basin, while elevation and aspect play a more variable or secondary role. This highlights the importance of incorporating topographic controls when assessing glacier response to climate change in high mountain environments.
Multi-temporal satellite analysis indicates a consistent retreat of glaciers across the UZRB from 2016 to 2024. The total glacierized area decreased from 254.09 km2 in 2016 to 252.8 km2 in 2024, corresponding to a net loss of 1.31 km2 (Figure 6 and Table 2) and an average annual decline of approximately 0.15 km2. Glacier area loss was continuous throughout the study period, with the most pronounced decreases occurring in 2021 (0.25 km2), 2023 (0.22 km2), and 2019 (0.18 km2), while 2024 exhibited the lowest annual reduction (0.06 km2). Area losses were disproportionately higher for both large (>10 km2) and small (<1 km2) glaciers, reflecting heightened sensitivity to local topography and climatic variability.
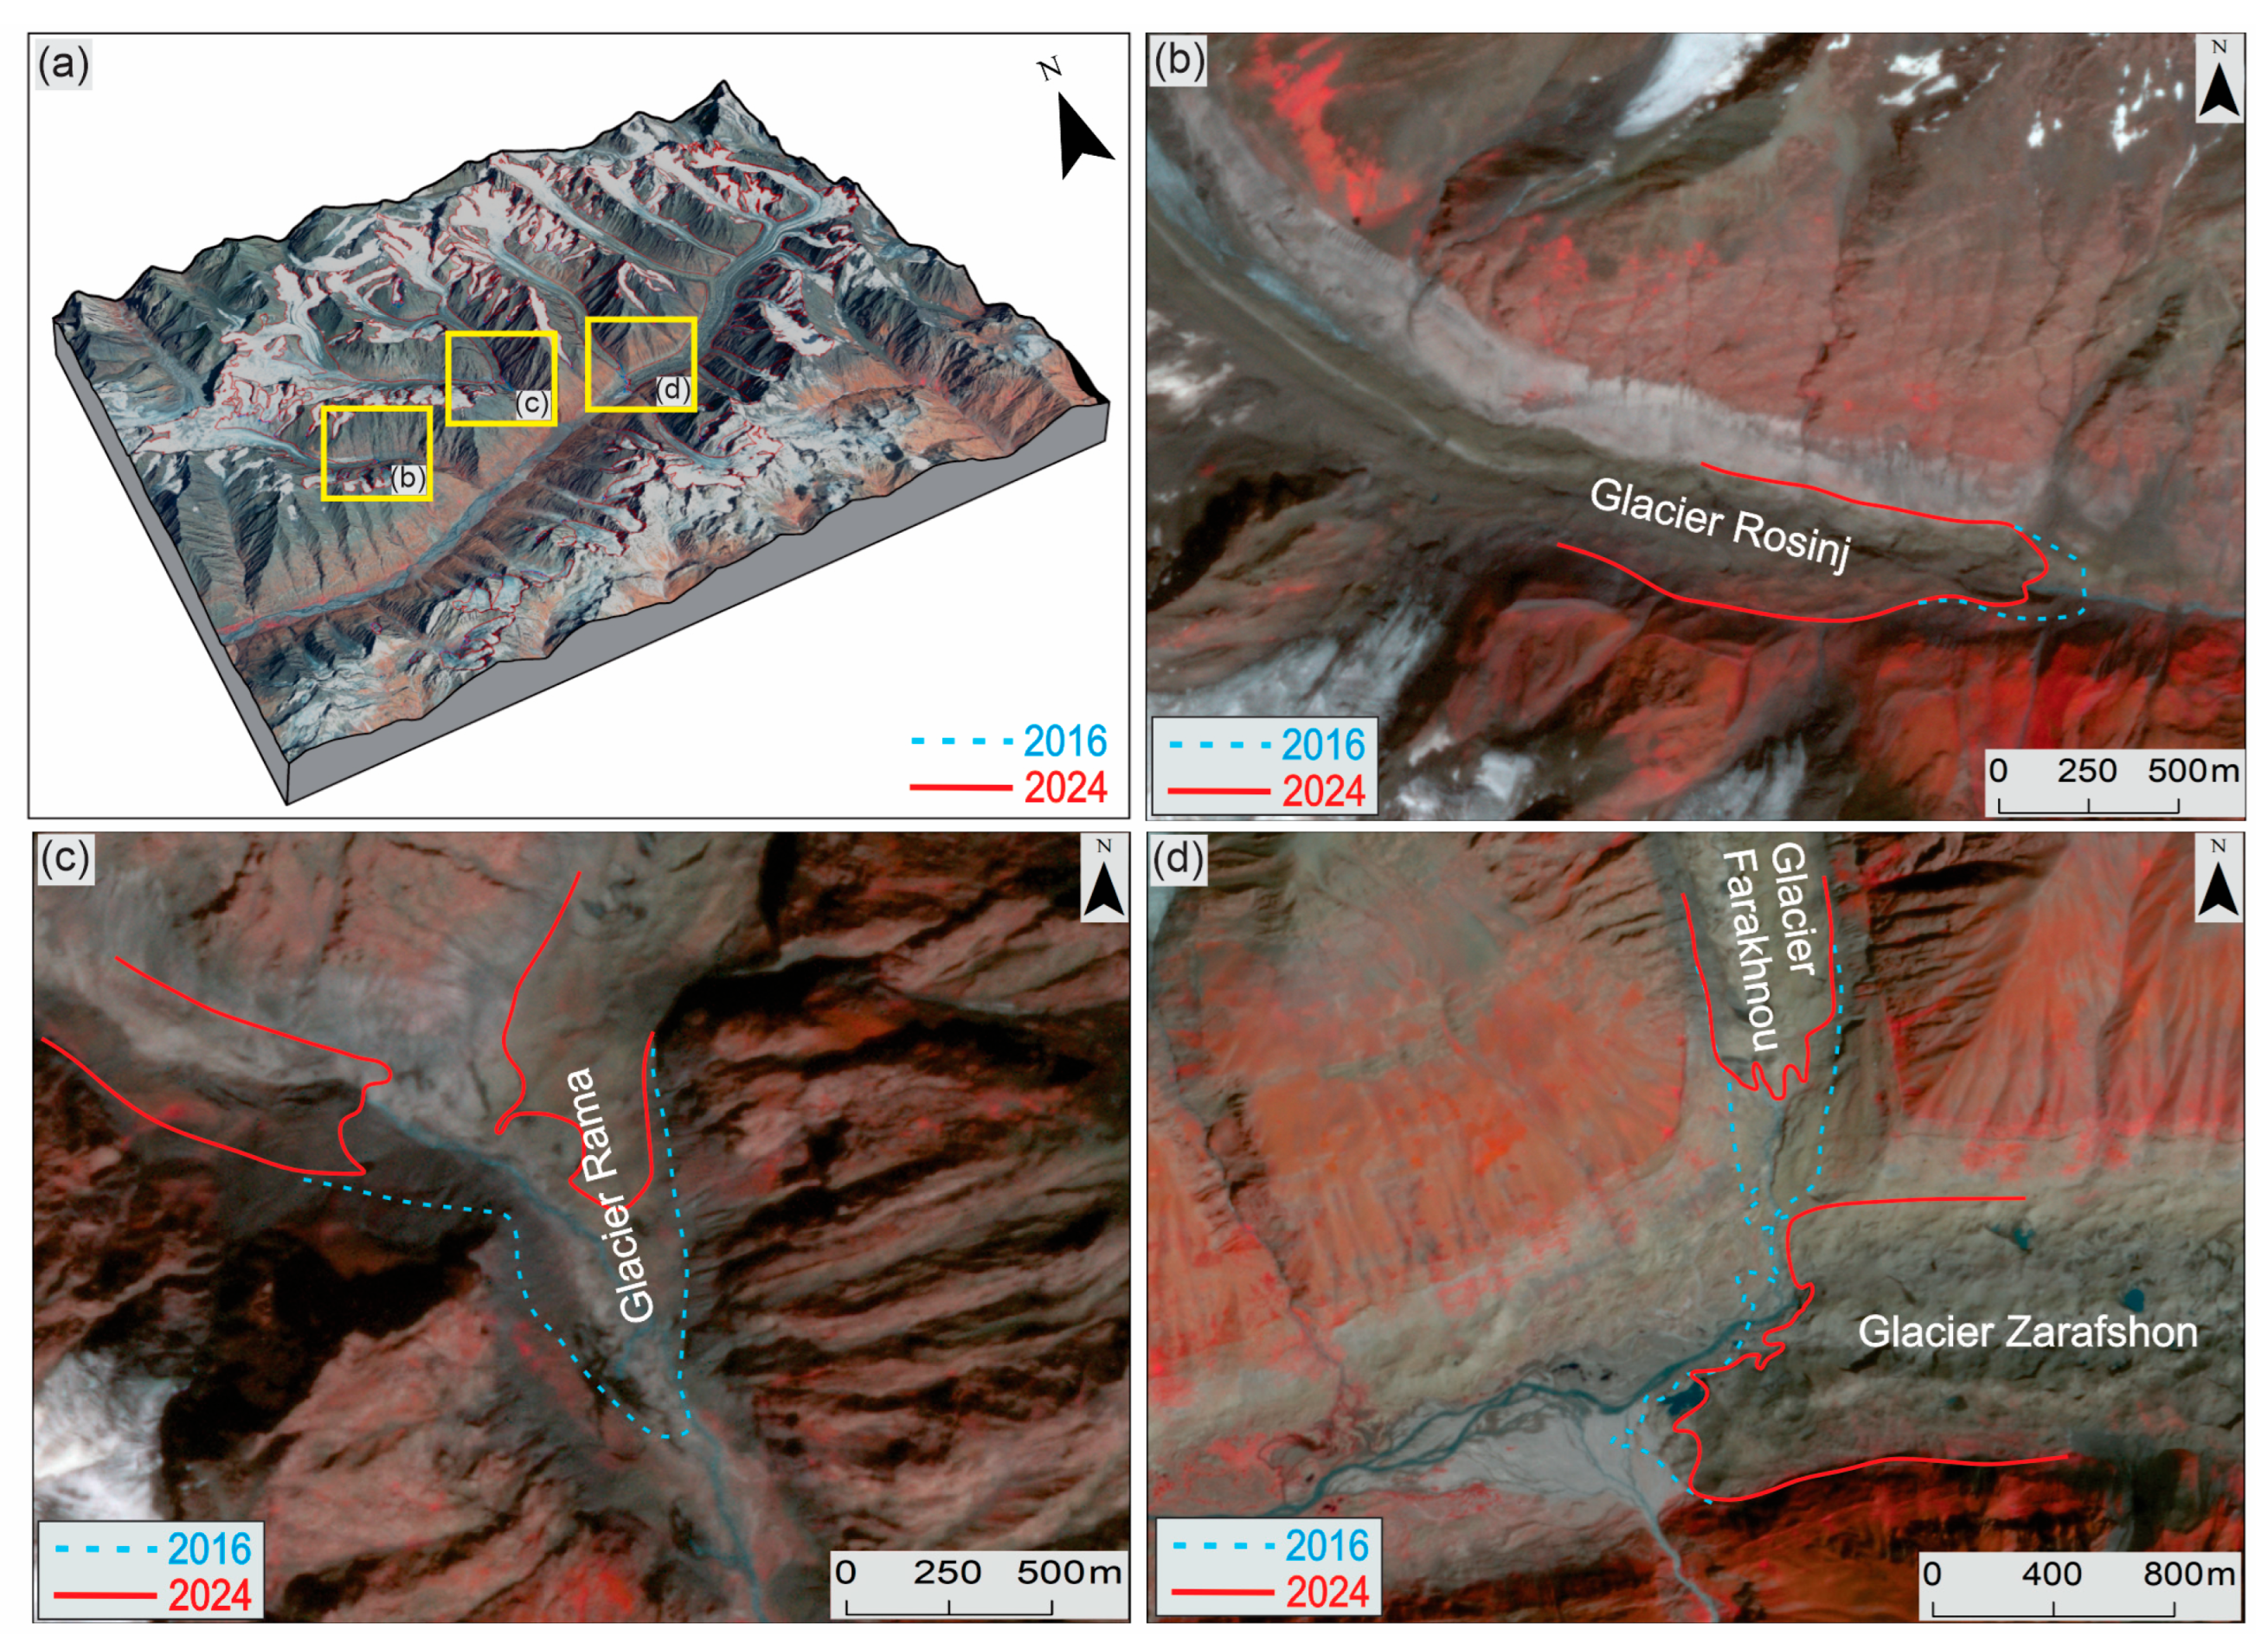
Several major valley glaciers experienced pronounced terminus retreat and structural reorganization (Figure 6). The Rama Glacier (Figure 6c) exhibited the most severe frontal retreat, with an average terminus recession of approximately 793 m between 2016 and 2024, resulting in complete separation from the glacier. The Farakhnou Glacier, formerly connected to the Zarafshon Glacier, retreated approximately 491 m and is now fully detached (Figure 6d). The Rosinj Glacier retreated by an average of 133 m over the same period. The Zarafshon Glacier itself exhibited an average frontal recession of approximately 151 m, primarily concentrated in the middle and lower tongue sectors.

5.2. Supraglacial Lakes and Surface Features

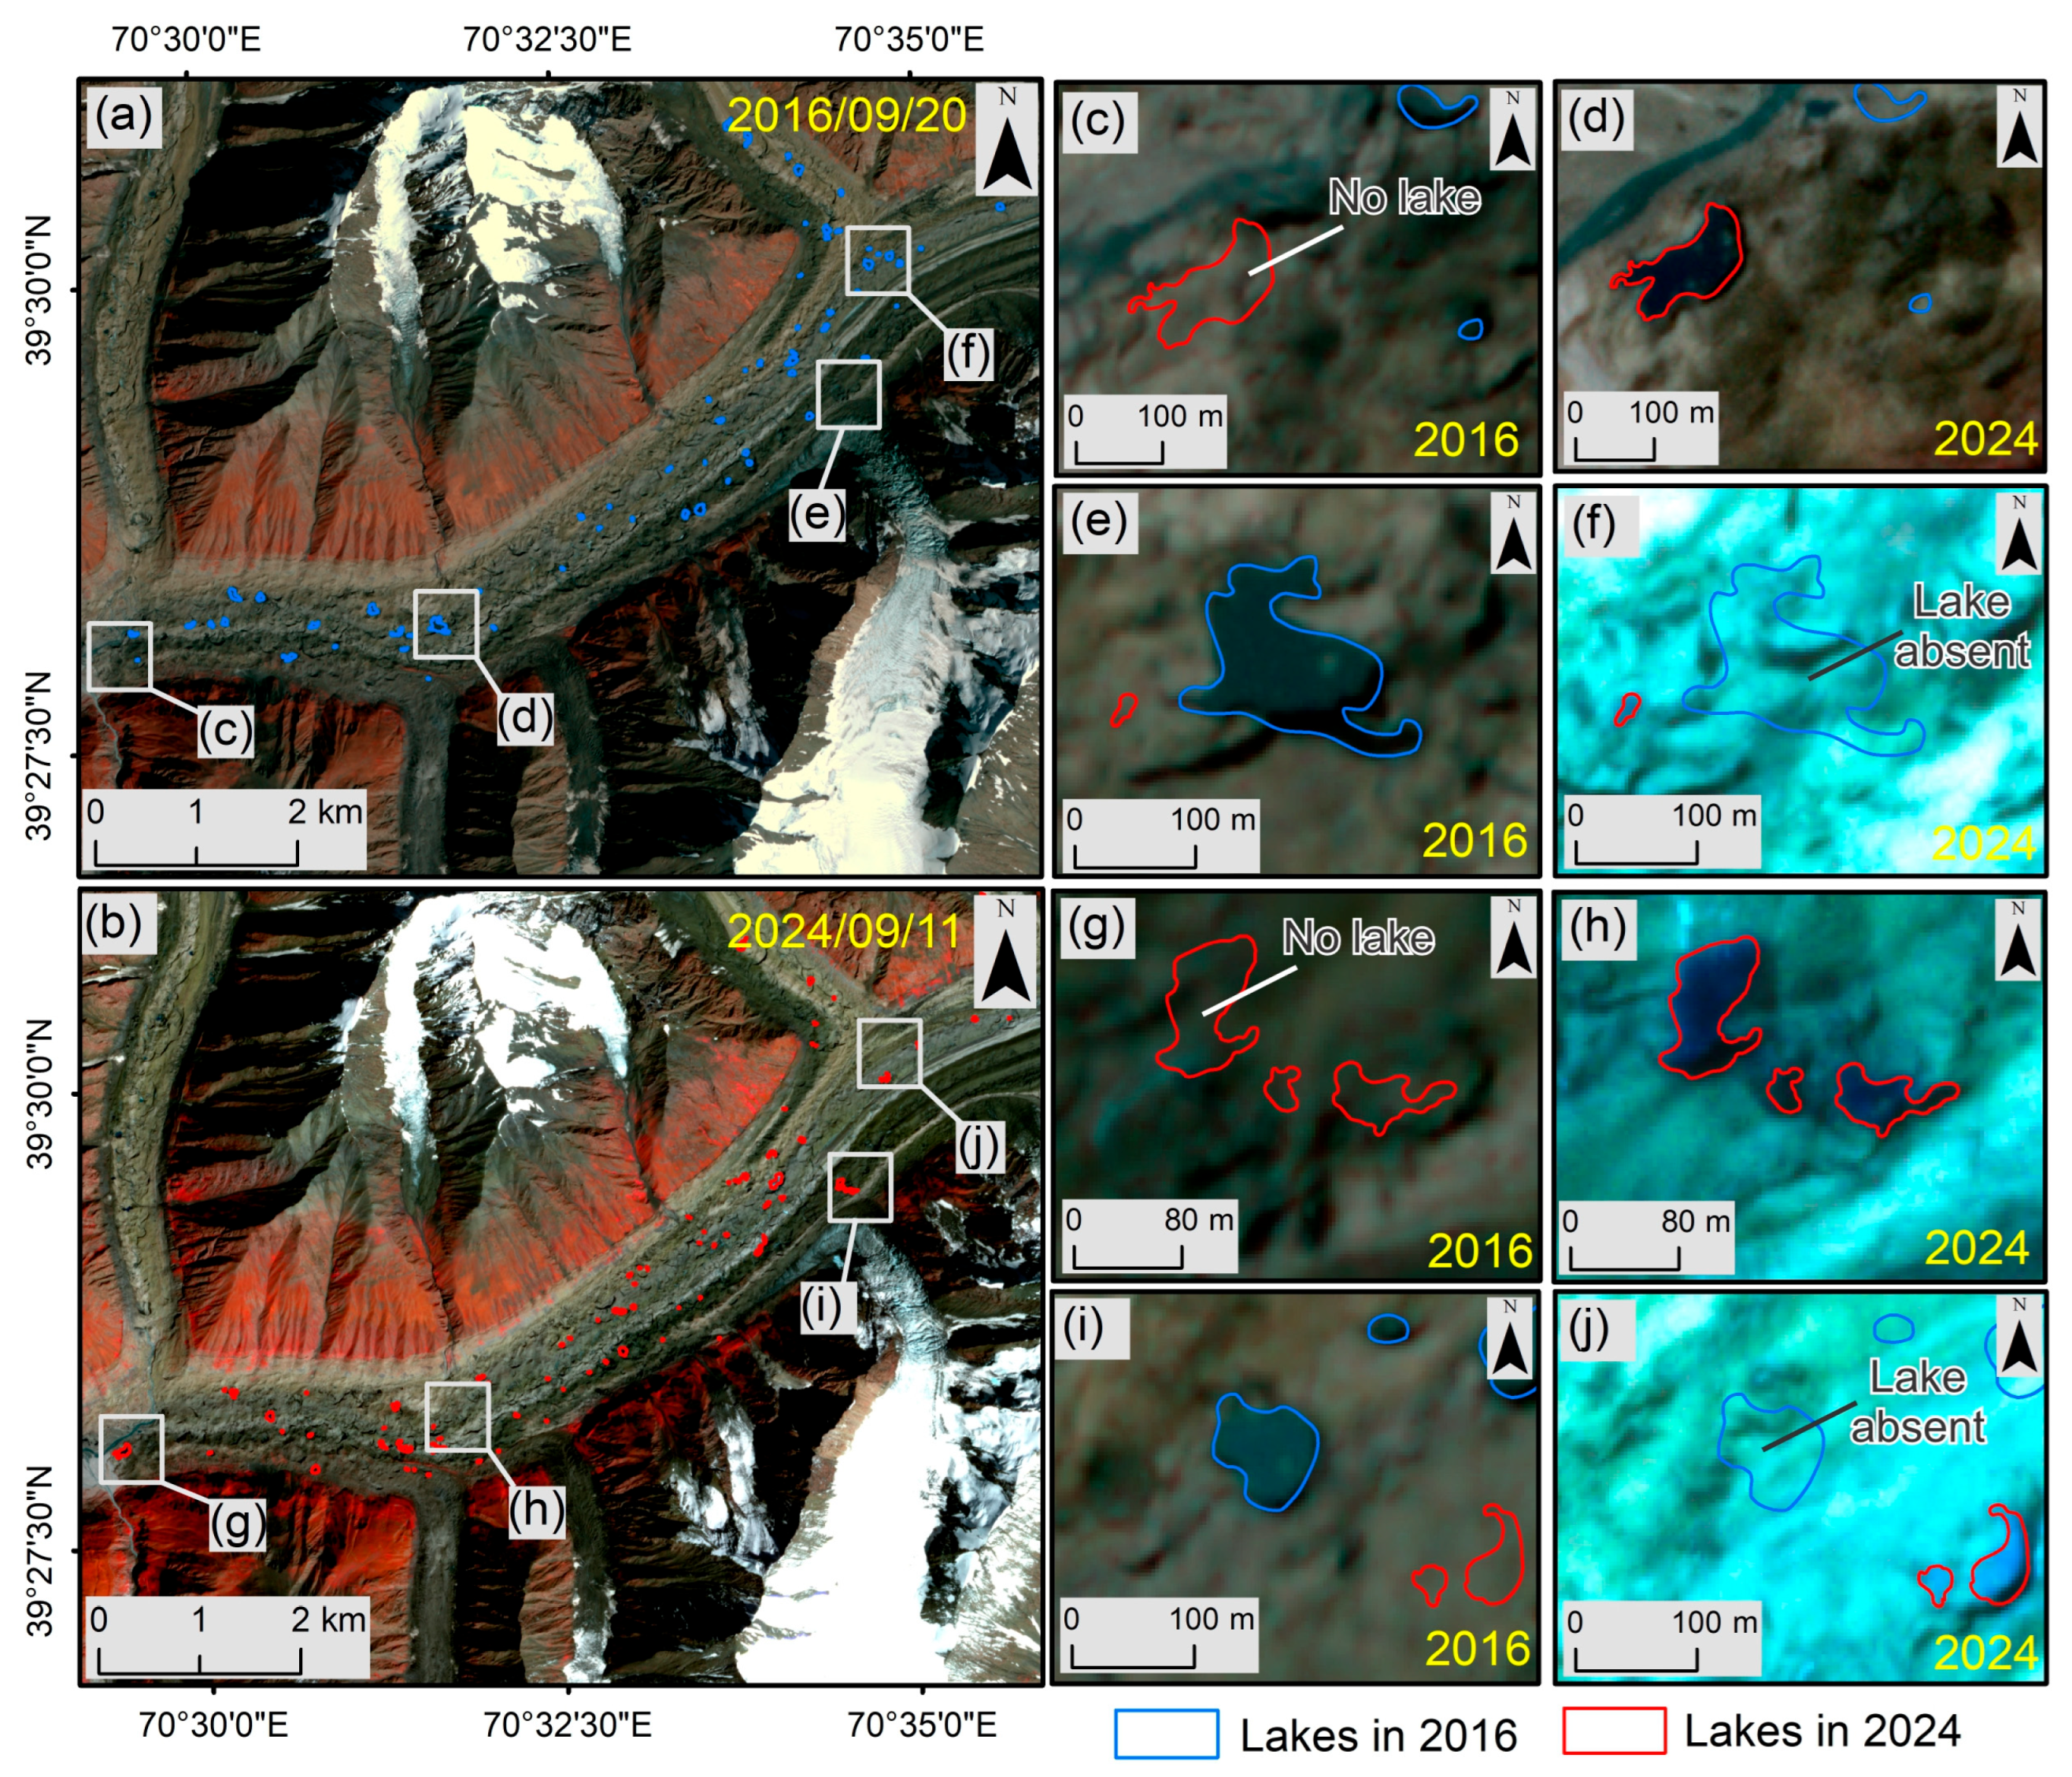
The analysis of the supraglacial lake area on the Zarafshon Glacier reveals pronounced inter-annual variability, with the total lake area rising from about 88,000 m2 in 2016 to a maximum of 150,000 m2 in 2022 (Figure 7; Table 3). This increase reflects a substantial expansion of surface water coverage over the study period.
In addition to changes in total area, the supraglacial lake system exhibits notable structural and spatial dynamics. Several lakes disappeared entirely in subsequent years, while ice cavities or englacial openings (e.g., ice caves or moulins) remained at their former locations as persistent surface features. At the same time, coalescence of adjacent lakes was observed, with multiple smaller lakes merging into larger water bodies. This process resulted in a reduction in the number of lakes, accompanied by an increase in overall lake area.
From a spatial perspective, most supraglacial lakes are concentrated in the lower part of the glacier, particularly in areas covered by supraglacial debris. Lakes in these debris-covered zones tend to be irregular in shape and persist for several years. In contrast, lakes in the upper glacier are fewer, smaller, and generally short-lived.
Overall, the pronounced expansion observed in 2022 coincides with the increased presence and persistence of supraglacial lakes, reflecting the combined influence of enhanced surface melting and evolving englacial drainage conditions, as indicated by patterns of lake growth, disappearance, and coalescence (Figure 7). Changes in the supraglacial lakes during 2016–2024. (a) Lake outlines derived from PlanetScope images from September 20, 2016; (b) Lake outlines derived from PlanetScope images from September 11, 2024; (c–j) indicates a zoomed part of the supraglacial lakes.
Lakes were primarily situated on low-gradient, debris-covered glacier tongues, where meltwater accumulated behind surface depressions or debris dams. In several instances, supraglacial lakes or ponds coalesced into interconnected lake systems. By 2023–2024, some lakes had drained or disappeared, potentially due to subglacial outflow.
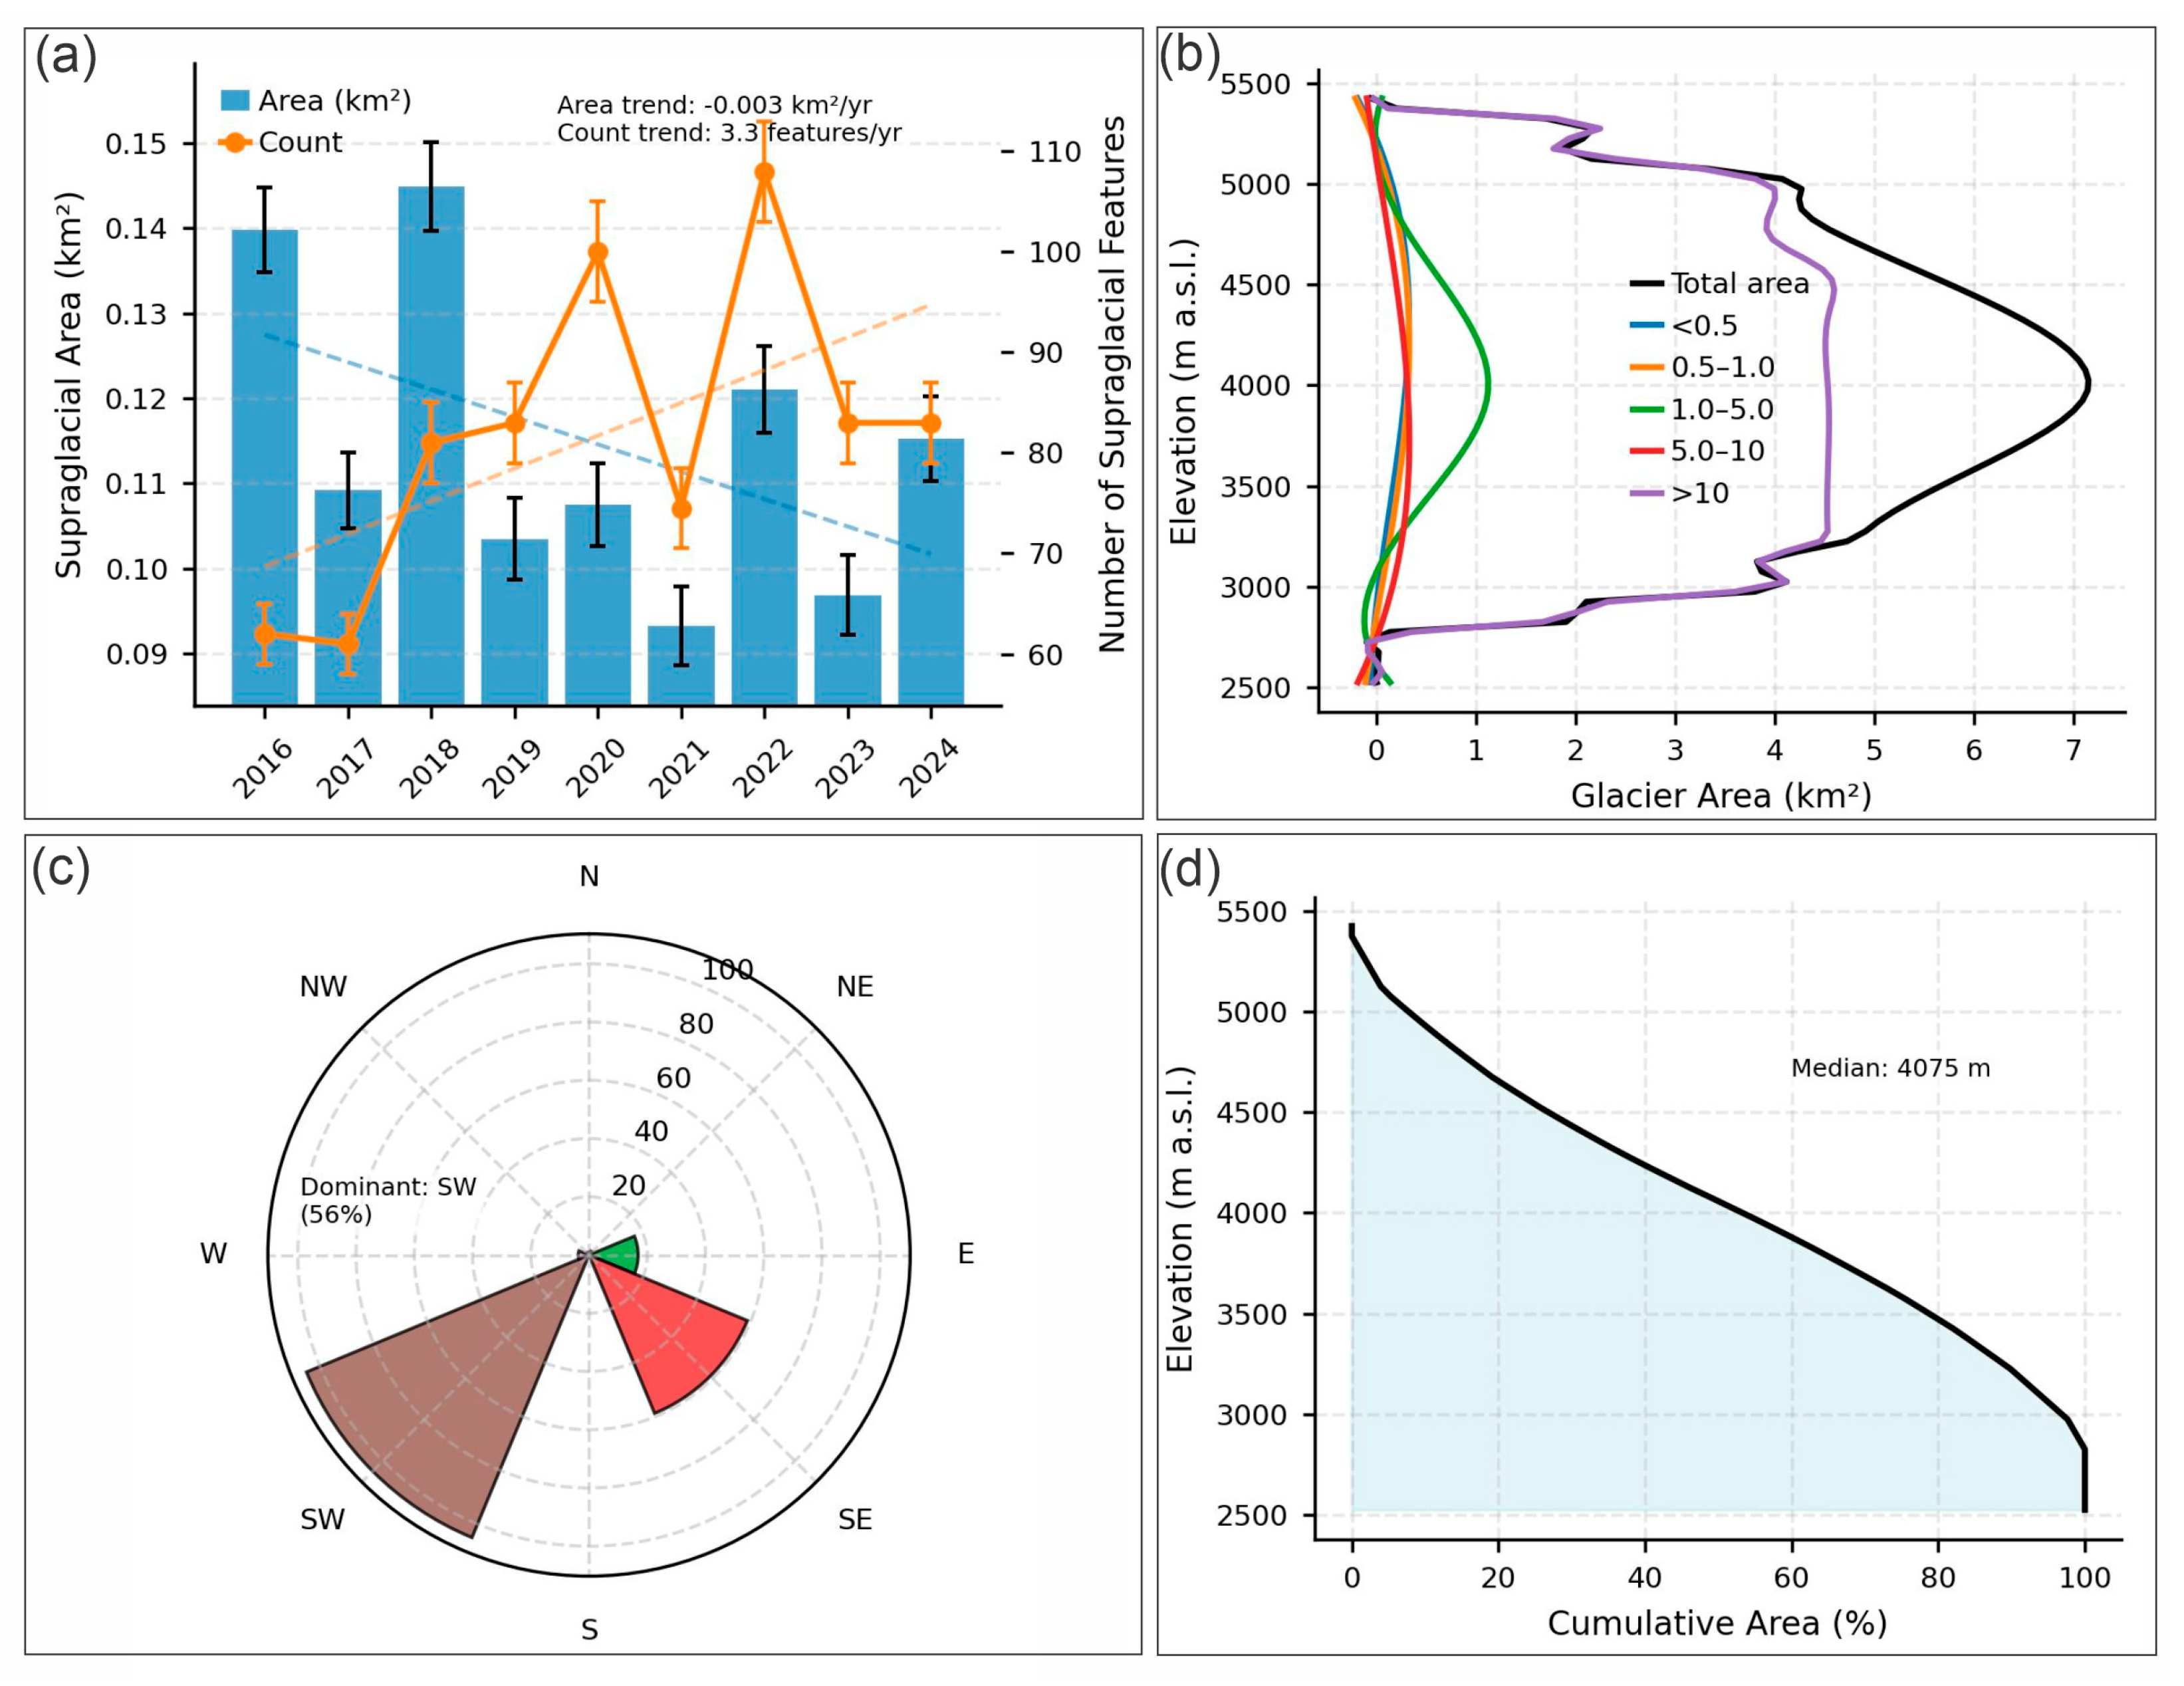
The annual variation in lake area from 2016 to 2024 exhibits a fluctuating pattern without a clear linear trend (Figure 8a). Peaks were observed in 2016, 2018, and especially in 2022, which climatic conditions and topographical patterns may have influenced.
Spatial sampling of supraglacial features over time shows significant variability between 2016 and 2024. The total supraglacial area shows a slight negative trend of −0.003 km2/yr, whereas the number of individual features shows a positive trend of approximately +3.3 features/yr. This implies that although the total area covered by supraglacial features decreased marginally, the frequency increased, indicating broader processes of glacier disintegration and fragmentation. The peaks in the appearance of supraglacial features are more pronounced in 2021 and 2023, during periods of increased glacier retreat.
The glacier altitudinal distribution shows that most of the glacierized area lies between 3500 and 4500 m a.s.l. Range, with the highest contribution in areas with glaciers larger than 10 km2. Small glaciers (less than 1 km2) are more likely to be found at higher altitudes (greater than 4000 m), whereas larger valley glaciers occupy a more altitudinal range. This distribution shows that glacier size and presence depend strongly on elevation, with smaller glaciers at greater risk from climate variability.
Analysis of glacier orientation indicates that southwestern aspects predominate (56%), followed by southern and western aspects. The eastern and northeastern regions are underrepresented. The south- and southwest-facing glaciers are more numerous, indicating greater exposure to incoming solar radiation, which increases ablation. This orientation bias is essential in justifying high rates of retreat in the study region. The hypsometric curve shows that glaciers in the UZRB are mainly concentrated at altitudes of 3000–5000 m a.s.l., with a median altitude of 4075 m. This curve form implies a large percentage of glacierized areas near the equilibrium line altitude (ELA).
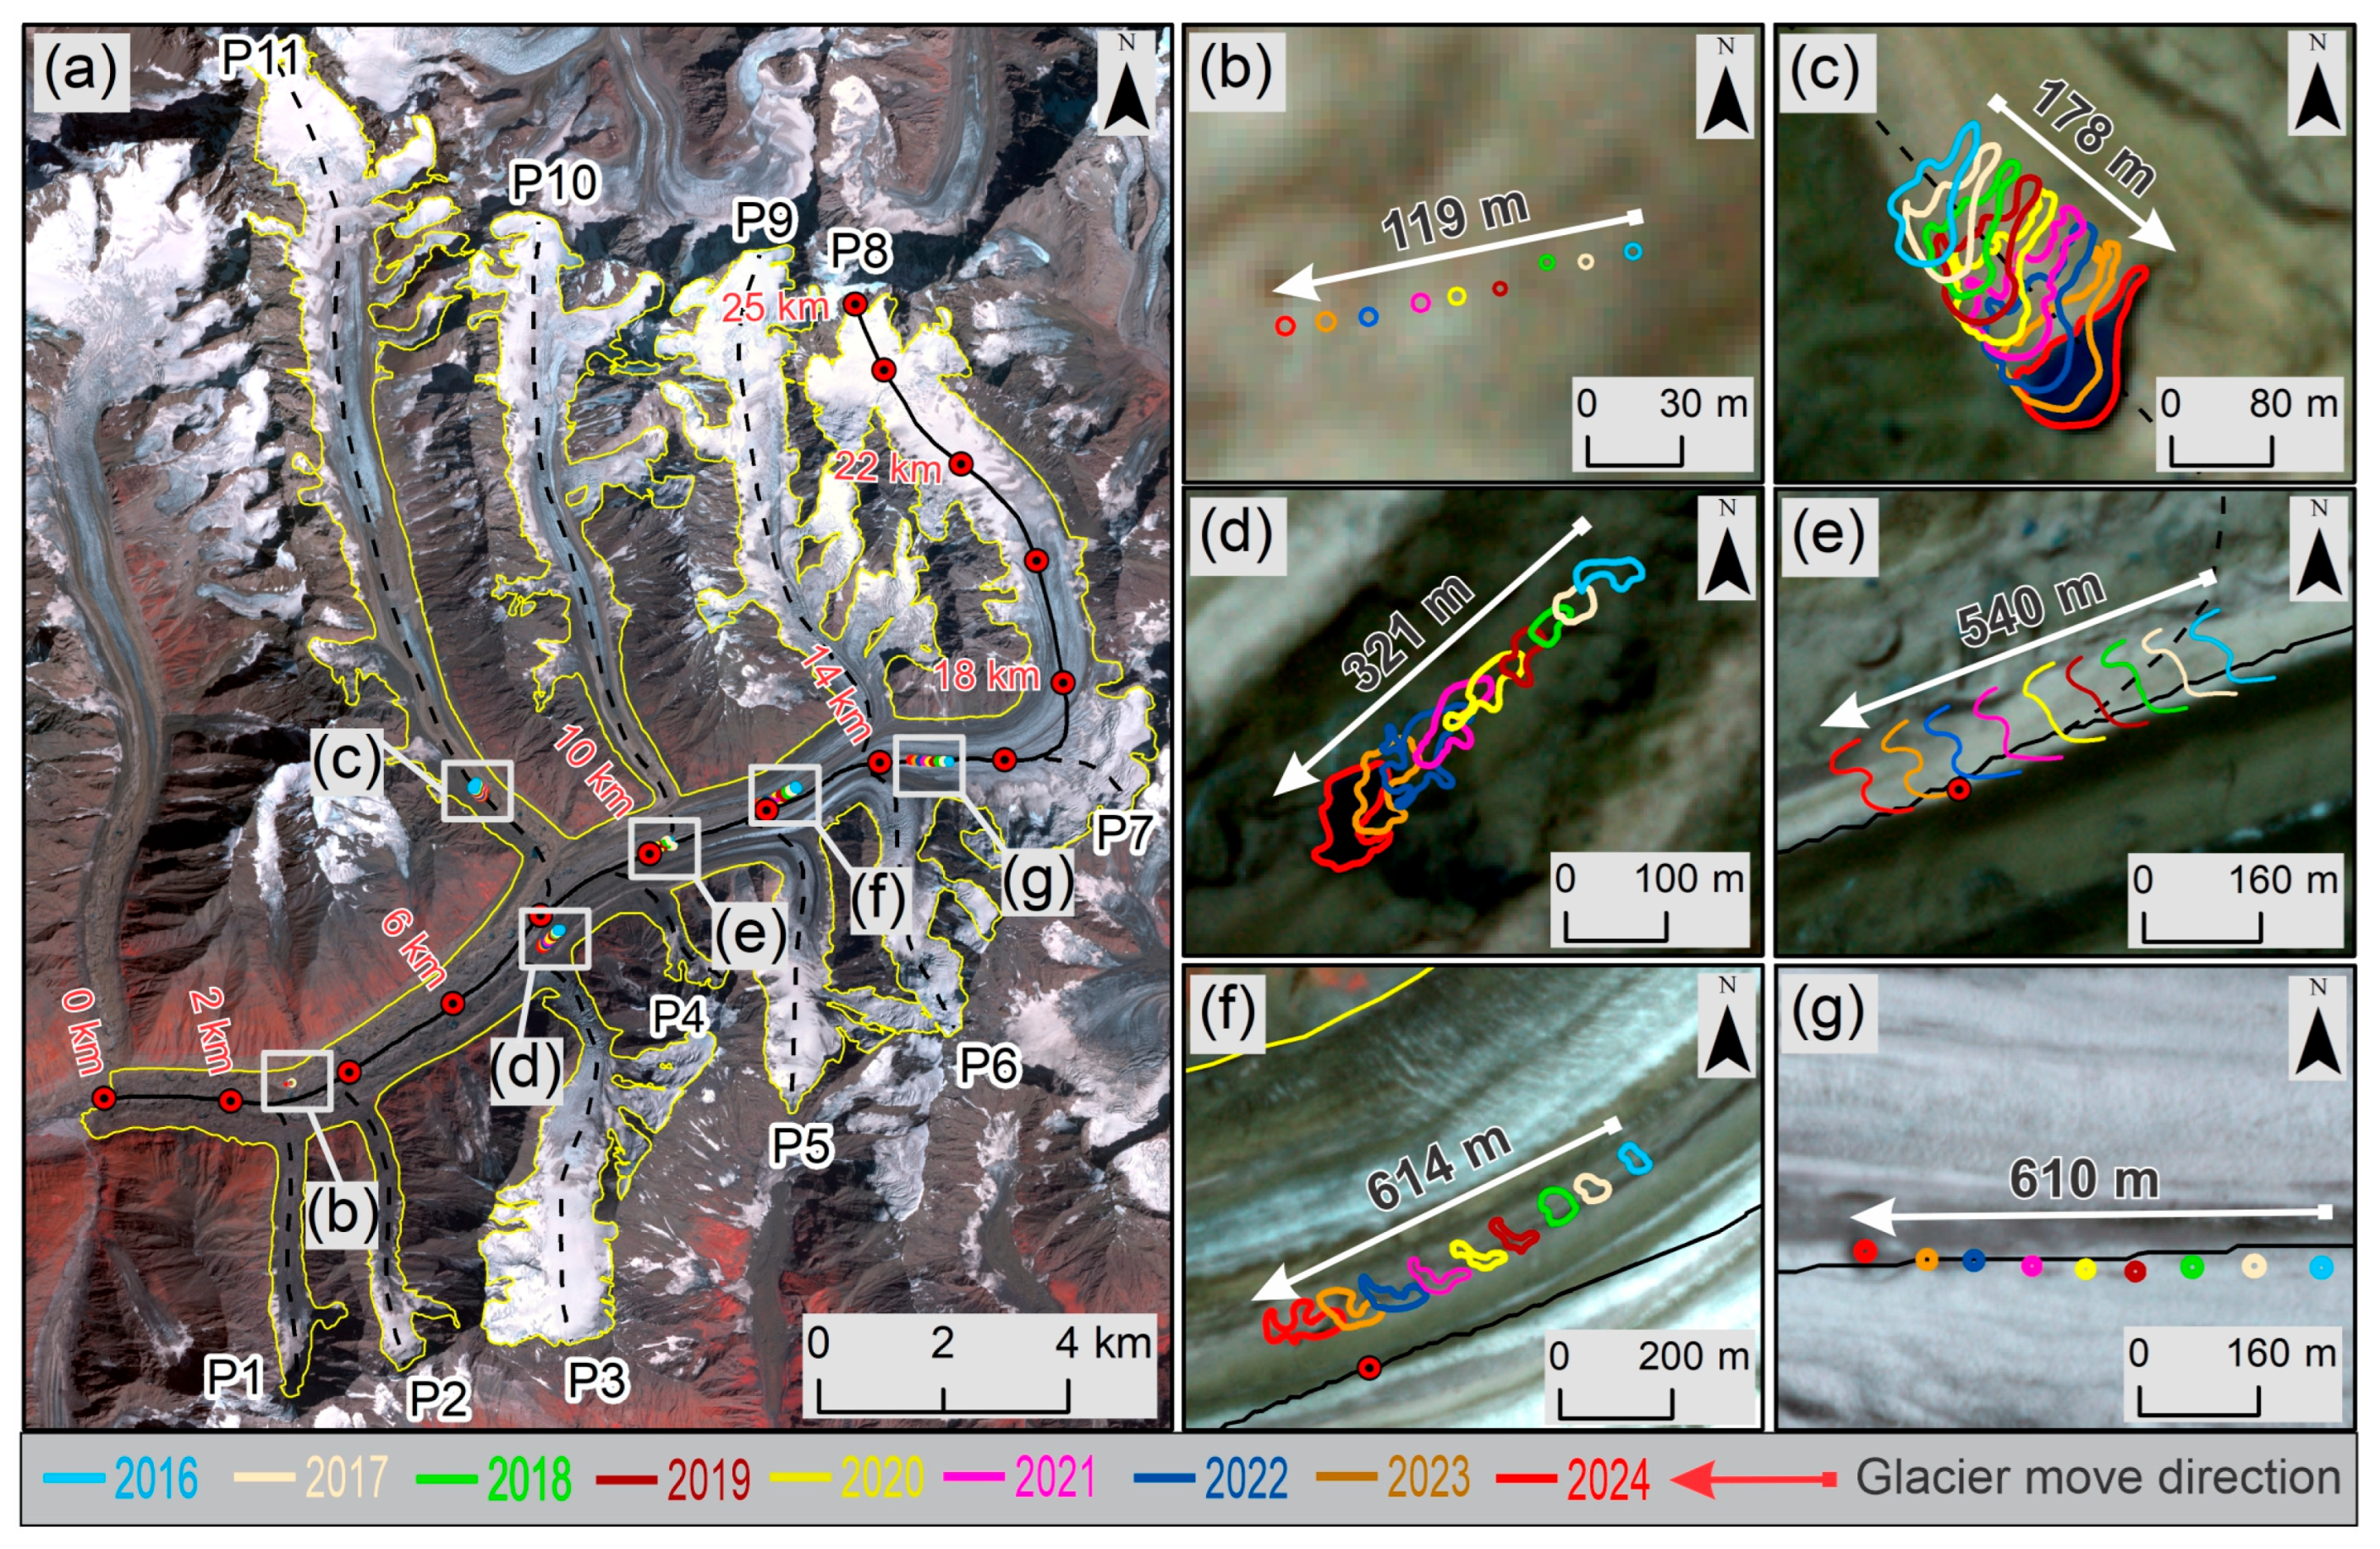
Displacement across different glacier sections was determined by tracking supraglacial features (lakes, boulders, and debris) from 2016 to 2024. The analysis revealed apparent variation in flow velocity along the glacier profile, with displacement ranging from 119 m to 614 m. In the upper accumulation area (Figure 9e–g), displacement was greatest, with measured values of 610, 614, and 540 m, respectively. In the middle section (Figure 9d,e), displacements reached 178 m and 321 m, indicating moderate flow activity. The reduced motion here likely reflects ice thinning and a transition from active flow to a slower, partially stagnant regime, both of which are associated with topographic patterns.
The derived glacier surface displacement fields indicate that the maximum annual surface velocity, obtained from high-resolution PlanetScope and Gaofen-2 (GF-2) imagery, is 76.8 m (Figure 9). For the same glacier sectors, the corresponding maximum annual surface velocity derived from ITS_LIVE data is 80.8 m (Figure 10). Analysis of supraglacial lakes and ponds reveals consistent down-glacier migration of lake positions between successive years in the PlanetScope and GF-2 imagery. The spatial distribution of lake displacement vectors aligns with the main glacier flow direction and corresponds to the surface velocity patterns shown in the ITS_LIVE velocity field. A total of 31 points were selected across the glacier surface to compare velocity values derived from Planet imagery with those from the ITS_LIVE dataset, demonstrating strong agreement (R2 = 0.813; Figure S1). Most points are distributed close to the 1:1 line, while some deviations are observed at higher velocity values, where ITS_LIVE tends to underestimate the velocities relative to PlanetScope. The mean glacier surface velocity along the central line of Zarafshon Glacier is 52.1 m yr−1, with a maximum of 82.6 m yr−1 and a minimum of 11.2 m yr−1. These values reflect the spatial variation in surface flow along the main glacier trunk, with slower ice in the upper accumulation zone and faster flow toward the terminus.
To evaluate the influence of local topography and geomorphology on the evolution of glacier morphology in the Upper Zarafshon River Basin, a sensitivity analysis was conducted using glacier area loss, geomorphological classification, aspect, slope, and elevation (Figures S2 and S3).

6. Discussion

6.1. Regional and Temporal Context of Glacier Retreat, Ice Flow Changes, and Supraglacial Evolution

The observed glacier retreat and evolving surface dynamics in the UZRB between 2016 and 2024 reflect broader regional and global patterns of accelerated cryospheric change driven by ongoing climatic warming [55]. The consistent retreat of the Zarafshon Glacier margin from 2016 to 2024 aligns with regional trends documented across Central Asia, where glacier area loss has intensified over the past two decades [5,56]. Recent multi-sensor analyses show that glaciers in Central Asia have been losing mass at a rate of −0.23 ± 0.04 m w.e. yr−1 since the early 2000s, driven primarily by increasing summer air temperatures and shifts in seasonal precipitation [57,58]. The magnitude of terminus retreat observed in this study (e.g., Rosinj, Rama, Frakhnou, and Zarafshon Glaciers, showing decreases from ~17 to ~99 m) falls within this regional envelope, suggesting that UZRB glaciers have responded consistently to the broader climatic forcing affecting Pamir and Pamir-Alay glaciers [5,59]. However, localized variations in retreat rates along the Zarafshon Glacier margin indicate complex interactions among topographic shading, debris cover distribution, and ice dynamics. Debris-covered tongues, particularly in the lower ablation zone, appear to retard melt locally [60,61], while supraglacial ponds and thermokarst depressions enhance melt through lower albedo and positive feedbacks in heat exchange [62]. For the Zarafshon Glacier, the velocity reduction is most pronounced near the mid-ablation zone, where longitudinal compression and surface lowering are accompanied by increased crevassing and the emergence of supraglacial lakes. These observations suggest a shift toward a more stagnant flow regime, possibly linked to enhanced internal drainage efficiency and reduced basal lubrication [63,64].
Between 2016 and 2024, the total area of supraglacial lakes nearly doubled, peaking around September 2022. The development of these lakes corresponds to intensified surface melting and the deepening of thermokarst depressions, processes increasingly reported across debris-covered glaciers in the Himalaya and Pamirs [54,62,65]. The spatial clustering of lakes along flowline discontinuities and heavily crevassed zones indicates that both surface meltwater accumulation and englacial drainage blockages sustain them.
Such features represent not only a surface manifestation of internal ice degradation but also a precursor to potential lake expansion and glacier lake outburst floods (GLOFs) [66,67]. Although observed lake changes in the study area (<0.02 km2) between 2016 and 2024 remain, their rapid morphological evolution warrants continued monitoring. Their presence also alters the local energy balance: lake surfaces absorb more solar radiation, amplifying localized ablation and accelerating nearby ice disintegration [68,69]. The interplay among debris thickness, meltwater routing, and lake expansion, therefore, plays a decisive role in shaping the near-future geomorphic trajectory of the glacier tongue.

6.2. Climatic Drivers and Hydrological Implications

The spatial heterogeneity of glacier behavior observed between 2016 and 2024 aligns with recent climatic trends documented in the Upper Zarafshon River Basin. Regional climatological records show persistent warming throughout the Pamir-Alay since the 1990s [5], consistent with data from the Dehavz station, which indicates a long-term temperature increase of approximately 0.01 °C yr−1 and an accelerated warming rate of ~0.21 °C yr−1 during 2016–2024. Precipitation exhibits pronounced interannual variability, characterized by a modest long-term increase but a discernible short-term drying trend in the most recent decade. Interannual variation in glacier area in the study area was closely associated with changes in temperature and precipitation during 2016–2024. Over this period, the annual mean temperature increased by about 0.21 °C/year, whereas annual precipitation decreased by about 5.6 mm/year. Under these climatic conditions, the glacier area decreased continuously from 254.11 km2 in 2016 to 252.80 km2 in 2024, resulting in a total loss of 1.31 km2. The annual glacier reduction was not uniform, with larger losses in 2021 (0.25 km2) and 2023 (0.22 km2), which corresponded to years with relatively unfavorable hydroclimatic conditions. These results indicate that rising temperatures were the dominant driver of glacier shrinkage, while decreasing precipitation likely enhanced glacier mass loss by reducing snow accumulation and accelerating surface ablation.
The observed intensification of surface melt, particularly over debris-covered glacier tongues, is likely due to enhanced regional warming. Increased meltwater production may modify subglacial hydrology and significantly influence ice flow dynamics through basal lubrication processes [70,71]. In upper glacier sectors, where ice thickness and driving stress remain relatively high, greater meltwater availability could contribute to transient acceleration, as reflected in the higher cumulative displacement values observed (up to ~610 m). Conversely, continued ice thinning in the lower ablation zones reduces driving stress, lowering velocity and leading to partial stagnation. The lower displacement values measured in the middle and lower glacier sectors (119–321 m) indicate dynamic weakening associated with a persistent negative mass balance.
The expansion of supraglacial lakes observed in 2022 coincided with elevated temperatures and likely reflects intensified surface melting, driven by evolving englacial drainage systems. The growth of these lakes reduces surface albedo, thereby amplifying localized ablation rates [72], while their downstream migration supports passive advection with glacier flow [48]. These processes collectively link climatic forcing to hydrological reorganization and changes in surface kinematics.
From a hydrological perspective, the implications are twofold. In the short term, accelerated glacier melt increases summer runoff and helps stabilize the seasonal water supply to downstream agricultural regions in Tajikistan and Uzbekistan. However, as the glacierized area continues to shrink, the basin is likely to approach “peak water,” after which a decline in meltwater contribution is anticipated [73]. This transition poses significant challenges for water resource management in the semi-arid context of Central Asia, where glacier melt currently accounts for 40–60% of summer discharge in the major tributaries of the Amu Darya River (ADR) [3].

6.3. Comparison with Other Central Asian and Global Studies

The magnitude of glacier retreat observed in the UZRB is comparable to that reported in recent studies of the Pamir and Tien Shan, yet it contrasts with the anomalous stability of parts of the Karakoram (Table 4), where glaciers remain near balanced mass budgets [74,75]. This contrast underscores the pronounced spatial heterogeneity of glacier–climate interactions in the UZRB [4]. The western Pamir-Alay, influenced by both westerly and monsoonal air masses, represents a transitional climatic zone where glaciers are particularly sensitive to subtle shifts in seasonal temperature and precipitation [76].
At the global scale, the patterns identified in the Zarafshon Glacier mirror those reported from the European Alps [77], the Andes [78], and the Himalaya [57,79], confirming that Central Asian glaciers are part of a synchronous, though regionally modulated, global trend of cryospheric decline. The coincident expansion of supraglacial lakes and deceleration of ice flow may thus be interpreted as signatures of a late-degradation phase in glacier evolution, preceding possible fragmentation and detachment of stagnant ice masses [44].
Table 4. Comparison of glacier change rates in different mountain regions and basins.
Mountain NameGlacier Name/
Basin/Study Area
Highest ElevationAverage Elevation (m)PeriodsAnnual Rates (%/a)Data Source
AlayUpper Zarafshon500038752016–2024−0.06Our study
Gissar-AlayAbramov496936061975–2015−0.2Denzinger, et al. [80]
Western Tien ShanAksu River Basin500030001990–2022−0.29Ren, et al. [81]
Eastern PamirEastern Pamir550040001994–2024−0.12Liu, et al. [82]
Central HimalayaUpper Alaknanda Basin580048001994–2020−0.16Mishra, et al. [83]

6.4. Implications, Future Research, and Study Limitations

The integration of Gaofen-2 and PlanetScope imagery in this study highlights the importance of using multi-resolution optical satellite imagery for monitoring fine-scale glacier dynamics in remote mountain basins. While radar-based methods, such as Sentinel-1 InSAR, can provide extended temporal coverage during cloudy periods, optical sensors excel at delineating supraglacial features and debris morphologies [84]. Moreover, establishing an integrated ground-based observation network in the UZRB that connects automatic weather stations, discharge gauges, and periodic GPS surveys would enable calibration of satellite-derived results. This integration could enhance our understanding of glacier-lake interactions and improve other distributed hydrological frameworks. Given the potential for supraglacial and proglacial lake formation and growth, it is crucial to prioritize hazard assessments as a key research and policy priority, especially for downstream settlements in the Zarafshon River basin.
Several limitations should be addressed in this study. The analysis relies primarily on optical satellite imagery, which can be constrained by cloud cover and seasonal snow. This may result in gaps in observations of surface displacement and meltwater. Additionally, mapping supraglacial lakes can be affected by shadows, small lake sizes, or mixed-pixel effects, introducing uncertainties in the accurate quantification of total lake area. Furthermore, the study period from 2016 to 2024 captures only short- to medium-term glacier dynamics, potentially underrepresenting longer-term trends and episodic surge events. Addressing these limitations in future work would enhance the accuracy of glacier change assessments and improve projections of cryospheric impacts in the Zarafshon River Basin.

7. Conclusions

This study presents a comprehensive assessment of glacier dynamics in the UZRB from 2016 to 2024, using high-resolution remote sensing datasets, including PlanetScope and Gaofen-2 imagery, as well as glacier velocity fields from the ITS_LIVE dataset. The findings indicate a persistent retreat of glaciers, with a total area reduction of 1.31 km2. Analysis of surface displacement, performed using morphological marker tracking and high-resolution satellite imagery, reveals pronounced spatial heterogeneity, with higher velocities in the upper glacier reaches and reduced movement in the lower glacier tongues. These variations are likely attributable to differences in surface slope, debris cover, and stagnation.
The evolution of supraglacial lakes was quantified using multi-temporal imagery, revealing a remarkable expansion in 2022, primarily driven by increased surface melting. Methods such as visual interpretation of satellite images, manual refinement of glacier outlines, and cross-validation with ground control points are used to ensure the accuracy and reliability of glacier boundary and supraglacial feature delineation.
Climatic observations from the Dehavz station during the period 2016–2024 reveal a temperature increase of 0.21 °C, accompanied by a discernible drying trend in precipitation, especially pronounced between 2016 and 2019. These climatic patterns align with observed glacier retreat and intensified melting, highlighting the important role of climate in driving cryospheric changes.
The findings demonstrate the effectiveness of using multi-source remote sensing data, specifically PlanetScope, Gaofen-2, and ITS_LIVE, for comprehensive monitoring of glacier dynamics and supraglacial features. The sustained application of these methods will be critical for tracking future changes in the UZRB and other glaciated regions, with important implications for hydrological forecasting and climate adaptation strategies.

Supplementary Materials

The following supporting information can be downloaded at: https://www.mdpi.com/article/10.3390/rs18091293/s1, Figure S1. Glacier surface velocity distribution and cross-validation between PlanetScope-derived and ITS_LIVE velocities. (a) Glacier boundaries, central lines, profile lines (P1–P11), central line points (red circles), and velocity measurement points (green circles) on the PlanetScope images, used to calculate glacier surface displacement. (b) Annual glacier surface velocity (m yr−1) derived from ITS_LIVE (2018). (c) Scatter plot comparing PlanetScope-derived velocities with ITS_LIVE velocities (m yr−1), showing strong agreement (R2 = 0.813) with the 1:1 line (orange dashed) and regression line (blue). Figure S2. Glacier area change (2016–2024) by geomorphological type and geographic aspect. (a) Glacier area change by geomorphological type; (b) glacier area change by geographic aspect. Figure S3. Slope and elevation characteristics of the mapped features: (a) slope distribution, (b) area–slope relationship, (c) elevation distribution, and (d) area–elevation relationship. Dashed lines indicate mean values in histograms and fitted regression lines in scatterplots. Figure S4. Temporal variation of annual temperature. (a) Interannual variability and linear trend during 1940–2024; (b) annual temperature and linear trend during 2016–2024. Figure S5. Temporal variation of annual precipitation. (a) Interannual variability and linear trend during 1940–2024; (b) annual precipitation and linear trend during 2016–2024.

Author Contributions

Conceptualization, A.H. and J.L.; methodology, A.H., J.L., M.S. and M.M.; software, M.S. and R.L.; validation, A.H., M.S., M.M. and R.L.; formal analysis, A.H., M.S., M.M. and R.L.; investigation, A.H., M.S., M.M. and S.S.; resources, J.L., F.N. and N.S.; data curation, A.H., M.S. and M.M.; writing—original draft preparation, A.H. and J.L.; writing—review and editing, M.S. and J.L.; visualization, A.H. and M.S.; supervision, J.L.; project administration, J.L. All authors have read and agreed to the published version of the manuscript.

Funding

This research was funded by the Natural Science Foundation of Xinjiang Uygur Autonomous Region (2023D01E18), the Tianshan Talent-Science and Technology Innovation Team (2022TSYCTD0006), and the Third Integrated Scientific Expedition Project in Xinjiang (2021xjkk1403).

Data Availability Statement

The raw data supporting of this study will be made available by the authors upon reasonable request.

Acknowledgments

Halimov Ardamehr expresses his sincere gratitude to the Xinjiang Institute of Ecology and Geography, Chinese Academy of Sciences (http://english.egi.cas.cn/, accessed on 15 February 2026); the University of the Chinese Academy of Sciences (UCAS) (https://www.ucas.ac.cn/, accessed on 15 February 2026); the State Scientific Institution “Center for Research of Glaciers of the National Academy of Sciences of Tajikistan” (https://cryosphere.tj/en/, accessed on 15 February 2026); and the Research Center for Ecology and Environment in Central Asia (Dushanbe) (https://www.rceeca.tj/en/, accessed on 15 February 2026) for their invaluable assistance in this research. The Agency for Hydrometeorology of the Committee for Environmental Protection under the Government of the Republic of Tajikistan (https://www.meteo.tj/en/, accessed on 15 February 2026) provided meteorological station data. The first author also gratefully acknowledges the financial support provided by the ANSO Scholarship Program (https://www.anso.org.cn/, accessed on 23 March 2026) during his master’s studies.

Conflicts of Interest

The authors declare no conflicts of interest.

References

  1. Oerlemans, J. Extracting a climate signal from 169 glacier records. Science 2005, 308, 675–677. [Google Scholar] [CrossRef] [Scilit] [PubMed]
  2. Zemp, M.; Frey, H.; Gärtner-Roer, I.; Nussbaumer, S.U.; Hoelzle, M.; Paul, F.; Haeberli, W.; Denzinger, F.; Ahlstrøm, A.P.; Anderson, B.; et al. Historically unprecedented global glacier decline in the early 21st century. J. Glaciol. 2015, 61, 745–762. [Google Scholar] [CrossRef] [Scilit]
  3. Sorg, A.; Bolch, T.; Stoffel, M.; Solomina, O.; Beniston, M. Climate change impacts on glaciers and runoff in Tien Shan (Central Asia). Nat. Clim. Change 2012, 2, 725–731. [Google Scholar] [CrossRef] [Scilit]
  4. Bolch, T.; Shea, J.M.; Liu, S.; Azam, F.M.; Gao, Y.; Gruber, S.; Immerzeel, W.W.; Kulkarni, A.; Li, H.; Tahir, A.A.; et al. Status and Change of the Cryosphere in the Extended Hindu Kush Himalaya Region. In The Hindu Kush Himalaya Assessment: Mountains, Climate Change, Sustainability and People; Springer: Cham, Switzerland, 2019; pp. 209–255. [Google Scholar]
  5. Barandun, M.; Pohl, E.; Naegeli, K.; McNabb, R.; Huss, M.; Berthier, E.; Saks, T.; Hoelzle, M. Hot Spots of Glacier Mass Balance Variability in Central Asia. Geophys. Res. Lett. 2021, 48, e2020GL092084. [Google Scholar] [CrossRef] [Scilit] [PubMed]
  6. Benn, P.; Borell, A.; Chiu, R.; Cuckle, H.; Dugoff, L.; Faas, B.; Gross, S.; Johnson, J.; Maymon, R.; Norton, M.; et al. Position statement from the Aneuploidy Screening Committee on behalf of the Board of the International Society for Prenatal Diagnosis. Prenat. Diagn. 2013, 33, 622–629. [Google Scholar] [CrossRef] [Scilit]
  7. Miles, S. Stakeholder Theory Classification: A Theoretical and Empirical Evaluation of Definitions. J. Bus. Ethics 2015, 142, 437–459. [Google Scholar] [CrossRef] [Scilit]
  8. Normatov, I.S.; Idiev, M.T.; Fayz, N.; Olsson, O.; Opp, C. Analyses and Monitoring of Water Resources (Quantity and Quality) of the Zerafshan River Basin. 2017, pp. 1–6. Available online: https://iwra.org/proceedings/congress/resource/PAP00-4836.pdf (accessed on 10 May 2025).
  9. Konovalova, G.I.; Nasyrov, M.A.; Shurupov, A.G.; Shchetinnikov, A.S. Catalog of Glaciers of the USSR. Vol. 14: Central Asia. Issue 3: Amu Darya Basin; Part 1: Basin of the Upper Reaches of the Zerafshan River from the Mouth of the Fandarya River; Part 2: Zerafshan River Basin below the Mouth of the Fandarya River; Gidrometeoizdat: Leningrad, Russia, 1982; 119p. (In Russian) [Google Scholar]
  10. Cogley, J.G. Glacier shrinkage across High Mountain Asia. Ann. Glaciol. 2016, 57, 41–49. [Google Scholar] [CrossRef] [Scilit]
  11. Humbert, A.; Helm, V.; Zeising, O.; Neckel, N.; Braun, M.H.; Khan, S.A.; Rückamp, M.; Steeb, H.; Sohn, J.; Bohnen, M.; et al. Insights into supraglacial lake drainage dynamics: Triangular fracture formation, reactivation, and long-lasting englacial features. Cryosphere 2025, 19, 3009–3032. [Google Scholar] [CrossRef]
  12. Livingstone, S.J.; Li, Y.; Rutishauser, A.; Sanderson, R.J.; Winter, K.; Mikucki, J.A.; Björnsson, H.; Bowling, J.S.; Chu, W.; Dow, C.F.; et al. Subglacial lakes and their changing role in a warming climate. Nat. Rev. Earth Environ. 2022, 3, 106–124. [Google Scholar] [CrossRef] [Scilit]
  13. Safarov, M.; Kang, S.; Fazylov, A.; Gulayozov, M.; Banerjee, A.; Navruzshoev, H.; Chen, P.; Xue, Y.; Murodov, M. Estimating glacier dynamics and supraglacial lakes together with associated regional hazards using high-resolution datasets in Pamir. J. Mt. Sci. 2024, 21, 3767–3788. [Google Scholar] [CrossRef] [Scilit]
  14. Lucchitta, B.K.; Ferguson, H.M. Antarctica: Measuring Glacier Velocity from Satellite Images. Science 1986, 234, 1105–1108. [Google Scholar] [CrossRef] [Scilit]
  15. Whillans, I.M.; Bindschadler, R.A. Mass Balance of Ice Stream B, West Antarctica. Ann. Glaciol. 1988, 11, 187–193. [Google Scholar] [CrossRef] [Scilit]
  16. Bindschadler, R.A.; Scambos, T.A. Satellite-Image-Derived Velocity Field of an Antarctic Ice Stream. Science 1991, 252, 242–246. [Google Scholar] [CrossRef] [Scilit]
  17. Scambos, T.A.; Dutkiewicz, M.J.; Wilson, J.C.; Bindschadler, R.A. Application of image cross-correlation to the measurement of glacier velocity using satellite image data. Remote Sens. Environ. 1992, 42, 177–186. [Google Scholar] [CrossRef] [Scilit]
  18. Scherler, D.; Leprince, S.; Strecker, M.R. Glacier-surface velocities in alpine terrain from optical satellite imagery—Accuracy improvement and quality assessment. Remote Sens. Environ. 2008, 112, 3806–3819. [Google Scholar] [CrossRef] [Scilit]
  19. Fahnestock, M.; Scambos, T.; Moon, T.; Gardner, A.; Haran, T.; Klinger, M. Rapid large-area mapping of ice flow using Landsat 8. Remote Sens. Environ. 2016, 185, 84–94. [Google Scholar] [CrossRef] [Scilit]
  20. Gardner, A.S.; Moholdt, G.; Scambos, T.; Fahnstock, M.; Ligtenberg, S.; van den Broeke, M.; Nilsson, J. Increased West Antarctic and unchanged East Antarctic ice discharge over the last 7 years. Cryosphere 2018, 12, 521–547. [Google Scholar] [CrossRef] [Scilit]
  21. Yu, J.; Liu, H.; Jezek, K.C.; Warner, R.C.; Wen, J. Analysis of velocity field, mass balance, and basal melt of the Lambert Glacier–Amery Ice Shelf system by incorporating Radarsat SAR interferometry and ICESat laser altimetry measurements. J. Geophys. Res. 2010, 115, B02409. [Google Scholar] [CrossRef] [Scilit]
  22. Vijay, S.; Khan, S.A.; Kusk, A.; Solgaard, A.M.; Moon, T.; Bjørk, A.A. Resolving Seasonal Ice Velocity of 45 Greenlandic Glaciers With Very High Temporal Details. Geophys. Res. Lett. 2019, 46, 1485–1495. [Google Scholar] [CrossRef] [Scilit]
  23. Messerli, A.; Grinsted, A. Image georectification and feature tracking toolbox: ImGRAFT. Geosci. Instrum. Methods Data Syst. 2015, 4, 23–34. [Google Scholar] [CrossRef] [Scilit]
  24. Van Wyk de Vries, M.; Wickert, A.D. Glacier Image Velocimetry: An open-source toolbox for easy and rapid calculation of high-resolution glacier velocity fields. Cryosphere 2021, 15, 2115–2132. [Google Scholar] [CrossRef] [Scilit]
  25. Stocker-Waldhuber, M.; Fischer, A.; Helfricht, K.; Kuhn, M. Long-term records of glacier surface velocities in the Ötztal Alps (Austria). Earth Syst. Sci. Data 2019, 11, 705–715. [Google Scholar] [CrossRef] [Scilit]
  26. García-Esteban, R. Surface Ice Velocity near the Terminus of Grey Glacier in the Southern Patagonian Icefield, Based on Direct Field Measurements. Geosciences 2025, 15, 452. [Google Scholar] [CrossRef] [Scilit]
  27. David Chadwell, C. Reliability analysis for design of stake networks to measure glacier surface velocity. J. Glaciol. 1999, 45, 154–164. [Google Scholar] [CrossRef]
  28. Lei, Y.; Gardner, A.; Agram, P. Autonomous Repeat Image Feature Tracking (autoRIFT) and Its Application for Tracking Ice Displacement. Remote Sens. 2021, 13, 749. [Google Scholar] [CrossRef] [Scilit]
  29. Gardner, A.S.; Greene, C.A.; Kennedy, J.H.; Fahnestock, M.A.; Liukis, M.; López, L.A.; Lei, Y.; Scambos, T.A.; Dehecq, A. ITS_LIVE global glacier velocity data in near-real time. Cryosphere 2025, 19, 3517–3533. [Google Scholar] [CrossRef] [Scilit]
  30. Olsson, O.; Gassmann, M.; Wegerich, K.; Bauer, M. Identification of the effective water availability from streamflows in the Zerafshan river basin, Central Asia. J. Hydrol. 2010, 390, 190–197. [Google Scholar] [CrossRef] [Scilit]
  31. Normatov, I.S.; Azimov, D.S.; Sharofzoda, F.A. Spatial Distribution of Precipitation and Its Contribution to the Formation of the Transboundary Zeravshan River Runoff (Tajikistan). Russ. Meteorol. Hydrol. 2023, 48, 682–686. [Google Scholar] [CrossRef] [Scilit]
  32. Kurbonov, N.B.; Frumin, G.T. The Impact of Climate Change on the Conditions of Formation and Chemical Composition of Water Resources in the Zeravshan River Basin; Lambert Academic Publishing: Beau Bassin, Mauritius, 2021; p. 145. (In Russian) [Google Scholar]
  33. Weibing, D.; Junli, L.; Anming, B.; Baoshan, W. Mapping changes in the glaciers of the eastern Tienshan Mountains during 1977–2013 using multitemporal remote sensing. J. Appl. Remote Sens. 2014, 8, 084683. [Google Scholar] [CrossRef] [Scilit]
  34. Hamandawana, H.; Eckardt, F.; Ringrose, S. Proposed methodology for georeferencing and mosaicking Corona photographs. Int. J. Remote Sens. 2007, 28, 5–22. [Google Scholar] [CrossRef] [Scilit]
  35. Murodov, M.; Li, L.; Safarov, M.; Lv, M.; Murodov, A.; Gulakhmadov, A.; Khusrav, K.; Qiu, Y. A Comprehensive Examination of the Medvezhiy Glacier’s Surges in West Pamir (1968–2023). Remote Sens. 2024, 16, 1730. [Google Scholar] [CrossRef] [Scilit]
  36. Jarvis, A.; Rubiano Mejía, J.E.; Nelson, A.; Farrow, A.; Mulligan, M. Practical Use of SRTM Data in the Tropics: Comparisons with Digital Elevation Models Generated Cartographic Data; International Center for Tropical Agriculture: Cali, Colombia, 2004. [Google Scholar]
  37. Bolch, T.; Menounos, B.; Wheate, R. Landsat-based inventory of glaciers in western Canada, 1985–2005. Remote Sens. Environ. 2010, 114, 127–137. [Google Scholar] [CrossRef] [Scilit]
  38. RGI Consortium. Randolph Glacier Inventory–A Dataset of Global Glacier Outlines, 6th ed.; Available online through the Global Land Ice Measurements from Space (GLIMS); NSIDC: Boulder, CO, USA, 2017; Available online: https://doi.org/10.7265/4M1F-GD79 (accessed on 27 June 2025). [CrossRef]
  39. Paul, F.; Huggel, C.; Kääb, A. Combining satellite multispectral image data and a digital elevation model for mapping debris-covered glaciers. Remote Sens. Environ. 2004, 89, 510–518. [Google Scholar] [CrossRef] [Scilit]
  40. Bolch, T.; Buchroithner, M.F.; Kunert, A.; Kamp, U. Automated delineation of debris-covered glaciers based on ASTER data. In Geoinformation in Europe, Proceedings of the 27th EARSeL Symposium, Bolzano, Italy, 4–7 June 2007; Millpress: Rotterdam, The Netherlands, 2007; pp. 4–6. [Google Scholar]
  41. Miles, E.S.; Willis, I.C.; Arnold, N.S.; Steiner, J.; Pellicciotti, F. Spatial, seasonal and interannual variability of supraglacial ponds in the Langtang Valley of Nepal, 1999–2013. J. Glaciol. 2017, 63, 88–105. [Google Scholar] [CrossRef] [Scilit]
  42. Soheb, M.; Ramanathan, A.; Bhardwaj, A.; Coleman, M.; Rea, B.R.; Spagnolo, M.; Singh, S.; Sam, L. Multitemporal glacier inventory revealing four decades of glacier changes in the Ladakh region. Earth Syst. Sci. Data 2022, 14, 4171–4185. [Google Scholar] [CrossRef] [Scilit]
  43. Lesi, M.; Nie, Y.; Shugar, D.H.; Wang, J.; Deng, Q.; Chen, H.; Fan, J. Landsat- and Sentinel-derived glacial lake dataset in the China–Pakistan Economic Corridor from 1990 to 2020. Earth Syst. Sci. Data 2022, 14, 5489–5512. [Google Scholar] [CrossRef] [Scilit]
  44. Kääb, A.; Berthier, E.; Nuth, C.; Gardelle, J.; Arnaud, Y. Contrasting patterns of early twenty-first-century glacier mass change in the Himalayas. Nature 2012, 488, 495–498. [Google Scholar] [CrossRef] [Scilit]
  45. Heid, T.; Kääb, A. Repeat optical satellite images reveal widespread and long-term decrease in land-terminating glacier speeds. Cryosphere 2012, 6, 467–478. [Google Scholar] [CrossRef] [Scilit]
  46. Steiner, J.F.; Buri, P.; Miles, E.S.; Ragettli, S.; Pellicciotti, F. Supraglacial ice cliffs and ponds on debris-covered glaciers: Spatio-temporal distribution and characteristics. J. Glaciol. 2019, 65, 617–632. [Google Scholar] [CrossRef] [Scilit]
  47. Rana, A.S.; Kunmar, P.; Mehta, M.; Kumar, V. Glacier retreat, dynamics and bed overdeepenings of Parkachik Glacier, Ladakh Himalaya, India. Ann. Glaciol. 2023, 64, 254–267. [Google Scholar] [CrossRef] [Scilit]
  48. Arthur, J.F.; Stokes, C.R.; Jamieson, S.S.R.; Carr, J.R.; Leeson, A.A. Distribution and seasonal evolution of supraglacial lakes on Shackleton Ice Shelf, East Antarctica. Cryosphere 2020, 14, 4103–4120. [Google Scholar] [CrossRef] [Scilit]
  49. Zeller, L.; McGrath, D.; McCoy, S.W.; Jacquet, J. Seasonal to decadal dynamics of supraglacial lakes on debris-covered glaciers in the Khumbu region, Nepal. Cryosphere 2024, 18, 525–541. [Google Scholar] [CrossRef] [Scilit]
  50. Immerzeel, W.W.; Kraaijenbrink, P.D.A.; Shea, J.M.; Shrestha, A.B.; Pellicciotti, F.; Bierkens, M.F.P.; de Jong, S.M. High-resolution monitoring of Himalayan glacier dynamics using unmanned aerial vehicles. Remote Sens. Environ. 2014, 150, 93–103. [Google Scholar] [CrossRef] [Scilit]
  51. Loriaux, T.; Ruiz, L. Spatio-Temporal Distribution of Supra-Glacial Ponds and Ice Cliffs on Verde Glacier, Chile. Front. Earth Sci. 2021, 9, 681071. [Google Scholar] [CrossRef] [Scilit]
  52. Taylor, C.J.; Carr, J.R.; Rounce, D.R. Spatiotemporal supraglacial pond and ice cliff changes in the Bhutan–Tibet border region from 2016 to 2018. J. Glaciol. 2022, 68, 101–113. [Google Scholar] [CrossRef] [Scilit]
  53. He, Z.; Yang, W.; Wang, Y.; Zhao, C.; Ren, S.; Li, C. Dynamic Changes of a Thick Debris-Covered Glacier in the Southeastern Tibetan Plateau. Remote Sens. 2023, 15, 357. [Google Scholar] [CrossRef] [Scilit]
  54. Watson, C.S.; Quincey, D.J.; Carrivick, J.L.; Smith, M.W. The dynamics of supraglacial ponds in the Everest region, central Himalaya. Global Planet. Change 2016, 142, 14–27. [Google Scholar] [CrossRef] [Scilit]
  55. Slaymaker, O.; Kelly, R. The Cryosphere and Global Environmental Change; Wiley-Blackwell: Oxford, UK, 2007. [Google Scholar]
  56. Bolch, T. Chapter 3—Past and Future Glacier Changes in the Indus River Basin. In Indus River Basin; Springer: Berlin/Heidelberg, Germany, 2019; pp. 85–97. [Google Scholar] [CrossRef] [Scilit]
  57. Hugonnet, R.; McNabb, R.; Berthier, E.; Menounos, B.; Nuth, C.; Girod, L.; Farinotti, D.; Huss, M.; Dussaillant, I.; Brun, F.; et al. Accelerated global glacier mass loss in the early twenty-first century. Nature 2021, 592, 726–731. [Google Scholar] [CrossRef] [Scilit] [PubMed]
  58. Mattea, E.; Bhattacharya, A.; Ghuffar, S.; Khatun, J.; Barandun, M.; Hoelzle, M. Predicted and observed glacier pulsations in the Hissar-Alay of Central Asia. EGUsphere 2025, 2025, 1–39. [Google Scholar] [CrossRef] [Scilit]
  59. Safarov, M.; Kang, S.; Murodov, M.; Banerjee, A.; Navruzshoev, H.; Gulayozov, M.; Fazylov, A.; Vosidov, F. Quantifying glacier surging and associated lake dynamics in Amu Darya river basin using UAV and remote sensing data. J. Mt. Sci. 2024, 21, 2967–2985. [Google Scholar] [CrossRef] [Scilit]
  60. Scherler, D.; Bookhagen, B.; Strecker, M.R. Spatially variable response of Himalayan glaciers to climate change affected by debris cover. Nat. Geosci. 2011, 4, 156–159. [Google Scholar] [CrossRef] [Scilit]
  61. Nicholson, L.; Benn, D.I. Properties of natural supraglacial debris in relation to modelling sub-debris ice ablation. Earth Surf. Processes Landforms 2013, 38, 490–501. [Google Scholar] [CrossRef] [Scilit]
  62. Miles, E.S.; Willis, I.; Buri, P.; Steiner, J.F.; Arnold, N.S.; Pellicciotti, F. Surface Pond Energy Absorption Across Four Himalayan Glaciers Accounts for 1/8 of Total Catchment Ice Loss. Geophys. Res. Lett. 2018, 45, 10464–10473. [Google Scholar] [CrossRef] [Scilit] [PubMed]
  63. Quincey, D.J.; Luckman, A.; Benn, D. Quantification of Everest region glacier velocities between 1992 and 2002, using satellite radar interferometry and feature tracking. J. Glaciol. 2009, 55, 596–606. [Google Scholar] [CrossRef] [Scilit]
  64. Benn, D.I.; Thompson, S.; Gulley, J.; Mertes, J.; Luckman, A.; Nicholson, L. Structure and evolution of the drainage system of a Himalayan debris-covered glacier, and its relationship with patterns of mass loss. Cryosphere 2017, 11, 2247–2264. [Google Scholar] [CrossRef] [Scilit]
  65. Nie, Y.; Sheng, Y.; Liu, Q.; Liu, L.; Liu, S.; Zhang, Y.; Song, C. A regional-scale assessment of Himalayan glacial lake changes using satellite observations from 1990 to 2015. Remote Sens. Environ. 2017, 189, 1–13. [Google Scholar] [CrossRef] [Scilit]
  66. Veh, G.; Korup, O.; von Specht, S.; Roessner, S.; Walz, A. Unchanged frequency of moraine-dammed glacial lake outburst floods in the Himalaya. Nat. Clim. Change 2019, 9, 379–383. [Google Scholar] [CrossRef] [Scilit]
  67. Wester, P.; Chaudhary, S.; Chettri, N.; Jackson, M.; Maharjan, A.; Nepal, S.; Steiner, J.F. Water, Ice, Society, and Ecosystems in the Hindu Kush Himalaya: International Centre for Integrated Mountain Development; ICIMOD: Kathmandu, Nepal, 2023. [Google Scholar] [CrossRef] [Scilit]
  68. Sakai, A.; Takeuchi, N.; Fujita, K.; Nakawo, M. Role of supraglacial ponds in the ablation process of a debris-covered glacier in the Nepal Himalayas. IAHS Publ. 2000, 265, 119–132. [Google Scholar]
  69. Watson, C.S.; Kargel, J.S.; Shugar, D.H.; Haritashya, U.K.; Schiassi, E.; Furfaro, R. Mass Loss From Calving in Himalayan Proglacial Lakes. Front. Earth Sci. 2020, 7, 342. [Google Scholar] [CrossRef] [Scilit]
  70. Schoof, C. Ice-sheet acceleration driven by melt supply variability. Nature 2010, 468, 803–806. [Google Scholar] [CrossRef] [Scilit]
  71. Bartholomaus, T.C.; Anderson, R.S.; Anderson, S.P. Growth and collapse of the distributed subglacial hydrologic system of Kennicott Glacier, Alaska, USA, and its effects on basal motion. J. Glaciol. 2011, 57, 985–1002. [Google Scholar] [CrossRef] [Scilit]
  72. Immerzeel, W.W.; Lutz, A.F.; Andrade, M.; Bahl, A.; Biemans, H.; Bolch, T.; Hyde, S.; Brumby, S.; Davies, B.J.; Elmore, A.C.; et al. Importance and vulnerability of the world’s water towers. Nature 2020, 577, 364–369. [Google Scholar] [CrossRef] [Scilit]
  73. Kraaijenbrink, P.D.A.; Bierkens, M.F.P.; Lutz, A.F.; Immerzeel, W.W. Impact of a global temperature rise of 1.5 degrees Celsius on Asia’s glaciers. Nature 2017, 549, 257–260. [Google Scholar] [CrossRef] [Scilit] [PubMed]
  74. Hewitt, K. The Karakoram Anomaly? Glacier Expansion and the ‘Elevation Effect,’ Karakoram Himalaya. Mt. Res. Dev. 2005, 25, 332–340. [Google Scholar] [CrossRef] [Scilit]
  75. Farinotti, D.; Longuevergne, L.; Moholdt, G.; Duethmann, D.; Mölg, T.; Bolch, T.; Vorogushyn, S.; Güntner, A. Substantial glacier mass loss in the Tien Shan over the past 50 years. Nat. Geosci. 2015, 8, 716–722. [Google Scholar] [CrossRef] [Scilit]
  76. Pohl, E.; Gloaguen, R.; Andermann, C.; Knoche, M. Glacier melt buffers river runoff in the Pamir Mountains. Water Resour. Res. 2017, 53, 2467–2489. [Google Scholar] [CrossRef] [Scilit]
  77. Zemp, M.; Huss, M.; Thibert, E.; Eckert, N.; McNabb, R.; Huber, J.; Barandun, M.; Machguth, H.; Nussbaumer, S.U.; Gärtner-Roer, I.; et al. Global glacier mass changes and their contributions to sea-level rise from 1961 to 2016. Nature 2019, 568, 382–386. [Google Scholar] [CrossRef] [Scilit] [PubMed]
  78. Dussaillant, I.; Berthier, E.; Brun, F.; Masiokas, M.; Hugonnet, R.; Favier, V.; Rabatel, A.; Pitte, P.; Ruiz, L. Two decades of glacier mass loss along the Andes. Nat. Geosci. 2019, 12, 802–808. [Google Scholar] [CrossRef] [Scilit]
  79. Brun, F.; Berthier, E.; Wagnon, P.; Kääb, A.; Treichler, D. A spatially resolved estimate of High Mountain Asia glacier mass balances from 2000 to 2016. Nat. Geosci. 2017, 10, 668–673. [Google Scholar] [CrossRef] [Scilit] [PubMed]
  80. Denzinger, F.; Machguth, H.; Barandun, M.; Berthier, E.; Girod, L.; Kronenberg, M.; Usubaliev, R.; Hoelzle, M. Geodetic mass balance of Abramov Glacier from 1975 to 2015. J. Glaciol. 2021, 67, 331–342. [Google Scholar] [CrossRef] [Scilit]
  81. Ren, P.; Pan, X.; Liu, T.; Huang, Y.; Chen, X.; Wang, X.; Chen, P.; Akmalov, S. Glacier Changes from 1990 to 2022 in the Aksu River Basin, Western Tien Shan. Remote Sens. 2024, 16, 1751. [Google Scholar] [CrossRef] [Scilit]
  82. Liu, H.; Zhang, Z.; Liu, S.; Xie, F.; Ding, J.; Li, G.; Su, H. Quantifying Spatiotemporal Changes in Supraglacial Debris Cover in Eastern Pamir from 1994 to 2024 Based on the Google Earth Engine. Remote Sens. 2025, 17, 144. [Google Scholar] [CrossRef] [Scilit]
  83. Mishra, A.; Nainwal, H.C.; Bolch, T.; Shah, S.S.; Shankar, R. Glacier inventory and glacier changes (1994–2020) in the Upper Alaknanda Basin, Central Himalaya. J. Glaciol. 2023, 69, 591–606. [Google Scholar] [CrossRef] [Scilit]
  84. Dehecq, A.; Gourmelen, N.; Gardner, A.S.; Brun, F.; Goldberg, D.; Nienow, P.W.; Berthier, E.; Vincent, C.; Wagnon, P.; Trouvé, E. Twenty-first century glacier slowdown driven by mass loss in High Mountain Asia. Nat. Geosci. 2019, 12, 22–27. [Google Scholar] [CrossRef] [Scilit]
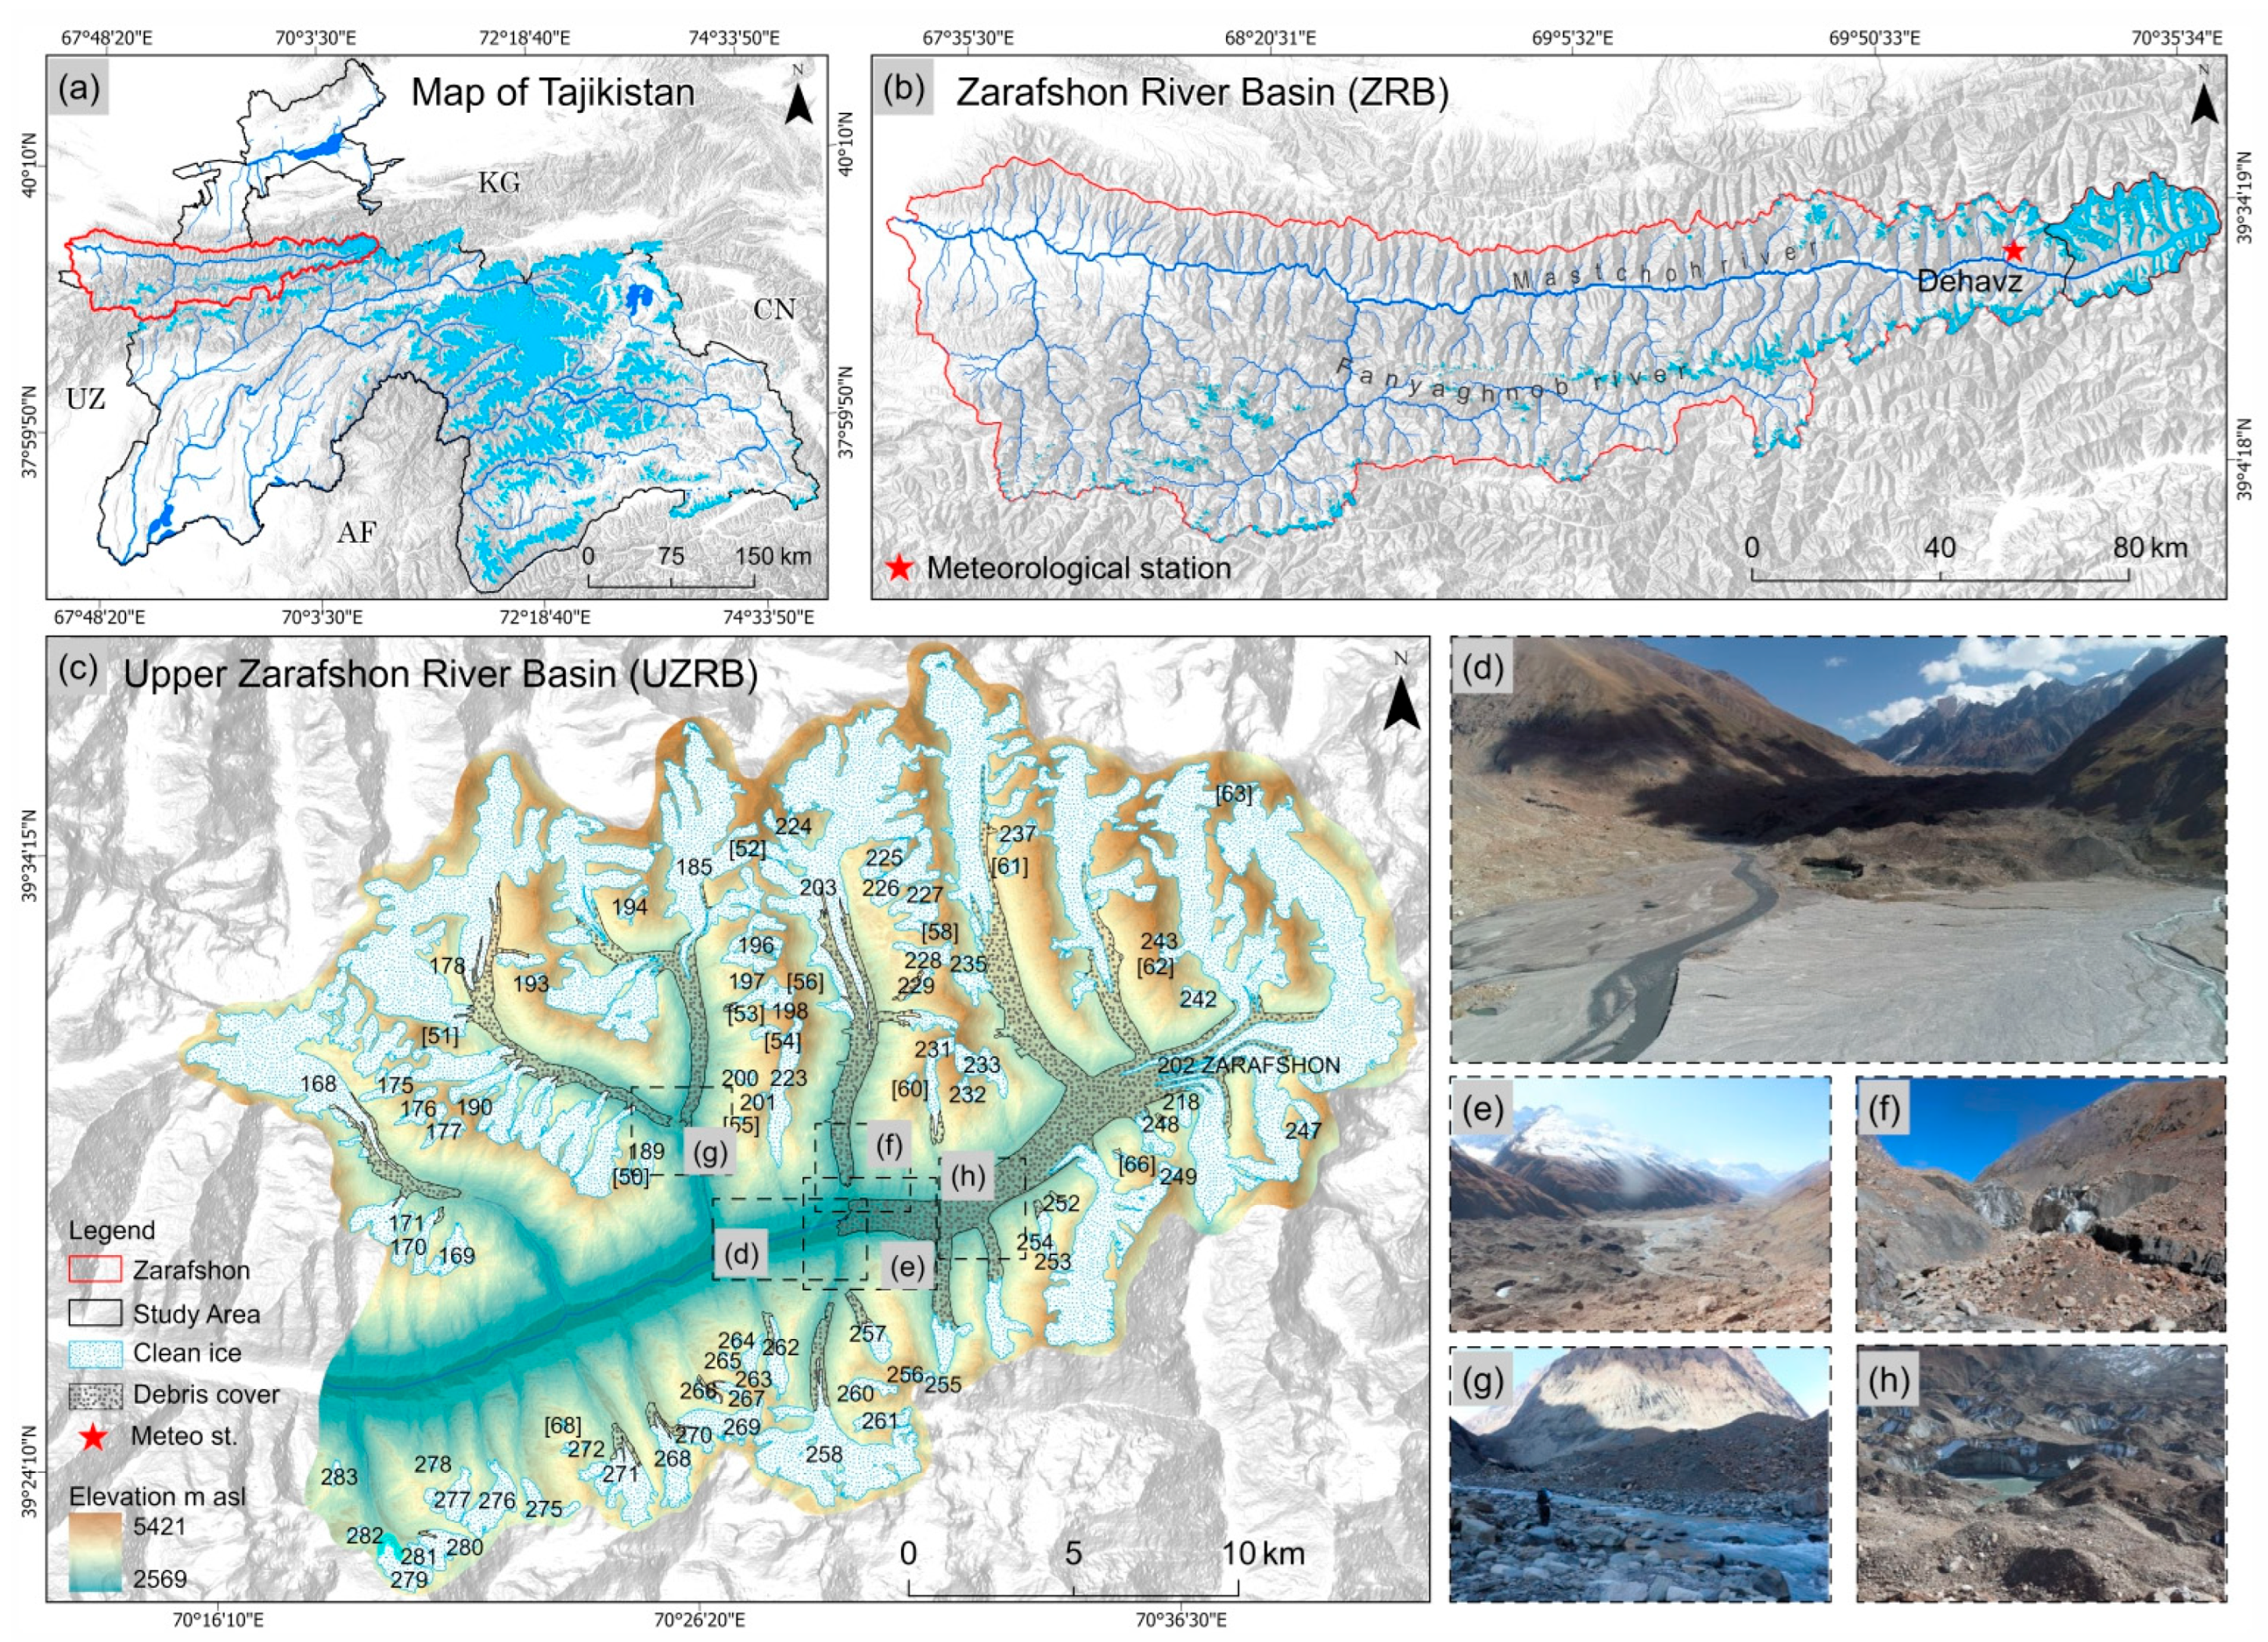
Figure 1. Overview of the study area and its location. (a) Central Asia map indicating Tajikistan; (b) Map of Zarafshon; (c) Map of the study area, illustrating glacier locations, elevation data, water inflows, and meteorological stations; (dh) Field observation images of Zarafshon glacier downstream.
Remotesensing 18 01293 g001
Figure 2. Conceptual framework of the study.
Remotesensing 18 01293 g002
Figure 3. Glacier delineation based on the PlanetScope image acquired on 20 September 2016: (a) RGI 6.0 (2017) glacier outlines; (b) RGI outlines overlaid on the PlanetScope image; (c) comparison of RGI and manually delineated PlanetScope glacier outlines; and (d) differences between the initial RGI outlines and the corrected PlanetScope-derived glacier boundaries.
Remotesensing 18 01293 g003
Figure 4. Conceptual illustration of glacier flow direction and supraglacial lake evolution on a glacier. Blue polygons represent supraglacial lakes observed at different times (tₙt1), showing downstream advection (dₙd1), consistent with glacier surface flow.
Remotesensing 18 01293 g004
Figure 5. Spatial distribution and morphological classification of glaciers within the study area: (a) glacier size classes overlaid on a DEM-derived elevation background (m a.s.l.); (b) glacier types.
Remotesensing 18 01293 g005
Figure 6. Retreat and separation of glaciers during the period 2016–2024. (a) Upper Zarafshon River Basin; (b) Rosinj Glacier; (c) Rama Glacier; (d) Zarafshon and Farakhnou glaciers.
Remotesensing 18 01293 g006
Figure 7. Changes in the supraglacial lakes during 2016-2024. (a) Lake outlines derived from PlanetScope images from September 20, 2016; (b) Lake outlines derived from PlanetScope images from 11 September 2024; (cj) indicates a zoomed part of the supraglacial lakes.
Remotesensing 18 01293 g007
Figure 8. Glacier characteristics in the upper Zarafshon River Basin (2016–2024): (a) supraglacial features, (b) glacier area distribution by elevation, (c) glacier aspect distribution, and (d) glacier hypsometry.
Remotesensing 18 01293 g008
Figure 9. Glacier surface velocity based on visible markers (lakes, rocks, and debris) during 2016–2024. (a) Overview of the study area; (b) rock markers; (c,d) lake markers; (eg) debris markers.
Remotesensing 18 01293 g009
Figure 10. Glacier surface velocity based on ITS_LIVE data for 2018.
Remotesensing 18 01293 g010
Table 1. Details of the satellite data and digital elevation model (DEM) used in this study.
Satellite/SensorDate of AcquisitionSpectral Bands
Used
Spatial
Resolution (m)
PlanetScope20 September 2016Blue, green,
red
3
8 September 2017; 13 September 2017; 15 September 2017
6 September 2018; 9 September 2018
23 September 2019; 24 September 2019
14 September 2020; 16 September 2020
26 September 2021; 27 September 2021; 28 September 2021
26 September 2022
13 September 2023
11 September 2024; 13 September 2024
Gaofen-215 September 2017Blue, green,
red
0.80
24 September 2020
2 September 2021
27 September 2022
7 September 2023
DEM
ALOS/PALSAR
2012 12.5
Table 2. Annual changes in the area of the glacier from 2016 to 2024.
Year201620172018201920202021202220232024Total
Area, km2254.11253.97253.82253.64253.47253.22253.07252.85252.8-
Area change km2-−0.14−0.15−0.18−0.17−0.25−0.15−0.22−0.06−1.31
Table 3. Supraglacial lake area changes.
Year201620172018201920202021202220232024
Area, m2139,785109,184144,892103,451107,49394,527121,04096,880115,248
Count62618183100761088383
Disclaimer/Publisher’s Note: The statements, opinions and data contained in all publications are solely those of the individual author(s) and contributor(s) and not of MDPI and/or the editor(s). MDPI and/or the editor(s) disclaim responsibility for any injury to people or property resulting from any ideas, methods, instructions or products referred to in the content.