Article

Modeling Long-Term LULC Changes and Future Urban Growth: A Case Study of Ulaanbaatar Using CA-Based Machine Learning

by
Ochirkhuyag Lkhamjav
1,2,3,
Usukhbayar Ganbaatar
3 and
Fuan Tsai
1,4,*
1
Department of Civil Engineering, National Central University, Taoyuan City 320317, Taiwan
2
Institute of Geography and Geoecology, Mongolian Academy of Sciences, Ulaanbaatar 15170, Mongolia
3
Mongolian Geospatial Association, Ulaanbaatar 15141, Mongolia
4
Center for Space and Remote Sensing Research, National Central University, Taoyuan City 320317, Taiwan
*
Author to whom correspondence should be addressed.
Remote Sens. 2026, 18(8), 1228; https://doi.org/10.3390/rs18081228
Submission received: 23 February 2026 / Revised: 29 March 2026 / Accepted: 14 April 2026 / Published: 18 April 2026

Highlights

What are the main findings?
  • Support Vector Machine (SVM) and Random Forest (RF) yielded comparable accuracy in multi-temporal LULC mapping, with no statistically meaningful difference between classifiers in capturing Ulaanbaatar’s land cover dynamics from 2000 to 2021.
  • CA-ANN simulations identify accessibility as a primary driver of urban growth, projecting a sustained decline in dense forest and grassland ecosystems through 2050 under a business-as-usual scenario.
What are the implications of the main findings?
  • Transition probability maps identify specific forest and grassland zones at highest risk of urban conversion through 2050, supporting the evidence-based delineation of green belt boundaries and targeted reforestation priorities aligned with Ulaanbaatar’s Master Plan.
  • This hybrid machine learning and cellular automata framework offers a replicable approach for city planners to anticipate urban sprawl and support evidence-based land management in rapidly developing regions.

Abstract

Accelerated urbanization in Ulaanbaatar, Mongolia, has driven substantial changes in Land Use and Land Cover (LULC), threatening sustainable urban ecosystems. This study investigates historical LULC dynamics (2000–2021) and simulates future expansion scenarios through 2050 using a hybrid Machine Learning (ML) and Cellular Automata-Artificial Neural Network (CA-ANN) approach. Multi-temporal classification was performed using Support Vector Machine (SVM) and Random Forest (RF) algorithms. Both classifiers demonstrated high and comparable accuracy; SVM achieved an average Kappa coefficient of 0.8939 while RF achieved 0.8917, a marginal difference that should be interpreted with caution. Change detection analysis revealed a continuous expansion of built-up areas at the expense of dense forest and grassland, a trend driven largely by accessibility factors. Future projections indicate that even as the rate of urbanization may slow, encroachment on green spaces will persist without policy intervention. This research presents a replicable methodological workflow for monitoring urban sprawl and provides evidence to inform sustainable land management and reforestation strategies in rapidly developing urban regions.

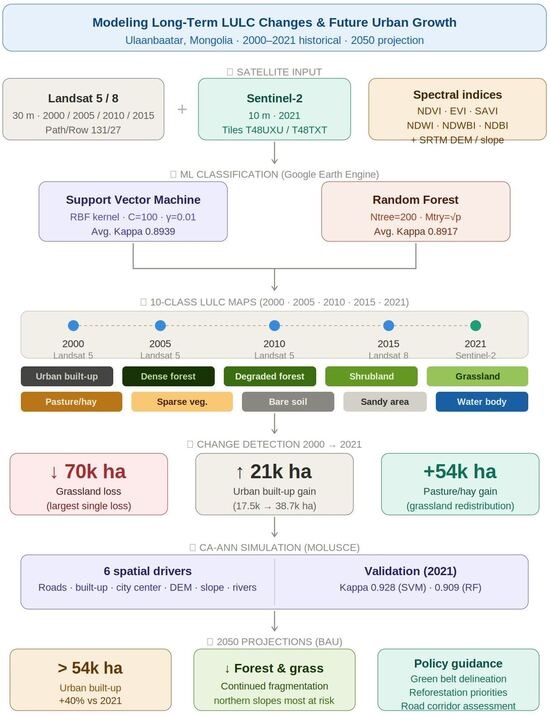
Graphical Abstract

1. Introduction

Natural resources and anthropogenic influences that characterize the various areas of the earth’s surface are known as Land Use and Land Cover (LULC) [1]. Due to the diversity of Land Use and Land Cover (LULC) systems, data sources, and methodologies, significant variations exist in contemporary LULC applications worldwide. Among the various approaches for generating LULC maps, the classification of remotely sensed imagery using advanced algorithms remains a cornerstone method [2]. Over time, a range of classification techniques has been developed and applied, encompassing both unsupervised and supervised methods to address diverse LULC mapping needs. Accurate information about LULC is essential for different levels of applications, such as managing and monitoring environmental resources [3,4]. In remote sensing (RS), multi-temporal LULC classifications and their change analysis are two important tasks, which serve as the basis for ecological sustainability and have been discussed extensively in the last few decades [5].
In general, LULC data provide crucial factors for earth monitoring. It shows a close connection between the rapid development of human societies and the changes in the ecological environment. These changes have amplified a wide range of processes, resulting in a constant and observable impact on LULC [6]. Classification maps generated from this data can be used to monitor and assess changes in selected areas of interest. Thus, accurate mapping of LULC classification enables the implementation of appropriate environmental management practices and improves understanding of its impact on climatic and environmental systems [7]. To analyze LULC changes optimally, statistical data that includes multiple values are required. The process involves identifying changes in objects and phenomena by monitoring them in numerous phases [8,9]. Optimized change detection and analysis of Earth’s surface characteristics are beneficial for creating the framework for understanding the relationship between human and environmental activities. It can also improve resource management and usage [10].
Recently, machine learning (ML) classification algorithms have greatly developed the effectiveness and application of variations. In that way, numerous ML classification algorithms are available for multiple applications in different fields. Random Forest (RF) and Support Vector Machine (SVM) classifiers are among the most frequently used, especially for RS applications [11,12]. However, the performance of ML algorithms can be affected by several factors such as data sources, standards, parameter settings, and the number of other datasets input. To assess the effectiveness of these algorithms, it is crucial to compare accuracy assessments based on the preparation of training and test samples. This can help in evaluating the effectiveness of these algorithms and determining their suitability for different applications.
Techniques for analyzing LULC have significantly advanced in recent years with spatial analysis and future simulation modeling. These models have played a crucial role in studying the factors that affect LULC simulations of past to future scenarios and how they vary in different circumstances. Various models use different approaches to tackle complex issues related to LULC. Neural network models, for instance, have proven to be a crucial technique for simulating LULC changes, as they accurately capture the non-linear and spatially probabilistic nature of these changes. By assessing various factors that influence LULC patterns and exploring different scenarios, neural network models have become indispensable tools for urban planning, environmental monitoring, and resource allocation [13]. Meanwhile, transitional potential modeling and projecting probability of LULC change techniques have been developed to determine past and potential future locations of change based on geospatial data. These models require multiple source data to analyze the LULC transition matrix and make predictions about future conditions when combined with geospatial factors [13,14].
The dynamics of Land Use and Land Cover (LULC) changes can be effectively analyzed using Cellular Automata (CA) models, which facilitate the identification of spatial correlations [15]. In the CA framework, the study area is discretized into a grid of cells, with each cell assigned a specific LULC class based on its attributes. The integration of CA with Artificial Neural Networks (ANN) provides a robust modeling framework for predicting LULC transitions. As a core component of Artificial Intelligence (AI), ANN enhances the CA model by determining transition rules and parameter values based on input data [16]. The ANN model estimates the transition probability for each cell within the CA grid, enabling the CA model to simulate spatial patterns of LULC change based on these probabilities. The accuracy of these simulations is highly dependent on the quality of input data used to train the ANN, including historical and current LULC classification maps and relevant spatial variables [17]. The integrated CA-ANN model offers valuable insights for urban planners and policymakers, enabling informed decision-making in urban planning and land management by forecasting the impacts of various scenarios on future LULC patterns [16].
The findings of this study provide critical insights for developing effective land management and urban master planning strategies to address the challenges of rapid urbanization. By analyzing historical and current Land Use and Land Cover (LULC) trends and employing machine learning (ML) techniques to forecast future scenarios, this research elucidates the intricate interplay between urbanization and the urban environment. These insights enable local authorities to construct robust predictive models for anticipating future LULC transitions, thereby facilitating informed decision-making and strategic urban planning. Furthermore, the results support the formulation of policies that promote sustainable urban development while safeguarding environmental integrity. By achieving a balanced approach to urban expansion and LULC transitions, this research addresses key challenges to sustainable urban development. It enhances the potential for creating cities that offer livable urban environments while prioritizing long-term sustainability and environmental well-being. Consequently, this study is instrumental in tackling urbanization challenges in Ulaanbaatar and serves as a valuable reference for sustainable urban planning and management in other developing cities in Mongolia facing comparable issues.
Urbanization may cause environmental imbalance, particularly in developing countries, and it is driven by multiple reasons. While Mongolia’s population growth rate is not particularly high, a significant proportion (about 68%) of the population lives in a few key urban areas [18]. The capital city of Ulaanbaatar was initially planned in 1950 to have a population of 600,000. However, the population continues to grow. As of now, there are officially 1.6 million registered residents in Ulaanbaatar, with an additional 78,000 people moving into the city between 2019 and 2021 [19]. Unfortunately, urban development has not kept pace with population growth, resulting in excessive density and concentration in the city. This has become a significant issue due to urban expansion and inadequate infrastructure, which is in stark contrast to the City Master Plan and Development Approaches of Ulaanbaatar City [20].
Previous research showed the land management and master planning of Ulaanbaatar city has experienced a 16.4 percent increase in the designated area of a suitable residential area as of 2019 [21]. Based on this research, the main objective of this study is to detect and analyze the impact of rapid urban growth and expansion on the sustainable development of the urban environment. Emphases are placed on understanding how these factors influence urban LULC changes, specifically addressing the imbalance in LULC transitions between urban built-up areas and the urban green zone, along with other vegetation-covered areas.
By achieving a balance between urban expansion and transitions in LULC, numerous issues associated with sustainable urban development can be addressed. On the other hand, this approach will enhance the prospects of constructing a city that not only offers a comfortable urban environment but also prioritizes long-term sustainability and environmental well-being. Therefore, this research is crucial in addressing the urbanization challenges faced by Ulaanbaatar and can serve as a valuable reference for sustainable urban planning and management in other developing cities of Mongolia facing similar challenges.
The main purpose of this research is to investigate the past changes and future trends in LULC and urban expansion in Ulaanbaatar, Mongolia. To achieve this goal, advanced ML classification algorithms, specifically RF and SVM, were selected and applied to Sentinel-2 and Landsat 5 and 8 satellite data, enabling a comprehensive analysis of long-term LULC changes. Using a combination of multi-spectral satellite images from 2000 to 2021, extensive ground surveys, and existing research on Ulaanbaatar city, LULC classification maps were extracted for five significant periods (2000, 2005, 2010, 2015, and 2021). These maps provide a detailed representation of the spatial distribution and dynamics of LULC over time. To assess the accuracy of the generated classification maps, rigorous accuracy assessments were conducted for each selected year-interval and method, allowing for in-depth analysis and comparison of the results.

2. Materials and Methods

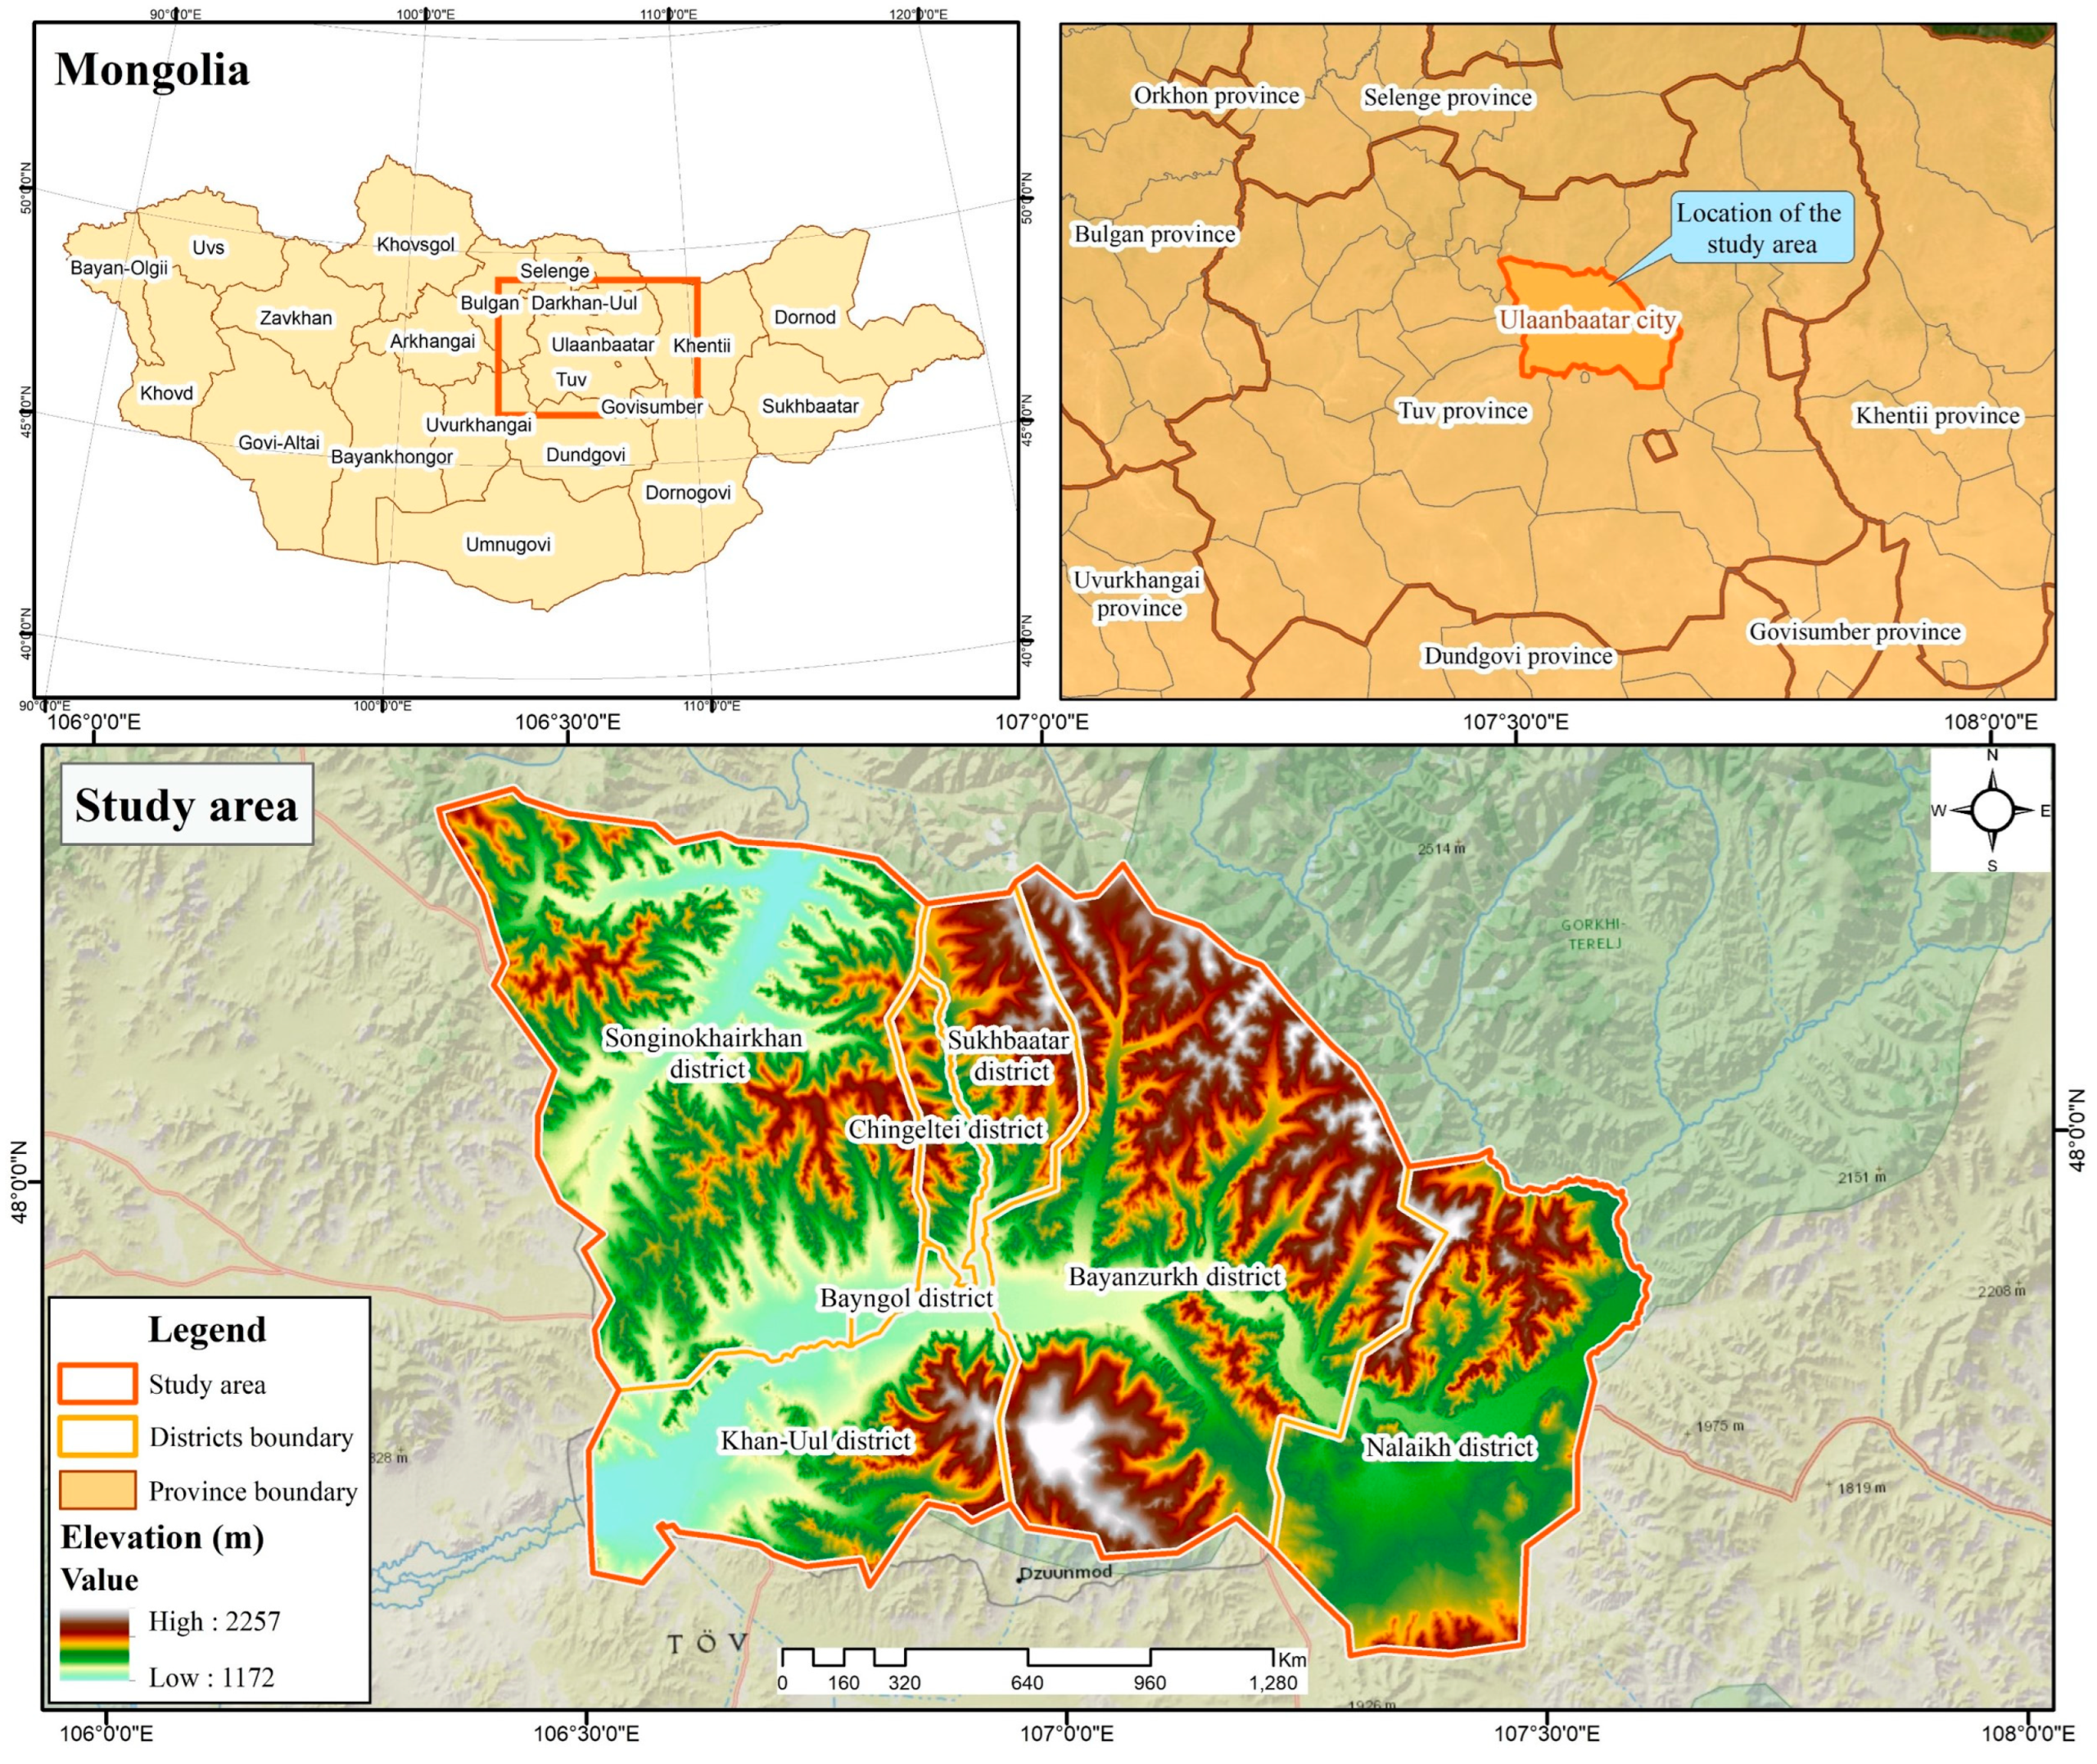
The area of interest in this study is Ulaanbaatar city, which has been one of the fastest-growing cities over the past few decades in Mongolia (Figure 1). Ulaanbaatar city is in the center of Mongolia along the southern edge of the Khentii mountain range. It is surrounded by mountains from four sides of the valley along the Tuul River basin. The full administrative municipality of Ulaanbaatar covers 470,440 ha across all nine districts and is home to almost 1.6 million residents as of 2021 [22]. It is located at an average height of 1351 m above sea level. The nine administrative districts are divided into 204 sub-districts. Two districts, Baganuur and Bagakhangai, are geographically isolated from the main urban agglomeration and are excluded from the analytical area of interest (AOI). The remaining seven contiguous central districts constitute the study AOI, with a total area of approximately 75,625 ha 756.25 km2. All area statistics reported in this study correspond exclusively to this seven-district AOI. The three primary divisions of the research area are ger-places, city center, and the other area [23].
To characterize the long-term spatiotemporal dynamics of land use and land cover (LULC) in Ulaanbaatar, a multi-temporal dataset spanning the period from 2000 to 2021 was compiled. As detailed in Table 1, the study utilized medium-resolution optical imagery from the Landsat archive for the earlier epochs, specifically Landsat 5 Thematic Mapper (TM) for the years 2000, 2005, and 2010, and Landsat 8 Operational Land Imager (OLI) for 2015. These datasets were acquired with a standardized spatial resolution of 30 m (Path/Row 131/27). For the most recent epoch (2021), Sentinel-2 imagery was employed at a spatial resolution of 10 m. To minimize the influence of seasonal phenological changes and cloud cover, image acquisition was concentrated during the vegetation growing season (June through September), with supplementary dates in late spring and autumn utilized to ensure complete spatial coverage. Given the mixed-sensor design, resolution harmonization was applied prior to CA-ANN modeling: Landsat-derived classifications (native 30 m) were resampled to 10 m using nearest-neighbor interpolation to preserve categorical label integrity, as required by the MOLUSCE module’s uniform raster specification (9478 × 6778 pixels at 10 m). Classification was performed at each sensor’s native resolution before resampling. Readers should note that accuracy figures for 2021 partly reflect the higher spatial detail of Sentinel-2 and should not be interpreted as indicating superior algorithmic performance relative to earlier epochs.
The research plan was organized by gathering information and creating an understanding of other relevant studies within the scope of this research before starting the main technical process. Initially, different sources of multi-temporal satellite data were collected and pre-processed, including Landsat TM and OLI-TIRS scenes and Sentinel 2 imageries covering the entire area of Ulaanbaatar city, Mongolia from 2000 to 2021. At the same time, suitable LULC classes within the selected study area were identified based on a combination of field surveys and high-resolution Google Earth images. Following that, reference point datasets related to the LULC classes were obtained through photointerpretation and in situ techniques. Reference samples were collected as stratified random points with a minimum spatial separation of 500 m between training and validation points to ensure independence and reduce spatial autocorrelation. Sample counts per class per year ranged from approximately 120 to 300 points, with over-represented classes sub-sampled to maintain class balance. Temporally stable sites (e.g., permanent water bodies, urban core, high-density forest ridgelines) were used to anchor consistent labeling across epochs, supplemented by year-specific points for dynamic classes. Identical reference datasets were used for both SVM and RF classifiers within each year to ensure comparable evaluation. Input features for both classifiers included all available spectral bands for the relevant sensor, plus six spectral indices: NDVI, EVI, SAVI, NDWI, NDWBI, and NDBI. Elevation and slope derived from the SRTM DEM were included as static covariates.
Generally, machine learning methods were the primary methodology used for LULC classification in this research. The Support Vector Machines (SVM) and Random Forest (RF) methods were applied to assess the LULC maps using corrected satellite images in GEE. SVM was implemented with a Radial Basis Function (RBF) kernel; the cost parameter C and gamma were optimized using a grid search (C = 100, gamma = 0.01), and all features were normalized to [0, 1] prior to classification. The SVM is a non-parametric classifier used to solve classification issues in datasets with unknown patterns between variables. SVM can identify linear two-class problems but can also classify nonlinear and multi-class data using statistical learning theory [24]. Random Forest is a powerful ML classifier that uses bagging and random subspace techniques to create decision trees. RF was configured with Ntree (number of trees) set to 200, and Mtry (features randomly sampled at each split) set to the square root of the total number of input features (rounded to the nearest integer), consistent with standard practice [24]. Both classifiers used identical input features per year and were trained and validated on the same reference sample sets to ensure comparability.
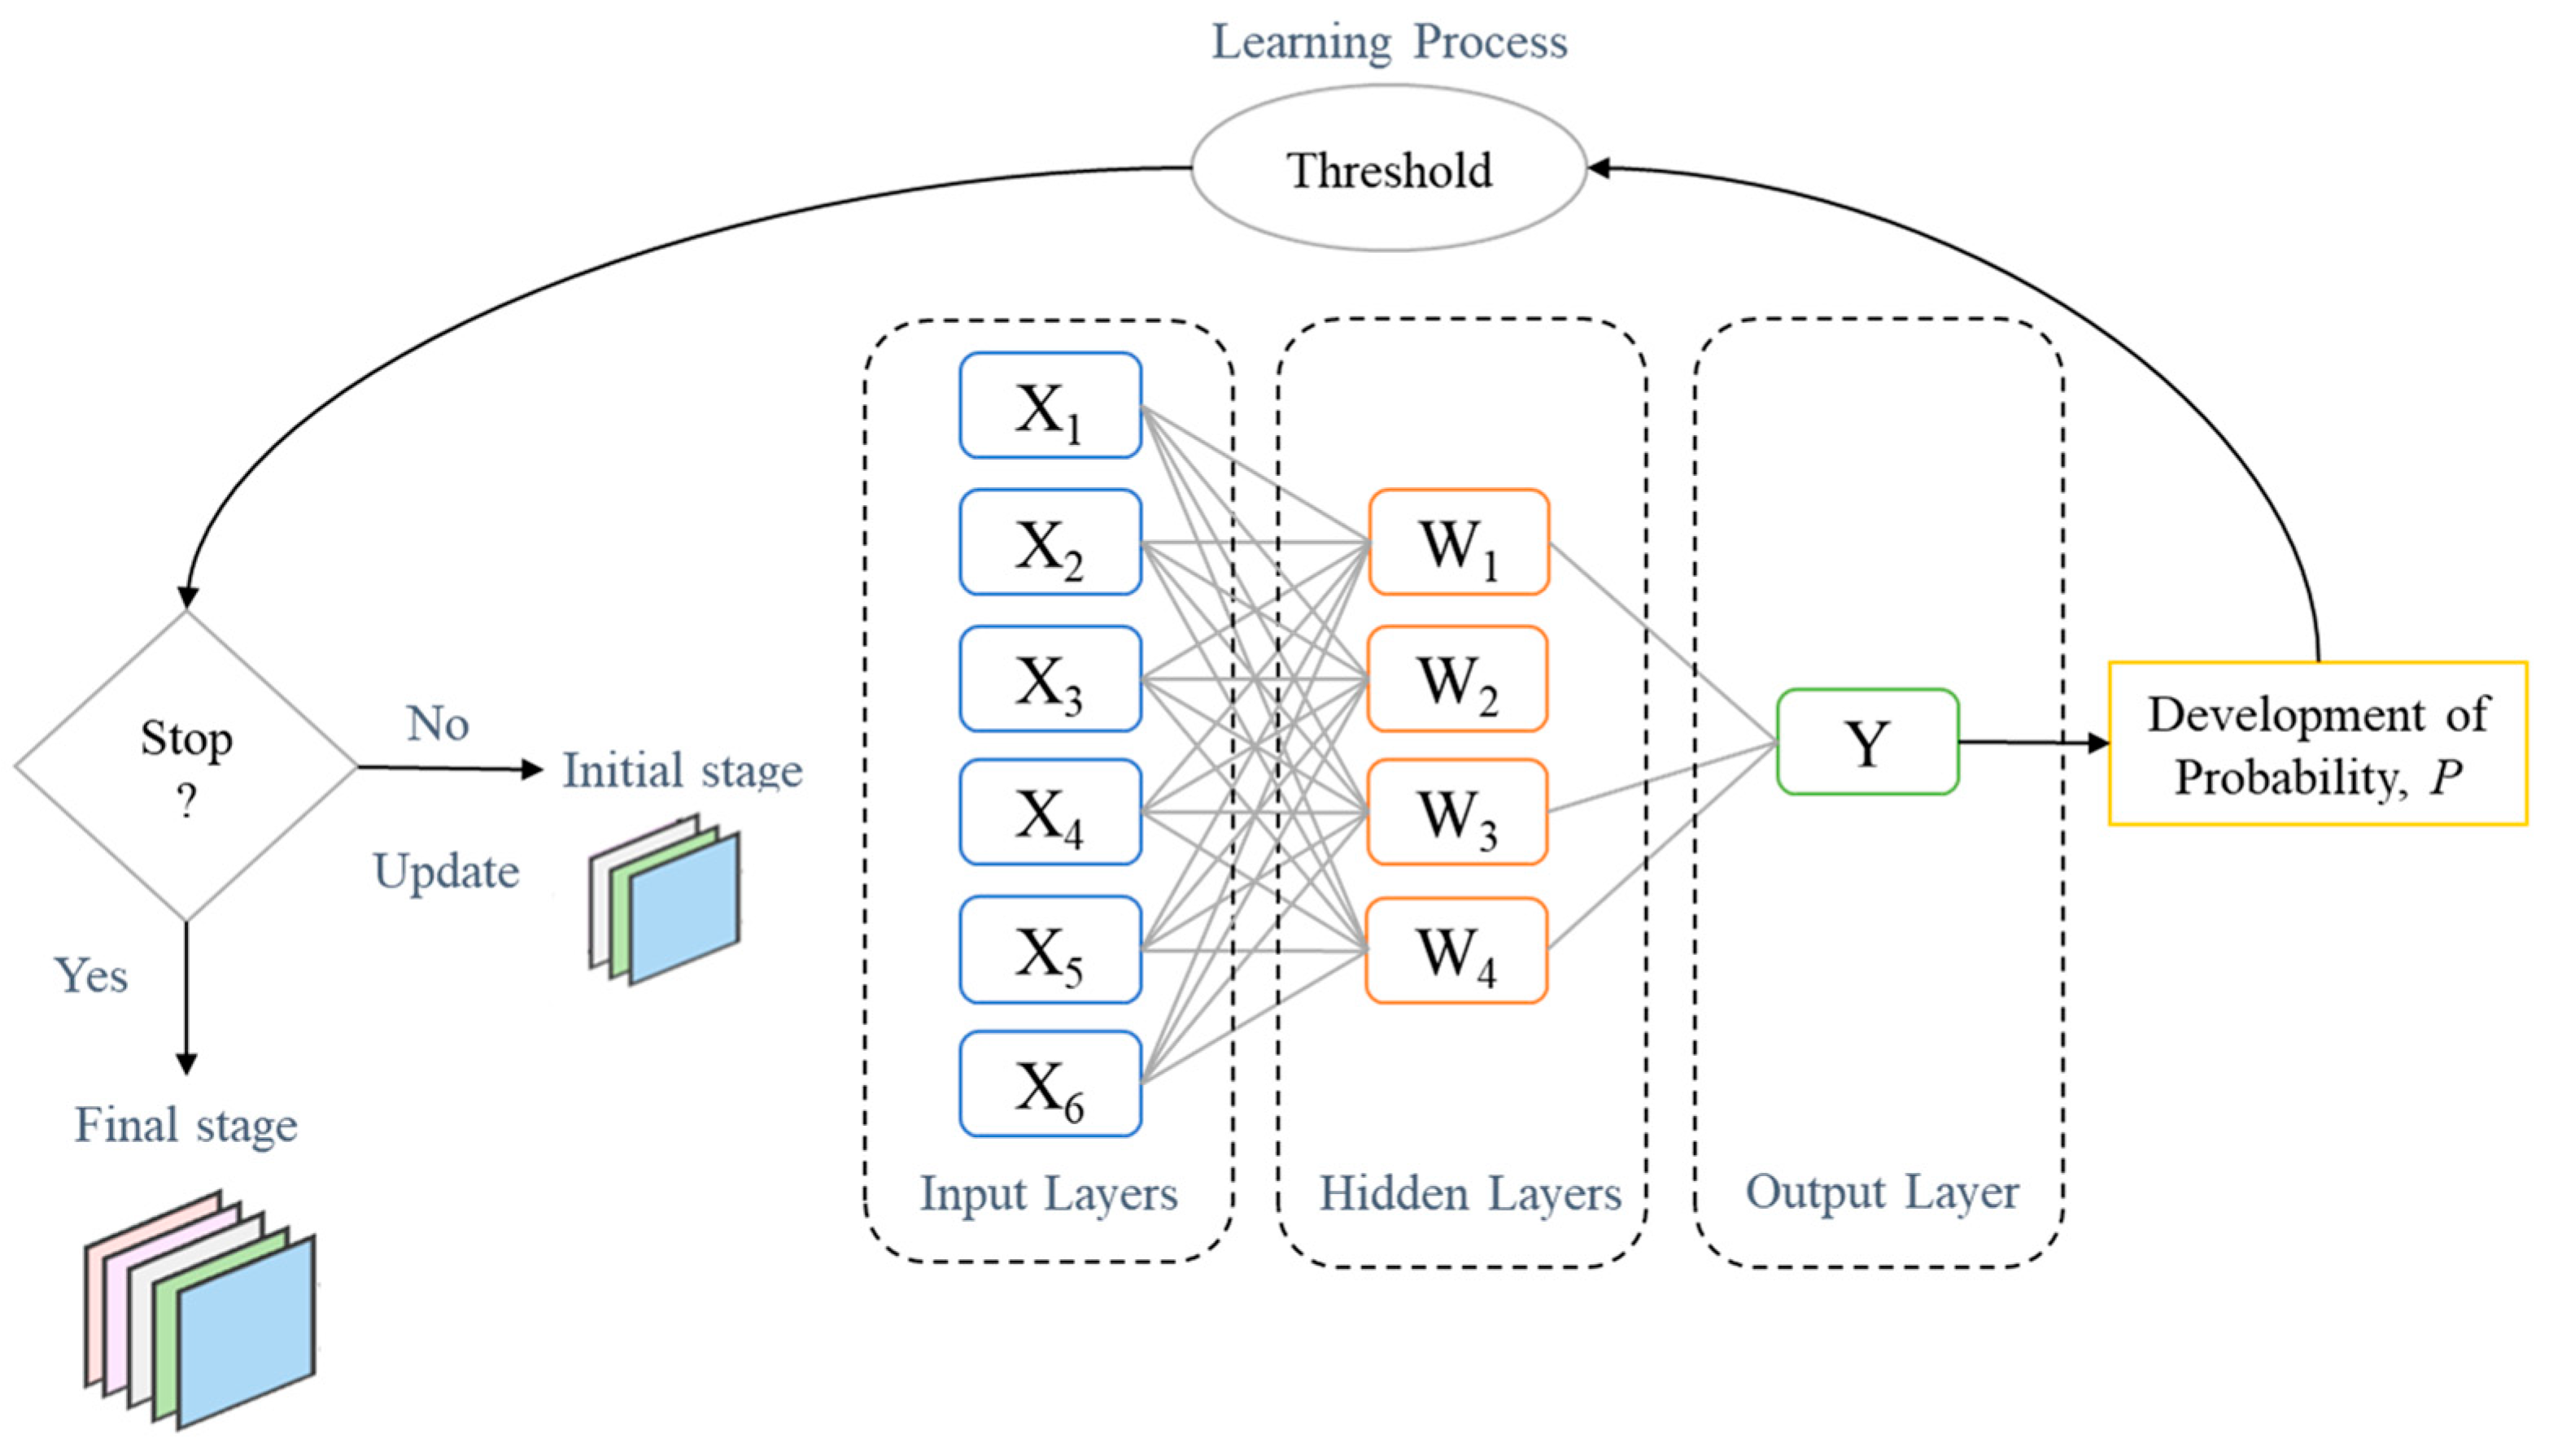
The CA-ANN model leverages the variational learning dynamics of the Artificial Neural Network (ANN) to elucidate Land Use and Land Cover (LULC) changes, supported by the simulation capabilities of the MOLUSCE module (Figure 2). Through the MOLUSCE framework, the CA-ANN model forecasts and models future LULC trends. The LULC change modeling process within the MOLUSCE module follows a structured methodology comprising the following key steps. Six spatial driver variables were used as ANN inputs: (1) distance to primary and secondary roads, (2) distance to existing urban built-up land, (3) distance to city center (Sükhbaatar Square), (4) elevation from SRTM 30 m DEM, (5) slope derived from SRTM, and (6) distance to rivers. All continuous variables were normalized to [0, 1] prior to input. A Moore 3 × 3 neighborhood was applied. The model was calibrated on 2000–2015 LULC transitions and validated against the observed 2021 map as a true out-of-sample test. The ANN underwent 10 iterations; convergence monitoring confirmed Kappa stabilized after 8 iterations, and 10 was retained as a conservative margin. The LULC change modeling process follows these key steps:
  • Preparation of input data;
  • Evaluation of correlations;
  • Change analysis and transition potential modeling;
  • Prediction and model validation.
To perform accurate assessments of LULC changes using the MOLUSCE module, it is essential to simulate LULC precisely, considering various factors that contribute to these changes, in addition to historical and current LULC mapping. By integrating these variables into the simulation process, the MOLUSCE module provides a comprehensive and effective approach to analyzing and projecting changes in the LULC pattern’s expected period. The simulation operates at the cellular level, with each cell having a unique set of attributes, or spatial variables, which are used as inputs for the neural network. These spatial variables can be represented as:
X = [ x 1 , x 2 , x 3 , , x n ] T
where xi is the i-th attribute, and T is a transposition.
The above sections provide detailed descriptions of how the input data are prepared. All input raster data is formatted in TIF and set to a pixel size of 10 m, as specified in the module evaluation criteria, with column and row numbers set to 9478 × 6778 in each raster.
Furthermore, Figure 2 illustrates that the ANN structure comprises three layers: input, hidden, and output. Each spatial variable is linked with a neuron in the input layer, following scaling within the interval [0, 1]. As a result, the input layer neurons, which correspond to the attributes. In the hidden layer, the net signal received by the j-th neuron, netj(k,t), from the input layer for the k-th cell at time t is computed as follows:
n e t j k , t = i w i , k x i k , t
In this context, the weight that connects the input and hidden layers is called ‘w’, while “x” corresponds to the i-th scaled attribute associated with the i-th neuron in the input layer, for the k-th cell at time t.
P k , t , l = j w j , l 1 1 + e n e t j ( k , t )
In this context, “P(k,t,l)” refers to the probability of converting from the existing LULC to the l-th type for the k-th cell at time t. “w” denotes the weight between the hidden and output layers. A larger weight value implies a higher probability of transitioning from the initial LULC type to the l-th type.
To accurately predict changes in land use, it is essential to utilize a robust model that considers current land use data and relevant factors. The method involved analyzing LULC data from 2000 to 2021, along with transition matrices and spatial variables, to predict LULC maps up to 2050. This module’s kappa validation technique was used to validate the accuracy of the model and compare actual and projected LULC images. The module can calculate three types of kappa statistics. As follows:
K a p p a = p o p e 1 p e
K a p p a l o c = p o p e p m a x p e
K a p p a h i s = p m a x p e 1 p e
In this context, “po” refers to the proportion of observed agreements, while “pe” corresponds to the proportion of agreements that would be expected by chance.
p o = i = 1 c p i j
p e = i = 1 c p i j T p T j
p m a x = i = 1 c m i n ( p i T , p T j )
where “pij” represents the value of the i, j-th cell in the contingency table, “piT” corresponds to the sum of all cells in the i-th row, “Ptj” represents the sum of all cells in the j-th column, and “c” is the count of categories in the raster.
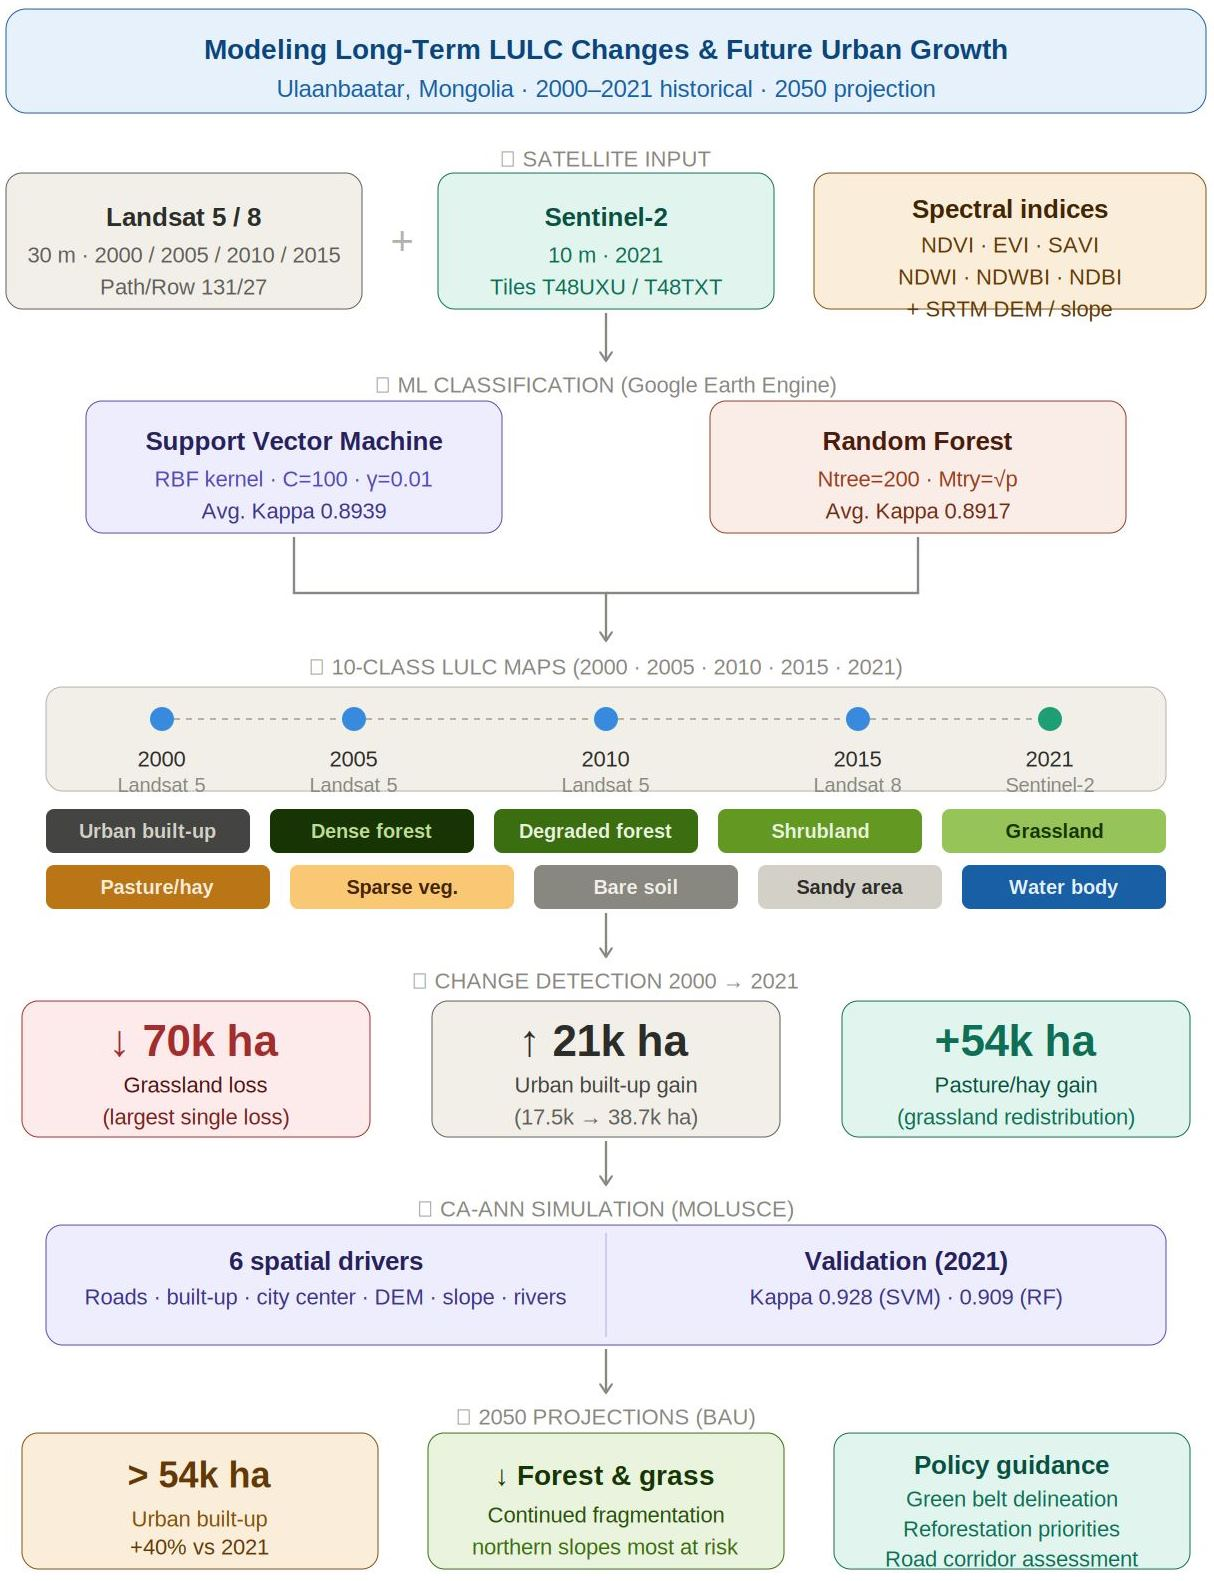
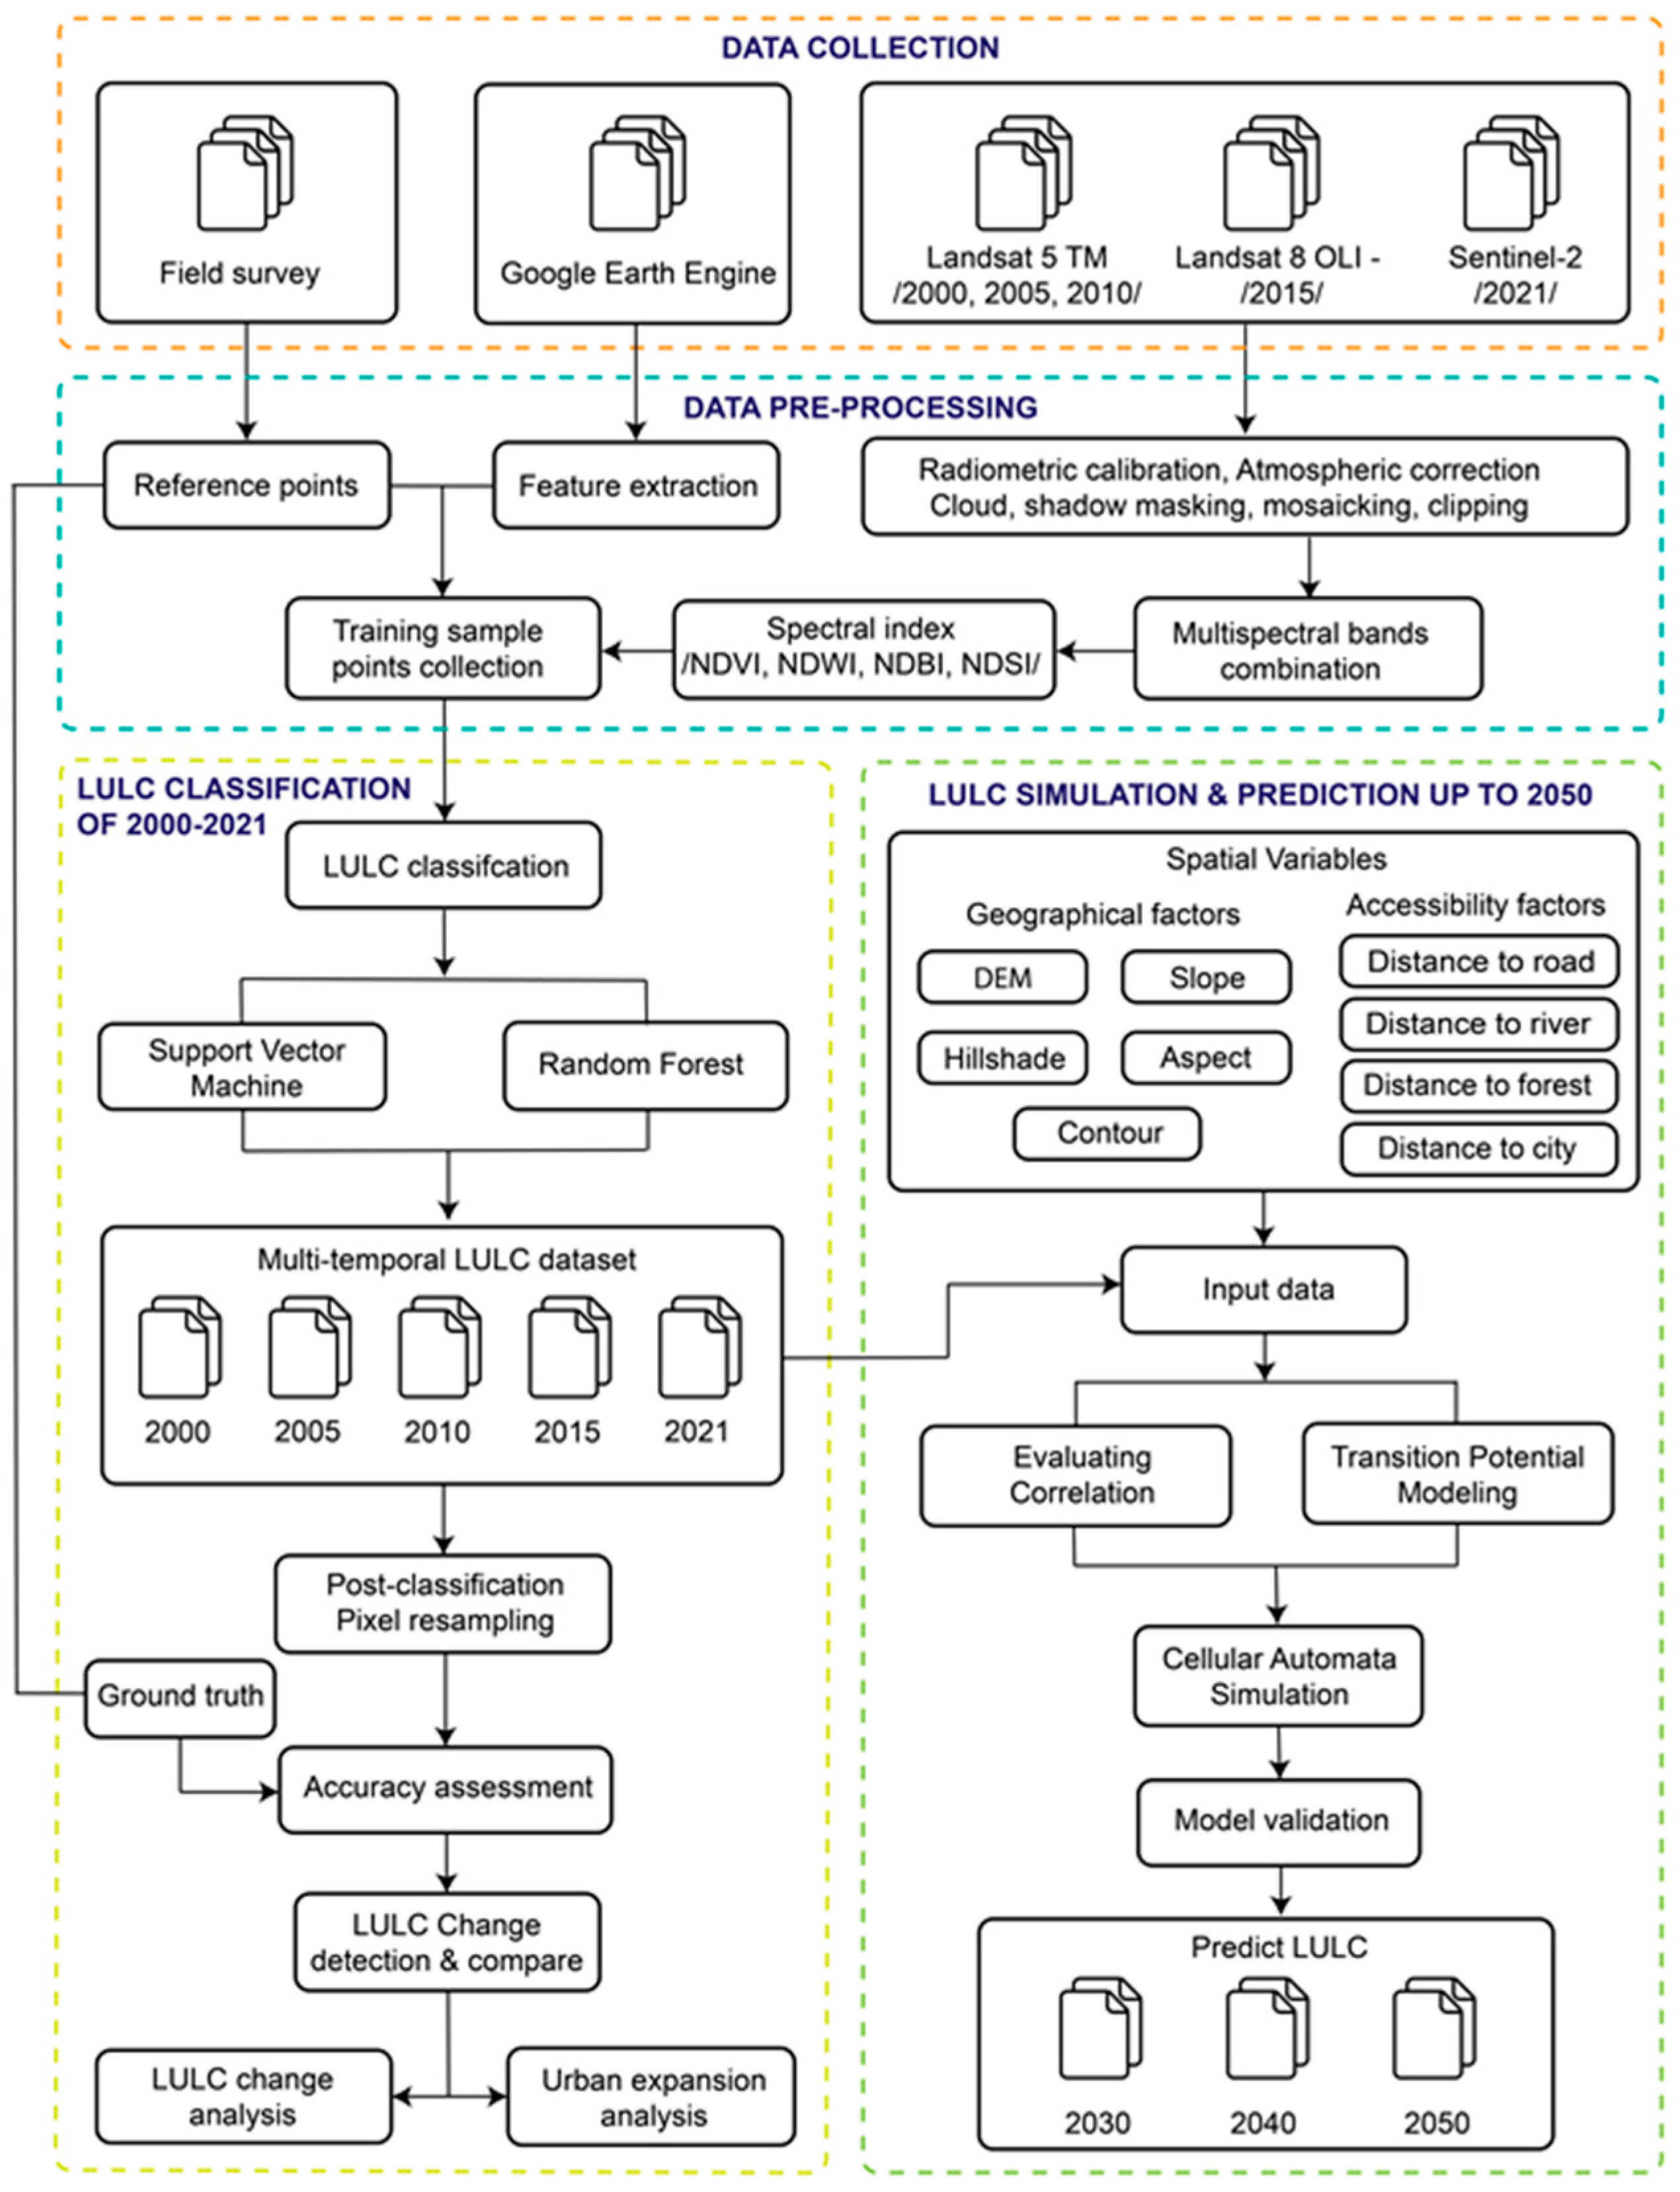
The Cellular Automata-Artificial Neural Network (CA-ANN) methodology was employed to simulate and predict spatio-temporal Land Use and Land Cover (LULC) transitions and urban expansion trends up to 2050. This approach was implemented using the MOLUSCE module, which integrates CA-ANN to model transition potential and generate future LULC scenarios. To enhance simulation accuracy, the module incorporates multi-temporal LULC classification maps alongside spatial variables, including geographical and accessibility factors. Once the input data is prepared in accordance with the module’s specifications, the system evaluates correlations, simulates potential transitions, and projects future LULC trends. The LULC change detection outcomes were systematically analyzed to derive significant findings, which informed the development of recommendations, discussions, and conclusions. The primary methodological workflow of this study is illustrated in Figure 3.
Then, machine learning based classifiers were employed on GEE to produce LULC classification maps based on pre-processed satellite images. In addition, auxiliary datasets, namely the Normalized Difference Vegetation Index (NDVI), Enhanced vegetation index (EVI), Soil Adjusted Vegetation Index (SAVI), Normalized Difference Water Index (NDWI), Normalized Difference Water Body Index (NDWBI), Normalized Difference Built-Up Index (NDBI) were derived and calculated from the corrected satellite images to collect suitable training and validation samples and increase the accuracy of LULC classification. After producing a series of LULC classification maps, post-classification processes and accuracy assessments were conducted. Subsequent analyses were then performed to detect changes in LULC and urban expansion from the past to the present and compare the results of the two different ML classification algorithms.
The LULC classes were categorized into 10 classes, including: Urban built-up area, Dense Forest, Degraded Forest, Shrubland, Grassland/Herbaceous, Pasture/Hay Sparse vegetation, Bare soil/rock, Sandy area, and Water Body (Table 2).

3. Results

3.1. Land Use and Land Cover Classification

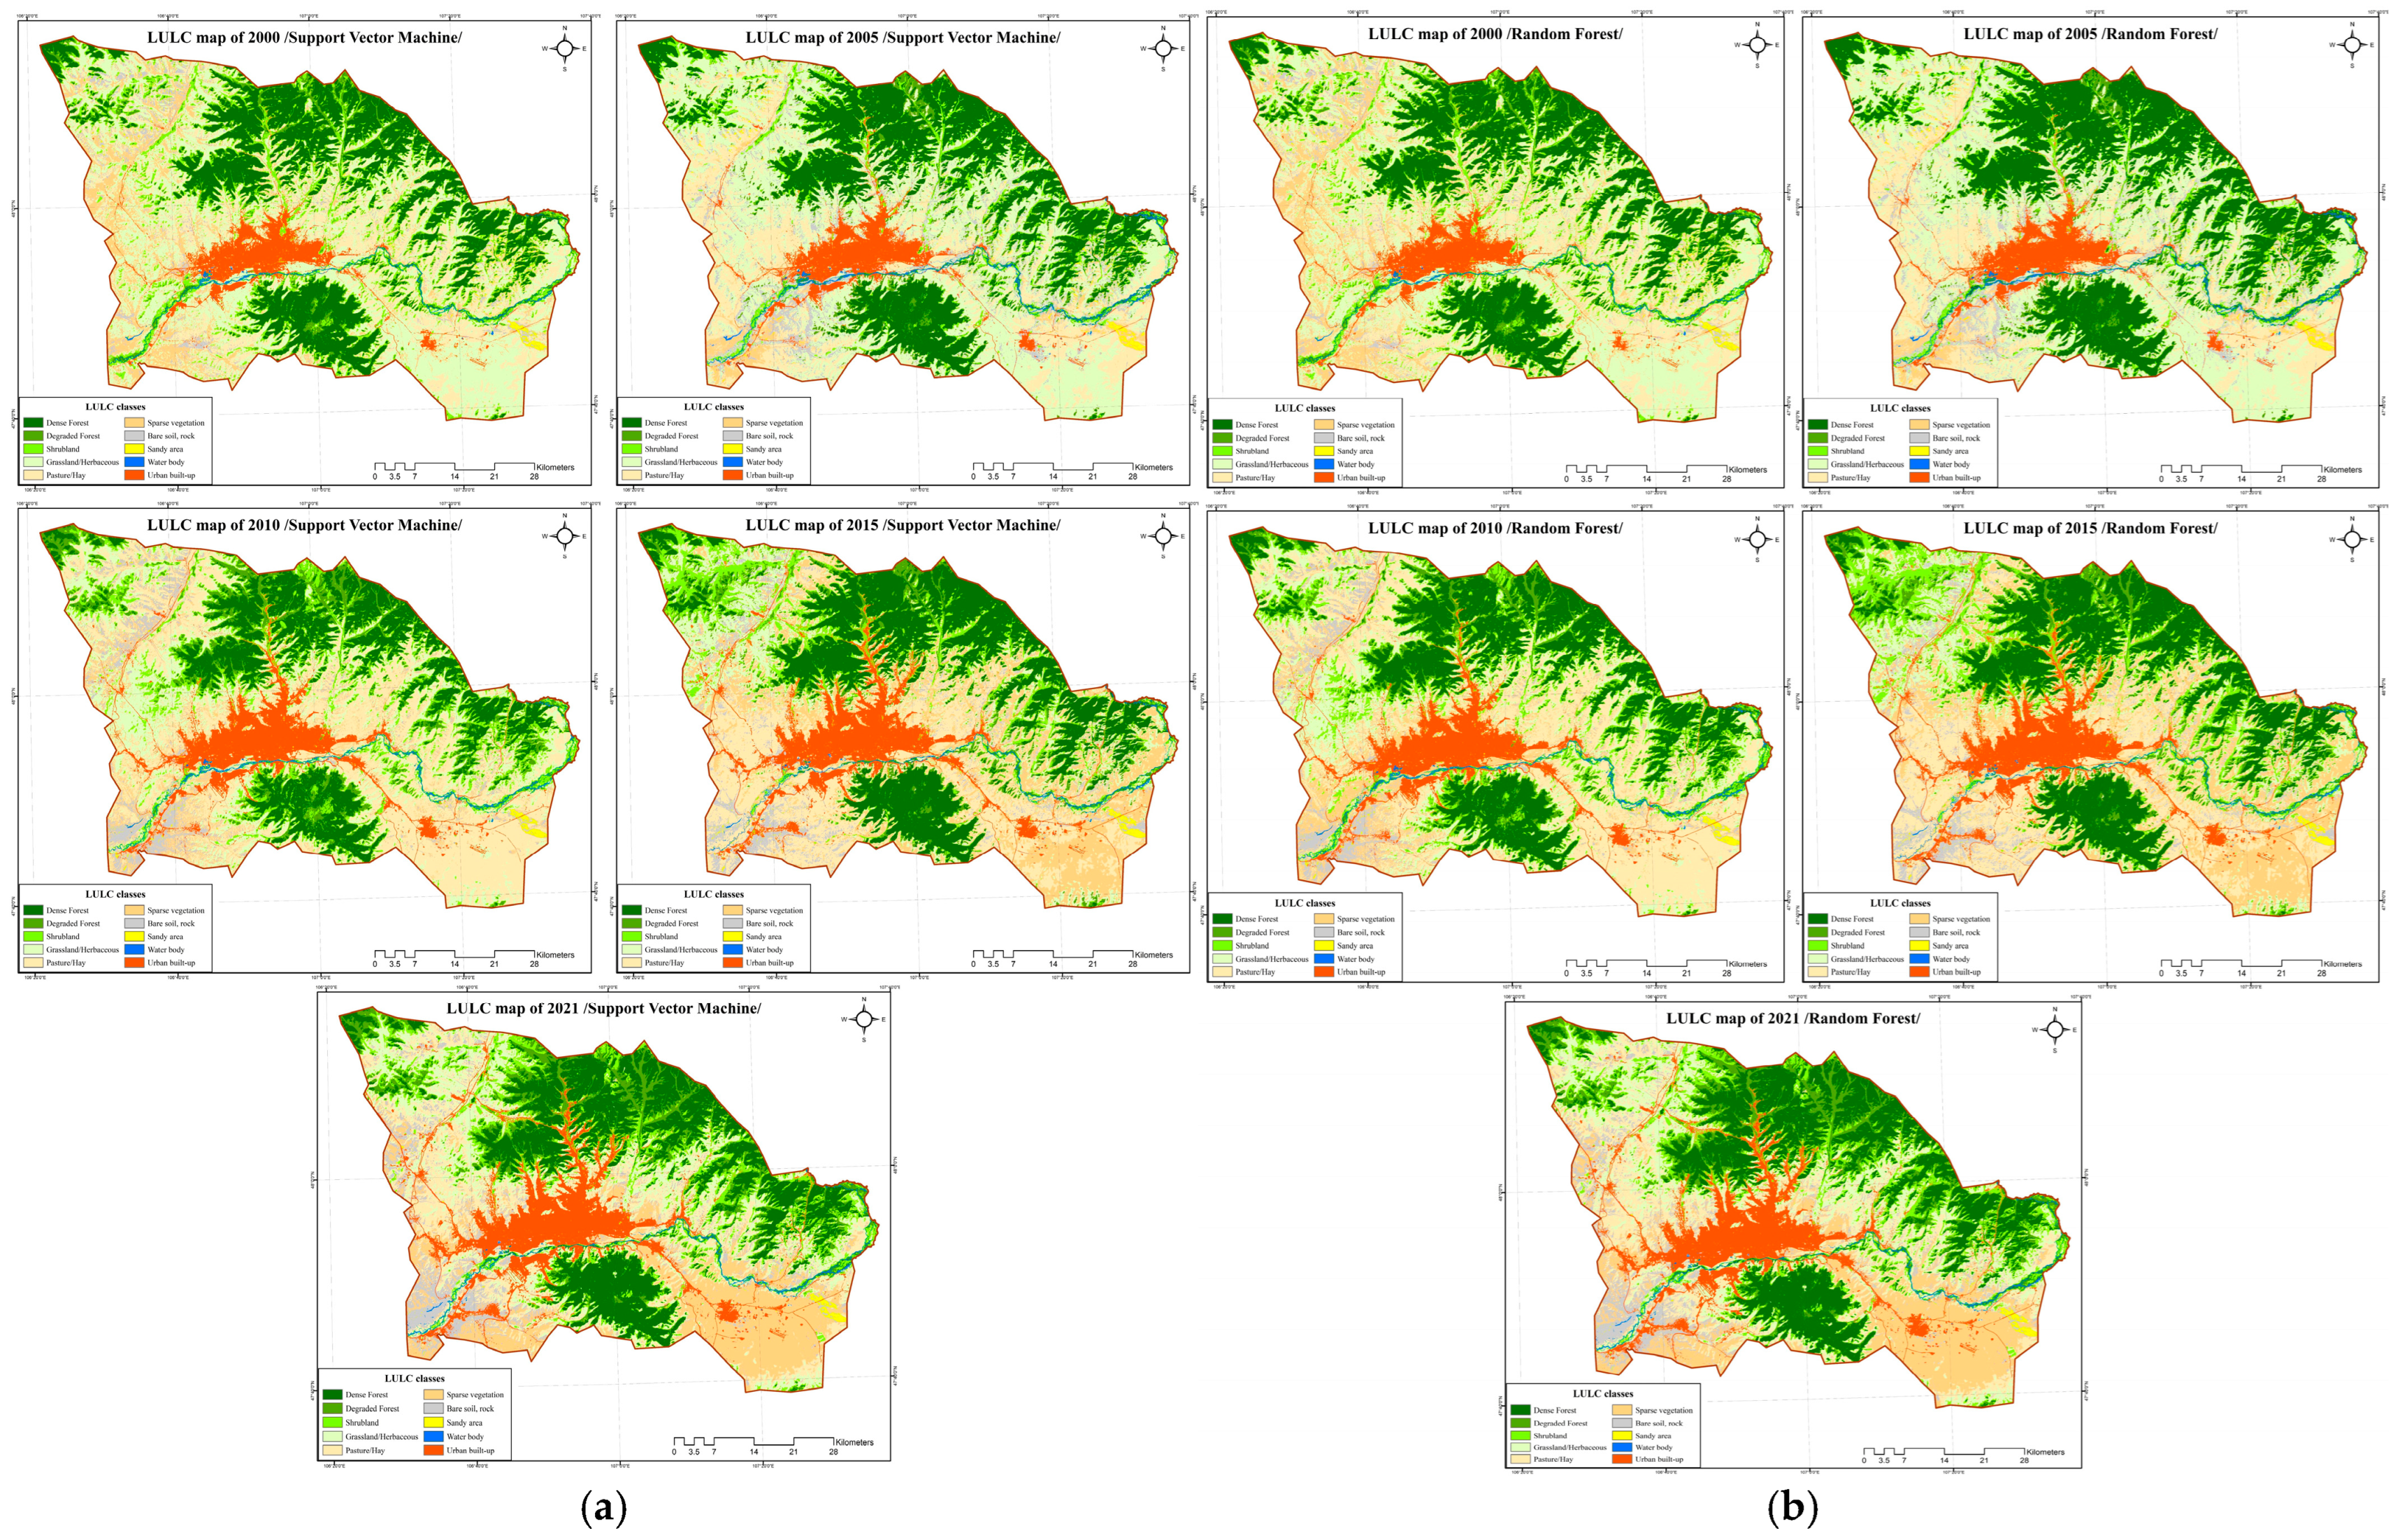
Multi-temporal LULC maps were generated for 2000, 2005, 2010, 2015, and 2021 using both the Support Vector Machine (SVM) and Random Forest (RF) classifiers. The spatial distribution of classified categories is shown in Figure 4, with consistent patterns of vegetated cover dominating the study area throughout the study period. The classification maps illustrate these trends spatially, showing broad stability in natural classes but a marked expansion of built-up areas in central and peri-urban zones.
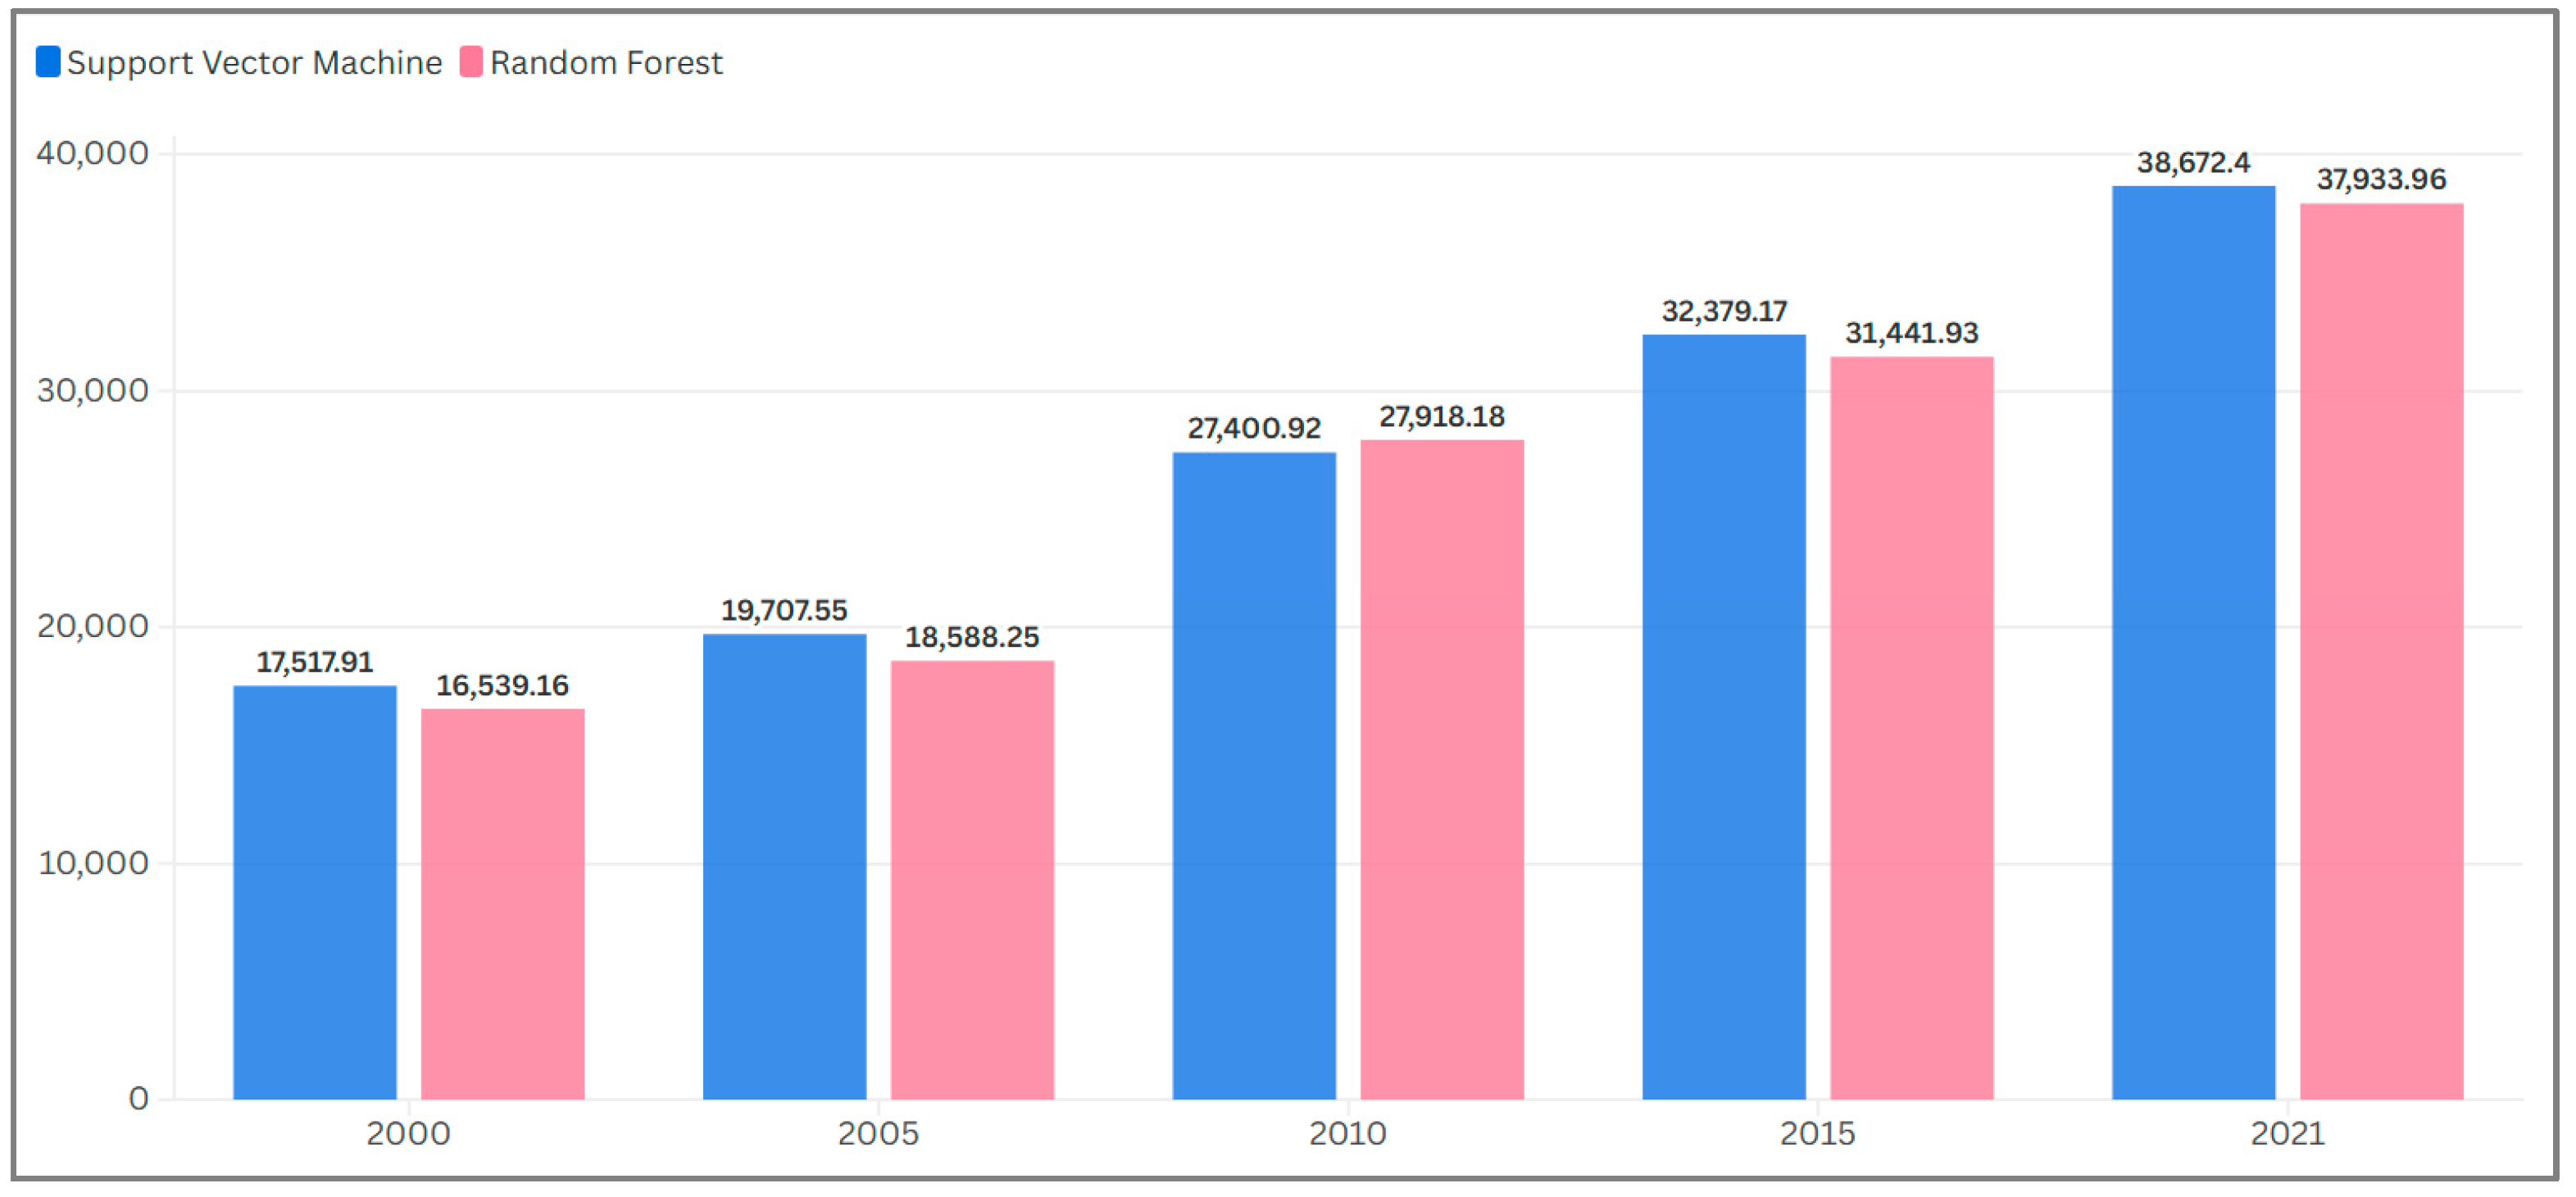
Area statistics (Table 3 and Table 4) demonstrate that dense forest, degraded forest, shrubland, grassland/herbaceous, pasture/hay, and sparse vegetation accounted for most land cover in all years. Sandy areas and water bodies remained minor components, each contributing less than 1% of total area. The extent of urban built-up land, though relatively modest in 2000, has grown markedly over the past two decades. Based on SVM classification, the area expanded from 17,517.91 ha in 2000 to 38,672.40 ha in 2021. A comparable pattern was captured by the RF classification, which showed an increase from 16,539.16 ha to 37,933.96 ha during the same period.
Accuracy assessments (Table 5) confirm the reliability of the classification outputs. For 2021, SVM achieved an overall accuracy of 95.01% with a Kappa coefficient of 0.9424, while RF achieved 93.44% overall accuracy and a Kappa coefficient of 0.9243. Across all years, the highest accuracies were consistently associated with the grassland, pasture/hay, and urban built-up classes. Lower accuracies were observed in sandy areas and water bodies, largely due to their limited extent and susceptibility to mixed-pixel effects.
These results indicate that both classifiers provided reliable representations of LULC dynamics across the two decades. SVM and RF yielded comparable accuracy across all time steps, with only marginal numerical differences between classifiers. These differences should not be over-interpreted as indicating meaningful algorithmic superiority without formal statistical testing. It should also be noted that the higher 2021 accuracy values partly reflect the resolution advantage of Sentinel-2 imagery rather than classifier performance alone.

3.2. LULC Change Detection & Transition Analysis

Post-classification change detection highlights major shifts in land cover between consecutive periods (2000–2005, 2005–2010, 2010–2015, 2015–2021). The area changes derived from SVM are presented in Table 6, while corresponding RF results are shown in Table 7. It should be noted that post-classification change detection is sensitive to classification errors in individual epoch maps; any systematic misclassification can inflate or suppress apparent change estimates. The large redistribution among vegetation sub-classes in 2005–2010, in particular, may partly reflect classifier drift associated with the continued use of Landsat 5 imagery in later years of that sensor’s operational life, in addition to genuine land cover dynamics.
Generally, both classifiers detect similar patterns of transformation. The most dynamic interval was 2005–2010, when SVM indicated a net loss of 30,806.3 ha of dense forest and 55,981.9 ha of grassland (RF result), accompanied by increases in pasture/hay (+18,519.1 ha in RF) and sparse vegetation (+31,127.7 ha in RF). These trends suggest extensive redistribution among vegetation classes during the mid-period. Urban built-up consistently increased across all intervals, though its absolute contribution remained smaller relative to vegetation transitions.
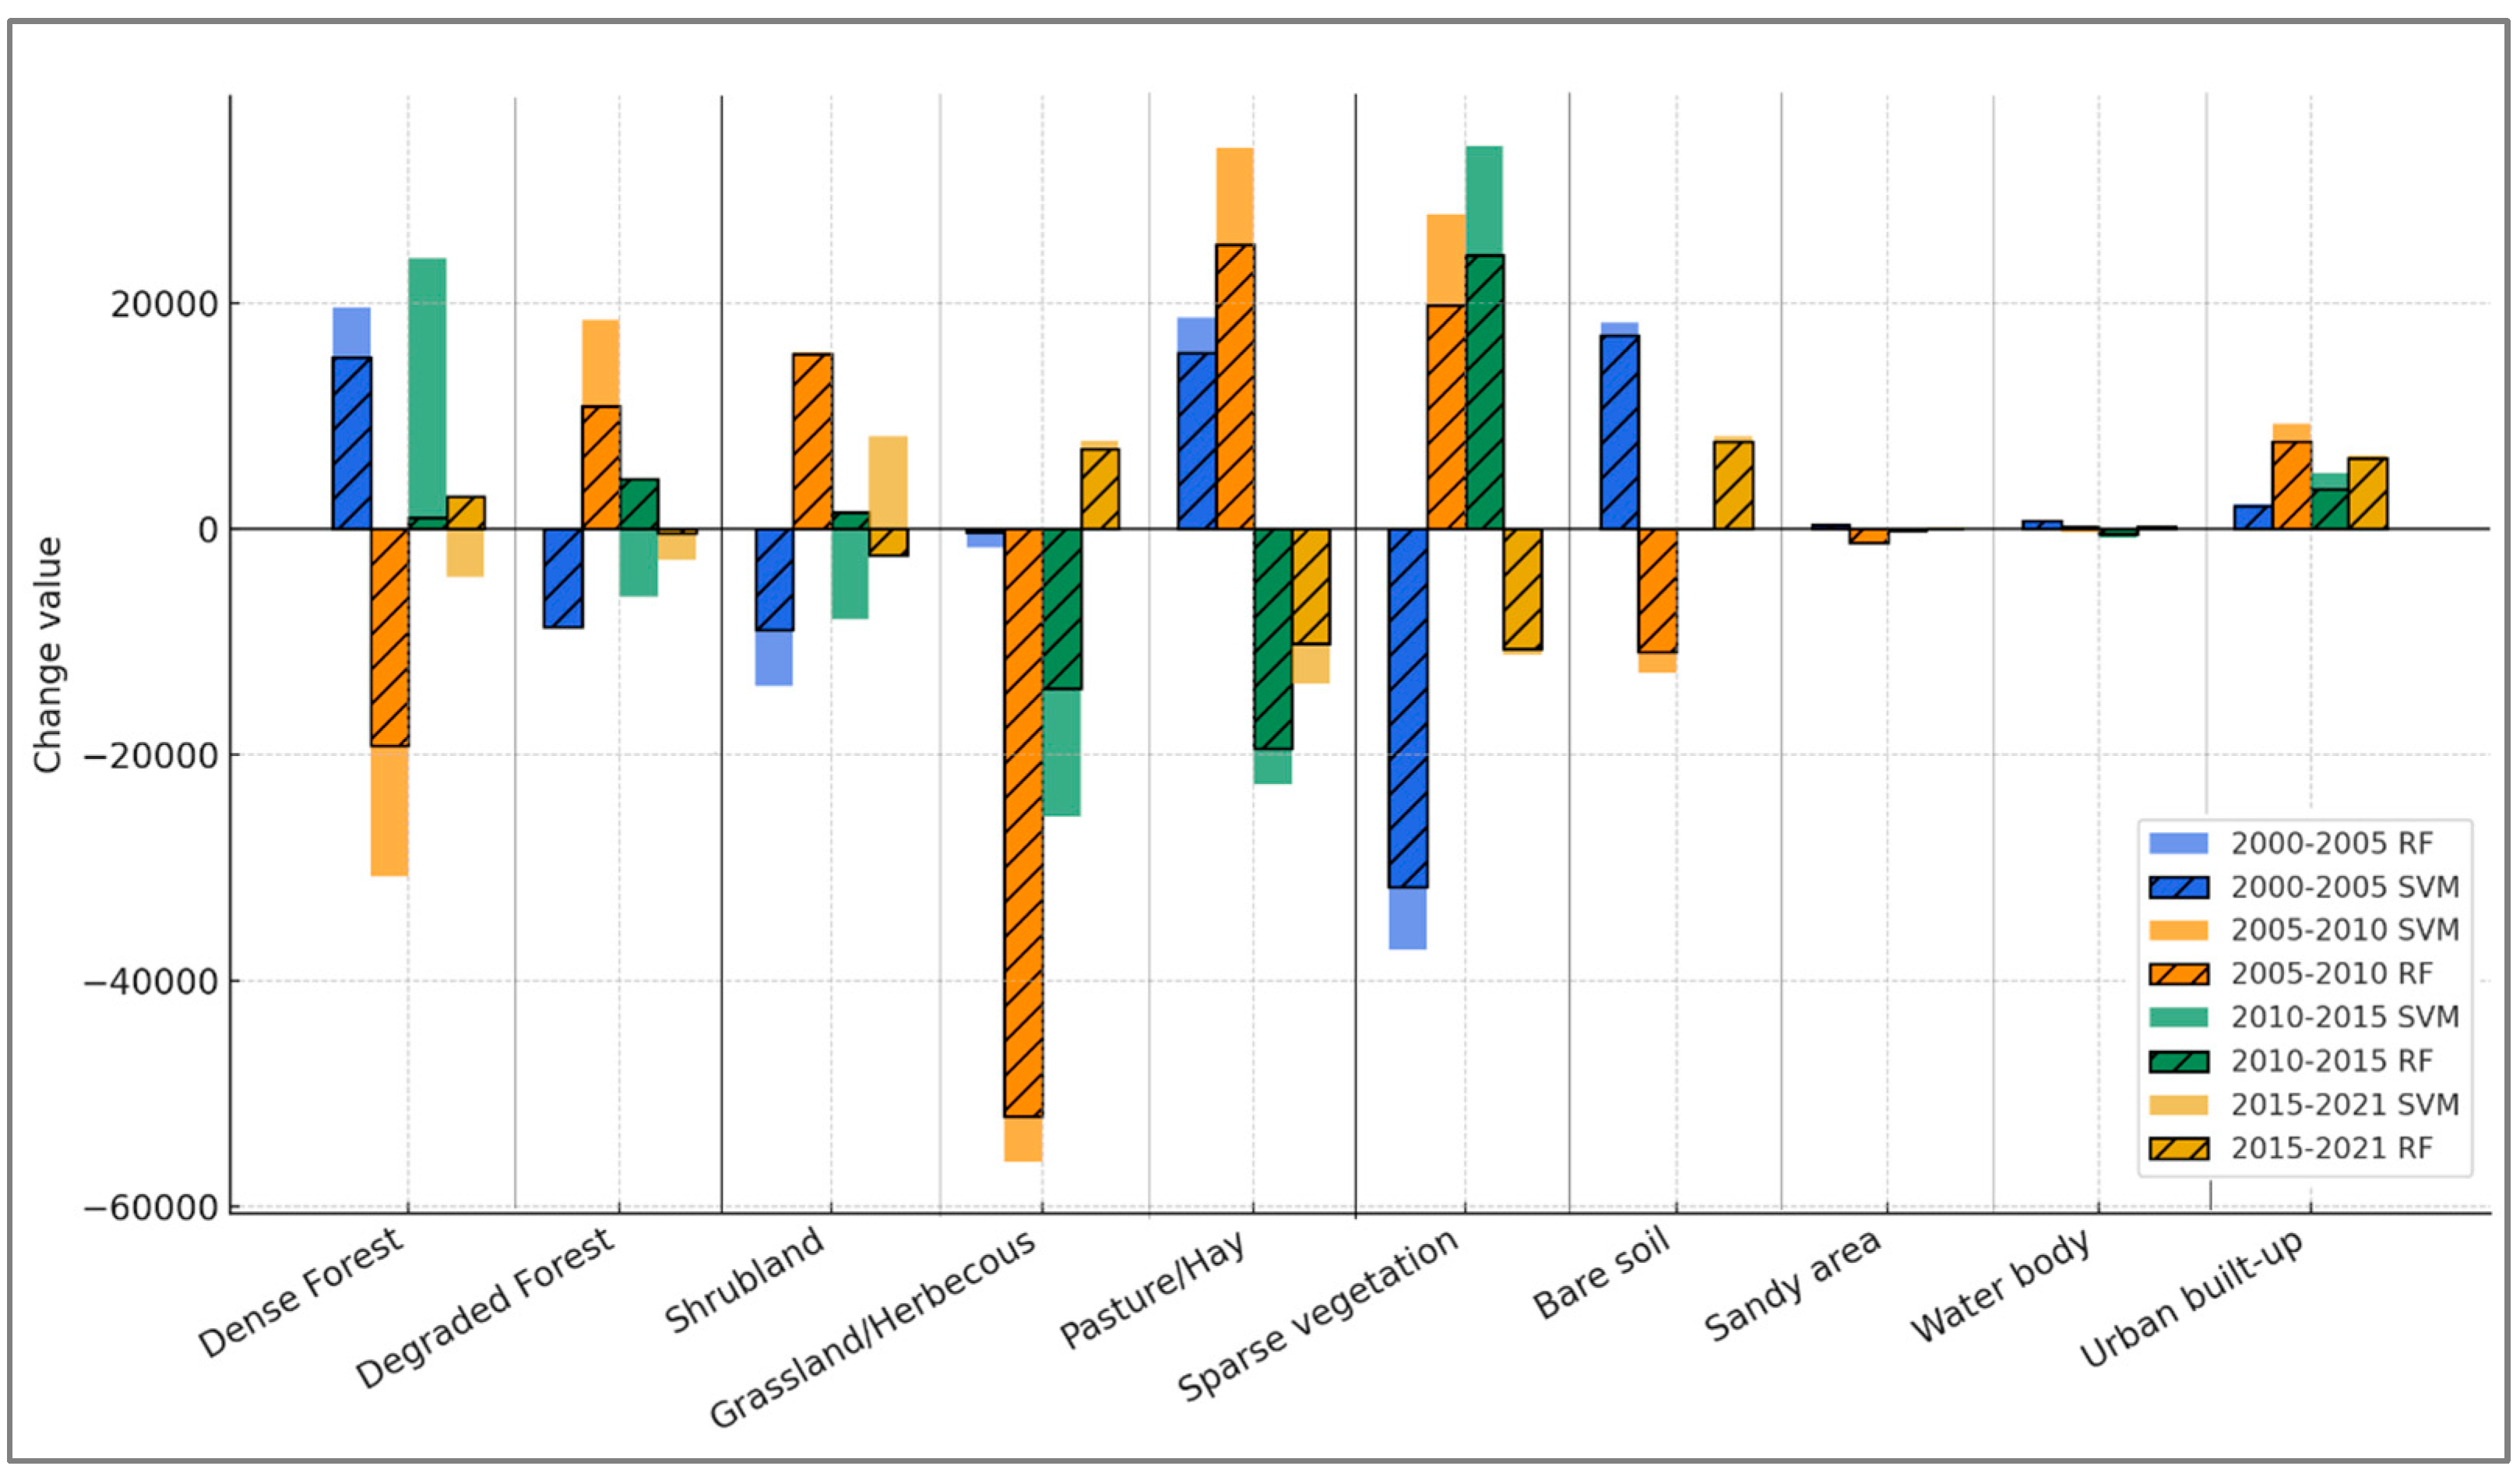
Figure 5 summarizes LULC changes across the study period. Grassland/herbaceous land showed the sharpest decline, particularly between 2005 and 2010, followed by further losses in 2010–2015. Pasture/hay and shrubland fluctuated markedly, with initial gains giving way to reductions in later years. Sparse vegetation alternated between decline and recovery, peaking in 2010–2015 before contracting again after 2015. Forest classes also displayed mixed dynamics, with dense forest increasing in 2000–2005 and 2010–2015 but declining in other intervals. By contrast, urban built-up land expanded consistently throughout all periods, while bare soil rose notably after 2015. Water bodies and sandy areas remained largely stable.
These results show that the two classifiers not only captured the same overall trend of vegetation redistribution and urban expansion but also highlighted differences in the magnitude of class-level change. SVM tended to identify more compact change clusters, whereas RF produced slightly more fragmented patterns of transition.

3.3. Urban Expansion Analysis

Urban expansion was one of the most consistent and striking LULC trends over the study period. As shown in Figure 6, the built-up area increased steadily from 2000 to 2021, with the steepest growth recorded between 2005 and 2010. During this interval, built-up land grew by +7693.4 ha (SVM) and +9329.9 ha (RF), corresponding to the highest annual growth rates observed in the study (Table 8). After 2010, expansion continued but at a slower pace, averaging approximately 340 ha per year.
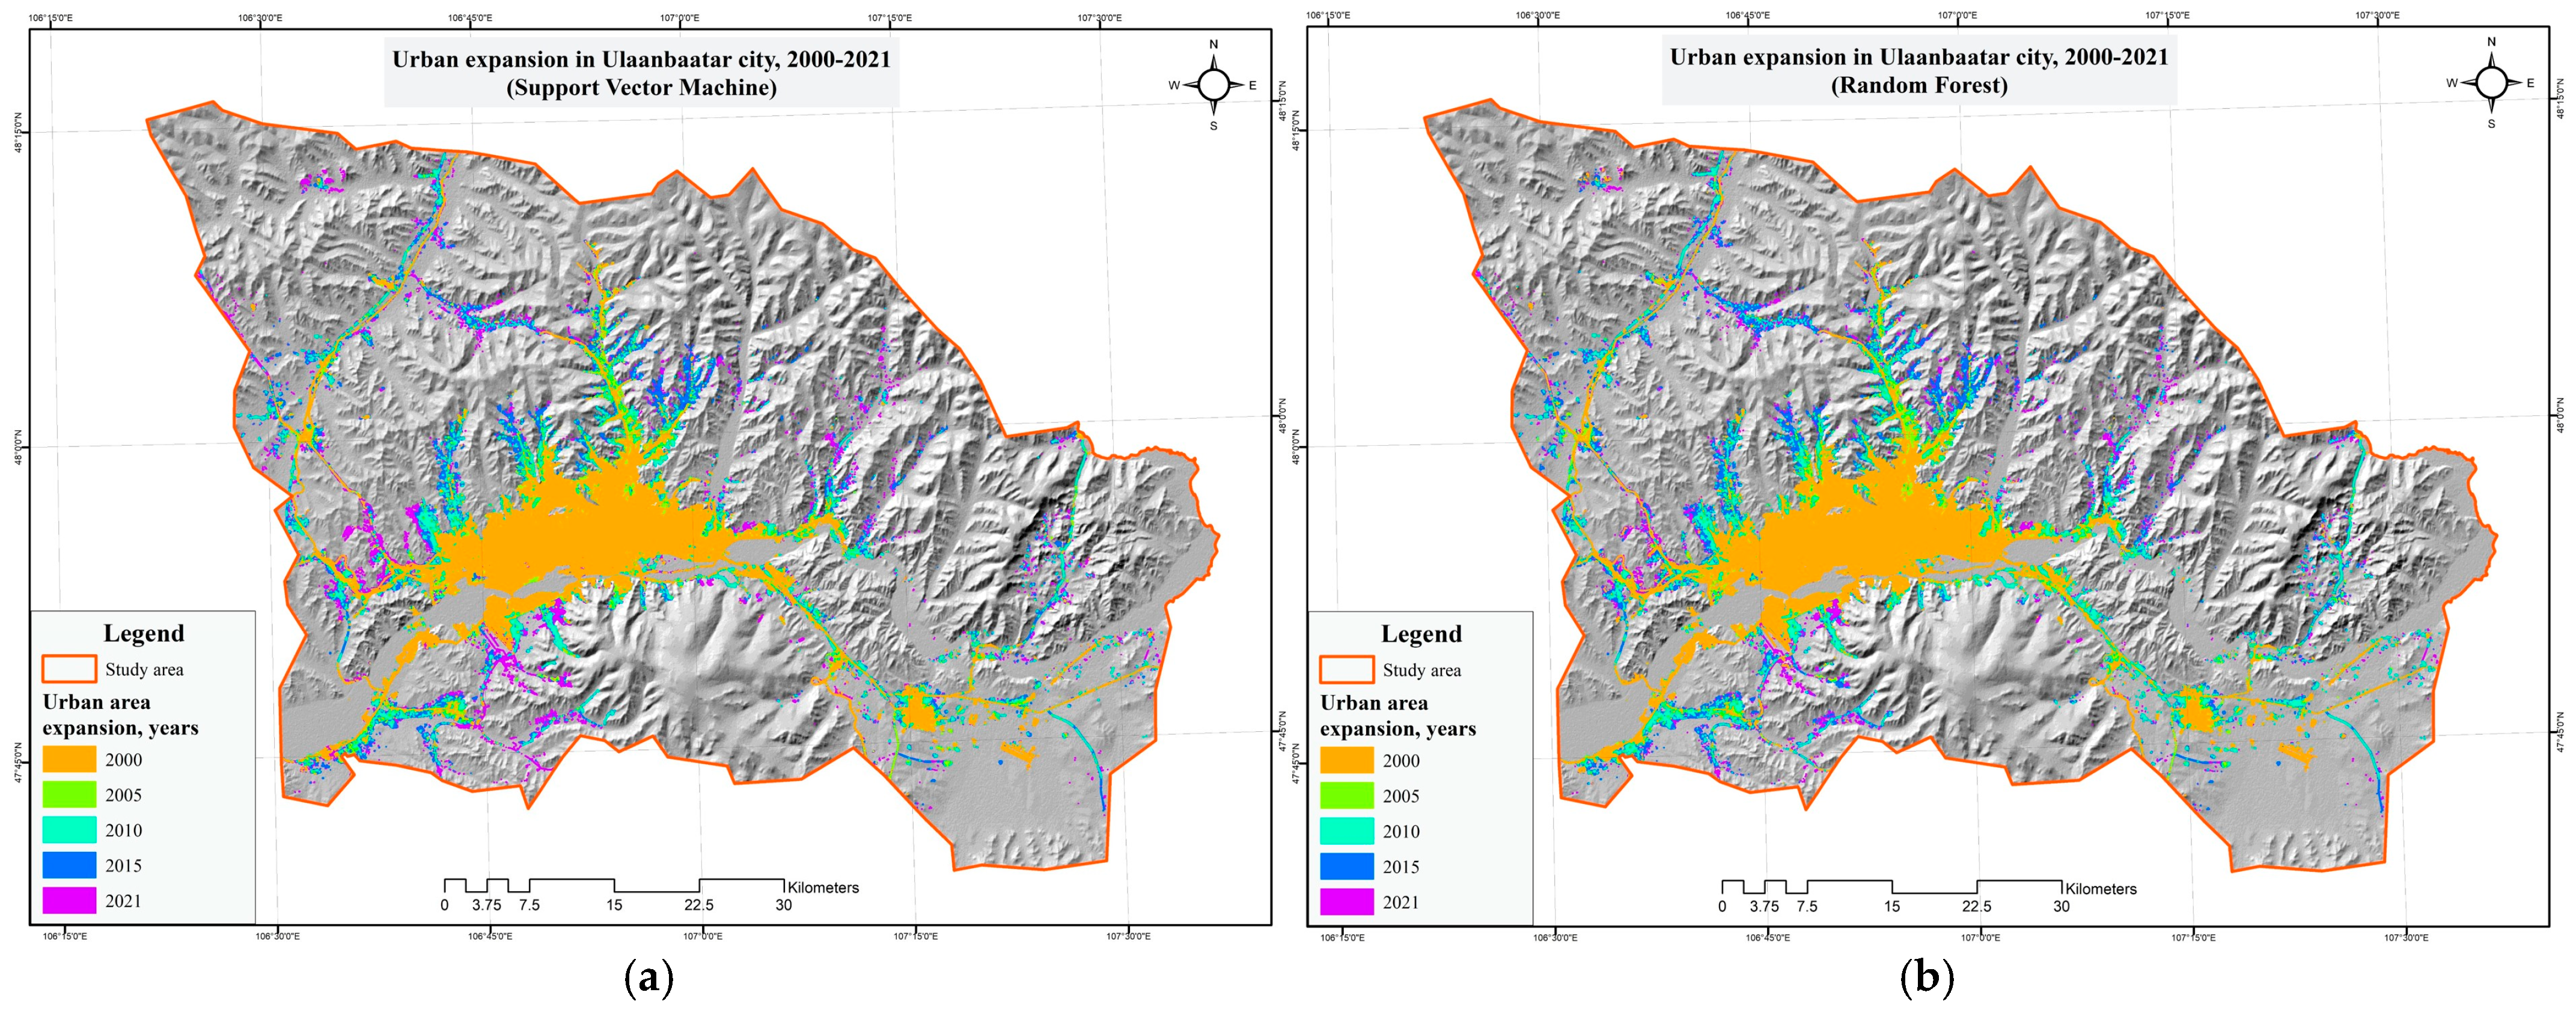
The spatial patterns of expansion are illustrated in Figure 7. Both classifiers show that urban growth was concentrated in the city core and expanded outward into peri-urban areas. New development was most evident in the eastern and southern sectors, where continuously built-up blocks replaced formerly vegetated or agricultural lands. The RF classification captured slightly more fragmented expansion patches compared to the more compact SVM outputs.
These results confirm that urbanization has been the primary land-use driver reshaping the study area in the past two decades. The temporal analysis (Table 8) highlights not only the magnitude of expansion but also the shift in intensity over time, while the spatial maps (Figure 7) provide direct evidence of the outward spread of urban footprints.

3.4. CA-ANN Modeling and Future Scenarios

Cellular Automata–Artificial Neural Network (CA-ANN) modeling was applied to simulate LULC changes and forecast scenarios for 2030, 2040, and 2050. Model performance was first validated by comparing simulated 2021 maps against observed 2021 classifications.
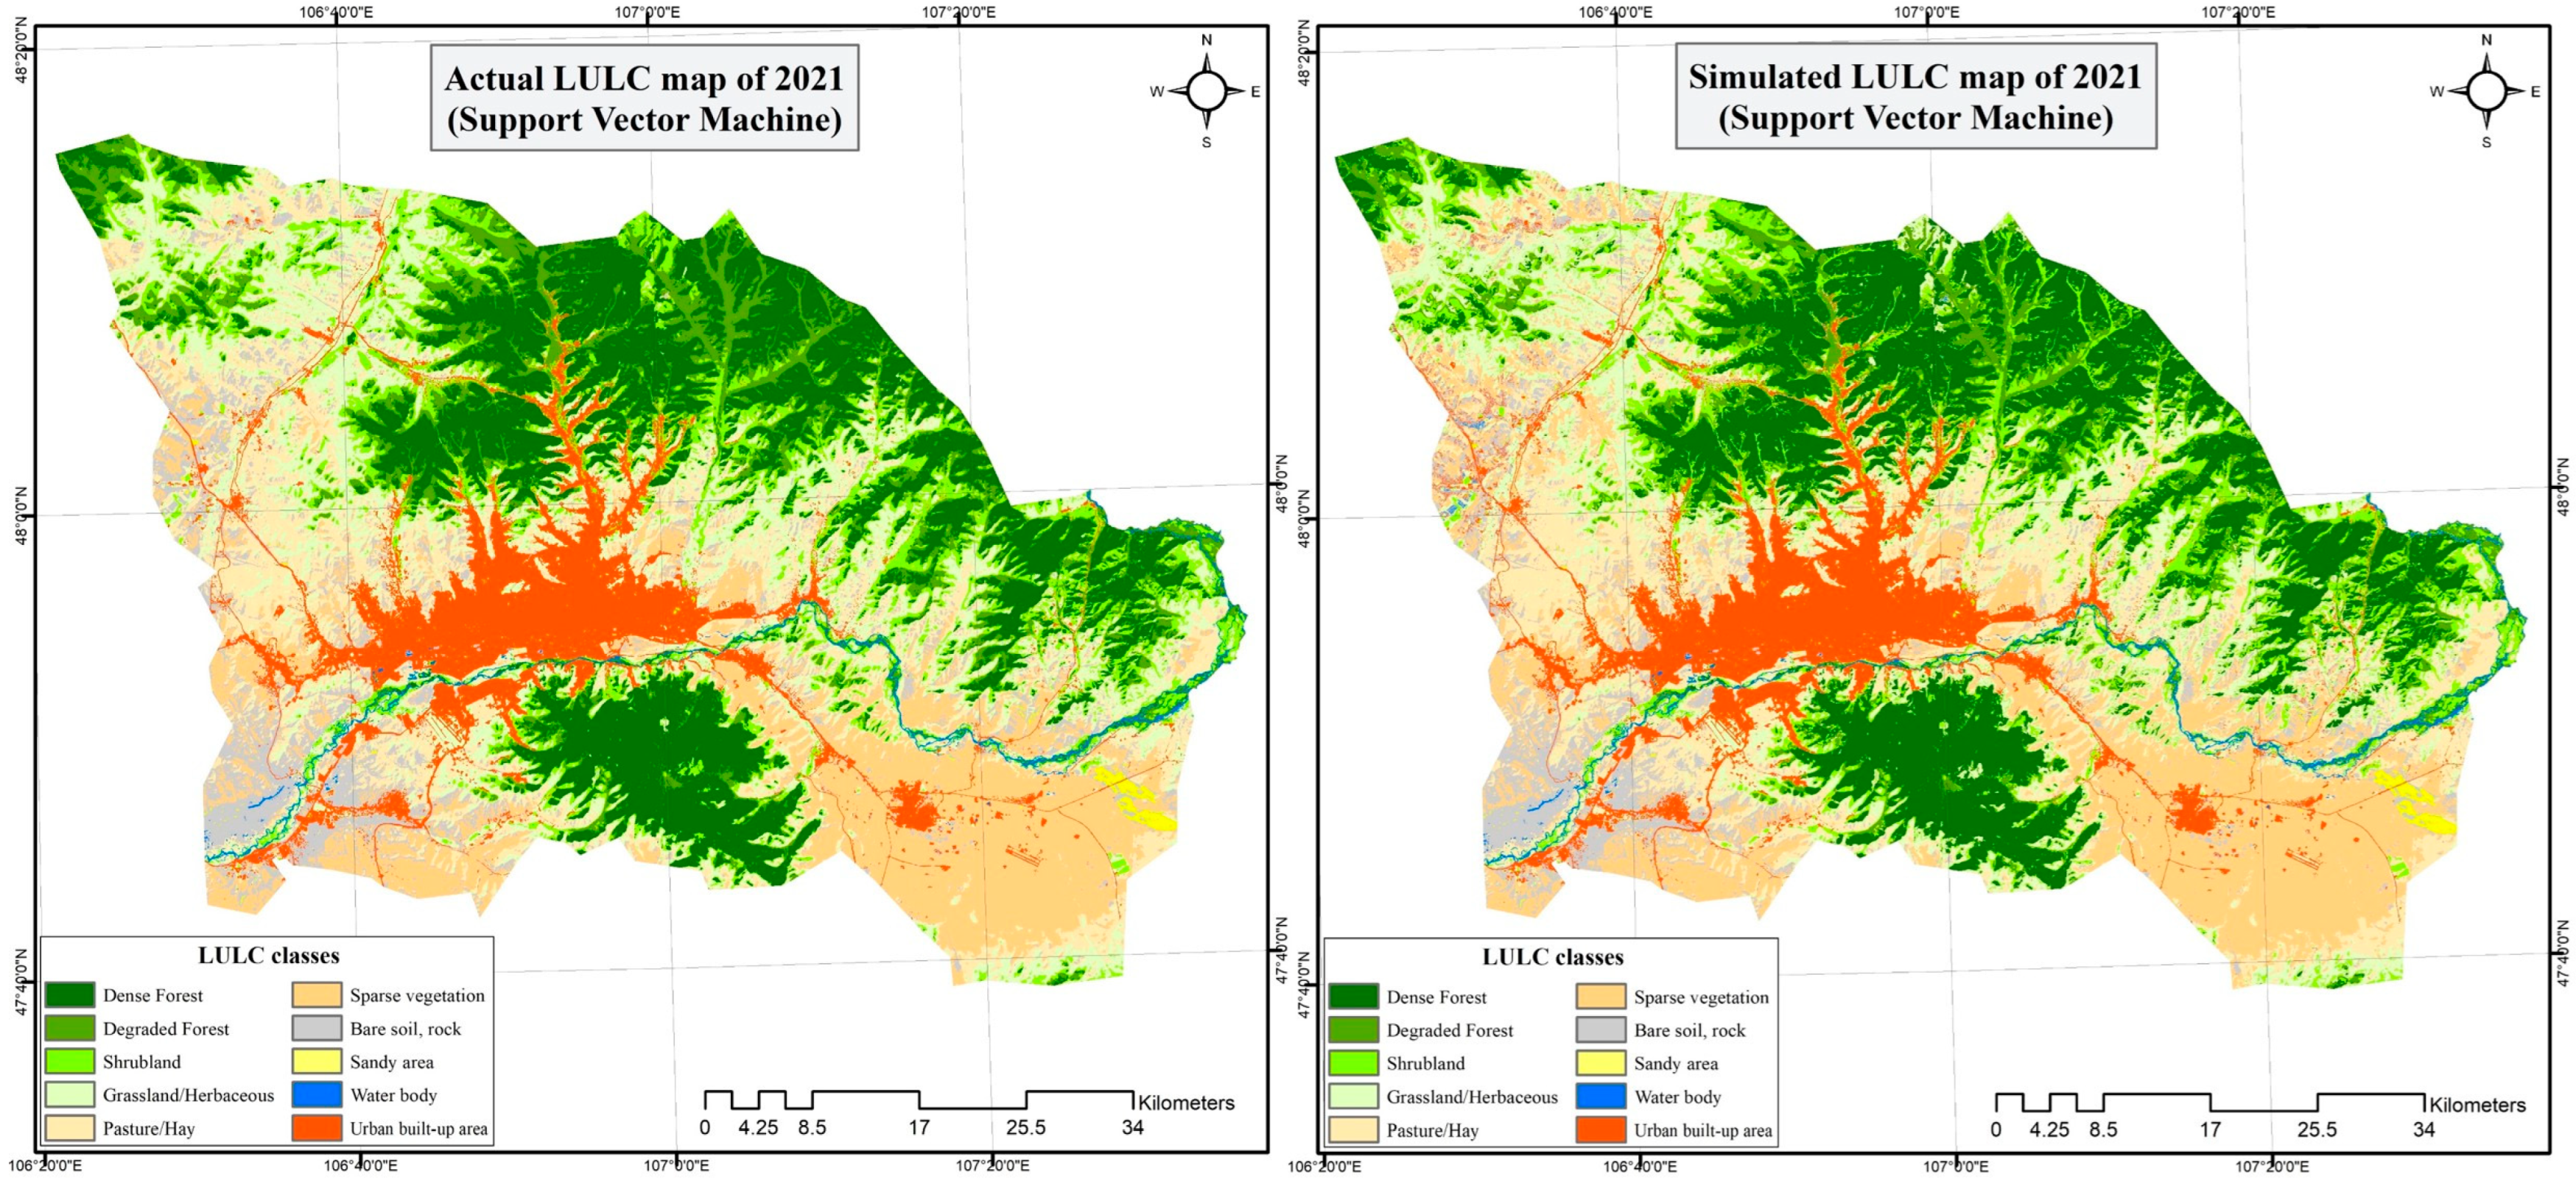
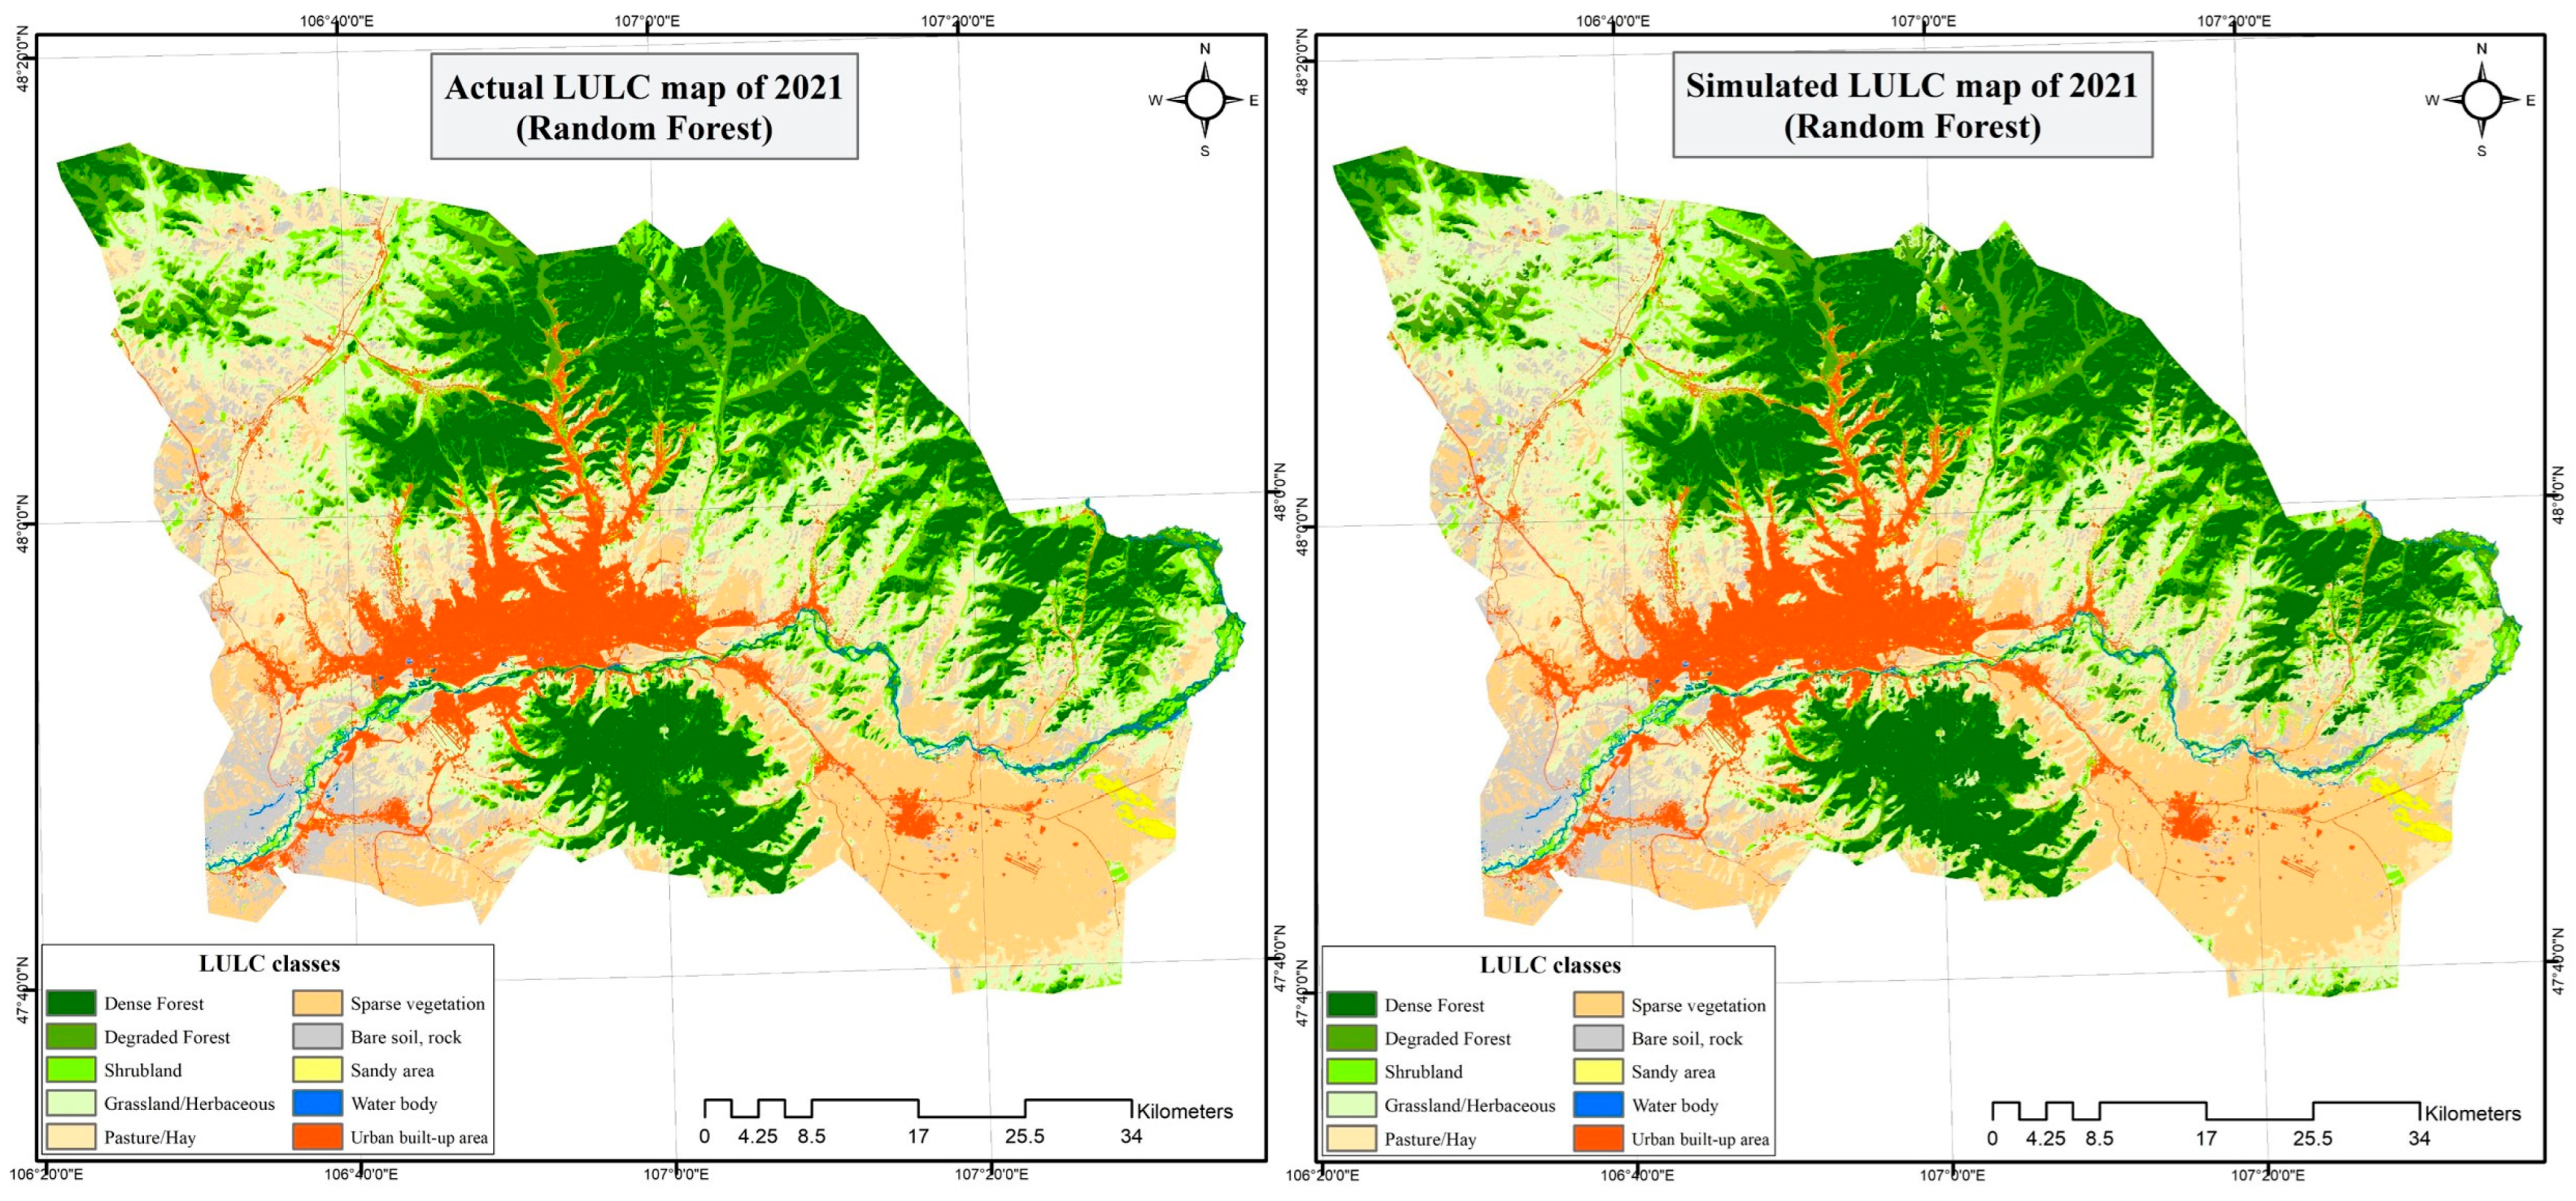
The validation outputs (Figure 8 and Figure 9) show good agreement between simulated and actual distributions. Quantitatively, the SVM-based model achieved a Kappa value of 0.9278, while the RF-based model reached 0.9087 (Table 9), indicating satisfactory simulation performance. These Kappa values are interpreted alongside the percentage of correctness metric; readers should note that Kappa can be inflated when landscape persistence dominates, as is common in urban growth scenarios where most cells remain unchanged between time steps.
The ANN algorithm underwent a total of 10 iterations and was trained on each classifier. The training process was evaluated and defined by five key values, which are integral components of the training validation.
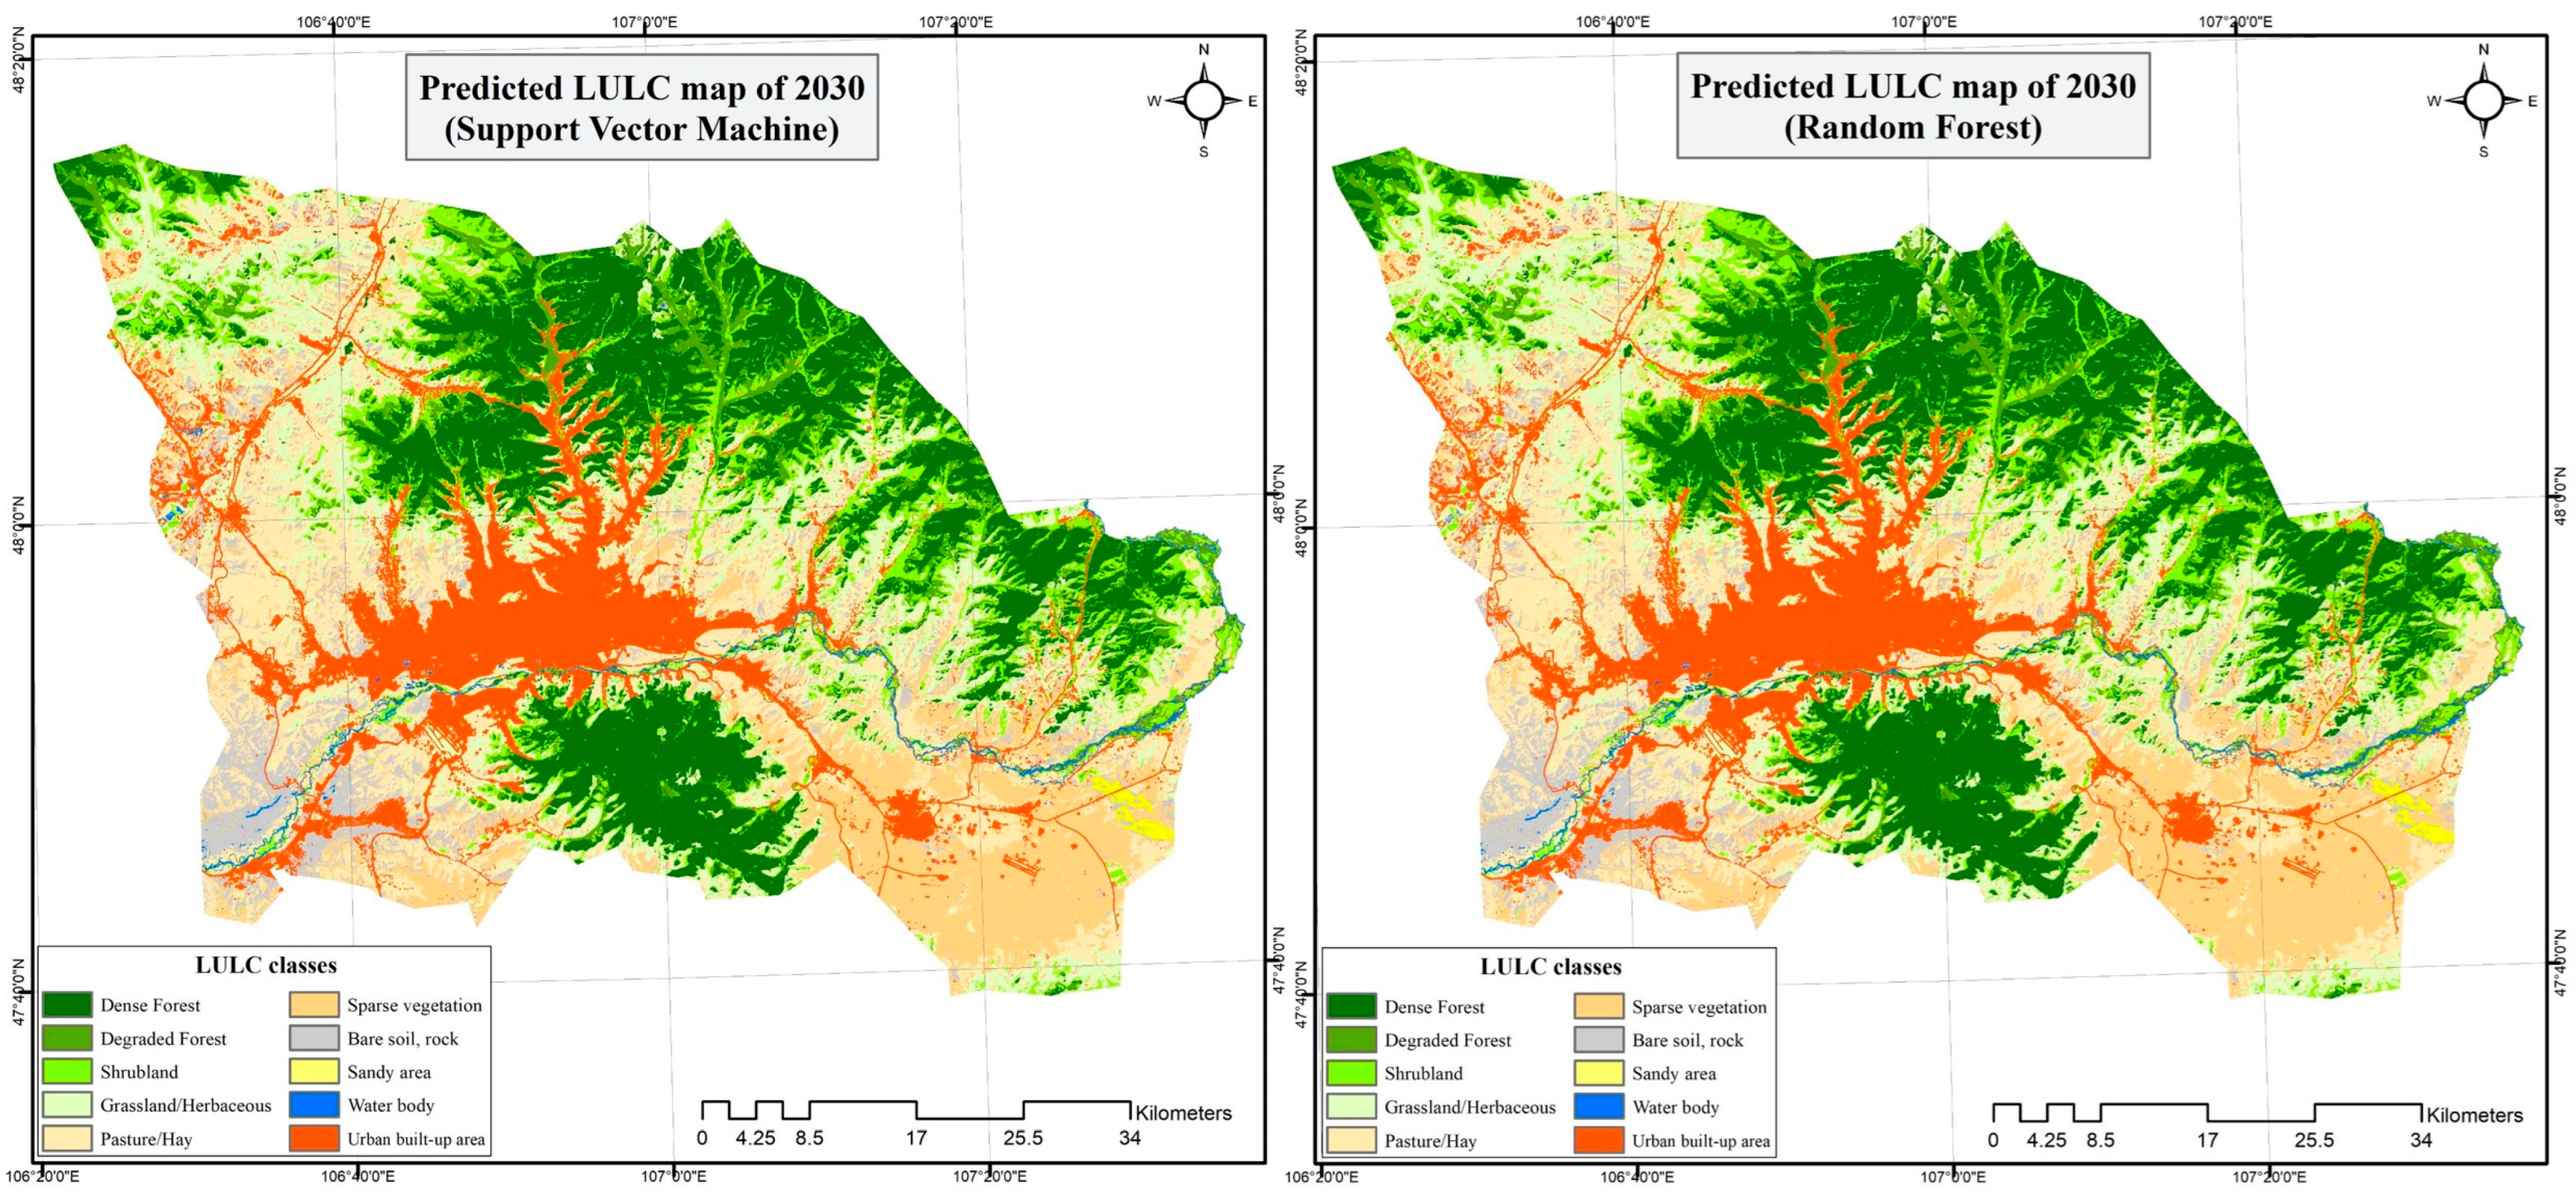
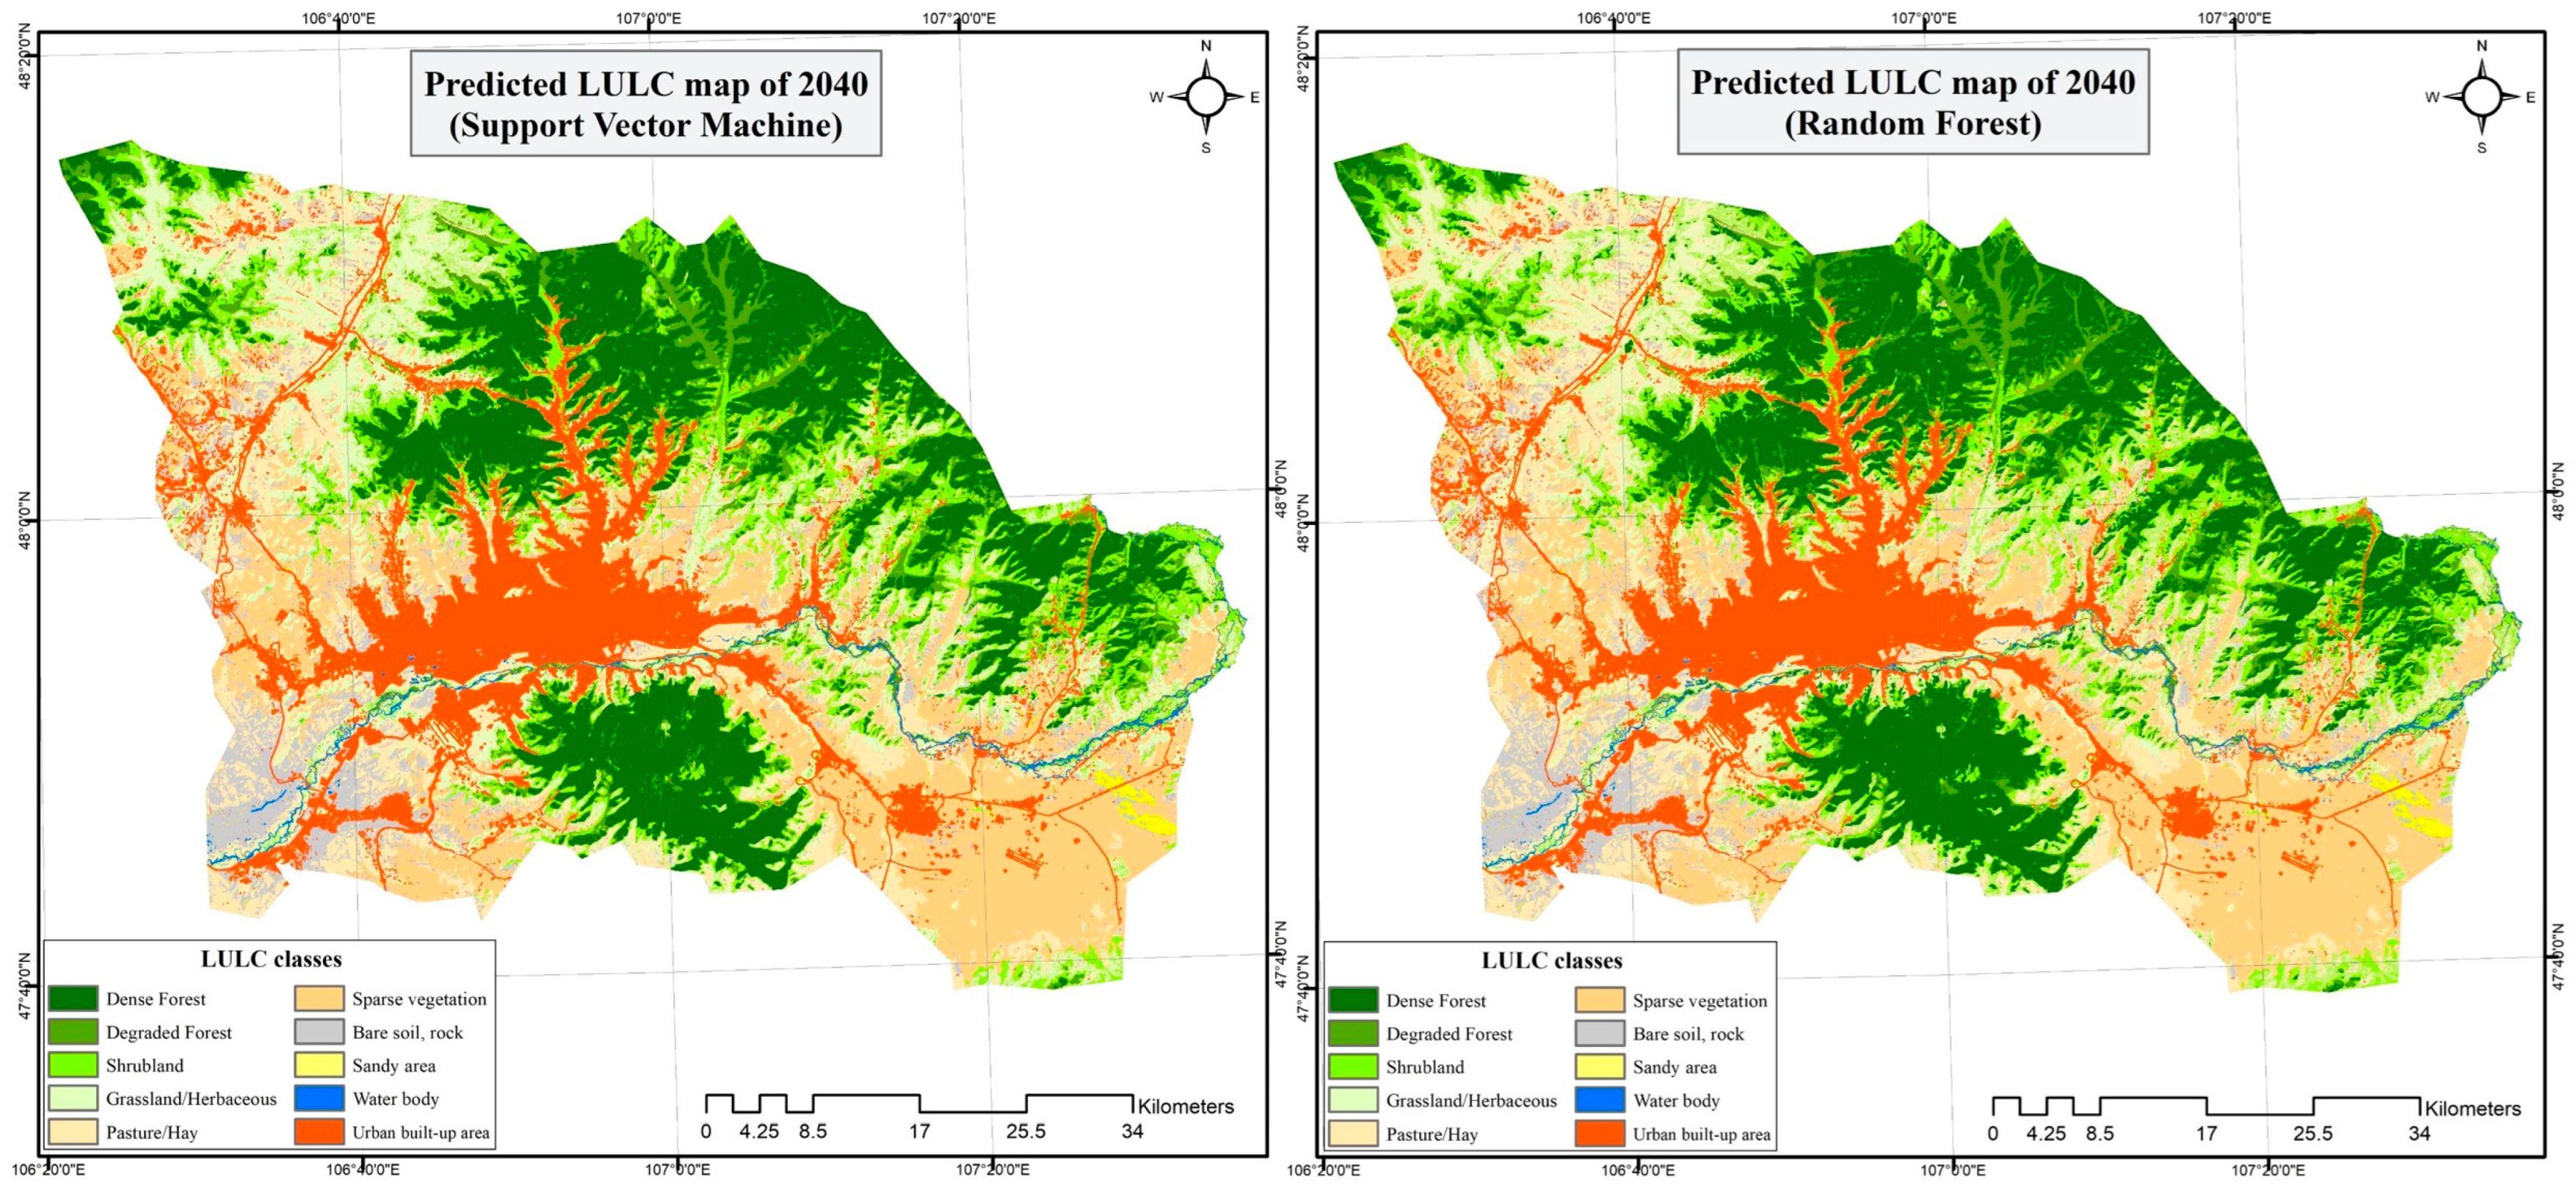
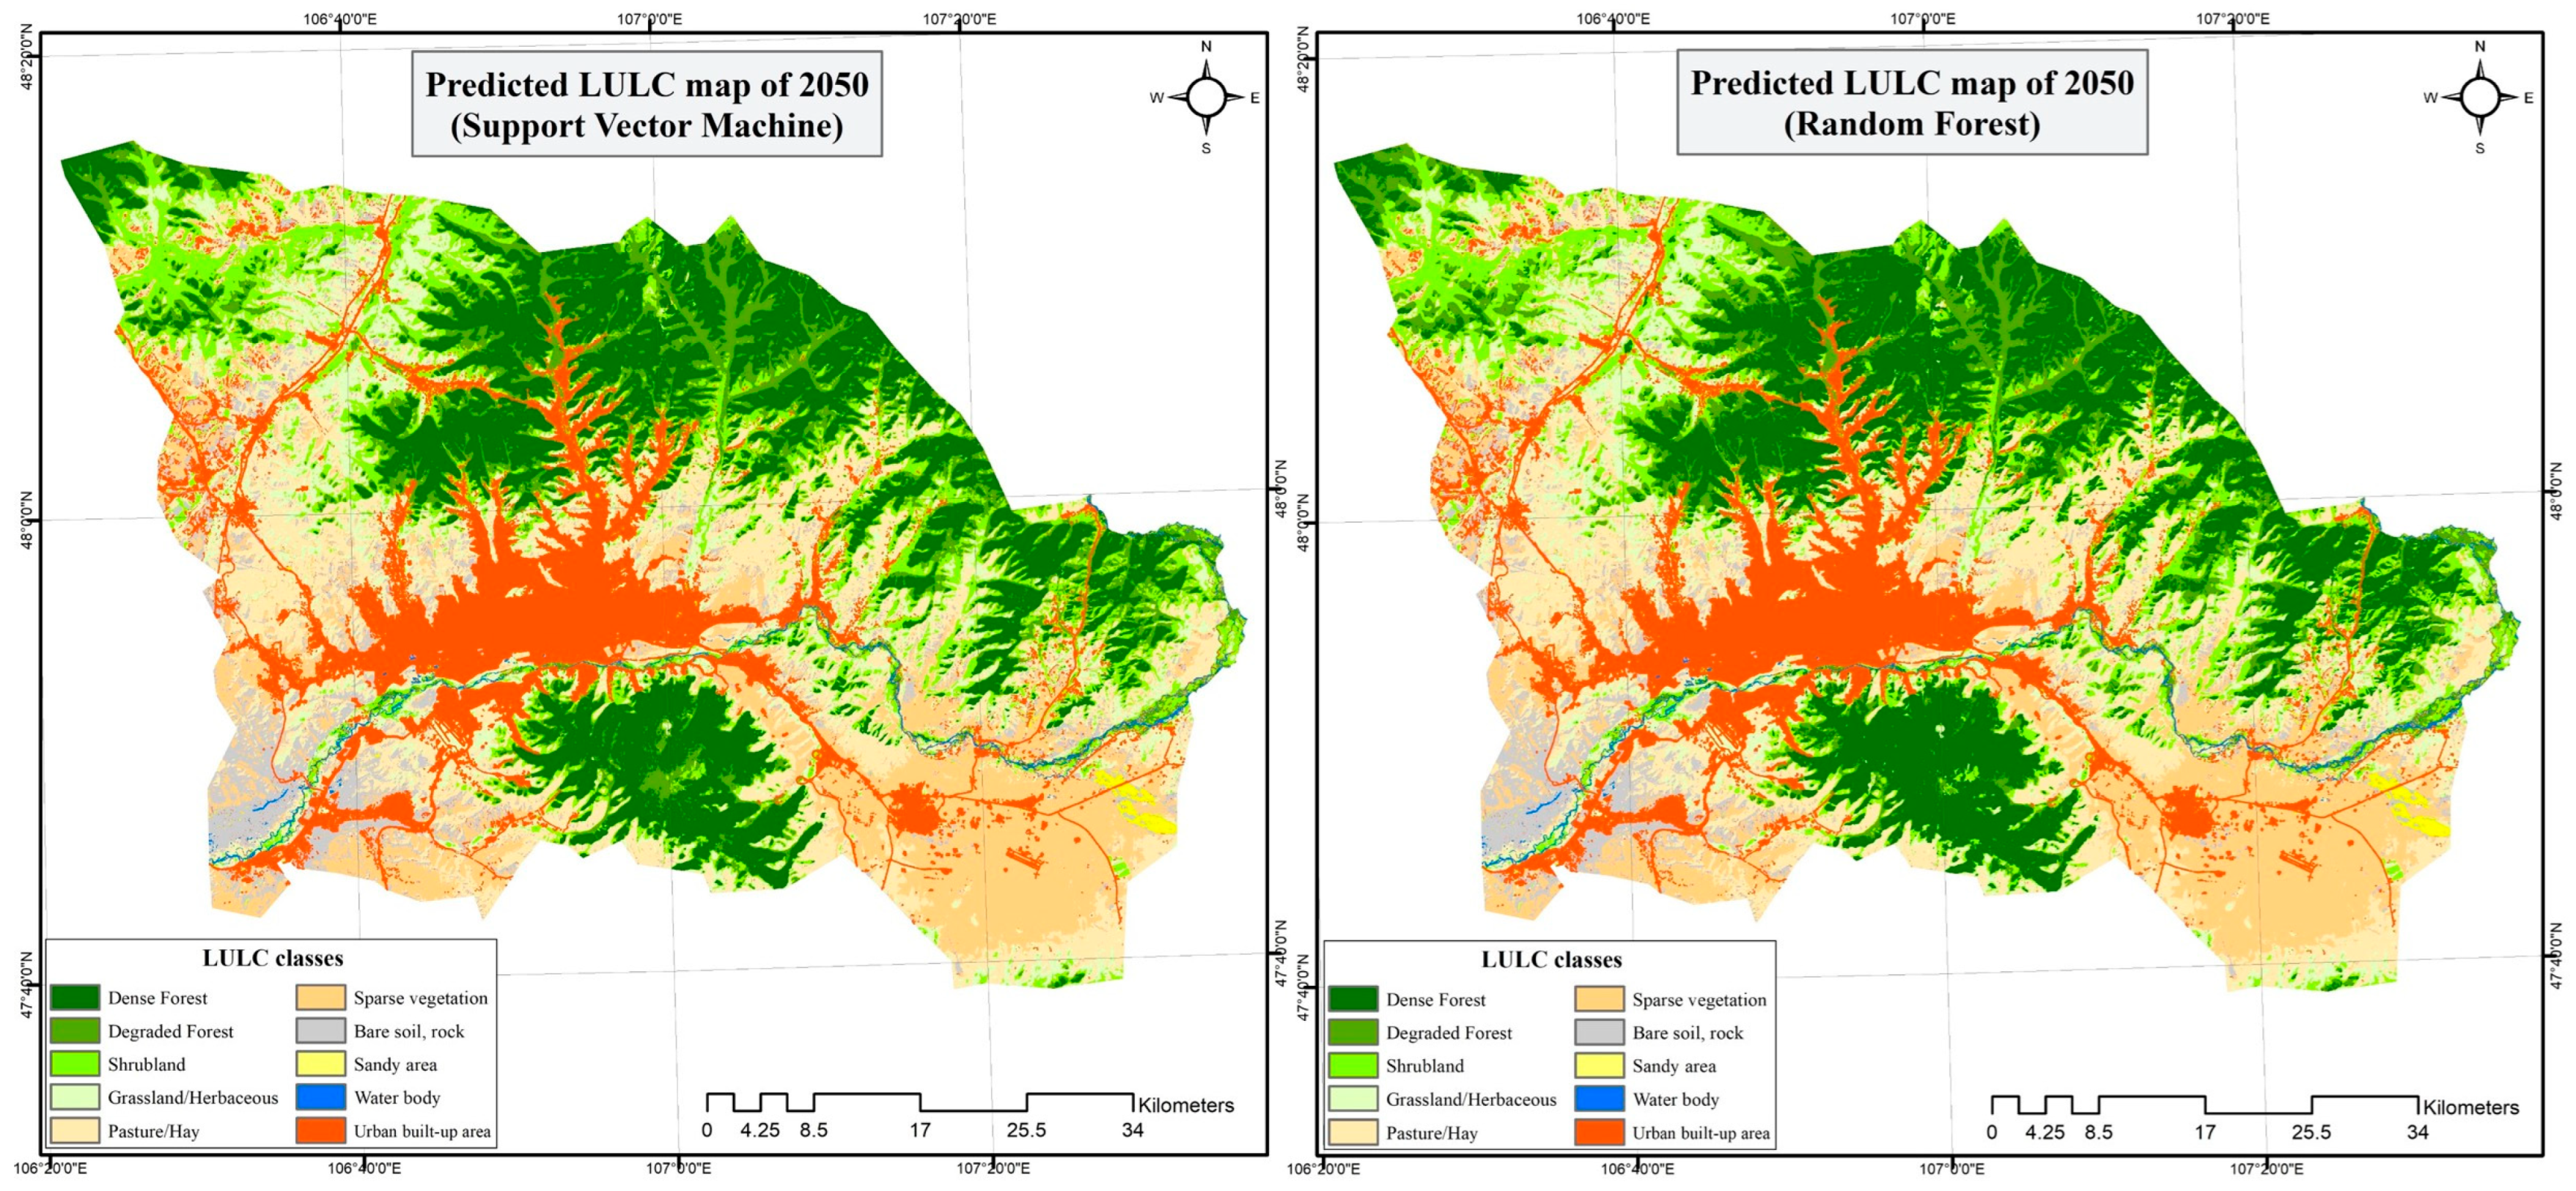
Future projections highlight continued urban expansion at the expense of vegetation classes. Predicted maps for 2030, 2040, and 2050 are shown in Figure 10, Figure 11 and Figure 12, indicating progressive outward growth of built-up areas and further fragmentation of grassland and pasture/hay. The SVM projection suggests a slightly more compact pattern of expansion, whereas the RF projection distributes growth more diffusely.
Projected area statistics (Table 10 and Table 11) quantify these trends. Both classifiers predict that by 2050, urban built-up will exceed 50,000 ha, reflecting an approximate 30–35% increase relative to 2021. Vegetation classes, especially grassland and degraded forest, are projected to decline steadily over the same period. Sparse vegetation is expected to expand in northern and eastern margins, consistent with earlier observed degradation hotspots.
These projections demonstrate that urbanization will remain the dominant driver of LULC change in coming decades. While both classifiers converge on similar overall trajectories, their different spatial configurations underscore the importance of model assumptions and the inherent uncertainty of scenario-based predictions.

3.5. Net Change Analysis

Net change analysis between 2000 and 2021 provides an overview of long-term land cover shifts (Table 12 and Table 13). Both classifiers indicate substantial gains in urban built-up and corresponding losses in several vegetation classes.
According to the SVM results (Table 12), urban built-up increased by 21,154.5 ha, representing the most prominent positive change. Conversely, grassland decreased by 70,545.5 ha, the largest single net loss among all categories. Additional declines were observed in shrubland (−21,168.1 ha) and degraded forest (−17,083.1 ha). Gains occurred in pasture/hay (+53,503.2 ha) and sparse vegetation (+29,332.4 ha), indicating that much of the reduction in grassland was redistributed into these categories.
RF-based results (Table 13) follow the same general pattern. Built-up expanded by 21,394.8 ha, while grassland declined by 63,894.6 ha. Pasture/hay again showed a strong net increase (+51,042.8 ha), while sparse vegetation grew by +23,627.1 ha. Minor differences between classifiers reflect their sensitivity to class boundaries and classification decisions, yet both consistently highlight the same dominant trends: built-up expansion, grassland decline, and redistribution toward pasture/hay and sparse vegetation.
The net change analysis consolidates the temporal and spatial findings from earlier subsections, demonstrating that urbanization and vegetation redistribution have been the defining processes in reshaping LULC for the last two decades.

4. Discussion

4.1. Classifier Performance and Multi-Sensor Comparability

Both SVM and RF classifiers produced high and comparable overall accuracies (Kappa 0.84–0.94 across all years and classifiers), consistent with performance levels reported for similar multi-temporal LULC studies using these algorithms [11,12]. The marginal numerical advantage of SVM over RF in most epochs aligns with findings by Shih et al. [11], who noted that SVM tends to generalize better in high-dimensional spectral feature spaces, particularly when training samples are limited relative to the number of input features. However, the difference observed here is too small to attribute to algorithmic superiority without formal statistical testing, and both classifiers should be considered functionally equivalent for the purposes of this study.
A critical interpretive caveat concerns the mixed-sensor design. The transition from Landsat 5/8 (30 m) to Sentinel-2 (10 m) in 2021 introduces a resolution discontinuity that inflates apparent classification accuracy for the most recent epoch. Resolution differences between sensors are a well-recognized source of bias in multi-temporal LULC comparisons [5], and the improvement from a Kappa of 0.90–0.91 (2015) to 0.92–0.94 (2021) cannot be attributed solely to classifier or preprocessing advances. Users of the 2021 classification outputs should therefore interpret these results with awareness that some apparent gains in classification detail reflect sensor capability rather than methodological refinement. Future work should examine the use of harmonized reflectance products or sensor-agnostic radiometric normalization to minimize this effect [17].

4.2. Drivers and Patterns of LULC Change in Spatial and Socioeconomic Context

The most striking historical pattern revealed by both classifiers is the continuous expansion of urban built-up land alongside simultaneous declines in grassland and degraded forest throughout 2000–2021. These trends are not spatially random: urban growth was concentrated in the eastern and southern peri-urban margins of the seven-district AOI, consistent with infrastructure expansion along the Tuul River corridor and major road networks—the primary accessibility drivers identified by the CA-ANN model. This spatial pattern echoes findings from comparable post-socialist cities in Central Asia, where road-led expansion and informal settlement growth are the dominant mechanisms of urban land conversion [13,21].
The socioeconomic context of Ulaanbaatar’s urbanization is essential for interpreting these patterns. Post-1990 land privatization following Mongolia’s transition from a planned to a market economy triggered a sustained wave of ger district expansion on the urban periphery, as rural migrants constructed informal dwellings on individually allocated plots [18,19]. This process is spatially visible in the LULC data as incremental conversion of grassland and shrubland to built-up land at the urban fringe. The 2005–2010 interval, identified as the most dynamic period in this study, coincides with a period of intensified rural-to-urban migration driven by severe dzud (extreme winter weather) events that decimated livestock herds and displaced pastoral households [18]. This socioeconomic pressure, rather than deliberate planning, was the primary engine of LULC change during this interval, and the apparent redistribution among vegetation sub-classes may partly reflect both genuine land degradation from increased grazing pressure on the urban periphery and classifier drift between Landsat 5 acquisitions across the sensor’s later operational years.
Forest loss on the southern slopes of the Khentii mountain range—reflected in declining dense forest cover between 2000 and 2010 and again after 2015—is consistent with documented patterns of illegal logging, firewood collection, and encroachment by ger settlements into forested buffer zones [20]. These dynamics are driven by the city’s heavy reliance on coal and biomass combustion for winter heating, a persistent problem directly tied to the socioeconomic conditions of low-income peripheral populations. The spatial accessibility factors identified by the CA-ANN model (proximity to roads and existing built-up) are therefore proxies for a broader socioeconomic gradient in which poorer households occupy increasingly marginal peri-urban land, placing mounting pressure on adjacent forest and grassland ecosystems.

4.3. CA-ANN Model Performance, Uncertainty, and Scenario Interpretation

The CA-ANN model achieved satisfactory out-of-sample validation accuracy against the 2021 observed map (Kappa: 0.9278 for SVM-based, 0.9087 for RF-based). These values are broadly comparable with CA-ANN validation Kappa values reported in analogous urban growth modeling studies using the MOLUSCE framework [14,16]. However, as noted in the Results, Kappa can be inflated in urban growth scenarios where landscape persistence dominates; the Figure of Merit (FoM) metric provides a more informative assessment of the model’s ability to simulate actual change locations [9,14]. The FoM reported here (0.24) is consistent with the range typically observed in cellular automata urban growth models (0.10–0.35), suggesting that while the model captures overall spatial dynamics, its ability to predict the precise location of cell-level transitions is inherently limited—a well-known constraint of the CA paradigm [15].
The business-as-usual (BAU) projections should be interpreted as conditional trajectories rather than deterministic forecasts. They assume the continuation of historical transition rates and spatial driver relationships calibrated on 2000–2015 dynamics, and therefore do not capture potential discontinuities introduced by policy interventions, demographic shifts, or macro-economic changes. In the context of Ulaanbaatar, where national urban planning policy has undergone significant revision since the 2030 Master Plan, this limitation is non-trivial. The scenario-based extensions (Conservation and Infrastructure Expansion), while not modeled in full within the current study, illustrate the sensitivity of projected outcomes to planning assumptions and underscore the need for scenario analysis to accompany any single-trajectory projection in a policy context [13].

4.4. Planning Implications

The CA-ANN transition probability maps generated in this study identify the specific areas at highest risk of urban conversion through 2050 under current trends. These outputs have direct operational value for Ulaanbaatar’s planning authorities. The northern and north-eastern forest margins show consistently elevated transition probability to built-up land and degraded vegetation categories, indicating that proactive designation of legally enforced green belt zones in these areas—as recommended under the 2030 Master Plan—would have the greatest conservation return per unit of policy effort. Reforestation initiatives should prioritize the southern mountain slopes, where dense forest loss has been most pronounced and where terrain-driven accessibility limits future urban encroachment [20,21].
Road infrastructure investment is the most powerful spatial predictor of urban expansion in the CA-ANN model, consistent with international evidence on accessibility-driven sprawl [13]. This implies that planned road corridor extensions—particularly those connecting the city center with eastern and south-eastern peri-urban areas—should be subject to proactive LULC impact assessment before construction. The methodological framework presented here, including the spatial driver analysis and transition probability mapping, can be adapted to evaluate the projected LULC consequences of specific infrastructure scenarios and integrated directly into the environmental impact assessment process for major transport projects in Ulaanbaatar and comparable rapidly urbanizing cities across Mongolia and Central Asia.

4.5. Limitations

Several limitations of this study should be acknowledged. First, the mixed-sensor design (Landsat 30 m for 2000–2015, Sentinel-2 10 m for 2021) introduces a resolution discontinuity that limits the strict comparability of classification accuracy metrics across time periods and should be borne in mind when interpreting apparent temporal trends in class-level accuracy. Second, the ten vegetation and land cover classes used in this study include several spectrally similar sub-categories (particularly the grassland, pasture/hay, and sparse vegetation trio) that are challenging to discriminate at 30 m resolution. Jeffries-Matusita separability analysis confirmed marginal separability between some pairs, meaning that apparent inter-class transitions during 2005–2010 may partly reflect classification uncertainty rather than genuine land cover change. Third, the CA-ANN model relies on spatial accessibility variables as proxies for urbanization pressure, but does not explicitly incorporate demographic projections, household income distributions, or formal planning designations. Integration of population census data, housing policy records, and district-level economic indicators in future iterations of the model would improve its socioeconomic realism and predictive validity [19,21]. Fourth, the study area is restricted to the seven contiguous central districts, excluding the geographically isolated Baganuur and Bagakhangai districts, which have distinct land use dynamics related to coal mining and peri-urban agriculture respectively. A full-municipality analysis incorporating these districts would provide a more complete picture of Ulaanbaatar’s long-term LULC trajectory.

5. Conclusions

This study evaluated the spatiotemporal dynamics of Land Use and Land Cover (LULC) in Ulaanbaatar, Mongolia, utilizing a multi-temporal remote sensing approach integrated with machine learning and simulation modeling. The accuracy of Support Vector Machine (SVM) and Random Forest (RF) classifiers was assessed for long-term LULC mapping (2000–2021). Both algorithms exhibited high reliability and produced comparable results; SVM yielded an average Kappa coefficient of 0.8939 while RF achieved 0.8917. This marginal numerical difference should not be interpreted as evidence of algorithmic superiority without formal statistical testing. The highest classification accuracy was recorded in 2021 (SVM Kappa: 0.9424), which partly reflects the improved spatial resolution of Sentinel-2 imagery in addition to any classifier-specific performance differences.
The integration of these classifiers with the Cellular Automata-Artificial Neural Network (CA-ANN) model provided future projections of urban expansion through 2050 under a business-as-usual scenario. Key findings indicate a consistent trajectory of urban growth at the expense of natural ecosystems. Specifically, the analysis identified a notable decline in dense forest and grassland cover, driven primarily by accessibility-related factors such as proximity to existing built-up areas and transport infrastructure. Although the rate of urban expansion is projected to decelerate in the coming decades relative to the rapid growth observed since 2000, the cumulative loss of green space represents a significant concern for urban ecological integrity that warrants proactive planning responses.
These results offer an analytical basis for balancing urbanization with environmental preservation. The projected trajectories highlight the need for proactive land management strategies. Specifically, the transition probability maps generated by the CA-ANN model can be used to identify the spatial extent of forest and grassland areas at highest risk of urban conversion through 2050, supporting the delineation of evidence-based green belt boundaries as called for in Ulaanbaatar’s 2030 Master Plan. Targeted reforestation programs should prioritize the northern mountain slopes, where dense forest loss has been most pronounced. Planners should also consider the role of road infrastructure expansion as a driver of peri-urban growth; new transport corridors should be evaluated against projected LULC change outcomes before approval. Future work should incorporate fully operationalized scenario-based projections (enforced conservation zones versus accelerated infrastructure expansion) and independent accuracy benchmarking against contemporary global LULC products such as ESA WorldCover. The methodological approach is applicable to other rapidly developing cities in Mongolia and Central Asia facing similar land-use pressures.
Finally, it should be noted that cross-sensor accuracy comparisons in this study are subject to a resolution discontinuity: Landsat-derived classifications (30 m, 2000–2015) and Sentinel-2 (10 m, 2021) cannot be strictly compared as equivalent outputs. The higher accuracy values recorded for 2021 partly reflect the finer spatial resolution of Sentinel-2 rather than algorithmic or methodological improvement alone. All temporal comparisons of classification accuracy should be interpreted in light of this inherent limitation, which is a common challenge in long-term multi-sensor LULC monitoring and is documented in full in the Materials and Methods.


Author Contributions

Conceptualization, O.L. and F.T.; methodology, O.L. and U.G.; software, U.G.; validation, O.L. and U.G.; formal analysis, O.L. and U.G.; investigation, O.L. and F.T.; resources, O.L. and F.T.; data curation, U.G.; writing—original draft preparation, O.L. and U.G.; writing—review and editing, O.L., U.G. and F.T.; visualization, U.G.; supervision, F.T.; project administration, F.T.; funding acquisition, F.T. All authors have read and agreed to the published version of the manuscript.

Funding

This research was supported by the National Science and Technology Council and Ministry of Interior of Taiwan (ROC) under project no. of NSTC-113-2923-E-008-005-MY3 and 114PC050201A, respectively. The APC was supported by the National Science and Technology Council of Taiwan under project no. NSTC-113-2923-E-008-005-MY3.

Data Availability Statement

Data will be made available on request.

Conflicts of Interest

The authors declare no conflicts of interest.

References

  1. Meyer, W.B.; Meyer, W.B.; BLTurner, I.I. (Eds.) Changes in Land Use and Land Cover: A Global Perspective; Cambridge University Press: Cambridge, UK, 1994. [Google Scholar]
  2. Kavzoglu, T.; Tonbul, H.; Yildiz Erdemir, M.; Colkesen, I. Dimensionality Reduction and Classification of Hyperspectral Images Using Object-Based Image Analysis. J. Indian Soc. Remote Sens. 2018, 46, 1297–1306. [Google Scholar] [CrossRef]
  3. Foley, J.A.; DeFries, R.; Asner, G.P.; Barford, C.; Bonan, G.; Carpenter, S.R.; Snyder, P.K. Global Consequences of Land Use. Science 2005, 309, 570–574. [Google Scholar] [CrossRef] [PubMed]
  4. Alberti, M. Advances in Urban Ecology: Integrating Humans and Ecological Processes in Urban Ecosystems; Springer: New York, NY, USA, 2008. [Google Scholar]
  5. Potapov, P.; Hansen, M.C.; Kommareddy, I.; Kommareddy, A.; Turubanova, S.; Pickens, A.; Ying, Q. Landsat Analysis Ready Data for Global Land Cover and Land Cover Change Mapping. Remote Sens. 2020, 12, 426. [Google Scholar] [CrossRef]
  6. Petropoulos, G.P.; Partsinevelos, P.; Mitraka, Z. Change Detection of Surface Mining Activity and Reclamation Based on a Machine Learning Approach of Multi-temporal Landsat TM imagery. Geocarto Int. 2013, 28, 323–342. [Google Scholar] [CrossRef]
  7. Di Gregorio, A. Land Cover Classification System: Classification Concepts and User Manual: LCCS; Food & Agriculture Organization: Rome, Italy, 2005. [Google Scholar]
  8. Afify, H.A. Evaluation of Change Detection Techniques for Monitoring Land-Cover Changes: A Case Study in New Burg El-Arab area. Alex. Eng. J. 2011, 50, 187–195. [Google Scholar]
  9. Singh, A. Review Article Digital Change Detection Techniques using Remotely Sensed Data. Int. J. Remote Sens. 1989, 10, 989–1003. [Google Scholar] [CrossRef]
  10. Deer, P. Digital Change Detection Techniques in Remote Sensing; Defence Science and Technology Organization Canberra: Canberra, Australia, 1995. [Google Scholar]
  11. Shih, H.C.; Stow, D.A.; Tsai, Y.H. Guidance on and Comparison of Machine Learning Classifiers for Landsat-Based Land Cover and Land Use Mapping. Int. J. Remote Sens. 2019, 40, 1248–1274. [Google Scholar] [CrossRef]
  12. Bangira, T.; Alfieri, S.M.; Menenti, M.; Van Niekerk, A. Comparing Thresholding with Machine Learning Classifiers for Mapping Complex Water. Remote Sens. 2019, 11, 1351. [Google Scholar] [CrossRef]
  13. Alsharif, M.; Alzandi, A.A.; Shrahily, R.; Mobarak, B. Land Use Land Cover Change Analysis for Urban Growth Prediction Using Landsat Satellite Data and Markov Chain Model for Al Baha Region Saudi Arabia. Forests 2022, 13, 1530. [Google Scholar] [CrossRef]
  14. Muhammad, R.; Zhang, W.; Abbas, Z.; Guo, F.; Gwiazdzinski, L. Spatiotemporal Change Analysis and Prediction of Future Land Use and Land Cover Changes using QGIS MOLUSCE Plugin and Remote Sensing Big Data: A Case Study of Linyi, China. Land 2022, 11, 419. [Google Scholar] [CrossRef]
  15. Liu, Q.; Gong, F. Monitoring Land Use and Land Cover Change: A Combining Approach of Change Detection to Analyze Urbanization in Shijiazhuang, China. 2013. Available online: https://hig.diva-portal.org/smash/record.jsf?pid=diva2%3A600665&dswid=-2922 (accessed on 15 May 2024).
  16. Amgoth, A.; Rani, H.P.; Jayakumar, K.V. Exploring LULC Changes in Pakhal Lake Area, Telangana, India using QGIS MOLUSCE plugin. Spat. Inf. Res. 2023, 31, 429–438. [Google Scholar] [CrossRef]
  17. Svoboda, J.; Štych, P.; Laštovička, J.; Paluba, D.; Kobliuk, N. Random Forest Classification of Land Use, Land-Use Change and Forestry (LULUCF) Using Sentinel-2 Data—A Case Study of Czechia. Remote Sens. 2022, 14, 1189. [Google Scholar] [CrossRef]
  18. Myagmartseren, P.; Myagmarjav, I.; Enkhtuya, N.; Byambakhuu, G.; Bazarkhand, T. Estimating Built-up Area Change in Ulaanbaatar city, Mongolia. Int. Arch. Photogramm. Remote Sens. Spat. Inf. Sci. 2020, 43, 143–147. [Google Scholar] [CrossRef]
  19. The National Statistical Office (NSO) of Mongolia. 2023. Available online: https://www.nso.mn/eng/ (accessed on 1 March 2023).
  20. The Study on City Master Plan and Urban Development of Ulaanbaatar City (UBMPS) Final Report. 2009. Available online: https://openjicareport.jica.go.jp/pdf/11937158_01.pdf (accessed on 1 March 2023).
  21. Batsuuri, B.; Fürst, C.; Myagmarsuren, B. Estimating the Impact of Urban Planning Concepts on Reducing the Urban Sprawl of Ulaanbaatar City using Certain Spatial Indicators. Land 2020, 9, 495. [Google Scholar] [CrossRef]
  22. World Population Review. 2022. Available online: https://worldpopulationreview.com (accessed on 1 March 2023).
  23. Capital City Governor’s Office of Ulaanbaatar. 2021. Available online: https://zdtg.ulaanbaatar.mn/docs?cat=1 (accessed on 1 March 2023).
  24. Cervantes, J.; Garcia-Lamont, F.; Rodríguez-Mazahua, L.; Lopez, A. A Comprehensive Survey on Support Vector Machine Classification: Applications, Challenges and Trends. Neurocomputing 2020, 408, 189–215. [Google Scholar] [CrossRef]
Figure 1. Study area (Ulaanbaatar, Mongolia).
Remotesensing 18 01228 g001
Figure 2. Model structure of simulating LULC changes using CA-ANN.
Remotesensing 18 01228 g002
Figure 3. General methodological workflow chart of the research.
Remotesensing 18 01228 g003
Figure 4. Land use and land cover classification maps for 2000–2021 using (a) SVM and (b) RF classifiers.
Remotesensing 18 01228 g004
Figure 5. Temporal dynamics of LULC change between intervals.
Remotesensing 18 01228 g005
Figure 6. Trends in urban built-up area expansion (2000–2021).
Remotesensing 18 01228 g006
Figure 7. Urban expansion patterns from 2000 to 2021 derived from (a) SVM and (b) RF classifications.
Remotesensing 18 01228 g007
Figure 8. Validation map: simulated vs. actual 2021 (SVM).
Remotesensing 18 01228 g008
Figure 9. Validation map: simulated vs. actual 2021 (RF).
Remotesensing 18 01228 g009
Figure 10. Predicted LULC distribution for 2030.
Remotesensing 18 01228 g010
Figure 11. Predicted LULC distribution for 2040.
Remotesensing 18 01228 g011
Figure 12. Predicted LULC distribution for 2050.
Remotesensing 18 01228 g012
Table 1. Details of satellite data for the analysis of LULC in the study area.
YearData SourceHID
Path/Row
Tile Number
DateResolution, m
2000Landsat 5 TM131/2714 April 200030
1 June 200030
28 July 200030
4 August 200030
2005Landsat 5 TM131/2714 May 200530
2 August 200530
18 August 200530
21 October 200530
2010Landsat 5 TM131/2713 June 201030
31 July 201030
17 September 201030
3 October 201030
2015Landsat 8 OLI/TIRS131/2727 June 201530
14 August 201530
30 August 201530
1 October 201530
2021Sentinel-2T48UXU18 June 202110
T48UXU21 June 202110
T48UXU11 July 202110
T48UXU
T48TXT
18 July 202110
T48UXU4 August 202110
T48TXT5 August 202110
T48UXU
T48TXT
10 August 202110
T48TXT16 September 202110
T48UXU6 October 202110
Table 2. LULC classes descriptions.
ClassesDescriptions
Urban built-upUrban artificially surfaced areas, occupied by settlements, industrial areas, and transport infrastructure
Dense ForestClosed-canopy forest stands dominated by Siberian larch (Larix sibirica) and birch (Betula platyphylla), consistent with Mongolian national forest inventory classifications. Includes all lands with tree canopy density of 70% and above.
Degraded ForestPartially disturbed or open-canopy forest dominated by Siberian larch (Larix sibirica) and birch (Betula platyphylla), including areas affected by fire, logging, or grazing pressure. Tree canopy density below 70%, per Mongolian national forest inventory definitions.
ShrublandAreas primarily covered with shrubs, scrubs, orchards, groves, and transitional vegetation in residential and agricultural areas
Grassland/HerbaceousNative grassland areas have grass or herbaceous vegetation, with a maximum height of 1.5 m and gramineous species dominating.
Pasture/HaySeasonally grazed steppe grassland used for nomadic and semi-nomadic pastoralism, consistent with Mongolia’s national land classification framework. Distinguished from natural grassland by detectable seasonal phenological signatures associated with grazing pressure and rotational land use patterns.
Sparse vegetationAreas with sparse vegetation cover 10–30% of the surface. Low-productivity grasslands including rocky areas
Bare soil, rockNon-vegetated areas where at least 90% of the land surface is covered by bare soil, rocks, or active erosion
Sandy areaSandy area with less than 10% vegetation cover
Water bodyWater bodies such as streams, lakes, rivers, and reservoirs
Table 3. Area statistics of LULC classes (2000–2021) classified by SVM.
LULC Classes20002005201020152021
ha%ha%ha%ha%ha%
Dense Forest73,914.4918.7089,124.0822.5558,317.7514.7582,213.0420.8077,937.7519.72
Degraded Forest30,634.727.7521,979.575.5640,498.6510.2434,549.568.7434,135.848.64
Shrubland40,628.1310.2826,694.846.7542,174.6310.6734,194.888.6542,400.1710.73
Grassland/Herbaceous133,174.233.69132,86933.6180,932.520.4755,546.2314.0562,628.7315.84
Pasture/Hay39,140.239.9057,867.2314.6491,539.4123.1668,945.0217.4455,198.3513.96
Sparse vegetation42,520.2810.7610,872.842.7530,637.97.7564,483.6116.3153,345.0513.49
Bare soil12,875.813.2630,031.647.6019,133.054.8418,974.744.8026,677.576.75
Sandy area2320.240.592817.080.711626.690.411465.40.371461.710.37
Water body2582.290.653344.510.853046.830.772556.680.652850.760.72
Urban built-up17,517.914.4319,707.554.9927,400.926.9332,379.178.1938,672.49.78
Table 4. Area statistics of LULC classes (2000–2021) classified by RF.
LULC Classes20002005201020152021
ha%ha%ha%ha%ha%
Dense Forest74,060.218.793,696.0923.774,546.7318.975,546.2919.178,382.1819.8
Degraded Forest30,751.257.7822,064.075.5832,927.668.3337,331.269.4434,581.098.75
Shrubland35,875.239.0826,888.396.842,572.5510.844,020.3811.141,703.9910.6
Grassland/Herbaceous126,898.732.1125,228.231.769,246.2717.555,147.31463,004.1515.9
Pasture/Hay44,131.5411.259,699.5815.184,873.5121.565,404.416.655,267.6714
Sparse vegetation48,907.3912.411,663.542.9539,494.689.9963,679.3616.153,110.6313.4
Bare soil13,412.093.3931,667.738.0118,932.444.7918,934.124.7927,161.956.87
Sandy area2360.610.62755.840.71588.810.41390.850.351542.450.39
Water body2372.130.63056.690.773207.50.812412.440.612620.260.66
Urban built-up16,539.164.1818,588.254.727,918.187.0631,441.937.9537,933.969.6
Table 5. Overall accuracy and Kappa coefficient of LULC classifications (2000–2021).
Classifiers20002005201020152021
OAKappaOAKappaOAKappaOAKappaOAKappa
SVM87.240.845191.950.901989.310.875091.840.905195.010.9424
RF88.960.866390.620.883090.830.892790.730.892393.440.9243
(OA = overall accuracy %; Kappa = Cohen’s Kappa on 0–1 scale).
Table 6. Area changes in LULC classes across time intervals (SVM).
LULC Classes2000–20052005–20102010–20152015–2021
ha%ha%ha%ha%
Dense Forest15,209.593.85−30,806.3−7.823,895.296.05−4275.29−1.08
Degraded Forest−8655.15−2.1918,519.084.68−5949.09−1.5−413.72−0.1
Shrubland−13,933.3−3.5315,479.793.92−7979.75−2.028205.292.08
Grassland/Herbaceous−305.2−0.08−51,936.5−13.14−25,386.3−6.427082.51.79
Pasture/Hay18,7274.7433,672.188.52−22,594.4−5.72−13,746.7−3.48
Sparse vegetation−31,647.4−8.0119,765.06533,845.718.56−11,138.6−2.82
Bare soil17,155.834.34−10,898.6−2.76−158.31−0.047702.831.95
Sandy area496.840.12−1190.39−0.3−161.29−0.04−3.690.1
Water body762.220.2−297.68−0.08−490.15−0.12294.080.07
Urban built-up2189.640.567693.371.944978.251.266293.231.59
Table 7. Area changes in LULC classes across time intervals (RF).
LULC Classes2000–20052005–20102010–20152015–2021
ha%ha%ha%ha%
Dense Forest19,635.894.97−19,149.4−4.84999.560.252835.890.72
Degraded Forest−8687.18−2.210,863.592.754403.61.11−2750.17−0.69
Shrubland−8986.84−2.2815,684.163.971447.830.37−2316.39−0.59
Grassland/Herbaceous−1670.50.42−55,981.9−14.16−14,099−3.577856.851.99
Pasture/Hay15,568.043.9425,173.936.37−19,469.1−4.92−10,136.7−2.57
Sparse vegetation−37,243.9−9.4227,831.147.0424,184.686.12−10,568.7−2.67
Bare soil18,255.644.62−12,735.3−3.221.6808227.832.08
Sandy area395.230.1−1167.03−0.3−197.96−0.05151.60.04
Water body684.560.17150.810.04−795.06−0.2207.820.05
Urban built-up2049.090.529329.932.363523.750.896492.031.65
Table 8. Annual average changes in urban built-up area (2000–2021).
2000–20052005–20102010–20152015–2021Average
ha%ha%ha%ha%ha%
SVM87.592.50307.737.81199.133.63209.773.89201.064.46
RF81.962.48373.2010.04140.952.52216.403.44203.134.62
Average84.772.49340.478.92170.043.08213.093.66202.094.54
Table 9. Validation metrics of CA-ANN model for 2021 simulation.
SVMRF
Percentage of correctness93.7640891.86532
Kappa (overall)0.927830.908719
Kappa (histo)0.966090.95639
Kappa (loc)0.960400.94809
Table 10. Projected area statistics of LULC classes (2030–2050, SVM).
LULC Classes203020402050
ha%ha%ha%
Dense Forest75,679.8419.1474,565.8318.8672,902.9818.44
Degraded Forest26,844.536.7932,528.648.2337,067.729.38
Shrubland41,119.510.4046,859.6511.8548,050.1912.16
Grassland/Herbaceous56,071.3614.1853,387.9113.5137,932.619.60
Pasture/Hay69,185.1717.5042,912.7410.8665,125.6416.47
Sparsely vegetation51,132.7212.9365,129.8916.4849,400.8712.50
Bare soil23,465.055.9424,225.686.1326,409.636.68
Sandy area1421.450.361374.760.351357.680.34
Water body3306.060.842946.560.752545.490.64
Urban built-up47,082.6511.9151,376.6713.0054,515.5213.79
Table 11. Projected area statistics of LULC classes (2030–2050, RF).
LULC Classes203020402050
ha%ha%ha%
Dense Forest79,430.7620.0977,079.6619.5074,908.118.95
Degraded Forest25,599.256.4829,559.67.4834,831.148.81
Shrubland43,864.6811.1049,915.2412.6349,252.9612.46
Grassland/Herbaceous59,127.0214.9646,081.511.6637,440.319.47
Pasture/Hay72,103.2518.2449,282.2412.4769,305.2617.53
Sparsely vegetation42,858.2310.8464,611.4816.3448,401.9312.24
Bare soil22,930.255.8024,250.886.1323,143.765.85
Sandy area1491.980.381305.810.331226.150.31
Water body2936.080.742579.10.652490.280.63
Urban built-up44,966.8311.3850,642.8212.8154,308.4413.74
Table 12. Net LULC changes between 2000 and 2021 (SVM).
LULC Classes2000–20102010–20212021–20302030–20402040–2050
Dense Forest486.533835.451048.58−2351.1−4176.68
Degraded Forest2176.411653.43−8981.843960.357508.12
Shrubland6697.32−868.562160.696050.56−1865.05
Grassland/Herbaceous−57,652.4−6242.12−3877.13−13,045.5−8148.89
Pasture/Hay40,741.97−29,605.816,835.58−22,82115,843.4
Sparse vegetation−9412.7113,615.95−10,252.421,753.25−15,210.6
Bare soil5520.358229.51−4231.71320.632158.75
Sandy area−771.8−46.36−50.47−186.1751.87
Water body835.37−587.24315.82−356.98−33.61
Urban built-up11,379.0210,015.787032.875675.993872.7
Table 13. Net LULC changes between 2000 and 2021 (RF).
LULC Classes2000–20102010–20212021–20302030–20402040–2050
Dense Forest−15,596.719,620−2257.91−1114.01342.27
Degraded Forest9863.93−6362.81−7291.315684.112302.5
Shrubland1546.5225.54−1280.675740.152393.31
Grassland/Herbaceous−52,241.7−18,303.8−6557.37−2683.45−15,947.6
Pasture/Hay52,399.18−36,341.113,986.82−26,272.426,392.52
Sparsely vegetation−11,882.422,707.15−2212.3313,997.17−16,728
Bare soil6257.247544.52−3212.52760.63−1081.92
Sandy area−693.55−164.98−40.26−46.69−148.61
Water body464.54−196.07455.3−359.5−456.28
Urban built-up9883.0111,271.488410.254294.022931.77
Disclaimer/Publisher’s Note: The statements, opinions and data contained in all publications are solely those of the individual author(s) and contributor(s) and not of MDPI and/or the editor(s). MDPI and/or the editor(s) disclaim responsibility for any injury to people or property resulting from any ideas, methods, instructions or products referred to in the content.