Article

Alternate Wetting and Drying Irrigated Rice Paddy Field Water Status Monitoring with ALOS-2 Three Components and IoT Sensors


1
Department of Geography and Environment, Pabna University of Science and Technology, Pabna 6600, Bangladesh
2
Earth Observation Research Center (EORC), Japan Aerospace Exploration Agency (JAXA), Ibaraki 305-8505, Japan
3
Institute of Industrial Science, University of Tokyo, Tokyo 182-8522, Japan
*
Author to whom correspondence should be addressed.
Remote Sens. 2026, 18(8), 1183; https://doi.org/10.3390/rs18081183
Submission received: 31 January 2026 / Revised: 26 March 2026 / Accepted: 10 April 2026 / Published: 15 April 2026

Highlights

What are the main findings?
  • Integration of IoT water-level sensors and ALOS-2 (L-band SAR) data successfully distinguishes AWD from non-AWD irrigation practices.
  • Freeman–Durden’s decomposition components (surface, double-bounce, and volume scattering) identify AWD status with high accuracy (80–93%).
What are the implications of the main findings?
  • L-band SAR-derived components provide an efficient, scalable tool for sustainable irrigation monitoring.
  • The proposed method could be applicable to generate reliable, large-scale and scientific evidence for carbon credit registration on an AWD irrigated rice paddy field.

Abstract

Alternate Wetting and Drying (AWD) is a proven water-saving irrigation technique that reduces irrigation water use and methane emissions from rice cultivation. The emission reduction achievable through AWD irrigation practices represents a significant opportunity for credits generation, particularly for the major rice-producing countries. To capitalize on this opportunity, a scalable, reliable, and cost-effective information system for AWD irrigation monitoring, reporting, and verification (MRV) is urgently needed. However, most existing MRV systems depend on manual data collection or software systems driven by field-based observation. Satellite remote sensing, derived from different tools and techniques, has achieved considerable traction in agriculture monitoring. This study attempts to develop a remote sensing and Internet of Things (IoT)-based system for large-scale AWD irrigation detection and monitoring as a potential tool for the MRV system. IoT sensor-based water level measurement, L-band PALSAR-2 full polarimetric data, and intensive field survey data were integrated and analyzed. Three study sites in the Naogaon District of Bangladesh, one of the major rice-growing regions, were selected as the study area. The PALSAR-2 full-polarimetric data were collected, radiometrically and geometrically corrected, and converted into the backscattered coefficient (Sigma-naught) value. Using the full-polarimetric channel of VV, VH, HH, and HV, the Freeman–Durden three-component decomposition, surface scattering, double-bounce, and volume scattering were constructed to assess the irrigation water condition of the rice paddy field. IoT sensors data, field survey data, and three-component data on 8 different dates and a total of 704 fields during the rice growing period were subsequently analyzed and cross-calibrated. The results showed that surface scattering and double bounce are more sensitive to irrigation water status, while volume scattering primarily responds to plant height changes. By leveraging the backscatter characteristics of these three components, a Random Forest classifier was applied to classify AWD and non-AWD irrigated paddy fields. Classification accuracy achieve 94% in early crop growth stages and declined to 80% during dense canopy stages. These findings offer a reliable and scalable approach to documenting water regime management with direct applicability to carbon emissions reduction verification and carbon credits claims.

1. Introduction

Rice is the staple food for more than half of the world’s population [1]. The global population will be 10 billion by the end of 2100, requiring a 30% increases in food production to meet the growing demand [2]. However, rice production already faces numerous challenges, including shrinking arable land, land degradation, irrigation water scarcity, disasters, and climate change [3]. In Bangladesh alone, rice production is projected to decline by 7–8% by 2050. [4]. Rice cultivation needs a huge amount of irrigation water, and 80% of irrigation water comes from freshwater reserves. Furthermore, rice cultivation contributes to approximately 10% of total global carbon emissions [5], and is a major source of non-CO2 greenhouse gases, accounting for 84% nitrous oxide emissions, 47% of methane emissions, and 10% to 75% of total anthropogenic emissions [6]. These combining effects place rice cultivation at the center of a critical dilemma: ensuring food security while promoting sustainable environmental management.
Traditionally, rice paddy is cultivated under continuously flooded conditions, which is responsible for freshwater consumption and substantial greenhouse gas (GHG) emissions. However, continuous flooding is not agronomically required throughout the entire growing cycle. The rice paddy does not require standing water except during critical growing stages (rooting and flowering) [7]. Alternate Wetting and Drying (AWD) is an irrigation technique in which paddy fields are maintained in a periodic wet and dry cycle, excluding the rooting and flowering stages [8]. AWD irrigation practice is recognized as a climate-smart irrigation system with strong potential for sustainable rice cultivation. Implementation of the AWD irrigation system can reduce total irrigation water use by up to 40% [9,10,11,12], decreasing methane emissions up to 70% from rice cultivation [13,14,15,16] without any significant yield loss [17,18,19]. Additionally, AWD practices have been reported to provide direct economic benefits to farmers through reduced input costs associated with decreased irrigation water use [20].
Based on the Kyoto protocol, AWD represents a potential source of carbon credit as it demonstrably reduces GHG emissions. The United Nations Framework Convention on Climate Change (UNFCCC) has approved AWD as a Clean Development Mechanism (CDM) [21]. Emission reductions from AWD practices have also been recognized under different bilateral carbon credit methodologies, such as the Joint Crediting Mechanism (JCM) and voluntary schemes like the Verified Carbon Standard (VCS) and Gold Standard (GS) [22,23]. The Intergovernmental Panel on Climate Change (IPCC) guidelines for methane emission estimation from rice paddies also incorporate water regime management parameters. Specifically, mid-season drainage and AWD implementation are key variables in the emission estimation formula [24].
A credible carbon credit project requires convincing, measurable, and reliable reductions in GHG emissions. To meet this requirement, accurate and comprehensive documentation on AWD practices is very important for monitoring, reporting, and verification. Evidence of water management and its validation is very crucial for credit application, verification, and the successful issuance of carbon credits. Currently, most of the AWD monitoring and documentation relies on manual field records or a software-based system. Satellite-based earth observing systems and the Internet of Things (IoT) technologies offer effective and efficient alternatives for such water management monitoring. Against this backdrop, this study aims to detect and monitor the AWD irrigation practices using remote sensing and IoT devices.
Remote sensing has been widely applied in agricultural management for vegetation growth and health monitoring, yield estimation, soil moisture monitoring, and crop losses and damage assessment [25,26,27,28,29,30]. In particular, Synthetic Aperture Radar (SAR)-based monitoring systems have demonstrated high sensitivity to soil water status [31,32]. Several studies have attempted to characterize water inundation conditions in rice paddy fields using various techniques and satellite datasets [33,34,35,36]. For instance, Sentinel 1A time series VV and VH backscatter coefficients were employed to detect rice paddies and assess flood inundation damage in the Red River Delta, Vietnam [31]. Additionally, IoT sensors integrated within a wireless sensor network (WSN) used for water-level monitoring, irrigation system control, and network management were deployed to facilitate large-scale adaptation of the AWD irrigated system in Bangladesh [37].
The L-band ALOS PALSAR dual polarimetry data, combined with backscatter coefficients and a Bayesian model, were used to distinguish between inundation and non-inundation soils [38]. Furthermore, L-band PALSAR-derived Freeman–Durden’s three-component decomposition backscatter data, integrated with intensive field survey data on plant height and water level, were used to classify inundation and non-inundation rice paddy fields with a high degree of precision [39]. The Sentinel-1 polarization ratio (VV/VH) derived during the peak growing session, in conjunction with two different classifiers—rule-based and machine learning—was applied to discriminate between rainfed and irrigated rice paddy fields [40]. A spatio-temporal fusion of MODIS and Sentinel-2 data, combined with a Random Forest classifier, was applied to assess irrigation dynamics of rice paddy fields in China [41].
Effective and timely information on irrigation water status is essential for AWD irrigation management. However, most of the existing studies have focused on the satellite sensor types and time series indices for irrigation water status assessment, while only a few have exclusively employed IoT devices to develop an automated irrigation system. The major challenges remain: field-specific and time-based irrigated water information, wide-scale applicability, maintaining operational efficiency, and generating reliable data for carbon credit verification. To address these gaps, this study integrates IoT devices, intensive field data, and PALSAR-2 satellite-derived three-component decomposition data to identify AWD irrigated rice paddy fields and monitor the irrigation status throughout the entire rice-growing season.

2. Materials and Methods

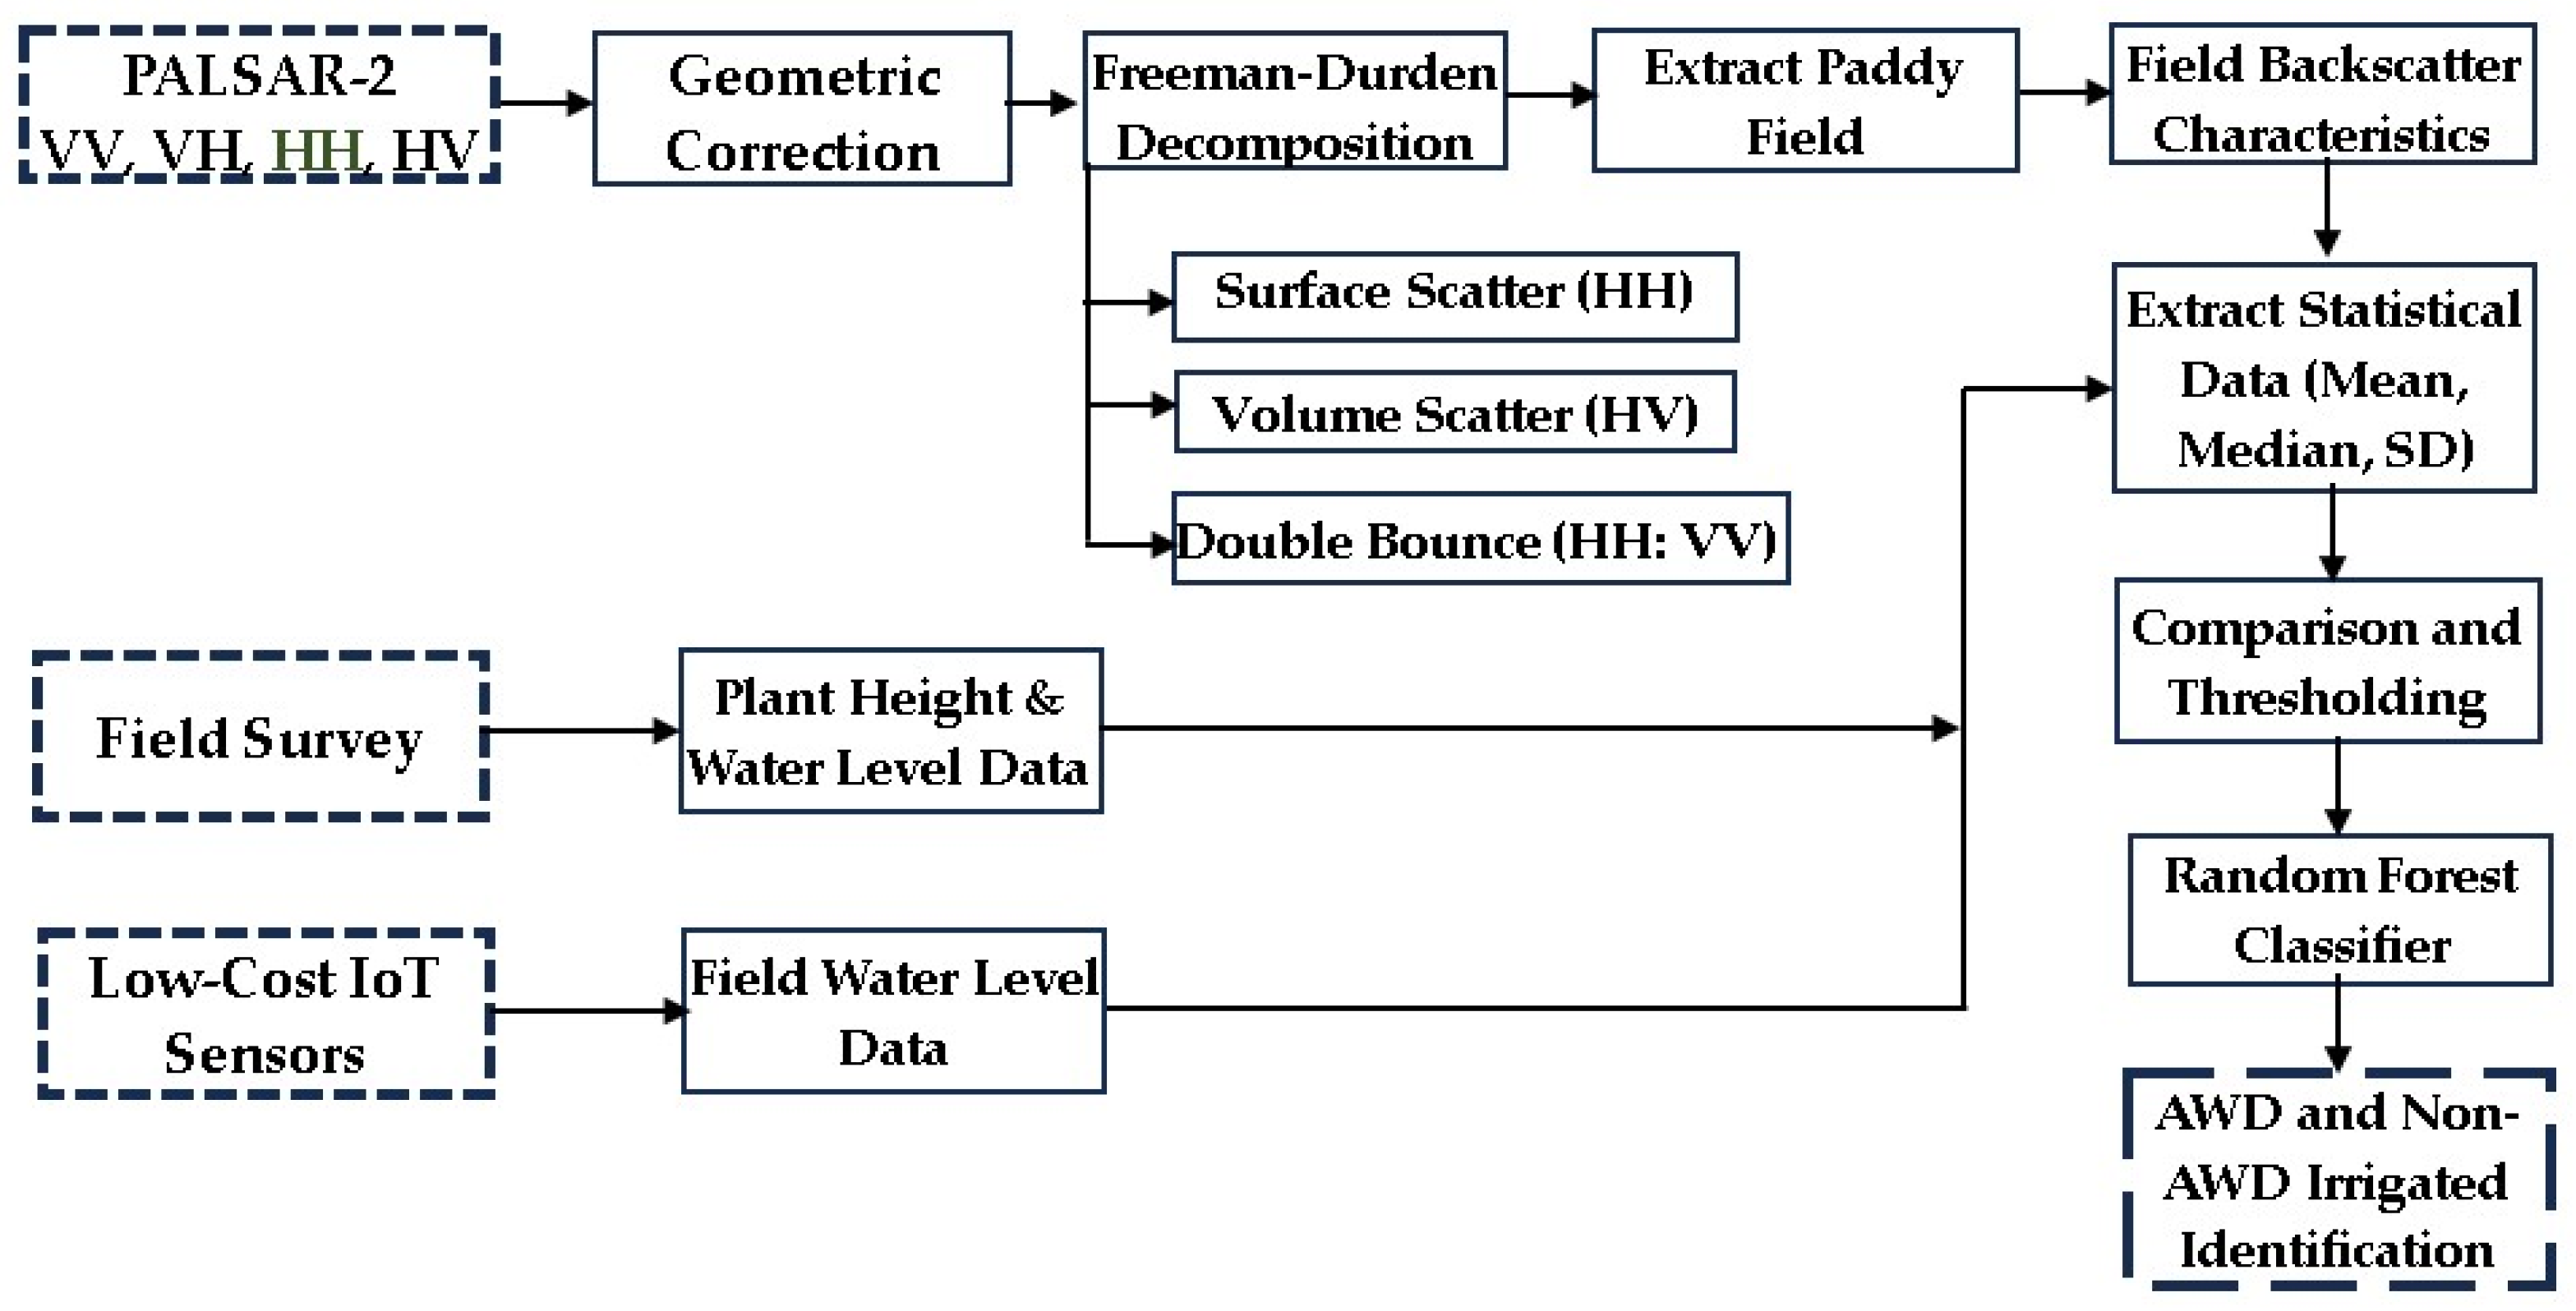
This study used three distinct data sources: (i) low-cost IoT sensor-based water level data, (ii) periodic intensive field survey data, and (iii) ALOS PALSAR 2 polarimetric data acquired over the study area. The field and IoT data were collected and processed, while the satellite data were simultaneously preprocessed, classified, compared, and validated against the field data to identify AWD and Non-AWD irrigated rice paddy fields within the study area. The overall workflow is illustrated in Figure 1.

2.1. Study Area

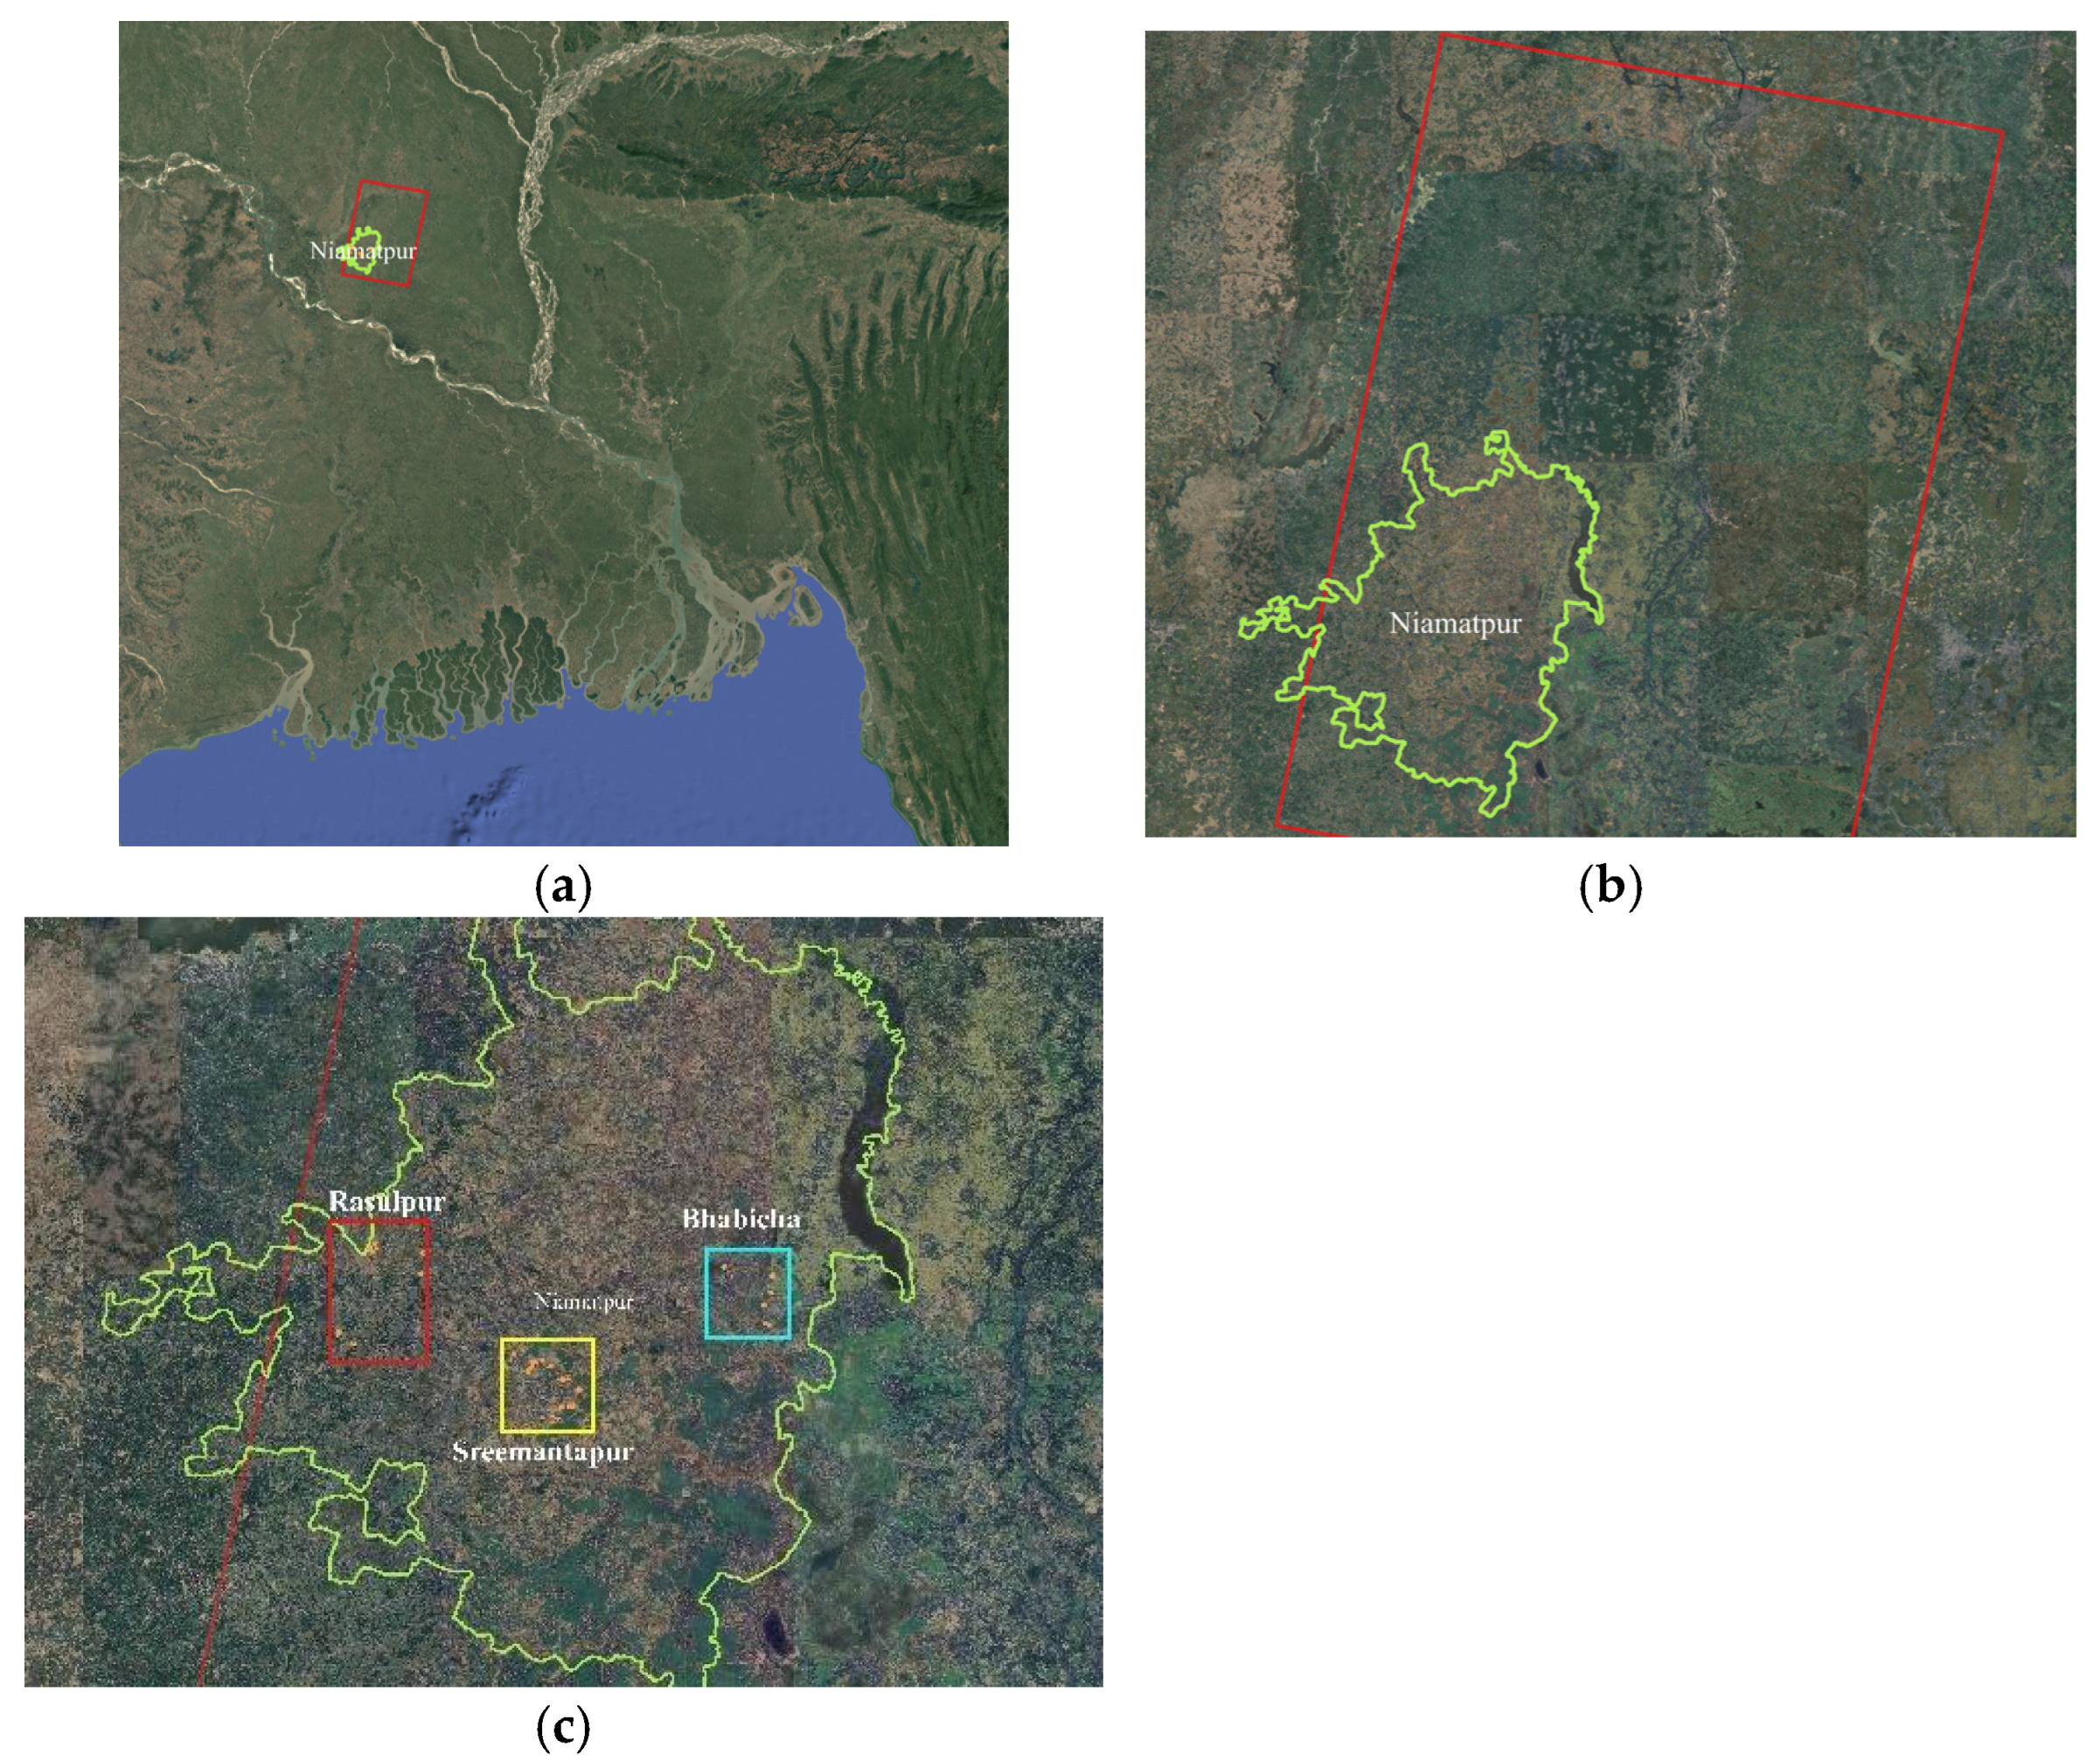
Bangladesh is the fourth-largest rice-producing country in the world [42]. The country’s physical and climatic conditions are highly favorable for rice production. Niamotpur Upazila, located within Naogaon district, is one of the country’s major rice-producing hubs. Three different sites within the Upazila were selected as the study area. The sites are: (a) Sreemantapur, (b) Rosulpur, and (c) Bhabicha. The predominant cropping patterns in the study area are Aman Rice–Fallow–Boro Rice (double-cropping) and Aman Rice–Mustard–Boro Rice (triple-cropping). In the double-cropping system, Boro rice is transplanted in December/January and harvested in April, whereas in the triple-cropping patterns, Boro rice is transplanted in January/February and harvested in April/May [43]. Farmers in the study area follow a traditional farming system in which land is prepared under puddled clay conditions, seedlings are manually transplanted, and fields are maintained under continuously flooded conditions throughout the growing period. Figure 2 presents the detailed location of the field sites overlaid on the PALSAR-2 observation path.

2.2. Remote Sensing Data

The ALOS-2 PALSAR-2 is a Japan Aerospace Exploration Agency (JAXA) Tokyo, Japan, satellite specifically designed for disaster monitoring, agriculture assessment, forest mapping, and crustal deformation monitoring [44]. The satellite carries the Phased Array Type L-band Synthetic Aperture RADDAR-2 (PALSAR-2) sensor, JAXA, Japan. Data were obtained from the JAXA data portal. In this study, we used PALSAR-2 polarimetric (quad-pole) Super Sites data with a 6.0 m spatial resolution, which was specifically acquired over the study area. Path/Frame 047/3110 provides full coverage of the study sites. The detailed observation characteristics of PALSAR-2 are summarized in Table 1. Satellite observation over the field sites spanning the entire rice-growing season was collected and analyzed to identify the AWD and non-AWD irrigated paddy fields.

2.3. Field Data

Field data on AWD and non-AWD irrigated rice paddy fields were collected from the three sites within the study area. Intensive manual observations and data collection were conducted by the agriculture extension department field-level officers and trained volunteers. A web-based data collection and storage system was developed, and field data were collected and entered into the database through KoboToolbox, version-2. Data collectors gathered information on transplantation date, rice variety, fertilizer and pesticide inputs, field irrigation water level, weather conditions, vegetation growth in terms of plant height, and relevant information for AWD practice monitoring and methane emission estimation. The collected data were uploaded to a web-based central data server and monitored with data expert. Furthermore, field visits were conducted and we periodically visited the plots on the date nearest to the satellite observation date. The satellite observation date and corresponding field visit dates are summarized in Table 2.

2.4. IoT Sensor Data

Along with the manual and web-based data collection, IoT water-level monitoring sensors were also installed across the study area. The IoT sensors with a laser sensor within a narrow pipe are installed in a rice paddy field. The sensor specifications are as follows: measuring range, 1–100 cm; resolution, 1 mm; transducer frequency, 200 kHz; output, RS485 Modbus; supply voltage, 5–12 VDC; accuracy, (±0.5%); working temperature, −20–70 °C; and data collection interval, 30 min. The sensors are capable of measuring water level both above and below the rice paddy field surface.
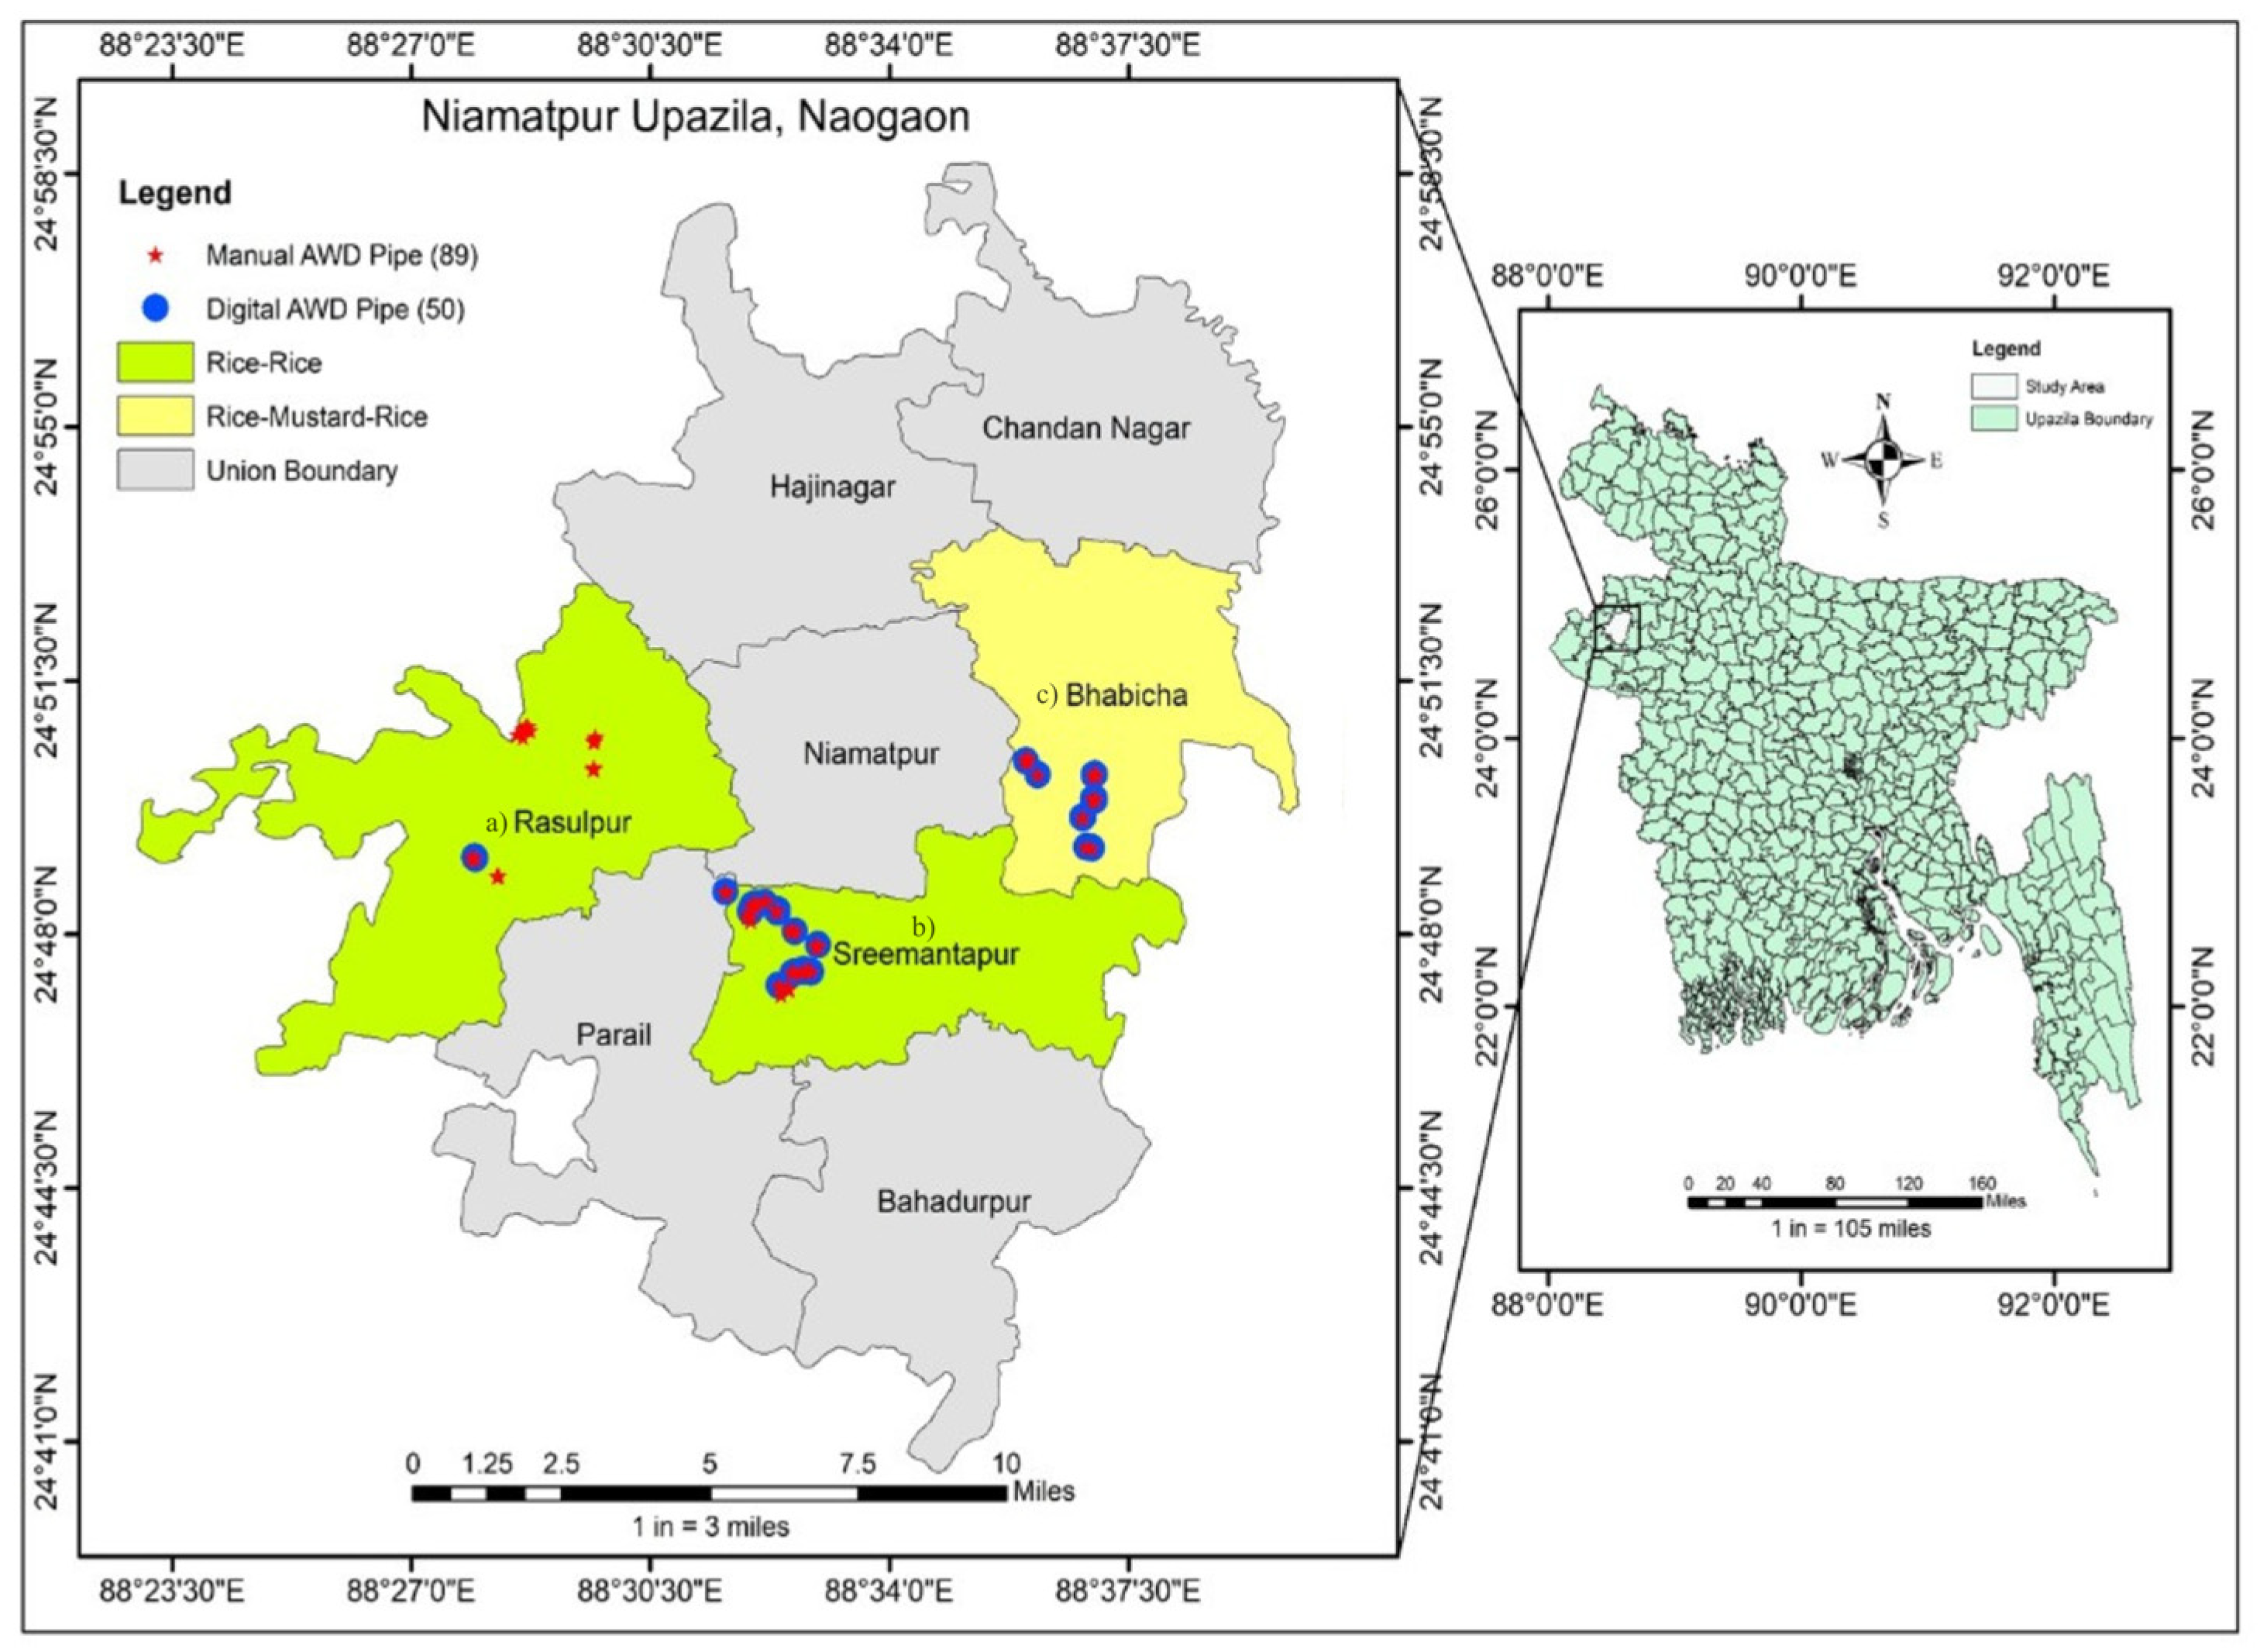
A total of 88 IoT sensors were installed for continuous water level data collection. At Site A (Rosulpur), 20 IoT sensors were installed, with 5 in AWD fields and 15 in non-AWD fields. Similarly, 44 sensors (40 AWD and 4 non-AWD) were installed in Sreemanatpur, and 24 sensors (15 AWD and 9 non-AWD) were installed in Bhabicha (Figure 3). Sensors were set up in both AWD and non-AWD fields to examine the differences in irrigation status between AWD and non-AWD fields, and compare with remote sensing techniques. The laser sensor-based IoT devices enable continuous water level measurement in the rice paddy fields [45]. In a non-AWD (traditional) irrigation system, farmers maintain continuous standing water at 1–15 cm above surface level, whereas AWD practice is permitted to reduce the irrigation water level to below −15 cm during non-critical growth stages of the rice crop.
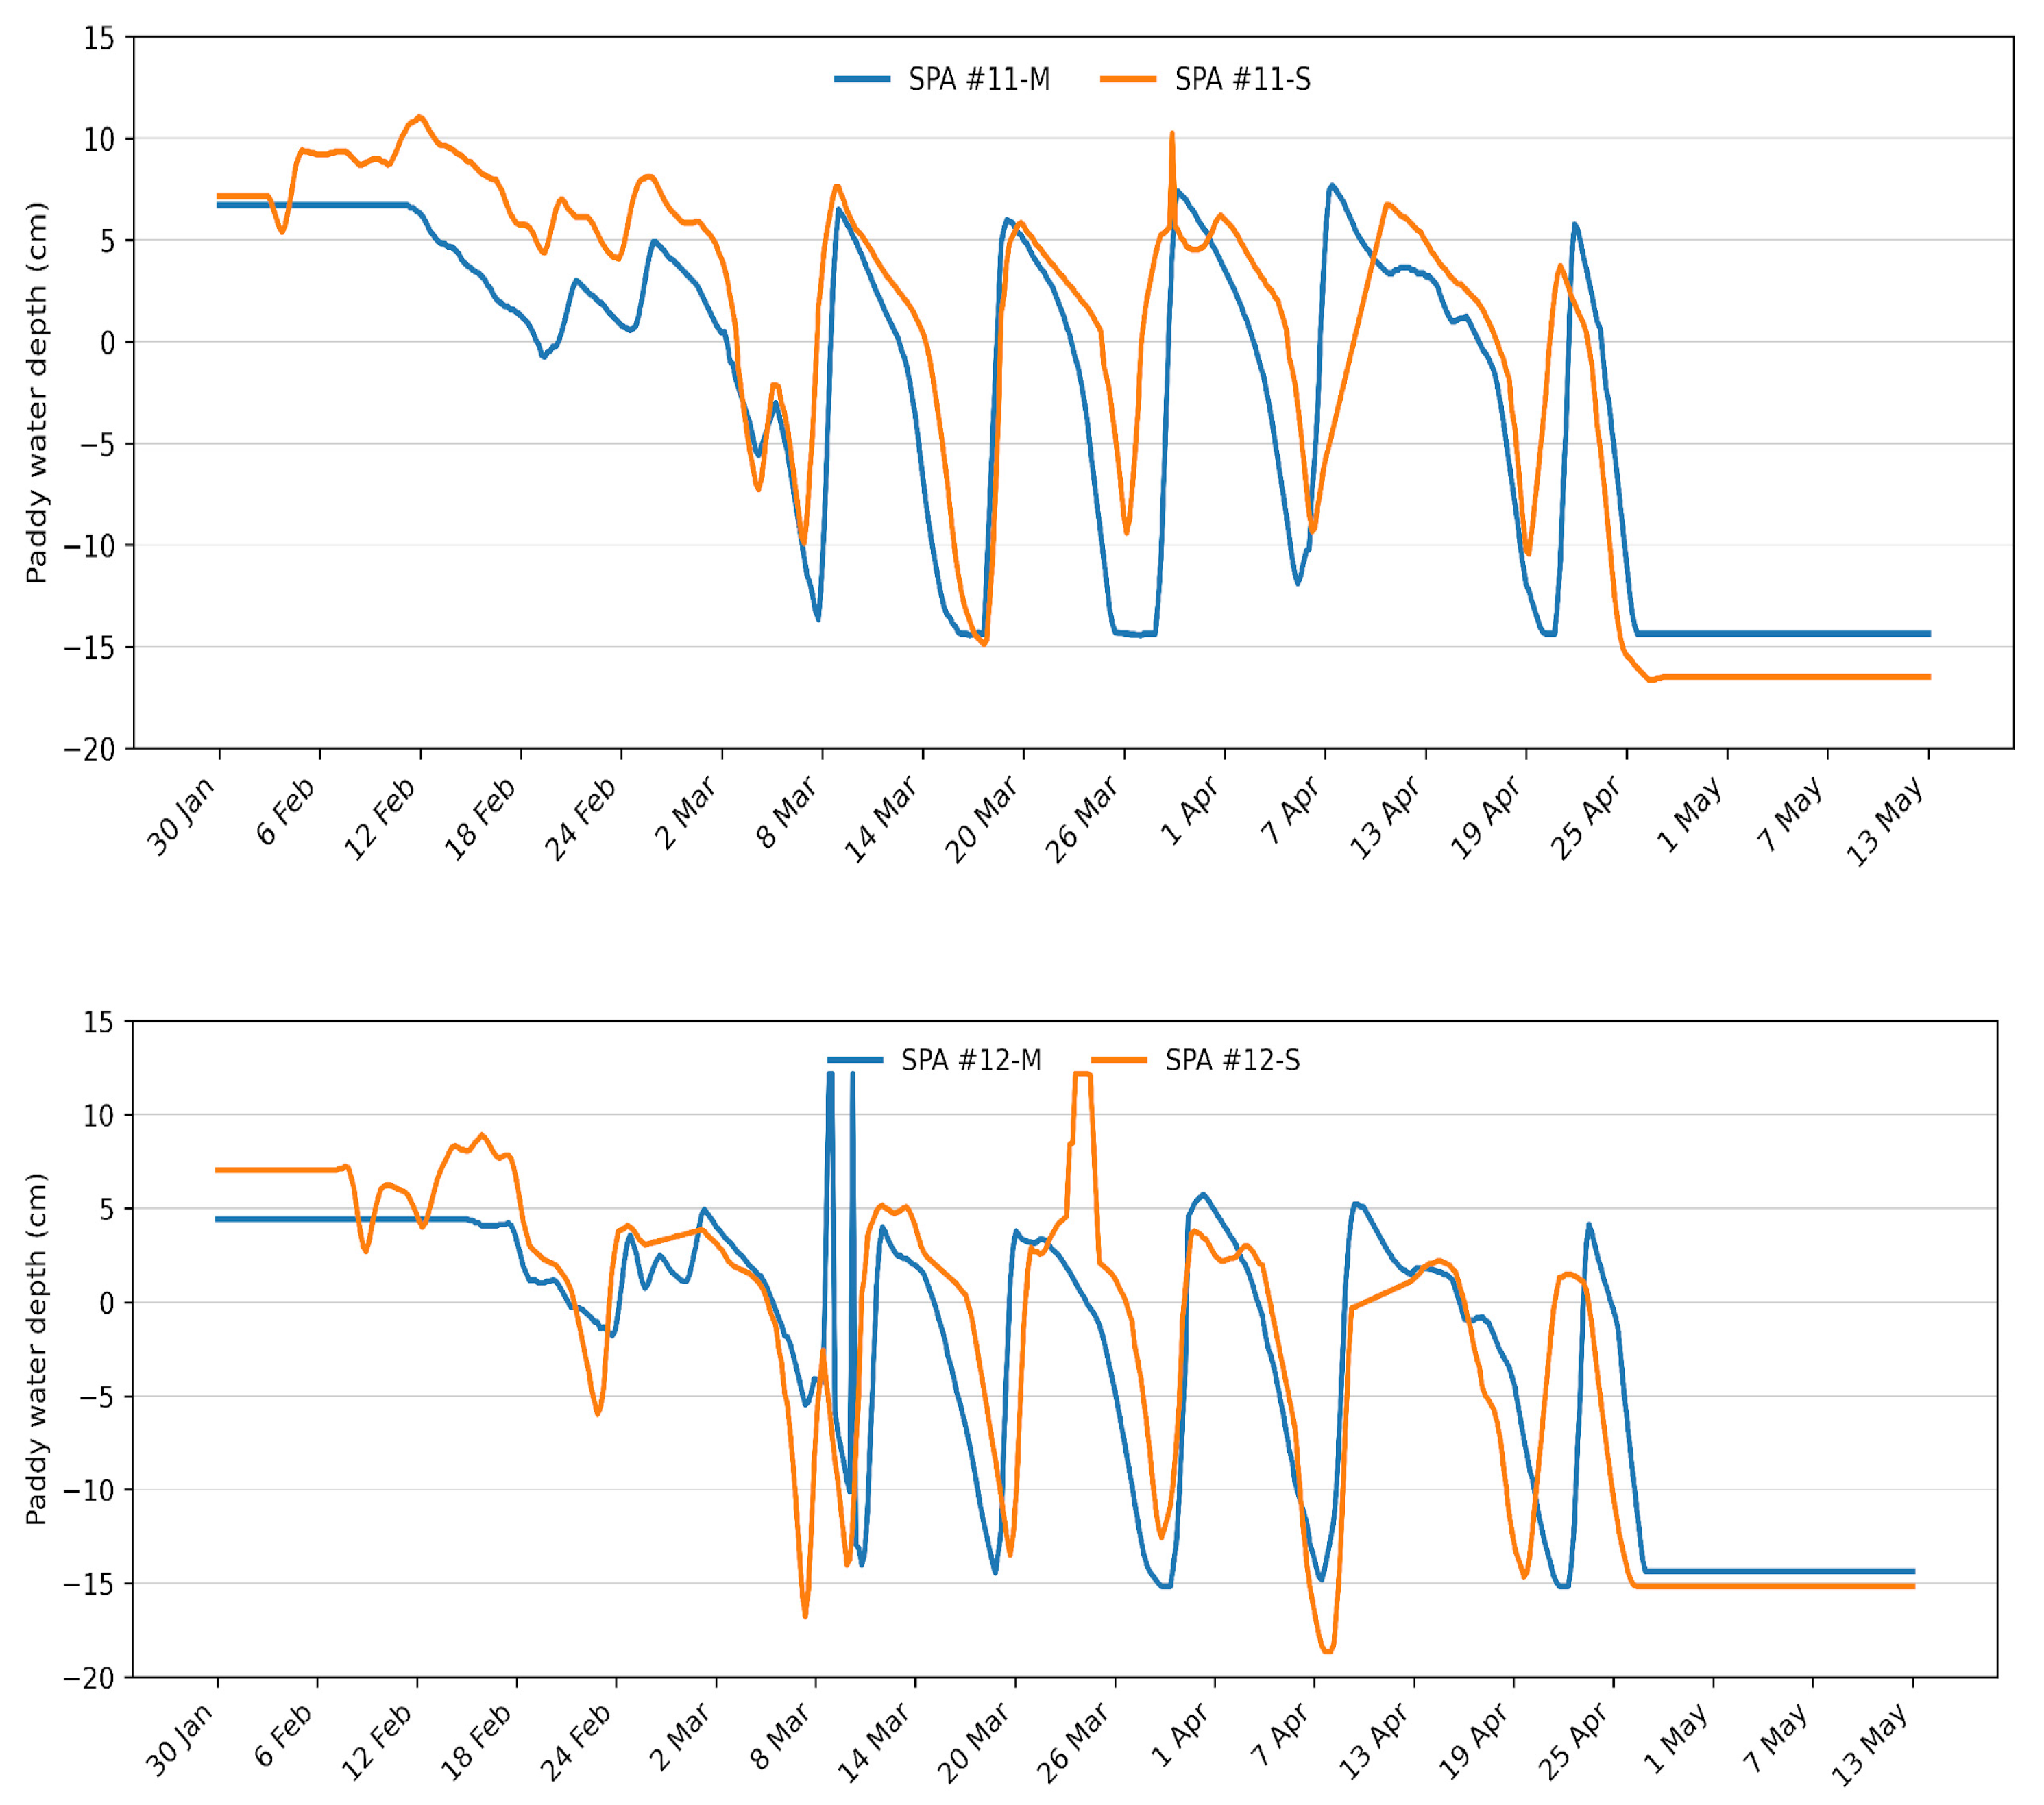
Additionally, a perforated pipe of 30 cm total length (15 cm above and 15 cm below the surface) was installed at each IoT sensor-mounted site to facilitate manual observation. When the standing water in the rice paddy field recedes below the surface level, the perforated pipe indicates the actual below-surface water level. Field supervisors visited each site daily, measured the water level using a graduated scale and took a photo. The recorded data were uploaded to the central data server. The manually collected data and IoT sensor-based water level data were compared and found to be in very good agreement (Figure 4). In terms of water status, the IoT sensor readings were closely constant with the manual observations, while water level measurement demonstrated an overall accuracy of 90% between the manual and the IoT sensors dataset. Subsequently, this IoT sensor water level data was used for the calibration and validation of remote sensing-based measurements.

2.5. Data Processing

The ALOS-2 PALSAR-2 data were processed to generate geometrically and radiometrically corrected backscatter and polarimetric features suitable for irrigation water dynamics monitoring. The data were preprocessed through geometric and radiometric correction in the Sentinel Application Platform (SNAP), developed by the European Space Agency (ESA) [46]. Radiometric calibration was applied to convert raw digital number (DN) values into calibrated backscattered coefficients (Sigma-naught) using the PALSAR-2 level 2 calibration equation [47]. Subsequently, the speckle filtering was performed to reduce the inherent speckle noise in the SAR image while maintaining the spatial details. Geometric correction was then applied through spatial alignment of the SAR imagery with ground coordinates using Range–Doppler terrain correction. Finally, Freeman–Durden’s three-component decomposition was derived from the full polarimetric PALSAR-2 data (VV, VH, HH, and HV), using SNAP [48]. The three decomposition components are: (i) surface scattering (SS), (ii) volume scattering (VS), and (iii) double-bounce scattering (DB). The SS is sensitive to bare soil and shallow water on the surface, with high surface scattering observed under dry soil conditions as encountered in managed fields. The VS component is not directly related to the water indicator but indicates the vegetation phenological changes caused by irrigation water management. The DB component is the most sensitive parameter to surface water presence, increasing significantly in response to standing water [49,50]. Rice paddy field boundaries were delineated as locational polygons corresponding to all the IoT devices installed in the rice paddy field to calibrate with sensor-based water level data. These three components’ backscattering characteristics were used to monitor irrigation water status and distinguish between AWD and non-AWD irrigated rice paddy fields.

2.6. Data Assimilation and Integration

Three different data sources, (i) field survey data, (ii) IoT sensor-based water level data, and (iii) PALSAR-2-derived three-component decomposition data, were collected and integrated to characterize the distinguished properties of AWD and non-AWD irrigated rice paddy fields. The rice paddy fields in which IoT devices were installed were digitized as polygons representing the individual field boundaries. Continuous IoT sensor records and periodic survey data from the selected fields were compiled and linked to the corresponding polygon dataset. Subsequently, the pixel values of PALSAR-2 backscatter coefficient data were extracted using the delineated field polygons. The extracted three-component values were statistically analyzed through calculations of mean, median, and standard deviation. Based on the statistical relationship among the three-component decomposition, a Random Forest (RF) classification was performed on the SAR imageries to generate the AWD and non-AWD irrigated rice paddy map of each observation date across the study sites. A dataset of 560 samples derived from 704 IoT sensor-instrumented plots was split into 70% for model training and 30% for validation to evaluate the RF classification performance. During model development, five-fold cross-validation was applied to ensure model robustness. The RF classification model comprised 100 decision trees to achieve stable classification accuracy. The most important influential variables were identified through feature importance analysis based on the mean decrease in impurity (Gini importance). Hyperparameter tuning was conducted by testing various tree counts; 100 trees were selected as optimal, as increasing the number of trees beyond this threshold did not yield significant improvement in classification accuracy.

3. Results

3.1. Irrigated Condition of AWD and Non-AWD Rice Paddy Fields

The IoT-based water level data and field-surveyed data on water level and plant height were synchronized with the corresponding satellite observation dates. A total of eight observation dates were recorded across the field sites throughout the rice-growing season. Plant height and water level data corresponding to each satellite observation date were compiled accordingly (Table 3). A total of 704 observation plots, including varying water levels and plant heights, were recorded across the three study sites.

3.2. Freeman–Durden Three Components Statistical Analysis

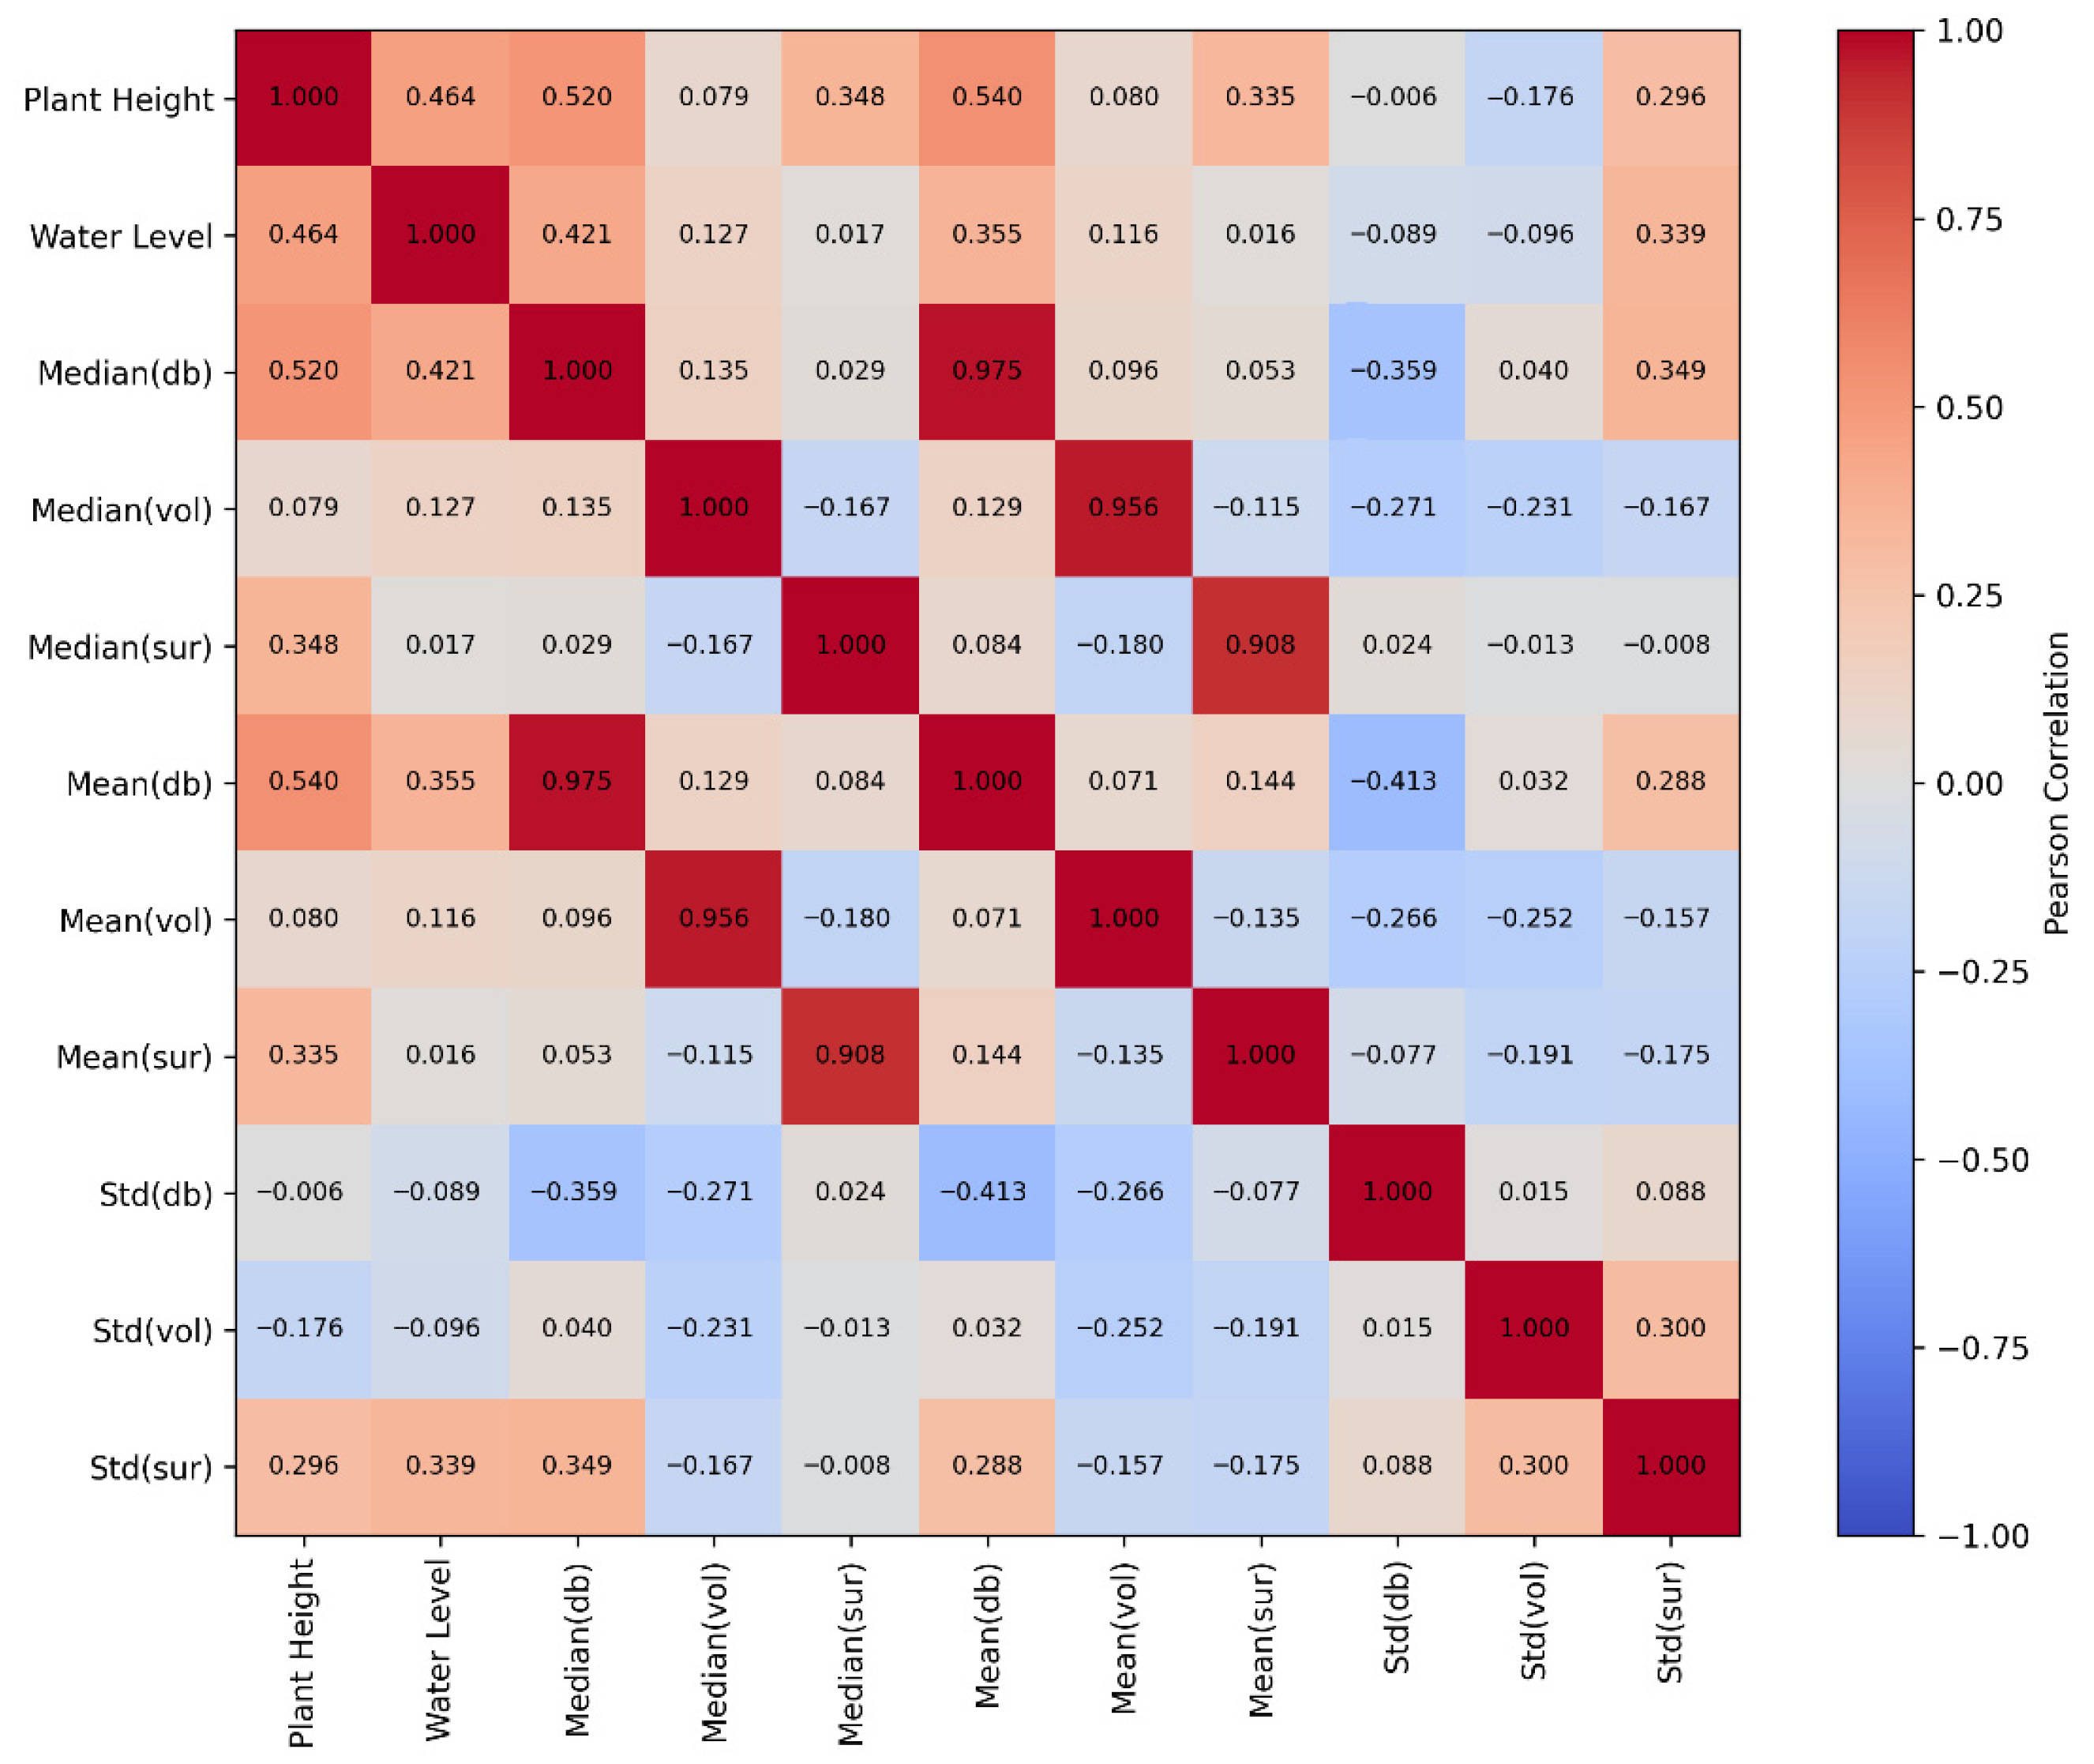
Freeman–Durden’s three-component backscatter coefficient (dB) values were extracted across the three field sites (704 plots) on eight observation dates. The SS, DB and VS backscatter dB values were statistically analyzed using mean, median and standard deviation. Figure 5 represents the Pearson correlation matrix of these derived statistics in relation to plant height and water level. The diagonal elements represent perfect self-correlation (r = 1.00). The DB component exhibited the comparatively stronger internal consistency between its mean and median values (r = 0.975), followed by VS (r = 0.956) and SS (r = 0.908). Plant height and water level were moderately negatively correlated, as increasing canopy height gradually limits water status detection. Plant height shows a stronger correlation with backscatter statistics compared to the water level. DB value exhibits a positive correlation with the mean and median values, with SS showing a weak correlation and VS showing a very weak correlation. The overall weak correlation with water level is attributed to variability in irrigation water level across aggregated plots and dates.
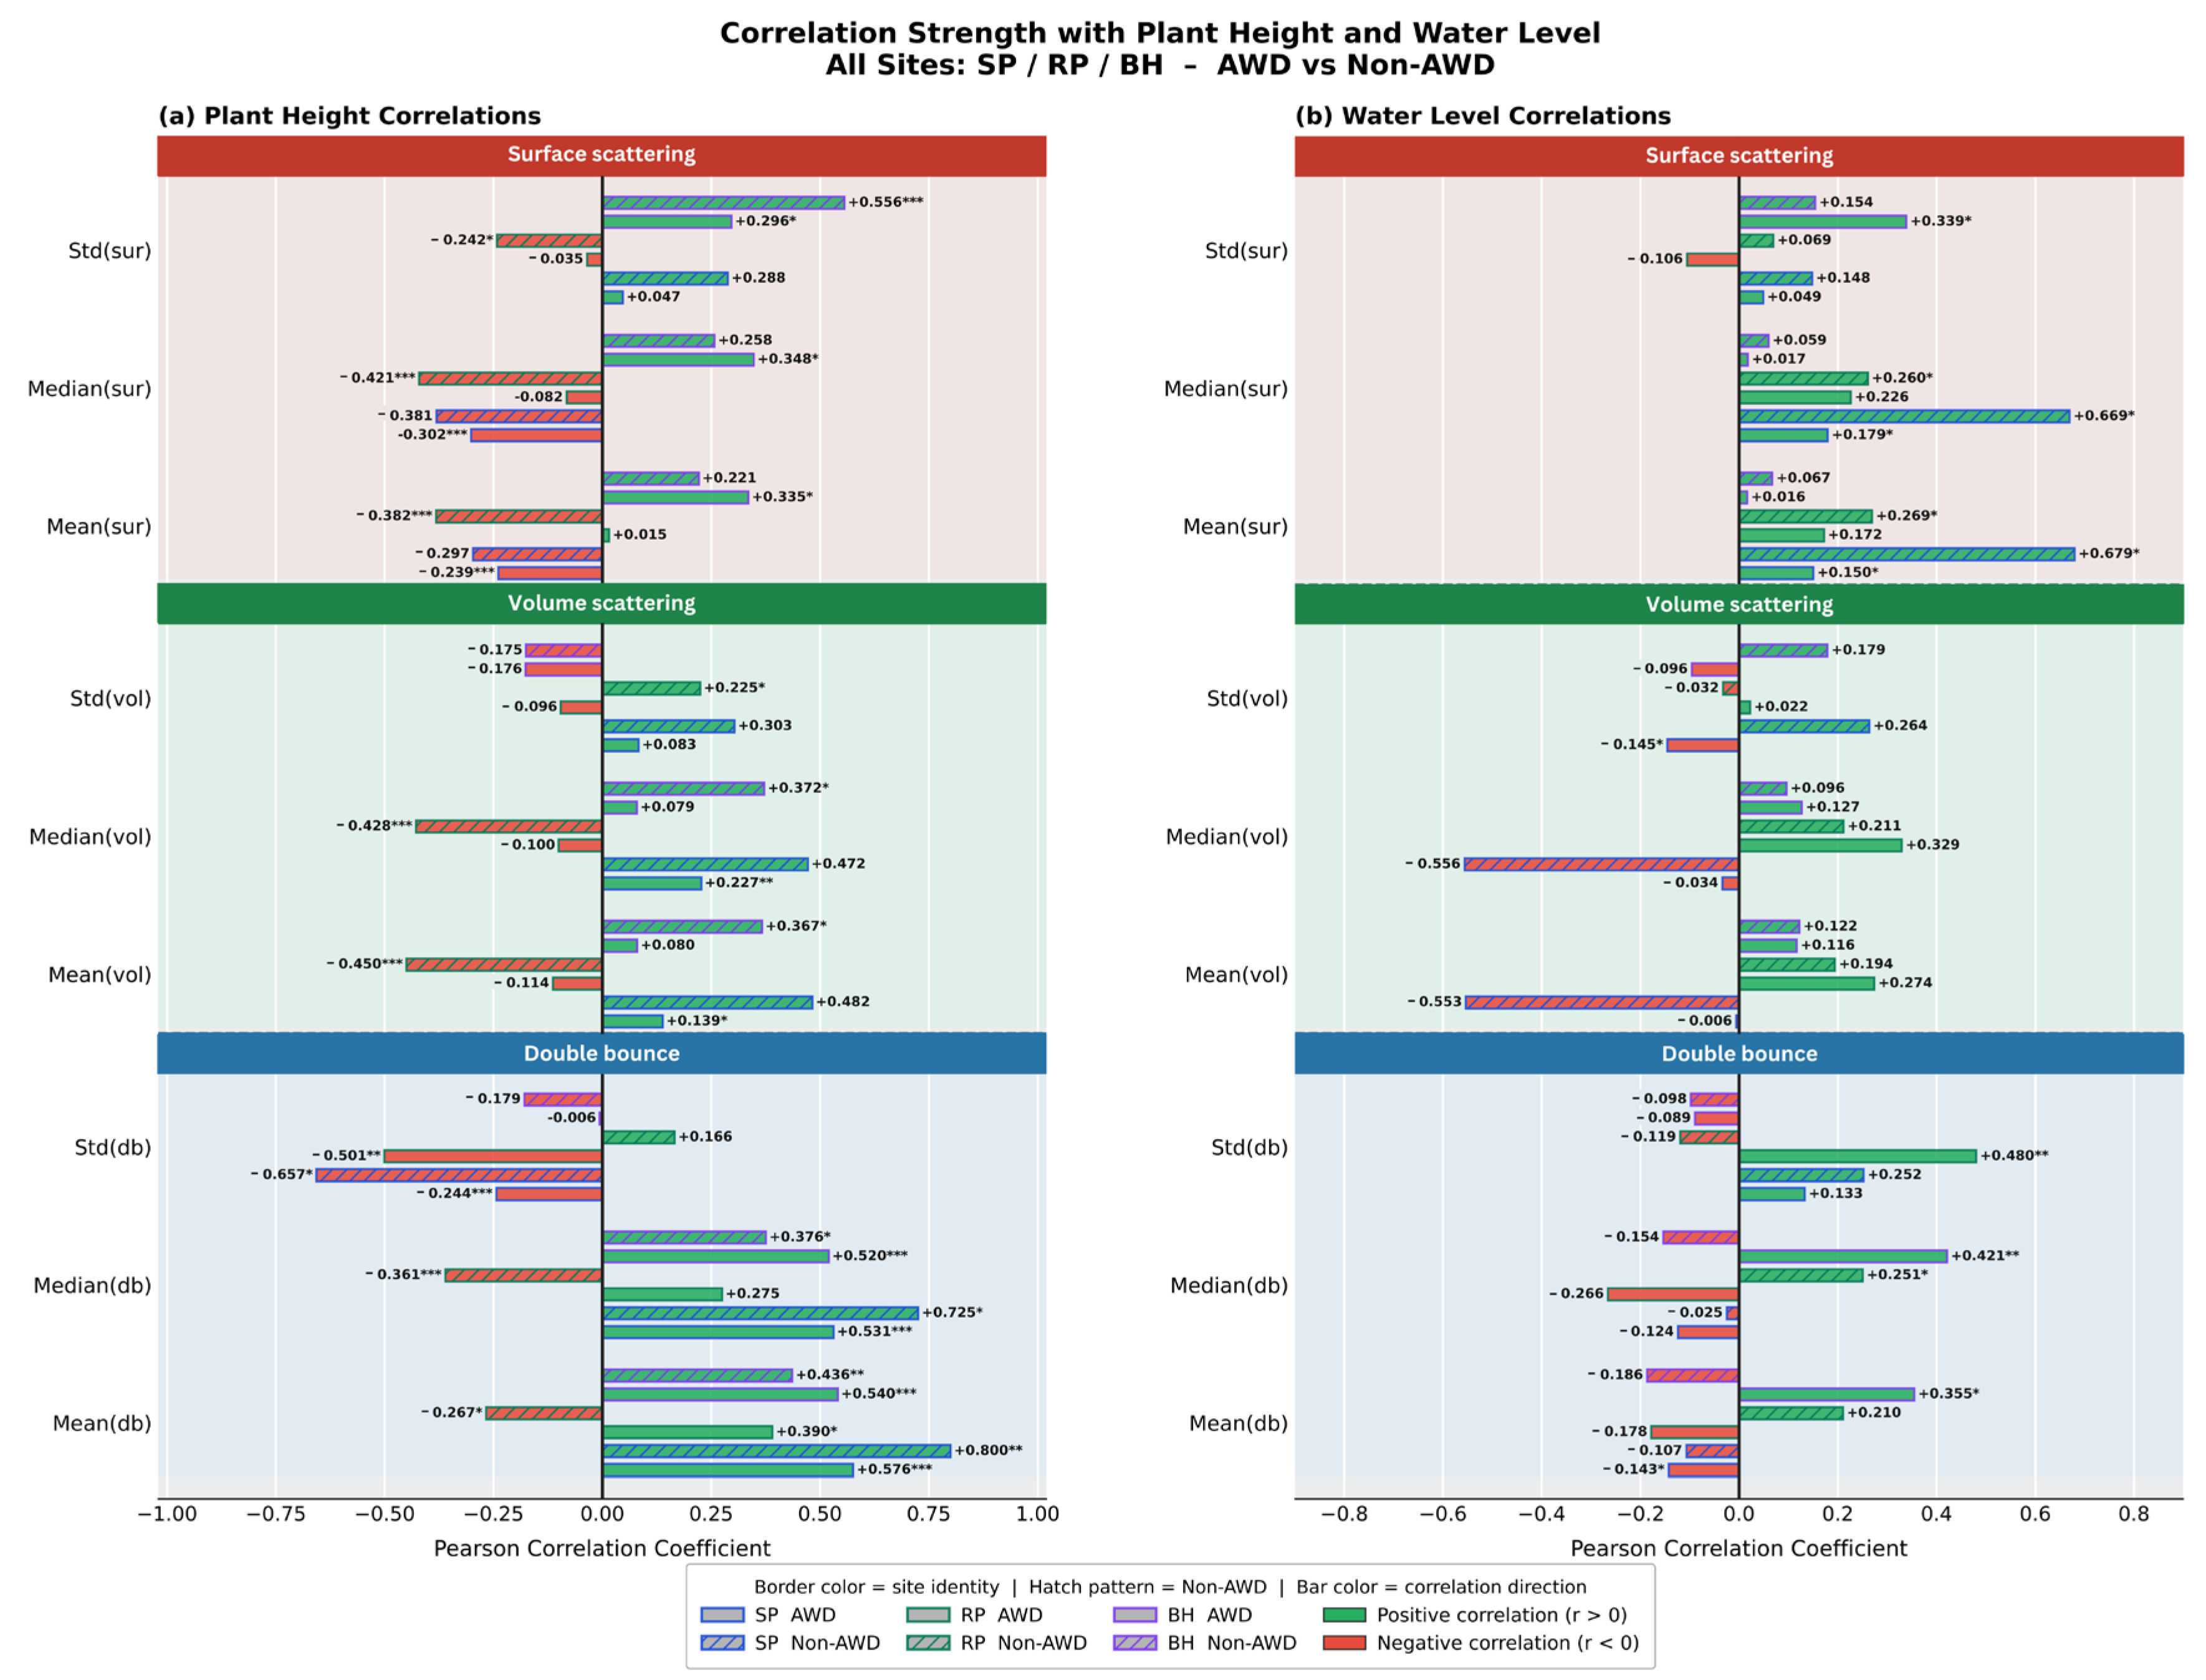
To further investigate site-specific behavior, data were analyzed separately for each site under AWD and non-AWD conditions (Figure 6). The DB and SS components were comparatively highly sensitive to plant height, while the relations with water level ranged from moderate to weak. Under a non-AWD irrigation system, continuously standing water strengthened the surface scattering response consistent with known interactions between shallow inundation and radar backscatter. Under an AWD irrigation system, periodic drying cycles caused water level fluctuations, which weakened this correlation [27]. As canopy height increased across the growing season, SS sensitivity to water declined, while DB became increasingly dominant. The reason behind it reflects the progressive masking of surface water by vegetation. Across the three sites, correlation values varied slightly, reflecting differences in the promotion of AWD and non-AWD fields, total plot numbers, transplanting dates, and water management schedules [39].

Rice Paddy Phonological Growth and Three Components Responses Analysis

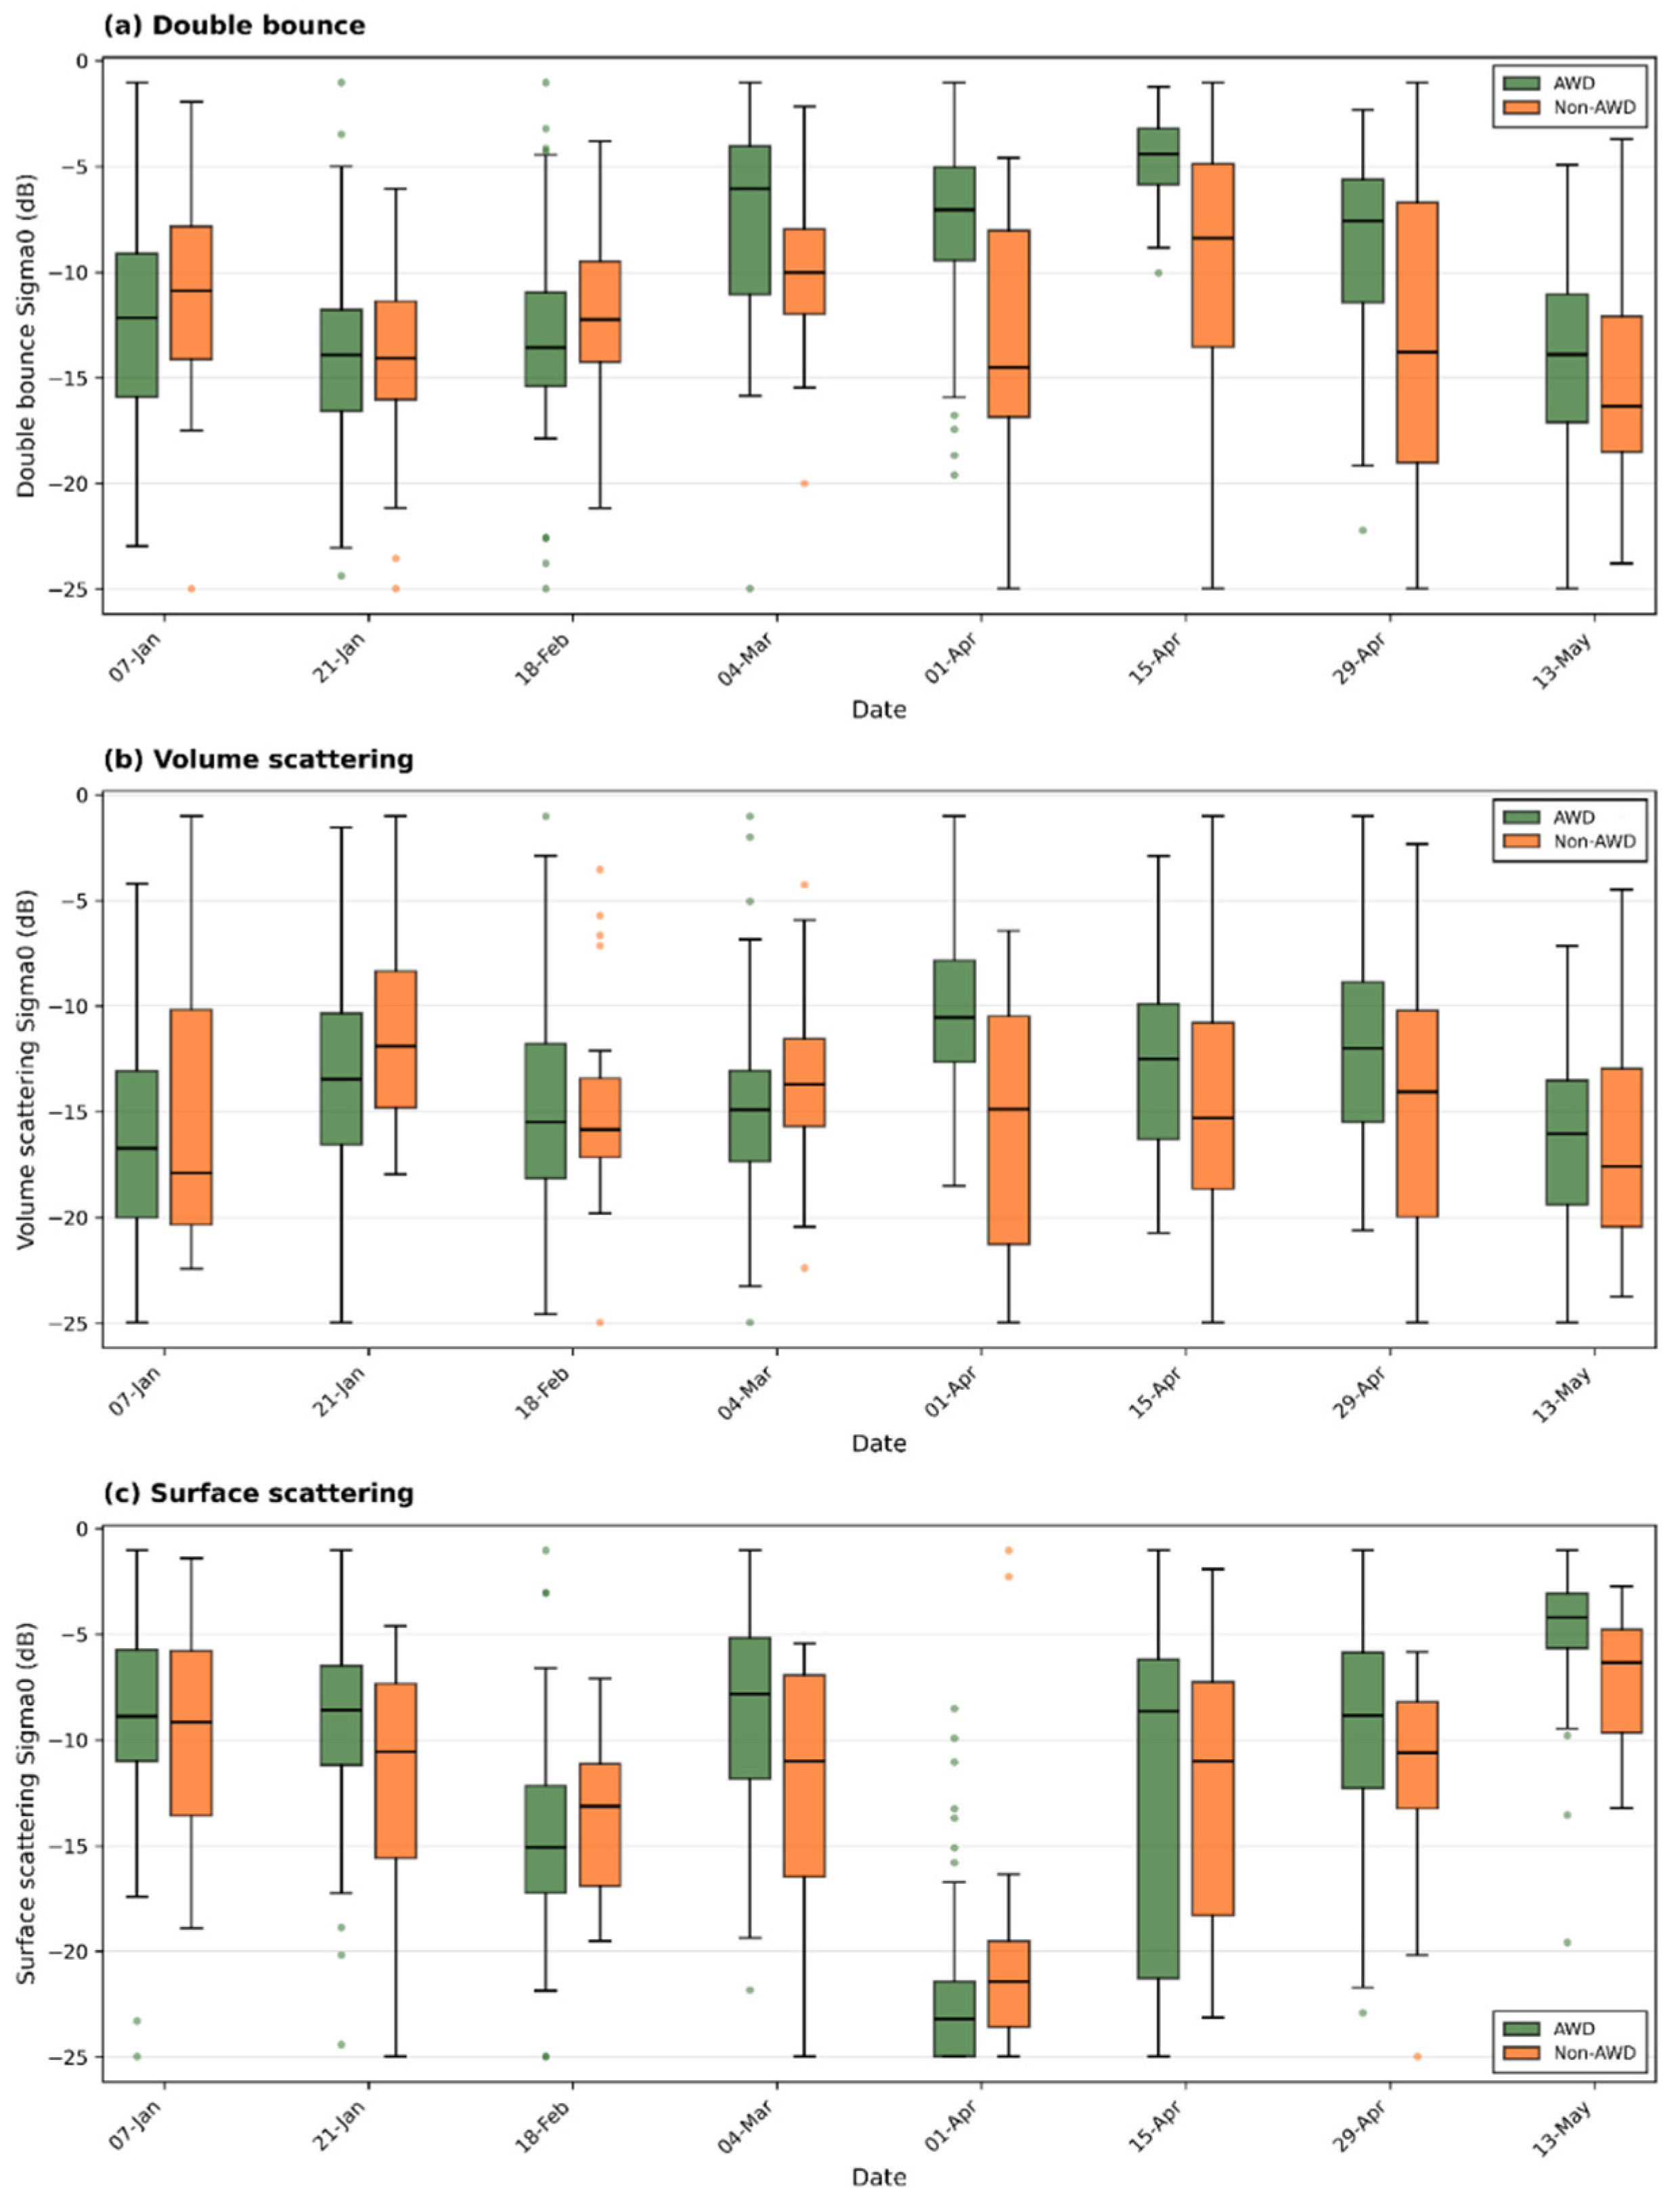
Temporal variation in SS, DB and VS backscatter for AWD and non-AWD irrigated rice paddy fields was investigated using boxplots of Sigma-naught throughout the rice-growing season. DB consistently showed higher Sigma-naught (σ0) in the AWD field compared to non-AWD fields across most observation dates. This difference becomes more pronounced during mid-season (March and April), while plant height is 60 to 80 cm. The primary cause of this enhancement is dihedral interactions between the plant structure and the periodically exposed soil surface under AWD management. Non-AWD fields illustrate lower median σ0 and greater variability during mid-season variability. The prolonged surface inundation suppresses effective double-bounce contributions to such changes. VS showed a steady σ0 increase from January/February to March/April under both AWD and non-AWD irrigation practices. The canopy growth and multiple scattering in the vegetation layer are probable reasons. AWD fields demonstrated slightly higher median σ0 values and a narrower interquartile range, whereas non-AWD fields showed greater inconsistency during the taller canopy stages (Figure 7).
SS exhibited lower σ0 values as vegetation cover increased, specifically in April, near full canopy cover. AWD fields maintained comparatively higher σ0 during the dry cycles due to recurring soil surface exposure, whereas non-AWD fields maintained lower σ0 with dominant specular replication from continuous standing water. Collectively, AWD irrigation meaningfully alters the relative contributions of all three components of the mechanism. Enhancing DB and SS responses while stabilizing VS highlights the sensitivity of polarimetric decomposition to irrigation management and its potential for discriminating water regimes in rice cultivation.

3.3. Plant Height and Water Level Relationship

The three scattering components mechanism showed a distinct response to AWD and non-AWD irrigation management in the rice paddy field. To examine the influence of each component on plant height and water level more clearly, a comparative analysis was conducted across the three study sites. Six representative plots were selected—two from each site (one AWD and one non-AWD) as summarized in Table 4. The selected plots are: (i) SPA#11 (AWD) and SPF#46 (non-AWD) from Sreemantpur (SP); (ii) RPA#51 (AWD) and RPA#55 (non-AWD) field from Rosulpur (RP); and (iii) BHA#68 (AWD) and BHA#88 (non-AWD) from Bhbicha (BH). These plots were selected on the basis of comparable land preparation, soil characteristics, transplantation dates, identical rice variety, and similar agronomic management practices, differing only in irrigation management. The relationship between the Freeman–Durden three-component backscatter values and both water level and plant height is discussed in the following sections.

3.3.1. Relationship with Plant Height

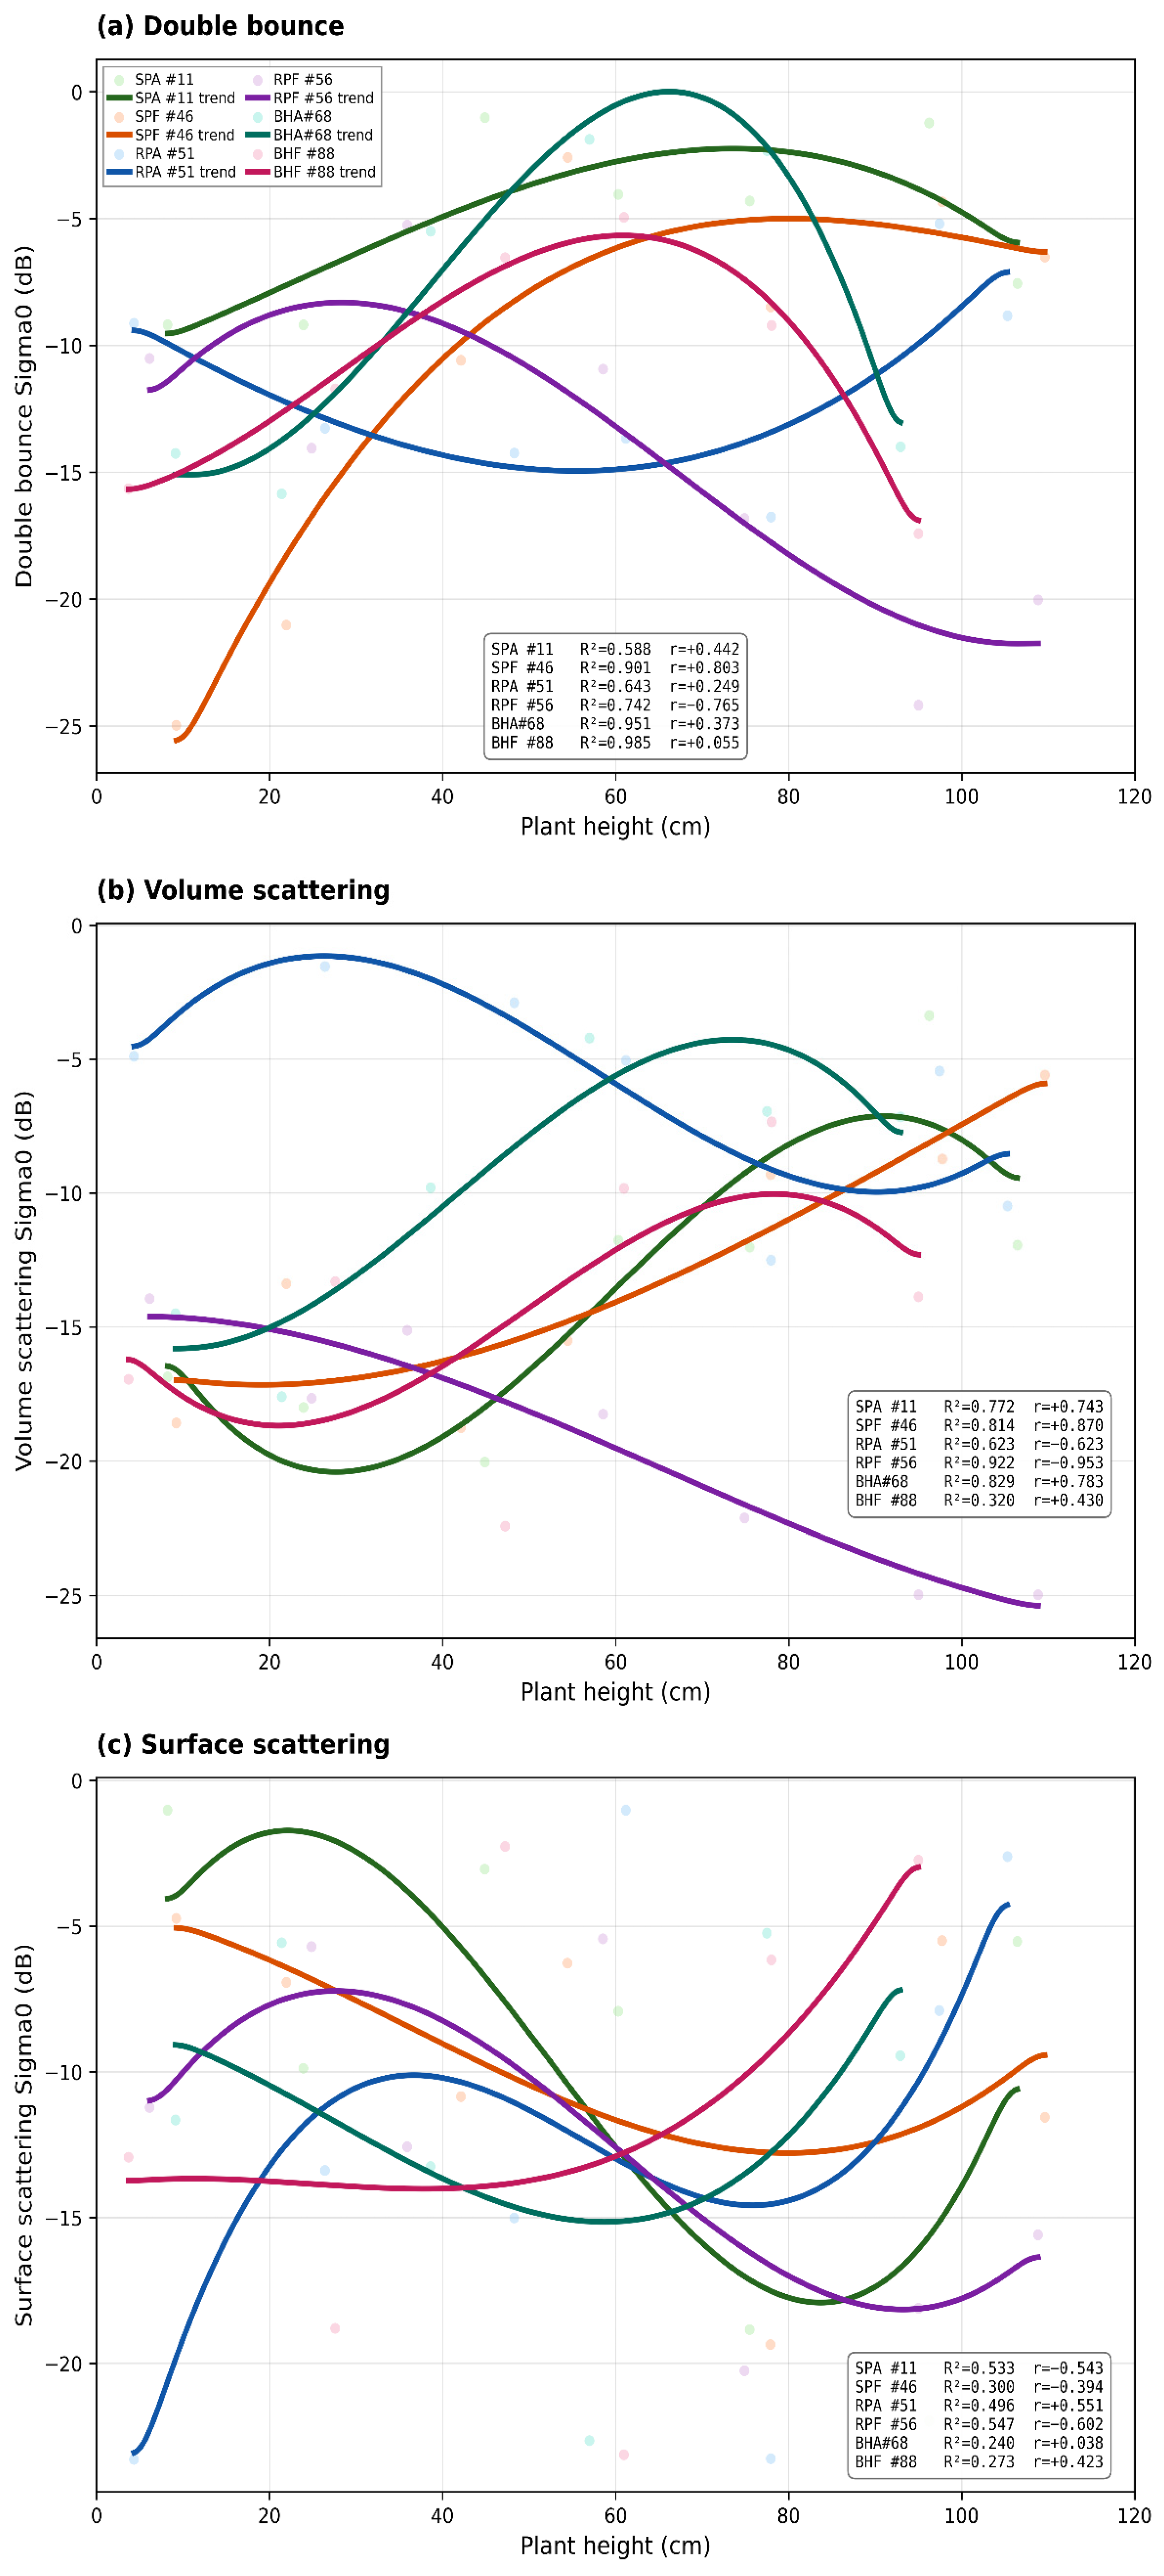
Figure 8 presents the relationship between Freeman–Durden’s three-component backscatter coefficient and plant height in three different sites under both AWD and non-AWD practices in rice paddy fields. In the AWD plot at Rosulpur (RPA#51), DB initially decreases before rising with increasing plant height, which is an indicator of alternating dominance of stem–soil and stem–water interactions as water levels fluctuate under periodic drying cycles. The non-AWD plot (RPF #56) exhibits a constant decline at later growth stages. This is the dilution caused by dense canopies over continuously inundated surfaces.
VS illustrates moderate sensitivity to plant height under AWD conditions, whereas non-AWD exhibits a comparatively strong negative relationship, mostly due to signal attenuation within a dense, uniformly flooded canopy. This contrast reflects the stabilizing effect of continuous inundation on canopy structure and scattering behavior. SS most clearly discriminates between the two irrigation regimes. AWD exhibits high variability and moderately strong sensitivity to plant height, consistent with periodic soil exposure during AWD drying cycles. In contrast, non-AWD fields display suppressed SS, indicative of persistent water surface dominance.
In Sreemantapur (SR), AWD and non-AWD paddy field pairs showed trends broadly consistent with those observed at RP. DB increases with plant height at the AWD field, whereas the non-AWD field exhibits lower σ0 values in early growth stages. A smoother trajectory in later growth stages under continuous flooding. VS shows a positive relationship with plant height in both practices. However, AWD displays greater variability, while non-AWD response uniform canopy development under continuous flooding. SS again provides clearer discrimination between the irrigation regimes. AWD field exhibits large σ0 fluctuations, particularly at mid-to-late growth stages, which indicates frequent changes between exposed soil and shallow water. Non-AWD field maintains lower and more stable σ0 values, consistent with smooth water surfaces.
At Bhabicha (BH), DB under AWD conditions shows a stronger non-linear relationship with plant height. It sharply rises at an intermediary height and declines at later stages. This pattern is consistent with AWD-induced transitions between exposed soil and shallow inundation, which enhance stem–soil interactions during drying phases while suppressing DB during re-flooding. Non-AWD field exhibits a smoother response, replicating stable stem–water geometry under inundation conditions. The comparatively weaker VS response in BHF#88 (AWD), σ0 varies considerably with plant height, steady with repeated wet–dry changes. Conversely, BHF #88 (non-AWD) maintains relatively low and stable SS values.
Across all field pairs (Figure 8), the AWD field consistently demonstrates greater variability and stronger sensitivity in DB and SS, mostly due to periodic dry and wet cycles. Non-AWD fields show smoother and more stable scattering responses dominated by stem–water and water–surface interactions. VS responds primarily to canopy growth but is controlled by irrigation-induced structural heterogeneity. These field-specific results provide significant evidence that polarimetric SAR scattering components can reliably capture irrigation management differences at the field scale. These findings highlight the potential of polarimetric SAR for the effective monitoring of AWD adoption and rice water management using spaceborne observations.

3.3.2. Relationship with Water Level

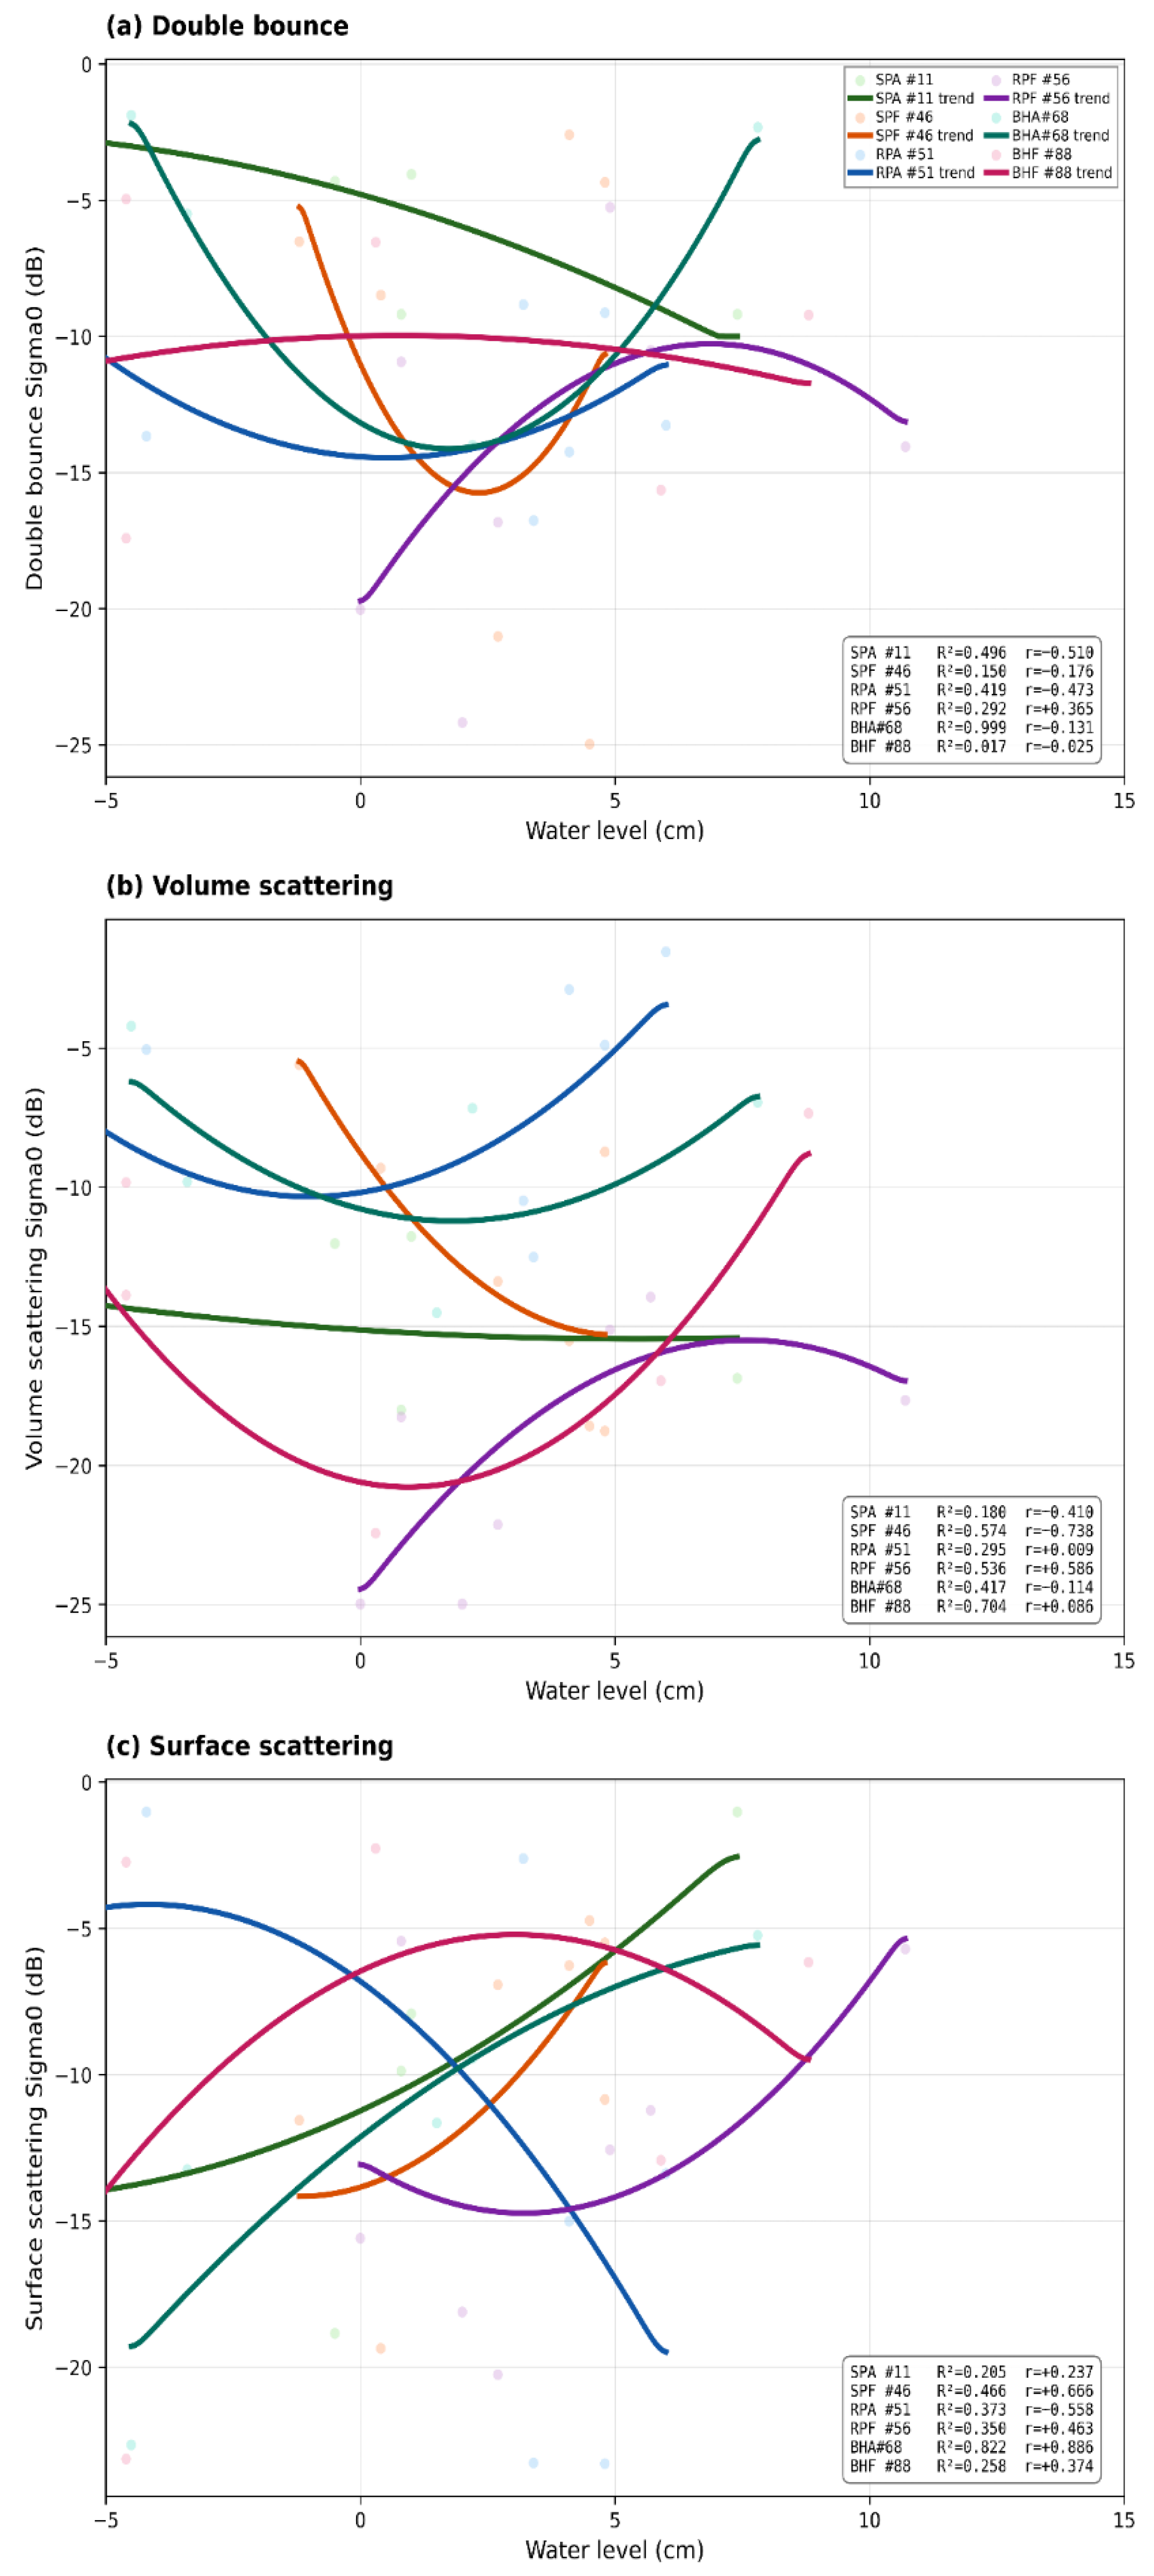
The L-band PALSAR-2-derived backscatter components show clear sensitivity to AWD and non-AWD irrigation management. Although responses differ across DB, VS, and SS, each component captures distinct irrigation- induced changes in crop–soil dynamics. DB responds to water level non-linearly, sparkly a balancing stem-surface dihedral formation, and signal attenuation by standing water. Under the non-AWD field, continuously stable water status directed a smooth and relatively invariant DB trajectory. In AWD fields, each dying cycle re-exposes the soil surface and restores steam–soil contact, driving an upward trend of DB. Afterward, re-flooding shifts dominance toward specular reflection, suppressing DB once again. This recurring pattern with every wet–dry cycle confirms DB as a reliable field-scale indicator of irrigation-driven hydrological change (Figure 9).
SS demonstrates a comparatively sharp line between AWD and non-AWD irrigation regimes. Continuous flooded non-AWD fields maintain smooth water surfaces throughout the season, keeping SS low and largely invariant. AWD dry phases expose coarsened soil under the canopy, driving SS sharply upward—until re-flooding brings it back down again. This repeating rise-and-fall pattern constitutes a SAR-readable record of AWD wet–dry cycling.
VS is unlikely to respond differently compared to SS and DB. VS indicates the canopy changes due to irrigation management. Continuous flooding supports steady and uniform crop growth, and VS changes predictably as biomass accumulates. AWD introduces additional complexity into this relationship. Periodic dry conditions induce water stress, which reshapes the canopy structure and weakens the VS signal. This points to an important insight that VS responds to canopy structure more directly than water depth.
AWD represents both hydrological and structural variability. The decomposed SAR scattering components collectively capture these effects. DB, VS, and SR each contribute harmonizing and non-redundant information, which altogether provides a basis for AWD detection that is different from a single-polarization metric. For spaceborne rice-field irrigation monitoring, this multi-component polarimetric approach offers demonstrably greater reliability.

3.4. AWD and Non-AWD Irrigated Rice Paddy Fields Mapping

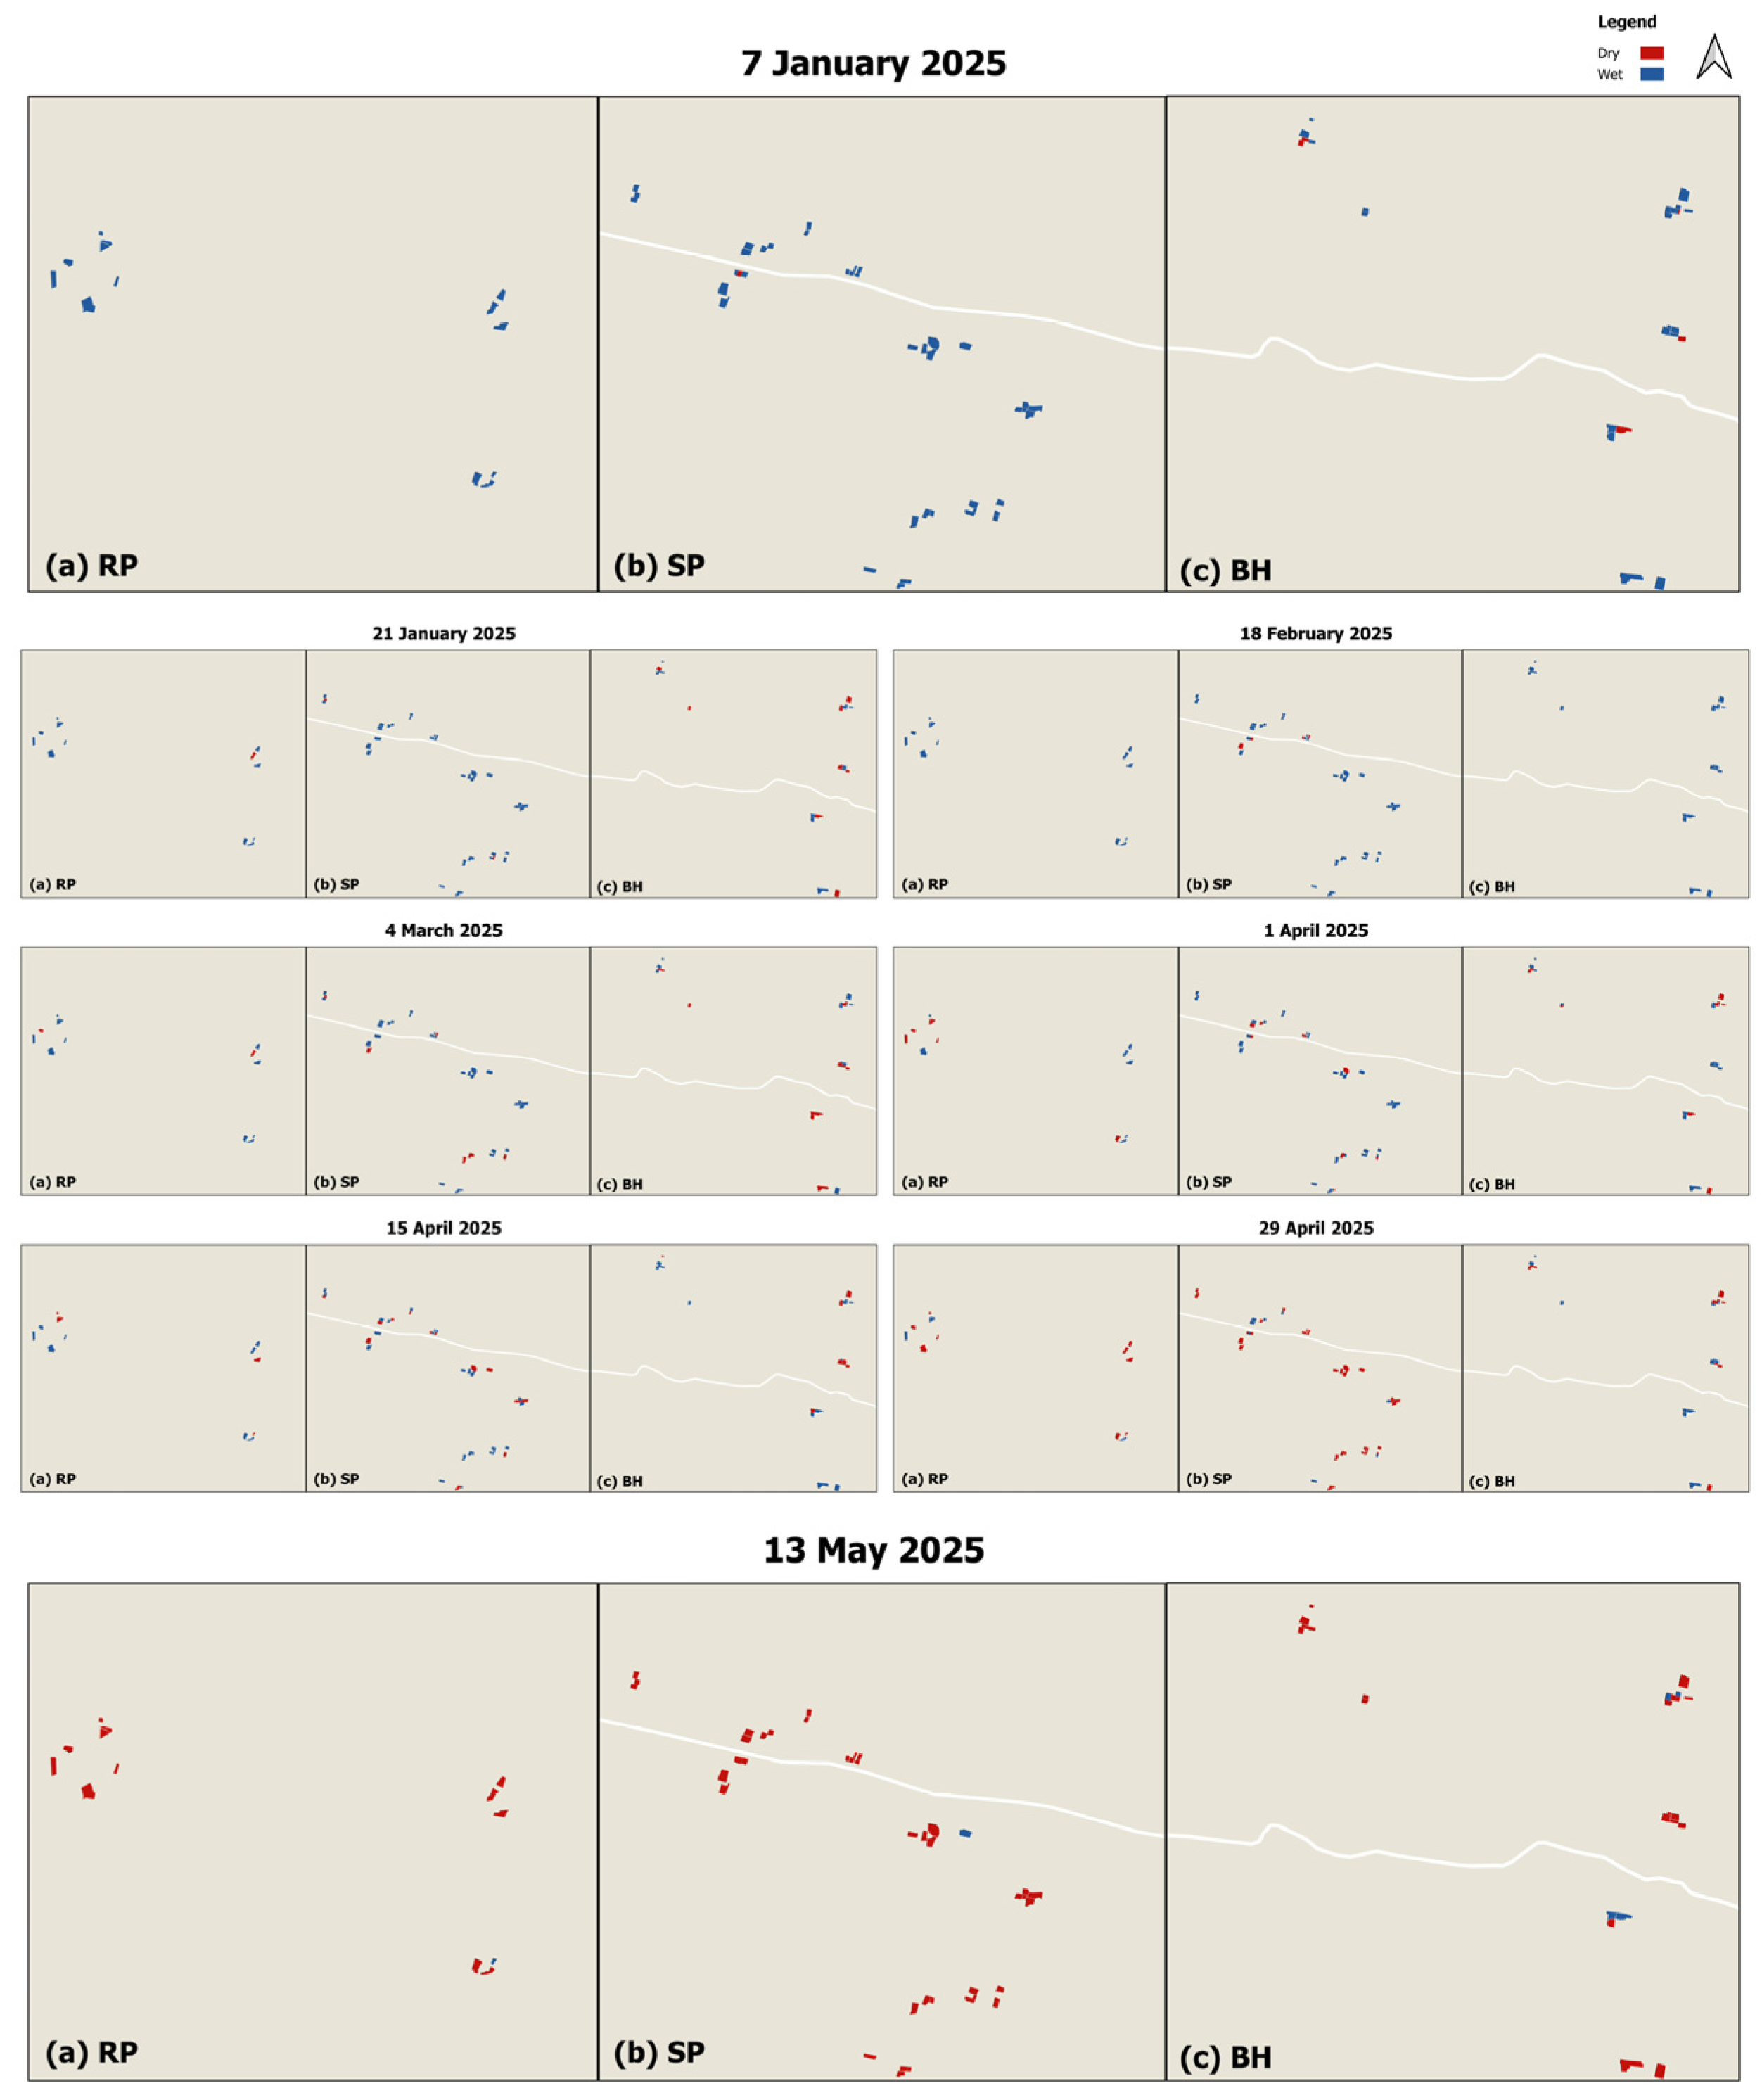
The sensitivity of ALOS-2 PALSAR-2-derived three-component decomposition to irrigation water status was investigated to identify AWD and non-AWD irrigated rice paddy fields. Using backscatter coefficient characteristics in combination with IoT data and field survey data, AWD and non-AWD irrigated rice paddy fields were classified across eight dates during the growing season. A Random Forest (RF) classifier was applied to classify rice paddy fields based on water inundation status. The resulting AWD and non-AWD irrigated rice paddy field maps for 7 January, 21 January, 18 February, 4 March, 1 April, 15 April, 29 April, and 13 May 2025 are shown in Figure 10.
The satellite-based classified map reveals temporal and spatial variation in wet and dry conditions between AWD and non-AWD rice fields across the observation period. The observed surface wetness conditions serve as effective indicators of field-level irrigation practices. The results show that nearly all fields across all sites remained inundated on 7 January, 21 January, 18 February, 4 March, and 1 April 2025. By contrast, approximately 90% of plots were non-irrigated on 15 April, 29 April, and 13 May 2025. At BH, a later transplantation date resulted in most plots remaining irrigated in April. Overall, the results indicate that fields predominantly remained inundated during the transplantation and flowering stages while wet–dry cycles were observed during the mid-season, and dry at the harvesting stages.
Figure 10 illustrates the spatial distribution of dry and wet fields across three sites, demonstrating irrigation dynamics throughout the rice growth stages. Table 3 summarizes the number of irrigated and non-irrigated plots by observation dates. At Rosulpur (RP) and Sreemantpur (SR), most of the fields were inundated on 7 January (42 and 20 fields, respectively), which gradually declined through observation dates, and only one or two plots remained by 13 May, indicating a progressive transition from wet to dry conditions. Bhabicha (BH) shows greater temporal variability, reflecting differences in transplanting timing and water management. Overall, the results illustrate the temporal and spatial variations in water status across the key rice crop stages (planting, growing, flowering and harvesting).
Table 3 reveals that around 80–90% of the paddy fields were inundated during the transplantation and flowering stages. While a wet–dry cycle is maintained during the growing stage. Collectively, these findings document the spatio-temporal irrigation dynamics across three sites and multiple crop stages under AWD and non-AWD irrigation practices.

3.5. Accuracy Assessment

The previous analysis demonstrated that the L-band SAR-derived three-component decomposition is capable of detecting AWD and non-AWD irrigated rice paddy fields. Remote sensing techniques were applied to identify the irrigation conditions (dry or wet) across multiple observation dates and rice growth stages. High-resolution ALOS-2 PALSAR-2 SAR data at 6 m spatial resolution were used to detect and monitor the wet and dry status of the study plots. Classification results were validated against the IoT sensor data and assessed the overall classification accuracy. For validation, IoT sensor records corresponding to the satellite observation dates were extracted and the number of fields for each observation date was tabulated, as presented in Table 5.
A comparison between the IoT sensor record and L-band SAR-derived classification of AWD and non-AWD plots across all observation dates shows a good accuracy in detecting water status in paddy fields (Table 6). The overall classification accuracy of satellite-based paddy fields water status detection ranged from 85% to 95% across all observation dates. During early growth stages, when canopy height and density are relatively low, classification accuracy shows very good agreement with IoT sensor-based observations. However, classification accuracy declined with increasing canopy height and density. During the harvesting stage, accuracy recovered as both AWD and non-AWD fields converged towards similar dry conditions.

4. Discussion

This study found that the integration of L-band polarimetric SAR data with field observations and IoT-based water level data is a promising approach for monitoring and distinguishing AWD and non-AWD irrigation practices in rice paddy fields. Although the applied methodological approach found good results, several operational, instrumental, and physical constraints should be carefully considered when interpreting the outcomes.

4.1. Interaction Between SAR Scattering Mechanisms to AWD and Non-AWD

The results indicate that the L-band PALSAR-2 full-polarimetric data-derived DB and SR are the most sensitive to surface irrigation water dynamics. Under AWD irrigation, the rice paddy field temporarily dries out until the water level drops below −15 cm of surface. After that, the rice paddy fields are re-irrigated up to 15 cm above the surface level. This wet and dry cycle, repeated several times, drives changes in surface scattering. These alternating conditions enhance both SS and DB, particularly when standing water interacts with vertically oriented rice stems. In contrast to non-AWD fields, which maintain relatively stable water levels, sustaining consistent stem–water interactions that suppresses SS and reduces variability in DB responses.
Although the mechanisms are physically consistent with SAR scattering theory and earlier L-band SAR studies [39], the sensitivity of the three components is not uniform across all growth stages and sites. In particular, surface scattering interpretation is challenging when the canopy is fully developed. The DB is also affected by other factors such as canopy density, planting line spacing, and stem orientation [51]. These findings support the application of multiple polarimetric components rather than a single component. Compared to current irrigation monitoring approaches based on optical vegetation indices, evapotranspiration models [29,34], or C-band SAR time series [40,41], the integration of L-band polarimetric SAR with IoT-based water-level data provides deeper insight into surface water dynamics, even below dense vegetation canopies. Optical remote sensing is often challenging due to cloud cover, reducing data availability, while C-band is strongly influenced by vegetation scattering as the rice canopy develops. In contrast, L-band SAR penetrates vegetation more effectively and can capture stem–water interactions beneath the canopy, making it particularly suitable for monitoring irrigation dynamics and identifying AWD practices in rice paddy fields.

4.2. Influence of Rice Vegetation Growth on AWD Identification

The ability to distinguish AWD and non-AWD irrigated rice paddy field strongly influenced by rice phenological development. The classification accuracy is highest in early growth stages up to a canopy height of 80 cm, when the double bounce and surface scattering mechanisms are clearly expressed in the SAR signal. When the rice canopy becomes dense and taller, VS becomes dominant in the SAR signal. This shift reduces classification accuracy by around 80% with a slight site-specific variation. Interestingly, the classification accuracy increases during the pre-harvest period, despite similar canopy conditions. During pre-harvest, all fields dry out naturally due to irrigation demand, removing the water status contrast between AWD and non-AWD plots. The results suggest that, although L-band SAR offers greater canopy penetration compared to shorter wavelengths, irrigation signals are still partially masked at peak biomass. This constraint should be carefully considered when designing monitoring approaches for late-season irrigation dynamics.

4.3. Challenges of AWD Irrigated Rice Paddy Identification

The AWD irrigation cycle generally begins two weeks after transplantation and continues until 80–90 days after transplanting. Outside of this window, there is no difference between AWD and non-AWD irrigation schedules. As a result, the distinctive behavior of the three scattering components is very important for identifying an AWD irrigated field during this intermediate period. The comparatively lower classification accuracy observed in the later growing season is therefore less of a practical concern. Moreover, the small plot sizes, planting date variation, different rice varieties, and varying input parameters are also important factors for limiting the detection accuracy.

4.4. Application of L-Band SAR for Carbon Credit

The AWD irrigation is globally recognized as an effective technique to reduce methane emissions from rice cultivation and increase water use efficiency. Rice paddy cultivation significantly contributes to the global GHG emissions and AWD irrigation practice is considered a potential tool for climate change mitigation. The successful adoption of AWD irrigation in carbon credit schemes depends on a reliable monitoring, reporting and verification system providing transparent and verifiable evidence of irrigation management practices.
The L-band SAR-based AWD identification and monitoring could serve as a credible monitoring tool for supporting AWD adoption in carbon credit schemes. Remote sensing technologies, particularly SAR-based observations, offer significant advantages for MRV systems because they enable consistent, large-scale monitoring of irrigation conditions regardless of cloud cover or weather conditions. Furthermore, recent initiatives such as the CH4Rice project have demonstrated the importance of integrating satellite observations with in situ water-level sensors and field measurements to support methane emission estimation and water management monitoring [52].
Therefore, SAR-based monitoring should be considered a complementary component within MRV systems rather than a standalone verification tool. Combining satellite observations with field measurements, IoT sensor networks, and farm management records will be essential for ensuring the transparency and credibility required for carbon credit certification.

5. Conclusions

This study developed a comprehensive technique to detect and monitor the AWD irrigated rice paddy field by integrating full-polarimetric PALSAR-2 L-band data, low-cost IoT water level monitoring sensors, and field observation data. The results demonstrate that Freeman–Durden’s three-component decomposition is capable of detecting changes in the water status of rice paddy fields through variation in polarimetric scattering response. In particular, SS and DB are highly sensitive to AWD irrigation-induced dry and wet conditions, whereas VS is primarily responsive to phonological growth and canopy structural changes. Using three component characteristics in conjunction with a Random Forest classifier, AWD irrigated rice paddy fields were successfully identified with an overall accuracy of 80–95%. However, dense canopy development during the middle and later stages creates challenges in achieving consistently high classification accuracy. IoT sensor-based field-level water status data provides critical ancillary information that increases the efficiency and effectiveness of the L-band SAR-based irrigation water-level monitoring. Overall, the findings indicate that L-band polarimetric SAR, particularly when combined with ground-based sensing, offers a stronger methodological foundation for monitoring AWD irrigation practices at the field scale. Nevertheless, continued methodological refinement and multi-source data integration will be essential to fully support large-scale implementation, evidence-based policy applications, and rigorous carbon credit verification in rice-based agricultural systems.

Author Contributions

Conceptualization, M.R.I., K.O. and W.T.; methodology, M.R.I., K.O. and W.T.; software, M.R.I. and K.O.; validation, M.R.I.; formal analysis, M.R.I.; investigation, M.R.I.; resources, M.R.I., K.O. and W.T.; data curation, M.R.I.; writing—original draft preparation, M.R.I.; writing—review and editing, K.O. and W.T.; visualization, M.R.I.; supervision, K.O. and W.T.; project administration, M.R.I. All authors have read and agreed to the published version of the manuscript.

Funding

This research received no external funding.

Data Availability Statement

The data supporting the findings of this study are available from the corresponding author. Some datasets are subject to licensing agreements.

Acknowledgments

The authors thank Japan Aerospace Research Agency (JAXA) for data support, and Md Yusuf Ali and Md Sabbir Islam for their support in data collection.

Conflicts of Interest

The authors declare no conflicts of interest.

References

  1. Sen, S.; Chakraborty, R.; Kalita, P. Rice—Not just a staple food: A comprehensive review on its phytochemicals and therapeutic potential. Trends Food Sci. Technol. 2020, 97, 265–285. [Google Scholar] [CrossRef]
  2. Vollset, S.E.; Goren, E.; Yuan, C.-W.; Cao, J.; E Smith, A.; Hsiao, T.; Bisignano, C.; Azhar, G.S.; Castro, E.; Chalek, J.; et al. Fertility, mortality, migration, and population scenarios for 195 countries and territories from 2017 to 2100: A forecasting analysis for the Global Burden of Disease Study. Lancet 2020, 396, 1285–1306. [Google Scholar] [CrossRef] [PubMed]
  3. Jamal, R.; Kristiansen, P.; Kabir, J.; de Bruyn, L.L. Challenges and Adaptations for Resilient Rice Production under Changing Environments in Bangladesh. Land 2023, 12, 1217. [Google Scholar] [CrossRef]
  4. Dasgupta, S.; Hossain, M.; Huq, M.; Wheeler, D. Climate Change, Salinization and High-Yield Rice Production in Coastal Bangladesh. Agric. Resour. Econ. Rev. 2017, 47, 66–89. [Google Scholar] [CrossRef]
  5. Jahangir, M.M.R.; Aguilera, E.; Ferdous, J.; Mahjabin, F.; Al Asif, A.; Hossan, M.; Ahmad, H.; Bauer, M.; Cobeña, A.S.; Müller, C.; et al. Carbon footprint and greenhouse gas emissions of different rice-based cropping systems using LCA. Sci. Rep. 2025, 15, 10214. [Google Scholar] [CrossRef]
  6. Wang, X.; Chang, X.; Ma, L.; Bai, J.; Liang, M.; Yan, S. Global and regional trends in greenhouse gas emissions from rice production, trade, and consumption. Environ. Impact Assess. Rev. 2023, 101, 107141. [Google Scholar] [CrossRef]
  7. Bouman, B.; Tuong, T. Field water management to save water and increase its productivity in irrigated lowland rice. Agric. Water Manag. 2001, 49, 11–30. [Google Scholar] [CrossRef]
  8. Carrijo, D.R.; Lundy, M.E.; Linquist, B.A. Rice yields and water use under alternate wetting and drying irrigation: A meta-analysis. Field Crop. Res. 2017, 203, 173–180. [Google Scholar] [CrossRef]
  9. Rahman, M.S.; Sander, B.O. Application of Alternate Wetting and Drying (AWD) in Bangladesh Agriculture: Findings from case studies. In Proceedings of the 2017 ASAE 9th International Conference, Bangkok, Thailand, 11–13 January 2017; pp. 310–332. [Google Scholar]
  10. Barmon, B.K.; Tarafder, S.K. Impacts of Alternate Wetting and Drying (AWD) Irrigation System on Water Productivity, Profitability and Household Income of Modern Varieties (MV) of Paddy Producer in Bangladesh. In Proceedings of the 2017 ASAE 9th International Conference, Bangkok, Thailand, 11–13 January 2017; pp. 250–274. [Google Scholar]
  11. Chidthaisong, A.; Cha-Un, N.; Rossopa, B.; Buddaboon, C.; Kunuthai, C.; Sriphirom, P.; Towprayoon, S.; Tokida, T.; Padre, A.T.; Minamikawa, K. Evaluating the effects of alternate wetting and drying (AWD) on methane and nitrous oxide emissions from a paddy field in Thailand. Soil Sci. Plant Nutr. 2018, 64, 31–38. [Google Scholar] [CrossRef]
  12. Kürschner, E.; Henschel, C.; Hildebrandt, T.; Leineweber, M.; Paul, C. Water Saving in Rice Production—Dissemination, Adoption and Short Term Impacts of Alternate Wetting and Drying (AWD) in Bangladesh; SLE: Berlin, Germany, 2010. [Google Scholar]
  13. Oo, A.Z.; Sudo, S.; Inubushi, K.; Mano, M.T.; Yamamoto, A.; Ono, K.; Osawa, T.; Hayashida, S.; Patra, P.K.; Terao, Y.; et al. Methane and nitrous oxide emissions from conventional and modified rice cultivation systems in South India. Agric. Ecosyst. Environ. 2017, 252, 148–158. [Google Scholar] [CrossRef]
  14. Begum, K.; Kuhnert, M.; Yeluripati, J.B.; Ogle, S.M.; Parton, W.J.; Williams, S.A.; Pan, G.; Cheng, K.; Ali, M.A.; Smith, P. Modelling greenhouse gas emissions and mitigation potentials in fertilized paddy rice fields in Bangladesh. Geoderma 2019, 341, 206–215. [Google Scholar] [CrossRef]
  15. Khan, M.R.U.; Saleh, A.F.M. Model-based Estimation of Methane Emission from Rice Fields in Bangladesh. J. Agric. Eng. Biotechnol. 2015, 3, 125–137. [Google Scholar] [CrossRef]
  16. Xie, B.; Zhou, Z.; Zheng, X.; Zhang, W.; Zhu, J. Modeling methane emissions from paddy rice fields under elevated atmospheric carbon dioxide conditions. Adv. Atmos. Sci. 2010, 27, 100–114. [Google Scholar] [CrossRef]
  17. Maina, M.M.; Amin, M.S.M.; Aimrun, W.; Abd Aziz, S.; Yazid, M.; Rowshon, M.K. Evaluation of Field Measurements and Estimated Rice Crop Water Requirements. In Proceedings of the PAWEES 2012 International Conference: Challenges of Water & Environmental Management in Monsoon Asia, Nonthaburi, Thailand, 27–29 November 2012; Available online: https://www.researchgate.net/publication/333996238_Evaluation_of_Field_Measurements_and_Estimated_Rice_Crop_Water_Requirements/references#fullTextFileContent (accessed on 15 March 2026).
  18. Tran, V.T.; Mai, V.T.; Nguyen, T.D.T.; Le, H.A.; Richards, M.B.; Sebastian, L.; Wollenberg, E.; Vu, D.Q.; Sander, B.O. An Investment Plan for Low-Emission Rice Production in the Mekong River Delta Region in Support of Vietnam’s Nationally Determined Contribution to the Paris Agreement. CCAFS Working Paper no. 263. Wageningen, Netherlands: CGIAR Research Program on Climate Change, Agriculture and Food Security (CCAFS). 2019. Available online: https://cgspace.cgiar.org/server/api/core/bitstreams/66bd9d36-de7d-4fa8-b84f-b8cc91b83b64/content (accessed on 12 January 2026).
  19. Khan, M.A.; Reza, M.O.H.; Khan, M.T.; Ali, M.A. Effect of Irrigation Water Management Practices and Rice Cultivars on Methane (CH4) Emission and Rice Productivity. Int. J. Innov. Appl. Stud. 2015, 10, 516–534. [Google Scholar]
  20. Islam, R.; Kim, H.; Takeuchi, W. Physio-Climatic and Socio-Economic Suitability Assessment of Alternate Wetting and Drying (AWD) Irrigation Water Management in Bangladesh. In Remote Sensing Application II: A Climate Change Perspective in Agriculture; Ahamed, T., Ed.; Springer Nature: Singapore, 2024; pp. 379–403. [Google Scholar] [CrossRef]
  21. CDM.2. on Matters Relating to the Clean Development Mechanism II. Functioning of the Clean Development Mechanism Beyond the End of the Second Commitment Period of the Kyoto Protocol. 2025. Available online: https://unfccc.int/documents/654823 (accessed on 8 January 2026).
  22. Joint Crediting Mechanism (JCM). Methane Emission Reduction by Water Management in Rice Paddy Fields, Version 1.0 (PH_AM004). Available online: https://www.jcm.go.jp/jc/ph-methodologies-proposed/ (accessed on 10 January 2026).
  23. Verra. VM0051. Improved Management in Rice Production Systems, v1.0. Verified Carbon Standard Program. Available online: https://verra.org/methodologies/improved-management-in-rice-production-systems/ (accessed on 5 January 2026).
  24. Intergovernmental Panel on Climate Change. Preface. In Climate Change 2014: Mitigation of Climate Change: Working Group III Contribution to the IPCC Fifth Assessment Report; Cambridge University Press: Cambridge, UK, 2015. [Google Scholar] [CrossRef][Green Version]
  25. Janardanan, R.; Maksyutov, S.; Tsuruta, A.; Wang, F.; Tiwari, Y.K.; Valsala, V.; Ito, A.; Yoshida, Y.; Kaiser, J.W.; Janssens-Maenhout, G.; et al. Country-scale analysis of methane emissions with a high-resolution inverse model using GOSAT and surface observations. Remote Sens. 2020, 12, 375. [Google Scholar] [CrossRef]
  26. Bousbih, S.; Zribi, M.; El Hajj, M.; Baghdadi, N.; Lili-Chabaane, Z.; Gao, Q.; Fanise, P. Soil moisture and irrigation mapping in a semi-arid region, based on the synergetic use of Sentinel-1 and Sentinel-2 data. Remote Sens. 2018, 10, 1953. [Google Scholar] [CrossRef]
  27. Rosenqvist, A.; Shimada, M.; Suzuki, S.; Ohgushi, F.; Tadono, T.; Watanabe, M.; Tsuzuku, K.; Watanabe, T.; Kamijo, S.; Aoki, E. Operational performance of the ALOS global systematic acquisition strategy and observation plans for ALOS-2 PALSAR-2. Remote Sens. Environ. 2014, 155, 3–12. [Google Scholar] [CrossRef]
  28. Babu, S.C.; De Pinto, A.; Paul, N. Strengthening Institutional Capacity for Disaster Management and Risk Reduction Through Climate-Resilient Agriculture; International Food Policy Research Institute: Washington, DC, USA, 2019. [Google Scholar]
  29. Ambika, A.K.; Wardlow, B.; Mishra, V. Remotely sensed high resolution irrigated area mapping in India for 2000 to 2015. Sci. Data 2016, 3, 160118. [Google Scholar] [CrossRef]
  30. Chen, Y.; Lu, D.; Luo, L.; Pokhrel, Y.; Deb, K.; Huang, J.; Ran, Y. Detecting irrigation extent, frequency, and timing in a heterogeneous arid agricultural region using MODIS time series, Landsat imagery, and ancillary data. Remote Sens. Environ. 2018, 204, 197–211. [Google Scholar] [CrossRef]
  31. Phan, A.; Ha, D.N.; Man, C.D.; Nguyen, T.T.; Bui, H.Q.; Nguyen, T.T.N. Rapid assessment of flood inundation and damaged rice area in Red River Delta from Sentinel 1A imagery. Remote Sens. 2019, 11, 2034. [Google Scholar] [CrossRef]
  32. Li, H.; Fu, D.; Huang, C.; Su, F.; Liu, Q.; Liu, G.; Wu, S. An approach to high-resolution rice paddy mapping using time-series sentinel-1 sar data in the mun river basin, Thailand. Remote Sens. 2020, 12, 3959. [Google Scholar] [CrossRef]
  33. Alam, E. Assessment of Irrigation Efficiency and Techno-Socio-Economic Opportunities for Its Improvement in Minor Irrigation. Ph.D. Thesis, Institute of Water and Flood Management, Dhaka, Bangladesh, 2011. [Google Scholar]
  34. Demarez, V.; Helen, F.; Marais-Sicre, C.; Baup, F. In-season mapping of irrigated crops using Landsat 8 and Sentinel-1 time series. Remote Sens. 2019, 11, 118. [Google Scholar] [CrossRef]
  35. Jonai, H.; Takeuchi, W. Global Rice Paddy Field Mapping by Integrating Modis and Amsr-E Measurements. In Proceedings of the Asisan Association of Remote Senseing (AARS), Pattaya, Thailand, 26–30 November 2012. [Google Scholar]
  36. Alexandridis, T.K.; Cherif, I.; Chemin, Y.; Silleos, G.N.; Stavrinos, E.; Zalidis, G.C. Integrated methodology for estimating water use in mediterranean agricultural areas. Remote Sens. 2009, 1, 445–465. [Google Scholar] [CrossRef]
  37. Singha, M.; Dong, J.; Sarmah, S.; You, N.; Zhou, Y.; Zhang, G.; Doughty, R.; Xiao, X. Identifying floods and flood-affected paddy rice fields in Bangladesh based on Sentinel-1 imagery and Google Earth Engine. ISPRS J. Photogramm. Remote Sens. 2020, 166, 278–293. [Google Scholar] [CrossRef]
  38. Arai, H.; Takeuchi, W.; Oyoshi, K.; Nguyen, L.D.; Inubushi, K. Estimation of methane emissions from rice paddies in the mekong delta based on land surface dynamics characterization with remote sensing. Remote Sens. 2018, 10, 1438. [Google Scholar] [CrossRef]
  39. Segami, G.; Oyoshi, K.; Sobue, S.; Takeuchi, W. Characterizing L-Band Backscatter in Inundated and Non-Inundated Rice Paddies for Water Management Monitoring. Remote Sens. 2026, 18, 370. [Google Scholar] [CrossRef]
  40. Paudel, D.; Sherchan, B.; Panday, U.S. Delineation of rainfed and irrigated paddy fields using SAR-based polarization ratio: A case of Chitwan district, Nepal. Int. J. Remote Sens. 2025, 46, 6235–6259. [Google Scholar] [CrossRef]
  41. Xiao, D.; Niu, H.; Guo, F.; Zhao, S.; Fan, L. Monitoring irrigation dynamics in paddy fields using spatiotemporal fusion of Sentinel-2 and MODIS. Agric. Water Manag. 2022, 263, 107409. [Google Scholar] [CrossRef]
  42. U. D. of A. USDA (Foreign Agricultural Service). Production—Rice. 2026. Available online: https://www.fas.usda.gov/data/production/commodity/0422110 (accessed on 12 January 2026).
  43. Gumma, M.K.; Thenkabail, P.S.; Maunahan, A.; Islam, S.; Nelson, A. Mapping seasonal rice cropland extent and area in the high cropping intensity environment of Bangladesh using MODIS 500m data for the year 2010. ISPRS J. Photogramm. Remote Sens. 2014, 91, 98–113. [Google Scholar] [CrossRef]
  44. JAXA. ALOS-2 Project/PALSAR-2. JAXA. ALOS-2 Project/PALSAR-2. Available online: https://www.eorc.jaxa.jp/ALOS-2/en/about/palsar2.htm (accessed on 6 January 2026).
  45. Kumar, M.; Sahni, R.K.; Waghaye, A.M.; Kumar, M.; Randhe, R.D. Electronic Sensor-Based Automated Irrigation System for Rice Cultivated Under Alternate Wetting and Drying Technique. AgriEngineering 2024, 6, 4720–4738. [Google Scholar] [CrossRef]
  46. Veci, L.; Prats-Iraola, P.; Scheiber, R.; Collard, F.; Fomferra, N.; Engdahl, M. The Sentinel-1 Toolbox. In Proceedings of the IEEE International Geoscience and Remote Sensing Symposium (IGARSS), Quebec City, QC, Canada, 13–18 July 2014; pp. 1–3. [Google Scholar]
  47. JAXA. ALOS-2 Project/PALSAR-2; Tokyo, Japan. 2014. Available online: https://www.eorc.jaxa.jp/ALOS/en/alos-2/a2_calval_e.htm (accessed on 15 March 2026).
  48. Freeman, A.; Durden, S.L. A three-component scattering model for polarimetric SAR data. IEEE Trans. Geosci. Remote Sens. 1998, 36, 963–973. [Google Scholar] [CrossRef]
  49. Inoue, Y.; Sakaiya, E.; Wang, C. Capability of C-band backscattering coefficients from high-resolution satellite SAR sensors to assess biophysical variables in paddy rice. Remote Sens. Environ. 2014, 140, 257–266. [Google Scholar] [CrossRef]
  50. Rosenqvist, A.; Shimada, M.; Ito, N.; Watanabe, M. ALOS PALSAR: A Pathfinder Mission for Global-Scale Monitoring of the Environment. IEEE Trans. Geosci. Remote Sens. 2007, 45, 3307–3316. [Google Scholar] [CrossRef]
  51. Zhu, Z.; Woodcock, C.E.; Rogan, J.; Kellndorfer, J. Assessment of spectral, polarimetric, temporal, and spatial dimensions for urban and peri-urban land cover classification using Landsat and SAR data. Remote Sens. Environ. 2012, 117, 72–82. [Google Scholar] [CrossRef]
  52. CH4Rice. SAFE CH4Rice Project. Available online: https://www.eorc.jaxa.jp/SAFE/project/ch4rice/ (accessed on 12 December 2025).
Figure 1. The overview of data sources, preprocessing, processing, multi-source data integration, and the overall workflow of the study.
Remotesensing 18 01183 g001
Figure 2. Locational map of the study area: (a) ALOS PALSA-2 observation path over Bangladesh; (b) location of Niamotpur Upazila within Naogaon district; (c) location of three selected sites; Rosulpur, Sreemantopur, and Bhabicha.
Remotesensing 18 01183 g002
Figure 3. Spatial distribution of installed IoT water-level monitoring sensors across the study area, incorporating the three study sites: Rasolpur, Sreemantapur, and Bhabica.
Remotesensing 18 01183 g003
Figure 4. Comparison of plot-level irrigation water level data between manual field observations (Plot SPA#11 M and SPA#12 M), and IoT sensor-based water level measurements (SPA#11 S and SPA#12 S) for selected rice paddy fields.
Remotesensing 18 01183 g004
Figure 5. Pearson correlation heat map comparing rice plant height, IoT-based water level, and backscatter descriptors (mean, median, standard deviation) of the double-bounce, volume, and surface scattering components from Freeman–Durden decomposition. Red and blue shading indicate the direction and magnitude of correlations, ranging from −1.00 to +1.00.
Remotesensing 18 01183 g005
Figure 6. Site-specific correlation matrices of mean, median and standard deviation derived from Freeman–Durden three components across. Sreemantapur (SP), Rosulpur (RP) and Bhabicha (BH) under AWD and non-AWD irrigation practices. (p < 0.001: ‘*’; p < 0.01: ‘**’; and p < 0.05: ‘***’).
Remotesensing 18 01183 g006
Figure 7. Temporal changes in Freeman–Durden’s scattering mechanisms for AWD and non-AWD rice fields are presented as boxplots of Sigma-naught.
Remotesensing 18 01183 g007
Figure 8. The relationship of (a) SS; (b) DB; and (c) VS with plant height in three study sites (RP, SR, and VH) under AWD and non−AWD irrigation practices.
Remotesensing 18 01183 g008
Figure 9. The relationship of (a) SS; (b) DB; and (c) VS with water level in three study sites (RP, SR, and VH) under AWD (A) and non−AWD (F) irrigation practices.
Remotesensing 18 01183 g009
Figure 10. AWD and non-AWD rice paddy field maps at RP, SP, and BH derived from Freeman–Durden’s decomposition components and Random Forest classification across eight PALSAR-2 acquisition dates (7 January–13 May 2025).
Remotesensing 18 01183 g010
Table 1. Observation parameters and technical specifications of the ALOS-2 PALSAR-2 satellite.
CharacteristicsValues
Observation Range(24.79, 88.43, 24.71, 88.87), (24.17, 88.30, 24.09, 88.74)
Local Time2025/02/18 06:07:49 (approx.)
ModeSM2
Revisit Time14 days
Spatial Resolution6.0 m
Off Nadir Angle25.0
Path/Frame047/3110
Swath50 km
PolarizationHH + HV + VH + VV
Table 2. ALOS-2 PALSAR-2 satellite observation dates and corresponding field survey dates over the study sites.
Satellite Observation DatePathField Visit Date
7 January 2025479 January 2025
21 January 20254720 January 2025
18 February 20254719 February 2025
4 March 2025476 March 2025
1 April 2025471 April 2025
15 April 20254717 April 2025
29 April 20254728 April 2025
13 May 20254710 May 2025
Table 3. PALSAR-2 observation date over the field sites and the field survey date on the project sites.
Observation DateSite A (Rosulpur)Site B (Sreemantapur)Site C (Bhabicha) *Plant Height (cm)
Dry Field Wet Field Dry Field Wet Field Dry Field Wet Field
7 January 20251420205200–20
21 January 2025241119111420–40
18 February 202543921802540–60
4 March 2025934515141160–80
1 April 20251033614101580–100
15 April 2025162781291680–100
29 April 20253581281114100–120
13 May 2025421182214100–120
Total1192255210881119704
* In the case of the Bhabicha site, the cropping pattern was rice–mastered–rice, and the plantation date was delayed in February 2024. The plant height was different in the date compared with sites A and B. The value was adjusted in the later part.
Table 4. The plant height and water level of three different sites, AWD and non-AWD irrigation practices, in the rice paddy field.
FieldParameters7 January 21 January 18 February4 March1 April15 April29 April13 May
SPA #11Plant Height (cm)0–2020–3030–5050–7070–8080–100100–110
Water level (cm)7.40.8−11.51.0−0.5−15−17
SPF #46Plant Height (cm)0–2020–3030–5050–7070–8080–100100–110
Water level (cm)4.52.74.84.10.44.8−1.2
RPA #51Plant Height (cm)0–2020–3030–5050–7070–8080–100100–110
Water level (cm)4.86.04.1−4.23.4−7.83.2
RPF #55Plant Height (cm)0–2020–3030–5050–7070–8080–100100–110
Water level (cm)2.2−4.81.50.82.7−0.5−1.00
BHA#68Plant Height (cm) 0–2020–3030–5050–7070–8080–100
Water level (cm) 1.5 −3.4−4.57.82.2
BHF #88Plant Height (cm) 0–2020–3030–5050–7070–8080–100
Water level (cm) 5.96.50.34.68.84.6
Table 5. PALSAR-2 backscattered coefficient induced three components derived AWD and non-AWD classified map and actual field irrigation comparison.
DateActual DryIdentified DryActual WetIdentified Wet
7 January016362
21 January136360
18 February1167782
4 March17286760
1 April25225122
15 April33335555
29 April62582630
13 May192164
Table 6. Accuracy of the L-band PALSAR-2-derived AWD and non-AWD irrigated rice paddy map on different dates over the study area.
Date7 January21 January18 February4 March1 April15 April29 April13 May
Accuracy96.80%93.75%88.60%80.68%92.10%92%90.90%84%
Disclaimer/Publisher’s Note: The statements, opinions and data contained in all publications are solely those of the individual author(s) and contributor(s) and not of MDPI and/or the editor(s). MDPI and/or the editor(s) disclaim responsibility for any injury to people or property resulting from any ideas, methods, instructions or products referred to in the content.