


Highlights
What are the main findings?
- A physics-aware inverse projection strategy combined with global coherent integration achieves robust side-lobe suppression and sub-meter floor height estimation from airborne TomoSAR data.
- A directional morphological reconstruction algorithm, leveraging a separation-of-axes strategy and LOS-based geometric correction, effectively recovers orthogonal roof contours and fine semantic substructures.
What are the implications of the main findings?
- The study validates the capability of high-resolution TomoSAR to discern internal architectural hierarchies (e.g., floor levels), proving its potential for all-weather, fine-grained urban mapping beyond surface representation.
- The proposed integration of imaging geometry constraints with geometric priors offers a robust solution for regularized LOD2 modeling, overcoming the sparsity and noise limitations inherent in radar point clouds.
Abstract
The automatic generation of semantic Level of Detail (LOD) 2 models from TomoSAR point clouds is frequently compromised by elevation side-lobes, data sparsity, and inherent geometric distortions. In particular, the energy dispersion caused by side-lobes blurs vertical structures, making the extraction of floor details and accurate floor height estimation significantly challenging. To overcome these limitations, we present a refined reconstruction framework that tightly couples tomographic imaging mechanisms with building geometric priors. For fine-grained vertical reconstruction, we employ a geometry-constrained inverse projection strategy that concentrates scattered energy back onto the building façade to mitigate side-lobe interference. This is complemented by a Global Coherent Integration method, utilizing spectral analysis to robustly recover periodic floor patterns and estimate average floor heights. In the horizontal domain, we address the conflict between noise suppression and feature preservation through a separation-of-axes morphological strategy. Unlike traditional isotropic filtering, this approach processes orthogonal directions independently to bridge data gaps while strictly maintaining sharp building corners and recovering fine substructures. Validated on airborne Ku-band datasets, the proposed method demonstrates the capability to produce topologically complete and semantically rich urban models from sparse radar observations.
1. Introduction
Accelerated global urbanization has driven an unprecedented demand for dynamic, high-resolution three-dimensional (3D) city models [1,2]. These models, particularly those at Level of Detail (LOD) 2 and LOD3, have evolved beyond mere visualization assets to become critical components of smart city ecosystems, serving vital roles across multiple domains [3,4]. Specifically, according to CityGML standards, LOD2 models feature differentiated roof structures and thematic surfaces, while LOD3 models further incorporate detailed architectural elements such as windows and doors. While airborne Light Detection and Ranging (LiDAR) and oblique photogrammetry have long been the dominant technologies for urban reconstruction, they face operational limitations in certain scenarios. Optical sensors are inherently constrained by weather conditions and daylight availability, complicating data acquisition in cloudy or rainy regions [5]. Similarly, nadir-viewing LiDAR systems often struggle to capture complete vertical façade information due to steep incidence angles and occlusion effects within dense urban canyons [6,7].
In this context, Synthetic Aperture Radar Tomography (TomoSAR) has emerged as a powerful alternative. By exploiting coherent phase information from multiple acquisitions, TomoSAR synthesizes an aperture in the elevation direction, allowing for the resolution of multiple 3D scatterers within a single azimuth-range pixel [8,9,10]. This capability, combined with the microwave spectrum’s ability to penetrate clouds and operate day or night, renders TomoSAR an effective tool for time-critical and large-scale urban monitoring [11,12]. Unlike nadir sensors, the side-looking geometry of SAR offers a unique advantage for urban reconstruction, as it naturally illuminates building façades, providing rich vertical geometric information [13,14]. Recently, advancements in airborne array InSAR systems have enabled the acquisition of high-resolution Ku-band TomoSAR data with sub-meter range resolution, creating favorable conditions for fine-grained building reconstruction [15,16]. Despite these advantages, automated reconstruction of detailed building models from TomoSAR point clouds remains technically challenging, primarily due to inherent data sparsity, anisotropic localization errors, and artifacts introduced during signal processing [17,18].
Existing research on TomoSAR-based urban reconstruction primarily follows three technical routes. The first focuses on refining tomographic inversion algorithms. Traditional Compressed Sensing (CS) methods employ L1-norm sparsity constraints to enhance elevation resolution [19,20]. To further improve inversion accuracy, researchers have explored various optimization strategies: Zhu et al. [21] proposed a joint sparse inversion method utilizing constraints along building contours, while Shi et al. [22] and D’Hondt et al. [18] introduced non-local filtering to improve the signal-to-noise ratio by processing interferometric images in weighted blocks. While effective in specific scenarios, these methods highlight the need for further research into automated processing for large-scale, complex scenes and quality optimization from an imaging geometry perspective. The second route emphasizes geometric extraction and reconstruction directly from TomoSAR point clouds. Zhu and Shahzad [23,24] established a foundational framework for façade reconstruction from multi-view TomoSAR data, incorporating density projection-based façade detection, unsupervised clustering, and recursive angular optimization with alpha shapes for contour refinement. Wang et al. [25] proposed fusing point density maps with height maps for façade detection, and Guo et al. [26] utilized the DBSCAN clustering algorithm to separate individual building structures. While these contributions have advanced the field, they often rely heavily on data quality. Given the inherent defects of TomoSAR point clouds, methods adapted directly from LiDAR processing can lead to distorted models, underscoring the necessity of incorporating prior information for more refined and plausible reconstruction. The third route explores data-driven approaches such as deep learning. Wang et al. [27] applied Conditional Generative Adversarial Networks (CGAN) to generate high-quality 3D reconstructions from limited observation tracks, learning the mapping from low-quality to high-quality point clouds via adversarial training. Shi et al. [28] proposed a PointNet-based semantic segmentation method to separate building façades and roofs directly from raw TomoSAR points. Chen et al. [29] introduced a dual-topology network that alternates between point and mesh representations for denoising and hole filling. Although these learning-based methods demonstrate strong noise-handling capabilities, they typically require vast amounts of training data and often lack interpretability regarding the underlying physical imaging mechanisms, making it difficult to optimize for specific imaging conditions.
Despite significant progress, critical challenges remain in TomoSAR building reconstruction. Regarding side-lobe suppression, existing methods mostly perform post-processing in the geographic coordinate system, failing to directly suppress energy dispersion along the elevation direction from the perspective of imaging geometry. For automated floor height extraction, traditional peak detection and clustering are sensitive to noise, while frequency domain methods based on periodic textures in optical remote sensing [30,31] are limited by the side-lobe artifacts and non-uniform sampling of TomoSAR data. Regarding roof reconstruction, the side-looking nature of SAR causes systematic “layover” displacements [32,33], while the mixture of specular reflection and volume scattering results in fragmented point clouds, complicating the extraction of fine structures. Furthermore, traditional morphological processing using isotropic structuring elements tends to “round off” building corners [34], necessitating new approaches to preserve the orthogonal geometry of man-made structures.
To address these challenges, this paper proposes a refined reconstruction framework that integrates the TomoSAR imaging mechanism with building geometric priors. The main contributions of this study are summarized as follows:
- For fine-grained vertical reconstruction, we propose a unified strategy combining inverse projection focusing with Global Coherent Integration. By inverse-transforming point clouds to the radar coordinate system and projecting them onto refined façades, we concentrate scattering energy to effectively suppress side-lobe dispersion. Leveraging this focused signal, we construct a global vertical density function and apply spectral analysis to robustly recover periodic floor patterns, achieving sub-meter accuracy in floor height estimation.
- For roof reconstruction, we propose a directional morphological method. Using orthogonal linear structuring elements to perform closing operations in horizontal and vertical directions respectively, we preserve building orthogonality. Additionally, we resolve layover displacement through Line-of-Sight (LOS) projection correction, successfully recovering fine structural details such as parapet walls.
2. Materials and Methods
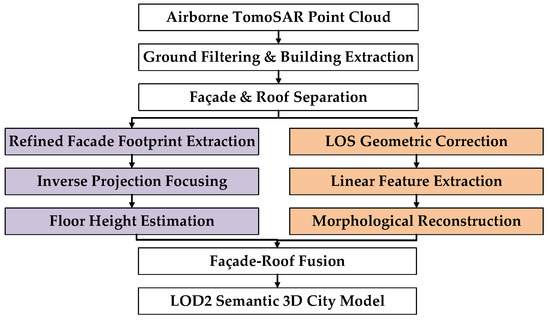
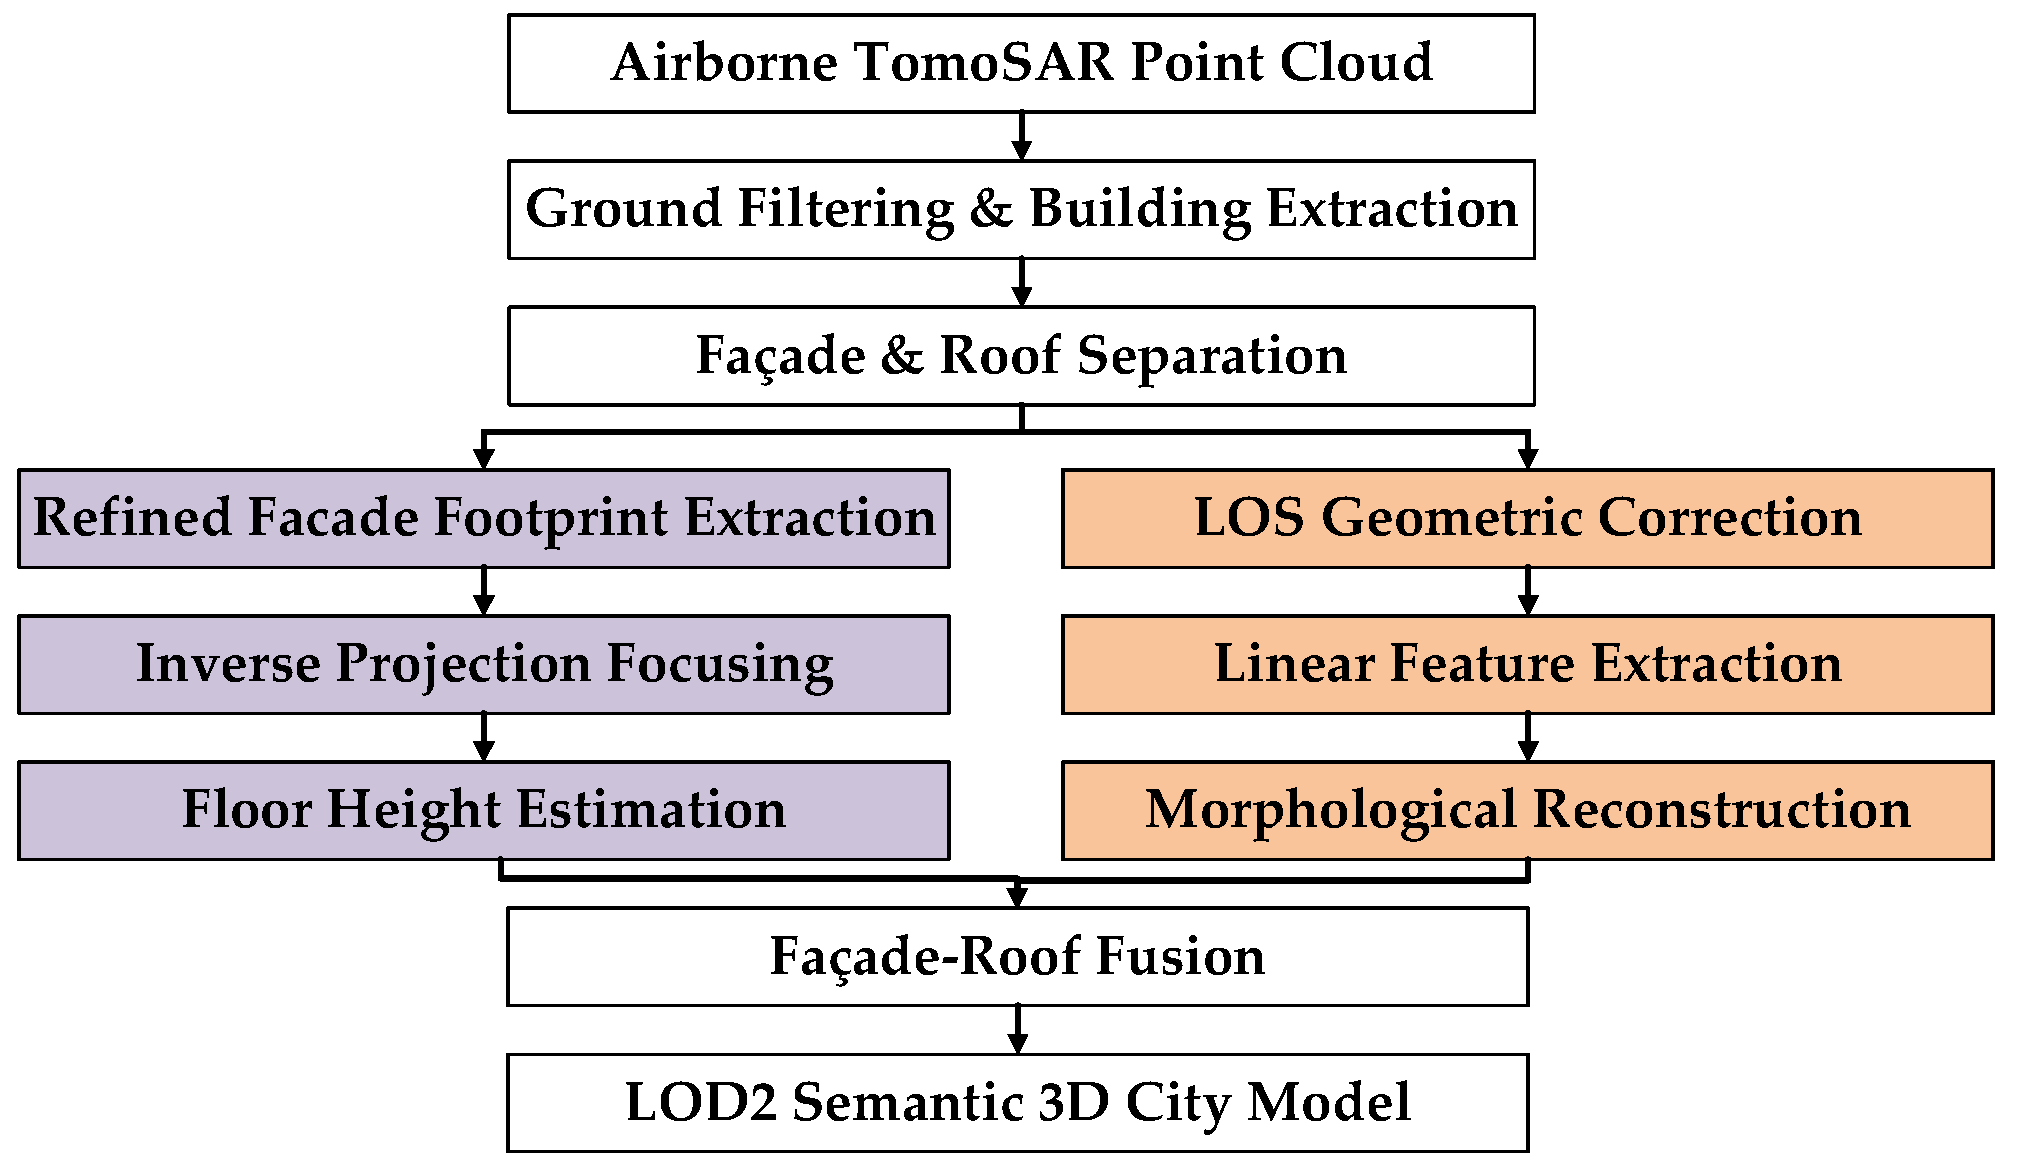
To address the signal sparsity and geometric distortions in TomoSAR point clouds, we propose a reconstruction framework that combines tomographic processing with geometric constraints from building priors, as illustrated in Figure 1. The workflow starts with preprocessing: raw point clouds are filtered and segmented into individual building instances. The reconstruction then proceeds along two parallel branches. The vertical branch applies an inverse projection strategy to suppress side-lobes and estimates floor heights through spectral analysis of the focused façade. The horizontal branch corrects layover displacement using the LOS geometry and extracts orthogonal roof boundaries through directional morphology. Finally, the façade footprints and roof contours are connected to form a closed LOD2 building model.
Figure 1.
The overall workflow of the proposed fine-grained reconstruction framework.
2.1. Principles of SAR Tomography
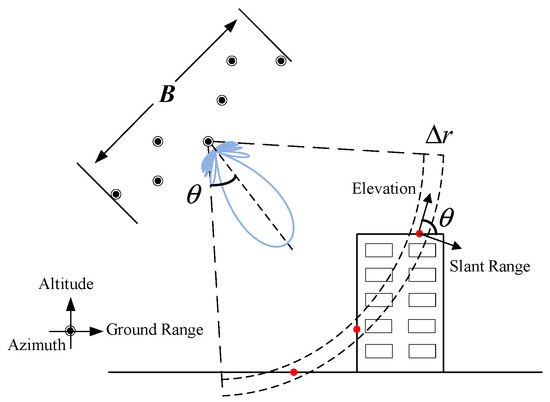
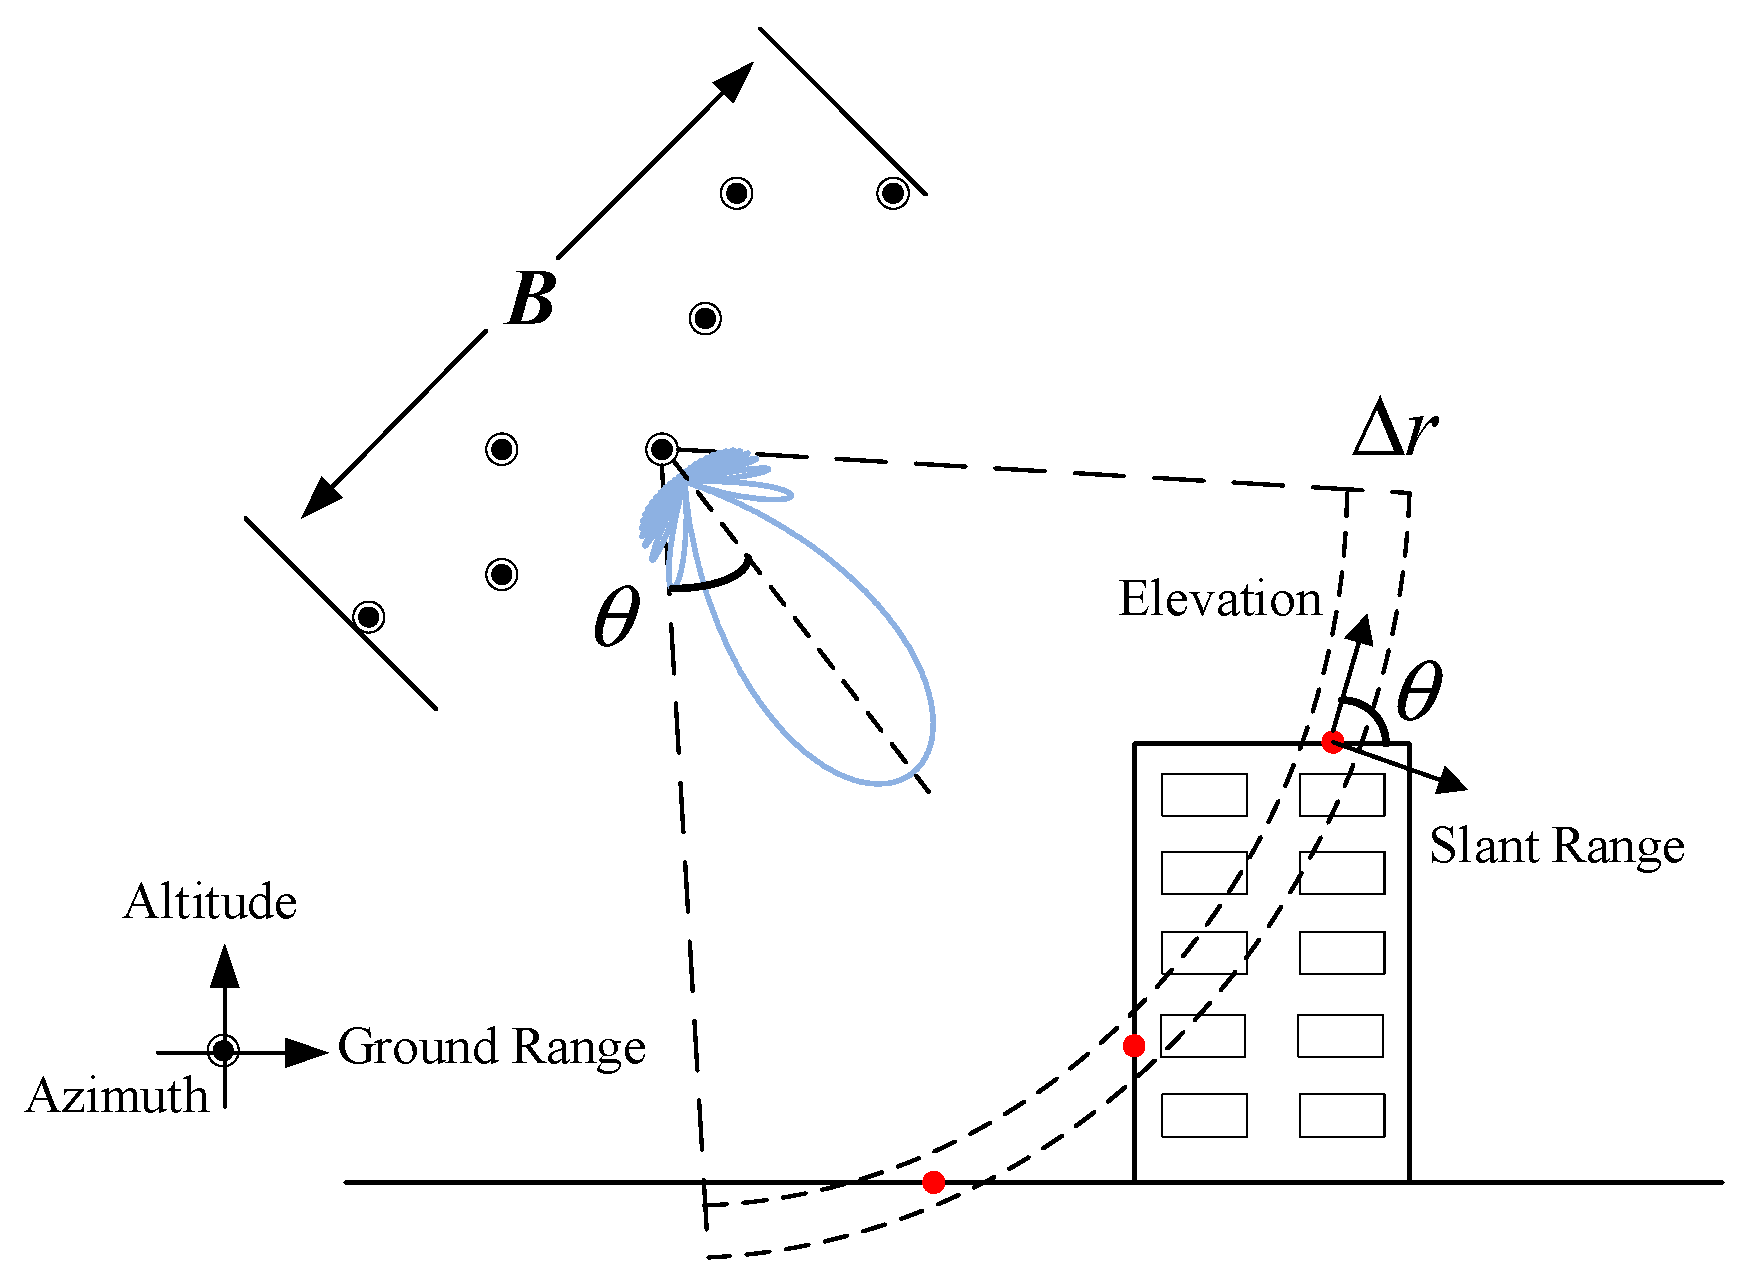
TomoSAR constructs a synthetic elevation aperture by capturing a series of M complex SAR images of the same area, forming an observation geometry as shown in Figure 2.
Figure 2.
TomoSAR imaging geometry. The red points represent the real overlaid scatterers within a single reconstruction cell. indicates the elevation aperture size (baseline length), and the blue lines represent the radar antenna beam pattern.
The focused imaging result can be expressed as
where represents the reflectivity function in the elevation direction. The term denotes the Rayleigh resolution along the elevation direction, with being the m-th baseline relative to the master track, representing the wavelength, indicating the slant range, and B representing the elevation aperture size. This model may be approximated as a linear equation containing noise ε
where Φ is an discretized measurement matrix, and its element , where represents the l-th sample of elevation .
To resolve the superposition of multiple scatterers within a single resolution cell, Compressed Sensing (CS) algorithms [35] are widely adopted due to their super-resolution capabilities. Based on the sparsity assumption of scatterers in the elevation direction, the tomographic inversion can be modeled as an -norm regularized optimization problem:
where represents the measurement vector, is the mapping matrix, and balances data fidelity and sparsity.
Although CS theory theoretically allows for the recovery of sparse signals from a limited number of observations, in practical TomoSAR applications, this inversion problem is inherently ill-posed. This primarily arises from the properties of the measurement matrix and the Basis Mismatch issue encountered during the discretization process [36].
Firstly, since the number of observations is significantly smaller than the number of discrete elevation grid points (i.e., ), Equation (3) constitutes an underdetermined system with infinite solutions. CS algorithms rely on the Restricted Isometry Property (RIP) or Mutual Coherence of the measurement matrix. However, constrained by the baseline distribution and the narrow elevation aperture, the column vectors of the measurement matrix often exhibit high correlation. This high mutual coherence impedes the reconstruction algorithm’s ability to distinguish adjacent scatterers, thereby leading to solution instability.
More critically, real-world building scatterers (e.g., window frames, balcony edges) are distributed continuously in elevation space, whereas the reconstruction model must rely on a predefined discrete grid . When a true scatterer’s position falls “off-grid,” it cannot be sparsely represented within the column space of the measurement matrix. Mathematically, this basis mismatch introduces a non-negligible modeling error, denoted as
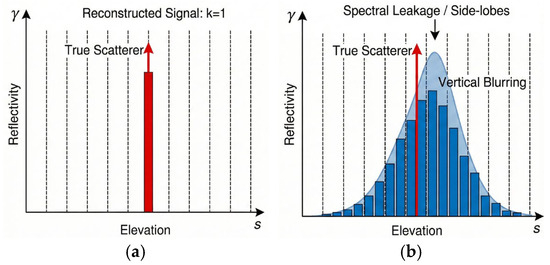
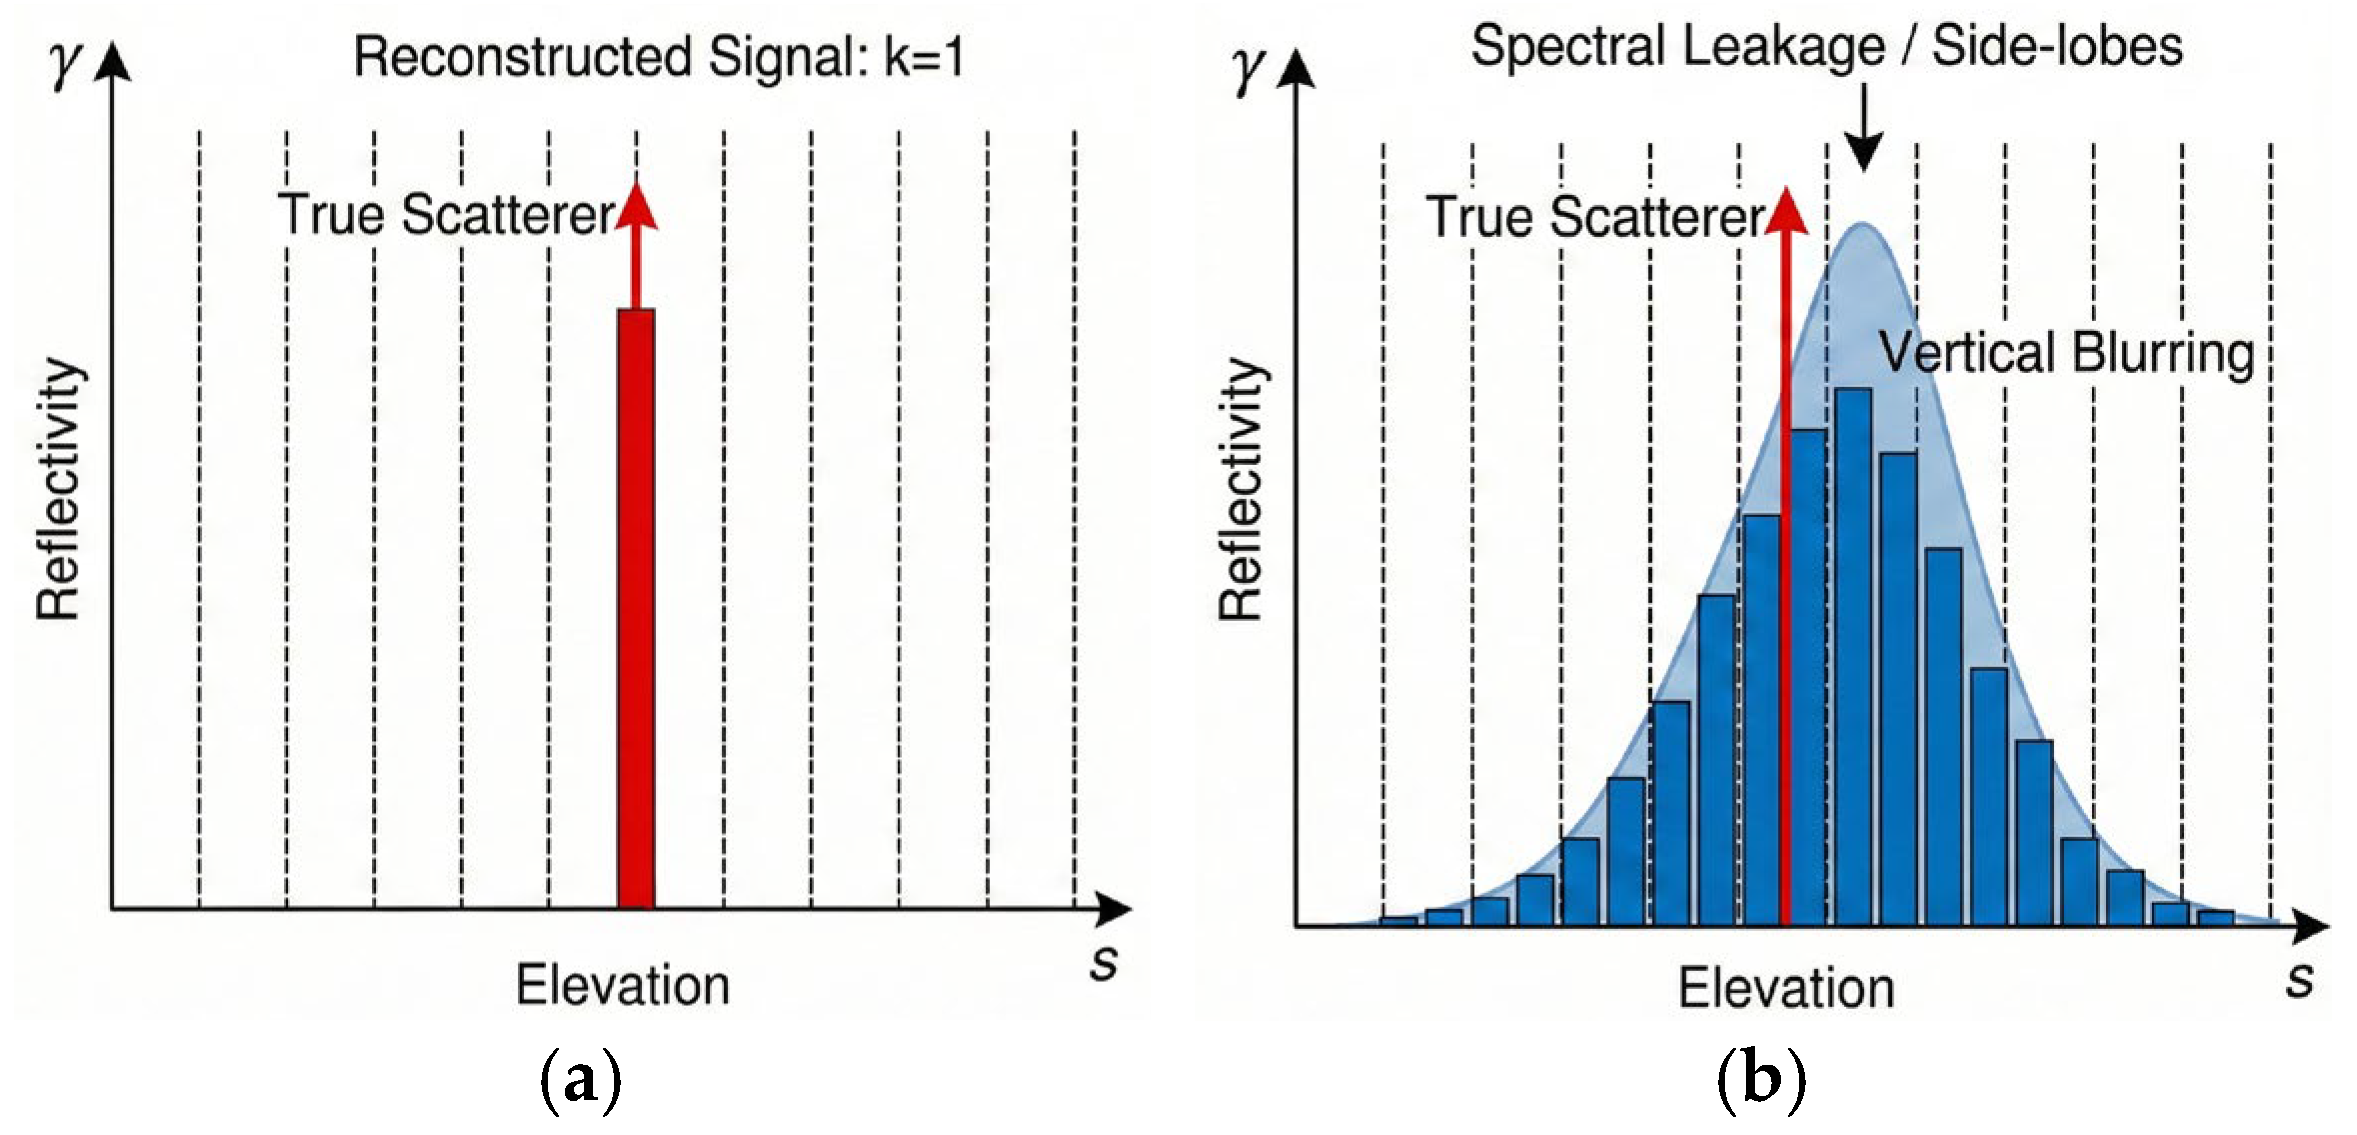
To compensate for , the CS solver is forced to utilize non-zero coefficients across multiple adjacent grid points to approximate the signal. In the frequency domain, this phenomenon manifests as Spectral Leakage; in the spatial domain, it appears as Energy Dispersion, where originally sharp scattering points blur vertically, creating “false side-lobes” or a “fog-like” effect in the point cloud, as shown in Figure 3.
Figure 3.
Schematic illustration of the “Off-grid” effect and spectral leakage in TomoSAR inversion. (a) Ideal scenario where the true scatterer aligns perfectly with the sampling grid. (b) Practical “basis mismatch” scenario where an off-grid scatterer causes energy dispersion (vertical blurring) across adjacent elevation bins.
2.2. Projection-Based Elevation Compression and Spectral Analysis
Due to limited baseline aperture, coarse elevation sampling, and basis mismatch in the CS inversion, reconstructed point clouds exhibit significant side-lobe effects along the elevation direction (perpendicular to the line of sight). Scatterers that physically lie on a single façade plane are dispersed asymmetrically across an elevation range of approximately ±1 m, blurring the boundaries between structural layers. To extract floor-level information from this dispersed signal, we use the refined façade footprints (extracted via the piecewise fitting method in our prior work [37]) as geometric constraints. By projecting the scattered points onto these reference surfaces in the geographic coordinate system, we compress the elevation spread and sharpen the vertical density profile, enabling robust floor height estimation through frequency-domain analysis.
2.2.1. Refined Façade Footprint Reconstruction
Precise façade footprints serve as the geometric foundation for the subsequent point cloud focusing. However, raw TomoSAR point clouds are often contaminated by strong outliers and multi-bounce scattering noise, rendering standard global line-fitting algorithms ineffective at capturing local geometric modulations such as bay windows or recesses. To address this, we employ a coarse-to-fine reconstruction strategy rooted in the Manhattan World assumption.
The process commences with a global initialization, where the building’s principal orientation is estimated using RANSAC [38] on the ground-projected points. To resolve fine-grained irregularities, we implement a fixed-width sliding window analysis along this principal axis. Within each window, we compute the median perpendicular distance of the points relative to the coarse baseline. By analyzing the gradient of these local distances, we identify structural inflection points—where the offset magnitude exhibits a step change—to segment the façade into discrete linear clusters.
Finally, the refined footprint is constructed by fitting line segments to these independent clusters. Crucially, to ensure geometric regularity, adjacent segments are bridged using an orthogonal connection strategy. This forces the connecting edges to align strictly with the parallel or perpendicular directions of the principal axis, yielding a continuous, rectified 2D baseline ideal for vertical projection.
2.2.2. Side-Lobe Mitigation via Geometric Regularization
Precise floor segmentation is fundamentally hindered by the limited elevation aperture of the tomographic system. The resulting Point Spread Function (PSF) exhibits significant side-lobes along the elevation direction (), orthogonal to the Line-of-Sight (LOS). Without geometric correction, energy from strong scatterers (e.g., window frames) suffers from spectral leakage, spreading into adjacent elevation bins. This phenomenon, often referred to as “inter-story crosstalk,” creates a vertical blurring effect that obscures the distinct density peaks of individual floors.
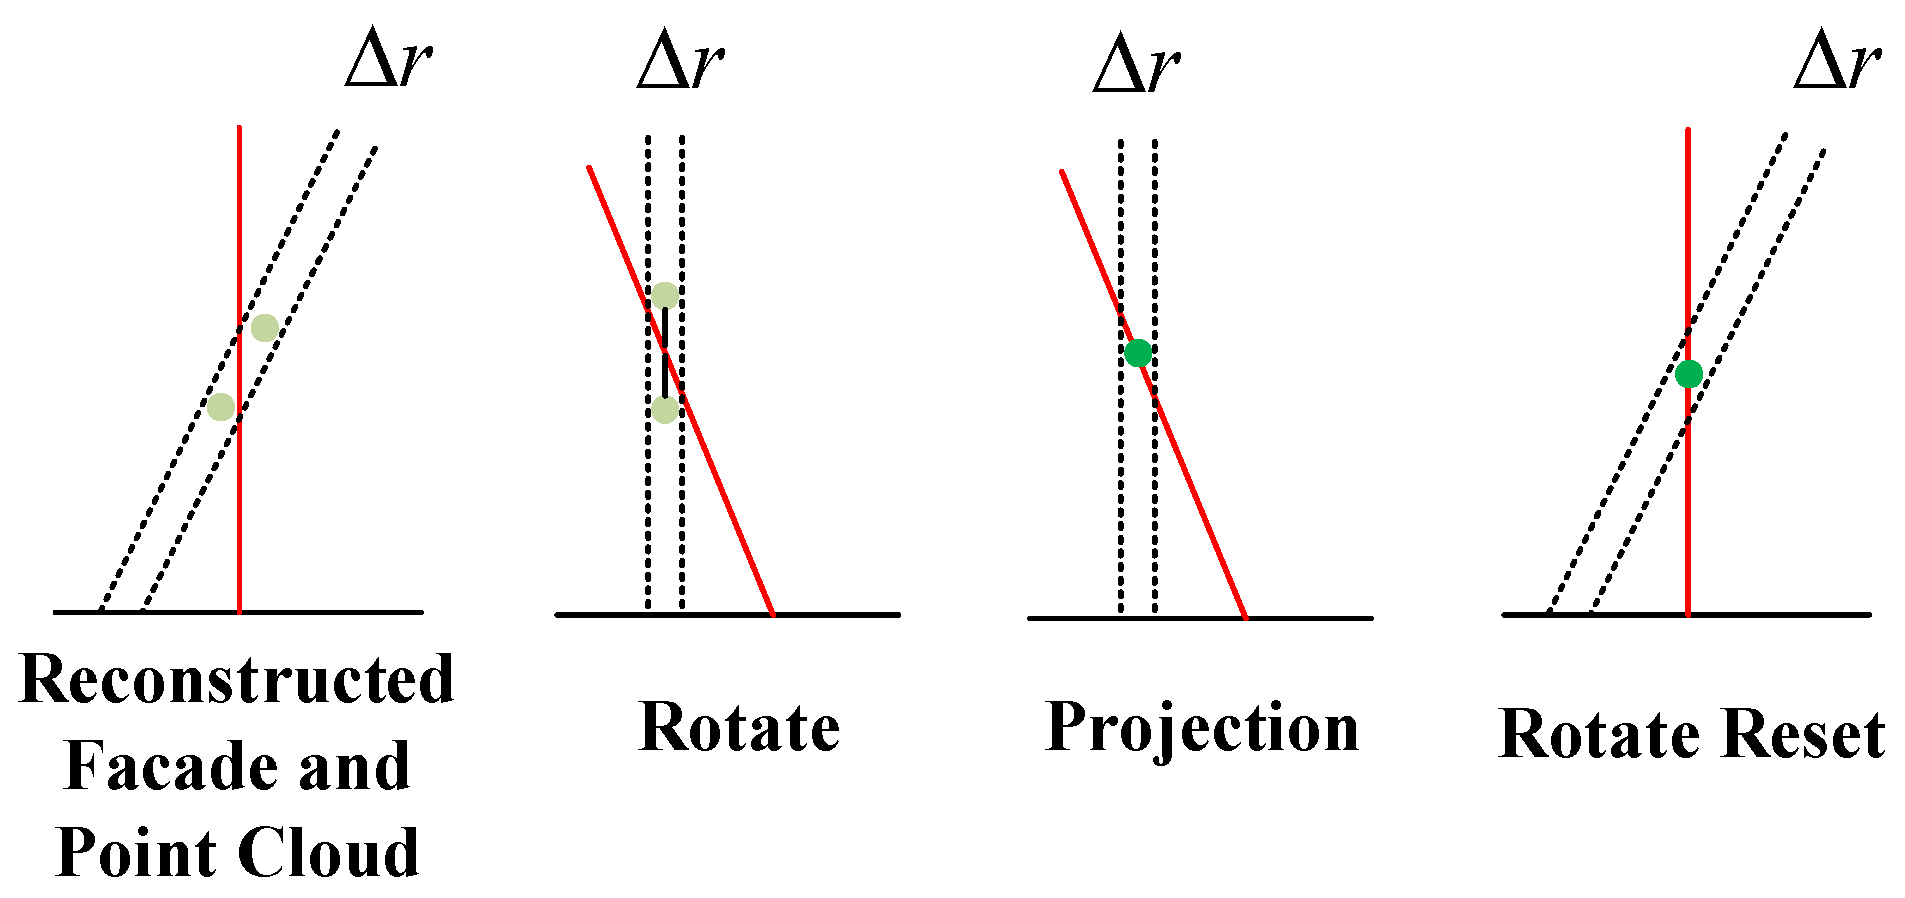
To resolve this, we propose a projection-based focusing strategy that re-aggregates scattered energy within the native radar coordinate system. As illustrated in Figure 4, the process comprises three stages:
(a) Transformation to Radar Coordinates: To align the processing domain with the direction of uncertainty, we first invert the geocoding process. Points in the Cartesian map domain (where denotes ground range) are transformed back to the slant range-elevation domain via the local incidence angle :
In this coordinate system, the -axis aligns perfectly with the direction of side-lobe dispersion, allowing for targeted correction.
(b) Anisotropic Sidelobe Compression: This is the critical step for distinguishing the floor structure. We first transform the reconstructed refined façade footprints into the radar slant range-elevation () system. Given that TomoSAR positioning uncertainty and side-lobe artifacts manifest primarily as energy dispersion along the elevation direction (-axis), we introduce a geometric regularization strategy. We enforce a constraint that projects each discrete scatterer along the -axis onto the nearest façade structure:
From a physical perspective, this operation effectively mitigates the “off-grid” artifacts inherent in the Compressed Sensing model. It is worth noting that while layover typically causes signal superposition in 2D SAR images, the TomoSAR inversion has already resolved these scatterers into distinct elevation positions. Therefore, this projection is applied to the 3D-resolved point cloud and is strictly constrained within a local buffer (e.g., 1.5 m) around the refined façade. This 1.5 m threshold is empirically determined based on the maximum side-lobe spread in our Ku-band system. Sensitivity analysis confirms that varying this buffer between 1.0 m and 2.0 m stably captures the main scattering energy without introducing significant background clutter. This constraint ensures that only valid façade scatterers are focused, while residual artifacts from the ground or adjacent structures are effectively excluded. It forces scattering energy—originally dispersed across different elevation bins due to side-lobe leakage—to re-aggregate at its true physical surface position. This step effectively severs the “crosstalk” between adjacent floors, sharpening the vertical density distribution from a locally “blurred dispersion” into distinct “multi-modal peaks” characteristic of floor levels.
(c) Coordinate Reset: Finally, the focused points are transformed back to the map coordinate system using the inverse of :
Following this processing, the structural clarity of the point cloud in the vertical direction is qualitatively improved, providing the necessary feature foundation for the subsequent accurate extraction of floor heights.
Figure 4.
Point cloud projection to reconstructed façade schematic diagram. The red line segments represent the azimuthal sectional view of the reconstructed façade. The light green dots are the initial reconstructed point cloud, and the green dots are the projected point cloud.
2.2.3. Floor Height Estimation via Global Coherent Integration and Spectral Analysis
Single-view TomoSAR point clouds inevitably suffer from data sparsity and local occlusions. To overcome these limitations, we propose a robust estimation strategy centered on Global Coherent Integration. By leveraging the horizontal periodic redundancy of building structures, this method projects the entire façade point cloud onto a unified vertical axis, thereby significantly boosting the signal-to-noise ratio. We then employ a “frequency-lag” dual-domain verification framework to precisely lock onto the average floor height. The procedure unfolds in three stages:
(a) Construction of Global Vertical Density Function: First, the projection-corrected façade points are aggregated globally along the vertical axis. We discretize the vertical space into bins of width and tally the point count in each interval to derive the global vertical density function :
where is the total number of points, and is the indicator function. To remove low-frequency trends associated with the building’s overall profile, detrending and Gaussian smoothing are applied to , isolating the zero-mean density fluctuation signal .
(b) Spectral Analysis for Coarse Estimation: In the frequency domain, the Fast Fourier Transform (FFT) is utilized to identify the fundamental frequency of these density fluctuations. To mitigate spectral leakage, we apply zero-padding before calculating the Power Spectral Density (PSD):
The primary peak spatial frequency in the spectrum corresponds to the dominant periodicity of the façade, offering a coarse initial estimate of the floor height, .
(c) Autocorrelation Refinement in Lag Domain: Acknowledging that the discrete FFT can be compromised by the Picket Fence Effect, which limits frequency resolution, we incorporate the Autocorrelation Function (ACF) in the lag domain for refinement. The ACF quantifies the signal’s self-similarity across varying vertical displacements :
We then search for the local maximum of in the vicinity of the coarse estimate . The final optimized floor height is determined as the lag value that maximizes autocorrelation:
By integrating the global perspective of spectral analysis with the high-resolution precision of lag-domain autocorrelation, this dual-strategy ensures robustness. It enables sub-meter accuracy in floor height estimation via global coherent accumulation, even when data for specific floors is severely fragmented.
2.3. Roof Geometric Correction and Linear Feature Extraction
Due to the side-looking geometry of SAR, raw roof point clouds suffer from systematic layover-induced displacement, where high-elevation structures appear shifted towards the sensor relative to their true nadir positions. Furthermore, fine semantic substructures, such as parapet walls, are often fragmented or obscured by speckle noise. To recover these details, we employ a two-stage strategy governed by imaging geometry constraints.
(a) Line-of-Sight (LOS) Geometric Rectification: To eliminate the height-dependent geolocation error, we apply a back-projection correction along the radar Line-of-Sight (LOS). Utilizing the local incidence angle and the estimated average roof height as constraints, discrete scatterers are re-mapped onto a reference horizontal plane:
Physically, this operation reverses the layover distortion, restoring the point cloud to its correct geographic coordinates. Beyond mere geometric correction, this process acts as a spatial consolidator: it compresses volume scattering energy—originally spread along the slant range—onto a focused 2D plane, significantly enhancing the Signal-to-Noise Ratio (SNR) of valid features. The corrected points are then rasterized into a high-resolution 2D density map .
(b) Morphological Linear Feature Extraction: In the density map , parapet walls and roof edges manifest as high-intensity but spatially discontinuous ridges. To isolate these semantically significant structures from background clutter, we introduce a morphological filtering approach rooted in the Manhattan World assumption [39].
We construct two orthogonal Linear Structuring Elements (SEs), aligned respectively with the building’s principal axes (longitudinal and transverse). A Morphological Opening operation is then performed to suppress noise while retaining structural connectivity:
This operation functions as a shape-selective filter: it eliminates isotropic noise spots smaller than the SE length while preserving strong scattering features that exhibit linear continuity. The extracted linear primitives serve as auxiliary geometric constraints, which are superimposed onto the final model to enrich the Level of Detail (LOD) 2 representation.
2.4. Orthogonal Contour Extraction via Directional Morphology
Despite geometric correction, TomoSAR point clouds remain spatially fragmented due to low SNR and non-uniform sampling. Traditional boundary extraction algorithms, such as Alpha Shapes [40], rely on isotropic distance constraints, presenting a dilemma for man-made structures: a small search radius leads to fragmented walls due to missing data, while a large radius causes over-smoothing, distorting the building’s orthogonal geometry. To resolve this, we propose a directional morphological reconstruction algorithm based on a Separation-of-Axes strategy, exploiting the “Manhattan” nature of urban architecture.
(a) Construction of Directional Structuring Elements: Unlike traditional isotropic disk kernels, we construct two orthogonal Linear Structuring Elements (SEs) strictly aligned with the building’s principal axes. Specifically, we define a Horizontal SE () and a Vertical SE () to analyze geometric connectivity along the X-axis and Y-axis, respectively. Both elements are modeled as line segments with a length of , where represents the maximum allowable gap threshold determined by the minimum scale of the building structure. The structural element length () is set based on typical urban architectural priors, where structural discontinuities (e.g., balconies or windows) usually span 1.0 to 2.0 m. Sensitivity analysis indicates that a smaller (e.g., 0.5 m) fails to bridge noise-induced signal gaps, resulting in fragmented contours. Conversely, an overly large (e.g., >3.0 m) causes over-smoothing, falsely merging valid architectural recesses and reducing the geometric fidelity.
(b) Separation-of-Axes Closing: We perform Morphological Closing separately in the two orthogonal directions on the binarized roof mask :
Physically, this acts as a direction-selective filter. can bridge collinear gaps along horizontal walls while halting at vertical recesses (e.g., light wells). This anisotropic behavior allows the algorithm to restore wall continuity while strictly preserving topological correctness.
(c) Fusion and Regularization: The final building envelope is derived from the logical union of the independent reconstruction results:
Through this fusion, the intersection of linear structures from different directions naturally forms sharp, right-angled corners, fundamentally avoiding the “corner filleting” effect common in Alpha Shapes. Finally, the outer boundary of is extracted and simplified to yield a regularized, semantically complete roof contour.
(d) Façade-Roof Fusion: To construct a watertight and geometrically consistent building footprint, we treat the high-SNR façade footprints as the geometric baseline and the extracted roof contours as supplementary. We bridge the spatial gaps between the façade endpoints and roof breakpoints by prioritizing the extension of the façade baseline. By constructing a Manhattan path (extending horizontally then vertically) to form intermediate inflection points, we achieve a seamless, orthogonal closure between the façade and the roof.
3. Results
3.1. Dataset Description and Experimental Setup
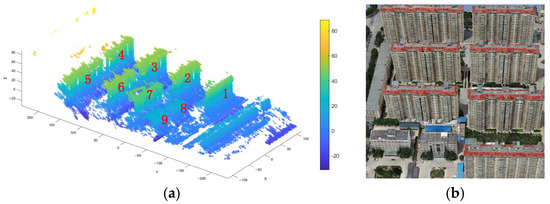
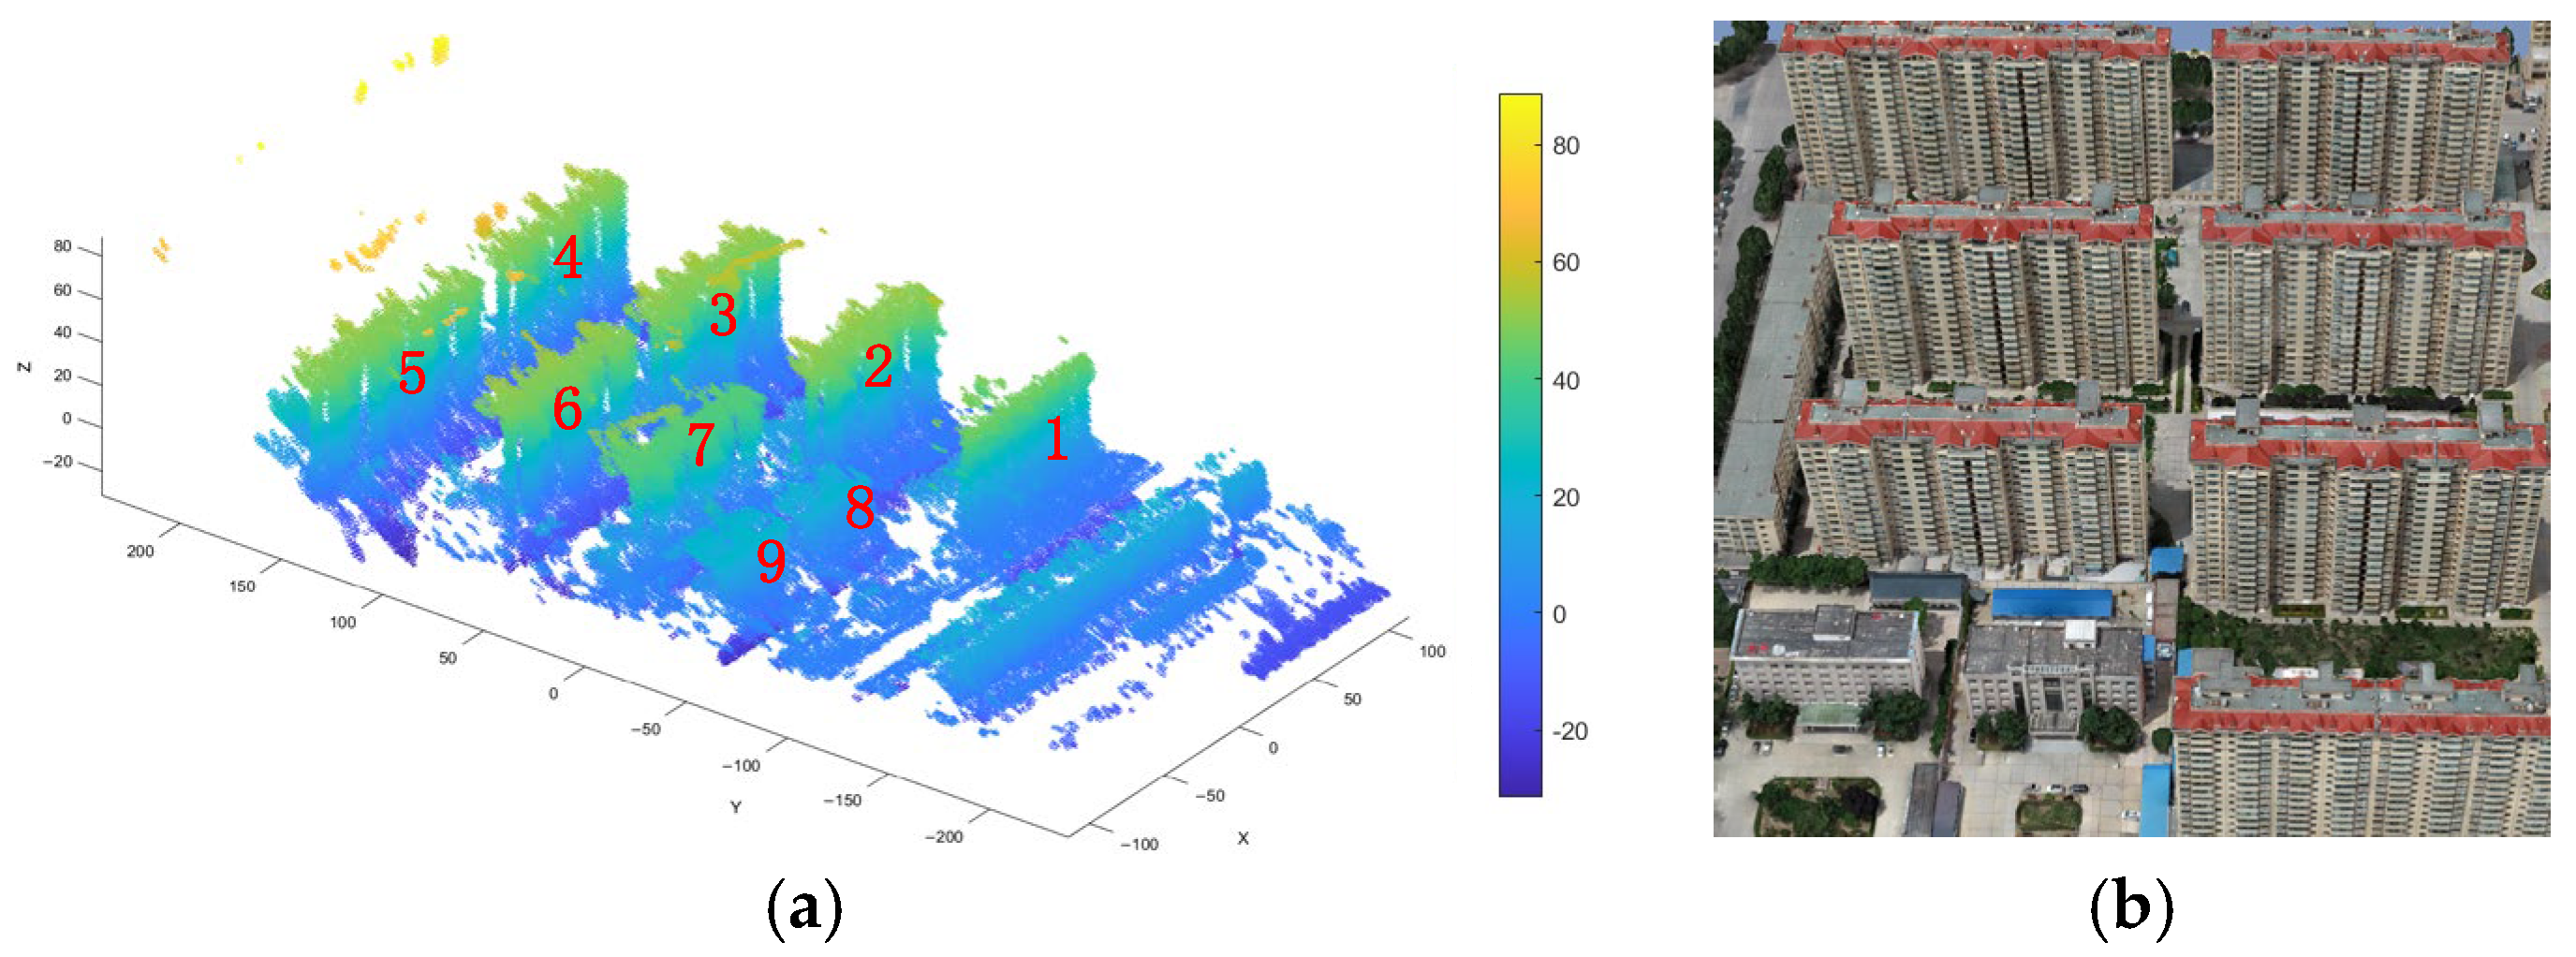
To comprehensively evaluate the proposed reconstruction framework, we utilized the publicly available SARMV3D-1.0 dataset [15]. Acquired over Yuncheng, Shanxi Province, China, this dataset was collected using an airborne array InSAR system operating in the Ku-band. The system’s high carrier frequency and wide bandwidth provide exceptional spatial resolution, enabling the capture of complex urban architectural structures with remarkable detail. For quantitative evaluation, a high-precision 3D mesh model of the same area, generated via Oblique Photogrammetry, served as the Ground Truth. With centimeter-level geometric accuracy and complete texture information, this model provides a reliable benchmark for assessing both the vertical accuracy of floor extraction and the horizontal fidelity of roof contours. A visual comparison between the raw TomoSAR point cloud and the ground truth model is presented in Figure 5.
Figure 5.
Overview of the experimental dataset in Yuncheng, China. (a) 3D visualization of the airborne TomoSAR point cloud for the residential building complex, colored by elevation. The red numbers indicate the unique Building IDs evaluated in the subsequent quantitative analysis. (b) Corresponding high-resolution oblique photogrammetry model serving as the ground truth for geometric verification.
Prior to reconstruction, we implemented a preprocessing workflow to isolate individual buildings from the large-scale scene. Ground points were first removed using a Simple Morphological Filter (SMRF) [41] constrained by local elevation. Subsequently, the Density-Based Spatial Clustering of Applications with Noise (DBSCAN) [42] algorithm was applied to segment non-ground points into independent building instances (Figure 6). By analyzing the vertical gradient of projection density, we further separated the façade points from the roof points for each instance. This process yielded 11 single-building point clouds with sufficient Signal-to-Noise Ratio (SNR), serving as the input for the core algorithm.
Figure 6.
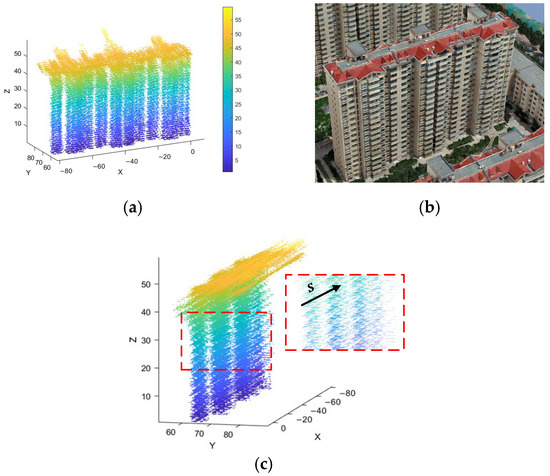
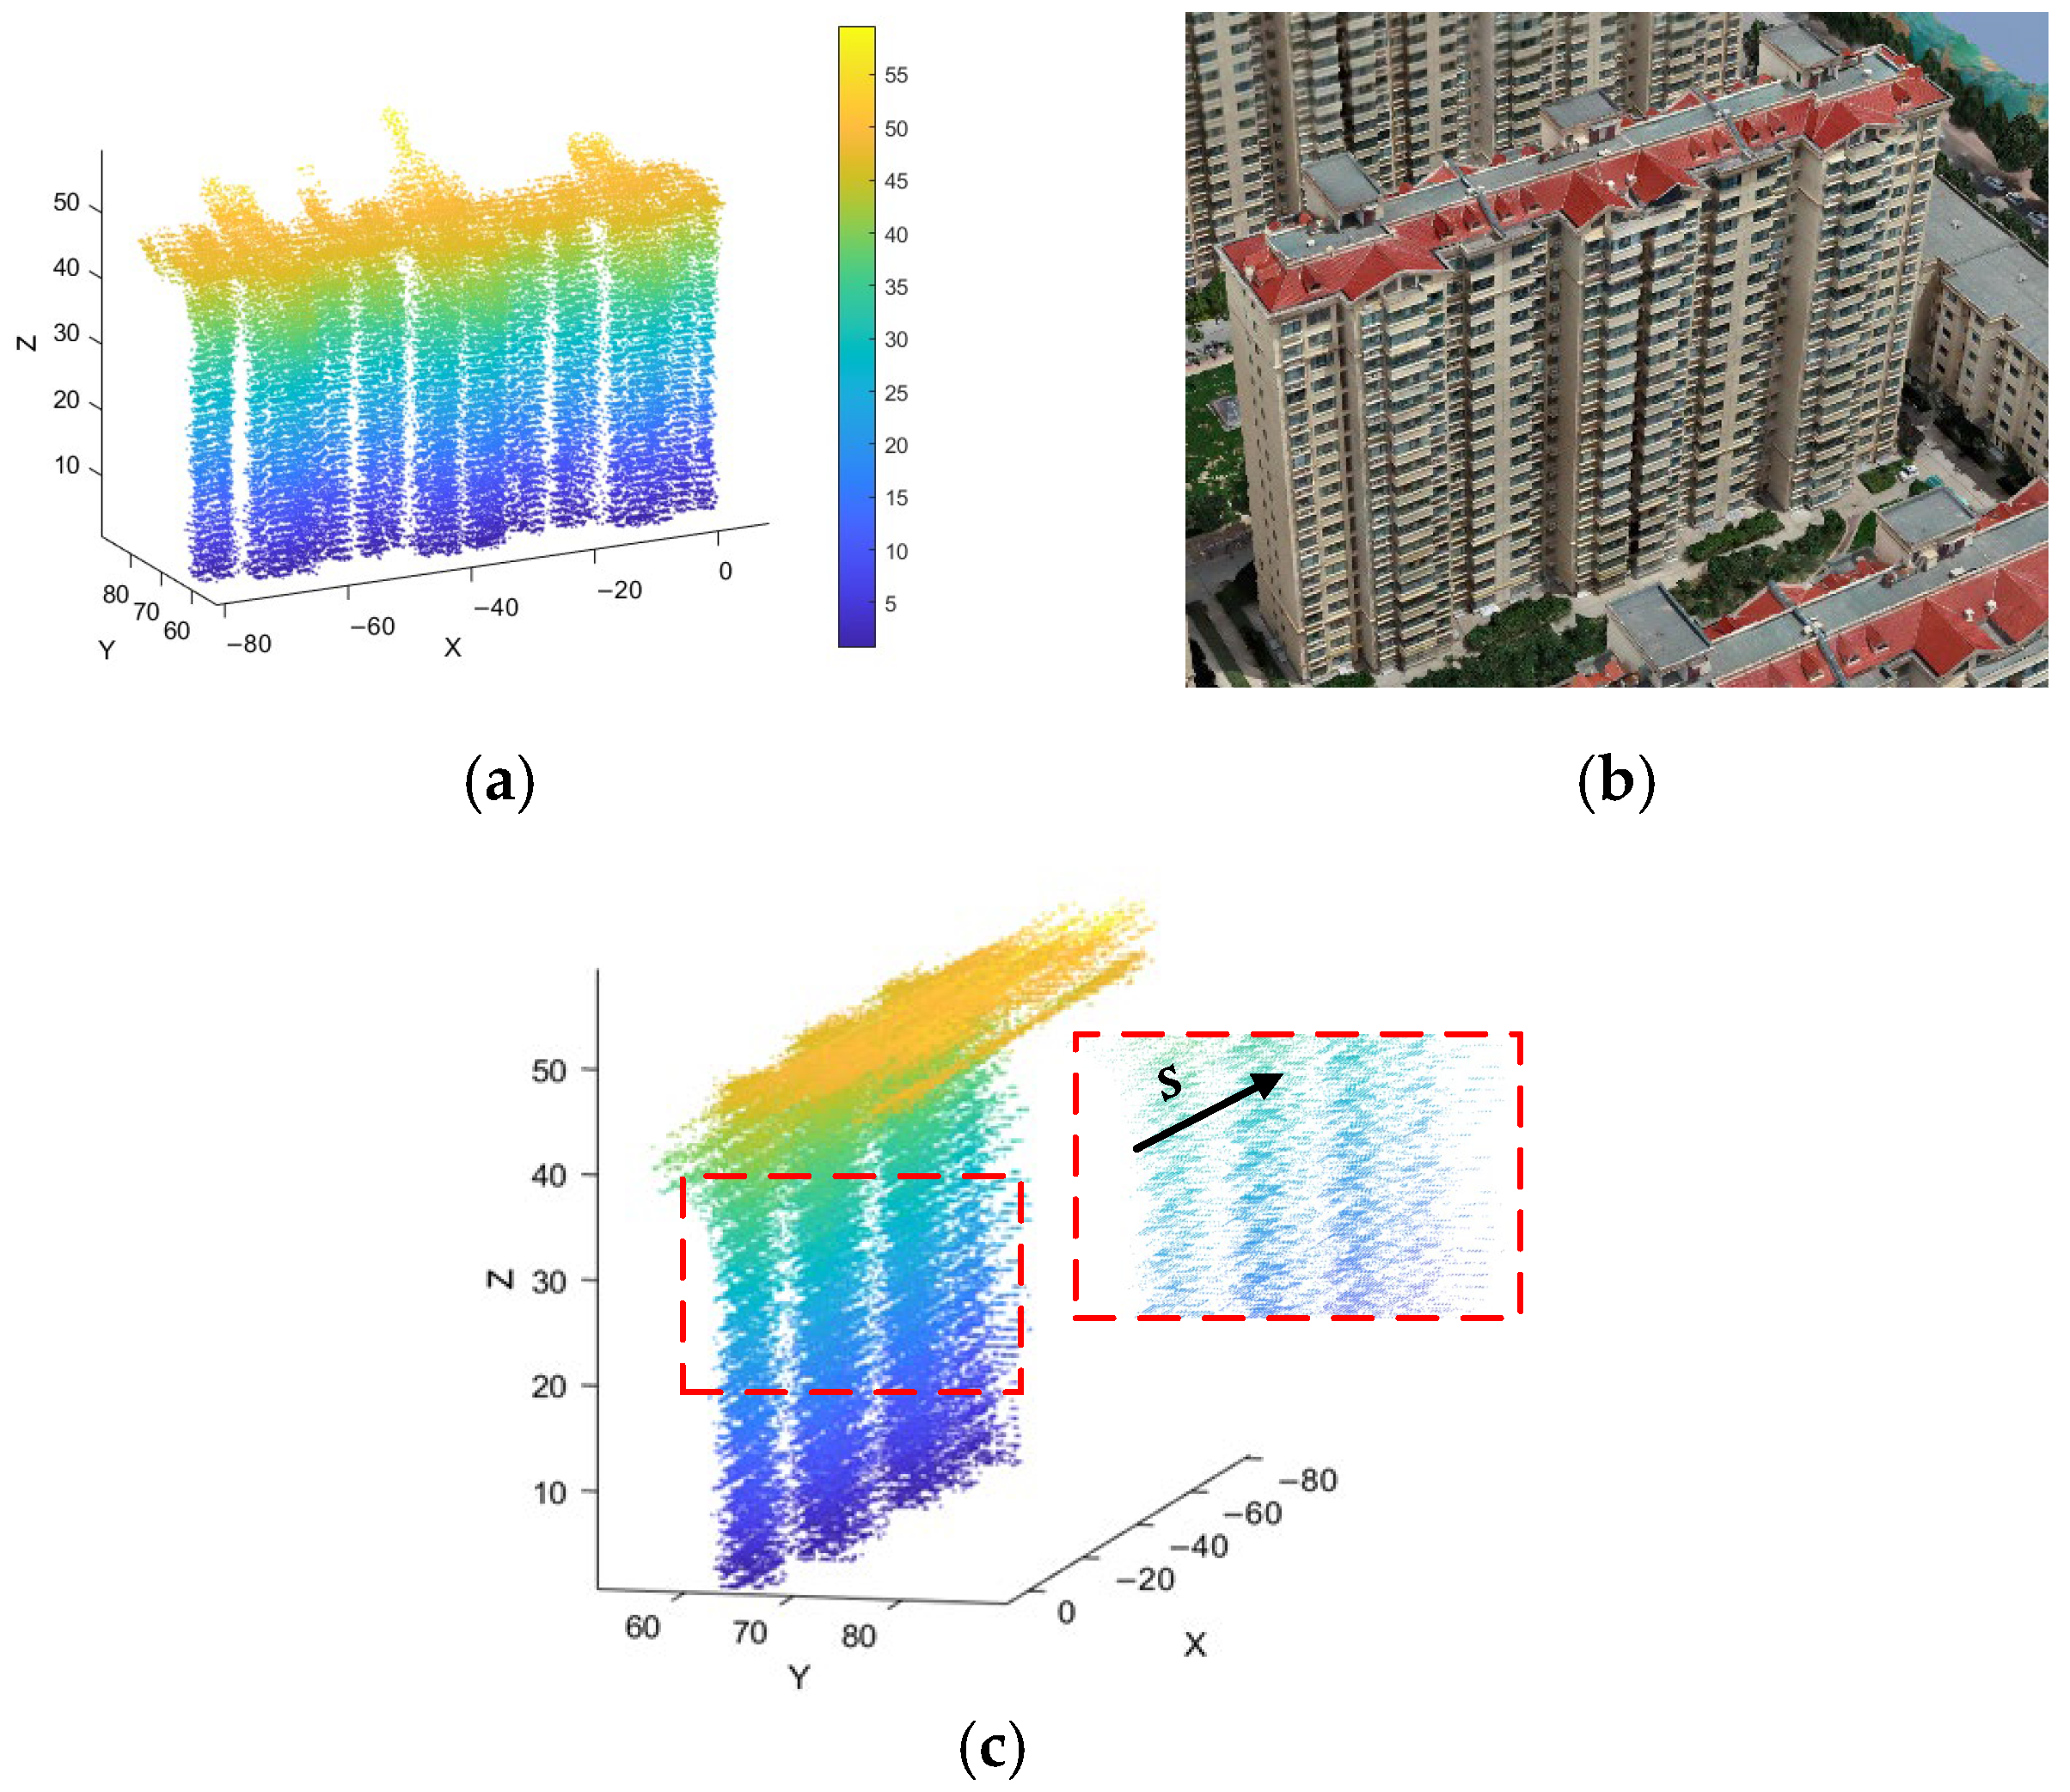
Visualization of a representative single building extracted from the dataset. (a) The isolated TomoSAR point cloud colored by elevation. (b) The corresponding high-resolution oblique photogrammetry model used as the ground truth reference. (c) 3D visualization of the façade point cloud illustrating the energy dispersion phenomenon. The red dashed box highlights a zoomed-in view of the wall structure.
To further investigate the impact of imaging geometry on structural details, we analyzed the cross-sectional profile of the building façade, as shown in Figure 6c. In an ideal scenario, the façade points should form a thin, vertical line. However, the observed point cloud exhibits significant ‘thickening’ and blurring. As visualized in Figure 6c, the raw TomoSAR point cloud suffers from severe side-lobe interference. The zoomed-in view reveals that the scattering energy is not localized but smeared along the elevation direction, forming diagonal striations that compromise the extraction of fine-grained floor heights. This visual evidence confirms that the vertical blurring is primarily caused by side-lobe leakage and the specific tomographic viewing geometry, underscoring the necessity of the geometry-constrained focusing strategy proposed in Section 2.2. It should be noted that the detailed point cloud processing and morphological reconstruction steps illustrated from Figure 6, Figure 7, Figure 8, Figure 9, Figure 10, Figure 11, Figure 12 and Figure 13 are demonstrated using Building ID 6 as a representative example.
3.2. Vertical Structure Reconstruction and Floor Height Estimation
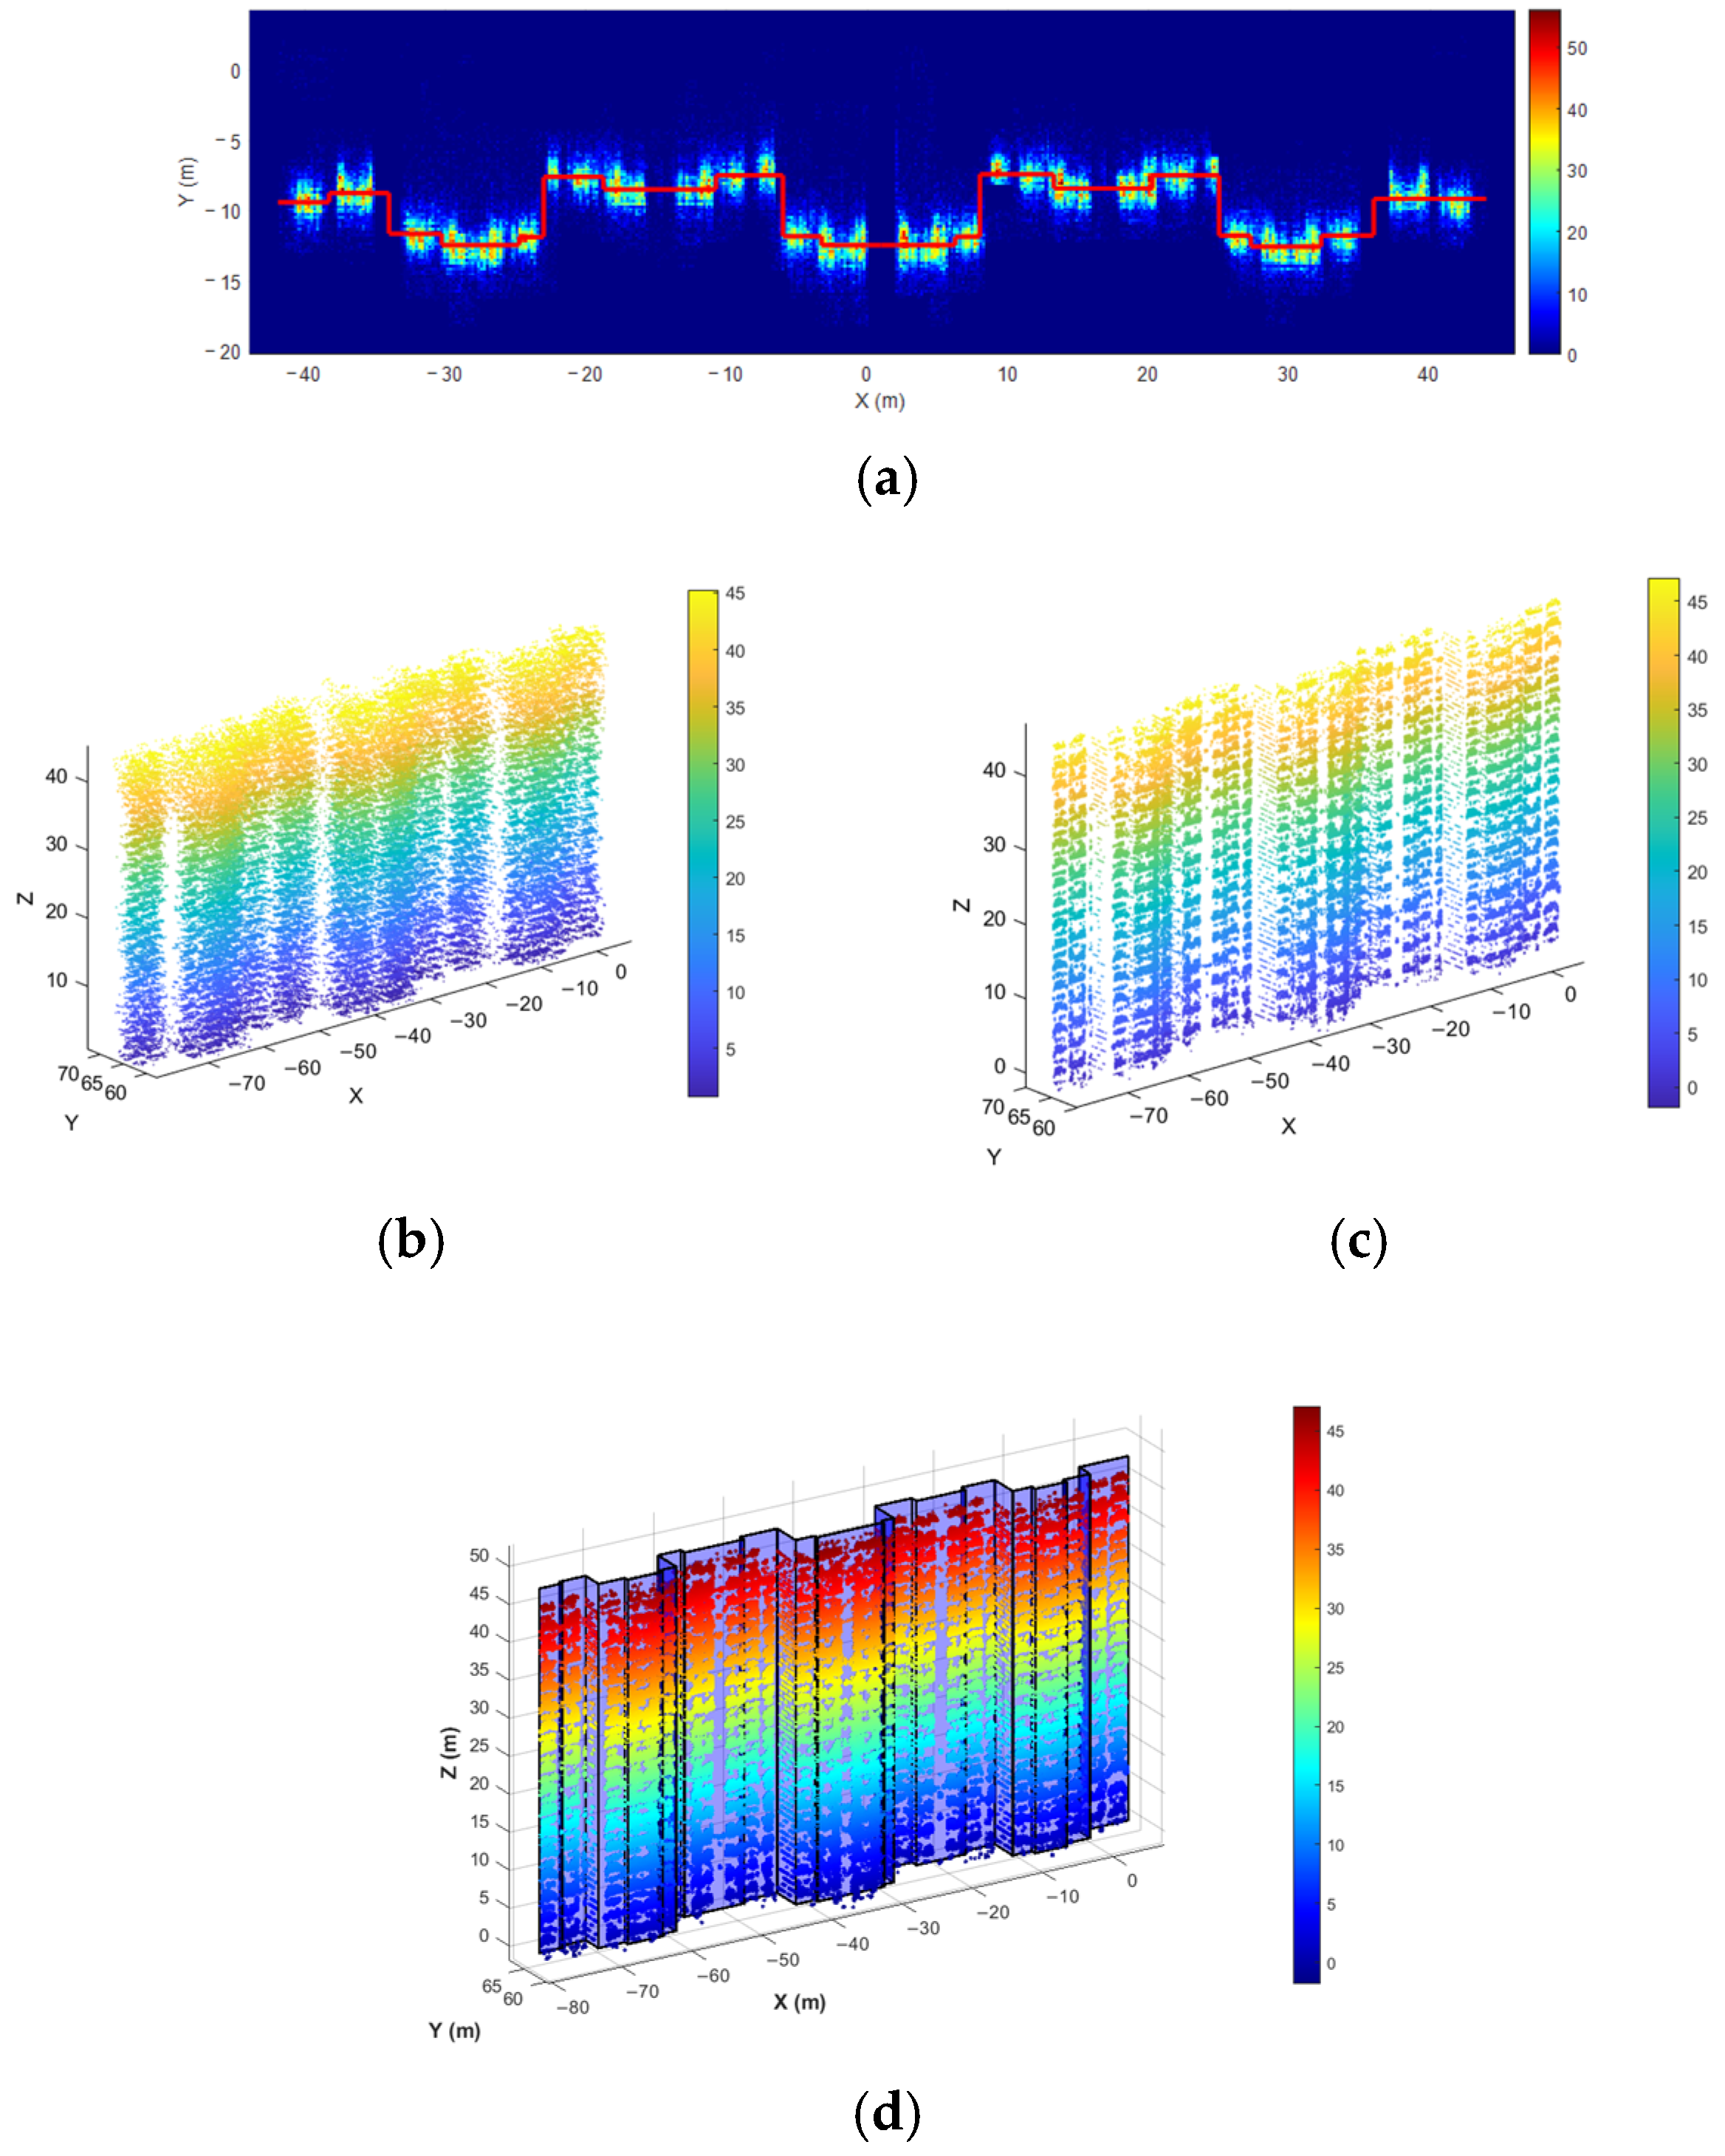
To qualitatively validate the proposed reconstruction strategy, Figure 7 illustrates the complete workflow from footprint extraction to geometric modeling. To generate precise geometric constraints for vertical focusing, we first extracted the building’s 2D baseline. As visualized in Figure 7a, the façade point cloud was projected onto the ground plane and rasterized into a spatial density map. Unlike raw point distributions which are susceptible to outliers, this density-based representation highlights the high-confidence scattering centers (indicated by warm colors). Based on this robust signal distribution, the refined façade footprint (red line) was extracted using an adaptive regularization strategy, ensuring a noise-resilient geometric basis for the subsequent inverse projection. Figure 7b,c provide a comparative visualization of the projection effect. The raw TomoSAR point cloud (Figure 7b) inherently suffers from side-lobe interference, resulting in a “thick” and diffuse distribution that obscures structural details. In contrast, by applying the inverse projection constrained by the extracted footprint, the point cloud in Figure 7c is physically “condensed” onto its true geometric plane. This operation effectively suppresses the spatial dispersion, significantly improving the definition of the vertical structure. And Figure 7d presents the overlay of the generated vector model with the focused point cloud. The strict spatial alignment between the reconstructed planes and the point clusters confirms the geometric fidelity of our method, providing a reliable geometric basis for the subsequent floor height estimation.
To validate the necessity of using refined footprints over simple planar assumptions, we benchmarked our method against the widely used RANSAC plane-fitting algorithm.
Figure 7.
Step-by-step visualization of the fine-grained façade reconstruction process. (a) Projective density map of the façade point cloud, where warm colors indicate high scatterer concentration. The red lines represent the final regularized footprint extracted from this distribution. (b) 3D view of the raw TomoSAR point cloud, exhibiting significant thickness due to side-lobe dispersion. (c) 3D view of the projected point cloud after applying geometric focusing, showing a sharpened, planar distribution. (d) Superimposition of the final reconstructed façade model (planes) with the focused point cloud, verifying spatial alignment.
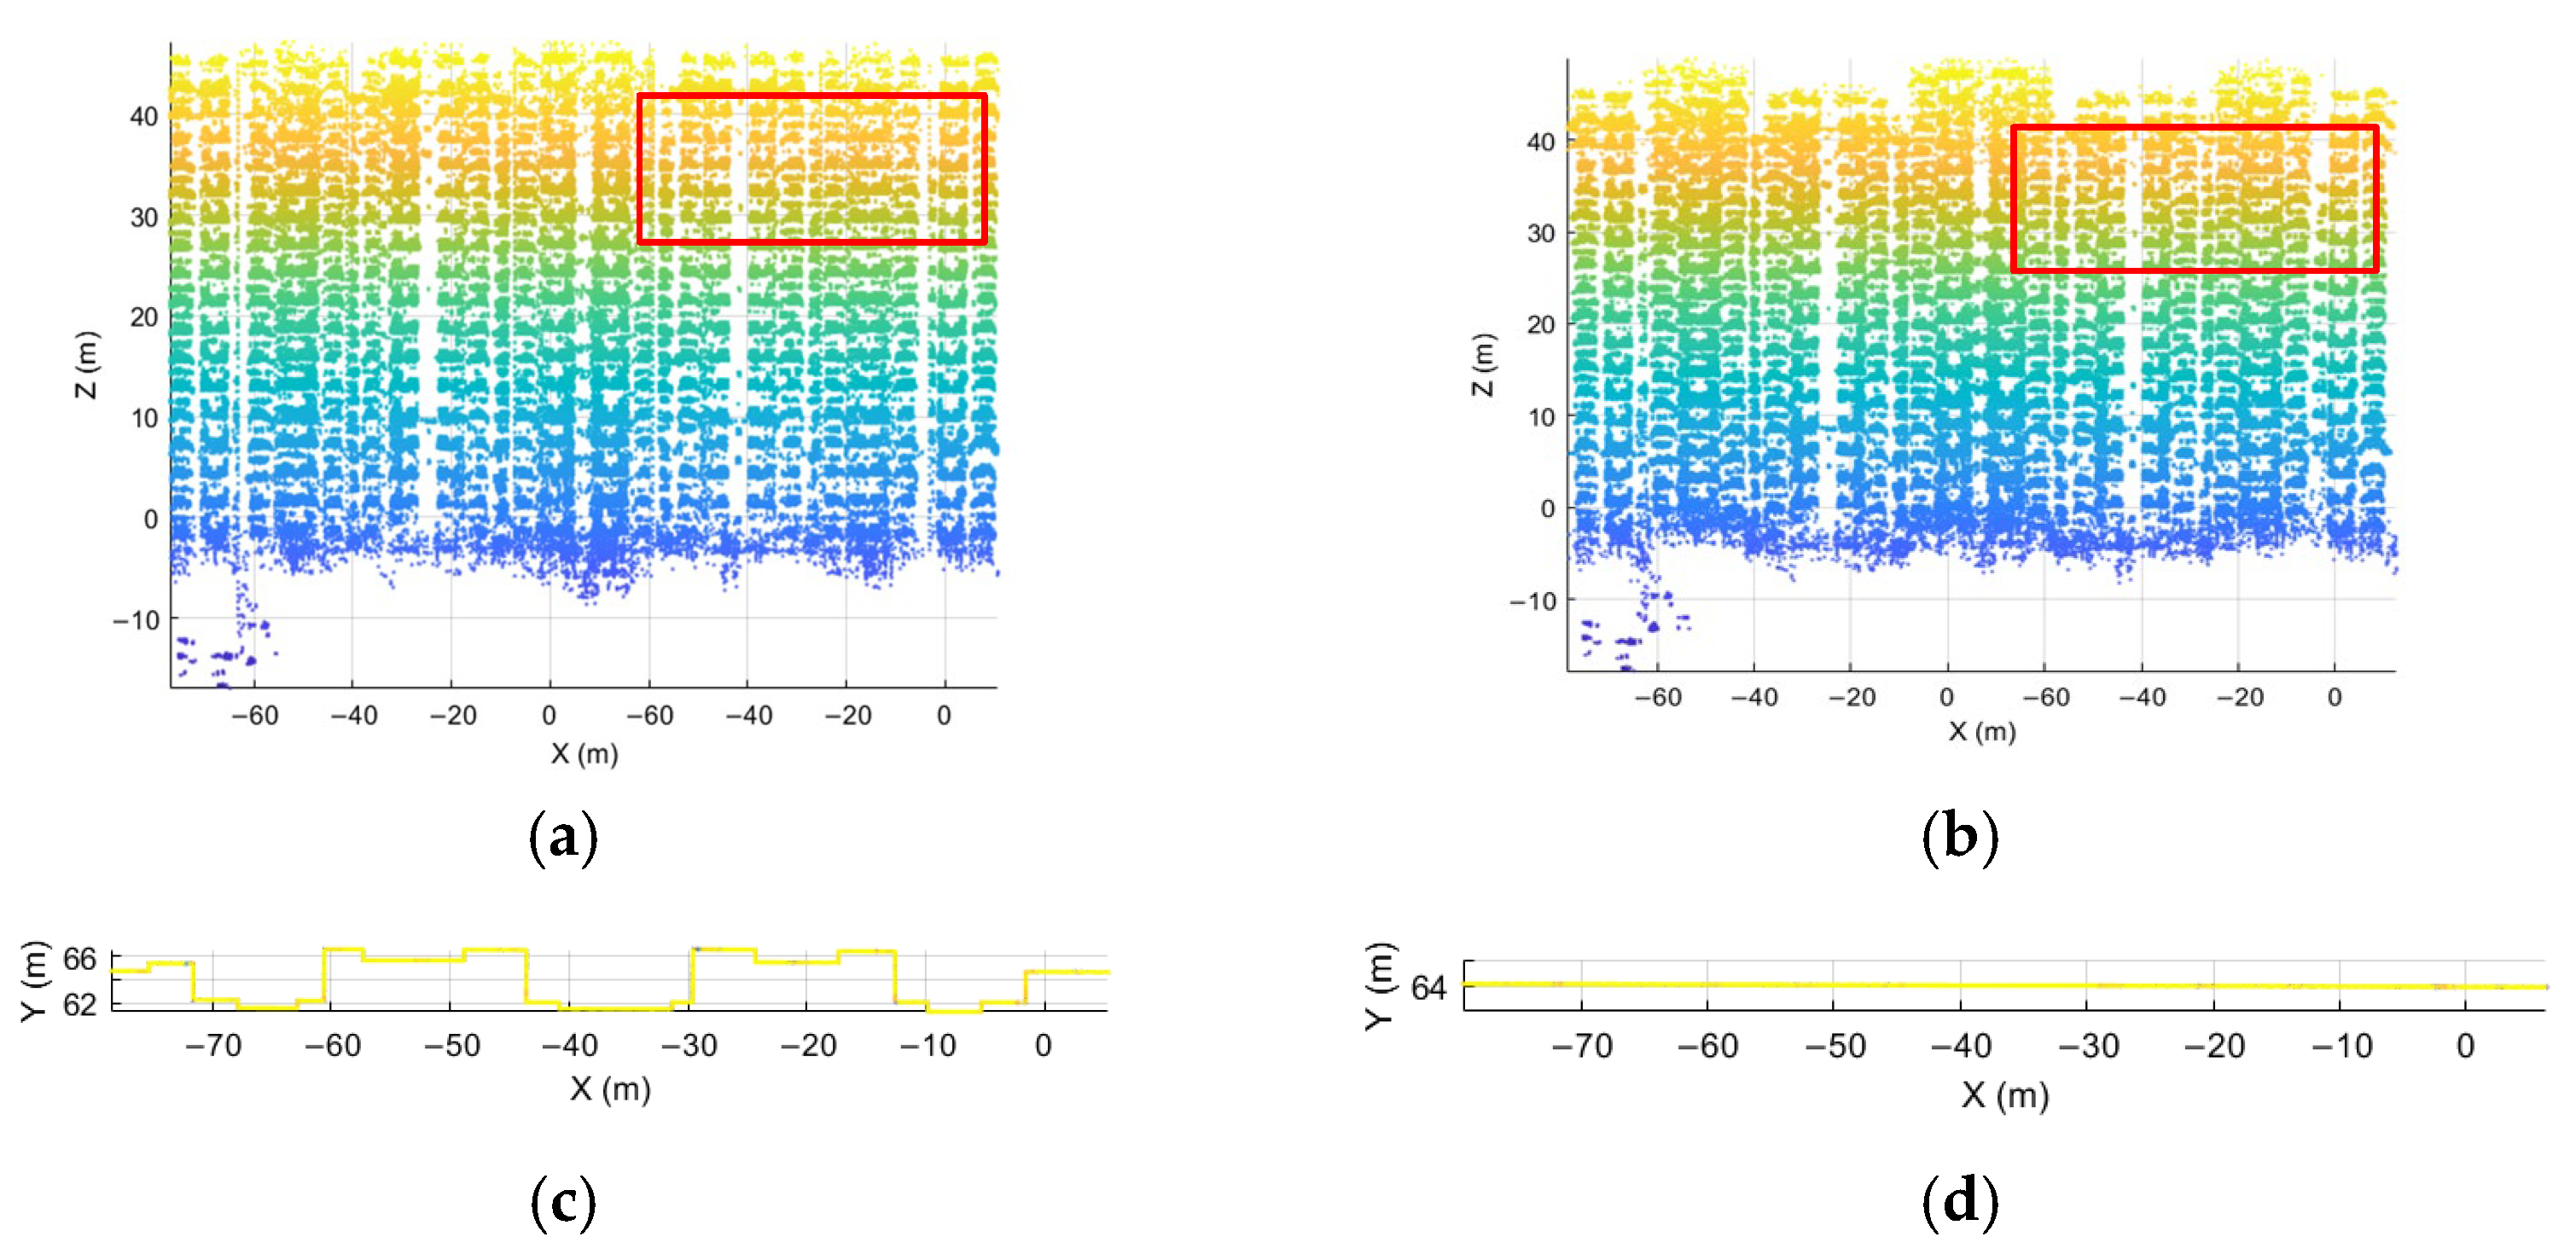
As observed in Figure 8b, the traditional RANSAC approach enforces a rigid planar constraint, inevitably ignoring local geometric undulations (such as bay windows or slight wall recesses). Consequently, when points are projected onto this ill-fitted plane, their vertical coordinates suffer from spatial misalignment, causing the point cloud to appear “foggy” and reducing the contrast between floors. In contrast, the result based on our refined façade footprints (Figure 8a) exhibits superior structural fidelity. By adaptively matching the projection surface to the building’s true footprint, the scattering energy is physically concentrated. Crucially, the empty spaces between floors—which are vital indicators for floor separation—are sharply preserved rather than being filled by misaligned noise. This high-contrast vertical profile provides a much cleaner signal input for the subsequent global coherent integration. To quantitatively demonstrate this advantage, we compared the floor height estimation using Building 3. The projection based on the RANSAC-fitted plane yielded a less distinct frequency peak, resulting in an absolute height error of approximately 0.45 m. In contrast, our geometry-constrained projection sharpened the periodic signal, significantly reducing the absolute error to 0.16 m (as detailed in Table 1), concretely validating the superiority of the proposed framework.
Table 1.
Quantitative accuracy assessment of floor height estimation and roof contour extraction across representative building samples.
With the inter-story signal voids clearly resolved, the focused vertical profiles provide a robust feature basis for the subsequent frequency-domain analysis. To quantitatively validate the floor height estimation, we selected 9 representative buildings within the experimental area (7 residential buildings with a reference height of 2.83 m, and 2 public buildings with a reference height of 3.50 m). Quantitative results, summarized in Table 1, demonstrate that our method achieves robust estimation accuracy across all samples. The estimated heights align closely with the ground truth, yielding an overall Mean Absolute Error (MAE) of 0.106 m and a Mean Relative Error (MRE) of 3.62%. Notably, even for Building 1, which exhibited the largest deviation (absolute error 0.26 m), the accuracy remains within a reasonable range, confirming the method’s capability to recover sub-meter building semantics from high-resolution airborne TomoSAR data. Notably, Building ID 1 exhibits a relatively larger estimation error (0.26 m). This deviation is primarily attributed to severe data sparsity and occlusion in the raw TomoSAR data for this specific instance. Specifically, the point cloud for Building 1 suffers from substantial missing parts, including an almost completely missing roof and a highly incomplete façade. Because our floor height estimation relies on global coherent integration, the lack of sufficient structural scatterers weakens the periodic signal strength, leading to a minor shift in the globally averaged frequency peak.
Figure 8.
Comparative validation of geometric focusing strategies. (a) Point cloud projected onto the proposed refined façade footprints, demonstrating distinct inter-story separation and preserved vertical structure. (b) Point cloud projected onto a RANSAC-fitted plane, exhibiting indistinct inter-story separation and vertical blurring due to geometric mismatch. (c) Top view of the proposed projection, illustrating how the refined footprint accurately preserves the concave-convex fluctuations. (d) Top view of the RANSAC projection, showing the façade over-simplified into a rigid flat plane.
To quantitatively evaluate the geometric fidelity of the extracted roof contours, we calculated the Intersection over Union (IoU) metric for the same nine representative buildings evaluated in Section 3.2. As shown in the rightmost column of Table 1, the proposed directional morphological reconstruction achieves a high overall average IoU of 89.98%. Notably, Building ID 1 exhibits a relatively lower IoU (70.4%). This is primarily due to severe data sparsity and significant missing parts in the raw roof point cloud for this specific instance, which fundamentally limits the completeness of the extracted contour. Nevertheless, for buildings with adequate data coverage, the IoU consistently exceeds 90%, confirming our framework’s capability to extract highly accurate and topologically complete building envelopes from sparse TomoSAR data.
3.3. Roof Geometric Correction and Contour Extraction
To intuitively demonstrate the impact of the side-looking imaging geometry, we superimposed the TomoSAR point clouds onto the high-resolution oblique photogrammetry image.
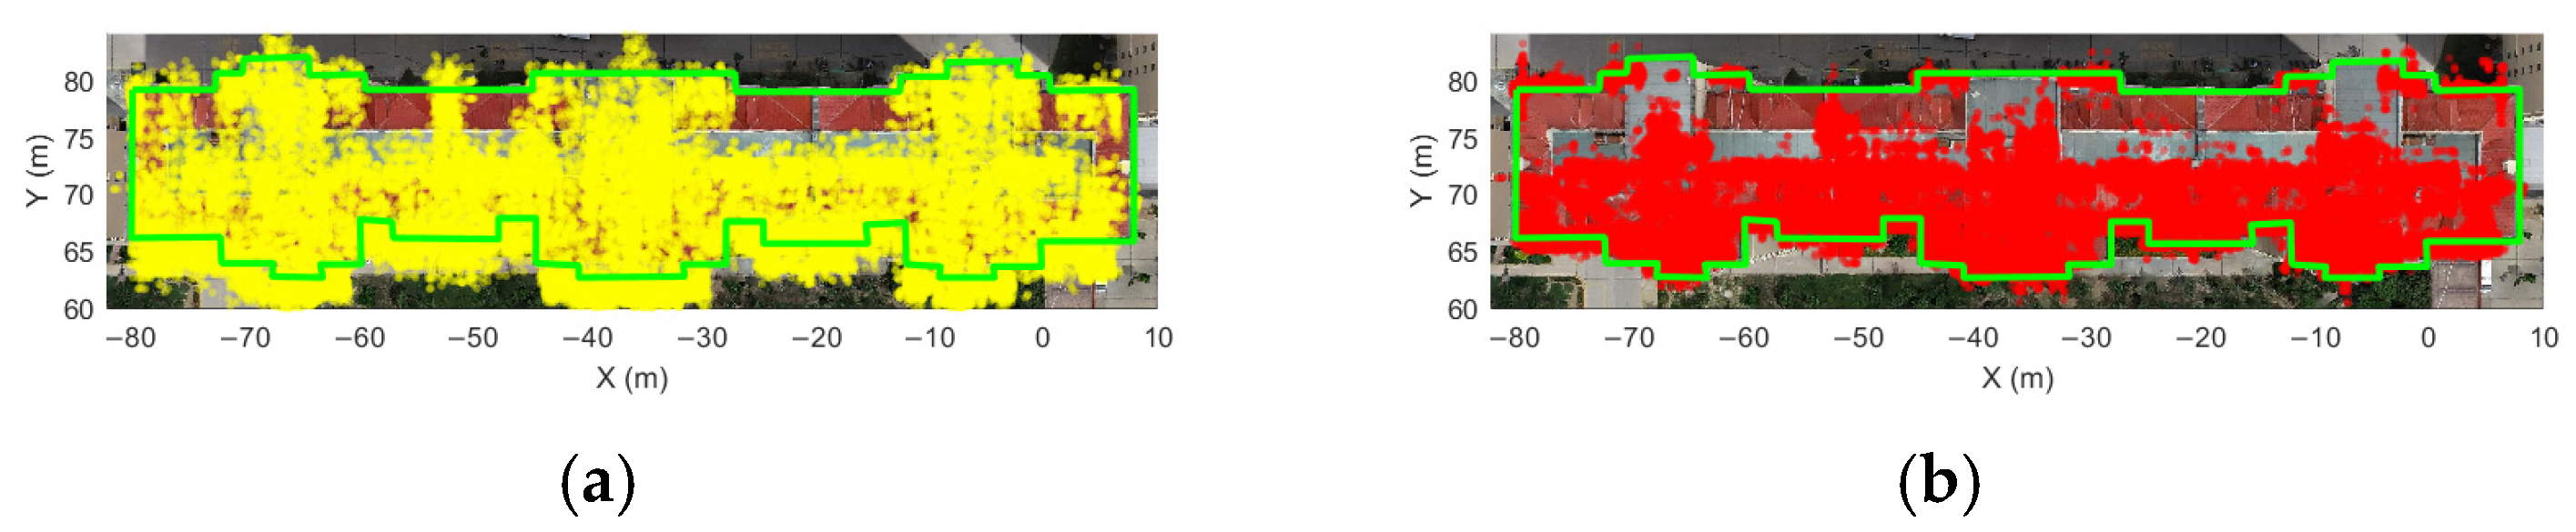
As illustrated in Figure 9a, the raw roof points (yellow clusters) exhibit a substantial systematic deviation from the ground truth building contour (green line). This phenomenon, known as “layover-induced displacement,” causes the roof points to shift towards the radar sensor, resulting in a significant mismatch with the actual physical footprint. If left uncorrected, this distortion would inevitably lead to erroneous geometric extraction. Figure 9b presents the result after applying our LOS-based projection. The corrected point cloud (red clusters) has been “restored” to its true geographic position, showing a high degree of spatial concordance with the reference green contour. This precise alignment confirms that the proposed geometric correction effectively eliminates the systematic positioning error, satisfying the accuracy requirements for the subsequent contour extraction.
Figure 9.
Visual validation of the LOS-based geometric correction for roof points. (a) Superimposition of the raw roof point cloud (yellow) and the ground truth contour (green line) on the oblique photogrammetry image. A significant systematic displacement is observable due to the layover effect. (b) Superimposition of the corrected point cloud (red) and the ground truth (green line). The projected points align precisely with the physical building boundary.
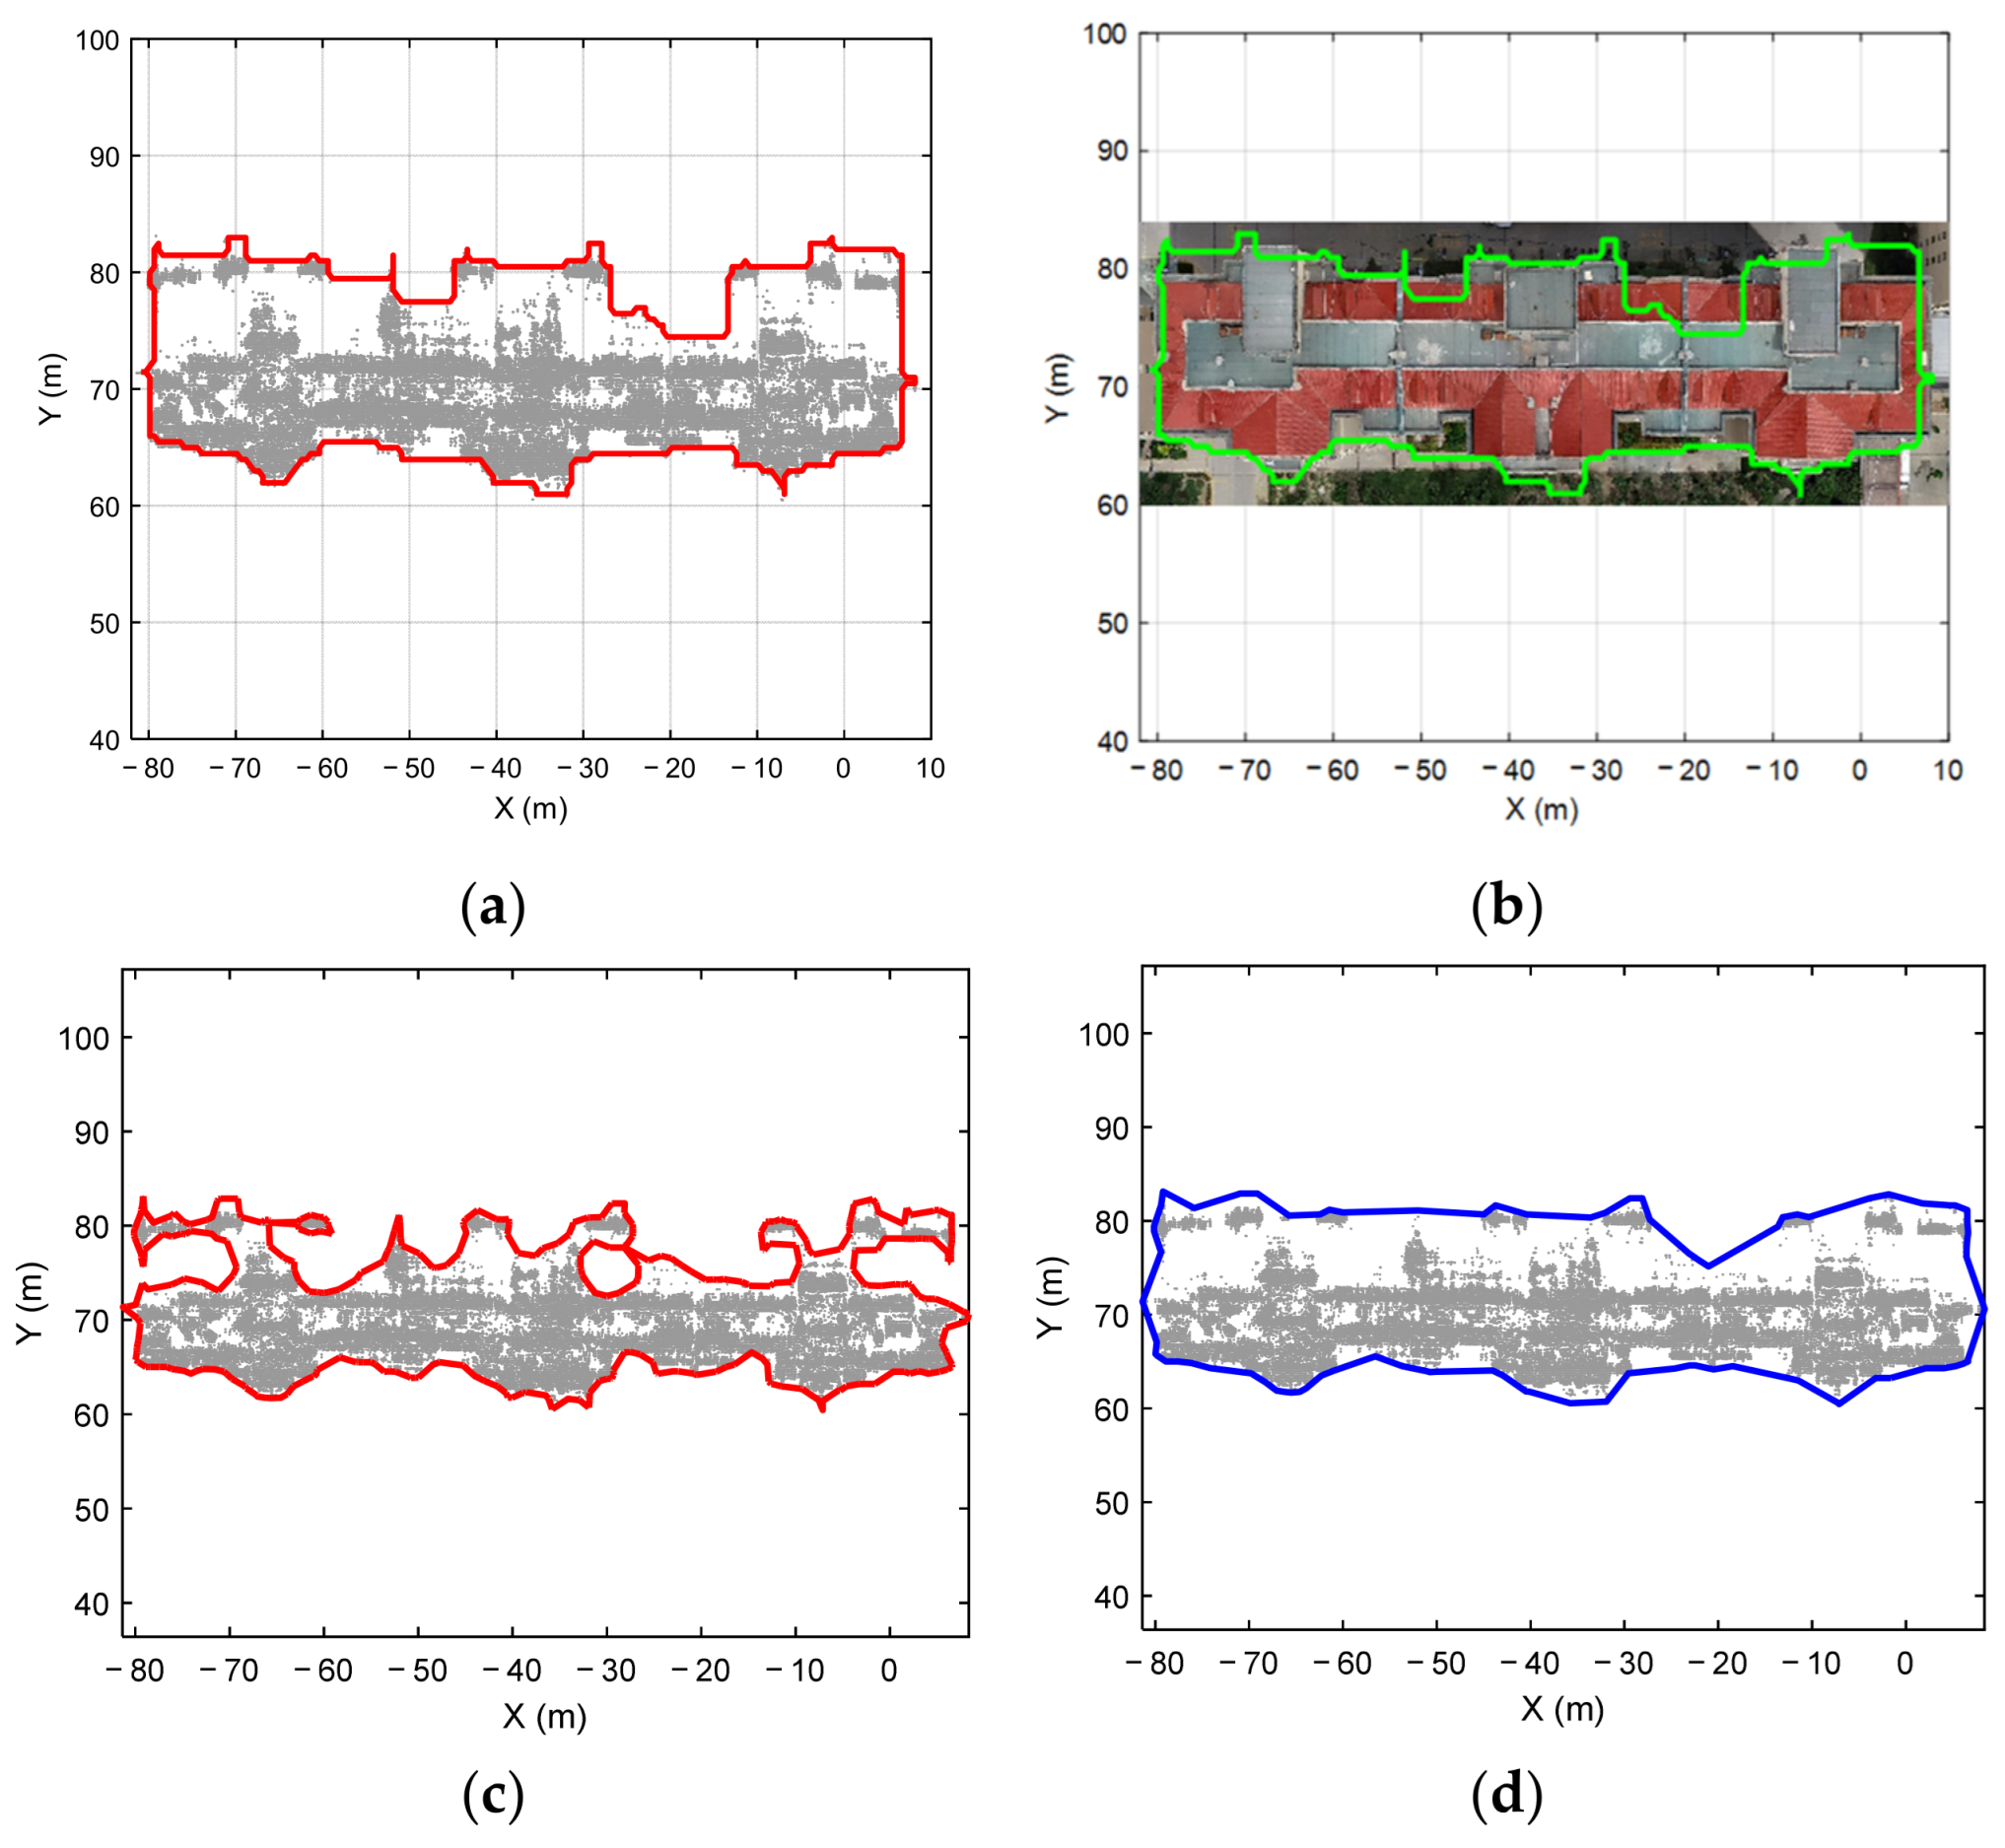
To benchmark the performance of the proposed framework, we compared it against the classic Alpha Shapes algorithm. The results, presented in Figure 10, highlight the limitations of traditional isotropic methods when handling sparse TomoSAR data. As observed in Figure 10c, when a small search radius is applied, Alpha Shapes fails to bridge the signal gaps caused by specular reflections, resulting in a fragmented and jagged boundary (under-segmentation). Conversely, increasing the search radius to close these gaps triggers the opposite problem: as shown in Figure 10d, the algorithm indiscriminately smooths over structural details, leading to the “filleting” of characteristic right-angled corners and the erroneous closure of internal concave features (over-smoothing).
In stark contrast, our Directional Morphological approach (Figure 10a) successfully resolves this dilemma. By employing the separation-of-axes strategy, it effectively spans long data gaps along the wall directions while rigorously preserving the orthogonality of the corners. The validation against the ground truth in Figure 10b confirms that our method yields a semantically complete and geometrically accurate building footprint, devoid of the artifacts common to isotropic filtering.
Figure 10.
Comparative evaluation of roof contour extraction algorithms. (a) Contour extracted by the proposed Directional Morphological Reconstruction (red line), showing a regularized and complete boundary. (b) Overlay of the proposed result (green line) on the ground truth, demonstrating high semantic fidelity. (c) Result of Alpha Shapes with a small radius (red line), exhibiting severe fragmentation and jagged edges due to data sparsity. (d) Result of Alpha Shapes with a large radius (blue line), showing significant “corner filleting” and loss of orthogonal details.
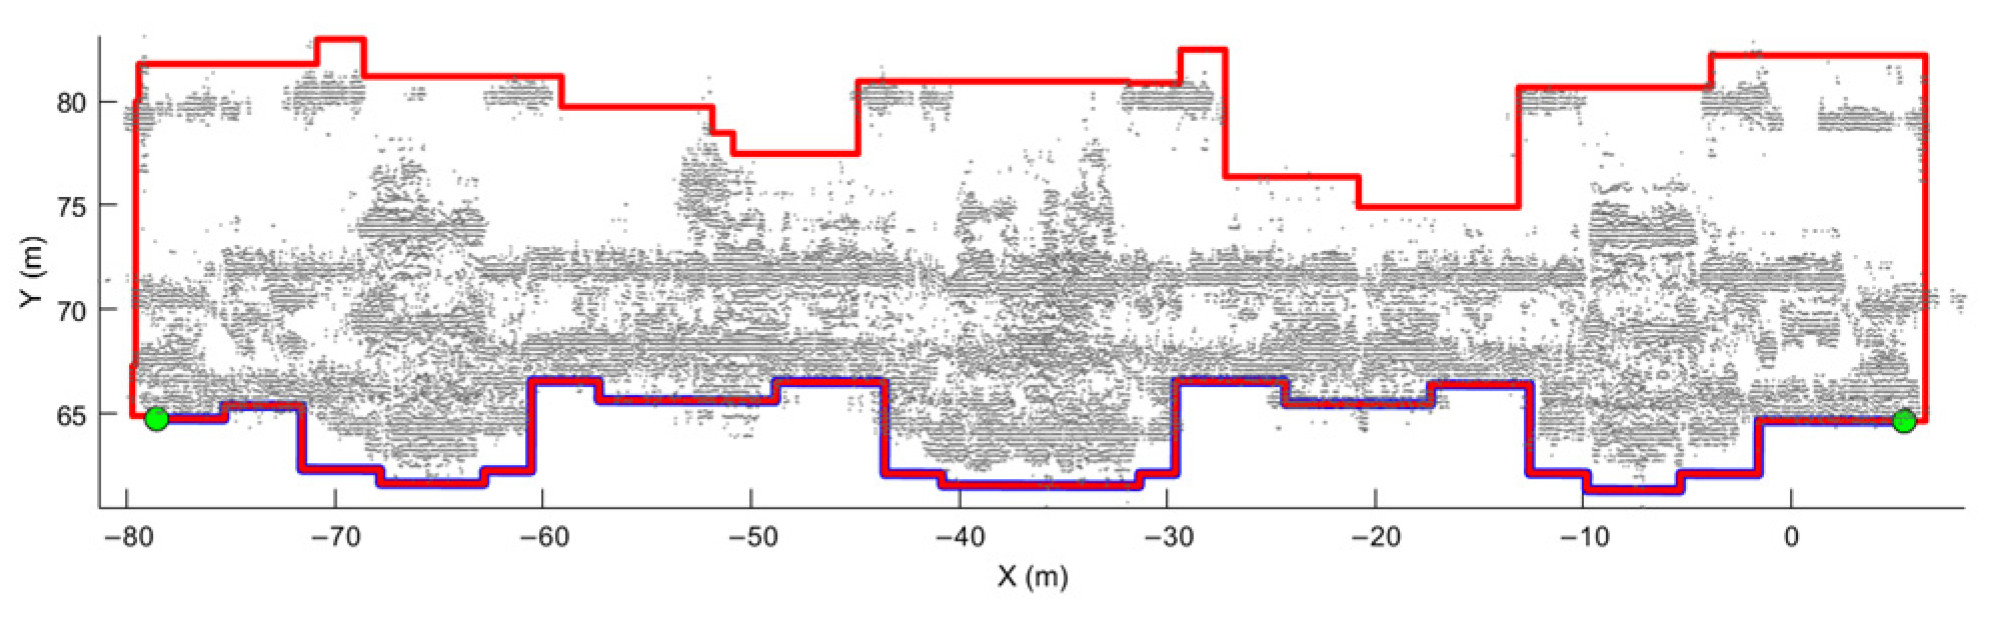
Although the morphological approach yields orthogonal contours, minor artifacts may persist due to local noise. To address this, we implemented a regularization step, forcibly merging non-physical edge segments shorter than 0.5 m. This threshold is selected based on the minimum physical dimension of typical roof appendages (e.g., small chimneys or vents). Sensitivity tests indicate that values between 0.3 m and 0.7 m yield topologically consistent results, proving the algorithm’s robustness to minor parameter perturbations. Subsequently, to construct a topologically closed model, we performed the Façade-Roof Fusion. As visualized in Figure 11, we treat the high-SNR façade footprint (blue line) as the “Master” geometric baseline and the roof contour (red line) as the “Slave”. By prioritizing the extension of the façade baseline and constructing a Manhattan path at the connection points (marked by green dots), we achieved a seamless fusion. This process not only repairs the spatial gaps between the façade and the roof but also ensures the strict geometric water-tightness of the final building footprint.
Figure 11.
Final building contour generation via regularization and fusion. The extracted roof boundary is first regularized to remove short artifacts (red line). It is then fused with the façade footprint (blue line), which serves as the geometric baseline. The green dots mark the fusion anchor points, where the two contours are seamlessly connected to form a watertight, geometrically consistent building base.
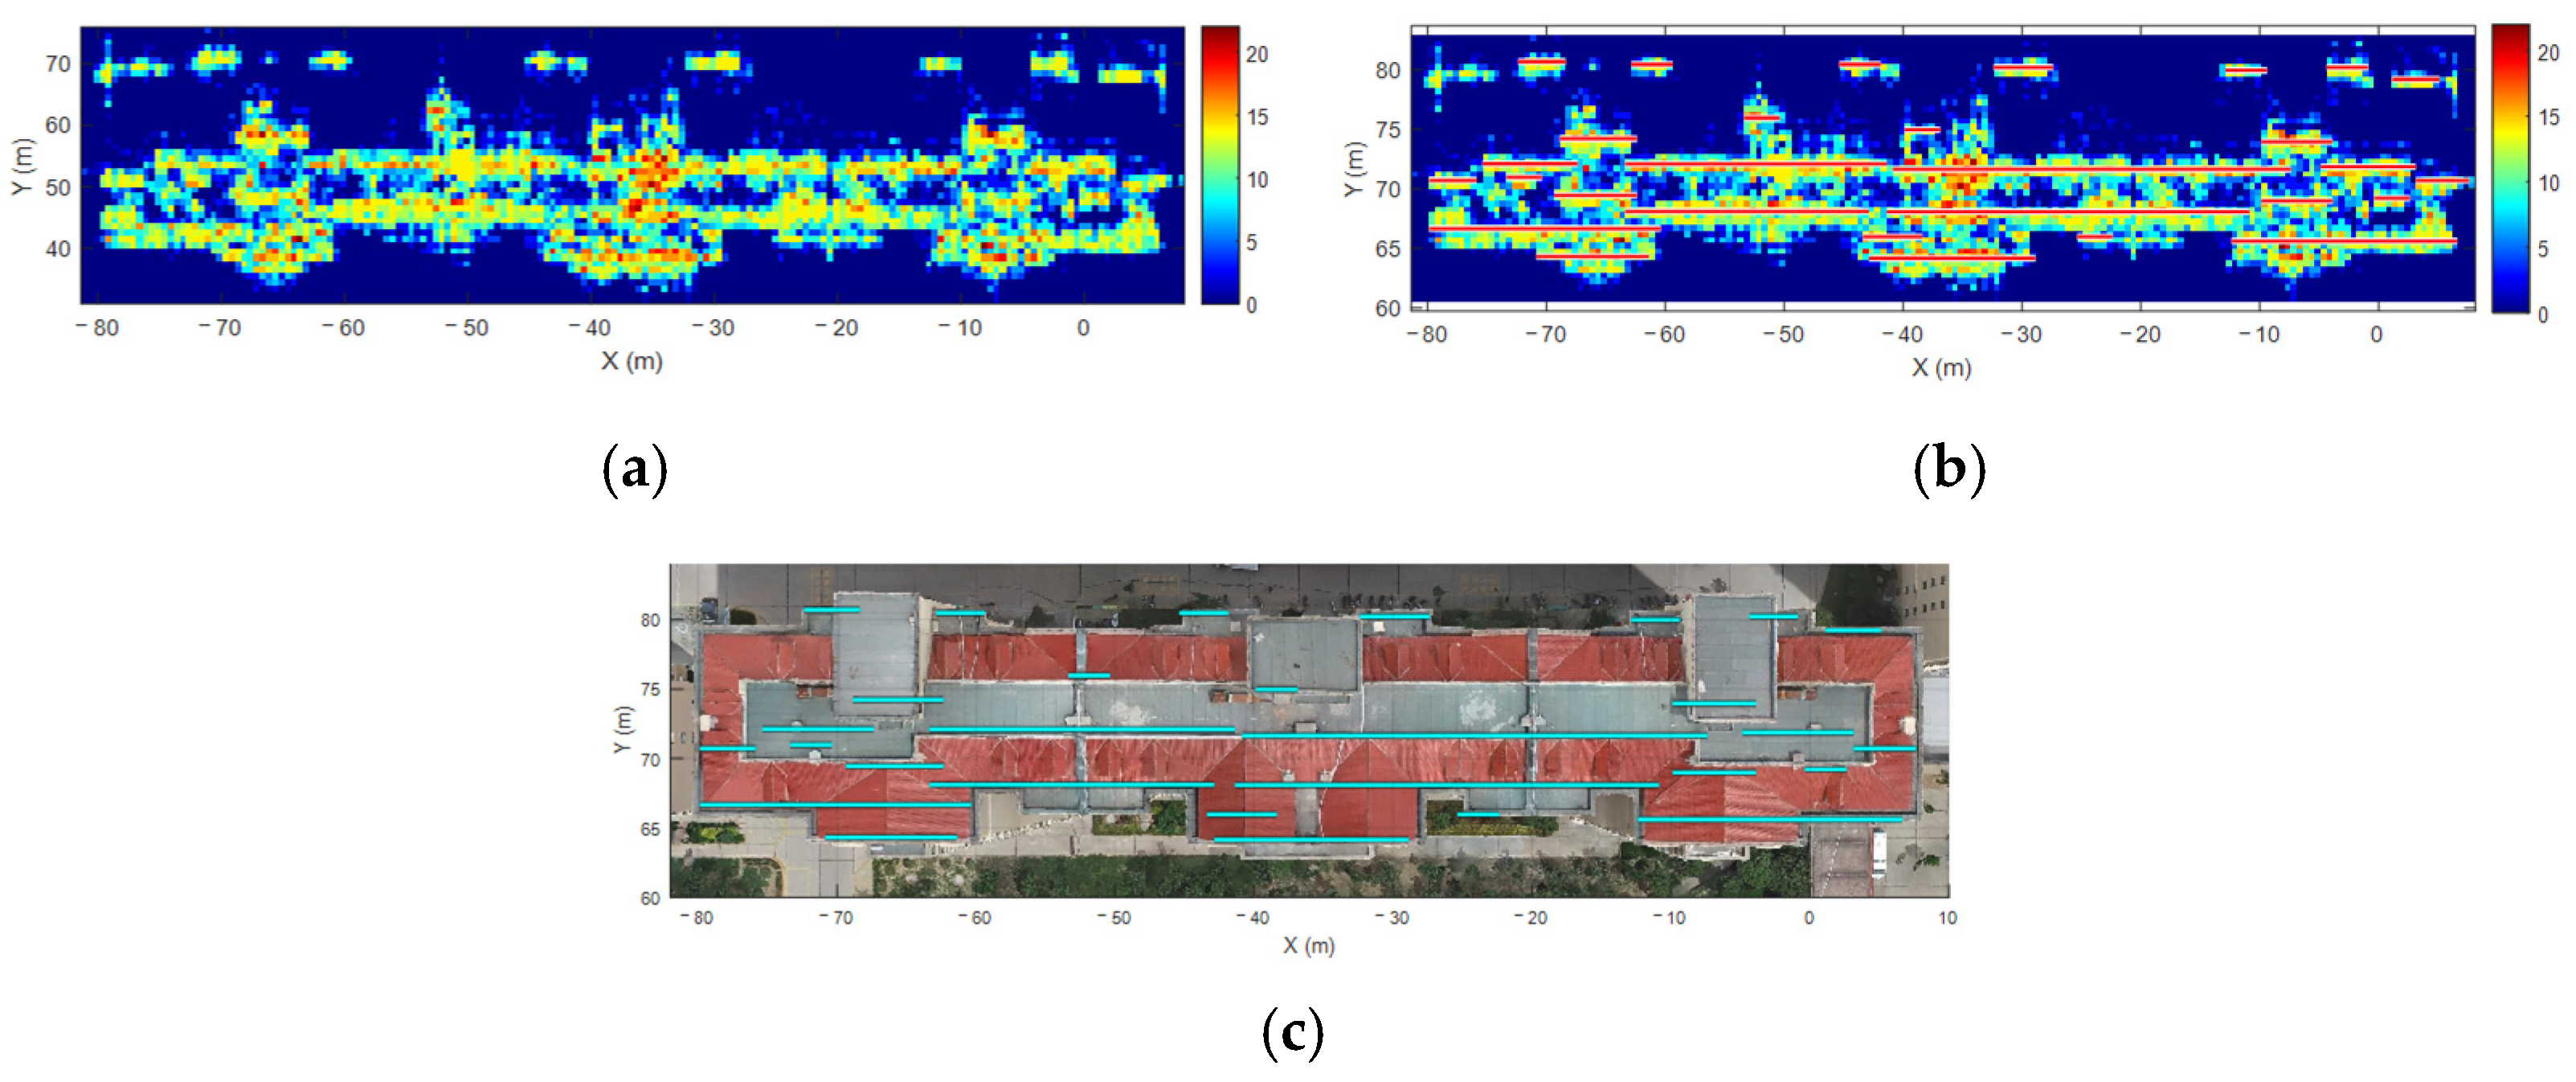
Beyond the outer building envelope, our method successfully recovers internal semantic details often missed by traditional smoothing algorithms. As visualized in Figure 12, the projected point density map (Figure 12a) exhibits distinct, high-intensity linear ridges inside the roof boundary.
We isolated these features using morphological extraction, resulting in the regularized linear segments shown in Figure 12b. To interpret their physical meaning, we superimposed these extracted lines (cyan) onto the ground truth model in Figure 12c. The comparison reveals a noticeable spatial correlation: the high-intensity strips predominantly align with vertical substructures, such as parapet walls.
Physically, this strong response is attributed to the dihedral corner reflector effect. The orthogonal intersection between the vertical parapet walls and the horizontal roof surface creates a “double-bounce” geometry, which reflects the radar signal strongly back to the sensor. By capturing these “highlighted” structures, our framework not only reconstructs the geometry but also identifies potential semantic primitives, paving the way for future semantic interpretation tasks.
Figure 12.
Extraction and validation of internal linear semantic features. (a) 2D density map of the projected roof point cloud, revealing high-intensity scattering strips. (b) Horizontal linear segments (red lines) extracted via morphological opening, corresponding to strong scattering centers. (c) Overlay validation against the oblique photogrammetry model. The extracted lines align precisely with physical parapet walls and elevator shafts, verifying their origin as dihedral corner reflectors.
3.4. 3D Modeling and Verification
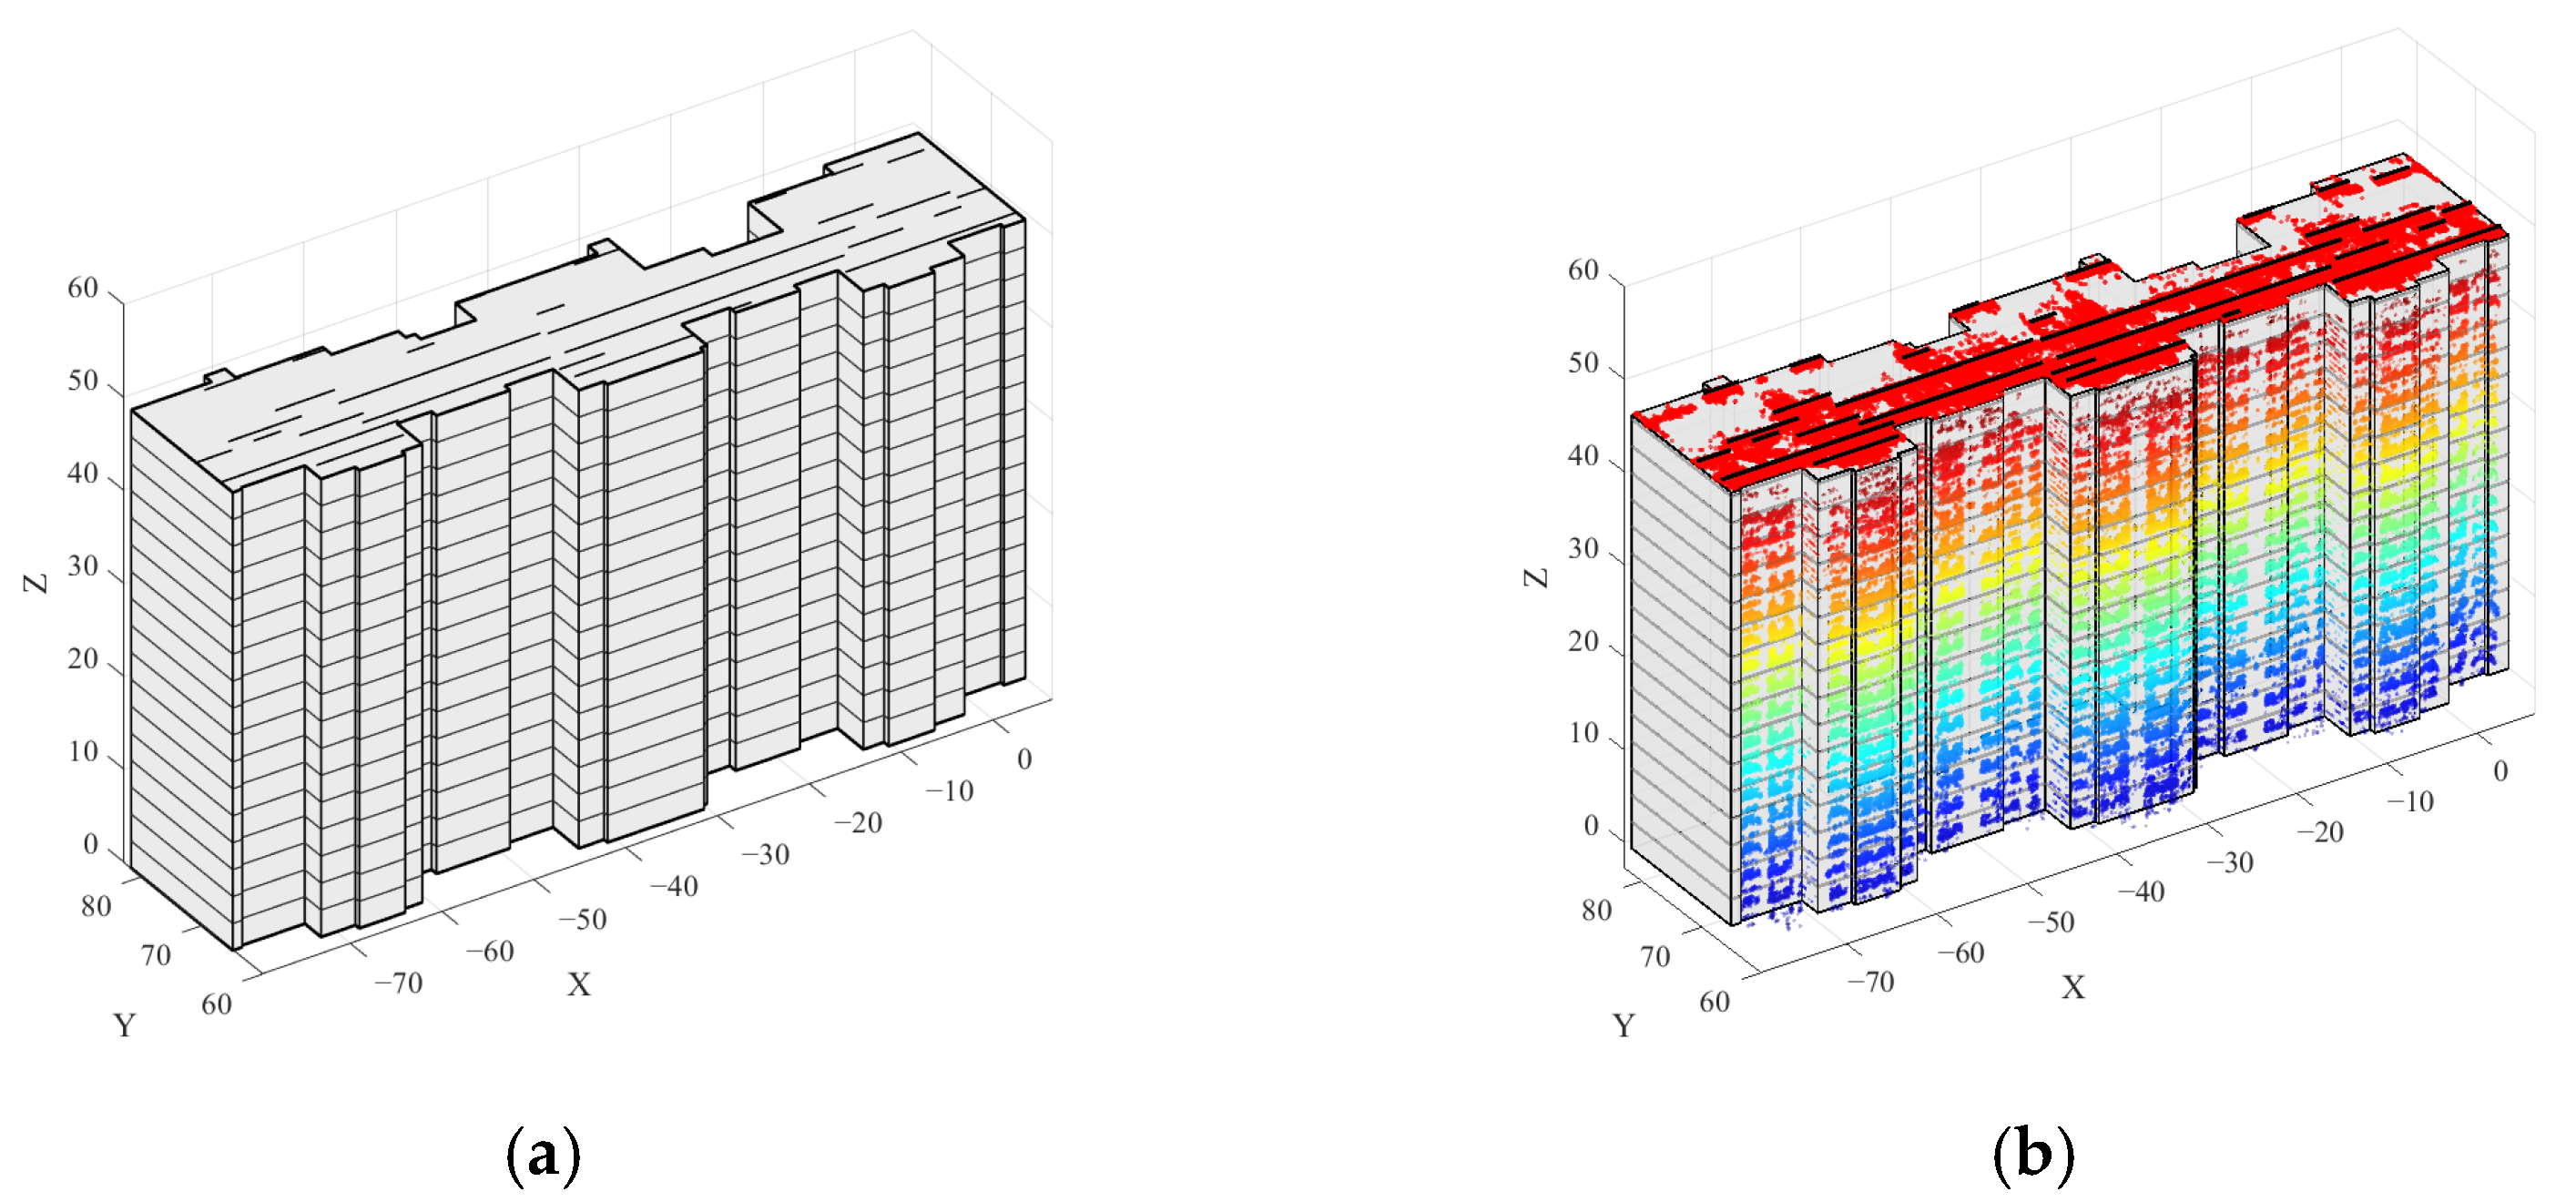
To intuitively assess the semantic richness and geometric precision of the final output, we integrated the estimated structural parameters back into the 3D space, generating the fine-grained model presented in Figure 13.
As visualized in Figure 13a, the reconstructed geometric envelope is not merely a LOD1 block but is semantically enhanced. Based on the average floor height estimated in Section 3.2, we mapped periodic horizontal division lines (black lines) onto the façade, accurately restoring the physical floor distribution. Simultaneously, the linear features (black segments) on the roof correspond to the parapet walls and machine room edges extracted in Section 3.3, significantly enriching the LOD2 detail level.
Furthermore, Figure 13b provides a rigorous geometric verification. By superimposing the focused TomoSAR point cloud onto the model, we observe that the points are no longer diffusely scattered but exhibit clear “layered striations.” These high-density point clusters align strictly with the model’s floor division lines, confirming that our projection-based focusing algorithm successfully recovered the true vertical structure from the original noisy data.
Figure 13.
Fine-grained 3D reconstruction and verification of a single building. (a) Semantically enhanced 3D model: The geometry is augmented with estimated floor division lines (horizontal black lines) and roof linear features (short black segments). (b) Overlay verification: Superimposition of the projected point cloud (colored by height) onto the reconstructed model.
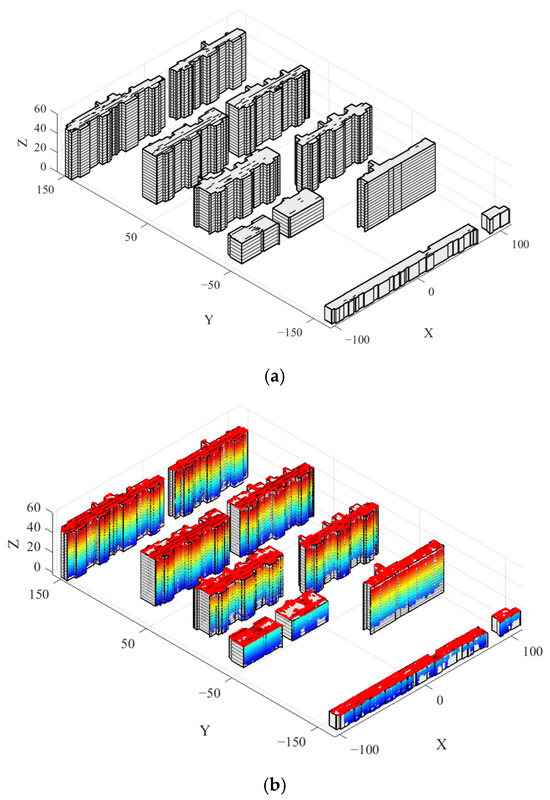
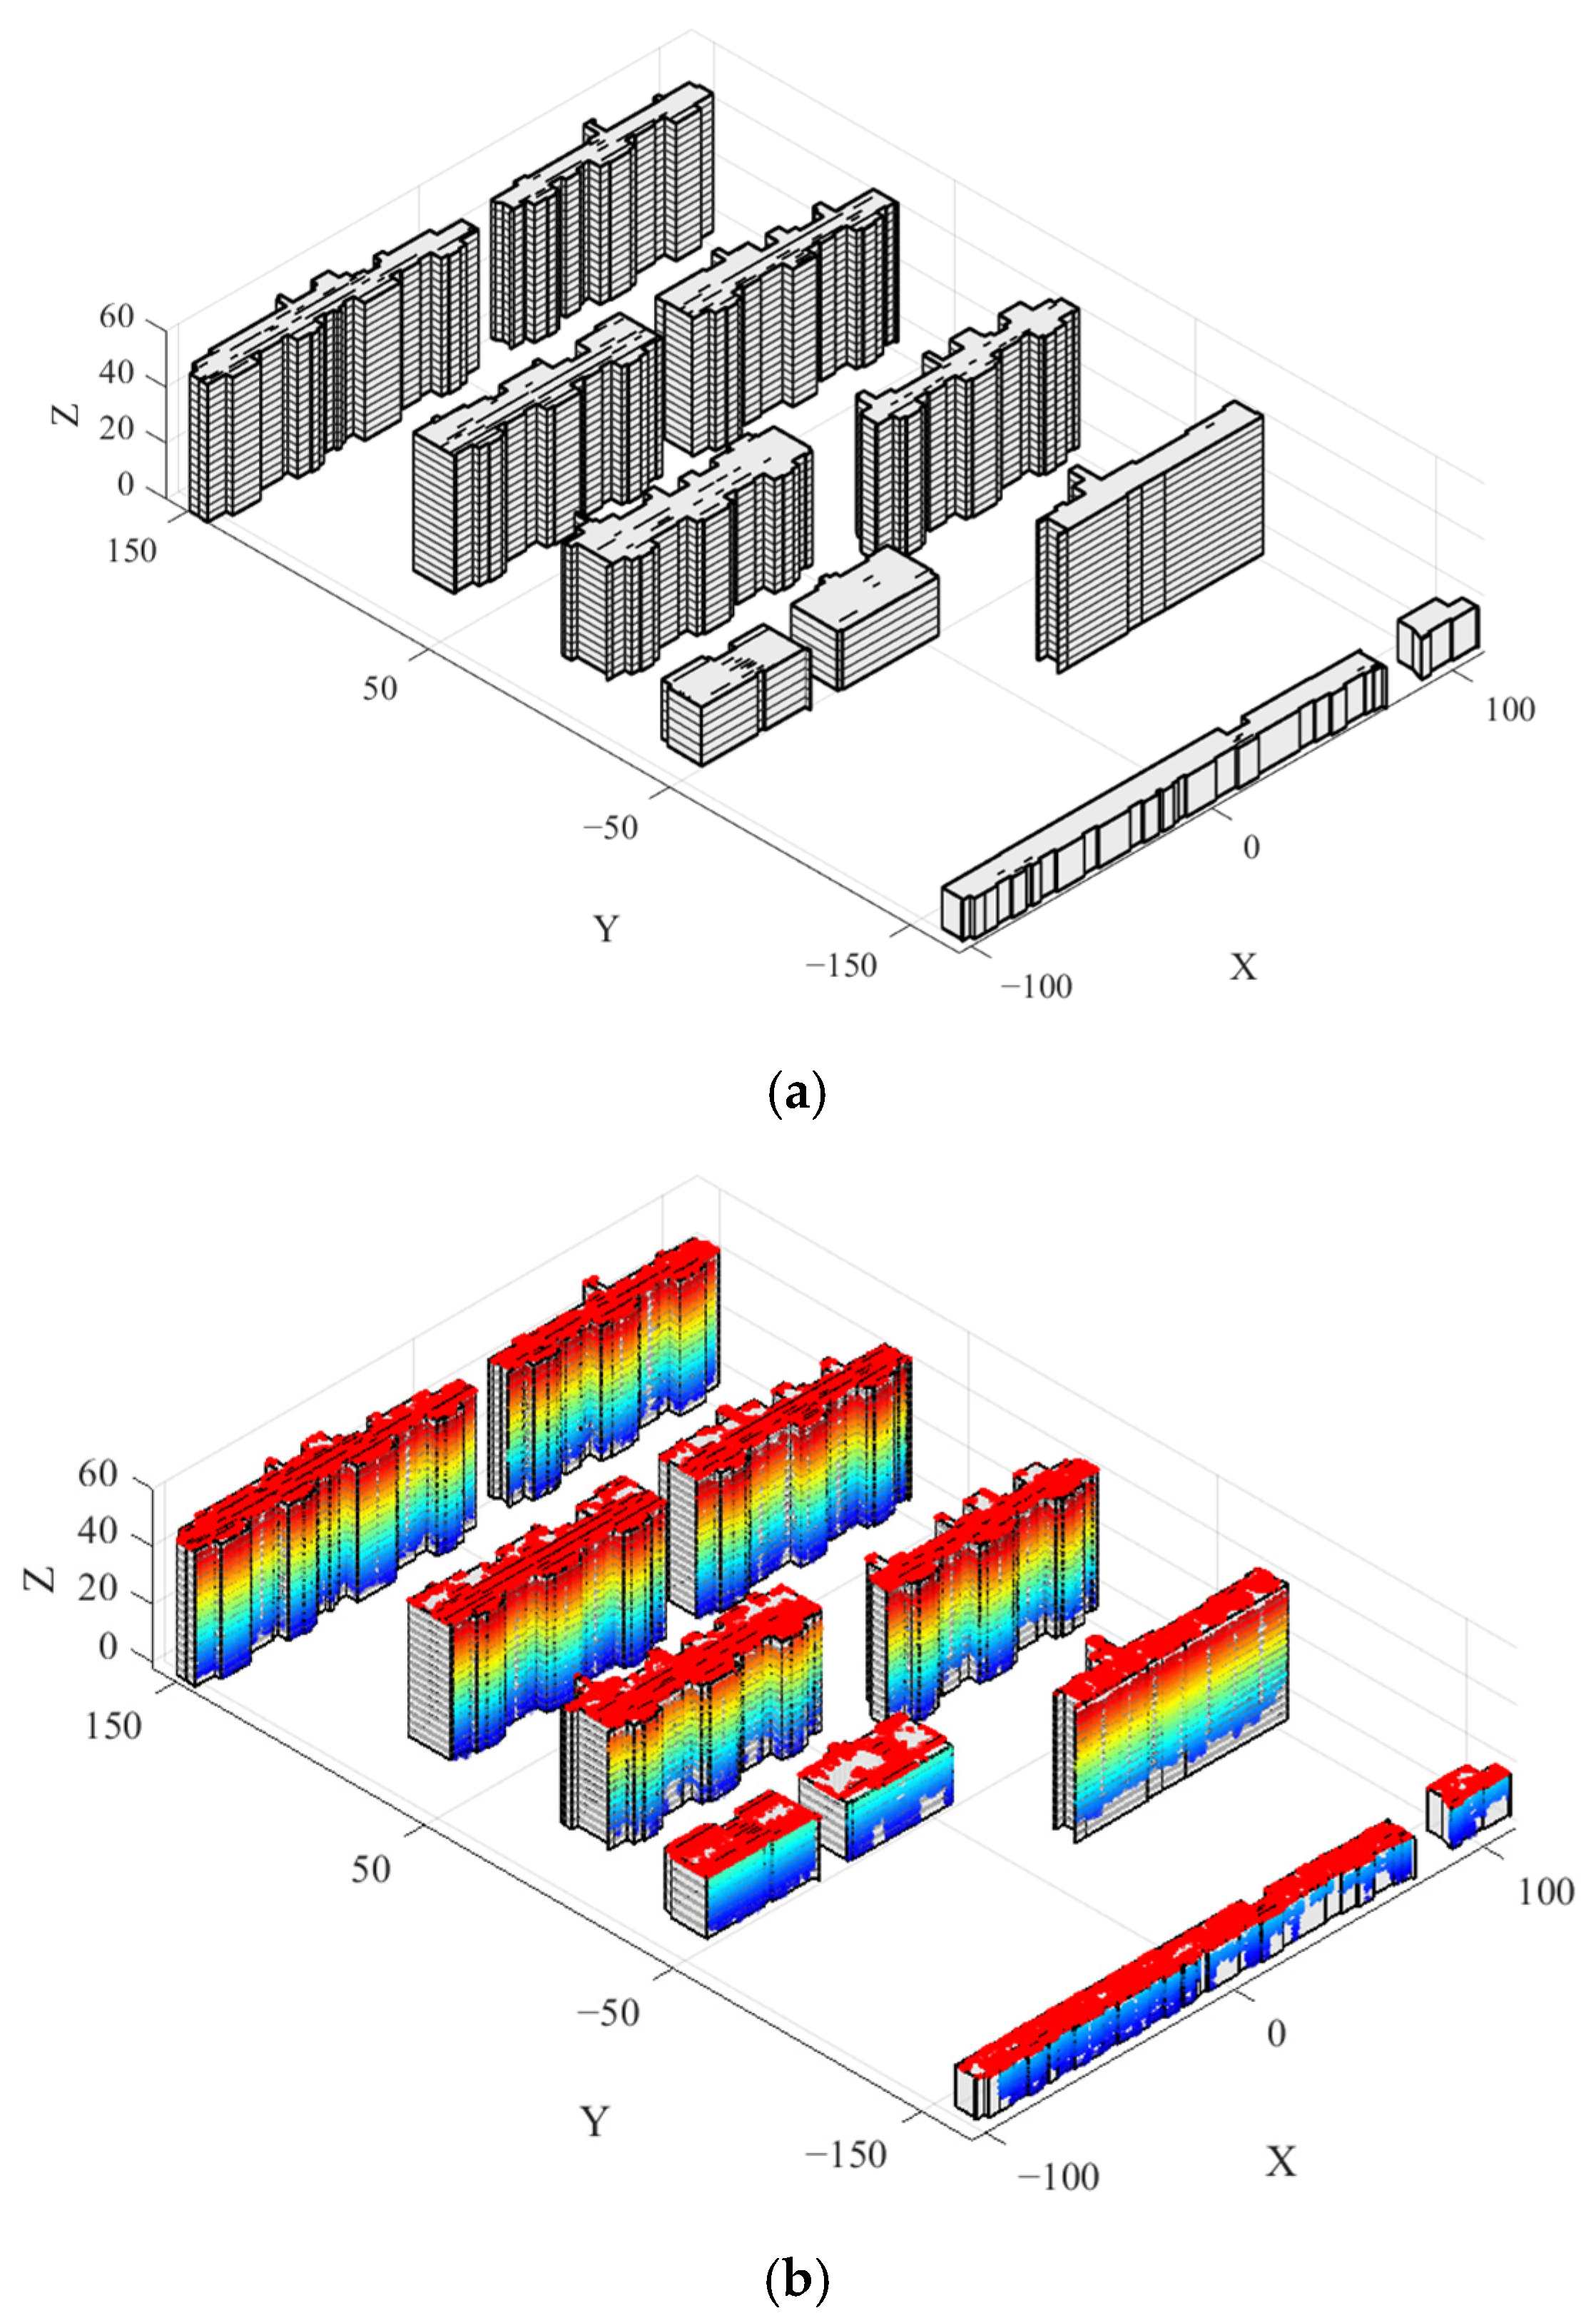
Extending the validation from a single instance to the entire experimental site, Figure 14 presents the holistic reconstruction results for all 11 buildings in the dataset. The final semantic city model, shown in Figure 14a, exhibits high regularity and visual coherence. The framework successfully adapts to varying architectural styles, ranging from the repetitive high-rise residential blocks to the lower, structurally distinct public buildings. Figure 14b further confirms the scalability of our approach. When the entire point cloud dataset is superimposed onto the city model, the geometric consistency is maintained across the large-scale scene. No significant accumulation of errors or structural drifts is observed, indicating that the proposed combination of geometric constraints and morphological priors provides a robust solution for automated, high-precision urban mapping from airborne TomoSAR data. Regarding computational efficiency, the processing time for a typical single building (e.g., Building 3) is approximately 16 s on a standard desktop workstation (Intel Core i7, Intel Corporation, Santa Clara, CA, USA, 32 GB RAM). Crucially, because our framework utilizes DBSCAN to segment the scene into independent building instances during preprocessing, the subsequent reconstruction steps can be fully parallelized. This highly scalable architecture makes the proposed method exceptionally feasible for large-scale urban modeling involving thousands of buildings.
Figure 14.
Holistic semantic reconstruction of the experimental urban area. (a) The generated semantic LOD2 city model, comprising diverse building types with regularized geometries and semantic attributes. (b) Global overlay verification, demonstrating the consistent spatial alignment between the reconstructed models and the original TomoSAR point clouds across the entire scene. The colors represent the elevation of the buildings.
4. Discussion
This study proposes a refined reconstruction framework tailored for TomoSAR point clouds. By integrating imaging geometry constraints with orthogonal morphological priors, we successfully addressed the challenge of extracting regularized semantic structures from sparse, noisy radar signals. The implications of our findings are discussed below from the perspectives of imaging mechanisms, geometric regularization, and current limitations.
4.1. The Decisive Role of the High-Resolution Ku-Band System
The experimental achievement of resolving 2.7 m floor heights with an accuracy of approximately 0.1 m is not solely attributable to the proposed algorithm; the hardware specifications played a decisive role. The airborne system utilized in this study operates in the Ku-band with a high signal bandwidth of 1.2 GHz, theoretically yielding a slant range resolution of roughly 0.15 m. In the side-looking geometry, this ultra-fine range resolution translates directly into high resolving power along the projected façade.
In contrast, while modern commercial spaceborne X-band constellations can achieve high bandwidths, many conventional scientific or widely used spaceborne SAR missions (e.g., C-band Sentinel-1 or standard modes of TerraSAR-X) often operate with bandwidths limited to hundreds of megahertz, resulting in meter-level range resolutions. Under such coarse resolution, scattering centers from adjacent floors would inevitably suffer from range aliasing, causing the vertical density profile to lose its distinct peak-valley characteristics and rendering the proposed FFT-based height estimation ineffective. Consequently, our results empirically validate the immense potential of high-frequency, wide-bandwidth SAR systems for urban “Micro-structure Sensing,” highlighting their viability as a robust complement to optical photogrammetry in fine-grained mapping.
4.2. Regularization Effect of Geometric Priors on Sparse Data
Fundamentally, TomoSAR point clouds represent a sparse collection of discrete scattering centers rather than a dense surface sampling. Traditional boundary extraction methods, such as Alpha Shapes, rely on a purely data-driven paradigm. Due to the ill-posed nature of sparse data reconstruction, these methods inevitably lead to topological fragmentation when data density drops below a critical threshold.
The “Directional Morphology” proposed in this study represents a model-aided strategy. Crucially, unlike parametric modeling which imposes rigid shape assumptions (e.g., fitting perfect cuboids), our approach applies “soft constraints” of orthogonality and straightness via structuring elements. This strategy strikes an optimal balance between preserving data authenticity (allowing for complex, non-convex envelopes) and imposing geometric regularity (repairing gaps and enforcing right angles). The experimental outcomes suggest that this processing paradigm, rooted in the Manhattan World assumption, constitutes one of the most effective solutions for reconstructing man-made targets from sparse radar point clouds.
4.3. Limitations and Future Improvements
Despite the promising performance demonstrated on typical urban architectures, the current framework is subject to certain limitations regarding geometric versatility and data quality. To explicitly define the failure boundaries of the proposed framework, we conducted synthetic simulation experiments.
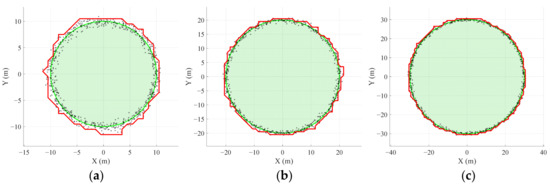
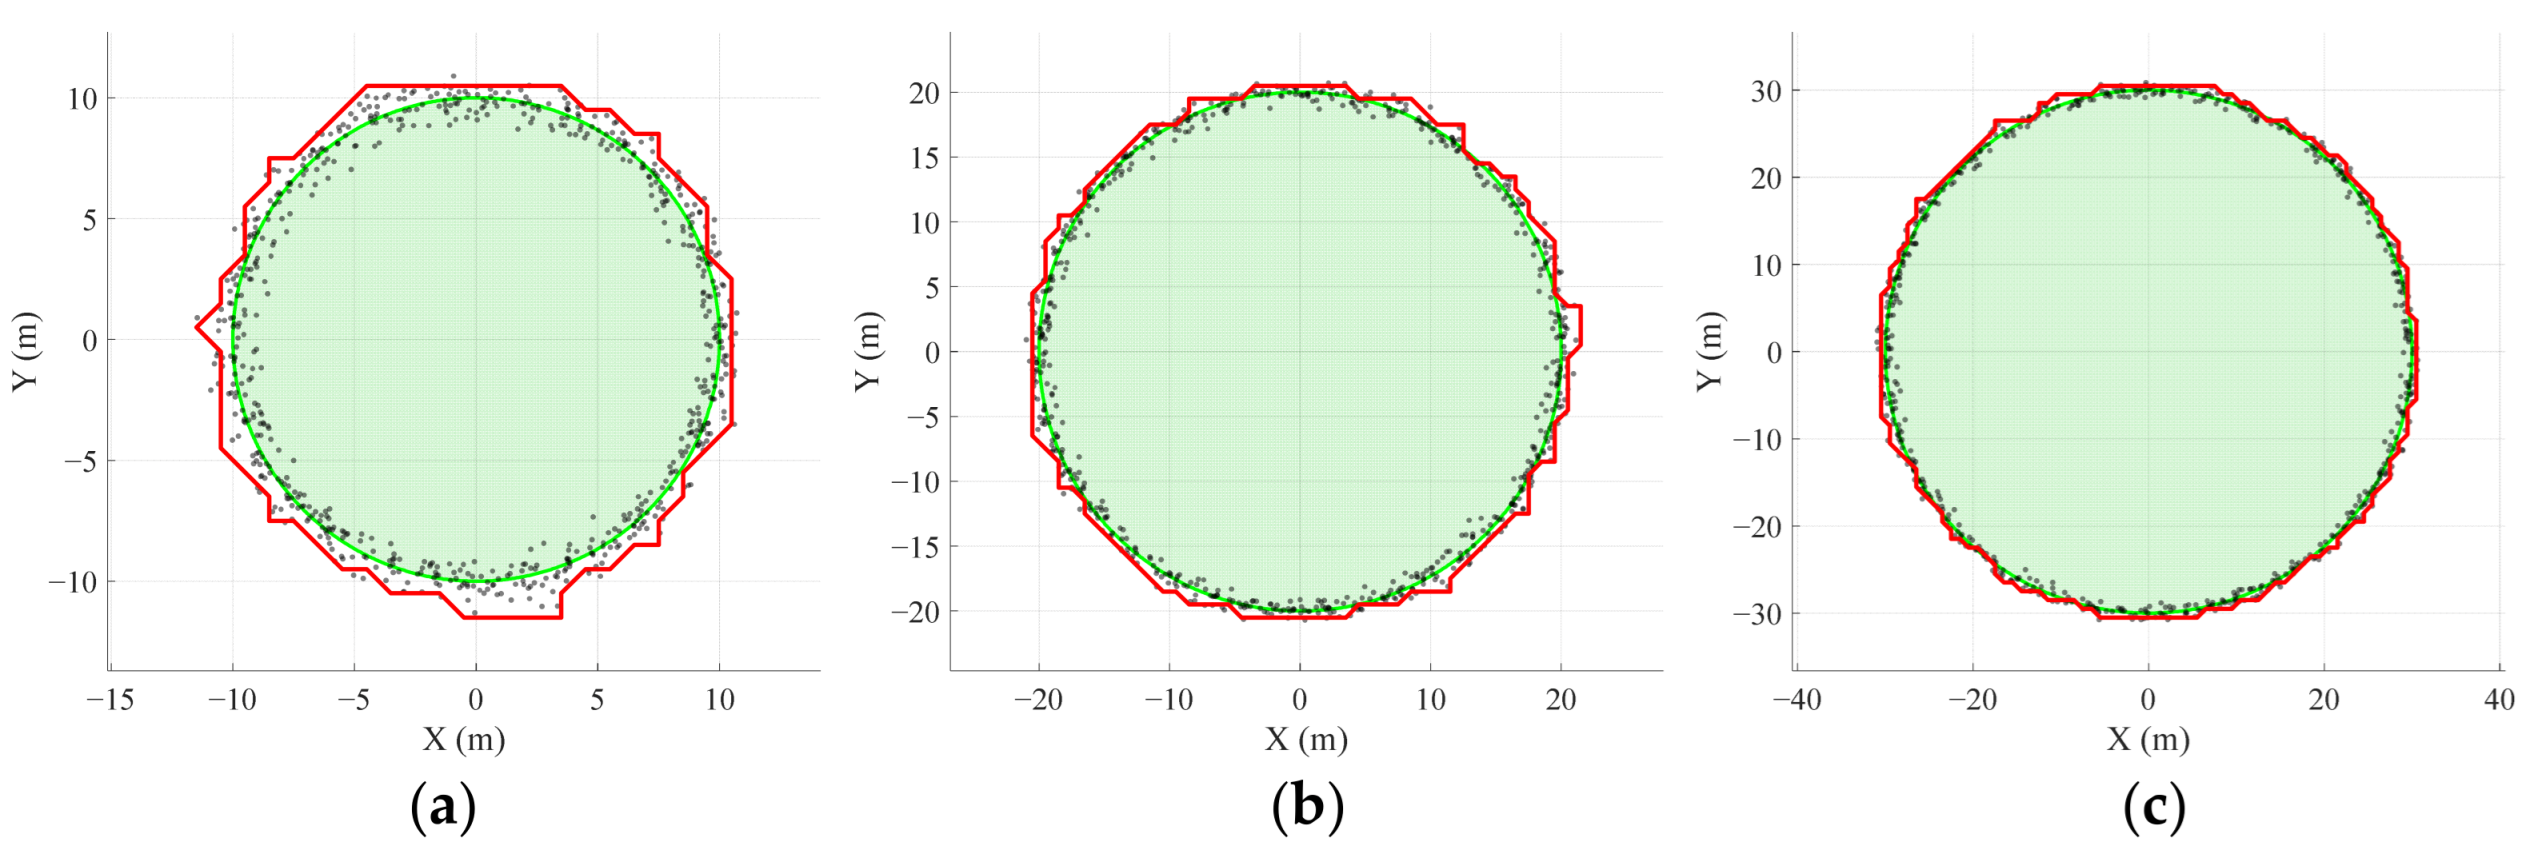
First, the contour extraction algorithm primarily relies on the Manhattan World assumption. As shown in Figure 15, applying our directional morphological algorithm to simulated canonical cylindrical buildings forcefully imposes orthogonal priors, resulting in distinct “staircase” distortions. Quantitative tests reveal that for building radii of 10 m, 20 m, and 30 m, the boundary Root Mean Square Errors (RMSE) are 0.90 m, 0.81 m, and 0.78 m, with IoU scores degrading to 85.60%, 93.39%, and 95.77%, respectively. This explicitly defines the method’s failure boundary, confirming that higher surface curvatures (smaller radii) induce more severe geometric quantization errors. Future work could address this by exploring adaptive structuring elements guided by local curvature tensors.
Figure 15.
Failure boundary analysis on non-orthogonal structures. The subplots display the simulated TomoSAR points (gray dots) generated from ideal cylindrical footprints (green lines) with varying radii: (a) 10 m; (b) 20 m; and (c) 30 m. The red lines represent the “staircase” contours extracted by the proposed directional morphological algorithm. The green shaded areas represent the interior of the ideal cylindrical footprints.
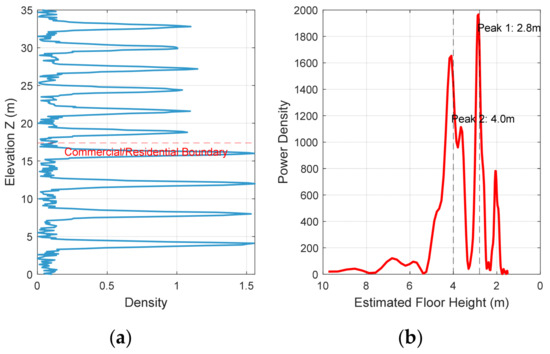
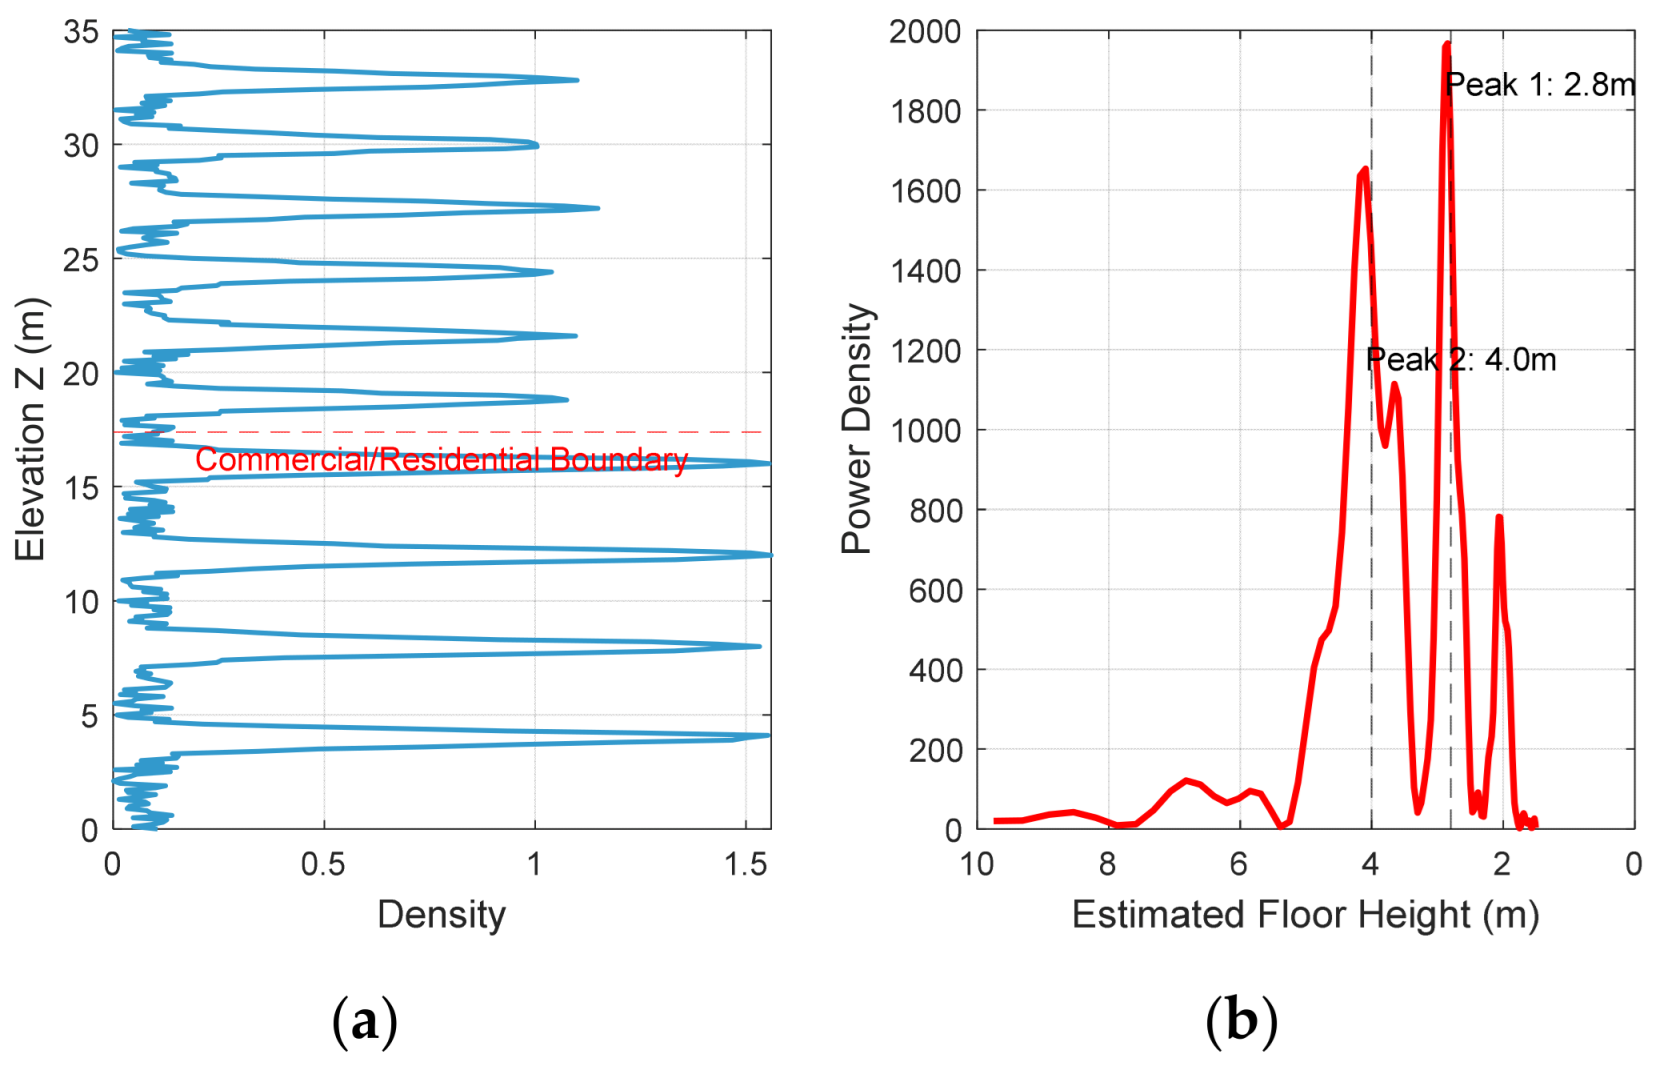
Second, regarding the uniform floor height assumption required by global coherent integration, we simulated a mixed-use building comprising a commercial podium (4.0 m floor height) and residential upper floors (2.8 m floor height). As shown in Figure 16, this height heterogeneity causes the global spectrum to suffer from distinct peak splitting. A simple global estimation would wrongly snap to the dominant peak (2.8 m), resulting in a severe localized absolute error of 1.2 m per floor for the commercial section. This controlled simulation rigorously defines the method’s failure boundary on heterogeneous structures, validating the necessity of replacing the global FFT with localized spectral analysis (e.g., Short-Time Fourier Transform, STFT) or sliding-window analysis layer by layer for future improvements.
Figure 16.
Failure boundary analysis on buildings with varying floor heights. (a) Simulated vertical density profile featuring a commercial podium (4.0 m height) and residential upper floors (2.8 m height). (b) The corresponding global power spectrum via FFT, exhibiting distinct peak splitting. A global estimation fails to resolve the heterogeneous structure, demonstrating the limitation of the uniform-height assumption.
Furthermore, the accuracy of linear feature extraction and floor height estimation is contingent upon a relatively high SNR. While airborne data suffices, extending this method to lower-density spaceborne TomoSAR data remains challenging. Integrating deep learning models (such as PointNet++ or graph neural networks) to learn robust feature representations from noisy data represents a critical direction for future enhancement.
Additionally, current validation is constrained by the limited availability of public high-resolution airborne TomoSAR datasets. Future work will focus on collecting multi-regional datasets with varying building densities to thoroughly verify the algorithm’s generalization capability. Furthermore, once large-scale annotated TomoSAR datasets become available, integrating advanced deep learning baselines will be explored to replace or enhance the current unsupervised morphological priors.
4.4. Cross-Sensor Validation Bias
It is worth noting that using oblique photogrammetry as the absolute ground truth introduces an inherent validation bias due to differing imaging mechanisms. Optical sensors capture the physical surface (visible light reflection), whereas TomoSAR extracts electromagnetic scattering phase centers. For instance, the internal linear features extracted on roofs (Figure 12) primarily originate from dihedral corner reflectors (double-bounce scattering) between vertical parapets and horizontal roof surfaces. The spatial location of these phase centers inherently exhibits sub-meter deviations from the optical physical edges. Correcting this systematic bias requires exhaustive priors on building materials, which is currently unfeasible for city-scale modeling. We acknowledge this inherent cross-sensor discrepancy as an objective source of residual errors in our quantitative metrics (e.g., the IoU).
5. Conclusions
Addressing the inherent limitations of airborne TomoSAR point clouds—specifically data sparsity, severe side-lobe interference, and imaging distortions—this study establishes a comprehensive framework for fine-grained reconstruction that bridges the gap between vertical structural extraction and horizontal contour generation. By implementing an inverse projection strategy rooted in the native radar coordinate system, we physically suppressed elevation-induced side-lobes; coupled with global spectral analysis, this approach enabled the automated and robust estimation of average floor heights with an MAE of 0.106 m, effectively validating the capability of TomoSAR to discern internal architectural hierarchies beyond surface representation. In the horizontal domain, we resolved the “top-bottom” displacement caused by the side-looking geometry via a Line-of-Sight (LOS) projection model, ensuring precise registration between roof points and true geographic coordinates. Furthermore, the proposed directional morphological algorithm, leveraging a separation-of-axes strategy, overcomes the specific limitations of traditional isotropic methods in handling sparse data, effectively bridging signal gaps while rigorously preserving orthogonal corner features and parapet details. Collectively, these findings demonstrate that with appropriate geometric constraints and morphological processing, TomoSAR point clouds possess the requisite fidelity for generating high-precision, regularized LOD2 urban models, offering a robust technical pathway for all-weather, fine-grained urban mapping.
Author Contributions
Conceptualization, H.C. and W.L.; methodology, H.C.; software, H.C.; validation, H.C., Q.C. and L.C.; formal analysis, H.C.; investigation, H.C.; resources, W.L. and M.X.; data curation, Q.C. and L.C.; writing—original draft preparation, H.C.; writing—review and editing, W.L. and M.X.; visualization, H.C.; supervision, W.L. and M.X.; project administration, W.L.; funding acquisition, W.L. All authors have read and agreed to the published version of the manuscript.
Funding
This research was funded by The National Key R&D Program of China under Grant 2022YFB3901604.
Data Availability Statement
Publicly available datasets were analyzed in this study. This data can be found here: https://www.radars.ac.cn/web/data/getData?newsColumnId=9ac203a4-90ca-4e8e-8663-6b6e89cfacea&pageType=en (accessed on 25 March 2026).
Acknowledgments
The authors thank AIRCAS and the Journal of Radars for providing open access to the SARMV3D-1.0 datasets.
Conflicts of Interest
The authors declare no conflicts of interest.
References
- Biljecki, F.; Stoter, J.; Ledoux, H.; Zlatanova, S.; Çöltekin, A. Applications of 3D City Models: State of the Art Review. ISPRS Int. J. Geo-Inf. 2015, 4, 2842–2889. [Google Scholar] [CrossRef] [Scilit]
- Kolbe, T.H.; Gröger, G.; Plümer, L. CityGML: Interoperable Access to 3D City Models. In Geo-Information for Disaster Management; van Oosterom, P., Zlatanova, S., Fendel, E.M., Eds.; Springer: Berlin/Heidelberg, Germany, 2005; pp. 883–899. [Google Scholar]
- Agugiaro, G.; Benner, J.; Cipriano, P.; Nouvel, R. The Energy Application Domain Extension for CityGML: Enhancing interoperability for urban energy simulations. Open Geospat. Data Softw. Stand. 2018, 3, 2. [Google Scholar] [CrossRef] [Scilit]
- Yao, Z.; Nagel, C.; Kunde, F.; Hudra, G.; Willkomm, P.; Donaubauer, A.; Adolphi, T.; Kolbe, T.H. 3DCityDB—A 3D geodatabase solution for the management, analysis, and visualization of semantic 3D city models based on CityGML. Open Geospat. Data Softw. Stand. 2018, 3, 5. [Google Scholar] [CrossRef] [Scilit]
- Esch, T.; Heldens, W.; Hirner, A.; Keil, M.; Marconcini, M.; Roth, A.; Zeidler, J.; Dech, S.; Strano, E. Breaking new ground in mapping human settlements from space—The Global Urban Footprint. ISPRS J. Photogramm. Remote Sens. 2017, 134, 30–42. [Google Scholar] [CrossRef] [Scilit]
- Zhou, Q.-Y.; Neumann, U. 2.5D Dual Contouring: A Robust Approach to Creating Building Models from Aerial LiDAR Point Clouds. In Proceedings of the Computer Vision—ECCV 2010, Heraklion, Greece, 5–11 September 2010; pp. 115–128. [Google Scholar]
- Van Genderen, J.L. Airborne and terrestrial laser scanning. Int. J. Digit. Earth 2011, 4, 183–184. [Google Scholar] [CrossRef] [Scilit]
- Fornaro, G.; Lombardini, F.; Serafino, F. Three-dimensional multipass SAR focusing: Experiments with long-term spaceborne data. IEEE Trans. Geosci. Remote Sens. 2005, 43, 702–714. [Google Scholar] [CrossRef] [Scilit]
- Zhu, X.X.; Bamler, R. Very High Resolution Spaceborne SAR Tomography in Urban Environment. IEEE Trans. Geosci. Remote Sens. 2010, 48, 4296–4308. [Google Scholar] [CrossRef] [Scilit]
- Reigber, A.; Moreira, A.; Papathanassiou, K.P. First demonstration of airborne SAR tomography using multibaseline L-band data. In Proceedings of the IEEE 1999 International Geoscience and Remote Sensing Symposium, IGARSS’99 (Cat. No.99CH36293), Hamburg, Germany, 28 June–2 July 1999; Volume 41, pp. 44–46. [Google Scholar]
- Fornaro, G.; Lombardini, F.; Pauciullo, A.; Reale, D.; Viviani, F. Tomographic Processing of Interferometric SAR Data: Developments, applications, and future research perspectives. IEEE Signal Process. Mag. 2014, 31, 41–50. [Google Scholar] [CrossRef] [Scilit]
- Reale, D.; Fornaro, G.; Pauciullo, A.; Zhu, X.; Bamler, R. Tomographic Imaging and Monitoring of Buildings with Very High Resolution SAR Data. IEEE Geosci. Remote Sens. Lett. 2011, 8, 661–665. [Google Scholar] [CrossRef] [Scilit]
- Wang, Y.; Zhu, X.X.; Bamler, R. Retrieval of phase history parameters from distributed scatterers in urban areas using very high resolution SAR data. ISPRS J. Photogramm. Remote Sens. 2012, 73, 89–99. [Google Scholar] [CrossRef] [Scilit]
- Li, X.; Zhang, F.; Liang, X.; Li, Y.; Guo, Q.; Wan, Y.; Bu, X.; Liu, Y. Fourfold Bounce Scattering-Based Reconstruction of Building Backs Using Airborne Array TomoSAR Point Clouds. Remote Sens. 2022, 14, 1937. [Google Scholar] [CrossRef] [Scilit]
- Qiu, X.; Jiao, Z.; Peng, L.; Chen, J.; Guo, J.; Zhou, L.; Chen, L.; Ding, C.; Xu, F.; Dong, Q.; et al. SARMV3D-1.0: Synthetic Aperture Radar Microwave Vision 3D Imaging Dataset. J. Radars 2021, 10, 485–498. [Google Scholar]
- Dong, S.; Jiao, Z.; Zhou, L.; Yan, Q.; Yuan, Q. A Novel Filtering Method of 3D Reconstruction Point Cloud from Tomographic SAR. Remote Sens. 2023, 15, 3076. [Google Scholar] [CrossRef] [Scilit]
- Zhao, J.; Yu, A.; Zhang, Y.; Zhu, X.; Dong, Z. Spatial Baseline Optimization for Spaceborne Multistatic SAR Tomography Systems. Sensors 2019, 19, 2106. [Google Scholar] [CrossRef] [Scilit]
- D’Hondt, O.; López-Martínez, C.; Guillaso, S.; Hellwich, O. Nonlocal Filtering Applied to 3-D Reconstruction of Tomographic SAR Data. IEEE Trans. Geosci. Remote Sens. 2018, 56, 272–285. [Google Scholar] [CrossRef] [Scilit]
- Zhu, X.X.; Bamler, R. Tomographic SAR Inversion by L_1 -Norm Regularization—The Compressive Sensing Approach. IEEE Trans. Geosci. Remote Sens. 2010, 48, 3839–3846. [Google Scholar] [CrossRef] [Scilit]
- Wei, L.; Balz, T.; Zhang, L.; Liao, M. A Novel Fast Approach for SAR Tomography: Two-Step Iterative Shrinkage/Thresholding. IEEE Geosci. Remote Sens. Lett. 2015, 12, 1377–1381. [Google Scholar]
- Zhu, X.X.; Ge, N.; Shahzad, M. Joint Sparsity in SAR Tomography for Urban Mapping. IEEE J. Sel. Top. Signal Process. 2015, 9, 1498–1509. [Google Scholar] [CrossRef] [Scilit]
- Shi, Y.; Bamler, R.; Wang, Y.; Zhu, X.X. SAR Tomography at the Limit: Building Height Reconstruction Using Only 3–5 TanDEM-X Bistatic Interferograms. IEEE Trans. Geosci. Remote Sens. 2020, 58, 8026–8037. [Google Scholar] [CrossRef] [Scilit]
- Zhu, X.X.; Shahzad, M. Facade Reconstruction Using Multiview Spaceborne TomoSAR Point Clouds. IEEE Trans. Geosci. Remote Sens. 2014, 52, 3541–3552. [Google Scholar] [CrossRef] [Scilit]
- Shahzad, M.; Zhu, X.X. Robust Reconstruction of Building Facades for Large Areas Using Spaceborne TomoSAR Point Clouds. IEEE Trans. Geosci. Remote Sens. 2015, 53, 752–769. [Google Scholar] [CrossRef] [Scilit]
- Wang, W.; Xu, H.; Wei, H.; Dong, Q. Progressive building facade detection for regularizing array InSAR point clouds. J. Radars 2022, 11, 144–156. [Google Scholar]
- Guo, Z.; Liu, H.; Pang, L.; Fang, L.; Dou, W. DBSCAN-based point cloud extraction for Tomographic synthetic aperture radar (TomoSAR) three-dimensional (3D) building reconstruction. Int. J. Remote Sens. 2021, 42, 2327–2349. [Google Scholar] [CrossRef] [Scilit]
- Wang, S.; Guo, J.; Zhang, Y.; Hu, Y.; Ding, C.; Wu, Y. TomoSAR 3D Reconstruction for Buildings Using Very Few Tracks of Observation: A Conditional Generative Adversarial Network Approach. Remote Sens. 2021, 13, 5055. [Google Scholar] [CrossRef] [Scilit]
- Shi, M.; Chen, L.; Zhang, F.; Li, W.; Cui, C.; Liu, Y. Building point cloud reconstruction in TomoSAR based on deep learning semantic segmentation. Electron. Lett. 2024, 60, e13208. [Google Scholar] [CrossRef] [Scilit]
- Chen, Z.; Wang, Y.; Shi, Y.; Zhu, X.X. Reconstructing Building Height from Spaceborne TomoSAR Point Clouds Using a Dual-Topology Network. IEEE Trans. Geosci. Remote Sens. 2026, in press. [Google Scholar] [CrossRef] [Scilit]
- Ma, C.; Zhang, Y.; Guo, J.; Zhou, G.; Geng, X. FusionHeightNet: A Multi-Level Cross-Fusion Method from Multi-Source Remote Sensing Images for Urban Building Height Estimation. Remote Sens. 2024, 16, 958. [Google Scholar] [CrossRef] [Scilit]
- Chen, L.; Zhao, S.; Han, W.; Li, Y. Building detection in an urban area using lidar data and QuickBird imagery. Int. J. Remote Sens. 2012, 33, 5135–5148. [Google Scholar] [CrossRef] [Scilit]
- Franceschetti, G.; Iodice, A.; Riccio, D. A canonical problem in electromagnetic backscattering from buildings. IEEE Trans. Geosci. Remote Sens. 2002, 40, 1787–1801. [Google Scholar] [CrossRef] [Scilit]
- Brunner, D.; Lemoine, G.; Bruzzone, L. Earthquake Damage Assessment of Buildings Using VHR Optical and SAR Imagery. IEEE Trans. Geosci. Remote Sens. 2010, 48, 2403–2420. [Google Scholar] [CrossRef] [Scilit]
- Schnabel, R.; Wahl, R.; Klein, R. Efficient RANSAC for Point-Cloud Shape Detection. Comput. Graph. Forum 2010, 26, 214–226. [Google Scholar] [CrossRef] [Scilit]
- Donoho, D.L. Compressed sensing. IEEE Trans. Inf. Theory 2006, 52, 1289–1306. [Google Scholar] [CrossRef] [Scilit]
- Chi, Y.; Pezeshki, A.; Scharf, L.; Calderbank, R. Sensitivity to basis mismatch in compressed sensing. In Proceedings of the 2010 IEEE International Conference on Acoustics, Speech and Signal Processing, Dallas, TX, USA, 14–19 March 2010; pp. 3930–3933. [Google Scholar]
- Chen, H.; Liu, W.; Xing, M. Method of Refined Facade Model Extraction Based on TOMOSAR Point Cloud. In Proceedings of the 2025 10th International Conference on Signal and Image Processing (ICSIP), Wuxi, China, 12–14 July 2025; pp. 541–545. [Google Scholar]
- Fischler, M.A.; Bolles, R.C. Random Sample Consensus: A Paradigm for Model Fitting with Applications to Image Analysis and Automated Cartography. In Readings in Computer Vision; Fischler, M.A., Firschein, O., Eds.; Morgan Kaufmann: San Francisco, CA, USA, 1987; pp. 726–740. [Google Scholar]
- Coughlan, J.M.; Yuille, A.L. Manhattan World: Compass direction from a single image by Bayesian inference. In Proceedings of the Seventh IEEE International Conference on Computer Vision, Corfu, Greece, 20–27 September 1999; Volume 942, pp. 941–947. [Google Scholar]
- Edelsbrunner, H.; Kirkpatrick, D.; Seidel, R. On the shape of a set of points in the plane. IEEE Trans. Inf. Theory 1983, 29, 551–559. [Google Scholar] [CrossRef] [Scilit]
- Pingel, T.J.; Clarke, K.C.; McBride, W.A. An improved simple morphological filter for the terrain classification of airborne LIDAR data. ISPRS J. Photogramm. Remote Sens. 2013, 77, 21–30. [Google Scholar] [CrossRef] [Scilit]
- Ester, M.; Kriegel, H.-P.; Sander, J.; Xu, X. A density-based algorithm for discovering clusters in large spatial databases with noise. In Proceedings of the Second International Conference on Knowledge Discovery and Data Mining, Portland, OR, USA, 2–4 August 1996; pp. 226–231. [Google Scholar]

Disclaimer/Publisher’s Note: The statements, opinions and data contained in all publications are solely those of the individual author(s) and contributor(s) and not of MDPI and/or the editor(s). MDPI and/or the editor(s) disclaim responsibility for any injury to people or property resulting from any ideas, methods, instructions or products referred to in the content. |
© 2026 by the authors. Licensee MDPI, Basel, Switzerland. This article is an open access article distributed under the terms and conditions of the Creative Commons Attribution (CC BY) license.