Article

E2E-SGRWNet: A Stage-Guided Multi-Task Network for High-Precision River-Width Estimation

1
School of Remote Sensing and Information Engineering, Wuhan University, Wuhan 430079, China
2
State Key Laboratory of Information Engineering in Surveying, Mapping, and Remote Sensing, Wuhan University, Wuhan 430079, China
3
Faculty of Geosciences and Environmental Engineering, Southwest Jiaotong University, Chengdu 611756, China
*
Author to whom correspondence should be addressed.
Remote Sens. 2026, 18(6), 894; https://doi.org/10.3390/rs18060894
Submission received: 19 January 2026 / Revised: 8 March 2026 / Accepted: 11 March 2026 / Published: 14 March 2026

Highlights

What are the main findings?
  • This study proposes E2E-SGRWNet, a stage-guided multi-task network that enables end-to-end estimation of river width from high-resolution optical remote sensing imagery through a stage-wise guidance strategy.
  • On the self-constructed RiverWidth-HR Dataset, E2E-SGRWNet achieves state-of-the-art river-width estimation accuracy, with an MAE of 3.428 m and an RMSE of 4.362 m, outperforming existing multi-stage river-width extraction methods.
What are the implications of the main findings?
  • The proposed method provides a simpler and more robust solution for automated river-width estimation, effectively avoiding the error accumulation associated with traditional multi-stage pipelines.
  • The stage-wise guidance strategy offers a generalizable modeling paradigm for other remote sensing-based geometric parameter regression tasks.

Abstract

Accurate estimation of river width is of great importance for hydrological analysis and water-related applications. However, existing remote sensing-based river-width extraction methods are often complex and prone to error accumulation due to their multi-step processing pipelines. To address these limitations, this study proposes an end-to-end stage-guided multi-task network for river-width estimation (E2E-SGRWNet), which directly regresses continuous river-width values from optical remote sensing imagery. The model adopts a stage-wise guidance strategy that progressively incorporates river spatial semantic information and geometric structural information to effectively guide the learning of river width. At the task-guidance level, a cascaded multi-task framework is designed according to the dependency relationships among tasks, in which river-mask segmentation and centerline extraction serve as auxiliary tasks to guide river-width regression. At the feature-guidance level, a cross-branch feature fusion mechanism is introduced to fully exploit multi-scale spatial semantic features and geometric structural features, thereby jointly guiding fine-grained river-width regression. The experimental results on the self-constructed RiverWidth-HR Dataset show that E2E-SGRWNet reduces the mean absolute error (MAE) and Root-Mean-Square error (RMSE) by 1.1 % and 3.8 % , respectively, compared with DeepRivWidth, the strongest existing multi-stage river-width estimation baseline. Overall, E2E-SGRWNet provides a concise and robust solution for high-precision, automated river-width estimation and offers new insights into end-to-end geometric parameter regression from remote sensing imagery.

1. Introduction

In river-crossing engineering operations, large-scale river-width information is essential for route planning and the selection of bridging equipment [1]. As a fundamental geometric parameter of rivers [2], river width can also provide essential data support for hydrological modeling [3,4], ecological assessment [5,6], and water resource engineering [7]. Existing remote sensing-based river-width estimation methods [8,9,10,11] generally adopt a geometry-driven processing framework centered on binary river masks, following a multi-stage pipeline of centerline extraction → orthogonal direction generation → width computation. However, these methods rely solely on river masks as the input representation, which limits the diversity of available information. Meanwhile, the serial processing structure causes errors introduced in earlier stages to propagate through subsequent steps, leading to cumulative amplification in the final width estimation [12,13]. In addition, several studies [14,15,16] have incorporated deep learning models into river-width estimation tasks by employing them for river-mask segmentation. Although this strategy can improve river-width estimation accuracy to some extent, the subsequent width computation still relies on the conventional multi-stage extraction framework. Consequently, the automation level and the accuracy of the final width estimates remain constrained. Against this backdrop, this study integrates the spatial observation capability of remote sensing imagery with the feature representation power of deep learning to develop an end-to-end river-width estimation network, enabling direct regression from raw remote sensing imagery to continuous river-width values.
Deep learning-based numerical regression tasks that directly rely on raw remote sensing imagery typically face the following two challenges: (1) Geometric parameter regression in complex remote sensing scenes is highly dependent on effective spatial constraints and discriminative feature guidance. On the one hand, high-resolution remote sensing imagery is characterized by diverse land-cover types and pronounced spectral and textural interference. In the absence of effective spatial constraints, directly regressing target geometric parameters from raw imagery makes deep learning models highly susceptible to noise from non-target regions, thereby degrading quantitative estimation accuracy [17,18]. On the other hand, even when effective spatial constraints are introduced by explicitly delineating target regions through semantic segmentation to suppress background interference, pixel-wise segmentation results discard implicit information related to contextual semantics, boundary transitions, and scale variations [19]. Moreover, they fail to fully exploit the advantages of intermediate network features in capturing the topological structure and geometric continuity of target objects [20,21], which ultimately limits the effectiveness of geometric parameter feature learning. (2) There is insufficient availability of high-quality supervised samples. For deep learning-based river-width regression tasks, existing open-access river-width datasets, such as GRWL [22] and MERIT Hydro [23], are generally reliable only for rivers wider than approximately 30 m, or even 90 m in some cases. As a result, they are inadequate for supporting high-precision quantitative modeling and rigorous evaluation of river width, particularly for narrow rivers [24,25]. To address the aforementioned challenges, this study adopts a stage-wise guidance strategy to jointly support end-to-end river-width regression modeling from both task-guidance and feature-guidance perspectives. Meanwhile, a high-spatial-precision river-width dataset is systematically constructed. This dataset not only provides reliable supervisory information for training the proposed river-width regression model, but also serves as a valuable data complement with enhanced spatial characterization capability for river-width studies.
Existing river-width extraction methods generally rely on a multi-stage processing pipeline consisting of centerline extraction–orthogonal profile generation–width computation, which tends to introduce cumulative error propagation. In addition, currently available river-width datasets often suffer from insufficient spatial precision. To address these limitations, this study conducts research from both methodological framework and data support perspectives. This paper proposes E2E-SGRWNet, a stage-guided multi-task network for river-width estimation. The proposed model adopts a stage-wise guidance strategy to construct a cascaded multi-task network architecture that jointly formulates river-mask segmentation, centerline extraction, and continuous river-width regression, thereby enabling end-to-end inference of river-width geometric parameters directly from optical remote sensing imagery. In addition, a high-spatial-resolution river-width dataset is constructed by systematically integrating optical remote sensing imagery, river masks, centerlines, and precise river-width annotations. This dataset provides a reliable data foundation for high-precision river-width estimation modeling. By integrating the proposed model with the constructed high-resolution dataset, E2E-SGRWNet offers a concise yet robust solution for fine-scale river-width estimation in complex remote sensing scenes.
The main contributions of this study are summarized as follows:
  • We propose E2E-SGRWNet, a stage-guided multi-task network for river-width estimation, which jointly formulates river-mask segmentation, centerline extraction, and continuous river-width regression within a unified framework, enabling end-to-end estimation of river width directly from optical remote sensing imagery.
  • We design a stage-wise guidance strategy, which progressively introduces semantic and structural information into the river-width regression process through a task dependency-driven cascaded architecture and cross-branch feature fusion mechanism, effectively improving the stability and consistency of river-width estimation in complex riverine environments.
  • We establish the RiverWidth-HR Dataset, a high-spatial-resolution river-width dataset, which systematically integrates optical remote sensing imagery, river masks, centerlines, and high-precision river-width annotations, providing valuable data support for river-width-related research.

2. Related Work

2.1. Morphological Extraction Method for River Width

To date, extensive research efforts have been devoted to the topic of automated river-width extraction based on remote sensing data, leading to the development of a series of representative algorithmic frameworks, such as RivWidth [8], RivWidthCloud [9], GrabRiver [10], and ARWE [11]. These studies have played an important role in advancing automated river-width extraction techniques and have demonstrated the feasibility of deriving river-width information from remote sensing imagery.
Most of the aforementioned methods follow a similar processing paradigm. Starting from a binarized river mask, they generally adopt a three-step workflow: (1) extraction of the river centerline; (2) construction of orthogonal cross-sections along the centerline direction; and (3) identification of the two riverbanks on each cross-section, with the distance between them calculated as the river width. By representing the overall river course through the centerline and characterizing local width directions via orthogonal profiles, these approaches establish a relatively robust geometric measurement pathway. They are particularly effective for medium- to large-scale rivers with regular structures and clearly defined banks.
However, such geometry-based river-width extraction pipelines still suffer from several inherent limitations. First, river-width extraction relies exclusively on the quality of the binarized river mask, making it highly sensitive to segmentation inaccuracies and prone to width estimation errors. Second, the multi-step processing pipeline increases the risk of error accumulation and amplification across successive stages. In addition, these methods often require numerous manually defined parameters, which constrains their degree of automation and adaptability. Such limitations become especially pronounced in remote sensing scenarios characterized by complex backgrounds, dense river networks, or irregular riverbank geometries.

2.2. Deep Learning-Based River-Width Extraction Method

Deep learning has demonstrated significant advantages in intelligent interpretation of remote sensing imagery through end-to-end feature learning and nonlinear mapping [26,27]. From the perspective of task formulation, both river-mask extraction and river centerline extraction aim to separate target regions from the background via pixel-level precise delineation and therefore belong to typical segmentation tasks. In contrast, river-width estimation is essentially a pixel-wise continuous-value prediction problem and falls into the category of regression tasks. Consequently, deep learning-based river-width estimation methods require not only the fine localization capability of segmentation models but also the ability of regression models to accurately characterize continuous geometric quantities. A large body of studies has shown that deep neural networks exhibit strong representation capacity in both remote sensing segmentation tasks [28,29,30,31,32,33,34,35] and parameter regression tasks [36,37], providing solid technical support for deep learning-based river-width modeling.
In recent years, several studies have attempted to introduce deep learning techniques into river-width extraction. Ling et al. [14] proposed a convolutional neural network-based approach for estimating river wetted width, in which a deep CNN is first used to generate high-resolution river masks, and the RivWidth software [8] is subsequently applied to automatically estimate river widths from the extracted masks. Verma et al. [15] proposed the DeepRivWidth method, which employs semantic segmentation networks such as U-Net or DeepLabV3+ to extract river masks from SAR imagery, and then measures river width by computing the distance between riverbanks along directions orthogonal to the local river centerline. Li et al. [16] developed RivBW, a CNN-based river bankfull width extraction framework, in which DeepLabV3+ is used to precisely delineate river boundaries, followed by centerline extraction using the Voronoi diagram method, and river widths are finally calculated based on the derived centerlines and channel boundaries. However, these methods share a common characteristic in that the introduction of deep learning is mainly limited to the use of segmentation models, where semantic segmentation networks are employed to extract river masks and improve the accuracy of water-boundary delineation. The subsequent stages of centerline generation and width computation still rely on traditional geometric–morphological methods, such as distance transforms, skeletonization, and cross-section construction. Therefore, these approaches have not moved beyond a multi-stage, indirect processing framework.
To fundamentally address the issue of error accumulation introduced by multi-stage processing frameworks, this study seeks to jointly introduce segmentation and regression models into the river-width estimation task, fully exploiting the end-to-end modeling capability of deep neural networks. By directly regressing river-width information from raw remote sensing imagery, the proposed approach avoids error propagation caused by intermediate steps and improves both the level of automation and the stability of river-width estimation accuracy.

3. Methodology

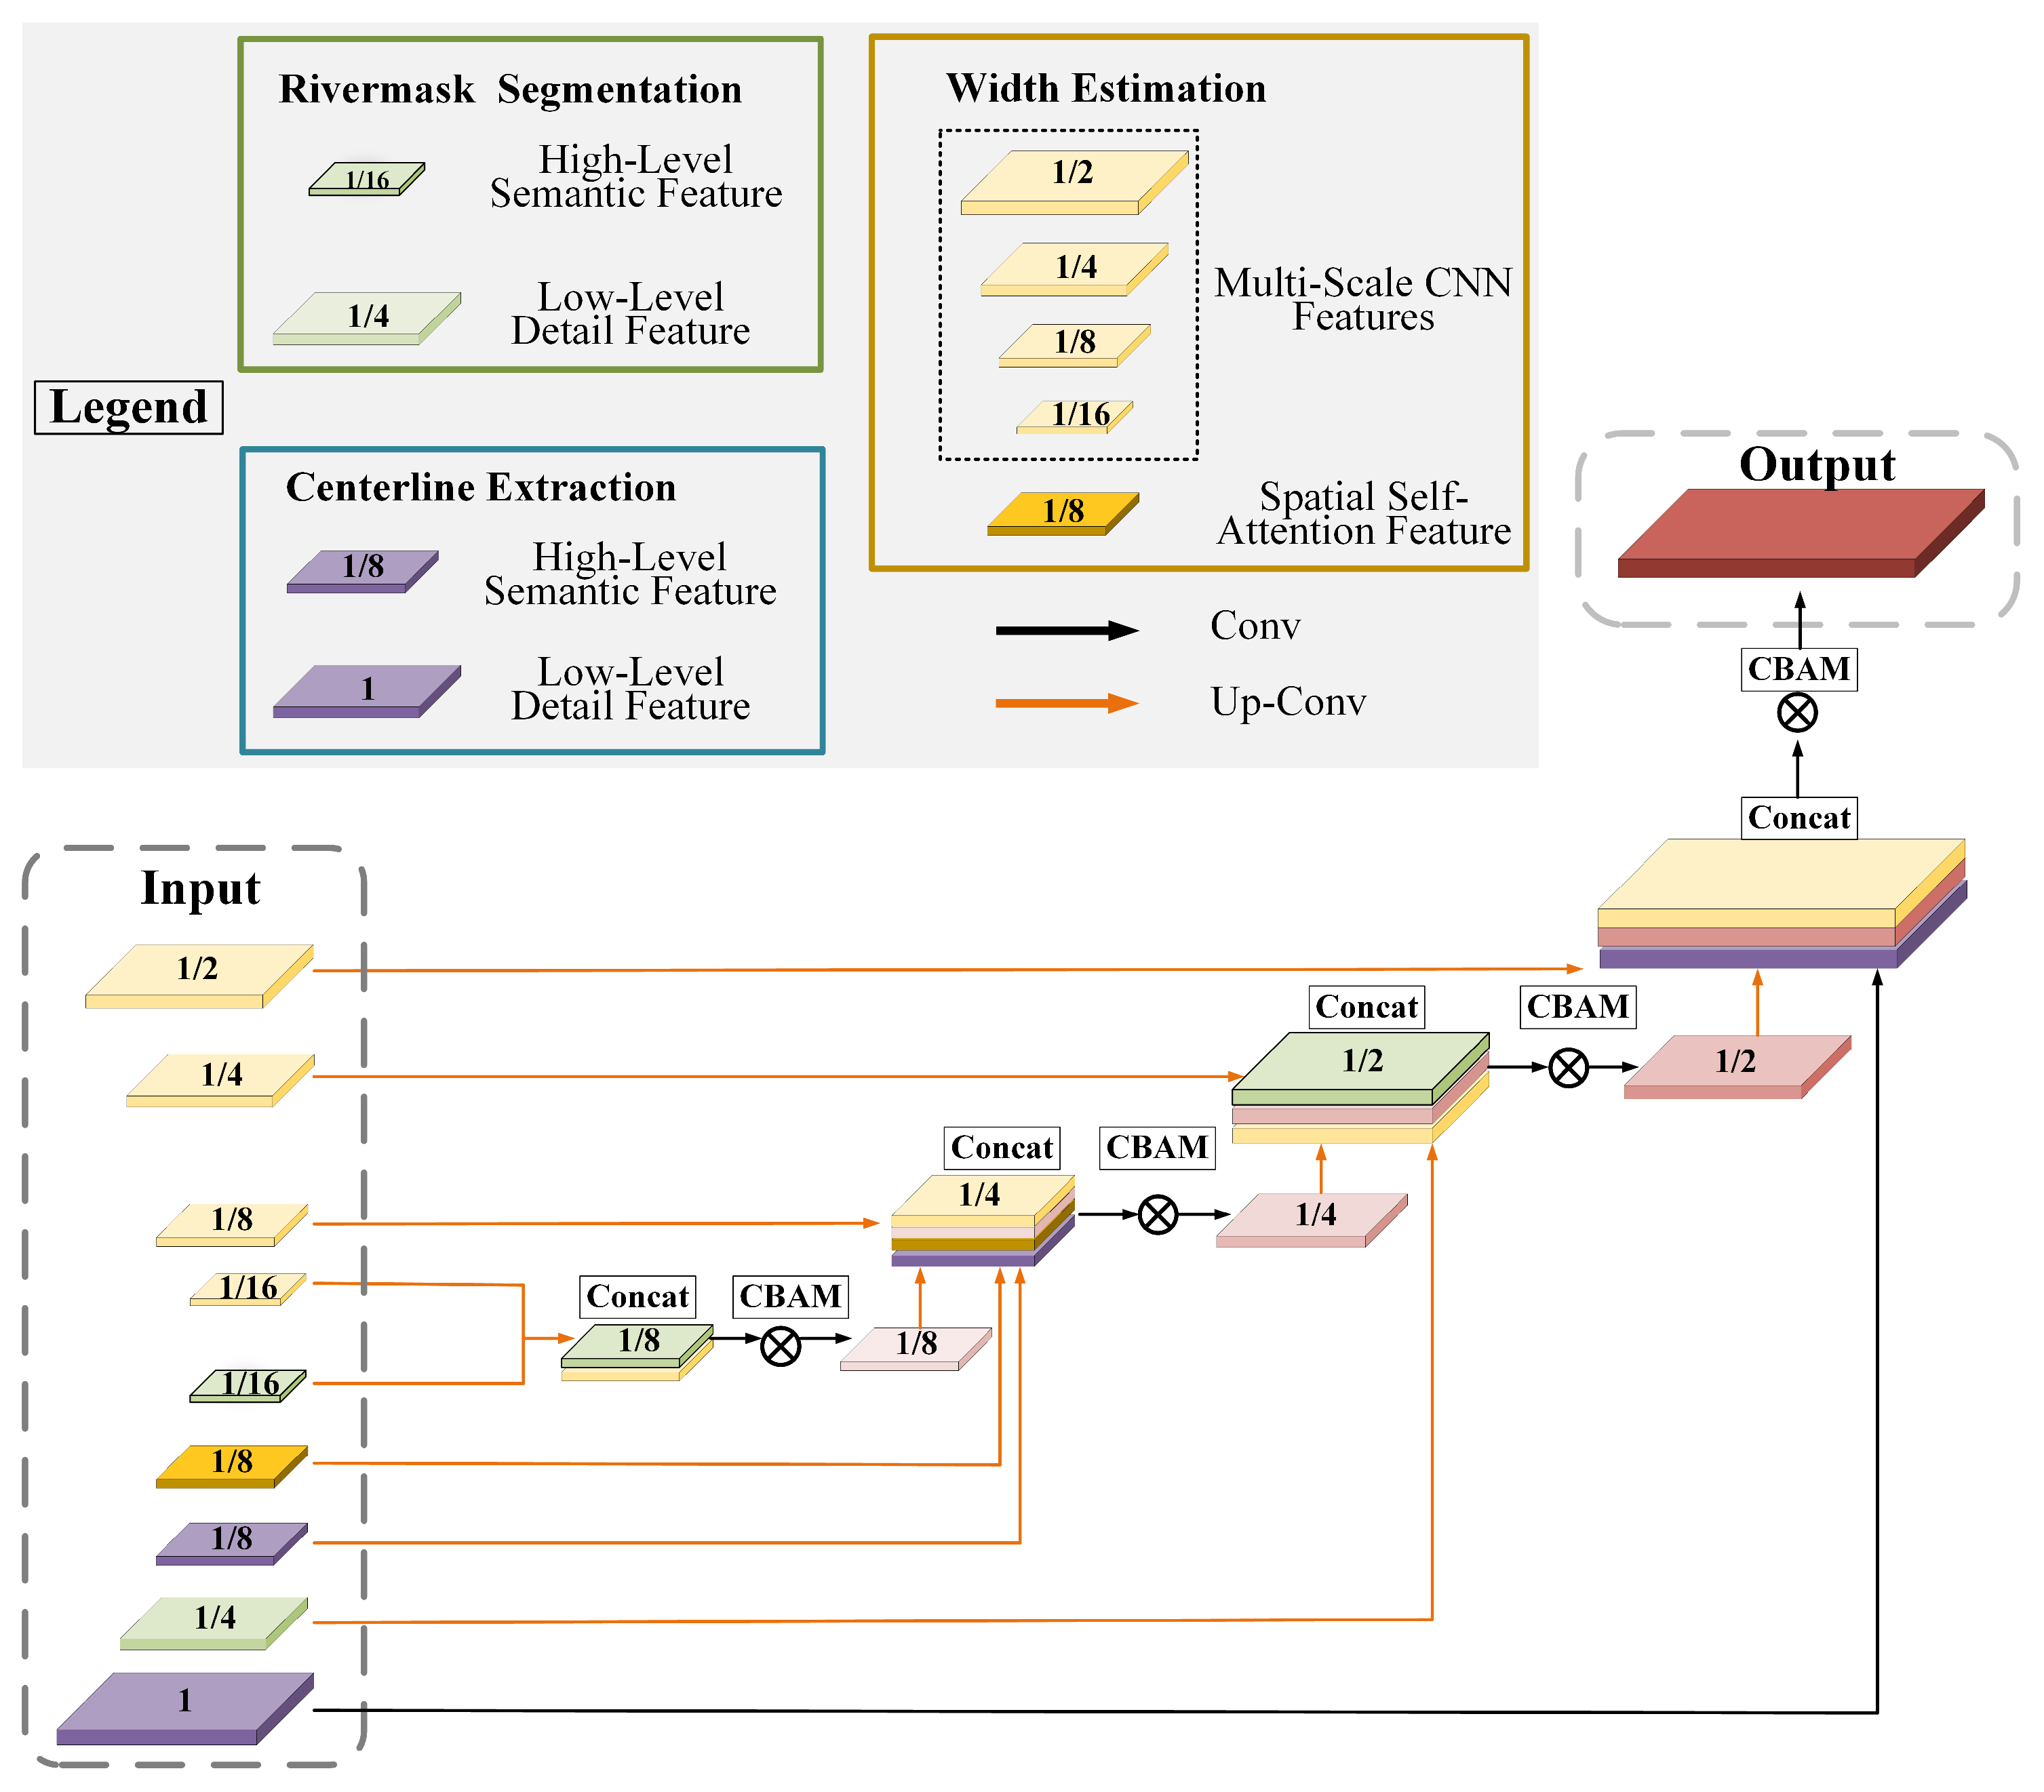
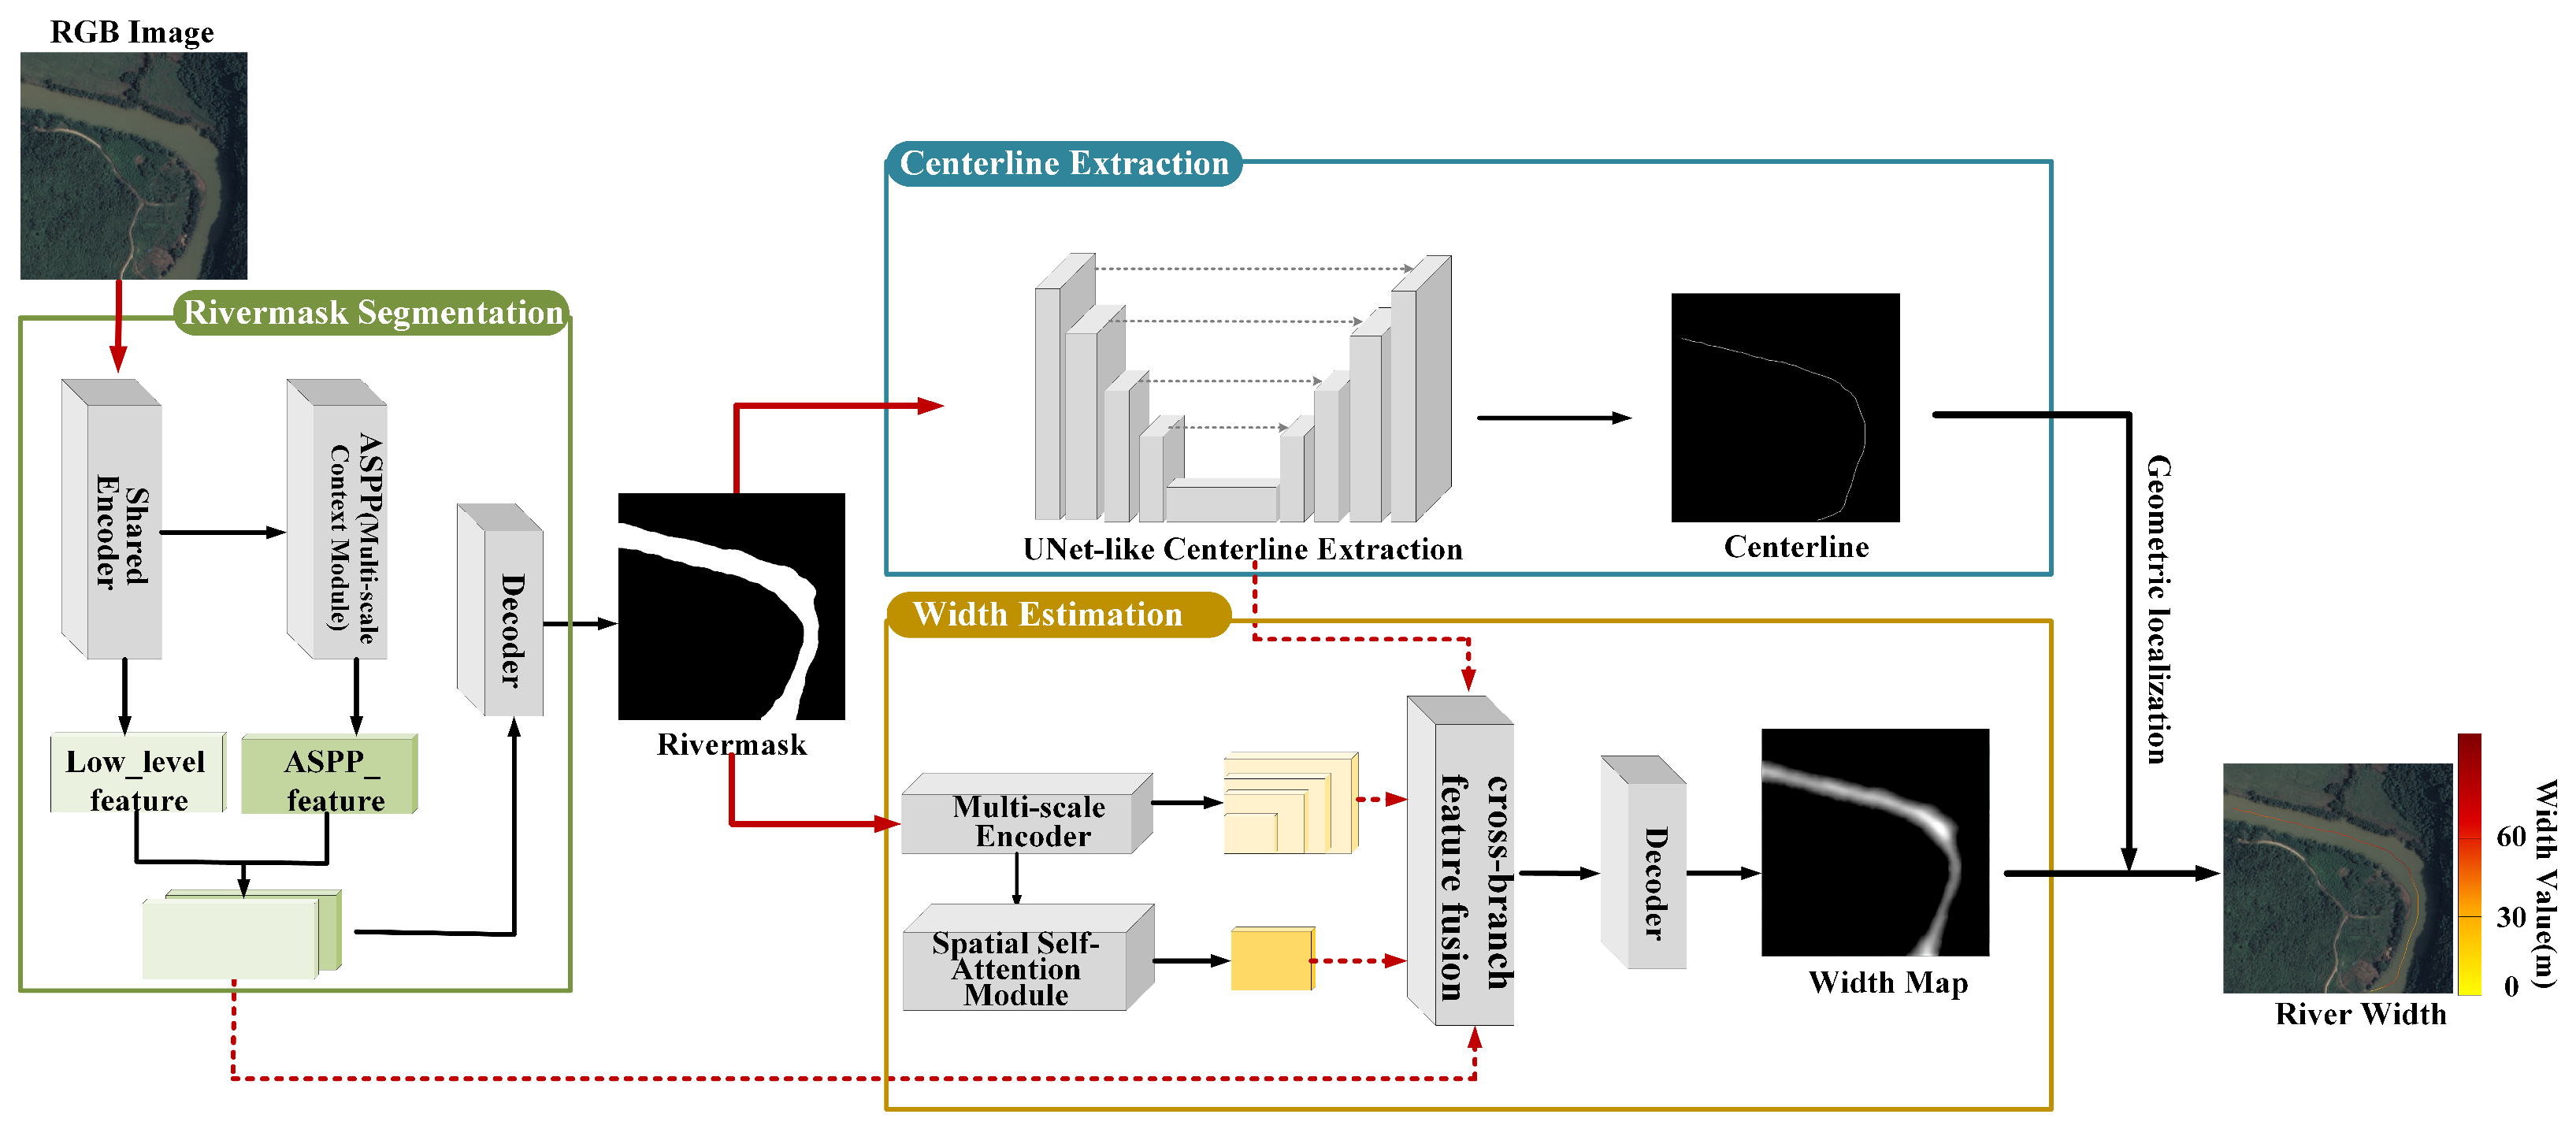
E2E-SGRWNet is a stage-guided multi-task network for river-width estimation, and aims to achieve end-to-end modeling from high-resolution optical remote sensing imagery to continuous river-width values. As illustrated in Figure 1, E2E-SGRWNet is constructed based on a stage-wise guidance strategy, which incorporates both task-level guidance and feature-level guidance to support accurate river-width estimation. At the task-guidance level, a cascaded multi-task learning framework is designed according to the intrinsic dependencies among tasks, in which three interrelated sub-tasks are jointly modeled within a unified architecture: (1) a semantic-oriented river-mask segmentation task, (2) a structure-oriented river centerline extraction task, and (3) a parameter regression task for river-width estimation. In this framework, the river-mask segmentation and centerline extraction tasks are explicitly introduced as auxiliary tasks, providing guidance and constraints for the main river-width regression task. At the feature-guidance level, a cross-branch feature fusion mechanism is introduced into the river-width regression branch, which effectively integrates multi-scale semantic features from the mask segmentation branch and geometric structural features from the centerline extraction branch, thereby jointly guiding the learning of river-width geometric parameters. Given an input RGB remote sensing image X R H × W × 3 , E2E-SGRWNet progressively models the transformation from semantic localization to geometric parameter estimation within a unified framework, and simultaneously produces three types of outputs: a river-mask segmentation map, a river centerline segmentation map, and a dense river-width map.

3.1. Task-Guided Cascaded Multi-Task Framework

3.1.1. Semantic-Oriented River-Mask Segmentation Task

The semantic-oriented river-mask segmentation task aims to identify and delineate river regions from raw RGB optical remote sensing imagery, producing accurate spatial distribution information that serves as high-quality spatial priors for subsequent river centerline geometric structure extraction and river-width geometric parameter regression.
Considering the characteristics of rivers in remote sensing imagery—such as large scale variability, blurred boundaries, and complex morphologies—this task adopts DeepLabv3+ [33] as the reference framework. A shared feature encoder is employed to extract multi-level semantic representations from the input optical imagery. The shallow encoder features preserve high spatial resolution and effectively characterize fine-grained river boundaries and local structural details, while the deeper features encode high-level semantic information representing the overall river regions. At the end of the encoder, an Atrous Spatial Pyramid Pooling (ASPP) module [38] is integrated to aggregate multi-scale contextual information from the deep features, enabling effective modeling of river structures across different spatial scales and enhancing the network’s capability to interpret complex river morphologies. During decoding, the high-level semantic features produced by the ASPP module are fused with the shallow encoder features, and the fused representations are upsampled to generate a river-mask probability map with the same spatial resolution as the input image, achieving pixel-wise river segmentation.
In addition to the final river-mask output, the semantic-oriented river-mask segmentation task provides two types of intermediate features for downstream tasks. The first type consists of high-resolution shallow encoder features, which retain detailed riverbank and boundary information. The second type includes high-level semantic features output by the ASPP module, which have a large receptive field and encode rich contextual information, offering global structural cues. These two categories of features are jointly introduced as guidance features in the subsequent river-width regression task to facilitate the learning of river-width geometric parameters.

3.1.2. Structure-Oriented River Centerline Extraction Task

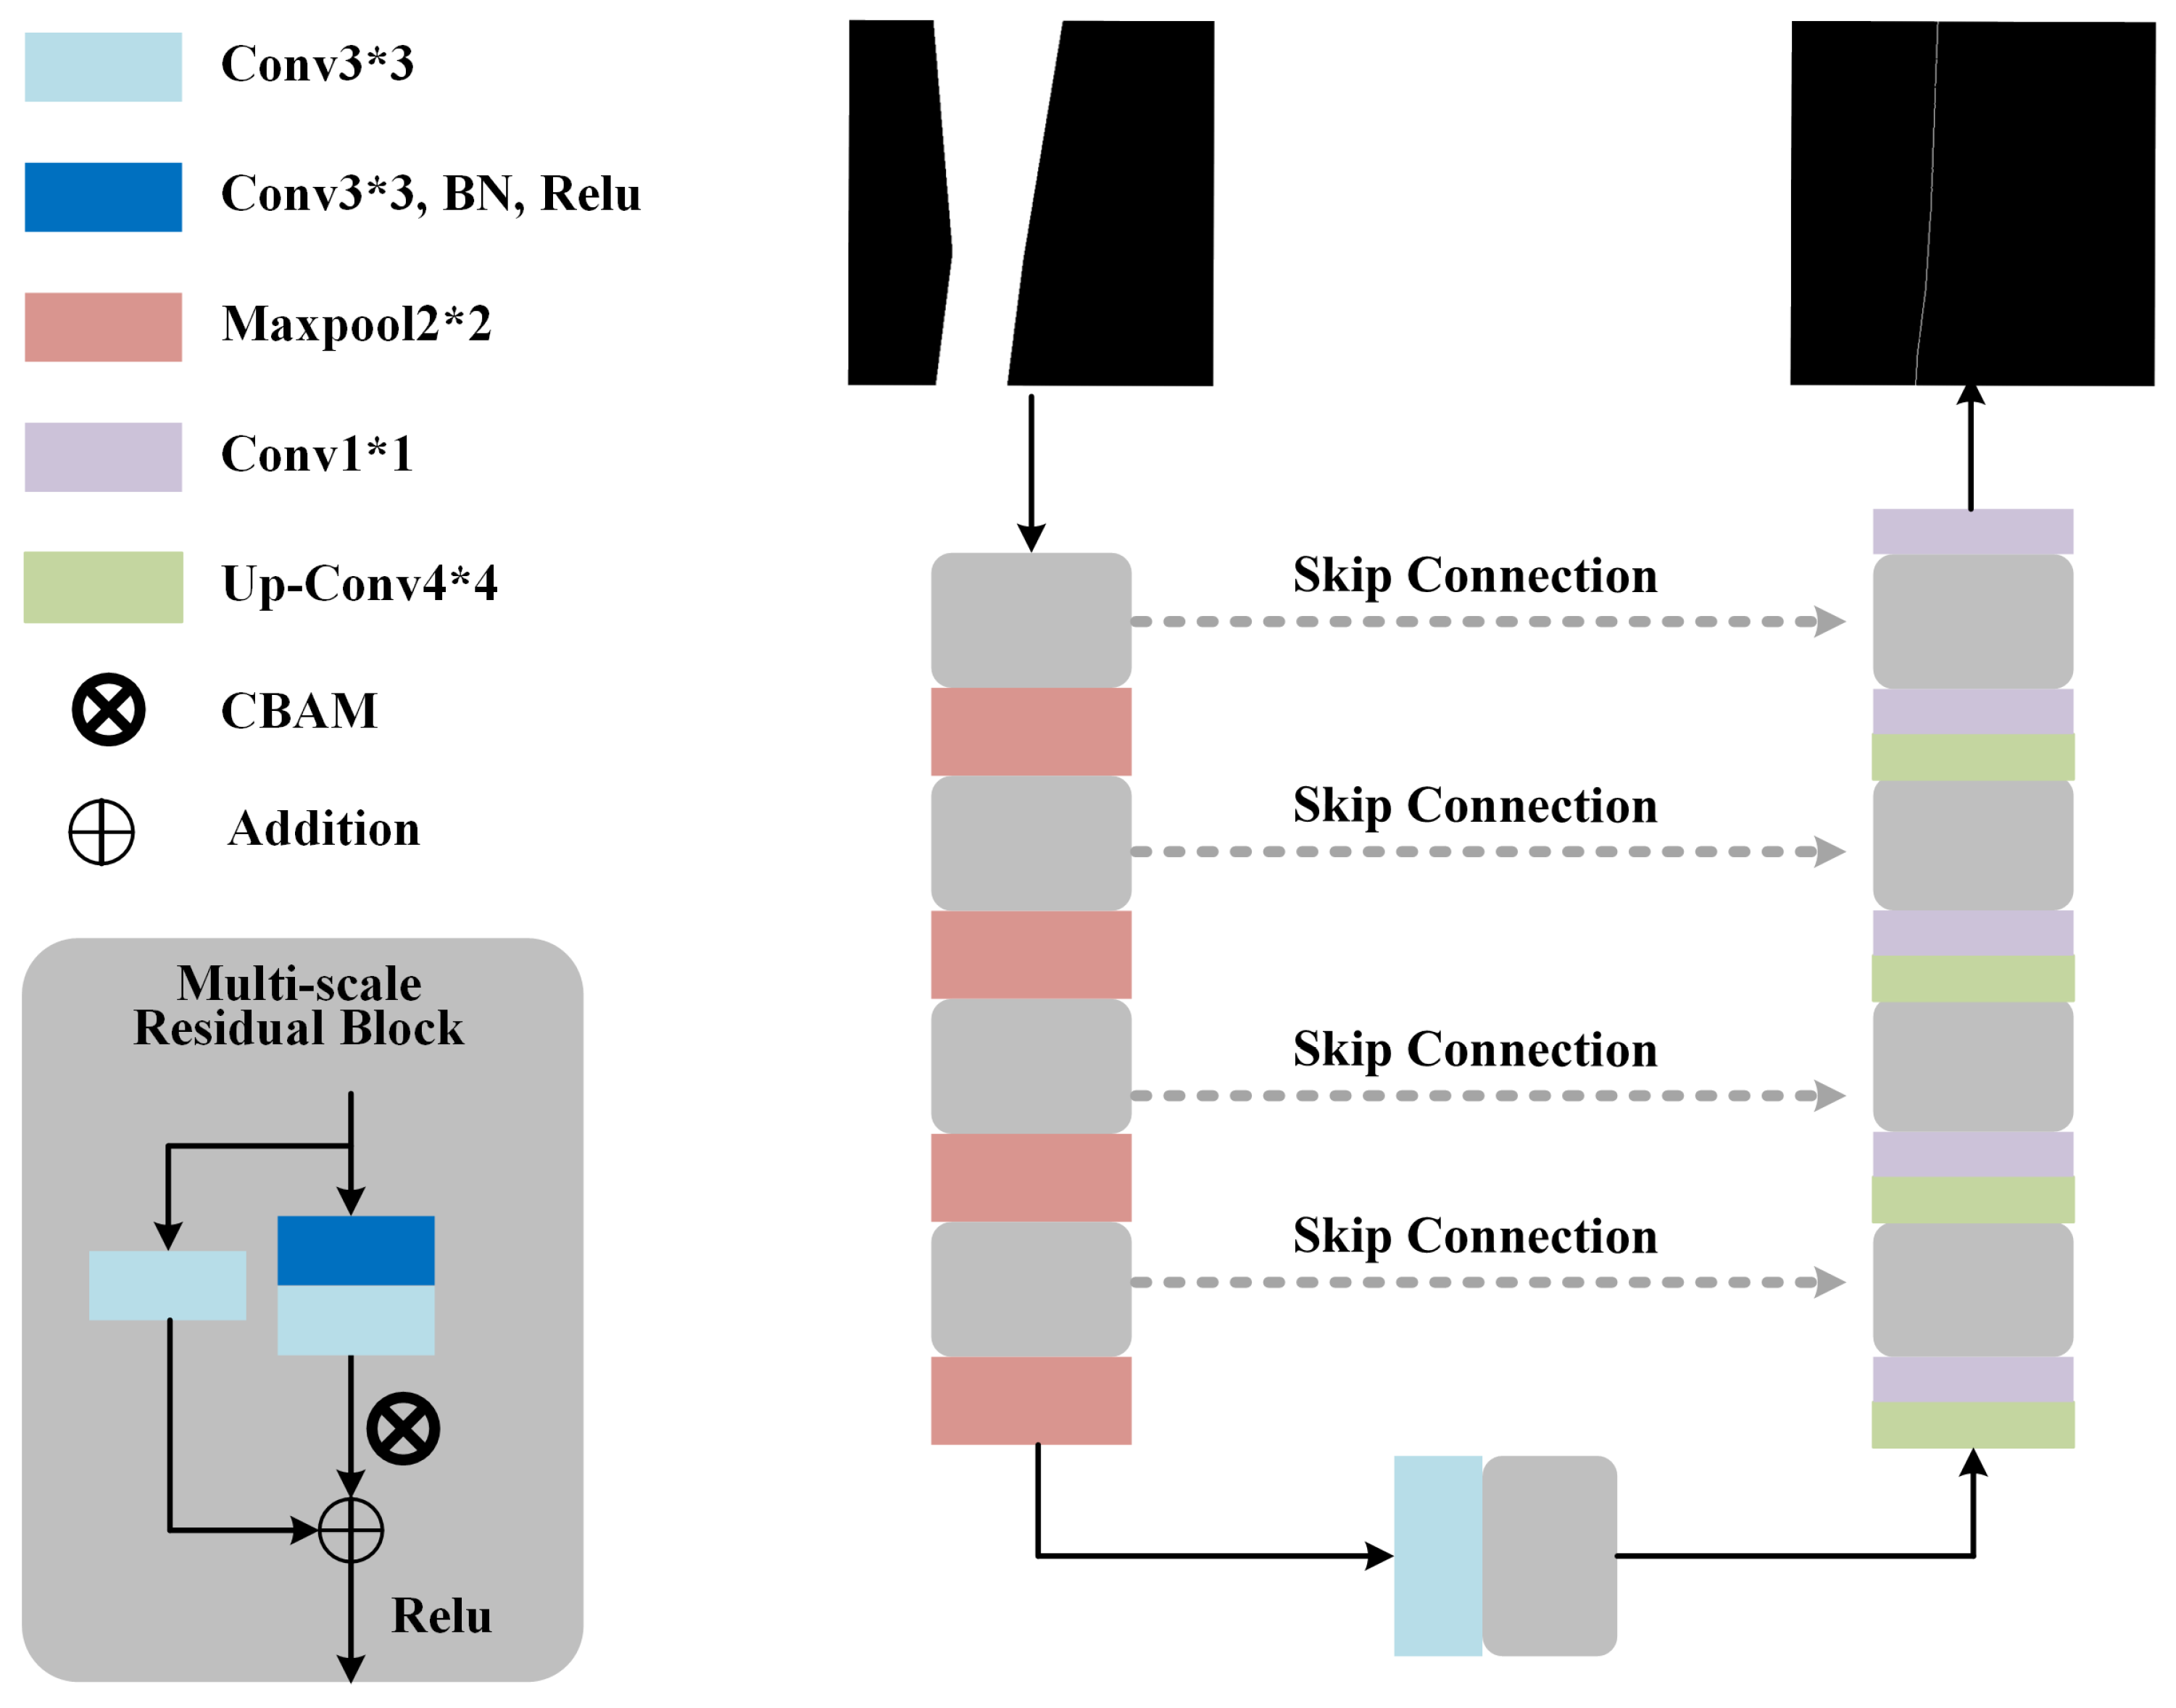
The river centerline extraction task aims to further derive the geometric structural information of river channels from river-mask features, enabling accurate localization of the river centerline. This task takes the mask feature maps produced by the river-mask segmentation branch as input and predicts the corresponding centerline probability maps, thereby completing a hierarchical transition from semantic region recognition to geometric structure representation and serving as a critical linkage between semantic and geometric modeling within the overall network. The sub-network architecture used to accomplish this task is illustrated in Figure 2.
The model adopts a U-Net-style encoder–decoder architecture [28,29,30,31] as the backbone to enhance structural preservation for linear targets. Both the encoder and decoder are constructed by stacking multi-scale residual blocks, which progressively extract and reconstruct centerline structures through hierarchical feature modeling. The encoding stage consists of four residual encoding units, each followed by max-pooling for successive downsampling, enabling the learning of multi-scale structural representations. During decoding, spatial resolution is gradually restored through corresponding upsampling operations, and feature maps at matching scales from the encoder are fused via skip connections. The concatenated features are then passed through residual blocks for integrated reconstruction. To strengthen structural awareness of the river centerline, a Convolutional Block Attention Module (CBAM) [39] is embedded within each residual block to jointly model feature responses along both the channel and spatial dimensions. This attention mechanism emphasizes the central river regions while suppressing background interference, thereby improving the accuracy and robustness of centerline localization.
Finally, the decoder outputs a centerline probability map with the same spatial resolution as the input mask features, representing the spatial distribution of the river centerline. In addition, intermediate features from different encoder stages are preserved and forwarded to the subsequent river-width regression branch as structural priors, where they participate in cross-stage feature fusion to provide high-quality geometric constraints for accurate width estimation.

3.1.3. River-Width Regression Task

The river-width regression task aims to perform pixel-wise continuous regression of river width. This task takes the river-mask output as the primary input and employs a cross-branch feature fusion mechanism to jointly incorporate complementary information from multiple sub-tasks, enabling a unified mapping from the learned feature representation to continuous river-width values.
To comprehensively characterize river geometry across multiple spatial scales, the river-width regression sub-network first employs a multi-scale feature encoding module to encode the river mask. The multi-scale encoding process produces four hierarchical feature representations:
{ M 1 , M 2 , M 3 , M 4 } , M i R B × C i × H i × W i .
where M 1 denotes shallow features and M 4 denotes deep features. These representations correspond to different spatial resolutions and receptive fields, forming a hierarchical feature hierarchy that progressively transitions from fine-grained spatial details to high-level semantic abstractions.
On the basis of the multi-scale encoding, a spatial self-attention module is introduced to further model the deep feature M 3 , enhancing the model’s capability to perceive complex river morphologies. This module performs contextual modeling via a local-window self-attention mechanism [40,41], which balances computational efficiency with the integration of both local and global contextual information, thereby producing a structure-enhanced spatial self-attention feature M 3 attn . The spatial self-attention feature M 3 attn , together with the multi-scale encoded features, is subsequently used as key input for the cross-branch feature fusion.
Finally, the river-width decoding head generates the width prediction based on the fused feature map obtained from the cross-branch feature fusion module. The decoding head consists of a single-channel convolution layer followed by a ReLU activation function, producing a non-negative real-valued river-width prediction map W ^ R 0 B × 1 × H × W .

3.2. Feature-Guided Cross-Branch Fusion Mechanism

To achieve effective feature-level guidance for river-width regression, we introduce a cross-branch feature fusion module within the river-width regression sub-network, as illustrated in Figure 3. This module is designed to enable collaborative feature interaction among the river-mask segmentation branch, the river centerline extraction branch, and the river-width regression branch.
Taking the multi-scale encoded features from the regression branch as the backbone, semantic and textural features from the mask segmentation branch, as well as geometric structural features from the centerline extraction branch, are progressively incorporated during the decoding and upsampling stages. In addition, a spatial self-attention feature is injected at intermediate fusion stages. Through multi-level skip connections and feature concatenation, a fused representation is constructed that jointly captures local and global context, as well as semantic and structural information.
An attention mechanism is further applied to reweight feature responses along both the channel and spatial dimensions, guiding the network to focus on river-relevant regions and improving feature integration efficiency, thereby effectively facilitating continuous river-width regression.

3.3. River-Width Extraction from Width-Response Distribution with Structural Constraints

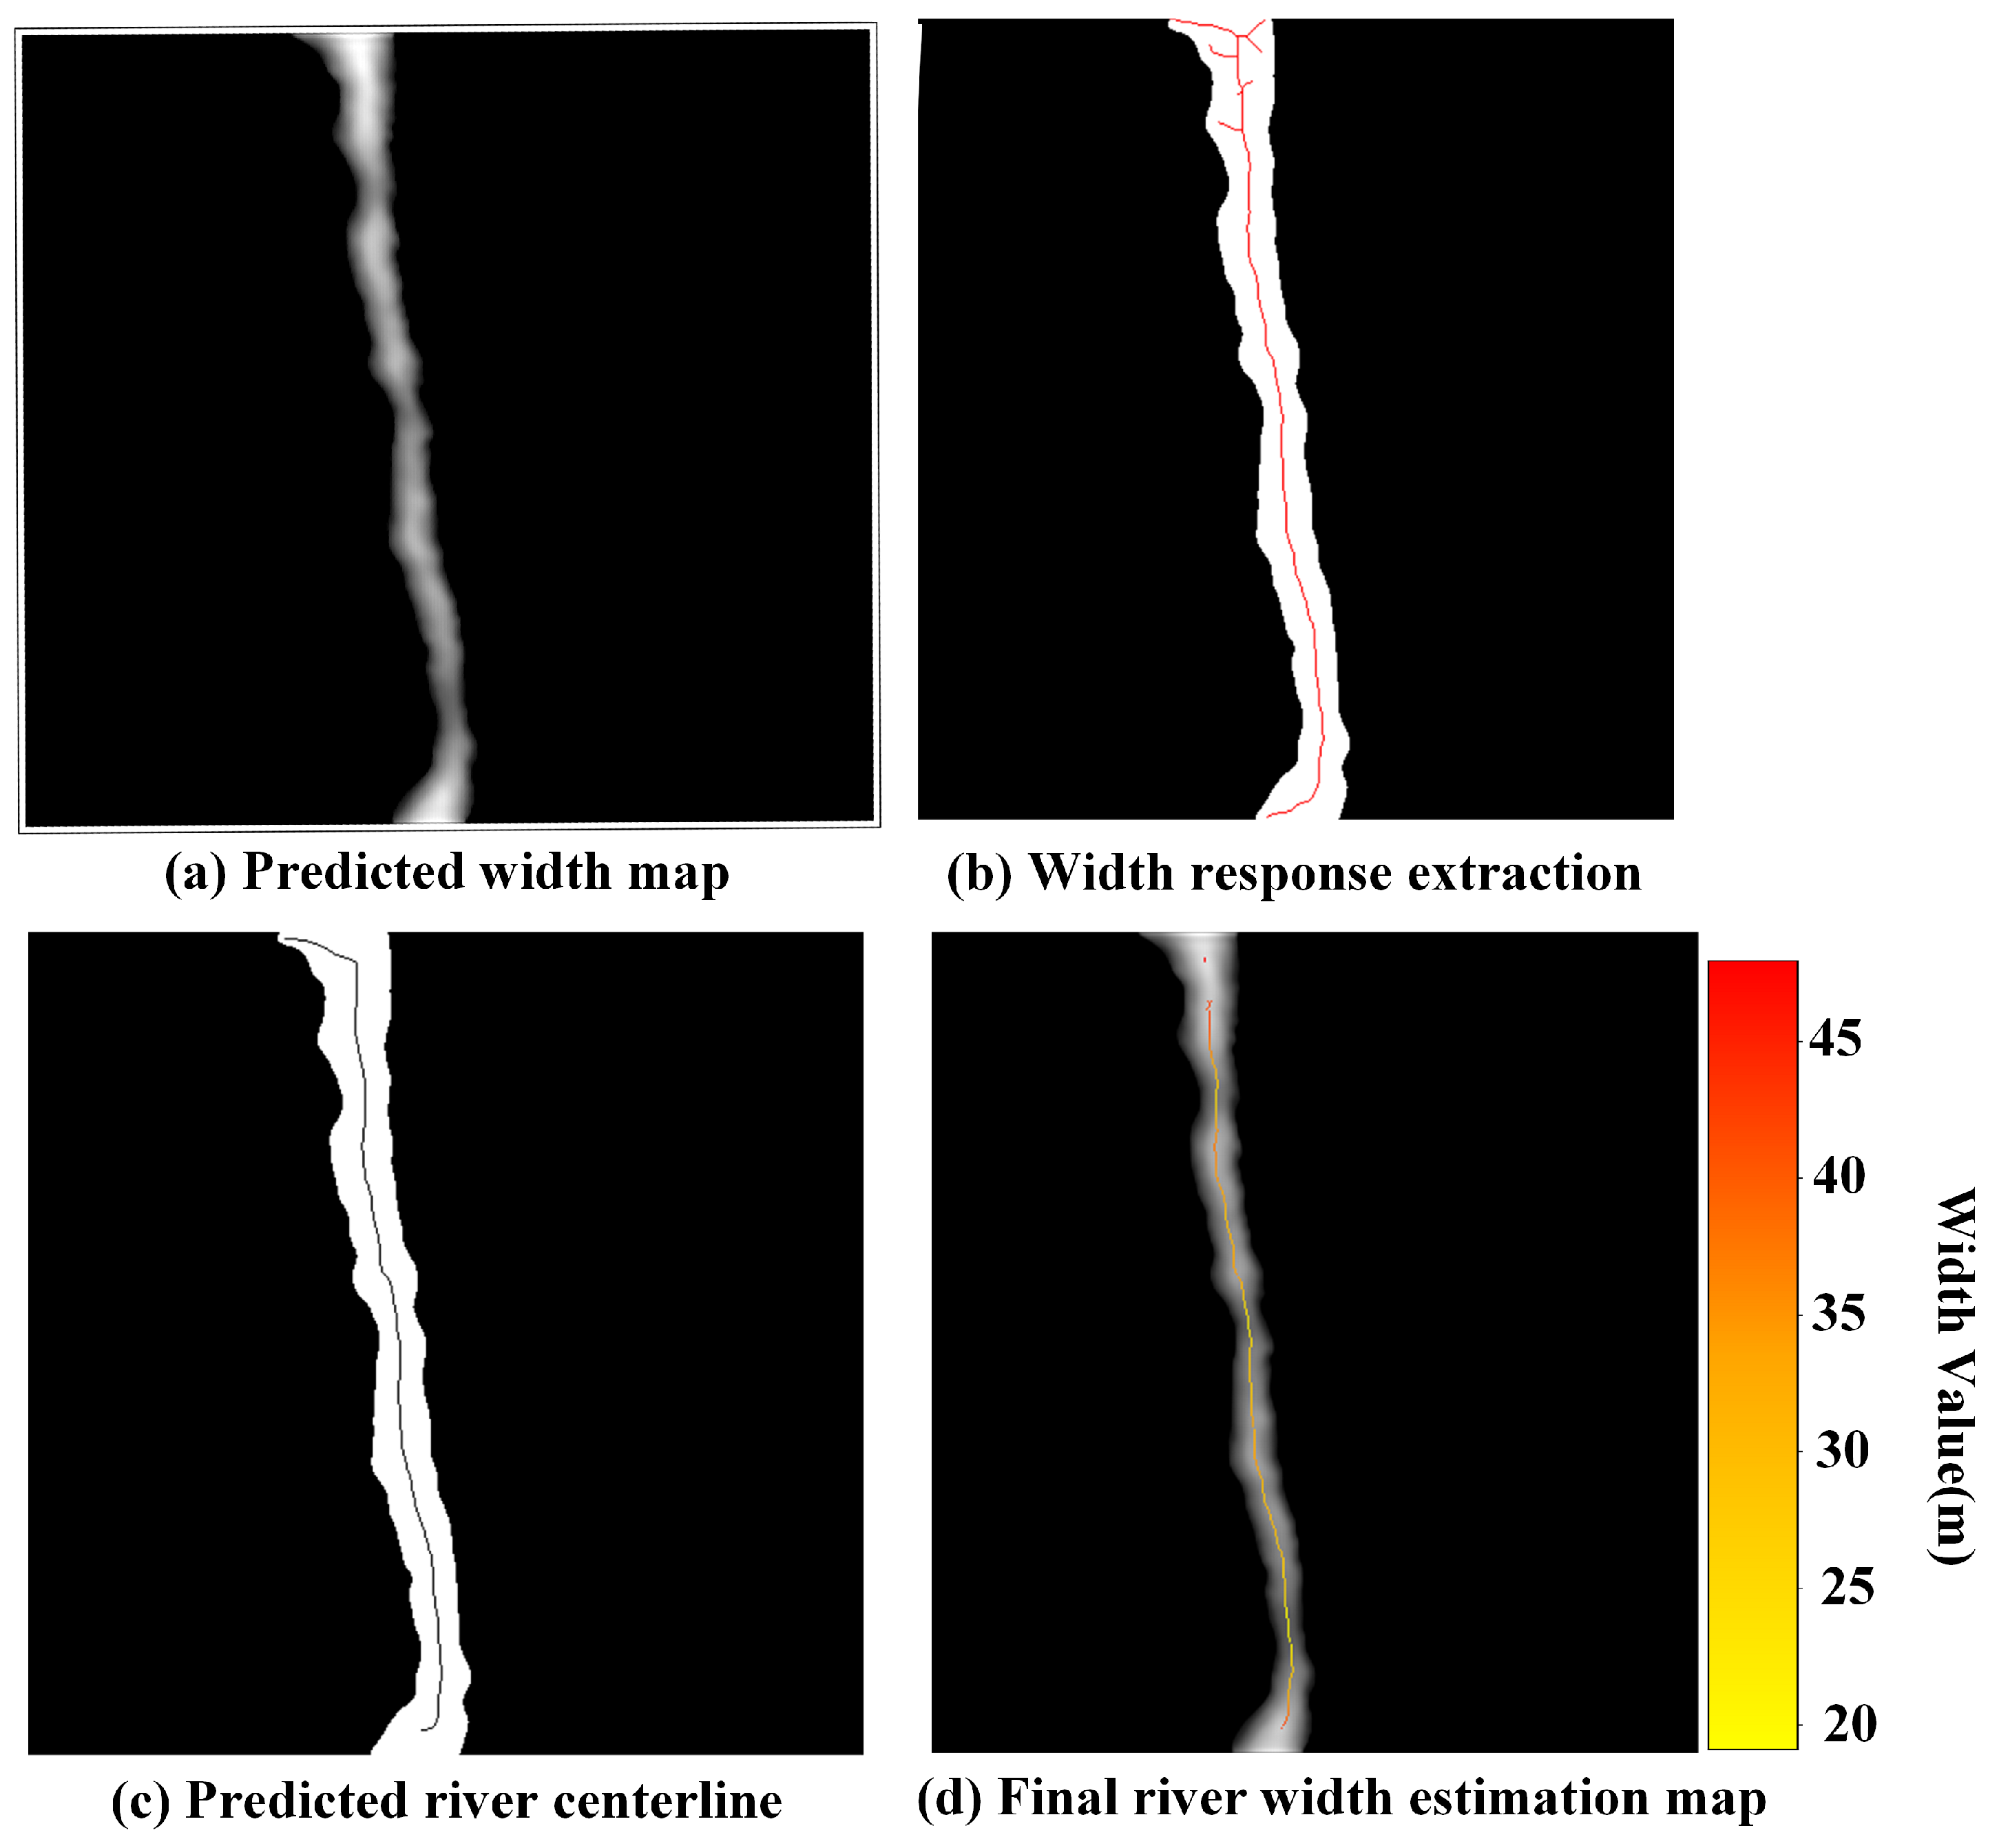
The river-width regression sub-network produces a continuous raster width map, which can be interpreted as a spatial width-response field. Within river regions, pixel values form a pronounced high-response distribution, as illustrated in Figure 4a. Based on this response characteristic, the high-response bands in the width map can be extracted to provide an initial spatial representation of river width. However, when extracting features from a continuous response field, multiple candidate response ridges are often produced, leading to evident redundant responses, as shown in Figure 4b.
The proposed end-to-end multi-task network simultaneously incorporates a centerline extraction task and a river-width regression task, which are jointly optimized during training. As a result, the predicted centerline and the high-response distribution in the width map exhibit strong spatial geometric consistency, as illustrated in Figure 4c. This consistency provides a reliable structural basis for further refinement. Therefore, the predicted centerline is introduced as an auxiliary structural constraint to guide the selection of valid response ridges and suppress redundant responses. As a result, the final river-width results can be distributed more consistently and stably along the river course, as illustrated in Figure 4d.

3.4. Loss Functions and Training Strategy

3.4.1. Loss Function

The proposed model adopts a multi-task learning framework, in which the river-mask segmentation task and the centerline extraction task serve as auxiliary tasks to facilitate the main river-width regression task. Owing to the substantial differences among the sub-tasks in terms of learning objectives and output formats, a single unified loss function is insufficient to provide effective supervision for all branches. Therefore, task-specific loss functions are designed for each branch to fully exploit task-related characteristics and guide the network toward learning more discriminative multi-dimensional representations, enabling targeted optimization.
For the river-mask segmentation branch and the centerline extraction branch, both tasks are formulated as pixel-wise binary classification problems. To mitigate the severe class imbalance between target pixels (river or centerline) and background pixels, a Weighted Cross-Entropy (WCE) loss is adopted. Let the proportion of pixels belonging to class k { 0 , 1 } in the training set be denoted as p k , where k = 0 represents the background class and k = 1 denotes the target class. The corresponding class weight w k is defined as:
w k = 1 log γ + p k , k { 0 , 1 } .
where γ > 1 is a smoothing factor introduced to avoid numerical instability.
The Weighted Cross-Entropy loss is formulated as:
L WCE = 1 H W x = 1 H y = 1 W k = 0 1 w k y k ( x , y ) log p ^ k ( x , y ) .
where H and W denote the height and width of the image, respectively; y k ( x , y ) is the ground-truth label of pixel ( x , y ) for class k; and p ^ k ( x , y ) is the predicted probability that the pixel belongs to class k.
For the river-width regression branch, considering that river-width estimation is a continuous-valued regression task, a hybrid Root-Mean-Square Error (RMSE) loss is employed to jointly account for global prediction accuracy and local precision within the river region. The loss function is defined as:
L RMSE = λ g 1 H W ( x , y ) W ^ ( x , y ) W ( x , y ) 2 + λ r 1 N r ( x , y ) R W ^ ( x , y ) W ( x , y ) 2 .
where W ^ ( x , y ) denotes the predicted river width at pixel ( x , y ) , W ( x , y ) is the corresponding ground-truth width value, R = { ( x , y ) W ( x , y ) > 0 } represents the set of pixels within the true river region, N r = | R | is the number of river-region pixels, and λ g and λ r are balancing coefficients for the global and region-specific error terms, respectively.

3.4.2. Training Strategy

To fully exploit the structural advantages of the proposed stage-guided multi-task network and to ensure effective coordination among the sub-tasks during joint optimization, a staged training strategy aligned with the model architecture is adopted. This strategy follows the inherent prior dependencies among the three tasks—river-mask segmentation, centerline extraction, and river-width regression. Specifically, the river-mask branch delineates valid river regions and provides spatial boundary constraints for both centerline localization and width estimation, while the centerline task characterizes the river’s main axis and directly constrains the geometric localization of river width. If all tasks are jointly optimized in an end-to-end manner in the early stage of training, unstable semantic localization can introduce noisy gradients, thereby hindering the convergence of the subsequent regression task.
Based on these considerations, the training process is divided into three successive stages. In the first stage, only the river-mask branch is trained by optimizing the segmentation loss to establish a stable river-body prior. In the second stage, the parameters of the mask branch are frozen, and only the centerline extraction branch is optimized, allowing the network to focus on precise centerline localization under fixed mask guidance. In the third stage, both the river-mask and centerline branches are kept fixed, and only the river-width regression branch is trained to perform continuous-valued regression under stable semantic and structural constraints.
This staged training strategy progressively propagates stable and reliable semantic and structural information to the width regression branch according to the task dependencies, effectively alleviating gradient conflicts among branches in multi-task joint optimization and improving convergence stability and overall predictive performance.

4. Experimental Section

4.1. Construction of the RiverWidth-HR Dataset

4.1.1. Data Sources

To construct a high-precision river-width dataset suitable for deep learning-based width prediction, two representative study areas were selected in Wuhan City, Hubei Province, China, and Qingyuan City, Guangdong Province, China, respectively. The selection of these study areas was intended to cover diverse geomorphological environments and river morphologies, thereby enhancing the model’s generalization capability under heterogeneous natural conditions.
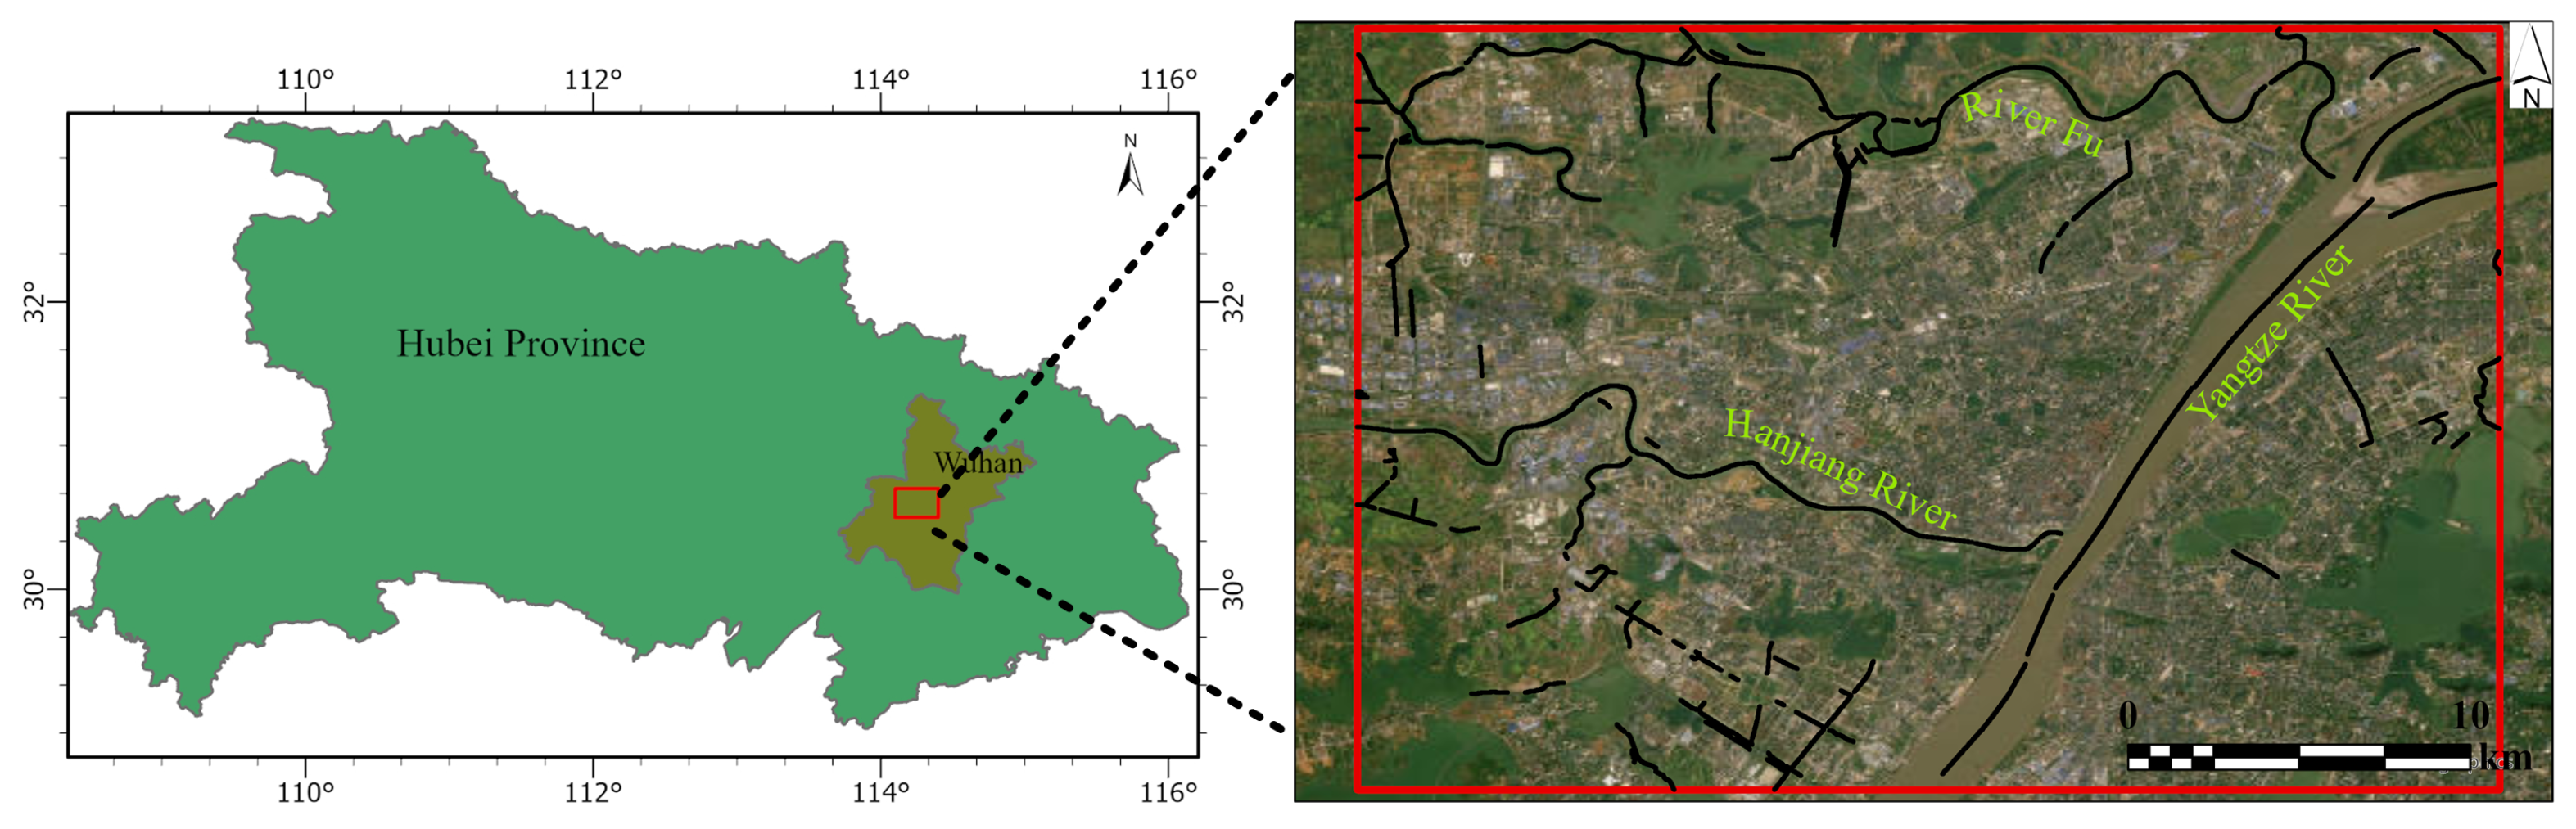
The Wuhan study area is located in the main urban and peri-urban regions of Wuhan City, with a geographic extent of 114.1–114.4°E and 30.5–30.7°N, as illustrated in Figure 5. The river system within this area comprises the main stem of the Yangtze River, two major first-order tributaries (the Han River and the Fu River), and numerous minor branches. This configuration forms a multi-scale sample composition of “main stem rivers–major tributaries–minor branches”, which facilitates the learning of width representations for large rivers and confluence scenarios. The total area of the study region is approximately 640 km2, with a cumulative effective river length of about 134 km.
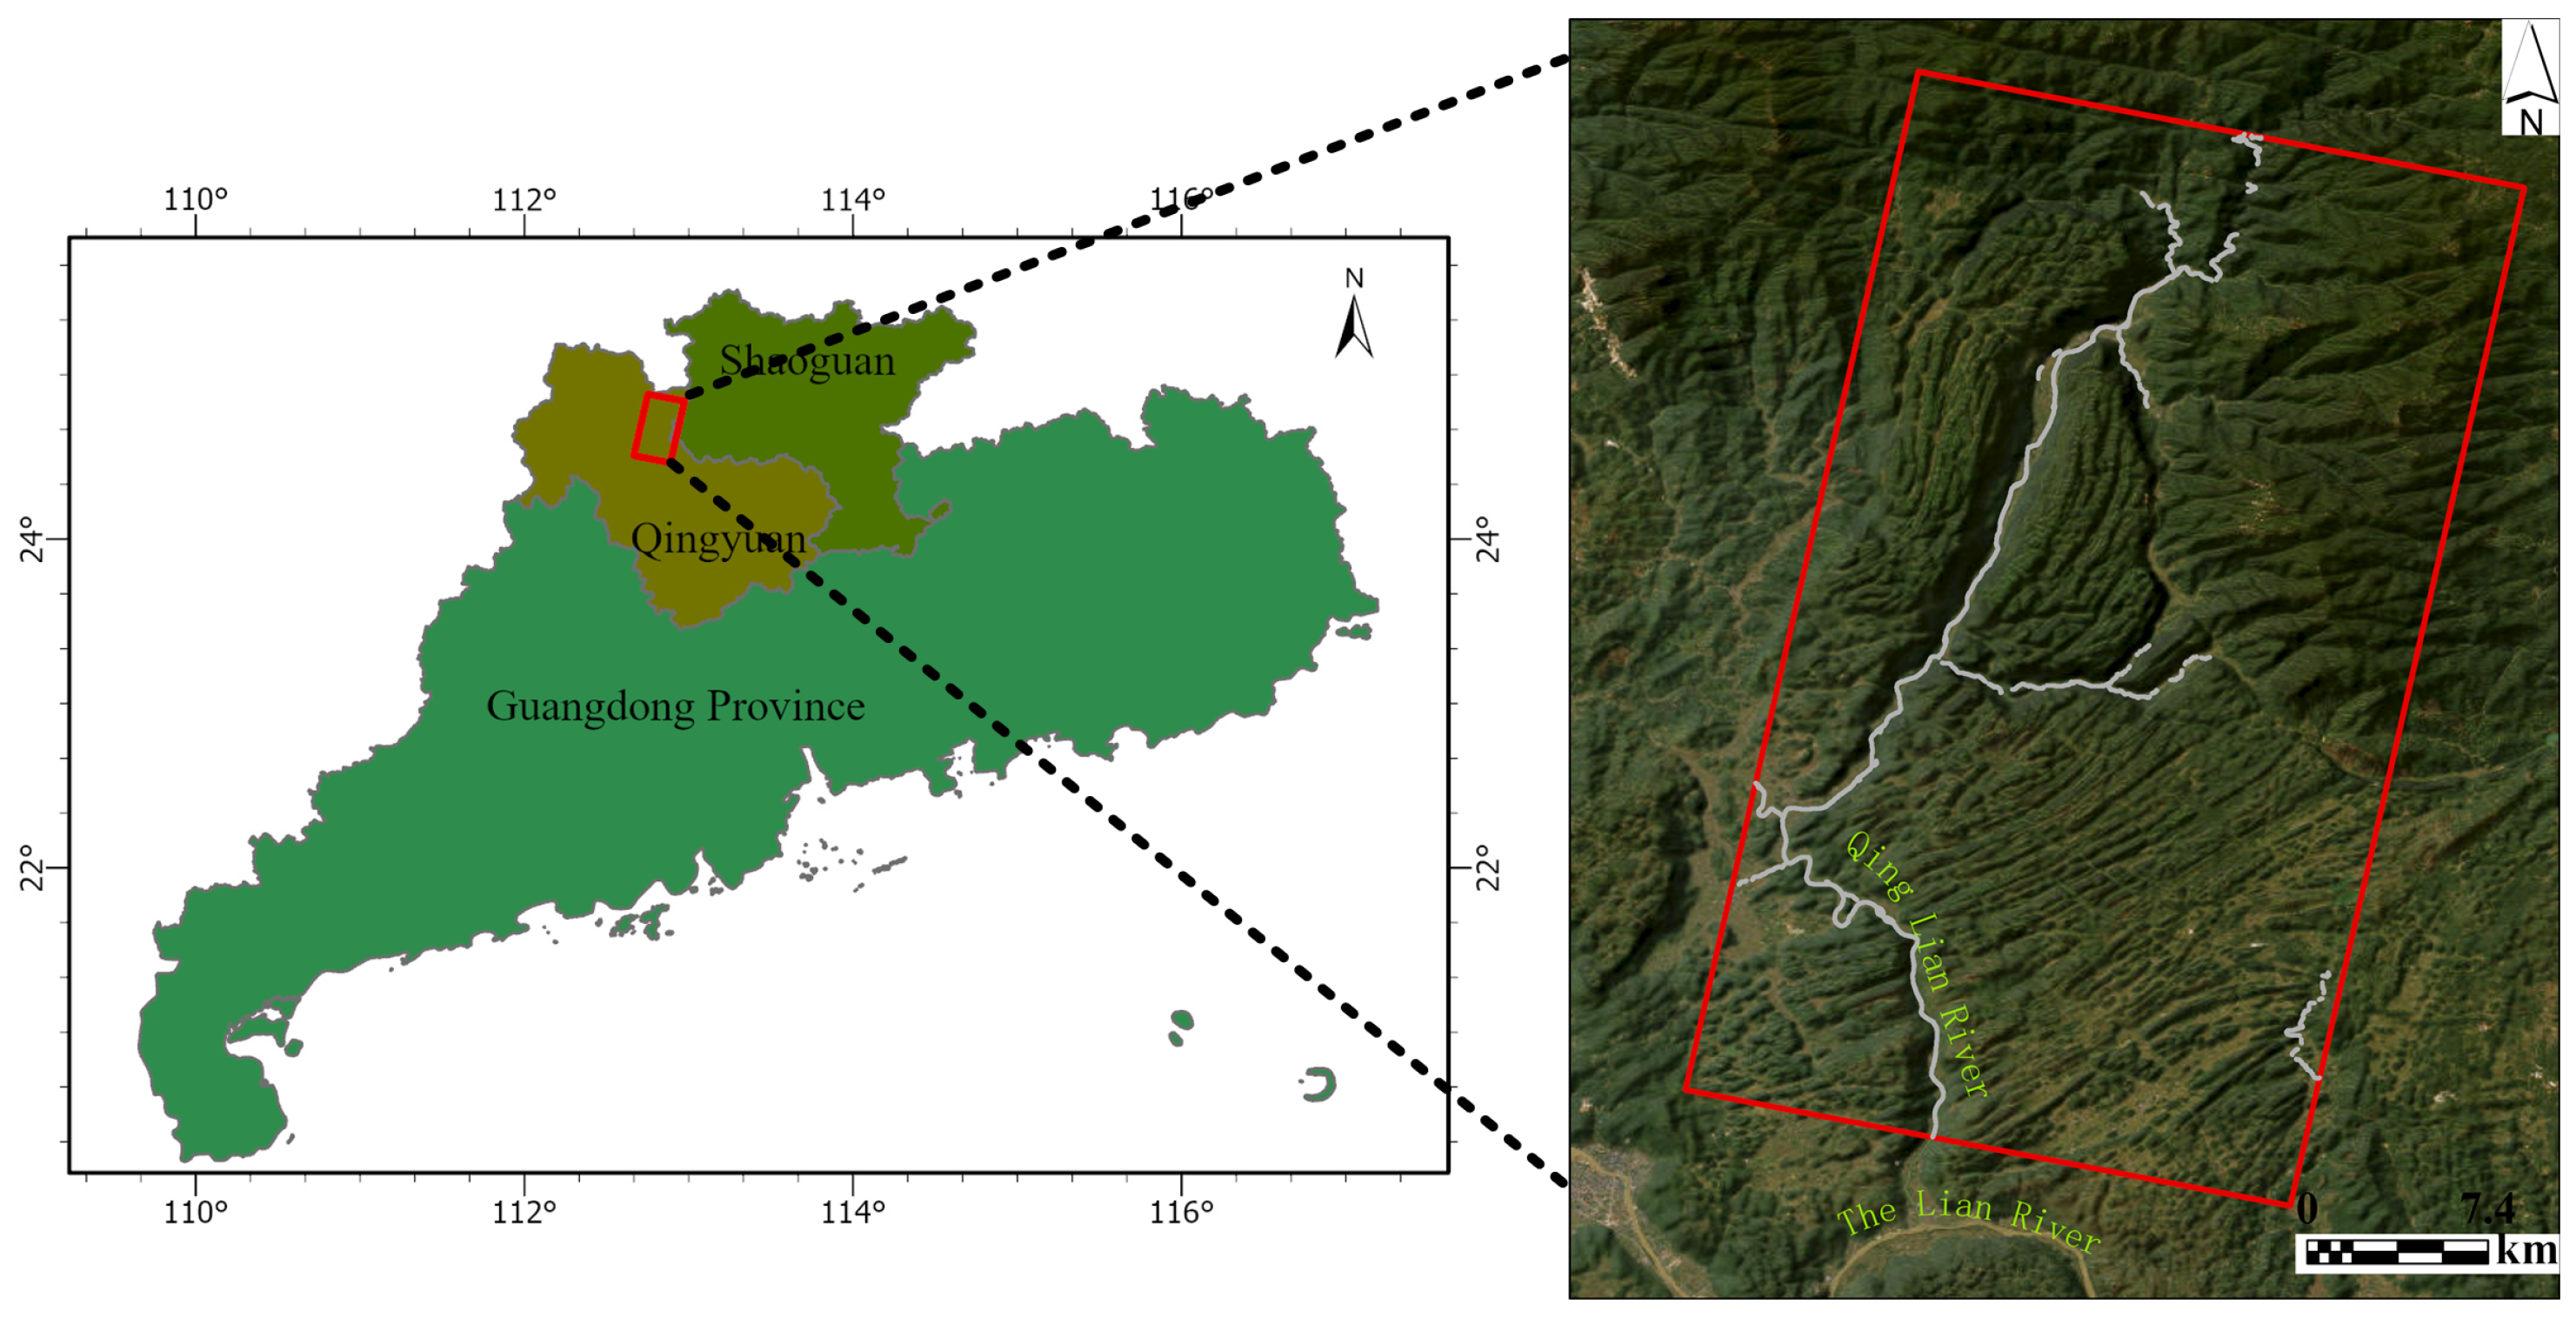
To further enhance the model’s generalization across different hydrological and geographical conditions, a second study area was selected in the border region between Qingyuan City and Shaoguan City, Guangdong Province, with a geographic extent of 112.66–112.97°E and 24.46–24.88°N, as illustrated in Figure 6. This area is dominated by the Qinglian River system, a first-order tributary of the Lian River main stem, and is accompanied by numerous small mountainous streams characterized by highly sinuous channel patterns. In contrast to the large-river-dominated Wuhan region, this study area represents a mountainous and hilly narrow-channel river system, which provides strong training constraints for rivers narrower than 30 m and highly curved riverbanks. The total area of this study region is approximately 980 km2, with a cumulative effective river length of about 80.8 km.
Neither of the two study areas is covered by existing high-precision river-width datasets, and a pronounced data gap exists, particularly at the scale of small and medium-sized rivers. In this study, river reaches were discretized into width-based classes, including small rivers (<30 m), medium rivers (30–60 m), and large rivers (>60 m). The threshold values were defined by considering both hydrological significance and the representational capability of commonly used medium-resolution imagery for river network characterization. The statistical distribution of river-width categories in the two study areas is summarized in Table 1.

4.1.2. Data Processing

The river-mask data were derived from the national 1 m resolution land-cover product [42]. This product provides a fine-grained classification system covering multiple land-cover categories, such as cropland, forest, and water bodies, thereby offering a reliable baseline for water-body delineation in this study. Based on the water-body class extracted from this product, non-river water bodies, including lakes, reservoirs, and ponds, were first automatically identified and removed using geometric descriptors such as the perimeter-to-area ratio and shape index. The algorithmic screening results were then further refined through manual interpretation, resulting in accurate river-mask data for the study areas.
Based on the refined river masks, the RWC algorithm was employed to automatically generate river centerlines and the corresponding initial river-width estimates. This algorithm can substantially reduce the workload associated with manual field measurements and visual interpretation. However, due to the complexity of river morphology and the inherent limitations of the algorithm, the automatically generated results may still exhibit centerline misalignment or width estimation errors in certain areas. To ensure the accuracy and consistency of the annotation data, the outputs of the RWC algorithm were manually corrected using the spatial editing tools in ArcGIS Pro 3.0.0. The corrections mainly involved adjusting the centerline positions and rectifying abnormal width values. In this study, river width is defined as the river-surface width determined by the observable river boundaries in optical remote sensing imagery. During the annotation process, exposed sandbars, lateral bars, and other non-water geomorphic units were excluded from width measurements. For areas affected by vegetation occlusion or aquatic vegetation coverage, the river width was delineated according to the identifiable water boundaries in the imagery. Through this semi-automatic annotation workflow, standardized river centerline and river-width reference data that meet the required accuracy criteria were ultimately obtained.
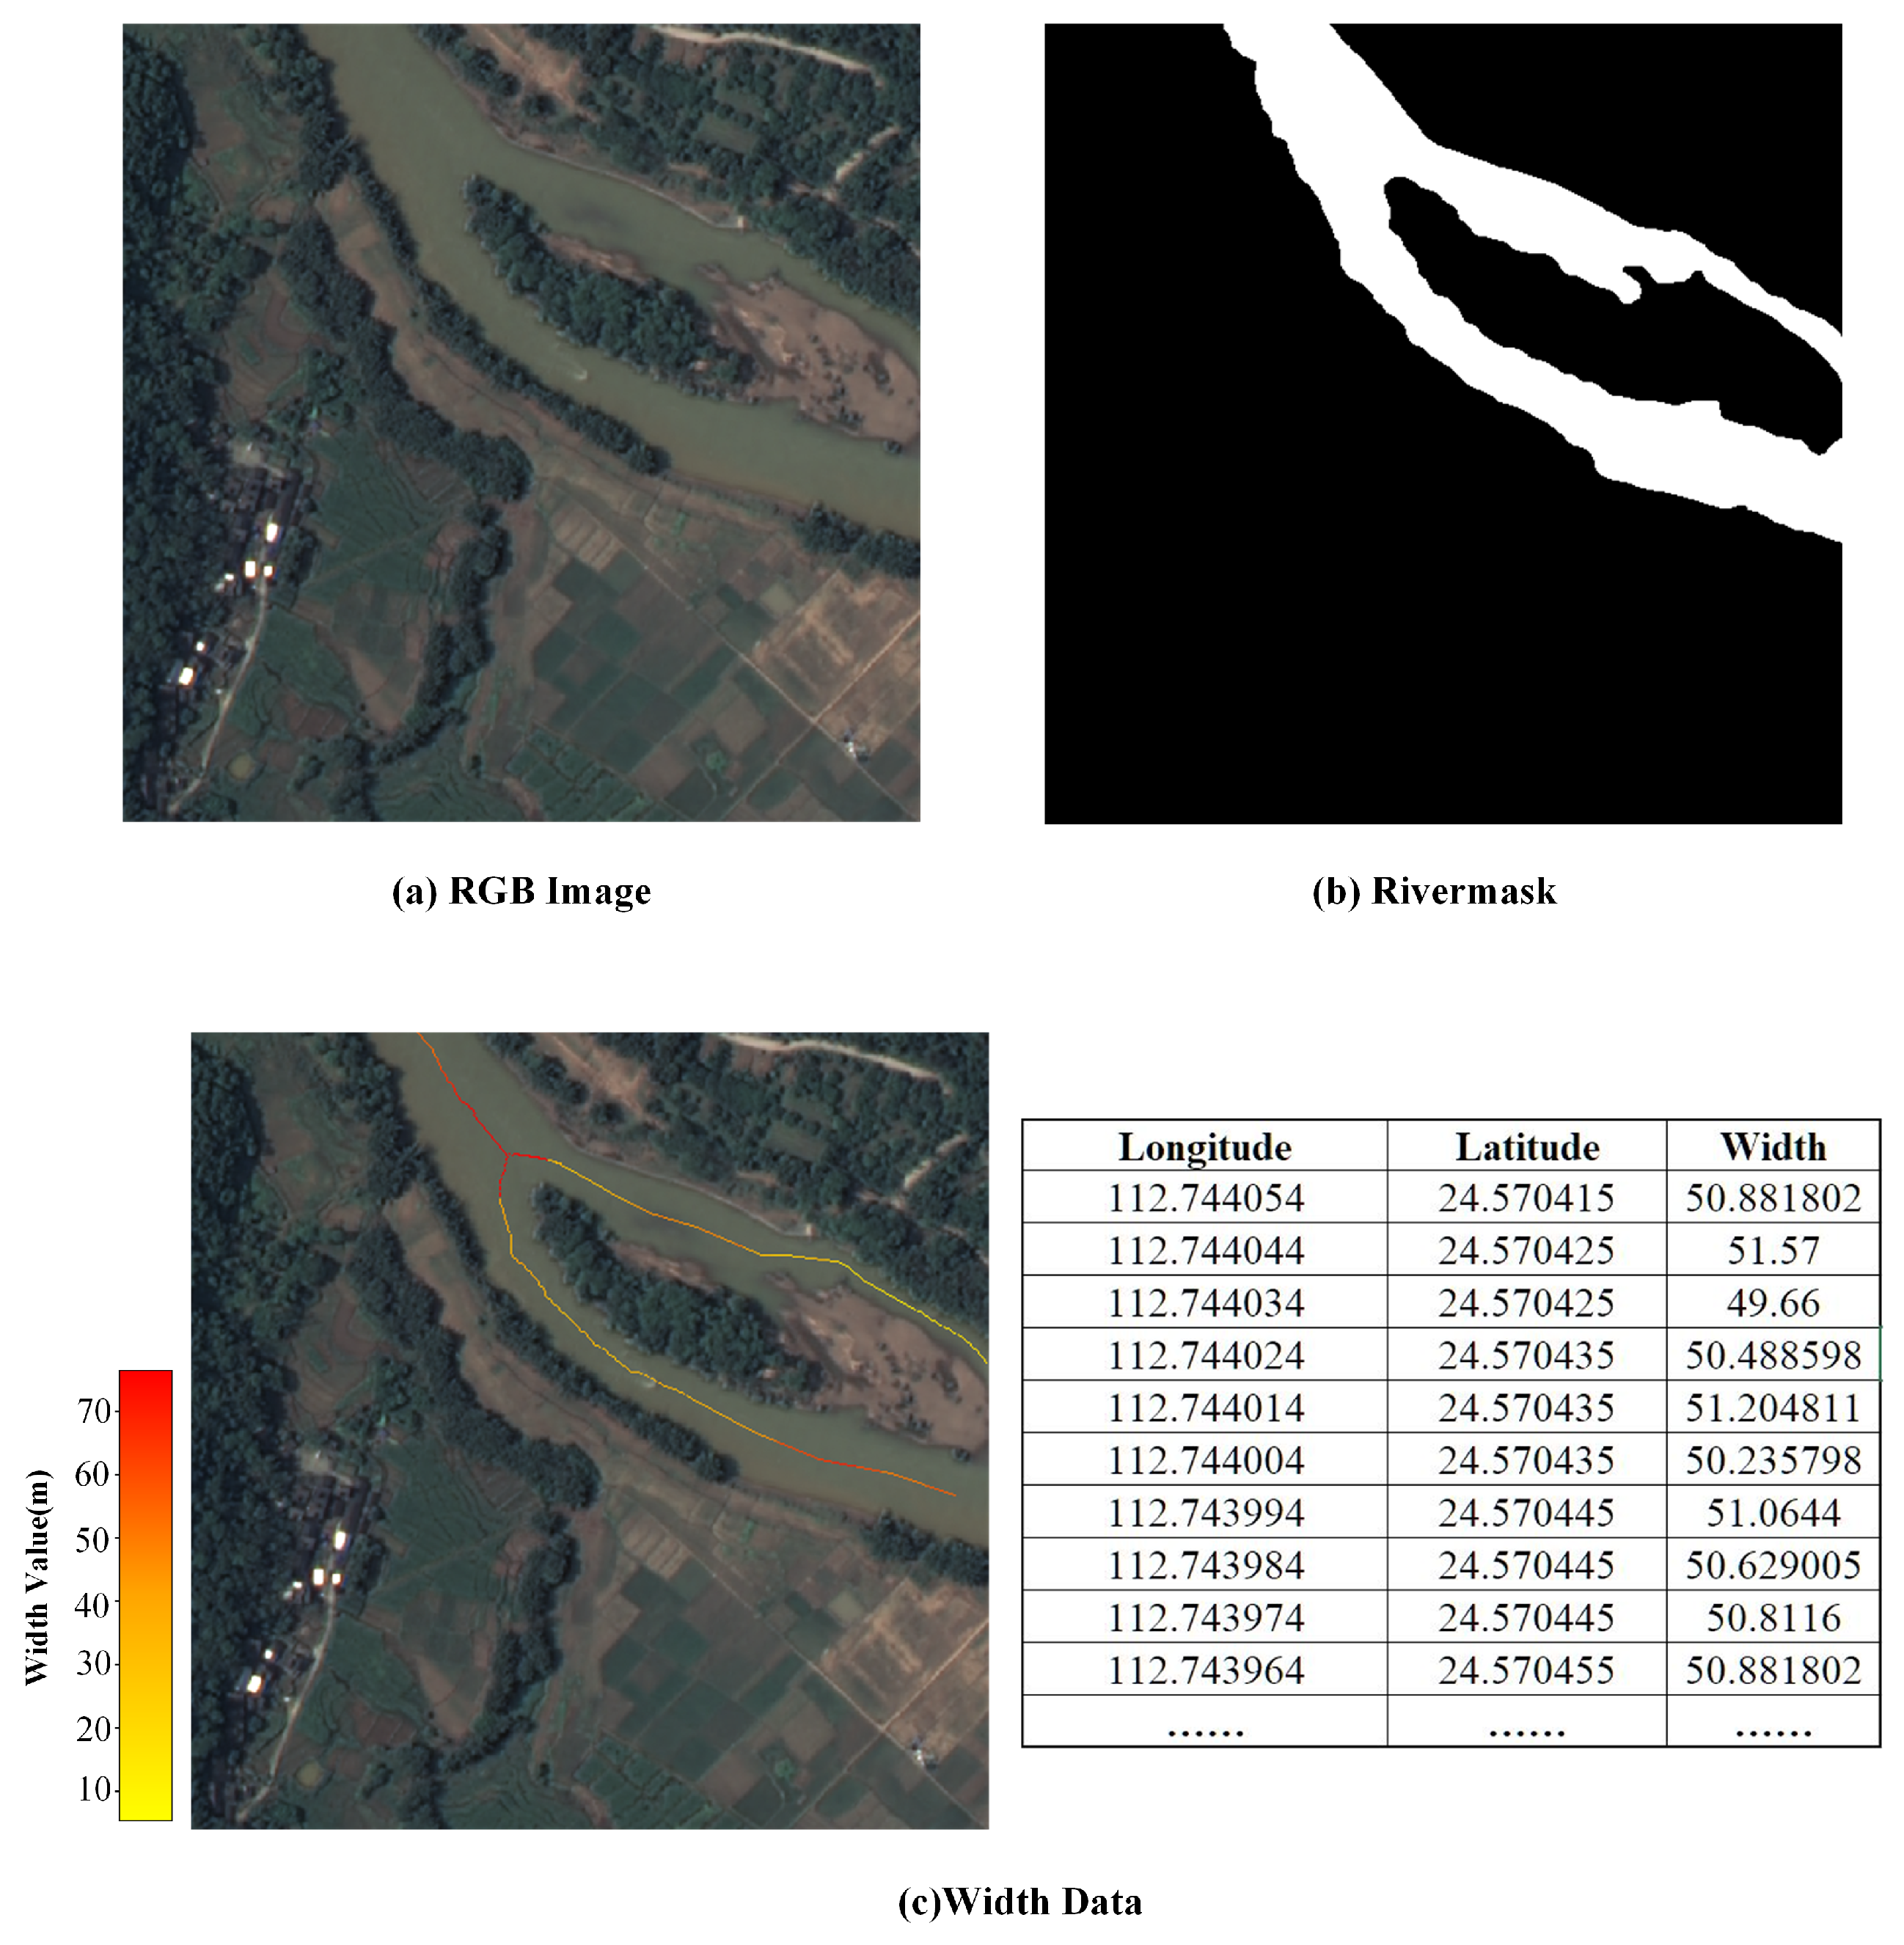
Based on the 1 m resolution GF-2 optical remote sensing imagery, together with the manually refined river masks, centerlines, and river-width annotations, the RiverWidth-HR Dataset, a structured sample dataset, was constructed for the river-width regression task. Each sample is defined as a 512 × 512 pixel image patch, which preserves sufficient spatial context while maintaining computational efficiency. As illustrated in Figure 7, each sample unit consists of a “triplet”: (1) a 512 × 512 RGB optical remote sensing sub-image; (2) a binary river-mask sub-image covering the same spatial extent (river pixels labeled as 255 and background as 0); and (3) a river-width annotation file that records the geographic coordinates of all centerline points within the patch and their corresponding river-width values. Spatial consistency among the imagery, mask, and width annotations is strictly ensured through coordinate-based matching.
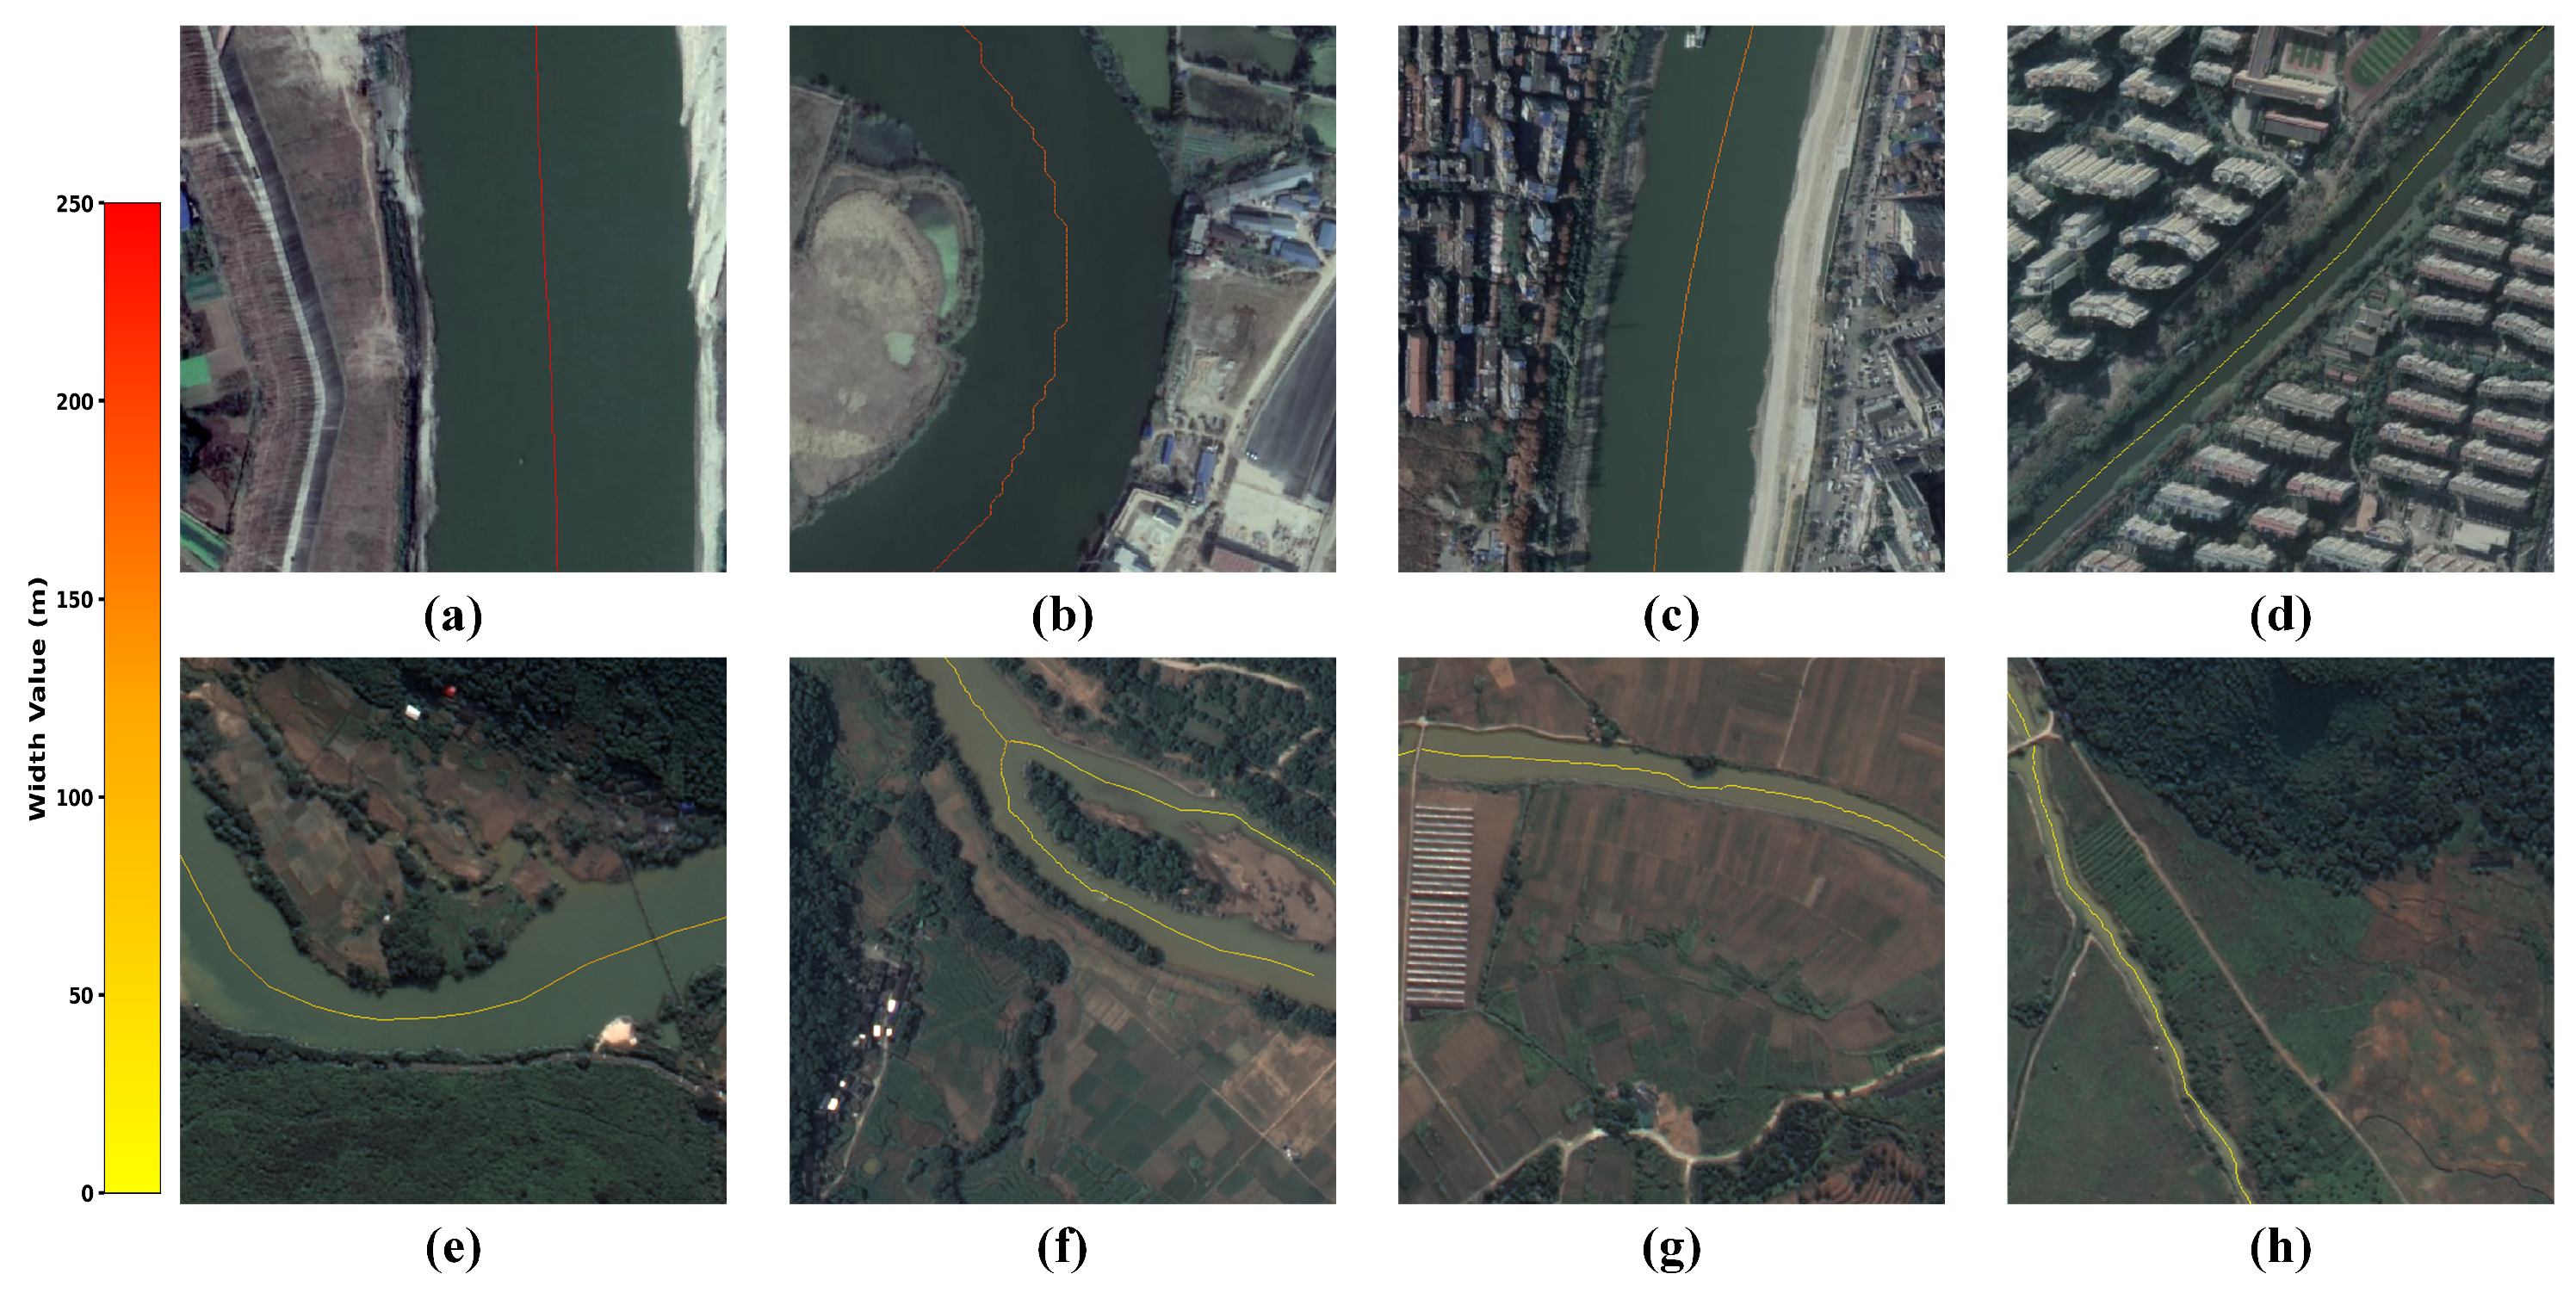
During sample cropping, a dual-offset sliding-window strategy is adopted to mitigate the spatial bias introduced by fixed cropping origins, thereby enabling more diverse representations of river positions and morphologies within the sub-images. To further enhance the model’s robustness to varying river orientations, rotation-based data augmentation is applied, and samples with incomplete river structures are removed through quality control. After augmentation and filtering, a total of 3040 sample units are obtained. The dataset is partitioned into training, validation, and test sets at a ratio of 7:2:1. The resulting dataset covers multiple river-width scales, diverse geomorphological environments, and complex channel morphologies, as illustrated in Figure 8.
Through rigorous annotation, strict spatial consistency constraints, and systematic quality control, the RiverWidth-HR Dataset provides reliable supervision for the proposed river-width estimation model and serves as a valuable data resource for future river-width research. The RiverWidth-HR Dataset is publicly available at: https://github.com/zhengxt-google/RiverWidth-HR-Dataset (accessed on 10 January 2025).

4.2. Implementation Details

The proposed method is implemented within the PyTorch 2.1 framework, and all experiments are conducted on a single-GPU environment equipped with an NVIDIA GeForce RTX 3090 (24 GB memory) (Nvidia Corporation, Santa Clara, CA, USA). The input RGB optical remote sensing imagery is cropped into patches of 512 × 512 pixels. The proposed E2E-SGRWNet comprises three task branches: river-mask segmentation, centerline extraction, and river-width regression. The river-mask segmentation branch adopts ResNet-101 [43] as the backbone network. In the river-width regression branch, EfficientNet-B5 [44] is employed as the feature-extraction backbone, with multi-scale feature channel dimensions set to [ 32 , 56 , 160 , 272 ] .
Model training uses the stochastic gradient descent (SGD) optimizer with a momentum of 0.9 and a weight decay of 5 × 10 4 . The base learning rate is set to 0.007 , and a differential learning-rate strategy is adopted: the backbone encoder parameters are updated using the base learning rate, whereas the ASPP module, decoder layers, attention modules, and task branches are optimized with a learning rate that is ten times higher. A polynomial (poly) learning-rate decay schedule is applied during training, and the batch size is set to 8.
According to the prior dependencies among tasks in the model architecture, a three-stage training strategy is adopted. In the first stage, only the river-mask segmentation branch is trained, with an end-to-end forward-pass computational cost of approximately 177.076 GFLOPs and an average forward-pass time of about 14.468 ms per iteration. In the second stage, the mask branch is frozen and only the centerline extraction branch is optimized, resulting in a cumulative computational cost of approximately 291.149 GFLOPs and an average forward-pass time of about 69.775 ms per iteration. In the third stage, the mask branch remains fixed, and the river-width regression branch is trained based on the best-performing weights of the centerline branch while allowing lightweight collaborative fine-tuning of the centerline branch. The overall computational cost at this stage is approximately 344.940 GFLOPs, with an average forward-pass time of about 121.580 ms per iteration. The numbers of training epochs for the three stages are set to 200, 100, and 20, respectively. At each stage, the best model weights on the validation set are saved and used to initialize the subsequent stage.

4.3. Evaluation Metrics

To systematically evaluate the performance of the proposed E2E-SGRWNet across the three tasks of river-mask segmentation, centerline extraction, and river-width estimation, we construct an evaluation framework from two complementary perspectives: continuous-value regression accuracy and pixel-level segmentation accuracy. To mitigate the influence of large background regions on the evaluation, all metrics are computed exclusively over foreground target pixels.

4.3.1. Regression Evaluation Metrics

The river-width estimation task is inherently a continuous-value regression problem. We assess the prediction results from both numerical accuracy and spatial usability perspectives by adopting five metrics: Mean Absolute Error (MAE), Root-Mean-Square Error (RMSE), Mean Relative Error (MRE), Prediction Point Utilization Rate (PPUR), and Ground-Truth Point Coverage Rate (GTCR).
Because slight spatial misalignments may exist between predicted width points and ground-truth annotations, a distance-based point-level matching strategy is introduced prior to computing the regression metrics. Specifically, for each ground-truth width annotation point, the predicted point with the minimum Euclidean distance is identified, subject to a one-to-one matching constraint. A point pair is considered successfully matched only if their spatial distance is smaller than a predefined tolerance threshold d t . In our experiments, the matching tolerance is set to two pixels.
Let Ω denote the set of valid matched width point pairs obtained through the above strategy, with cardinality N = | Ω | . For any matched pair i Ω , the predicted and ground-truth widths are denoted by w ^ i and w i . Let N pred and N true represent the total numbers of predicted width points and ground-truth width points, respectively. The regression metrics are defined as follows:
MAE = 1 N i = 1 N w ^ i w i .
RMSE = 1 N i = 1 N w ^ i w i 2 .
MRE = 1 N i = 1 N w ^ i w i w i .
PPUR = N N pred .
GTCR = N N true .
MAE and RMSE quantify the prediction accuracy in terms of average error magnitude and sensitivity to large deviations, respectively. MRE normalizes the error by the ground-truth width, enabling relative error assessment across different river-width scales. PPUR measures the proportion of spatially valid prediction points that can be used for width evaluation, thereby reflecting the spatial reliability of the predicted width field. GTCR evaluates the completeness of the model’s predictions in terms of their spatial coverage of the ground-truth river-width annotations.

4.3.2. Segmentation Evaluation Metrics

Both the river-mask segmentation and river centerline extraction tasks are formulated as pixel-wise binary classification problems. We adopt IoU, Precision, Recall, and the F1-score as the evaluation metrics. Let TP c , FP c , and FN c denote the numbers of true positive, false positive, and false negative pixels for class c (river mask or centerline), respectively. The metrics are defined as follows:
IoU c = TP c TP c + FP c + FN c .
Precision c = T P c T P c + F P c .
Recall c = T P c T P c + F N c .
F 1 c = 2 × Precision c × Recall c Precision c + Recall c .
IoU measures the spatial overlap between the predicted results and the ground-truth labels. Precision reflects the proportion of correctly predicted target pixels among all pixels predicted as the target class. Recall quantifies the completeness with which true target pixels are successfully detected. The F1-score provides a balanced measure that jointly characterizes the trade-off between Precision and Recall.

4.4. Comparative Experiments

4.4.1. Comparison with Baseline Methods

To verify the effectiveness of the proposed E2E-SGRWNet in the river-width estimation task, three representative baseline methods were selected for comparison: RWC [9], ARWE [11], and DeepRivWidth [15]. RWC measures river width by extracting the centerline from a river mask and constructing orthogonal cross-sections. ARWE generates a smoothed centerline from a binarized river-mask through a medial-axis transform and an automatic correction module, and then similarly computes river width along orthogonal directions. DeepRivWidth employs U-Net/DeepLabV3+ models to extract river masks from SAR imagery, followed by distance transformation, skeletonization, and orthogonal cross-section construction to estimate river width. All these methods follow the typical multi-stage processing paradigm of “centerline extraction–orthogonal profile generation–width computation” and thus serve as representative baselines for comparison with the proposed end-to-end river-width regression framework.
To ensure objectivity and fairness in the comparison, a unified evaluation protocol was adopted. First, all methods were evaluated on the same test set using a consistent set of five regression metrics (MAE, RMSE, MRE, PPUR, and GTCR) to ensure comparability. Second, considering that traditional multi-stage methods are highly dependent on the quality of upstream river masks, the ground-truth river masks from the test set were provided as inputs to all three baseline methods. This design minimizes uncertainty introduced by mask errors and allows the comparison to focus specifically on the performance of the width estimation strategies under identical and reliable mask priors.
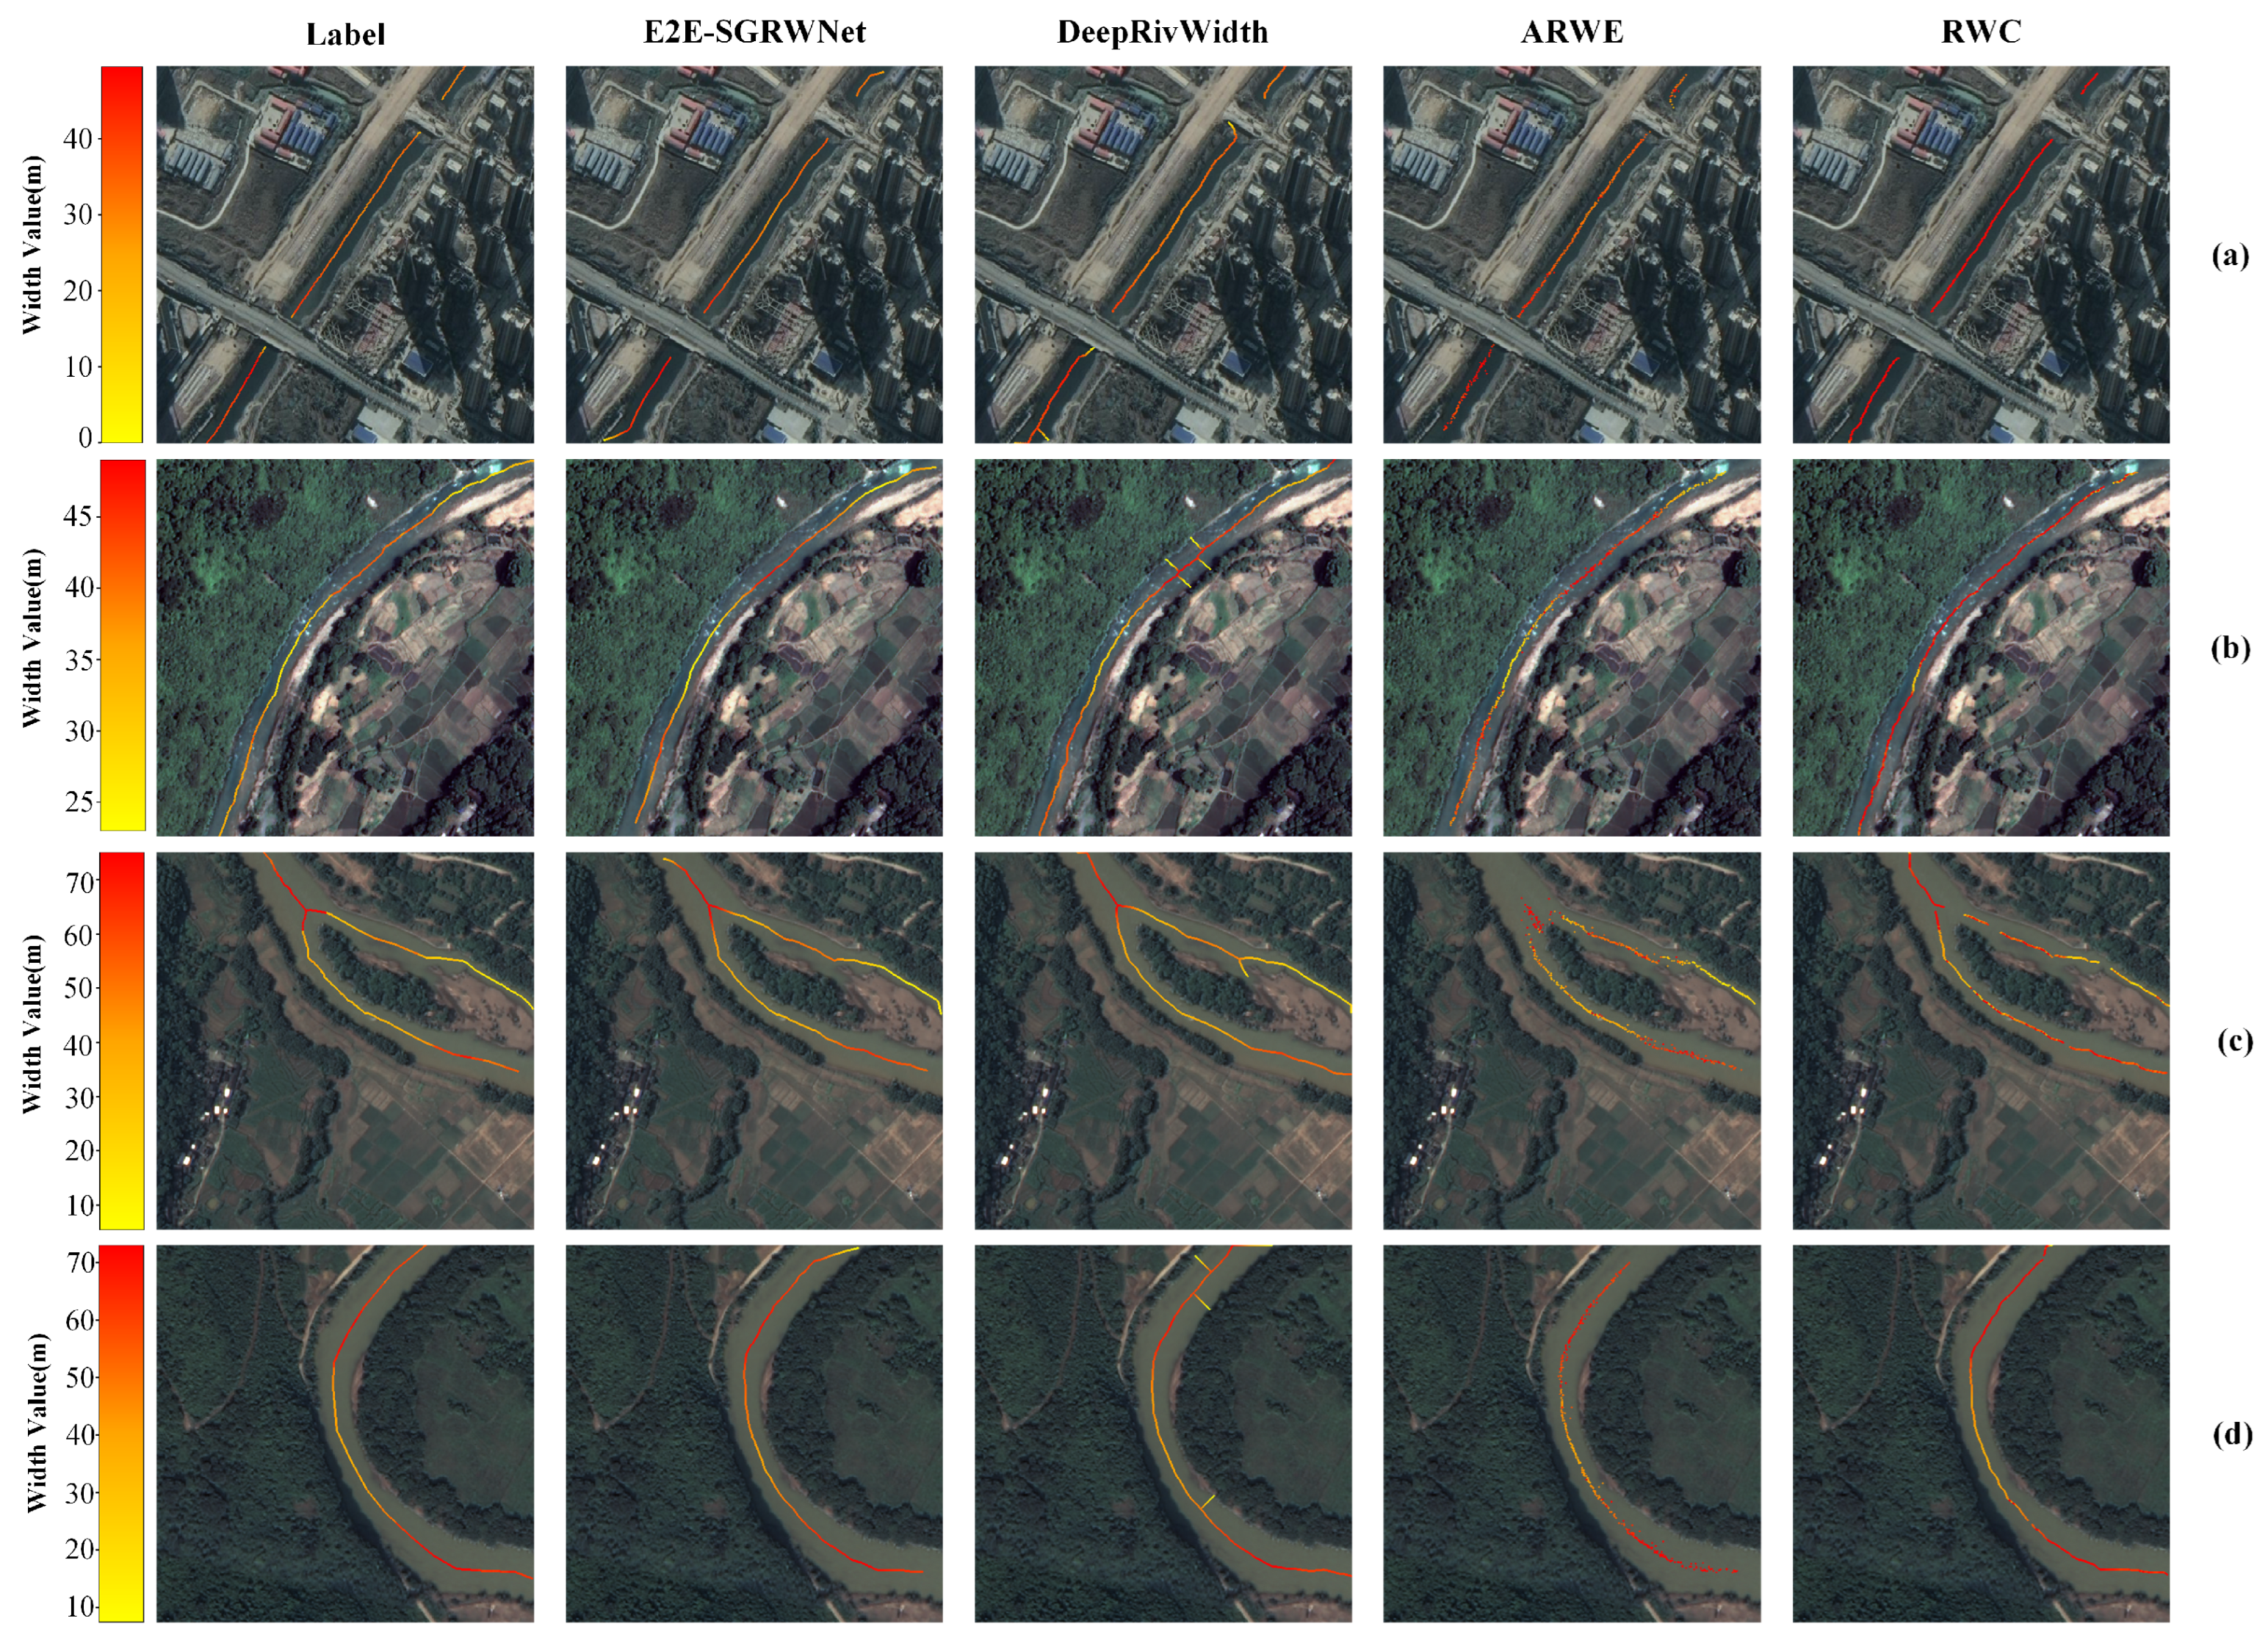
Table 2 reports the overall quantitative results of the four methods on the test set. From the perspective of numerical accuracy, E2E-SGRWNet achieves the best performance across the three error metrics (MAE = 3.428 m, RMSE = 4.362 m, and MRE = 13.6%). Compared with DeepRivWidth, which ranks second in overall performance, E2E-SGRWNet reduces MAE, RMSE, and MRE by 0.038 m, 0.174 m, and 2.0%, respectively, indicating that the proposed end-to-end framework is able to more accurately regress continuous river-width values at the global level. However, E2E-SGRWNet does not achieve the best performance in terms of spatial usability metrics. Its PPUR is 61.8%, which is 5.8% lower than that of the best-performing method for this metric, and its GTCR is 80.3%, 5.6% below the highest value. The analysis of the results indicates that the slightly lower performance in the spatial usability metrics is mainly associated with reduced prediction stability in the edge regions of the image patches.
The qualitative comparison results shown in Figure 9 further support the quantitative analysis presented above. The width color distribution produced by E2E-SGRWNet is most consistent with the reference annotations. The predicted widths are continuously distributed along the river channels, showing good structural consistency with the river geometry while capturing reasonable width variation trends.The main limitation occurs near the boundaries of image tiles, where the predicted widths may occasionally appear interrupted or slightly shifted. This phenomenon is mainly caused by insufficient contextual information at tile boundaries, which can lead to local missed or false predictions. Such effects are associated with the incomplete contextual observations introduced by image cropping rather than deficiencies in the model’s ability to recognize river structures. By adopting offset-based tiling or overlapping sliding-window strategies, river segments located at the boundary of one tile can be shifted to the interior of another tile with richer contextual information, thereby producing more reliable predictions. In comparison, the predictions of DeepRivWidth are generally continuous, but redundant spikes and spurious side responses frequently appear along long river segments, leading to an increase in redundant spatial prediction points and consequently reducing PPUR. The results produced by ARWE appear as spatially discontinuous scattered points, which is related to its interval-based sampling strategy and results in insufficient continuity in complex river network structures. Although RWC shows better spatial continuity than ARWE, its width estimates exhibit noticeable numerical deviations, particularly for small-scale rivers.
Considering both the qualitative and quantitative results, E2E-SGRWNet achieves a better balance between structural continuity and numerical accuracy, demonstrating the effectiveness of the proposed end-to-end stage-guided multi-task framework for high-precision river-width regression in complex remote sensing scenes.
To systematically analyze the prediction performance across different river scales, the results were statistically summarized according to three river-width categories—small rivers (<30 m), medium-sized rivers (30– 60 m ), and large rivers (>60 m)—as shown in Table 3. For medium-sized and large rivers, E2E-SGRWNet achieves the best performance across all three error metrics (medium-sized rivers: MAE = 3.225 m , RMSE = 4.353 m , MRE = 7.5 % ; large rivers: MAE = 5.076 m , RMSE = 6.890 m , MRE = 7.3 % ), demonstrating a stable advantage for medium- and large-scale rivers. For small rivers, E2E-SGRWNet still achieves the best performance in terms of the MRE metric ( 19.8 % ), although its MAE and RMSE values are slightly higher than those obtained by DeepRivWidth. This phenomenon is mainly related to the high sensitivity of narrow rivers to spatial resolution and boundary localization errors. In the experimental setting, DeepRivWidth directly uses river-mask labels as input, whereas E2E-SGRWNet performs end-to-end regression based on RGB imagery. As a result, the absolute error metrics are slightly inferior. Nevertheless, the advantage in relative error indicates that the model does not exhibit significant systematic bias, and the overall predictions remain stable.
To further characterize the error distribution within small-scale rivers, the small category (<30 m) was further subdivided into three intervals (<10 m, 10– 20 m , and 20– 30 m ) for statistical analysis (see Table 4), in order to evaluate the stability of river-width predictions at narrow scales. The comparison results show that E2E-SGRWNet and DeepRivWidth consistently rank as the best and second-best methods across all three sub-intervals, with only small differences in the absolute error metrics ( MAE and RMSE ). This indicates that E2E-SGRWNet does not exhibit significant performance degradation in small-scale river segments. Further analysis of the error variations across the sub-intervals shows that the relative error ( MRE ) increases markedly in the <10 m interval, while the absolute errors ( MAE and RMSE ) remain largely stable. This suggests that for extremely narrow rivers, even minor boundary localization offsets can substantially amplify relative errors, whereas the absolute errors remain within a controllable range.

4.4.2. Model Analysis

Unlike the other three methods, E2E-SGRWNet not only performs river-width regression but also simultaneously accomplishes river-mask segmentation and river centerline extraction as auxiliary tasks. Table 5 reports the evaluation results of E2E-SGRWNet on the test set for river-mask and centerline segmentation, where the predicted IoU for the river-mask map reaches 0.908 , and the IoU for the predicted centerline map is 0.519 .
In addition, the alignment between the predicted river-width pixels and the reference river-mask pixels is evaluated by computing the IoU between the binarized river-width prediction map (with a binarization threshold of 0 m ) and the reference river-mask map. The resulting IoU score is 0.833 , indicating a high degree of spatial agreement. This comparable IoU suggests that the river features learned through regression exhibit strong consistency with the segmentation targets.
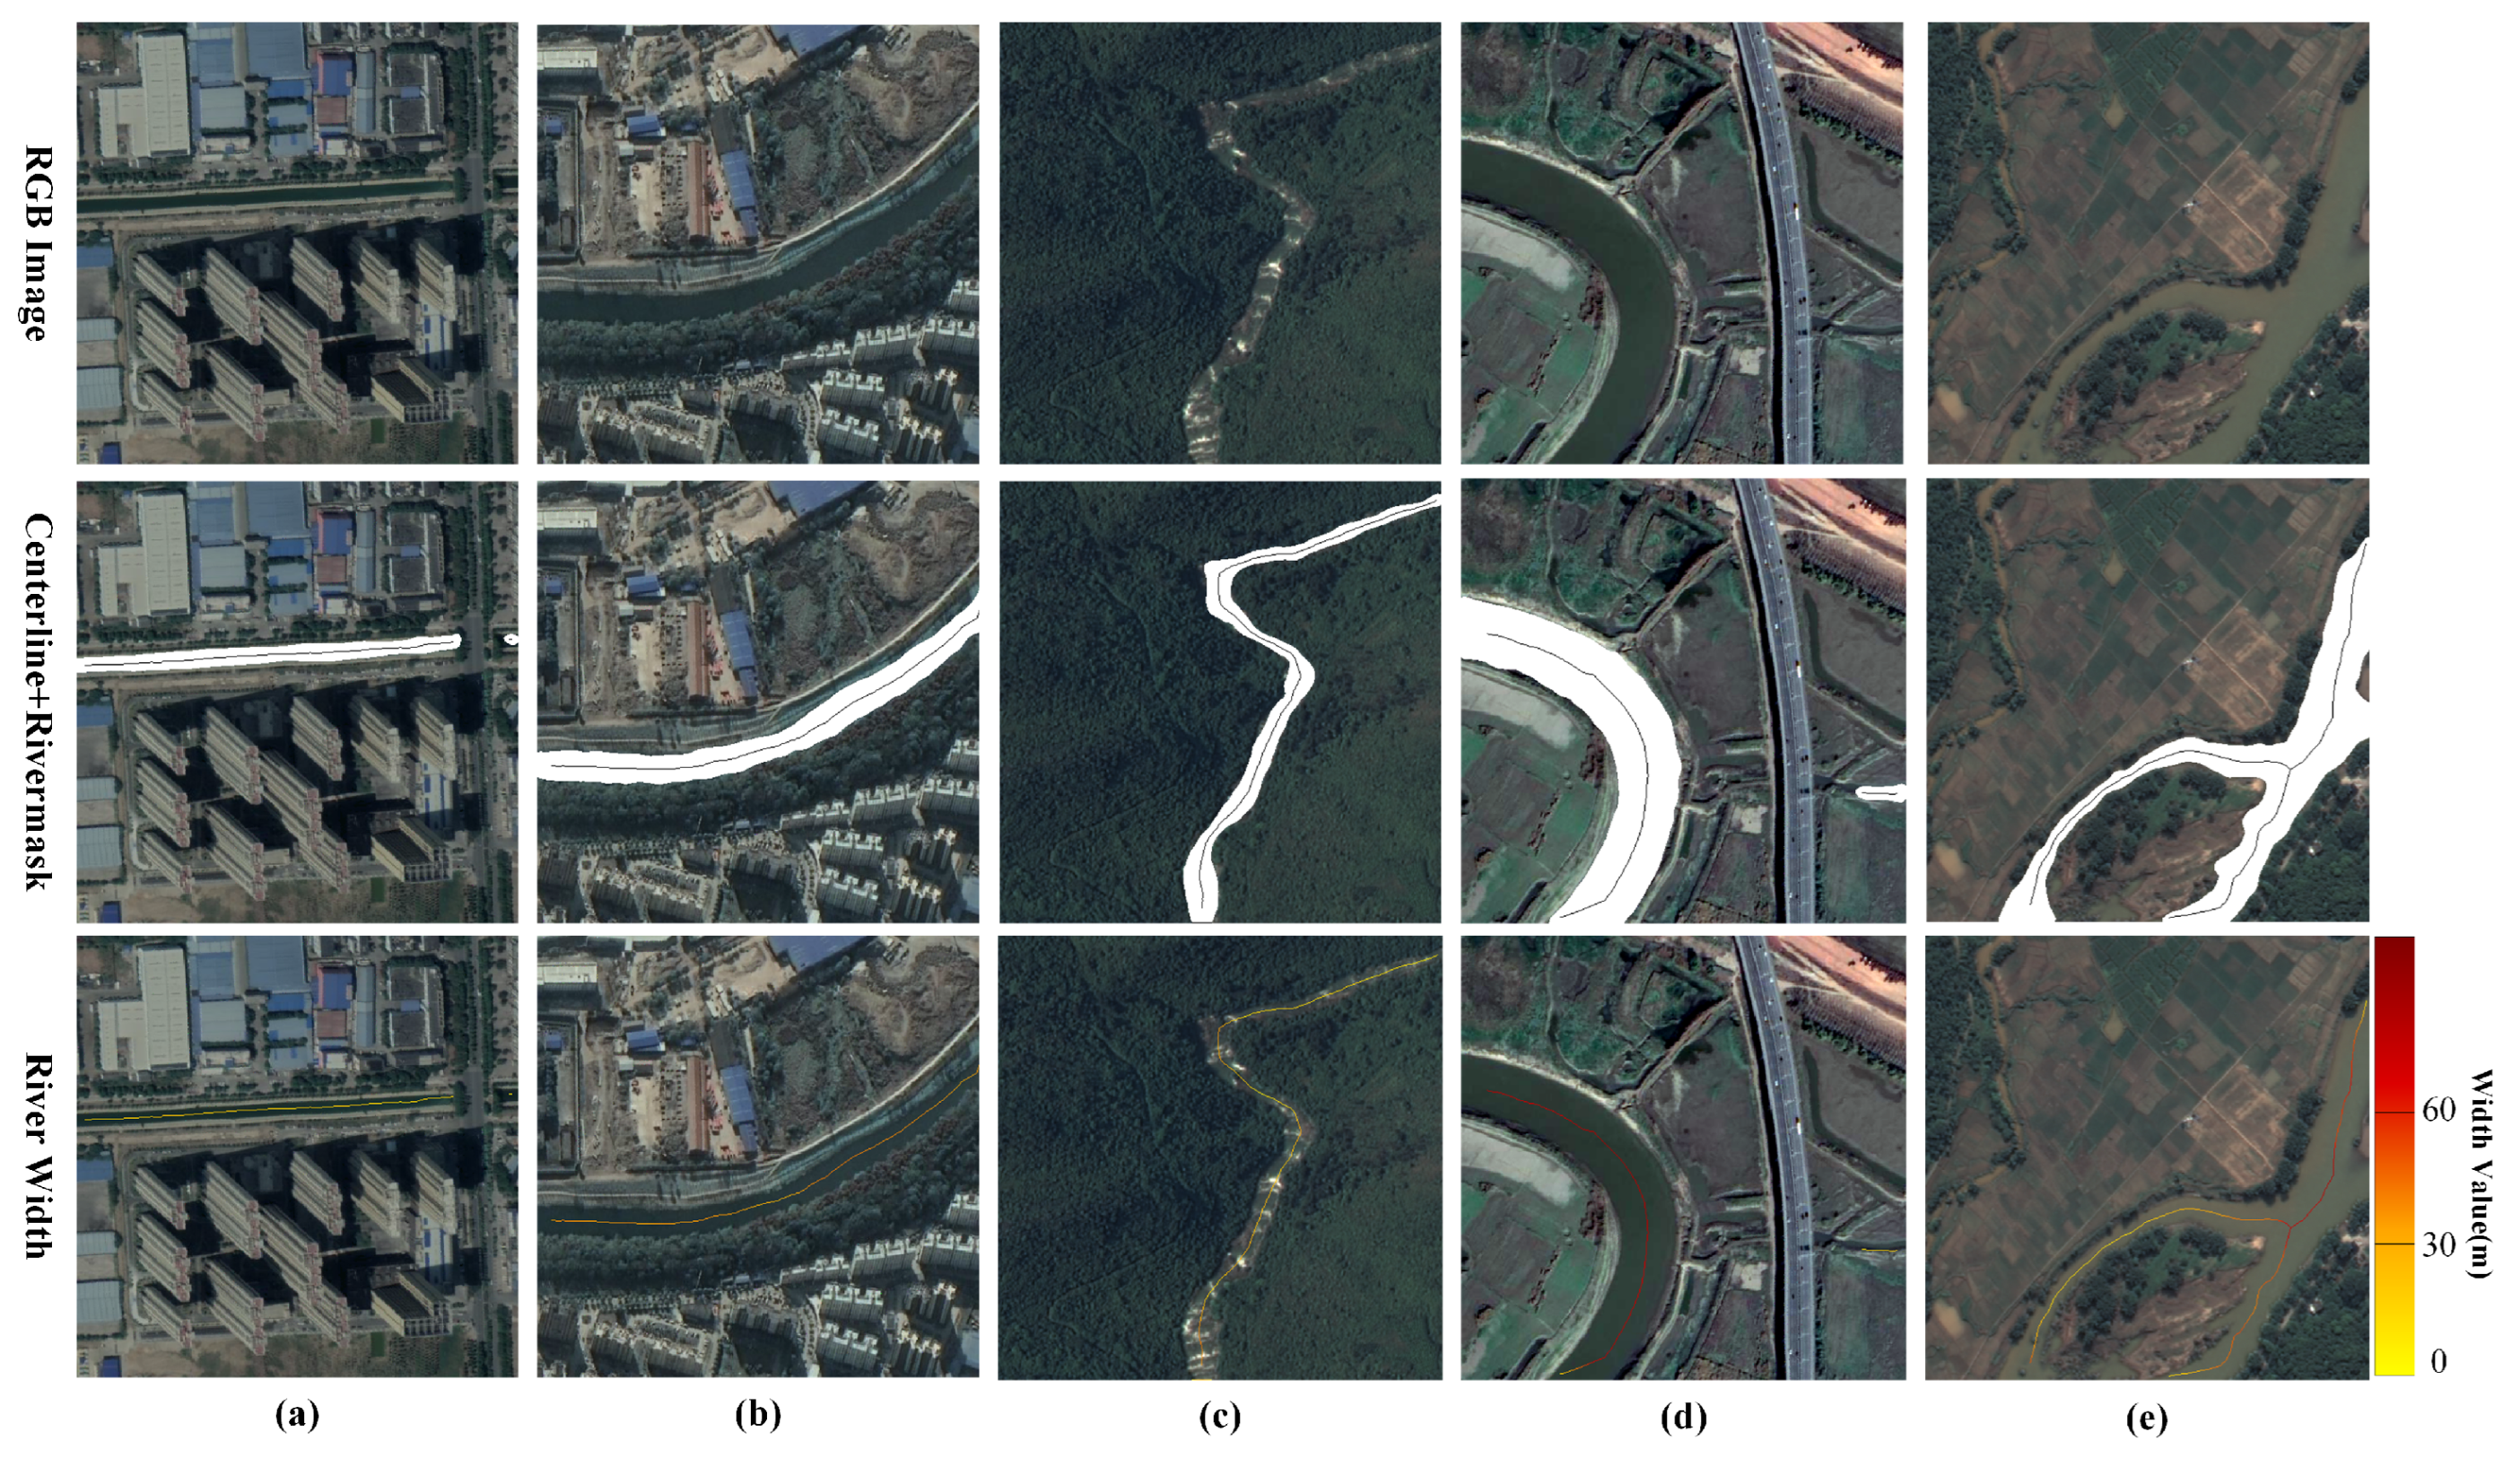
Beyond the quantitative analysis, five representative river-basin samples are selected to visually illustrate the prediction performance of the three task branches of E2E-SGRWNet under diverse scenarios. These samples cover markedly different geographic environments, river morphologies, and width scales. Figure 10a,b correspond to urban watershed samples, where the background contains dense buildings, road networks, and other artificial land-cover surfaces, and the two cases exhibit distinct river flow directions and width categories. Figure 10c–e represent natural-environment samples, with backgrounds dominated by forests, farmland, and other natural or semi-natural land-cover types. Specifically, Figure 10c shows a typical narrow mountainous stream, Figure 10d illustrates a complex river reach with sharp directional changes, and Figure 10e depicts a small river network with pronounced branching structures. These samples reflect the diversity of natural rivers in terms of morphology and topological structure from multiple perspectives.
Overall, the model is able to accurately delineate river boundaries and precisely localize river centerlines across these diverse scenarios, while the predicted river-width results effectively capture both the continuous variation in width along the flow direction and localized scale transitions. Although slight overestimation or underestimation can still be observed at certain locations, the overall width predictions remain continuous and spatially complete, and the width variation trends are well preserved, with relative errors maintained within an acceptable range. These qualitative results demonstrate that E2E-SGRWNet exhibits strong generalization capability and robustness when applied to different geographic environments, background complexities, river morphologies, and width scales.

4.5. Generalization Validation Experiments

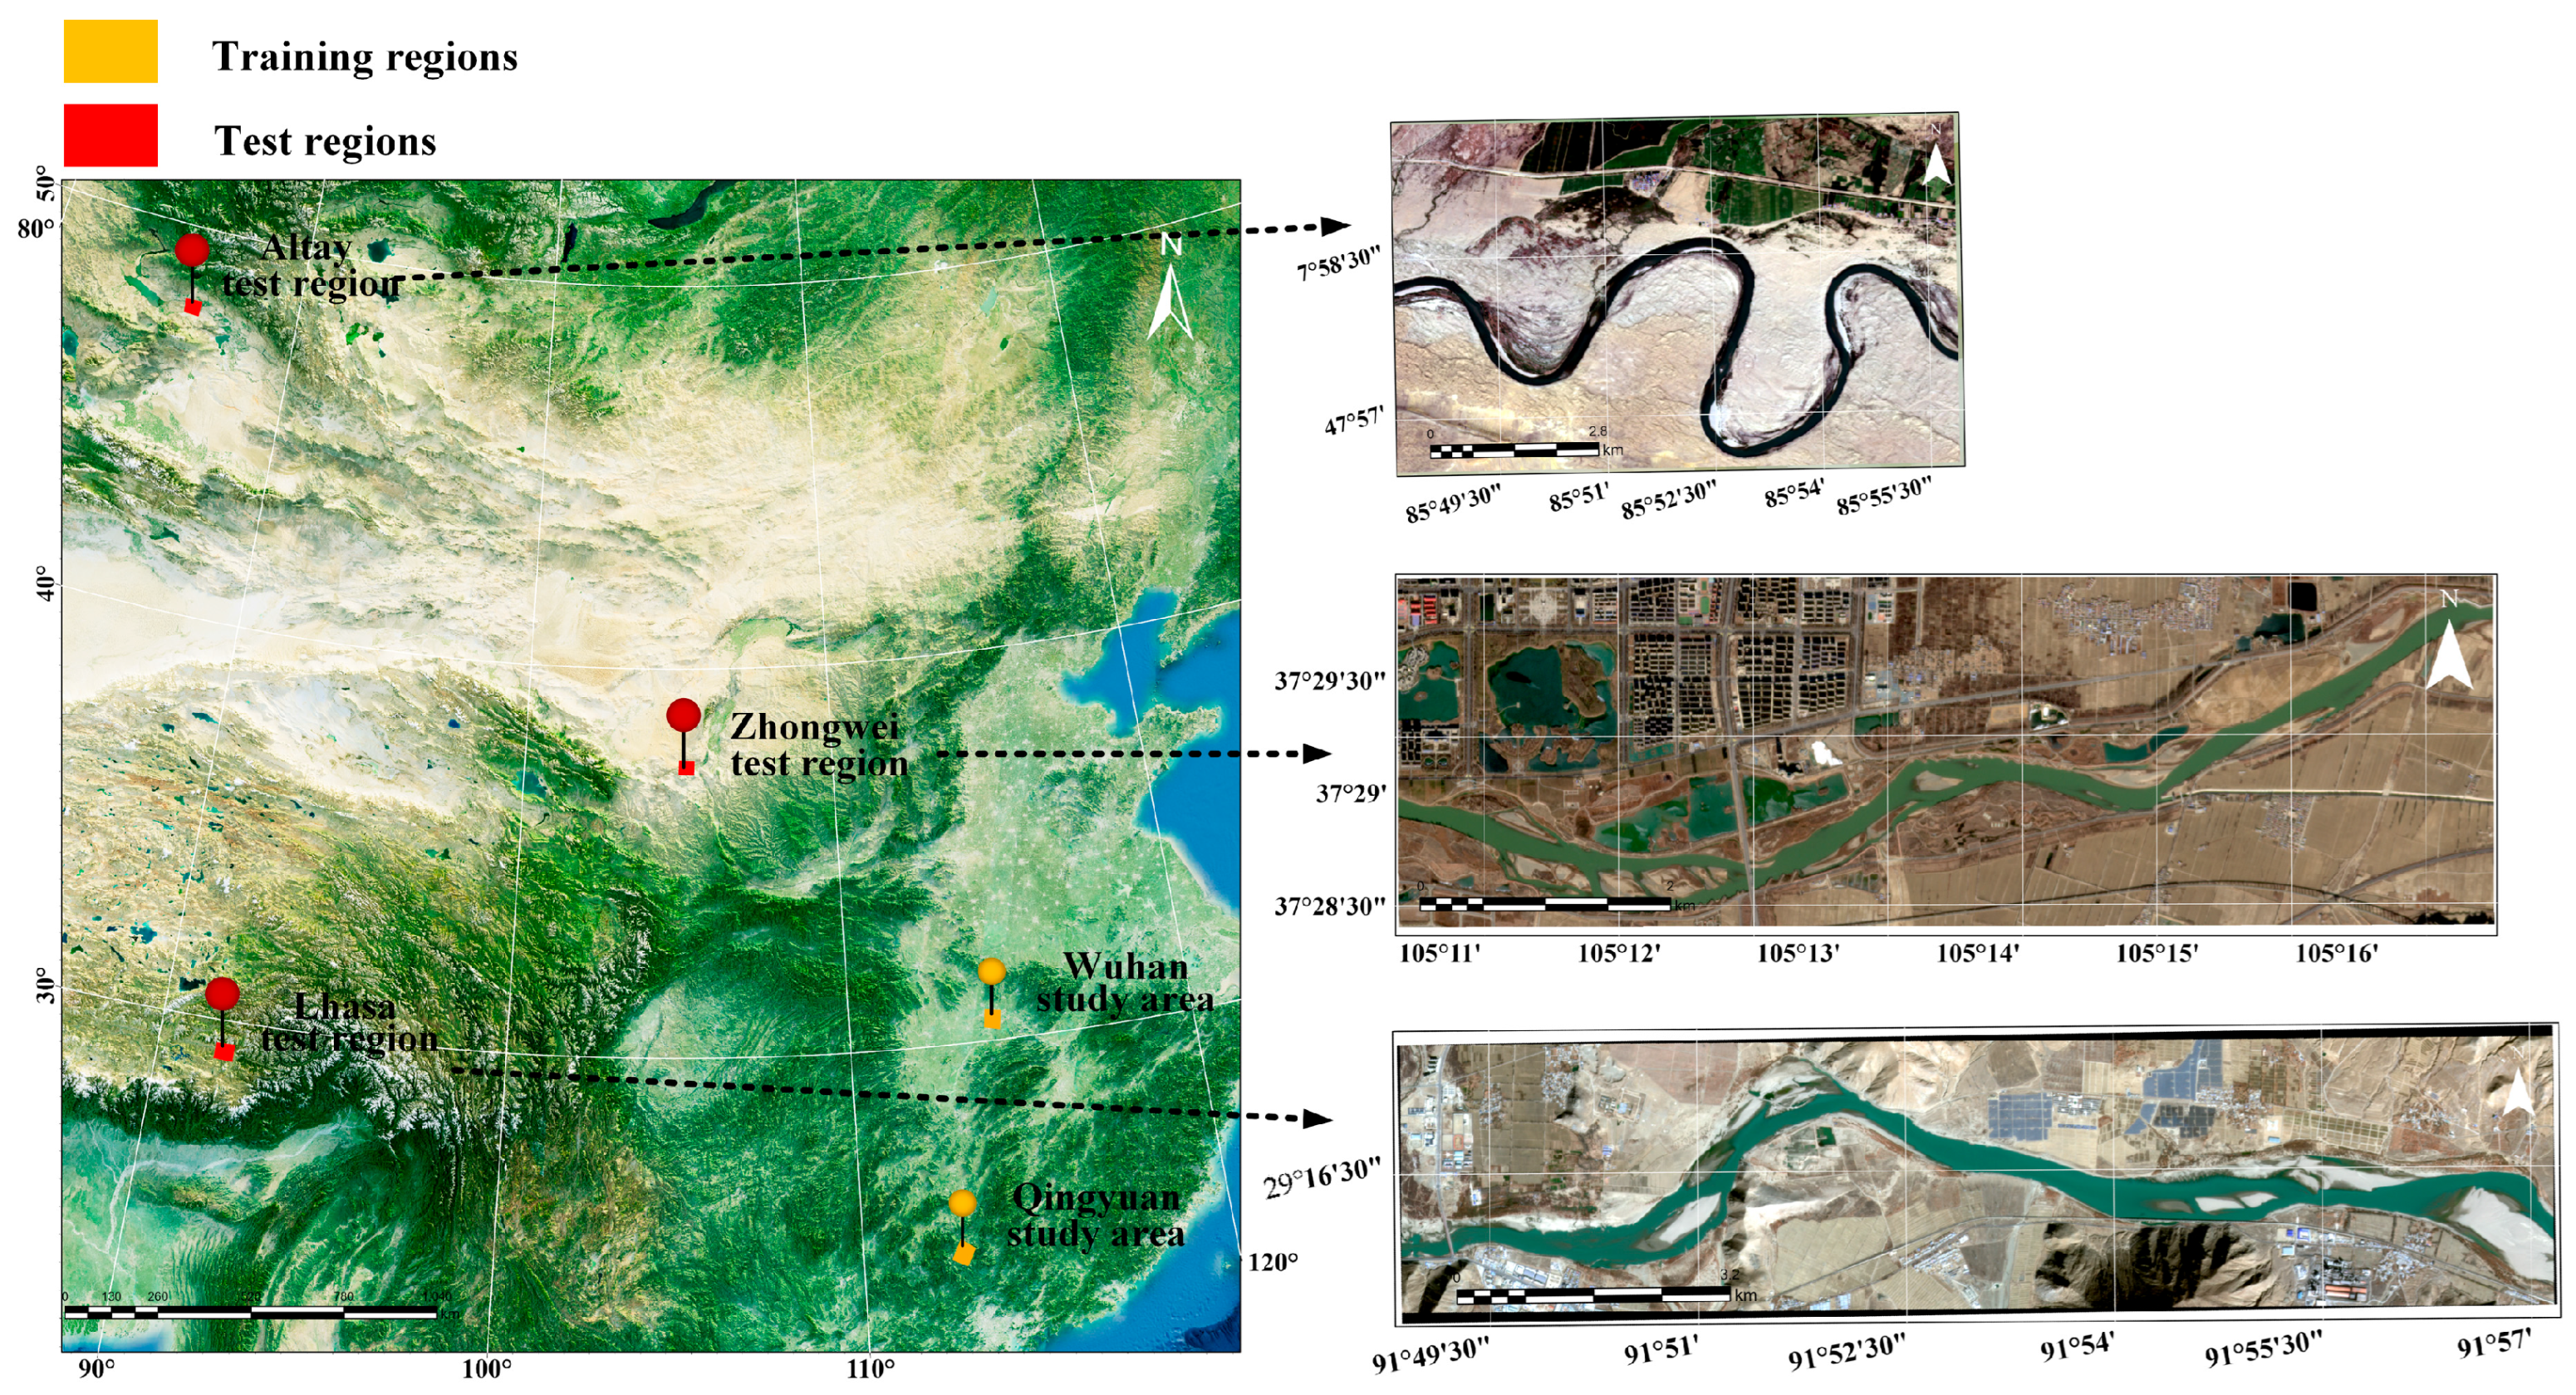
To evaluate the generalization capability of E2E-SGRWNet under different geomorphological environments and imaging conditions, cross-regional validation experiments were conducted in three regions with distinct geomorphological characteristics that were not included in the training dataset. All three test areas use 3 m resolution PlanetScope imagery, which differs substantially from the 1 m resolution GF-2 imagery used during training. This setting allows further assessment of the model’s robustness under different spatial resolutions and sensor conditions. None of the validation areas participated in the training process, and the trained model was directly applied to perform inference in these new regions.
The three test regions are located in Altay (Xinjiang, China), Lhasa (Tibet Autonomous Region, China), and Zhongwei (Ningxia, China), as illustrated in Figure 11, representing arid-region rivers, plateau braided rivers, and sediment-laden large river systems.The Altay test area covers approximately 60 km 2 . The region is characterized by extensive exposed surfaces with widespread gravel and sandy riverbanks, and includes sections of the middle and upper reaches of the Irtysh River, where the river morphology is relatively complex. The Lhasa test area covers approximately 44 km 2 and includes sections of the middle reaches of the Yarlung Zangbo River, where the channel is wide and frequently exhibits multi-thread braided structures. The Zhongwei test area covers approximately 26 km 2 and includes sections of the upper reaches of the Yellow River, where the river channel is wide with extensive floodplains and sandbars. The river also exhibits significant seasonal variations in sediment concentration due to upstream sediment transport and hydrological changes. The three test regions differ substantially in terms of climate conditions and river morphology, providing diverse scenarios for evaluating the model’s generalization capability under different natural environments.
The total river lengths within the Altay, Lhasa, and Zhongwei test areas are approximately 19 km , 14.5 km , and 11.4 km , respectively. Validation points were established at 500 m intervals along the river channels, resulting in 38, 29, and 23 validation points in the three test areas. At each validation point, the corresponding river width was manually measured from the original remote sensing imagery and compared with the model predictions to compute the errors. Table 6 presents the river-width prediction errors for the three test regions. All results were obtained using 3 m resolution PlanetScope imagery. The Mean Absolute Errors (MAEs) for the Altay, Lhasa, and Zhongwei test areas are 8.42 m , 8.51 m , and 5.02 m , while the corresponding Mean Relative Errors (MREs) are 4.9 % , 4.2 % , and 4.0 % . Because the rivers in all three test areas are dominated by large channels, the absolute errors are relatively high. However, the relative errors remain low and are generally consistent with those observed for the large-river category in the RiverWidth-HR Dataset. Overall, the model produces reasonable river-width predictions across different regions, indicating that E2E-SGRWNet demonstrates good generalization capability under diverse geomorphological conditions.
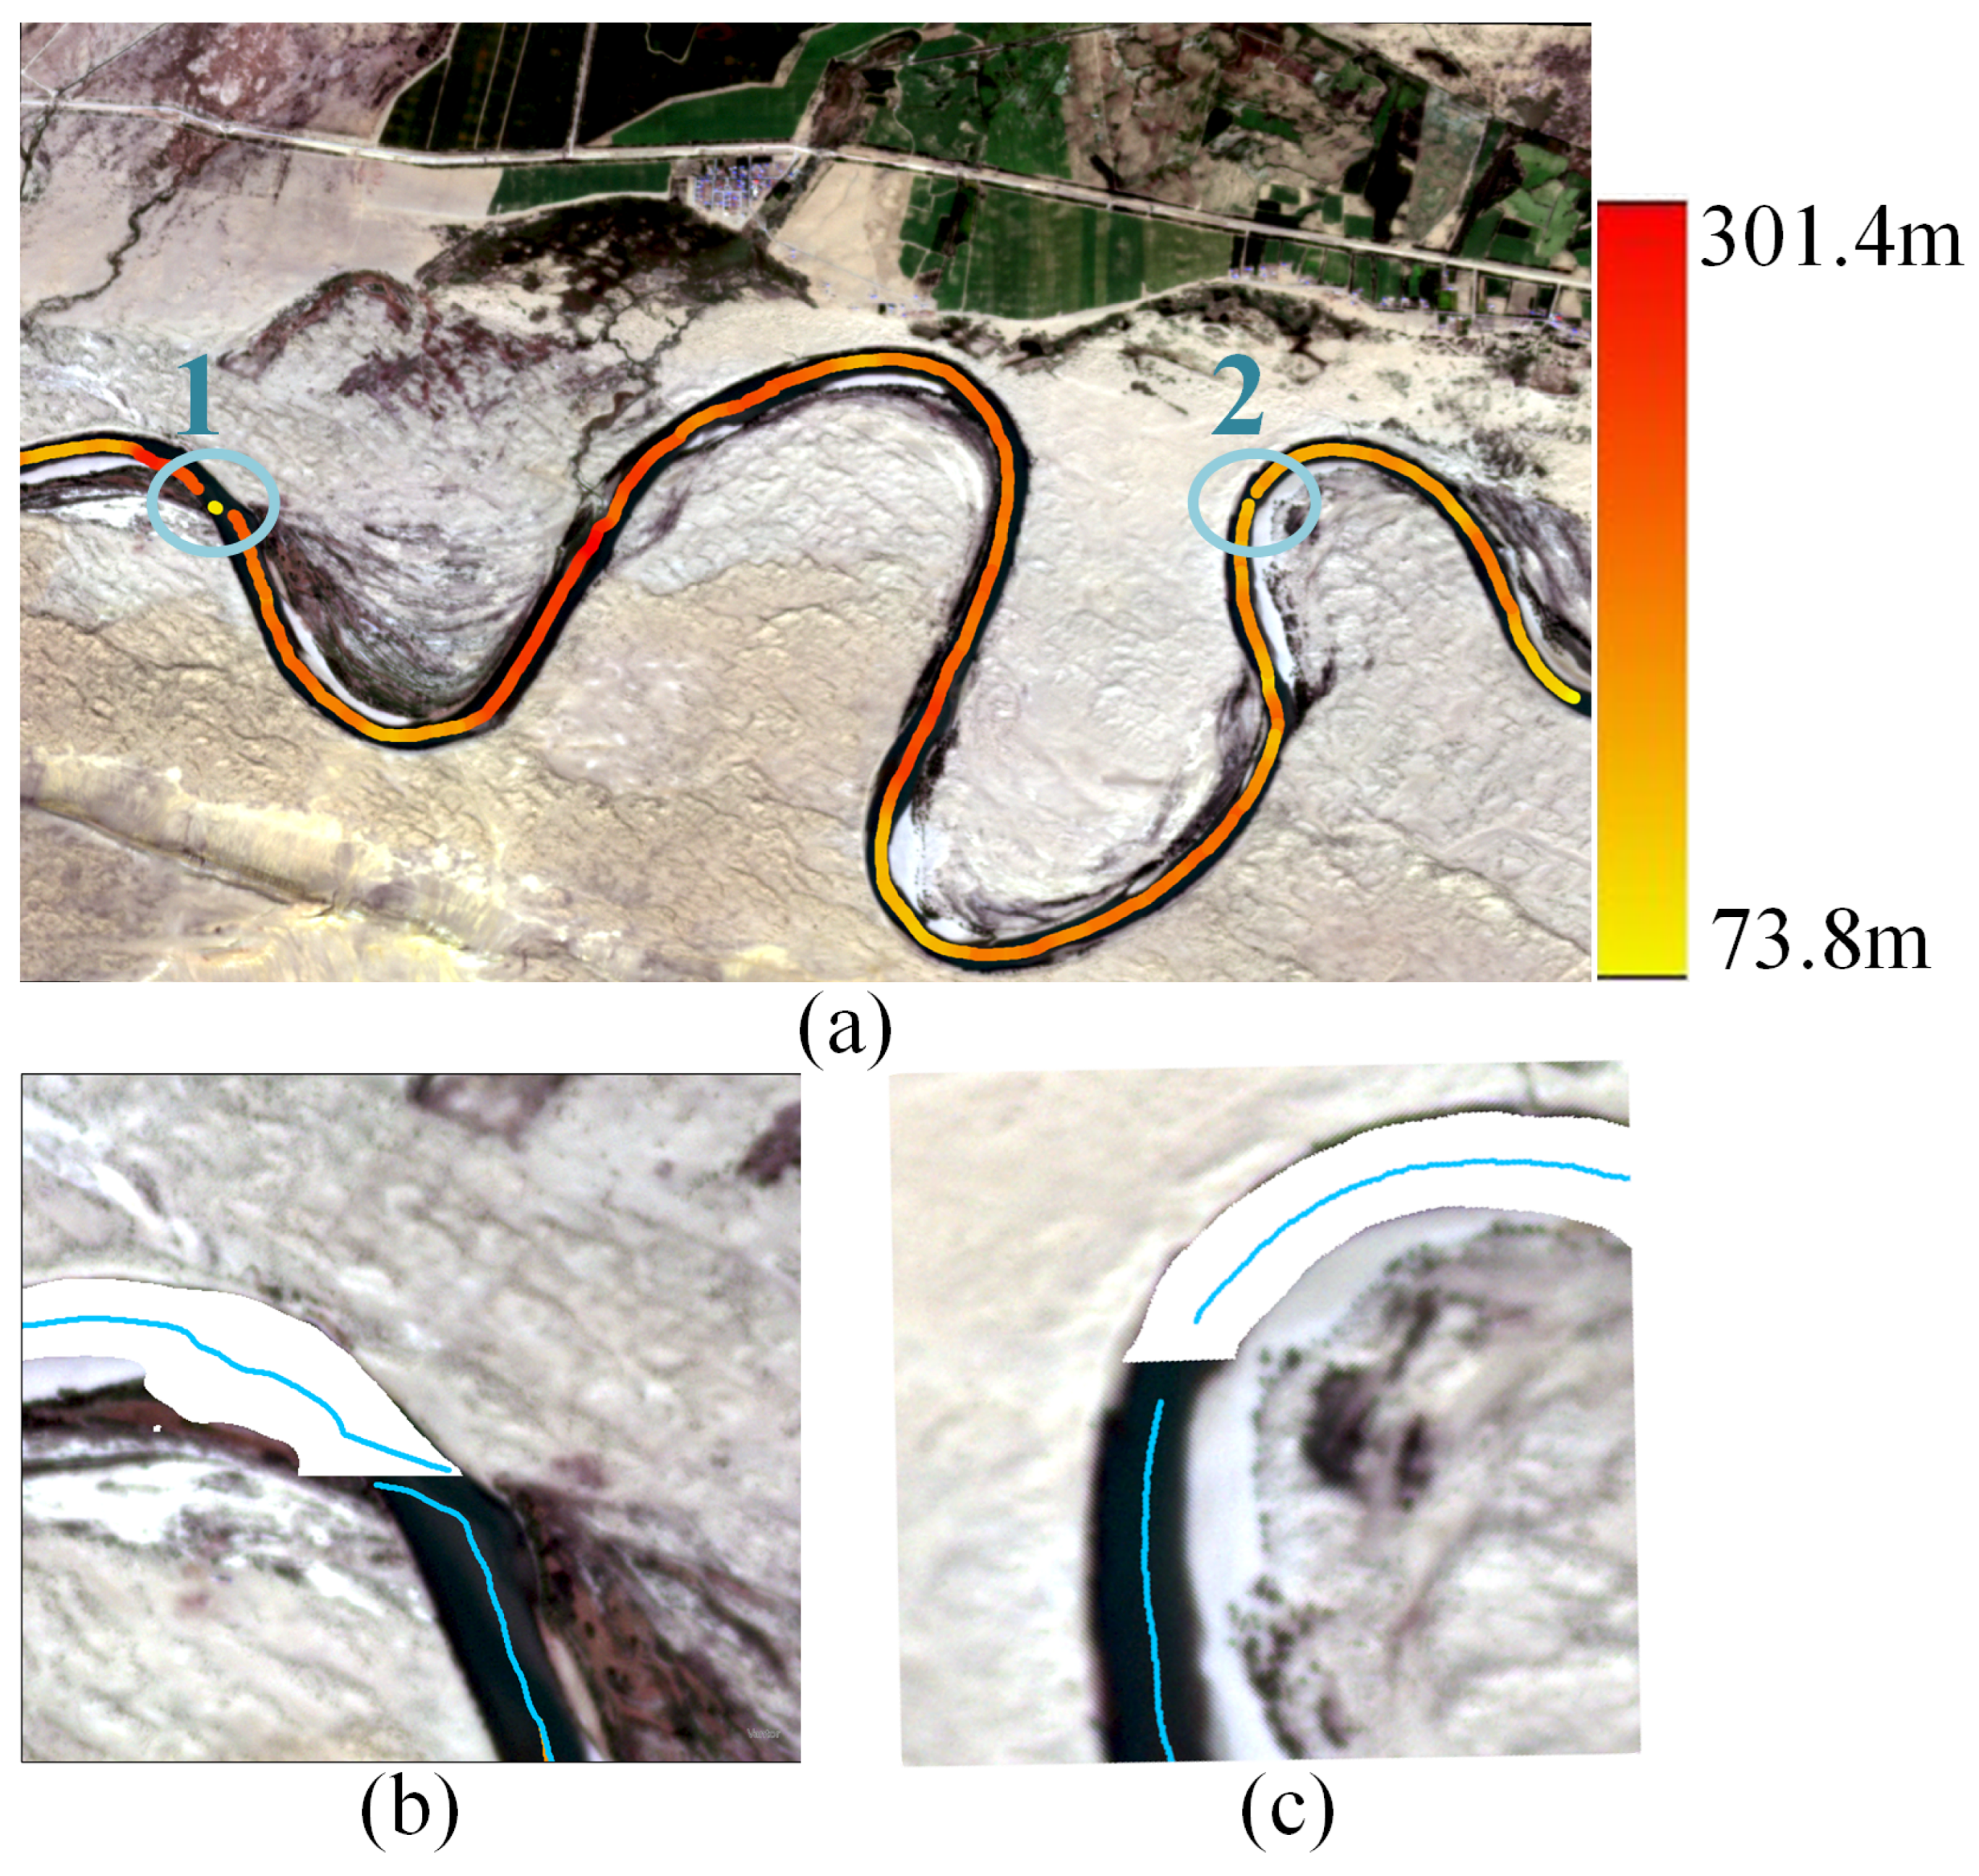
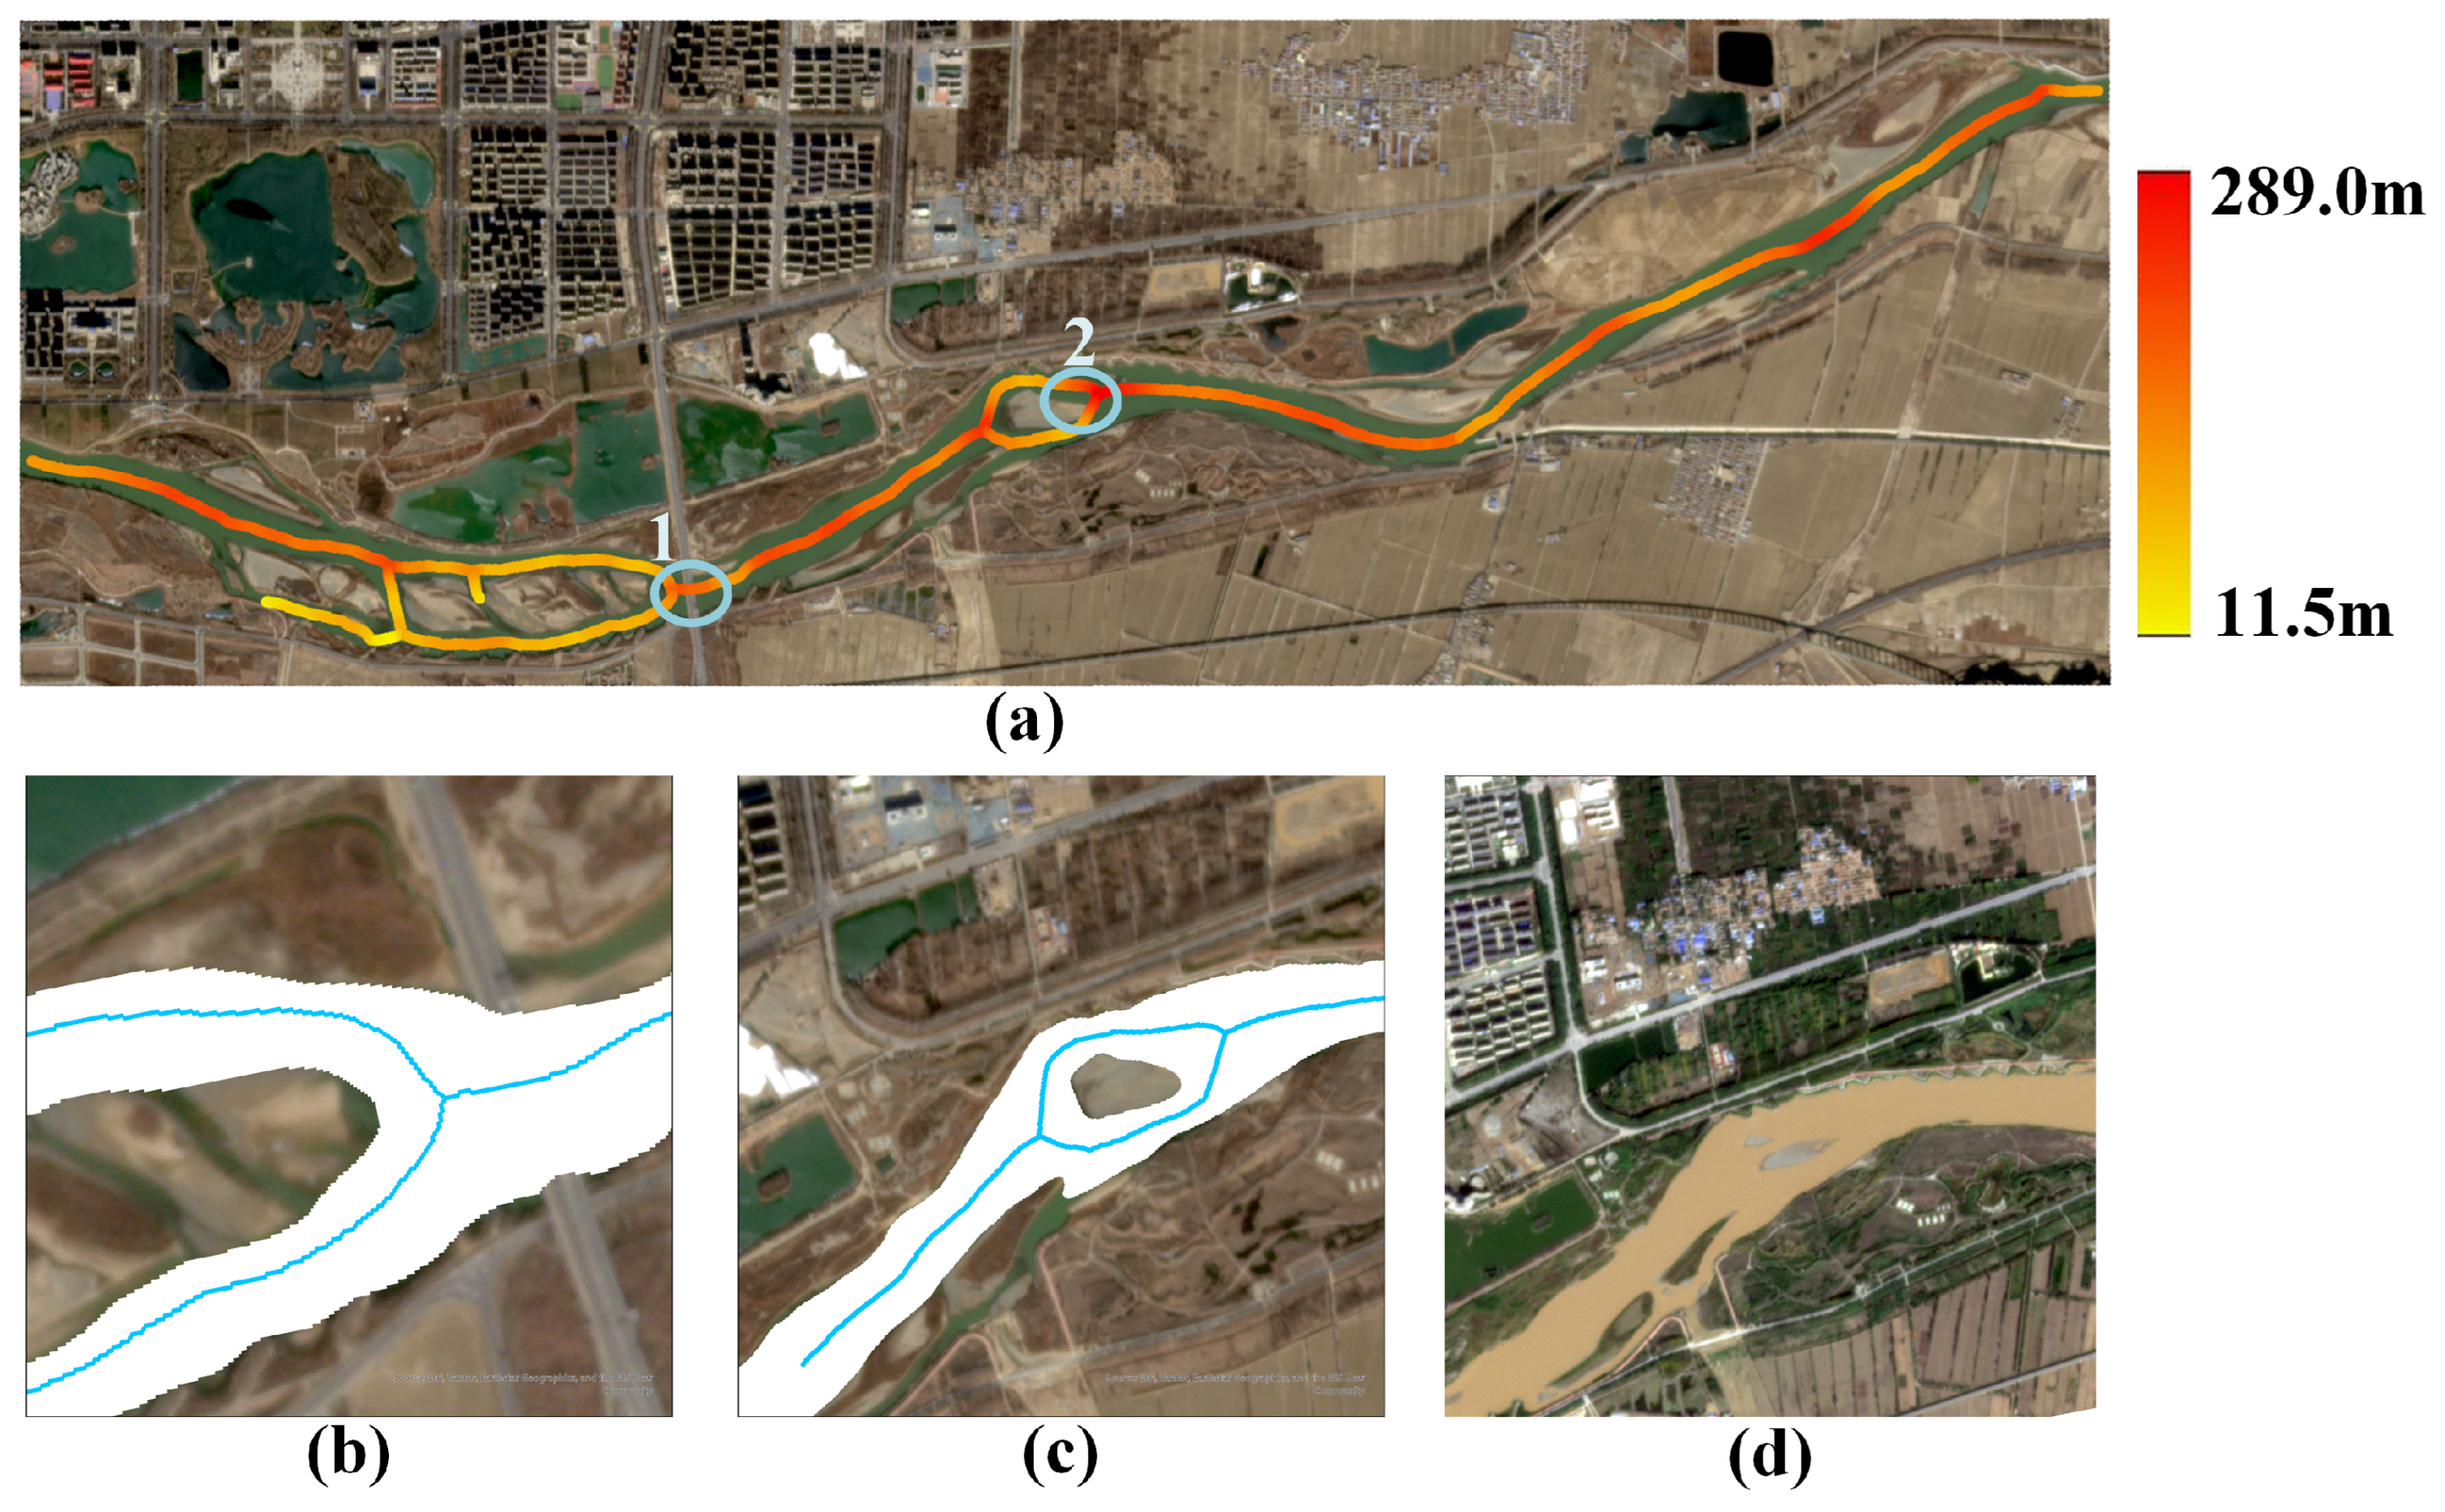
Figure 12a presents the river-width classification results for the Altay test region. It can be observed that the predicted river widths are spatially consistent with the river channel morphology and effectively capture the variation in river width along the channel direction. This indicates that the model can still reliably identify river structures and produce relatively accurate width predictions even in environments with highly exposed surfaces and complex river morphology. However, prediction discontinuities can still be observed in a few locations, as shown at points 1 and 2 in Figure 12a. Figure 12b,c show detailed views of points 1 and 2, respectively. By analyzing the river-mask segmentation results together with the extracted centerlines, it can be found that both locations lie near the boundary between two adjacent image tiles. Due to insufficient contextual information near image boundaries, the predicted centerlines and the river-width exhibit deviations and discontinuities in these areas. This phenomenon indicates that when the input image is located near the edge of a tile, the model still has certain limitations in utilizing contextual information.
Figure 13a shows the river-width classification results for the Lhasa test region imagery under winter conditions. The results indicate that the model can effectively handle channel bifurcations and abrupt changes in flow direction while maintaining continuous and stable river-width predictions. However, a small number of prediction errors still occur in some local areas. Figure 13b presents a detailed view of point 1, where the model incorrectly identifies a bridge structure crossing the river as part of the river channel. In addition, Figure 13c shows a local detail of point 2, where both the predicted centerline and river-width results exhibit discontinuities because the location lies at the boundary between two adjacent image tiles. In addition, experiments were conducted using summer imagery from the same region. As shown in Figure 13, the spectral appearance of the river water differs significantly from that in winter, and the model can only detect part of the river segments, resulting in incomplete predictions. This phenomenon indicates that when the spectral characteristics of river water deviate substantially from those in the training data, the model’s generalization capability may still be affected.
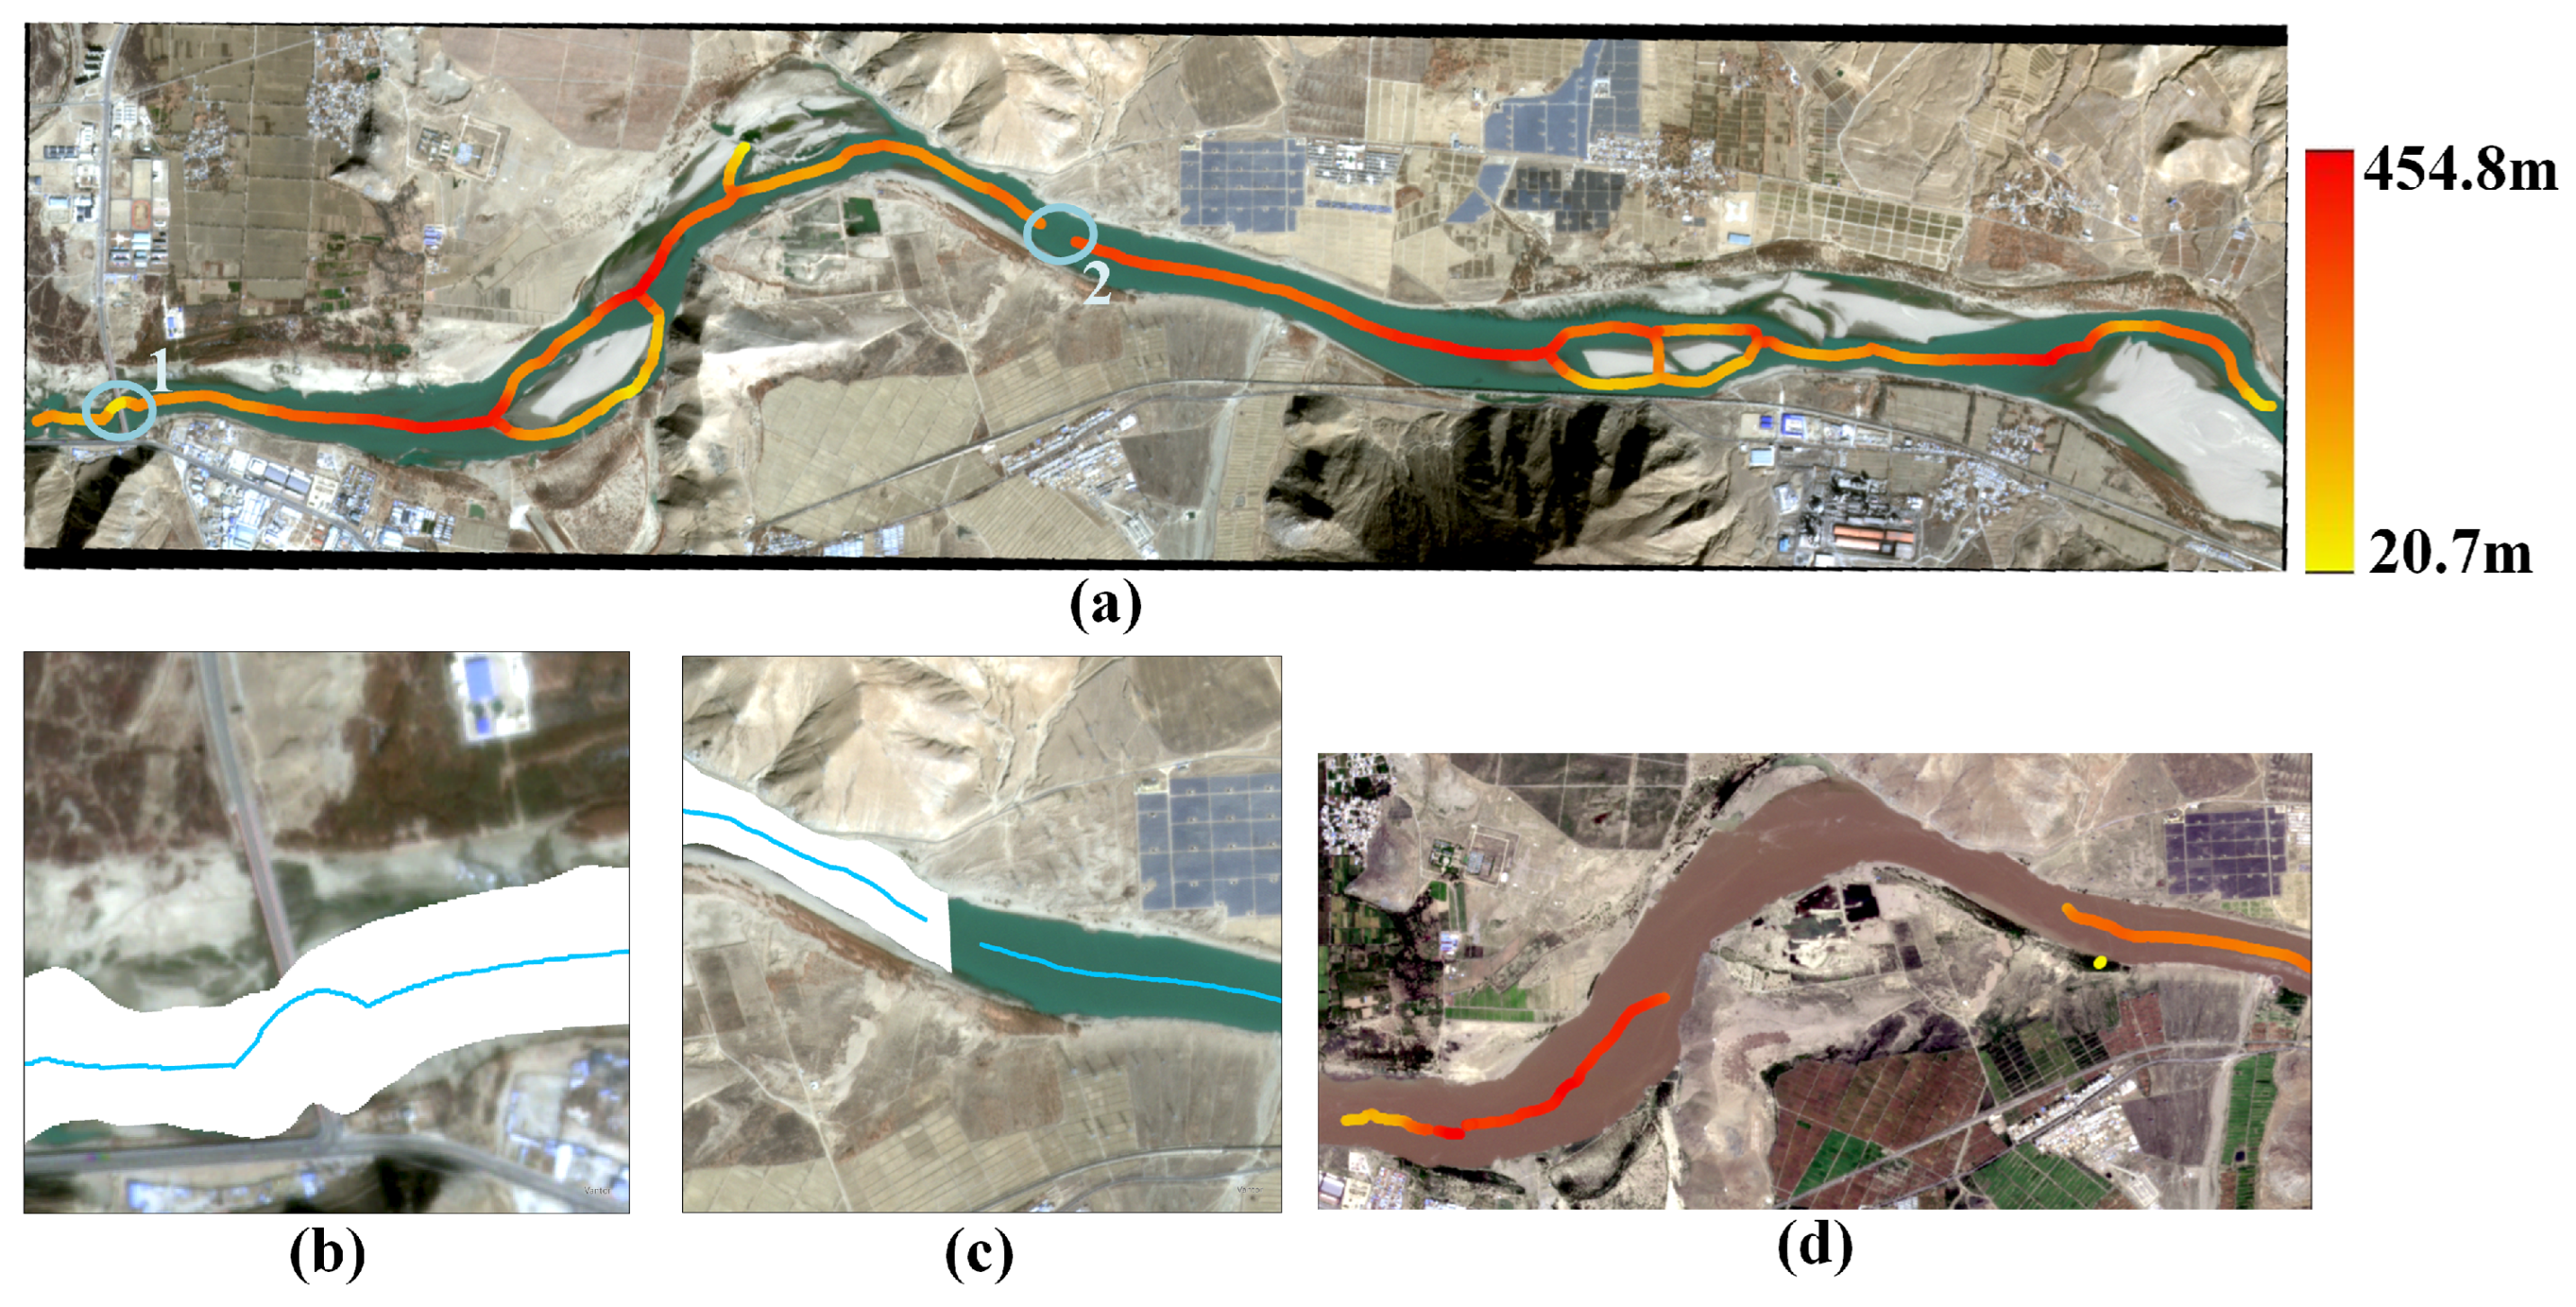
Figure 14a presents the river-width classification results for the Zhongwei test region imagery under winter conditions. The results show that the model can produce continuous and stable river-width predictions in this region. However, prediction errors still occur in some local areas, as indicated by points 1 and 2 in Figure 14a. Detailed views of these two locations are shown in Figure 14b and Figure 14c, respectively. In Figure 14b, a bridge crossing the river is incorrectly identified as part of the river channel, resulting in erroneous width predictions. In the area shown in Figure 14c, the river-mask segmentation contains errors in the presence of sandbar islands within the channel, where part of the sandbar is incorrectly classified as river, thereby affecting the river-width estimation. In addition, during the summer high-sediment period, the river water appears distinctly yellow-brown, as illustrated in Figure 14d. Under these conditions, the model fails to recognize the river channel and therefore cannot produce reliable width predictions. This result further indicates that when the spectral characteristics of river water deviate substantially from those represented in the training data, the model’s generalization capability may be affected.

5. Discussion

5.1. Ablation Study

To enable end-to-end river-width estimation directly from raw optical remote sensing imagery, a stage-wise guidance strategy is introduced into the proposed E2E-SGRWNet as a key supporting mechanism to ensure the stability and accuracy of the regression task in complex remote sensing scenes. Specifically, this strategy consists of two complementary levels: (1) a task-guidance level, implemented as a cascaded multi-task network framework, in which the river-mask segmentation and centerline extraction tasks are employed to assist the main river-width regression task; (2) a feature-guidance level, realized through a cross-branch feature fusion mechanism that progressively incorporates semantic and structural information from the mask segmentation and centerline extraction branches into the feature representation space of the river-width regression sub-network, thereby effectively guiding the learning of river-width geometric parameters. In addition, during the generation of the final river-width results, the predicted centerlines produced by the model are further used to impose auxiliary structural constraints on the width-response map, thereby deriving the final river-width estimates.
Based on the above design, three ablation experiments with progressive configurations were conducted. These experiments correspond to (1) removing the stage-wise guidance strategy entirely, (2) removing only the feature-level guidance mechanism, and (3) removing the centerline-based auxiliary structural constraint introduced during the width generation stage. By comparing the quantitative performance of these different ablation configurations in the river-width prediction task, the contributions of task guidance, stage-wise feature guidance, and centerline-based structural constraints to the model’s prediction accuracy and stability are systematically analyzed.

5.1.1. Effect of Stage-Wise Guidance Strategy

To evaluate the overall effectiveness of the proposed stage-wise guidance strategy, a control model with the entire stage-wise guidance strategy removed was constructed (denoted as Model_1). In this ablation setting, the cascaded multi-task framework is discarded, and only the centerline extraction branch and the river-width regression branch are retained in a parallel configuration. No prior information is propagated between the two tasks, and no cross-branch feature fusion mechanism is introduced. The model takes the original RGB optical remote sensing imagery as the sole input, and the predicted centerline is subsequently used to localize the width prediction map in order to obtain river-width estimates.
This ablation configuration effectively degrades the original stage-guided multi-task framework into a parallel multi-task modeling paradigm, enabling an assessment of the necessity of the stage-wise guidance strategy for end-to-end river-width extraction. As reported in Table 7, compared with the full E2E-SGRWNet, Model_1 exhibits substantial performance degradation across all river-width evaluation metrics: MAE , RMSE , and MRE increase by 6.402 m , 7.834 m , and 15.6 % , respectively, while PPUR and GTCR decrease by 24 % and 26.2 % .
These results indicate that, in the absence of both task-level guidance and feature-level guidance, the model fails to effectively focus on river regions and to establish stable geometric representations, leading to a pronounced amplification of river-width estimation errors. This outcome confirms the critical role of the stage-wise guidance strategy in the proposed framework.

5.1.2. Effect of Feature-Level Guidance

To further disentangle the respective contributions of task-level guidance and feature-level guidance, a second ablation model was constructed by retaining the cascaded multi-task architecture while removing the cross-branch feature fusion module in the river-width regression branch (denoted as Model_2). Under this configuration, the river-mask segmentation branch and the centerline extraction branch are still executed in the original cascaded order; however, their intermediate features are no longer propagated to the river-width regression branch. Consequently, width prediction relies solely on the encoded features within the regression branch itself.
This ablation experiment is designed to assess the independent contribution of feature-level guidance to the river-width regression task. As shown in Table 7, relative to the full model, Model_2 exhibits increases of 0.469 m , 0.752 m , and 2.2 % in MAE, RMSE, and MRE, respectively, while PPUR and GTCR decrease by 0.6 % and 1.3 % . The observed degradation in prediction accuracy demonstrates that the feature-level guidance provides a positive contribution to river-width regression. In contrast, when compared with Model_1, Model_2 achieves reductions of 5.933 m , 7.082 m , and 13.4 % in MAE, RMSE, and MRE, respectively, along with increases of 23.4 % and 24.9 % in PPUR and GTCR. This comparison further highlights the substantial impact of task-level guidance on high-precision river-width regression.

5.1.3. Centerline-Based Auxiliary Structural Constraint

To evaluate the dependence of the final river-width results on the centerline-based auxiliary structural constraint, an ablation experiment was designed by modifying only the result extraction stage, while keeping the complete network architecture and training strategy of E2E-SGRWNet unchanged (denoted as Model_3). Under this setting, the cascaded multi-task framework at the task-guidance level and the cross-branch feature fusion mechanism at the feature-guidance level are both retained. The only modification is that the centerline-based auxiliary structural constraint is removed during the final result generation stage, and the river-width results are directly extracted from the width map based on local response consistency.
As shown in Table 7, compared with E2E-SGRWNet, Model_3 achieves reductions of 0.032 m in MAE and 0.2 % in MRE, while PPUR and GTCR decrease by 3.3 % and 1.8 % , respectively. These results indicate that the width map produced by the network can already represent the spatial distribution of river width reasonably well. Consequently, even without the centerline-based auxiliary structural constraint, the numerical error metrics remain comparable to, or even slightly better than, those of E2E-SGRWNet. However, the spatial usability metrics show a noticeable decline in Model_3, suggesting that the centerline-based auxiliary structural constraint plays an important role in improving the spatial distribution consistency and usability of the river-width results. Considering both prediction accuracy and spatial stability, E2E-SGRWNet demonstrates slightly better overall performance.
Overall, the ablation results demonstrate that the stage-wise guidance strategy, through the coordinated effects of task guidance and feature guidance, jointly improves both the prediction accuracy and spatial stability of E2E-SGRWNet in river-width estimation. In addition, the centerline-based auxiliary structural constraint further enhances the spatial usability and structural consistency of the river-width results while maintaining stable numerical errors. Together, these mechanisms provide essential spatial and structural prior constraints for river-width extraction, strengthening the stability and consistency of geometric information learning and enabling E2E-SGRWNet to achieve high-precision river-width estimation in complex remote sensing scenes.

5.2. Method Analysis

5.2.1. Strengths of the Proposed Method

Current remote sensing-based river-width extraction methods typically rely on binary river masks and estimate river width through a multi-stage geometric–morphological processing framework consisting of centerline extraction, orthogonal cross-section generation, and width calculation [8,9,10,11]. Within such serial frameworks, uncertainties introduced in earlier stages—such as those associated with river-mask inputs—may propagate along the processing chain, leading to cumulative error amplification. In contrast, E2E-SGRWNet introduces a new paradigm for river-width estimation. By employing a deep learning regression model to directly learn the mapping between image features and river-width geometric information [45], it enables end-to-end automatic estimation of river width from optical imagery under complex remote sensing conditions, thereby effectively mitigating cumulative errors and improving both the accuracy and stability of width predictions.
Meanwhile, E2E-SGRWNet adopts a cascaded multi-task learning framework that introduces river-mask segmentation and centerline extraction as auxiliary tasks to provide task-level guidance for the river-width regression process. This design allows the model to focus on a constrained and meaningful space under explicit spatial priors, mitigating the adverse impact of complex backgrounds on quantitative geometric modeling and thereby enhancing the stability and consistency of river-width estimation.
In addition, at the feature level, E2E-SGRWNet incorporates a cross-branch feature fusion mechanism that progressively integrates multi-scale semantic features and geometric structural features to jointly guide the learning of river-width geometric parameters. This strategy strengthens the reliability and representational capacity of fine-grained width regression. Overall, by leveraging a stage-wise guidance strategy at both the task-guidance and feature-guidance levels, E2E-SGRWNet provides a systematic solution for constructing a high-precision, end-to-end river-width regression model, enabling robust and accurate river-width estimation in complex remote sensing scenarios.

5.2.2. Limitations and Future Directions

Although E2E-SGRWNet demonstrates stable and promising performance, several limitations remain and warrant further investigation. First, the model exhibits a strong dependence on contextual information during river-width estimation. In regions near image boundaries, insufficient contextual cues often lead to missing or biased width estimates. While offset-based tiling strategies can partially alleviate this issue, further improvements in the model’s context-awareness are required for large-scale continuous inference and real-time applications.
Second, the current training of the model is primarily based on the self-constructed RiverWidth-HR Dataset. Although this dataset covers diverse geographic environments, river-width scales, and river morphologies, there remains room for improvement in terms of sample diversity and distribution balance. Future work will focus on expanding the dataset by incorporating samples from multiple regions and a wider range of river types, together with targeted data augmentation for challenging scenarios such as extremely narrow rivers and high-sediment rivers, thereby further enhancing the model’s generalization capability and prediction stability.
In addition, E2E-SGRWNet relies solely on optical remote sensing imagery as input, whose information content is inherently constrained by the optical imaging mechanism, thereby limiting the information available to the model. Vegetation occlusion and confusion caused by aquatic vegetation may affect river boundary detection, thereby introducing errors in river-width estimation. Moreover, river widths estimated from single-temporal imagery represent the observable river-surface width and do not account for geomorphic units such as exposed sandbars, which may lead to an underestimation of channel scale in morphologically active river reaches. Future work may consider incorporating multi-source remote sensing data into the river-width extraction framework. For example, SAR imagery could be integrated to enhance the robustness of river-body detection [46], while DEM and other terrain-related information may provide auxiliary constraints for river channel structure modeling [47]. Such integrations may further improve the reliability and accuracy of river-width prediction under complex imaging conditions.

6. Conclusions

This paper proposes E2E-SGRWNet, a stage-guided multi-task network for river-width estimation, which directly regresses continuous river-width values from optical remote sensing imagery, effectively avoiding the error accumulation commonly introduced by traditional multi-stage river-width extraction pipelines. Within a unified framework, the model jointly performs river-mask segmentation, river centerline extraction, and river-width regression, enabling an integrated workflow from qualitative recognition to quantitative estimation. E2E-SGRWNet adopts a stage-wise guidance strategy that incorporates both task-level guidance and feature-level guidance. At the task-guidance level, a cascaded multi-task framework introduces explicit spatial prior constraints based on the intrinsic dependencies among tasks, while at the feature-guidance level, a cross-branch feature fusion mechanism progressively integrates semantic and structural information to guide high-quality learning of river-width. Extensive quantitative and qualitative experiments demonstrate that the proposed method outperforms existing representative river-width extraction approaches in terms of both prediction accuracy and overall spatial consistency, exhibiting enhanced stability and robustness, particularly against complex backgrounds and in multi-scale riverine scenarios. Future work will focus on dataset expansion, architectural optimization, and the integration of multi-source remote sensing data to further strengthen the practical applicability and reliability of high-precision river-width estimation in real-world remote sensing applications.

Author Contributions

Conceptualization, X.Z. and C.Z.; Methodology, X.Z., C.Z. and H.C.; Validation, X.Z., G.Z. and H.C.; Formal Analysis, X.Z., G.Z. and H.C.; Investigation, H.C. and G.G.; Data Curation, X.Z., G.Z., C.Z., H.C. and G.G.; Writing—Original Draft Preparation, X.Z.; Writing—Review and Editing, G.Z., C.Z. and H.C.; Visualization, X.Z. and H.C.; Supervision, G.Z. and C.Z.; Project Administration, C.Z.; Funding Acquisition, G.Z. and C.Z. All authors have read and agreed to the published version of the manuscript.

Funding

This research was funded by Research and Application of Key Technologies and Standards for Quantitative Risk Assessment of Low-Altitude Flight in Full-Scenario Environments (Grant No. 2024YFF0617400) and the National Natural Science Foundation of China (Grant No.: U24A20589, Grant No.: 42301411).

Data Availability Statement

The original contributions of this work are fully contained in the study. Further requests for additional information can be directed to the corresponding author.

Acknowledgments

The authors would like to thank the editors and reviewers for their advice.

Conflicts of Interest

The authors declare no conflicts of interest.

References

  1. Kompan, J.; Brezina, D.; Hrnčiar, M. Interoperability requirements for enhanced military mobility during water crossing operations. Transp. Res. Procedia 2026, 93, 1111–1117. [Google Scholar] [CrossRef] [Scilit]
  2. Yang, J.; Huang, X.; Tang, Q. Satellite-derived river width and its spatiotemporal patterns in China during 1990–2015. Remote Sens. Environ. 2020, 247, 111918. [Google Scholar] [CrossRef] [Scilit]
  3. Liu, Q.; Chen, Y.; Brêda, J.P.L.; Cui, H.; Duan, H.; Huang, C. Higher-density river discharge observation through integration of multiple satellite data: Midstream Yellow River, China. Int. J. Appl. Earth Obs. Geoinf. 2025, 137, 104433. [Google Scholar] [CrossRef] [Scilit]
  4. Lin, H.; Cheng, X.; Liu, J.; Shi, Q.; Li, T.; Zheng, L.; Hou, X.; Du, J. Estimating river discharge across scales with a novel regional gauging method driven by Sentinel satellite data. Remote Sens. Environ. 2024, 311, 114266. [Google Scholar] [CrossRef] [Scilit]
  5. Basyal, C.; Neupane, B.; Dhami, B.; Adhikari, B.; Nishan, K.; Poudel, S.; Adhikari, A.; Griffith, P.; Nishan, K. Factors influencing the habitat selection of Gharial (Gavialis gangeticus) and threats to its conservation in the Narayani River of Chitwan National Park, Nepal. Authorea 2025. [Google Scholar] [CrossRef] [Scilit]
  6. Zhang, S.; Wang, J.; Liu, Z.; Xia, X.; Wu, X.; Li, X.; Liu, Y.; Xu, Z.; Marzadri, A.; Mcdowell, W.H.; et al. Temperature has an enhanced role in sediment N2O and N2 fluxes in wider rivers. Water Res. 2025, 273, 123095. [Google Scholar] [CrossRef] [Scilit]
  7. Arora, R.K.; Ibrahim, M.; Kumar, N.; Banerjee, S. Hydraulic Loads on Bridges during Floods: Comparative Assessment Based on Code Provisions. J. Struct. Des. Constr. Pract. 2025, 30, 04025059. [Google Scholar] [CrossRef] [Scilit]
  8. Pavelsky, T.M.; Smith, L.C. RivWidth: A software tool for the calculation of river widths from remotely sensed imagery. IEEE Geosci. Remote Sens. Lett. 2008, 5, 70–73. [Google Scholar] [CrossRef] [Scilit]
  9. Yang, X.; Pavelsky, T.M.; Allen, G.H.; Donchyts, G. RivWidthCloud: An automated Google Earth Engine algorithm for river width extraction from remotely sensed imagery. IEEE Geosci. Remote Sens. Lett. 2019, 17, 217–221. [Google Scholar] [CrossRef] [Scilit]
  10. Wang, Z.; Li, J.; Lin, Y.; Meng, Y.; Liu, J. GrabRiver: Graph-theory-based river width extraction from remote sensing imagery. IEEE Geosci. Remote Sens. Lett. 2020, 19, 1500505. [Google Scholar] [CrossRef] [Scilit]
  11. Xue, Y.; Qin, C.; Wu, B.; Li, D.; Fu, X. Automatic extraction of mountain river surface and width based on multisource high-resolution satellite images. Remote Sens. 2022, 14, 2370. [Google Scholar] [CrossRef] [Scilit]
  12. Ku, H. Notes on the use of propagation of error formulas. J. Res. Natl. Bur. Stand. Eng. Instrum. Sect. 1966, 70, 263. [Google Scholar] [CrossRef] [Scilit]
  13. Schumann, G.; Bates, P.D.; Horritt, M.S.; Matgen, P.; Pappenberger, F. Progress in integration of remote sensing–derived flood extent and stage data and hydraulic models. Rev. Geophys. 2009, 47. [Google Scholar] [CrossRef] [Scilit]
  14. Ling, F.; Boyd, D.; Ge, Y.; Foody, G.M.; Li, X.; Wang, L.; Zhang, Y.; Shi, L.; Shang, C.; Li, X.; et al. Measuring river wetted width from remotely sensed imagery at the subpixel scale with a deep convolutional neural network. Water Resour. Res. 2019, 55, 5631–5649. [Google Scholar] [CrossRef] [Scilit]
  15. Verma, U.; Chauhan, A.; M.M., M.P.; Pai, R. DeepRivWidth: Deep learning based semantic segmentation approach for river identification and width measurement in SAR images of Coastal Karnataka. Comput. Geosci. 2021, 154, 104805. [Google Scholar] [CrossRef] [Scilit]
  16. Li, W.; Zhang, C.; Puhl, D.; Pan, X.; Hassan, M.A.; Bird, S.; Yang, K.; Zhao, Y. A CNN-Based Framework for Automatic Extraction of High-Resolution River Bankfull Width. Remote Sens. 2024, 16, 4614. [Google Scholar] [CrossRef] [Scilit]
  17. Li, H.; Tang, X.; Cui, L.; Zhai, X.; Wang, J.; Zhao, X.; Li, J.; Lei, Y.; Wang, J.; Wang, R.; et al. Estimating Aboveground Biomass of Wetland Plant Communities from Hyperspectral Data Based on Fractional-Order Derivatives and Machine Learning. Remote Sens. 2024, 16, 3011. [Google Scholar] [CrossRef] [Scilit]
  18. Chen, Y.; Yan, Q.; Huang, W. MFTSC: A semantically constrained method for urban building height estimation using multiple source images. Remote Sens. 2023, 15, 5552. [Google Scholar] [CrossRef] [Scilit]
  19. Shi, F.; Zhang, T. A multi-task network with distance–mask–boundary consistency constraints for building extraction from aerial images. Remote Sens. 2021, 13, 2656. [Google Scholar] [CrossRef] [Scilit]
  20. Shao, Z.; Zhou, Z.; Huang, X.; Zhang, Y. MRENet: Simultaneous extraction of road surface and road centerline in complex urban scenes from very high-resolution images. Remote Sens. 2021, 13, 239. [Google Scholar] [CrossRef] [Scilit]
  21. Mosinska, A.; Marquez-Neila, P.; Koziński, M.; Fua, P. Beyond the pixel-wise loss for topology-aware delineation. In Proceedings of the IEEE Conference on Computer Vision and Pattern Recognition, Salt Lake City, UT, USA, 18–22 June 2018; pp. 3136–3145. [Google Scholar]
  22. Allen, G.H.; Pavelsky, T.M. Global extent of rivers and streams. Science 2018, 361, 585–588. [Google Scholar] [CrossRef] [Scilit]
  23. Yamazaki, D.; Ikeshima, D.; Sosa, J.; Bates, P.D.; Allen, G.H.; Pavelsky, T.M. MERIT Hydro: A high-resolution global hydrography map based on latest topography dataset. Water Resour. Res. 2019, 55, 5053–5073. [Google Scholar] [CrossRef] [Scilit]
  24. Lin, P.; Pan, M.; Allen, G.H.; de Frasson, R.P.; Zeng, Z.; Yamazaki, D.; Wood, E.F. Global estimates of reach-level bankfull river width leveraging big data geospatial analysis. Geophys. Res. Lett. 2020, 47, e2019GL086405. [Google Scholar] [CrossRef] [Scilit]
  25. Popelka, S.J.; Smith, L.C. Rivers as political borders: A new subnational geospatial dataset. Water Policy 2020, 22, 293–312. [Google Scholar] [CrossRef] [Scilit]
  26. Islam, M.T.; Xing, L. Deciphering the feature representation of deep neural networks for high-performance AI. IEEE Trans. Pattern Anal. Mach. Intell. 2024, 46, 5273–5287. [Google Scholar] [CrossRef] [Scilit] [PubMed]
  27. Han, W.; Zhang, X.; Wang, Y.; Wang, L.; Huang, X.; Li, J.; Wang, S.; Chen, W.; Li, X.; Feng, R.; et al. A survey of machine learning and deep learning in remote sensing of geological environment: Challenges, advances, and opportunities. ISPRS J. Photogramm. Remote Sens. 2023, 202, 87–113. [Google Scholar] [CrossRef] [Scilit]
  28. Ronneberger, O.; Fischer, P.; Brox, T. U-net: Convolutional networks for biomedical image segmentation. In Proceedings of the International Conference on Medical Image Computing and Computer-Assisted Intervention; Springer: Berlin/Heidelberg, Germany, 2015; pp. 234–241. [Google Scholar]
  29. Qiu, W.; Gu, L.; Gao, F.; Jiang, T. Building extraction from very high-resolution remote sensing images using refine-UNet. IEEE Geosci. Remote Sens. Lett. 2023, 20, 6002905. [Google Scholar] [CrossRef] [Scilit]
  30. Wang, H.; Miao, F. Building extraction from remote sensing images using deep residual U-Net. Eur. J. Remote Sens. 2022, 55, 71–85. [Google Scholar] [CrossRef] [Scilit]
  31. Wei, Y.; Hu, X.; Zhang, M.; Xu, Y. Automatic extraction of road centerlines and edge lines from aerial images via CNN-based regression. ISPRS Ann. Photogramm. Remote Sens. Spat. Inf. Sci. 2020, 2, 925–932. [Google Scholar] [CrossRef] [Scilit]
  32. Cheng, G.; Wang, Y.; Xu, S.; Wang, H.; Xiang, S.; Pan, C. Automatic road detection and centerline extraction via cascaded end-to-end convolutional neural network. IEEE Trans. Geosci. Remote Sens. 2017, 55, 3322–3337. [Google Scholar] [CrossRef] [Scilit]
  33. Chen, L.C.; Zhu, Y.; Papandreou, G.; Schroff, F.; Adam, H. Encoder-decoder with atrous separable convolution for semantic image segmentation. In Proceedings of the European Conference on Computer Vision (ECCV), Munich, Germany, 8–14 September 2018; pp. 801–818. [Google Scholar]
  34. Papoutsis, I.; Bountos, N.I.; Zavras, A.; Michail, D.; Tryfonopoulos, C. Benchmarking and scaling of deep learning models for land cover image classification. ISPRS J. Photogramm. Remote Sens. 2023, 195, 250–268. [Google Scholar] [CrossRef] [Scilit]
  35. Cao, H.; Tian, Y.; Liu, Y.; Wang, R. Water body extraction from high spatial resolution remote sensing images based on enhanced U-Net and multi-scale information fusion. Sci. Rep. 2024, 14, 16132. [Google Scholar] [CrossRef] [Scilit]
  36. Li, Z.L.; Wu, H.; Duan, S.B.; Zhao, W.; Ren, H.; Liu, X.; Leng, P.; Tang, R.; Ye, X.; Zhu, J.; et al. Satellite remote sensing of global land surface temperature: Definition, methods, products, and applications. Rev. Geophys. 2023, 61, e2022RG000777. [Google Scholar] [CrossRef] [Scilit]
  37. Yadav, R.; Nascetti, A.; Ban, Y. How high are we? Large-scale building height estimation at 10 m using Sentinel-1 SAR and Sentinel-2 MSI time series. Remote Sens. Environ. 2025, 318, 114556. [Google Scholar] [CrossRef] [Scilit]
  38. Chen, L.C.; Papandreou, G.; Schroff, F.; Adam, H. Rethinking atrous convolution for semantic image segmentation. arXiv 2017, arXiv:1706.05587. [Google Scholar] [CrossRef] [Scilit]
  39. Woo, S.; Park, J.; Lee, J.Y.; Kweon, I.S. Cbam: Convolutional block attention module. In Proceedings of the European Conference on Computer Vision (ECCV), Munich, Germany, 8–14 September 2018; pp. 3–19. [Google Scholar]
  40. Vaswani, A.; Shazeer, N.; Parmar, N.; Uszkoreit, J.; Jones, L.; Gomez, A.N.; Kaiser, Ł.; Polosukhin, I. Attention is all you need. Adv. Neural Inf. Process. Syst. 2017, 30, 5998–6008. [Google Scholar]
  41. Dosovitskiy, A. An image is worth 16x16 words: Transformers for image recognition at scale. arXiv 2020, arXiv:2010.11929. [Google Scholar]
  42. Cui, H.; Zhang, G.; Qi, J.; Li, H.; Tao, C.; Li, X.; Hou, S.; Li, D. MDANet: Unsupervised, mixed-domain adaptation for semantic segmentation of remote sensing images. IEEE Geosci. Remote Sens. Lett. 2022, 19, 6517205. [Google Scholar] [CrossRef] [Scilit]
  43. He, K.; Zhang, X.; Ren, S.; Sun, J. Deep residual learning for image recognition. In Proceedings of the IEEE Conference on Computer Vision and Pattern Recognition, Las Vegas, NV, USA, 26 June–1 July 2016; pp. 770–778. [Google Scholar]
  44. Tan, M.; Le, Q. Efficientnet: Rethinking model scaling for convolutional neural networks. In Proceedings of the International Conference on Machine Learning, PMLR, Long Beach, CA, USA, 9–15 June 2019; pp. 6105–6114. [Google Scholar]
  45. Eigen, D.; Puhrsch, C.; Fergus, R. Depth Map Prediction from a Single Image using a Multi-Scale Deep Network. In Proceedings of the Advances in Neural Information Processing Systems; Ghahramani, Z., Welling, M., Cortes, C., Lawrence, N., Weinberger, K., Eds.; Curran Associates, Inc.: Red Hook, NY, USA, 2014; Volume 27. [Google Scholar]
  46. Misra, A.; White, K.; Nsutezo, S.F.; Straka, W., III; Lavista, J. Mapping global floods with 10 years of satellite radar data. Nat. Commun. 2025, 16, 5762. [Google Scholar] [CrossRef] [Scilit]
  47. Muhadi, N.A.; Abdullah, A.F.; Bejo, S.K.; Mahadi, M.R.; Mijic, A. The use of LiDAR-derived DEM in flood applications: A review. Remote Sens. 2020, 12, 2308. [Google Scholar] [CrossRef] [Scilit]
Figure 1. Overview of the proposed E2E-SGRWNet architecture. The network takes high-resolution optical remote sensing imagery as input and adopts a stage-guided multi-task framework composed of river-mask segmentation, centerline extraction, and river-width regression, enabling end-to-end river-width estimation.
Remotesensing 18 00894 g001
Figure 2. Detailed architecture of the structure-oriented river centerline extraction task. The network follows a U-Net-style encoder–decoder paradigm built upon multi-scale residual convolutional blocks and integrates complementary feature representations across different semantic levels through skip connections between corresponding encoder and decoder stages.
Remotesensing 18 00894 g002
Figure 3. Architecture of the cross-branch feature fusion module. This module progressively integrates spatial semantic features from the river-mask segmentation branch and structural features from the river centerline extraction branch, using the multi-scale features and the spatial attention feature from the river-width regression branch as the backbone, thereby enabling collaborative modeling of multi-branch features.
Remotesensing 18 00894 g003
Figure 4. River-width extraction from width-response distribution with structural constraints. (a) Predicted river-width map produced by the width-regression branch; (b) Initial response ridges extracted from the width-response distribution. (c) Predicted river centerline overlaid on the river mask, where black pixels within the river region indicate the centerline locations. (d) Final river-width results extracted from width-response distribution with structural constraints.
Remotesensing 18 00894 g004
Figure 5. Overview of the Wuhan study area.
Remotesensing 18 00894 g005
Figure 6. Overview of the Qingyuan study area.
Remotesensing 18 00894 g006
Figure 7. Schematic illustration of the data organization for a river-width sample unit. (a) 1 m resolution GF-2 optical remote sensing imagery; (b) the corresponding river-mask; (c) river-width annotations referenced to the centerline for the corresponding river segment.
Remotesensing 18 00894 g007
Figure 8. Representative samples from the RiverWidth-HR Dataset. River-width information is overlaid on GF-2 optical remote sensing imagery, covering diverse geographic settings, multiple river-width scales, and a wide range of river morphologies. (a) A wide-river scene with relatively regular riverbanks; (b) a wide-river scene with pronounced channel meandering; (c) a wide-river scene located in an urban built-up area with dense surrounding buildings; (d) a small-river scene in a high-density urban built-up area; (e) a natural wide-river scene with strong background vegetation coverage; (f) a natural medium-width river with multiple branches and complex channel structures; (g) a natural medium-width river in an agricultural landscape with relatively homogeneous surrounding land cover; (h) a natural small-river scene with narrow channel width and evident surrounding vegetation.
Remotesensing 18 00894 g008
Figure 9. Qualitative comparison of river-width estimation results in representative scenes from the high-precision river-width dataset. (a) A typical urban scene; (bd) representative natural scenes. The examples cover different river-width classes and diverse channel morphologies. For each scene, the ground-truth width annotations and the results produced by the four methods are shown in sequence. Each scene is equipped with an independent color legend that maps river-width values to corresponding colors.
Remotesensing 18 00894 g009
Figure 10. Qualitative analysis results. Five representative river samples are selected from the test set for segmentation and width estimation. The first row shows the corresponding 1 m resolution GF-2 optical remote sensing imagery. The second row visualizes the river-mask segmentation and centerline segmentation results overlaid on the imagery, where white regions denote river areas and black pixels indicate centerline locations. The third row presents the river-width prediction results overlaid on the original imagery, where width values are mapped to colors according to a shared color legend. (a) An urban scene with a narrow river channel surrounded by dense buildings; (b) An urban scene with a medium-width river channel within a densely built environment; (c) A mountainous scene featuring a narrow stream with extensive forest vegetation; (d) A natural river reach exhibiting abrupt changes in flow direction; (e) An agricultural landscape with a highly branched river network and complex channel morphology.
Remotesensing 18 00894 g010
Figure 11. Locations of the training regions and cross-region test sites. Yellow boxes indicate the training regions used to construct the RiverWidth-HR dataset and train the E2E-SGRWNet, while red boxes represent the cross-region test sites.
Remotesensing 18 00894 g011
Figure 12. River-width prediction results of E2E-SGRWNet in the Altay test region. (a) Overall river-width classification results for the test area, where the marked points 1 and 2 indicate two typical locations with prediction errors. (b,c) Local details corresponding to points 1 and 2 in (a), respectively. White pixels represent the river-mask segmentation results, and blue pixels indicate the predicted river centerlines. To illustrate the boundary between adjacent image tiles, only the river-mask results from the upper tile are displayed within the local region, while the adjacent tile retains only the centerline results.
Remotesensing 18 00894 g012
Figure 13. River-width prediction results of E2E-SGRWNet in the Lhasa test region. (a) Overall river-width classification results for the test area, where the marked points 1 and 2 indicate two typical locations with prediction errors. (b,c) Local details corresponding to points 1 and 2 in (a), respectively. White pixels represent the predicted river-mask results, and blue pixels indicate the predicted river centerlines. In (c), to illustrate the boundary between adjacent image tiles, only the river-mask results from the left tile are displayed within the local region, while the adjacent tile retains only the centerline results. (d) River-width prediction results for a local area of the test region imagery under summer conditions.
Remotesensing 18 00894 g013
Figure 14. River-width prediction results of E2E-SGRWNet in the Zhongwei test region. (a) Overall river-width classification results for the test area, where the marked points 1 and 2 indicate two typical locations with prediction errors. (b,c) Local details corresponding to points 1 and 2 in (a), respectively. White pixels represent the predicted river-mask results, and blue pixels indicate the predicted river centerlines. (d) Original remote sensing imagery of a local area in the test region under summer conditions.
Remotesensing 18 00894 g014
Table 1. Distribution of river-width classes in the study areas.
River ClassWidth Range (m)Total Length (km)
Wuhan Study AreaQingyuan Study Area
Small<3027.3835.77
Medium30–6028.8326.46
Large>6077.7818.55
Table 2. Quantitative evaluation results of river-width estimation for different methods on the test set.
MethodMAE ↓RMSE ↓MRE ↓PPUR ↑GTCR ↑
RWC24.80061.84274.0%67.6%80.9%
ARWE5.70018.27219.2%64.3%80.8%
DeepRivWidth3.4664.53615.6%56.9%85.9%
E2E-SGRWNet3.4284.36213.6%61.8%80.3%
↓ indicates lower values are better, ↑ indicates higher values are better. Bold values represent the best results.
Table 3. Width prediction errors across different river-width categories in the test set (small: <30 m; medium-sized: 30– 60 m ; large: >60 m).
MethodMAE ↓RMSE ↓MRE ↓
SmallMediumLargeSmallMediumLargeSmallMediumLarge
RWC13.48330.71645.19436.97971.59788.77175.5%69.9%63.3%
ARWE4.8067.14310.99114.54022.43926.69235.3%16.9%15.8%
DeepRivWidth2.8053.5206.2174.0415.2128.68825.3%8.0%8.7%
E2E-SGRWNet3.1433.2255.0764.0534.3536.89019.8%7.5%7.3%
↓ indicates lower values are better. Bold values represent the best results.
Table 4. Width prediction errors for subdivided river-width intervals (<30 m) in the test set.
MethodMAE ↓RMSE ↓MRE ↓
<10 m10–20 m20–30 m<10 m10–20 m20–30 m<10 m10–20 m20–30 m
RWC5.94611.48614.58316.03932.03939.780104.5%69.9%61.8%
ARWE5.8184.6084.81011.15313.81215.60490.5%30.5%20.0%
DeepRivWidth3.4302.5702.6344.7233.8843.89368.3%17.2%11.1%
E2E-SGRWNet3.0652.6873.5314.1533.5044.43443.4%17.7%15.1%
↓ indicates lower values are better. Bold values represent the best results.
Table 5. Evaluation of river-mask segmentation maps and centerline segmentation maps on the test set at 1   m spatial resolution. All metrics are computed only over foreground pixels.
TaskIoUPrecisionRecallF1
River mask0.9080.9830.9220.952
River centerline0.5190.6870.6800.684
Table 6. River-width prediction errors for the three test regions. All results were obtained from 3 m resolution PlanetScope imagery.
RegionMAE (m)RMSE (m)MRE
Altay 8.42 11.98 4.9 %
Lhasa 8.51 11.99 4.2 %
Zhongwei 5.02 5.85 4.0 %
Table 7. Ablation results of E2E-SGRWNet under different stage-wise guidance configurations on the 1 m spatial resolution test set.
ModelMAE ↓RMSE ↓MRE ↓PPUR ↑ GTCR ↑
Model_19.83012.19629.2%37.8%54.1%
Model_23.8975.11415.8%61.2%79.0%
Model_33.3964.58213.4%58.5%78.5%
E2E-SGRWNet3.4284.36213.6%61.8%80.3%
↓ indicates lower values are better, ↑ indicates higher values are better. Bold values represent the best results.
Disclaimer/Publisher’s Note: The statements, opinions and data contained in all publications are solely those of the individual author(s) and contributor(s) and not of MDPI and/or the editor(s). MDPI and/or the editor(s) disclaim responsibility for any injury to people or property resulting from any ideas, methods, instructions or products referred to in the content.