Article

CrownViM: Context Clustering Meets Vision Mamba for Precise Tree Crown Segmentation in Aerial RGB Imagery

1
College of Electronic Information and Physics, Central South University of Forestry and Technology, Changsha 410004, China
2
College of Forestry, Central South University of Forestry and Technology, Changsha 410004, China
*
Author to whom correspondence should be addressed.
These authors contributed equally to this work.
Remote Sens. 2026, 18(6), 860; https://doi.org/10.3390/rs18060860
Submission received: 25 January 2026 / Revised: 27 February 2026 / Accepted: 6 March 2026 / Published: 11 March 2026

Highlights

What are the main findings?
  • CrownViM: First SSM-based framework for tree crown delineation.
  • High segmentation accuracy with low parameter count, surpassing Mask R-CNN.
What are the implications of the main findings?
  • Context Clustering Vision Mamba + MaskFormer enables precise crown separation.
  • Sparse-annotation loss reduces dependency on full pixel-level masks.

Abstract

The proliferation of high-spatial-resolution remote sensing data is transforming forest attribute estimation, replacing traditional manual approaches with deep learning-based Individual Tree Crown Delineation (ITCD). Nevertheless, accurate ITCD boundary extraction from aerial RGB imagery faces persistent challenges: boundary ambiguity from complex crown occlusion in mixed forests, scarcity of high-quality annotations, and computational limitations of existing methods in dense forests. The latter manifests particularly in overlapping crown scenarios through constrained receptive fields, leading to substantial parameter requirements, computational inefficiency, and compromised accuracy. To overcome these limitations, we propose CrownViM, a novel architecture based on a bidirectional State Space Model (SSM). The framework integrates a linear-complexity Context Clustering Vision Mamba (CCViM) encoder for efficient global context modeling and employs a MaskFormer decoder for precise boundary prediction. We further introduce a partial-supervision loss function to reduce dependence on exhaustively annotated crown masks. Evaluations on OAM-TCD and the single-tree segmentation dataset (SSD) show CrownViM achieves significant segmentation accuracy improvements while maintaining a lightweight profile (39.6 M parameters). It substantially outperforms Convolutional Neural Network (CNN), Vision Transformer (ViT), and hybrid-based baselines when processing overlapping crowns and structurally complex scenes. As the first implementation of state space models in ITCD, CrownViM effectively addresses core limitations in global context capture, computational efficiency, and boundary definition. Our efficient architecture and sparse-annotation loss strategy enable high-accuracy, robust individual tree mapping, advancing tools for large-scale forest monitoring and accurate carbon stock quantification.

1. Introduction

As fundamental structural elements of terrestrial ecosystems, trees within and beyond forests perform irreplaceable ecological functions by sustaining biodiversity (Santoro et al., 2022) [1], regulating hydrological cycles (Lei et al., 2022) [2], and modulating carbon pool dynamics (Chai et al., 2023) [3]. Accurate quantification of individual-tree-level forest attributes (e.g., canopy cover, diameter at breast height [DBH], and biomass) constitutes a critical foundation for optimizing forest management strategies and provides essential baseline data for achieving carbon neutrality objectives. Currently, most national forest monitoring systems worldwide still depend on periodic ground surveys to assess, quantify, and monitor forests (Wang et al., 2019) [4]. Yet these traditional approaches face limitations due to high economic costs and labor-intensive processes, hindering their application to large-scale, high-frequency monitoring.
Recent years have witnessed substantial advances in automated forest parameter retrieval using high-resolution remote sensing. The maturation of collaborative Unmanned Aerial Vehicle (UAV)–satellite observation systems has particularly facilitated the adoption of Individual Tree Crown Delineation (ITCD), gradually replacing conventional pixel-based spectral classification. Unlike its predecessors, ITCD enables precise forest parameter retrieval through morphological feature extraction at the single-tree level. Accurate crown structure characterization enhances key parameter estimation effectiveness—exemplified by crown size and canopy cover retrieval (Zhang et al., 2010) [5], DBH prediction based on crown volumetric modeling (Dalponte et al., 2018) [6], and biomass inversion frameworks integrating multispectral indices (Graves et al., 2018) [7].
According to algorithmic principles and data-driven paradigms, current ITCD methodologies are categorized into traditional approaches and deep learning-based techniques. Traditional methods comprise three main types: valley-following, region-growing, and watershed segmentation. Valley-following algorithms rely on an optical reflectance assumption specific to coniferous forests: crown apexes exhibit high reflectance while inter-crown shadow zones form local brightness minima (Gougeon et al., 1998) [8]. By tracking shadow gaps via gradient descent, they performed well in homogeneous mature stands. However, crown self-shading and topographic interference increase segmentation errors in broadleaf or all-aged mixed forests. Region-growing techniques iteratively aggregate pixels based on spectral similarity around seed points, accommodating irregular crowns but facing two limitations: (a) seed detection sensitivity to canopy density causes proliferation in dense stands; (b) manual growth thresholds lack adaptability to gradual crown-edge transitions (Ferreira et al., 2014) [9]. Watershed segmentation treats local minima in Digital Surface Models (DSMs) or Canopy Height Models (CHMs) as watershed boundaries, simulating flooding processes to segment crowns. The marker-controlled variant suppresses over-segmentation through predefined local maxima markers (Wang et al., 2004) [10], though topographic variations induce CHM interpolation errors that degrade boundary topology.
Deep learning-based delineation has emerged to address traditional limitations, generally outperforming predecessors by efficiently extracting features from training data. Persistent challenges include the following: Hybrid methods integrating watershed processing require manual hyperparameter tuning for post-processing steps (e.g., noise removal), with inconsistent optimal values across diverse environments. While instance segmentation (e.g., Mask R-CNN) circumvents extra parameters, its reliance on non-maximum suppression (NMS) using axis-aligned bounding boxes poorly approximates crown morphology during overlap, producing inaccurate segmentations. NMS threshold selection further complicates optimization. Additionally, annotating crowns in dense mixed forests presents difficulties: indistinguishable crowns in RGB-only imagery impede comprehensive annotation (He et al., 2017) [11].
High-resolution aerial RGB imagery imposes stringent requirements on algorithmic models due to crown morphological diversity (e.g., umbellate, conical) and frequent dense overlaps. Widely adopted Convolutional Neural Networks (CNNs) (Wang et al., 2023) [12] represent images as pixel grids, performing convolution operations within local regions. While effective at capturing local features, CNNs inadequately model long-range feature interactions, limiting their ability to establish contextual dependencies between global canopy structures and fine edge details. Vision Transformers (ViTs) (Zhang et al., 2023) [13] effectively address this limitation by partitioning images into patch tokens. Each token attends to others globally, capturing contextual information through long-range interactions. However, ViTs exhibit quadratic computational complexity relative to token count, creating substantial overhead that hinders efficient deployment with high-resolution imagery.
Tree crown segmentation presents a dense overlapping instance regime: multiple crowns share local appearance and occlude each other, so distinguishing instances and resolving boundaries inherently requires long-range contextual reasoning (e.g., propagating identity from treetop to crown extent). This motivates encoders that combine global receptive fields with scalable complexity. State space models (SSMs) offer a theoretically grounded alternative: they maintain linear complexity O(N) in sequence length N while still modeling long-range dependencies via recurrent state updates, unlike ViT’s O(N2) self-attention. For high-resolution imagery, N scales with the number of patches; thus, SSMs afford efficient long-range dependency modeling precisely where ViTs become costly. Combining an SSM-based encoder with an instance-aware decoder (e.g., MaskFormer) is therefore well-suited to ITCD: the encoder captures global crown layout and adjacency at linear cost, while the decoder assigns instance labels and refines boundaries using mask-level attention.
Hybrid CNN–Transformer architectures consequently attract significant research interest. Recent approaches include Transformer-based encoders paired with CNN decoders (Zhou et al., 2024; Zhou et al., 2025) [14,15] and hybrid modules integrating convolutions with self-attention throughout encoder–decoder networks (Shi et al., 2025; Guo et al., 2024) [16,17]. Despite achieving competitive segmentation accuracy, three critical challenges impede precise individual crown segmentation: (1) transformers’ quadratic complexity versus CNNs’ limited receptive fields; (2) boundary delineation difficulties in high-canopy-closure zones with interlocking crowns; (3) annotation challenges from numerous high-resolution RGB images where exhaustive crown labeling is prohibitively labor-intensive.
The 2024 emergence of Vision Mamba (ViM) introduces a bidirectional State Space Model (SSM) solution. Adapting the causal Mamba framework originally designed for NLP (Gu & Dao, 2024) [18] and recently extended to complex visual tasks (Liu et al., 2024) [19], ViM processes flattened image patches bidirectionally using cross-scanning mechanisms that assimilate positional information along four spatial directions (Liu et al., 2024; Huang et al., 2024) [19,20]. This maintains linear complexity while establishing global receptive fields. Figure 1 (right) illustrates the following: (A) ViT (Zhang et al., 2023) [13] employs token-based self-attention; (B) VMamba (Liu et al., 2024) [19] implements cross-scanning for linear-complexity global context; (C) our CCViM (Zhu et al., 2025) [21] integrates cross-scanning with context clustering, dynamically grouping image points into local clusters to extract contextual features. The right panel is adapted from the encoder comparison in Zhu et al. (2025) [21]; we extend the schema to include CrownViM’s placement relative to ViT and VMamba.
Our contributions are as follows: (1) the first integration of an SSM encoder (CCViM) into ITCD for linear-complexity global crown context; (2) the CCS6 layer coupling multi-directional scanning with context clustering for adaptive local–global features tailored to overlapping crowns; (3) a partial-supervision (region-constrained mask) loss for sparse-annotation training; (4) state-of-the-art accuracy with a lightweight 39.6 M parameters. The framework reuses CCViM and MaskFormer as building blocks but combines them for ITCD and introduces (2) and (3) to address crown-specific challenges.

2. Related Work

The following section consolidates related work on ITCD and segmentation backbones to position CrownViM within the existing literature; the introduction above has already outlined our motivation and contributions.
Traditional Segmentation Methods: These encompass valley-following, region-growing, and watershed techniques. Valley-following segments trees by detecting ‘valley’ features in crown gaps. Leckie (2003) [22] developed a semi-automated high-resolution imagery method effective in coniferous stands (e.g., Larix spp., Picea spp.) with defined canopy structures. Performance significantly degrades when crown overlap exceeds 40% due to obscured valleys.
Region-growing leverages spectral/textural homogeneity to expand crowns from seed points (Gu and Congalton, 2022) [23], offering practical implementation advantages. Zhen et al. (2014) [24] fused ALS and orthoimagery, improving segmentation in Picea abies plantations—sequential growing increased the producer’s/user’s accuracy by approximately 2%. However, interspecies crown heterogeneity in mixed forests induces errors. Gärtner et al. (2014) [25] analyzed Populus euphratica dynamics using multispectral crown contours, succeeding in structured vegetation but failing in occluded, heterogeneous areas.
Watershed segmentation primarily utilizes edge detection. Two refinements address over-segmentation:
Multiscale Processing: Jing et al. (2012) [26] implemented watershed segmentation on Gaussian-smoothed images at three spatial scales, selecting optimal contours. Insufficient adaptability to natural crown size variation limited effectiveness. Yang et al. (2014) [27] combined gradient images with multi-scale thresholds for automated scale selection, though persistent over-segmentation occurred due to non-adaptive scaling.
Marker-Controlled Watershed: This approach uses detected treetops (local maxima) as markers. Wang (2010) [28] refined treetop detection via spectral–spatial local maxima fusion. Wagner et al. (2018) [29] achieved high accuracy in tropical forests using mathematical morphology, but manual parameterization constrained generalization. Tong et al. (2021) [30] similarly employed treetop markers to suppress over-segmentation. Performance remains limited by treetop detection accuracy, as imprecise crown boundary delineation in complex stands reduces robustness.
Deep Learning-Based Methods: Recent years have witnessed the development of deep learning approaches for crown delineation (Straker et al., 2023; Dersch et al., 2024) [31,32]. One category integrates deep learning with watershed segmentation to enhance crown delineation. Weinstein et al. (2019) [33] employed the single-stage detector RetinaNet to detect tree crown bounding boxes in open woodlands of California (USA) using aerial imagery. Labels derived from Silva et al. (2016) [34] in LiDAR segmentation or manual annotation showed training inconsistencies between unsupervised LiDAR labels and human annotations, causing significant false-positive detections. Lassalle et al. (2022) [35] utilized CNNs to predict distance maps indicating pixel-to-nearest-crown-boundary distances. Treetops were identified as local maxima in distance maps, enabling marker-controlled watershed segmentation for final crown delineation. Similarly, Freudenberg et al. (2022) [36] predicted crown masks, contours, and distance maps via U-Net, then performed watershed segmentation based on these outputs. Compared to traditional methods, this category leverages deep learning to generate essential inputs for marker-controlled watershed, demonstrating superior performance.
Another category adopts instance segmentation frameworks. Mask R-CNN (He et al., 2017) [11] remains the most widely applied deep learning model for crown delineation. Chadwick et al. (2020) [37] achieved high F1-scores when detecting conifer regeneration under deciduous canopies in Rocky Mountain valleys using UAV RGB imagery. Braga et al. (2020) [38] applied Mask R-CNN to tropical forests with high-resolution satellite images, yielding reasonable results against visually interpreted references—though over-segmentation increased notably with larger crowns. Dersch et al. (2023) [39] evaluated Mask R-CNN on UAV imagery from mixed forests, while Ball et al. (2023) [40] developed the Detectree2 framework based on Mask R-CNN for airborne RGB crown segmentation in tropics. These studies confirm Mask R-CNN’s utility while highlighting persistent limitations like over-segmentation.
We innovatively integrate Vision Mamba with MaskFormer for high-resolution aerial RGB tree crown segmentation. Vision Mamba efficiently captures global crown spatial distributions through linear-complexity feature modeling, addressing crown localization challenges in complex backgrounds. MaskFormer refines boundary details via mask prediction mechanisms as the decoder. Our partial-supervision loss function further reduces annotation dependency, enhancing model applicability and efficiency.

3. Materials and Methods

3.1. Data Collection

Deep learning segmentation algorithms utilizing high-resolution aerial and satellite imagery have demonstrated precise mapping capabilities for tree cover at national-to-continental scales (Lei et al., 2025; Tong and Zhang, 2025) [41,42]. However, ensuring model practicality and generalization requires large-scale, geographically diverse datasets that capture the morphological diversity of trees across terrestrial biomes and distinct urban/natural environments. This paper’s dataset comprises two components:
(1)
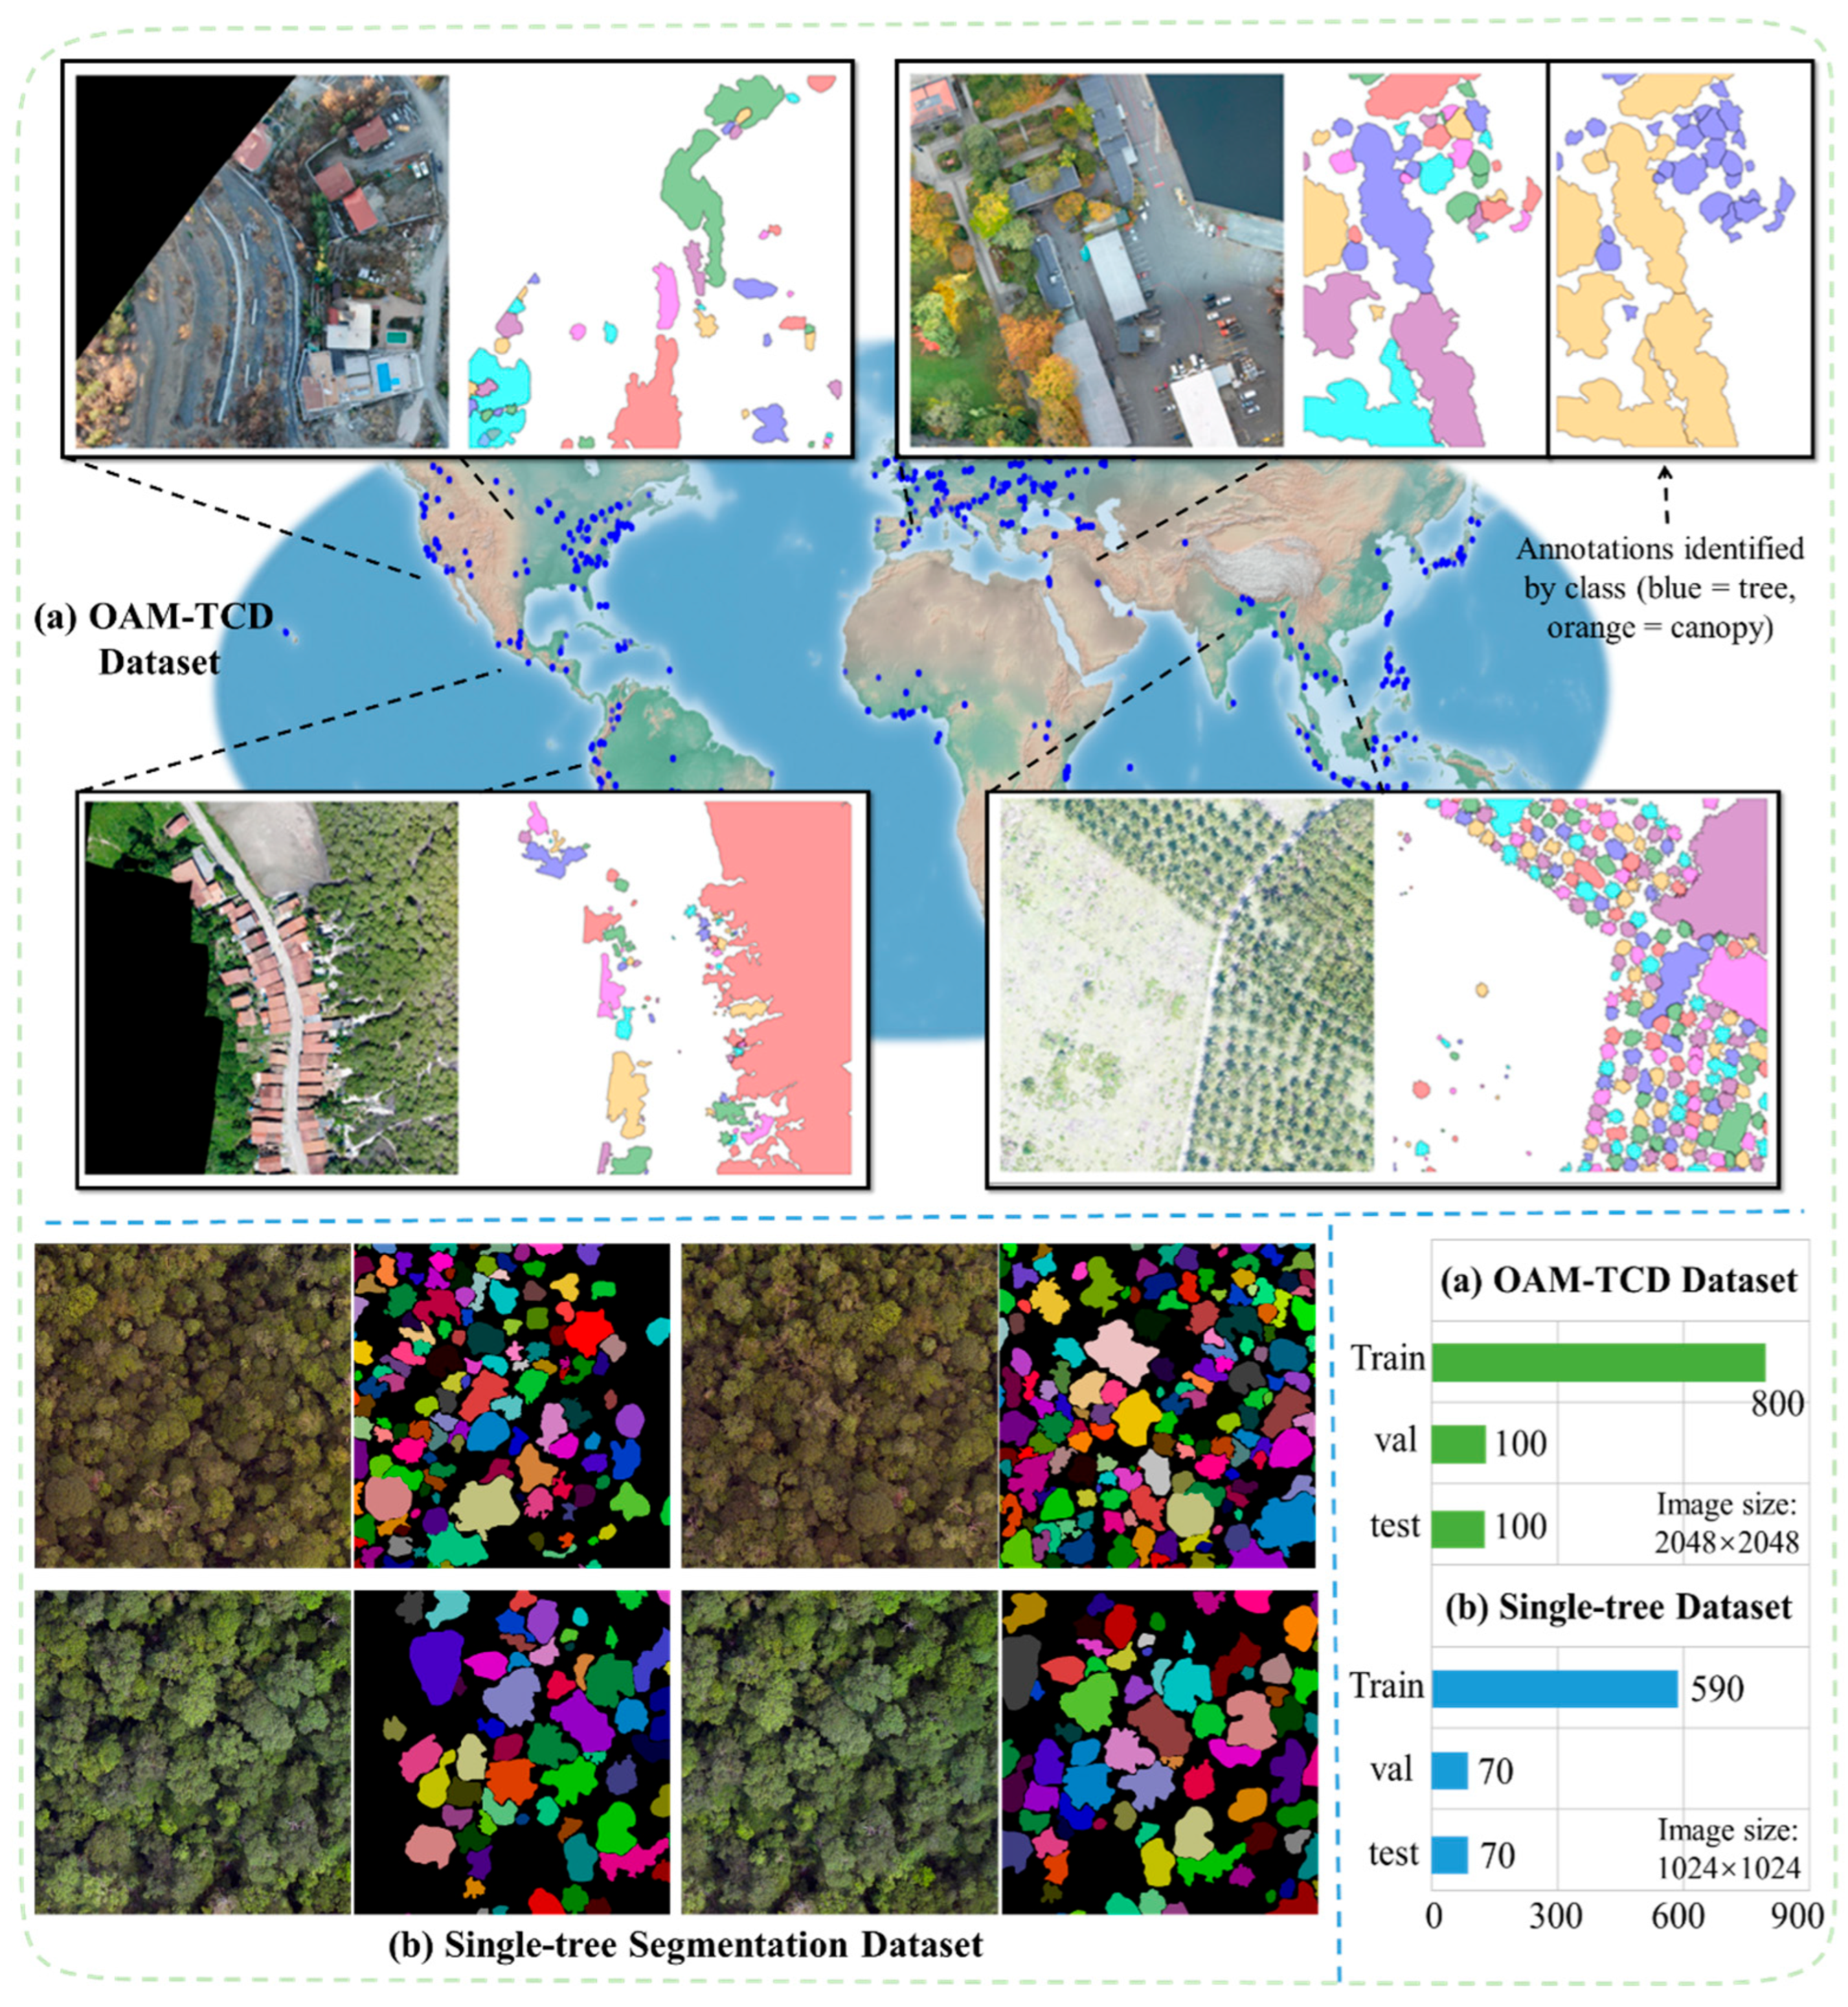
The OAM-TCD dataset (Veitch–Michaelis et al., 2024) [43], illustrated in Figure 2a, is an open-source resource for individual tree crown segmentation in high-resolution aerial imagery developed by ETH Zürich and collaborators. It contains 5072 annotated images (2048 × 2048 pixels at 10 cm/pixel resolution) with instance masks delineating >280,000 individual trees and 56,000 tree clusters. Globally sampled across biomes including urban and forest landscapes, the dataset incorporates geographical and ecological diversity through multi-stage sampling and filtering protocols. Primarily applied in ecological monitoring and forest restoration assessment, it enhances quantitative canopy cover accuracy. The high-resolution nature imposes computational constraints: pixel-level operations exhibit quadratic scaling with image edge length, while memory requirements increase linearly with resolution, creating challenges for model parameter optimization and computational efficiency.
(2)
The single-tree segmentation dataset (SSD), illustrated in Figure 2b, was developed by the State Key Laboratory of Surveying, Mapping and Remote Sensing Information Engineering at Wuhan University. This specialized dataset serves high-precision single-tree segmentation research, comprising 731 aerial images at 1024 × 1024 pixel resolution. Collected through stratified regional sampling, the dataset captures canopy distribution patterns across diverse forest stands, including coniferous, broad-leaved, and mixed forest types. The high-canopy-closure characteristic of these forests leads to overlapping crown edges and complex shadow patterns, posing significant challenges for accurate edge detection and instance segmentation, which consequently limits segmentation accuracy.

3.2. Deep Learning Method

3.2.1. Mamba and MaskFormer

Mamba (Gu and Dao, 2024 [18]) is an efficient causal visual state space model that identifies a fundamental limitation in structured state space models (SSMs): their incapacity for content-dependent reasoning. To address this, Mamba (Zhang et al., 2024) [44] proposes selective state space models (S6). The recursive SSM formulation is defined as follows:
h t = A ¯ h t + B ¯ x t y t = C h t
where h t R N represents the intermediate latent state of transforming x t R to y t R . The matrices A R N × N and B R N × N are discretized via A ¯ = e x p Δ A and B ¯ = Δ A 1 e x p Δ A E · Δ B with Δ being the time scale parameter for discretization. This discretization enables the continuous-time SSM to be incorporated into deep learning frameworks. The output matrix C R N × 1 and identity matrix I complete the parameter set. S6 extends the SSM framework by making parameters Δ , B , and C input-dependent (x), formulated as follows:
s B x = L i n e a r N x s C x = L i n e a r N x s Δ x = s o f t p l u s P a r a m e t e r + B r o a d c a s t D L i n e a r 1 x
where L i n e a r N and L i n e a r 1 denote fully connected (FC) layers projecting input x to dimensions N and one, respectively. The B r o a d c a s t D operation aligns tensor dimensions through broadcasting. The s o f t p l u s activation ensures non-negative outputs.
The S6 integration enables Mamba to maintain linear computational complexity while demonstrating state-of-the-art performance in language modeling benchmarks (Gu and Dao, 2024; Lieber et al., 2024) [18,45]. However, the model’s causal structure poses challenges for image processing, as visual data inherently lacks temporal causality. To address this limitation, Li et al. (2025) [46] introduced a cross-scan module that performs bidirectional traversal of patch-embedded images along four orthogonal axes. This design resolves the non-causal constraints while preserving the original receptive field and maintaining O(N) computational complexity.
Experimental results show that the Vision Mamba-based VM-UNet outperforms certain CNN and Transformer architectures in tasks including nuclei segmentation and skin lesion segmentation. The improved CCViM with integrated contextual clustering achieves 58.83% PQ on the Kumar dataset and 81.40% mIoU on the ISIC-2017 dataset, with competitive efficiency metrics such as parameter size and inference speed, highlighting the promise of Vision Mamba in image processing.
MaskFormer (Cheng et al., 2021) [47] is a segmentation model employing mask classification principles. This approach provides sufficient generality to handle both semantic segmentation and instance-level segmentation tasks within a unified framework, requiring no modifications to the model architecture, loss function, or training procedure.
Traditional semantic segmentation methods typically employ the per-pixel classification paradigm, assigning class labels for each pixel in the image, while instance-level segmentation utilizes the mask classification paradigm, generating a set of binary masks with each mask assigned a specific category. MaskFormer unifies these two tasks within the mask classification framework through prediction of binary masks, where each mask corresponds to a global category label, thereby providing a unified approach for both semantic segmentation and instance-level segmentation tasks.
MaskFormer comprises three core components: a pixel-level module, Transformer module, and segmentation module. The pixel-level module first extracts feature maps using a backbone network, which are then processed by a pixel decoder to produce per-pixel embeddings E p i x e l R C E × H × W . The Transformer module employs a Transformer decoder that processes both image features and learnable query embeddings to output N segment embeddings Q R C Q × N . The segmentation module subsequently (i) predicts class probabilities p i Δ K + 1 (containing a special “no-object” class ∅) via a linear classifier operating on segment embeddings, and (ii) generates mask embeddings E m a s k R C ε × N through an MLP. The final binary mask predictions are computed as the sigmoid-activated dot product between mask embeddings and per-pixel embeddings, formulated as follows:
m i h , w = s i g m o i d E m a s k : , i T · E p i x e l : , h , w
where E m a s k : , i denotes the i-th mask embedding vector. E p i x e l : , h , w represents the per-pixel embedding at spatial location h , w . The dot product of their transposes after s i g m o i d activation obtains the probability value that this position belongs to the i-th mask. The value ranges between [0, 1], which is used to indicate whether the pixel belongs to the region corresponding to the current mask.
MaskFormer employs a mask classification loss ( L m a s k c l s ) which is composed of a cross-entropy classification loss and a binary mask loss L mask. The definition is as follows:
L m a s k c l s z , z g t = j = 1 N l o g p σ j c j g t + 1 c j g t L m a s k m σ j , m j g t
where σ is the matching mapping between predicted and ground-truth sets. l o g p σ ( j ) c j g t is the cross-entropy classification loss measuring the discrepancy between predicted class probabilities and ground-truth classes. 1 c j g t is the indicator function that equals one when the ground-truth class c j g t is not the “no-object” class ∅, and zero otherwise. L m a s k m σ ( j ) , m j g t is the binary mask loss employing a linear combination of f o c a l loss and d i c e loss. This loss function effectively guides the model to learn both accurate class predictions and precise mask predictions.
MaskFormer employs task-specific inference strategies for different segmentation tasks. For panoptic segmentation, a universal inference strategy partitions the image into mask regions by assigning each pixel to the region where the product of its maximum class probability p i c i and mask activation m i h , w are maximized. For semantic segmentation, a semantic inference strategy aggregates all binary masks with their corresponding class predictions via matrix multiplication to generate per-pixel class labels. The precise formulation is given by the following:
arg m a x c 1 , , K i = 1 N p i c · m i h , w
where p i c represents the probability that the i -th mask predicts class c, and m i h , w represents the probability that the image position h , w belongs to the i -th mask.
The argmax operation in semantic inference explicitly excludes the ‘no-object’ class (∅), since standard semantic segmentation requires every output pixel to have a definite class label, whereas ∅ denotes background/unlabeled pixels. While this approach provides per-pixel class probability distributions, the direct maximization of per-pixel class likelihood results in suboptimal segmentation performance.

3.2.2. Overall Architecture

The choice of an SSM-based encoder (CCViM) paired with a MaskFormer decoder is motivated by the specific demands of tree crown segmentation. Dense overlapping crowns require (i) long-range dependency modeling to associate distant but semantically coherent crown regions and to disambiguate boundaries between adjacent instances, and (ii) computational efficiency so that high-resolution images (large N) remain tractable. SSMs satisfy (i) through recurrent state propagation that spans the full sequence and (ii) through O(N) complexity versus the O(N2) of token-wise self-attention in ViTs. MaskFormer then provides instance-level mask prediction and boundary refinement without imposing additional quadratic cost on the encoder. This encoder–decoder combination is therefore theoretically aligned with ITCD’s need for efficient, globally aware instance segmentation.
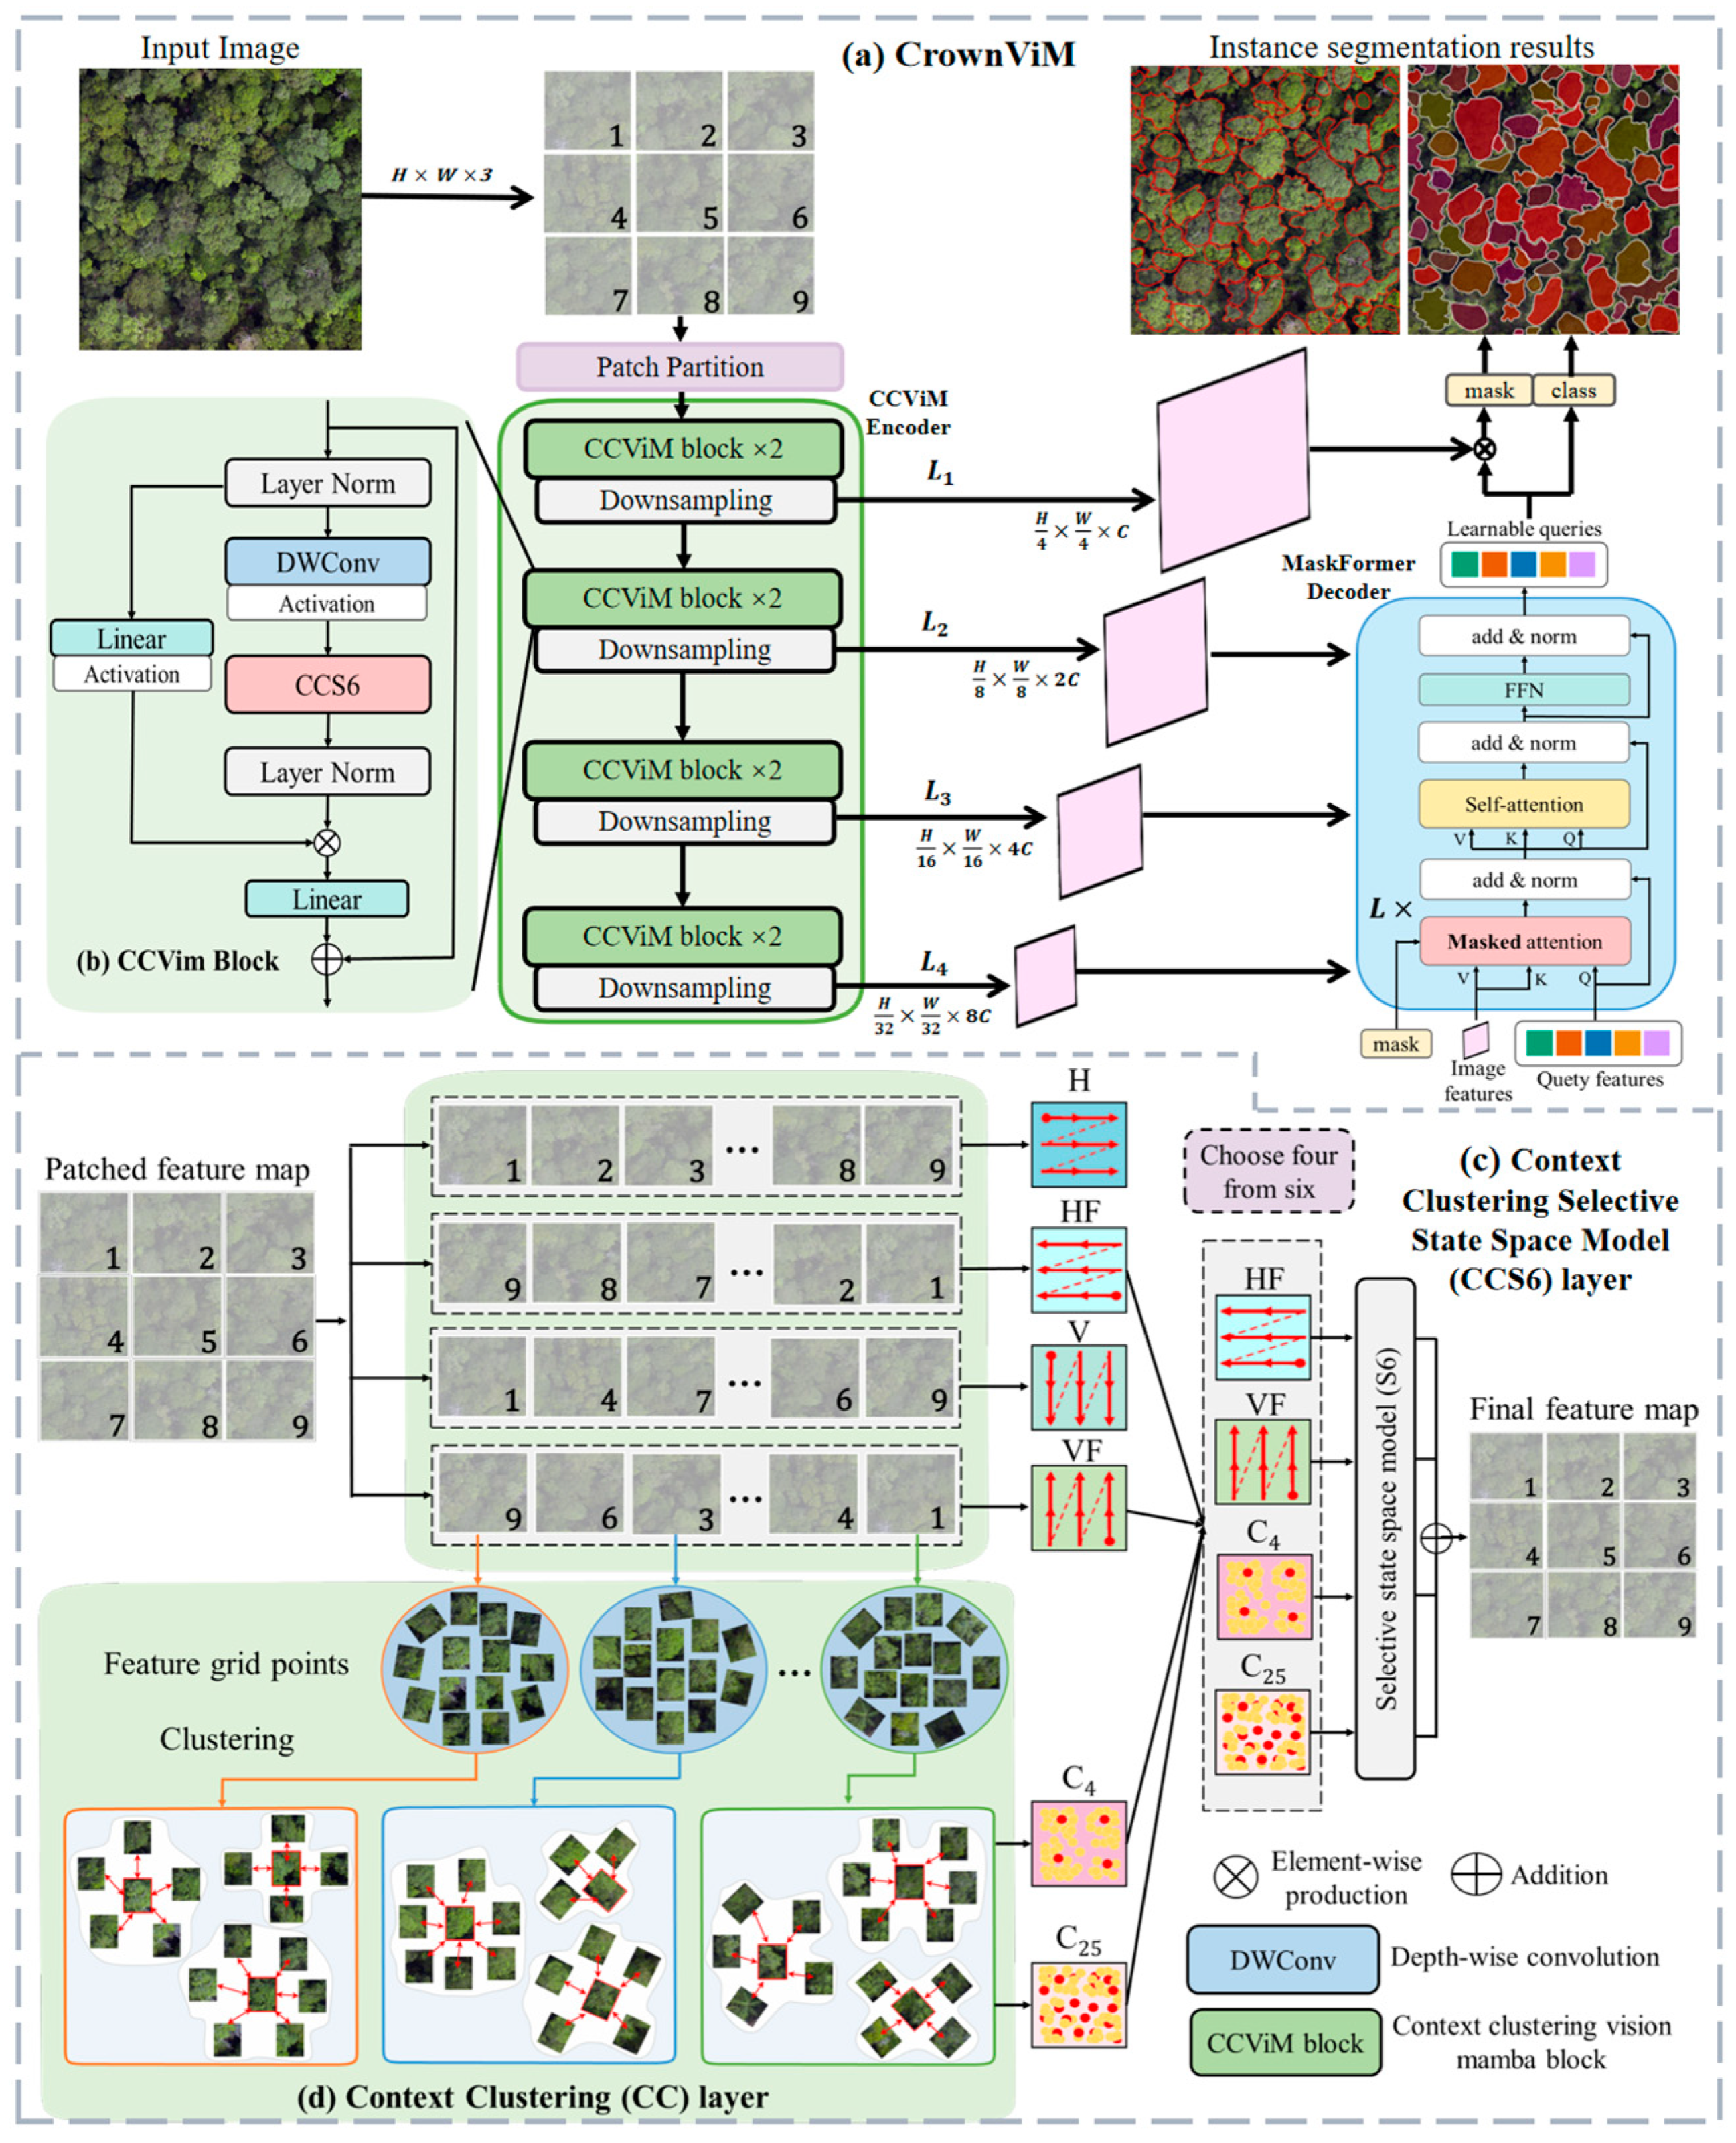
To mitigate segmentation difficulties caused by complex backgrounds, overlapping tree crowns, and high-resolution RGB images, we propose the CrownVim model for precise single-tree crown segmentation in high-resolution aerial imagery. Figure 3a illustrates the CrownVim architecture. Departing from UNet’s symmetric structure, CrownVim features an asymmetric design comprising three core modules: a patch division layer, a four-stage encoder (CCViM Encoder), and a Mask2Former decoder. These modules enable end-to-end processing from image input to segmentation output. The workflow is as follows:
First, an RGB input image I R 3 × W × H is passed to the patch division layer. This layer applies a 4 × 4 non-overlapping patch partition, converting the image into an initial feature map of size C × W × H, where C denotes the number of feature channels (initially set to 64). This transformation produces a feature sequence compatible with subsequent processing while retaining local spatial structure information, thereby laying the foundation for feature extraction.
Second, the initial feature map is processed by the four-stage encoder network. Each encoder stage contains two CCViM Blocks followed by a downsampling module. The downsampling module concatenates features from 2 × 2 neighboring patches and applies linear projection, halving the spatial resolution (height and width) and doubling the channel count. After processing through four stages, the feature maps possess channel dimensions [C, 2C, 4C, 8C], corresponding to spatial resolutions of 1/4, 1/8, 1/16, and 1/32 of the original image dimensions, respectively. This design facilitates progressive extraction and abstraction of multi-scale features.
Finally, the multi-scale features from the encoder are input to the Mask2Former decoder. Leveraging a high-resolution feature pyramid and mask attention mechanism, this decoder performs feature interaction focused within the foreground regions of predicted masks. This approach optimizes tree crown boundary detail while controlling computational costs, ultimately generating the final single-tree instance segmentation masks efficiently. Next, we detail CrownVim’s two core modules: the CCViM Encoder, which handles feature extraction, and the Mask2Former Decoder, which handles instance-level optimization.

3.2.3. CCViM Feature Encoder with Contextual Clustering

As illustrated on the left of Figure 3a, the CCViM Encoder forms the core for capturing global and local tree crown features. Its central component is the CCViM Block, designed for efficient feature interaction via its CCS6 layer, which integrates Contextual Clustering (CC) with the Selective State Space Model (S6).
CCViM Block: The CCViM Block, depicted in Figure 3b, operates as follows. The input is first normalized (e.g., LayerNorm), then split into two branches. The first branch applies a linear layer followed by an activation function. The second branch sequentially processes the input through a linear layer, a depthwise convolution layer, and an activation function, before passing it to the CCS6 layer. The output from the CCS6 layer is normalized again, then fused via element-wise multiplication with the output of the first branch. Finally, a linear layer projects the fused features back to match the dimensionality of the original input, establishing a residual connection.
Contextual Clustering Selective State Space Model (CCS6) Layer: The CCS6 layer, core to the CCViM Block, builds upon the Selective State Space Model (S6). While S6 efficiently models long-range dependencies, its causal nature inherently processes data sequentially along a single scan path. This constraint causes two issues for non-causal data-like images: 1) difficulty capturing global context from all directions simultaneously, and 2) fixed scanning trajectories poorly handle complex, varying spatial relationships. Prior solutions (Liu et al., 2024; Huang et al., 2024) [19,20] propose multi-directional scanning but often sacrifice localized feature understanding. To jointly capture multi-directional context and adaptive local structure, we propose the CCS6 layer. As shown in Figure 3c, the CCS6 layer leverages two types of learnable transformations on the input:
Cross-Scan Paths: Inspired by VMamba (Liu et al., 2024) [19], we flatten and traverse feature patches sequentially along four distinct directions (e.g., horizontal and vertical scans in both forward/reverse orders) to gather multi-directional context.
Contextual Clustering (CC): Operating within local windows, CC layers learn adaptive feature aggregation by clustering local feature vectors into a specified number of centers. We employ two CC layers with four and 25 centers, respectively, capturing structural information at different granularities.
Thus, six distinct transformation strategies are available: four Cross-Scan paths and two CC paths. To balance efficacy and computational load, the CCS6 layer dynamically selects four out of these six strategies. The features transformed by the four selected strategies are then individually processed by S6 modules (as in Huang et al., 2024 and Zhu et al., 2025) [20,21], and their outputs are finally merged to form the CCS6 layer’s output feature map.
In contrast to window-based or deformable attention in ViTs—which rely on fixed spatial windows or learned offset sampling—the CCS6 layer uses dynamic clustering to assign each point to a cluster by feature similarity, so that context aggregation is adaptive to crown morphology and boundary layout, rather than to a predefined grid. This is particularly beneficial for ITCD: crown overlap and boundary ambiguity require context to follow semantic regions (e.g., a crown’s extent) instead of rectangular windows; the two CC branches with four and 25 centers capture structure at different granularities, accommodating both compact and spread crown shapes.
Contextual Clustering: We utilize the Contextual Clustering (CC) algorithm (Ma et al., 2023) [48] as an alternative to convolution or attention for local feature extraction and spatial context capture. The CC layer treats the image as a collection of data points grouped into clusters. To manage computation, clustering is confined to local windows. Points within each cluster are adaptively aggregated to form a cluster center. As depicted in Figure 3d, an input image I R 3 × W × H is transformed by a patch-embedding layer into a feature map F R d × w × h . We convert the block feature map into a set of data points P R d × n , where n = w × h represents the total number of data points, and d is the point feature dimension. We cluster points into distinct groups based on feature similarity, ensuring single-cluster assignments.
For the CC layer, we first project the input points to a feature space denoted as P S R n × d to compute similarity scores, where d represents the dimensionality of the new point features. Within each local window, we uniformly sample t centroids. The feature of each centroid is computed by averaging the features of its k nearest neighboring points. We then compute the pairwise cosine similarity between these t centroids and all points in P S , yielding a similarity matrix S R t × n . Based on S , each point is assigned to its most similar centroid, resulting in t clusters. Note that cluster sizes may vary, and some clusters might remain empty (indicating redundant centroids, which are subsequently removed). During the clustering process, points within each cluster are dynamically aggregated towards their corresponding centroid, weighted by their similarity scores. For each cluster (excluding empty ones), we consider its m member points, denoted as P m R m × d . We compute the similarity scores s R m between these m points in P m R n × d (which are a subset of P S R n × d ) and the cluster centroid; these scores form a sub-vector of the similarity matrix S. Subsequently, the member points P m R m × d are projected into a value space, obtaining their value embeddings. Within this value space, we derive the value center v c by aggregating the embeddings of P m , analogous to the process of centroid proposal. The aggregated feature g R d for the cluster is then computed as follows:
g = 1 T v c + i = 1 m σ α s i + β p i s . t . ,   T = 1 + i = 1 m σ α s i + β
where α and β are learnable scalar parameters responsible for scaling and offsetting the similarity values, σ denotes the sigmoid function that remaps similarities to the open interval (0,1), and p i corresponds to the i-th feature vector within the cluster subset P m . Inclusion of the value center v c in Equation (3) serves dual purposes: enhancing numerical stability and preserving locality information. To regulate feature magnitude, the aggregated representation g undergoes scaling by a factor T. The vector g is then used to adaptively modulate the feature representation of each point in the cluster based on its assigned similarity weights. This mechanism enables information exchange among clustered points, effectively propagating shared features derived from the aggregation step. Consequently, the feature vector p i of each point in the cluster subset P m is updated as follows:
p i = p i + F C σ α s i + β × g
where s represents similarity, using the same process as above. We apply a fully connected (FC) layer to project the feature dimension from the value space dimension d to the original dimension d .

3.2.4. MaskFormer Decoder with Masked Attention

The MaskFormer decoder is illustrated in the right of Figure 3a. The mask classification framework groups pixels by predicting N binary masks and their corresponding category labels. Its versatility allows distinct semantics (e.g., instance or category) to be assigned to different segments. However, a critical challenge of this framework lies in effectively representing individual segments. While traditional methods like Mask R-CNN depend on bounding box representations—limiting their applicability to semantic segmentation—it follows DETR (Carion et al., 2020) [49] in representing each segment as a C-dimensional feature vector (“object query”). These queries are processed via a Transformer decoder using set prediction objectives. This meta-architecture consists of three modules: (1) a backbone network extracting low-resolution features from images; (2) a pixel decoder that gradually upsamples backbone outputs to produce high-resolution per-pixel embeddings; and (3) a Transformer decoder that operates on image features to refine object queries. Mask2Former implements this meta-architecture with three enhancements: First, it substitutes the standard Transformer decoder with a masked attention decoder, which confines cross-attention to the predicted foreground mask region of each query, thereby extracting local features instead of global contexts. Second, an efficient multi-scale strategy cyclically feeds consecutive feature maps from the pixel decoder’s pyramid to successive Transformer decoder layers, enabling high-resolution RGB image processing. Third, architectural optimizations boost performance without additional computational overhead.
Masked Attention Mechanism: Contextual features are essential for image segmentation (Chen et al., 2018) [50], yet global context in cross-attention layers causes slow convergence in Transformer-based models (Gao et al., 2021; Sun et al., 2021) [51,52]. Specifically, cross-attention requires prolonged training to localize target regions (Sun et al., 2021) [52]. We posit that local features are sufficient for query updates, with contextual information aggregated via self-attention. Thus, we adopted masked attention—a cross-attention variant that exclusively attends to features within each query’s predicted mask foreground region.
The standard cross-attention (with residual path) is formulated as follows:
X l = s o f t m a x Q l K l T V l + X l 1
where l denotes the layer index, X l R N × C represents the N query features of dimension C at layer l, and Q l = f Q X l 1 R N × C . X 0 signifies the input query features to the Transformer decoder. K l , V l R H l W l × C denote the linearly transformed image features under f K · and f V · , respectively, with H l × W l being the spatial resolution of the features. Here, f Q , f K , and f V are linear transformation functions.
The attention mask modulates the attention matrix according to the following:
X l = s o f t m a x M l 1 + Q l K l T V l + X l 1
The value of the attention mask M l 1 at spatial coordinate (x, y) is defined as follows:
M l 1 x , y = f x = 0     i f M l 1 x , y = 1     o t h e r w i s e
Here, M l 1 0,1 N × H l W l denotes the binarized output (via thresholding at 0.5) of the mask prediction from the preceding Transformer decoder layer, spatially resampled to align with the resolution of K l . The initial mask M 0 corresponds to the binary mask prediction derived from the initial queries X 0 prior to their input into the Transformer decoder.
High-Resolution Features: While high-resolution features enhance model performance, they incur substantial computational costs. To mitigate this, we employ an efficient multi-stage strategy that incorporates high-resolution features while constraining computational overhead. Rather than consistently utilizing high-resolution feature maps, we leverage a feature pyramid encompassing both low-resolution and high-resolution features. Multi-scale features corresponding to a single resolution are sequentially processed within individual Transformer decoder layers.
Specifically, we utilize the feature pyramid generated by the pixel decoder, with resolutions corresponding to 1/32, 1/16, and 1/8 of the original image dimensions. For each resolution level, sine positional embeddings e p o s R H l W l × C (Carion et al., 2020) [49] and learnable scale-level embeddings e l v l R 1 × C (Zhu et al., 2020) [53] are incorporated. These embeddings are provided to their corresponding Transformer decoder layer. This three-layer decoder structure is replicated L times, resulting in a final Transformer decoder comprising 3L layers. Crucially, the first three layers process feature maps of progressively higher resolution (( H 1 = H / 32 , W 1 = W / 32 ); ( H 2 = H / 16 , W 2 = W / 16 ); ( H 3 = H / 8 , W 3 = W / 8 ) denote the original image height and width). This processing pattern cyclically repeats throughout all subsequent layers.
Framework Optimization: The standard Transformer decoder layer (Vaswani et al., 2017) [54] comprises three modules operating sequentially on the query features: a self-attention module, a cross-attention module, and a feed-forward network (FFN). Query features ( X 0 ) are initialized to zero vectors and augmented with learnable positional embeddings prior to input into the decoder. Additionally, dropout is applied to residual connections and attention maps. MaskFormer introduces several optimizations to this decoder design:
Attention Order: The sequence of self-attention and masked attention modules is reversed to improve computational efficiency. As the query features input to the initial self-attention module lack prior image conditioning (carrying no image-derived signal), applying self-attention at this stage yields limited informational gain.
Learnable Query Initialization: Beyond learnable positional embeddings, the initial query features ( X 0 ) themselves are made learnable parameters. These features are directly supervised (generating an initial mask prediction M 0 ) before being further processed by the Transformer decoder for final mask prediction. We observe that these learnable queries functionally resemble region proposal networks (Ren et al., 2015) [55], exhibiting the capability to generate mask proposals.
Dropout Removal: We empirically find dropout unnecessary, as it generally degrades performance. Consequently, dropout is entirely omitted from our decoder architecture.

3.2.5. Loss Function

The original mask loss function in Mask2Former (combining binary cross-entropy and Dice loss) operates on both target and background pixels simultaneously and necessitates fully annotated training samples. We refer to our region-constrained variant as the partial-supervision (mask) loss for consistency with the abstract. However, the canopy contour extraction task presents unique challenges: overstory and midstory canopies exhibit low visual distinguishability in RGB imagery, leading to the acquisition of only sparsely annotated samples. Directly applying the original loss function during training causes the model to assign high foreground probability solely to canopies resembling the annotated samples while disregarding others, significantly compromising the completeness of the extracted contours. This occurs because training objectives enforce suppression of probabilities in background regions. Crucially, the background regions often contain unlabeled canopies that are visually highly similar to the annotated ones. This similarity leads to misassignment during suppression, paradoxically decreasing the model’s predicted probability for the annotated canopies. To overcome this limitation, we reformulate the following mask loss function:
M a n n = I p > 0
where I · is the indicator function, taking a value of one when p > 0 and zero otherwise, representing the generation of a binary mask that fully corresponds to the annotated region (one for annotation, zero for background).
The modified cross-entropy loss is given by Equation (12):
L c e m o d = 1 S i M a n n i y i l o g p i 1 y i l o g 1 p i
where i denotes the i -th pixel in the image, S is the total number of pixels within the annotated region (equivalent to M a n n i ), serving as a normalization factor to mitigate the impact of varying annotation densities. M a n n i is the binary mask value (0 or 1) for the i -th pixel. The term y i l o g p i penalizes low predicted probability p i for canopy pixels ( y i = 1 ), while 1 y i l o g 1 p i penalizes high predicted probability for background pixels ( y i = 0 ), and this background penalty term is applied only within the annotated region.
The modified Dice loss is defined in Equation (13):
L d i c e m o d = 1 2 i M a n n i p i y i + ϵ i M a n n i p i + i M a n n i y i + ϵ
Equation (13) quantifies the spatial overlap between the prediction and the ground truth within the annotated region. The numerator represents the sum of predicted probabilities p i within the annotated canopy area (approximating the intersection volume), while the first denominator term i M a n n i p i is the sum of all predicted probabilities within the annotated region. The second denominator term i M a n n i y i is the sum of ground-truth positives within the annotated region (equivalent to S ). A small constant ϵ (e.g., 10−8) is added to prevent division by zero.
The new mask loss function is defined as follows:
L m a s k m o d = λ c e L c e m o d + λ d i c e L d i c e m o d
where λ c e = 5.0 and λ d i c e = 5.0 are weighting coefficients balancing the contributions of the cross-entropy and Dice losses, respectively.
The overall loss function is subsequently formulated as follows:
L c l s = L m a s k m o d + λ c l s L c l s
where L c l s denotes the classification loss (e.g., cross-entropy). The classification weight λ c l s is set to 2.0 for foreground predictions (matched objects) and 0.1 for background predictions.
The region-constrained loss computation is delimited by the binary annotation mask, restricting both the binary cross-entropy and Dice losses exclusively to the annotated canopy regions ( p > 0 ). This approach completely eliminates contributions from background pixels ( p = 0 ). During training, this constraint focuses optimization on the annotated regions, enabling predicted probabilities to directly indicate structural similarity to the training canopies. Consequently, most tree crowns achieve high confidence scores, significantly improving contour extraction coverage and consistency.

4. Experiments

4.1. Implementation Details

To verify the performance of CrownViM, we conducted necessary comparative experiments and ablation studies. The specific hardware and software environment information are provided in Table 1:
Data split: For OAM-TCD, we used a train/validation/test ratio of approximately 70%/15%/15% by image count (exact counts and random seed are reported in the released code). For SSD, the same ratio is applied with 731 images in total. Pre-processing: RGB values are normalized to zero mean and unit variance using the ImageNet statistics; images are center-cropped or resized to 640 × 640 for training and inference. Data augmentation: random horizontal and vertical flips (probability 0.5 each), random rotation (±15°), and color jitter (brightness, contrast, saturation each with factor 0.2, probability 0.5) are applied during training. No test-time augmentation is used.
We implemented CrownVim using the MMDetection codebase (Chen et al., 2019) [56] in PyTorch v1.8.0. To ensure fair comparisons with all methods, identical input size (640 × 640 for RGB images), pre-processing strategies, and training losses were applied to both datasets without additional pre-training data. Following MaskFormer (Cheng et al., 2021) [47], FPN (Lin et al., 2017) [57] serves as the default backbone due to its simplicity. To achieve robust performance across segmentation tasks, we adopt the advanced multi-scale deformable attention Transformer (MSDeformAttn) (Zhu et al., 2020) [53] as the default pixel decoder. The Transformer decoder comprises nine layers with 300 queries by default. Optimization uses Adam with a learning rate of 1 3 (exponentially decayed), momentum of 0.9, and weight decay of 1 4 . Models were trained for 300 epochs with batch sizes of four for single-tree segmentation data and two for the OAM-TCD dataset, adjusted for image resolution differences. During post-processing, binary mask pairs and category predictions are converted into standard formats for panoptic and semantic segmentation. For instance segmentation, each predicted instance is assigned a composite confidence score defined as the product of class confidence and mask quality score—the latter being the average foreground pixel probability—enabling end-to-end instance confidence evaluation.

4.2. Configuration of Scan Directions and Local Clusters

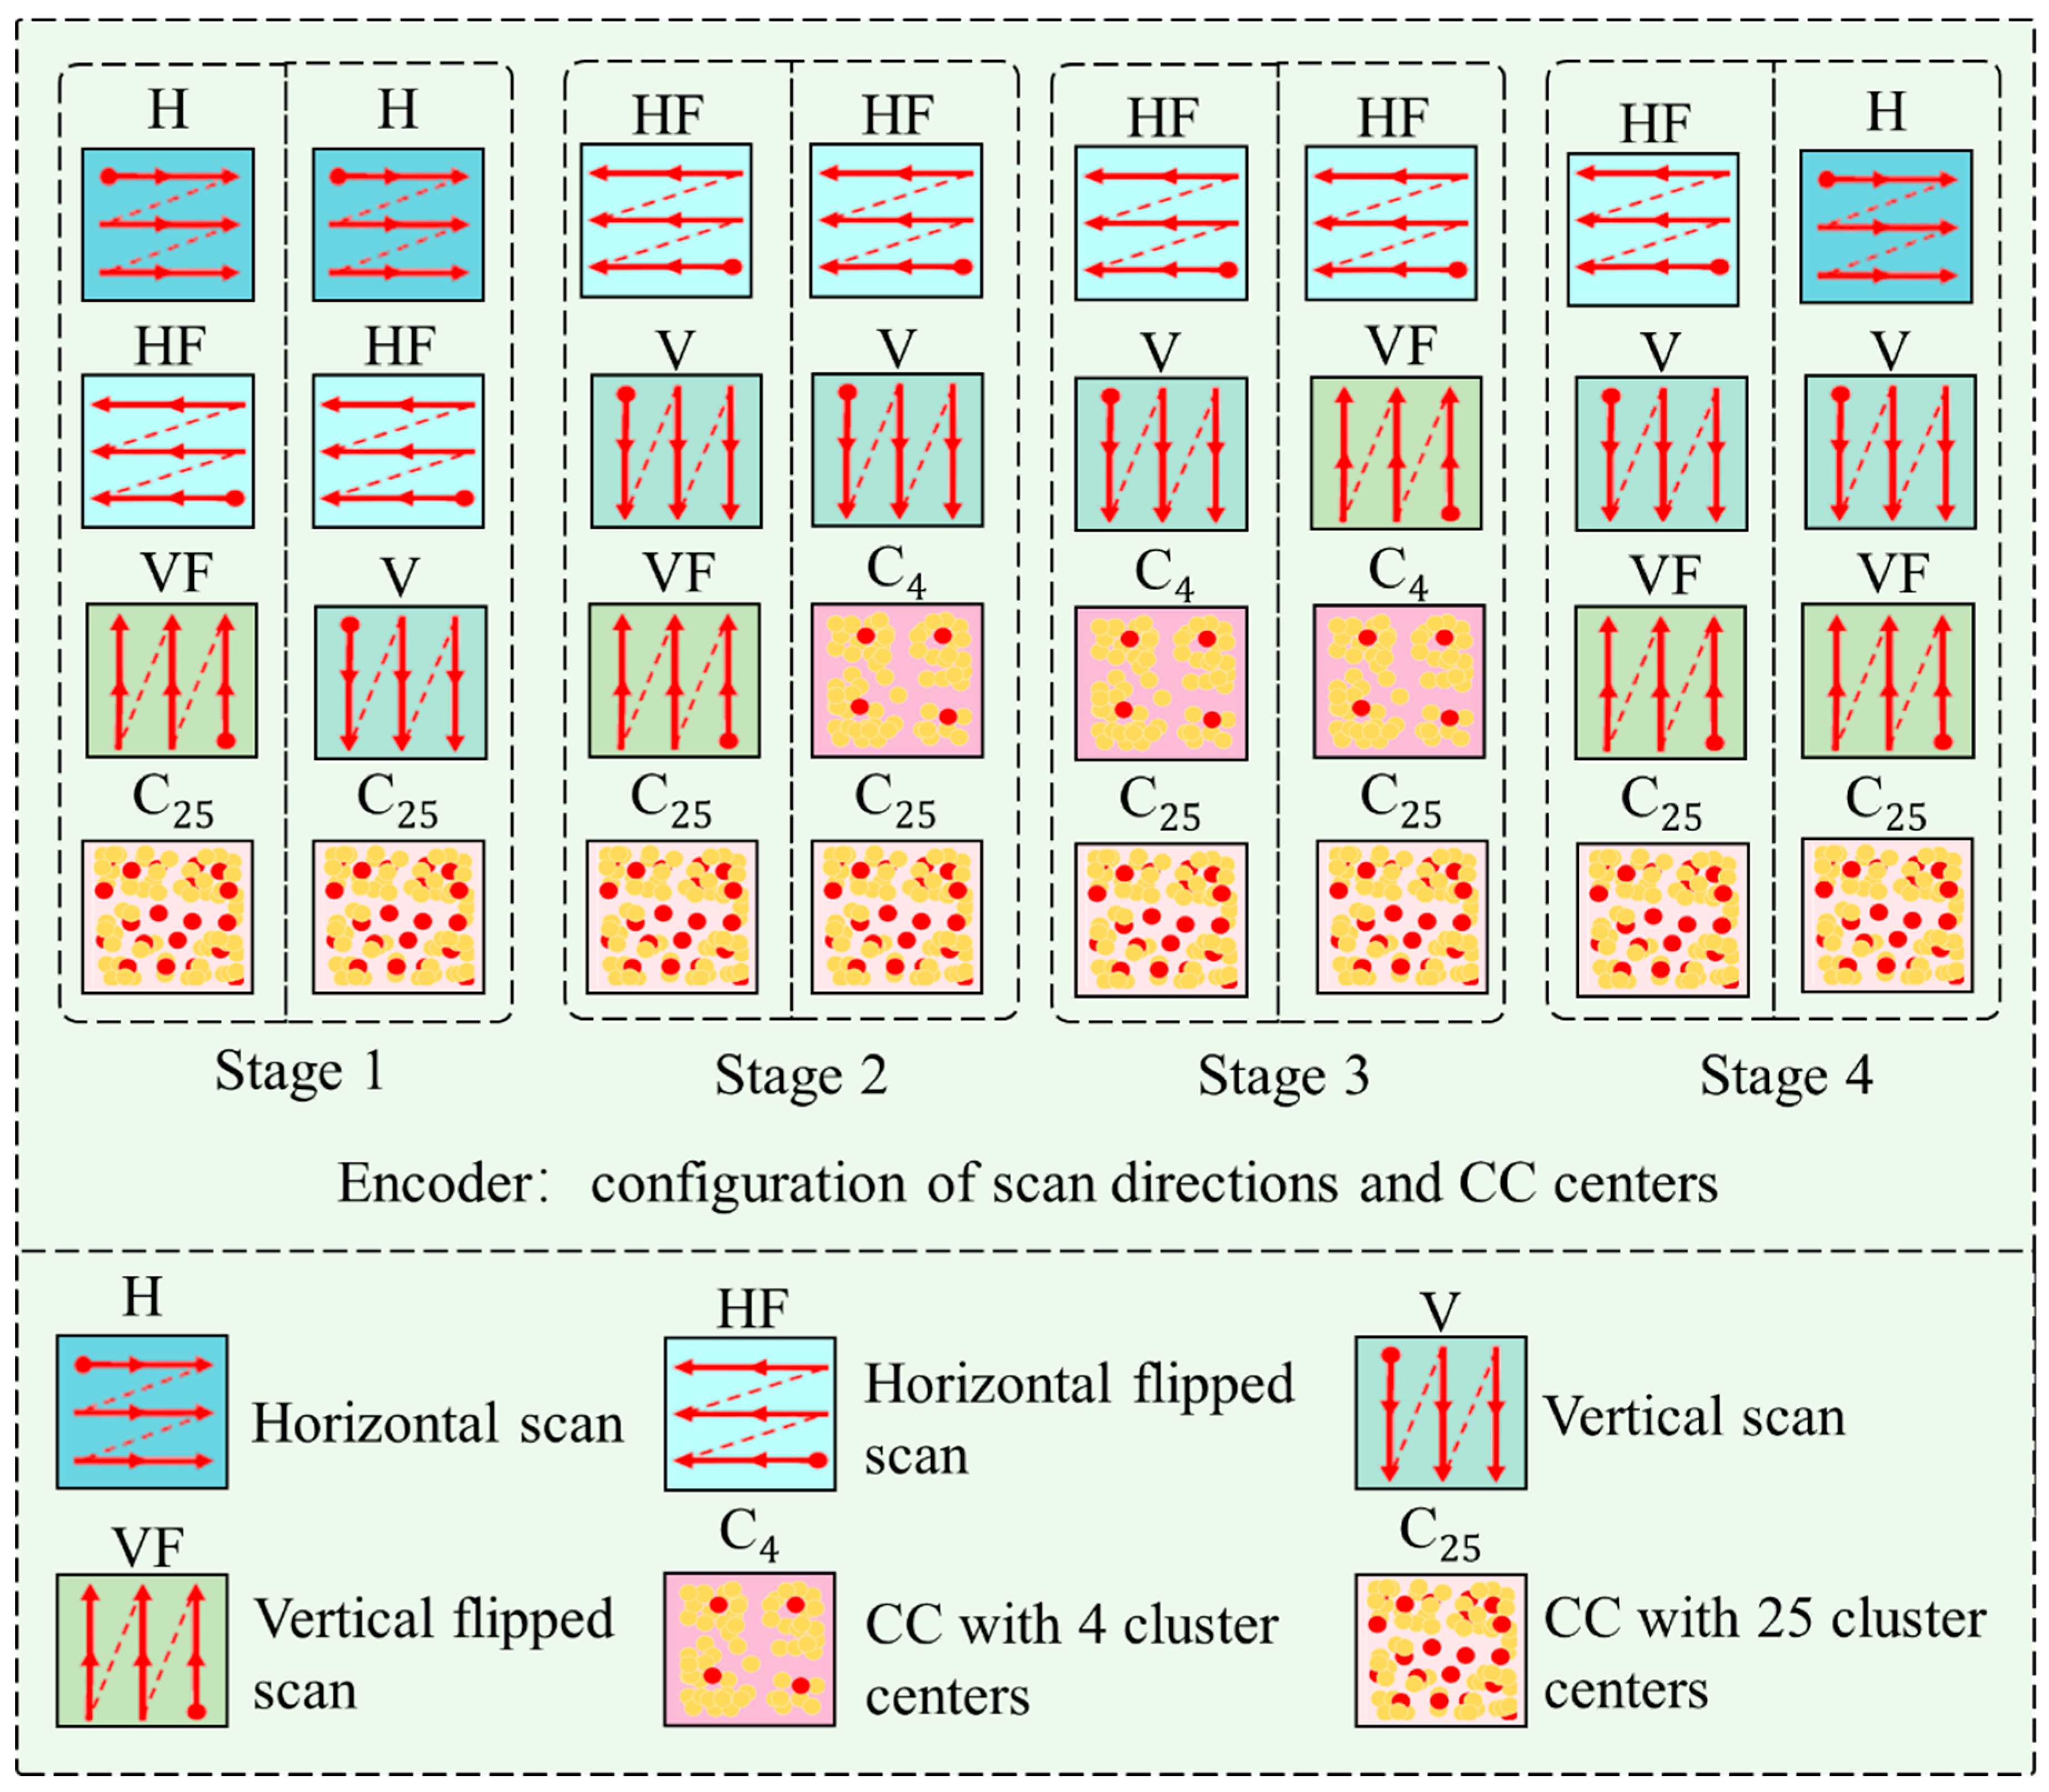
In this work, we redesign the CCS6 layer structure by replacing VMamba’s (Zhu et al., 2024) [58] redundant scanning strategy with one to three distinct scanning directions per layer. As show in Figure 4, to enable adaptive local feature extraction and effective spatial context capture, each CCS6 layer integrates context clustering (CC) layers, forming a four-module structure comprising one to three scanning direction modules and one to two CC layer modules. This design eliminates additional computational overhead compared to prior models. Four scanning directions are implemented: horizontal, horizontally flipped, vertical, and vertically flipped. To accommodate varying object sizes and densities in images, two CC layer variants are adopted: one with four cluster centers per local region and another with 25 cluster centers. Our implementation builds upon the Local Mamba (Huang et al., 2024) [20] framework, substituting its fixed local scanning with CC layers. This substitution enables dynamic clustering of local features and adaptive spatial information capture, significantly improving feature extraction flexibility and efficacy.

4.3. Evaluation Index

For comprehensive evaluation of tree crown delineation results, we adopt established metrics from prior literature. The primary metric is Delineation Accuracy. Given N reference crowns with N correctly delineated crowns, accuracy is defined as follows:
D e l i n e a t i o n   A c c u r a c y = n N
Major error sources include over-segmented, under-segmented, and missing crowns. As not all crowns are designated as references, the quantification of undetected crowns is infeasible. Instead, we report counts of over-segmented crowns and missing crowns to identify delineation inaccuracies, adhering to the definitions by Jing et al. (2012) [26]: (1) Over-segmented crown: A reference crown is over-segmented if >50% of its area is overlapped by multiple predicted crowns. (2) Missing crown: A reference crown is missing if >50% of its area lacks overlap with any predicted crown. Furthermore, the spatial correspondence between predicted and reference crowns requires quantification.
The proposed framework was rigorously evaluated using four principal metrics: Dice, Precision, and Recall. These metrics were computed based on the fundamental confusion matrix elements. Let Ω denote the entire image domain as follows:
T P : { x Ω | y ( x ) = 1 ŷ ( x ) = 1 }       T N : { x Ω | y ( x ) = 0 ŷ ( x ) = 0 } F P : { x Ω | y ( x ) = 0 ŷ ( x ) = 1 }       F N : { x Ω | y ( x ) = 1 ŷ ( x ) = 0 }
where True Positives (TP) refer to canopy regions correctly identified as such. True Negatives (TN) denote non-canopy regions accurately classified. False Positives (FP) represent non-canopy areas misclassified as canopy, while False Negatives (FN) indicate canopy regions missed by the model.
Precision measures the proportion of correctly predicted crown areas (TP) among all the predicted diseased regions (TP + FP). The expression is as follows:
P r e c i s i o n = T P T P + F P
Recall indicates the proportion of correctly predicted crown regions (TP) among all actual crown regions (TP + FN). It reflects the model’s ability to identify positive samples correctly. The expression is represented by the following equation:
R e c a l l = T P T P + F N
Dice Similarity Coefficient (DSC) is used to compare the overlap between segmentation predictions and real labels and is commonly used to measure the performance of a model in an image segmentation task. The expression is illustrated in Equation (20).
D S C P , T = 2 P T P + T
where P and T denote the segmented region predicted by the network and the real segmented region, respectively.

4.4. State-of-the-Art Comparison

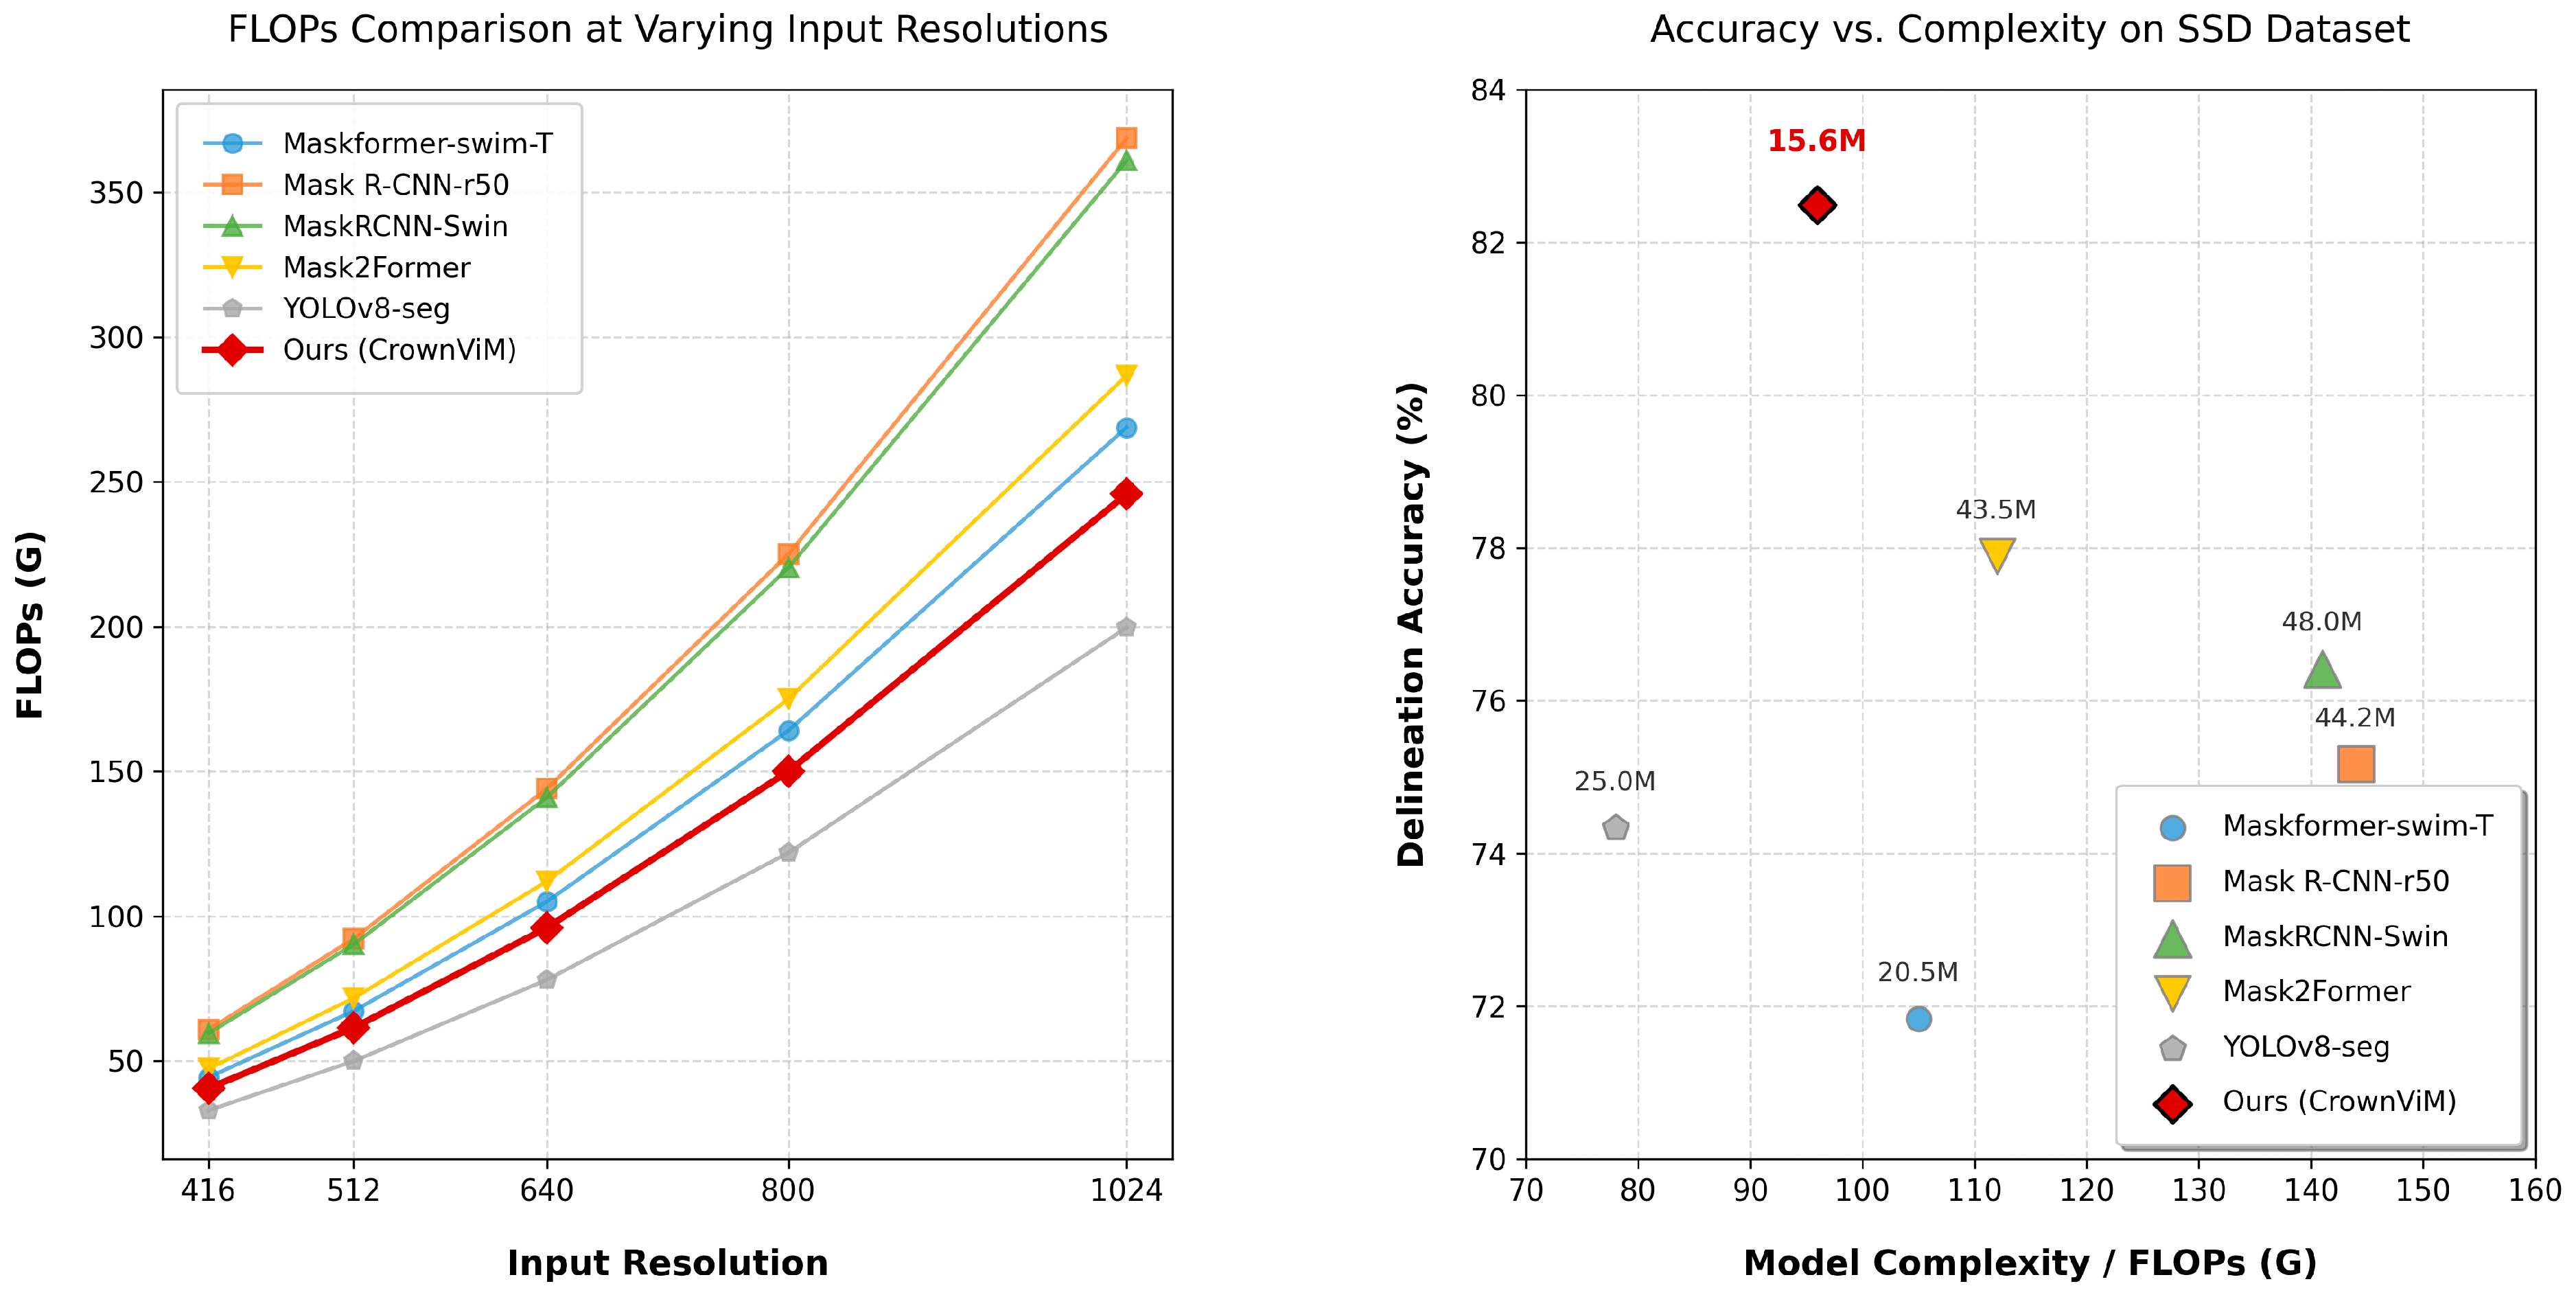
To systematically evaluate the proposed model, we conduct comparative experiments on the OAM-TCD and single-tree segmentation datasets. Benchmark results against state-of-the-art models are summarized in Table 2. The same three methods (MaskFormer-Swin-T, Mask R-CNN-R50, and CrownViM) are consistently compared in both Table 2 and Figure 5. The sparse-annotation strategy in the single-tree segmentation dataset precludes precise calculation of segmentation accuracy, recall, and Dice coefficient; thus, qualitative evaluation via crown contour visualization is applied. For OAM-TCD, quantitative metrics—including Precision, Recall, and Dice coefficient—evaluate crown segmentation performance in high-resolution aerial imagery. Reported results reflect single-model accuracy without ensembles or auxiliary data. Experiments indicate the following: SwinTransformer (Cao et al., 2022) [59] achieves linear computational complexity via hierarchical shifting windows but yields subpar crown segmentation. Mask R-CNN’s strong instance segmentation capability yields competitive accuracy, but its 144G FLOPs incur prohibitive deployment costs.
Our CrownViM model integrates a Contextual Clustering module as an image encoder within the Vision Mamba (Guo et al., 2024) [17] framework, coupled with a MaskFormer decoder. This design achieves state-of-the-art segmentation accuracy for diverse crown types with only 96G FLOPs.
Quantitatively, the efficiency advantage of SSM-based long-range modeling is evident: CrownViM (96G FLOPs) outperforms the ViT-based MaskFormer-Swin (105G FLOPs) in delineation accuracy (81.85% vs. 73.67% on OAM-TCD; 82.49% vs. 71.83% on SSD) while using fewer computations, and substantially reduces FLOPs compared with the CNN-based Mask R-CNN (144G FLOPs). This provides direct quantitative support that SSMs offer more efficient long-range dependency modeling than ViTs and CNNs in dense overlapping crown scenarios, without sacrificing—and in fact improving—segmentation accuracy.
Furthermore, Figure 5 shows CrownViM’s superiority in both segmentation accuracy and parameter efficiency (39.6 M parameters) over existing CNN and ViT architectures.
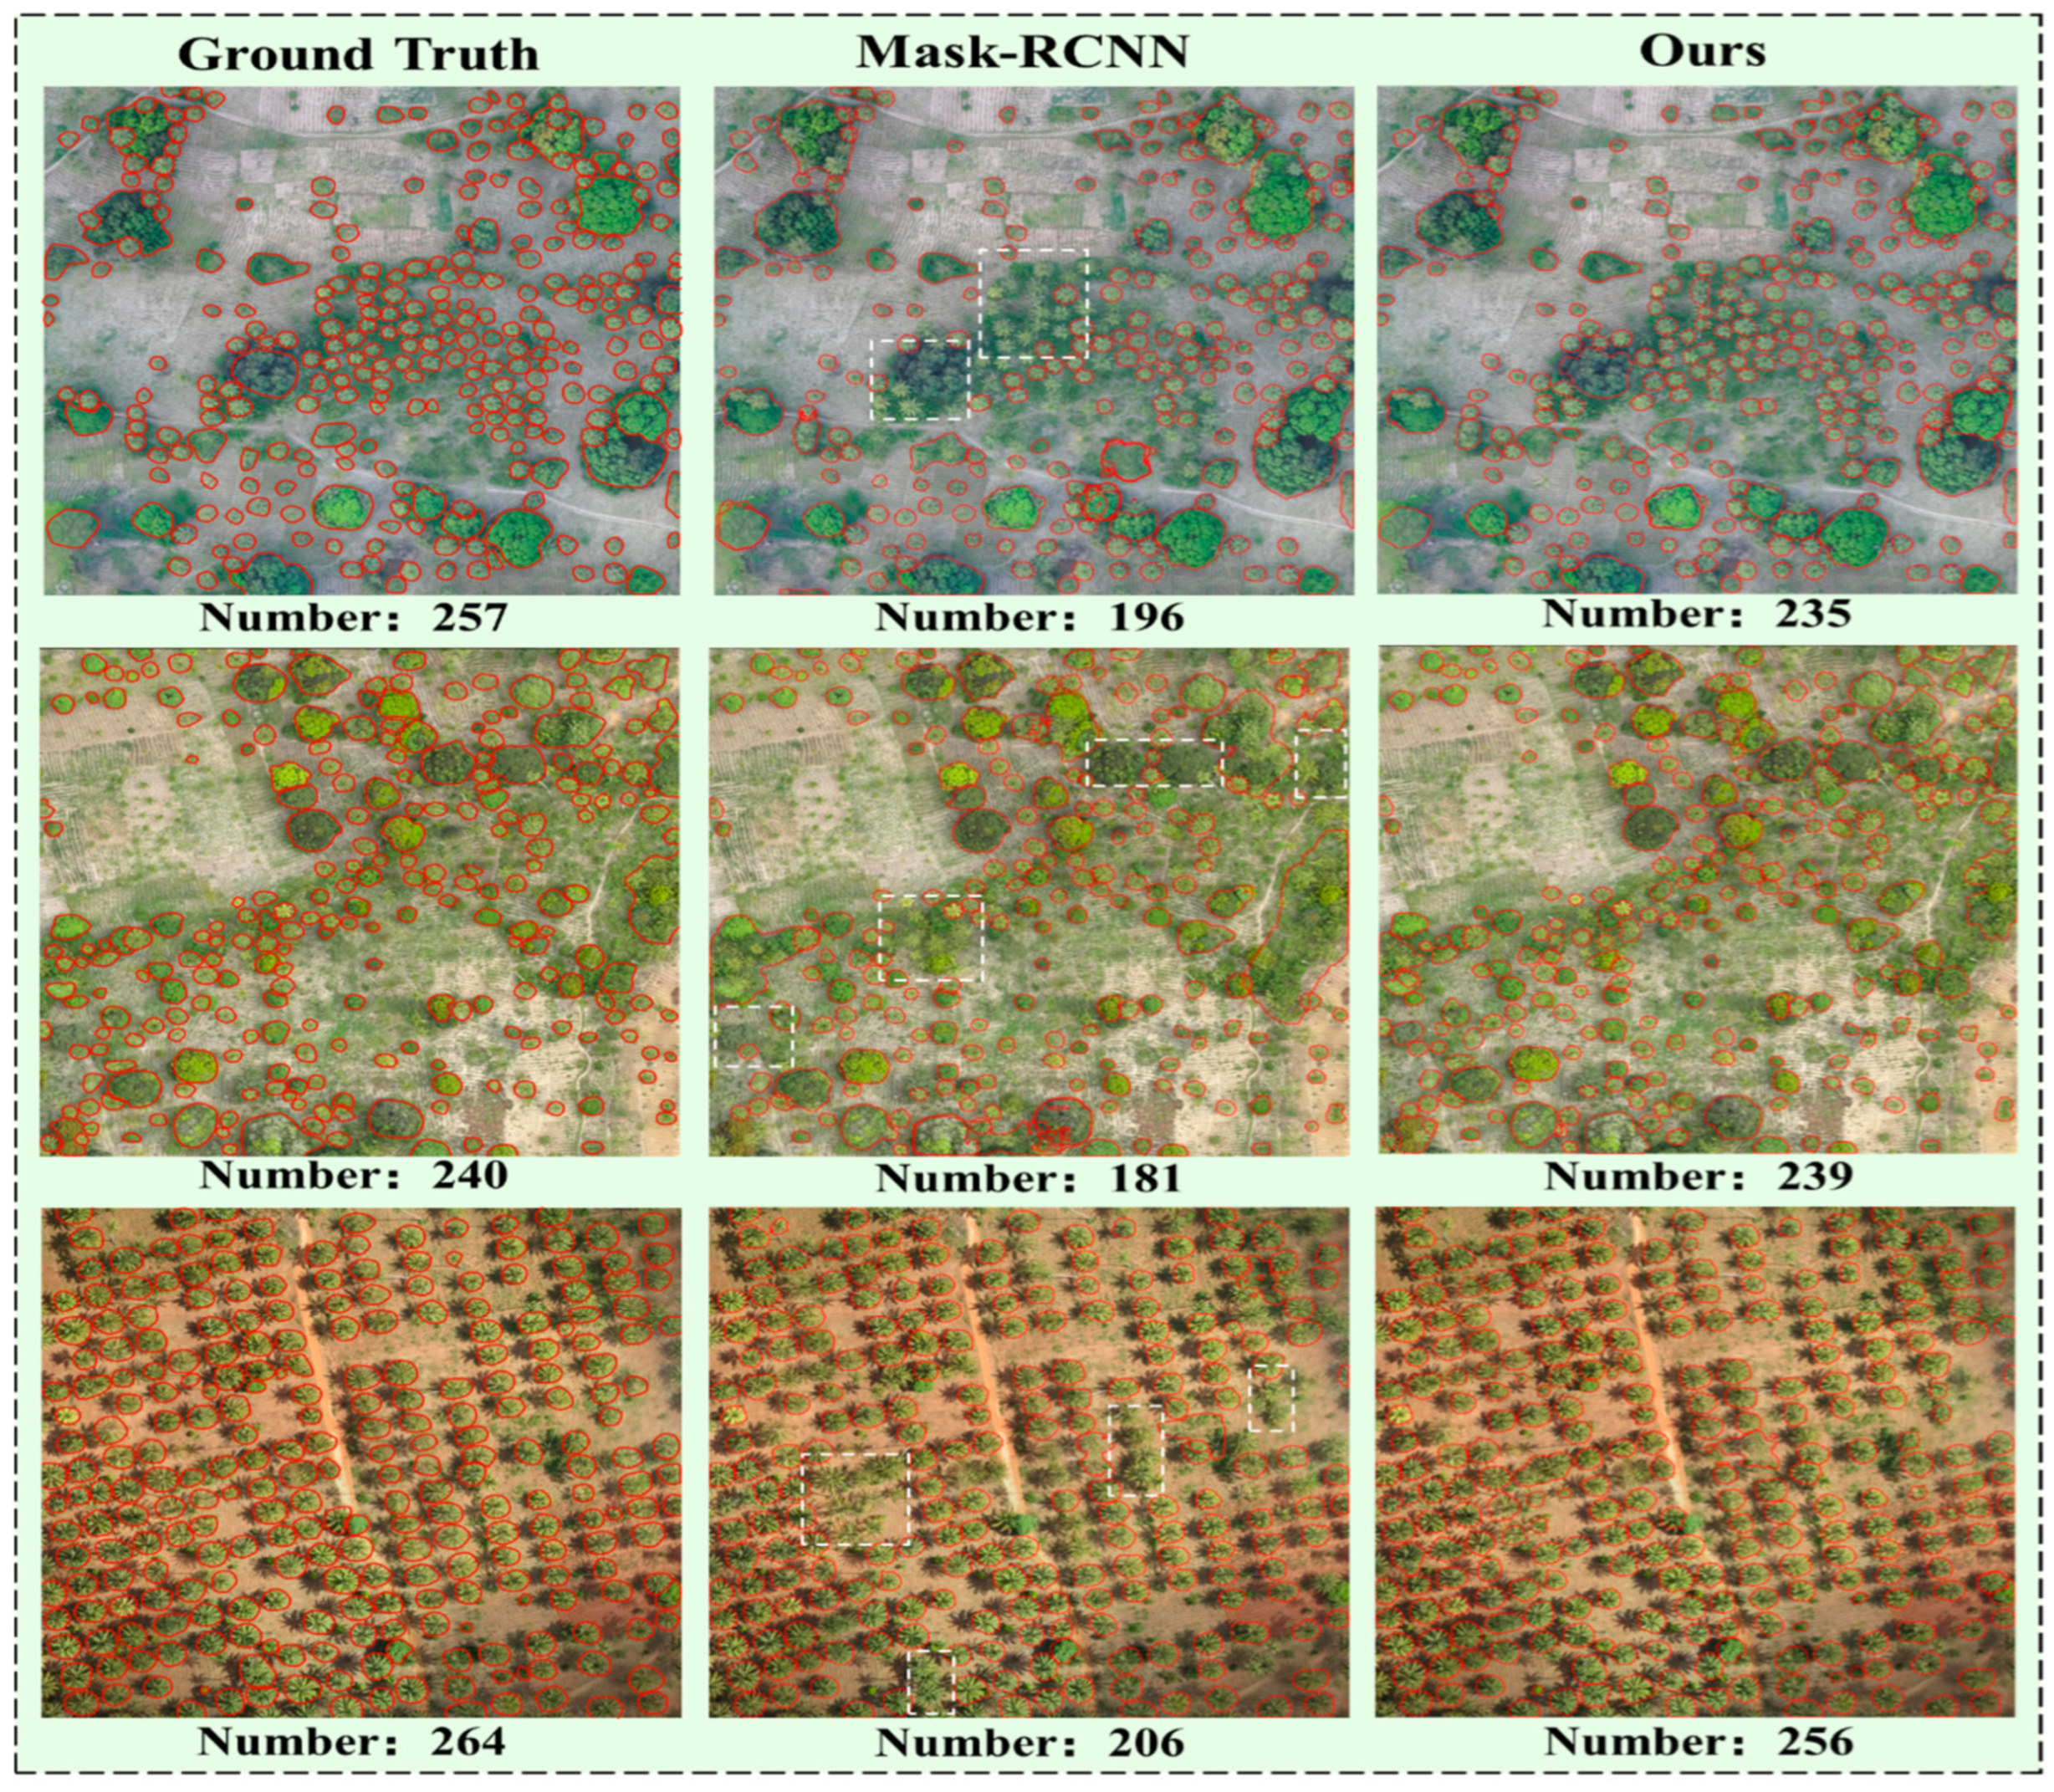
OAM-TCD Dataset: Figure 6 illustrates a qualitative comparison between CrownVim and Mask R-CNN on the OAM-TCD dataset. Three representative aerial images from natural environments are shown, depicting scenes with trees that are naturally scattered, are small in scale, and exhibit high density. Given these characteristics which pose a low risk of over-segmentation, the evaluation focuses on the models’ performance in achieving high recall for small targets and mitigating under-segmentation. For clear visual comparison, regions exhibiting under-segmentation in Mask R-CNN results are highlighted with white borders and contrasted with CrownVim’s segmentations.
The results reveal that Mask R-CNN, constrained by its predefined anchor sizes and lower sensitivity to small targets, exhibits severe under-segmentation. This leads to a significant deviation in the number of segmented canopies compared to the ground-truth count. In contrast, leveraging global–local collaborative modeling, CrownVim achieves accurate localization and precise delineation of minute canopies. Its segmentation results demonstrate strong consistency with manual annotations, highlighting robust performance in scenarios characterized by sparse, small targets.
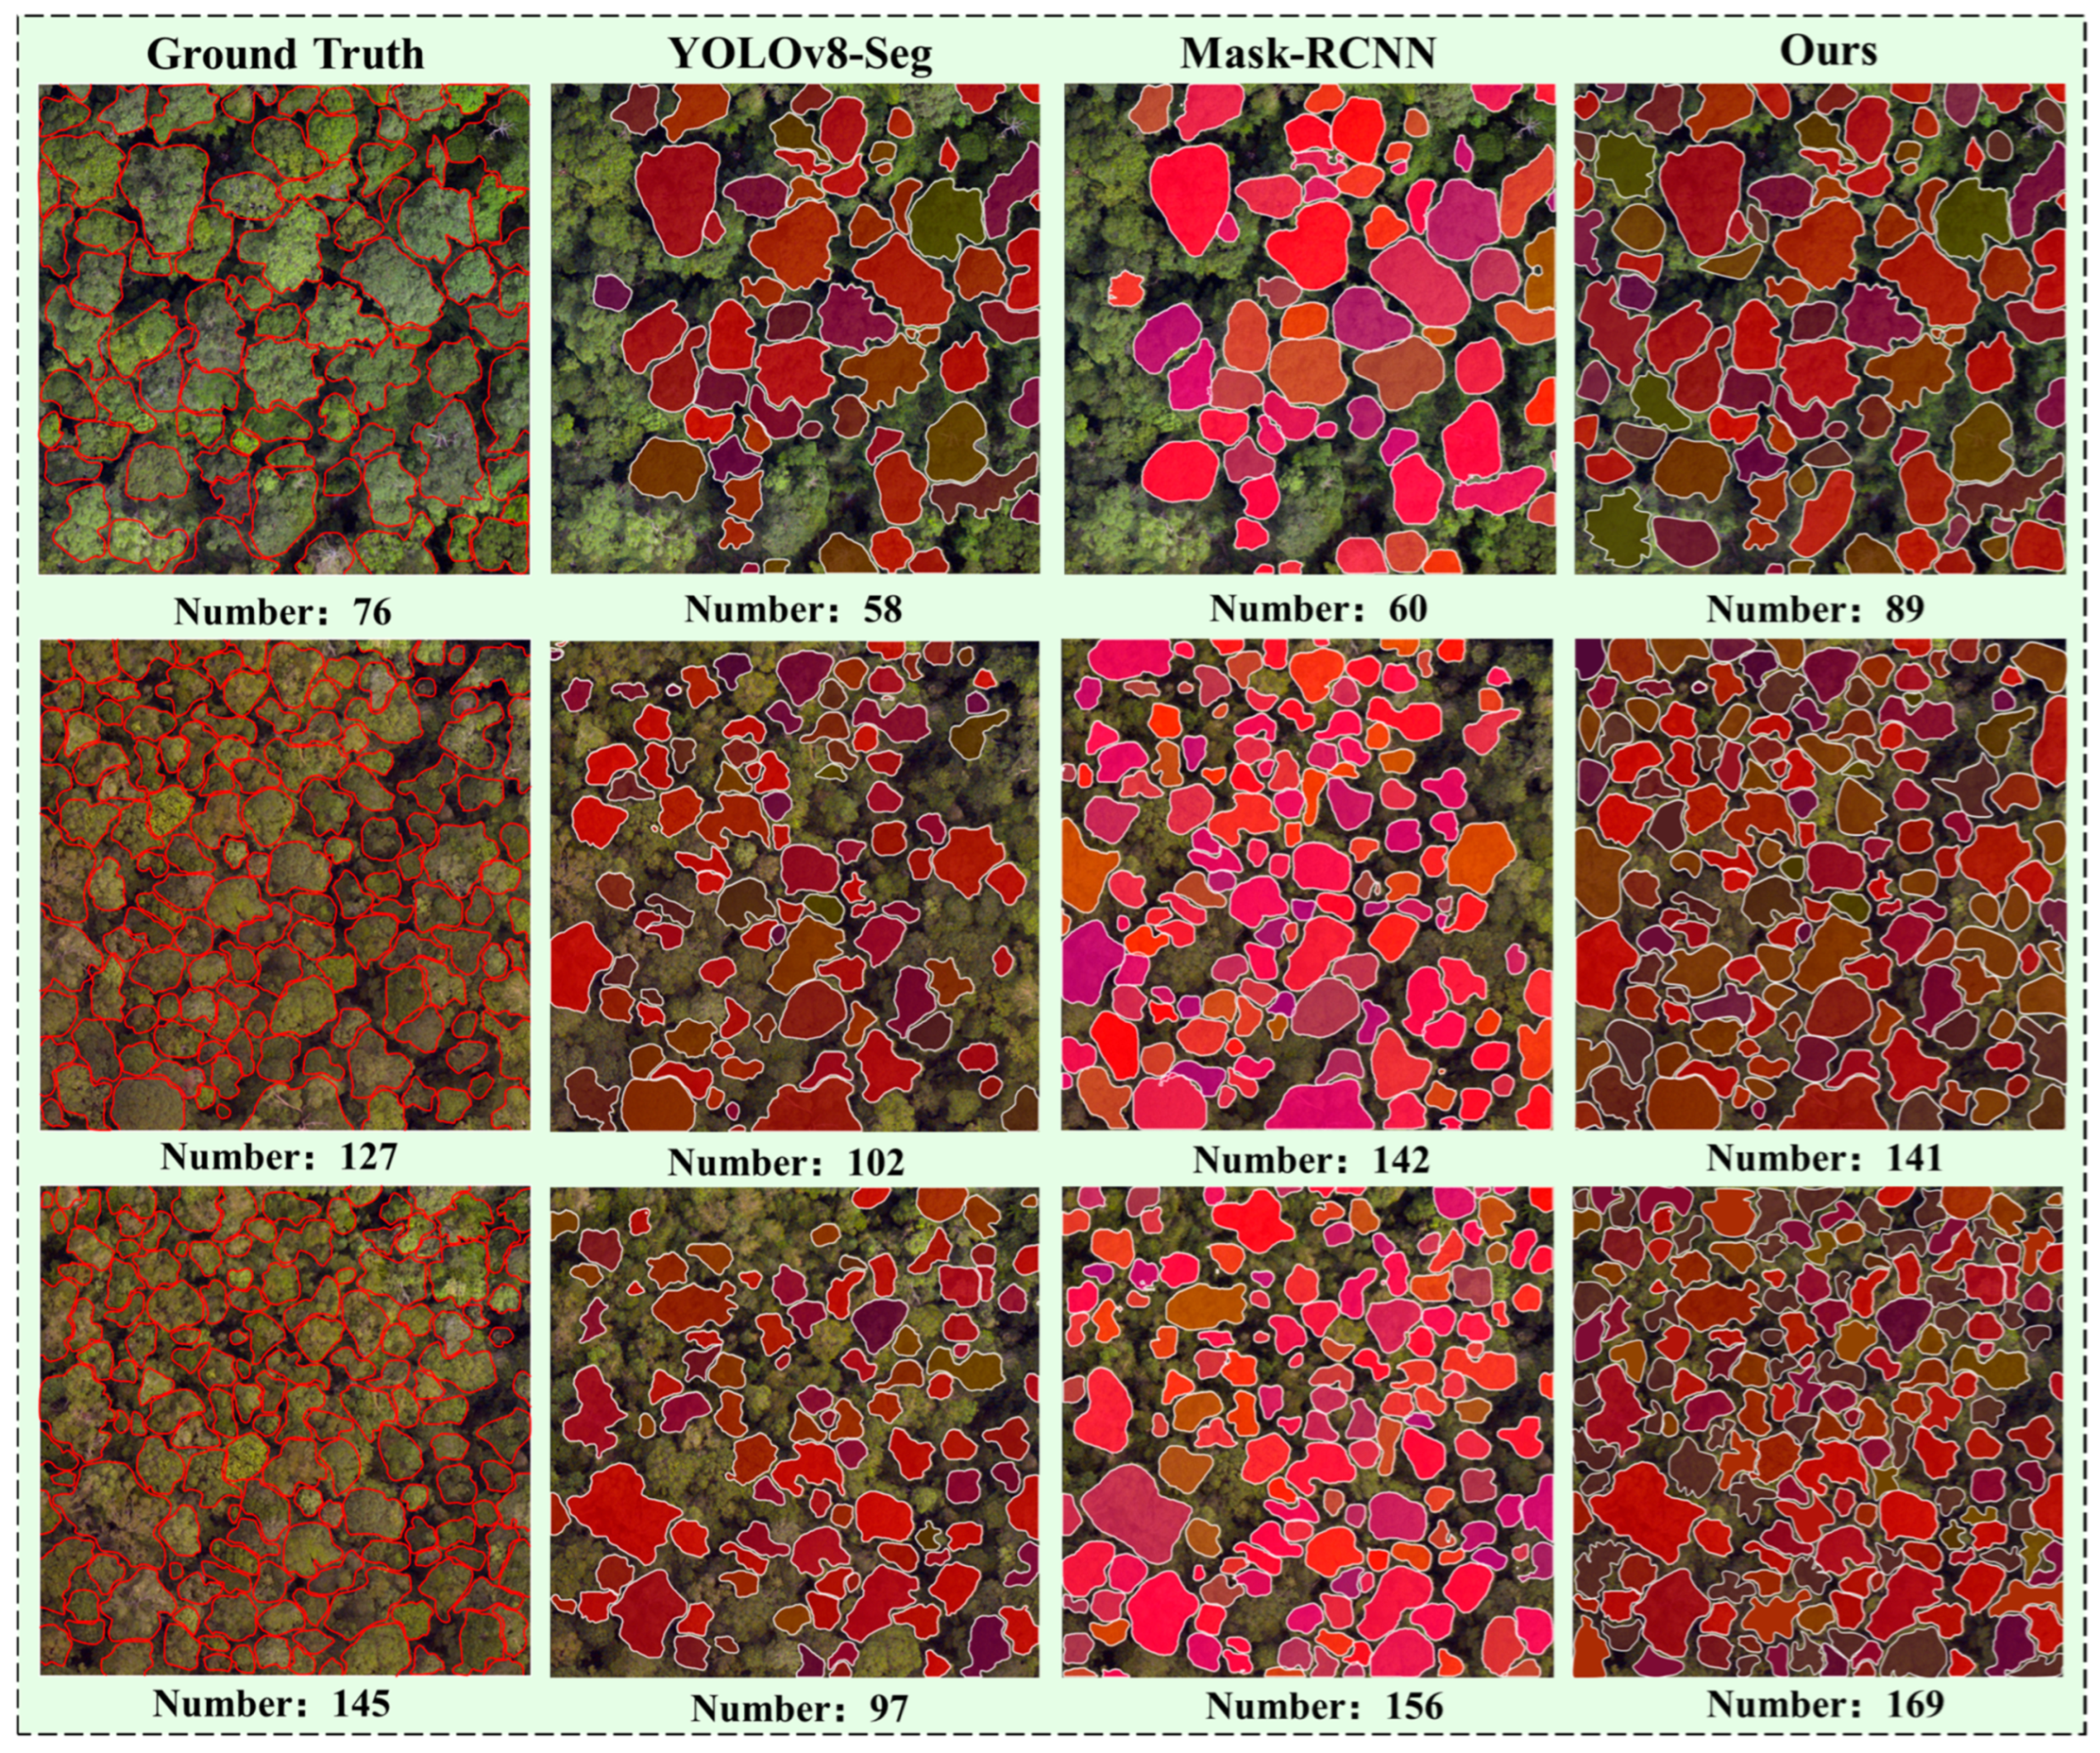
Single-tree Segmentation Dataset: As shown in Figure 7, we present a qualitative comparison between CrownViM and the state-of-the-art instance segmentation method Mask R-CNN on the SSD. Cases 1, 2, and 3 (top to bottom) correspond to forest scenes with low, medium, and high canopy densities, respectively. Existing methods struggle to accurately segment tree crowns in complex forest backgrounds. Mask R-CNN exhibits under-segmentation in low-density areas due to convolutional operations’ limited receptive fields, failing to capture global context and causing significant missed detections. In medium/high-density areas, reliance on axis-aligned bounding boxes and non-maximum suppression (NMS) thresholds leads to ambiguous box assignments in overlapping regions, resulting in repeated segmentation of single crowns and severe over-segmentation. In contrast, CrownViM achieves high consistency with manual annotations (Ground Truth). Its CCViM encoder and MaskFormer decoder efficiently model global context and refine boundary predictions to accurately capture individual crown features, delivering superior single-tree segmentation.

4.5. Ablation Experiment

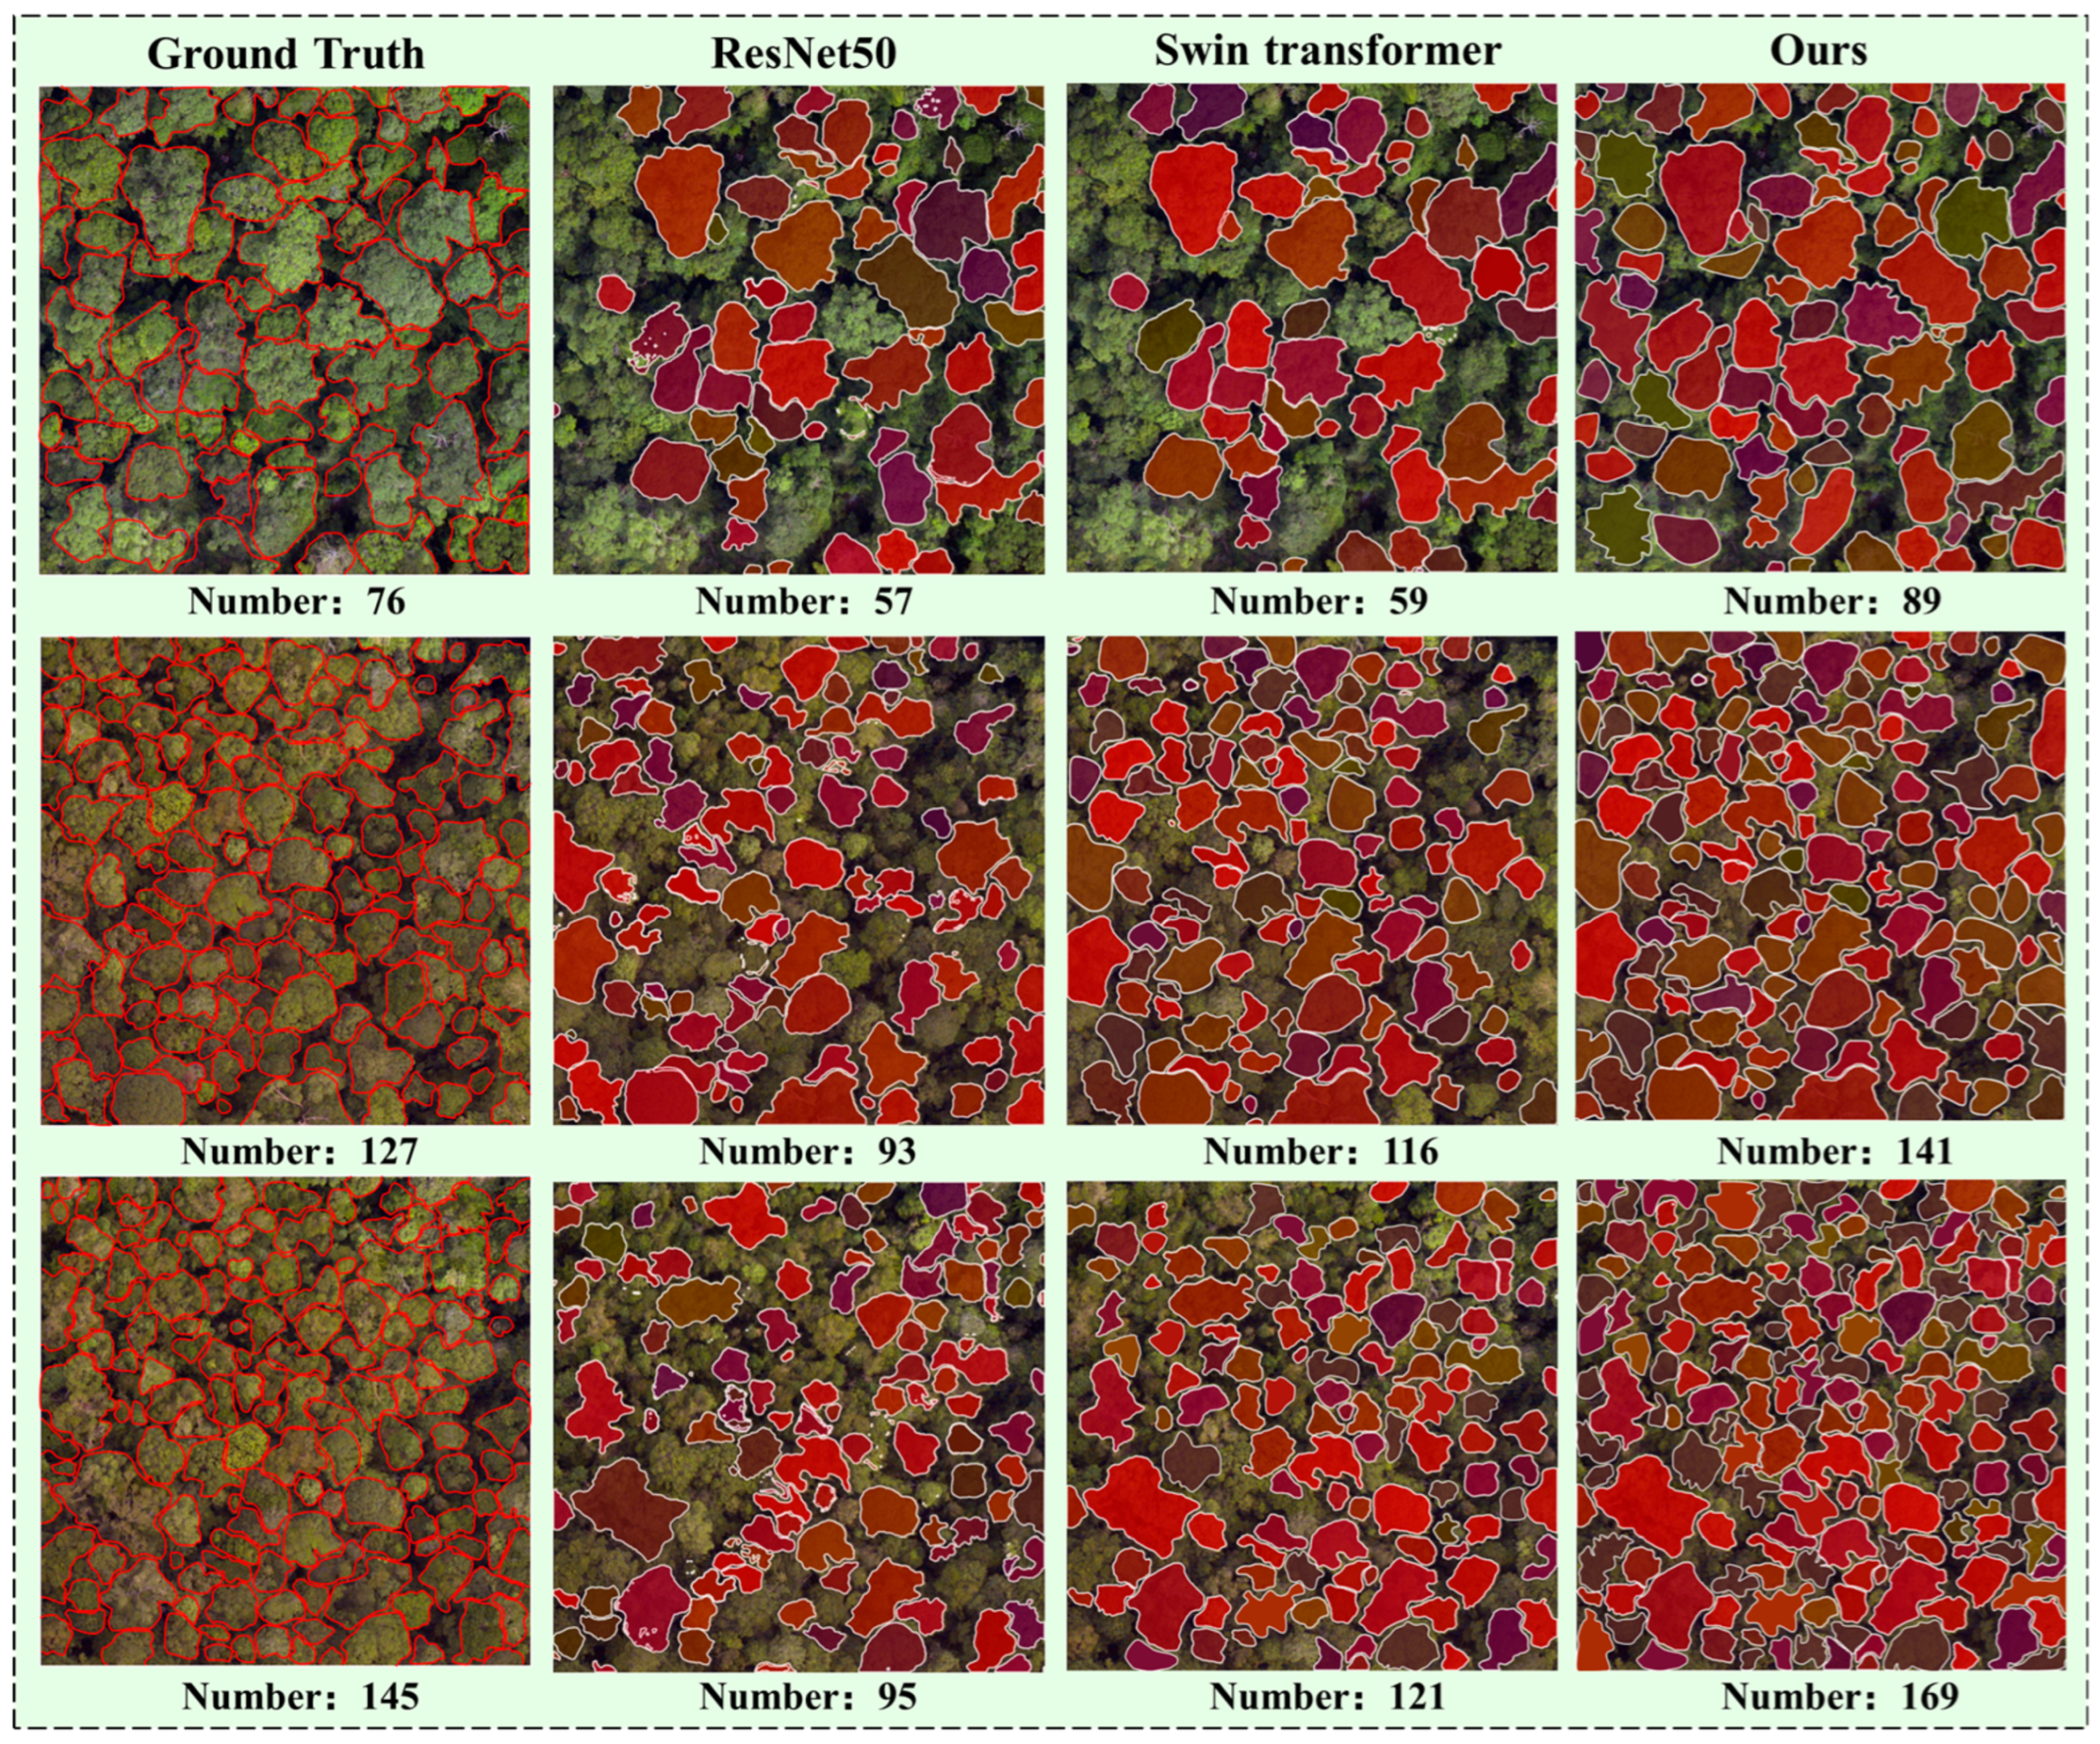
In this section, we evaluate the efficacy of the proposed CCViM encoder through ablation studies conducted on the SSD. To fairly compare the impact of different encoders on segmentation performance, the CCViM module within the CrownVim framework was replaced by the convolutional backbone ResNet50 (R50) and the hierarchical Swin Transformer, respectively, while maintaining identical surrounding architectures and training protocols.
To gain insights into the underlying causes of segmentation errors, we quantified over-segmentation and missed detection counts for tree canopies, as detailed in Table 3. CrownVim achieved the lowest error rates for both metrics: compared with R50, it resulted in 22 fewer over-segmentation cases and 73 fewer missed detections; compared with Swin Transformer, it led to 11 fewer over-segmentation cases and 38 fewer missed detections. These results demonstrate CCViM’s superior capability in delineating complex forest stand boundaries and improving recall.
Figure 8 presents segmentation results on the SSD using ResNet50, Swin Transformer, and CCViM encoders. The results demonstrate that our proposed CrownVim model significantly outperforms conventional methods in segmentation accuracy, with predicted tree canopy counts aligning most closely with ground-truth annotations. Conversely, both the CNN-based ResNet50 and transformer-based Swin Transformer exhibit lower segmentation accuracy and severe under-segmentation, yielding counts substantially below ground-truth values. By integrating CCViM’s global–local interactive selection mechanism and efficient global modeling capability, CrownVim achieves precise individual crown segmentation even under high-canopy-closure conditions. This approach clearly demonstrates robust performance advantages.
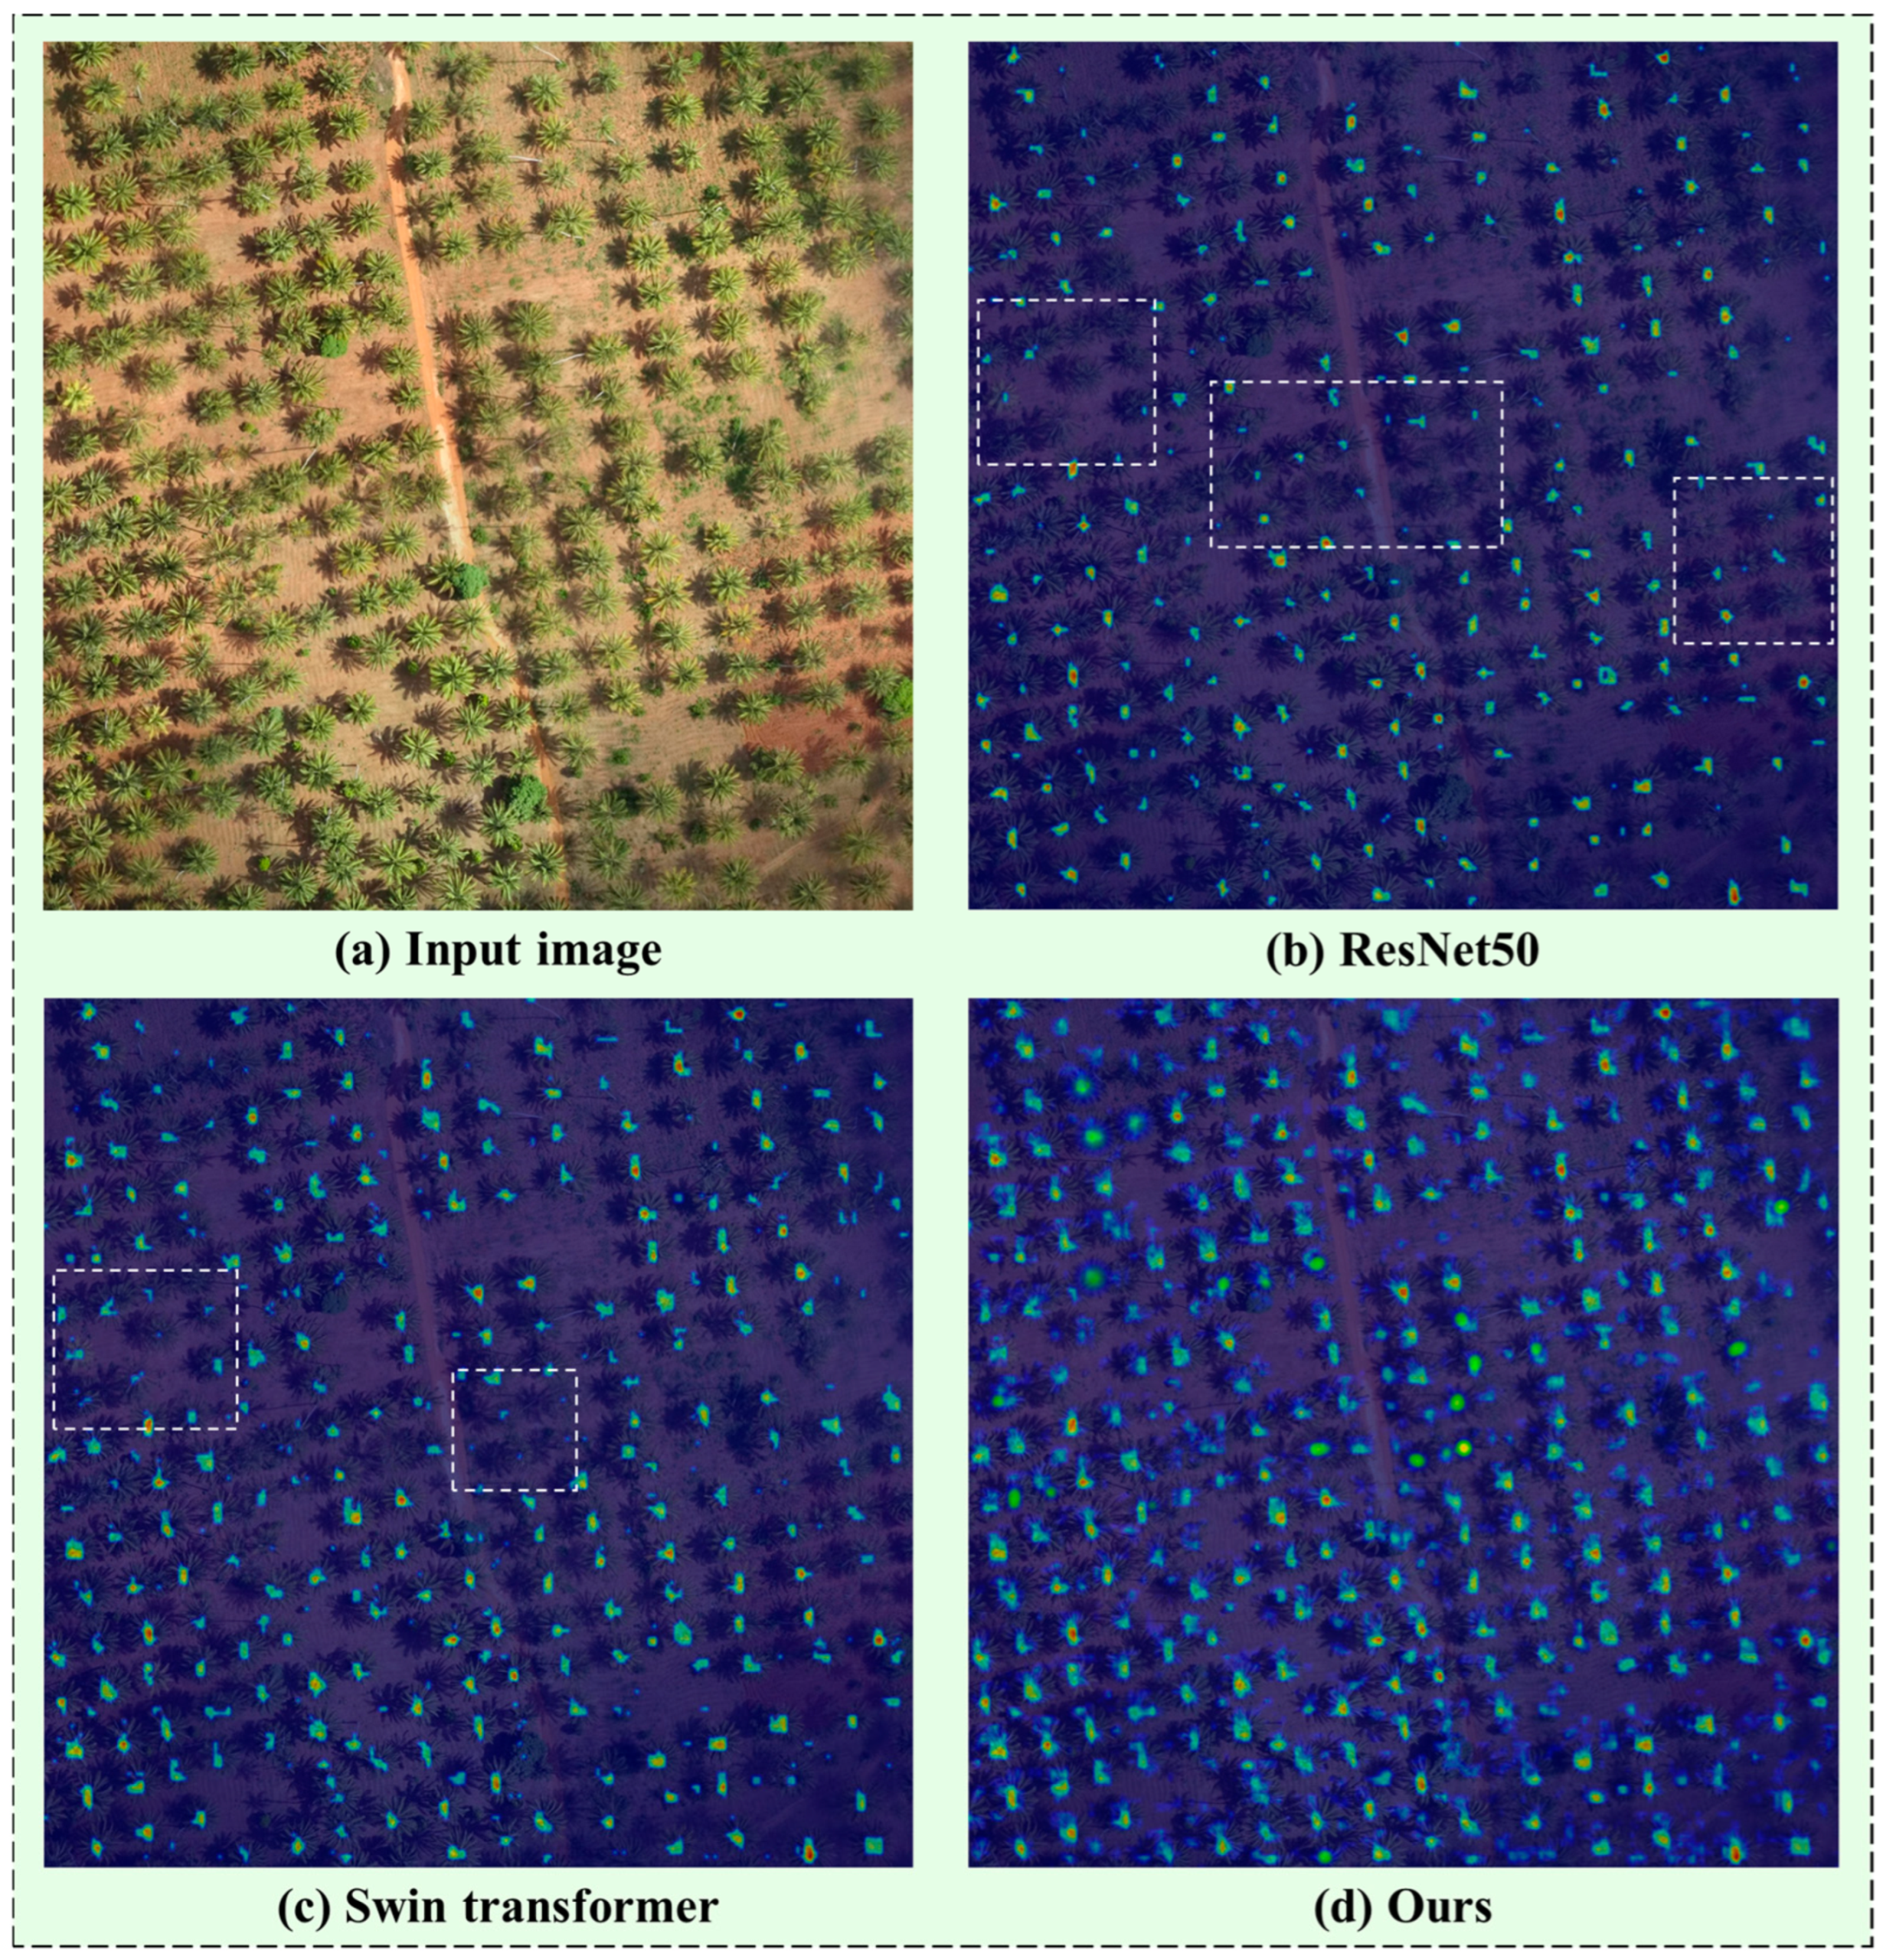
Figure 9 compares the predicted tree canopy segmentation heatmaps generated by the ResNet50, Swin Transformer, and CCViM models on the OAM-TCD dataset. CCViM, incorporating a contextual clustering module, adaptively segments image tokens into distinct windows for clustering. This effectively integrates both long-range and short-range feature interactions, enhancing spatial contextual representation and enabling the generation of segmentation heatmaps that capture richer detail. Consequently, CCViM significantly outperforms traditional methods in segmentation accuracy, as reflected in heatmap comparisons. In contrast, both ResNet50 and Swin Transformer exhibit evident limitations in feature capture within the regions marked with white squares. This analysis on OAM-TCD corroborates CCViM’s performance superiority.

4.6. Generalization

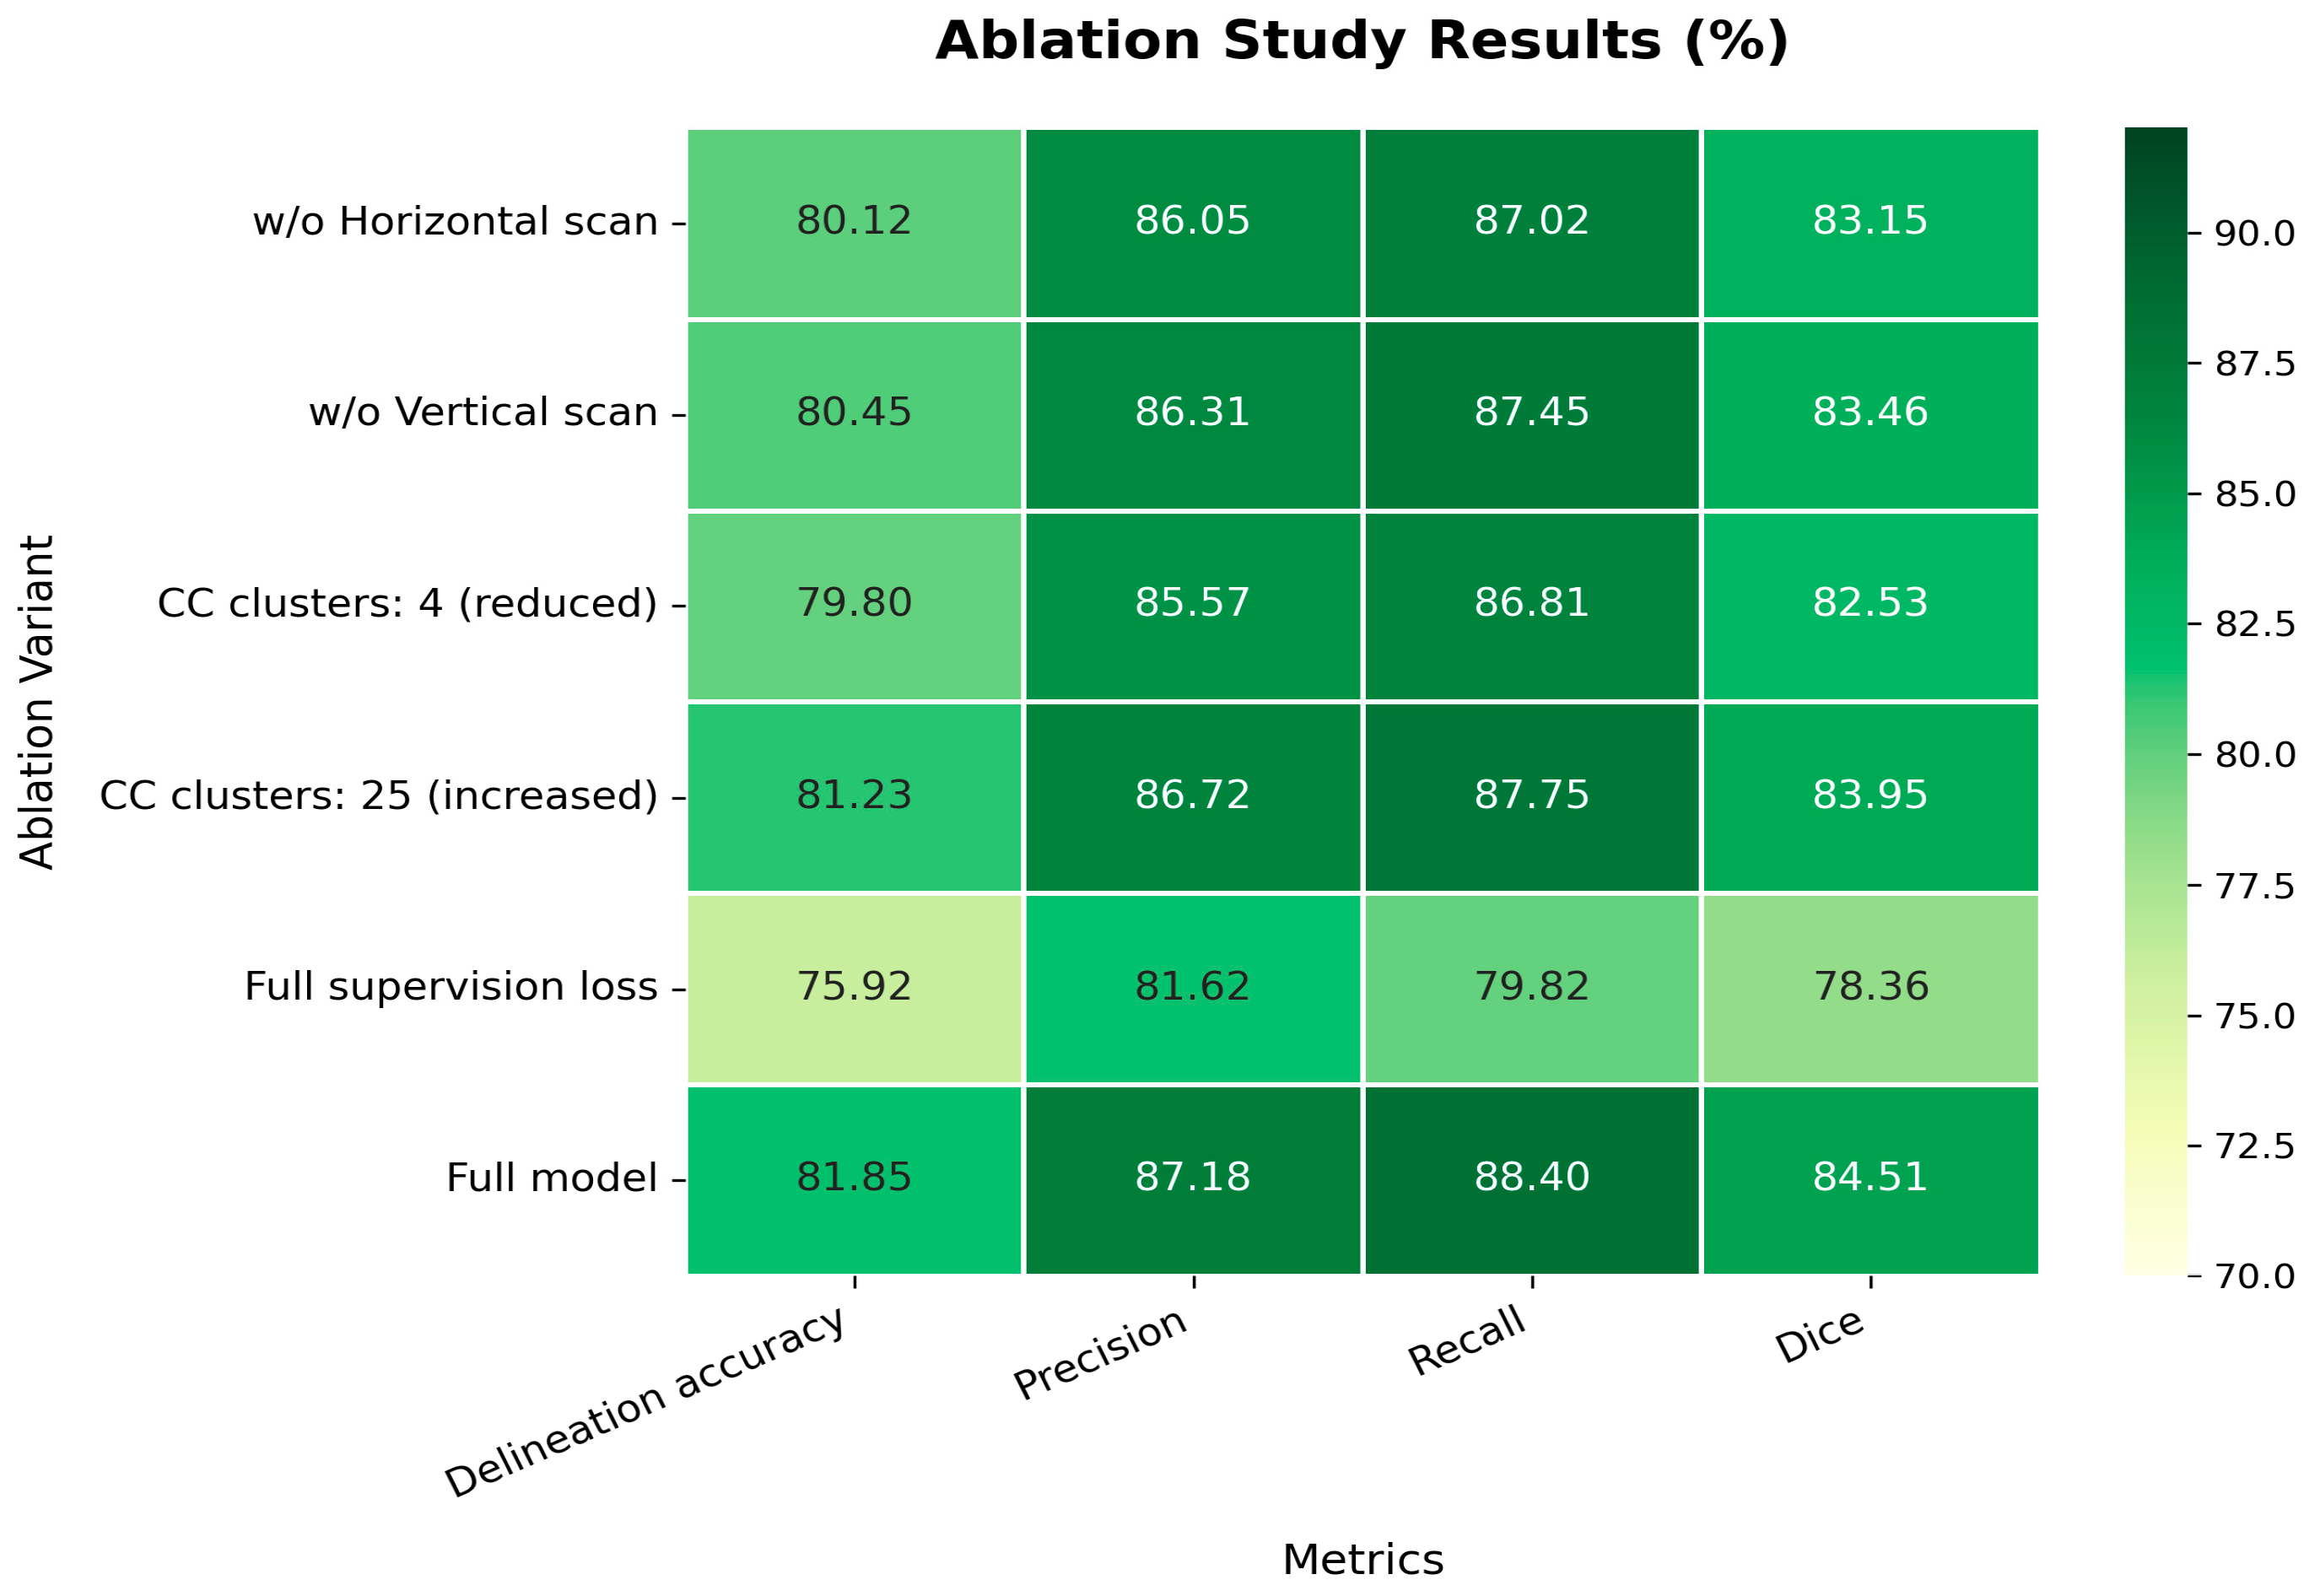
To quantify the contributions of CrownViM’s core modules, fine-grained ablation experiments were conducted on the SSD (Table 4), with results further visualized in Figure 10.
Regarding the scanning mechanism, removing horizontal or vertical scanning resulted in accuracy decreases of 1.73% and 1.40%, respectively, indicating that contextual modeling along orthogonal directions provides complementary information for crown delineation.
The model also exhibited sensitivity to cluster granularity. Neither reducing cluster centers to four (79.80%) nor increasing them to 25 (81.23%) surpassed the baseline configuration, suggesting that deviations from the default setting may weaken discriminative feature representation. These findings indicate that the default parameters maintain a relative balance between feature compactness and spatial coverage.
The supervision strategy produced the largest performance variation. Replacing the proposed loss with conventional full supervision reduced accuracy to 75.92% (Dice: 78.36%), suggesting limited robustness to boundary ambiguity and label noise in forestry imagery. In contrast, the proposed loss formulation improved segmentation consistency and overall stability. The complete model achieved an accuracy of 81.85% and a Dice score of 84.51%, reflecting the cumulative contribution of all modules.

4.7. Generalization Experiment

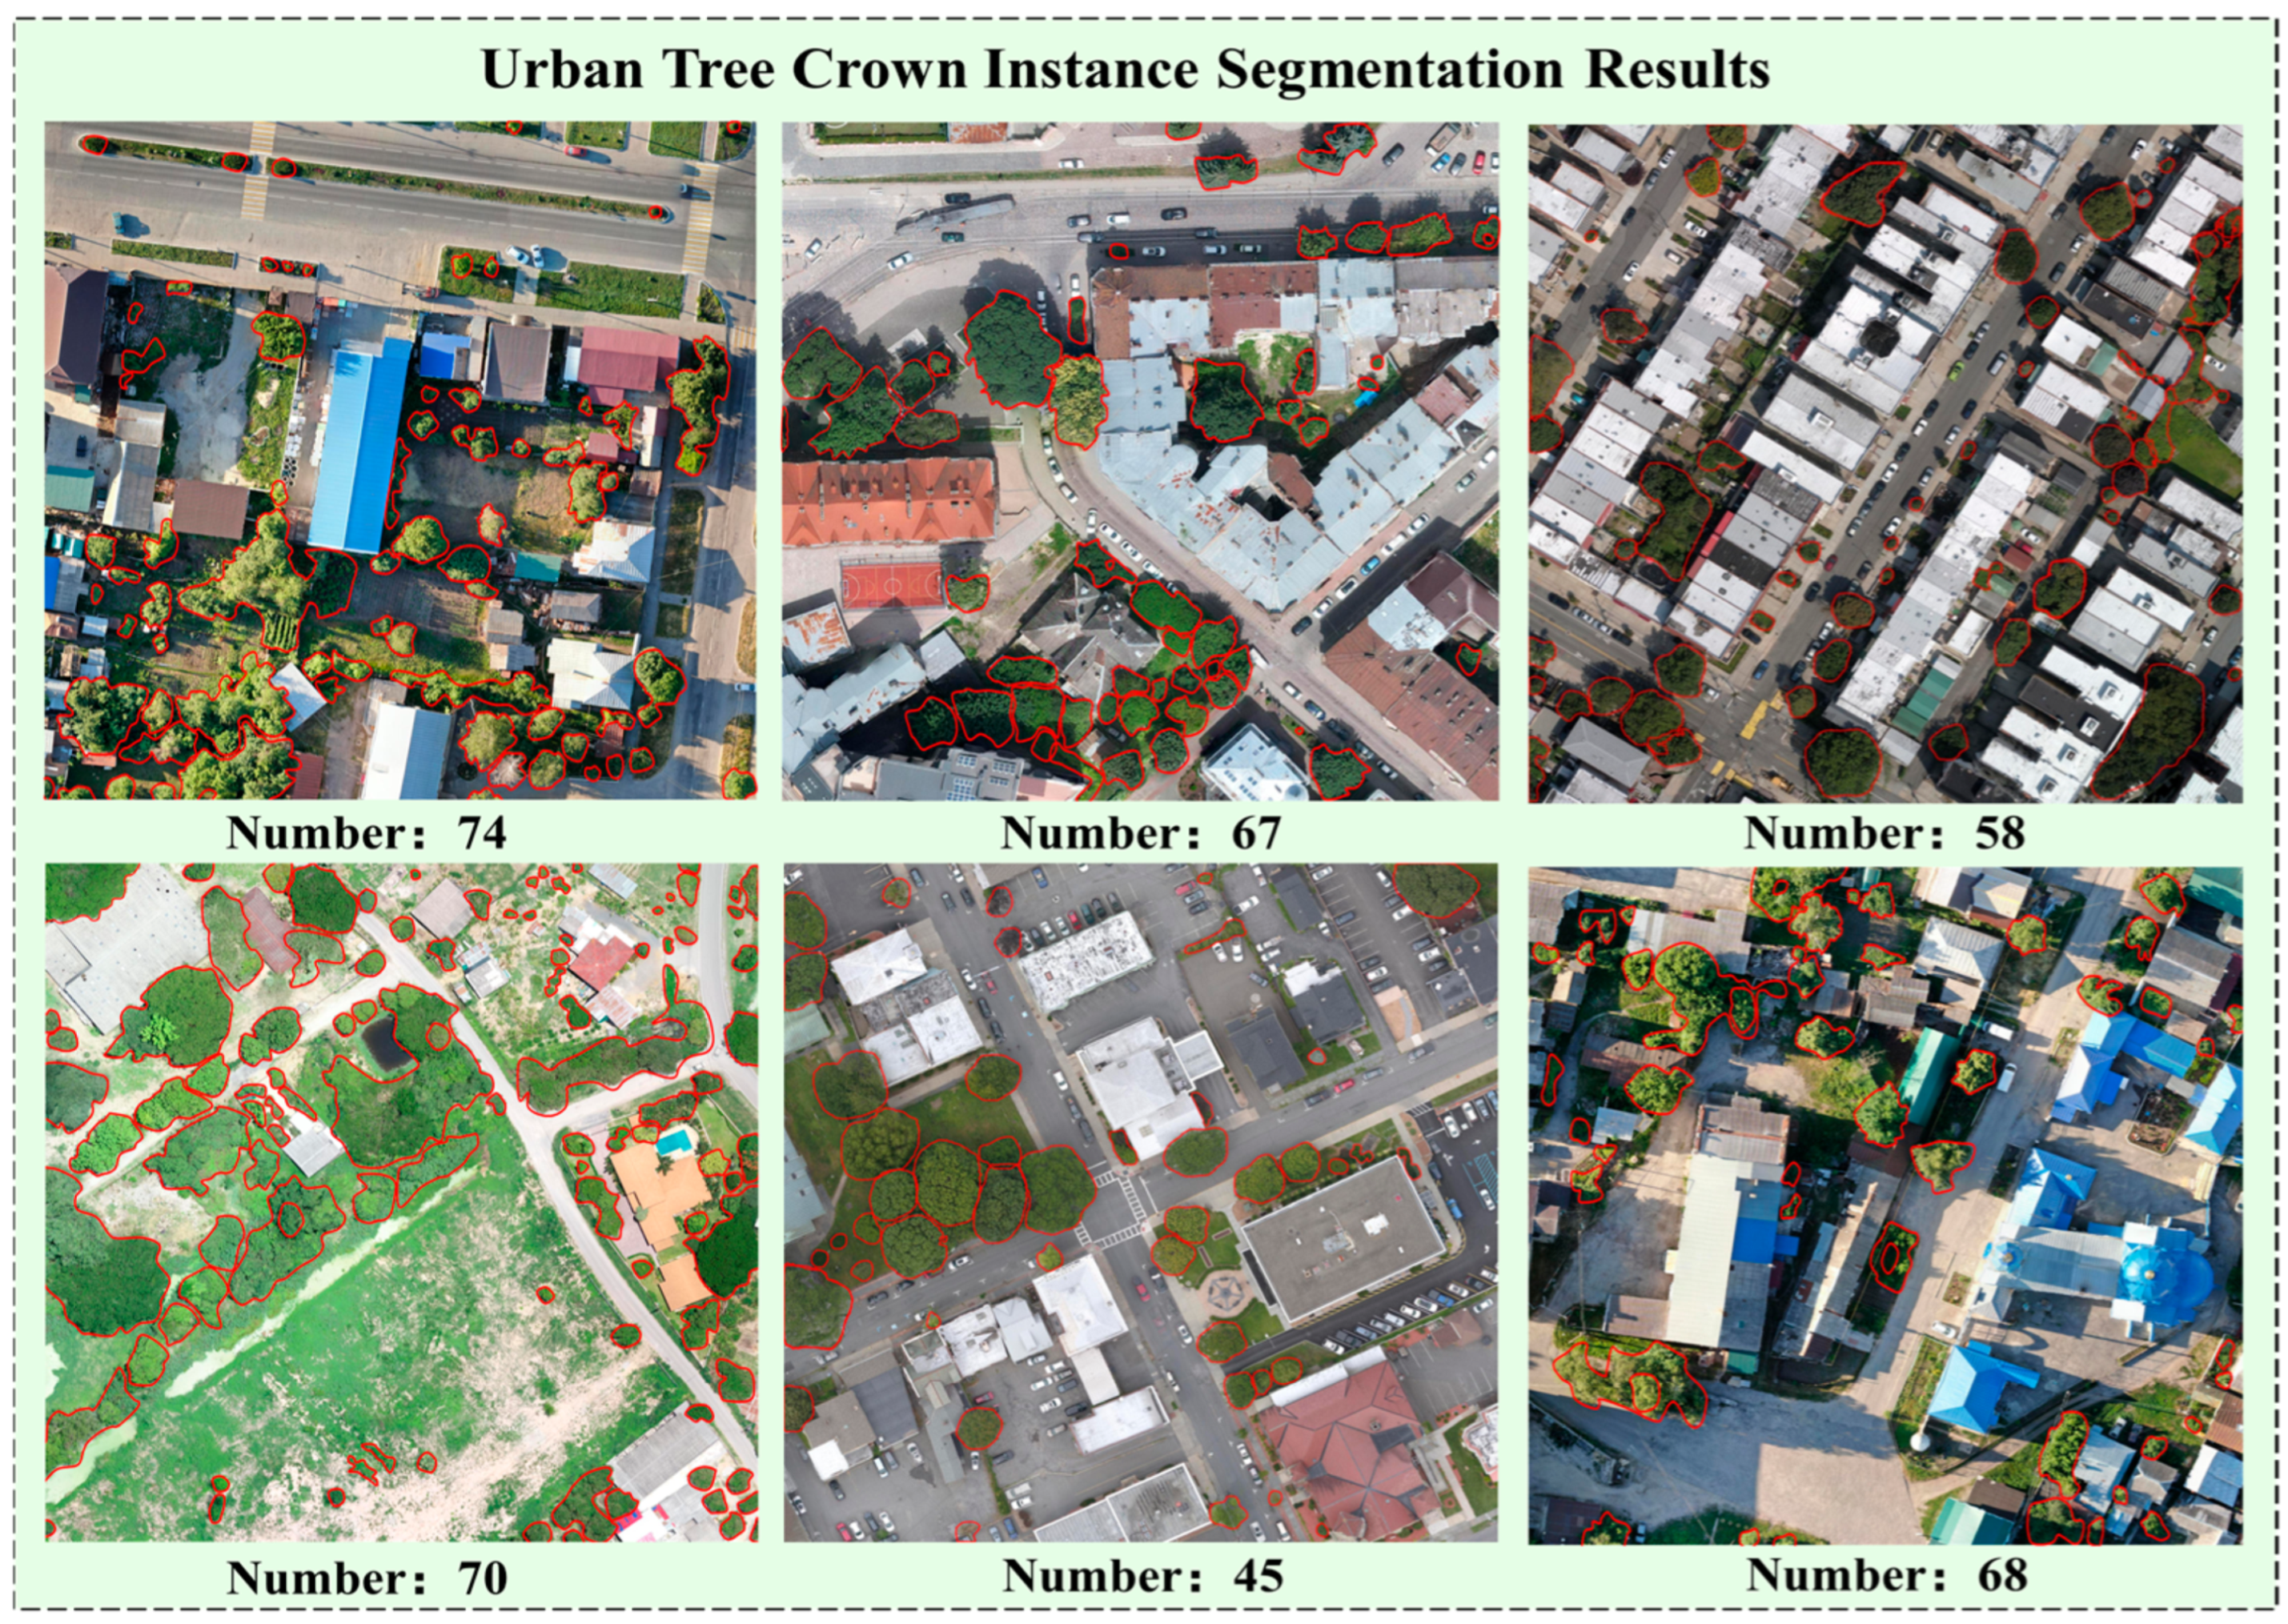
To further assess the generalizability of the proposed CrownVim model, we performed individual tree crown segmentation using urban aerial imagery from the OAM-TCD dataset. This subset encompasses typical urban areas featuring complex scenes with interspersed buildings, roads, and vegetation. The spectral and spatial characteristics markedly differ from the forest region imagery used for training, posing significant challenges.
As illustrated in Figure 10 (red polygons denote automatically delineated crown boundaries), CrownVim effectively identifies and segments tree crowns despite the substantial domain shift from forest to urban environments. Notably, it avoids significant over-segmentation or under-segmentation of artifacts caused by building shadows, high-reflectance roads, or crown overlaps. These results robustly demonstrate the model’s adaptability, supporting its practical application in diverse remote sensing tasks including urban green space monitoring and ecological assessment.

5. Discussion

5.1. State Space Modeling: A Robust Framework for ITCD

The results demonstrate that state space modeling (SSM) provides an effective alternative for Individual Tree Crown Delineation (ITCD) from high-resolution RGB imagery, structurally distinct from conventional CNN- or ViT-based approaches. CNNs are limited by hierarchical receptive fields, while ViTs face bottlenecks due to quadratic computational complexity. The CrownViM encoder employs bidirectional state propagation to achieve global context modeling with linear complexity. This mechanism plays a critical role in resolving ambiguities caused by overlapping crown boundaries.

5.2. Boundary Separation in Complex Crown Structures

CrownViM leverages context clustering within the Vision Mamba framework to address challenges arising from spectral similarity and canopy occlusion. Coupled with the MaskFormer decoder, simple pixel-wise classification is transformed into mask-based attention reasoning, enabling clear separation of adjacent crowns and minimizing boundary fragmentation.

5.3. Balancing Accuracy and Efficiency

With approximately 39.6 M parameters, CrownViM maintains a lightweight design while outperforming baseline models such as Mask R-CNN and ViT. These results confirm that SSM-based architectures are scalable for large-scale forestry applications or hardware-constrained environments, achieving a favorable trade-off between computational cost and segmentation performance. A visual comparison of the ablation variants is provided in Figure 11.

5.4. Practical Significance of Sparse-Annotation Supervision

The sparse-annotation supervision strategy alleviates the labor-intensive burden of manual annotation, a major obstacle in regional-scale forest monitoring. Even under incomplete annotation conditions, CrownViM maintains stable segmentation performance, demonstrating strong practical applicability in real-world monitoring scenarios.

5.5. Limitations and Future Directions

Several limitations remain. The current framework relies solely on RGB imagery and requires further optimization for ultra-large mosaic images. Future research will focus on multi-modal fusion (e.g., LiDAR and multispectral data) and deployment of lightweight model variants for real-time UAV applications. Extending SSM architectures to other remote sensing segmentation tasks may further enhance their applicability in large-scale ecological monitoring and carbon stock assessment.

6. Conclusions

This study presented CrownViM for precise individual tree crown segmentation in high-resolution aerial RGB imagery. On OAM-TCD and SSD, CrownViM achieves state-of-the-art delineation accuracy with lightweight 39.6 M parameters; ablation studies confirm the CCViM encoder’s advantage over CNN and ViT baselines, and urban transfer results validate generalizability. The partial-supervision loss enables training with sparse annotations, improving practicality in high-canopy-closure settings. Future work will explore CrownViM’s generalizability across broader forest typologies and aerial image resolutions. We aim to incorporate multispectral data and LiDAR-derived canopy height models (CHMs) through optimized cross-modal registration and enhance the local-constrained loss for extremely sparse-annotation regimes. These advances will enable annotation-efficient training in high-canopy-closure environments, maximizing the framework’s practical utility.

Author Contributions

E.S.: Writing—original draft, formal analysis, methodology, data curation, conceptualization. Z.S.: writing—original draft, formal analysis, methodology, data curation, conceptualization. F.S.: methodology, data curation, conceptualization. L.L.: writing—review and editing, funding acquisition. R.L.: writing—review and editing, formal analysis, funding acquisition. F.W.: data curation, validation. K.Z.: supervision, investigation. All authors have read and agreed to the published version of the manuscript.

Funding

This work was supported by the National Natural Science Foundation of China (Grant No. 61902436), the Education Department Key Program of Hunan Province (Grant No. 21A0160).

Data Availability Statement

The datasets and code used in this study are available at: https://github.com/shziyang/CrownViM (accessed on 1 February 2026). Additional data are available from the corresponding author on reasonable request.

Acknowledgments

The authors would like to thank the creators of MMDetection (Chen et al., 2019 [56]) and OAM-TCD (Veitch–Michaelis et al., 2024 [43]) for providing open-source codebases and the dataset. During the preparation of this work, the authors utilized DeepSeek-R1 to enhance writing quality. Following its use, the manuscript was reviewed and edited as required, and the authors assume full responsibility for its content.

Conflicts of Interest

The authors declare that they have no known competing financial interests or personal relationships that could have appeared to influence the work reported in this paper.

References

  1. Santoro, M.; Cartus, O.; Wegmüller, U.; Besnard, S.; Carvalhais, N.; Araza, A.; Herold, M.; Liang, J.; Cavlovic, J.; Engdahl, M.E. Global estimation of above-ground biomass from spaceborne C-band scatterometer observations aided by LiDAR metrics of vegetation structure. Remote Sens. Environ. 2022, 279, 113114. [Google Scholar] [CrossRef]
  2. Lei, L.; Yin, T.; Chai, G.; Li, Y.; Wang, Y.; Jia, X.; Zhang, X. A novel algorithm of individual tree crowns segmentation considering three-dimensional canopy attributes using UAV oblique photos. Int. J. Appl. Earth Obs. Geoinf. 2022, 112, 102893. [Google Scholar] [CrossRef]
  3. Chai, G.; Zheng, Y.; Lei, L.; Yao, Z.; Chen, M.; Zhang, X. A novel solution for extracting individual tree crown parameters in high-density plantation considering inter-tree growth competition using terrestrial close-range scanning and photogrammetry technology. Comput. Electron. Agric. 2023, 209, 107849. [Google Scholar] [CrossRef]
  4. Wang, Y.; Ni, W.; Sun, G.; Chi, H.; Zhang, Z.; Guo, Z. Slope-adaptive waveform metrics of large footprint lidar for estimation of forest aboveground biomass. Remote Sens. Environ. 2019, 224, 386–400. [Google Scholar] [CrossRef]
  5. Zhang, W.; Ke, Y.; Quackenbush, L.J.; Zhang, L. Using error-in-variable regression to predict tree diameter and crown width from remotely sensed imagery. Can. J. For. Res. 2010, 40, 1095–1108. [Google Scholar] [CrossRef]
  6. Dalponte, M.; Frizzera, L.; Ørka, H.O.; Gobakken, T.; Næsset, E.; Gianelle, D. Predicting stem diameters and aboveground biomass of individual trees using remote sensing data. Ecol. Indic. 2018, 85, 367–376. [Google Scholar] [CrossRef]
  7. Graves, S.J.; Caughlin, T.T.; Asner, G.P.; Bohlman, S.A. A tree-based approach to biomass estimation from remote sensing data in a tropical agricultural landscape. Remote Sens. Environ. 2018, 218, 32–43. [Google Scholar] [CrossRef]
  8. Gougeon, F.A. Automatic individual tree crown delineation using a valley-following algorithm and rule-based system. In Proceedings of the International Forum on Automated Interpretation of High Spatial Resolution Digital Imagery for Forestry, Victoria, BC, Canada, 10–12 February 1998; pp. 11–23. Available online: https://ostrnrcan-dostrncan.canada.ca/handle/1845/231062 (accessed on 1 February 2026).
  9. Ferreira, M.P.; Zanotta, D.C.; Zortea, M.; Korting, T.S.; Fonseca, L.M.G.; Shimabukuro, Y.E.; Filho, C.R.S. Automatic tree crown delineation in tropical forest using hyperspectral data. In Proceedings of the 2014 IEEE Geoscience and Remote Sensing Symposium, Quebec City, QC, Canada, 13–18 July 2014; pp. 784–787. [Google Scholar] [CrossRef]
  10. Wang, L.; Gong, P.; Biging, G.S. Individual Tree-Crown delineation and treetop detection in High-Spatial-Resolution aerial imagery. Photogramm. Eng. Remote Sens. 2004, 70, 351–357. [Google Scholar] [CrossRef]
  11. He, K.; Gkioxari, G.; Dollár, P.; Girshick, R. Mask R-CNN. In Proceedings of the IEEE International Conference on Computer Vision (ICCV), Venice, Italy, 22–29 October 2017; pp. 2961–2969. [Google Scholar] [CrossRef]
  12. Wang, W.; Dai, J.; Chen, Z.; Huang, Z.; Li, Z.; Zhu, X.; Hu, X.; Lu, T.; Lu, L.; Li, H.; et al. InternImage: Exploring large-scale vision foundation models with deformable convolutions. In Proceedings of the IEEE/CVF Conference on Computer Vision and Pattern Recognition (CVPR), Vancouver, BC, Canada, 17–24 June 2023; pp. 14408–14419. [Google Scholar] [CrossRef]
  13. Zhang, D.; Zhang, L.; Tang, J. Augmented FCN: Rethinking context Modeling for Semantic Segmentation. Sci. China Inf. Sci. 2023, 66, 142105. [Google Scholar] [CrossRef]
  14. Zhou, H.; Peng, Y.; Zhang, R.; He, Y.; Li, L.; Xiao, W. GS-DeepLabV3+: A Mountain Tea disease segmentation network based on improved shuffle attention and gated multidimensional feature extraction. Crop Prot. 2024, 183, 106762. [Google Scholar] [CrossRef]
  15. Zhou, H.; Li, L.; Peng, S.; Xu, S.; Shi, Z.; Xie, B.; Peng, Y.; Zhao, B. RLEM-Net: Reinforcement learning enhanced multimodal segmentation for Camellia oleifera diseases based on semantic and visual features. Expert Syst. Appl. 2025, 214, 130176. [Google Scholar] [CrossRef]
  16. Shi, Z.; Zhang, R.; Wei, X.; Yu, C.; Xie, H.; Hu, Z.; Chen, X.; Zhang, Y.; Xie, B.; Luo, Z.; et al. LUNETR: Language-Infused UNETR for precise pancreatic tumor segmentation in 3D medical image. Neural Netw. 2025, 187, 107414. [Google Scholar] [CrossRef]
  17. Guo, R.; Zhang, R.; Zhou, H.; Xie, T.; Peng, Y.; Chen, X.; Yu, G.; Wan, F.; Li, L.; Zhang, Y.; et al. CTDUNet: A Multimodal CNN–Transformer Dual U-Shaped Network with Coordinate Space Attention for Camellia oleifera Pests and Diseases Segmentation in Complex Environments. Plants 2024, 13, 2274. [Google Scholar] [CrossRef] [PubMed]
  18. Gu, A.; Dao, T. Mamba: Linear-time sequence modeling with selective state spaces. In Proceedings of the 41st International Conference on Machine Learning, PMLR, Vienna, Austria, 21–27 July 2024; pp. 17810–17836. Available online: https://proceedings.mlr.press/v235/gu24a.html (accessed on 1 February 2026).
  19. Liu, Y.; Tian, Y.; Zhao, Y.; Yu, H.; Xie, L.; Wang, Y.; Ye, Q.; Jiao, J.; Liu, Y. VMamba: Visual state space model. In Proceedings of the Advances in Neural Information Processing Systems 37 (NeurIPS 2024), Vancouver, BC, Canada, 10–15 December 2024. [Google Scholar] [CrossRef]
  20. Huang, T.; Pei, X.; You, S.; Wang, F.; Qian, C.; Xu, C. LocalMamba: Visual State Space Model with Windowed Selective Scan. arXiv 2024, arXiv:2403.09338. [Google Scholar] [CrossRef]
  21. Zhu, Y.; Zhang, D.; Lin, Y.; Feng, Y.; Tang, J. Merging Context Clustering with Visual State Space Models for Medical Image Segmentation. IEEE Trans. Med. Imaging 2025, 44, 2131–2142. [Google Scholar] [CrossRef]
  22. Leckie, D.; Gougeon, F.; Walsworth, N.; Paradine, D. Stand delineation and composition estimation using semi-automated individual tree crown analysis. Remote Sens. Environ. 2003, 85, 355–369. [Google Scholar] [CrossRef]
  23. Gu, J.; Congalton, R.G. Individual tree crown delineation from UAS imagery based on region growing by over-segments with a competitive mechanism. IEEE Trans. Geosci. Remote Sens. 2022, 60, 4402411. [Google Scholar] [CrossRef]
  24. Zhen, Z.; Quackenbush, L.J.; Zhang, L. Impact of Tree-Oriented Growth Order in Marker-Controlled Region growing for individual tree crown delineation using Airborne Laser Scanner (ALS) data. Remote Sens. 2014, 6, 555–579. [Google Scholar] [CrossRef]
  25. Gärtner, P.; Förster, M.; Kurban, A.; Kleinschmit, B. Object based change detection of Central Asian Tugai vegetation with very high spatial resolution satellite imagery. Int. J. Appl. Earth Obs. Geoinf. 2014, 31, 110–121. [Google Scholar] [CrossRef]
  26. Jing, L.; Hu, B.; Noland, T.; Li, J. An individual tree crown delineation method based on multi-scale segmentation of imagery. ISPRS J. Photogramm. Remote Sens. 2012, 70, 88–98. [Google Scholar] [CrossRef]
  27. Yang, J.; He, Y.; Caspersen, J. A multi-band watershed segmentation method for individual tree crown delineation from high resolution multispectral aerial image. In Proceedings of the 2014 IEEE Geoscience and Remote Sensing Symposium, Quebec City, QC, Canada, 13–18 July 2014; pp. 1588–1591. [Google Scholar] [CrossRef]
  28. Wang, L. A Multi-scale Approach for Delineating Individual Tree Crowns with Very High Resolution Imagery. Photogramm. Eng. Remote Sens. 2010, 76, 371–378. [Google Scholar] [CrossRef]
  29. Wagner, F.H.; Ferreira, M.P.; Sanchez, A.; Hirye, M.C.; Zortea, M.; Gloor, E.; Phillips, O.L.; De Souza Filho, C.R.; Shimabukuro, Y.E.; Aragão, L.E. Individual tree crown delineation in a highly diverse tropical forest using very high resolution satellite images. ISPRS J. Photogramm. Remote Sens. 2018, 145, 362–377. [Google Scholar] [CrossRef]
  30. Tong, F.; Tong, H.; Mishra, R.; Zhang, Y. Delineation of individual tree crowns using high spatial resolution multispectral WorldView-3 satellite imagery. IEEE J. Sel. Top. Appl. Earth Obs. Remote Sens. 2021, 14, 7751–7761. [Google Scholar] [CrossRef]
  31. Straker, A.; Puliti, S.; Breidenbach, J.; Kleinn, C.; Pearse, G.; Astrup, R.; Magdon, P. Instance segmentation of individual tree crowns with YOLOv5: A comparison of approaches using the ForInstance benchmark LiDAR dataset. ISPRS Open J. Photogramm. Remote Sens. 2023, 9, 100045. [Google Scholar] [CrossRef]
  32. Dersch, S.; Schöttl, A.; Krzystek, P.; Heurich, M. Semi-supervised multi-class tree crown delineation using aerial multispectral imagery and lidar data. ISPRS J. Photogramm. Remote Sens. 2024, 216, 154–167. [Google Scholar] [CrossRef]
  33. Weinstein, B.G.; Marconi, S.; Bohlman, S.; Zare, A.; White, E. Individual Tree-Crown detection in RGB imagery using Semi-Supervised Deep Learning neural networks. Remote Sens. 2019, 11, 1309. [Google Scholar] [CrossRef]
  34. Silva, C.A.; Hudak, A.T.; Vierling, L.A.; Loudermilk, E.L.; O’Brien, J.J.; Hiers, J.K.; Jack, S.B.; Gonzalez-Benecke, C.; Lee, H.; Falkowski, M.J.; et al. Imputation of individual longleaf pine (Pinus palustris Mill.) tree attributes from field and LiDAR data. Can. J. Remote Sens. 2016, 42, 554–573. [Google Scholar] [CrossRef]
  35. Lassalle, G.; Ferreira, M.P.; La Rosa, L.E.C.; De Souza Filho, C.R. Deep learning-based individual tree crown delineation in mangrove forests using very-high-resolution satellite imagery. ISPRS J. Photogramm. Remote Sens. 2022, 189, 220–235. [Google Scholar] [CrossRef]
  36. Freudenberg, M.; Magdon, P.; Nölke, N. Individual tree crown delineation in high-resolution remote sensing images based on U-Net. Neural Comput. Appl. 2022, 34, 22197–22207. [Google Scholar] [CrossRef]
  37. Chadwick, A.J.; Goodbody, T.R.H.; Coops, N.C.; Hervieux, A.; Bater, C.W.; Martens, L.A.; White, B.; Röeser, D. Automatic Delineation and Height Measurement of Regenerating Conifer Crowns under Leaf-Off Conditions Using UAV Imagery. Remote Sens. 2020, 12, 4104. [Google Scholar] [CrossRef]
  38. Braga, J.R.G.; Peripato, V.; Dalagnol, R.; Ferreira, M.P.; Tarabalka, Y.; Aragão, L.E.O.C.; De Campos Velho, H.F.; Shiguemori, E.H.; Wagner, F.H. Tree crown delineation algorithm based on a convolutional neural network. Remote Sens. 2020, 12, 1288. [Google Scholar] [CrossRef]
  39. Dersch, S.; Schöttl, A.; Krzystek, P.; Heurich, M. Towards complete tree crown delineation by instance segmentation with Mask R–CNN and DETR using UAV-based multispectral imagery and lidar data. ISPRS Open J. Photogramm. Remote Sens. 2023, 8, 100037. [Google Scholar] [CrossRef]
  40. Ball, J.G.C.; Hickman, S.H.M.; Jackson, T.D.; Koay, X.J.; Hirst, J.; Jay, W.; Archer, M.; Aubry-Kientz, M.; Vincent, G.; Coomes, D.A. Accurate delineation of individual tree crowns in tropical forests from aerial RGB imagery using Mask R-CNN. Remote Sens. Ecol. Conserv. 2023, 9, 641–655. [Google Scholar] [CrossRef]
  41. Lei, L.; Chai, G.; Yao, Z.; Li, Y.; Jia, X.; Zhang, X. A novel self-similarity cluster grouping approach for individual tree crown segmentation using multi-features from UAV-based LiDAR and multi-angle photogrammetry data. Remote Sens. Environ. 2025, 318, 114588. [Google Scholar] [CrossRef]
  42. Tong, F.; Zhang, Y. Individual tree crown delineation in high resolution aerial RGB imagery using StarDist-based model. Remote Sens. Environ. 2025, 319, 114618. [Google Scholar] [CrossRef]
  43. Veitch-Michaelis, J.; Cottam, A.; Schweizer, D.; Broadbent, E.N.; Dao, D.; Zhang, C.; Zambrano, A.A.; Max, S. OAM-TCD: A globally diverse dataset of high-resolution tree cover maps. arXiv 2024. [Google Scholar] [CrossRef]
  44. Zhang, R.; Li, G.; Qu, S.; Wang, J.; Peng, J. Mamba-GIE: A visual state space models-based generalized image extrapolation method via dual-level adaptive feature fusion. Expert Syst. Appl. 2024, 264, 125961. [Google Scholar] [CrossRef]
  45. Lieber, O.; Lenz, B.; Bata, H.; Cohen, G.; Osin, J.; Dalmedigos, I.; Safahi, E.; Meirom, S.; Belinkov, Y.; Shalev-Shwartz, S.; et al. Jamba: A hybrid Transformer-Mamba language model. arXiv 2024. [Google Scholar] [CrossRef]
  46. Li, H.; Liu, S.; Wang, H.; Jiang, X.; Jiu, M.; Chen, L.; Lu, Y.; Li, S.; Xu, M. RRGMambaFormer: A hybrid Transformer-Mamba architecture for radiology report generation. Expert Syst. Appl. 2025, 279, 127419. [Google Scholar] [CrossRef]
  47. Cheng, B.; Schwing, A.G.; Kirillov, A. Per-pixel classification is not all you need for semantic segmentation. Adv. Neural Inf. Process. Syst. 2021, 34, 17864–17875. [Google Scholar]
  48. Ma, X.; Zhou, Y.; Wang, H.; Qin, C.; Sun, B.; Liu, C.; Fu, Y. Image as set of points. In Proceedings of the Twelfth International Conference on Learning Representations (ICLR), Vienna, Austria, 7–11 May 2024; Available online: https://openreview.net/forum?id=awnvqZja69 (accessed on 1 February 2026).
  49. Carion, N.; Massa, F.; Synnaeve, G.; Usunier, N.; Kirillov, A.; Zagoruyko, S. End-to-End Object Detection with Transformers. In Computer Vision—ECCV 2020; Vedaldi, A., Bischof, H., Brox, T., Frahm, J.-M., Eds.; Springer International Publishing: Cham, Switzerland, 2020; pp. 213–229. [Google Scholar] [CrossRef]
  50. Chen, L.-C.; Papandreou, G.; Kokkinos, I.; Murphy, K.; Yuille, A.L. DeepLab: Semantic Image Segmentation with Deep Convolutional Nets, Atrous Convolution, and Fully Connected CRFs. IEEE Trans. Pattern Anal. Mach. Intell. 2018, 40, 834–848. [Google Scholar] [CrossRef] [PubMed]
  51. Gao, P.; Zheng, M.; Wang, X.; Dai, J.; Li, H. Fast convergence of DETR with spatially modulated co-attention. In Proceedings of the IEEE/CVF International Conference on Computer Vision (ICCV), Montreal, QC, Canada, 10–17 October 2021; pp. 3601–3610. [Google Scholar] [CrossRef]
  52. Sun, Z.; Cao, S.; Yang, Y.; Kitani, K. Rethinking transformer-based set prediction for object detection. In Proceedings of the IEEE/CVF International Conference on Computer Vision (ICCV), Montreal, QC, Canada, 10–17 October 2021; pp. 3591–3600. [Google Scholar] [CrossRef]
  53. Zhu, X.; Su, W.; Lu, L.; Li, B.; Wang, X.; Dai, J. Deformable DETR: Deformable transformers for end-to-end object detection. arXiv 2020. [Google Scholar] [CrossRef]
  54. Vaswani, A.; Shazeer, N.; Parmar, N.; Uszkoreit, J.; Jones, L.; Gomez, A.N.; Kaiser, L.; Polosukhin, I. Attention is all you need. Adv. Neural Inf. Process. Syst. 2017, 30, 5998–6008. [Google Scholar]
  55. Ren, S.; He, K.; Girshick, R.; Sun, J. Faster R-CNN: Towards Real-Time Object Detection with Region Proposal Networks. IEEE Trans. Pattern Anal. Mach. Intell. 2015, 39, 1137–1149. [Google Scholar] [CrossRef]
  56. Chen, K.; Wang, J.; Pang, J.; Cao, Y.; Xiong, Y.; Li, X.; Sun, S.; Feng, W.; Liu, Z.; Xu, J.; et al. MMDetection: Open MMLab detection toolbox and benchmark. arXiv 2019. [Google Scholar] [CrossRef]
  57. Lin, T.-Y.; Dollár, P.; Girshick, R.; He, K.; Hariharan, B.; Belongie, S. Feature pyramid networks for object detection. In Proceedings of the IEEE Conference on Computer Vision and Pattern Recognition (CVPR), Honolulu, HI, USA, 21–26 July 2017; pp. 2117–2125. [Google Scholar] [CrossRef]
  58. Zhu, Q.; Fang, Y.; Cai, Y.; Chen, C.; Fan, L. Rethinking Scanning Strategies with Vision Mamba in Semantic Segmentation of Remote Sensing Imagery: An Experimental Study. IEEE J. Sel. Top. Appl. Earth Obs. Remote Sens. 2024, 17, 18223–18234. [Google Scholar] [CrossRef]
  59. Cao, H.; Wang, Y.; Chen, J.; Jiang, D.; Zhang, X.; Tian, Q.; Wang, M. Swin-Unet: Unet-like pure transformer for medical image segmentation. In Computer Vision—ECCV 2022 Workshops; Springer: Berlin/Heidelberg, Germany, 2022; pp. 205–218. [Google Scholar] [CrossRef]
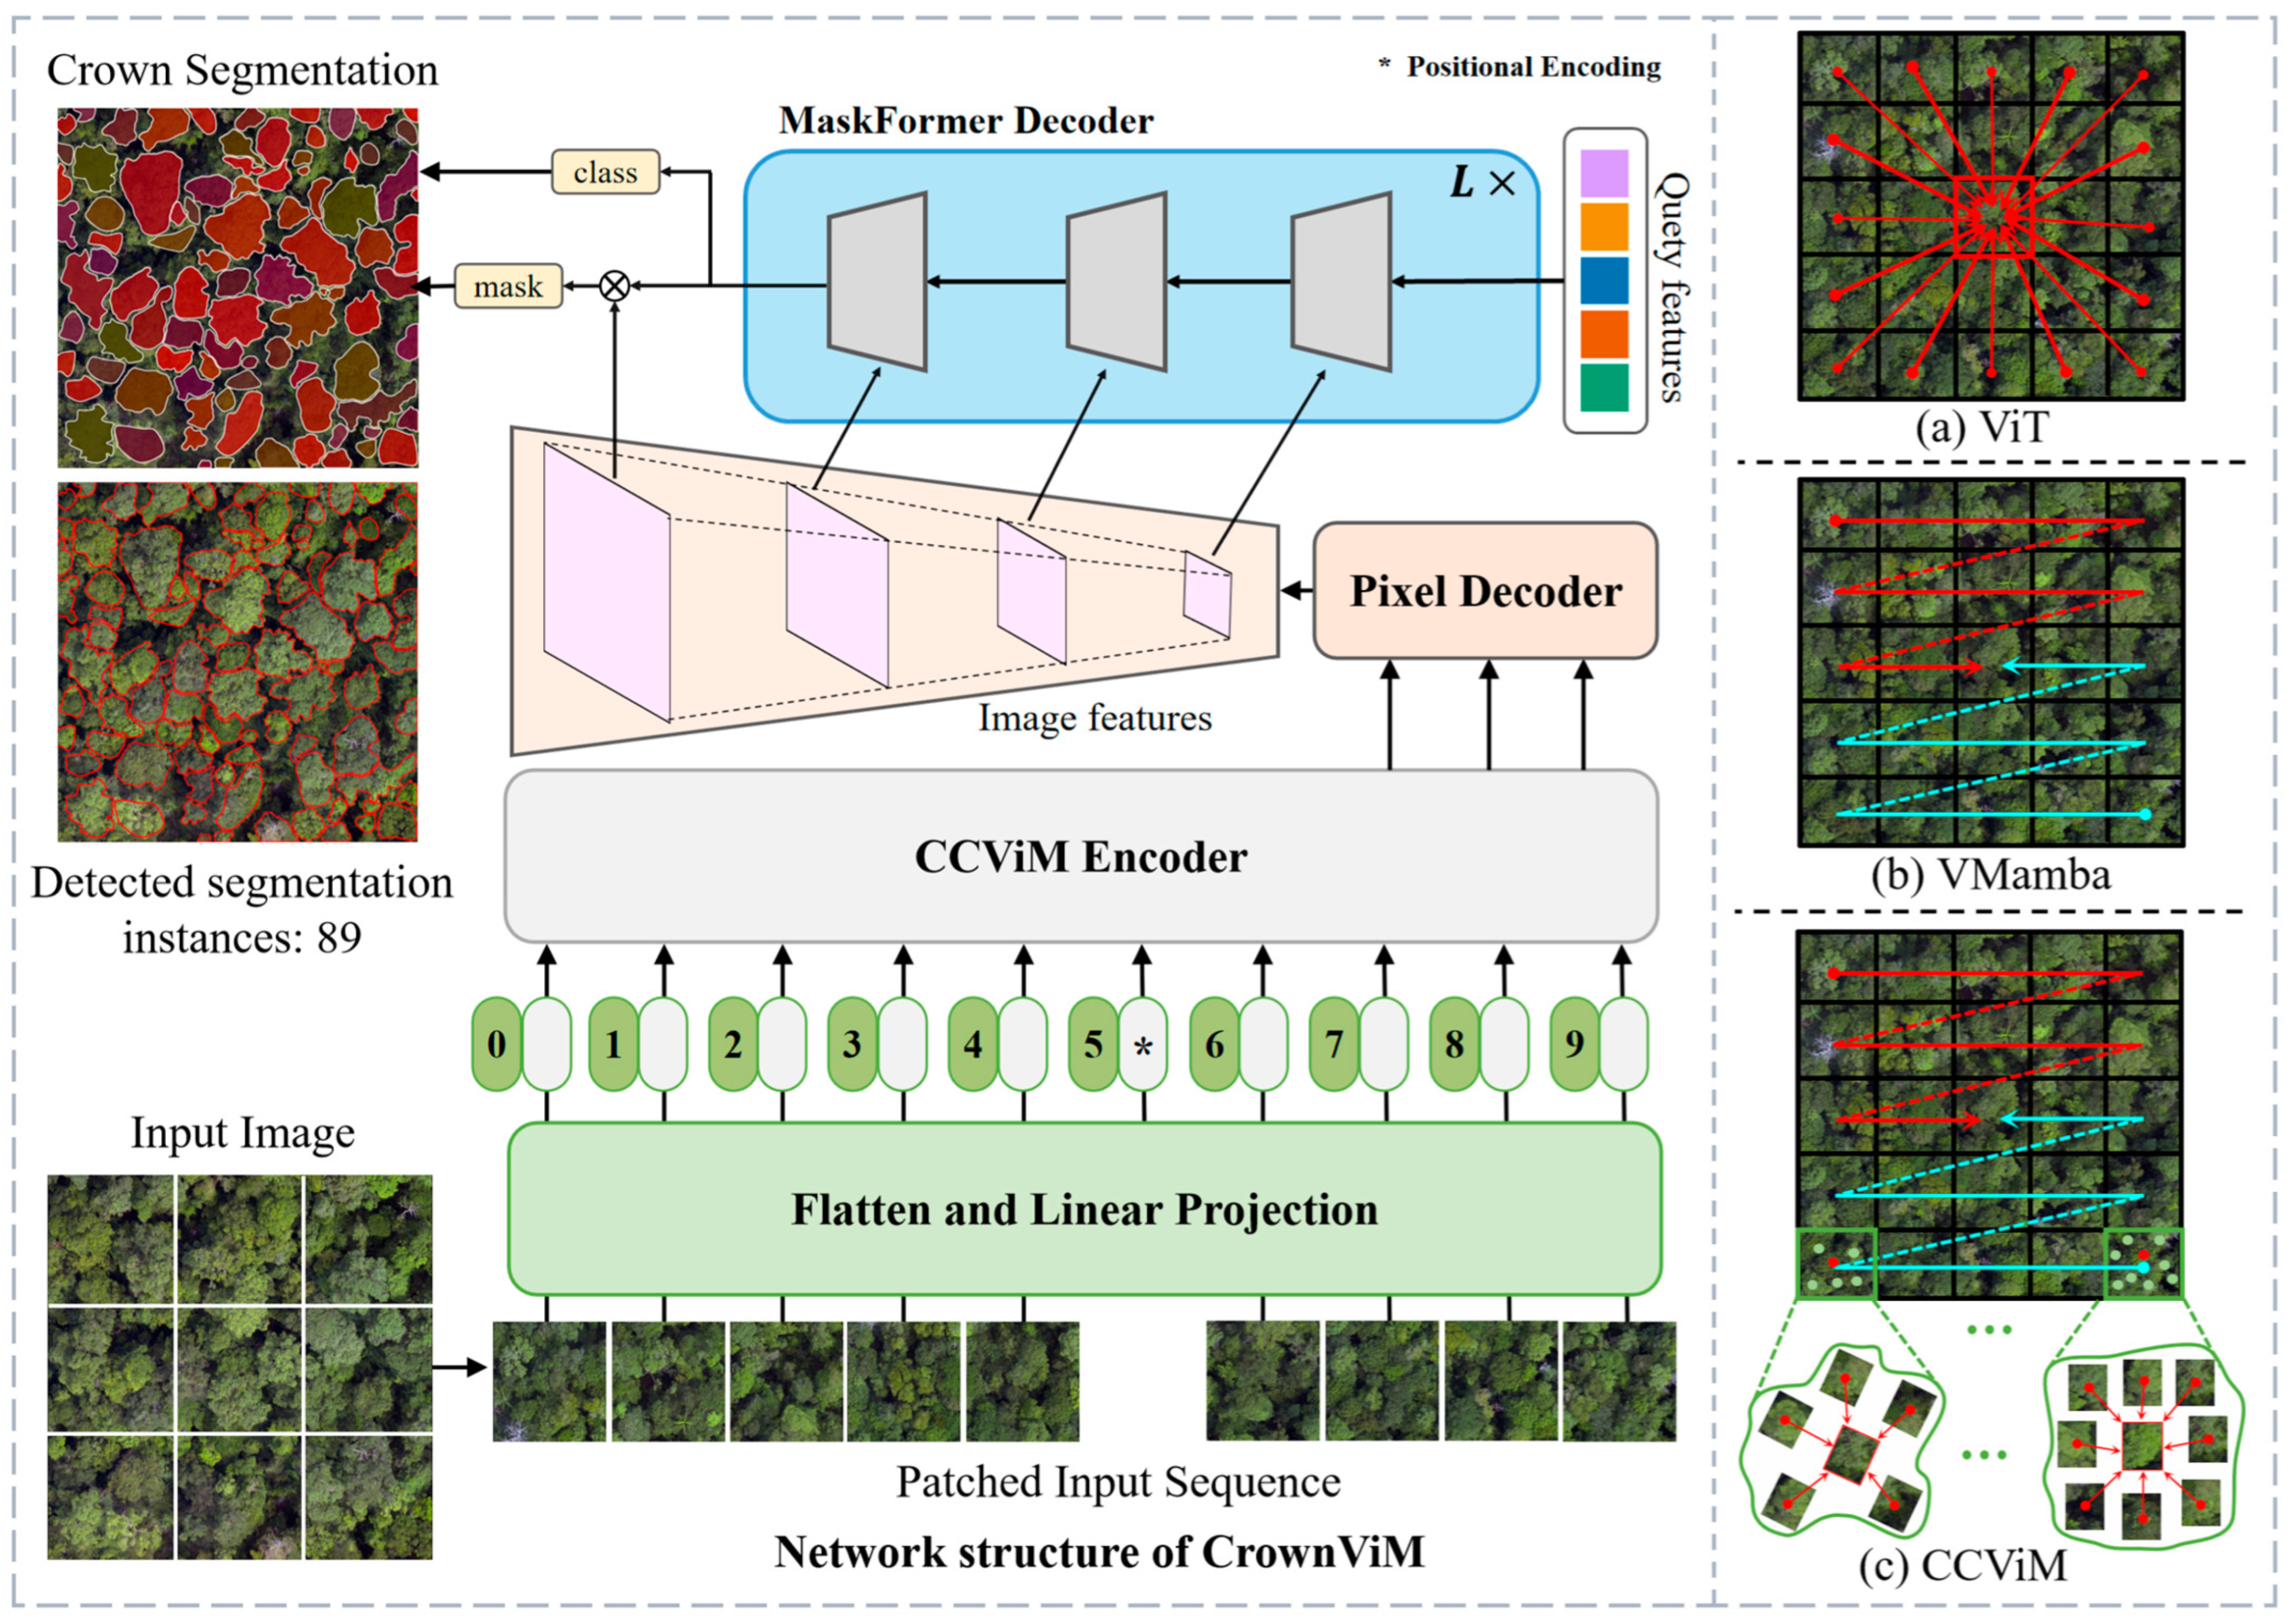
Figure 1. (Left) CrownVim network architecture. Input images are transformed into token sequences (flattened input patches). Precise crown instance segmentation is derived via skip connections at multiple encoder depth levels and a dedicated upsampling decoder network. Feature extraction from the Vision Mamba encoder further enhances crown feature capture. (Right) Comparison of vision encoder types. (Source: adapted from Zhu et al. (2025) [21]).
Remotesensing 18 00860 g001
Figure 2. Illustration of the OAM-TCD method and the single-tree segmentation dataset (SSD). (a) corresponds to the OAM-TCD dataset, and (b) corresponds to the Single-tree dataset. A color explanation (different colors represent individual tree crown instances).
Remotesensing 18 00860 g002
Figure 3. (a) CrownViM overall architecture. (b) CCViM Block, the core feature encoding module of CrownViM. (c) CCS6 Layer, the central component within the CCViM Block. This layer processes the input feature map through six parallel branches: four branches utilize cross-scanning modules to flatten and traverse the features sequentially along four different directions; the other two branches employ CC Layers to perform feature clustering using four and 25 cluster centers, respectively. The outputs from four specific branches are then chosen and fed into the S6 module. Finally, features from all six branches are combined to produce the output feature map. (d) The CC Layer aggregates feature by considering each local feature block as a collection of feature vectors and clustering them into a predetermined number of centers. (Source: adapted from Zhu et al. (2025) [21]).
Remotesensing 18 00860 g003
Figure 4. The configurations of scanning directions and CC layers with different cluster centers, which vary across stages. We retain Local Mamba’s original configuration while replacing its local scanning mechanism with CC layers. (Source: adapted from Zhu et al. (2025) [21]).
Remotesensing 18 00860 g004
Figure 5. (Left) Computational cost analysis (FLOPs) at varying input resolutions. (Right) Accuracy–complexity trade-off on the SSD. CrownViM demonstrates a superior balance between performance and efficiency, achieving state-of-the-art accuracy (82.49%) with the lowest parameter count (15.6 M) among all compared models. It outperforms heavy-weight baselines like Mask R-CNN and MaskRCNN-Swin while requiring significantly fewer FLOPs.
Remotesensing 18 00860 g005
Figure 6. Comparative results on OAM-TCD. White borders denote undersegmented regions. Red polygons denote automatically delineated individual tree crown boundaries.
Remotesensing 18 00860 g006
Figure 7. Qualitative comparison on the SSD. We compare the proposed CrownViM with the state-of-the-art Mask R-CNN and the widely used YOLOv8-seg.
Remotesensing 18 00860 g007
Figure 8. Comparison of MaskFormer with R50, Swin Transformer, and CCViM encoders in ablation studies on the SSD.
Remotesensing 18 00860 g008
Figure 9. Segmentation heatmap comparison using different encoders on OAM-TCD dataset: (a) input image; (b) ResNet50; (c) Swin Transformer; (d) CCViM (ours). White borders denote undersegmented regions. Brighter colors indicate higher model activation in the corresponding regions.
Remotesensing 18 00860 g009
Figure 10. Generalization results on the OAM-TCD dataset. CrownVim (trained on forest data) transferred to urban vegetation segmentation, validating cross-scene generalization capability. Red polygons denote automatically delineated individual tree crown boundaries.
Remotesensing 18 00860 g010
Figure 11. Performance comparison of ablation variants via heatmap.
Remotesensing 18 00860 g011
Table 1. Computer hardware and software environment.
Hardware
Environment
CPUAMD EPYC 7763
RAM128 G
GPUNVIDIA RTX 4090
Video Memory24 G
Software
Environment
OSUbantu 22.04
CUDA Toolkit 12.2; Python 3.8; Pytorch-GPU 1.8.0
Table 2. Comparison of advanced methods using the OAM-TCD and SSD. The best results are marked in bold.
DataMetricsMaskFormer
-Swim-T
Mask R-CNN
-r50
Mask RCNN
-Swin
Mask2FormerYOLOv8-SegOurs
OAM-TCD
Dataset
Delineation accuracy (%)73.6777.9279.1580.2374.4581.85
Precision (%)79.4388.7585.6284.7880.3287.18
Recall (%)83.7587.2186.4587.1981.6788.40
Dice (%)78.0682.3481.2381.8976.5684.51
FPS12.514.213.815.635.318.7
Single-tree
Dataset
Delineation accuracy (%)71.8375.1776.4277.8974.3382.49
640 × 640FLOPs(G)1051441411127896
Table 3. Comparison of over-segmentation and missed detection counts based on three models: R50, Swin Transformer, and CCViM. The best results are marked in bold.
Total Reference CrownsError TypeResNet50Swin TransformerCrownViM
348Over-segmented433221
Missed1026729
Table 4. Performance comparison of different ablation variants for crown delineation, including Delineation Accuracy, Precision, Recall, and Dice metrics. The best results are highlighted in bold.
Ablation VariantDelineation Accuracy (%)Precision (%)Recall (%)Dice (%)
w/o Horizontal scan80.1286.0587.0283.15
w/o Vertical scan80.4586.3187.4583.46
CC clusters: 4 (reduced)79.8085.5786.8182.53
CC clusters: 25 (increased)81.2386.7287.7583.95
Full supervision loss75.9281.6279.8278.36
Full model 81.8587.1888.4084.51
Disclaimer/Publisher’s Note: The statements, opinions and data contained in all publications are solely those of the individual author(s) and contributor(s) and not of MDPI and/or the editor(s). MDPI and/or the editor(s) disclaim responsibility for any injury to people or property resulting from any ideas, methods, instructions or products referred to in the content.