Article

Two-Phase Forest Damage Assessment with Sentinel-2 NDVI Double Differencing and UAV-Based Segmentation in the Sopron Mountains

1
Institute of Geomatics and Civil Engineering, Faculty of Forestry, University of Sopron, 9400 Sopron, Hungary
2
Institute of Environmental Protection and Nature Conservation, Faculty of Forestry, University of Sopron, 9400 Sopron, Hungary
3
Study Forestry Private Limited Company (TAEG PLC), 9400 Sopron, Hungary
*
Author to whom correspondence should be addressed.
Remote Sens. 2026, 18(5), 803; https://doi.org/10.3390/rs18050803
Submission received: 8 January 2026 / Revised: 2 March 2026 / Accepted: 3 March 2026 / Published: 6 March 2026
(This article belongs to the Section Biogeosciences Remote Sensing)

Highlights

What are the main findings?
  • Sentinel-2 NDVI double-difference mapping reliably detected and delineated both gradual drought-related forest decline and sudden disturbances (e.g., fire), while reducing bias from interannual weather variability and phenological shifts.
  • UAV-based photogrammetry with individual-tree crown segmentation and object-based NDVI analysis validated the satellite signals and quantified damaged trees and their spatial patterns at fine scale—even where RGB imagery did not show damage clearly.
What are the implications of the main findings?
  • Integrating satellite and UAV remote sensing provides an operational, cost-effective, multi-scale forest damage monitoring workflow that supports earlier and better-targeted forest management interventions.
  • Satellite change detection is most sensitive to recent/active damage, while UAV surveys capture detailed impacts and legacy degradation—so combining both improves decision support compared with using either data source alone.

Abstract

Due to climate change, drought periods are becoming more frequent and more intense, posing substantial stress to Central European forest stands, especially climatically sensitive conifer forests. The early detection and accurate spatial delineation of forest damage are essential for supporting adaptive forest management decisions. This study presents a two-tier, multi-step forest damage assessment approach that combines Sentinel-2 satellite-based NDVI double-difference analysis with UAV-based high-resolution photogrammetric evaluation. In the first phase, potential damaged forest patches were identified in two sample areas of the Sopron Mountains using double-difference maps derived from monthly window NDVI maxima calculated from Sentinel-2 data. In the second phase, UAV surveys were carried out over the selected forest compartments, resulting in individual-tree-level canopy segmentation and object-based NDVI analysis. The photogrammetric point clouds were combined with ground points derived from airborne laser scanning to enable the accurate generation of canopy height models. The results confirmed that NDVI double-difference analysis is suitable for the spatial detection of both gradual drought-related damage and sudden disturbances—such as forest fire—even under sequences of drought and moderate years occurring in a sporadic pattern. The UAV-based analysis corroborated the satellite observations in detail and enabled an accurate inventory of damaged trees as well as the exploration of their spatial distribution. The proposed methodology provides an efficient, cost-effective, and operational tool for multi-scale monitoring of forest damage, contributing to the timely recognition of climate-change impacts and to the substantiation of targeted forest management interventions.

1. Introduction

Over the past decades, climate change has become one of the most significant global challenges facing forest ecosystems. Rising temperatures, shifts in precipitation patterns, and extreme weather events—such as droughts, heatwaves, and storms—have become more frequent and more intense, placing considerable stress on forests. These impacts not only reduce forest vitality and carbon sequestration capacity but also promote the proliferation of pests and pathogens, which can lead to large-scale forest damage.
Hungarian forests are particularly sensitive to the effects of climate change, as the country lies at the intersection of continental, Atlantic, and Mediterranean climatic influences. In recent years, more frequent and prolonged drought periods, together with declining soil moisture, have had adverse effects on non-native and climatically sensitive tree species. As a result, forest health is deteriorating, with increasing defoliation, premature dieback, and a heightened risk of mass mortality.
The forests of the Sopron Mountains provide a prominent example of these processes. Norway spruce stands and Scots pine forests, which occur in substantial proportions in the region, have been exposed to continuous and increasingly severe damage events in recent years. The combined effects of precipitation deficits, high summer temperatures, and secondary damaging agents have led to rapid stand decline. The accurate and timely assessment of such damage is essential for forest management decisions, damage mitigation measures, and the development of long-term adaptation strategies.
Remote sensing technologies, especially the combined use of Sentinel-2 satellite imagery and UAV surveys, offer new opportunities for objective and cost-effective assessments of forest conditions. Satellite data provide regular temporal coverage, while UAV-based surveys, owing to their high spatial resolution, enable detailed, individual-tree-level damage analysis. The aim of this study is to present the possibilities and advantages of integrating these two data sources into forest damage assessment, with a particular focus on conifer stands in the Sopron Mountains, thereby contributing to a better understanding of climate-change impacts and to the development of proactive forest management practices.

1.1. Satellite-Based Forest Monitoring

Satellite-based forest observation is one of the most important application areas of remote sensing, enabling the monitoring of forest condition and its temporal changes through regularly repeated acquisitions. Its main advantages are wide-area coverage and high temporal resolution, which make it particularly suitable for the early detection of various damage events—such as forest decline, drought impacts, or fire damage. The classical data source for long-term forest dynamics studies is the Landsat satellite program, whose multi-decadal time series has enabled analyses of forest changes at a global scale [1]. In recent years, the European Space Agency’s Sentinel-2 satellites have become decisive in operational forest monitoring, thanks to their 10–20 m spatial resolution and short revisit time, which support detailed vegetation-index-based analyses [2].
In satellite-based forest monitoring, vegetation indices are frequently used to characterize forest condition. By combining different spectral bands, these indices describe vegetation vitality and stress status. The most widely used index is the Normalized Difference Vegetation Index (NDVI), which is based on the difference in reflectance between the red and near-infrared bands and effectively indicates the amount of photosynthetically active biomass; therefore, it is a fundamental tool for monitoring forest cover and health status [3]. The Enhanced Vegetation Index (EVI) is an improved version of NDVI that better corrects for soil and atmospheric effects, providing more reliable results particularly in closed-canopy forests [3]. In recent years, increasing attention has been given to the Normalized Difference Red Edge Index (NDRE), which uses the red-edge and near-infrared (NIR) bands and is more stable with respect to stand-structure parameters [4].
Time-series analyses play a key role in forestry monitoring because they allow continuous tracking of stand condition and help distinguish sudden from gradual changes. By examining long time series of vegetation indices, damage events such as drought, insect outbreaks, or forest fires can be delineated objectively and also well constrained in time. One of the most widely used methods is the Breaks for Additive Season and Trend (BFAST) algorithm, which separates seasonal and trend components to automatically detect breakpoints, and has been successfully applied, for example, in studies of subtropical forests [5]. In recent years, the cloud-based Google Earth Engine (GEE) processing environment has greatly facilitated time-series forest monitoring by providing global satellite archives and high computational capacity; using this platform, numerous international studies have implemented large-area, operational forest-change analyses based on Sentinel-2 and Landsat data [6,7,8].
Among operational forest monitoring systems built on satellite data, Global Forest Watch can be highlighted at the global level, providing information on forest cover change and forest degradation using Landsat-based time-series analyses [9]. In Europe, relatively few similarly unified, publicly accessible systems exist; these include the German ForestWatch, which supports nationwide monitoring of forest damage and condition changes using Sentinel-2 and Landsat data [10]. Similar systems can also be found in Slovakia [11], the Czech Republic [12], Slovenia [13], and Norway [14].
In Hungary, TEMRE (Remote Sensing-based Forest Monitoring System) is a nationwide satellite-based forest monitoring platform that primarily uses Moderate Resolution Imaging Spectroradiometer (MODIS) and Sentinel-2 data to track temporal changes in forest health status. The system is based on time-series vegetation indices—primarily NDVI—which are suitable for the spatial and temporal assessment of forest vitality and stress status [15,16].

1.2. Aerial Photogrammetry

In aerial photogrammetry, images are acquired by an optical sensor mounted on an airborne platform—nowadays most commonly a UAV—typically in the RGB range, and in some cases complemented with additional spectral channels. The drone captures overlapping images along a predefined flight path with predefined flight parameters, from which point clouds, surface models, and orthomosaics can be generated. Geometric resolution is determined by flight altitude and camera specifications (sensor size, pixel size, focal length), while image overlap strongly influences flight time and the quality of image orientation.
Image alignment and orientation are ensured by image matching, which automatically searches for corresponding features between overlapping images [17]. Several modern approaches build on this, including SIFT (Scale-Invariant Feature Transform), SURF (Speeded-Up Robust Features), ORB (Oriented FAST and Rotated BRIEF) [18], SGM (Semi-Global Matching) [19], MVS (Multi-View Stereo) [20], and SfM (Structure-from-Motion) [21]. With the widespread adoption of affordable drone technology, SfM has become one of the most commonly applied procedures, including in forestry practice. One key advantage is that it does not require a pre-calibrated camera, so imagery from simple, non-professional devices can also be processed with measurement-grade accuracy [22]. Harwin et al. [23] also showed that SfM can yield even more accurate results in cases where certain calibration parameters are available in advance; this finding is particularly relevant when, in addition to nadir images, oblique imagery is also collected.
According to Dhruva et al. [24], for forestry applications a flight altitude of 120 m and 90%/85% along-track and cross-track overlap provide the best results; although a lower altitude of 80 m improves spatial resolution, it increases the risk of modeling errors. Mapping typically relies on nadir (vertical) images, but Sadeq [25] demonstrated that the inclusion of oblique imagery improves model reliability. Ahmed et al. [26] likewise observed a substantial increase in accuracy when combining nadir images with 70° oblique images, especially when the directions of the two flight plans are perpendicular to each other.
From a forestry perspective, aerial photogrammetry is used for the direct measurement of tree height [27,28,29] and crown diameter [30,31,32], for the statistical estimation of diameter at breast height (DBH) [33,34] and tree volume [35], and for terrain mapping [36,37]. All of these applications require the identification of individual trees, which is typically achieved through crown segmentation. According to Lei et al. [38], the methods applied for this purpose can be grouped into two main categories: approaches based on digital surface models (DSM) or canopy height models (CHM), and point-cloud-based approaches. CHM/DSM-based methods generally combine image-processing techniques to delineate crowns, such as inverse watershed segmentation [30,39], object-oriented multilevel segmentation [40], morphological reconstruction [41], or voxel aggregation-based segmentation [27,42,43]. Miraki et al. [44] compared three marker-controlled approaches (inverse watershed, local maxima, region growing), among which region growing performed best. Hosingholizade et al. [45] also applied a marker-controlled approach and compared it with k-means and convolutional neural network methods; in that study as well, the latter produced the most accurate results.
Another, more recent aspect of forestry applications is forest health assessment. This requires multispectral sensors capable of recording the spectral characteristics of individual trees beyond the visible range. According to Dash et al. [46], physiological stress can be detected already at an early stage using the red-edge band, and even earlier using the near-infrared band. Based on the review by Manase et al. [47], UAV-based solutions—with their high-resolution imagery and flexible deployment—are effective tools for the early detection of abiotic stressors (e.g., drought, fire) and biotic damaging agents. Ecke et al. [48] point out that, despite progress in UAV-based forest health studies, multi-temporal investigations are still lacking; hyperspectral and LiDAR data collection remains underrepresented; the integration of different remote-sensing sources is insufficient; standardized processing workflows are missing; complex machine-learning models often limit interpretability; and workflows frequently rely on commercial software. The same assessments also emphasize that current applications make limited use of combinations of different methods; nevertheless, relevant studies do exist. For example, Dash et al. [49] combined UAV-based multispectral imagery with satellite remote-sensing data: owing to their finer spatial resolution, UAV data can indicate changes at the level of individual trees, whereas satellite imagery is suitable for observing patterns at broader scales; when combined with appropriate vegetation indices, the two data sources offer an effective multi-scale monitoring solution. Fraser and Congalton [50] achieved an accuracy of around 71% in classifying the health status of broadleaf and conifer trees using random forest and support vector machine (SVM) approaches and likewise emphasized that combining remotely sensed data from multiple sources could further improve this performance.

2. Materials and Methods

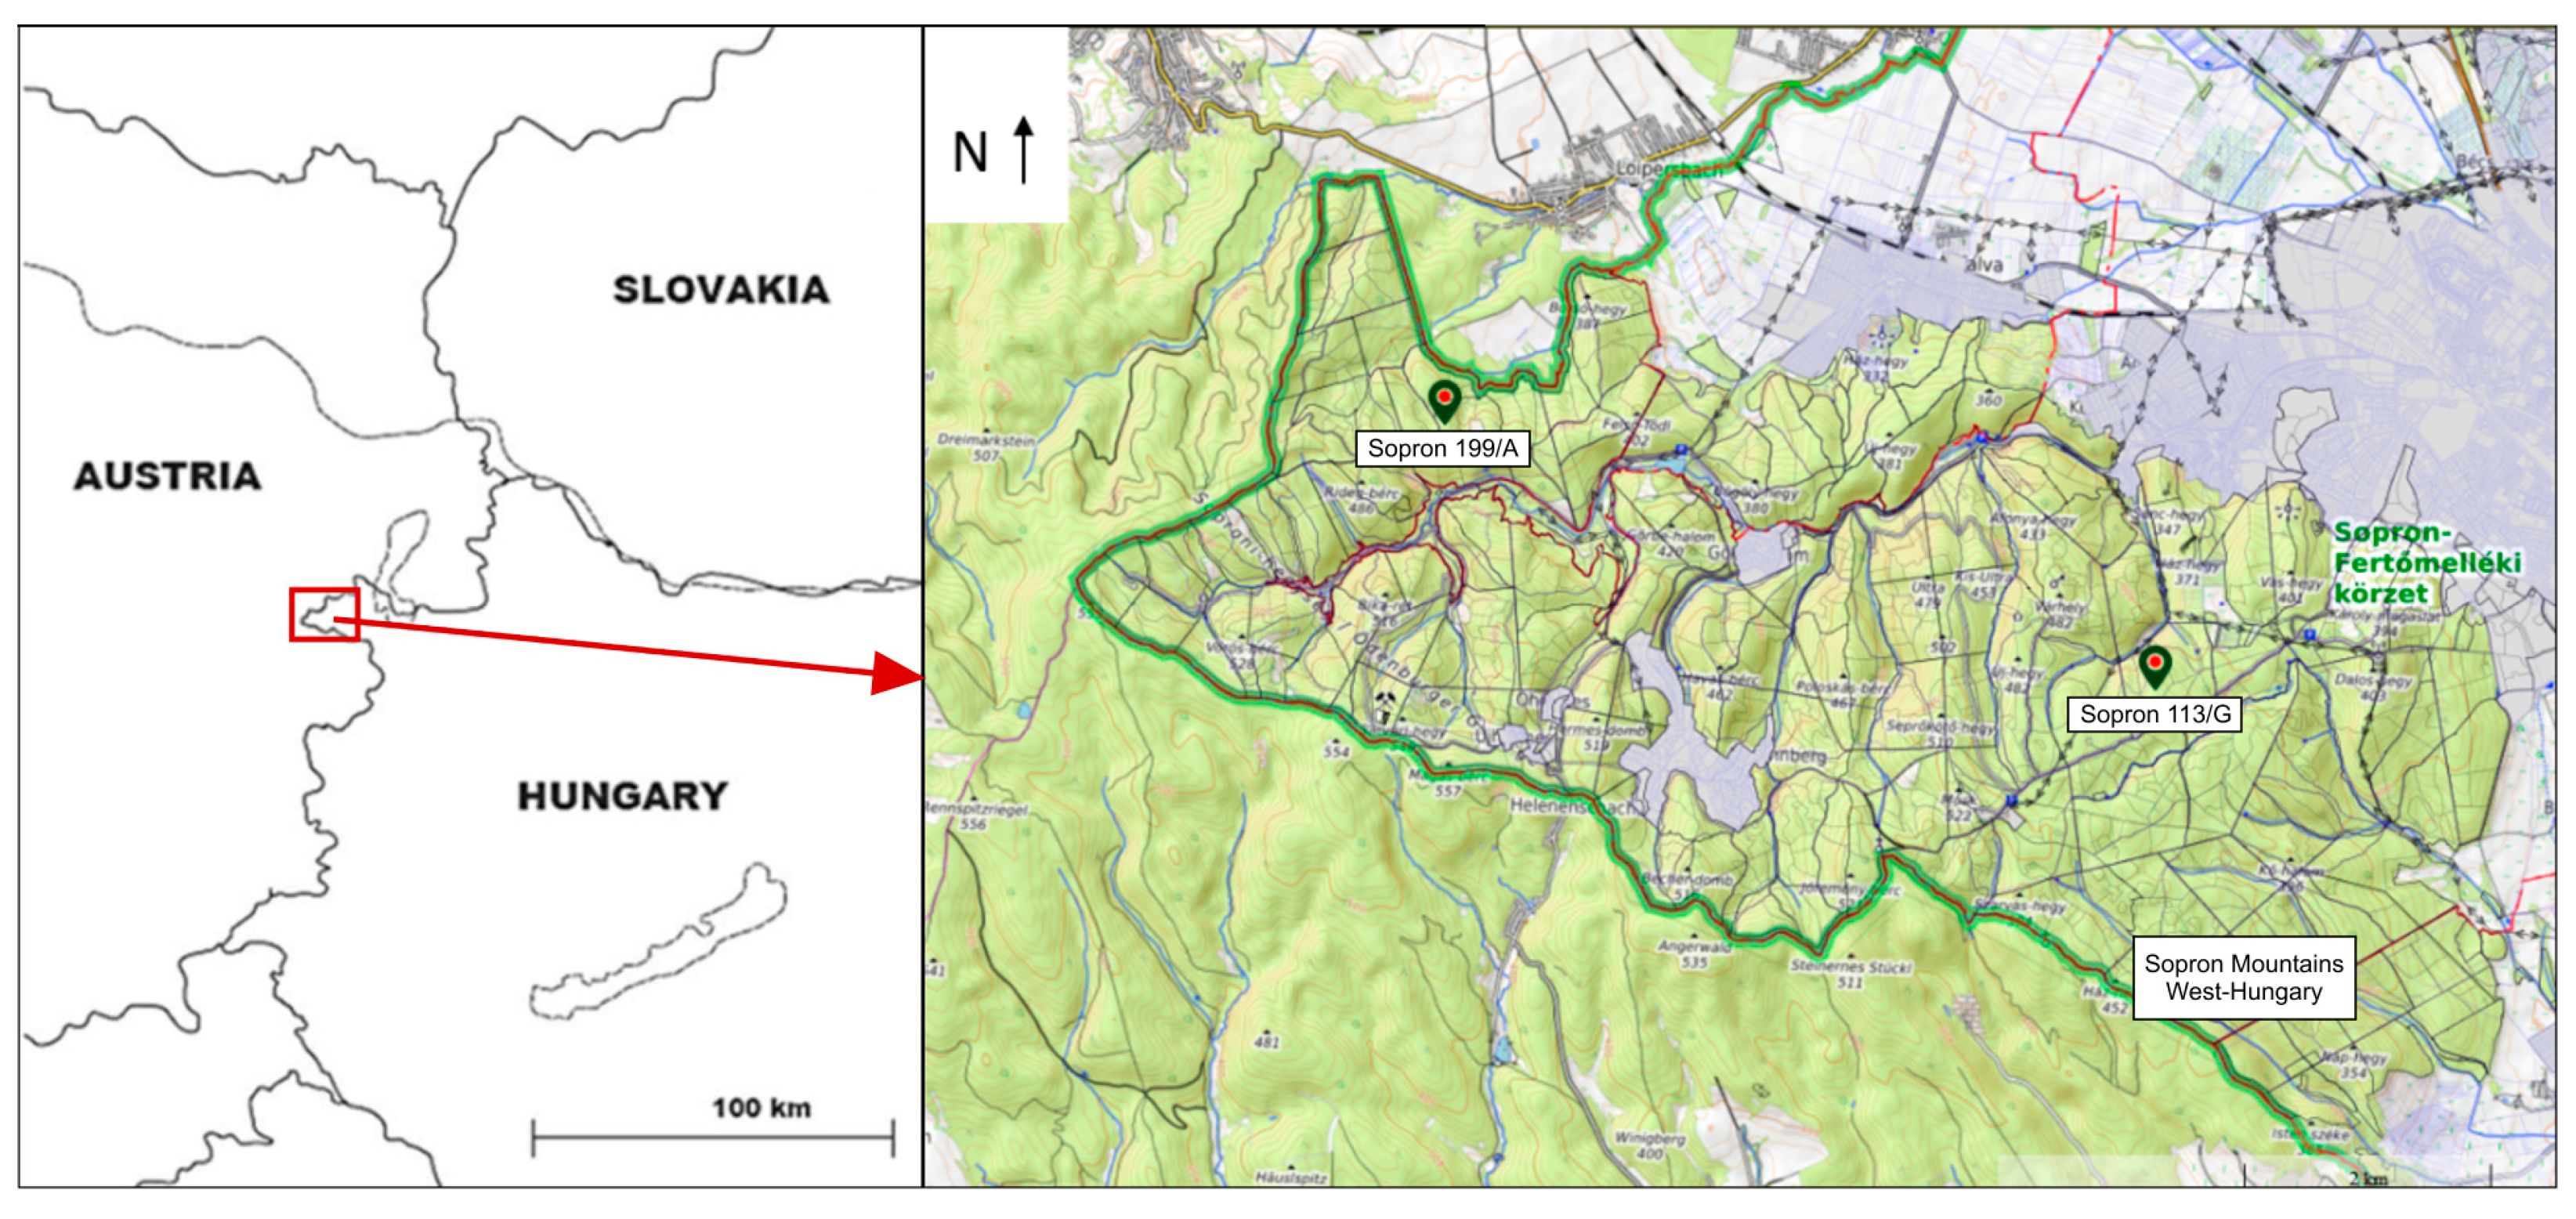
The study areas are located in western Hungary within the territory of the Study Forestry PLC, specifically in the Sopron Mountains (Figure 1). This region lies on the western margin of Hungary, in an area that forms the eastern extension of the Austrian Alps. The Hungarian part of the mountain range covers approximately 45 km2 and is typically situated at elevations of 250–550 m above sea level. From a geomorphological perspective, the area is characterized by a crystalline basement relief, with steep valleys and slopes and gently undulating plateaus. The bedrock consists mainly of gneiss and mica schist, which strongly influence landform stability and the types of slope processes.
Land cover is dominated by closed-canopy forest (85%), primarily oak, beech, and conifer stands, which are spectrally well distinguishable from smaller agricultural areas and built-up surfaces (e.g., around Sopron and Ágfalva). Overall, the Hungarian part of the Sopron Mountains is characterized by near-natural land cover and well-structured, readily interpretable yet diverse topographic conditions, providing valuable information for research in forest management and nature conservation.
Within the study area, two forest compartments were selected for the case study:
  • Sopron 199/A
In the northwestern part of the Sopron Mountains, the rock-outcrop-free area is characterized by a podzolic brown forest soil developed on gneiss bedrock. It is a north-facing hillside with variable aspects and slopes. The compartment covers 2.16 ha. According to a plot-based, stem-level volume estimation record, a total of 1674 stems were recorded in the compartment. The stand is dominated by a 50-year-old Norway spruce (Picea abies) at 65%, with scattered admixture of European beech (Fagus sylvatica) at 25%. Canopy closure in the upper layer is uneven but averages about 90%. In areas with gaps in canopy closure, a second canopy layer occurs. Additional species occur sporadically in the second layer (total admixture ca. 10%), including sweet chestnut (Castanea sativa), small-leaved lime (Tilia cordata), and hornbeam (Carpinus betulus); in the upper layer, sessile oak (Quercus petraea), European larch (Larix decidua), and Turkey oak (Quercus cerris) are also present. The ground layer is largely bare (“nudum”), with a patchy regeneration layer of beech and hornbeam covering about 30%. Tree height in the upper canopy layer is 22–25 m, while the second layer reaches 15–18 m. No shrub layer is present. A larger-scale damage event was detected by the forest manager in the summer of 2025, and salvage operations were carried out in August 2025, while leaving standing, stable broadleaved individuals. Following site cleaning after harvesting, the area is being reforested with beech as the target stand type.
  • Sopron 113/G
This compartment has highly variable aspects, slopes, and terrain conditions. The site is characterized by shallow, acidic brown forest soil. It covers 8.56 ha; stand age is 76 years, and the upper canopy layer is on average 17–18 m tall. The main stand is Scots pine (Pinus sylvestris) at approximately 60%, with patches of sessile oak (Quercus petraea) in compact groups (30%). Canopy closure in the upper layer is uneven, averaging about 85%. Additional admixed species occurring individually include sweet chestnut (Castanea sativa), Norway spruce (Picea abies), European beech (Fagus sylvatica), hornbeam (Carpinus betulus), black pine (Pinus nigra subsp. laricio), silver birch (Betula pendula), and silver fir (Abies alba). The shrub layer is negligible, with about 20% cover; it includes sweet chestnut (Castanea sativa), silver fir (Abies alba), and hornbeam (Carpinus betulus). In the herb layer, bilberry (Vaccinium sp.) occurs. On 11 April 2025, a litter fire of unknown cause affected nearly 2.00 ha. After suppression, damaged and dead individuals were removed in autumn 2025 by the forest manager in a selective (single-tree) manner.
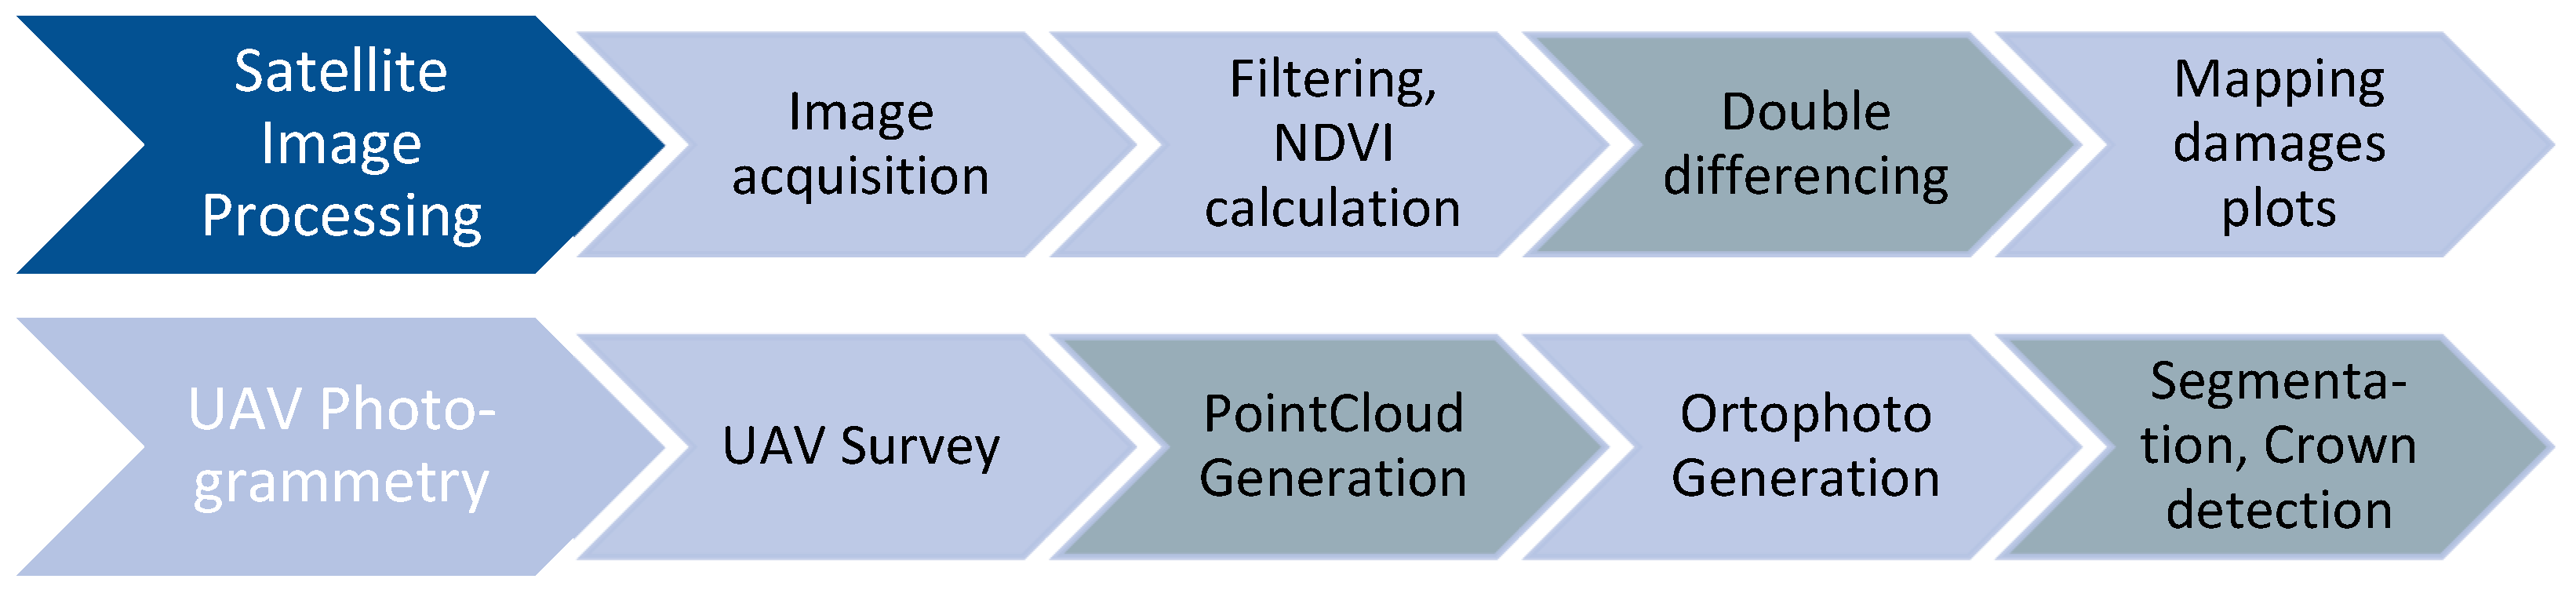
Our forest damage assessment methodology can be divided into two main components: a satellite phase and a UAV phase (Figure 2). The first phase supports continuous observation and early detection. In this phase, Sentinel-2 imagery covering the area is downloaded, cloudy pixels are filtered out, the normalized vegetation index (NDVI) is calculated, and the current observations are compared with imagery from a preceding period (previous week, month, or year) to map damaged patches.
The second phase focuses on the precise assessment of damaged forest compartments identified during the satellite analysis, producing an individual-tree-level map. Following UAV data acquisition, the photogrammetric workflow generates both a point cloud and an orthomosaic via image matching. The photogrammetric point cloud describing the vegetated surface is combined with an airborne laser scanning (ALS) terrain point cloud. The resulting point cloud is then segmented to delineate individual-tree crown segments, and pixel values from the orthomosaic are aggregated within the segment polygons.

2.1. Satellite Processing

To enable the early identification of forest damage, we use Sentinel-2 (L2A) satellite imagery. The first step of the satellite-based processing is to download the most recent tiles covering the study area. This is followed by the filtering of cloudy and shadowed pixels, for which we developed a custom, classification-based mask. We then compute the Normalized Difference Vegetation Index (NDVI) for the images within the selected time window and store the maximum NDVI value for that period. The time window can be 1 week, 2 weeks, or 1 month; for the research presented in this paper, we selected a 1-month window. The resulting image values are then compared to those from a preceding reference period. This reference period can also be defined in multiple ways (e.g., the previous week, month, or year). In this paper, we compared the current period to the same period of the previous year. For image comparison and mapping NDVI changes, we did not use a simple difference, nor the normalized deviation from the mean NDVI [51] but instead applied a double-difference approach [52].
We calculate the NDVI double difference (DD) on a pixel-by-pixel basis between the cloud-masked images containing the period-maximum NDVI values using the following equation:
DD = (NDVIact − NDVIactPerc) − (NDVIlast − NDVIlastPerc)
where:
NDVIact: NDVI value of the current image,
NDVIactPerc: interpolated value of the 85th percentile of the NDVI pixel block values of the current image,
NDVIlast: NDVI value of the previous image,
NDVIlastPerc: interpolated value of the 85th percentile of the NDVI pixel block values of the previous image.
In the procedure, pixel block values are computed as follows: within each 128 × 128 pixel block the 85th percentile of NDVI values is selected, considering only pixels where the NDVI value is greater than 0.5. If all values are lower, the resulting value for the block is set to 0.5. The values obtained in this way are interpolated using cubic convolution. At the image boundaries, only the pixels within the image are used. The 85th percentile is an experimental value based on previously processed image tiles of Hungary; using mean or maximum value produced biased results.
The double-difference approach handles differences between successive wet and drought years, as well as change mapping across consecutive drought years, and it also accounts for shifts in phenological timing (e.g., late leaf-out, early leaf coloration). It relates damaged forest areas not only to the preceding period but also to the surrounding forest areas.
Satellite-based processing involves multiple steps and requires substantial computation, and it is advisable to publish the results in a web environment. Therefore, we developed a dedicated software package for this purpose, consisting of three components. The first is a Python (v3.14) module that automatically downloads imagery for each time period. The second is an image-processing software written in C++ (v14) that also tiles the resulting output images. The third component is a web-based visualization application that foresters responsible for operational tasks can use daily. The application is called EVELIN (v3.0), an acronym derived from the Hungarian words for forest damage monitoring.

2.2. UAV Photogrammetry

UAV flights were carried out in early July over the two damaged forest areas using a DJI Mavic 3M drone. Flight altitude was 100 m. Forward image overlap was 70% and side overlap was 60%. Terrain following was implemented using the RealTimeFollow mode.
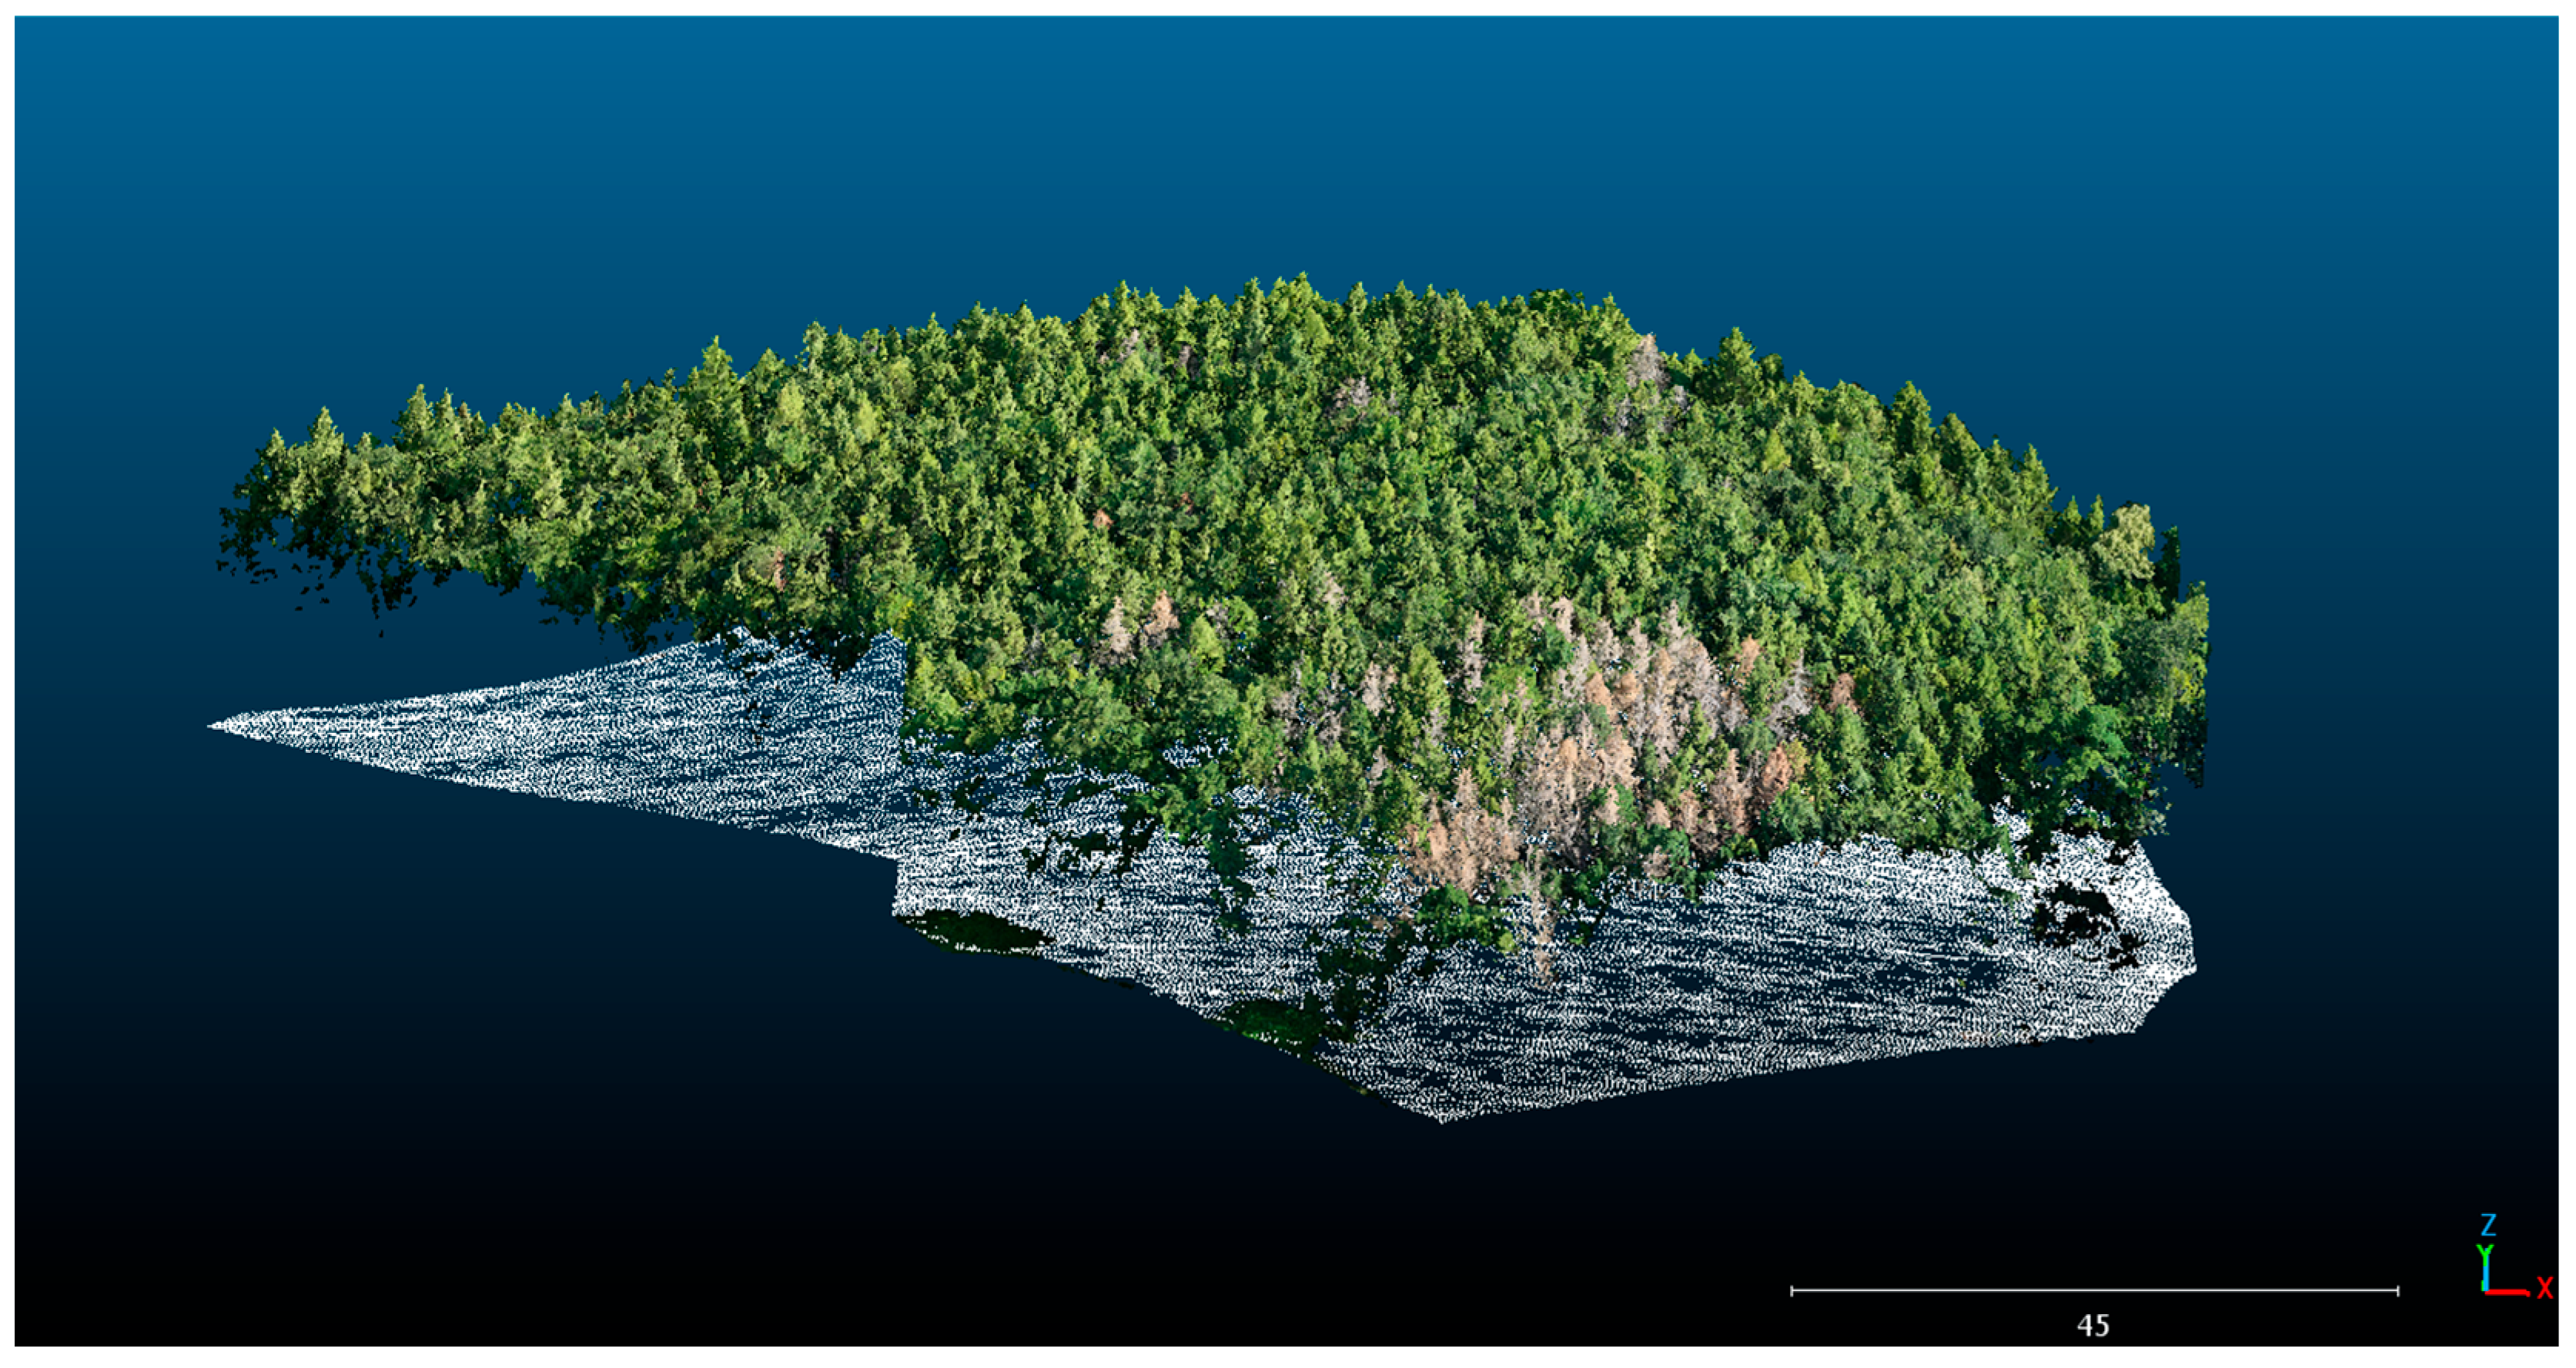
The first segmentation was performed in forest compartment 199/A. A point cloud was generated from the RGB UAV imagery using DJI Terra (v4.2.5, DJI Technology Co., Ltd., Shenzhen, China) with an SfM algorithm. Because the point cloud derived from the image-matching workflow contained no ground points due to the dense canopy, ground points from a previous ALS survey were used [27]. From the ALS survey, we used only the already classified ground points. UAV image matching ground points were vertically aligned to the DEM derived from ALS point cloud. The two point clouds were merged in CloudCompare (v2.13.0, GNU GPL) (Figure 3).
From the UAV point cloud, we generated a digital surface model (DSM), and from the ALS point cloud a digital terrain model (DTM); their difference was used to derive a canopy height model (CHM). This CHM served as the basis for crown segmentation. The accuracy of the CHM, given the instruments and software used, is 3 dm [27]. Segmentation was produced in several variants. The first segmentation was performed using inverse watershed method in topoXmap v1.23.7.27 (TopoLynx Ltd., Kőszeg, Hungary) with the following parameters: Gaussian smoothing = 2; search radius = 20; local-maximum threshold = 10. Subsequently, two additional crown-separation approaches were tested on the merged point cloud using TreeDetect v1.25.9.29 (TopoLynx Ltd., Kőszeg, Hungary): a voxel aggregation method and a new hybrid algorithm with radii of 2 and 2.5 m. The new algorithm adds the vertical extent of the crown to the crown surface. This hybrid method helps to better separate adjacent or suppressed crowns and is particularly advantageous in broadleaved stands.
The segmentation outputs were compared, and the best-performing solution compared to ALS based segmentations was used for further analyses. For forest compartment 113/G, the hybrid algorithm of TreeDetect—shown to perform well in earlier tests—was applied with a radius of 3.5 m.
RGB and multispectral orthomosaics were generated in DJI Terra. The imagery was projected in UTM 33N. Ground sampling distance was reduced to 10 cm/pixel to facilitate handling and processing of the datasets. Achieving the native spatial resolution would have required a flight altitude that, under current Hungarian regulations, would not have allowed operation in the open category.
Using the bands of the multispectral ortho mosaic, NDVI maps were produced. The RGB orthomosaic was used to mask shaded pixels based on a brightness index (Brightness < 0.2). For compartment Sopron 113/G, an additional mask based on the CHM was applied (CHM > 1) due to lower canopy closure (<85%), which also helped to exclude potential soil pixels. From the masked NDVI raster, zonal statistics were computed for the crown segments, excluding shaded pixels located in the lower part of the canopy. These pixels would otherwise have reduced the mean NDVI values of the crown segments. We also calculated the mean NDVI and standard deviation of the detected crowns within each compartment. We calibrated the NDVI threshold using a grid search to minimize the sum of false and missed detections. The mean—1 × standard deviation was used as the NDVI threshold to separate healthy and damaged trees.
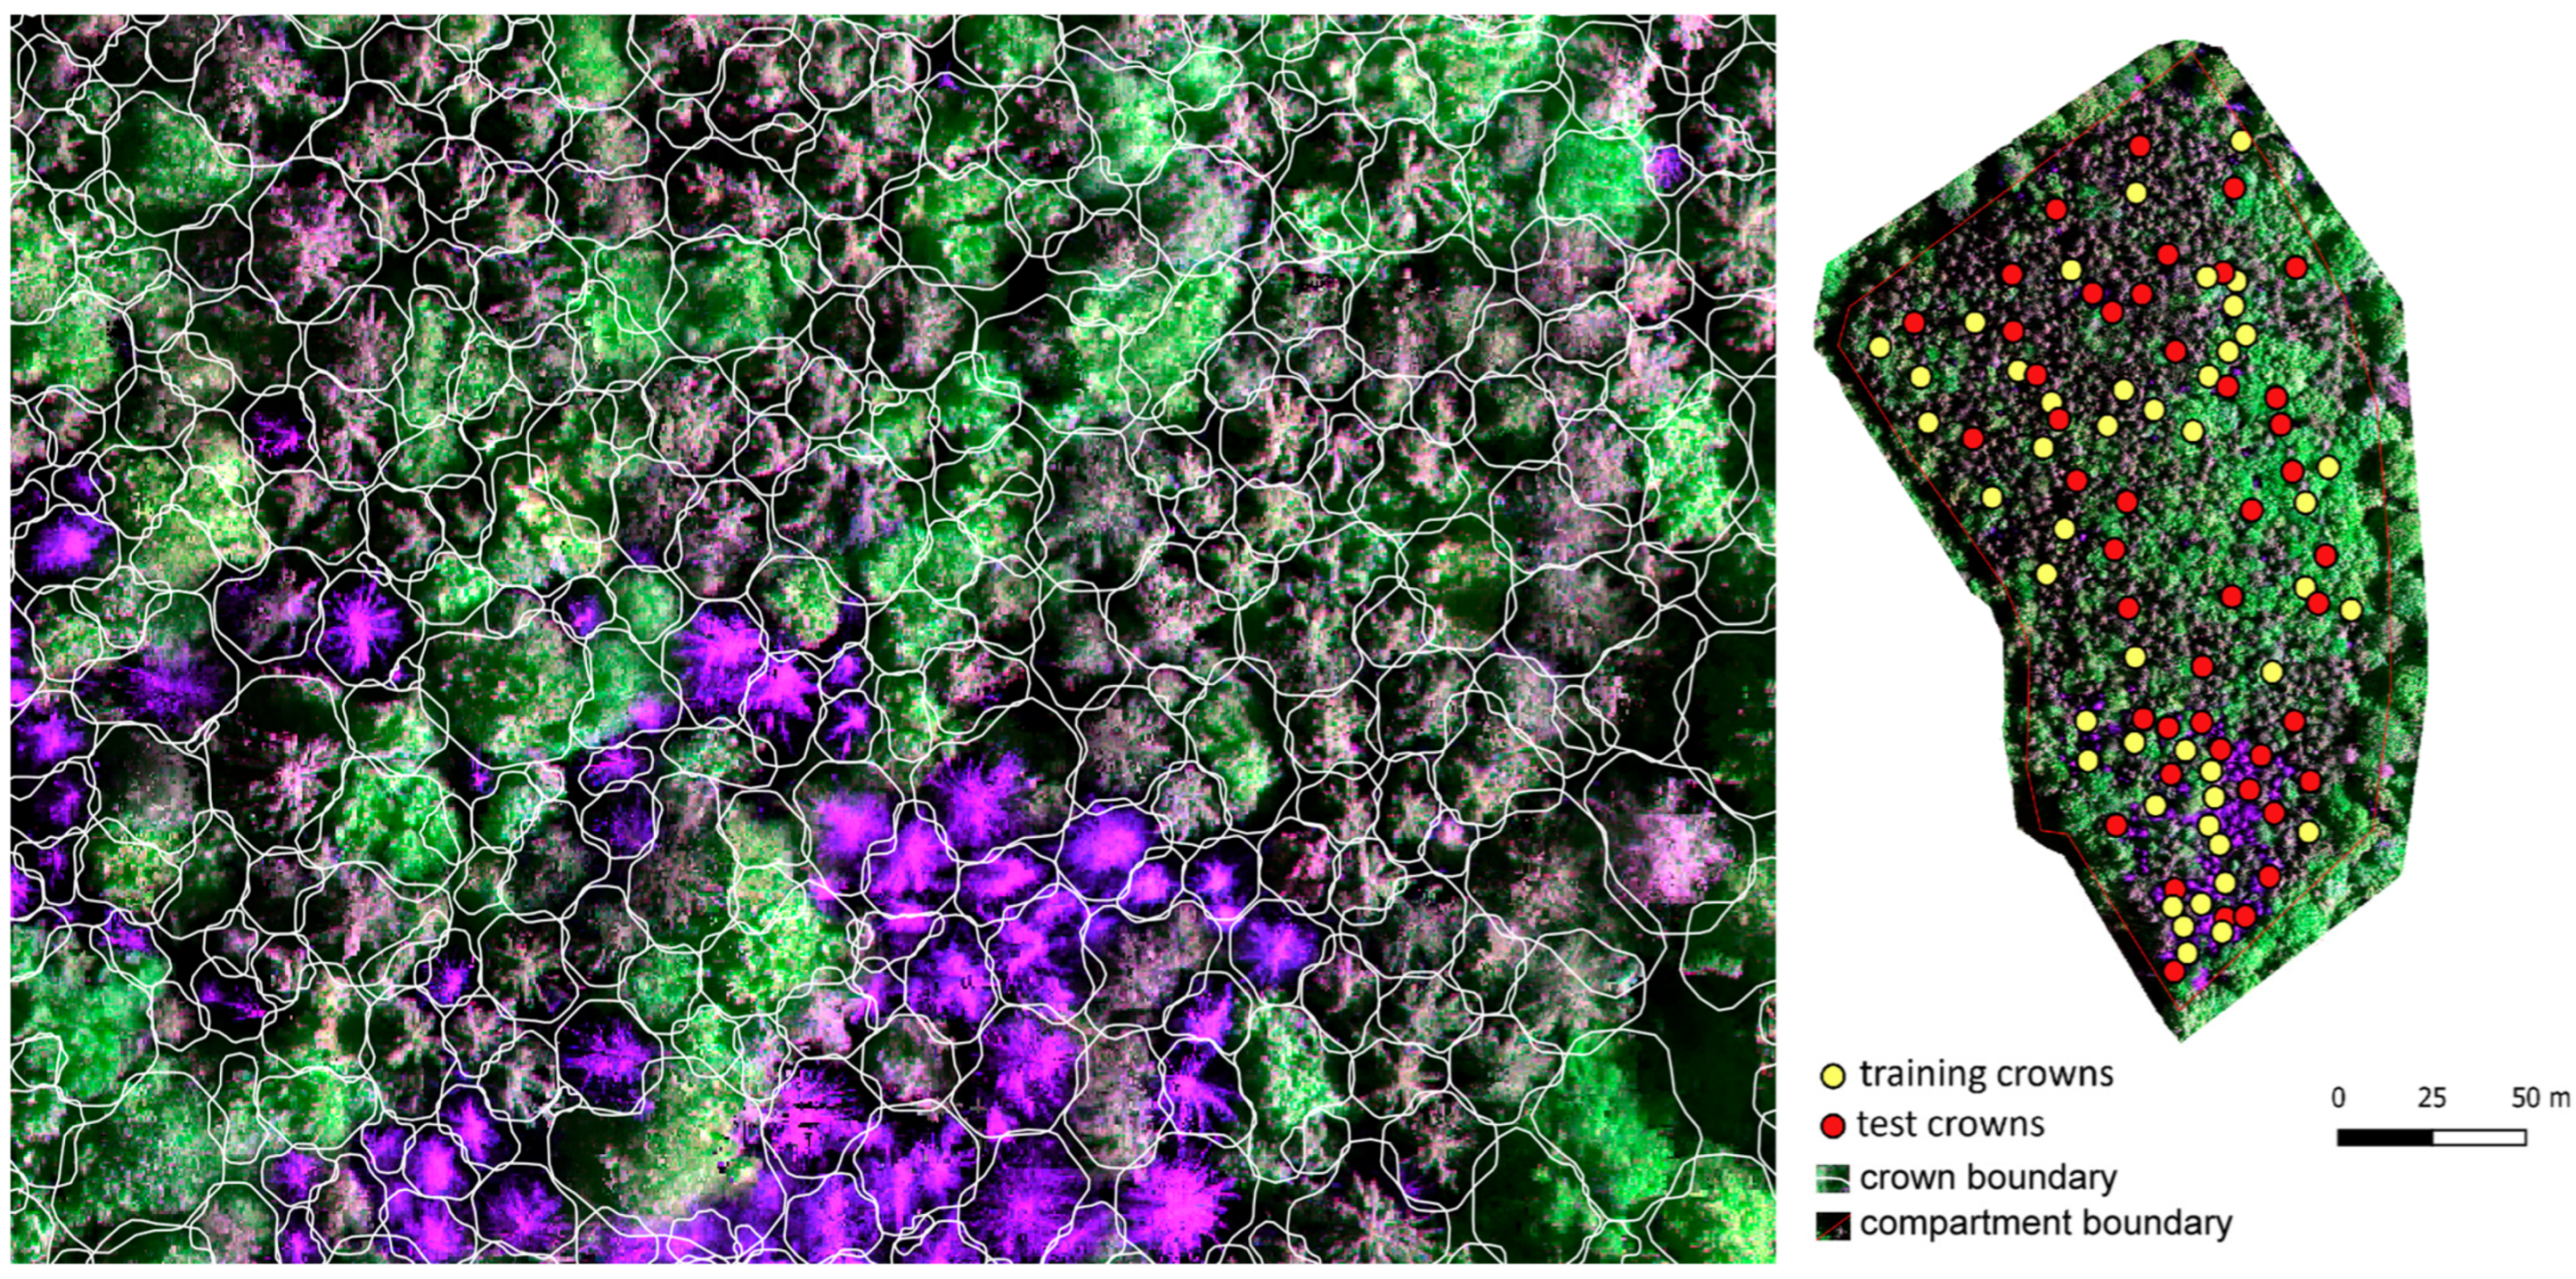
Supervised object-based image classification was conducted only for forest compartment Sopron 199/A. Based on the previous segmentation and the RGB and multispectral orthomosaics, we visually selected 90 crowns, comprising 30 conifers, 30 broadleaved trees, and 30 dead trees (Figure 4). The selected objects were split into training and test sets (50–50%), with 45 objects per class in each set.
Object-based classification was carried out using the Orfeo Toolbox tools in QGIS (v3.0.3, CSGroup and CNES). As input features, we used brightness-masked multispectral bands, as well as brightness-masked derived layers of NDVI, NDRE, and GNDVI. Two supervised classifiers were applied: Random Forest (RF) (maximum depth of trees: 5, minimum number of samples in each node: 10, maximum number of trees in forest: 100) and Support Vector Machine (SVM) (Kernel type: linear). By comparing the performance of different band combinations and algorithms, we identified the best classification configuration.


3. Results

3.1. Satellite Image Analysis

During the satellite-based analysis of forest compartment Sopron 199/A, we focused on the month of the UAV survey. We determined the NDVI values for the examined month and for the same month in the previous year, and we also generated an RGB composite in the visible range. We then calculated the NDVI double difference for the study period.
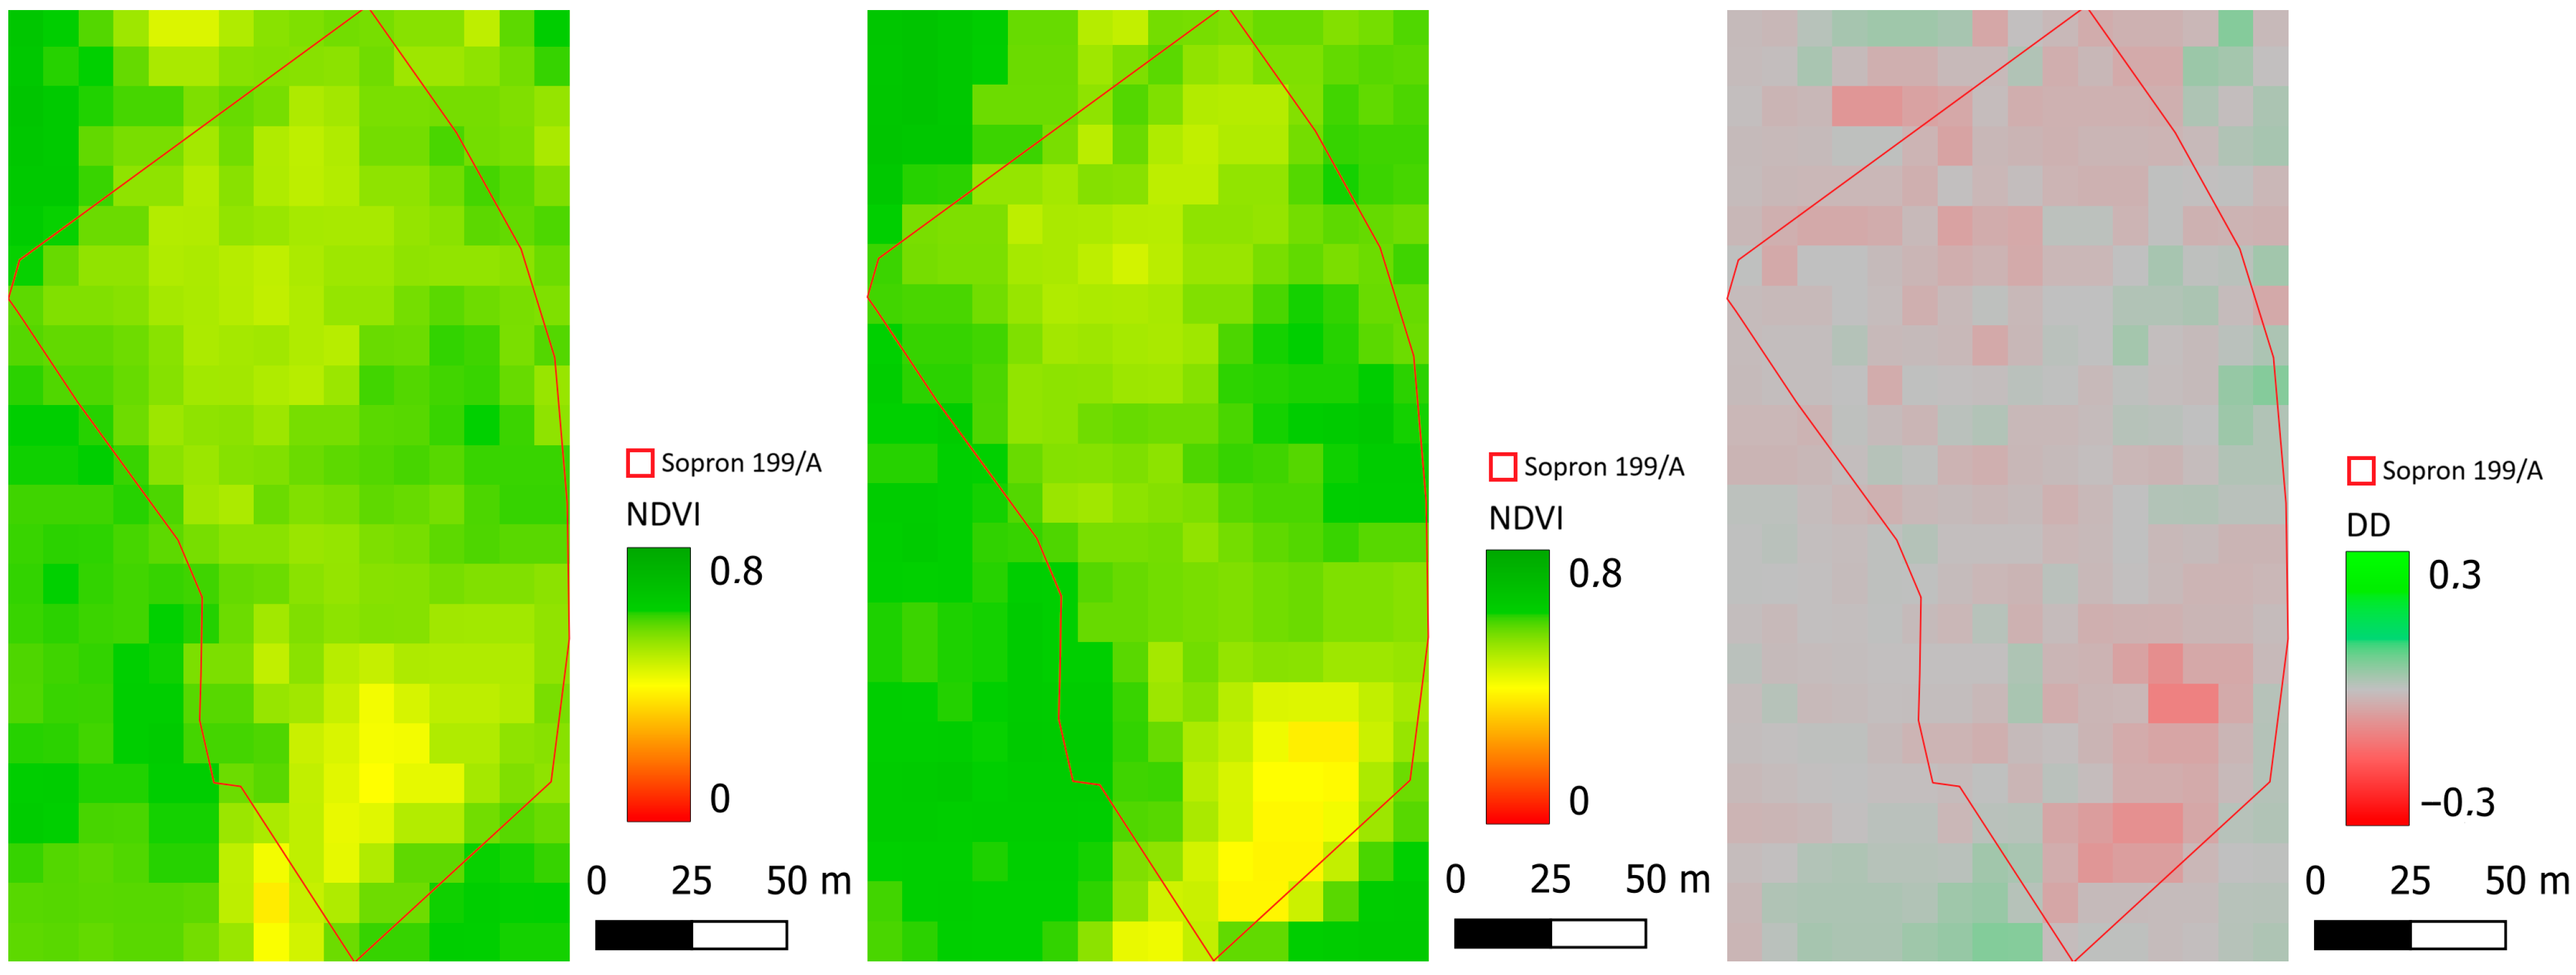
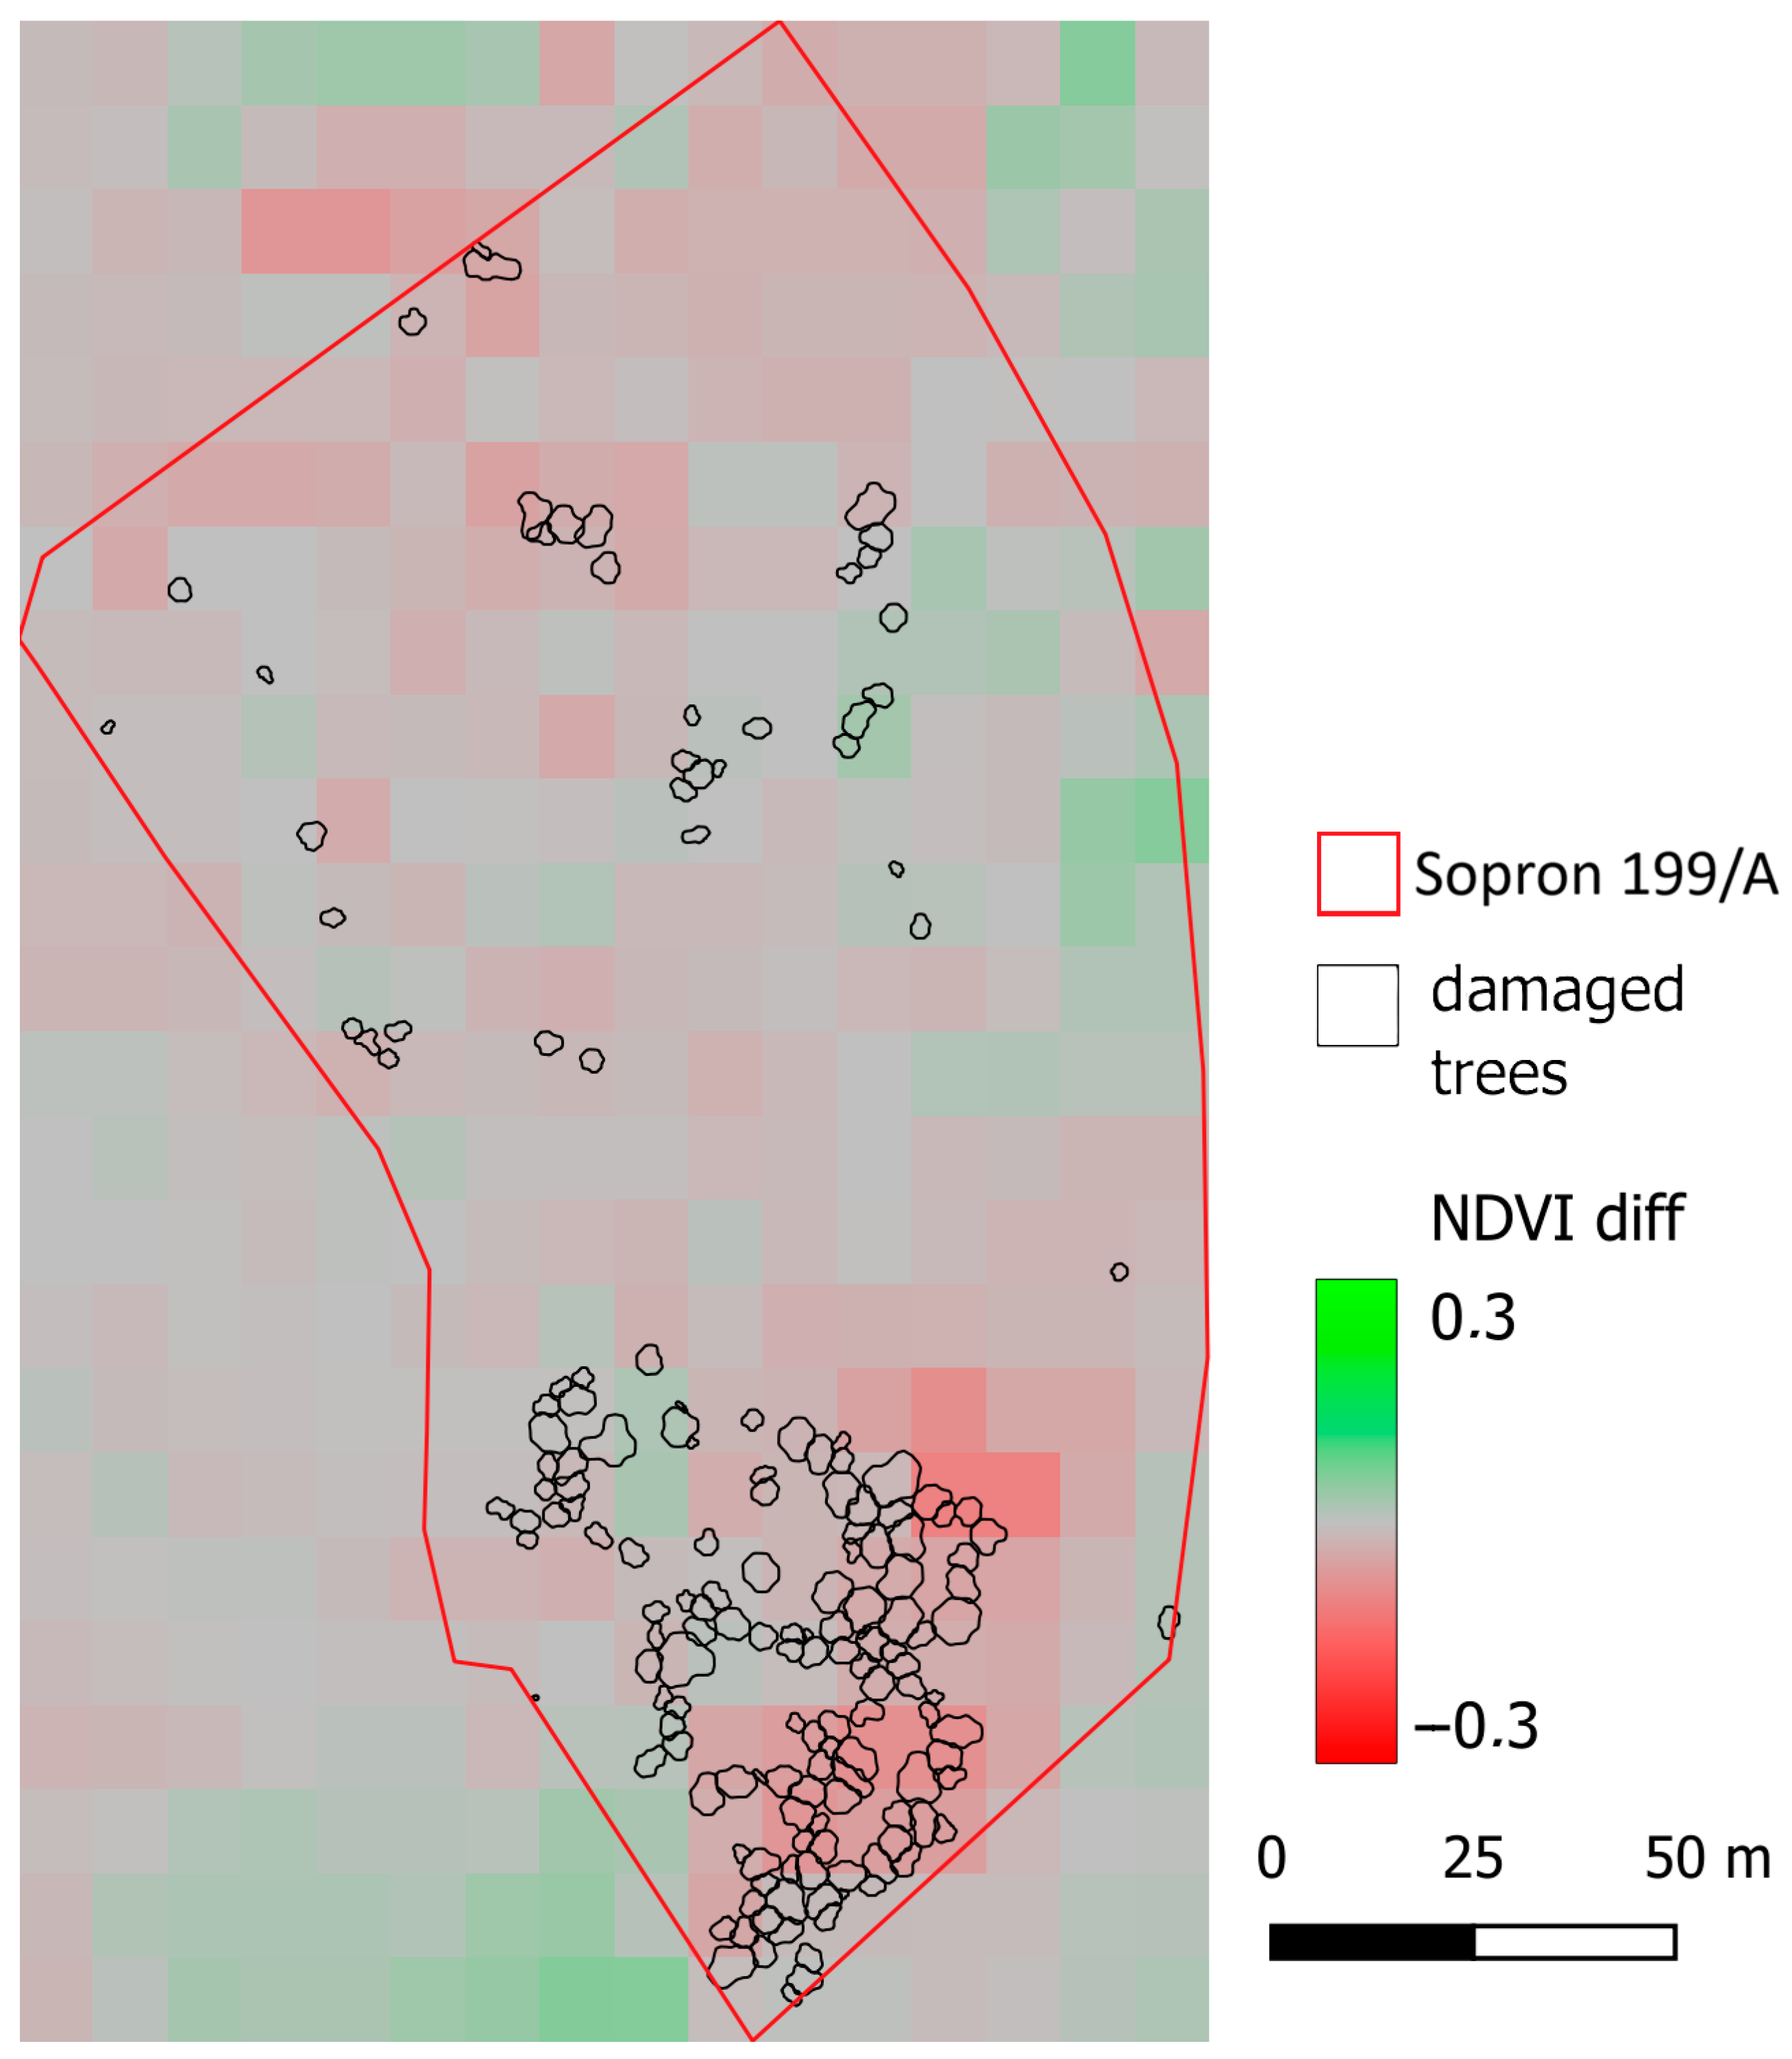
The double-difference maps indicated that, compared to the previous year, additional dieback occurred in compartment Sopron 199/A, primarily in its southern part and, to a lesser extent, also in the northern areas (Figure 5).
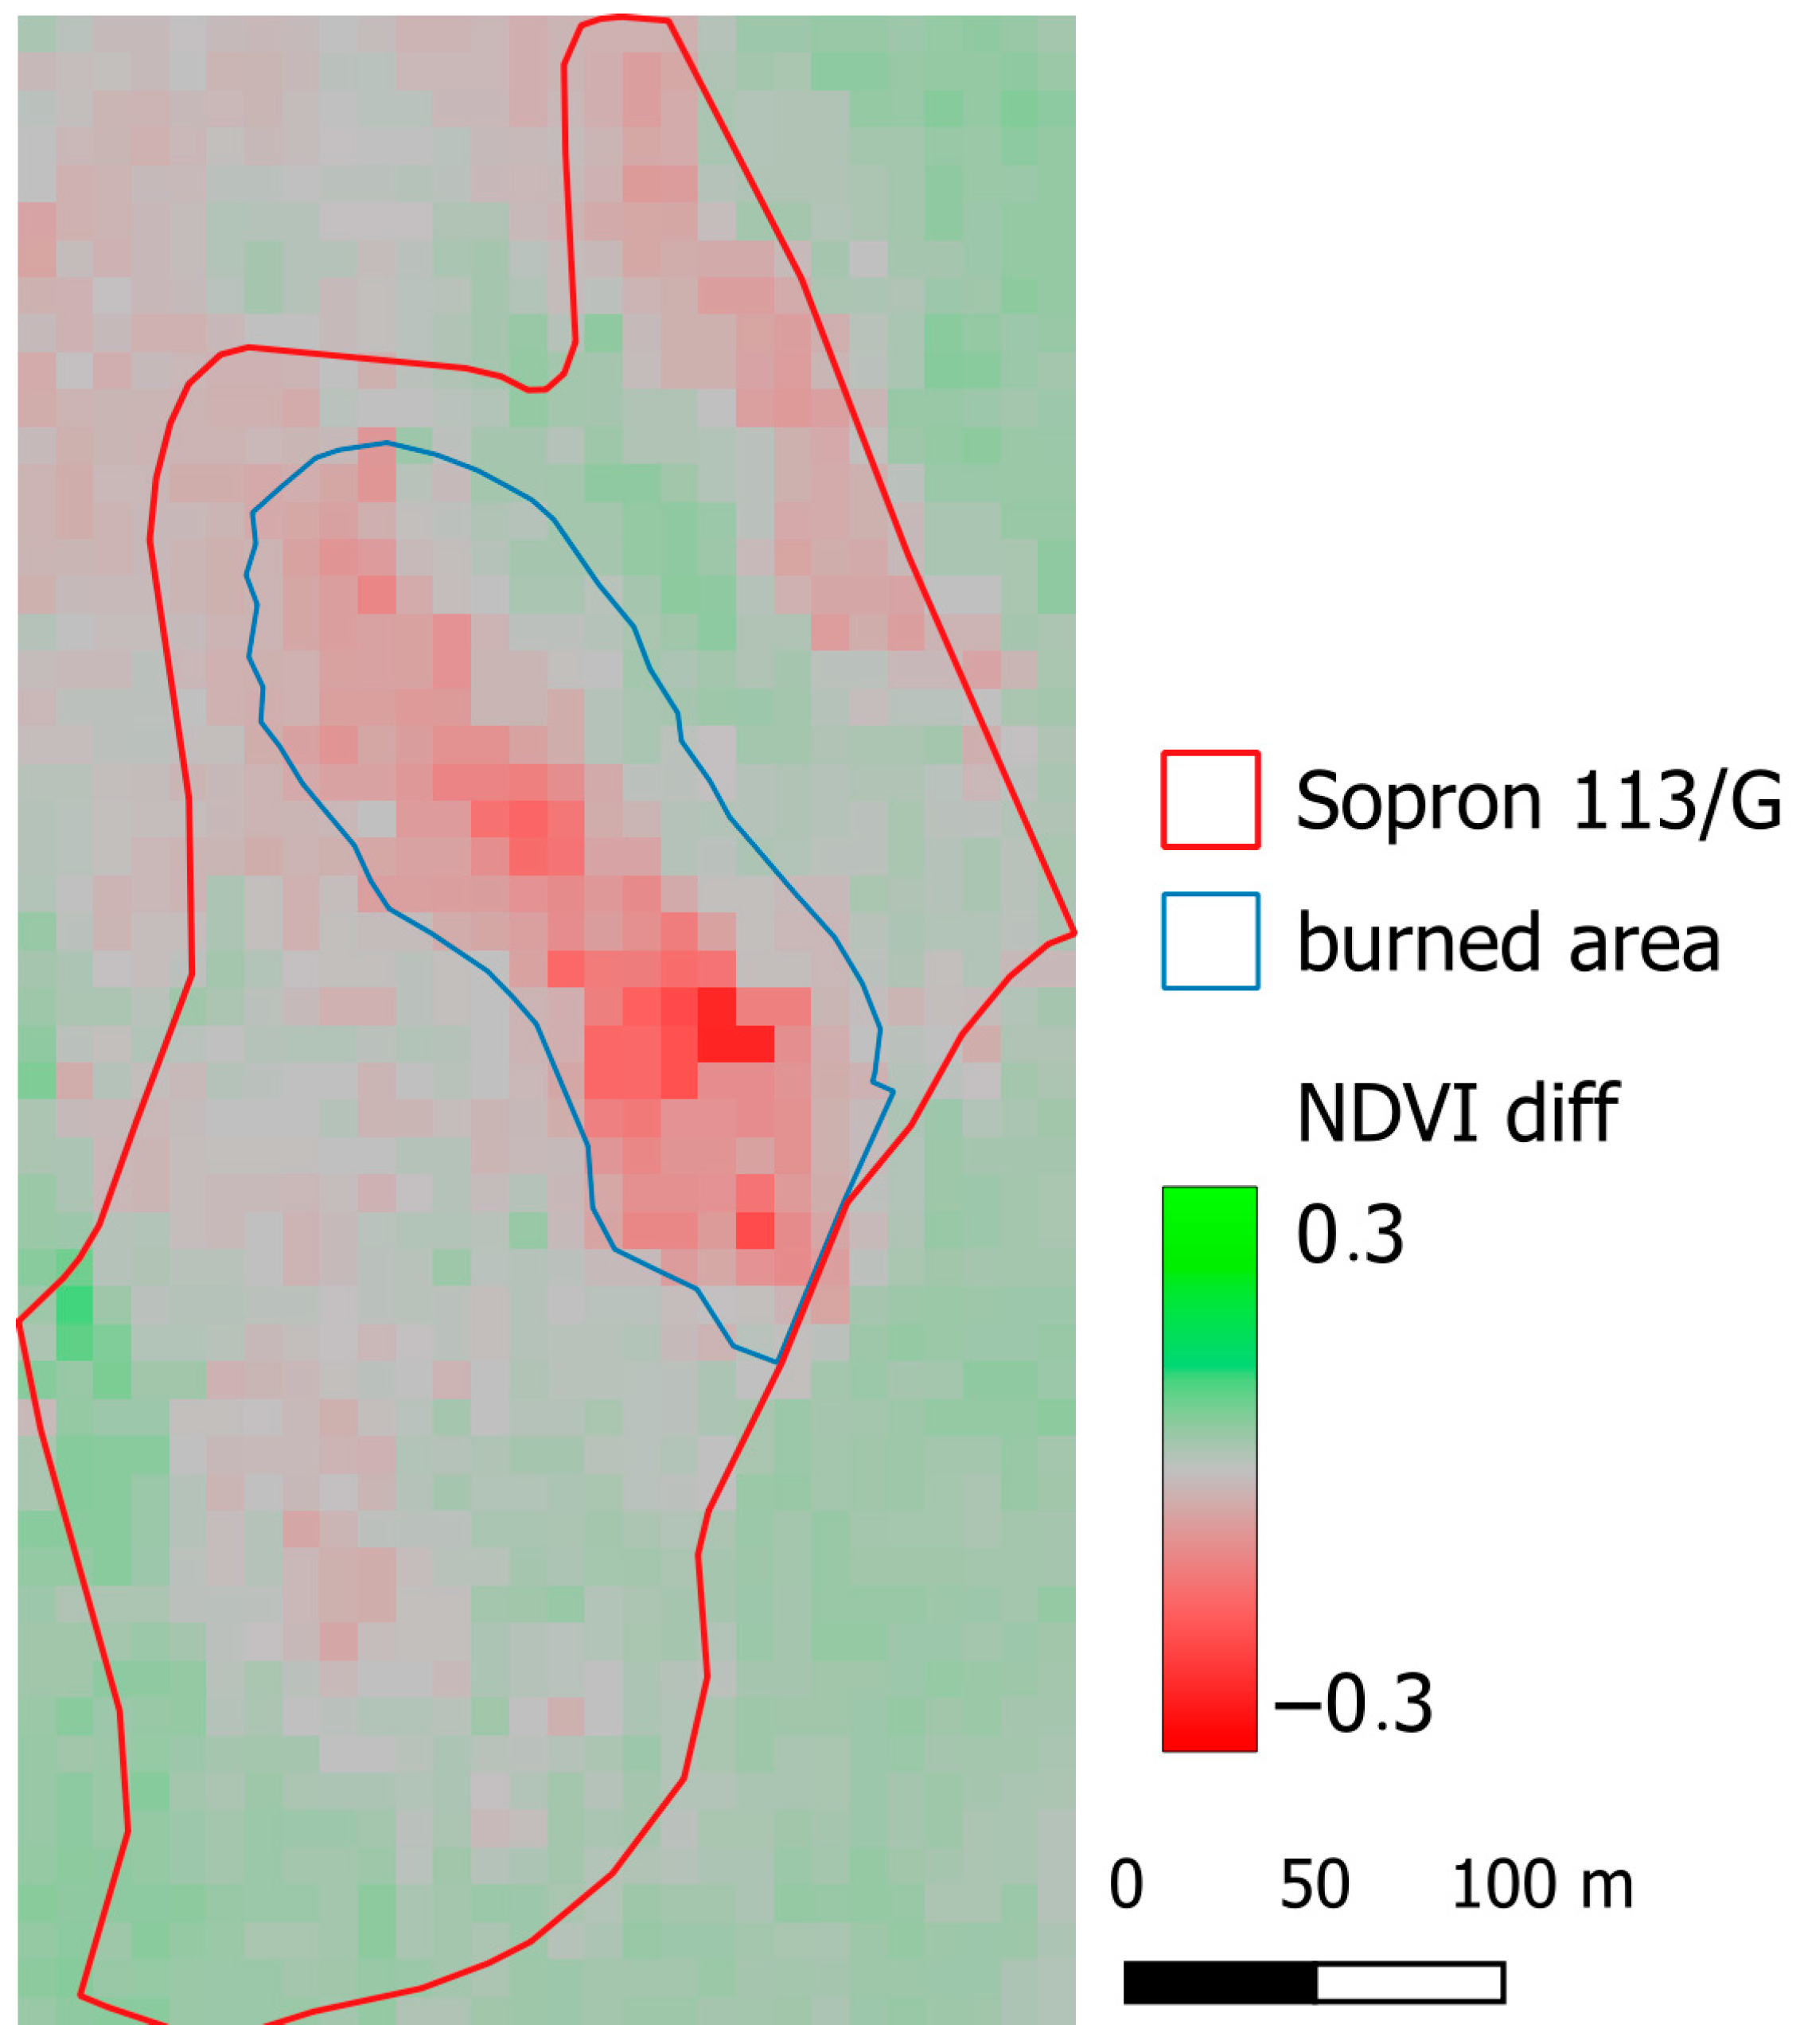
For forest compartment Sopron 113/G, we generated a satellite RGB composite in the visible range and then calculated the NDVI values for the examined month and for the same month in the previous year, as well as their double difference. Following the forest fire event, forestry professionals delineated the extent of the fire-affected area through field surveys. We compared the double-difference map with the boundary of the fire-damaged area defined from the field assessment, and their spatial location and extent were broadly consistent (Figure 6).
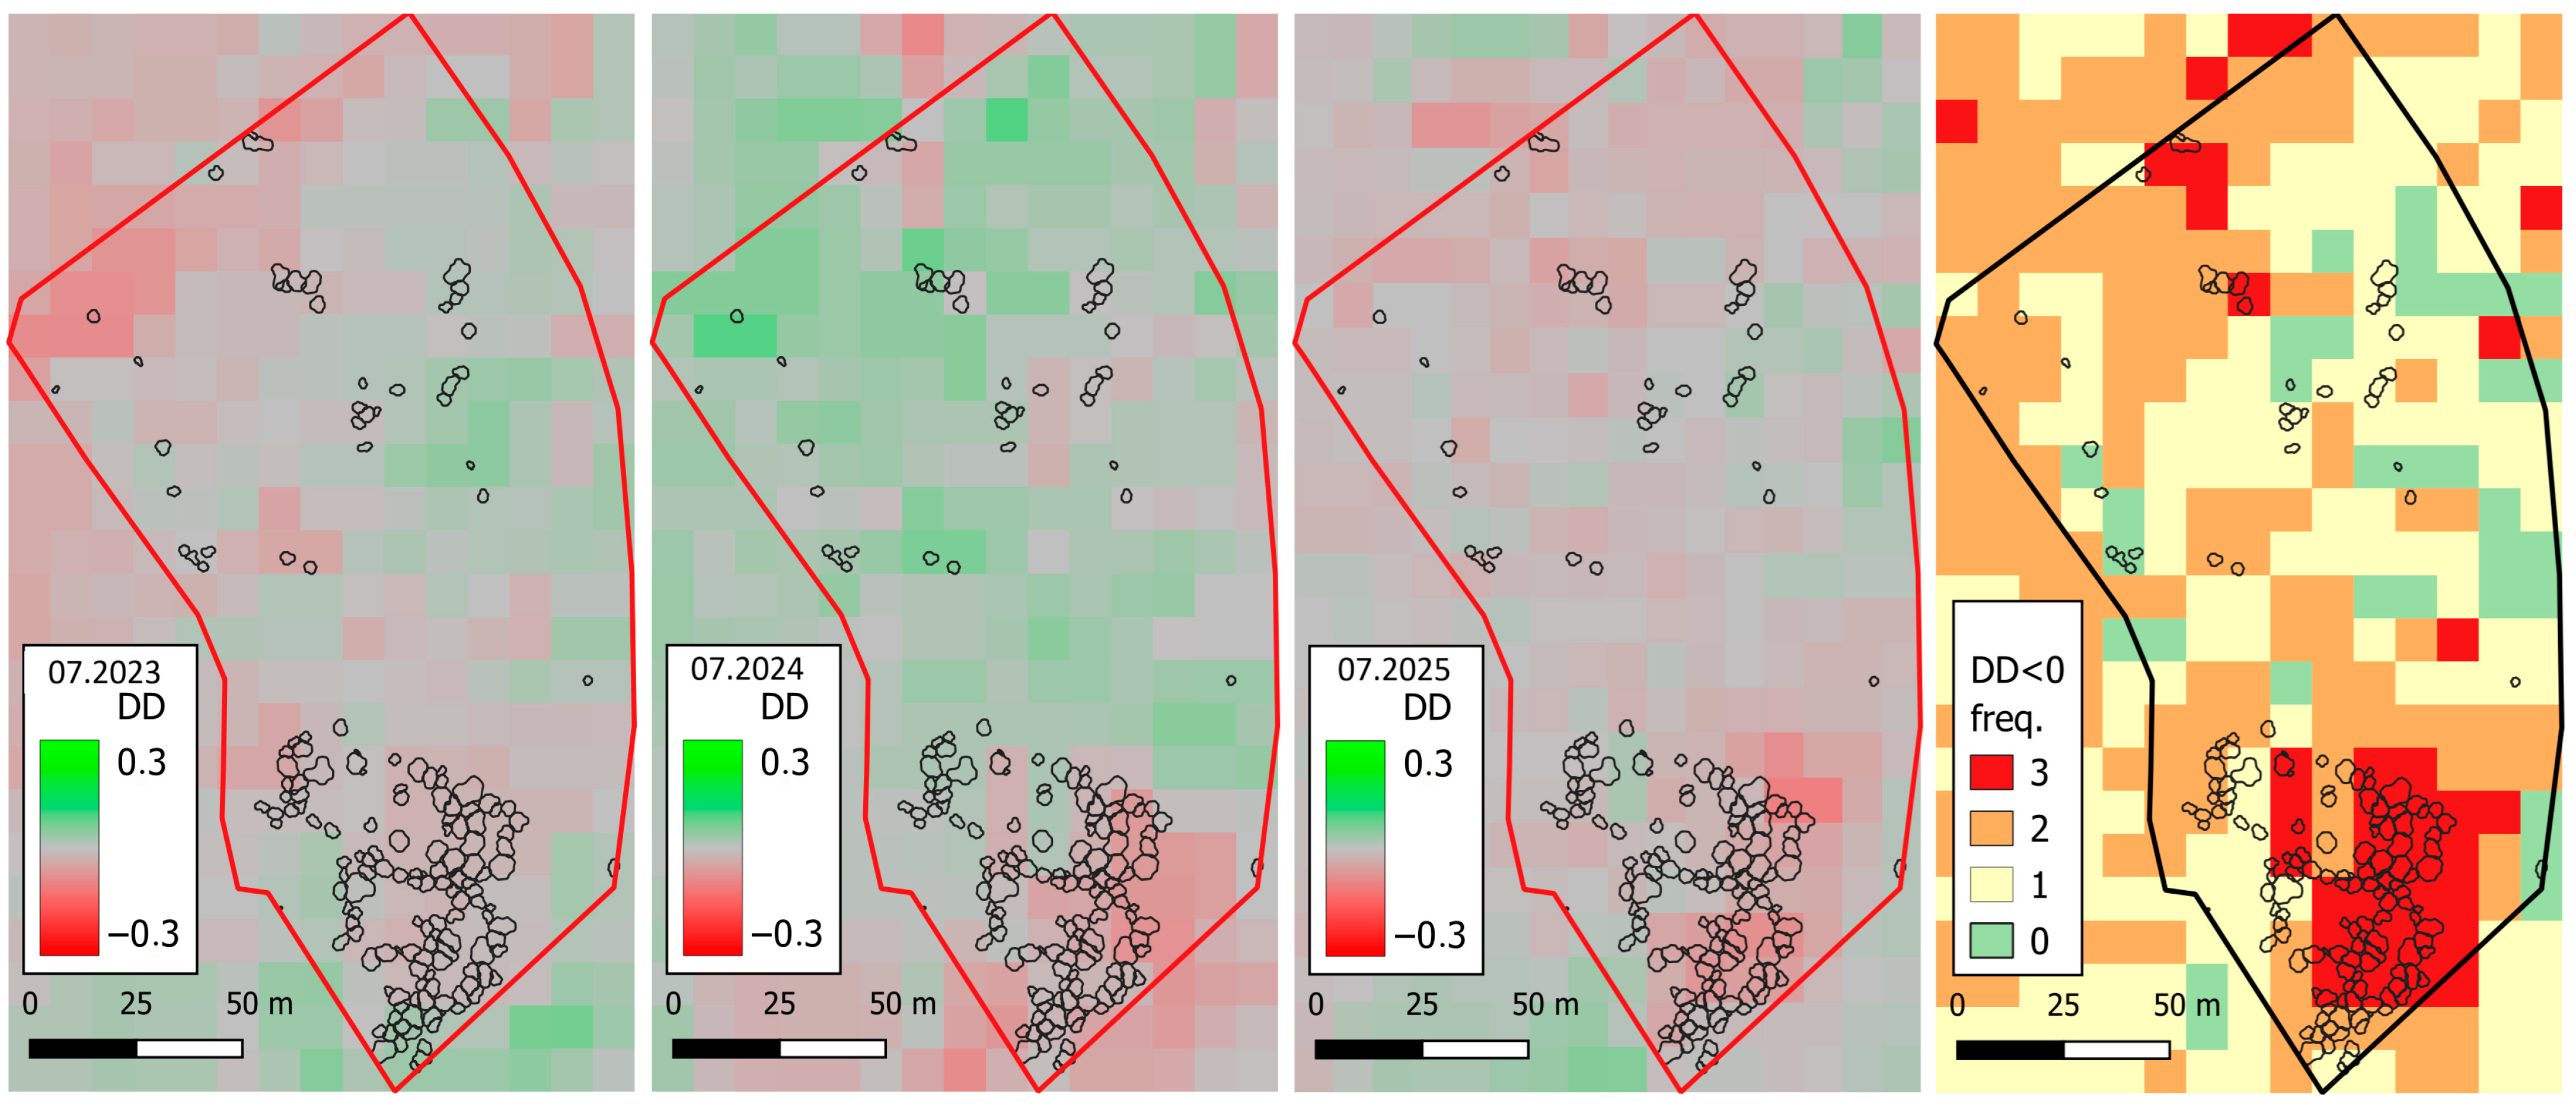
The interannual analysis of the study area demonstrates the sensitivity of the DD approach (Figure 7). By showing the changes that started after the drought year of 2022 and continued across subsequent years, it supports the applicability of the method. A separate map presents the number of interannual decreases, which also highlights the affected patches thematically.

3.2. UAV Photogrammetric Evaluation

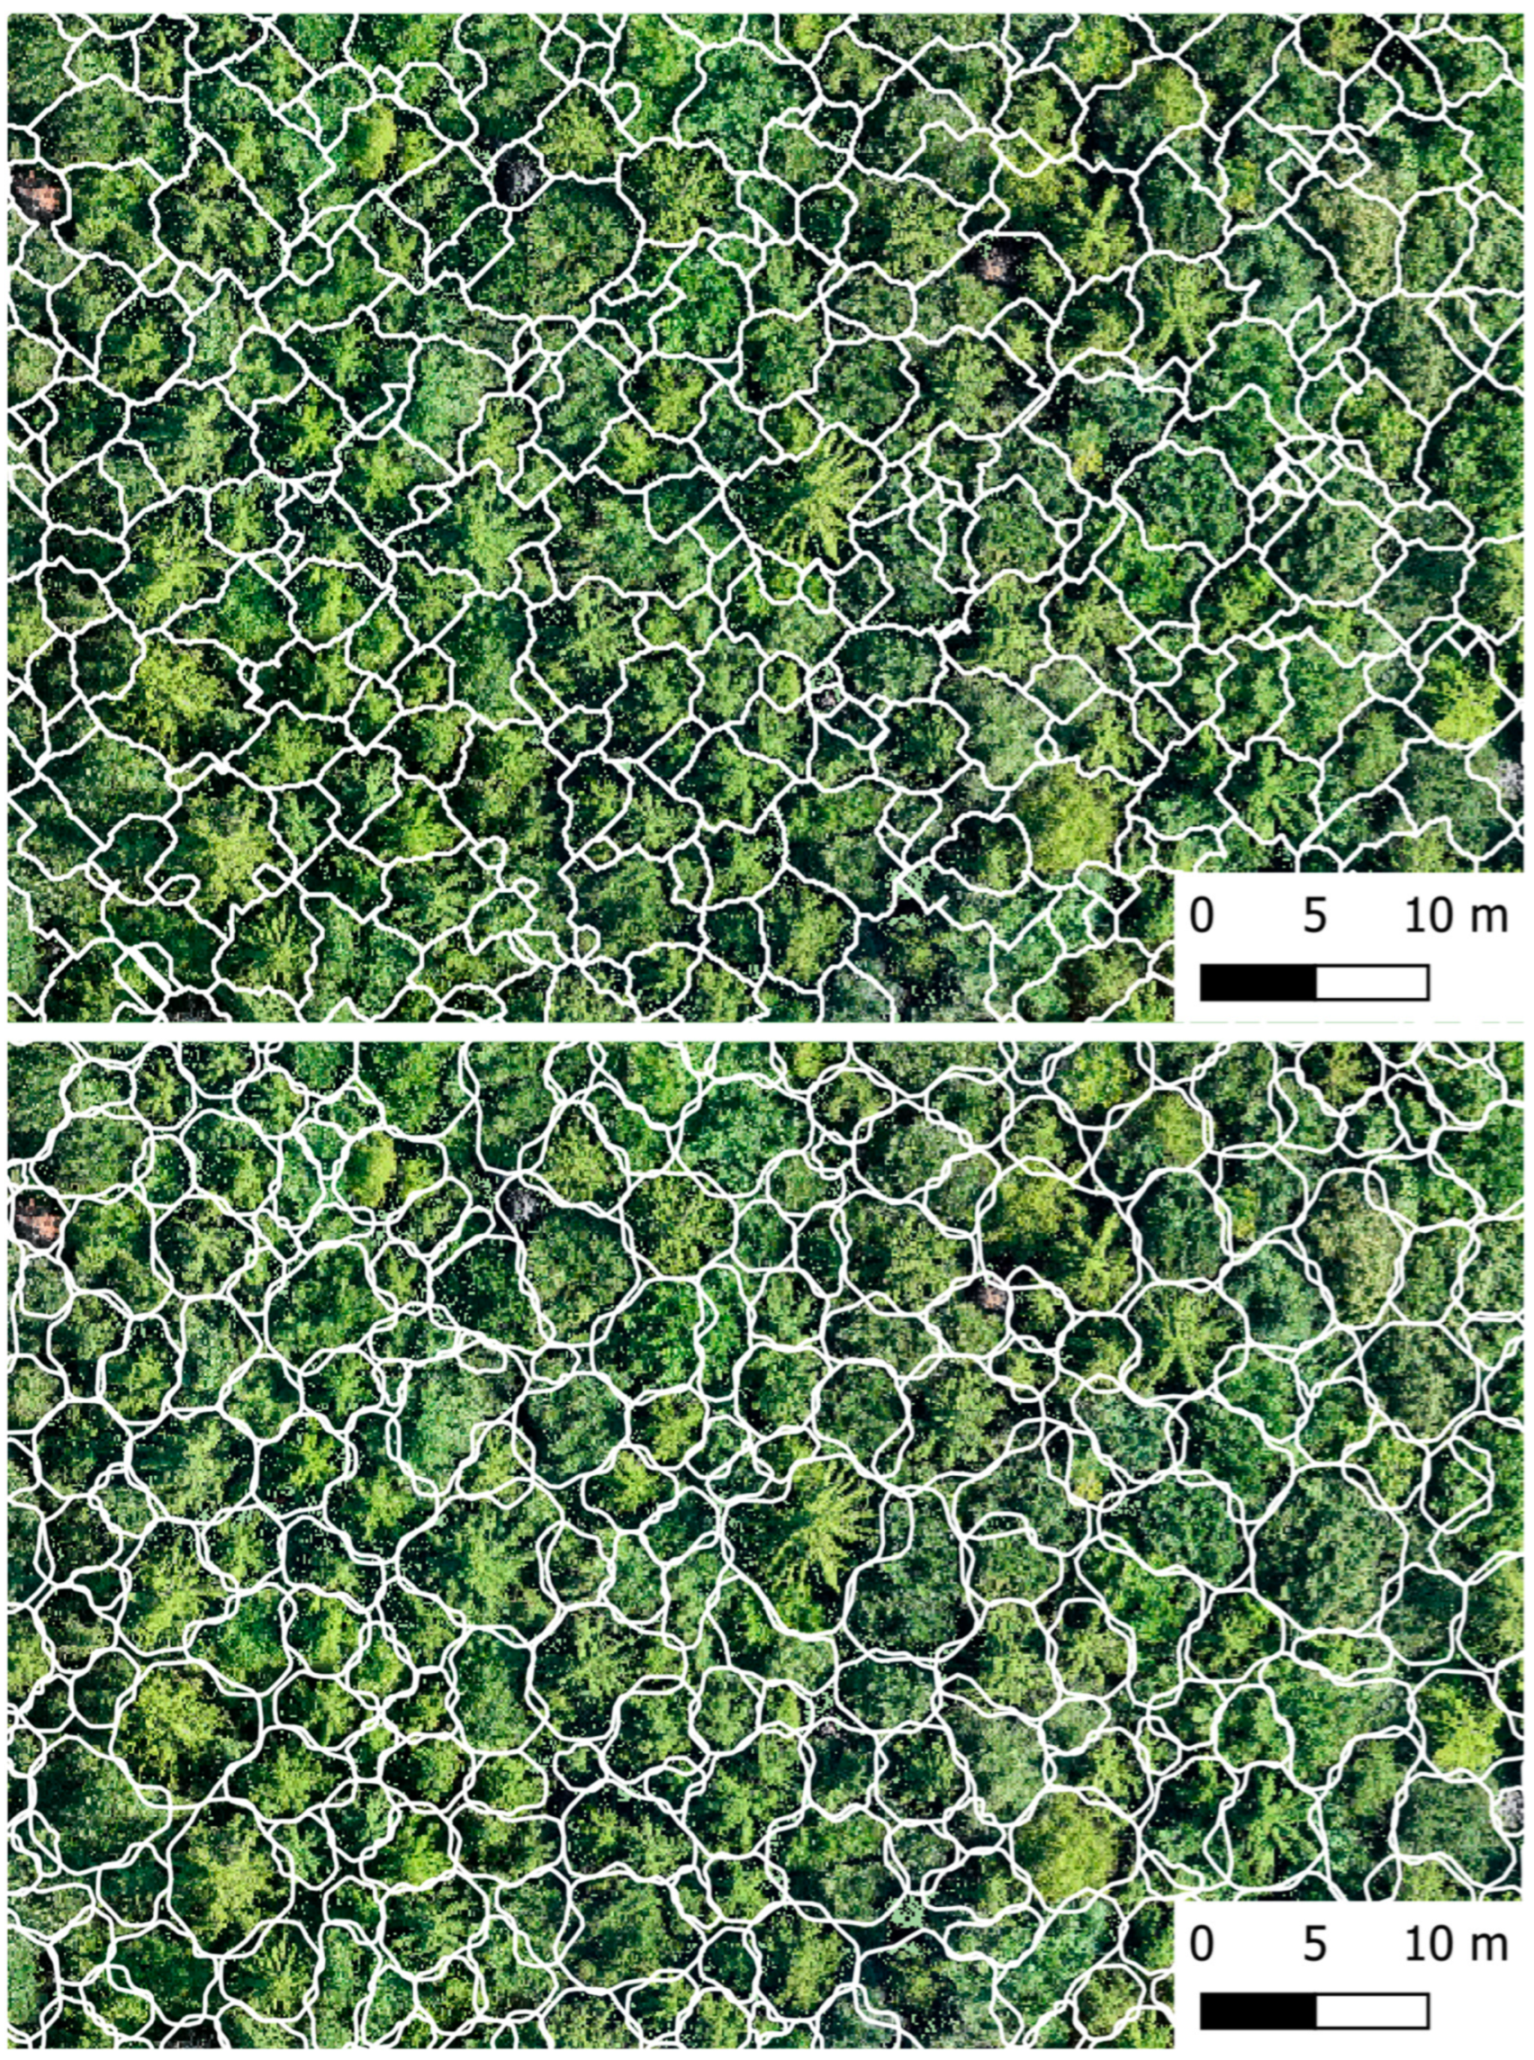
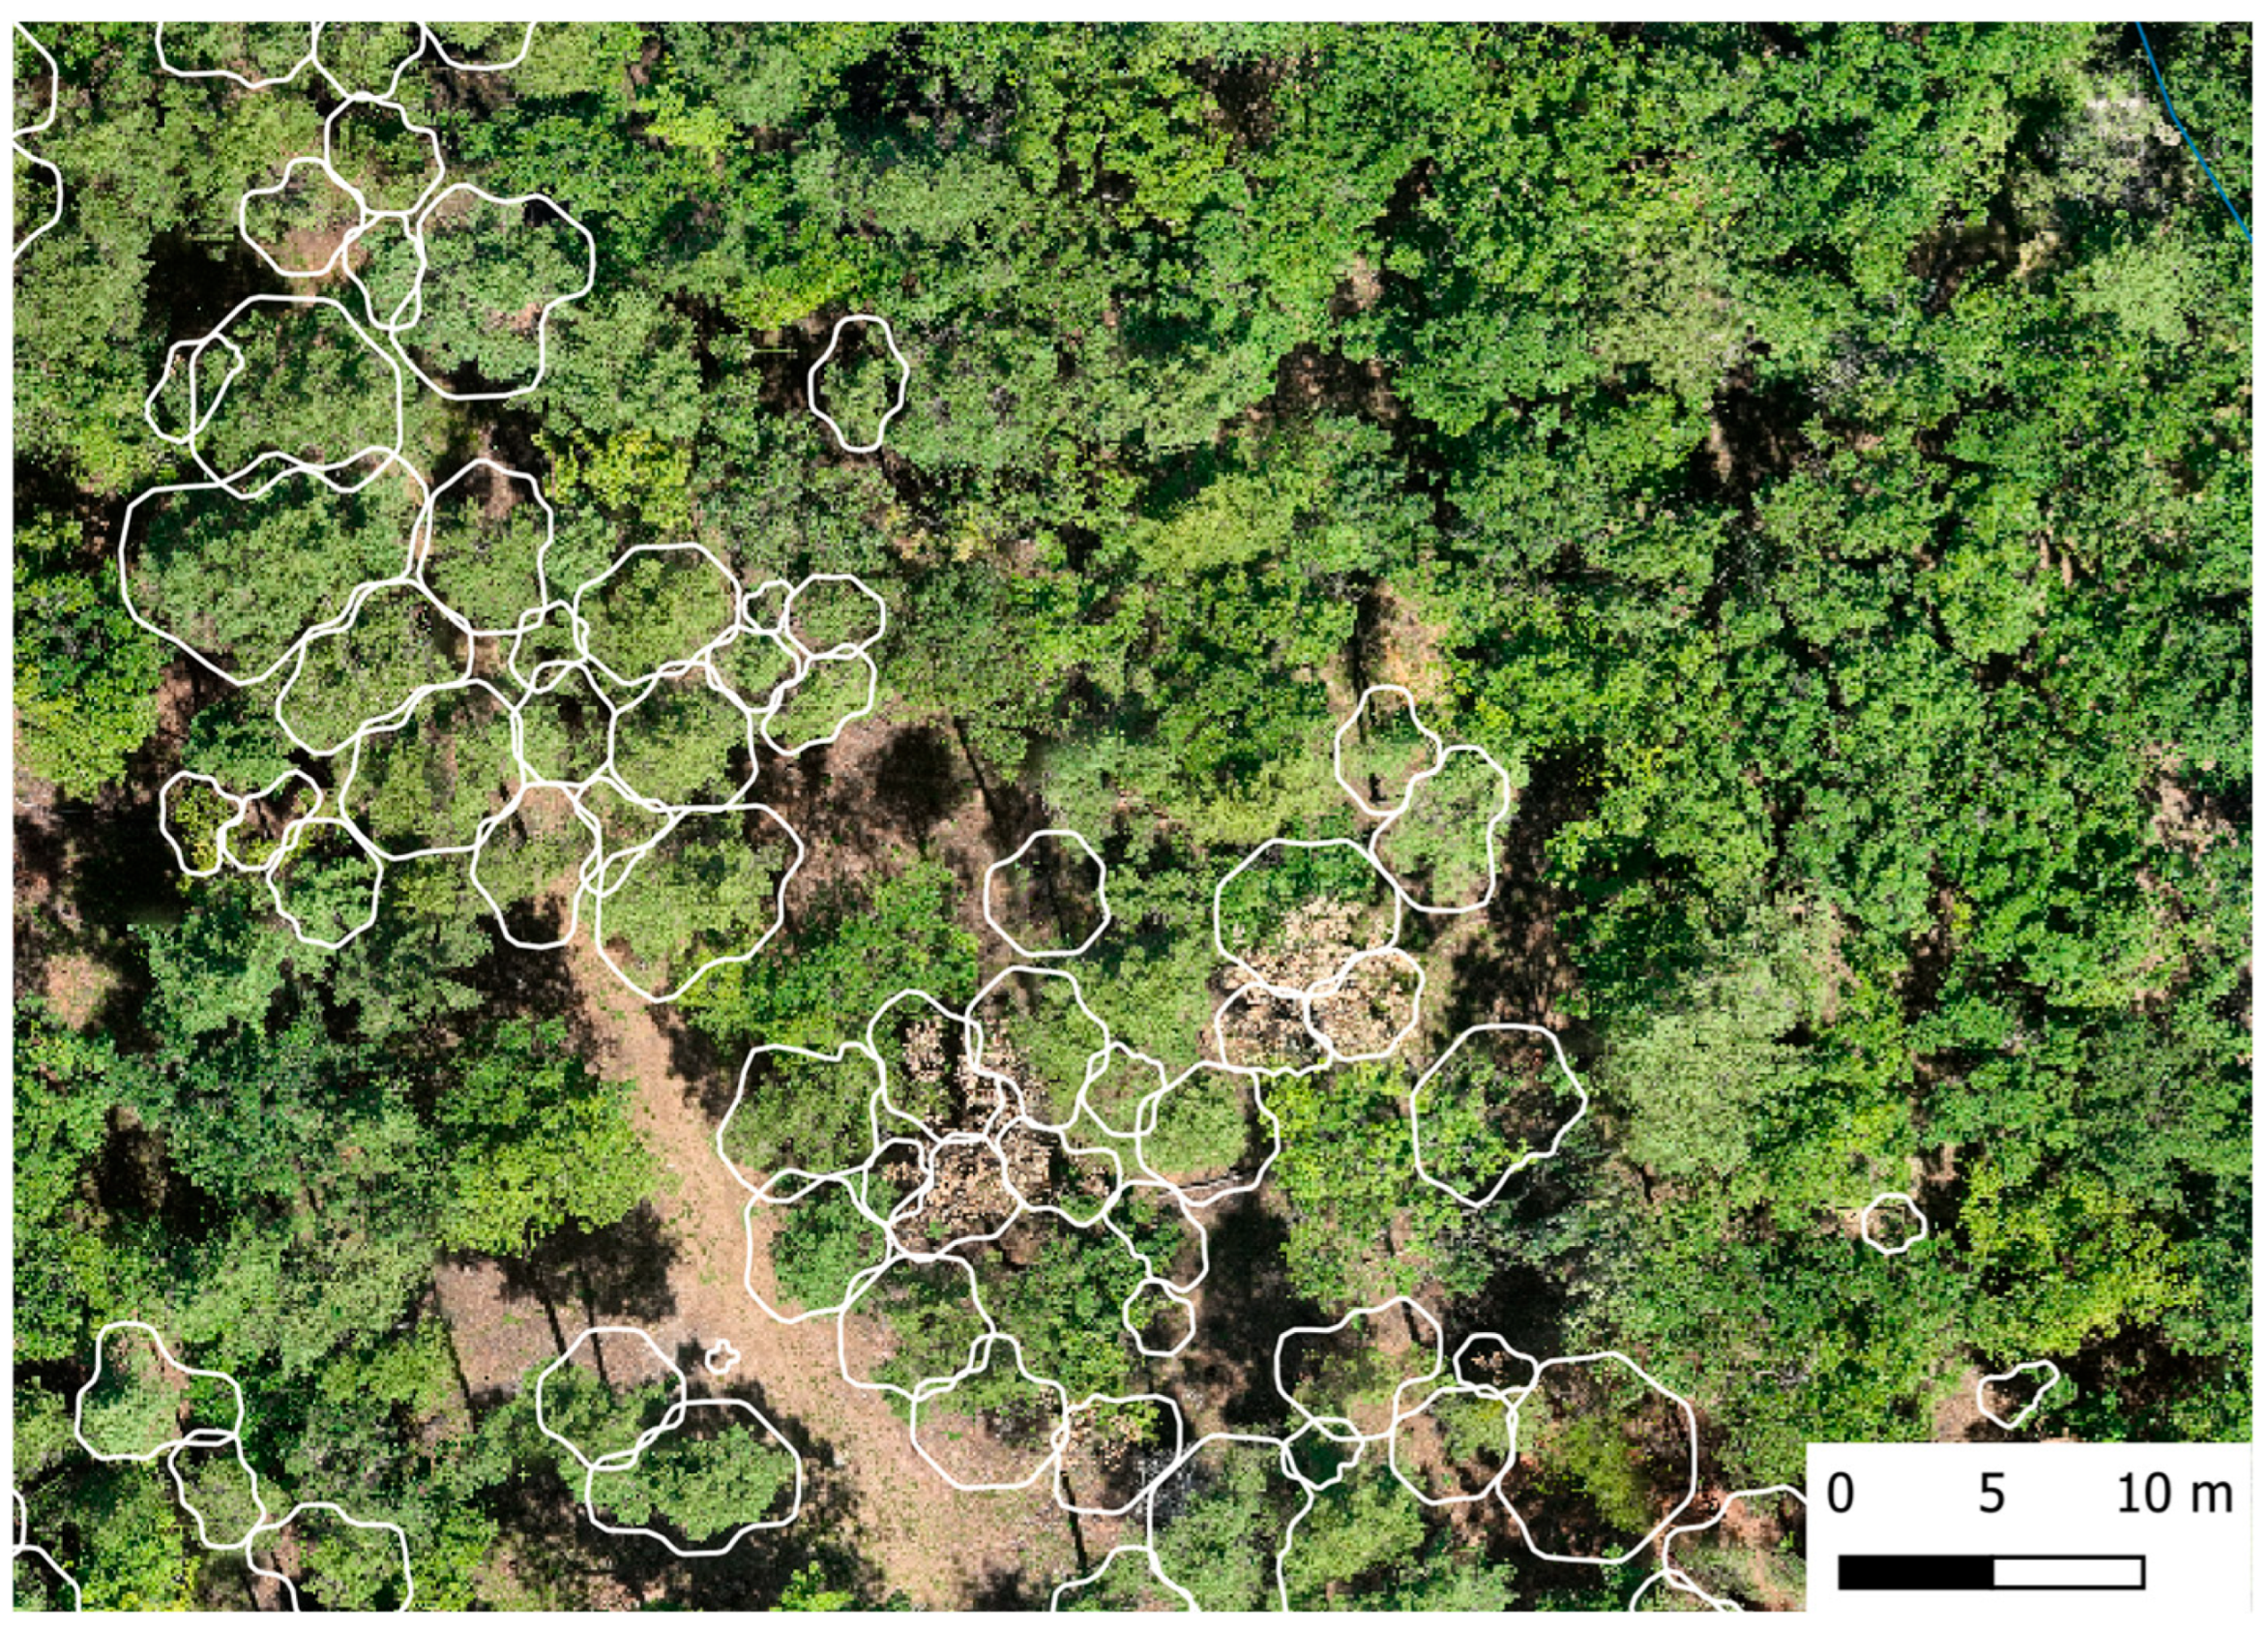
In forest compartment Sopron 199/A, a plot-based survey based on a complete stem count was carried out within the framework of district forest planning, resulting in a total of 1674 stems recorded for the compartment. Among the tested segmentation approaches, the hybrid algorithm of the TreeDetect software (v1.25.9.29), parameterized with a 2.5 m radius, showed the best agreement with the results of the field survey (Table 1) (Figure 8).
We validated the crown segmentation derived from the UAV image-matching point cloud using ALS-based voxel aggregation stem and crown segmentation following the method published in [43]. By aggregating stem voxels between 2 and 6 m, we delineated 1524 stems, while crown voxel aggregation between 10 and 35 m yielded 1684 crowns. These two values validate the crown segmentation based on the image-matching point cloud within an accuracy of 8%.
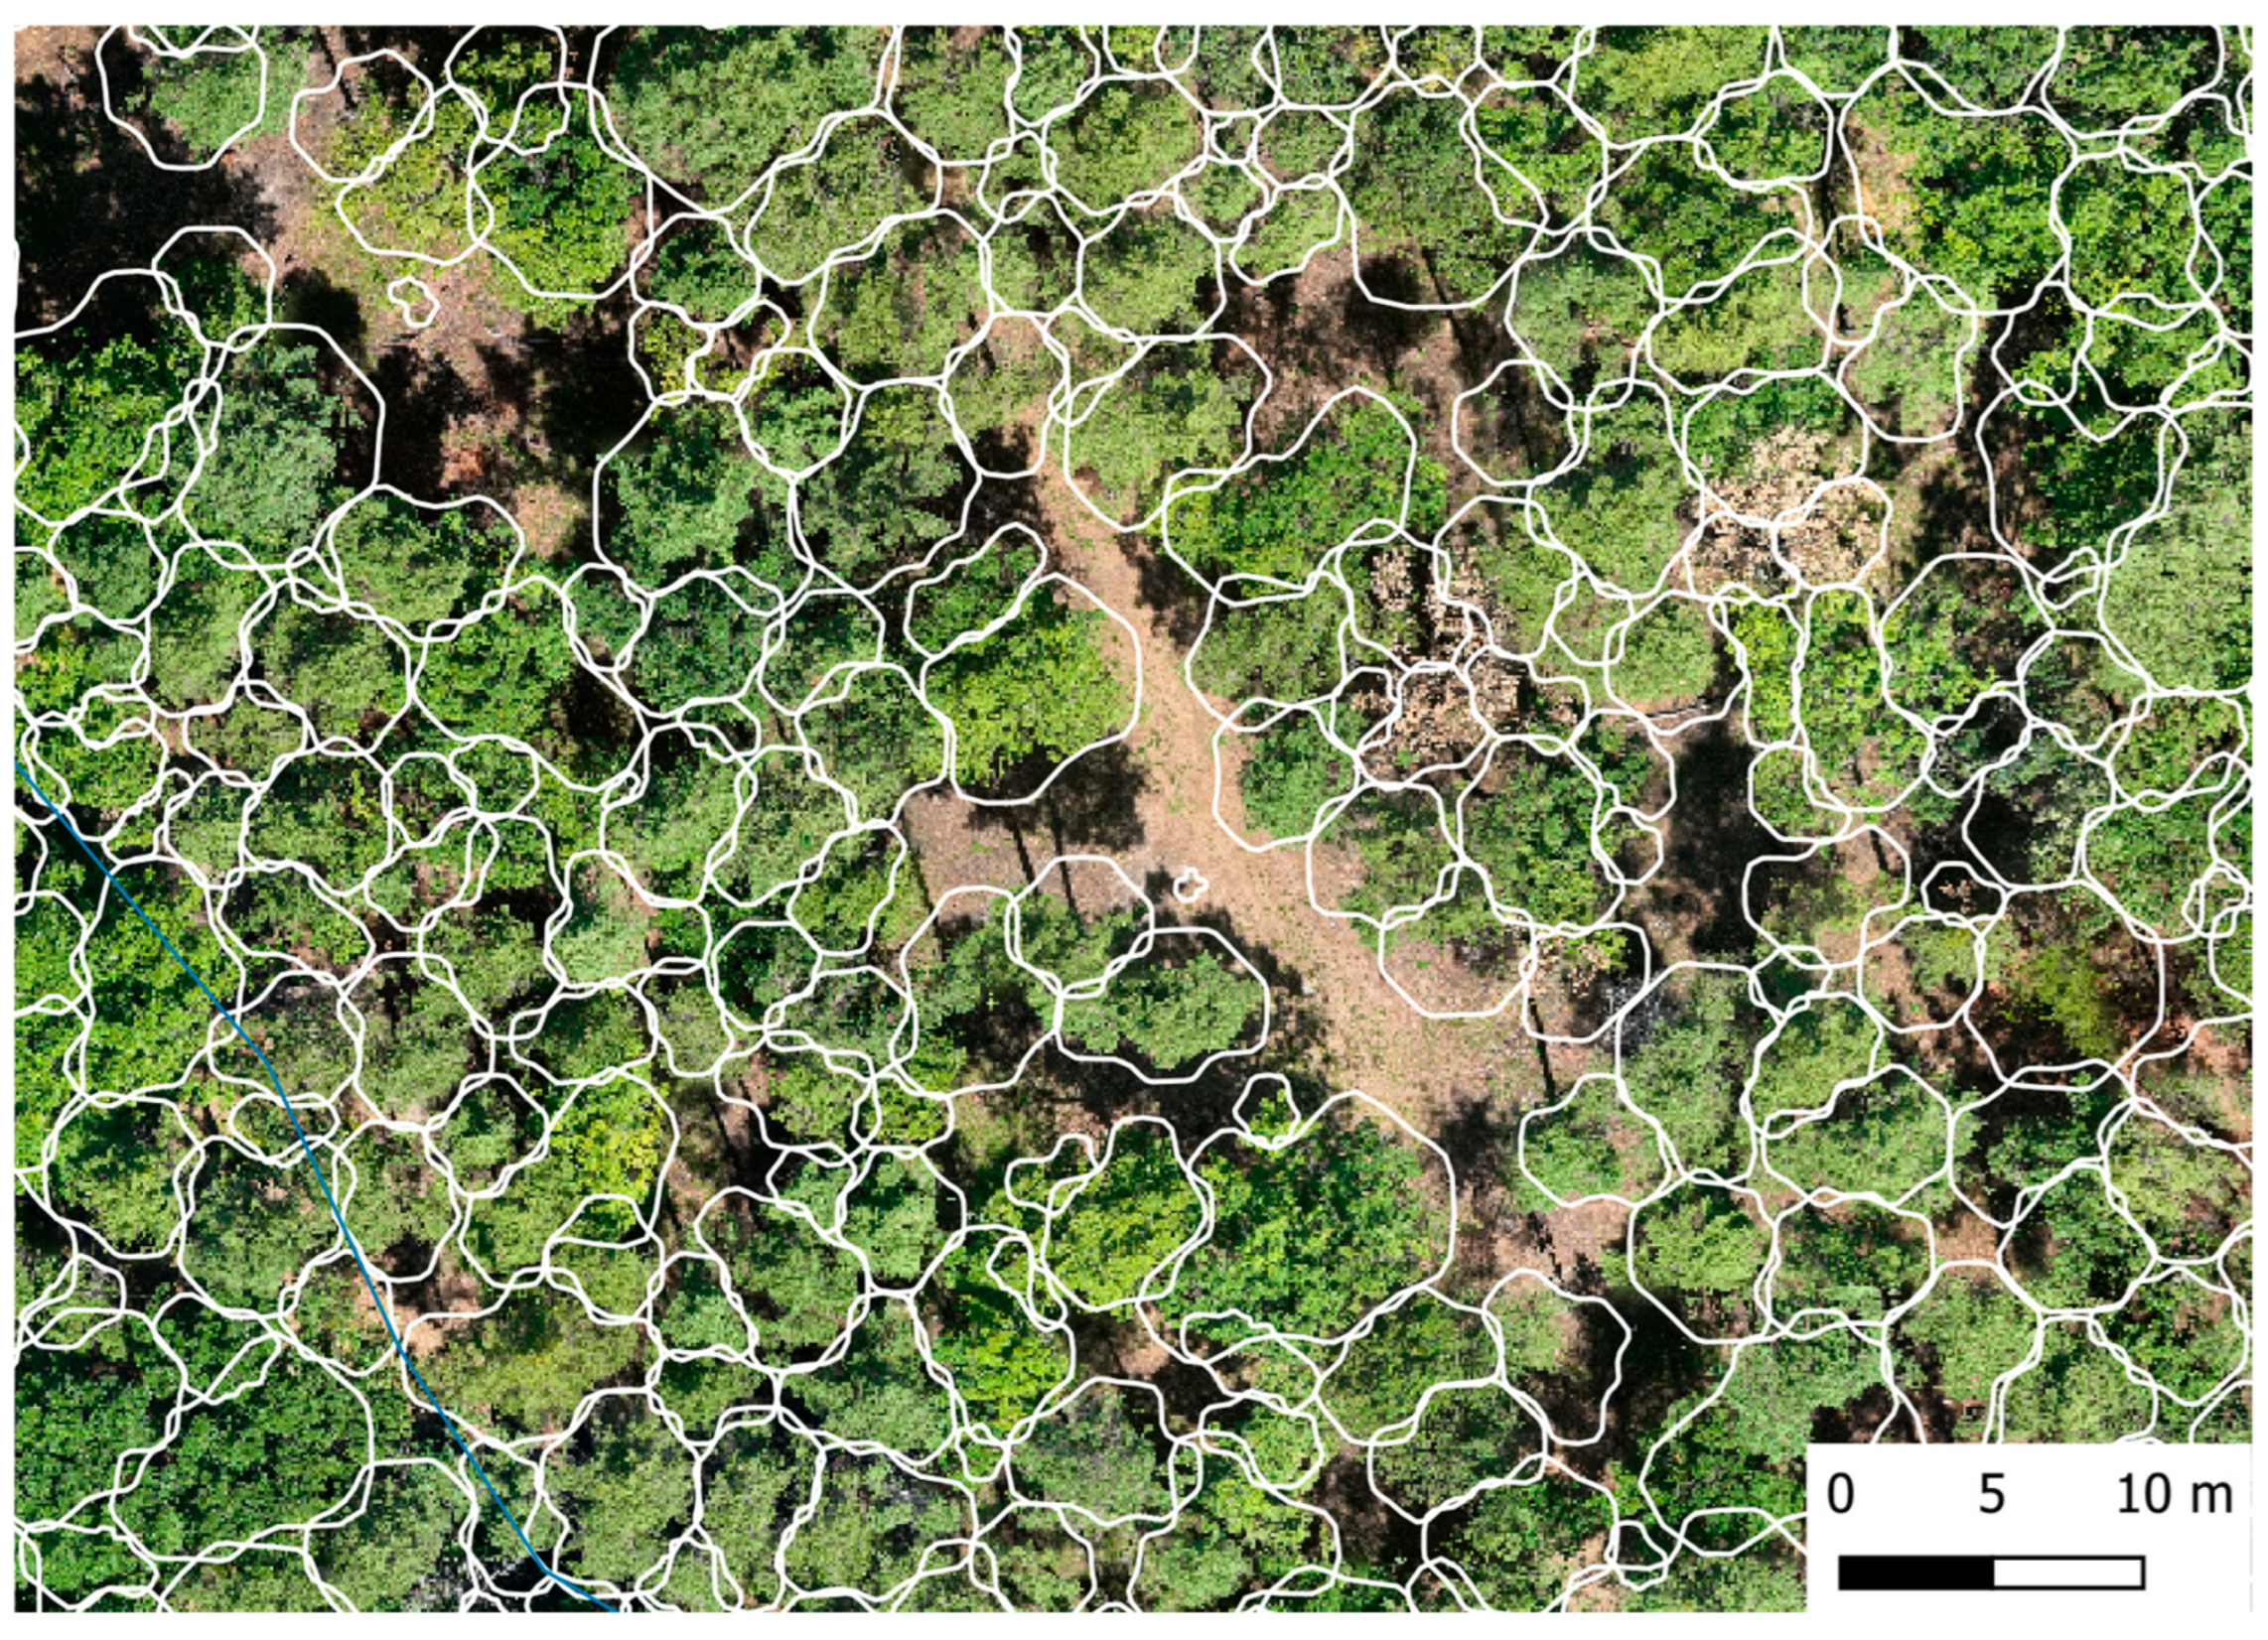
In forest compartment Sopron 113/G, the forest management plan reported a stem count of 5453. In contrast, segmentation performed with the hybrid algorithm of the TreeDetect software detected 5098 individual trees (Figure 9).
In forest compartment Sopron 199/A, the object-based NDVI classification of the UAV imagery identified 168 damaged trees. According to visual interpretation, these individuals were exclusively dead Norway spruce. In terms of the number of damaged trees, this corresponds to nearly 10% of the stand, and in terms of area it represents approximately 7% of the forest compartment (Table 2) (Figure 10).
The analysis was also carried out in forest compartment Sopron 113/G. Based on the object-based NDVI classification of the UAV imagery, 695 crowns fell below the defined threshold, which corresponds to approximately 11% of the compartment area (Table 3).
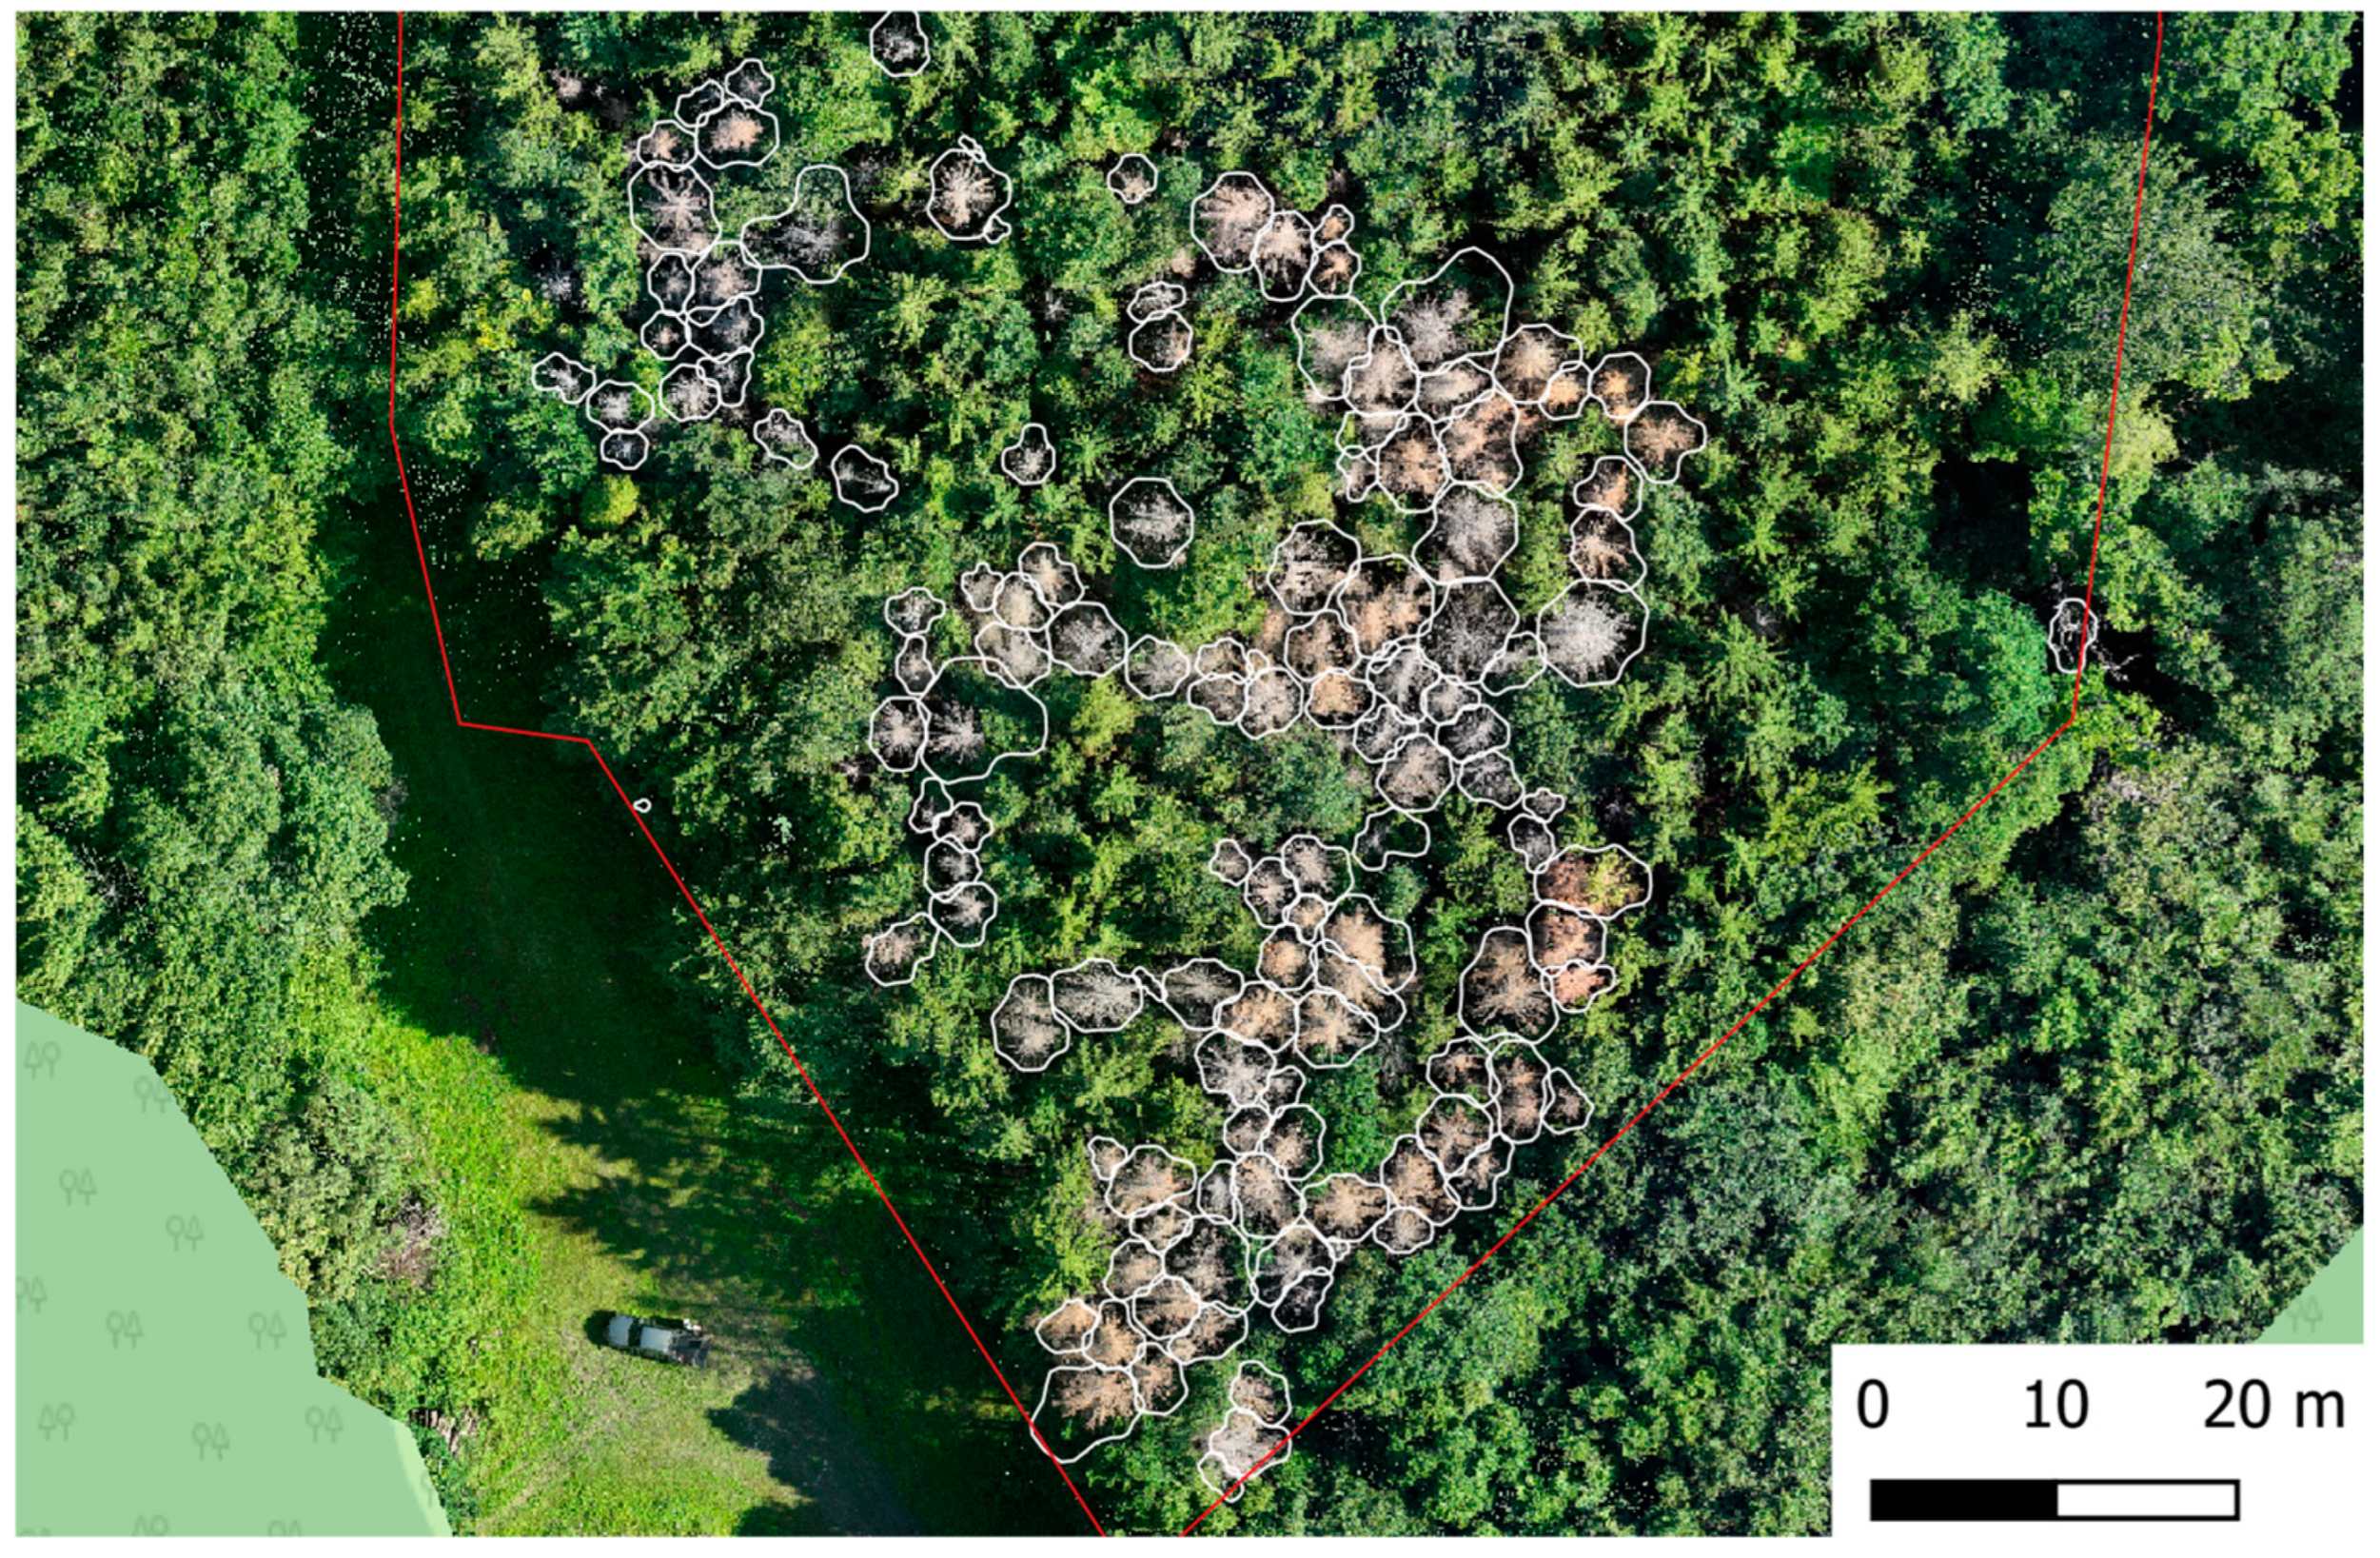
However, in the RGB orthomosaics, damage within this forest compartment was not visually apparent with the same clarity (Figure 11).
In forest compartment Sopron 199/A, different band and algorithm combinations for the object-based supervised classification of the UAV imagery were evaluated using the selected test objects. During the assessment, we did not observe any substantial differences among the combinations; all classifications performed virtually perfectly (Table 4). We examined the spectral separability of the three classes and found only minimal overlap, which explains the high classification accuracy.
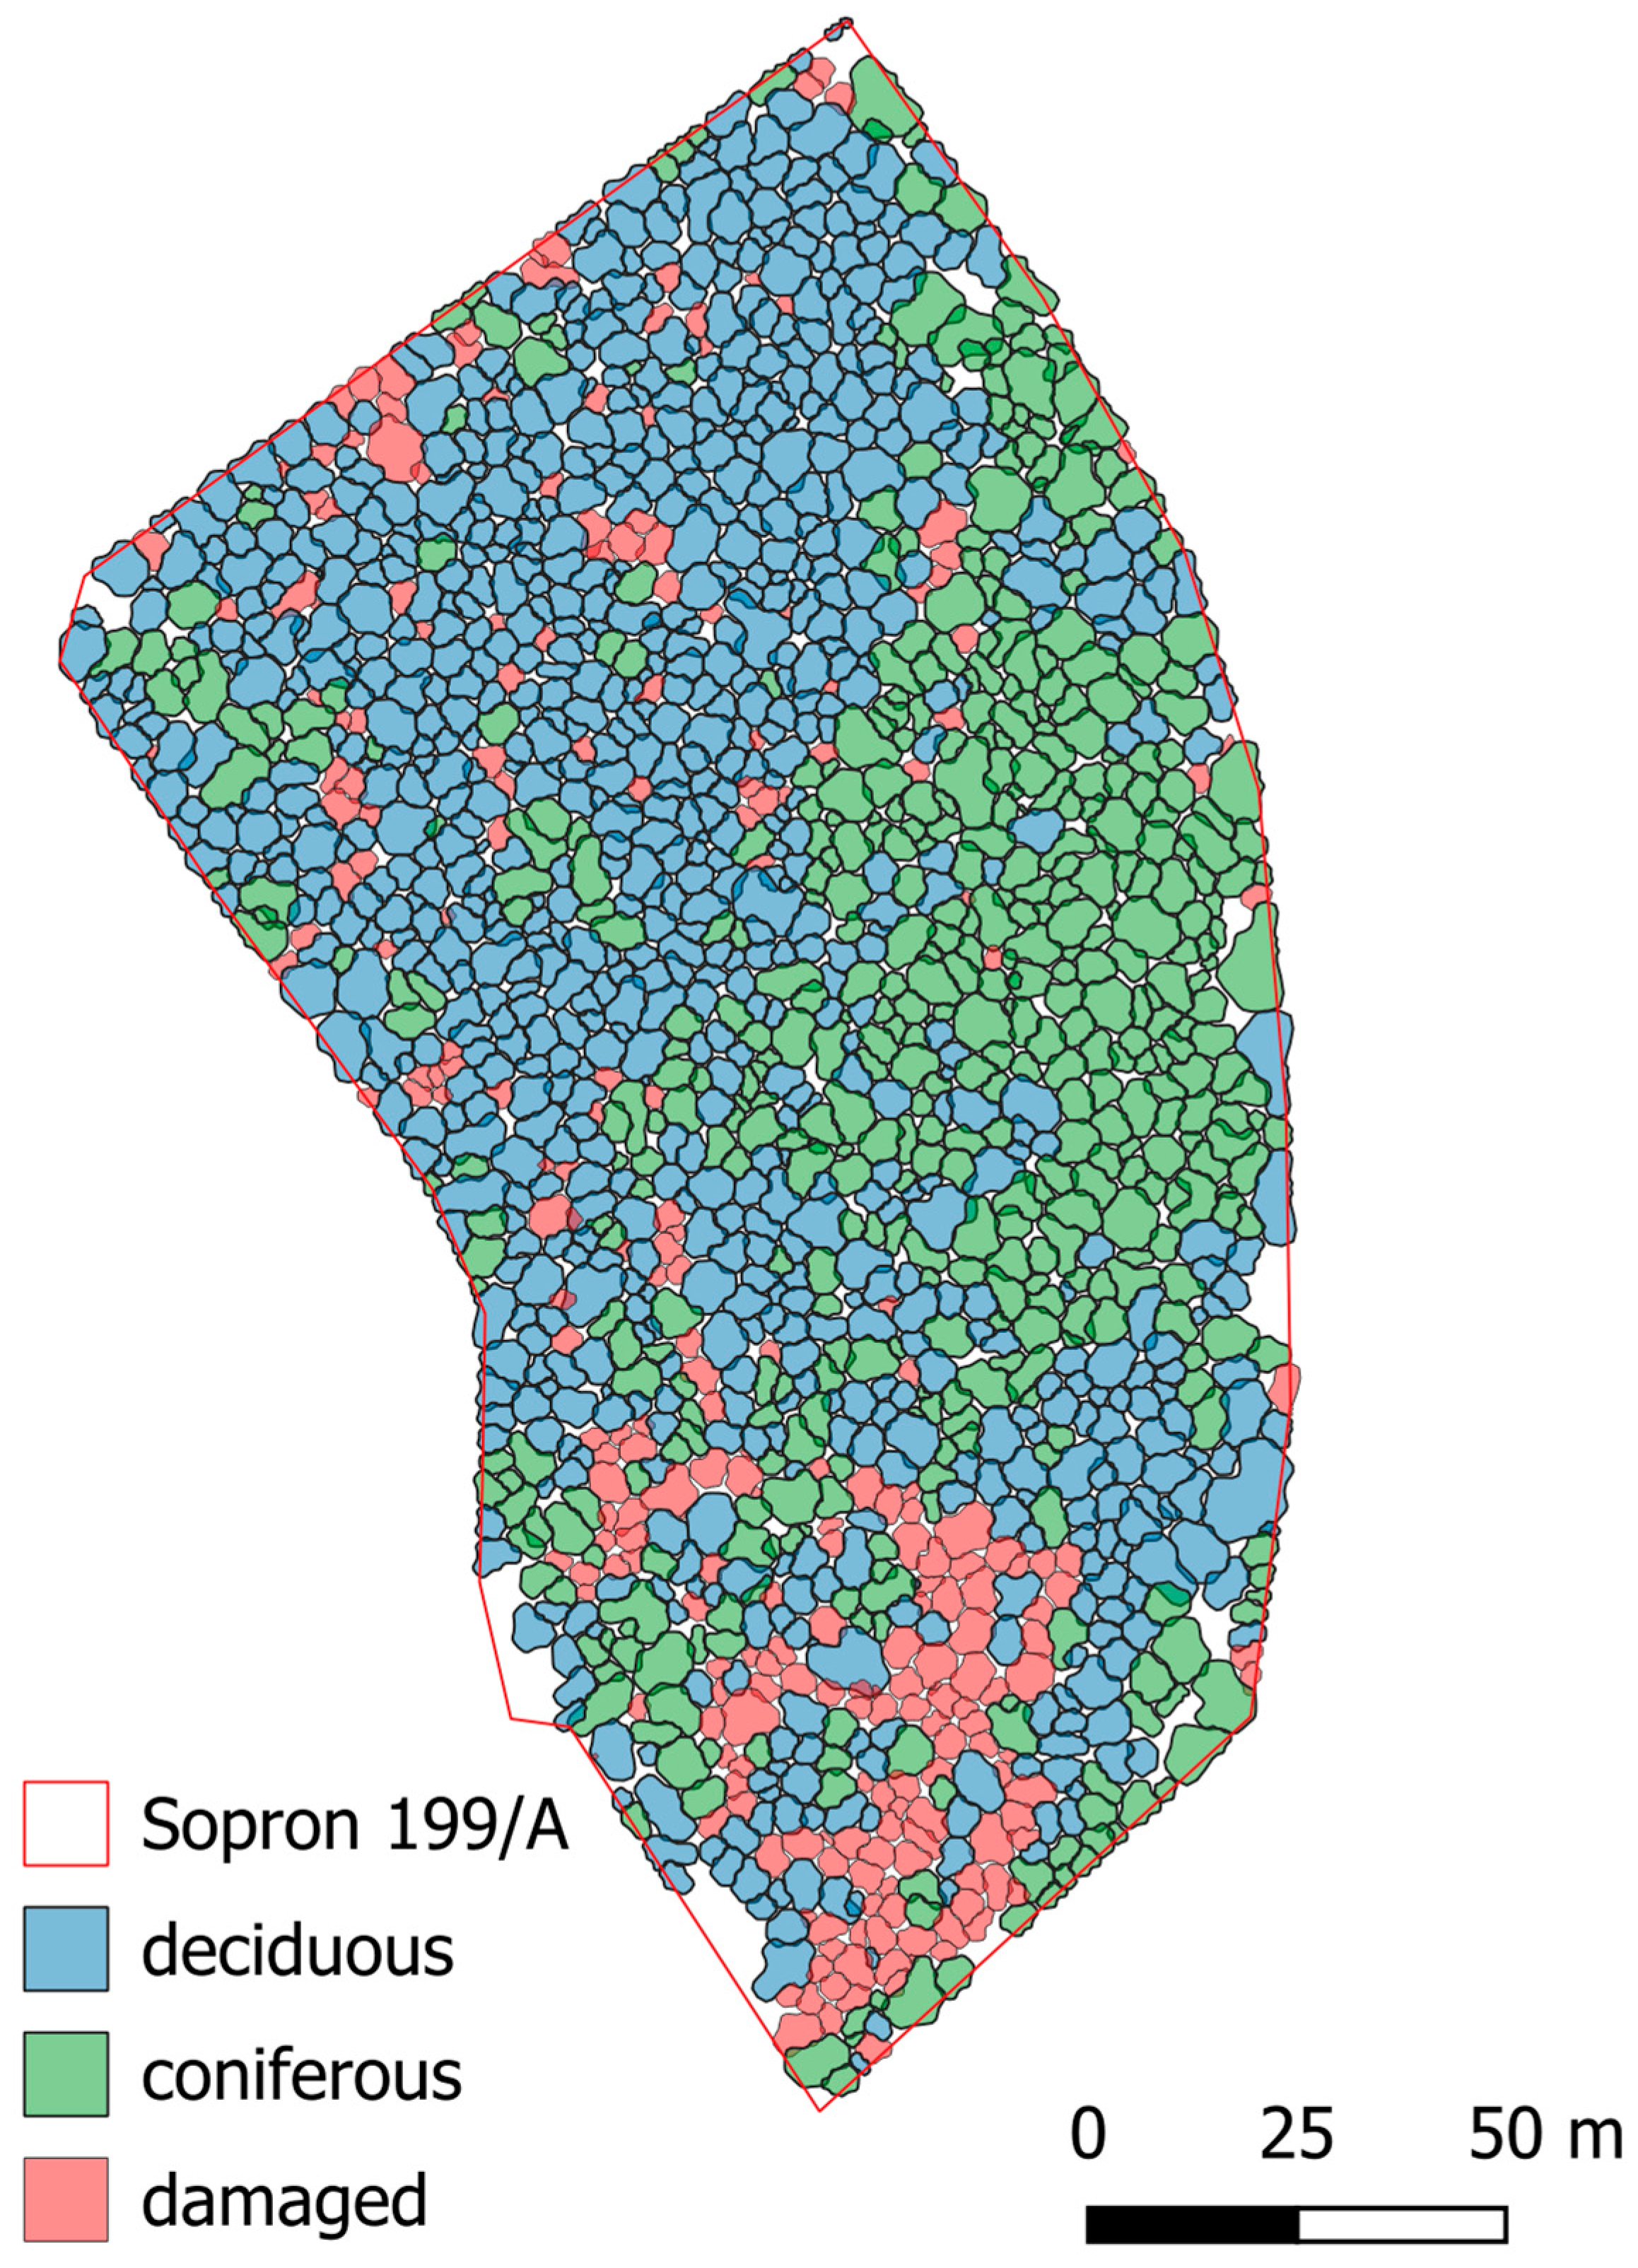
Because the test objects could not reveal meaningful differences between the classification models, we examined the forest planning data for the compartment regarding the crown-projection proportion of broadleaved and conifer species. Dead conifers were counted together with live conifers, and no significant differences were found in this comparison either. The Random Forest classifier produced the same 65:35 broadleaved–conifer mixture ratio as reported in the forest management plan (Table 5) (Figure 12).
We compared the different classification models in terms of the proportion of the forest compartment area assigned to the damaged category. In this comparison, substantially larger differences were observed among the models than in the other assessments. The results of the NDVI-based expert classification were most closely approximated by Model 3 (Table 6).
Nevertheless, the UAV survey corroborated the findings of the satellite analysis in forest compartment Sopron 199/A. The UAV-based model provided a finer-scale, more detailed spatial delineation of the damaged areas. For those individual trees where damage was detectable based on the UAV assessment but was not indicated by the current NDVI double-difference analysis, it is likely that the damage occurred in an earlier period. Forest degradation of this magnitude is typically the result of a multi-year process (Figure 13).
As the individual DD delineation thresholds decrease, the extent of damaged areas detected from the satellite data decreases; consequently, the areas jointly identified by DD and UAV also decrease. At the same time, DD-only detections decline, while the number of elements detected only by the drone increases (Table 7). The DD also identifies pixels that are only partially affected, but it does not capture crowns that died before 2024.
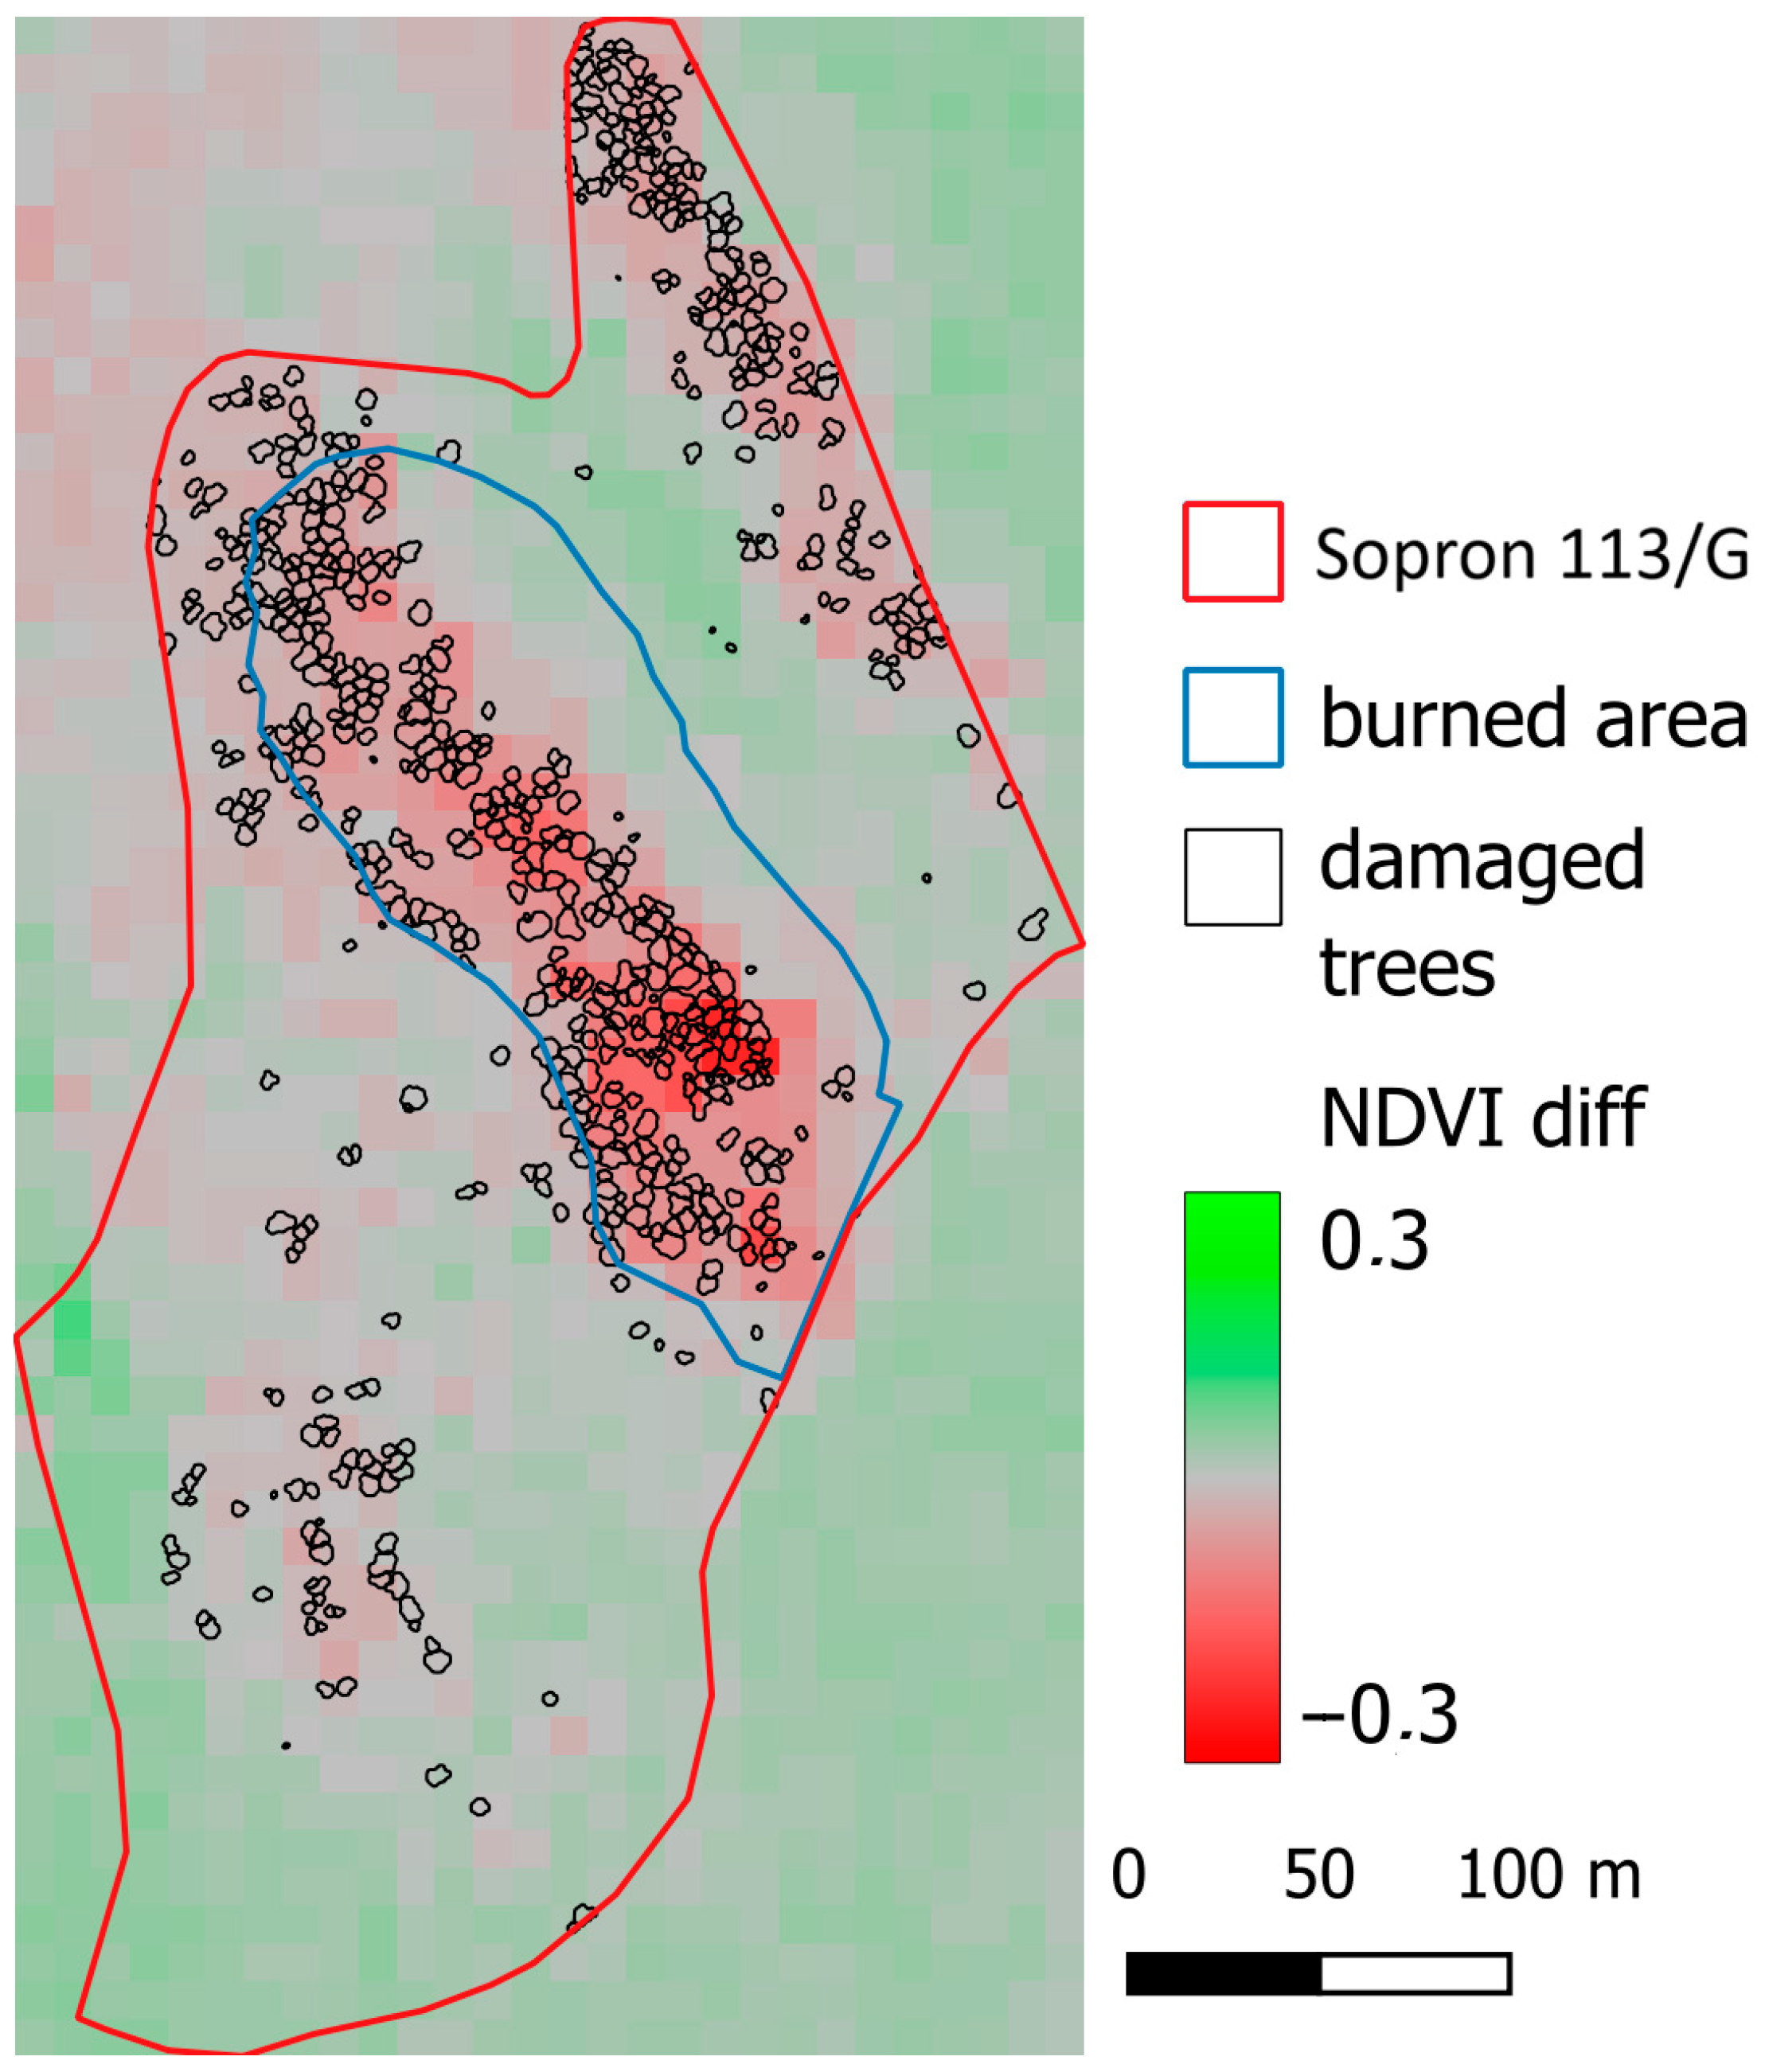
In forest compartment Sopron 113/G, the UAV survey likewise supported the conclusions of the satellite analysis and enabled a finer-scale, more detailed spatial representation of the damaged areas. Owing to the recent nature of the damage, the UAV-based results spatially closely followed the pattern indicated by the NDVI double-difference analysis. It is important to emphasize that the decrease in the double difference was not attributable solely to canopy deterioration; the dieback of the understory also contributed to the observed signal in areas with partially opened stand structure. In addition, damage was detectable not only within the patches directly affected by the forest fire, but also beyond them (Figure 14).
In compartment 113/G, dieback is more recent; therefore, the agreement between the satellite-derived NDVI change and the current condition recorded by the UAV is stronger. As the individual DD delineation thresholds decrease, the damaged area detected from the satellite data decreases, the area not detected by DD increases, the area jointly detected by DD and the drone decreases, and the area detected only by the drone increases (Table 8). The field survey indicates a larger affected area on the eastern side due to the litter fire, where neither DD nor the drone detected damaged crowns.

4. Discussion

The two-tier forest damage assessment approach presented in this study demonstrates that integrating satellite- and UAV-based remote sensing provides clear added value for operational forest damage monitoring, consistent with previous studies [49,50]. Sentinel-2 NDVI double-difference analysis supports early identification of damaged forest patches while reducing uncertainties caused by interannual weather variability and phenological shifts. The method proved particularly effective for delineating both gradual, drought-driven stand decline and sudden disturbances such as forest fire.
The UAV-based photogrammetric workflow enabled detailed validation and fine-scale interpretation of the satellite results. Individual-tree canopy segmentation combined with object-based NDVI analysis allowed the number and spatial distribution of damaged trees to be mapped with high accuracy, including cases where damage was not clearly visible in RGB imagery. While the satellite- and UAV-based assessments showed good agreement, discrepancies arose from differences in spatial resolution, aggregation units (pixel vs. crown), and the fact that the satellite analysis captures change between two time points whereas the UAV reflects current condition. The integration of photogrammetric point clouds with ALS-derived terrain models further improved CHM generation and supported robust segmentation.
Our results also suggest that satellite-based NDVI change detection is most sensitive to recent or ongoing damage processes, whereas UAV-based analysis can reveal impacts of earlier, multi-year degradation. This underscores the benefit of combining multi-scale data sources with complementary temporal and spatial sensitivities. Given that the satellite approach may capture varying degrees of damage, future work could also explore classifying UAV-derived canopy maps into multiple species and damage categories.

5. Conclusions

This study shows that a combined Sentinel-2 NDVI double-difference and UAV photogrammetry workflow can provide an operational, cost-effective, and repeatable framework for multi-scale forest damage monitoring. The approach is readily applicable in Hungarian forest management practice and can complement existing national forest monitoring systems by delivering decision-support information on the magnitude and spatial patterns of forest damage.
Future developments should include multi-temporal UAV surveys, the integration of additional spectral indices and LiDAR-derived features, and extension to larger areas and diverse forest types. As the proposed method was developed for conifer stands (Norway spruce and Scots pine), applications to broadleaved forests will require parameter re-calibration.

Author Contributions

Conceptualization, B.H., Á.F. and K.C.; methodology, N.Á. and K.C.; software, N.Á., B.S. and K.C.; validation, N.Á., Á.F. and M.P.; formal analysis, B.S.; investigation, N.Á.; resources, N.Á. and B.S.; data curation, K.C.; writing—original draft preparation, N.Á. and K.C.; writing—review and editing, N.Á., K.C., B.S., Á.F. and G.S.; visualization, N.Á.; supervision, B.H. and K.C.; project administration, B.H.; funding acquisition, K.C. All authors have read and agreed to the published version of the manuscript.

Funding

This research received funds from the project TKP2021-NVA-13 which has been implemented with the support provided by the Ministry of Culture and Innovation of Hungary from the National Research, Development and Innovation Fund, financed under the TKP2021-NVA funding scheme.

Data Availability Statement

The data that support the findings of this study are available from the corresponding authors upon reasonable request.

Acknowledgments

We thank the colleagues who participated directly and indirectly in this research for their support, especially the forest engineering students in the field measurements, and the university colleagues in the procurement and administrative tasks.

Conflicts of Interest

Authors Ádám Folcz, Preisinger Márk, Gyula Sándor were employed by the Study Forestry Private Limited Company (TAEG PLC). They participated in the fieldwork and the introduction of the compartments in the study. The role of the company was limited to providing access to the study area, facilitating field operations, and supplying relevant forest management data necessary for the research. The company had no role in the study design, data analysis, data interpretation, manuscript writing, or the decision to publish the results. The remaining authors declare that the research was conducted in the absence of any commercial or financial relationships that could be construed as a potential conflict of interest.

Abbreviations

The following abbreviations are used in this manuscript:
ALSAirborne Laser Scanning
DDDouble difference
DEMDigital Elevation Model
DSMDigital Surface Model
CHMCanopy Height Model
NDVINormalized Vegetation Index
UAVUnmanned Aerial Vehicle
SVMSupport Vector Machine
LiDARLight Detection and Ranging

References

  1. Banskota, A.; Kayastha, N.; Falkowski, M.J.; Wulder, M.A.; Froese, R.E.; White, J.C. Forest Monitoring Using Landsat Time Series Data: A Review. Can. J. Remote Sens. 2014, 40, 362–384. [Google Scholar] [CrossRef]
  2. Laštovička, J.; Švec, P.; Paluba, D.; Kobliuk, N.; Svoboda, J.; Hladký, R.; Stych, P. Sentinel-2 Data in an Evaluation of the Impact of the Disturbances on Forest Vegetation. Remote Sens. 2020, 12, 1914. [Google Scholar] [CrossRef]
  3. Huete, A.R. Vegetation Indices, Remote Sensing and Forest Monitoring. Geogr. Compass 2012, 6, e2379. [Google Scholar] [CrossRef]
  4. Modzelewska, A.; Stereńczak, K.; Mierczyk, M.; Maciuk, S.; Bałazy, R.; Zawiła-Niedźwiecki, T. Sensitivity of Vegetation Indices in Relation to Parameters of Norway Spruce Stands. Folia For. Pol. Ser. A—For. 2017, 59, 85–98. [Google Scholar] [CrossRef]
  5. Wu, L.; Li, Z.; Liu, X.; Zhu, L.; Tang, Y.; Zhang, B.; Xu, B.; Liu, M.; Meng, Y.; Liu, B. Multi-Type Forest Change Detection Using BFAST and Monthly Landsat Time Series for Monitoring Spatiotemporal Dynamics of Forests in Subtropical Wetland. Remote Sens. 2020, 12, 341. [Google Scholar] [CrossRef]
  6. Jahromi, M.N.; Naghdizadegan Jahromi, M.; Zolghadr-Asli, B.; Pourghasemi, H.R.; Alavipanah, S.K. Google Earth Engine and Its Application in Forest Sciences. In Spatial Modeling in Forest Resources Management; Springer: Cham, Switzerland, 2020; pp. 629–649. [Google Scholar] [CrossRef]
  7. Chen, S.; Woodcock, C.E.; Bullock, E.L.; Arévalo, P.; Torchinava, P.; Peng, S.; Olofsson, P. Monitoring temperate forest degradation on Google Earth Engine using Landsat time series analysis. Remote Sens. Environ. 2021, 265, 112648. [Google Scholar] [CrossRef]
  8. Hird, J.N.; Kariyeva, J.; McDermid, G.J. Satellite Time Series and Google Earth Engine Democratize the Process of Forest-Recovery Monitoring over Large Areas. Remote Sens. 2021, 13, 4745. [Google Scholar] [CrossRef]
  9. Global Forest Watch. Interactive Forest Monitoring Platform. Available online: https://www.globalforestwatch.org (accessed on 8 January 2026).
  10. Länderübergreifendes Umweltportal. Forest Monitoring and Environmental Data Platform. Available online: https://forestwatch.lup-umwelt.de/ (accessed on 8 January 2026).
  11. National Forest Centre of Slovakia. Forest Monitoring Application (m_aplikacia). Available online: http://www.nlcsk.sk/stales/m_aplikacia_en.html (accessed on 8 January 2026).
  12. Forest Management Institute of the Czech Republic. Remote Sensing Map Portal (MapyDpz). Available online: https://trendy.uhul.cz (accessed on 8 January 2026).
  13. Slovenia Forest Service. Spatial Data Viewer. Available online: https://prostor.zgs.gov.si/pregledovalnik/?locale=en (accessed on 8 January 2026).
  14. Norwegian Institute of Bioeconomy Research (NIBIO). Kilden Spatial Data Portal. Available online: https://kilden.nibio.no/ (accessed on 8 January 2026).
  15. Somogyi, Z.; Koltay, A.; Molnár, T.; Móricz, N. Forest Health Monitoring System in Hungary Based on MODIS Products. Technical Report, TEMRE, Debrecen, Hungary, 24 May 2018. Available online: http://www.temre.hu/temre/publikaciok/Somogyi_forest_health_monitoring_2018.pdf (accessed on 8 January 2026).
  16. TEMRE. Forest Health and Environmental Monitoring System. Available online: http://www.temre.hu/ (accessed on 8 January 2026).
  17. Verykokou, S.; Ioannidis, C. Image Matching: A Comprehensive Overview of Conventional and Learning-Based Methods. Encyclopedia 2025, 5, 4. [Google Scholar] [CrossRef]
  18. Karami, E.; Prasad, S.; Shehata, M. Image Matching Using SIFT, SURF, BRIEF and ORB: Performance Comparison for Distorted Images. arXiv 2017, arXiv:1710.02726. [Google Scholar] [CrossRef]
  19. Hirschmüller, H. Accurate and Efficient Stereo Processing by Semi-Global Matching and Mutual Information. In Proceedings of the IEEE Computer Vision and Pattern Recognition (CVPR), San Diego, CA, USA, 25–27 June 2005; IEEE: New York, NY, USA, 2005; pp. 807–814. [Google Scholar] [CrossRef]
  20. Furukawa, Y.; Hernández, C. Foundations and Trends® in Computer Graphics and Vision. In Multi-View Stereo: A Tutorial; Now Publishers Inc.: Boston/Hanover, MA, USA, 2015; Volume 9, pp. 1–148. [Google Scholar] [CrossRef]
  21. Westoby, M.J.; Brasington, J.; Glasser, N.F.; Hambrey, M.J.; Reynolds, J.M. Structure-from-Motion’ photogrammetry: A low-cost, effective tool for geoscience applications. Geomorphology 2012, 179, 300–314. [Google Scholar] [CrossRef]
  22. Verhoeven, G.; Doneus, M.; Briese, C.; Vermeulenc, F. Mapping by matching: A computer vision-based approach to fast and accurate georeferencing of archaeological aerial photographs. J. Archaeol. Sci. 2012, 39, 2060–2070. [Google Scholar] [CrossRef]
  23. Harwin, S.; Lucieer, A.; Osborn, J. The Impact of the Calibration Method on the Accuracy of Point Clouds Derived Using Unmanned Aerial Vehicle Multi-View Stereopsis. Remote Sens. 2015, 7, 11933–11953. [Google Scholar] [CrossRef]
  24. Dhruva, A.; Hartley, R.J.L.; Redpath, T.A.N.; Estarija, H.J.C.; Cajes, D.; Massam, P.D. Effective UAV Photogrammetry for Forest Management: New Insights on Side Overlap and Flight Parameters. Forests 2024, 15, 2135. [Google Scholar] [CrossRef]
  25. Sadeq, H.A. Accuracy Assessment Using Different UAV Image Overlaps. J. Unmanned Veh. Syst. 2019, 7, 175–193. [Google Scholar] [CrossRef]
  26. Ahmed, S.; El-Shazly, A.; Abed, F.; Ahmed, W. The Influence of Flight Direction and Camera Orientation on the Quality Products of UAV-Based SfM-Photogrammetry. Appl. Sci. 2022, 12, 10492. [Google Scholar] [CrossRef]
  27. Szász, B.; Heil, B.; Kovács, G.; Mészáros, D.; Czimber, K. Comparison of Advanced Terrestrial and Aerial Remote Sensing Methods for Above-Ground Carbon Stock Estimation—A Comparative Case Study for a Hungarian Temperate Forest. Remote Sens. 2025, 17, 2173. [Google Scholar] [CrossRef]
  28. Krause, S.; Sanders, T.G.M.; Mund, J.-P.; Greve, K. UAV-Based Photogrammetric Tree Height Measurement for Intensive Forest Monitoring. Remote Sens. 2019, 11, 758. [Google Scholar] [CrossRef]
  29. Vacca, G.; Vecchi, E. UAV Photogrammetric Surveys for Tree Height Estimation. Drones 2024, 8, 106. [Google Scholar] [CrossRef]
  30. Panagiotidis, D.; Abdollahnejad, A.; Surový, P.; Chiteculo, V. Determining Tree Height and Crown Diameter from High-Resolution UAV Imagery. Int. J. Remote Sens. 2017, 38, 2392–2410. [Google Scholar] [CrossRef]
  31. Pourreza, M.; Moradi, F.; Khosravi, M.; Deljouei, A.; Vanderhoof, M.K. GCPs-Free Photogrammetry for Estimating Tree Height and Crown Diameter in Arizona Cypress Plantation Using UAV-Mounted GNSS RTK. Forests 2022, 13, 1905. [Google Scholar] [CrossRef]
  32. Pádua, L.; Marques, P.; Adão, T.; Hruška, J.; Peres, E.; Morais, R.; Sousa, A.; Sousa, J.J. UAS-Based Imagery and Photogrammetric Processing for Tree Height and Crown Diameter Extraction. In Proceedings of the International Conference on Geoinformatics and Data Analysis (ICGDA ’18), Prague, Czech Republic, 20–22 April 2018; pp. 87–91. [Google Scholar] [CrossRef]
  33. Iizuka, K.; Yonehara, T.; Itoh, M.; Kosugi, Y. Estimating Tree Height and Diameter at Breast Height (DBH) from Digital Surface Models and Orthophotos Obtained with an Unmanned Aerial System for a Japanese Cypress (Chamaecyparis obtusa) Forest. Remote Sens. 2018, 10, 13. [Google Scholar] [CrossRef]
  34. Erfanifard, Y.; Hosingholizade, A.; Griess, V.C.; Garcia Millan, V.E.; Pirasteh, S. Estimating Tree Diameter at Breast Height (DBH) from UAV Data: A Comparison of Oblique–Vertical Imagery Fusion and Allometric Modeling. Sci. Remote Sens. 2025, 12, 100331. [Google Scholar] [CrossRef]
  35. Kameyama, S.; Sugiura, K. Estimating Tree Height and Volume Using Unmanned Aerial Vehicle Photography and SfM Technology, with Verification of Result Accuracy. Drones 2020, 4, 19. [Google Scholar] [CrossRef]
  36. Pessacg, F.; Gómez-Fernández, F.; Nitsche, M.; Chamo, N.; Torrella, S.; Ginzburg, R.; De Cristóforis, P. Simplifying UAV-Based Photogrammetry in Forestry: How to Generate Accurate Digital Terrain Model and Assess Flight Mission Settings. Forests 2022, 13, 173. [Google Scholar] [CrossRef]
  37. Graham, A.; Coops, N.C.; Wilcox, M.; Plowright, A. Evaluation of Ground Surface Models Derived from Unmanned Aerial Systems with Digital Aerial Photogrammetry in a Disturbed Conifer Forest. Remote Sens. 2019, 11, 84. [Google Scholar] [CrossRef]
  38. Lei, L.; Yin, T.; Chai, G.; Li, Y.; Wang, Y.; Jia, X.; Zhang, X. A Novel Algorithm of Individual Tree Crowns Segmentation Considering Three-Dimensional Canopy Attributes Using UAV Oblique Photos. Int. J. Appl. Earth Obs. Geoinf. 2022, 112, 102893. [Google Scholar] [CrossRef]
  39. Hu, B.; Li, J.; Jing, L.; Judah, A. Improving the Efficiency and Accuracy of Individual Tree Crown Delineation from High-Density LiDAR Data. Int. J. Appl. Earth Obs. Geoinf. 2014, 26, 145–155. [Google Scholar] [CrossRef]
  40. Campbell, M.J.; Dennison, P.E.; Tune, J.W.; Kannenberg, S.A.; Kerr, K.L.; Codding, B.F.; Anderegg, W.R.L. A Multi-Sensor, Multi-Scale Approach to Mapping Tree Mortality in Woodland Ecosystems. Remote Sens. Environ. 2020, 245, 111853. [Google Scholar] [CrossRef]
  41. Liu, J.; Jing, L.; Li, Y.; Tang, Y. A Tree Canopy Height Delineation Method Based on Morphological Reconstruction—Open Crown Decomposition. IOP Conf. Ser. Earth Environ. Sci. 2016, 34, 012020. [Google Scholar] [CrossRef]
  42. Szász, B.; Heil, B.; Kovács, G.; Heilig, D.; Veperdi, G.; Mészáros, D.; Illés, G.; Czimber, K. Investigation of the Relationship between Topographic and Forest Stand Characteristics Using Aerial Laser Scanning and Field Survey Data. Forests 2024, 15, 1546. [Google Scholar] [CrossRef]
  43. Czimber, K.; Szász, B.; Ács, N.; Heilig, D.; Illés, G.; Mészáros, D.; Veperdi, G.; Heil, B.; Kovács, G. Estimation of the Total Carbon Stock of Dudles Forest Based on Satellite Imagery, Airborne Laser Scanning, and Field Surveys. Forests 2025, 16, 512. [Google Scholar] [CrossRef]
  44. Miraki, M.; Sohrabi, H.; Fatehi, P.; Kneubuehler, M. Individual Tree Crown Delineation from High-Resolution UAV Images in Broadleaf Forest. Ecol. Inform. 2021, 61, 101207. [Google Scholar] [CrossRef]
  45. Hosingholizade, A.; Erfanifard, Y.; Alavipanah, S.K.; Millan, V.E.G.; Mielcarek, M.; Pirasteh, S.; Stereńczak, K. Assessment of Pine Tree Crown Delineation Algorithms on UAV Data: From K-Means Clustering to CNN Segmentation. Forests 2025, 16, 228. [Google Scholar] [CrossRef]
  46. Dash, J.P.; Watt, M.S.; Pearse, G.D.; Heaphy, M.; Dungey, H.S. Assessing Very High Resolution UAV Imagery for Monitoring Forest Health during a Simulated Disease Outbreak. ISPRS J. Photogramm. Remote Sens. 2017, 131, 1–14. [Google Scholar] [CrossRef]
  47. Manase, A.; Manyevere, A.; Abd Elbasit, M.A.M.; Mashamaite, C.V. The Use of UAV-Based Systems in Monitoring Forest Health: Potentials and Challenges. Sci. Afr. 2025, 28, e02724. [Google Scholar] [CrossRef]
  48. Ecke, S.; Dempewolf, J.; Frey, J.; Schwaller, A.; Endres, E.; Klemmt, H.-J.; Tiede, D.; Seifert, T. UAV-Based Forest Health Monitoring: A Systematic Review. Remote Sens. 2022, 14, 3205. [Google Scholar] [CrossRef]
  49. Dash, J.P.; Watt, M.S.; Pearse, G.D.; Heaphy, M. UAV Multispectral Imagery Can Complement Satellite Data for Monitoring Forest Health. Remote Sens. 2018, 10, 1216. [Google Scholar] [CrossRef]
  50. Fraser, B.T.; Congalton, R.G. Monitoring Fine-Scale Forest Health Using Unmanned Aerial Systems (UAS) Multispectral Models. Remote Sens. 2021, 13, 4873. [Google Scholar] [CrossRef]
  51. Peters, A.J.; Walter-Shea, E.A.; Andrés Viña, L.J.; Hayes, M.; Svoboda, M.D. Drought monitoring with NDVI-based standardized vegetation index. Photogramm. Eng. Remote Sens. 2002, 68, 72–75. [Google Scholar]
  52. Czimber, K.; Rekecki, D.; Ács, N. Development of a satellite-based forest protection monitoring system (In Hungarian: Erdővédelmi műholdas monitoring rendszer fejlesztése). In Az Elmélet és Gyakorlat Találkozása a Térinformatikában XIV.: Theory Meets Practice in GIS; Vanda Éva, A.M., Ed.; Debreceni Egyetemi Kiadó: Debrecen, Magyarország, 2023; pp. 61–66. [Google Scholar]
Figure 1. The selected sample plots are located in the Sopron Hills.
Remotesensing 18 00803 g001
Figure 2. Flowchart of the survey and processing methodology.
Remotesensing 18 00803 g002
Figure 3. Merged point cloud from UAV image matching and ALS Points in sopron 199/A.
Remotesensing 18 00803 g003
Figure 4. Visual selection of conifers (brown), broadleaf (green), and dead trees (purple) on an image composite (left image). Distribution of the randomly selected training and testing crowns (right image).
Remotesensing 18 00803 g004
Figure 5. Satellite based analysis in Sopron 199/A. (Left): 07.2024. NDVI, (Middle): 07.2025. NDVI (Right): 07.2025. NDVI double difference.
Remotesensing 18 00803 g005
Figure 6. NDVI double difference and burned area in Sopron 113/G.
Remotesensing 18 00803 g006
Figure 7. Interannual changes based on the DD method (three maps on the left) and the number of interannual decreases (map on the right). (Normal red and black lines are the boundary of the compartment, thin black lines are the damaged crown boundaries.)
Remotesensing 18 00803 g007
Figure 8. Visual comparison of the segmentation methods, white lines are the segmented crown boundaries. Upper: inverse watershed, Lower: best of TreeDetect segmentation.
Remotesensing 18 00803 g008
Figure 9. An example of TreeDetect segmentation (white lines) in Sopron 113/G.
Remotesensing 18 00803 g009
Figure 10. An example of NDVI-based classification in Sopron 199/A, white lines are the boundaries of the damaged tree crowns.
Remotesensing 18 00803 g010
Figure 11. An example of NDVI-based classification in Sopron 113/G, white lines are the boundaries of the damaged tree crowns.
Remotesensing 18 00803 g011
Figure 12. Model 1 (RF) classification in Sopron 199/A.
Remotesensing 18 00803 g012
Figure 13. Satellite NDVI difference and damaged trees from NDVI-based UAV classification in Sopron 199/A.
Remotesensing 18 00803 g013
Figure 14. Satellite NDVI difference and damaged trees from NDVI-based UAV classification in Sopron 113/G.
Remotesensing 18 00803 g014
Table 1. Validation of the segmentation methods in Sopron 199/A.
Segmentation MethodDetected Trees
Sample plot–based complete tree enumeration1674
TopoXmap inverse watershed delineation2166
TreeDetect mixed (2.0 m)1494
TreeDetect mixed (2.5 m)1636
TreeDetect (Voxel based)2025
Table 2. Results of NDVI-based classification in Sopron 199/A.
PropertyValue
Area (m2)21,600
Number of Trees1674
NDVI Mean0.83
NDVI Deviation0.11
NDVI Threshold0.72
Number of Damaged Trees168
Damaged Area (m2)1575
Damaged Area (%)7.0
Table 3. Results of NDVI-based classification in Sopron 113/G.
PropertyValue
Area (m2)85,600
Number of Trees5098
NDVI Mean0.81
NDVI Deviation0.07
NDVI Threshold0.74
Number of Damaged Trees695
Damaged Area (m2)9659
Damaged Area (%)11.0
Table 4. Overall Accuracies of the supervised OBIA classifications in Sopron 199/A.
NameAlgorithmBandsOA (%)
Model 1RFR, G, NIR, REDGE97.8
Model 2RFR, G, NIR, REDGE, NDVI, NDRE, GNDVI100.0
Model 3SVMR, G, NIR, REDGE97.8
Model 4SVMR, G, NIR, REDGE, NDVI, NDRE, GNDVI97.8
Table 5. Deciduous to coniferous ratio of the supervised OBIA classifications in Sopron 199/A.
NameDeciduous (%)Coniferous (%)
Model 16535
Model 26535
Model 36634
Model 46832
Table 6. Damaged areas of the classifications in Sopron 199/A.
ClassificationDamaged Area (%)
NDVI-based7.0
Model 110.0
Model 212.0
Model 39.0
Model 49.0
Table 7. Omission and commission counts at various DD delineation thresholds for 199/A.
DD LimitDD + UAVDD OnlyUAV Only
<05813022
<−0.01448636
<−0.02323848
<−0.03251555
Table 8. Omission and commission counts at various DD delineation thresholds for 113/G.
DD LimitDD + SurveySurvey OnlyDD + UAVSurvey + UAV
<0197451594
<−0.011696415013
<−0.021537214221
<−0.031327812736
Disclaimer/Publisher’s Note: The statements, opinions and data contained in all publications are solely those of the individual author(s) and contributor(s) and not of MDPI and/or the editor(s). MDPI and/or the editor(s) disclaim responsibility for any injury to people or property resulting from any ideas, methods, instructions or products referred to in the content.