Article

Revealing Driving Factors of Spatiotemporal Deformation in Typical Landslides of the Jinsha River Hulukou–Xiangbiling Segment Using InSAR: A Case Study of Xiaxiaomidi and Chenjiatian Landslides

1
Geophysical Exploration Academy of China Metallurgical Geology Bureau, Baoding 071051, China
2
School of Land and Technology, China University of Geosciences, Beijing 100083, China
3
Department of Geologic Engineering, Qinghai University, Xining 810016, China
4
Shanxi Intelligent Transportation Research Institute Co., Ltd., Taiyuan 030032, China
*
Author to whom correspondence should be addressed.
These authors contributed equally to this work.
Remote Sens. 2026, 18(5), 784; https://doi.org/10.3390/rs18050784
Submission received: 6 December 2025 / Revised: 22 January 2026 / Accepted: 25 February 2026 / Published: 4 March 2026

Highlights

What are the main findings?
  • SBAS-InSAR time series combined with trend–cycle decomposition and CWT/XWT/WTC show that the reservoir-bank Xiaxiaomidi and non-reservoir Chenjiatian landslides have contrasting deformation patterns and hydrological controls.
  • Xiaxiaomidi exhibits continuously accelerating, lower-slope-dominated, water-level-driven deformation with weak rainfall periodicity, whereas Chenjiatian shows long-term creep plus a robust 365-day cycle strongly coherent with rainfall and a 1–2 month lag.
What are the implications of the main findings?
  • For reservoir-bank landslides such as Xiaxiaomidi, hazard assessment and early warning should focus on reservoir operation (water-level amplitude and rate of change) and toe stability rather than rainfall thresholds.
  • For rainfall-controlled landslides such as Chenjiatian, the quantified annual cycle and lag support the development of seasonal rainfall- and antecedent-moisture–based early-warning models, and the InSAR–wavelet framework is transferable to other mountainous river basins.

Abstract

The Hulukou-Xiangbiling section of the Jinsha River is located in a typical high-mountain gorge area characterized by a complex geological environment, rendering it highly susceptible to landslide disasters. To reveal the deformation mechanisms of typical landslides in this region under hydrological effects, this study employed the Small Baseline Subset InSAR (SBAS-InSAR) technique to process multi-track Sentinel-1 SAR images acquired between 2021 and 2024. Long-term deformation time series were extracted for the Xiaxiaomidi and Chenjiatian landslides. On this basis, a systematic multi-scale coupling analysis of the deformation characteristics was conducted using trend-cycle decomposition, Continuous Wavelet Transform (CWT), Cross Wavelet Transform (XWT), and Wavelet Coherence (WTC). The results indicate that although the two landslides are located in the same river section, their deformation mechanisms and hydrological response patterns differ significantly. The deformation of the Xiaomidi landslide is mainly concentrated in the lower part of the slope, exhibiting a characteristic of continuous acceleration. The analysis demonstrates that the evolution of this landslide is primarily controlled by hydrodynamic processes such as toe unloading, water body erosion, and water level fluctuations. In contrast, the Chenjiatian landslide displays a distinct dominant cycle of 365 days, manifesting as a composite mode of long-term creep superimposed with seasonal acceleration. Its deformation shows a high correlation with rainfall (correlation coefficient > 0.9), with a lag effect of approximately 1 to 2 months. This reflects the dominant role of rainfall infiltration and pore pressure transfer in the landslide dynamics.

1. Introduction

The Jinsha River basin is characterized by typical high-mountain gorge geomorphology, featuring steep slopes, fractured geological structures, and developed fissures. Influenced by multiple triggering factors such as heavy rainfall, reservoir water level fluctuations, and engineering excavation disturbances, landslides occur frequently. Consequently, this region is one of the areas in the Sichuan-Yunnan region where landslide activities are most concentrated and the consequences are most severe [1,2]. For instance, two large-scale high-elevation landslides occurred on 11 October and 3 November 2018 in the upper reaches of the Jinsha River near Baige Village, Jiangda County, Tibet. The massive rock avalanches blocked the river channel, resulting in the formation of a barrier lake with an estimated volume of approximately 2.9 × 10⁸ m3, which affected more than 20,000 residents and caused significant economic losses and societal disruption [3]. In recent years, the progressive impoundment and operation of cascade hydropower reservoirs, including Baihetan, Wudongde, Xiluodu, and Xiangjiaba, have introduced pronounced reservoir water-level fluctuations. The associated processes of saturation-induced weakening and stress unloading have substantially modified slope stability along reservoir banks, leading to increasingly complex landslide deformation behaviors and triggering mechanisms [4,5,6]. Meanwhile, monsoon-controlled regional rainfall significantly affects the moisture content, groundwater level, and shear strength of rock and soil masses in non-reservoir areas. This generates long-term and periodic disturbances to slope stability, causing some landslides to exhibit typical seasonal acceleration characteristics [7]. For example, Gao et al. integrated InSAR and LiDAR data to investigate the long-term surface deformation of the Hongyanzi landslide and identified intense rainfall as the dominant controlling factor, resulting in a long-term, slow-moving deformation pattern characterized by seasonal, step-like displacement [8]. Li et al. conducted a study in the upper Jinsha River and similarly found that when the cumulative rainfall over 15 days exceeded 120 mm, landslide deformation accelerated markedly after rainfall events, with a time lag of 2–28 days between rainfall peaks and displacement responses [9].
An analysis by Feng et al. of landslides upstream and downstream of the Baihetan Hydropower Station indicated that landslide responses to rainfall in this region exhibit a lag of approximately 60–90 days, and that high-elevation accumulation zones generally respond more slowly than lower-elevation tensile zones [10]. These studies collectively demonstrate that landslide deformation patterns in the Jinsha River basin are highly diverse and controlled by complex triggering mechanisms.
Based on time-series deformation curves, Miao et al. classified landslides into four categories—stable, accelerating, step-like, and convergent types—to characterize their hazard levels [11]. Therefore, effectively identifying the spatiotemporal deformation patterns of landslides and quantitatively elucidating their responses to rainfall and reservoir water-level variations have become key scientific issues for improving landslide hazard assessment and risk mitigation in the Jinsha River basin [12,13].
In recent years, Interferometric Synthetic Aperture Radar (InSAR) has become an important remote sensing tool for identifying and monitoring slow deformation of landslides in mountainous areas, due to its all-weather capability, wide coverage, and high precision [14,15]. In particular, InSAR time series techniques [16,17], such as Persistent Scatterer Interferometry (PS-InSAR) and the Small Baseline Subset (SBAS-InSAR), are capable of acquiring continuous, long-term deformation information. These techniques have been demonstrated to be effective in analyzing reservoir bank landslide activity, identifying seasonal landslides, and studying rainfall-deformation processes [7,18,19]. However, relying solely on time series InSAR data is often insufficient to fully reveal the dynamic driving mechanisms of landslides. Landslide deformation is frequently controlled by the coupling of multiple factors, including rainfall, reservoir water level fluctuations, groundwater recharge, and the evolution of rock and soil strength. Consequently, their time-series characteristics often exhibit significant non-stationarity and multi-scale features, making it difficult for traditional trend analysis or single-domain frequency methods to effectively capture these complex time-varying responses [13].
In this context, wavelet analysis provides an effective approach for revealing the coupling relationship between landslides and hydro-meteorological factors, owing to its advantage of characterizing signal features simultaneously in the time-frequency domain. Continuous Wavelet Transform (CWT) can identify the dominant periodic structure of landslide deformation; Cross Wavelet Transform (XWT) can reveal the common periodic energy distribution between landslides and rainfall or water level changes; and Wavelet Coherence (WTC) can further quantify the phase relationship and coupling strength between the two, making it particularly suitable for identifying seasonal responses and lag effects driven by hydrology. Previous studies have shown that wavelet methods possess unique advantages in interpreting seasonal accelerated deformation caused by rainfall [7], lag responses induced by reservoir water level changes [20], and multi-scale hydrological influence mechanisms [21]. Therefore, combining wavelet analysis with time-series InSAR deformation data helps to gain a deeper understanding of the spatiotemporal evolution of landslides under complex hydrological-mechanical gradients.
Based on the above considerations, this study employs a combination of trend–cycle decomposition, continuous wavelet transform (CWT), cross-wavelet transform (XWT), and wavelet coherence (WTC) to systematically investigate the responses of landslides in the Hulukou-Xiangbiling section of the Jinsha River to rainfall processes from a multi-scale time–frequency perspective. The analyses focus on identifying response characteristics, dominant periodic structures, and lag effects, thereby providing deeper insights into the primary factors governing landslide deformation in this region. The results indicate that landslide deformation in the study area can be broadly classified into two types. The first type is predominantly controlled by rainfall, exhibiting a pronounced annual periodicity, with deformation responses lagging rainfall by approximately 45 days. The second type is mainly influenced by reservoir water-level fluctuations, showing a strong correlation with water-level variations but lacking distinct periodic behavior. These findings provide important scientific support for improving the understanding of landslide dynamic mechanisms in the Jinsha River basin and for developing effective risk monitoring and early-warning models.

2. Study Area and Data Pre-Processing

2.1. Study Area

This study focuses on the areas along both banks of the Hulukou-Xiangbiling section of the main channel of the Jinsha River. As shown in Figure 1, the study area features typical high-mountain gorge geomorphology, characterized by deep valleys and steep slopes. The geological conditions are complex, predominantly composed of limestone and basalt, and exhibit intense physical and geological processes [22]. Furthermore, dense residential areas are distributed along both banks of the river channel, accompanied by several major transportation routes. This region is marked by intense human engineering activities, poor slope stability, and a climate significantly influenced by large topographic relief. Influenced by the southwest monsoon and the Jinsha River valley, the region exhibits high air humidity and distinct climatic variations. It belongs to a subtropical monsoon climate, with an annual average temperature ranging from 12 °C to 20 °C. Rainfall is concentrated between June and October, accounting for more than 90% of the annual precipitation, which renders the area highly prone to geological disasters such as landslides [23,24]. In summary, the geographical environment is dominated by high mountains and deep valleys with large topographic relief and drastic changes in water vapor. Consequently, InSAR measurement results are susceptible to interference from tropospheric vertical stratification atmospheric effects, potentially affecting the accuracy of landslide detection.

2.2. Data Pre-Processing

2.2.1. SAR Data

This study utilized two datasets from the Sentinel-1 satellite provided by the European Space Agency (ESA), including ascending track (Path 26, Frame 87) and descending track (Path 62, Frame 504) images. The coverage and detailed information of the data are indicated by the black frames in Figure 1 and listed in Table 1. The ascending dataset comprises 87 scenes acquired from 9 April 2021 to 29 April 2024, while the descending dataset consists of 93 scenes acquired from 10 June 2021 to 29 August 2024. The DEM used to eliminate topographic residuals in the InSAR processing was the ALOS World 3D-30 m (AW3D30), obtained from the Earth Observation Center of the Japan Aerospace Exploration Agency (JAXA). Additionally, precise orbit ephemerides provided by the Copernicus POD (Precise Orbit Determination) Service were used to eliminate orbit errors.

2.2.2. Rainfall and Reservoir Water Level Data

Rainfall data were derived from the ERA5-Land reanalysis dataset released by the European Centre for Medium-Range Weather Forecasts (ECMWF). This dataset provides land variable data with higher resolution than ERA5 and covers several decades of time-series data. ERA5-Land provides detailed meteorological and surface information by reanalyzing the ECMWF ERA5 climate reanalysis model in combination with global observational data. However, due to the limited resolution of the ERA5-Land dataset, it is difficult to precisely obtain micro-scale rainfall variations within the landslide body; only a relatively smooth, regional trend can be derived. Therefore, prior to correlation analysis, the original data were interpolated to match the spatial resolution of the rainfall dataset with that of the InSAR-derived data. Water level data were obtained from relevant literature, in which water levels were extracted using remote sensing image processing methods and their reliability was validated [25].

3. Methodology

3.1. SBAS-InSAR Processing

In this study, the SBAS-InSAR method was employed to derive long-term surface deformation time series in the Line of Sight (LOS) direction over the study area. First, geocoding and co-registration were performed separately for the ascending and descending images covering the study area. Subsequently, the co-registered images were geocoded again, and a mask file was generated to exclude areas with geometric distortions and layover/shadows. To improve coherence and ensure consistency with the spatial resolution of the DEM, multi-looking processing was applied to the SAR images with a factor of 10 in the range direction and 2 in the azimuth direction.
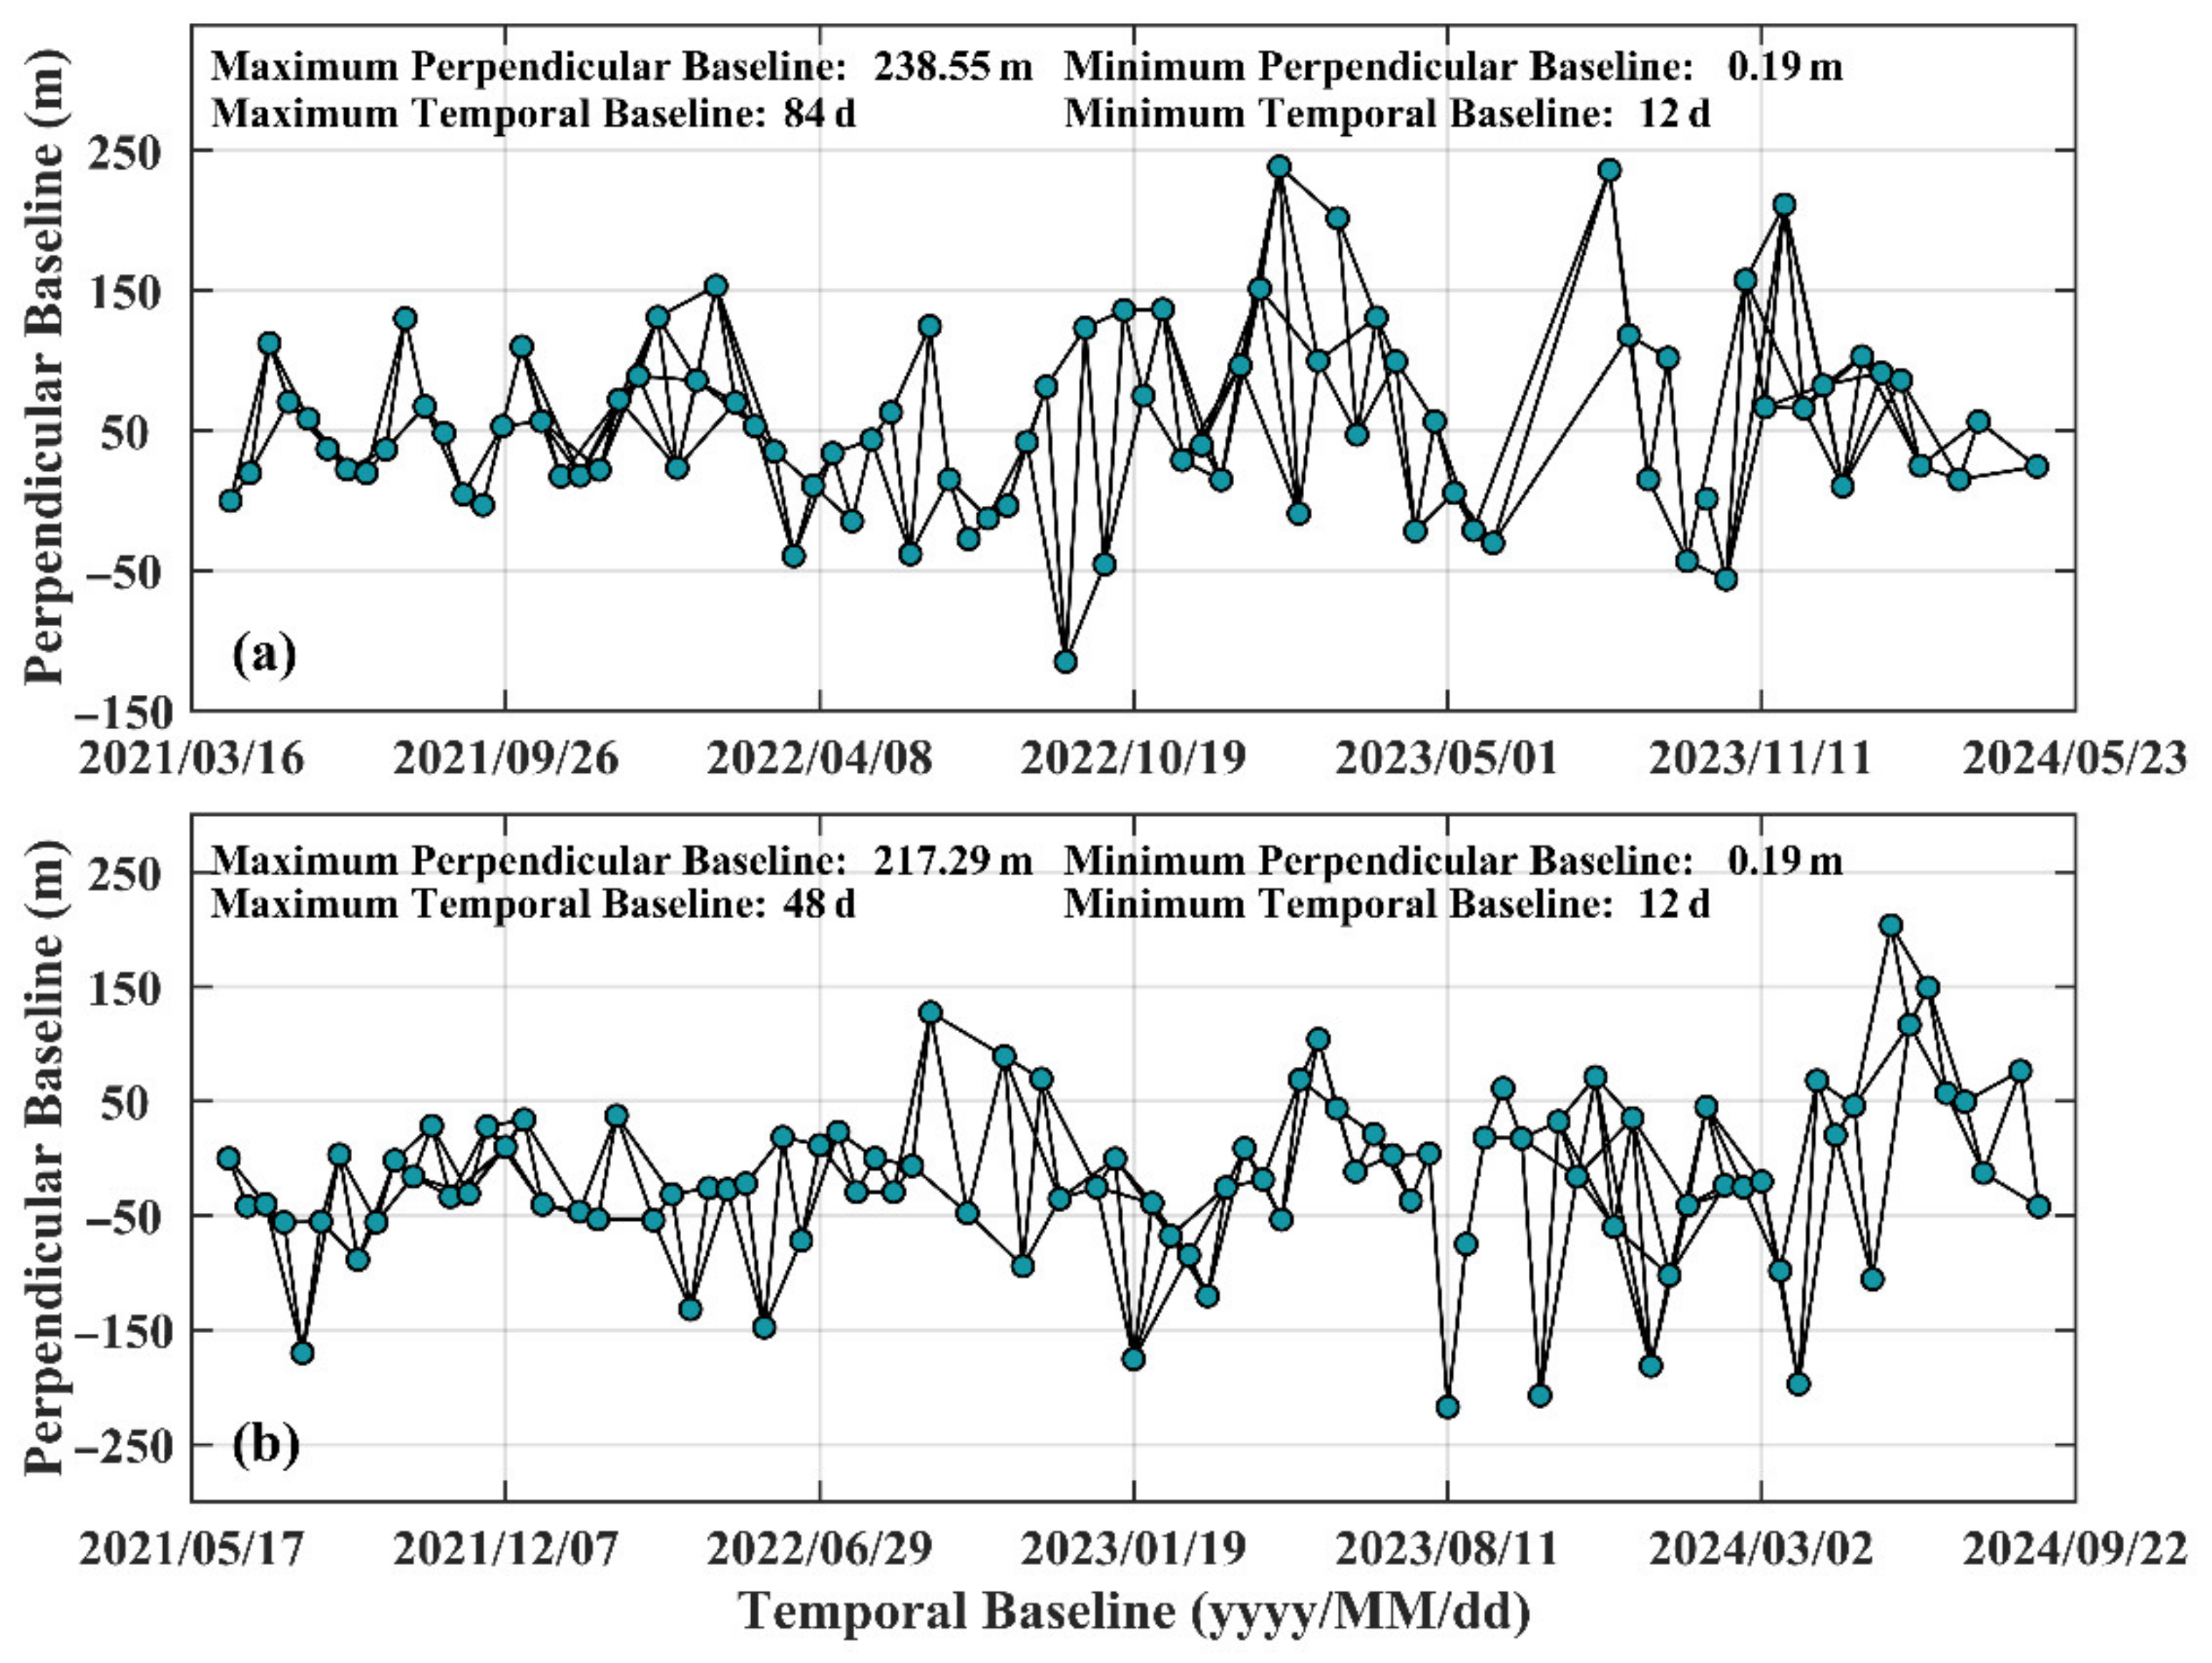
During the interferometric pair-construction stage, interferometric baselines are calculated based on a temporal baseline threshold of 36 days and a spatial baseline threshold of 300 m, after which the initial interferometric pairs are generated. To ensure that all interferograms belonged to the same subset, a small number of image pairs with temporal baselines slightly exceeding 36 days were also reasonably combined. The final temporal and spatial (perpendicular) baseline distributions of the interferometric pairs are shown in Figure 2. Subsequently, a Goldstein filter with a window size of 32 × 32 pixels was applied to the interferograms to suppress topographic residuals and flat-earth phase components, thereby enhancing the signal-to-noise ratio. Phase unwrapping was accomplished using the Minimum Cost Flow (MCF) algorithm. According to Equation (1), the components of the unwrapped phase of the interferogram were analyzed. Topographic residual phase φ r e s was removed through linear regression, and atmospheric delay effects were corrected using an empirical linear elevation model combined with spatiotemporal filtering methods φ a t m . Finally, Singular Value Decomposition (SVD) was utilized to estimate the deformation phase, obtaining the surface deformation rate and accumulated deformation φ d i s p . The results were re-projected to the WGS-84 coordinate system for subsequent analysis of landslide deformation characteristics and their correlation with rainfall.
φ u n w = φ r e s + φ a t m + φ d i s p + φ n o i s e

3.2. Correlation Analysis Between Rainfall and Deformation

3.2.1. Removal of Deformation Trend Component

The trend component typically represents the long-term variation trend of a landslide, which is mostly caused by geological tectonic movements or changes in soil moisture. Therefore, when analyzing the relationship between rainfall and landslide deformation, it is necessary to first process the original time series to remove the deformation trend component unrelated to rainfall variations.
For the modeling of the trend component, a quadratic polynomial of time was adopted to capture long-term non-linear variation trends. The mathematical relationship between the trend deformation T t and time t can be expressed as [26]:
T ( t ) = a 0 + a 1 t + 1 2 a 2 t 2
where T t is the surface displacement at time t , a 0 represents the initial displacement, a 1 denotes the linear deformation rate, and a 2 represents the acceleration or non-linear deformation rate.

3.2.2. Continuous Wavelet Transform (CWT)

Wavelet transform is a data analysis tool capable of analyzing the local characteristics of a signal simultaneously in the time and frequency domains. As a type of wavelet transform, Continuous Wavelet Transform (CWT) is primarily used for signal feature extraction. It involves convolving a discrete time series x n with a uniform time step δ t with a scaled and translated wavelet function to obtain the CWT [27,28]:
W n X ( s ) = δ t s n = 1 N x n φ 0 ( n n ) δ t s
Here, W n X ( s ) represents the wavelet transform coefficient, φ 0 is the wavelet basis function, s denotes the scale factor, and n is the time translation factor. The CWT can also be regarded as a collection of bandpass filters with uniform shape but varying positions and bandwidths.
When processing and analyzing time-series data, a non-orthogonal wavelet function is typically employed to achieve a smooth and continuous wavelet amplitude distribution. Considering application scenarios such as InSAR time-series solution and rainfall process analysis, the Morlet wavelet was selected as the mother wavelet, with its mathematical form as follows:
φ 0 ( t ) = π 1 4 e i ω 0 t e 1 2 t 2
Here, ω 0 represents the dimensionless central frequency, and t is the dimensionless time variable. The corresponding wavelet power spectrum can be expressed as W n X ( s ) . By adjusting the scale parameter s and performing local analysis in the time domain, the local fluctuation characteristics of the signal at a specific scale and its variation laws over time can be extracted.

3.2.3. Cross Wavelet Transform (XWT)

Cross Wavelet Transform (XWT) is an extension of CWT, primarily used to investigate the synergistic energy distribution characteristics of two time series in the time-frequency domain. This method can identify resonance regions between two different time series in time and frequency, thereby revealing their degree of consistency at specific cycles. It further allows for the quantitative assessment of the correlation strength and potential time lag relationship between them [28]. Given two time series X n and Y n , with their CWTs denoted as W n X ( s ) and W n Y ( s ) respectively, their cross-wavelet spectrum is defined as:
W X Y ( s ) = W n X ( s ) · W n Y * ( s ) = W X Y ( s ) e i Φ j ( s )
where W n X ( s ) and W n Y ( s ) are the wavelet transform coefficients of the two time series, and * denotes the complex conjugate operation. The resulting | W n X Y ( s ) | is the cross wavelet power. The phase angle Φ j s represents the phase delay between the two time-series signals, which can be converted into the time delay Δ t between them using their resonance period T :
Δ t = Φ j ( s ) · T 2 π

3.2.4. Wavelet Coherence (WTC)

When the CWT power spectrum of either of the two time series calculated by XWT exhibits a strong peak at a specific frequency, the absolute value of XWT may appear large even if there is no significant correlation between them, thus affecting the accuracy of the results. Wavelet Coherence (WTC) effectively compensates for this deficiency. WTC is a normalized measure for time series X and Y , which not only effectively overcomes the limitations of XWT in cases of unbalanced power distribution but also identifies potential correlations in low-power regions. The specific formula for WTC is expressed as follows:
R n X Y = ζ W n X Y ζ W n X ζ W n Y
Here, W n X Y represents the corresponding cross wavelet transform result, and ζ is a smoothing operator used to remove the interference of local fluctuations on the analysis results. R n X Y represents the wavelet coherence of the two time series over varying durations and temporal scales, with values ranging from 0 , 1 . A value closer to 1 indicates a stronger correlation between the two time series.

4. Results and Analysis

4.1. InSAR-Derived Deformation Results and Reliability Assessment

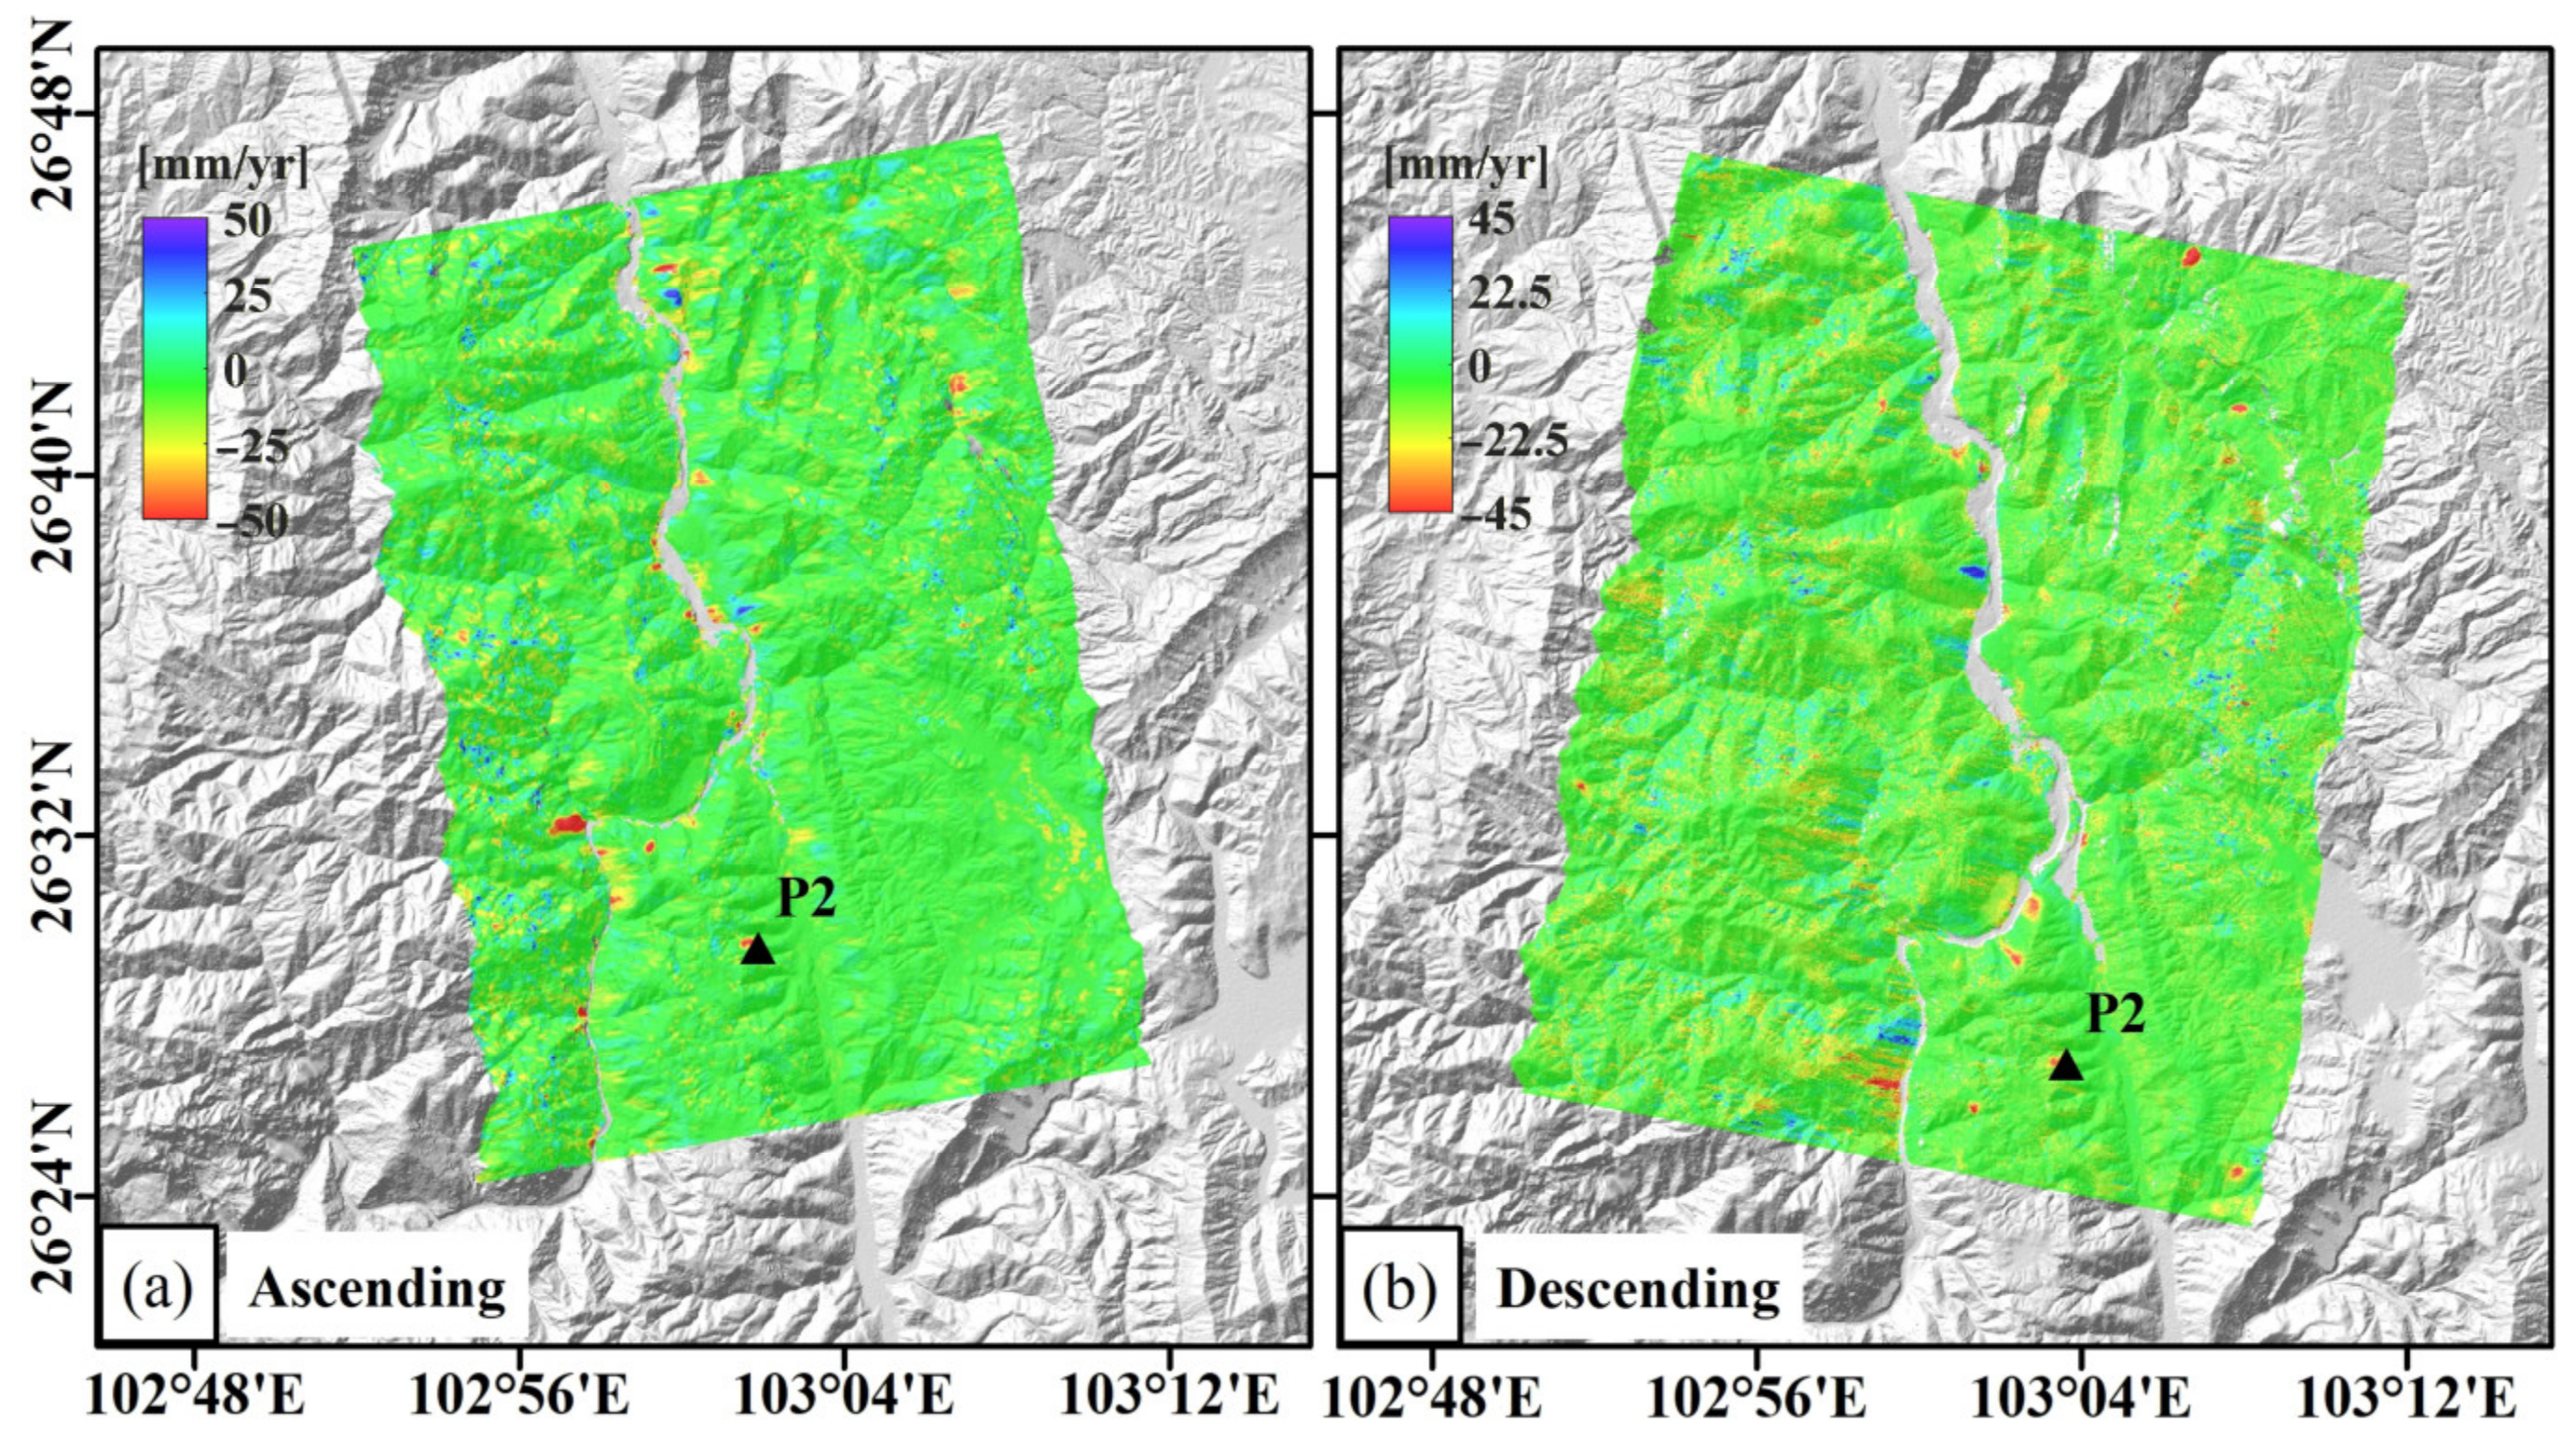
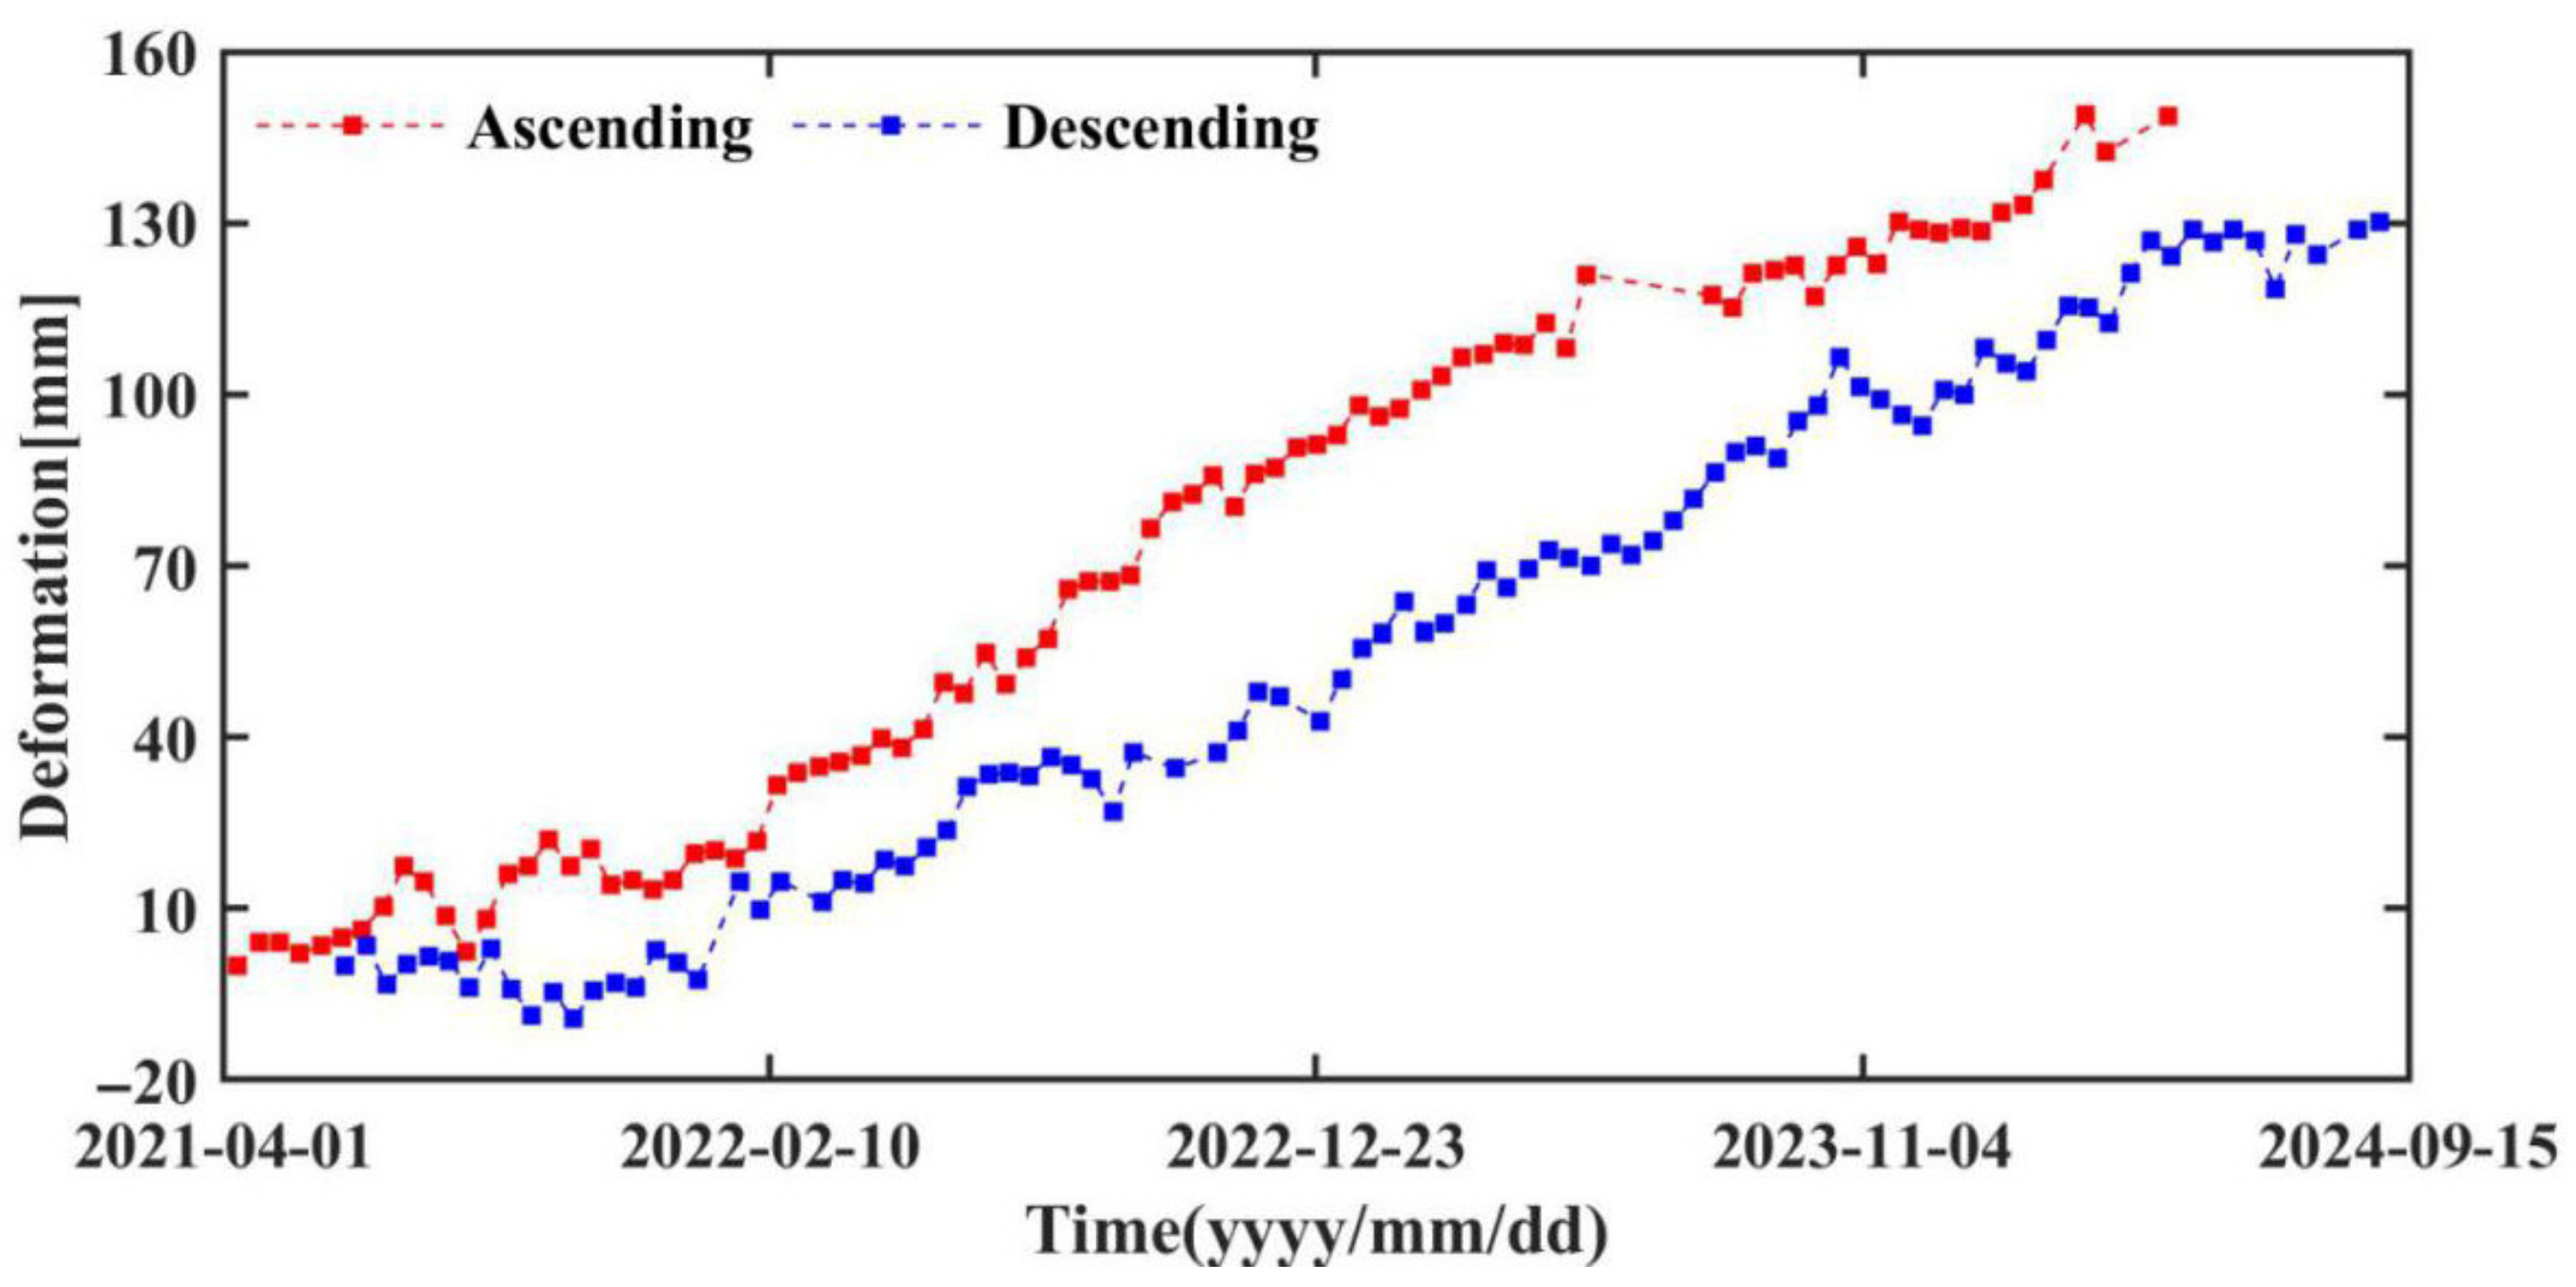
Prior to the detailed analysis of individual landslides, the reliability of the InSAR-derived deformation results was first assessed. As shown in Figure 3, a deformation characteristic point (P2) at an identical spatial location was selected from both ascending and descending InSAR datasets, and the corresponding deformation time series were extracted. As illustrated in Figure 4, despite the differences in radar imaging geometry between the two tracks, the deformation time series derived from ascending and descending observations exhibit good consistency in terms of the overall evolution trend and key temporal variations, indicating similar temporal behavior.
This cross-comparison between ascending and descending results provides evidence for the reliability of the InSAR-derived deformation presented in this study. It should be noted that InSAR measures displacement along the line-of-sight (LOS) direction, which represents a projection of the true three-dimensional ground deformation. Due to the different imaging geometries of ascending and descending tracks, their sensitivities to vertical and horizontal deformation components differ, resulting in discrepancies in accumulated deformation magnitudes, while the temporal evolution trends remain consistent.

4.2. Analysis of Spatiotemporal Deformation Characteristics of Typical Landslides

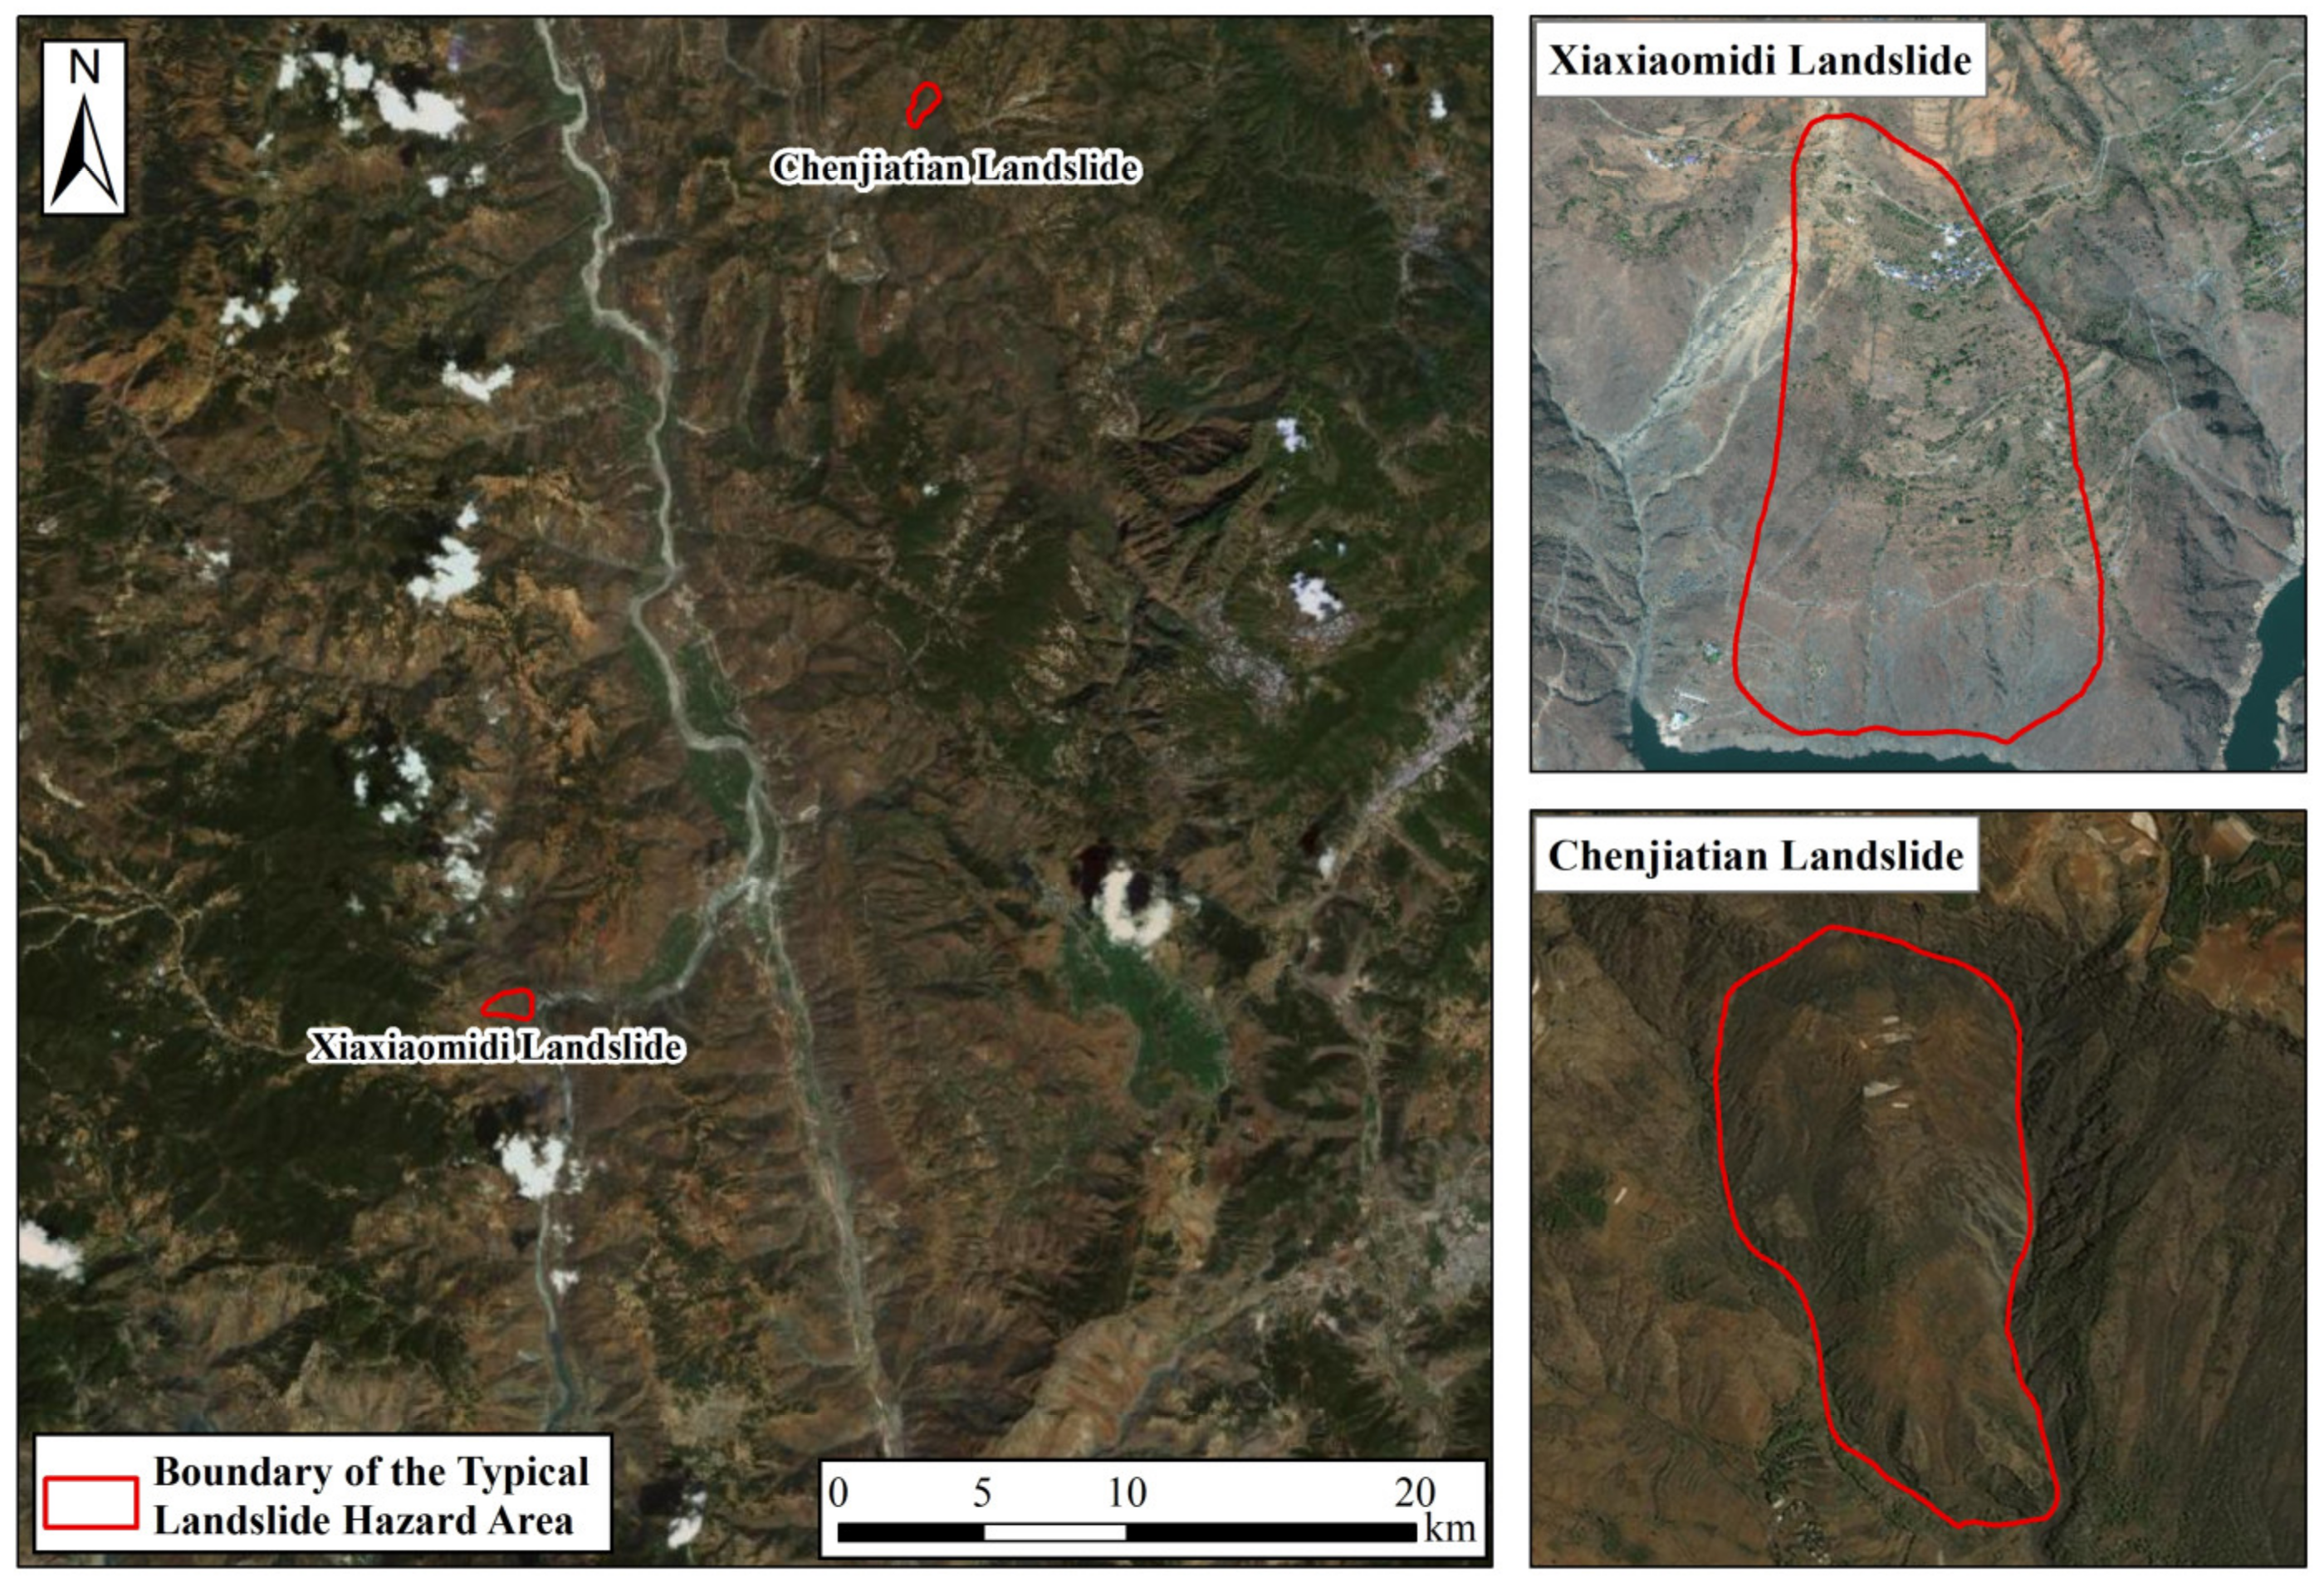
Based on the surface deformation information derived from SBAS-InSAR and combined with the interpretation results of Google optical images, potential landslide hazards within the study area were identified [29]. It should be noted that the landslide hazards identified in this study primarily focus on typical areas that exhibit significant deformation and whose landslide body outlines are clearly distinguishable in optical images. According to the spatial relationship between the landslide body and the Jinsha River channel, they are further classified into reservoir bank landslides and non-reservoir bank landslides. Specifically, the reservoir bank landslides include the Xiaxiaomidi landslide and the Shimenkan landslide, while the non-reservoir bank landslides comprise the Chenjiatian landslide and the Huangtiancun landslide. On this basis, an in-depth analysis of the spatiotemporal evolution characteristics of the aforementioned typical landslides was conducted, and their specific spatial distribution locations are shown in Figure 5.
To systematically reveal the spatiotemporal deformation laws of typical landslides in the Hulukou-Xiangbiling section of the Jinsha River and their coupling characteristics with rainfall processes, this study selected the Chenjiatian landslide and the Xiaxiaomidi landslide as core research objects based on a comprehensive analysis of the long-term deformation field from SBAS-InSAR and optical image information in the study area. Both landslides exhibit continuous and significant displacement evolution characteristics in the InSAR time series, with clear deformation signals and complete time series, providing a solid foundation for high-confidence deformation process analysis. At the same time, their sliding body boundaries are clear and structural features are highly identifiable in high-resolution optical images, showing good spatial consistency with the InSAR deformation field, which can effectively support landslide structure interpretation and active zone identification. Therefore, we consider that the Chenjiatian landslide and the Xiaxiaomidi landslide can typically reflect the spatiotemporal deformation modes and rainfall response laws of landslides in the study area. The subsequent content will systematically discuss their spatial distribution characteristics, time-series evolution processes, and rainfall triggering mechanisms.

4.2.1. Xiaxiaomidi Landslide

  • Spatial Deformation Information;
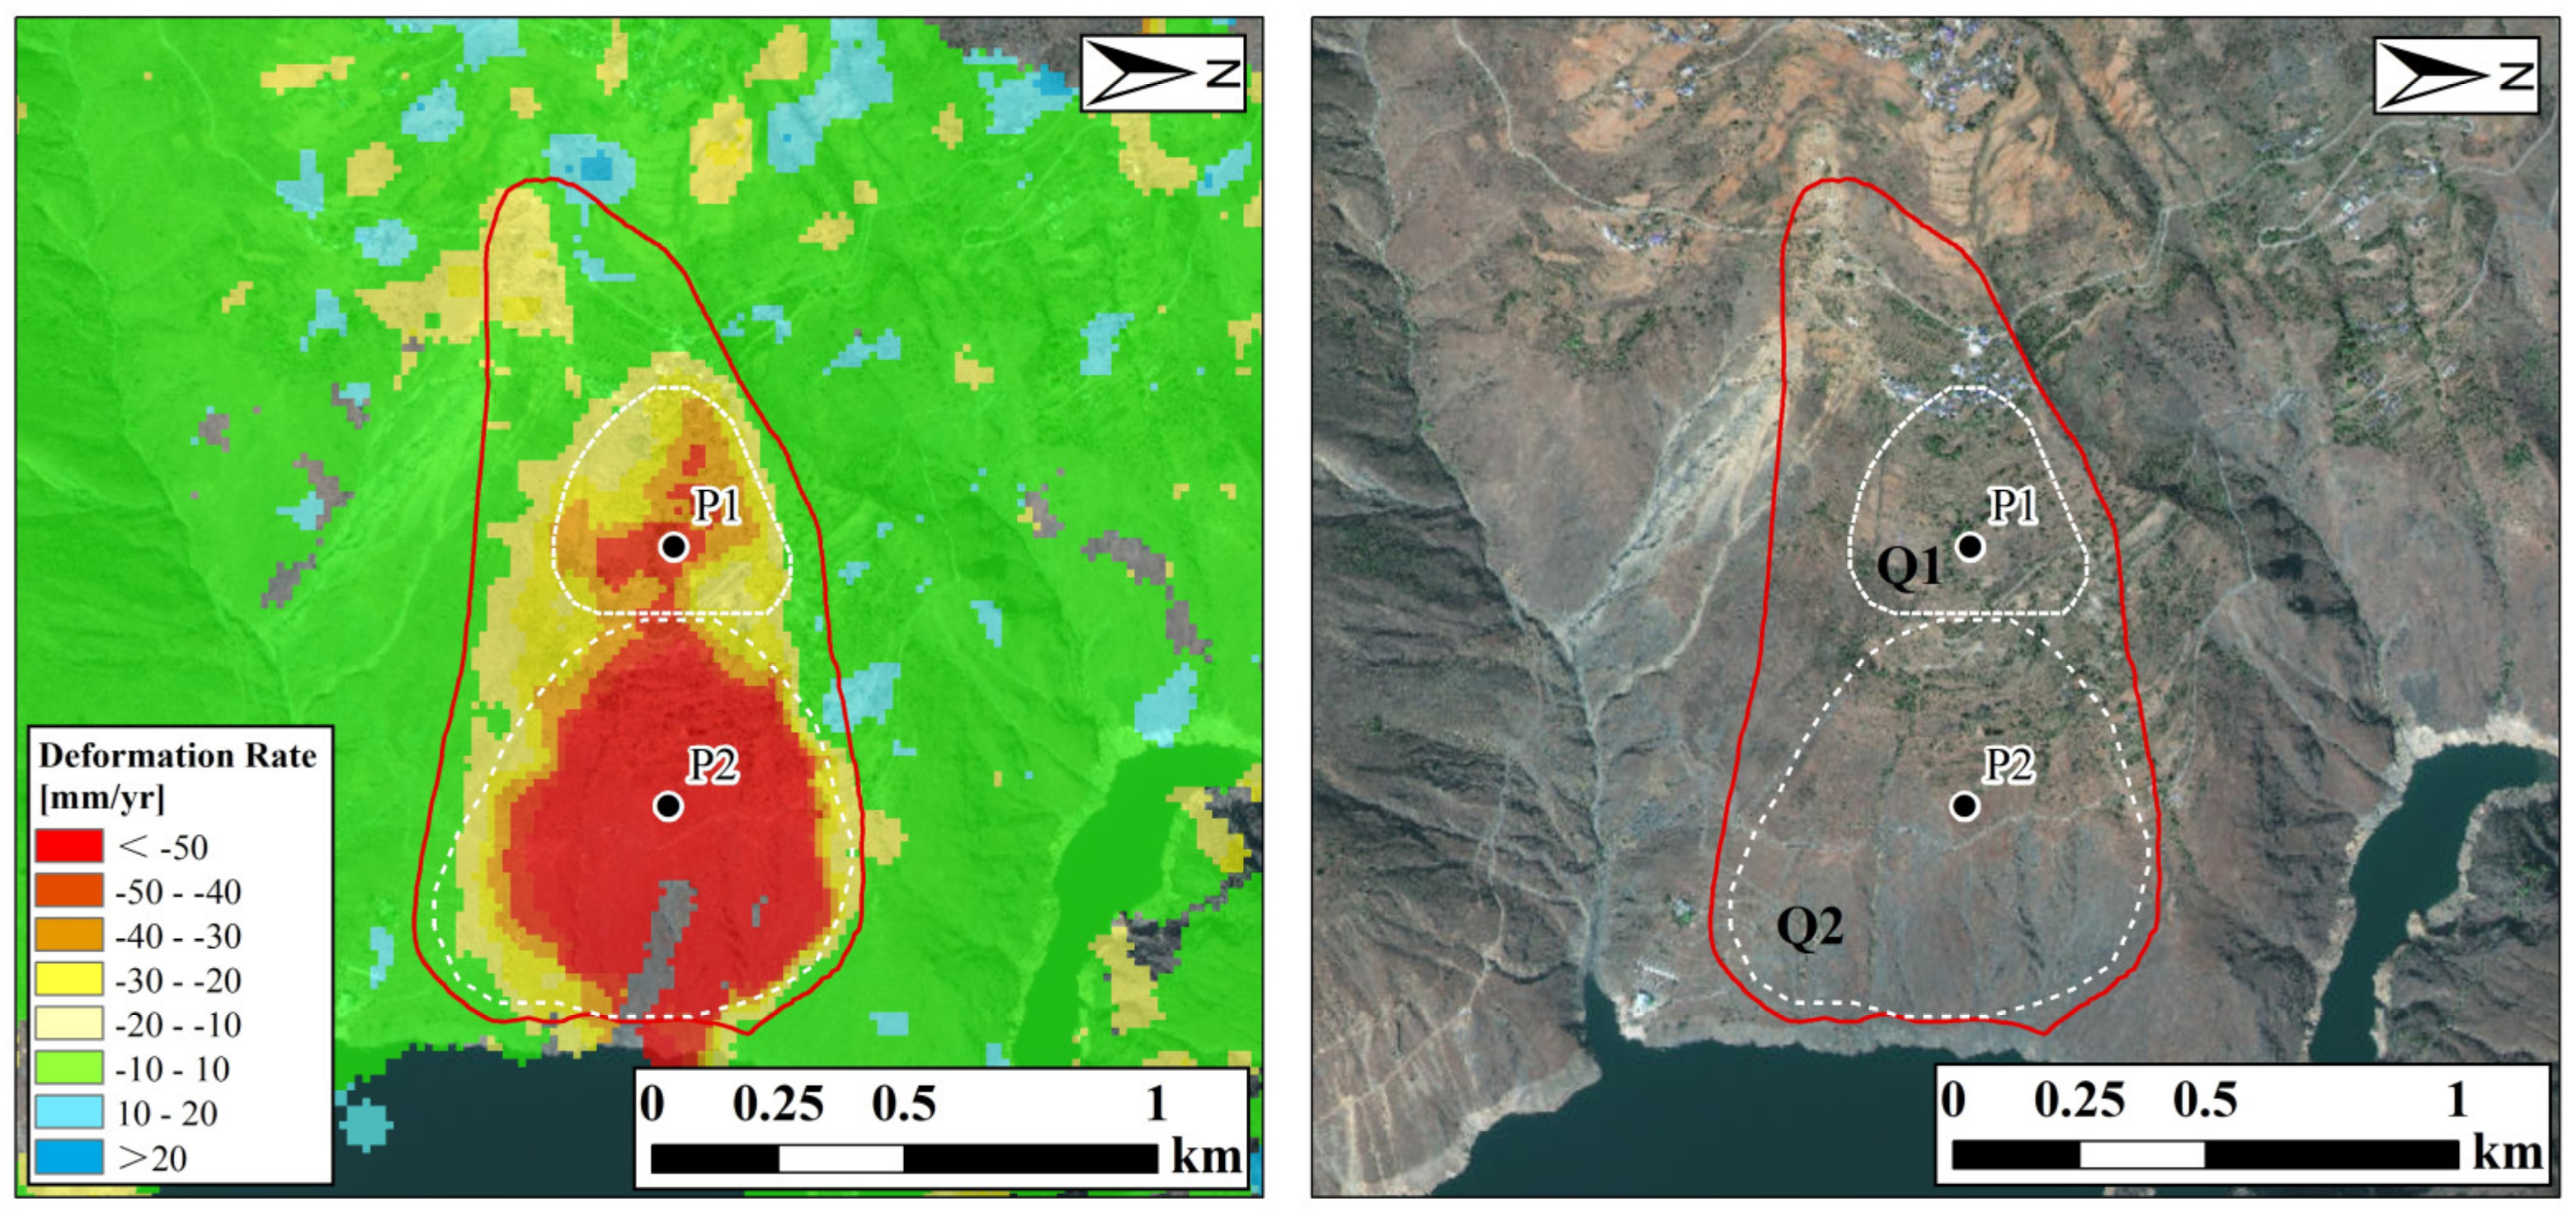
The Xiaxiaomidi landslide is located on the left bank of the Jinsha River, generally exhibiting a tongue-like shape. The central coordinates of the landslide are 102.977885°E, 26.483344°N. The landslide has a longitudinal length of approximately 1700 m, a width of about 790 m, and an aspect of approximately 93°. The elevation is about 710 m at the front edge and 1590 m at the rear edge, with a relative height difference of about 880 m and an area of approximately 8.59 × 10 5 m2.
As shown in Figure 6, based on the distribution of InSAR deformation rates, the Xiaxiaomidi landslide body is divided into two distinct regions: Q1 and Q2. The Q2 region is located in the lower part of the landslide body, characterized by lower elevation and steeper slopes, with an overall gradient of approximately 40–50°. InSAR monitoring results indicate that the overall deformation in this region is significant, with a maximum deformation rate exceeding 50 mm/year, suggesting that this region is the main deformation zone of the landslide. In contrast, the Q1 region has a higher elevation, with an average altitude above 1200 m, and a gentler slope, mostly ranging from 20° to 30°. The magnitude of deformation in Q1 is significantly smaller than that in the Q2 region. Since the deformation in the Q1 region mainly manifests as slow creep, it is inferred that its deformation may be influenced by the traction effect of the toppling deformation in the Q2 region, rather than large-scale failure occurring independently. This deformation mode indicates that the landslide body may exhibit retrogressive (traction) activity characteristics, meaning that the rapid deformation of the Q2 region exerts a traction effect on the Q1 region, causing slow displacement of the surface rock and soil mass in Q1. Combined with the analysis of deformation and topographic features in Q1 and Q2, it is inferred that this landslide is a retrogressive landslide, with deformation mainly concentrated in the lower Q2 region, which pulls upwards and induces creep deformation in the Q1 region.
It is worth noting that the LOS deformation results of the Q1 and Q2 regions are directly compared here. We consider that within the same landslide unit (e.g., Q1 and Q2 regions), due to the high consistency in aspect, sliding mechanism, and movement direction, the variation in the angle between the sliding direction and the LOS direction is small. Therefore, in this context, using LOS deformation for relative magnitude comparison can reasonably reflect the magnitude of deformation in different regions within a single landslide body.
  • Time-series Deformation Characteristics and Water Level Influence Analysis;
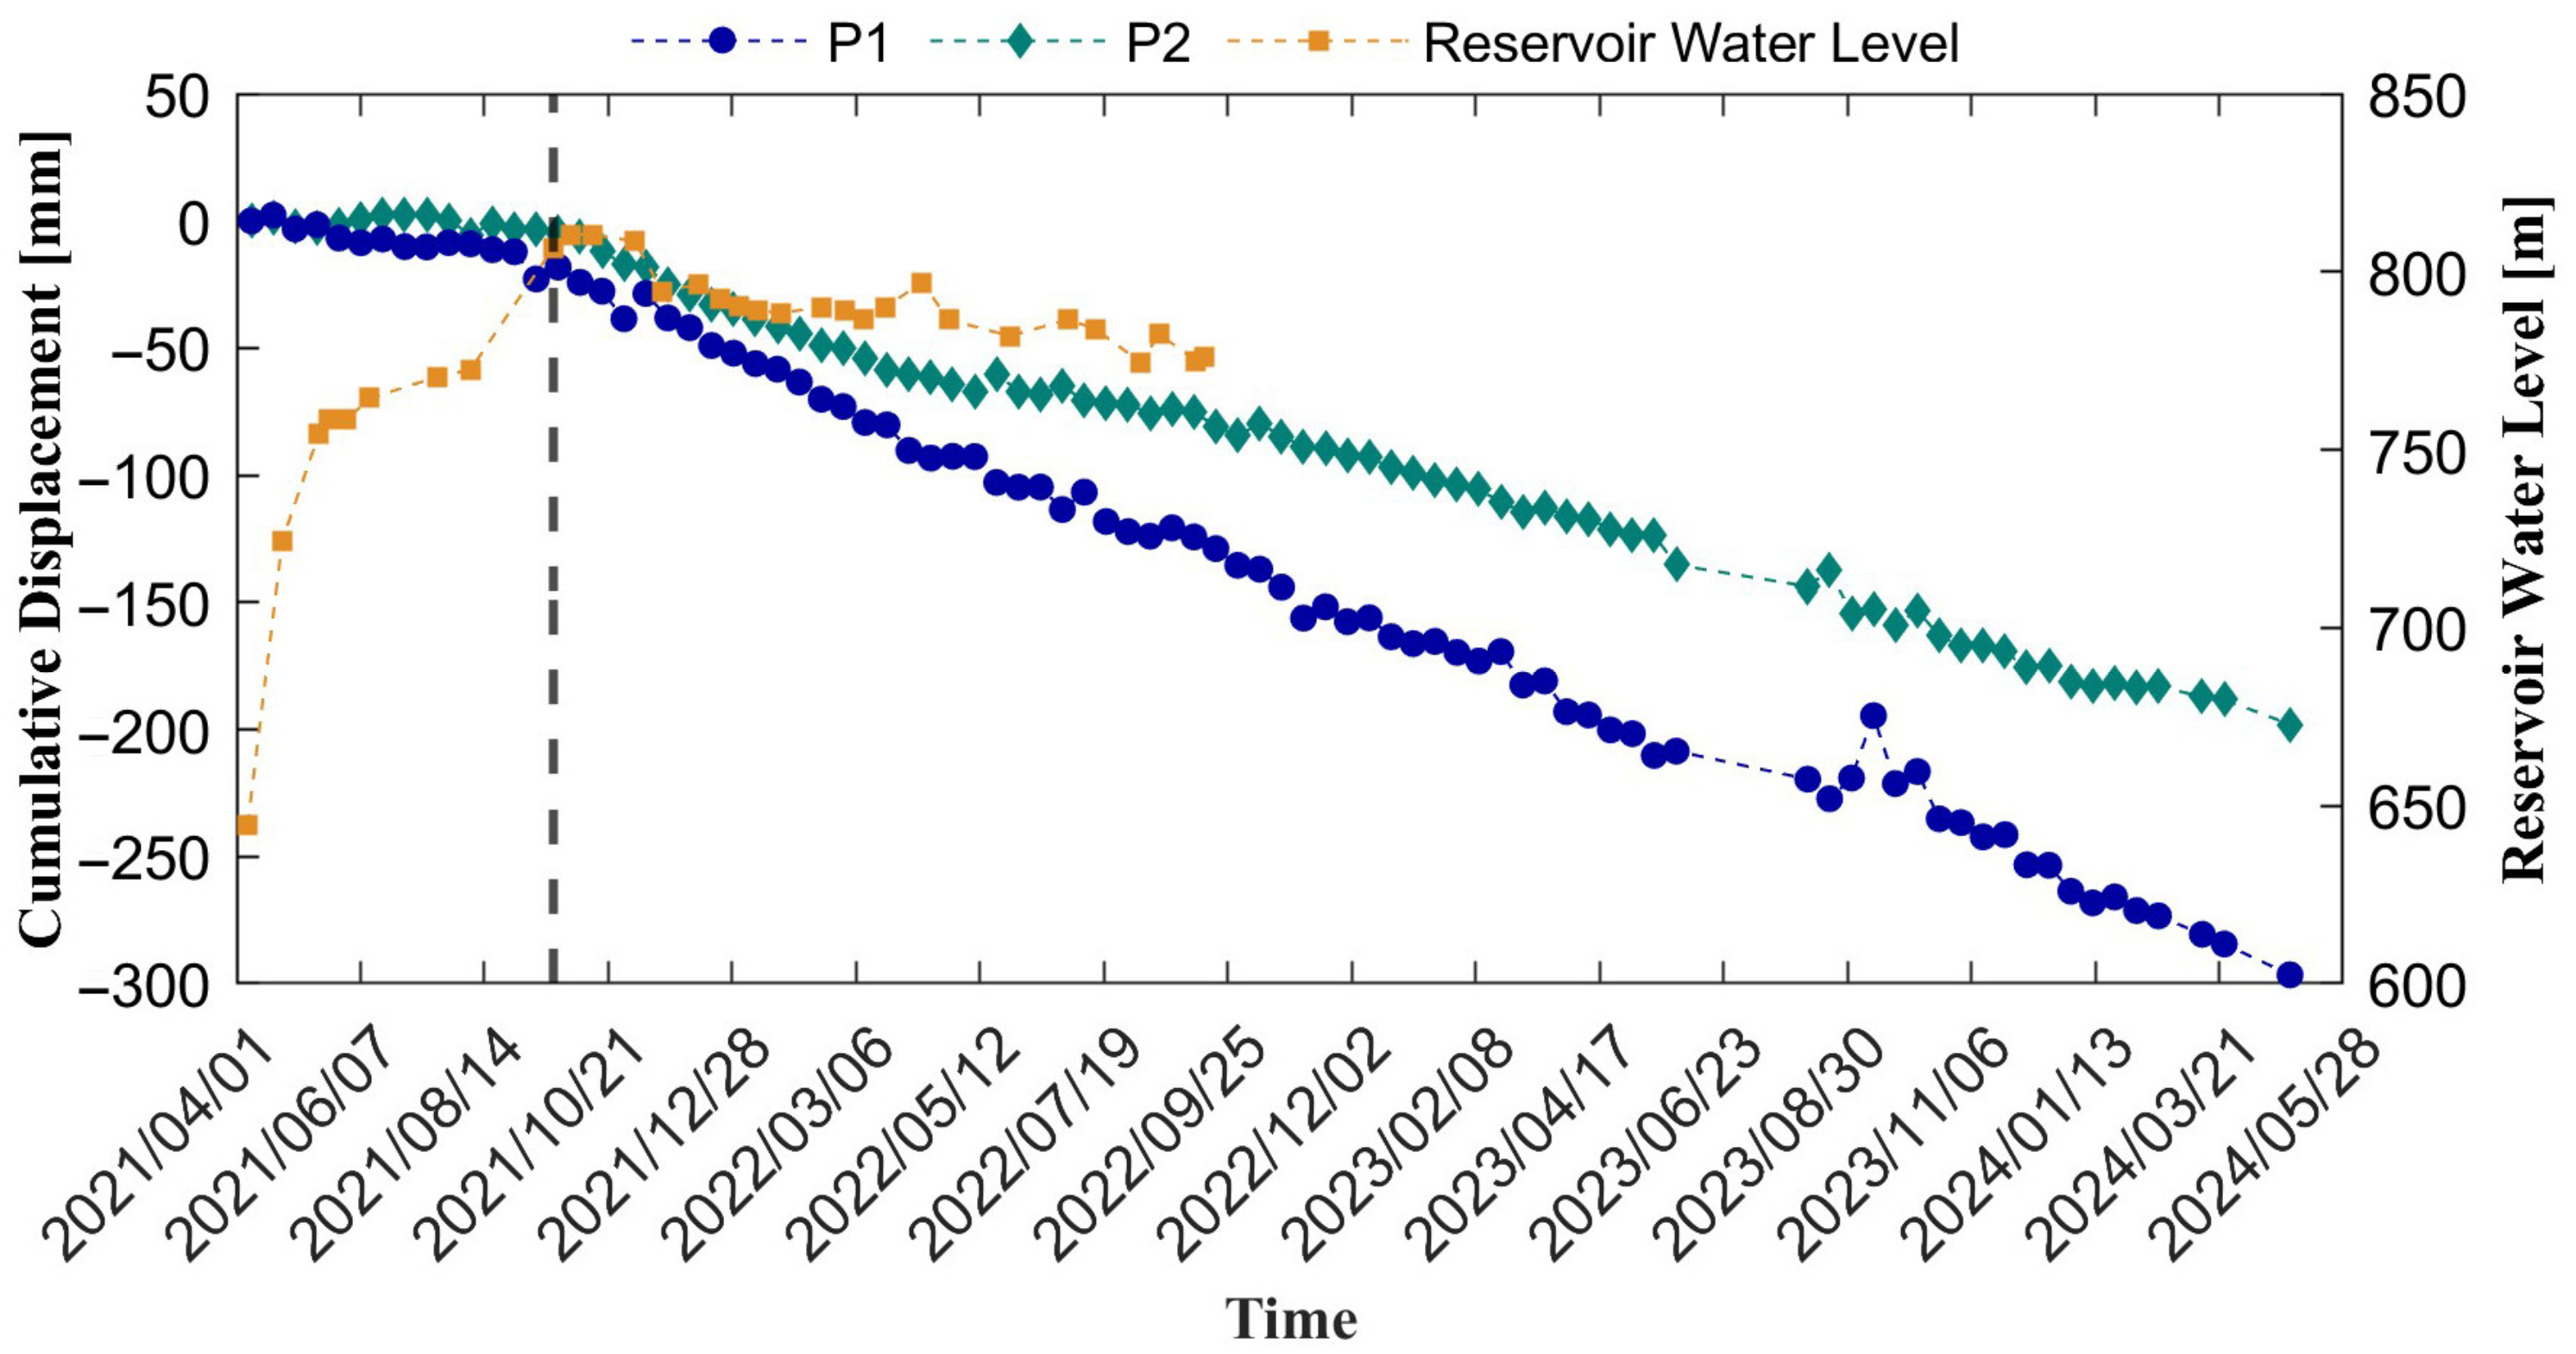
Two characteristic points (P1, P2) with relatively large deformation magnitudes were selected in the Q1 and Q2 regions, respectively, and their time-series deformation curves were plotted as shown in Figure 7. The reservoir began impoundment in April 2021. Point P2 did not show significant displacement changes during the first four temporal stages of the initial impoundment period (9 April 2021–16 May 2021). During the impoundment stage (16 May 2021–21 September 2021), P2 gradually exhibited slow creep deformation characteristics, with accumulated deformation reaching 18.18 mm. After the completion of impoundment, as the water level decreased, the deformation rate of P2 increased significantly and maintained a uniform deformation in the subsequent period (21 September 2021–29 April 2024), eventually reaching a maximum accumulated deformation of 296.56 mm. The time-series curve of point P1 showed relatively stable deformation during the impoundment stage (9 April 2021–21 September 2021), indicating that water level changes had little impact on the Q1 region located in the middle of the slope. After 21 September 2021, with the increase in the deformation rate of the Q2 region, point P1 gradually showed signs of deformation, with increasing deformation magnitude, eventually reaching an accumulated deformation of 197.99 mm.
In summary, water level changes mainly affect the Q2 region located in the lower part of the slope. Water body erosion of the soil leads to material loss and an increased deformation rate, which exerts a traction effect on the upper slope, thereby prompting the Q1 region to slide. This deformation mode is consistent with the results of spatial deformation analysis, further verifying the typical characteristics of retrogressive landslides. It indicates that the deformation of different regions of reservoir bank landslides is affected differently by reservoir impoundment and water level changes, with the lower part of the slope being most severely affected by water level changes, while the middle part of the slope is mainly subjected to the traction of the lower deformation.

4.2.2. Chenjiatian Landslide

  • Spatial Deformation Information;
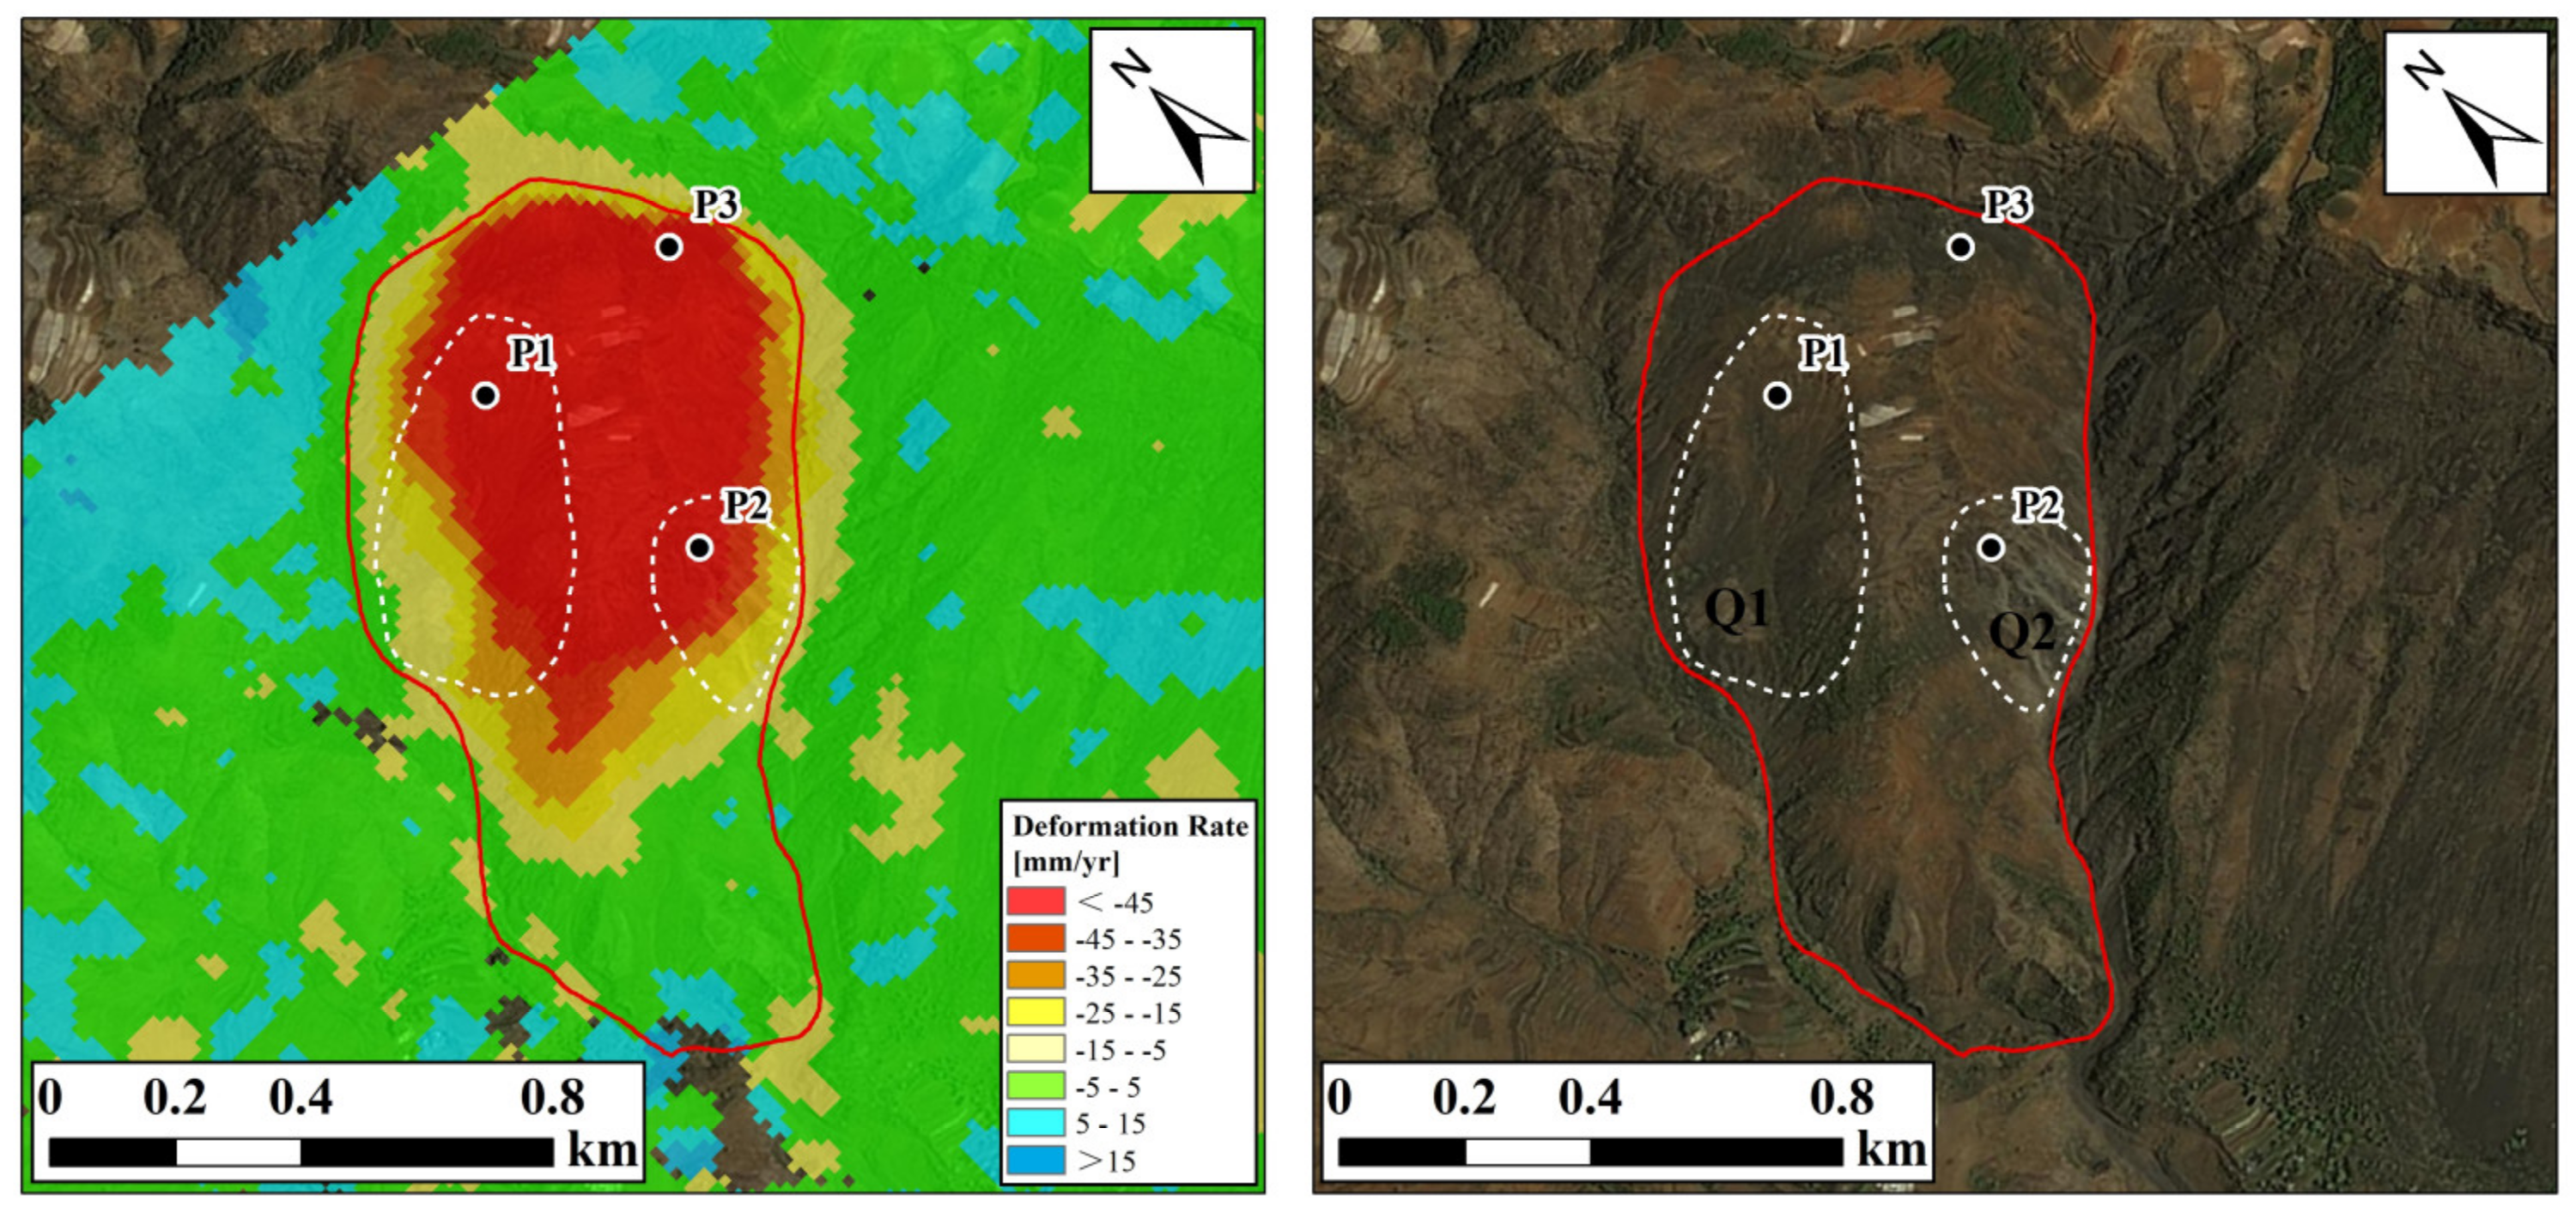
The Chenjiatian landslide is located in Nagu Town, Huize County, Qujing City, Yunnan Province, exhibiting an overall elongated strip shape. The central coordinates of the landslide are 103.107411°E, 26.736356°N. The landslide has a longitudinal length of approximately 1360 m, a width of about 670 m, and an aspect of approximately 210°. The elevation is about 1960 m at the front edge and 2660 m at the rear edge, with a relative height difference of about 700 m and an area of approximately 6.92 × 10 5 m2.
As shown in Figure 8, InSAR deformation rate monitoring results indicate that the Chenjiatian landslide is in a state of continuous deformation as a whole, with the deformation magnitude gradually decreasing from the center of the slope outwards. From the distribution of deformation rates, the deformation in the central area of the landslide (near P1) is the most significant, with a maximum rate reaching 79.64 mm/year, indicating that surface displacement in this area is active and it constitutes the main sliding zone. The deformation rates in the surrounding areas gradually decrease; the Q1 and Q2 sub-regions still exhibit relatively obvious deformation characteristics, while the peripheral areas tend to be stable. Monitoring points P2 and P3 are located in the secondary deformation areas of the landslide. Although their deformation rates are relatively lower, they are still affected by the overall landslide, suggesting that this landslide may involve multiple sliding units or slumping activities at different stages.
Combining optical image and deformation rate data analysis, the Huangtiancun landslide area features exposed rock and soil with low vegetation coverage. The Q1 region is located on the west side of the landslide, with a broken slope surface and obvious slumping activity. The Q2 region is located on the southeast side, characterized by loose soil slumping and significant accumulation on the slope surface, indicating poor overall stability. There are signs of continuous deformation overall.
  • Time-series Deformation Characteristics and Water Level Influence Analysis;
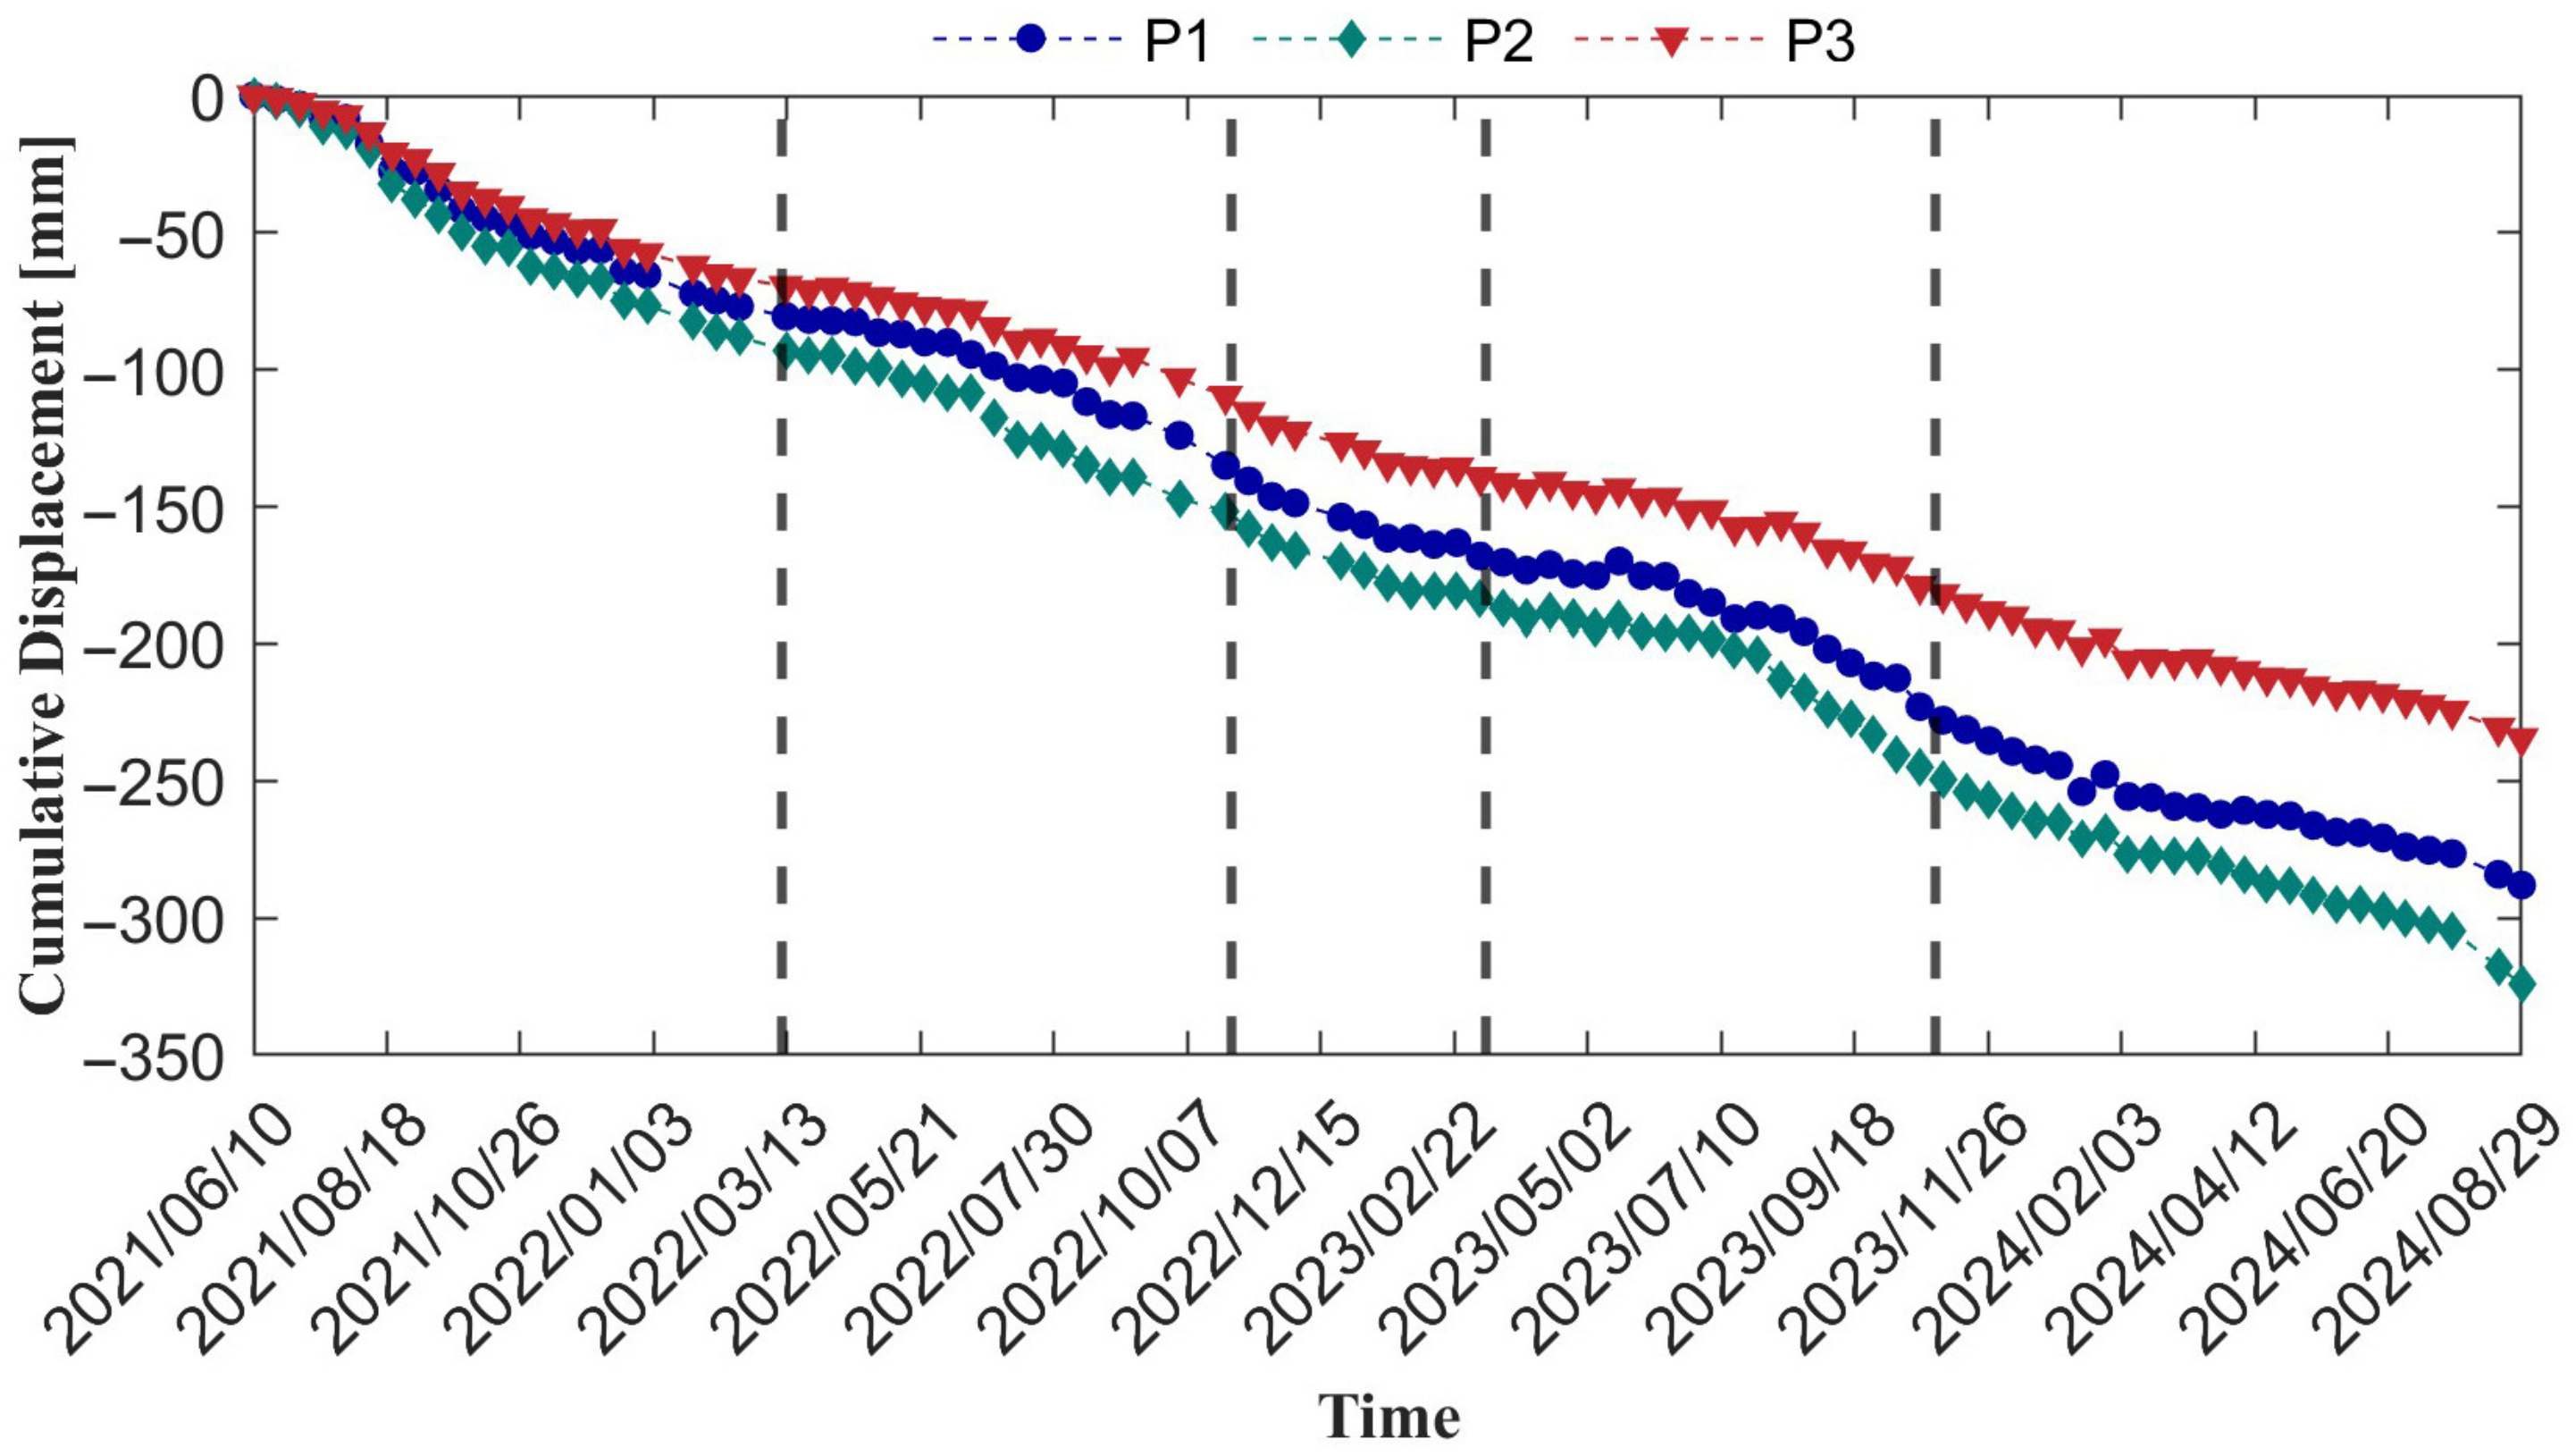
Three characteristic points, P1, P2, and P3, were selected in Q1, Q2, and the upper part of the slope, respectively, and their time-series curves were plotted as shown in Figure 9. Overall, the time-series curves of the characteristic points in the three different regions are relatively similar, all exhibiting long-term trend deformation characteristics over time. Among them, P1 and P2 are located in the upper parts of two different landslide units within the landslide body, respectively. Their time-series curve evolution laws and deformation magnitudes are basically consistent, with maximum accumulated deformation values of 288.00 mm and 324.10 mm, respectively. In contrast, although the overall trend of the time-series curve of point P3 is consistent with that of P1 and P2, its deformation magnitude is much smaller, with a maximum accumulated deformation of 234.49 mm. Combined with its spatial distribution location, it is inferred that this slope body may possess retrogressive landslide characteristics. The large deformation of P1 and P2 in the middle and lower parts of the landslide body induced the sliding of the upper soil mass; thus, corresponding deformation can also be observed in the curve of P3, but with a relatively smaller magnitude.
Figure 9 displays the time-series displacement curves of the three characteristic points P1, P2, and P3. While exhibiting long-term trend deformation characteristics, weak periodic deformation characteristics were also observed. A certain degree of periodic deformation or accelerated sliding phenomenon appeared annually approximately between March and October (the interval indicated by the black curve segments). In the time-series curves, this manifests as steeper slopes or larger amplitudes during this period. This periodicity is often related to factors such as increased rainfall, rising temperatures, snowmelt, and seasonal fluctuations in groundwater levels. In summary, the Chenjiatian landslide exhibits variation characteristics of superimposed coexistence of long-term trend terms and periodic deformation in its time series.

4.3. Analysis of Typical Landslide Deformation in Relation to Rainfall-Induced Wave Transformations

4.3.1. Extraction of Periodic Deformation

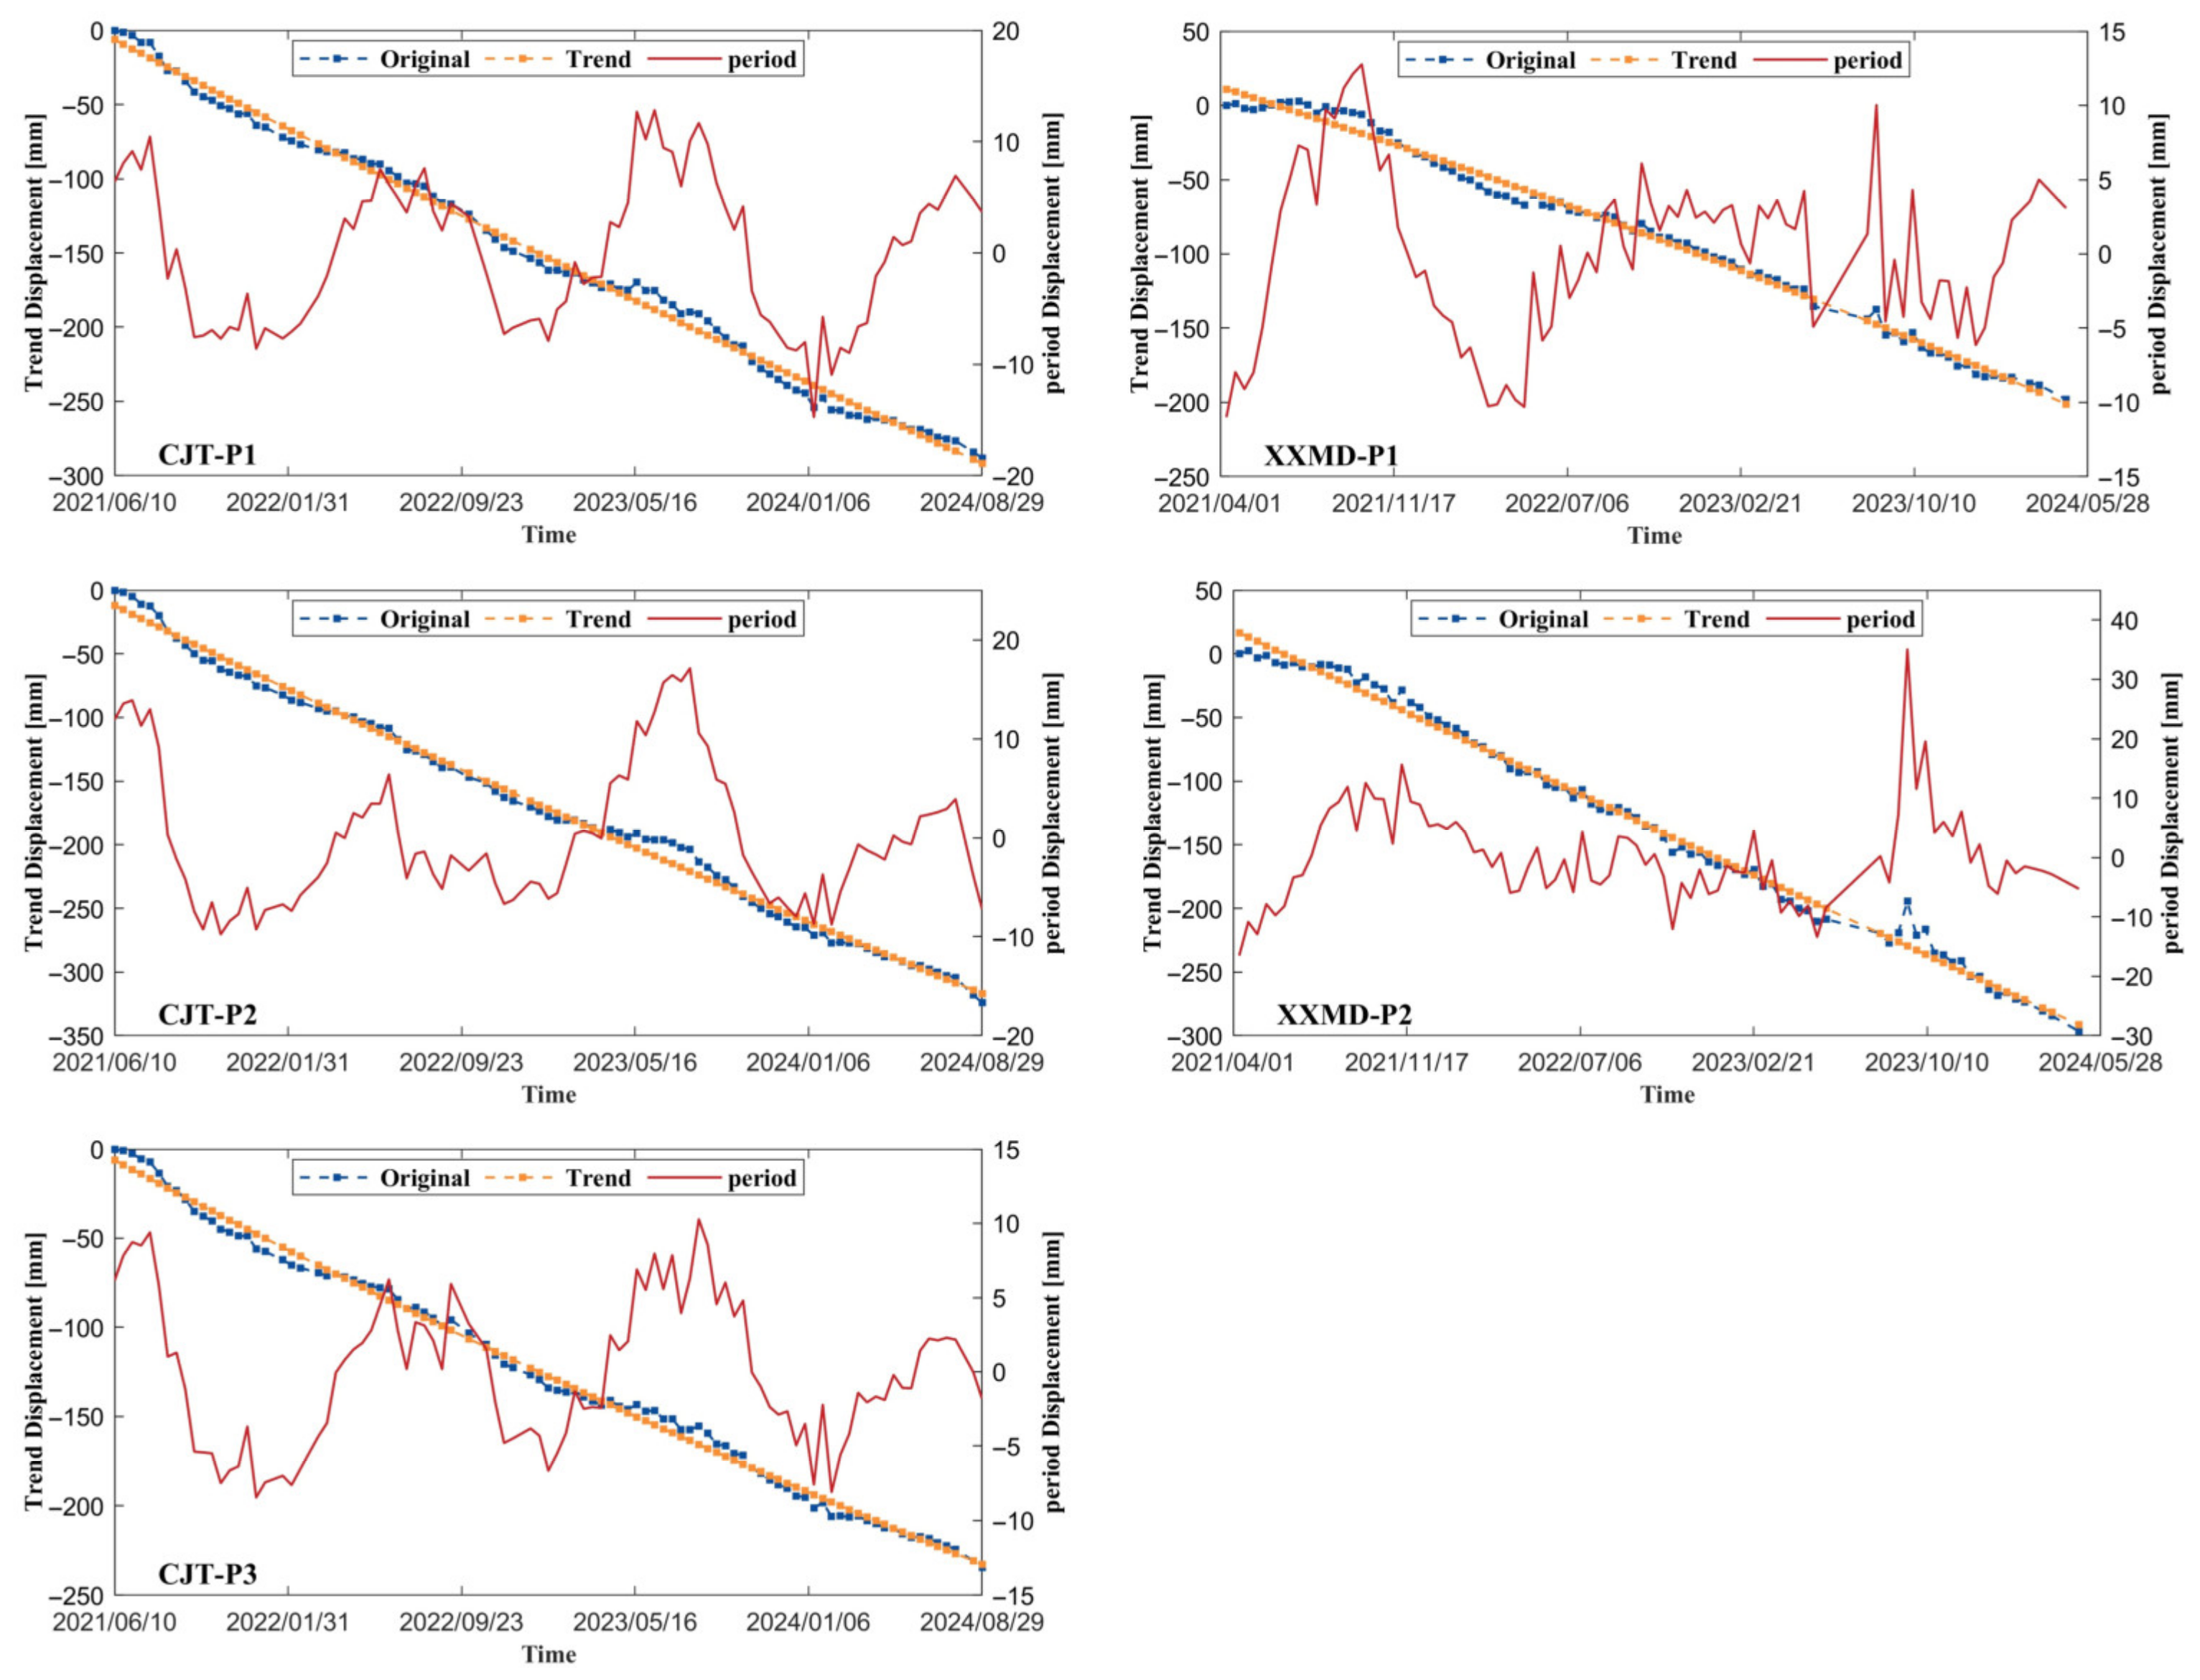
We selected the Xiaxiaomidi landslide and the Chenjiatian landslide, which exhibit more significant deformation, as analysis objects. A total of five different characteristic points from Figure 6 and Figure 8 were modeled to invert the trend deformation characteristics. The periodic deformation component was obtained by subtracting the trend deformation sequence from the original deformation sequence. Finally, the original deformation sequence was decomposed into trend variation components and periodic variation components, and compared with the original deformation as shown in Figure 9, to demonstrate the correspondence and variation characteristics among the three.
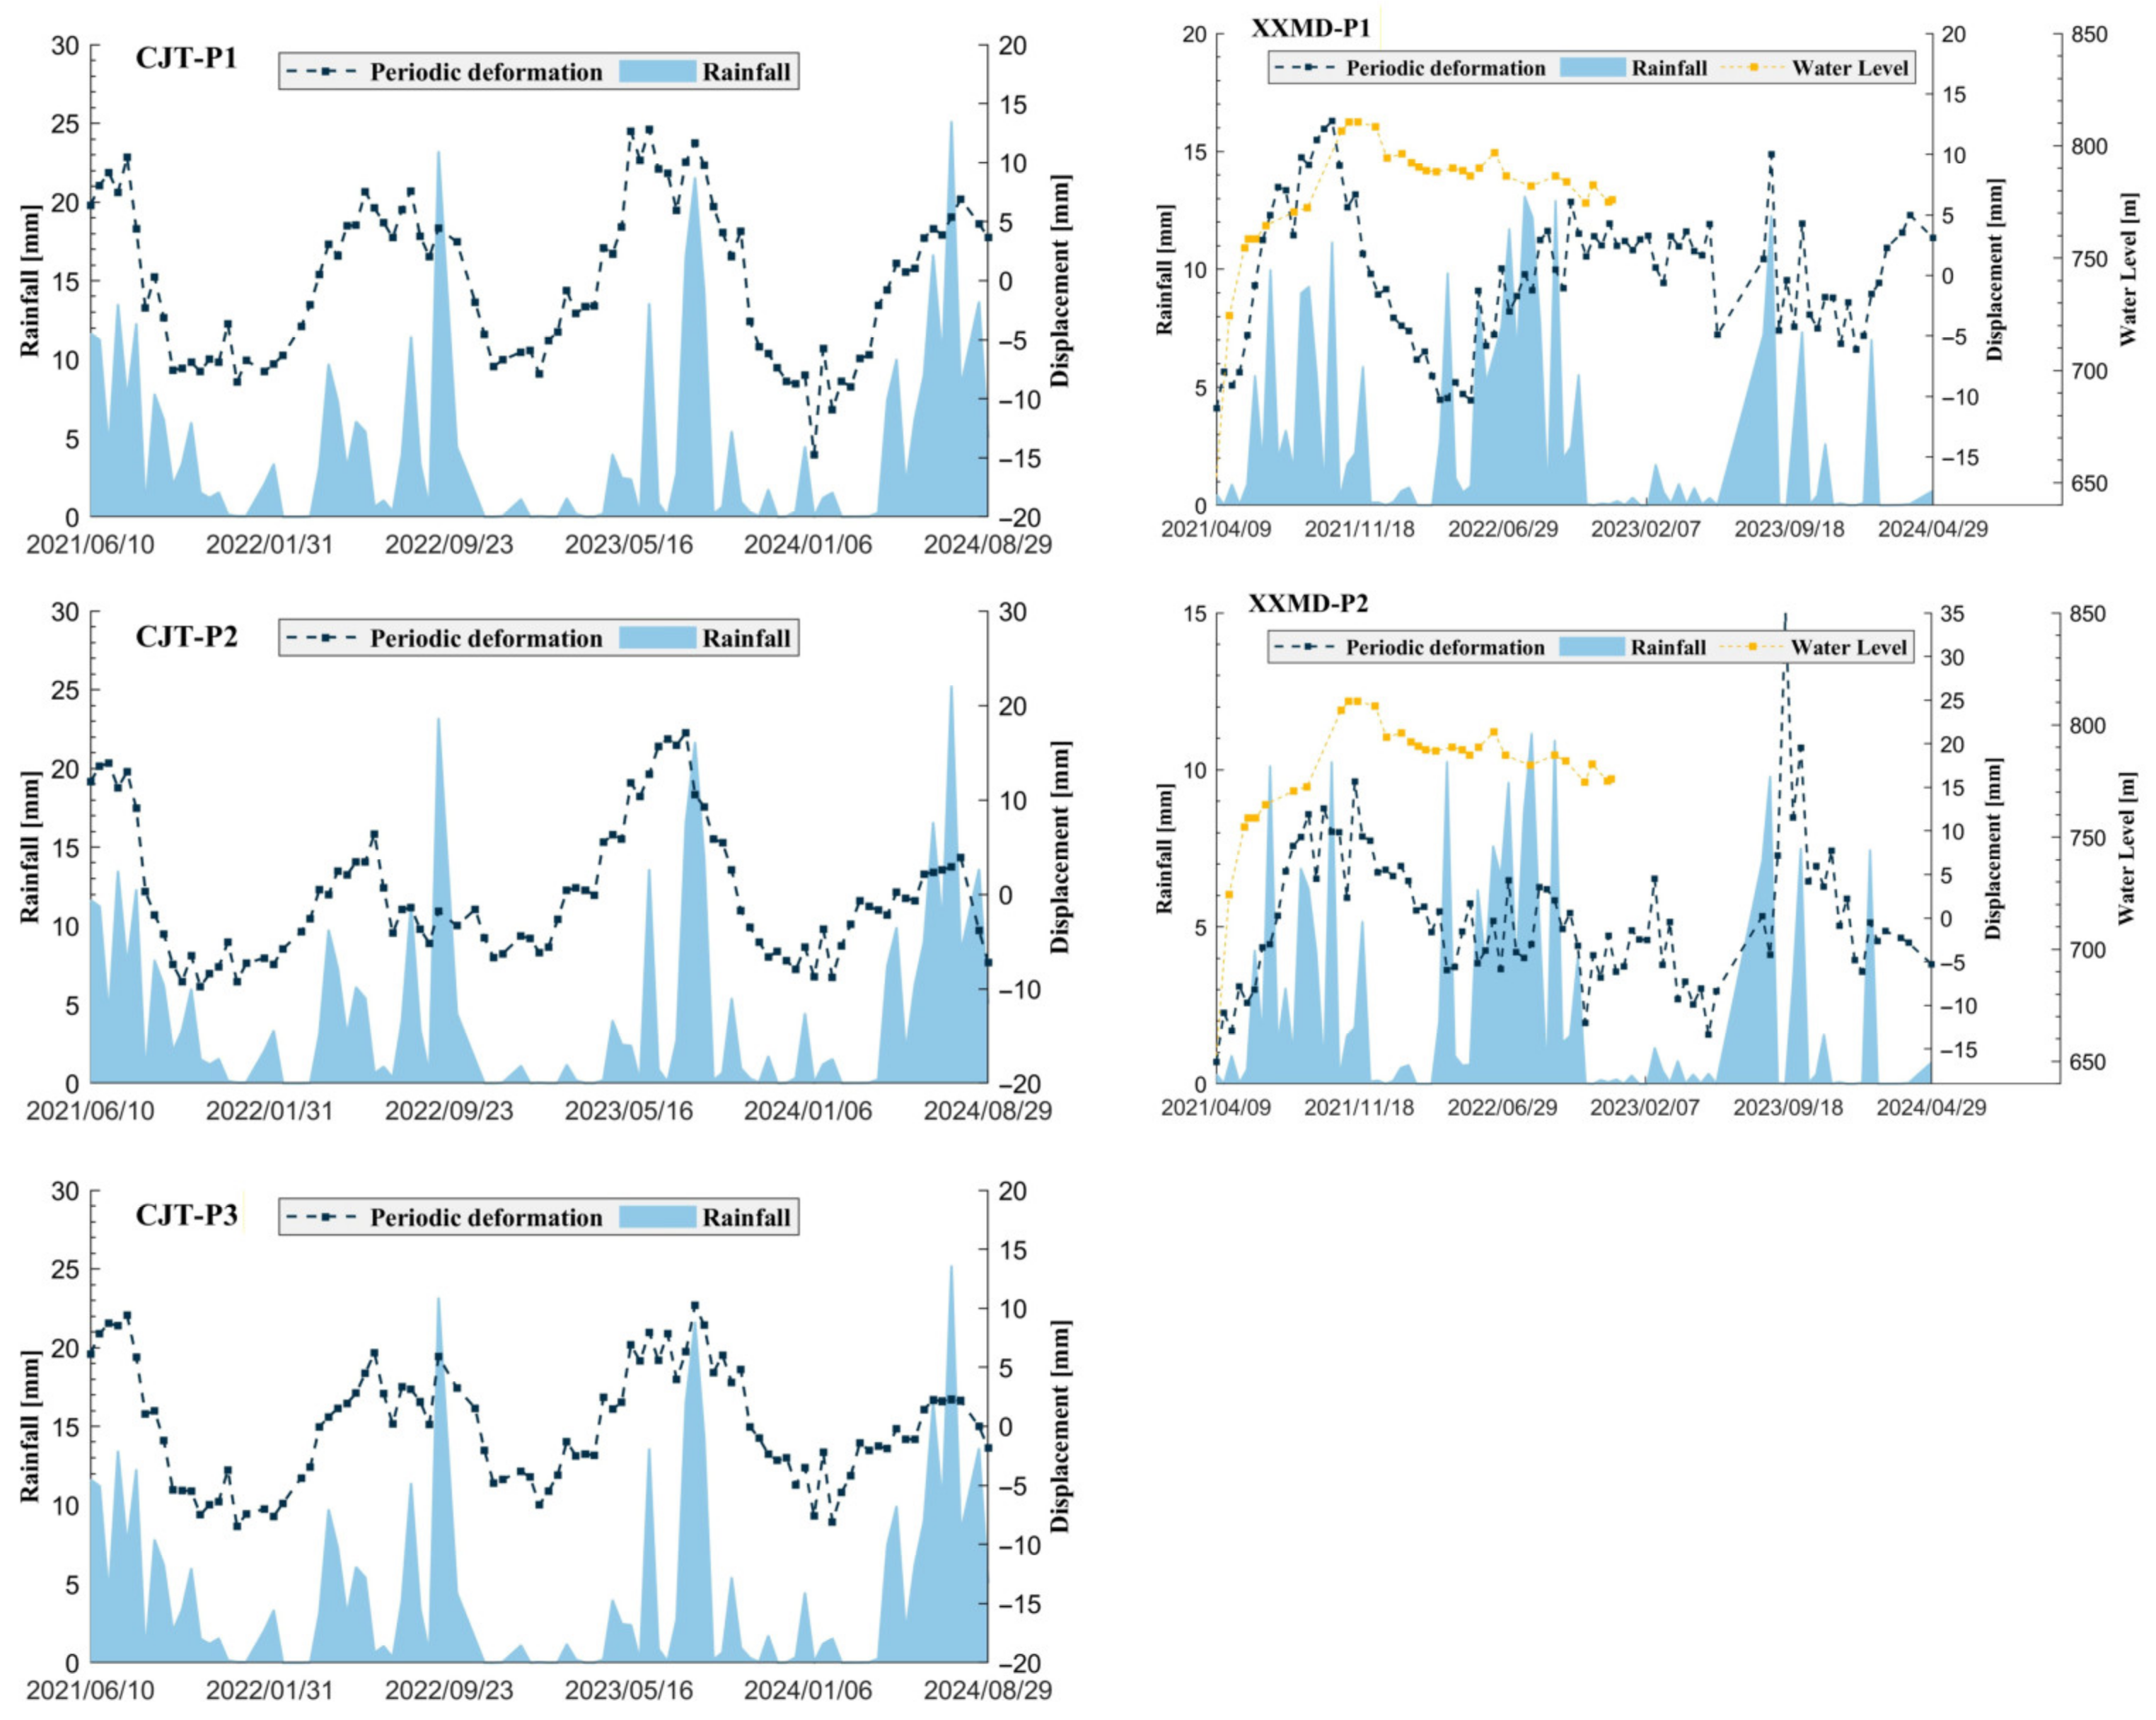
From Figure 10, it can be seen that for both the reservoir bank Xiaxiaomidi landslide (XXMD) and the non-reservoir bank Chenjiatian landslide (CJT), their time-series deformation trend terms almost overlap with the original series, with only minor differences. In terms of periodic deformation, the three characteristic points of the Chenjiatian landslide (CJT-P1, CJT-P2, CJT-P3) all exhibit significant periodic deformation characteristics, with deformation ranging from −20 mm to 20 mm. Meanwhile, the deformation period is relatively stable, approximately 365 days. Overall, the time-series deformation characteristics of the Chenjiatian landslide manifest as long-term deformation dominated by the trend term and supplemented by the periodic term. Apart from long-term trend deformation characteristics, the Xiaxiaomidi landslide does not show obvious periodic deformation components. Analysis of the residual deformation after removing the trend term shows that the residual time-series curve deformation is mostly distributed between −10 mm and 10 mm, with a trend of accelerated deformation in certain periods. In summary, the time-series deformation characteristics of the Xiaxiaomidi landslide manifest as the coexistence of dominant long-term trend deformation and short-term accelerated deformation.
Based on the rainfall dataset obtained from the ERA5 reanalysis product, we first investigated the relationship between rainfall and the deformation of the Chenjiatian landslide, which is strongly influenced by precipitation. Subsequently, the periodic deformation characteristics of the Xiaoxiamidi landslide under the combined effects of rainfall and reservoir water-level variations were examined. As shown in Figure 11, the left panel illustrates the relationships between rainfall and deformation at three characteristic points of the Chenjiatian landslide, while the right panel presents the deformation responses of two characteristic points of the Xiaoxiamidi landslide to rainfall and reservoir water-level changes.
The rainfall time series exhibits pronounced seasonal periodicity, with precipitation increasing markedly from June and reaching its peak between July and September each year. As a representative non-reservoir landslide, the periodic deformation components at the three characteristic points of the Chenjiatian landslide show trends that are highly consistent with rainfall variations. Following periods of intense rainfall, landslide deformation gradually accelerates, and subsequently diminishes as rainfall decreases, indicating a strong rainfall-controlled deformation behavior with a certain lag effect. In addition, the deformation amplitudes at these points are relatively small, generally remaining within 10 mm, suggesting a slow and stable deformation regime.
In contrast, as shown in the right panel of Figure 5, the deformation of the Xiaoxiamidi landslide is influenced by both rainfall and reservoir water-level fluctuations. Compared with the Chenjiatian landslide, the correspondence between rainfall and periodic deformation at Xiaoxiamidi is less evident, with only weak deformation responses observed during certain rainfall periods. Instead, reservoir water-level variations exert a more pronounced control on landslide deformation. For both XXMD-P1 and XXMD-P2, noticeable fluctuations in displacement occur during periods of rising water levels. When the reservoir water level stabilizes, landslide deformation gradually decreases, and only shows a slight increase during subsequent periods of intensified rainfall. Owing to the lack of continuous water-level records for the later period, the long-term influence of reservoir water-level changes cannot be further quantified. Nevertheless, the available observations indicate that the Xiaoxiamidi landslide is jointly affected by rainfall and reservoir water-level variations, with reservoir water-level fluctuations acting as the dominant controlling factor.
Overall, the deformation of non-reservoir landslides in the study area is primarily governed by rainfall, exhibiting clear periodic behavior with a distinct lag response. In contrast, reservoir-bank landslides are controlled by the combined effects of rainfall and reservoir water-level variations, among which water-level changes play a dominant role. This leads to a weaker and less direct correspondence between deformation and rainfall, with rainfall-related effects only manifested during specific periods.

4.3.2. Wavelet Analysis of Rainfall and Periodic Deformation

Before conducting wavelet analysis, it is crucial to ensure that the time sampling intervals of the landslide deformation time series and rainfall data are consistent. This helps to maintain the physical significance and mathematical consistency of the wavelet transform results. The Sentinel-1 data used for InSAR processing in this paper typically have a revisit cycle of 12 days, but some SAR images may be missing, resulting in non-uniform time steps in the obtained deformation sequences. Therefore, to address the issue of uneven deformation distribution in the time series, a linear interpolation method was employed to fill the missing deformation data. Here, linear interpolation does not introduce false periodicity because its linear characteristics only produce a constant or DC component in the frequency domain [28].
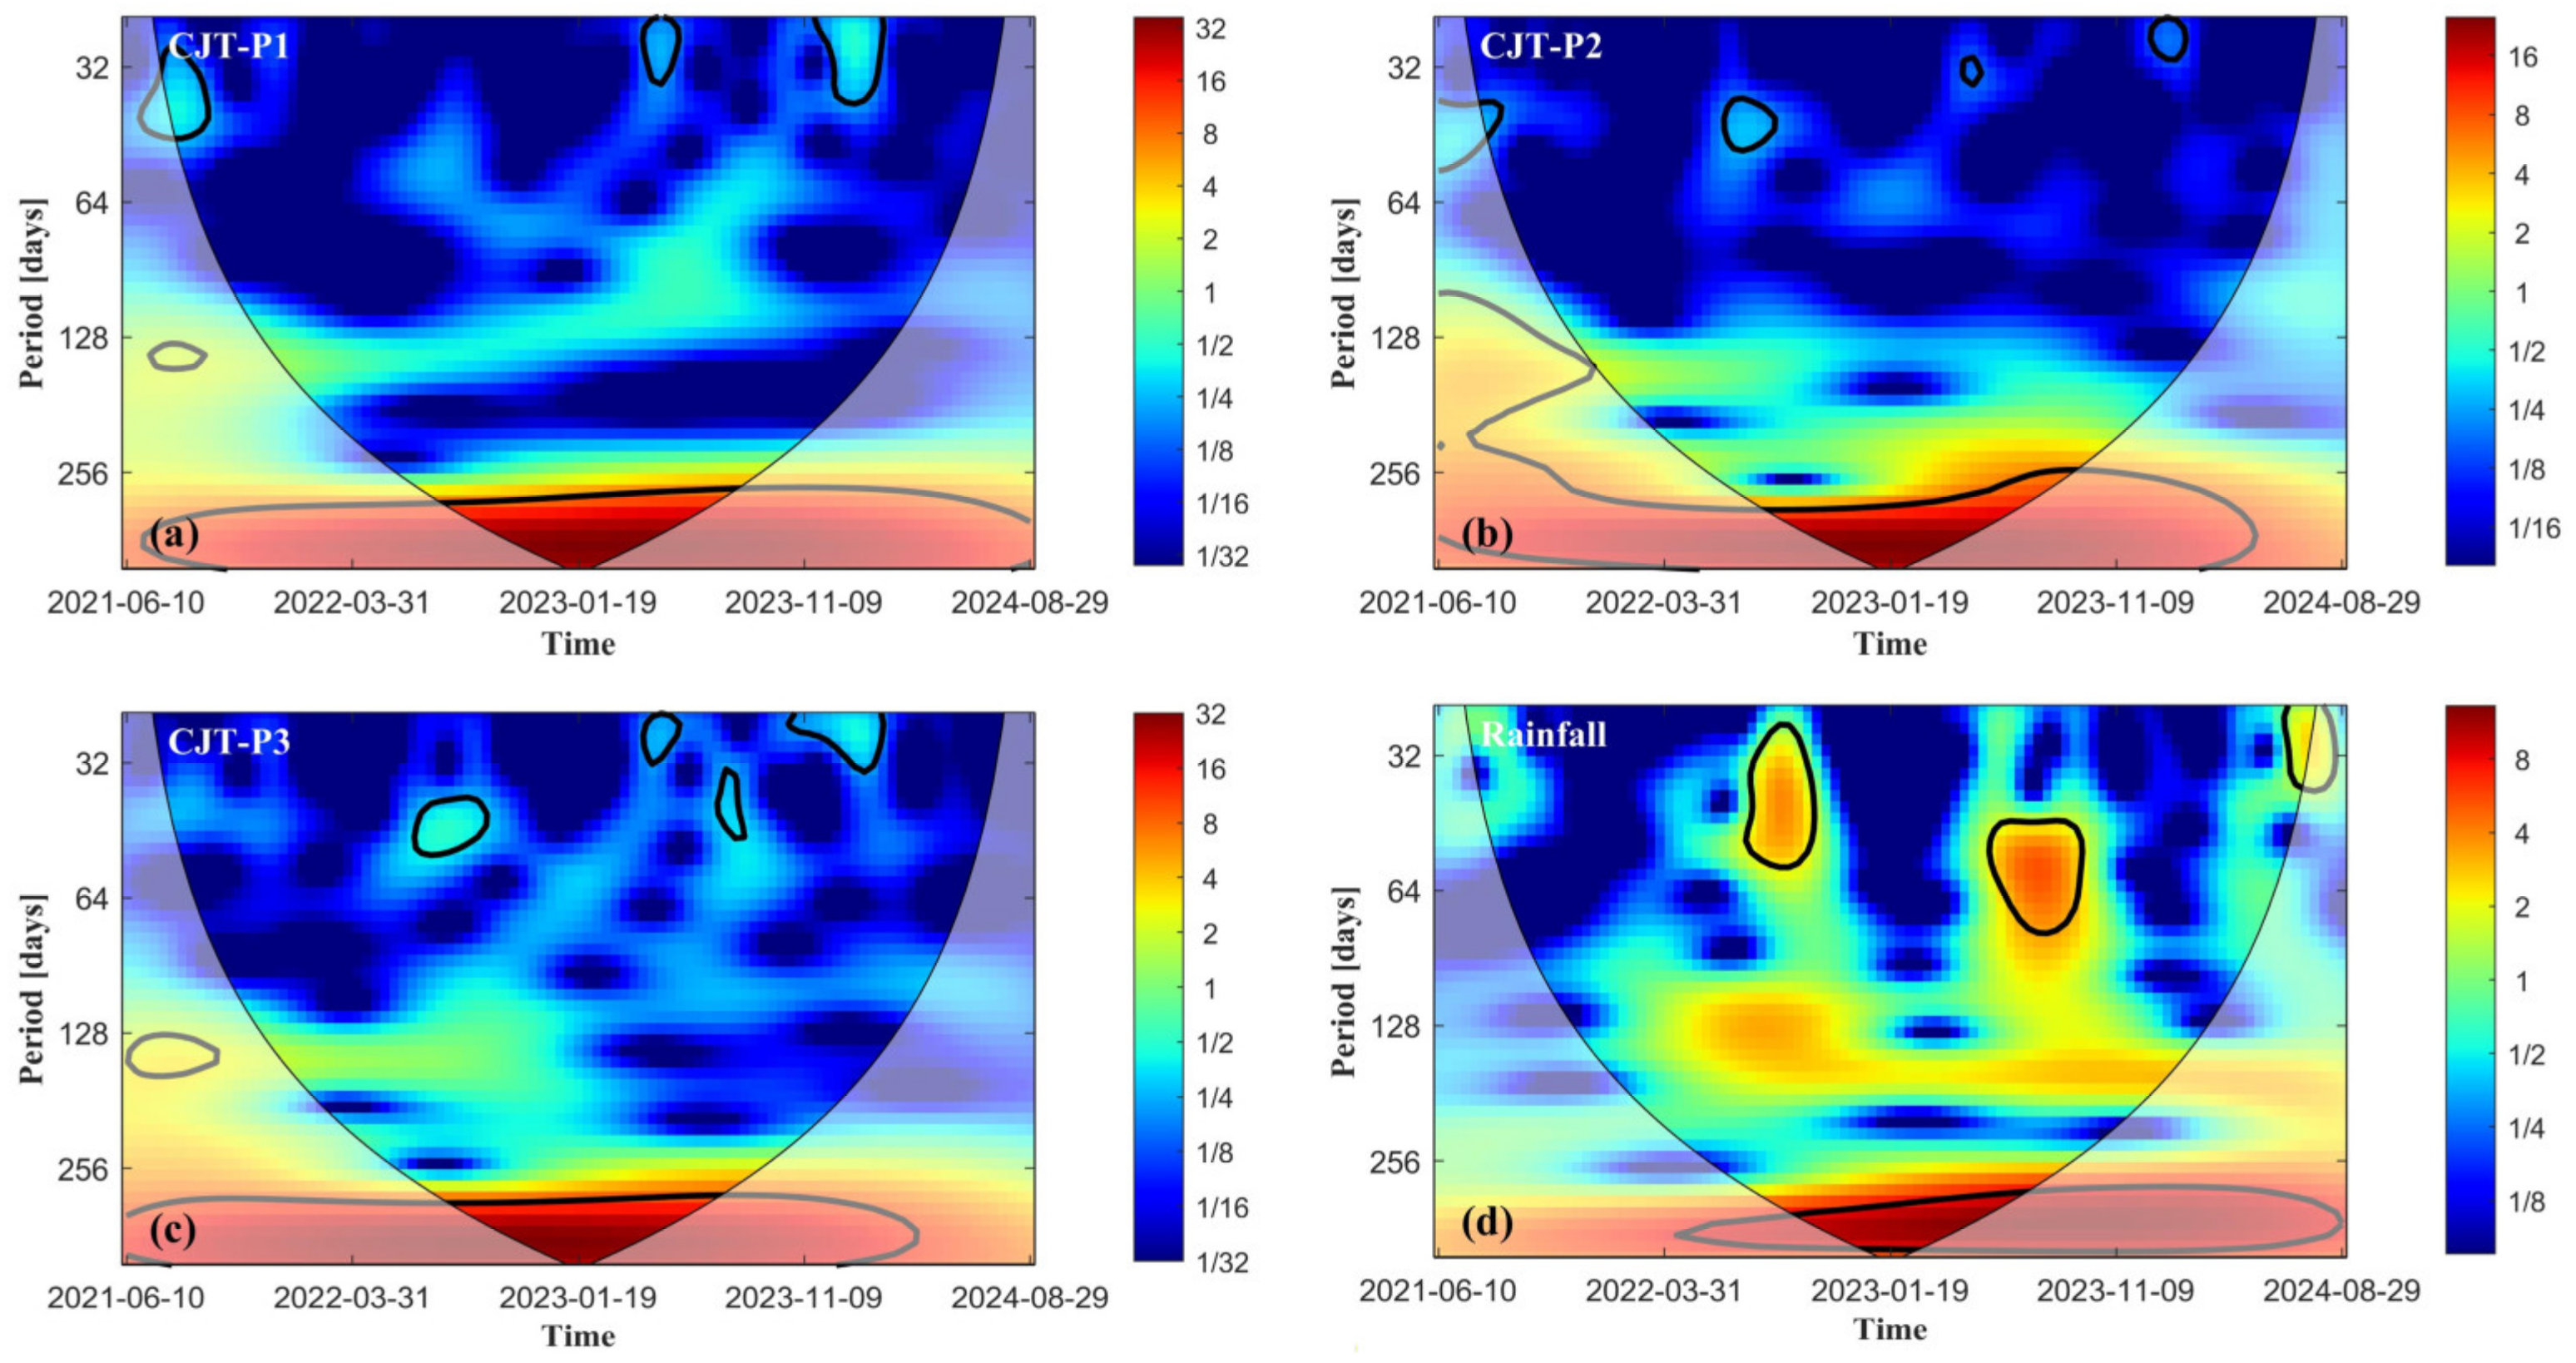
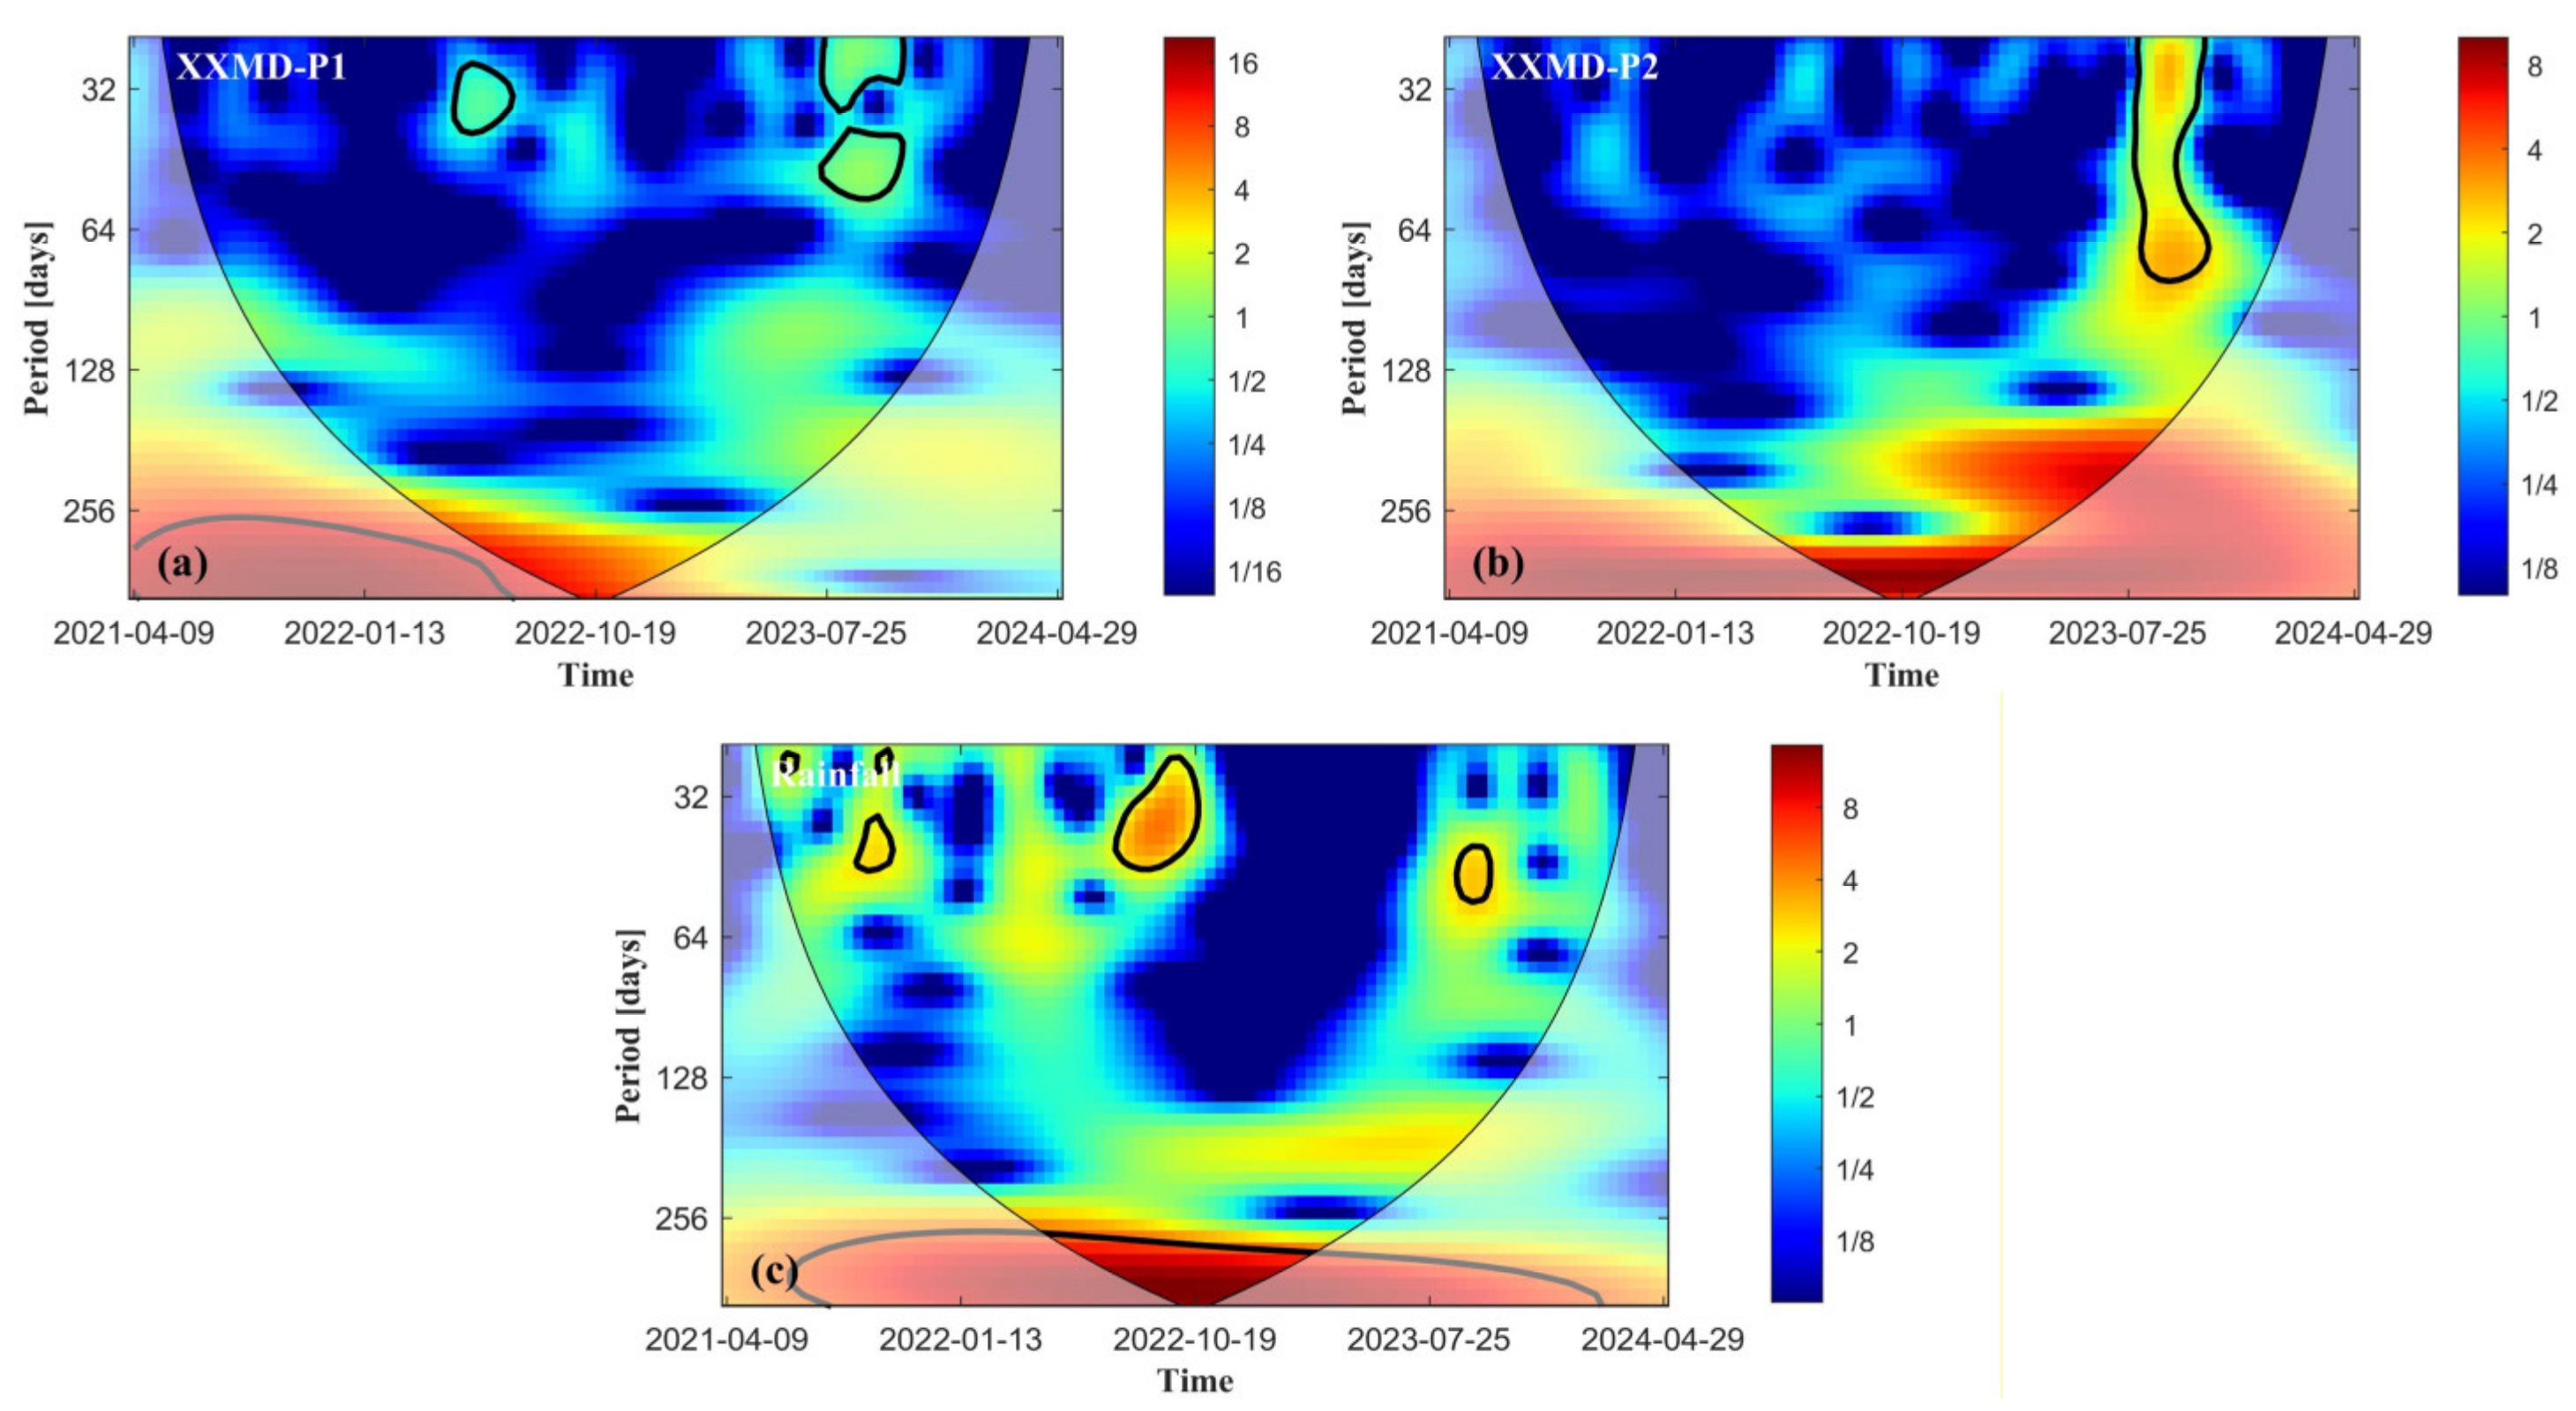
Continuous Wavelet Transform (CWT) was performed on rainfall and the non-linear deformation components of typical landslide characteristic points to further explore the correlation between the two. Figure 12 shows the wavelet power spectra of the deformation characteristic points of the Xiaxiaomidi landslide and rainfall. The horizontal and vertical axes in the figure represent the instantaneous time and the corresponding period (or frequency) in a specific analysis mode, respectively. Colors transitioning from blue to red represent the change in wavelet power intensity from weak to strong, revealing the local characteristics and dynamic evolution of dominant fluctuation components in the time-frequency domain. The area enclosed by the thick black line in the figure indicates the part that passed the 95% confidence level red noise test, indicating that the signal fluctuations within this area are statistically significant. The thin black line indicates the Cone of Influence (COI), used to mark areas with significant edge effects, where analysis results are not considered reliable due to boundary effect interference. The image is thus divided into credible analysis regions (colored parts) and regions significantly affected by edge effects (lighter gray areas). Figure 11 is interpreted and visualized in the same manner.
As shown in Figure 12, the CWT spectrum of point P1 of the Xiaxiaomidi landslide shows that during the period from April 2021 to July 2022, its significant energy regions are mainly located outside the reliable region, indicating weak annual periodic characteristics in this area. In addition, around August 2023, the high energy density region of point P2 is particularly prominent, exhibiting a significant periodic peak signal of 32–64 days, which may be related to reservoir water level fluctuations. Figure 13c shows that at the 95% confidence level, rainfall exhibits a periodic characteristic close to 365 days throughout the 2021–2024 period. In the power spectrum, short-term periodicity of 32–64 days can be observed in October of each year. Overall, the correlation between the deformation of the Xiaxiaomidi landslide and periodic rainfall is weak.
Figure 13 shows the wavelet transform power spectra of the Chenjiatian landslide. It can be seen from the figure that all three different characteristic points within this landslide body exhibit significant periodic characteristics of 365 days, which is similar to the rainfall results shown in Figure 13d. Furthermore, in seasons with heavy rainfall, similar local high-power signals appear at the same upper positions in Figure 13c,d. This further indicates a high correlation between the deformation of the Chenjiatian landslide and rainfall, suggesting it is more significantly affected by rainfall.

4.3.3. Cross Wavelet Transform and Wavelet Coherence Analysis

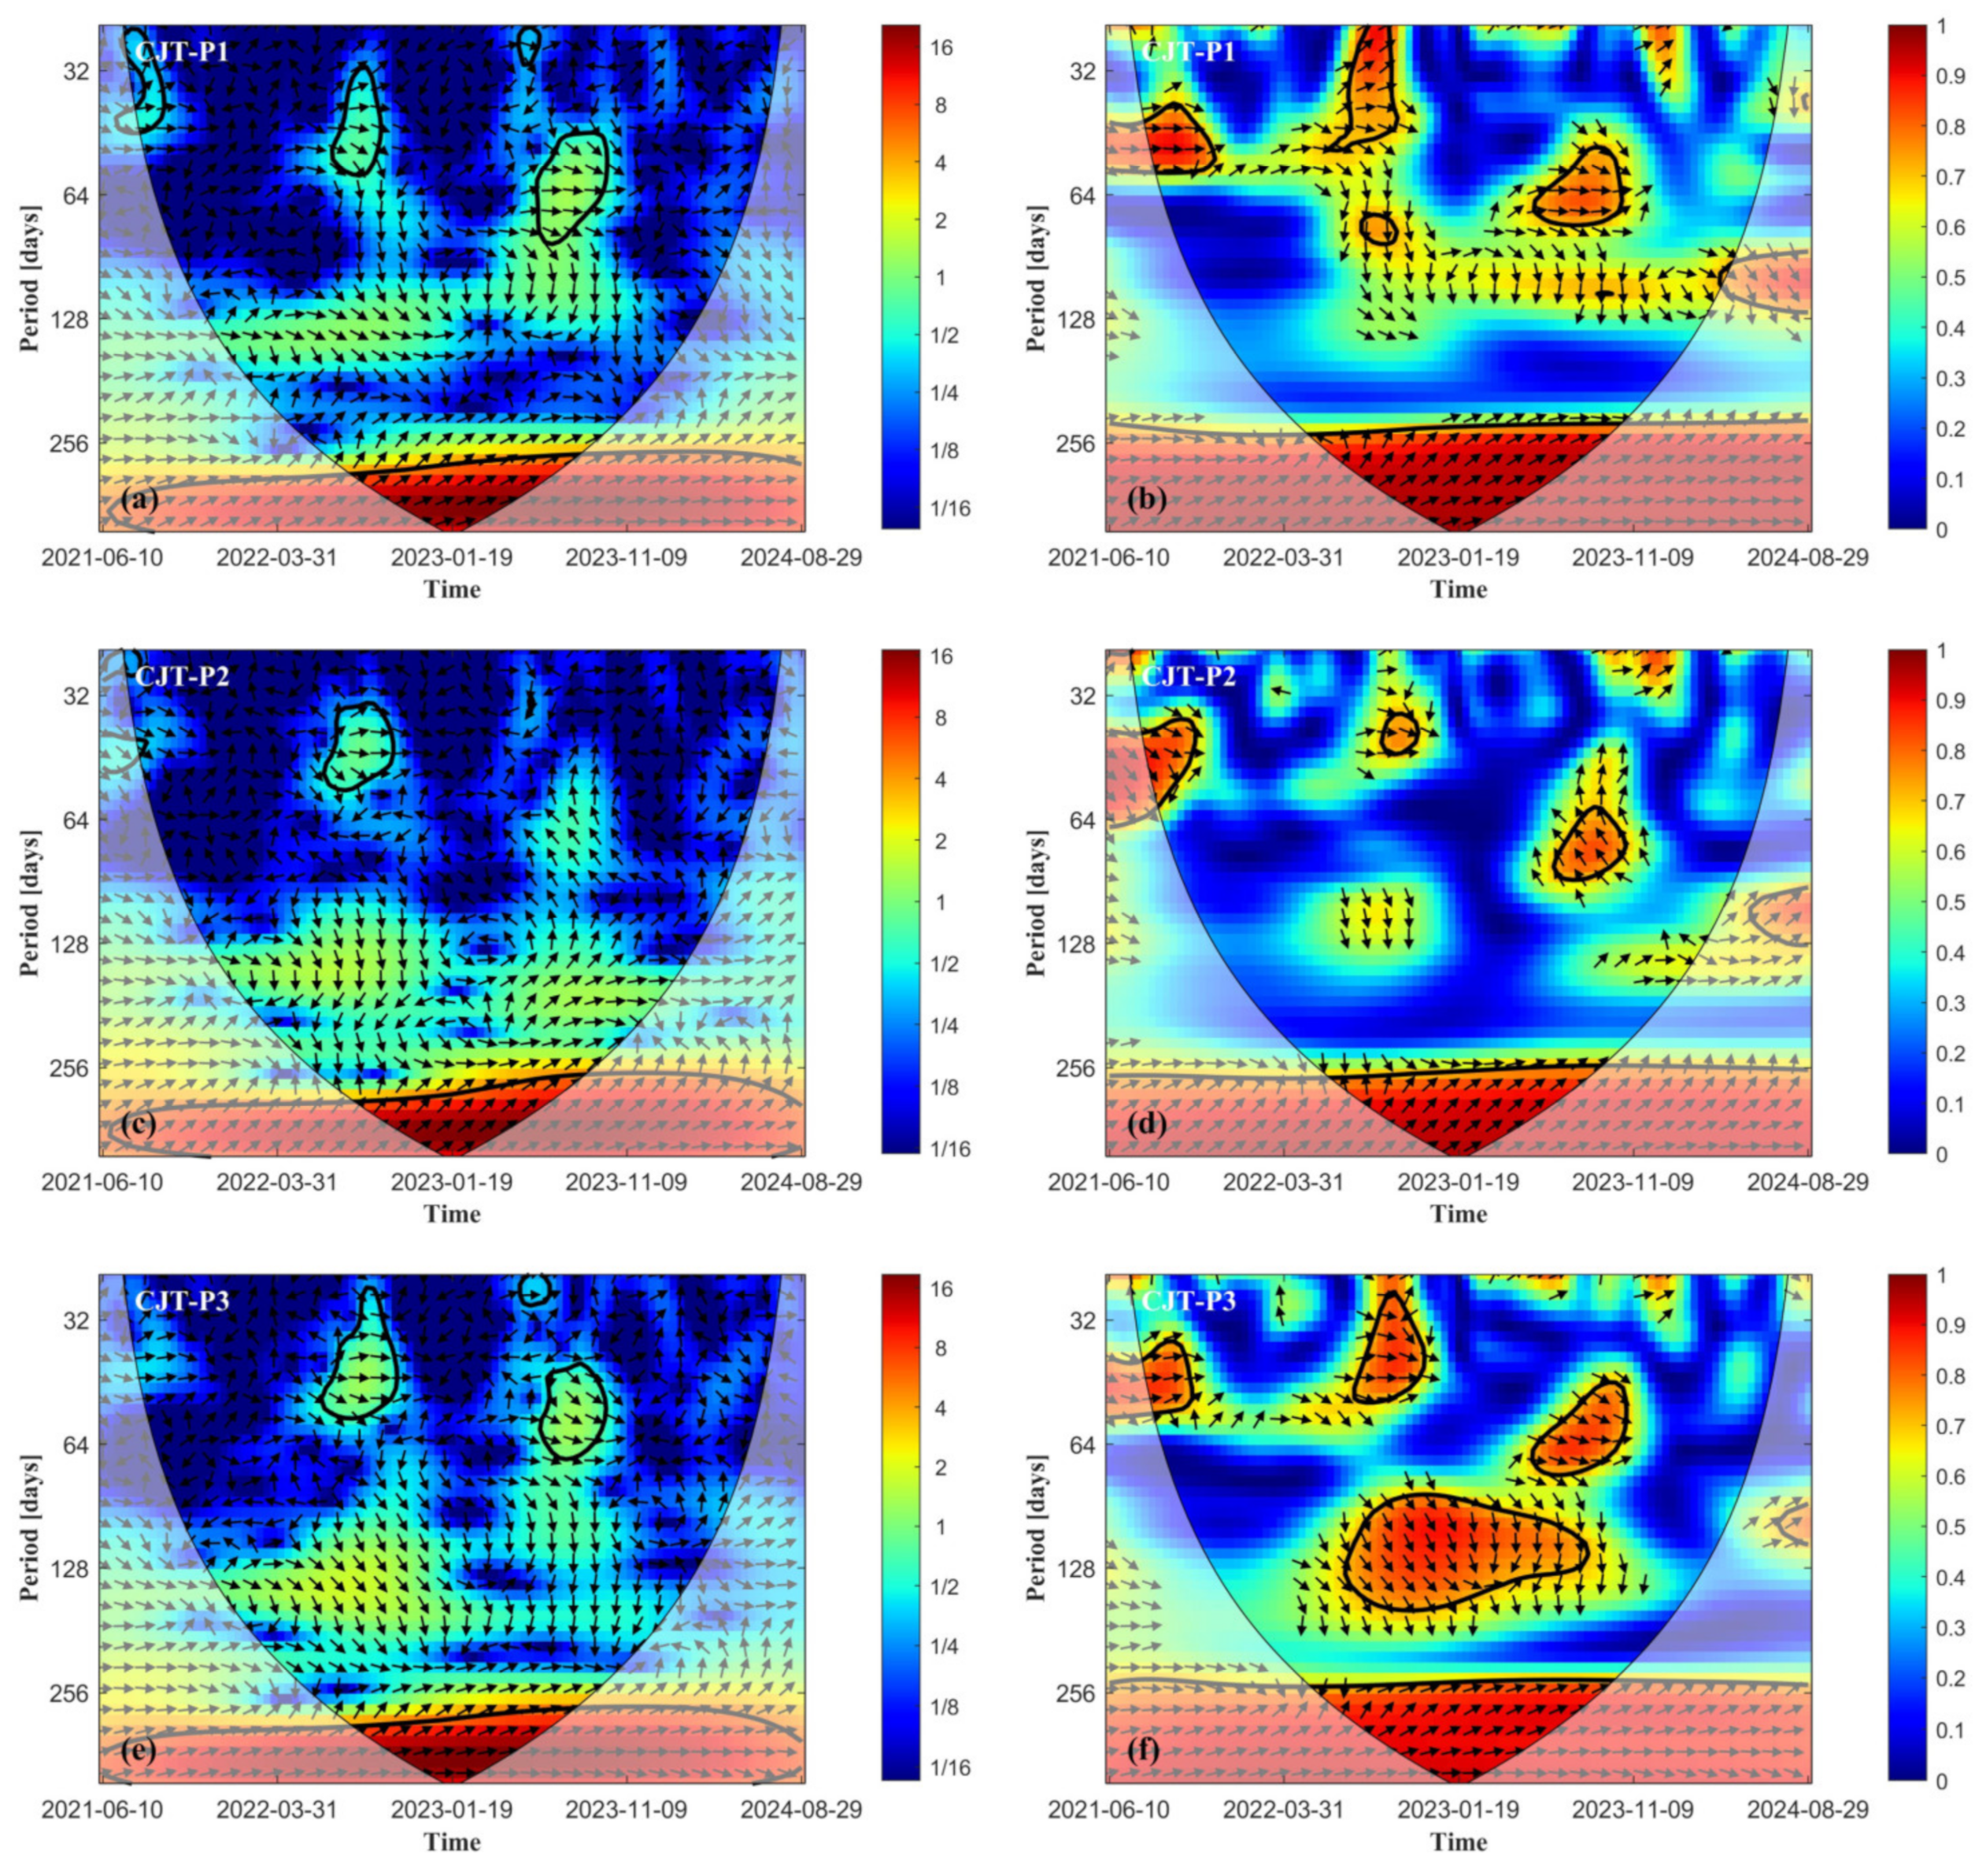
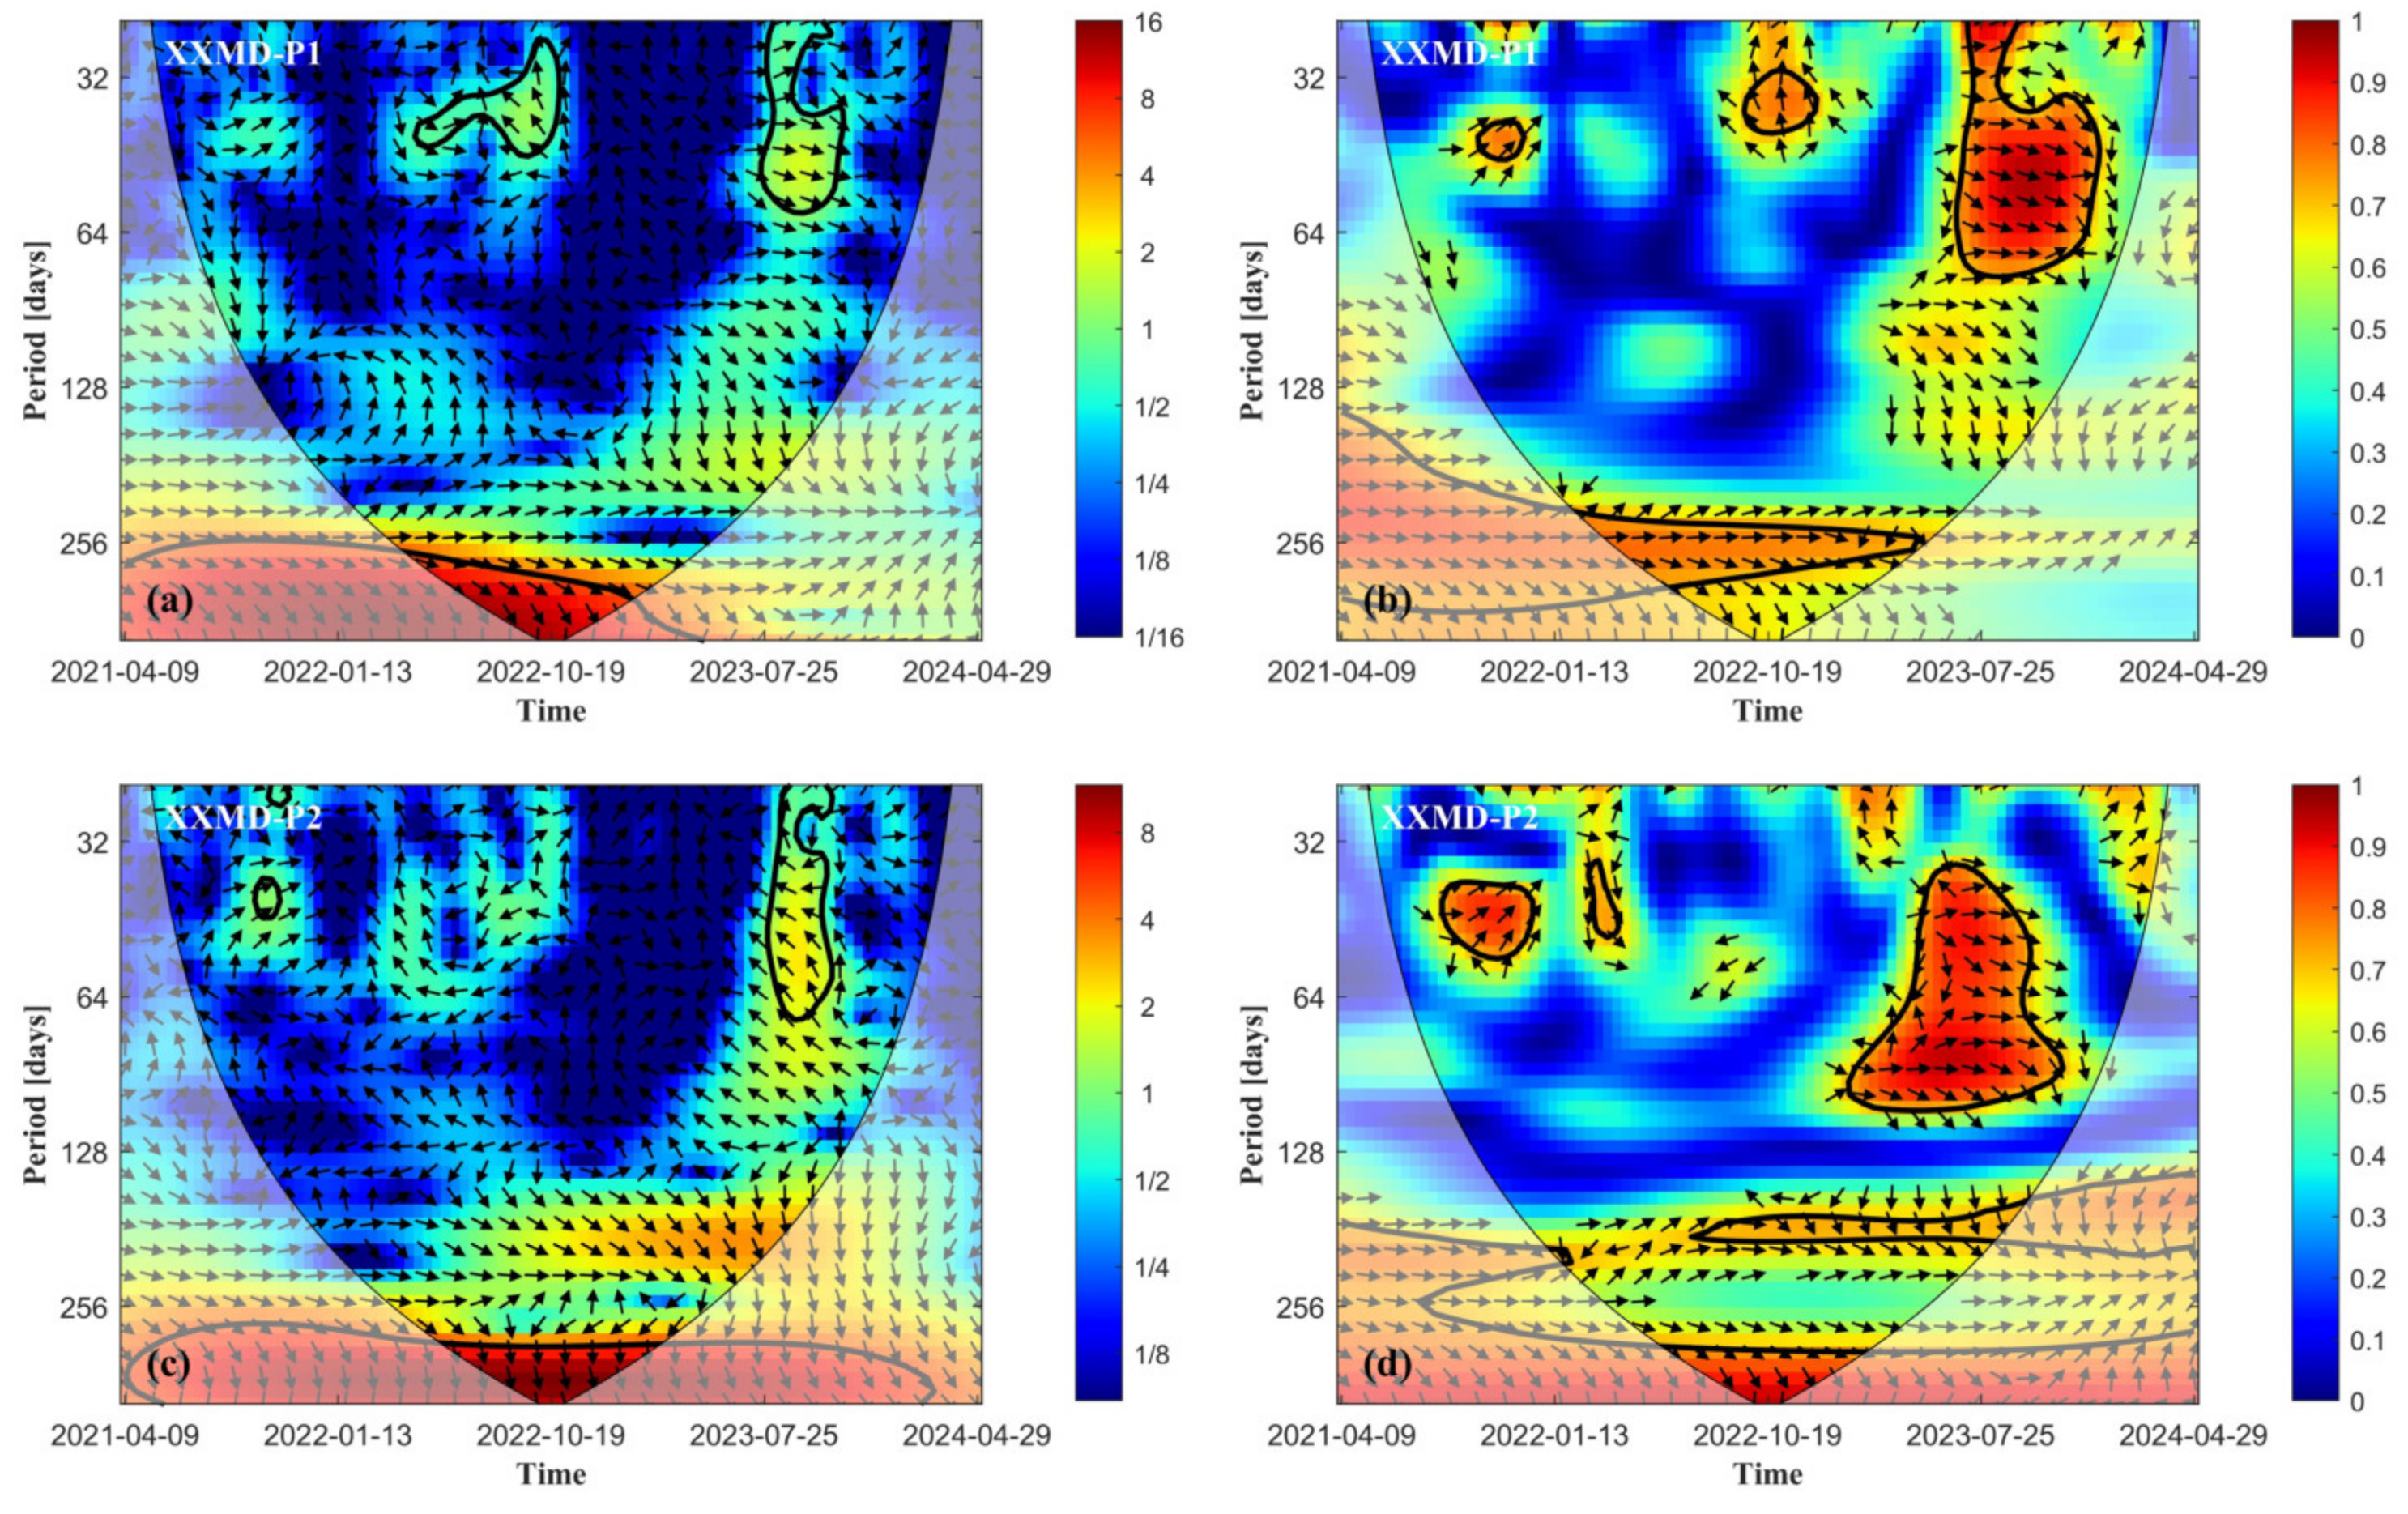
CWT analysis revealed the periodic characteristics of different deformation characteristic points of the landslide body and demonstrated the time-frequency variation laws of rainfall. However, it only reflects the energy distribution of a single variable and cannot directly reveal the correlation and phase relationship between landslide deformation and rainfall. XWT transform can serve as a supplement to continuous wavelet transform; it can identify common laws and relative phase shifts of two time series in time-frequency space. Therefore, by performing XWT and WTC analyses on the deformation and rainfall time series, the cross-wavelet power spectra and wavelet coherence spectra between the periodic deformation components and rainfall were obtained for the Chenjiatian landslide and the Xiaxiaomidi landslide, as shown in Figure 13 and Figure 14. The color bar of the left graph displays the magnitude of wavelet power, while the color bar of the right graph represents the intensity of wavelet coherence. Except for the meaning of the color bars, other graphical elements are consistent with the CWT power spectrum. The black arrows in the figure are used to indicate the phase relationship between the two time series. An arrow pointing to the right indicates that the two time series are in phase, i.e., they show synchronous changes on the corresponding time scale. An arrow pointing to the left indicates that the two time series have opposite trends. An arrow pointing up indicates that the first series leads the second series by a quarter cycle. An arrow pointing down indicates that the second series leads the first series by a quarter cycle. This visualization of phase information not only reveals the interaction mode between the two time series but also helps to analyze the lag relationship between them at different time scales.
As shown in Figure 14, the rainfall and deformation of the three characteristic points of the Chenjiatian landslide have the highest energy density within the 365-day cycle, and these high-energy regions passed the 5% significance level test of wavelet power against red noise. From the perspective of time-series distribution, significant high-energy regions span the entire analysis period, indicating a long-term correlation between rainfall and periodic displacement of the landslide.
In the cross-wavelet energy spectrum, the strongest consistency regions for all three characteristic points are concentrated within the 365-day frequency band. Within this band, the wavelet phase arrows almost consistently point 45° to the upper right, implying a strong positive correlation between rainfall and periodic landslide deformation. Meanwhile, the calculated correlation coefficients all exceed 0.9, further confirming the significant impact of rainfall on landslide deformation. In terms of phase relationship, there is a time lag in the response of periodic landslide deformation to rainfall. The lag time is approximately 0.125 cycles, or about 45 days. This indicates that the periodic deformation of the landslide is significantly affected by rainfall.
Figure 15 shows the XWT and WTC of rainfall and periodic deformation for different characteristic points of the Xiaxiaomidi landslide. From the XWT results, point XXMD-P1 exhibited a region of high energy density from April 2021 to April 2023, and this region also maintained high coherence, with coherence above 0.7. Point XXMD-P2 exhibited high energy density regions within the 365-day cycle, and these regions passed the 5% significance level test of wavelet power against red noise. It is worth noting that the arrow directions in the XWT and WTC analysis charts of the Xiaxiaomidi landslide are distinctly different from those of the Chenjiatian landslide. Most arrows in the high energy density regions of the Xiaxiaomidi landslide are between 90° and 180° (pointing left/up-left), indicating that rainfall changes lag behind landslide deformation, which is completely contrary to the conclusion obtained for the Chenjiatian landslide. This suggests that in the Xiaxiaomidi landslide, rainfall is not the dominant factor in landslide deformation, and the influence of rainfall on reservoir bank landslides is far less than the influence of reservoir water level changes on landslide deformation (Note: the original Chinese text said “influence of reservoir water level changes on rainfall”, but contextually it should be “influence of reservoir water level changes on landslide deformation” or “influence of water level is greater than rainfall”. I have adjusted the translation to reflect logical scientific meaning: the influence of rainfall is far less than the influence of reservoir water level changes).

5. Discussion

Based on the long-term deformation time series derived from SBAS-InSAR, combined with optical image interpretation and wavelet analysis techniques, this study systematically reveals the spatiotemporal deformation differences between the Xiaxiaomidi landslide and the Chenjiatian landslide and their response patterns to hydrological processes. Although both exhibit characteristics of continuous long-term creep, their driving mechanisms and time-frequency evolution laws differ significantly.
The deformation of the Xiaxiaomidi landslide is mainly concentrated in the lower part of the slope, and its time-series curve exhibits a monotonic accelerating sliding trend, showing higher consistency with the water level fluctuation process. With the rise and fall of the water level during reservoir operation, the lower sliding body undergoes significant shear softening and erosion effects, causing the landslide to enter a continuous acceleration phase and further exerting a retrogressive (traction) driving effect on the upper region. Wavelet analysis results show that the periodic signal of the Xiaxiaomidi landslide is weak. In the XWT/WTC images, the coherence between the deformation sequence and rainfall is limited, and a phase relationship where rainfall lags behind deformation is observed. This further confirms that its deformation activity is not primarily driven by rainfall but is more likely closely related to hydrodynamic processes such as reservoir operation, water body erosion, and toe unloading.
In contrast, the Chenjiatian landslide exhibits distinct seasonal response characteristics. Its time-series deformation is composed of a long-term creep trend and significant annual periodic signals, with deformation peaks coinciding highly with the rainy season. CWT results indicate that this landslide has a stable and strong periodic energy concentration zone at the 365-day scale. Further XWT and WTC analyses reveal significant coherence between multiple monitoring points and rainfall, exhibiting a typical lag relationship. This reflects the controlling role of rainfall infiltration, pore water pressure uplift, and deep aquifer regulation processes on the landslide dynamic response. This time-lag effect is consistent with the rainfall-groundwater transmission process, demonstrating that the Chenjiatian landslide is significantly controlled by hydrological recharge processes.
Overall, the differences in the dominant control mechanisms between the Xiaxiaomidi and Chenjiatian landslides mainly stem from variations in geomorphological structure, groundwater systems, hydrodynamic processes, and external disturbances. The former is more susceptible to external hydrodynamic factors such as reservoir water level fluctuations and toe erosion; the latter typically manifests as a rainfall-induced landslide, whose periodic variations are significantly expressed in the time-frequency domain. Wavelet analysis tools played a key role in revealing the dynamic differences between these two types of typical landslides, showing unique advantages particularly in identifying the superposition of long-term trends and short-term cycles, revealing rainfall lag effects, and conducting multi-scale dynamic response analysis.
From a practical engineering perspective, the study suggests that for the Xiaxiaomidi landslide, attention should be focused on the rate of water level change and toe stability during reservoir scheduling. Conversely, risk management for the Chenjiatian landslide should focus on cumulative rainfall, changes in rainfall intensity, and groundwater level responses before and after the rainy season. The two different triggering mechanisms indicate that landslide governance and monitoring strategies should be adapted to local conditions, adopting refined monitoring and differentiated early warning models for different hydrological processes.

6. Conclusions

  • In this study, long-term, high-precision surface deformation time series of the Xiaxiaomidi landslide and the Chenjiatian landslide were acquired using the SBAS-InSAR technique, revealing their significant spatial differences and time-series evolution laws. The Xiaxiaomidi landslide mainly exhibits continuous accelerating sliding characteristics controlled by the lower part of the slope, while the Chenjiatian landslide manifests as obvious annual periodic deformation against a background of long-term creep.
  • The Xiaxiaomidi landslide is distributed along the bank of the Jinsha River reservoir, and its deformation process is closely related to reservoir operation. Wavelet analysis results indicate that its deformation energy is relatively weak in the short-period range, the coherence with rainfall is not strong, and rainfall changes lag behind landslide deformation. This suggests that it is primarily affected by the combined effects of water level fluctuations, toe unloading, and hydrodynamic erosion, representing a typical water-level-driven landslide.
  • Compared to the Xiaxiaomidi landslide, the Chenjiatian landslide is located far from the Jinsha River reservoir bank. CWT analysis shows that multiple monitoring points of this landslide possess stable periodic energy concentration at the 365-day scale. XWT and WTC analyses further reveal high coherence between periodic landslide deformation and rainfall, with a lag response of approximately 1–2 months. This indicates that infiltration caused by rainfall, pore pressure rise, and changes in groundwater recharge are the main factors controlling the landslide’s dynamic behavior.
  • The integrated technical framework of SBAS-InSAR and wavelet analysis constructed in this study effectively characterized the significant differences between the Xiaxiaomidi and Chenjiatian landslides in terms of long-term trends, short-term cycles, and multi-scale hydro-dynamic responses. Through trend-cycle decomposition and time-frequency analysis, we successfully decoupled the dominant controlling factors affecting landslide deformation. The analysis results show that there is a clear spatial differentiation law in the dominant driving mechanisms of the landslide group in the Xiangbiling section: spatially, the deformation of landslides adjacent to the reservoir bank is mainly driven by erosion due to reservoir water level fluctuations, while the deformation of landslides far from the reservoir bank is mainly dominated by rainfall infiltration.

Author Contributions

Conceptualization, B.Z., C.H. and X.J.; methodology, B.Z. and C.H.; software, B.Z., C.H. and J.H.; validation, Y.W., X.M. and W.X.; formal analysis, B.Z. and C.H.; investigation, J.H., Y.W., X.L. and K.Y.; resources, X.J.; data curation, B.Z. and C.H.; writing—original draft preparation, B.Z. and C.H.; writing—review and editing, X.J., X.L. and K.Y.; visualization, B.Z. and C.H.; supervision, X.J.; project administration, X.J.; funding acquisition, X.J. All authors have read and agreed to the published version of the manuscript.

Funding

This research was supported by the Key Science and Technology Project of Shanxi Communications Holding Group (Grant No. 22-JKKJ-4) and the Key Research and Development Program of Ningxia Hui Autonomous Region (Grant No. 2025BEE04001).

Data Availability Statement

Publicly available datasets were analyzed in this study. The Sentinel-1 SAR data can be found at the Copernicus Open Access Hub (https://dataspace.copernicus.eu/, accessed on 25 September 2025); the ALOS World 3D-30 m (AW3D30) DEM data are available from the Japan Aerospace Exploration Agency (JAXA) at https://www.eorc.jaxa.jp/ALOS/en/aw3d30/, (accessed on 25 September 2025); the ERA5-Land rainfall reanalysis data can be accessed through the ECMWF Climate Data Store at https://cds.climate.copernicus.eu/, (accessed on 25 September 2025); and the precise orbit ephemerides are available from the Copernicus POD Service at https://sentinels.copernicus.eu/, (accessed on 25 September 2025). The InSAR deformation data generated during the study are available from the corresponding author upon reasonable request.

Acknowledgments

The authors would like to thank the European Space Agency (ESA) for providing the Sentinel-1 SAR data and precise orbit ephemerides. We also thank the Japan Aerospace Exploration Agency (JAXA) for providing the ALOS World 3D-30 m (AW3D30) DEM data, and the European Centre for Medium-Range Weather Forecasts (ECMWF) for the ERA5-Land rainfall reanalysis data.

Conflicts of Interest

Author Wei Xiong was employed by the company Shanxi Intelligent Transportation Research Institute Co., Ltd. The remaining authors declare that the research was conducted in the absence of any commercial or financial relationships that could be construed as a potential conflict of interest.

Abbreviations

The following abbreviations are used in this manuscript:
InSARInterferometric Synthetic Aperture Radar
SBAS-InSARSmall Baseline Subset Interferometric Synthetic Aperture Radar
PS-InSARPersistent Scatterer Interferometry
SARSynthetic Aperture Radar
DEMDigital Elevation Model
ALOSAdvanced Land Observing Satellite
AW3D30ALOS World 3D-30 m
JAXAJapan Aerospace Exploration Agency
ESAEuropean Space Agency
PODPrecise Orbit Determination
ECMWFEuropean Centre for Medium-Range Weather Forecasts
ERA5ECMWF Reanalysis 5
ERA5-LandERA5 Land reanalysis dataset
LOSLine of Sight
MCFMinimum Cost Flow
SVDSingular Value Decomposition
WGS-84World Geodetic System 1984
CWTContinuous Wavelet Transform
XWTCross Wavelet Transform
WTCWavelet Coherence
COICone of Influence
XXMDXiaxiaomidi landslide
CJTChenjiatian landslide
DCDirect current (zero-frequency) component

References

  1. Sun, X.; Chen, J.; Li, Y.; Rene, N.N. Landslide Susceptibility mapping along a rapidly uplifting river valley of the Upper Jinsha River, Southeastern Tibetan Plateau, China. Remote Sens. 2022, 14, 1730. [Google Scholar] [CrossRef]
  2. Cui, Y.; Bao, P.; Xu, C.; Fu, G.; Jiao, Q.; Luo, Y.; Shen, L.; Xu, X.; Liu, F.; Lyu, Y.; et al. A big landslide on the Jinsha River, Tibet, China: Geometric characteristics, causes, and future stability. Nat. Hazards 2020, 104, 2051–2070. [Google Scholar] [CrossRef]
  3. Liang, G.; Wang, Z.; Zhang, G.; Wu, L. Two huge landslides that took place in quick succession within a month at the same location of Jinsha River. Landslides 2019, 16, 1059–1062. [Google Scholar] [CrossRef]
  4. Liu, M.; Yang, Z.; Xi, W.; Guo, J.; Yang, H. InSAR-based method for deformation monitoring of landslide source area in Baihetan reservoir, China. Front. Earth Sci. 2023, 11, 1253272. [Google Scholar] [CrossRef]
  5. Yang, B.; Yin, K.; Xiao, T.; Chen, L.; Du, J. Annual variation of landslide stability under the effect of water level fluctuation and rainfall in the Three Gorges Reservoir, China. Environ. Earth Sci. 2017, 76, 564. [Google Scholar] [CrossRef]
  6. Huang, D.; Gu, D.M.; Song, Y.X.; Cen, D.F.; Zeng, B. Towards a complete understanding of the triggering mechanism of a large reactivated landslide in the Three Gorges Reservoir. Eng. Geol. 2018, 238, 36–51. [Google Scholar] [CrossRef]
  7. Liu, Y.; Qiu, H.; Yang, D.; Liu, Z.; Ma, S.; Pei, Y.; Zhang, J.; Tang, B. Deformation responses of landslides to seasonal rainfall based on InSAR and wavelet analysis. Landslides 2022, 19, 199–210. [Google Scholar] [CrossRef]
  8. Gao, Z.; Xie, M.; Ju, N.; Huang, X.; Peng, T.; He, C. Multi-source Remote Sensing Dynamic Deformation Monitoring of Accumulation Landslide. Geomat. Inf. Sci. Wuhan Univ. 2024, 49, 1482–1491. [Google Scholar]
  9. Li, X.; Guo, C.; Chen, W.; Wei, P.; Jin, F.; Yan, Y.; Liu, G. Deformation Mechanisms and Rainfall Lag Effects of Deep-Seated Ancient Landslides in High-Mountain Regions: A Case Study of the Zhongxinrong Landslide, Upper Jinsha River. Remote. Sens. 2025, 17, 687. [Google Scholar] [CrossRef]
  10. Feng, X.; Zhao, C.; Liu, X.; Yan, M. Detection and monitoring of active landslides after the initial impoundment of the Baihetan Reservoir (China) using time series InSAR method. Bull. Eng. Geol. Environ. 2025, 84, 86. [Google Scholar] [CrossRef]
  11. Miao, F.; Wu, Y.; Xie, Y.; Li, Y. Prediction of landslide displacement with step-like behavior based on multialgorithm optimization and a support vector regression model. Landslides 2017, 15, 475–488. [Google Scholar] [CrossRef]
  12. Intrieri, E.; Gigli, G.; Mugnai, F.; Fanti, R.; Casagli, N. Design and implementation of a landslide early warning system. Eng. Geol. 2012, 147, 124–136. [Google Scholar] [CrossRef]
  13. Handwerger, A.L.; Roering, J.J.; Schmidt, D.A. Controls on the seasonal deformation of slow-moving landslides. Earth Planet. Sci. Lett. 2013, 377, 239–247. [Google Scholar] [CrossRef]
  14. Crosetto, M.; Monserrat, O.; Cuevas-González, M.; Devanthéry, N.; Crippa, B. Persistent scatterer interferometry: A review. ISPRS J. Photogramm. Remote Sens. 2016, 115, 78–89. [Google Scholar] [CrossRef]
  15. Ferretti, A.; Fumagalli, A.; Novali, F.; Prati, C.; Rocca, F.; Rucci, A. A new algorithm for processing interferometric data-stacks: SqueeSAR. IEEE Trans. Geosci. Remote Sens. 2011, 49, 3460–3470. [Google Scholar] [CrossRef]
  16. Ferretti, A.; Prati, C.; Rocca, F. Permanent scatterers in SAR interferometry. IEEE Trans. Geosci. Remote Sens. 2001, 39, 8–20. [Google Scholar] [CrossRef]
  17. Berardino, P.; Fornaro, G.; Lanari, R.; Sansosti, E. A new algorithm for surface deformation monitoring based on small baseline differential SAR interferograms. IEEE Trans. Geosci. Remote Sens. 2002, 40, 2375–2383. [Google Scholar] [CrossRef]
  18. Yi, Y.; Xu, X.; Xu, G.; Gao, H. Landslide detection using time-series InSAR method along the Kangding-Batang section of Shanghai-Nyalam road. Remote Sens. 2023, 15, 1452. [Google Scholar] [CrossRef]
  19. Intrieri, E.; Raspini, F.; Fumagalli, A.; Lu, P.; Del Conte, S.; Farina, P.; Allievi, J.; Ferretti, A.; Casagli, N. The Maoxian landslide as seen from space: Detecting precursors of failure with Sentinel-1 data. Landslides 2018, 15, 123–133. [Google Scholar] [CrossRef]
  20. Wen, N.; Dai, K.; Tomas, R.; Wu, M.; Chen, C.; Deng, J.; Shi, X.; Feng, W. Revealing the time lag between slope stability and reservoir water fluctuation from InSAR observations and wavelet tools—A case study in Maoergai Reservoir (China). GIScience Remote Sens. 2023, 60, 2170125. [Google Scholar] [CrossRef]
  21. Lee, E.; Kim, S. Wavelet analysis of soil moisture measurements for hillslope hydrological processes. J. Hydrol. 2019, 575, 82–93. [Google Scholar] [CrossRef]
  22. Dai, K.; Chen, C.; Shi, X.; Wu, M.; Feng, W.; Xu, Q.; Liang, R.; Zhuo, G.; Li, Z. Dynamic landslides susceptibility evaluation in Baihetan Dam area during extensive impoundment by integrating geological model and InSAR observations. Int. J. Appl. Earth Obs. Geoinf. 2023, 116, 103157. [Google Scholar] [CrossRef]
  23. Dun, J.; Feng, W.; Yi, X.; Zhang, G.; Wu, M. Detection and mapping of active landslides before impoundment in the Baihetan Reservoir Area (China) based on the time-series InSAR method. Remote Sens. 2021, 13, 3213. [Google Scholar] [CrossRef]
  24. Ma, X.; Peng, J.; Su, Y.; Shi, M.; Zheng, Y.; Li, X.; Jiang, X. Deformation Characteristics and Activation Dynamics of the Xiaomojiu Landslide in the Upper Jinsha River Basin Revealed by Multi-Track InSAR Analysis. Remote Sens. 2024, 16, 1940. [Google Scholar] [CrossRef]
  25. Wei, C.H.; Li, W.L.; Wu, Z.L.; Zhou, S.S.; Wang, X.; Li, X.Q.; Li, Y.S. Identification of active landslides and analysis of deformation influencing factors in the Baihetan reservoir area. Geosci. Bull. 2025, 44, 62–77. (In Chinese) [Google Scholar]
  26. Su, Y.; Peng, J.; Shi, M.; Guo, C.; Ma, X.; Li, X.; Wang, J.; Wang, W. An M-Estimation Method for InSAR Nonlinear Deformation Modeling and Inversion. IEEE Trans. Geosci. Remote Sens. 2024, 62, 5207912. [Google Scholar] [CrossRef]
  27. Grinsted, A.; Moore, J.C.; Jevrejeva, S. Application of the cross wavelet transform and wavelet coherence to geophysical time series. Nonlinear Process. Geophys. 2004, 11, 561–566. [Google Scholar] [CrossRef]
  28. Tomás, R.; Li, Z.; Lopez-Sanchez, J.M.; Liu, P.; Singleton, A. Using wavelet tools to analyse seasonal variations from InSAR time-series data: A case study of the Huangtupo landslide. Landslides 2016, 13, 437–450. [Google Scholar] [CrossRef]
  29. Tang, W.; Zhao, X.; Kang, C.; Yang, K.; Bi, G.; Wang, J.; Dai, H.; Yan, Z. Time-series InSAR monitoring of land subsidence and wavelet analysis of seasonal deformation in the Taiyuan Basin. Chin. J. Geophys. 2023, 66, 2352–2369. (In Chinese) [Google Scholar]
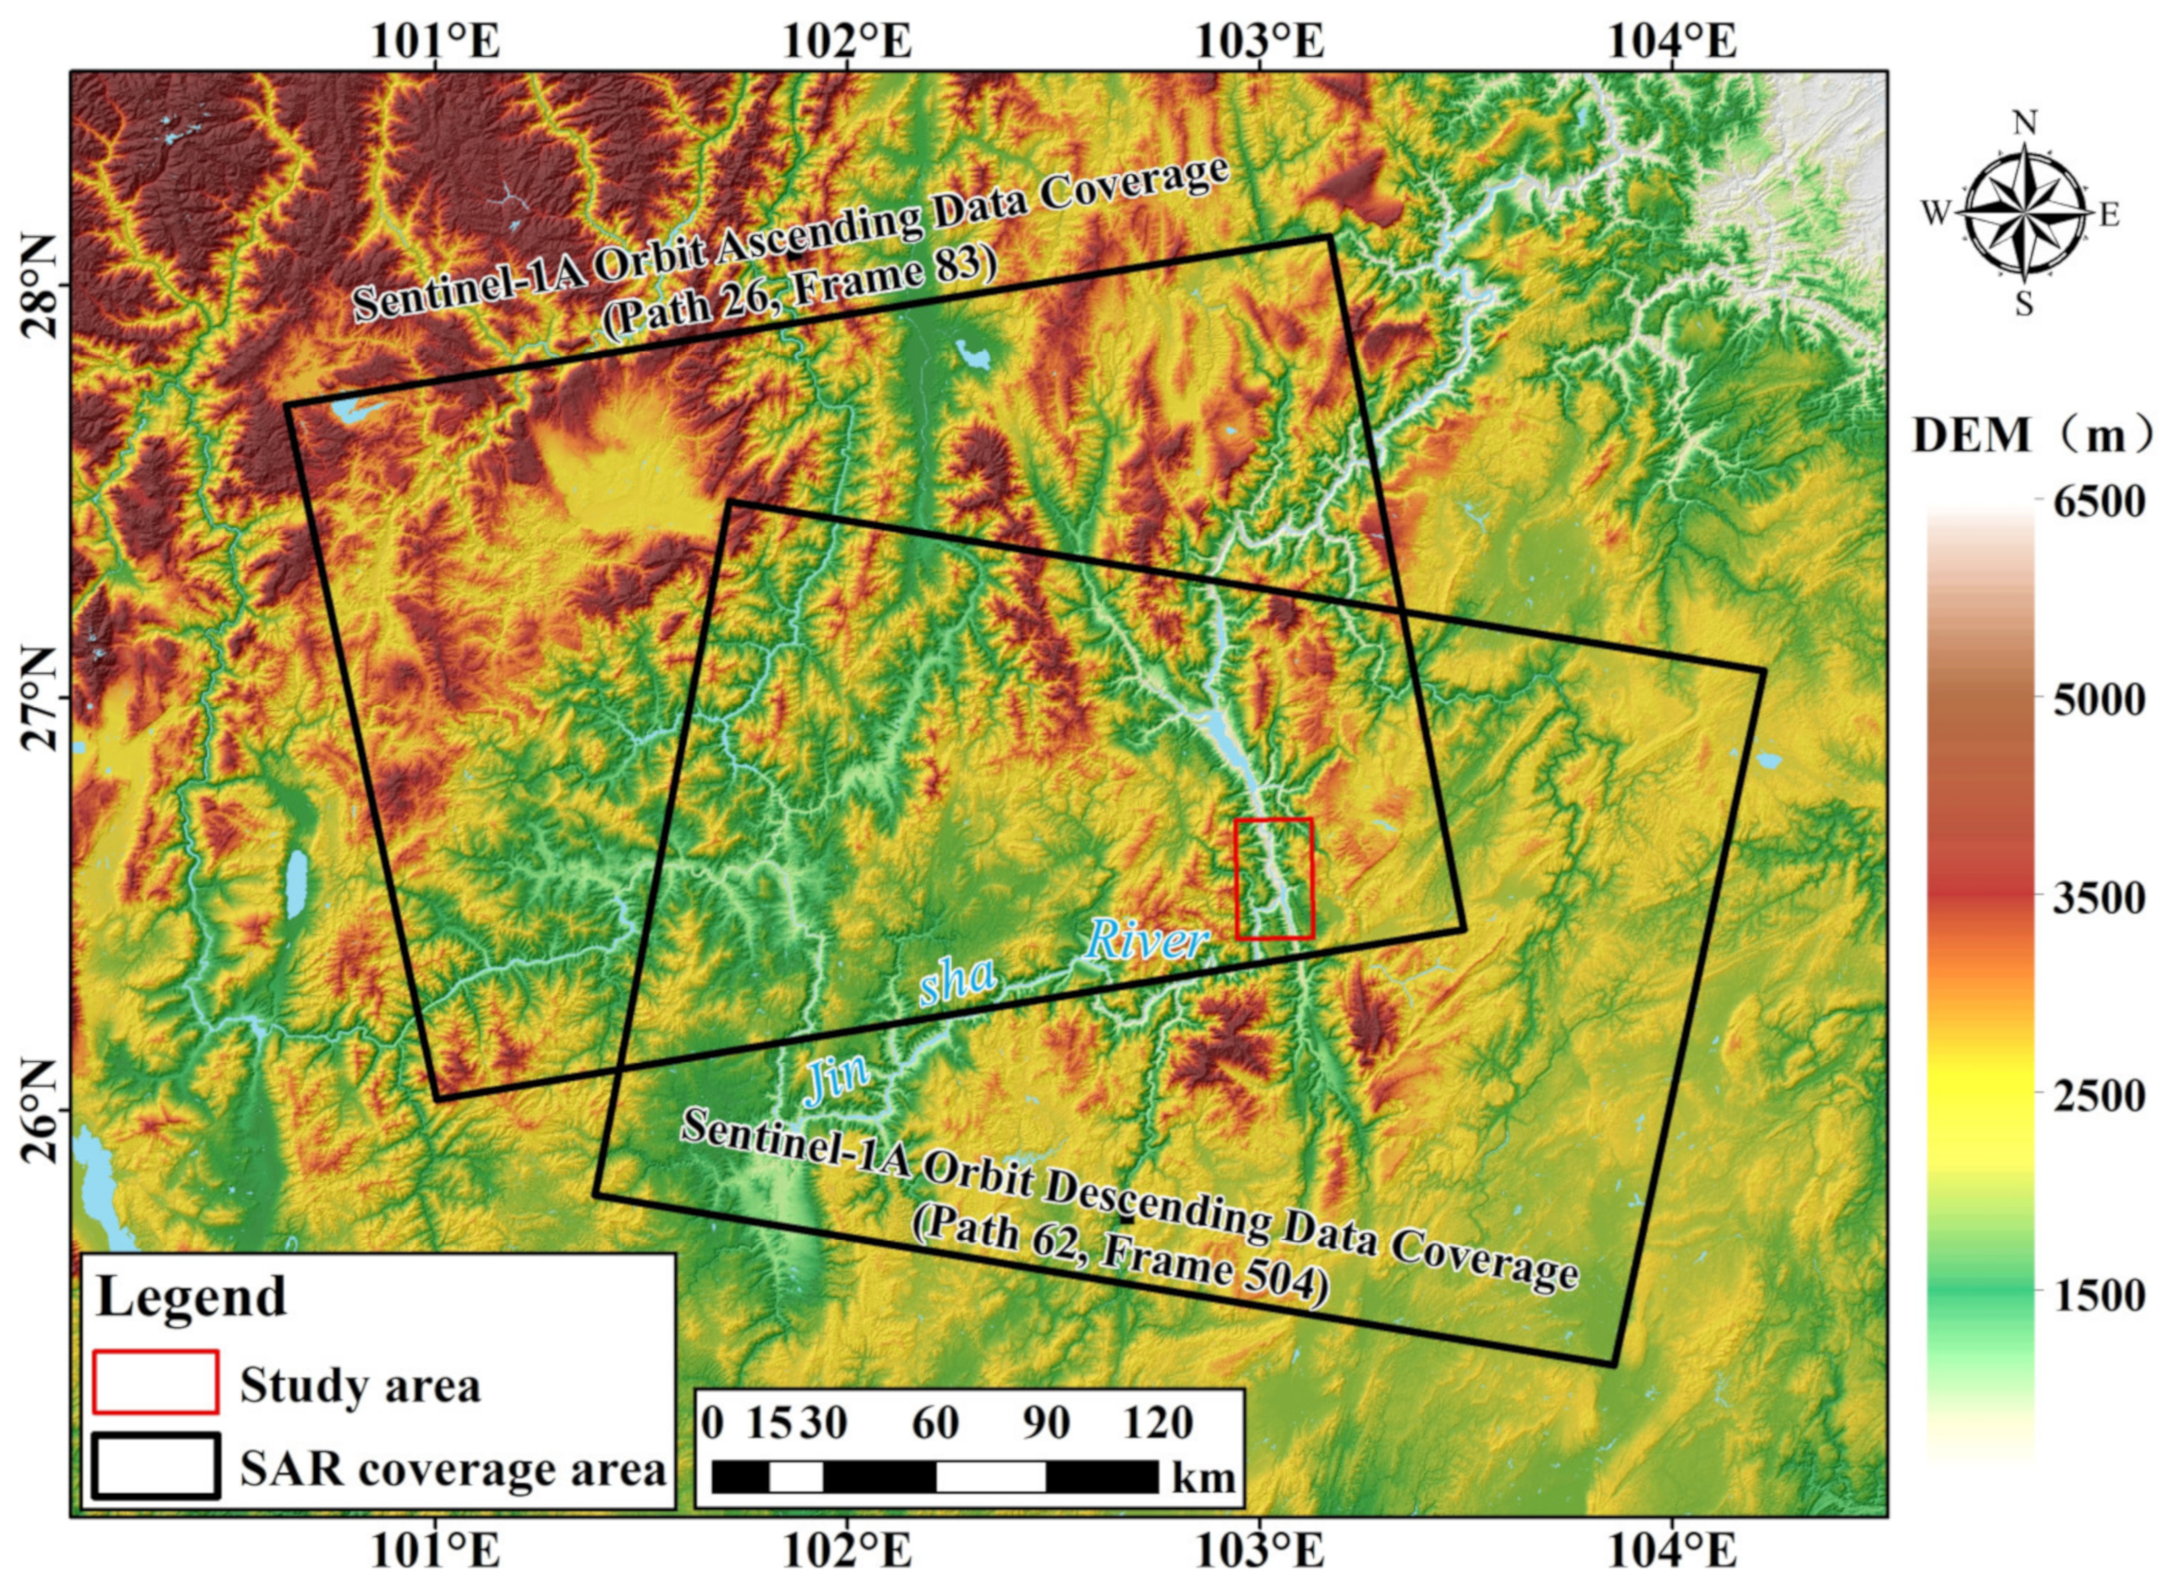
Figure 1. Sentinel-1 data coverage in the study area.
Remotesensing 18 00784 g001
Figure 2. Spatiotemporal baseline distribution of interferograms: (a) Path 26, Frame 83; (b) Path 62, Frame 504.
Remotesensing 18 00784 g002
Figure 3. Spatial distribution of point P2: (a) Ascending; (b) Descending.
Remotesensing 18 00784 g003
Figure 4. InSAR-derived deformation time series at point P2.
Remotesensing 18 00784 g004
Figure 5. Distribution of typical landslide hazards along the Hululukou-Xiangbiling reach.
Remotesensing 18 00784 g005
Figure 6. Spatial deformation characteristics of the Xiaxiaomidi landslide.
Remotesensing 18 00784 g006
Figure 7. Time-series deformation curves of monitoring points P1 and P2 at the Xiaomidi landslide.
Remotesensing 18 00784 g007
Figure 8. Spatial deformation characteristics of the Chenjiatian landslide.
Remotesensing 18 00784 g008
Figure 9. Time-series deformation curves of monitoring points P1, P2, and P3 at the Chenjiatian landslide.
Remotesensing 18 00784 g009
Figure 10. Time-series deformation curves of characteristic monitoring points at the Chenjiatian landslide (left) and the Xiaxiaomidi landslide (right).
Remotesensing 18 00784 g010
Figure 11. Relationship between periodic deformation and rainfall at the Chenjiatian landslide (left) and the Xiaxiaomidi landslide (right).
Remotesensing 18 00784 g011
Figure 12. Continuous wavelet transform (CWT) power spectra of the two deformation characteristic points and rainfall at the Xiaxiaomidi landslide: (a) XXMD-P1 deformation; (b) XXMD-P2 deformation; (c) rainfall.
Remotesensing 18 00784 g012
Figure 13. Continuous wavelet transform (CWT) power spectra of the three deformation characteristic points and rainfall at the Chenjiatian landslide: (a) CJT-P1 deformation; (b) CJT-P2 deformation; (c) CJT-P3 deformation; (d) rainfall.
Remotesensing 18 00784 g013
Figure 14. XWT and XTC relationships between periodic deformation components at different characteristic points and rainfall at the Chenjiatian landslide: (a) XWT of CJT-P1 and rainfall; (b) XTC of CJT-P1 and rainfall; (c) XWT of CJT-P2 and rainfall; (d) XTC of CJT-P2 and rainfall; (e) XWT of CJT-P3 and rainfall; (f) XTC of CJT-P3 and rainfall.
Remotesensing 18 00784 g014
Figure 15. XWT and XTC relationships between periodic deformation components at different characteristic points and rainfall at the Xiaxiaomidi landslide: (a) XWT of XXMD-P1 and rainfall; (b) XTC of XXMD-P1 and rainfall; (c) XWT of XXMD-P2 and rainfall; (d) XTC of XXMD-P2 and rainfall.
Remotesensing 18 00784 g015
Table 1. Detailed Parameters of Sentinel-1 SAR Data for the Study Area.
PeriodOrbit
Direction
Center Incidence
Angle (°)
Heading
Angle (°)
PathFrameNumber of
Images
1 April 2021–
29 August 2024
Ascending43.91349.95268387
1 June 2021–
29 August 2024
Descending39.31190.516250495
Disclaimer/Publisher’s Note: The statements, opinions and data contained in all publications are solely those of the individual author(s) and contributor(s) and not of MDPI and/or the editor(s). MDPI and/or the editor(s) disclaim responsibility for any injury to people or property resulting from any ideas, methods, instructions or products referred to in the content.