1. Introduction
Synthetic Aperture Radar (SAR) represents a powerful observation system. Compared to conventional observation techniques such as optical imaging, it offers significant advantages by being independent of factors like illumination and weather conditions [
1,
2], enabling continuous operation around the clock and throughout the year [
3,
4,
5]. Consequently, it has significant application value in the field of remote sensing and is widely utilized in areas such as ocean condition monitoring [
6], marine disaster early warning [
7], and maritime target detection [
8,
9].
In recent years, the rapid advancement of machine learning has led to the emergence of numerous object detection networks, offering novel approaches to SAR image target detection and recognition [
10,
11,
12]. However, targets in maritime SAR images often present challenges such as small size, varying scales, blurred contours, and susceptibility to background clutter interference [
13]. Most existing general-purpose detection networks are designed primarily for optical images and do not account for these characteristics of SAR images. Therefore, directly applying general optical image detection networks to SAR target detection suffers from poor adaptability, limiting their performance on practical platforms (cross-modal models). This paper reviews the development of SAR image object detection techniques and related general optical object detection technologies from two dimensions: traditional SAR target detection approaches and deep learning-based methods.
Traditional SAR image recognition methods primarily focus on feature extraction, image segmentation, and threshold detection [
14,
15,
16], among which Constant False Alarm Rate (CFAR) and its derivative algorithms represent the most extensively researched and applied thresholding approaches. In 2017, Wang et al. proposed a CFAR ship detection model based on the intensity–spatial domain, enhancing both image contrast and accuracy [
17]. In 2018, Ai et al. introduced a local CFAR detector based on SAR image gray-intensity correlations [
18]. While this detector adapts to dynamic backgrounds, it demands substantial computational resources. To further optimize detection algorithms, researchers have also conducted studies on target detection in high-resolution SAR images using CFAR as a foundation. In 2017, Li et al. proposed a lightweight superpixel-level constant false alarm rate detection method [
19] utilizing superpixel segmentation and a two-stage CFAR detection approach. Subsequently, in 2020, Lin et al. introduced a ship detection method [
20] for high-resolution SAR images that overcomes the limitations of traditional CFAR, enhancing detection robustness.
Image segmentation and feature extraction also represent significant research directions for conventional SAR target detection. As early as 2001, Kaplan et al. applied these techniques to conventional SAR target detection, evaluating the effectiveness of extended fractals (EF) [
21] in target detection. In 2002, Charalampidis et al. proposed wavelet fractal (WF) features [
22], enabling classification and segmentation through multi-scale roughness feature computation.
In summary, traditional SAR target detection methods primarily rely on image processing techniques such as feature extraction, thresholding, and image segmentation. While these methods reduce computational complexity to some extent, they make limited use of the scattering characteristics of SAR imaging and remain sensitive to environmental variations, making it difficult to maintain stable detection accuracy. These limitations severely restrict their application in more complex scenarios, such as collaborative understanding incorporating optical information.
With the advancement of deep learning research, the development of object detection networks has gradually gained momentum. Since the introduction of R-CNN [
23] in 2014—the first algorithm to utilize convolutional neural networks for object detection in computer vision—the field has undergone multiple iterations, ultimately evolving into two main detection frameworks [
24]. The original R-CNN was a two-stage network that pre-generated candidate regions. While it initiated the era of object detection, it suffered from slow computational speed and limited detection accuracy. To overcome the limitations of R-CNN, numerous improved models emerged. In 2015, Fast R-CNN [
25] employed the lightweight Very Deep Convolutional Network (VGG16) as its backbone [
26], accelerating detection speed nearly ninefold. Faster R-CNN [
27] introduced the Region Proposal Network (RPN), boosting both the speed and quantity of high-quality candidate boxes while enabling end-to-end training. Mask R-CNN [
28] added a parallel mask branch at the end of the Faster R-CNN network, facilitating instance segmentation; Cascade R-CNN [
29] focused on Intersection Over Union (IoU) thresholds, employing a cascaded detector architecture that progressively increased IoU thresholds to selectively suppress false positives and mitigate overfitting; Feature Pyramid Network (FPN) [
30] and SPP-net [
31] optimized performance through multi-scale feature fusion and spatial pooling methods, respectively. These networks transition feature extraction from manual design to data-driven approaches, achieving relatively faster speeds and higher accuracy. They provide deep learning references for multi-modal data detection, but still fail to meet real-time requirements and still have limitations in application.
To overcome this constraint, a series of single-stage object detection algorithms emerged. Among them, the YOLO (You Only Look Once) series [
32] transformed object detection into a regression problem, eliminating the need for region proposal generation and enabling end-to-end optimization, significantly reducing computational overhead; SSD (Single Shot MultiBox Detector) [
33] and its improved variants DSSD (Deconvolutional Single Shot Detector) [
34] and FSSD (Feature Fusion Single Shot Multibox Detector) [
35] further enhance detection performance and speed by predicting across feature maps of different scales and incorporating feature fusion strategies; RetinaNet (Focal Loss for Dense Object Detection) [
36] employs a focal loss function to address class imbalance; AFSar CenterNet [
37] treats object detection as a keypoint detection problem requiring only the center point of the target, eliminating the need for pre-generated anchors. These one-stage detection networks no longer require candidate box generation, significantly boosting detection speed. However, the early YOLO series lagged behind Fast R-CNN in accuracy, while the SSD series and RetinaNet models proved overly complex, demanding greater hardware resources for operation. Subsequent YOLO v3 [
38] and YOLOv5 [
39] improved upon the original YOLO architecture, enhancing detection accuracy while maintaining high speed. The newly proposed YOLOX [
40] further optimizes YOLOv3 and YOLOv5, achieving efficient object detection with fewer parameters and higher accuracy. Subsequent YOLO variants have also been refined for optical image detection: YOLOv7 [
41] builds upon YOLOv4 [
42] with training process optimization; YOLOv8 [
43] extends YOLOv5’s strengths through meticulous fine-tuning of Head, Loss, and data augmentation structures; YOLOv11 [
44] further refines network modules from YOLOv8; YOLOv10 [
45] is the product of extensive debugging and development based on the YOLO framework [
46], refining the model architecture and introducing a dual-label assignment strategy to reduce computational resource consumption while enhancing performance; YOLOV12 [
47] incorporates a region attention module and a residual efficient layer aggregation network, improving the model’s real-time capability and computational efficiency.
In the field of remote sensing, deep learning-based SAR ship detection methods have become a research focus. Researchers are also attempting to apply general-purpose object detection networks (typically designed for optical images) to SAR ship detection and recognition tasks. These attempts essentially represent the first step in exploring radar and other multi-modal data fusion—namely, improving detection models tailored to the characteristics of radar data. Due to significant differences in imaging principles and image characteristics between SAR images and other modalities like optical images, most researchers modify existing general-purpose optical object detection networks based on SAR ship image features [
48,
49].
In 2018, Jiao et al. proposed a densely connected multi-scale neural network based on Faster-RCNN [
50] to address SAR ship detection across varying scales and scenarios. That same year, Wang et al. attempted to integrate ship detection and angle estimation using a convolutional neural network to reduce computational load [
51]. Subsequently, Ai et al. proposed the Multi-Scale Rotational Feature Integration Convolutional Neural Network (MSRIHL-CNN) [
52] in 2019 and the Multi-Kernel Size Feature Fusion Convolutional Neural Network (MKSFF-CNN) [
53] in 2021. These feature fusion methods effectively enhance the model’s discriminative capability. Concurrently, Sun et al. introduced BiFA-YOLO in 2021 [
54]. By aggregating multi-scale features and employing data augmentation techniques like angular classification structures, it significantly improved detection robustness for ships in arbitrary orientations. Additionally, Sun et al. proposed the Multi-Scale Dynamic Feature Fusion Network (MSDFF-Net) [
55] in 2025, effectively mitigating scale imbalance issues. Building upon this foundation, Sun et al. proposed the Knowledge Fusion and Imbalance-Aware Network (KFIA-Net) in 2026 [
56]. By incorporating multi-source prior knowledge and an imbalance-aware loss function, KFIA-Net effectively mitigated the multi-class imbalance and misclassification issues in SAR ship detection. In 2020, Fu et al. proposed the Anchor-Free Feature Balancing and Refinement Network (FBR-Net) [
57] for SAR target detection, balancing and enhancing target features. Later that December, Li et al. designed Lite Faster R-CNN [
58] with feature amplification and multi-scale feature skip-connection structures, optimizing model speed for real-time maritime rescue and military emergency decision-making. That same year, the team further proposed HyperLi-Net [
59]. This network ensures detection accuracy and achieves rapid detection through separate inner and outer designs, proving highly applicable in numerous real-time scenarios. In 2021, S. Gao et al. introduced SAR-Net [
60], a dedicated detection method for SAR ship detection. It balances model flexibility and performance by refining the backbone network, neck, and head. In 2026, addressing the degradation of cross-sensor SAR target detection performance [
61], Zhang et al. proposed a cross-sensor target detection method based on semantic scattering graph structure alignment. By employing graph structure modeling and a hierarchical structure alignment mechanism, they achieved consistent target structure alignment, thereby enhancing the robustness of SAR detection in cross-sensor scenarios.
Researchers also observed that depthwise separable convolution (DSC) [
62] demonstrates significant advantages in SAR ship detection. DSC reduces model parameters and computational complexity, enabling more efficient extraction of target features from images. In 2019, Zhang Tianwen proposed a high-speed SAR search-and-rescue ship detection method [
7] based on practical application needs. This approach integrates multi-scale detection, cascading, and anchor box mechanisms using a depthwise separable convolutional neural network (DS-CNN). In the same year, the team also introduced a novel network architecture comprising a backbone convolutional neural network (B-CNN) and a detection convolutional neural network (D-CNN), which similarly achieved high-speed ship detection [
63]. In 2020, Zhang et al. introduced the ultra-lightweight SAR ship detection model “ShipDeNet-20” [
64]. Despite its shallow depth of only 20 separable convolutions, this model maintains high detection accuracy through alternative design approaches, enhancing algorithm portability.
Additionally, Zhang et al. introduced a Balanced Scene Learning Mechanism (BSLM) [
65]. This generative adversarial network (GAN)-based approach successfully classified nearshore and offshore ships, demonstrating interpretative potential for SAR imagery driven by intelligent technologies. It provides partial reference for exploring feature-level fusion detection across different modalities. In 2025, Xue et al. introduced AIS-FCANet [
66], incorporating long-term AIS data to augment SAR ship detection. By enhancing cross-modal feature representation through context-aware mechanisms, this approach charts a direction for exploring multi-modal data fusion detection.
In summary, researchers worldwide have made significant progress in the domain of deep learning for SAR target detection. From traditional feature extraction, threshold detection, and image segmentation methods to today’s neural network-based detection techniques, researchers continue to refine algorithms for SAR target detection. However, considering the inherent characteristics of SAR imagery, the following challenges remain:
Parameter Count and Real-Time Performance: Today, with the advancement of deep learning, models are becoming increasingly complex and diverse, leading to growing demands for hardware resources. During practical deployment, smaller network architectures are more easily integrated into systems such as cross-modal detection fusion models. However, SAR images do not possess the rich color and detail information found in optical images, which are now the mainstream in general detection models. Nevertheless, they exhibit their own unique color and morphological characteristics. Therefore, optimizing model parameters and inference speed while preserving or enhancing the extraction of complex scattering features from SAR images is an urgent challenge.
Performance Optimization: Most existing lightweight networks achieve reduced parameter counts and faster inference rates by sacrificing some model performance. Given the small target sizes, blurred edges, and high background noise inherent in SAR images, designing compact auxiliary structures to compensate for performance losses is essential.
Model Adaptation for Data Characteristics: Many SAR image detection algorithms still require improvements in robustness and accuracy for small targets and complex backgrounds. SAR ship images, characterized by small targets and complex backgrounds, particularly challenge existing models. Many lack SAR-specific adaptation, failing to adequately interpret contextual relationships within features. Enhancing feature extraction and classification capabilities tailored to SAR imagery is crucial.
To address these challenges, our research will focus on four key areas:
To address computational redundancy in traditional convolutions within SAR detection models, factorized convolutional groups and depthwise separable convolutions are employed. While maintaining performance, this approach explores novel lightweight object detection backbone networks tailored to SAR image characteristics, reducing computational complexity and freeing valuable computational resources for subsequent modules.
To mitigate accuracy loss from lightweight design, a direction-weighted attention module is designed considering SAR image differences from other modalities, enhancing the model’s ability to locate small and blurred targets.
To address the characteristics of SAR images—small target sizes, high contrast, and relatively uniform color—we innovatively introduce a morphology-aware parallel fusion module at the model tail. Utilizing a multi-branch convolutional structure, this module expands the receptive field at minimal computational cost. By integrating information from preceding and subsequent modules, it more effectively extracts target features from SAR images.
Integrating the lightweight backbone network, parallel fusion module, and attention mechanism within the YOLOX framework, our model demonstrates through systematic experiments that it significantly reduces computational demands while improving detection performance. This not only provides an efficient solution for SAR target detection but also lays the foundation for developing intelligent target detection through multi-source information fusion.
2. Related Works
To achieve efficient deployment of SAR ship target detection models, research on model lightweighting and the complex characteristics of SAR ship targets has become a primary focus. Lightweighting methods are primarily categorized into two types: those based on network structure optimization and those based on model compression techniques. Research on the complex characteristics of SAR ship targets extends beyond the target size, shape, and intensity-related features examined in this paper. Some studies also focus on the orientation, distribution, wake patterns, and clutter characteristics of SAR ship targets.
Lightweight methods based on network structure optimization involve improvements at the network architecture level, primarily aimed at enhancing efficiency. In addition, another important line of research addresses the problem from the perspective of model compression, encompassing techniques such as network pruning, knowledge distillation, and quantization. In 2025, Guo et al. proposed DFES-Net [
67], which introduced depthwise separable convolutions while employing a dynamic hierarchical pruning algorithm to dynamically prune different parameters, thereby achieving a reduction in model parameter size. In 2021, Xu et al. proposed Lite-YOLOv5 [
68], a more compact model based on YOLOv5. They designed a lightweight cross-stage part (L-CSP) module that reduces parameter count through network pruning techniques while integrating multiple modules to compensate for performance losses caused by pruning. In 2024, Yu et al. introduced SARGap [
69], a universal auto-pruning algorithm for the entire inference chain. By constructing dependency graphs to automatically analyze network structures, combined with Auto-Pruning Rate Search (APRS) and Multi-Objective Optimization Loss (MOOL), they achieved effective parameter compression.
These methods significantly improve model inference efficiency but heavily rely on pre-trained models, with relatively complex training workflows.
Regarding other complex features in SAR imagery such as sea clutter and wake, Xu et al. (2024) introduced the self-supervised denoising method Wake2Wake [
70]. This approach incorporates a novel Ship Wake Awareness (SWA) module specifically focused on the unique characteristics of turbulent and Kelvin wakes, effectively enhancing synthetic aperture radar (SAR) detection of ship wakes. In the same year, Xu et al. innovatively transformed the non-steady-state problem into a steady-state one, proposing the Ship Turbulent Wake Synthetic Aperture Radar (STW-SARSim) simulator [
71]. This laid the foundation for data generation and algorithm validation in complex scenarios.
While these studies do not focus directly on hull targets, they nevertheless offer valuable insights into maritime clutter and related phenomena, thereby supporting the development of SAR ship detection algorithms for complex environments.
3. Materials and Methods
In this paper, we propose SADW-Det, a lightweight Shape-Aware and Direction-Weighted algorithm for SAR ship Detection. Based on the anchor-free detection network YOLOX, the overall architecture of SADW-Det comprises three components: the Lightweight Streamlined Factorized-Parallel Network (LSFP-NET), the Shape-Aware Parallel Fusion Module (SAPF), and the Direction-Weighted Attention Module (DWA). This paper also elaborates on the proposed model from these three aspects.
3.1. Backbone Network Design
The YOLOX [
40] network is an object detection architecture derived from YOLOv5 [
39]. It demonstrates a robust balance between computational speed and detection accuracy, providing a reliable foundational framework for this research. The CSPDarknet backbone network design adopted by YOLOX also provides excellent structural compatibility for the three-stage backbone network proposed in this study, avoiding additional adaptation costs caused by drastic changes in the underlying framework.
Compared to previous detector series, YOLOX demonstrates greater stability and adaptability in ship detection on synthetic aperture radar (SAR) imagery, though room for improvement remains. Relative to emerging YOLO variants, YOLOX offers more robust model performance and mature training strategies. Its fixed architecture aligns with our core module framework, reducing adaptation uncertainties and avoiding additional variables that could compromise experimental control. This facilitates experimentation and performance demonstration within SAR environments. Therefore, to ensure structural compatibility, enhance result evaluation accuracy, and maintain experimental reliability, we selected the YOLOX network as the baseline architecture.
However, since YOLOX was originally designed for optical image detection tasks, its complex architecture exhibits poor compatibility when directly applied to SAR image detection. We redesigned the original network, implementing lightweight improvements to reduce the number of parameters while maintaining detection accuracy. This enhances processing speed to meet SAR image detection requirements, achieving simultaneous gains in precision and efficiency.
Specifically, we propose a novel lightweight backbone network, LSFP-NET, which balances detection speed and accuracy to better accommodate the unique demands of SAR images, such as diverse target scales, complex backgrounds, and significant clutter interference. This approach draws inspiration from FalconNet [
72].
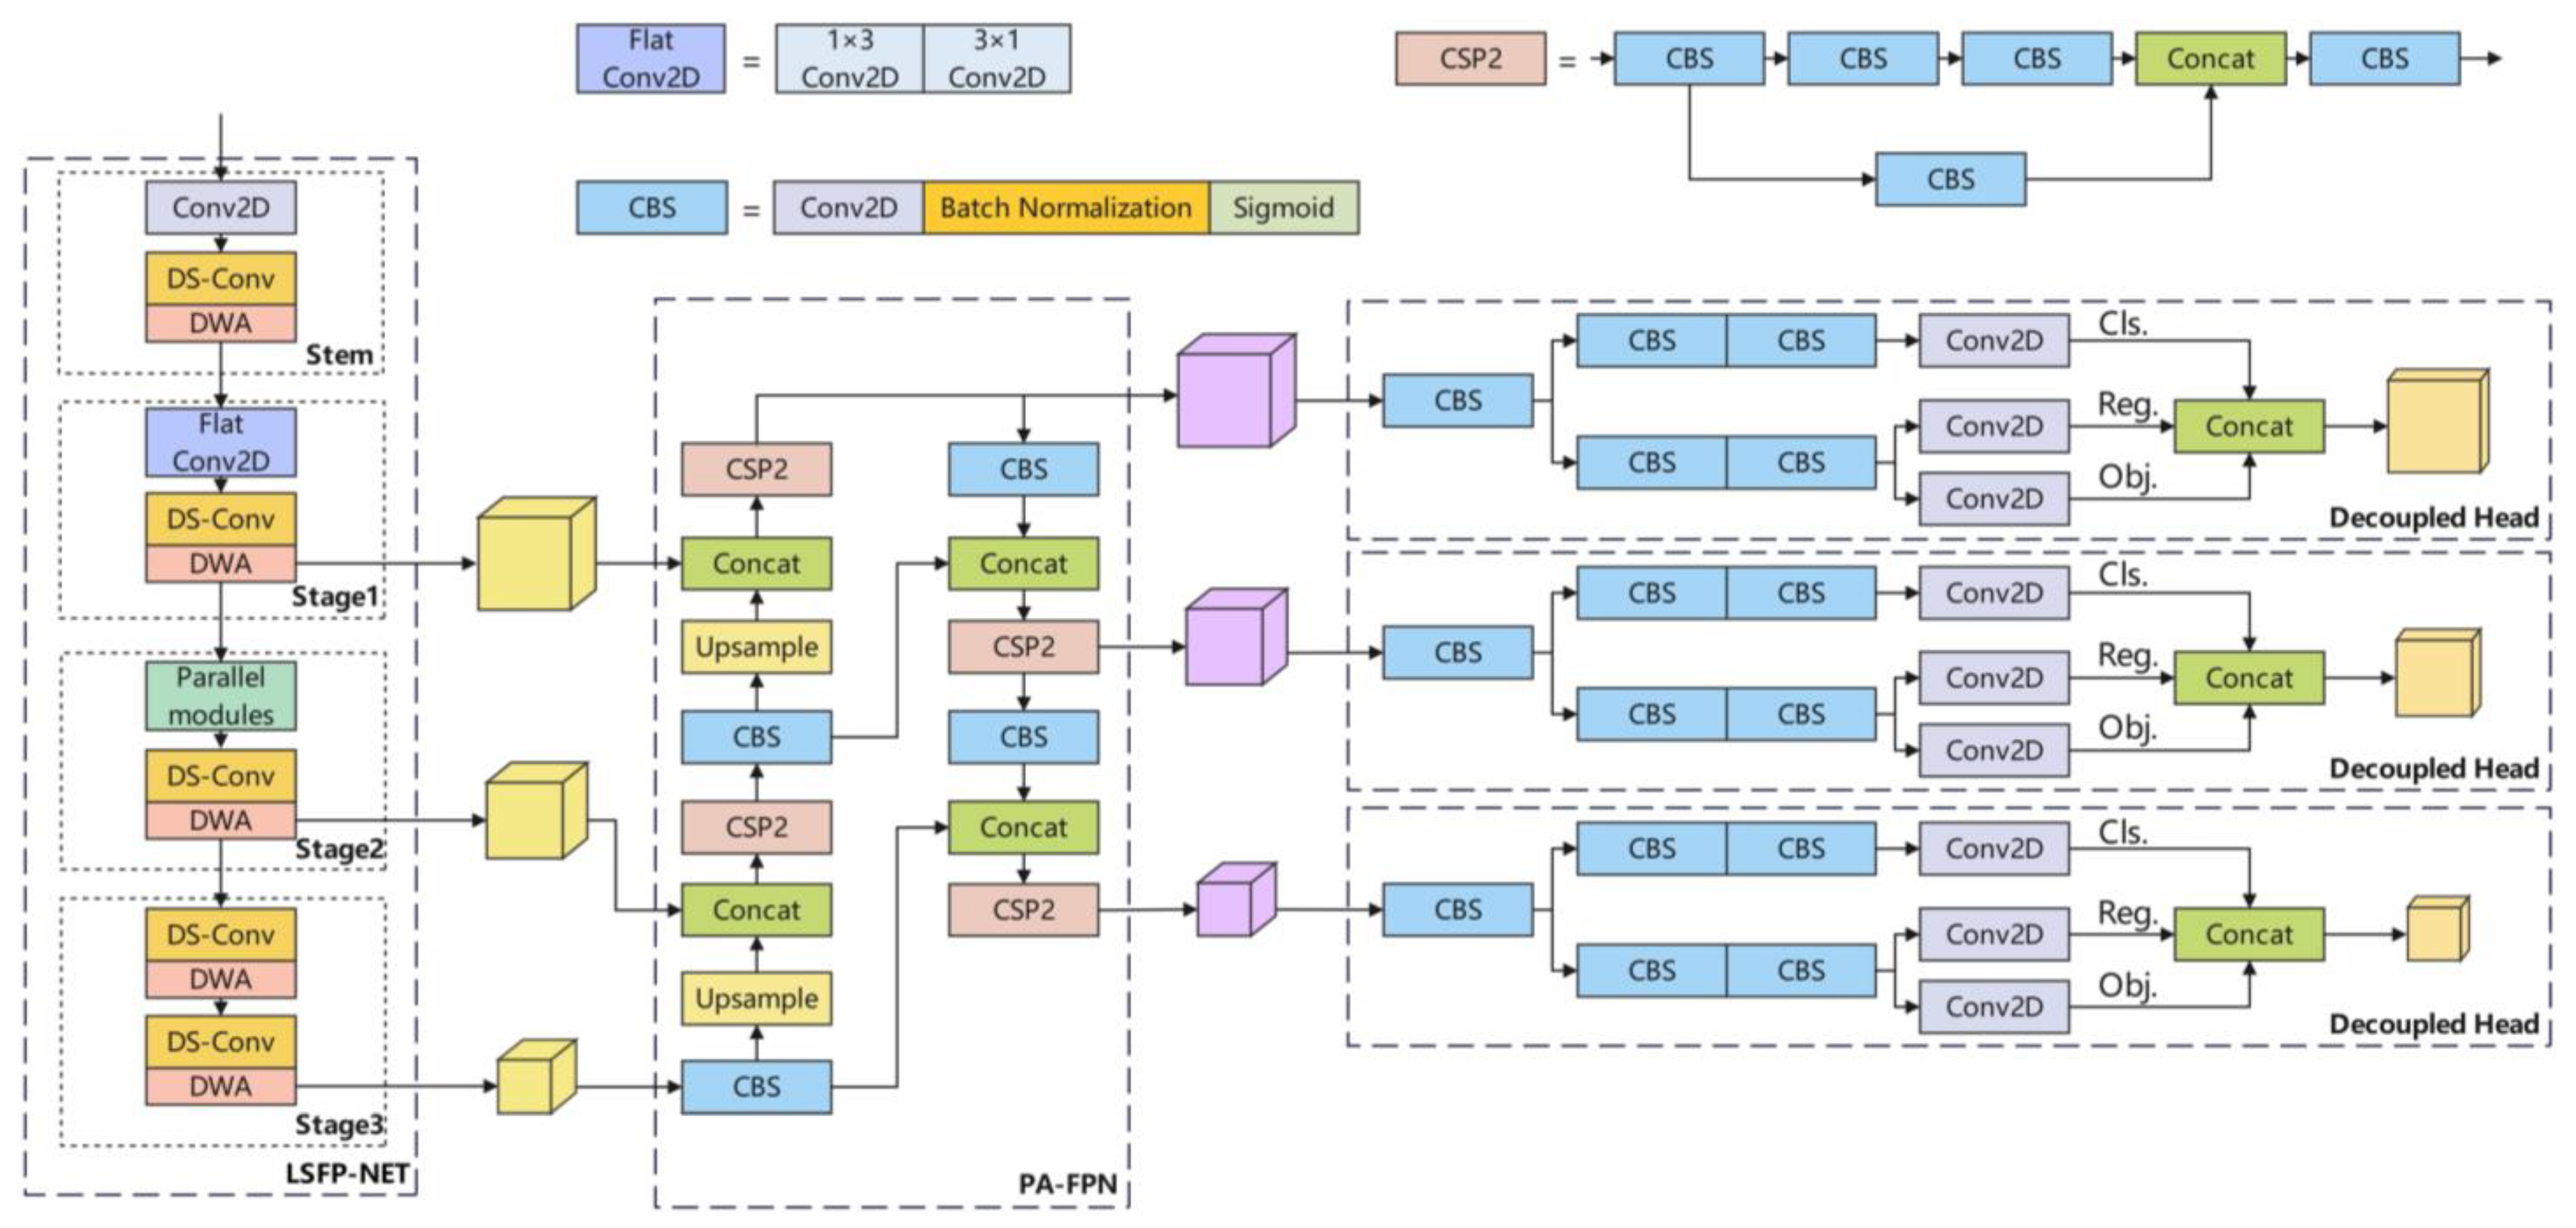
Figure 1 illustrates the overall framework structure of SADW-Det, where LSFP-NET serves as the backbone network embedded within the baseline model YOLOX.
SADW-Det adopts YOLOX as its baseline detection framework, as shown in
Figure 1, comprising three components: the lightweight backbone network LSFP-NET, the Path Aggregation Feature Pyramid Network PA-FPN, and three detection heads.
First, the lightweight backbone network LSFP-NET constitutes the core of our improvements. The Flat Conv2D module in
Figure 1 serves as a core module in Stage 1 of LSFP-NET, combining two symmetric factorized convolutions with kernel sizes 1 × 3 and 3 × 1. This design captures information in a more balanced manner.
Subsequently, PA-FPN efficiently fuses shallow and deep semantic information through top-down and bottom-up path aggregation, optimizing feature representation. This module is built primarily upon the Convolution–Batch Normalization–Activation (CBS) basic unit and the CSP2 structure, along with upsample and concat layers. The CBS unit and CSP2 structure are also illustrated in
Figure 1. The CBS unit comprises standard convolution, a Batch Normalization layer, and an activation function for efficient feature extraction. The CSP2 structure achieves further computational reduction while preserving expressive power through stacked CBS units and cross-stage connections.
Finally, three decoupled heads separate classification and regression tasks into independent branches, minimizing cross-task interference.
In terms of a detailed overview of our proposed architecture, the overall framework of LSFP-NET adopts a straight-through network architecture. Its core foundational stacked modules are the depthwise separable convolution from MobileNetV1 [
73] and the
factorized convolution, an improvement over traditional convolutions. Depthwise separable convolutions feature significantly reduced parameters—approximately one-third of traditional convolutions—though they may slightly compromise network accuracy.
factorized convolutions strike a better balance between performance and resource consumption. By combining the strengths of both, LSFP-NET achieves deeper network layers at lower computational cost, substantially reducing computational complexity while maintaining model performance.
Assuming a standard convolution uses a kernel size of
with
kernels, the number of parameters is
. A depthwise separable convolution of the same size comprises both depthwise and pointwise convolutions. The depthwise convolution uses a kernel size of
with
kernels, corresponding to parameters of
. The pointwise convolution employs a kernel size of
with
kernels, resulting in parameters of
. Thus, the total number of parameters for the depthwise separable convolution is
. Based on this, the parameter ratio between the two approaches is as follows:
In applications, factorized convolution typically employs a two-layer combination of
and
. Taking a single-layer
as an example for parameter calculation, its convolution kernel size is
, with
kernels. The total number of parameters is
. Compared to standard convolution (parameters:
), the parameter ratio is as follows:
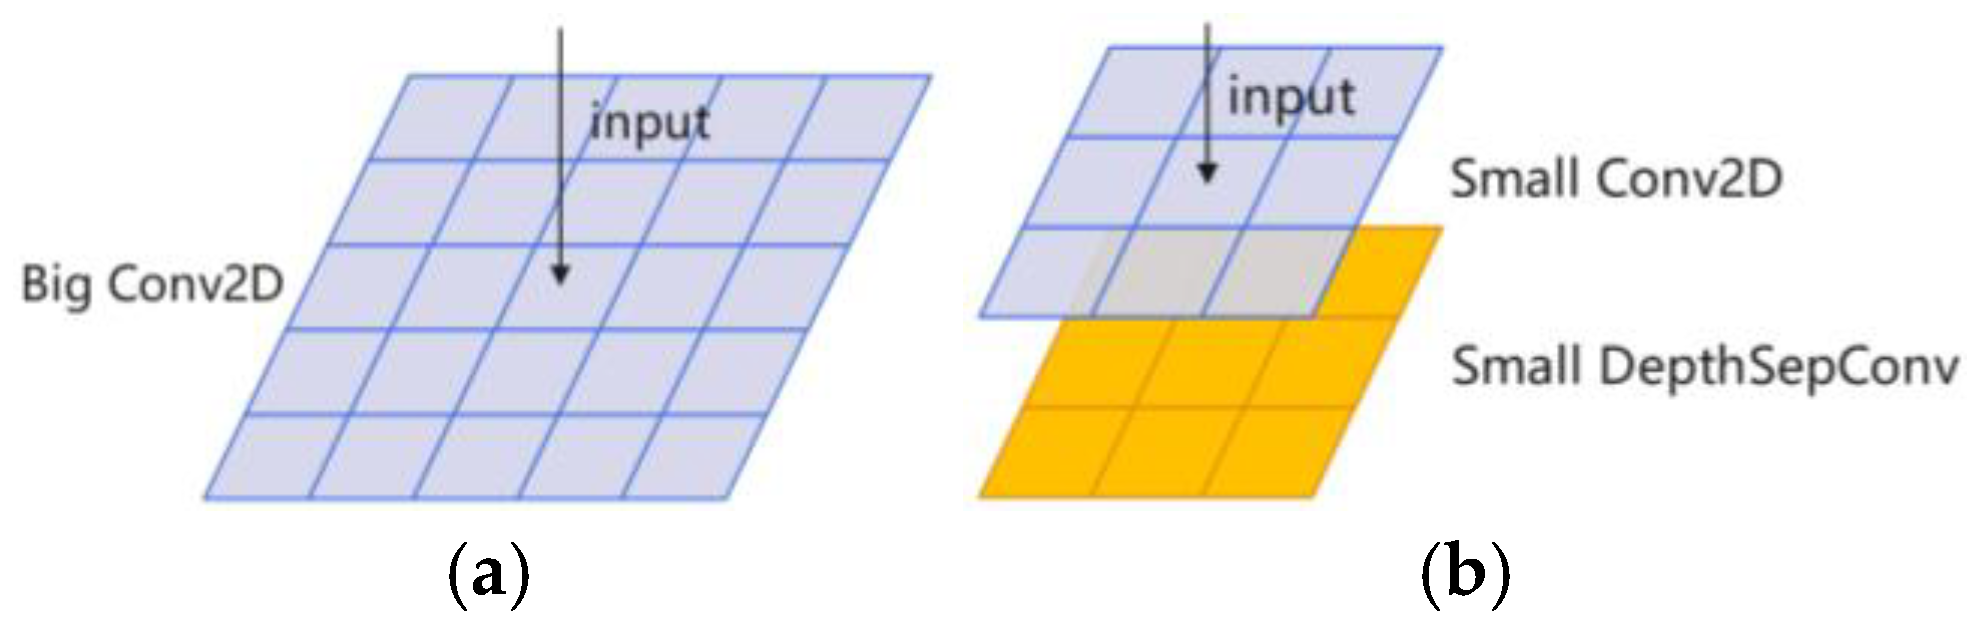
Building upon the plain network structure, to meet the feature extraction requirements of a feature pyramid network, we divide the network into four parts: one stem and three subsequent stages. In the stem design of the backbone network, we abandon the single large-kernel convolution approach commonly used in traditional models, instead splitting it into two small-kernel convolutions. As shown in
Figure 2,
Figure 2a depicts a conventional stem structure, while
Figure 2b illustrates the stem structure in our model composed of two small convolutions.
Each small kernel convolution consists of a standard convolution activated by the h-swish function, followed by a small-kernel depthwise separable convolution. While a stem with large convolution kernels captures broader data information, small convolution kernels offer greater advantages in extracting fine-grained features, better balancing model size and performance.
In the remaining parts of the backbone network, all three stages employ depthwise separable convolutions, each with distinct design characteristics. For the convolutional layer in stage 1, we abandoned the traditional regular convolution module in favor of stacking a series of factorized convolution modules. This design achieves a favorable trade-off between model size and performance. The depthwise separable convolution modules rapidly and distinctly highlight information from the core regions of SAR images, thereby better adapting to the characteristics of SAR images.
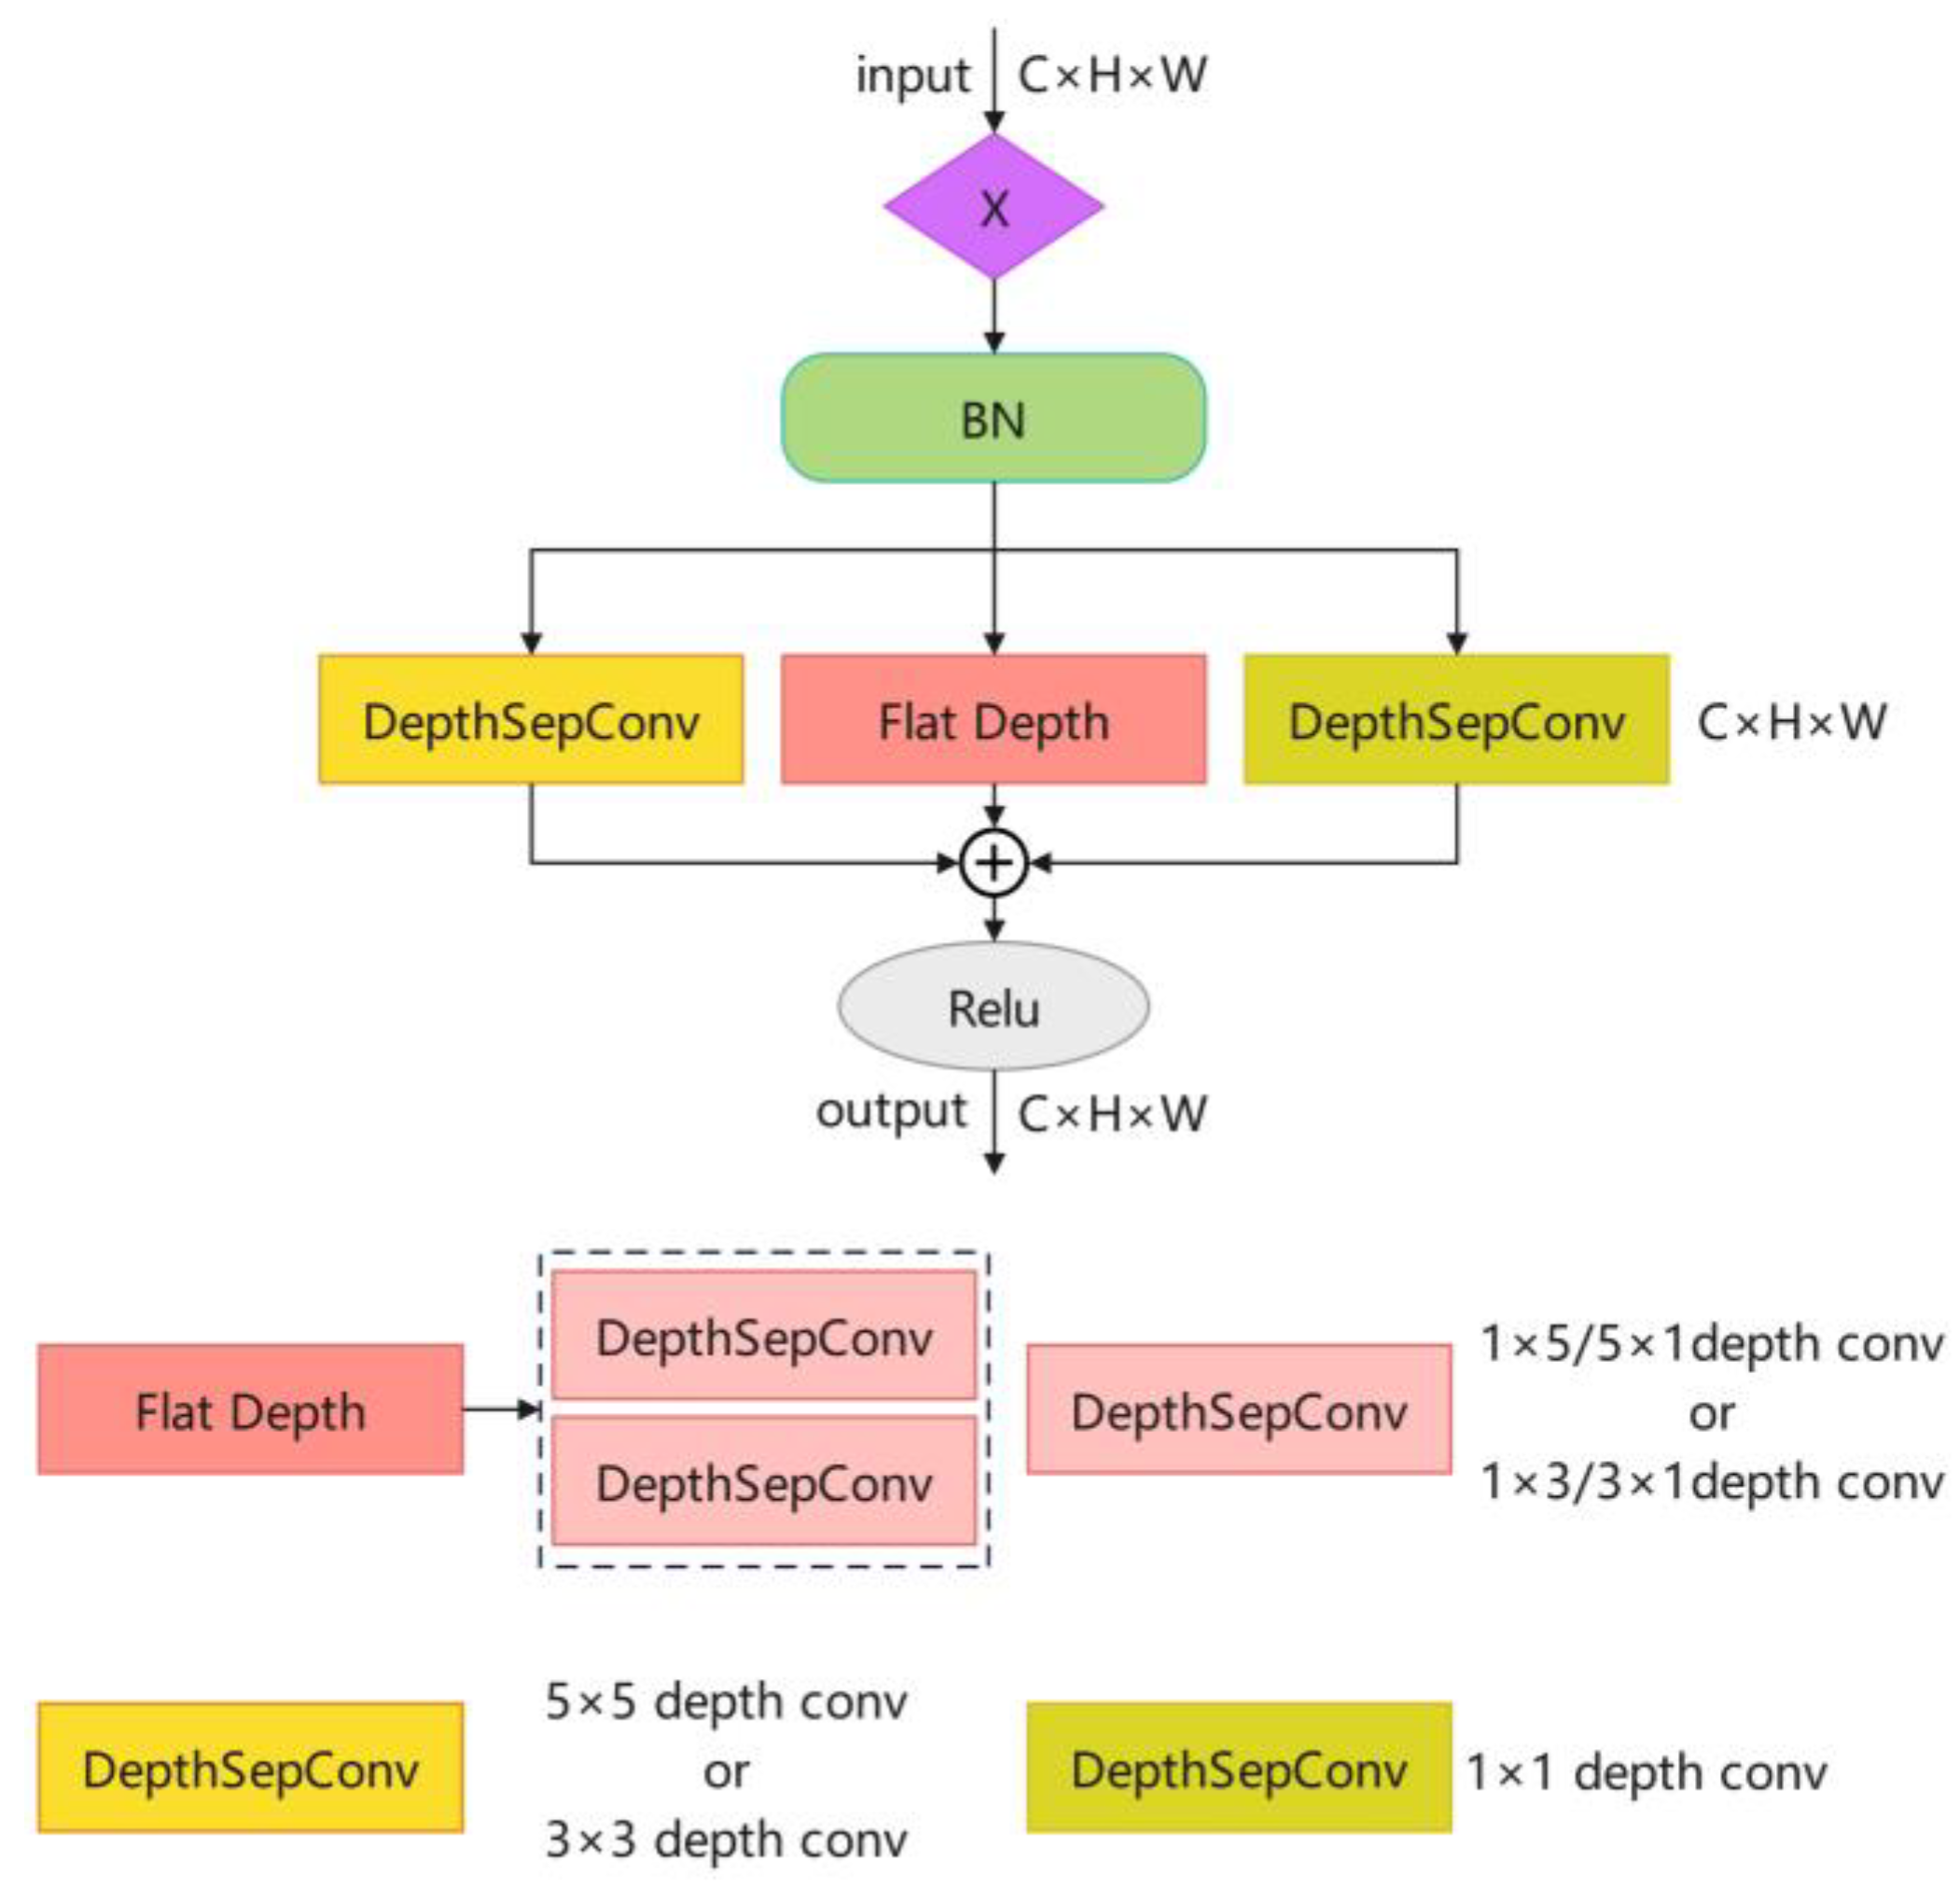
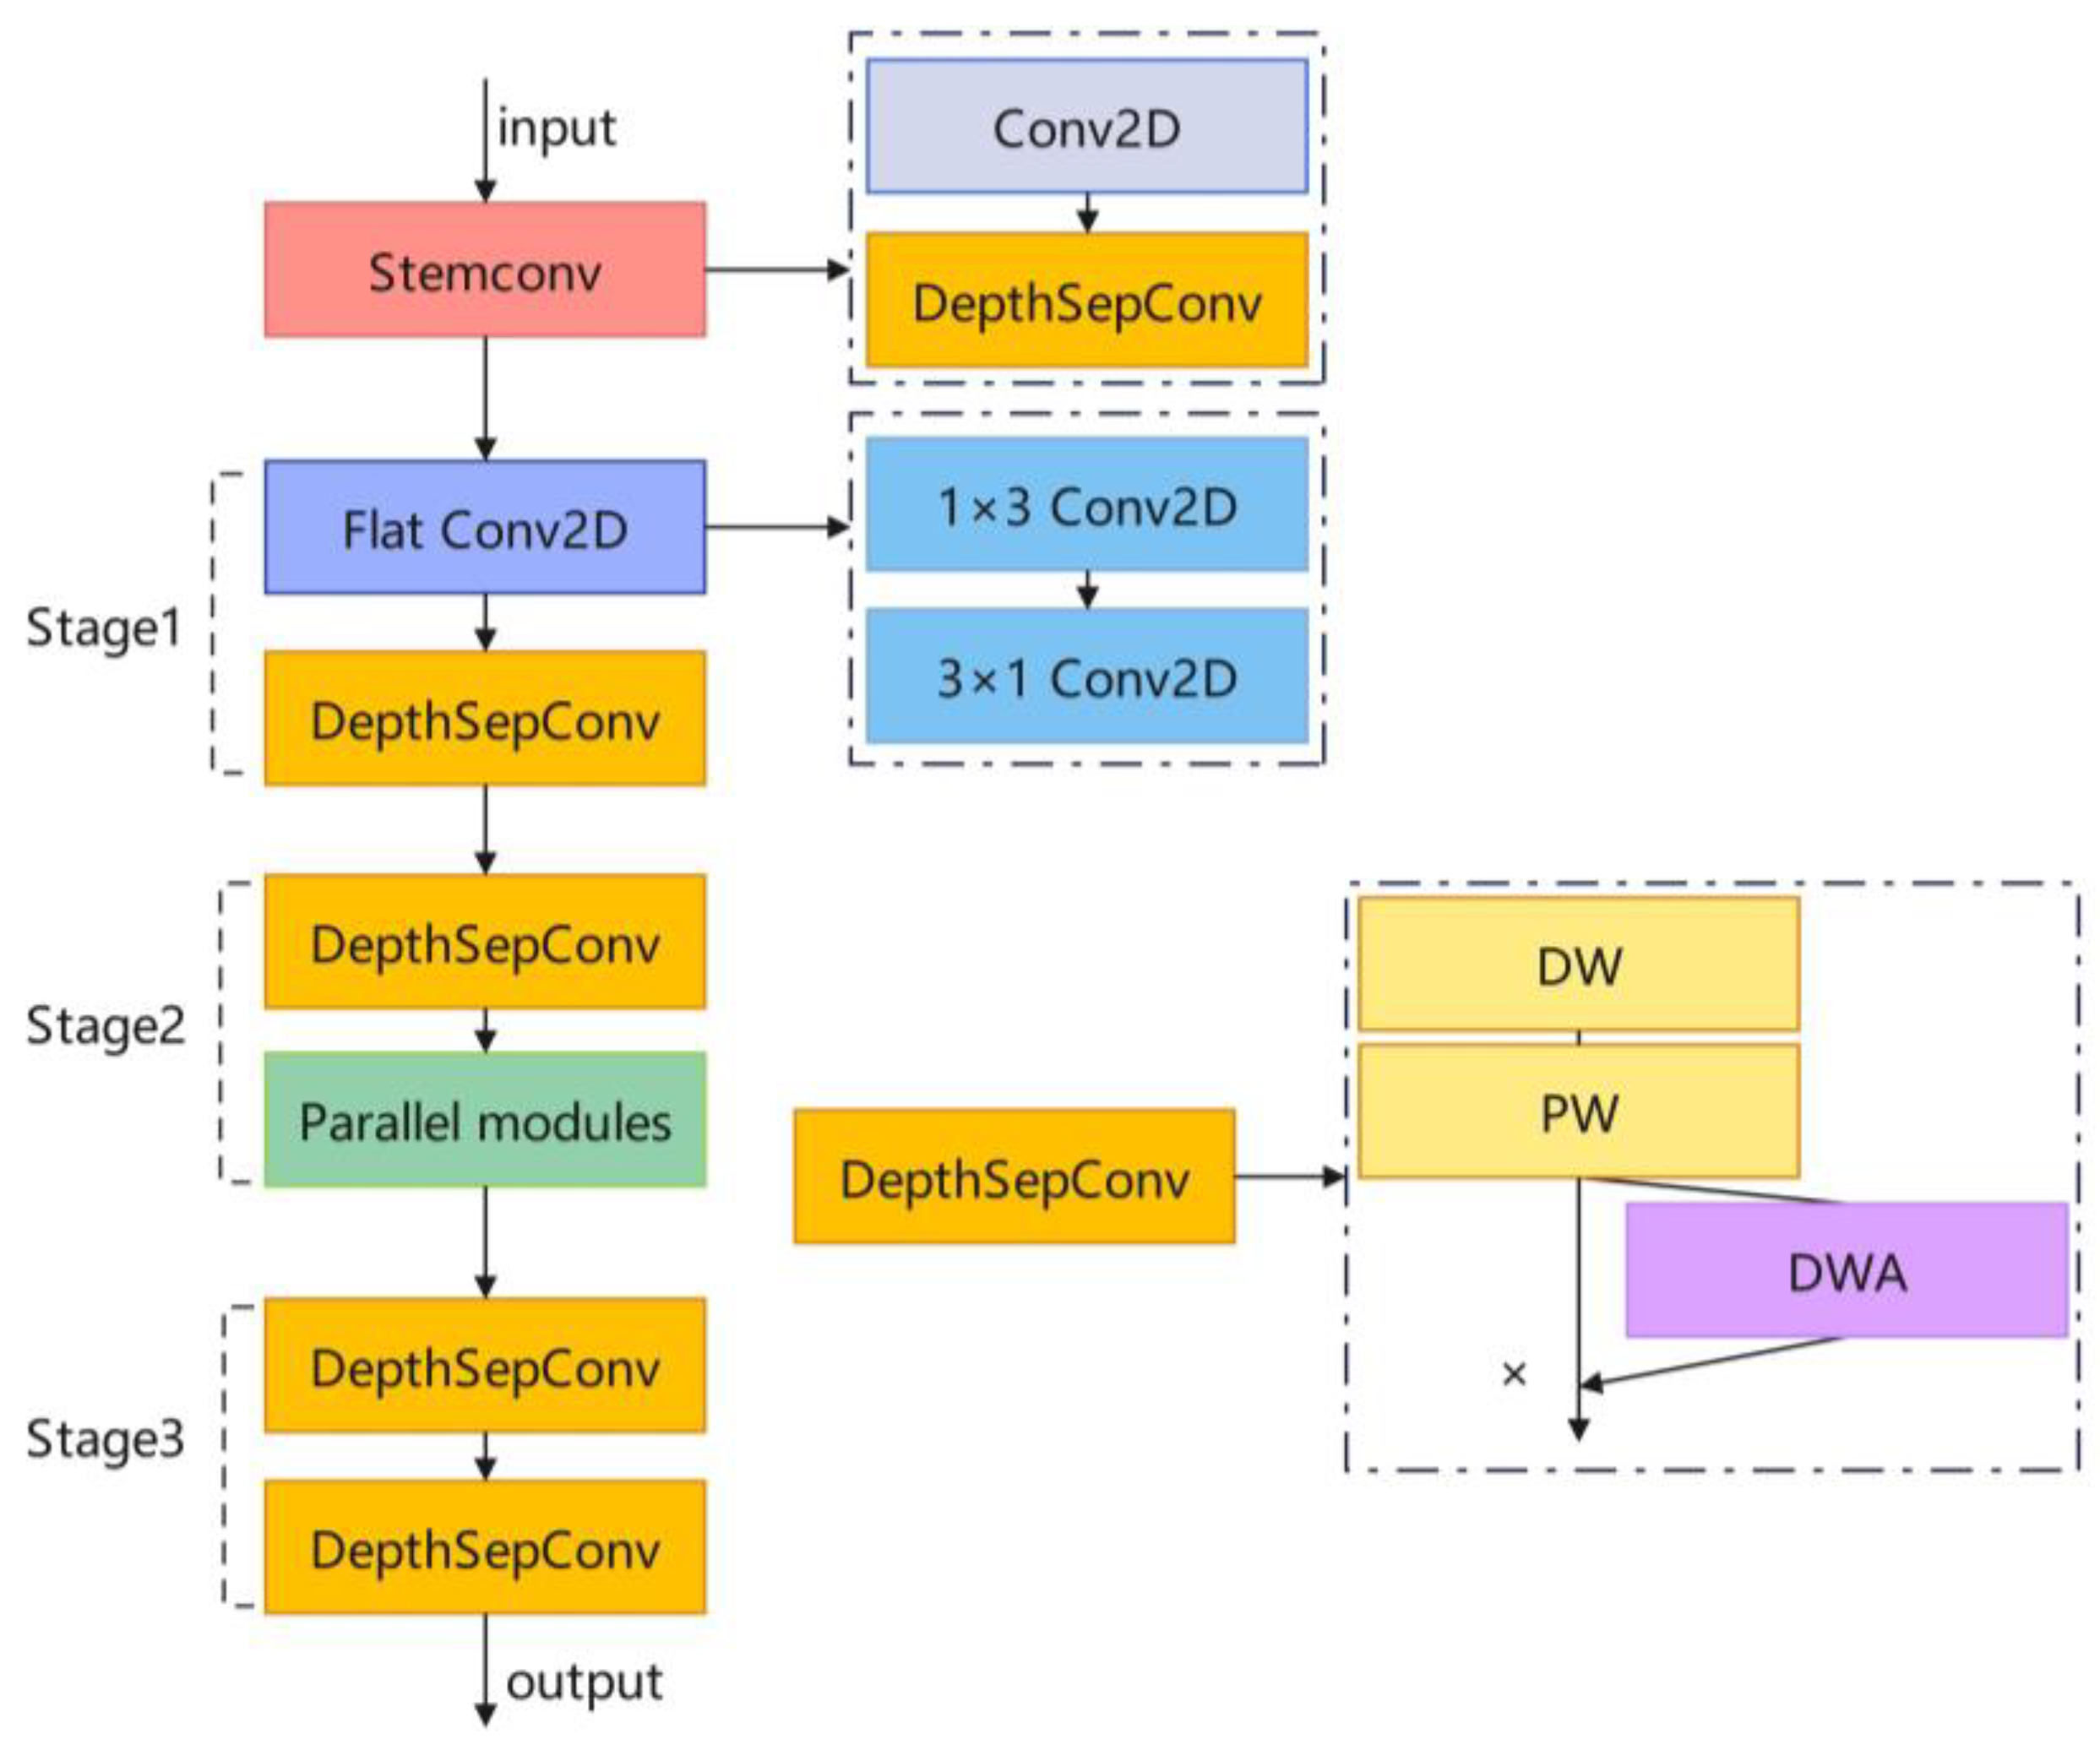
In the second-stage network, we introduced a Parallel Fusion Module (SAPF) based on depthwise separable convolutions to enhance feature extraction capabilities while minimizing the number of parameters. The third stage, serving as the network’s terminal layer closest to classification output, prioritizes lightweight design. Rather than expanding the receptive field or performing complex feature extraction, we adopt the most minimal structure to integrate the high-level features refined in preceding stages. Consequently, this stage concludes with only two depthwise separable convolutions. This design substantially reduces model complexity while preserving core feature extraction capabilities. To compensate for potential accuracy loss due to lightweighting, we incorporate Directional Weighted Attention (DWA) modules in selected separable convolution layers. This enables the model to focus on more critical features, further enhancing accuracy and robustness. The detailed architecture of LSFP-Net is illustrated in
Figure 3.
Compared to the original CSPDarknet network used with YOLOX-s, the LSFP-NET backbone network is more compact and has fewer parameters. Our model adopts a phased structure comprising a stem phase and three stages, each consisting of modules built from multiple basic layers. In this paper, a “layer” refers to a single basic operation, such as a single convolution or a single separable convolution operation, while a “module” consists of multiple consecutive layers, such as the SAPF module.
To clearly illustrate the model’s structure and design, we list the specific configurations of each network layer, including detailed parameters such as kernel size, stride, padding, input/output channels, and mark sections involving attention embedding. Specific parameter settings are shown in
Table 1.
As
Table 1 indicates, the model adopts a phased structure, with each phase composed of distinct layers and modules. The model extensively employs separable convolutions, attention mechanisms DWA, and partial factorized convolutions—selections driven by SAR image characteristics. Given SAR images’ distinct characteristics from other modalities—especially complex optical images—excessive computational redundancy is avoided early in the network architecture. Our chosen structure of stacked small-kernel convolutions focuses on more discriminative features in SAR images, such as ship contours and specific radar scattering/reflection patterns. This effectively avoids wasting computational resources on background noise, achieving a balance between computational cost and expressive capability.
Simultaneously, ship targets in SAR images exhibit characteristics such as varying scales and strong background clutter interference. As feature layers deepen, a single small-kernel convolution stack becomes insufficient for complex feature extraction. Therefore, we introduce the SAPF module in Stage 2. With both input and output channel dimensions set to 256, it applies multiple structurally distinct large-kernel depthwise-separable convolutions in parallel for complex fusion, while avoiding channel expansion and significant parameter growth. This design enables efficient, deep information integration, effectively addressing the challenges of diverse target morphologies and high background noise in SAR images while avoiding channel expansion and significant parameter growth.
The model concludes with only two small-kernel depthwise separable convolution layers at the tail end. This streamlined structure demonstrates the model’s efficiency in processing high-level SAR features, prevents overfitting, and reduces the model size and computational overhead for future deployment.
3.2. Shape-Aware Parallel Fusion Module
To maximize network performance without compromising the goal of lightweight architecture, we introduced a parallel fusion module in the relatively deep layers of the network.
Generally, the size and number of convolutional kernels influence both prediction outcomes and overall network performance. Larger kernels capture more comprehensive target information, while more convolutional layers enable deeper feature extraction. However, this increases model parameters and slows inference speed, often yielding only marginal accuracy gains.
To better balance performance and parameter count when using deeper convolutional layers, we designed a parallel fusion module called SAPF based on depthwise separable convolution. Experimental results demonstrate that this parallel fusion module effectively optimizes and balances performance with parameter count, achieving results comparable to those obtained by stacking larger convolutional kernels. The structural details of the SAPF module are shown in
Figure 4. The SAPF module does not alter the number of channels or the dimensions of the input and output feature maps.
This parallel fusion module primarily consists of parallel arrangements of
,
, and
depthwise separable convolution layers. These convolution layers are essentially size-compatible two-dimensional convolution kernels sharing identical inputs and strides. Consequently, despite differing kernel dimensions, the additivity property holds for two-dimensional convolutions, mathematically expressed as follows:
where
is a matrix,
and
are two 2D convolutional kernels of compatible sizes, and ⊕ denotes the summation operation at corresponding positions. Leveraging this property, these kernels can be stacked in parallel at corresponding positions. This delivers accuracy comparable to that of using several large kernels, but with fewer parameters.
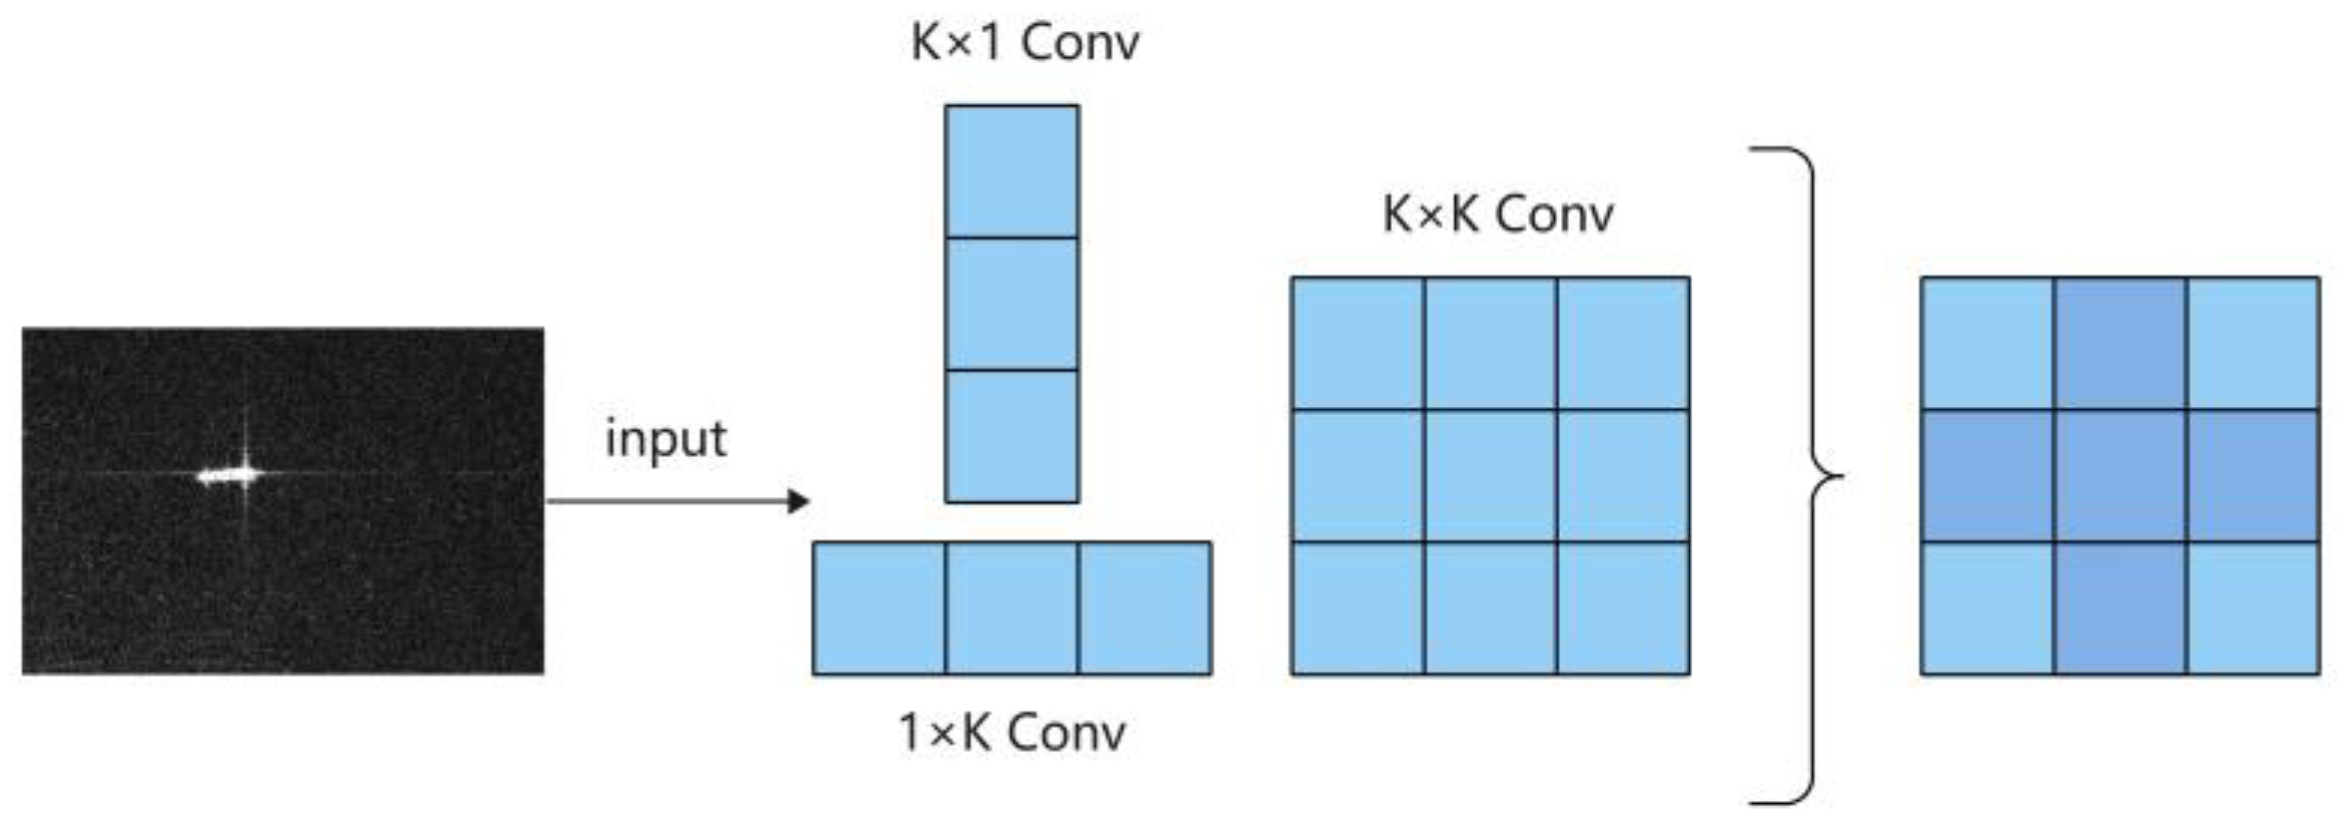
Additionally, this parallel fusion module incorporates SAR image characteristics during feature extraction. Its primary operating principle is illustrated in
Figure 5.
Compared to depthwise separable convolutions that merely increase the number of vertical layers, this parallel fusion module significantly reduces the number of parameters while enhancing network performance. The convolution module emphasizes information extraction from the core target region. In SAR images, ship targets typically exhibit high contrast, small size, square or point-like shapes, and scattering characteristics. These targets contrast sharply with the background, making them more conspicuous than optical targets. In shallow network layers near the stem, a stacked design using traditional convolution modules better adapts to SAR image characteristics and highlights key information while maximizing target information acquisition.
Subsequent experimental results indicate optimal network performance occurs around K = 5, where model complexity is low and detection accuracy is highest.
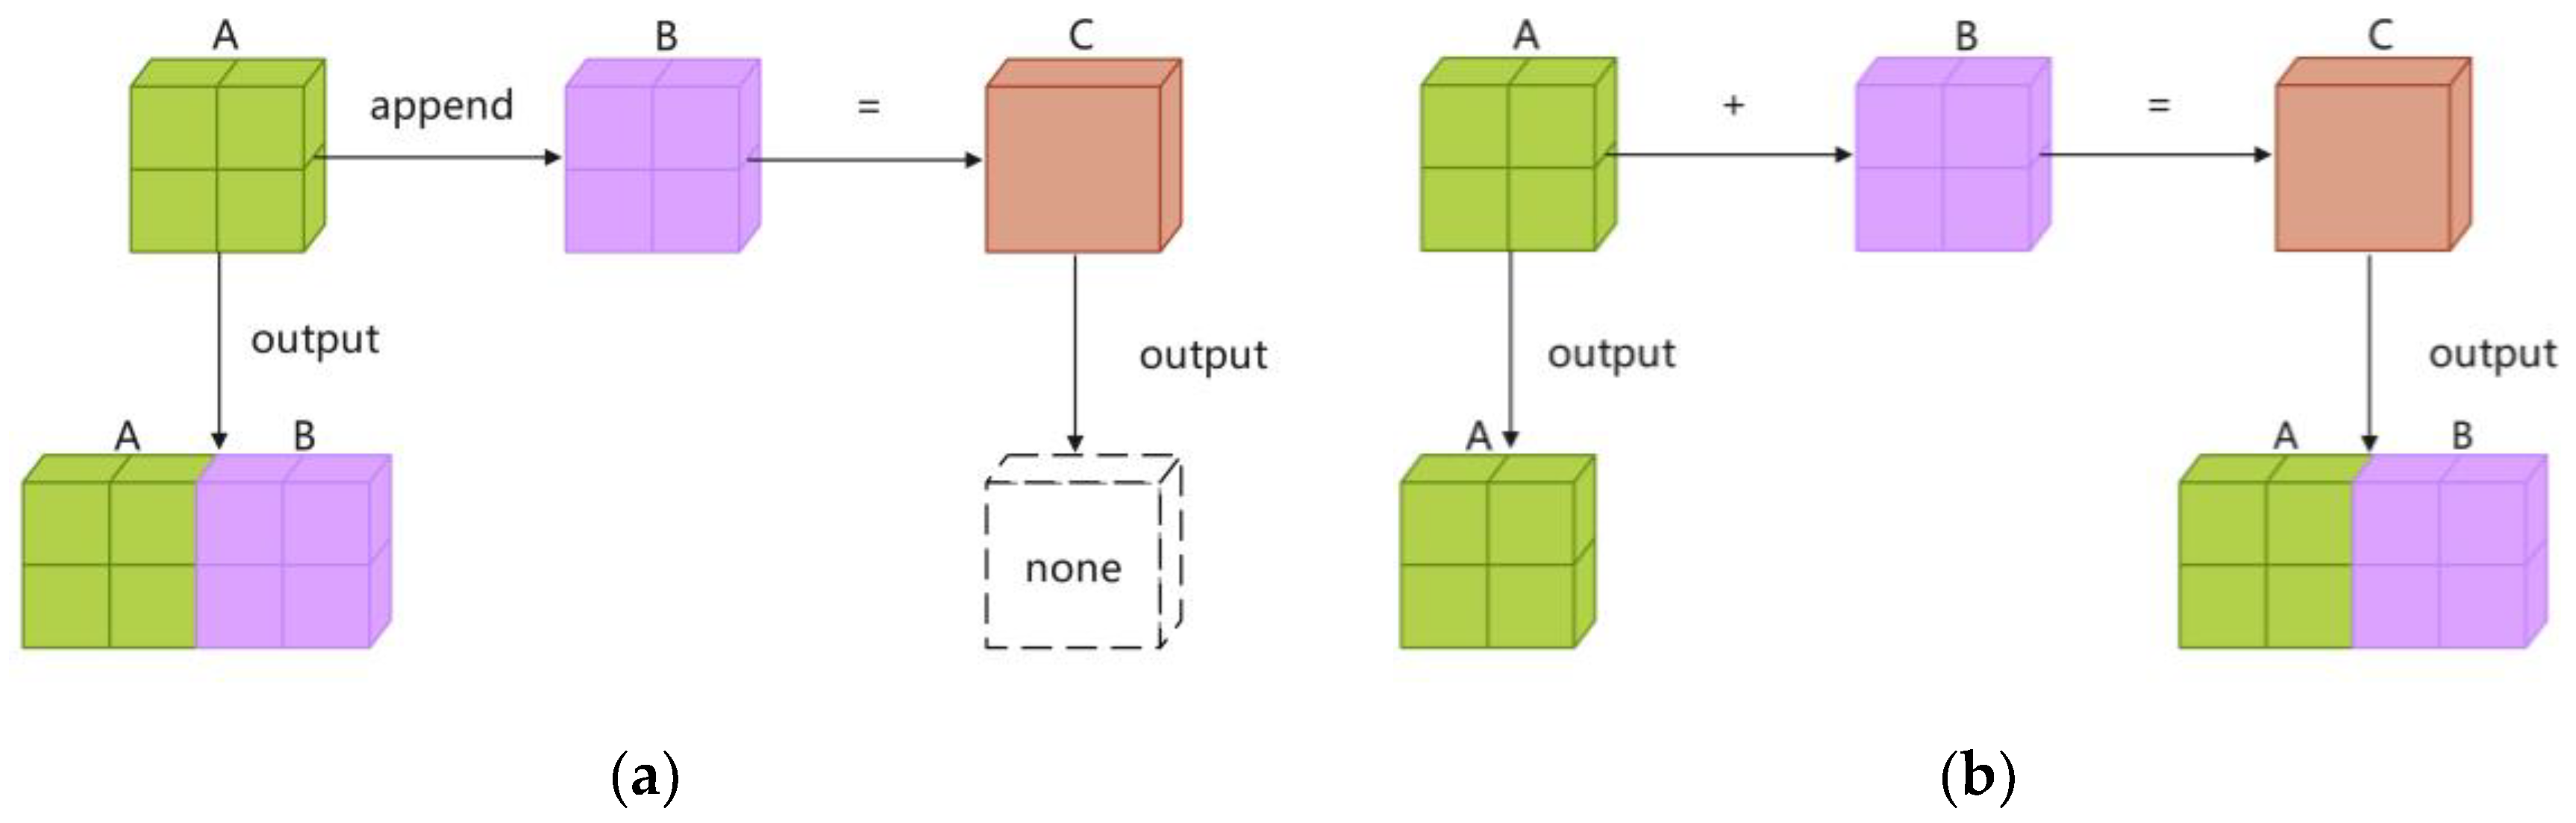
In the SFAP module, to achieve more efficient fusion of different branches, we experimented with and compared two common feature fusion methods to select the one best suited for our model: the append method and the addition method. Specifically, the append method operates directly on the original feature maps, concatenating different features together. This approach alters the channel dimension, potentially requiring specialized design to address this issue later. The addition method, on the other hand, generates a new, fused feature while preserving the original features unchanged. It offers greater flexibility, though slightly increases memory usage.
As shown in
Figure 6, assuming the features to be combined are A and B, the append method directly modifies feature A. However, when using the addition method, it outputs a new feature C. This slightly increases the required memory, but features A and B remain unchanged, facilitating subsequent operations. In convolutional neural network models, directly modifying or concatenating original features can easily lead to channel mis-matches in subsequent layers, particularly when fusing multiple branches sequentially. To resolve this, we added an Expansion Conv layer at the beginning and an Aggregation Conv layer at the end of the parallel fusion module as buffer layers.
Assuming the input to the stacking method is
and the output is
, with
and
representing the length and width of the convolutional kernel, respectively, the output of the stacking method can be expressed as follows:
where
is the activation function
, defined as follows:
For the append method, the process is relatively more complex:
Based on subsequent experimental results, within our designed parallel fusion module, employing the addition method eliminates the need for additional channel-adjusting convolutional layers. This approach achieves high performance while simultaneously conserving parameter counts.
3.3. Direction-Weighted Attention Module
To better address challenges in SAR imagery—such as varying scales of sea surface targets, small object sizes, sparse distribution, and significant background interference—we abandoned traditional attention (typically designed for optical-dominant modalities) mechanisms in favor of a directional weighted attention (DWA) strategy. DWA’s core principle is to achieve joint feature extraction of channel weights and directional spatial information while maintaining a lightweight architecture.
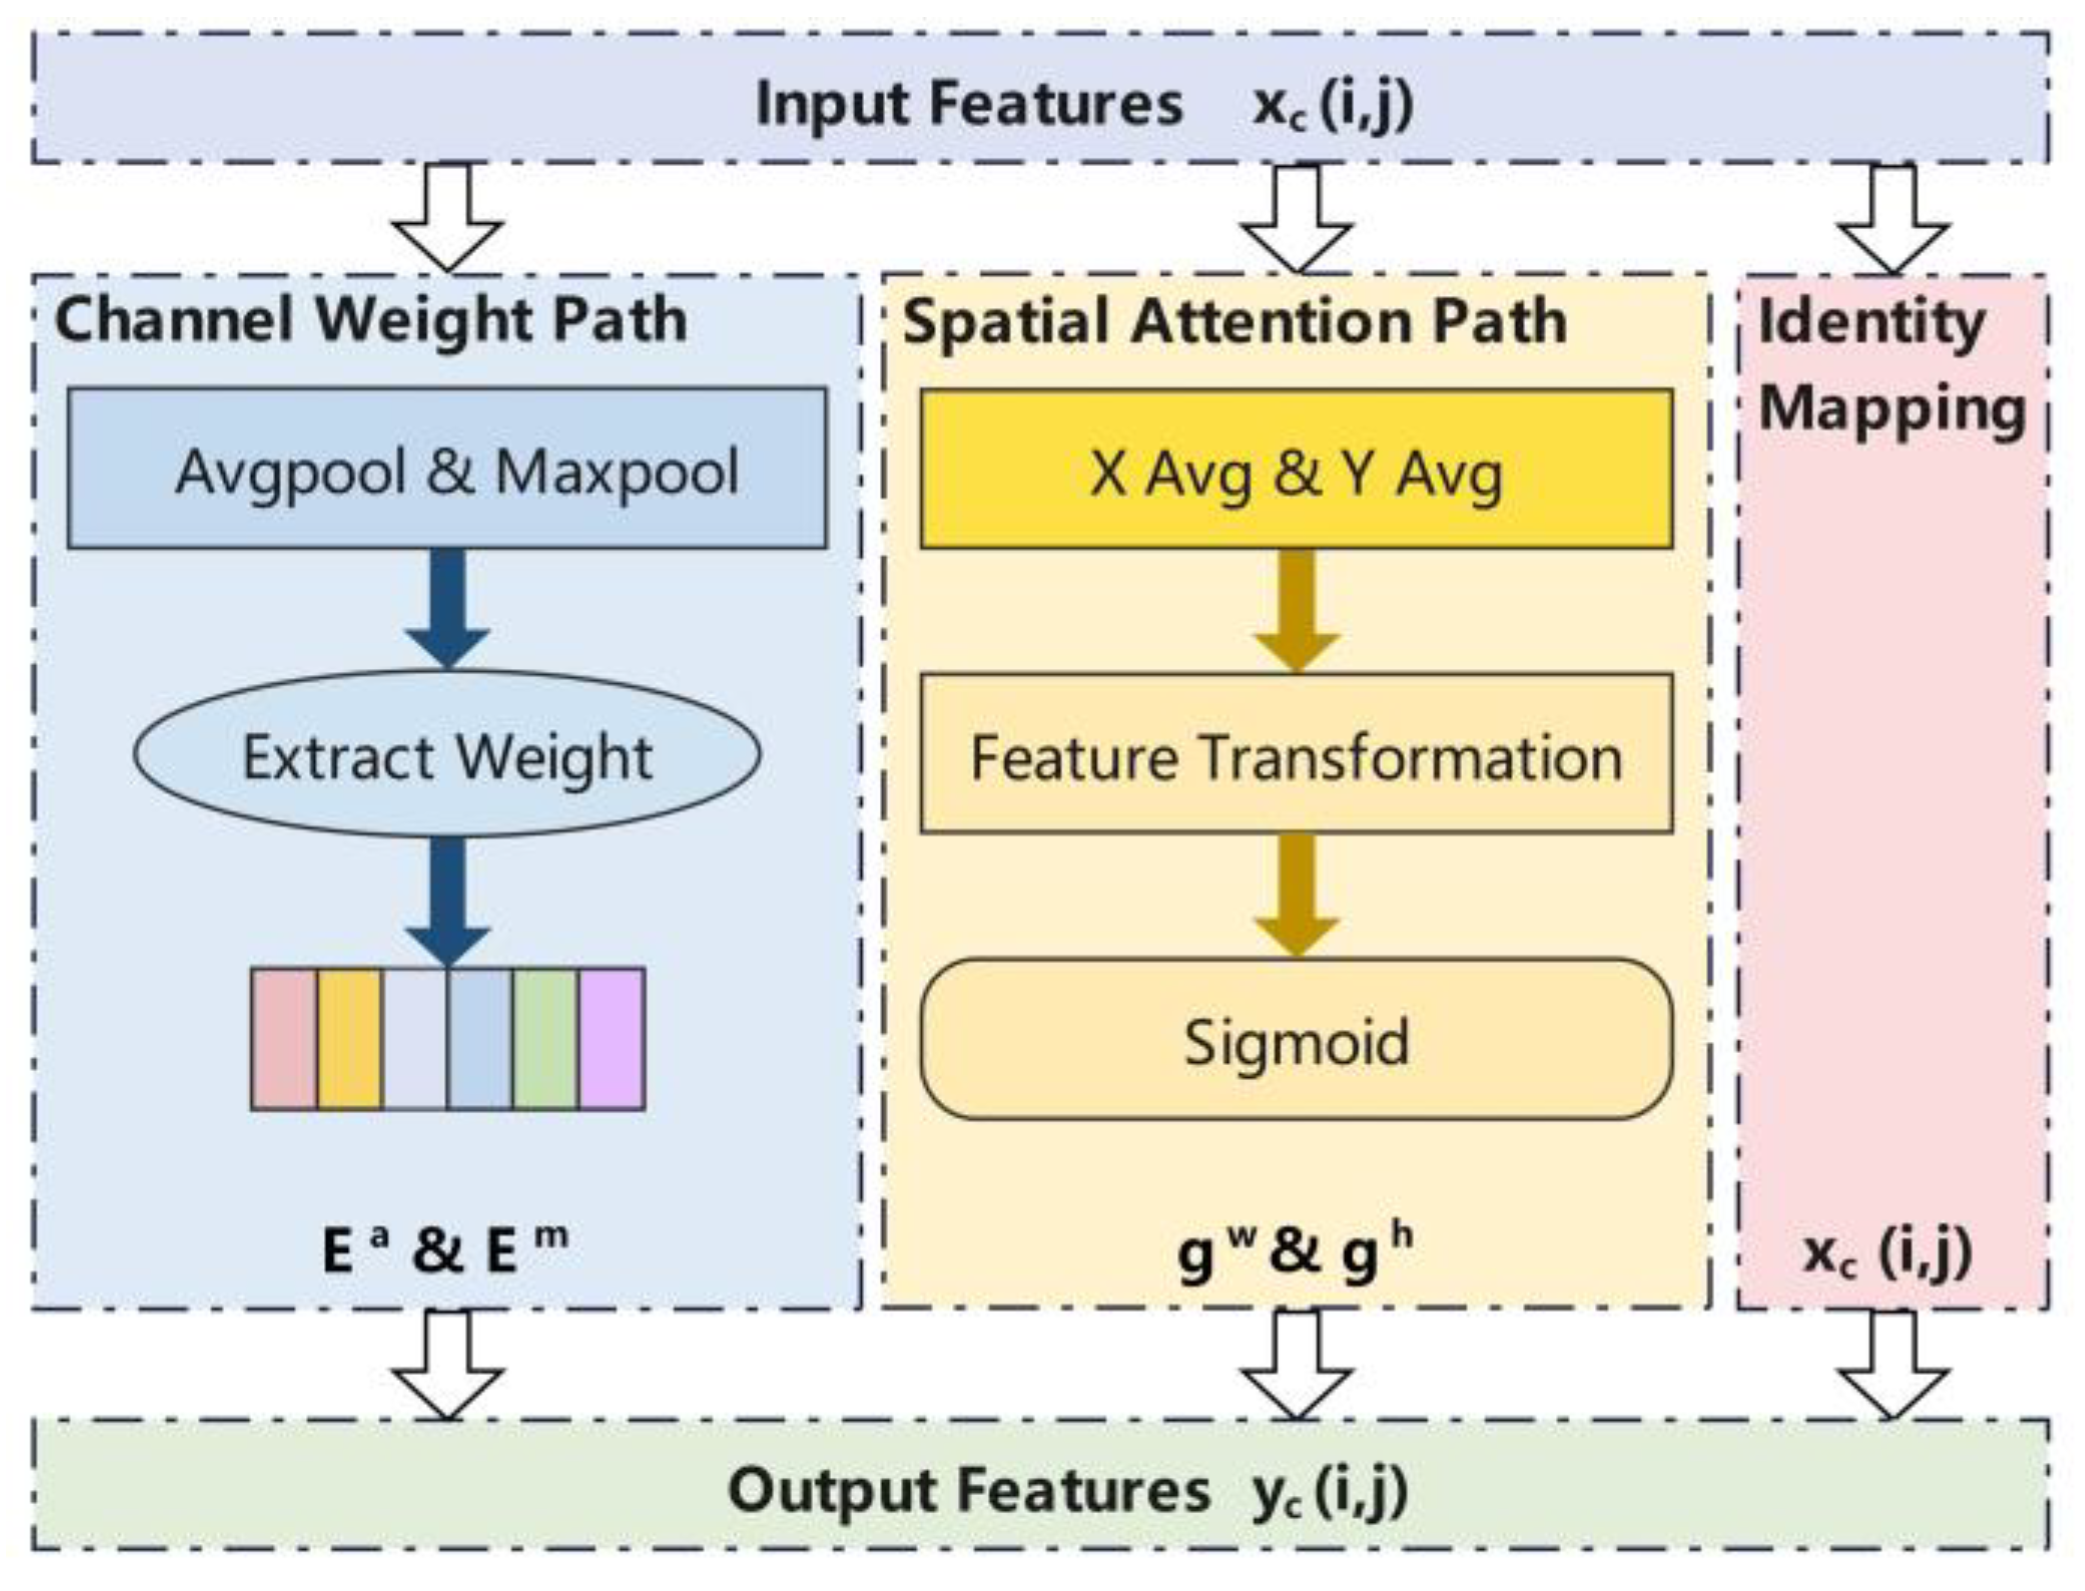
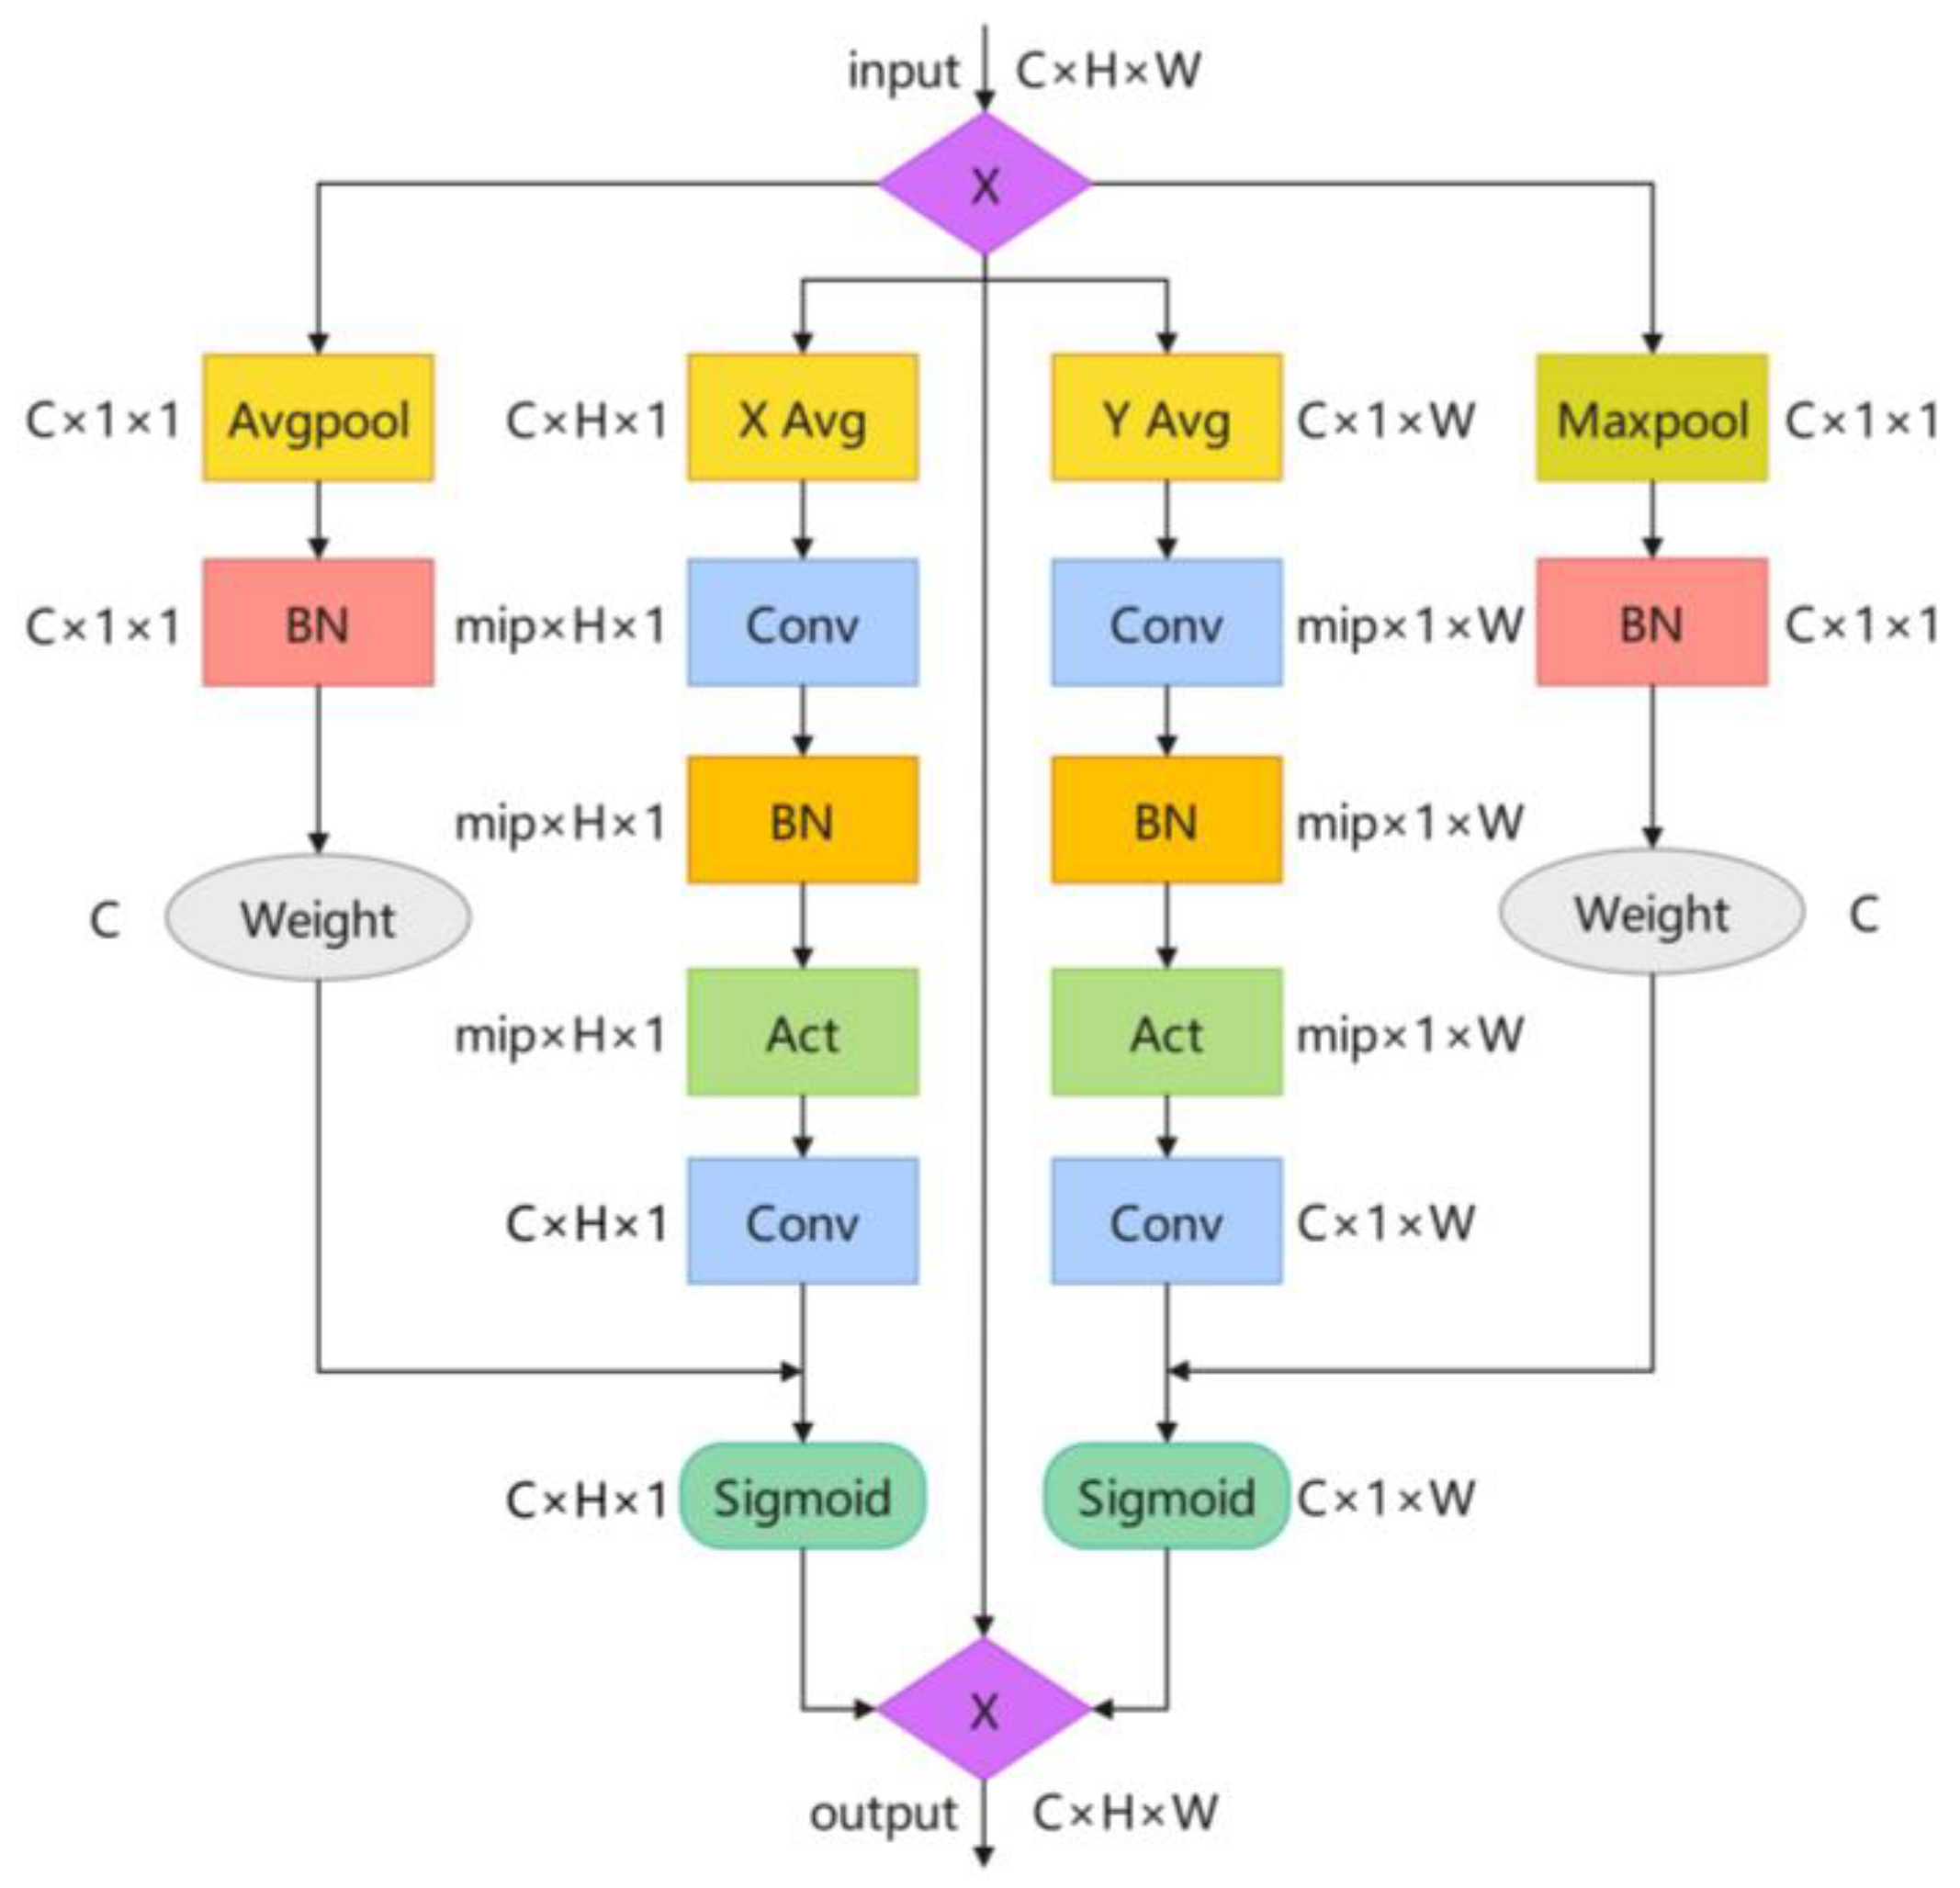
As illustrated in
Figure 7, DWA can be clearly divided into three primary data pathways, arranged from left to right as follows:
Channel Weight Pathway: Calculates channel weights through distinct pooling layers, generating channel importance information represented by .
Spatial Attention Pathway: Captures information in both horizontal and vertical directions via orthogonal pooling, generating spatial attention weights represented by and .
Identity Mapping: Preserves the original input features X unchanged, ensuring information integrity.
These three information pathways are ultimately integrated through multiplication, simultaneously enhancing feature sensitivity to channels and spatial expression. This structural design enables DWA to achieve satisfactory performance improvements at minimal computational cost.
Next, we will introduce the specific details of DWA’s different branches.
The channel component of DWA draws inspiration from the extremely lightweight NAM module [
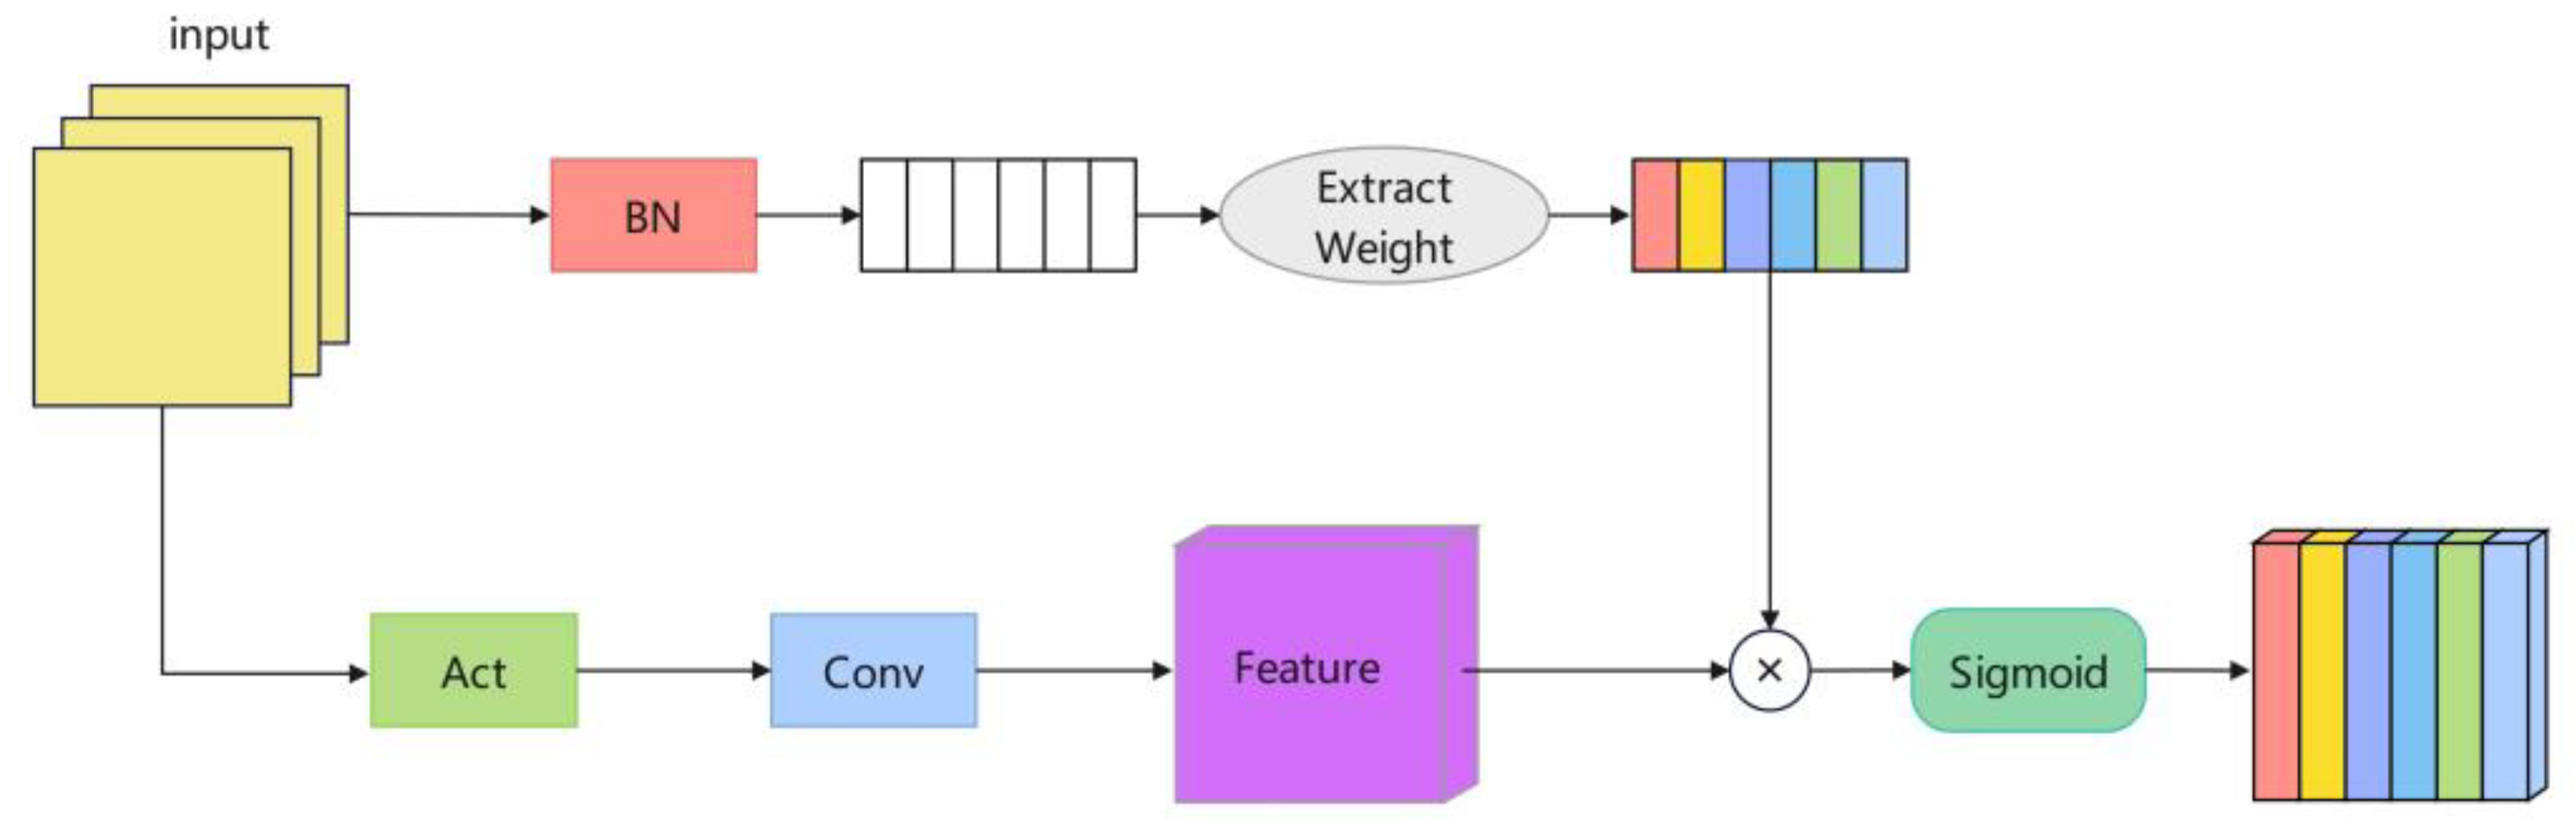
74], which achieves better performance by extracting weights but lacks sufficient specificity for SAR image targets. Therefore, we did not opt to directly incorporate this module. While SAR images emphasize spatial information, channel information remains equally important. Considering SAR image characteristics, devoting excessive parameters to channels is not warranted; however, channel information still requires some preservation during data compression. DWA not only has a relatively low computational cost but also extracts positional information of the target in two directions within the image while preserving channel information. This enables satisfactory performance in scenarios involving complex backgrounds and small targets with indistinct contours. The channel-information-based weight extraction process of DWA is illustrated in
Figure 8.
In brief, we utilize the scaling factor
from the Batch Normalization (BN) layer to extract channel information. The calculation process of the BN layer is expressed as follows:
In the BN layer, the scaling factor and bias are learnable parameters. Their presence enables the network to recover its original nonlinear representation capability. Meanwhile, and represent the mean and variance of each feature dimension, respectively, calculated from each batch of input data. is a small constant used to prevent division by zero. The scaling factor reflects the magnitude of channel variation, information content, and importance.
The mathematical expressions for mean
and variance
are as follows:
Before extracting channel weights, we preprocess the input x in a global direction using max pooling and average pooling to prepare for channel weight information extraction.
Max pooling divides the input image into multiple regions
and outputs the maximum value for each subregion:
Global average pooling similarly divides the input image into subregions
and outputs the average of all elements within each subregion, calculated as follows:
The final outputs
and
represent the feature maps obtained after applying the weight extraction operation
to the max pooling and average pooling branches, respectively. This channel weight extraction branch enables us to capture information from different channels, thereby compensating for the limitations of relying solely on spatial feature extraction and enhancing model performance. The specific outputs are as follows, where
and
denote the extracted weights:
The specific operation for spatial feature extraction is as follows: given an input , two one-dimensional average pooling operations approximately decompose it into orthogonal horizontal and vertical directions, encoding them separately. The pooling kernel sizes are (H, 1) and (1, W), respectively.
When the height is
, the output of one pooling branch is
At width
, the output of the other pooling branch is
After pooling in both directions, they proceed to perform convolutions and a series of subsequent feature extraction operations:
where
is the activation function, defined as follows:
F( ) denotes a standard convolutional layer. During the convolutional dimension reduction phase, the number of channels is reduced from the input channels C according to a reduction factor, resulting in mip (minimum value 8). This operation is defined as follows:
The BN denotes a batch normalization layer. Following these operations, the resulting and are the output feature maps.
Subsequently,
,
,
, and
are used for weight updates in the DWA module:
Specifically, DWA divides the input into four parallel pooling branches and one identity mapping branch. First, two pooling branches perform weight extraction, focusing on the channel pathway data. Then, two average pooling branches extract vertical and horizontal information along the spatial pathway, respectively. Finally, the identity mapping preserves the input features without loss. This approach captures more complete positional information. Finally, the outputs from each branch are combined via element-wise multiplication before being passed to the subsequent layers.
To more clearly describe the DWA architecture, its structural details are illustrated in
Figure 9:
4. Results
The experimental section primarily covers experiments and results. It first introduces the SSDD, HRSID and DSSDD used, followed by the evaluation metrics and parameter settings employed in assessing experimental outcomes. Subsequently, ablation studies are conducted on our proposed LSFP-NET backbone, the embedded parallel fusion module, and the DWA. These experiments not only test their independent and combined contributions to overall model performance but also analyze how variations in their internal structures and parameters affect the model. This process ultimately determines the optimal configuration for each module within our model to achieve the best performance. Finally, SADW-Det is experimentally compared with other state-of-the-art object detection networks across different datasets.
4.1. Dataset
The datasets used in our experiments are the SSDD [
75], HRSID [
76], and DSSDD [
77].
The SSDD is built upon the PASCAL VOC dataset [
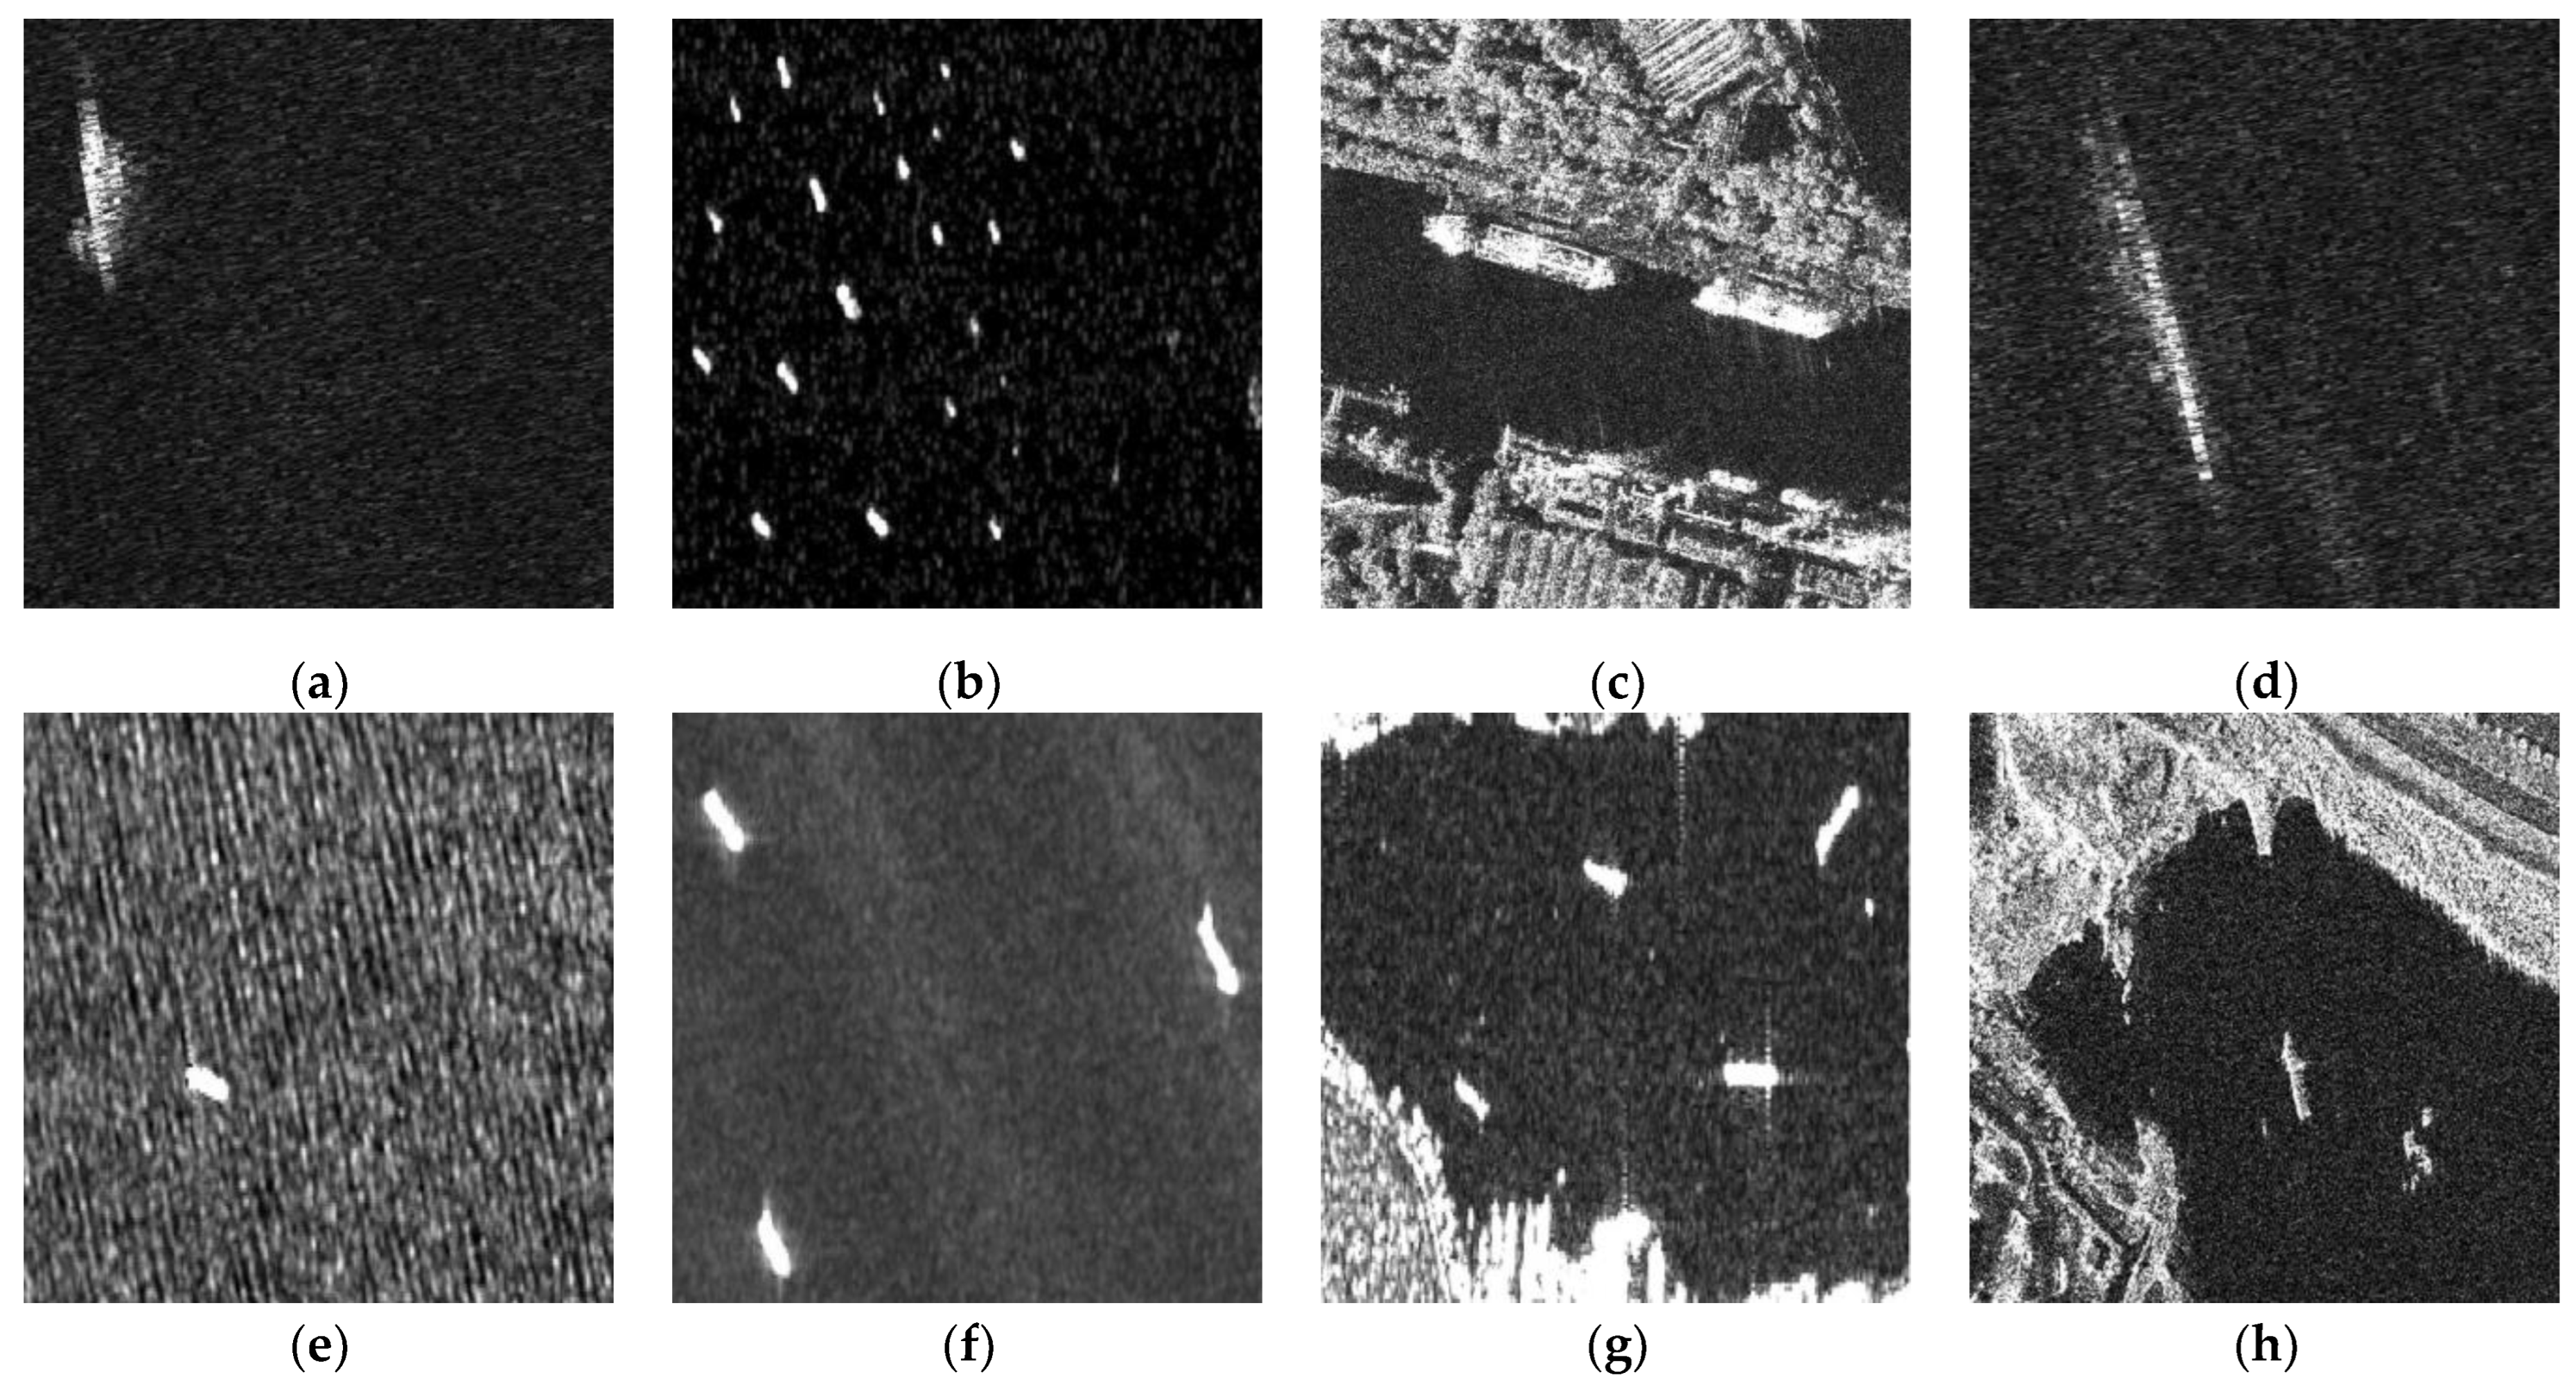
78]. Its data format offers strong compatibility, supporting platforms like PyTorch and TensorFlow, and is compatible with numerous object detection models. The SSDD comprises 1160 images, representing a moderate scale while covering imaging results under various sea conditions. On average, each image contains 2.12 ship targets, though the number of ships varies significantly across images, with inconsistent sizes and an overall uneven distribution. Additionally, the environmental and background clutter in the images shows marked variation, ranging from low-noise open ocean environments to high-noise coastal settings. This diversity effectively enhances the detector’s robustness during training. All ship target locations are annotated across HH, HV, VV, and VH polarization modes.
Figure 10 presents selected image samples from the SSDD.
Additionally, we introduce another high-resolution SAR image dataset, HRSID. Its construction references the Common Objects in Context (COCO) dataset, comprising 5604 images and 16,951 ship targets. SAR image resolutions range from 0.5 m to 3 m, covering diverse maritime scenarios and target distribution states. The HRSID offers significant advantages, including a wide range of SAR image sizes, high resolution, abundant training samples, and detailed annotations. These features enable more comprehensive validation of model robustness.
Furthermore, to validate the model’s adaptability to diverse data characteristics, we also employed the Dual-Polarization SAR Ship Detection Dataset (DSSDD). This dataset is constructed from Sentinel-1 satellite imagery, where the original satellite images were cropped to form 1236 images of size 256 × 256 pixels, containing a total of 3540 ship targets. Unlike conventional SAR ship datasets, this dataset incorporates both VV and VH polarization information within its images. This information is fused into the R, G, and B channels to generate pseudo-color inputs, resulting in more complex data. This not only provides validation for the model’s robustness but also further assesses its feature fusion capabilities.
4.2. Evaluation Indicators
In terms of evaluation metrics, we selected mean Average Precision (mAP), the number of parameters, and floating-point operations (FLOPs) to evaluate model performance. Mean Average Precision is calculated from precision and recall. Precision (P) is defined as the proportion of correctly identified targets in the test set relative to all identified targets:
True Positive (TP) denotes the number of targets correctly predicted by the model, while False Positive (FP) refers to the number of objects misclassified as ship. Recall (R) is the probability that all true samples in the test set are detected:
False Negative (FN) is the number of ship objects that remain undetected. The expression for mean Average Precision (mAP) is
4.3. Experimental Settings
Unless otherwise specified, all open-source comparison models in this paper were retrained using the official standard splits and recommended input sizes for the three datasets, with the same batch size, number of training epochs, optimizer settings, and other hyperparameters, ensuring fairness in comparisons.
For experimental validation on the SSDD, following official recommendations, the dataset was split at an 8:2 ratio: 80% for training and 20% for testing. The batch size was set to 8, and both the input and test image sizes were set to 640. The training was run for 600 epochs using a cosine annealing learning schedule with an initial learning rate (lr) of 0.01. The learning rate was adjusted to lr × batch size/64. The weight decay was set to 0.0005, and the SGD momentum was set to 0.9.
For the HRSID, we adhered to the official recommended split of 65% for training and 35% for testing. The input image size for the model was set to the officially recommended 800 pixels, with all other parameters identical to those used in experiments based on the SSDD.
For experiments based on the DSSDD, the officially recommended dataset split was also adopted, with approximately 70% of the data allocated to the training set and 30% to the test set. The input image size for the model was set to the officially recommended 512 pixels, with all other parameters identical to those used in experiments based on the SSDD.
4.4. Experimental Results and Analysis
Due to significant modifications across the entire object detection network, performance testing and analysis were conducted from three perspectives.
First, ablation experiments were performed to demonstrate the contributions of our modules. The initial experiment compares different backbone networks on the SSDD, with subsequent experiments incorporating attention mechanisms. The evaluated results validate the effectiveness of our proposed backbone network and attention mechanism. The second experiment explores the configuration and role of parallel fusion module and factorized convolutional modules, with performance evaluation conducted on the SSDD. Finally, our model is evaluated and tested on the SSDD, HRSID, and DSSDD, with results compared against several state-of-the-art object detection methods.
4.4.1. Backbone Network and Attention Mechanism
The experiments in this section first compare the performance differences between the newly designed backbone network and the original YOLOX architecture (based on CSPDarknet) on the SSDD. Subsequently, the direction-weighted attention (DWA) module undergoes evaluation and testing. Finally, experiments are conducted on both the stem and stage 1 of the backbone network to analyze their impact on network performance, selecting the most advantageous configuration.
To validate the advantages of the proposed network (LSFP-NET), ablation experiments were conducted based on four distinct backbone architectures: the original CSPDarknet backbone of YOLOX; an LSFP-NET backbone without direction-weighted attention; an LSFP-NET backbone with NAM attention; and the complete SADW-Det detection algorithm incorporating the direction-weighted attention mechanism. The final results are presented in
Table 2.
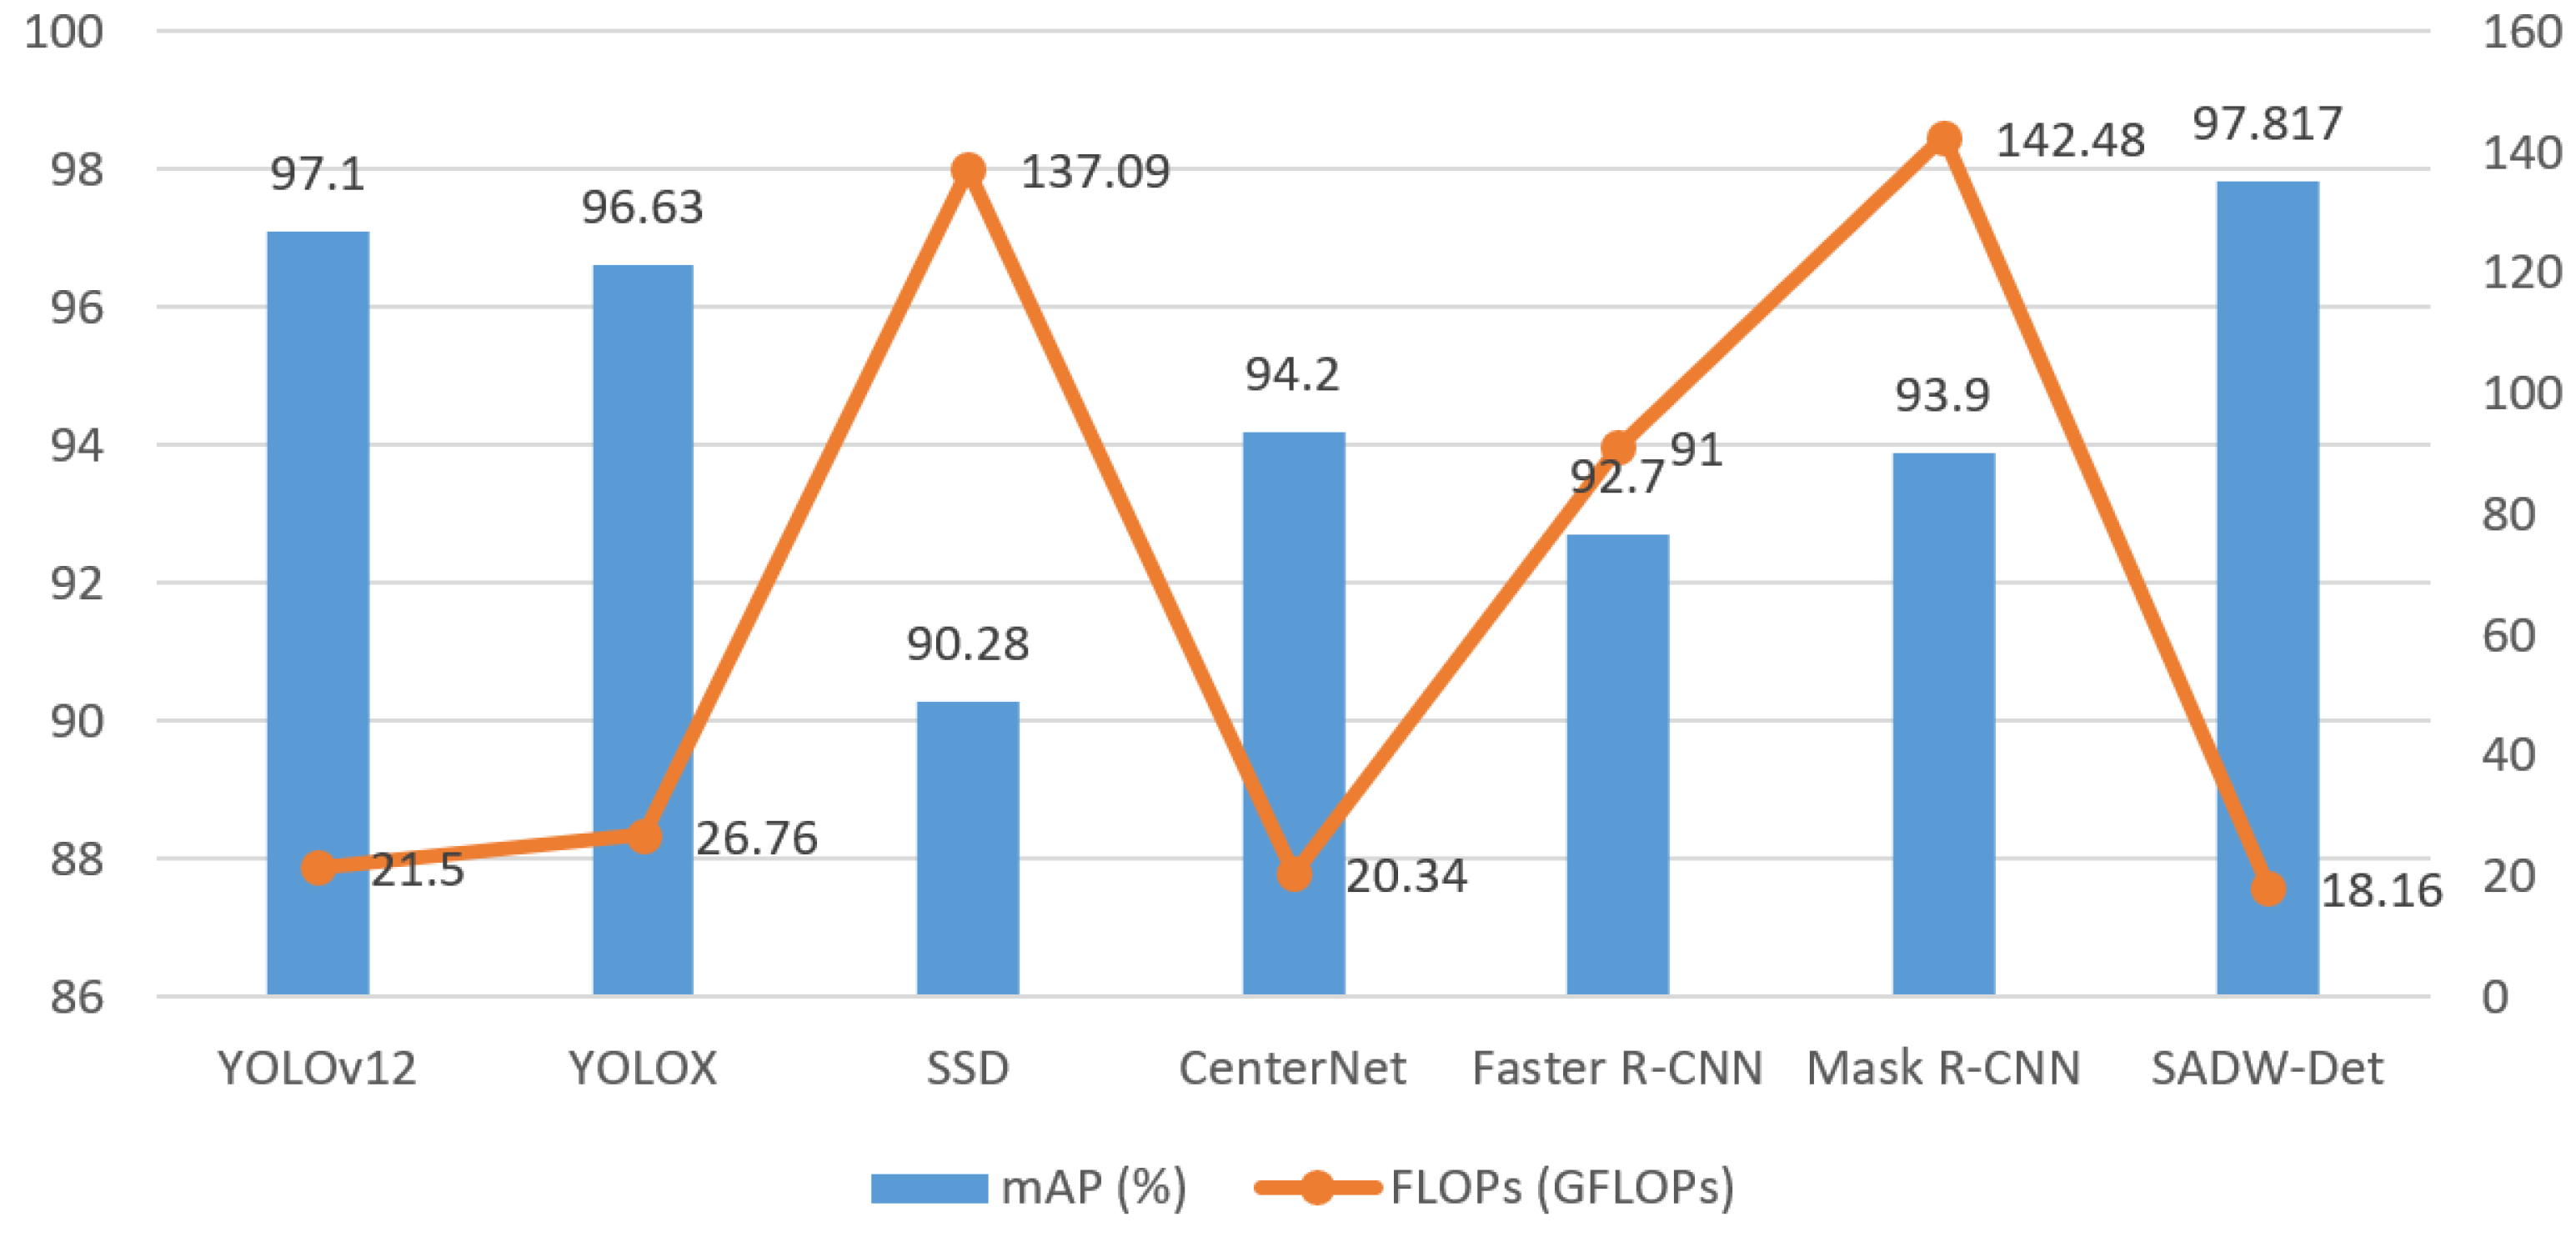
Compared to the baseline model, our model achieves higher mAP while simultaneously reducing the number of model parameters and FLOPs. mAP increased from 96.6% to 97.1% and 97.8%, representing gains of 0.5% and 1.2%, respectively. FLOPs decreased from 26.76 GFLOPs to 18.07 GFLOPs and 18.16 GFLOPs, a reduction of approximately 8.6 GFLOPs. Parameters decreased from 8.94 M to 5.53 M, a reduction of nearly half. Meanwhile, without introducing attention mechanisms, the FPS (Frames Per Second) reaches 61.6, showing a significant improvement over the baseline model. After incorporating NAM and DWA, the FPS drops to 50.7 and 49.5, respectively, remaining within an acceptable range overall. Additionally, our proposed DWA achieves an approximately 0.5% mAP improvement over NAM with nearly unchanged computational cost, validating its effectiveness. Thus, our model demonstrates clear advantages in SAR object detection tasks, exhibiting stronger adaptability to complex backgrounds and multi-scale targets.
To investigate the impact of different convolutional modules within the backbone network on overall performance, we conducted targeted ablation experiments, primarily focusing on the first two stages of the backbone:
In the stem, we evaluated the effects of single large-kernel convolutions versus small-kernel convolution combinations on model performance, while in stage 1, we compared the performance of conventional convolution modules with that of convolution groups.
The results of these ablation experiments are shown in
Table 3.
The experimental findings reveal that, in the stem’s convolutional module design, small-kernel convolution combinations demonstrate a performance advantage over large-kernel convolutions (AP improved by approximately 0.5%, while FPS can reach 61.6). In stage 1, the conventional convolution module not only increases the number of parameters by 0.01 M and computational overhead by 0.21 GFLOPs, but also causes a slight decrease in model performance of 0.09%, with FPS reduced to 58.8. Therefore, the combination of small-kernel convolution and convolution achieves improved model accuracy while maintaining lightweight characteristics, demonstrating advantages in SAR target detection applications.
4.4.2. Parallel Fusion Module
This section conducts ablation experiments on the parallel fusion module within stage 2, which are divided into two parts: first, comparing the integration effects of the append method versus the addition method; second, discussing the performance differences between modules based on 3 × 3 or 5 × 5 convolution kernels.
To contrast the effects of different integration methods, we experimentally tested parallel fusion modules using both the append and addition methods on the SSDD. The experimental results are shown in
Table 4.
Experimental results demonstrate significant performance differences among various integration methods. Compared to the addition approach, the parallel fusion module using the append method not only yields a smaller performance gain (approximately 0.362% less). Meanwhile, model complexity and FPS exhibit only minor fluctuations, with overall values differing very little. This discrepancy stems from the channel dimension mismatch induced by append, necessitating additional expansion convolution and aggregation convolution to align parallel channels. Consequently, this approach increases model parameters and computational load, leading to performance degradation. Therefore, for target detection in SAR maritime images, the addition method proves more suitable for parallel fusion module integration than the append method.
Building upon previous experiments, we designed an ablation study to compare the impact of placing 5 × 5 depthwise separable large-kernel convolutions at different positions within the backbone network on model performance. We embedded the 5 × 5 depthwise separable large-kernel convolution into both the parallel fusion module and the tail end of the backbone network. For comparison, we used 3 × 3 depthwise separable small-kernel convolutions and their corresponding
convolution blocks at positions where large-kernel convolutions were not applied. Experimental results are shown in
Table 5.
According to the results, incorporating the 5 × 5 depthwise separable large-kernel convolution solely into the parallel fusion module achieved a model accuracy of 97.144%. This represents an approximately 0.2% improvement compared to models without the large-kernel convolution (96.952%) and those with it only at the tail (96.927%). Meanwhile, model complexity and FPS exhibit only minor fluctuations, with overall values differing very little. The results demonstrate that introducing 5 × 5 depthwise separable large-kernel convolutions into the parallel fusion module enhances accuracy while preserving computational efficiency advantages, making it the optimal choice for SAR target detection.
4.4.3. Comparison of Object Detection Methods Based on the SSDD
To fully validate our approach, we compared SADW-Det’s performance against multiple object detection models on the SSDD, including (YOLO series) YOLOv5, YOLOv7, YOLOv8, YOLOv10, YOLOX, (one-stage) RetinaNet, SSD, AFSar, CenterNet, and (two-stage) Faster R-CNN, Mask R-CNN, Cascade R-CNN. These models are highly representative, covering diverse architectural types and development stages, including some of the latest mainstream models. This allows us to demonstrate the performance differences of different design biases and architectures in the SAR object detection task. The experimental results are shown in
Table 6.
According to the experimental results in
Table 6, SADW-Det achieved the best performance with a mean Average Precision (mAP) of 97.817%. Meanwhile, the model’s computational cost (FLOPs) is 18.16 GFLOPs, and the FPS reaches 49.5, which is comparable to the YOLO series and significantly outperforms other methods, while using only 5.53 M parameters, achieving an excellent lightweight design alongside high accuracy. Compared to YOLOX from the YOLO series, SADW-Det improves mAP by 1.1% while reducing parameters by approximately 38%. Against one-stage networks like CenterNet, it achieves about a 3.6% detection accuracy boost using only one-third of the parameters. Against relatively large two-stage networks such as the classic Faster R-CNN, SADW-Det demonstrates significantly higher computational efficiency and accuracy advantages.
It should be noted that to ensure experimental fairness, the results of the compared models were obtained by training them on the SSDD using the same training and testing set configurations and the same number of iterations as our model. All other parameter settings for these models were also set to their default values.
Overall experimental results demonstrate that our model achieves accuracy superior to mainstream object detection models while reducing parameter count and computational load. It exhibits excellent performance for SAR image object detection, particularly for small, irregular objects against high-clutter backgrounds.
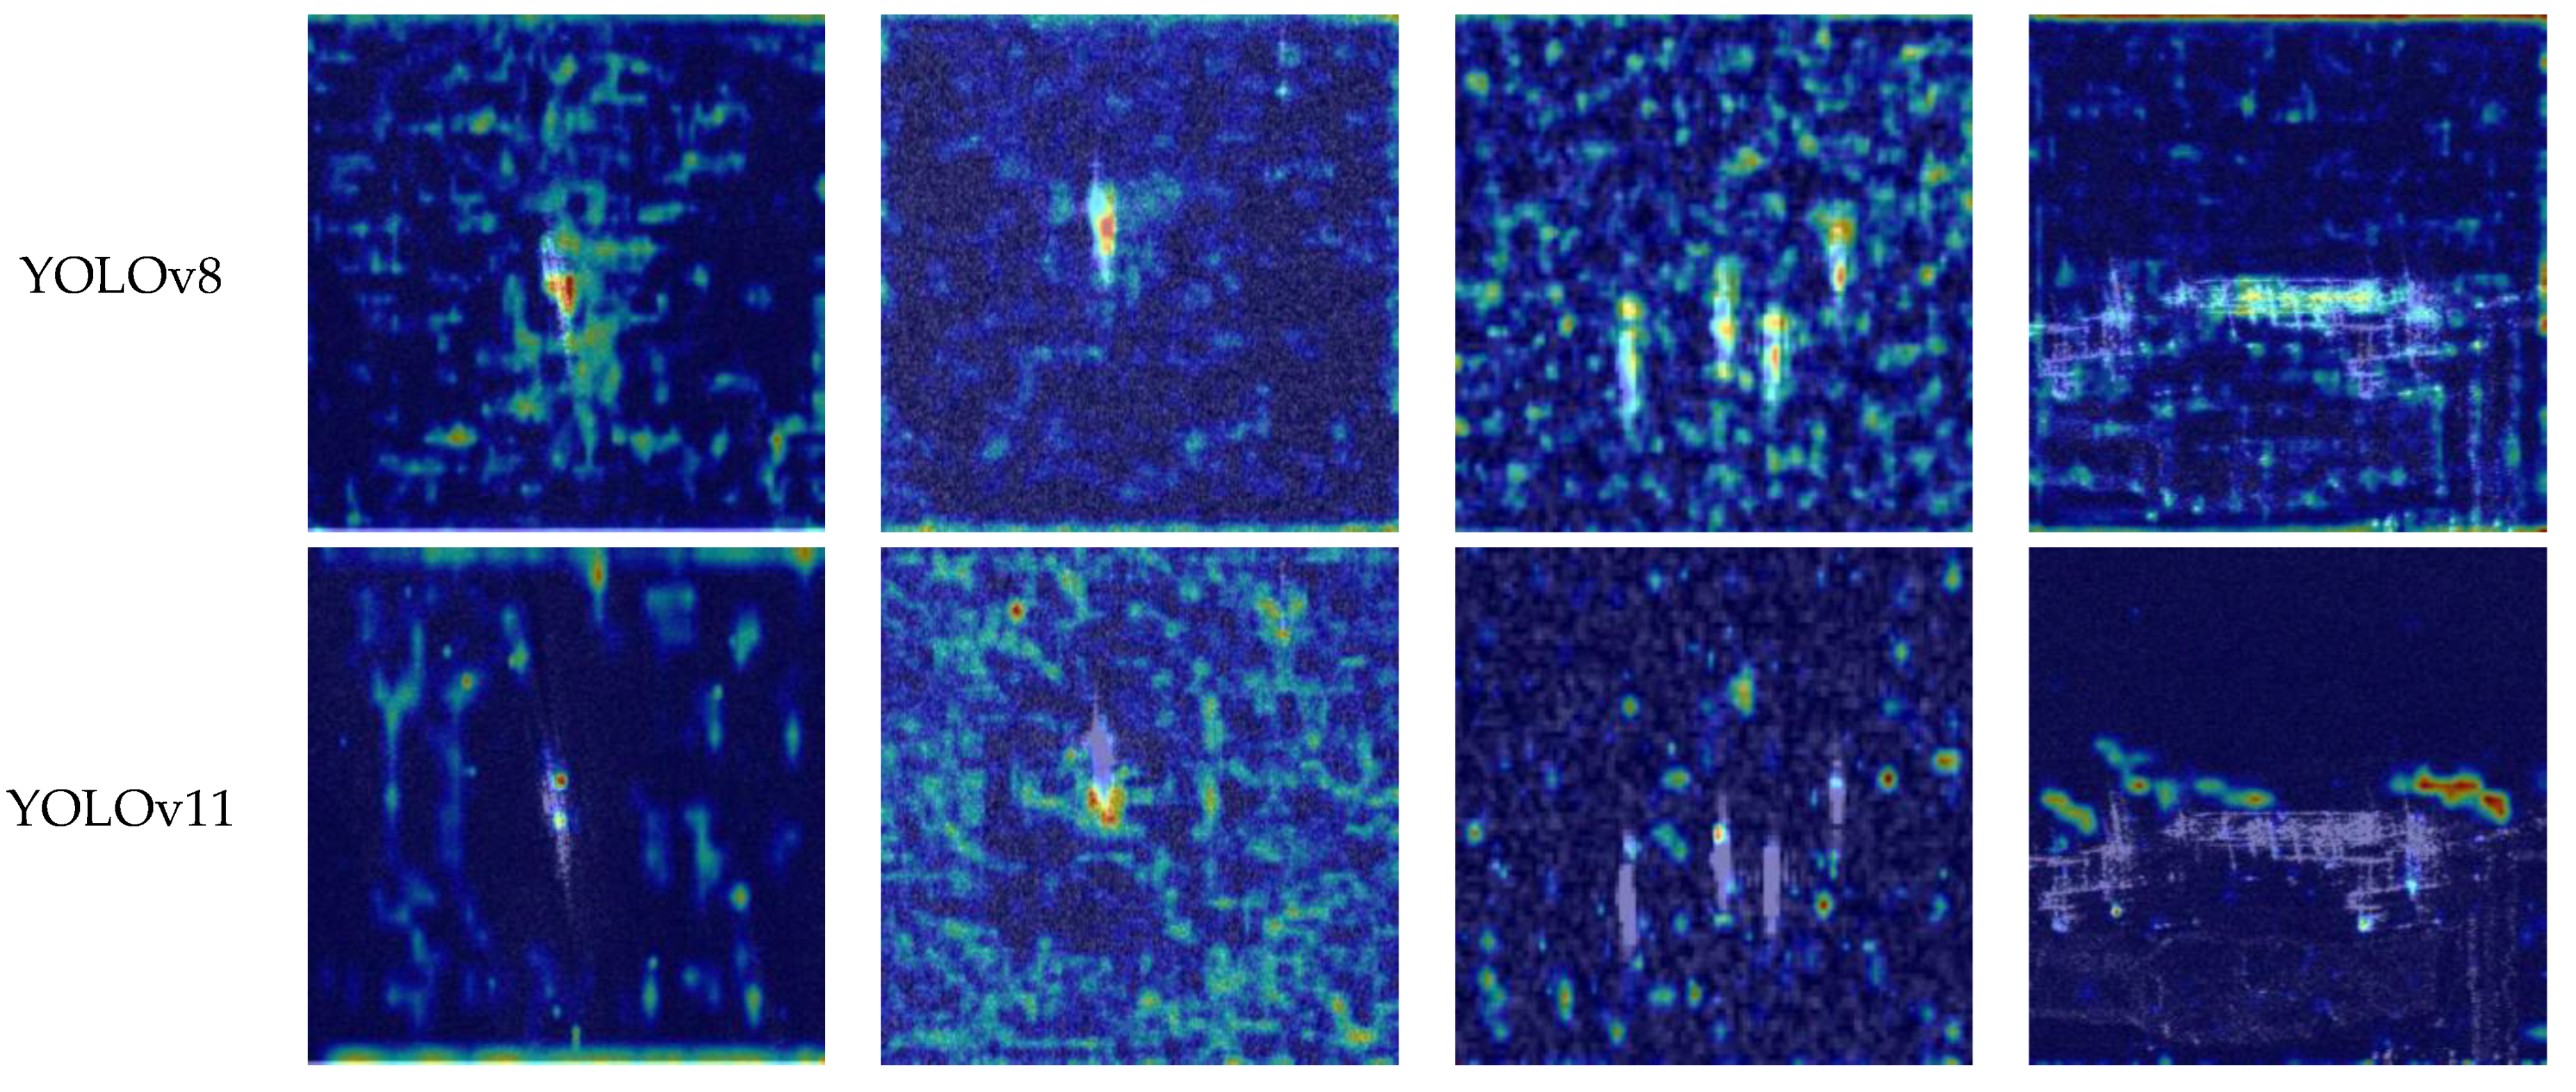
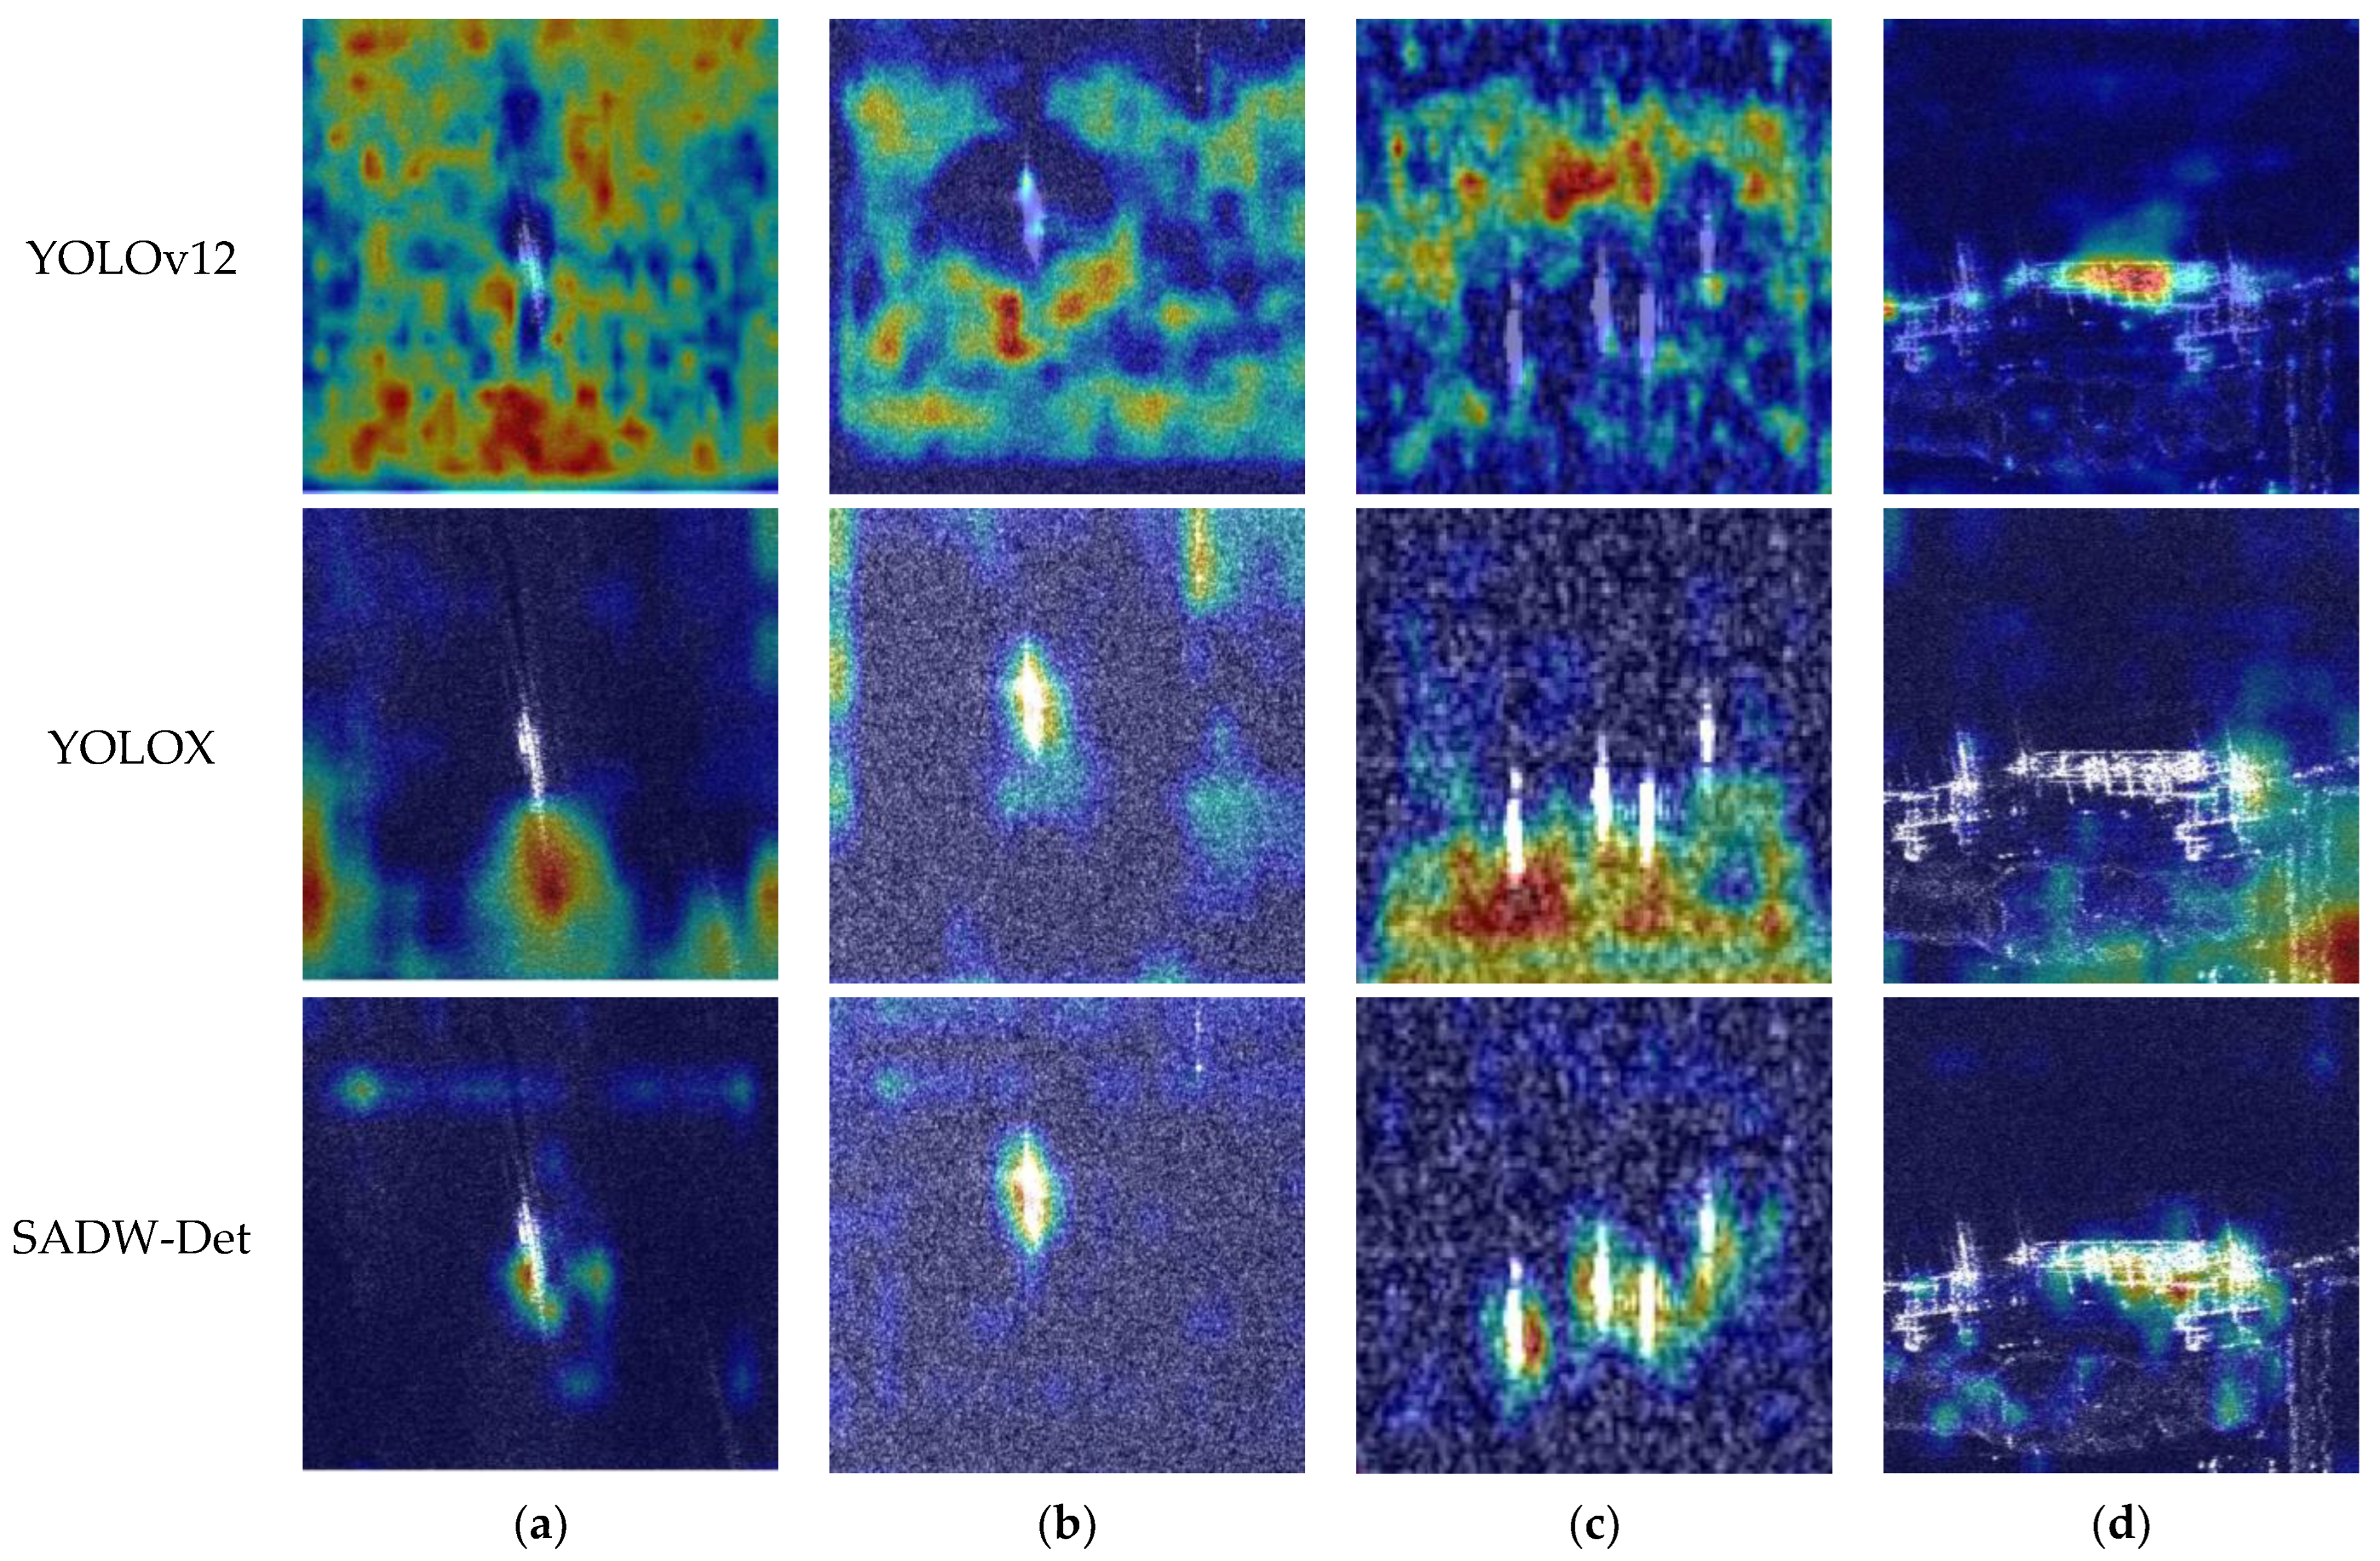
To more intuitively demonstrate the differences in feature attention and target perception of SADW-Det across various SAR ship environments, we conducted a comparative visualization of heatmaps with the benchmark model YOLOX and the currently emerging models YOLOv8, YOLOv11, and YOLOv12, as shown in
Figure 11. The heatmap visualization in
Figure 11 covers multiple representative scenarios. From left to right, each column represents a single target, multiple targets, a high-noise background, and near-shore targets.
The heatmap comparison in
Figure 11 reveals that different models focus on distinct regions. Our model demonstrates strong target localization in most complex scenarios, particularly excelling under single-target, multi-target, and high-noise background conditions. For inshore environments, its performance is comparable to that of the top-performing YOLOv12.
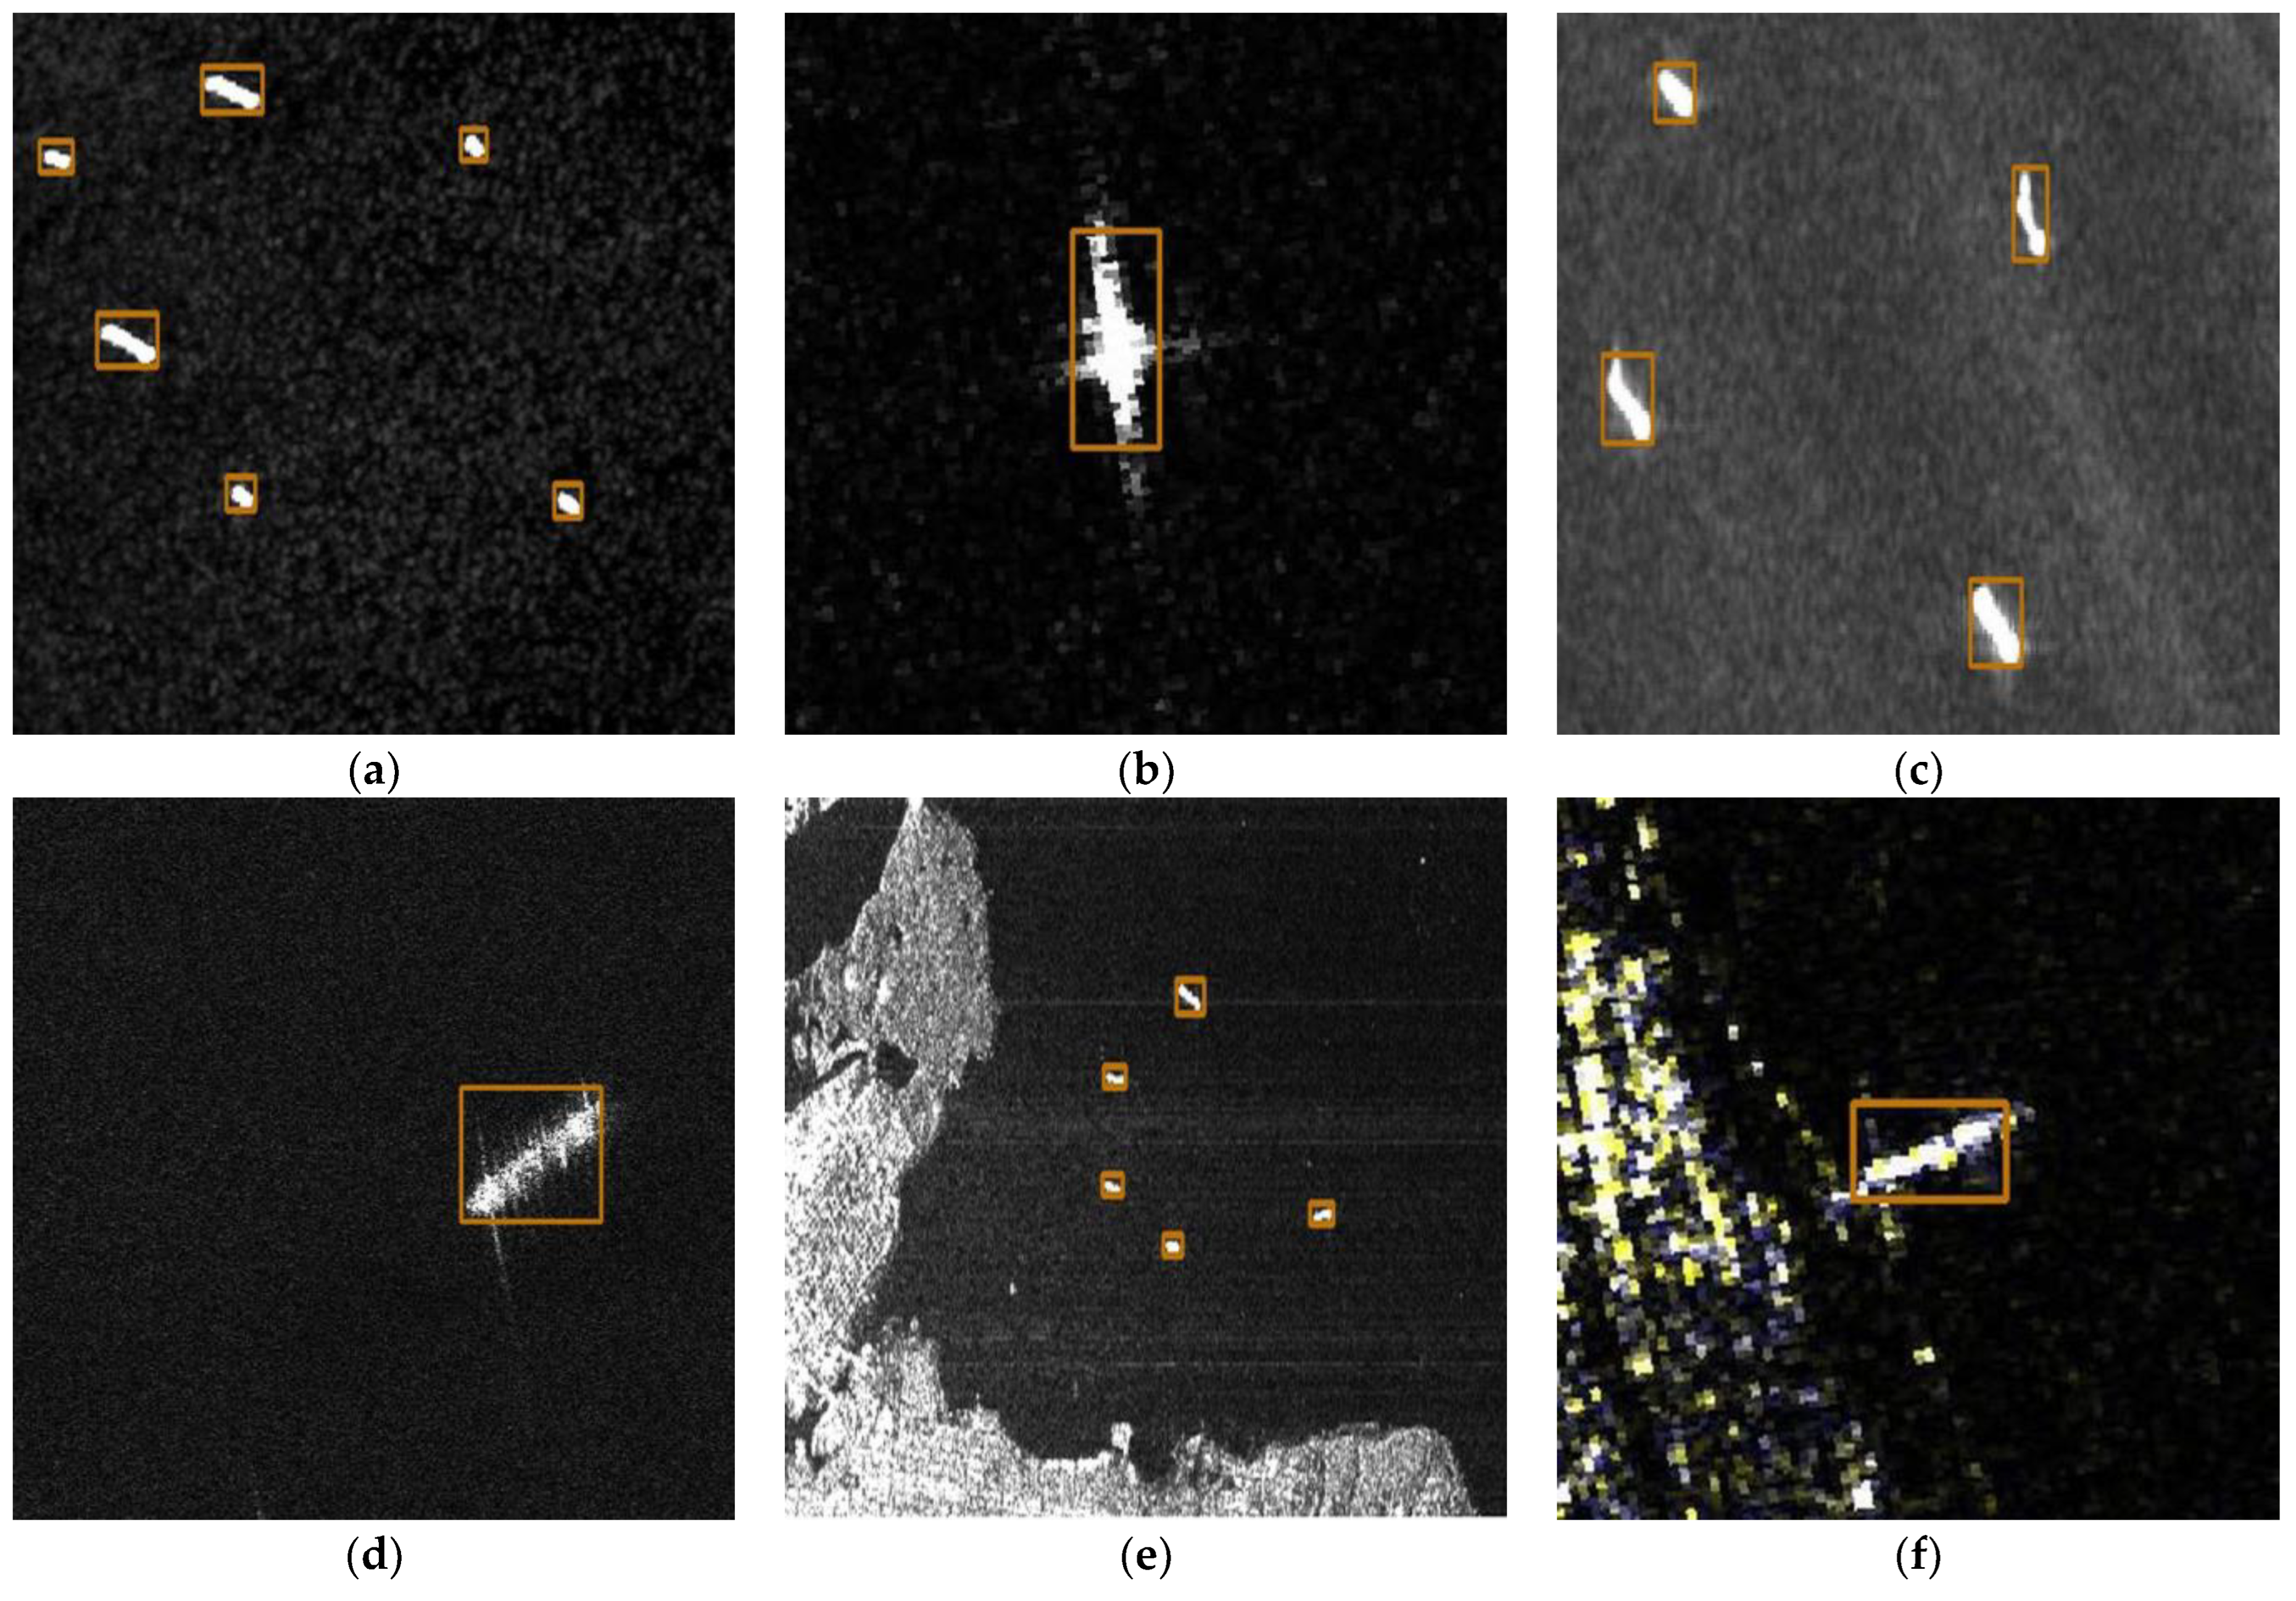
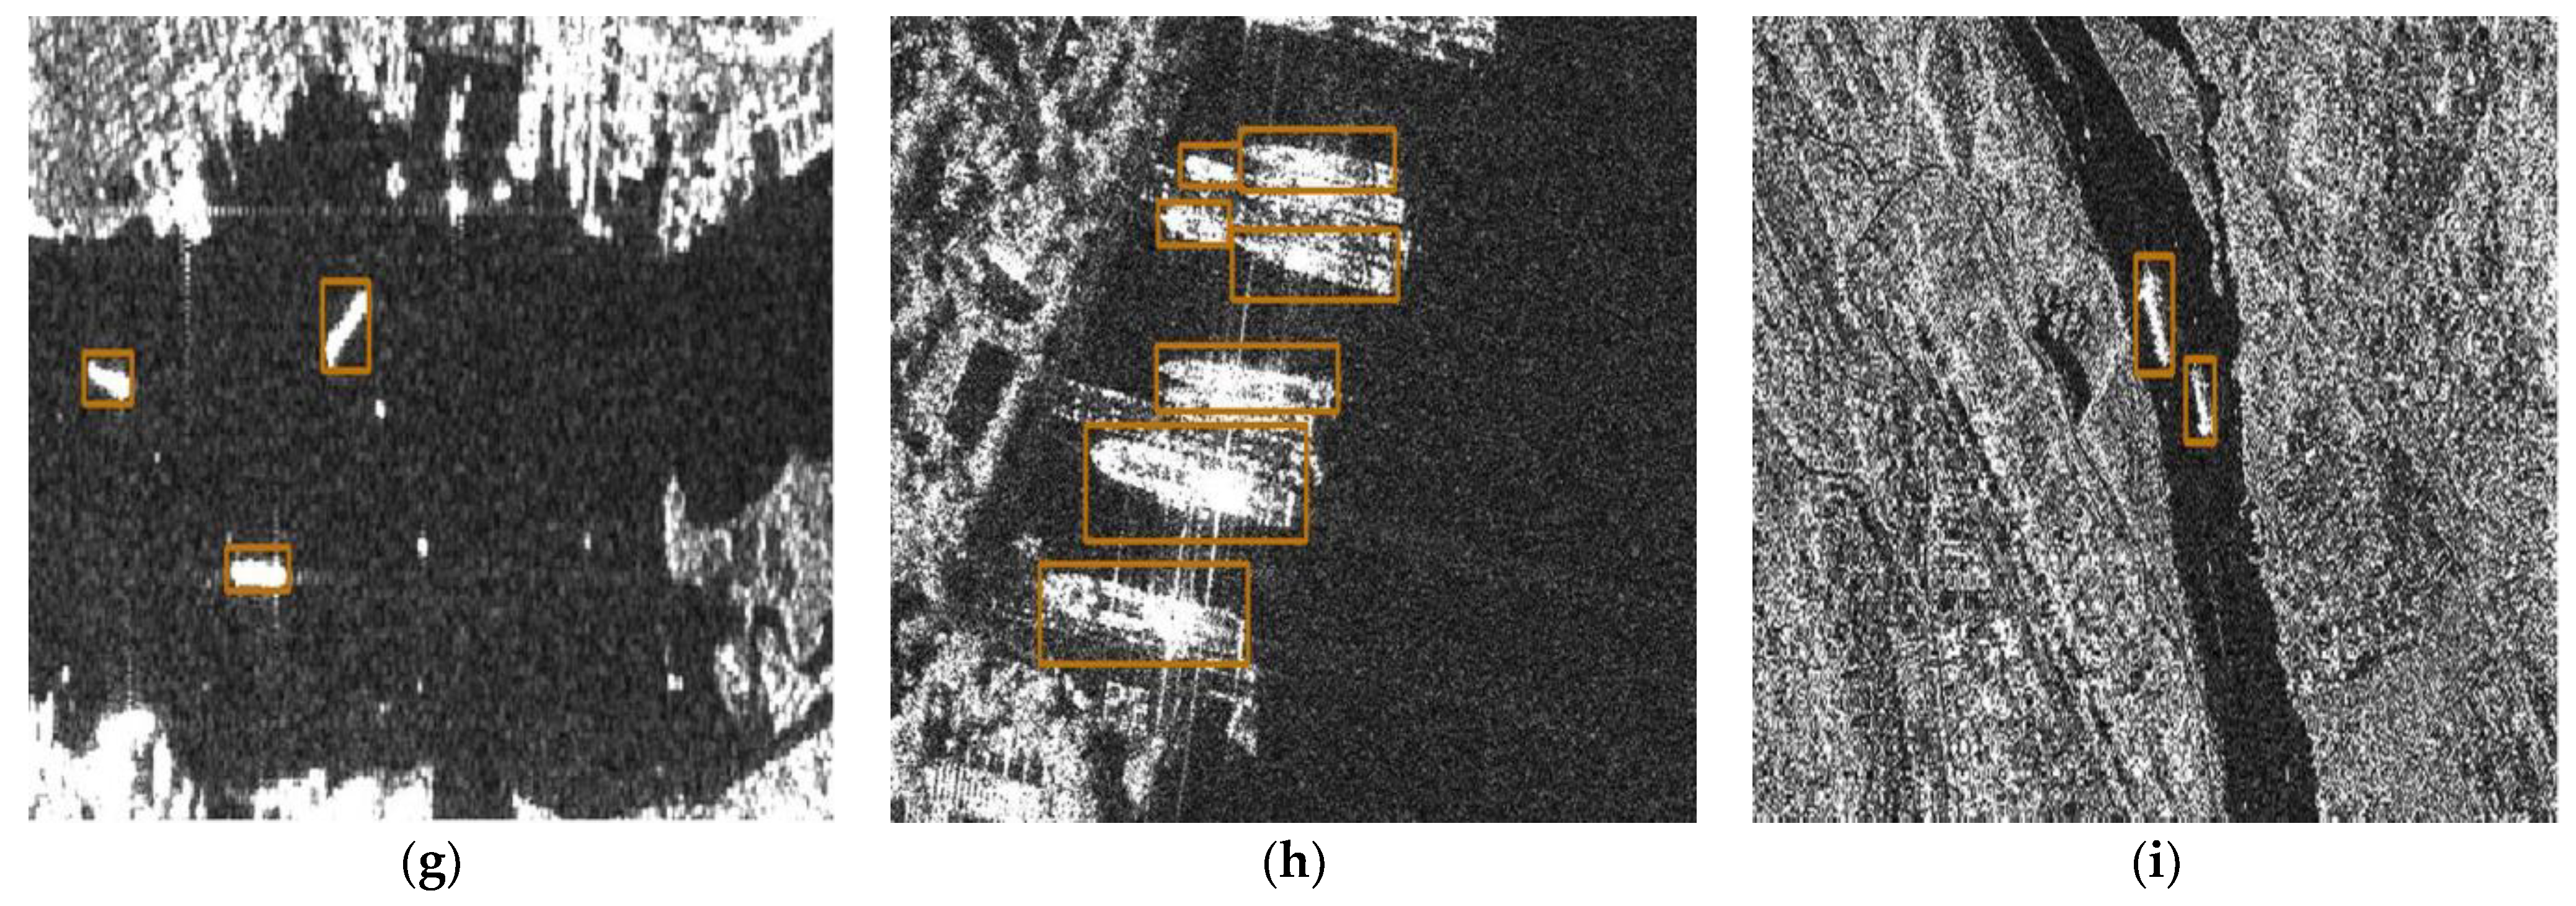
Building upon the heatmap visualization comparison above, to further demonstrate the model’s performance in SAR detection tasks, we trained our model on the SSDD training set and conducted inference on the test set images, with selected prediction results visualized in
Figure 12.
As depicted in
Figure 12, our model demonstrates robust performance in diverse scenarios—from the highly cluttered small-object scene in
Figure 12a to the challenging coastal canyon environment in
Figure 12i. Consequently, this model not only handles single-object detection and multi-object detection under strong clutter but also effectively detects coastal targets and objects with indistinct contours.
4.4.4. Comparison of SAR Ship Detection Methods Based on the SSDD
To further validate our model’s performance, we compared it with current mainstream SAR target detection methods. The comparison results are presented in
Table 7.
The experimental results demonstrate that our SADW-Det model exhibits outstanding overall performance.
In terms of model accuracy, its mean average precision (mAP) reaches 97.817%, ranking among the leading SAR ship detection methods. Although its accuracy is approximately 0.4% lower than GLDet, GLDet’s parameter count and FLOPs increase to 22.6 M and 45.1 GFLOPs, respectively—roughly four times that of SADW-Det. GLDet clearly sacrifices computational efficiency for marginal accuracy gains, resulting in suboptimal overall performance balance. This limitation is particularly pronounced in practical applications with constrained computational resources.
Regarding model lightweight design, SADW-Det also demonstrates strong performance. In terms of model lightweighting, while SADW-Det does not surpass AC-YOLO, the latter’s detection accuracy is relatively limited, achieving only 96.7% mAP on the SSDD—a significant gap compared to our model. Our model achieves an approximately 1.1% improvement in mAP while consuming only 18.16 GFLOPs. Parameter count is tightly controlled at an extremely low 5.53 million, and it maintains the highest FPS, demonstrating exceptional efficiency. This highlights our model’s optimal balance between accuracy and computational complexity.
It should be noted that since most of these SAR ship detection methods do not provide open-source code or complete implementation details, we were unable to fully reproduce their code structures and parameter settings. Therefore, to ensure fair performance comparisons, we directly referenced the reported best mAP results from the original papers of the comparison models based on experiments using the SSDD. For other metrics such as FLOPs, parameters, and FPS, some comparison models did not provide relevant data, which we denote as “-“. Where such parameters were reported, we directly reference the best results from the original papers’ experiments on the SSDD.
In summary, for SAR object detection tasks, SADW-Det achieves the highest detection accuracy while consuming the least computational resources. It demonstrates outstanding SAR-image-specific performance and an excellent balance between accuracy and model complexity, showcasing engineering application potential—particularly for computationally constrained remote sensing scenarios.
4.4.5. Comparison of Object Detection Methods Based on the HRSID
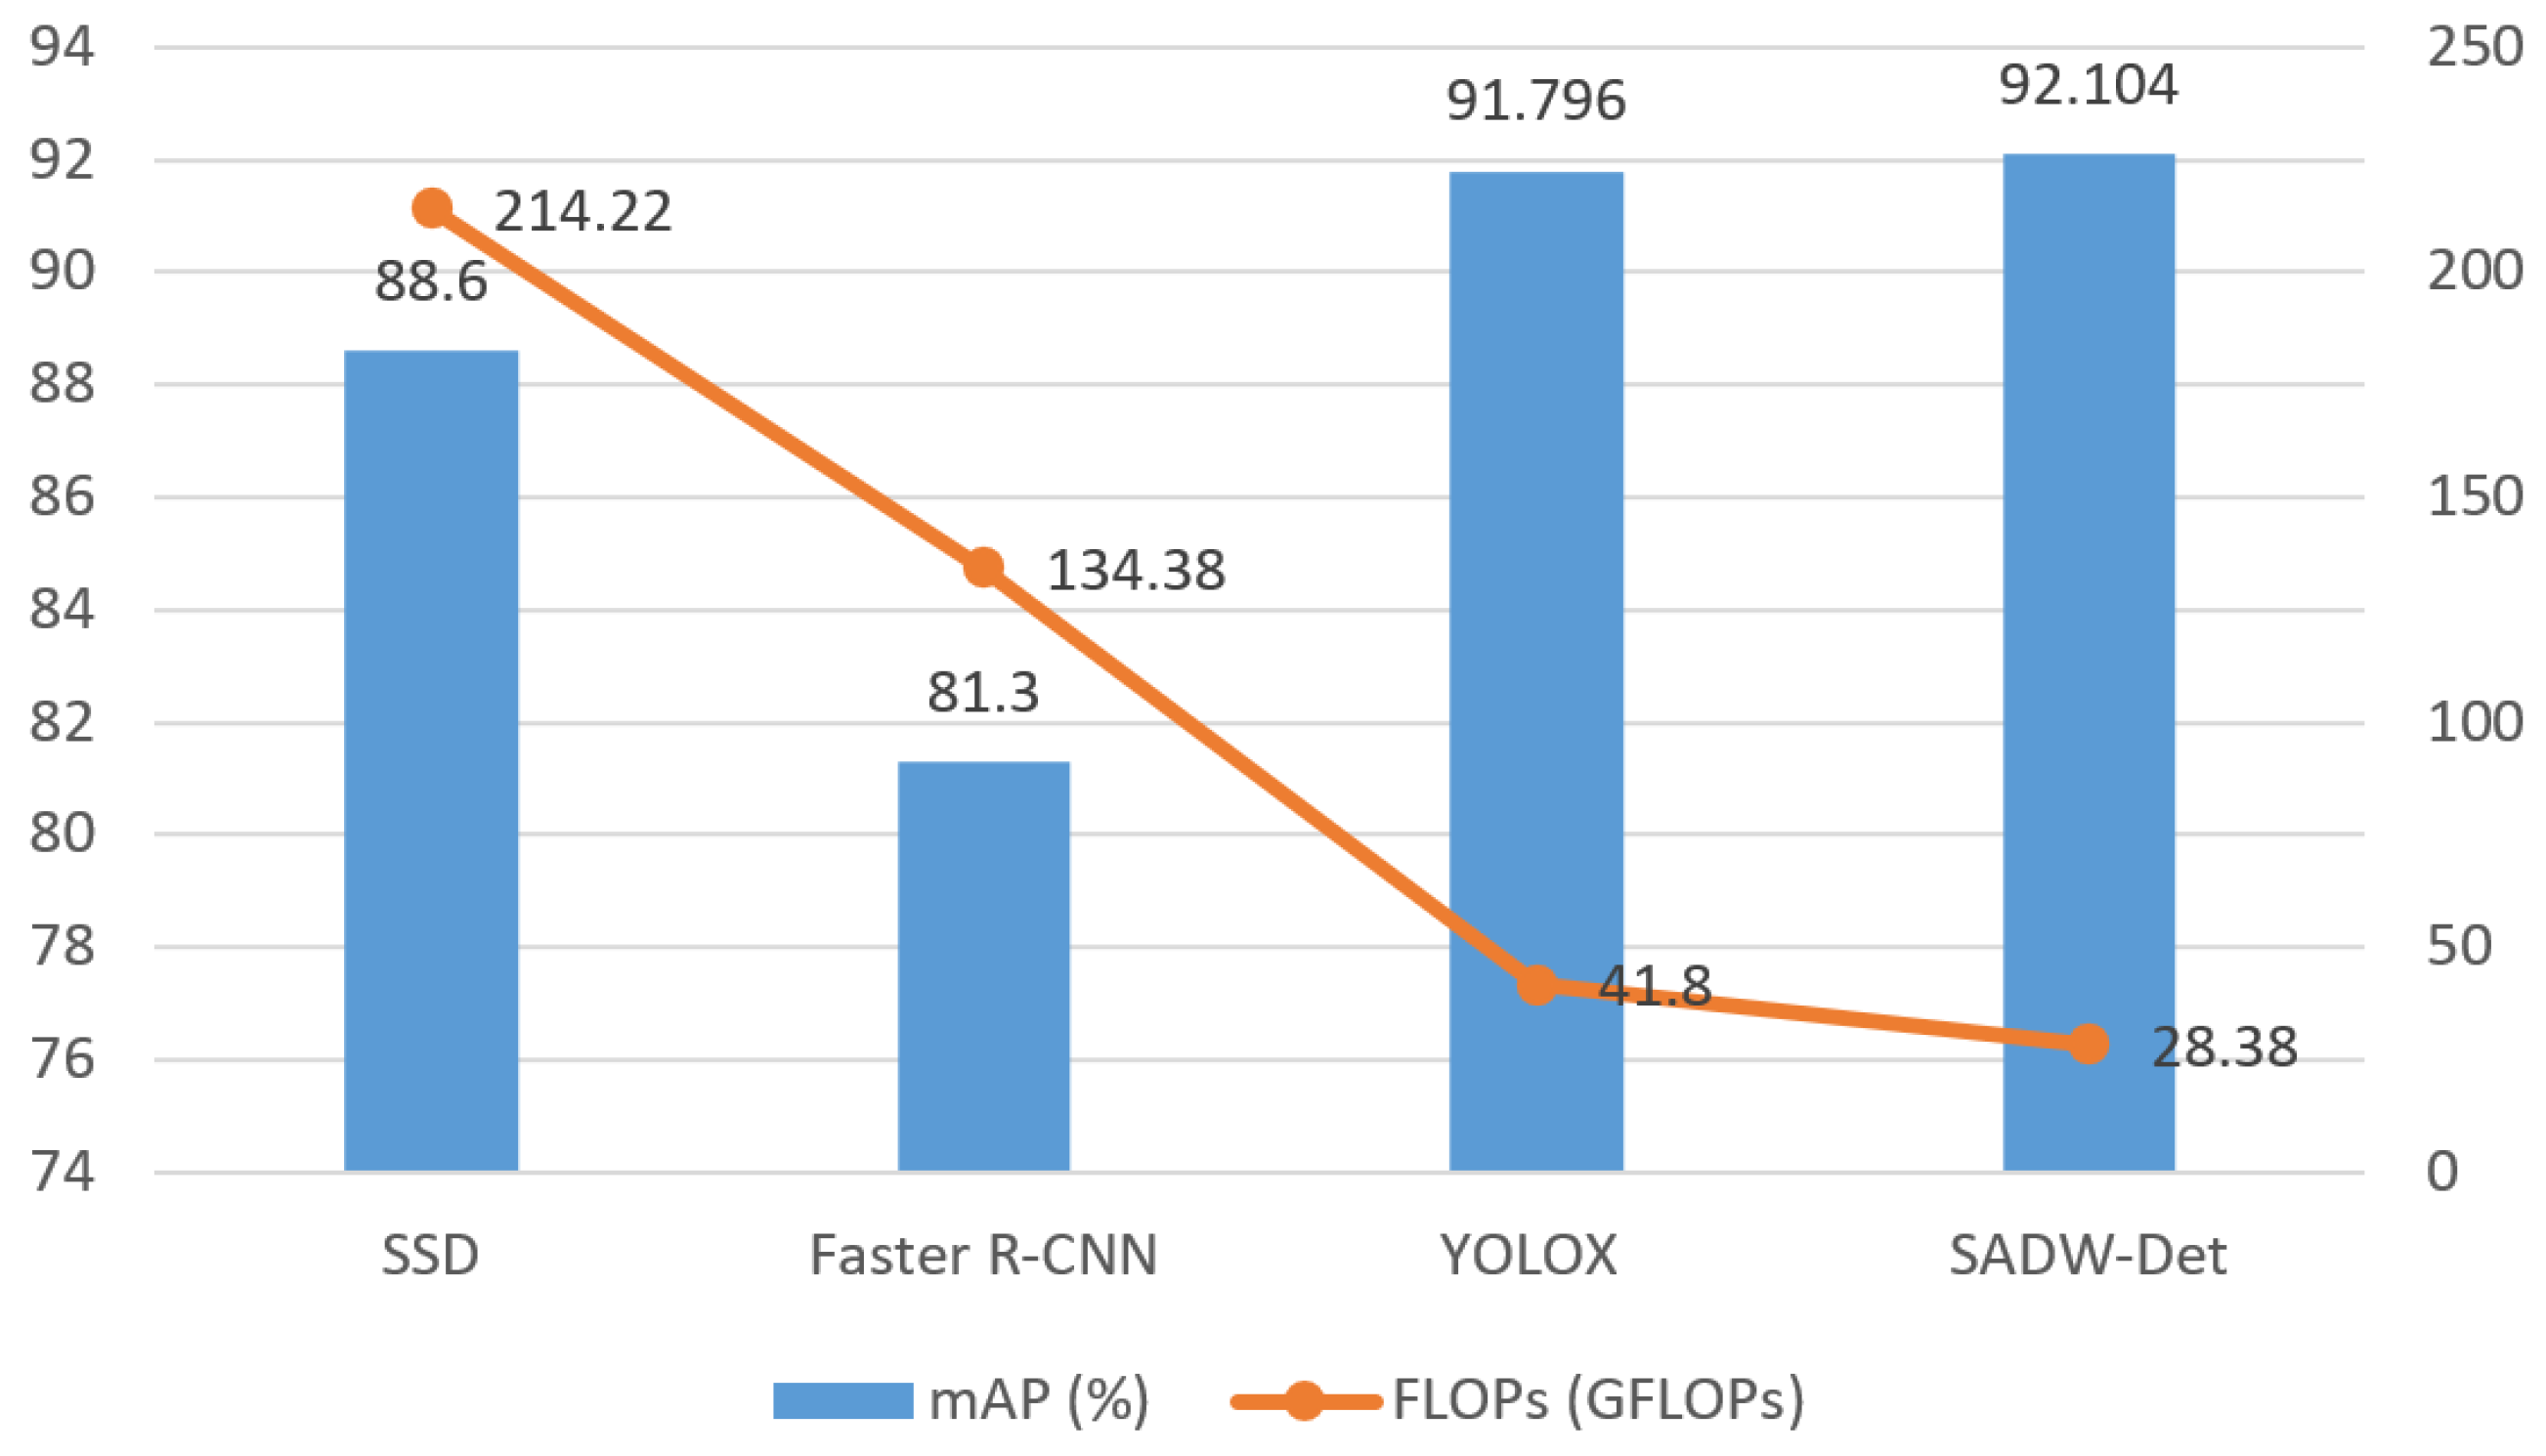
To test the generality and stability of our model, we introduced the HRSID. Compared to the SSDD, the HRSID features richer samples and more complex scenarios. On the HRSID, we selected representative YOLO-series models, YOLOX, the one-stage model SSD, and the two-stage model Faster R-CNN for comparative experiments. Detailed experimental results are shown in
Table 8.
Table 7 demonstrates that our model achieves advantages in both accuracy and speed. It not only achieves an mAP improvement of nearly 0.31% relative to the YOLOX baseline but also effectively controls model complexity by reducing parameters by approximately 40%, proving the stability and generality of our approach across different datasets.
4.4.6. Comparison of Object Detection Methods Based on the DSSDD
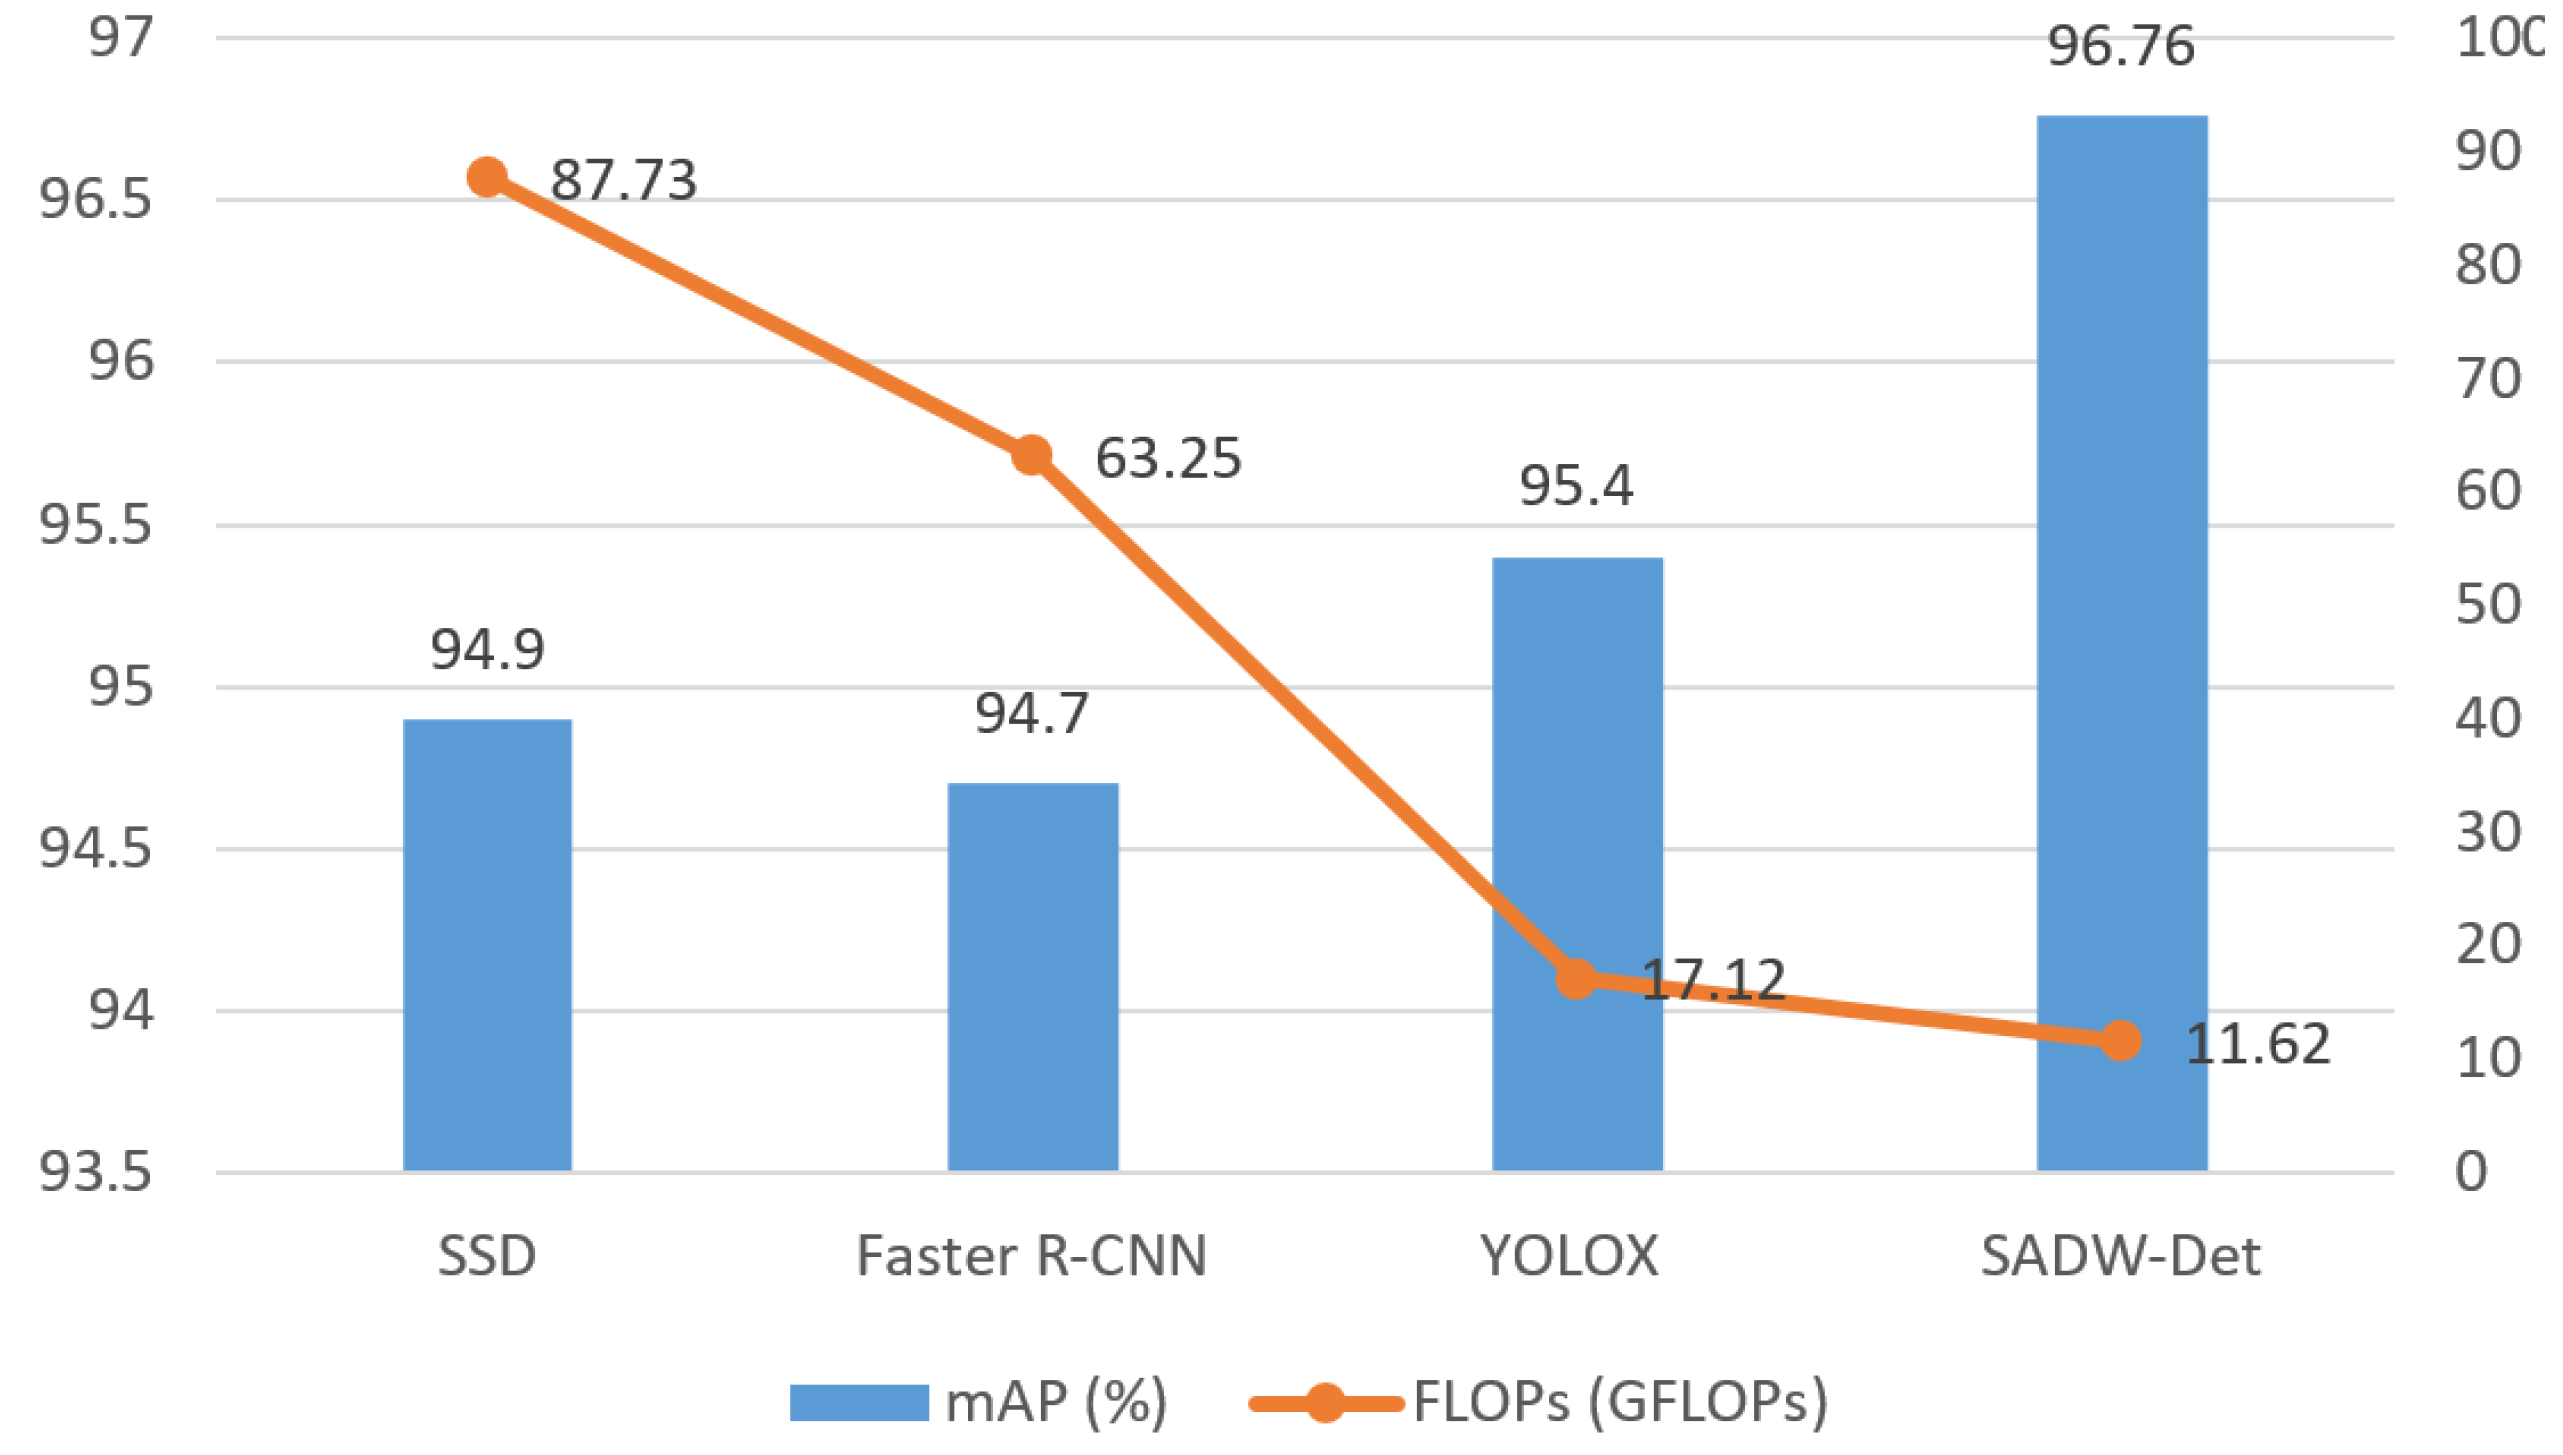
To further validate the adaptability of our proposed model under different data characteristics, we also conducted comparative experiments on the DSSDD. Compared to SSDD and HRSID, the DSSDD is more complex as it incorporates dual-polarization information and generates pseudo-color inputs through channel fusion. On the DSSDD, we similarly selected representative models from the YOLO family (YOLOX), a one-stage model (SSD), and a two-stage model (Faster R-CNN) as baselines. The detailed experimental results are shown in
Table 9.
The results in
Table 9 demonstrate the excellent performance of SADW-Det on the DSSDD. Specifically, compared to the baseline methods, SADW-Det not only achieves the highest mAP of 96.76% but also effectively reduces model complexity with only 5.53 million parameters and with computational cost controlled at 11.62 GFLOPs, while maintaining a high FPS (60.3). These results demonstrate that the proposed method retains stable feature extraction and fusion capabilities in complex fusion data, further highlighting the model’s versatility.