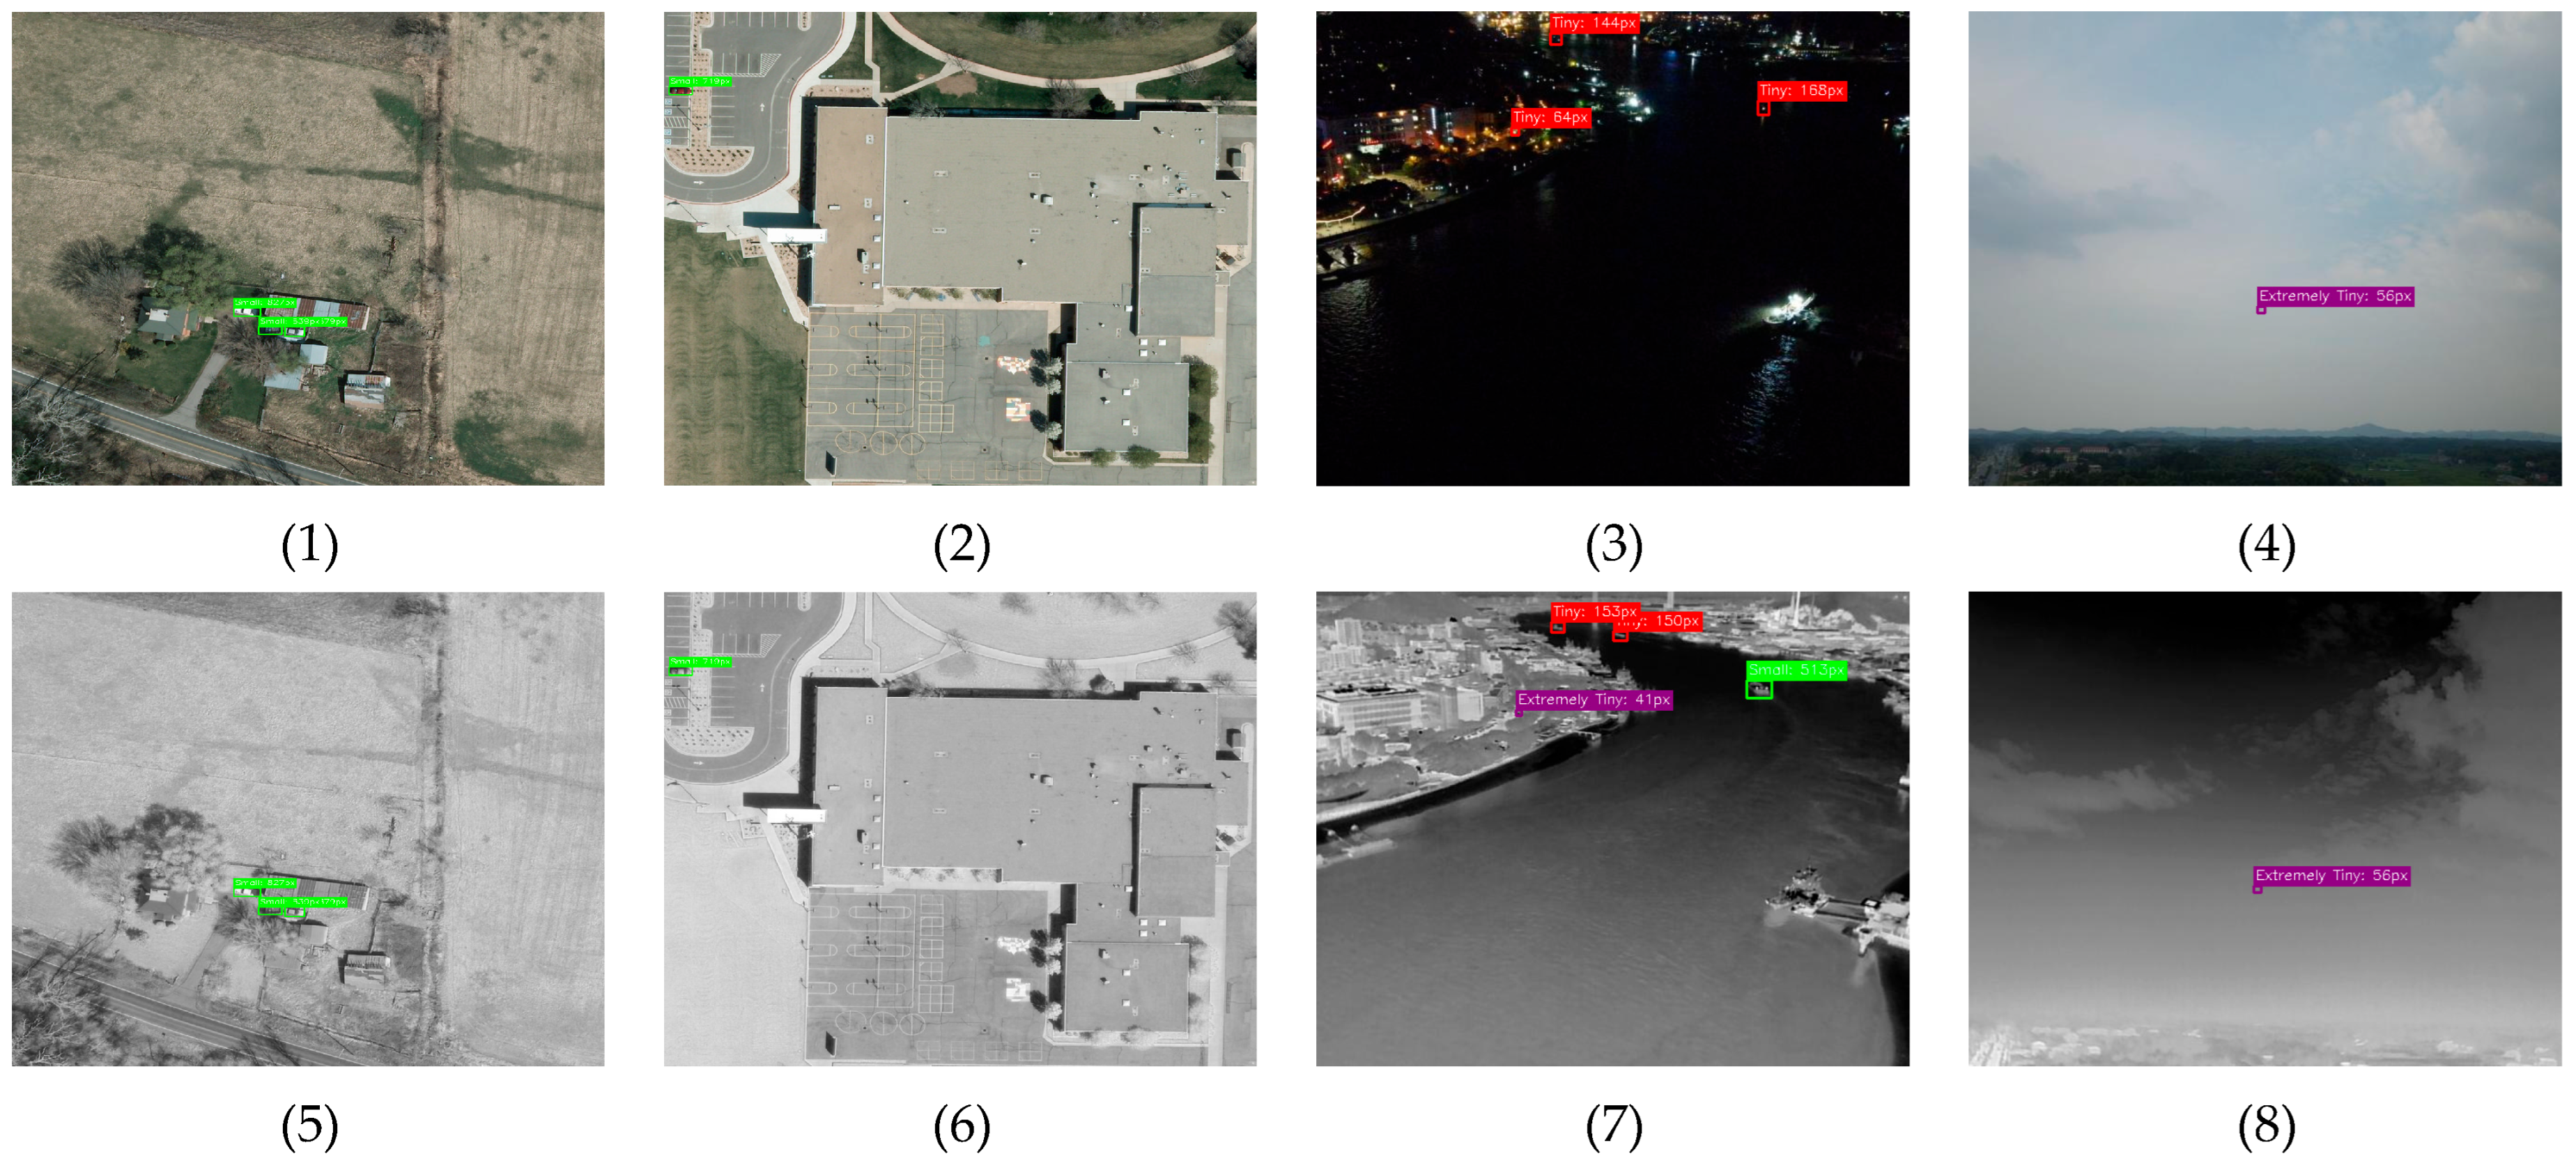
Figure 1.
Examples of aerospace remote sensing images: (1), (5) and (2), (6) are visible light-infrared images captured by a satellite platform, and (3), (7) and (4), (8) are visible light-infrared images captured by an UAV platform.
Figure 1.
Examples of aerospace remote sensing images: (1), (5) and (2), (6) are visible light-infrared images captured by a satellite platform, and (3), (7) and (4), (8) are visible light-infrared images captured by an UAV platform.
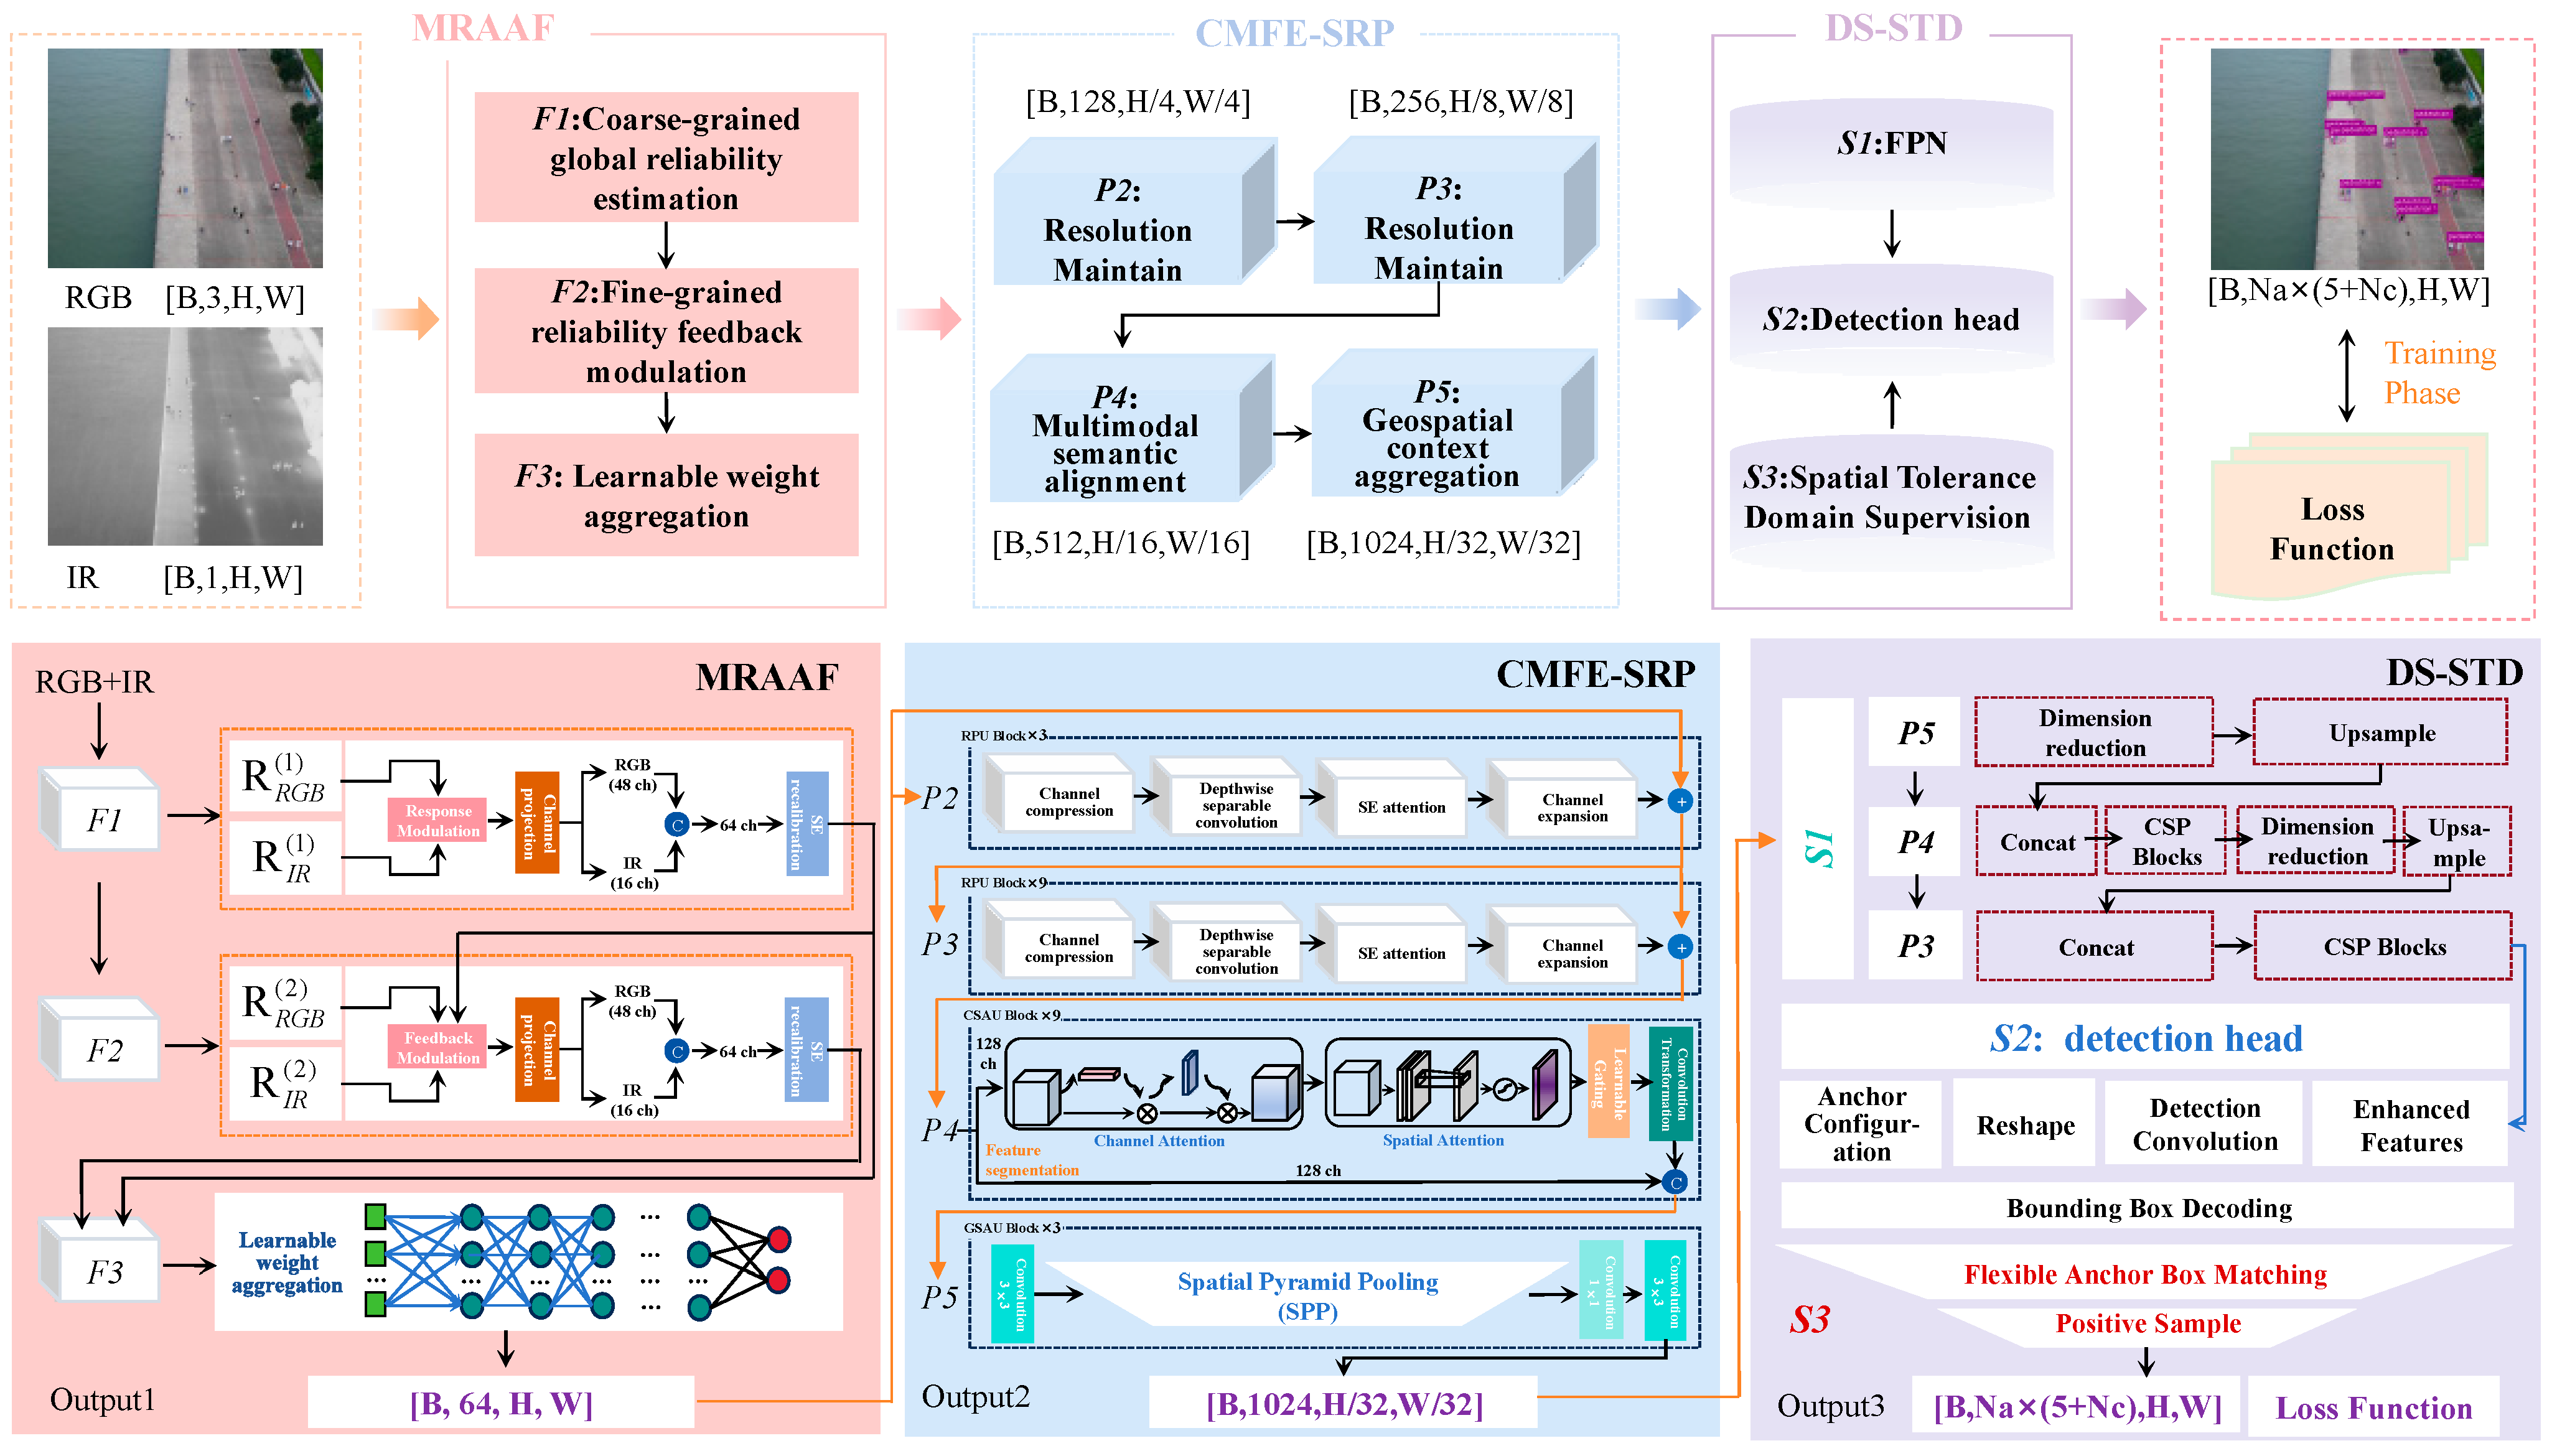
Figure 2.
Overall architecture of RAPT-Net. Left: MRAAF performs two-stage progressive fusion (F1: coarse-grained reliability estimation; F2: fine-grained feedback modulation; F3: learnable aggregation). Middle: CMFE-SRP employs hierarchy-specific processing with RPU at P2/P3 for spatial preservation, CSAU at P4 for semantic alignment, and GSAU at P5 for context aggregation. Right: DS-STD expands positive sample coverage through spatial tolerance domains during training. S1: FPN; S2: detection head; S3: spatial tolerance supervision.
Figure 2.
Overall architecture of RAPT-Net. Left: MRAAF performs two-stage progressive fusion (F1: coarse-grained reliability estimation; F2: fine-grained feedback modulation; F3: learnable aggregation). Middle: CMFE-SRP employs hierarchy-specific processing with RPU at P2/P3 for spatial preservation, CSAU at P4 for semantic alignment, and GSAU at P5 for context aggregation. Right: DS-STD expands positive sample coverage through spatial tolerance domains during training. S1: FPN; S2: detection head; S3: spatial tolerance supervision.
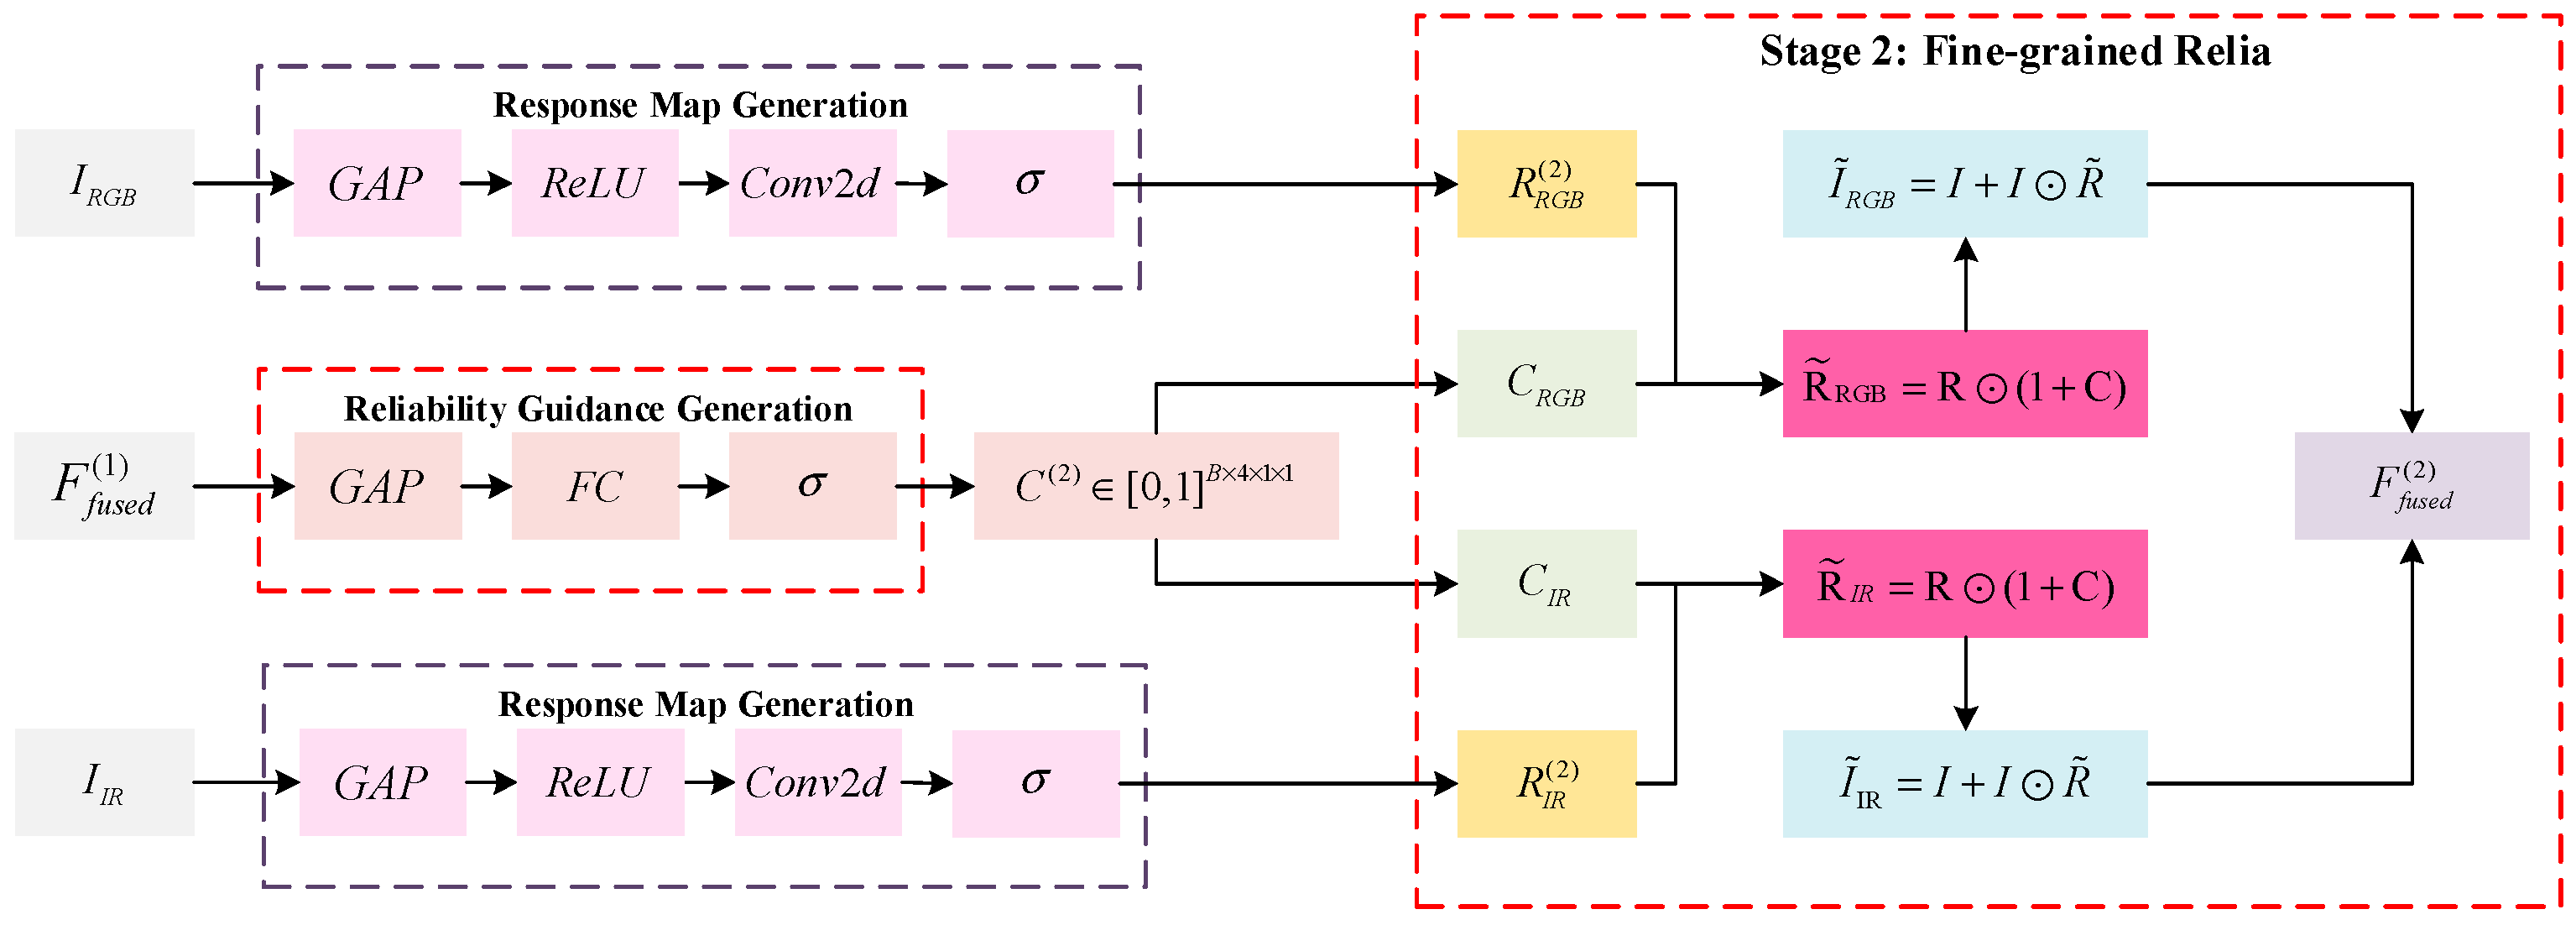
Figure 3.
Reliability-guided feedback modulation in MRAAF. Left: Response map generation for RGB and IR modalities via GAP, ReLU, convolution, and sigmoid activation. Center: Reliability guidance generation from first-stage fused features, producing modality-specific guidance signals. Right: Stage 2 fine-grained reliability modulation with additive scaling factors between 1 and 2, where enhanced features are obtained through element-wise multiplication with residual connection to produce the final fused output.
Figure 3.
Reliability-guided feedback modulation in MRAAF. Left: Response map generation for RGB and IR modalities via GAP, ReLU, convolution, and sigmoid activation. Center: Reliability guidance generation from first-stage fused features, producing modality-specific guidance signals. Right: Stage 2 fine-grained reliability modulation with additive scaling factors between 1 and 2, where enhanced features are obtained through element-wise multiplication with residual connection to produce the final fused output.
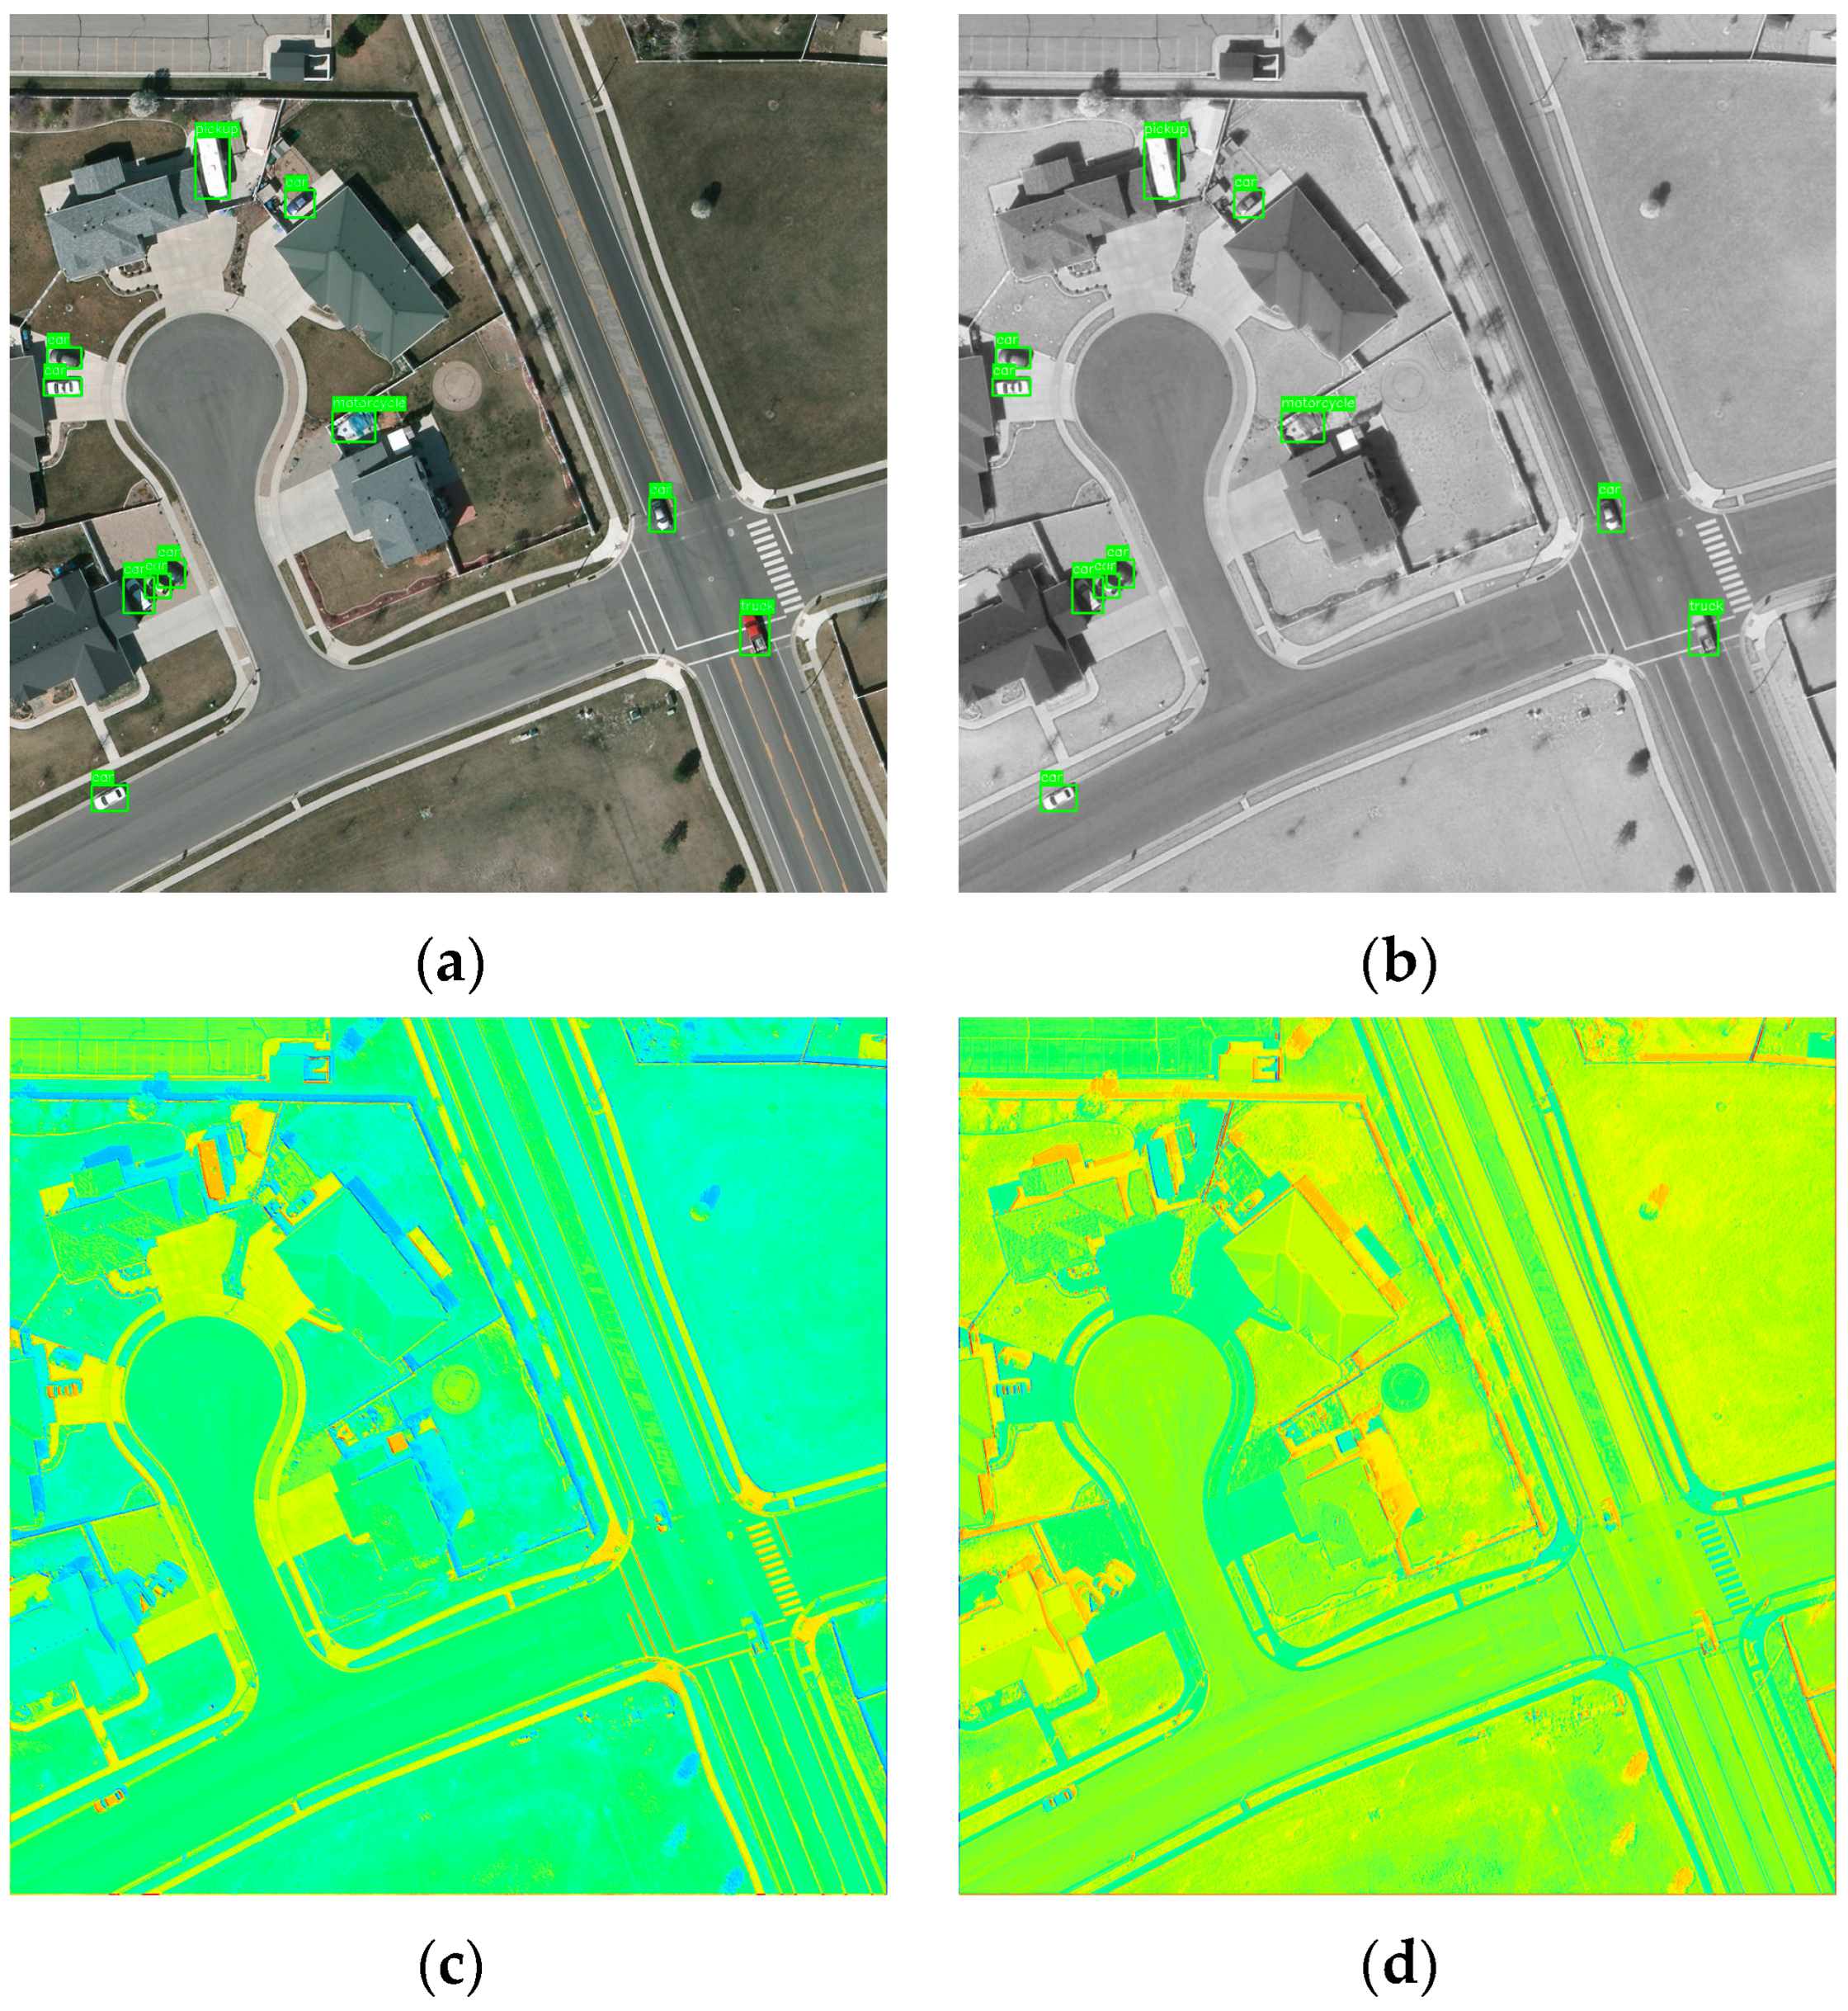
Figure 4.
Physical interpretation of MRAAF reliability modeling under diverse imaging conditions. (a) RGB modality: captures rich spatial texture in well- illuminated regions but exhibits degradation in shadowed areas (e.g., lower-left buildings and vegetation shadows). (b) Infrared modality: maintains stable thermal contrast across all regions regardless of illumination variations, providing complementary information to RGB. (c) Stage 1 fusion: coarse-grained global reliability estimation (Equations (1)–(6)) adaptively balances RGB and infrared contributions, yielding initial fused features with improved robustness. (d) Stage 2 fusion: fine-grained reliability modulation with feedback from Stage 1 (Equations (7)–(11)) further refines spatial adaptation through reliability-guided scaling factors, achieving optimal detection consistency across both well-lit and challenging regions. The progressive enhancement from (c) to (d) demonstrates that MRAAF’s reliability modeling is physics-driven—explicitly responding to observable imaging conditions such as illumination, shadow, and thermal contrast—rather than learning abstract attention weights, with the two-stage feedback mechanism ensuring fusion quality directly influences subsequent modulation.
Figure 4.
Physical interpretation of MRAAF reliability modeling under diverse imaging conditions. (a) RGB modality: captures rich spatial texture in well- illuminated regions but exhibits degradation in shadowed areas (e.g., lower-left buildings and vegetation shadows). (b) Infrared modality: maintains stable thermal contrast across all regions regardless of illumination variations, providing complementary information to RGB. (c) Stage 1 fusion: coarse-grained global reliability estimation (Equations (1)–(6)) adaptively balances RGB and infrared contributions, yielding initial fused features with improved robustness. (d) Stage 2 fusion: fine-grained reliability modulation with feedback from Stage 1 (Equations (7)–(11)) further refines spatial adaptation through reliability-guided scaling factors, achieving optimal detection consistency across both well-lit and challenging regions. The progressive enhancement from (c) to (d) demonstrates that MRAAF’s reliability modeling is physics-driven—explicitly responding to observable imaging conditions such as illumination, shadow, and thermal contrast—rather than learning abstract attention weights, with the two-stage feedback mechanism ensuring fusion quality directly influences subsequent modulation.

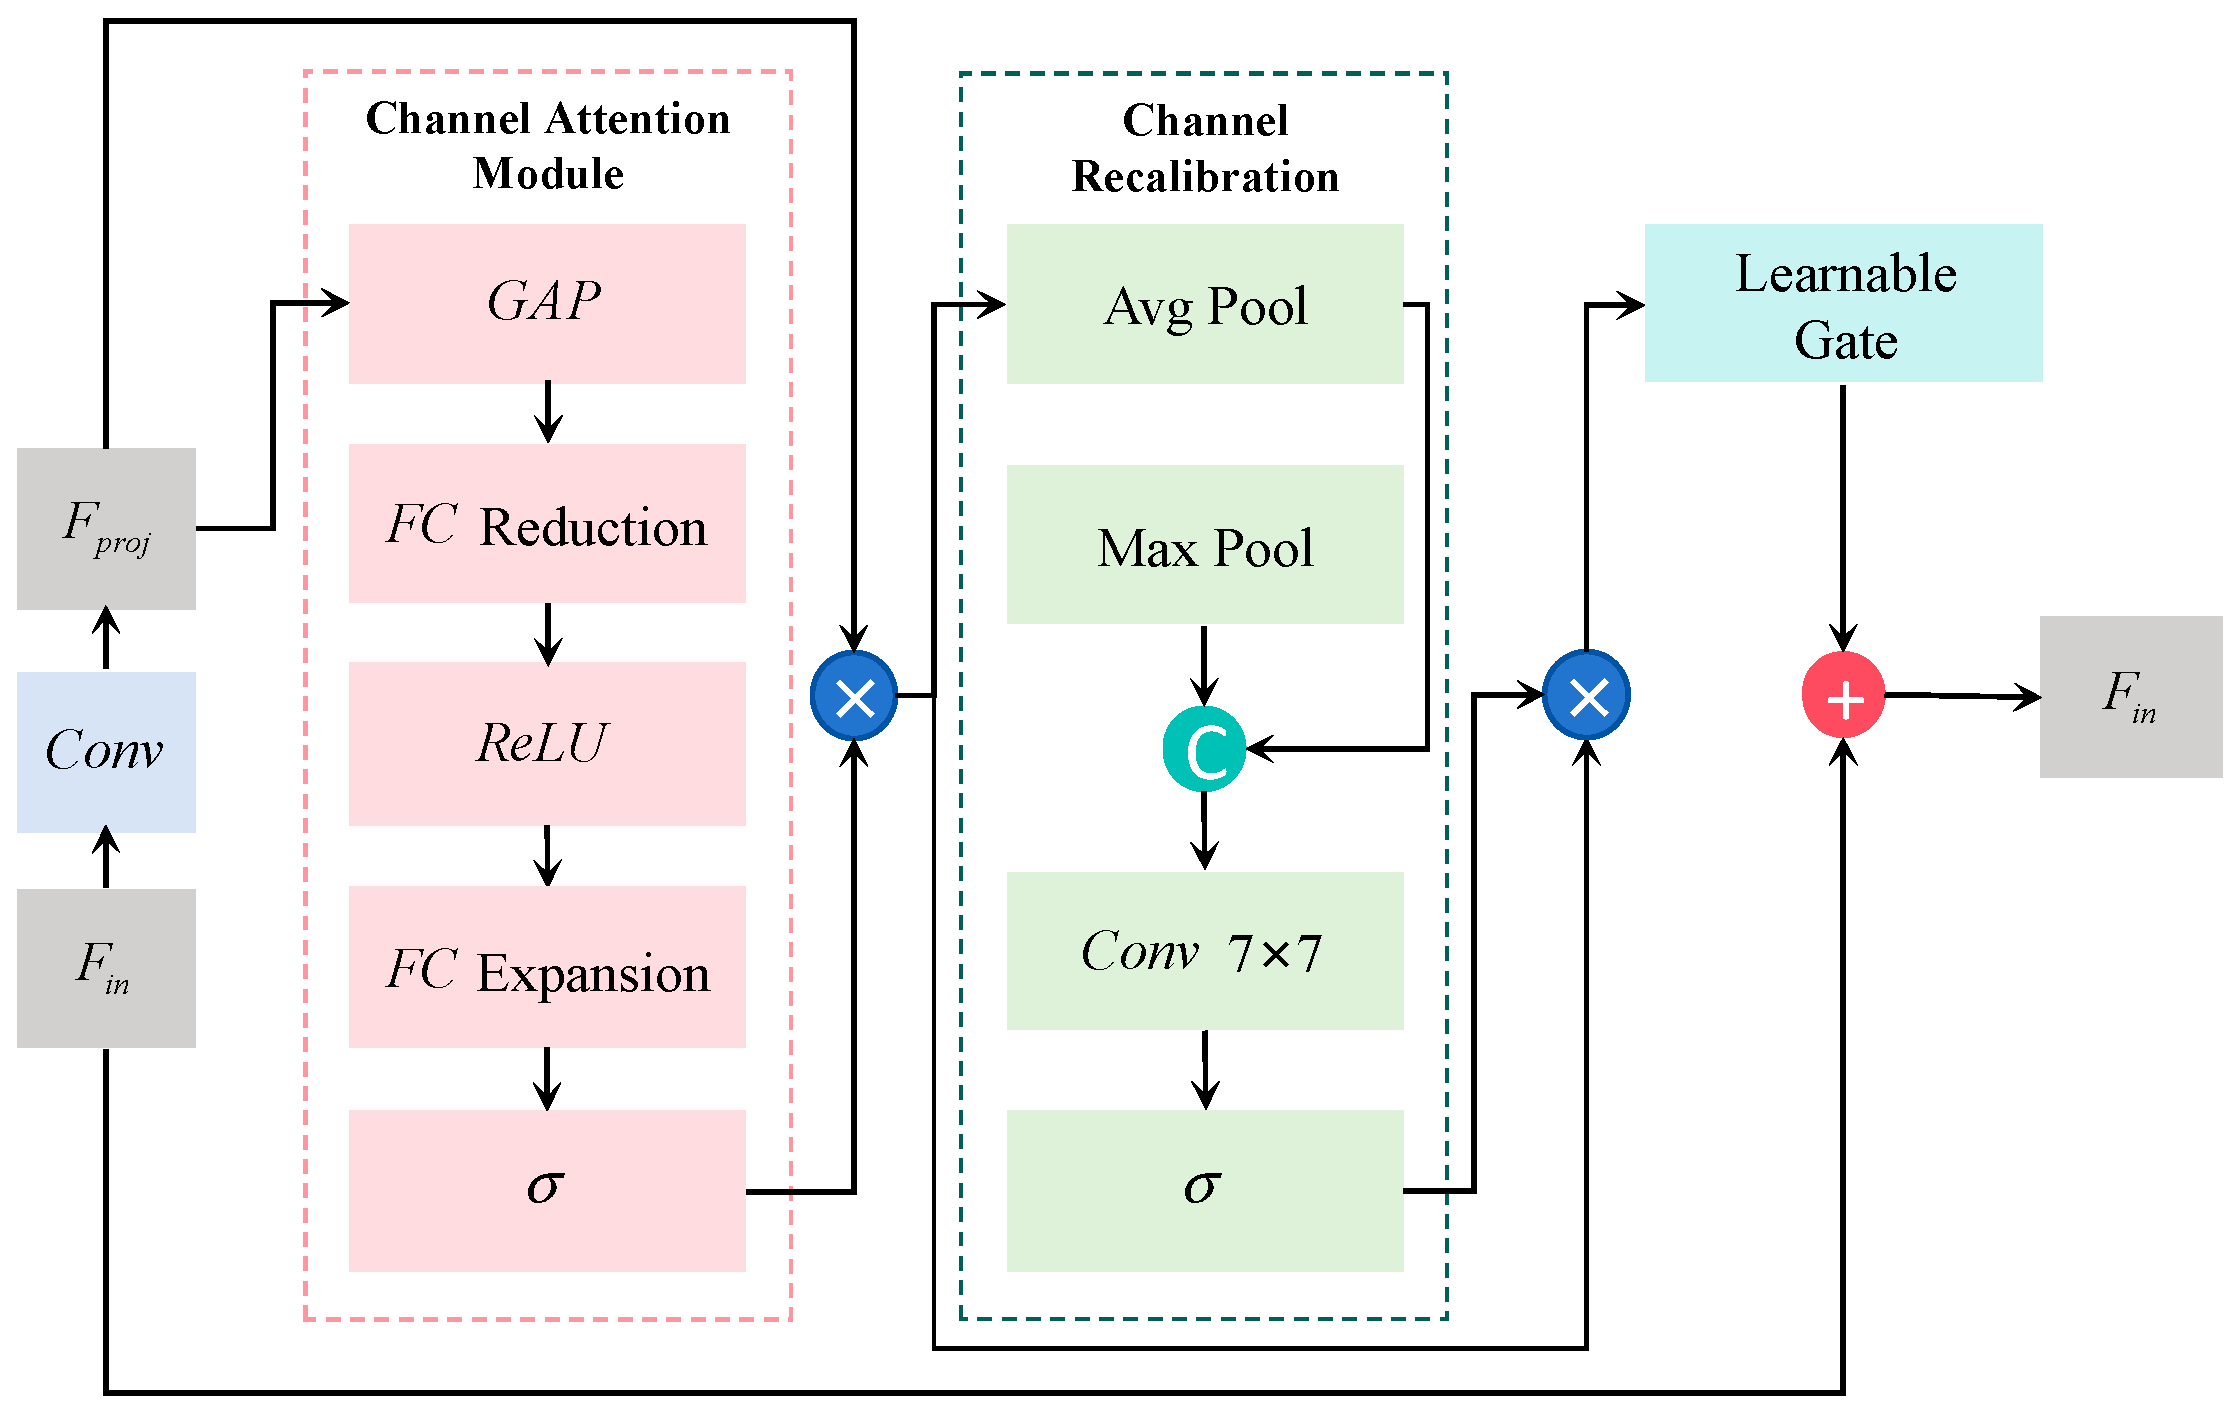
Figure 5.
Cross-modal Semantic Alignment Unit (CSAU) with sequential channel-spatial attention and learnable gating fusion. Blue dashed box: Channel Attention Module with GAP, FC layers, and sigmoid activation for channel-wise recalibration. Green dashed box: Spatial attention via parallel Average Pooling and Max Pooling branches, concatenation, 7 × 7 convolution, and sigmoid activation. Right: Learnable gating mechanism fuses attention-enhanced features with residual input through adaptive weighting.
Figure 5.
Cross-modal Semantic Alignment Unit (CSAU) with sequential channel-spatial attention and learnable gating fusion. Blue dashed box: Channel Attention Module with GAP, FC layers, and sigmoid activation for channel-wise recalibration. Green dashed box: Spatial attention via parallel Average Pooling and Max Pooling branches, concatenation, 7 × 7 convolution, and sigmoid activation. Right: Learnable gating mechanism fuses attention-enhanced features with residual input through adaptive weighting.
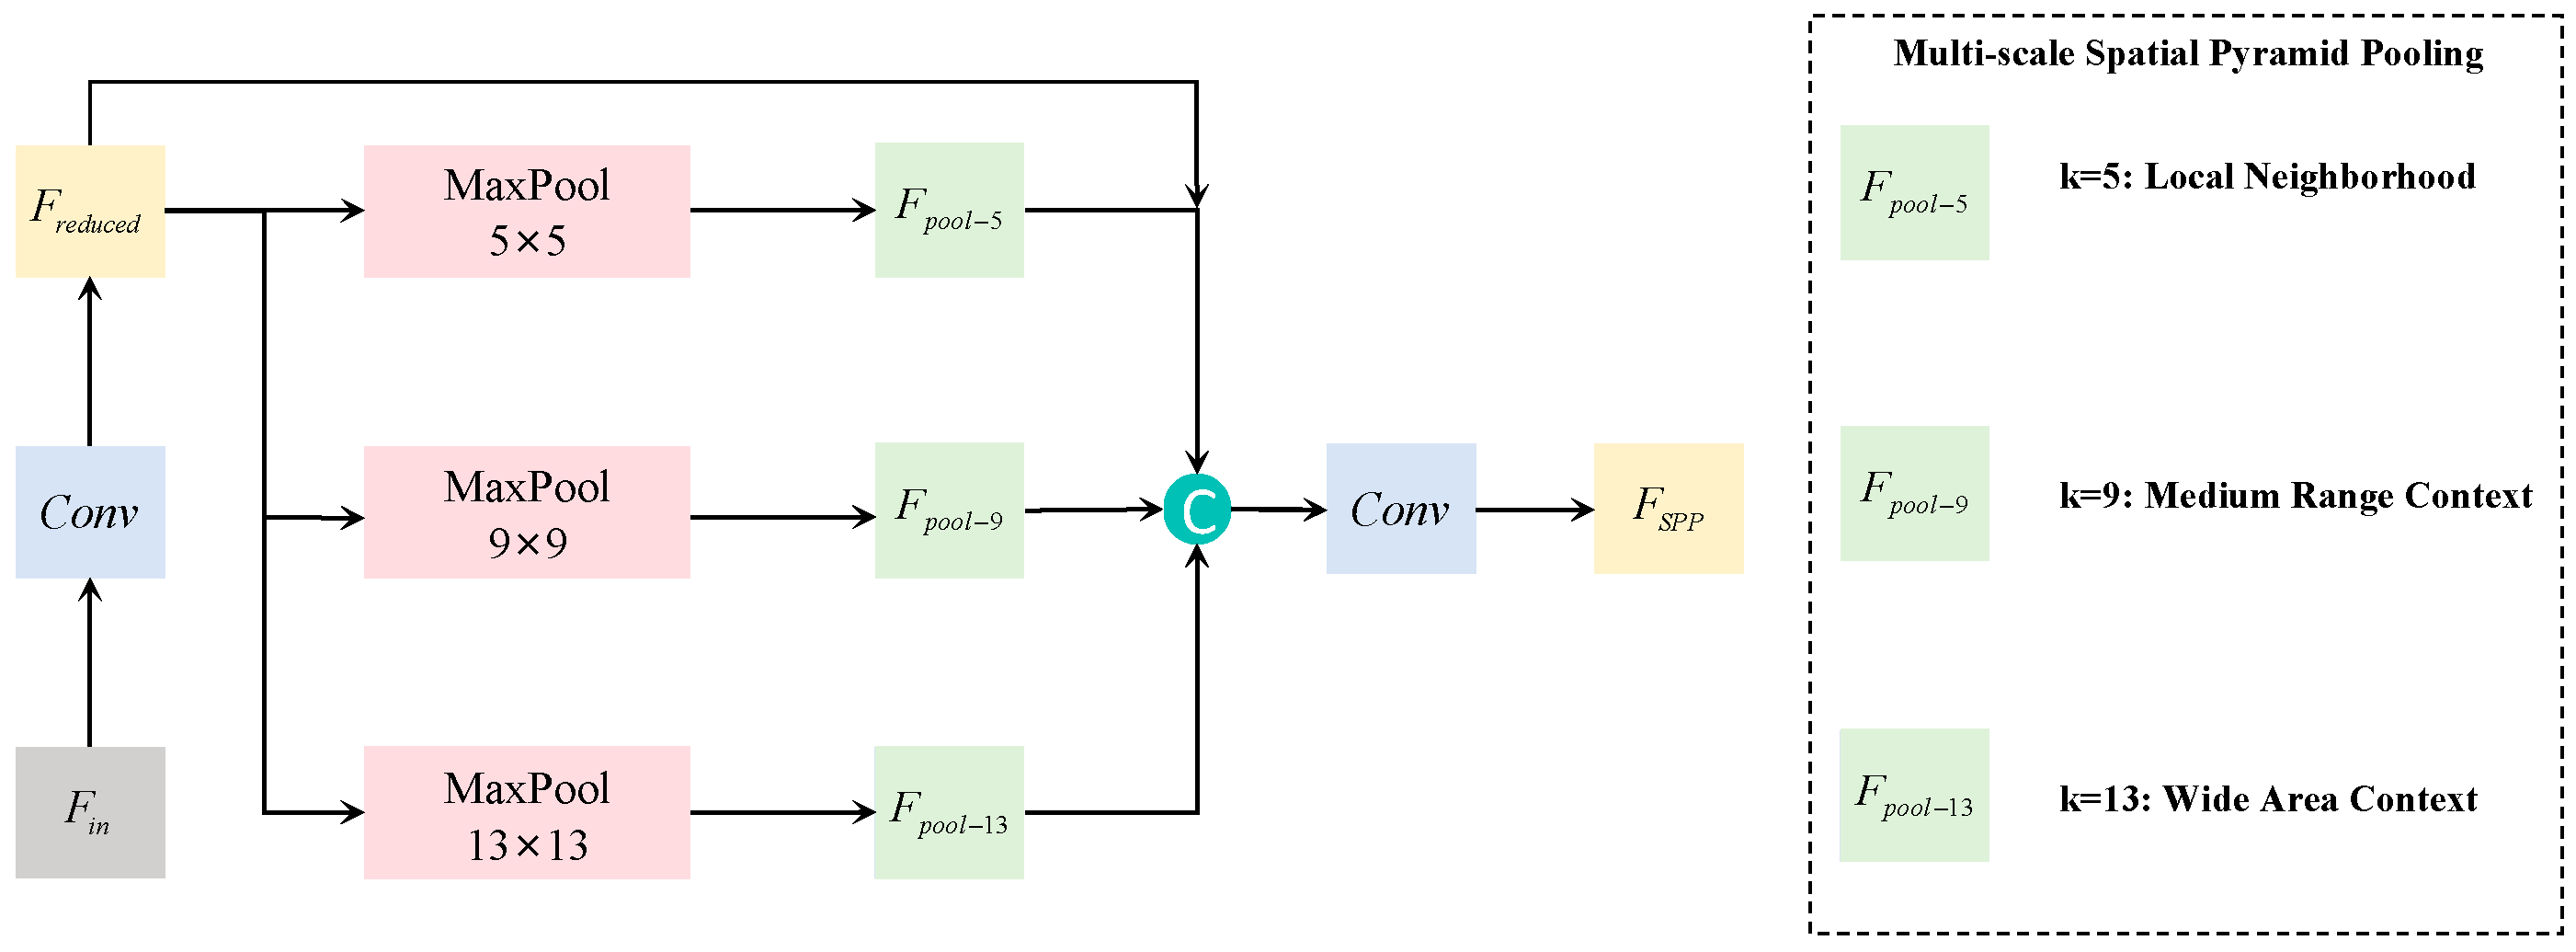
Figure 6.
Geographic Spatial Aggregation Unit (GSAU) with multi-scale spatial pyramid pooling. Input features are reduced via 1 × 1 convolution, then processed by three parallel Max Pooling branches with kernel sizes of 5 × 5, 9 × 9, and 13 × 13, capturing local neighborhood, medium-range context, and wide-area context, respectively. The pooled features are concatenated with reduced features and fused through convolution to aggregate multi-scale geospatial information.
Figure 6.
Geographic Spatial Aggregation Unit (GSAU) with multi-scale spatial pyramid pooling. Input features are reduced via 1 × 1 convolution, then processed by three parallel Max Pooling branches with kernel sizes of 5 × 5, 9 × 9, and 13 × 13, capturing local neighborhood, medium-range context, and wide-area context, respectively. The pooled features are concatenated with reduced features and fused through convolution to aggregate multi-scale geospatial information.
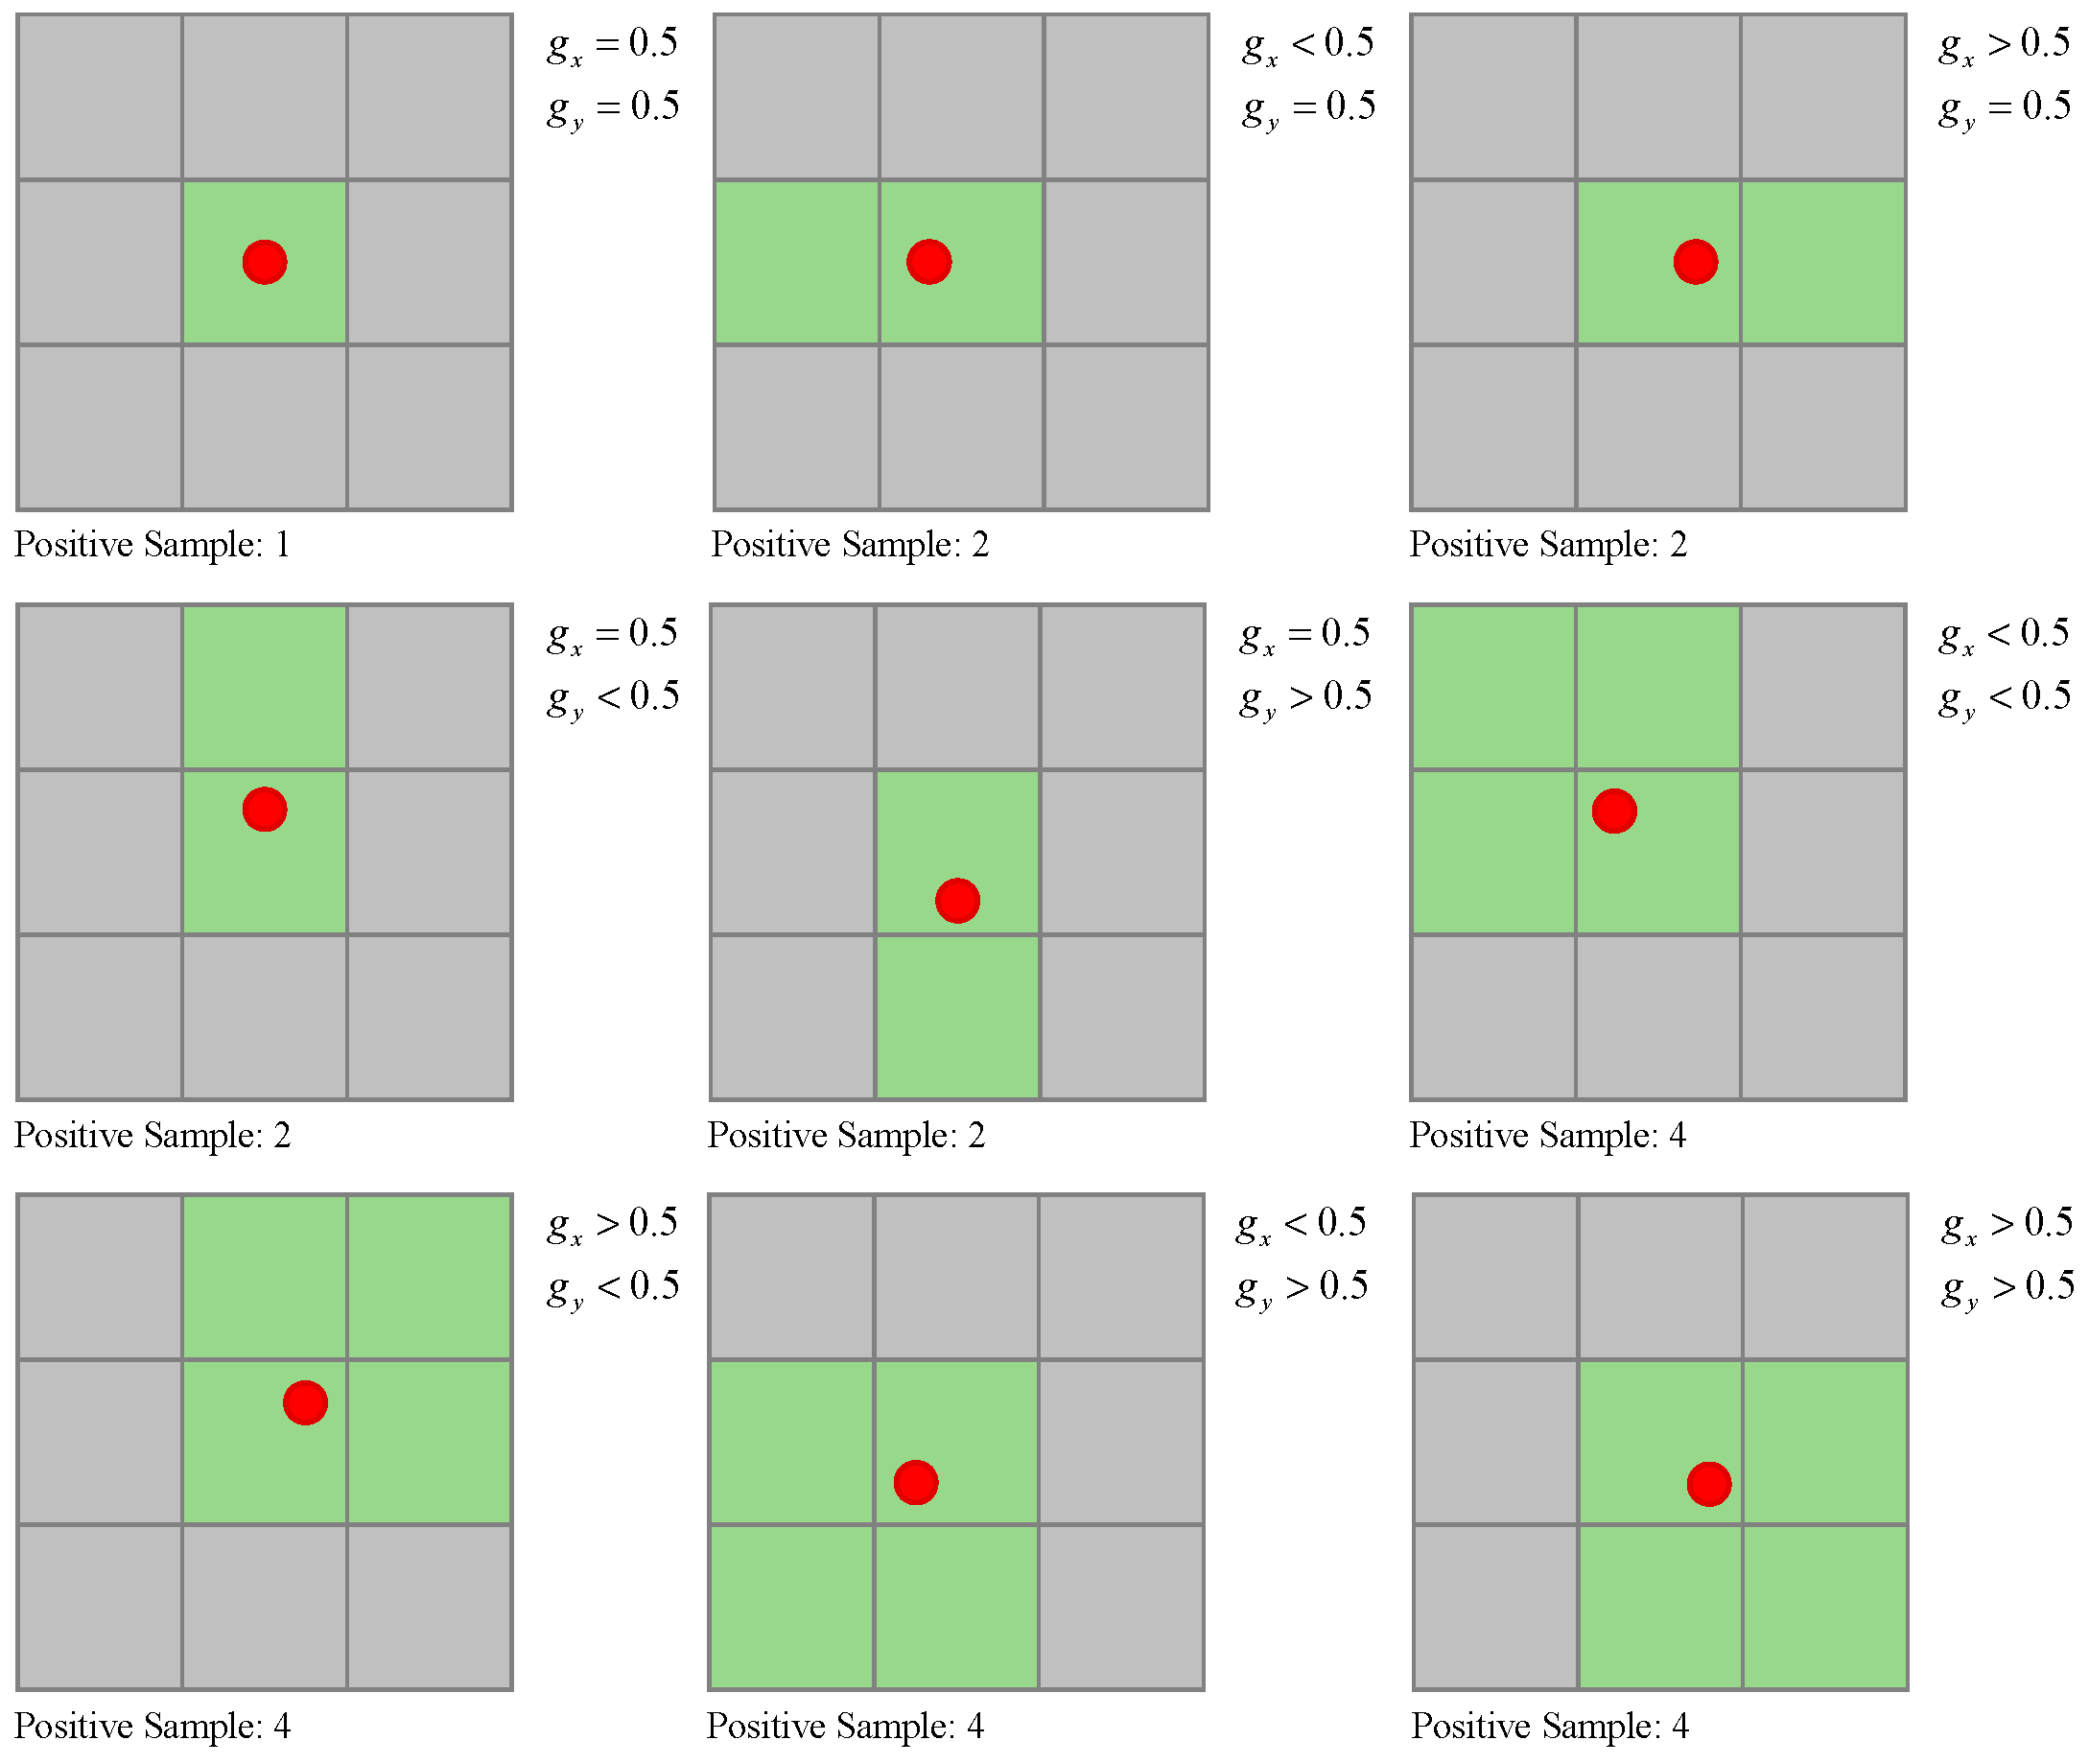
Figure 7.
Boundary Proximity Extension Rule for positive sample expansion. Red dots indicate target centers, green cells represent positive samples, and gray cells represent negative samples. Parameters and denote relative target center positions within grid cells. Center positions ( = 0.5, = 0.5) yield 1 positive sample; boundary proximity in one dimension yields 2 positive samples; corner proximity yields 4 positive samples, achieving up to 300% improvement in positive sample coverage.
Figure 7.
Boundary Proximity Extension Rule for positive sample expansion. Red dots indicate target centers, green cells represent positive samples, and gray cells represent negative samples. Parameters and denote relative target center positions within grid cells. Center positions ( = 0.5, = 0.5) yield 1 positive sample; boundary proximity in one dimension yields 2 positive samples; corner proximity yields 4 positive samples, achieving up to 300% improvement in positive sample coverage.
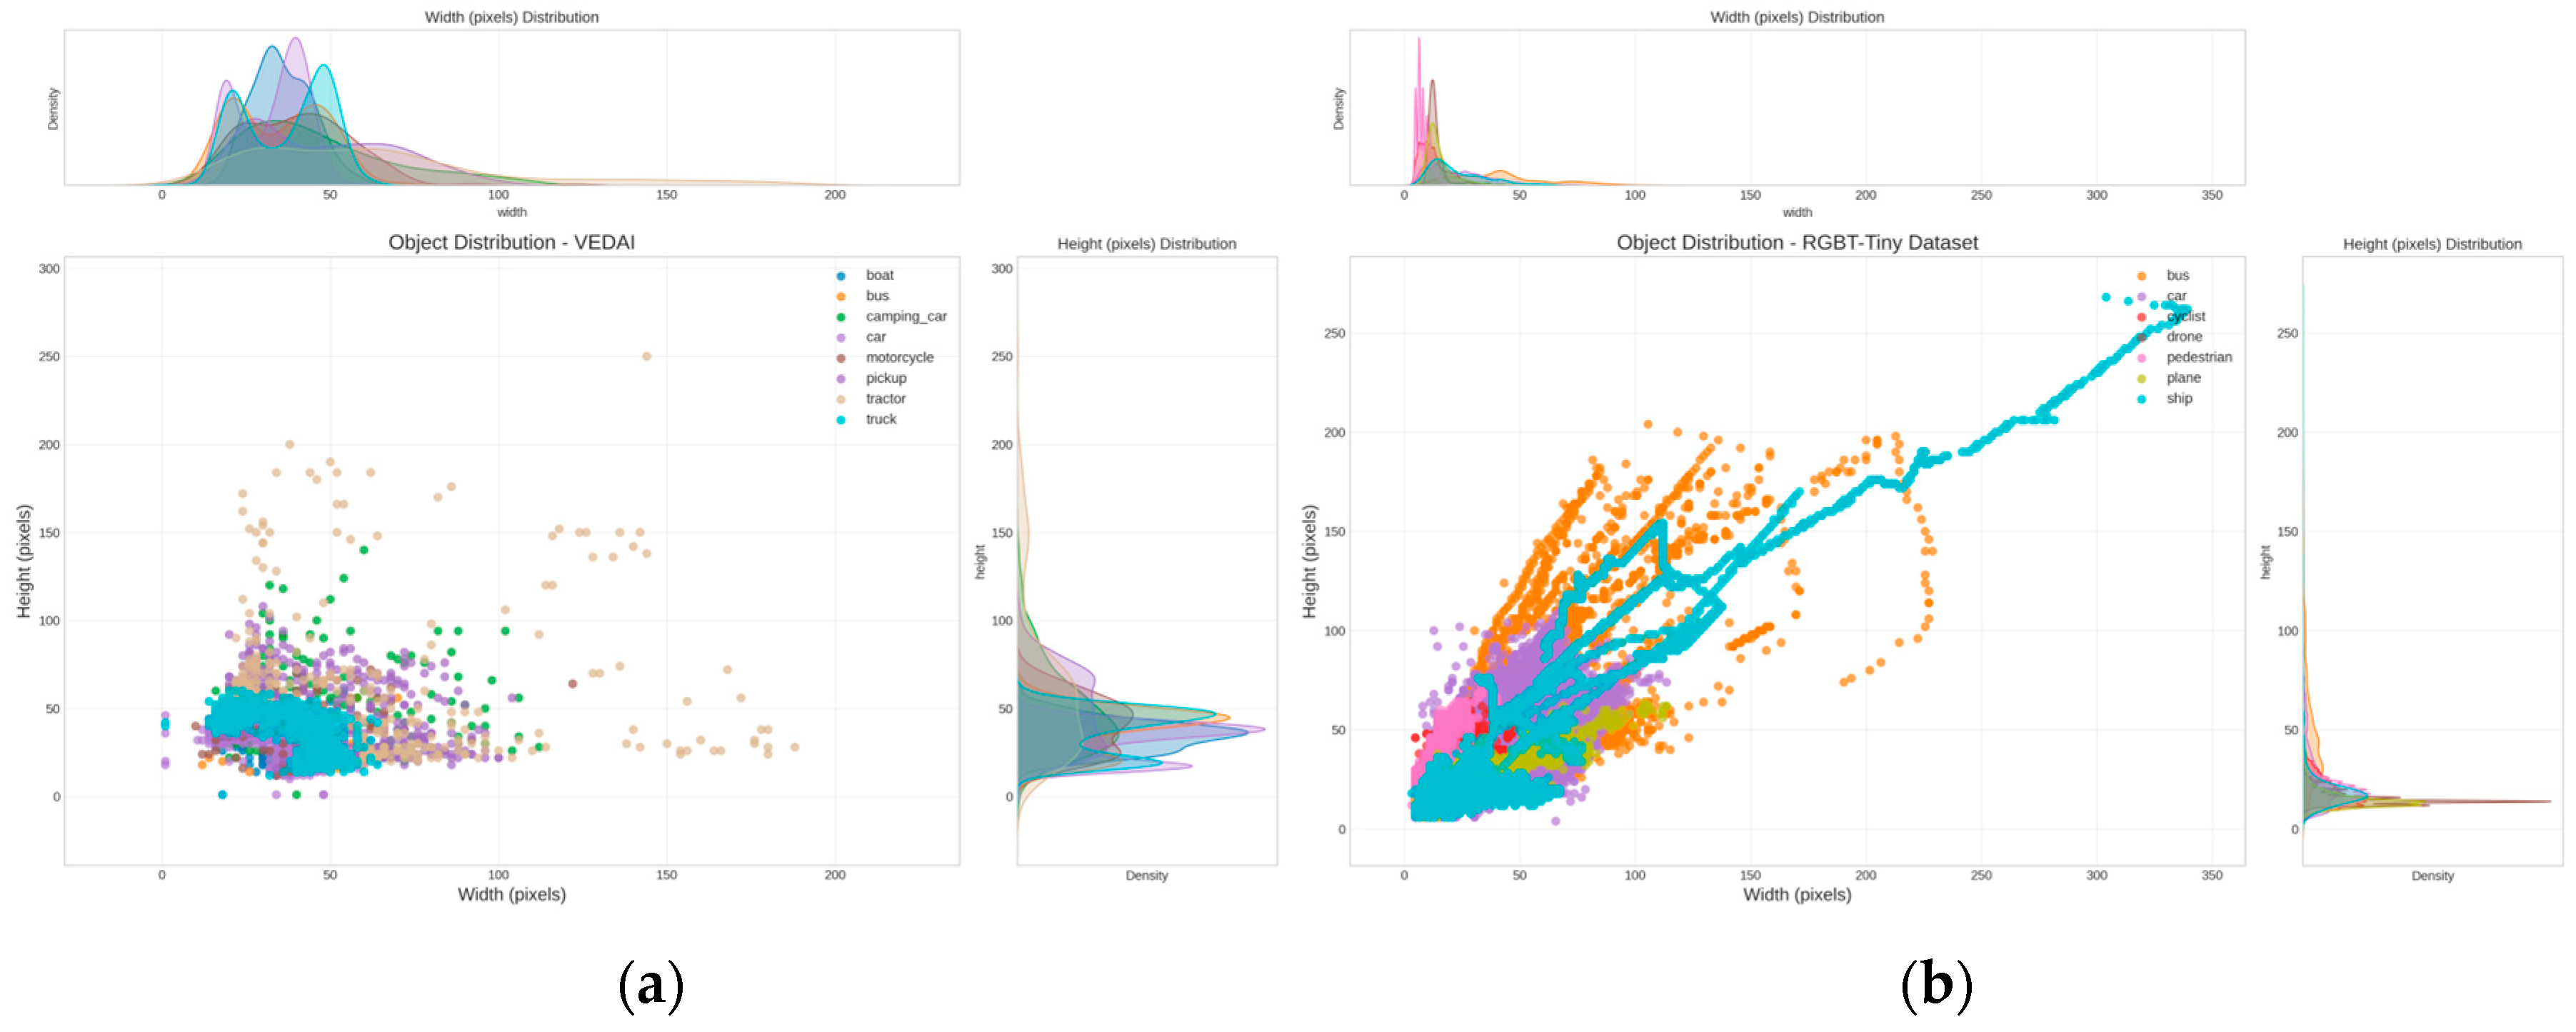
Figure 8.
Object size distribution characteristics in multispectral detection datasets. (a) VEDAI dataset with eight vehicle classes, showing targets concentrated in 20–100 pixel width and 10–100 pixel height ranges, reflecting stable high-altitude satellite imaging geometry. (b) RGBT-Tiny dataset with seven object classes, exhibiting strong concentration below 50 pixels in both dimensions with a diagonal aspect ratio pattern, reflecting extreme scale compression from UAV platforms at 60–100 m altitude where over 81% of targets are smaller than 16 × 16 pixels.
Figure 8.
Object size distribution characteristics in multispectral detection datasets. (a) VEDAI dataset with eight vehicle classes, showing targets concentrated in 20–100 pixel width and 10–100 pixel height ranges, reflecting stable high-altitude satellite imaging geometry. (b) RGBT-Tiny dataset with seven object classes, exhibiting strong concentration below 50 pixels in both dimensions with a diagonal aspect ratio pattern, reflecting extreme scale compression from UAV platforms at 60–100 m altitude where over 81% of targets are smaller than 16 × 16 pixels.
Figure 9.
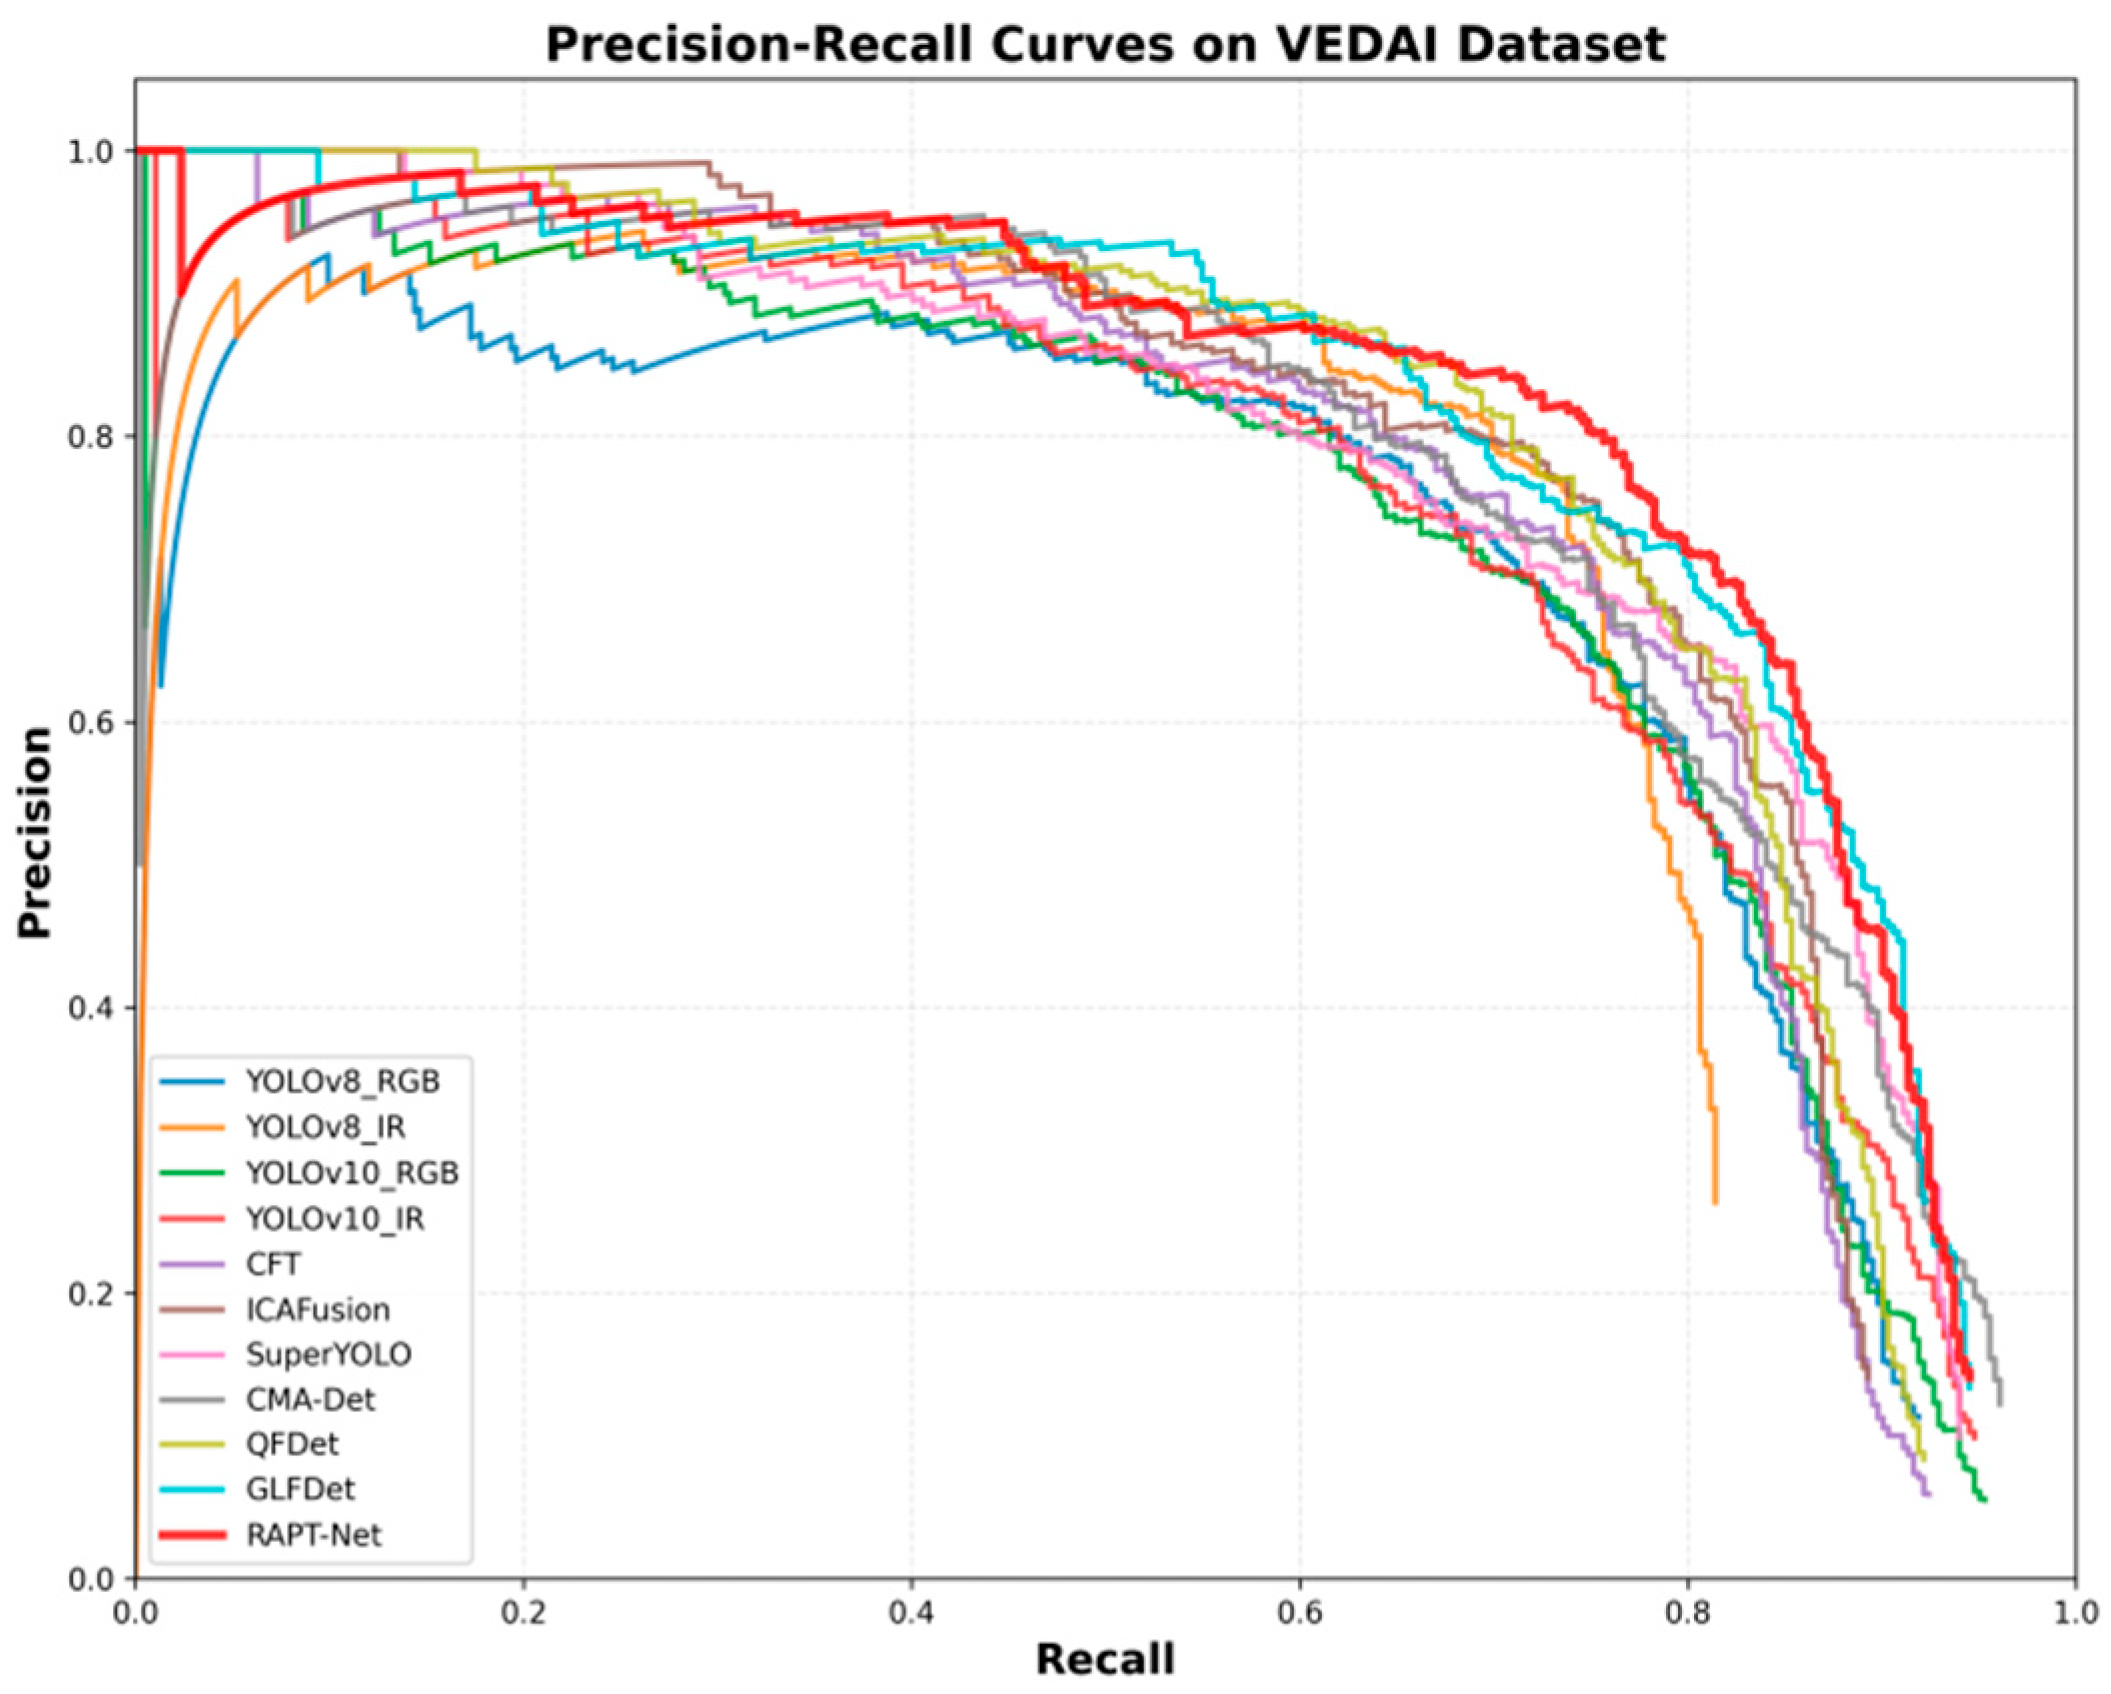
Precision–Recall (PR) curves of different methods on the VEDAI dataset. The compared methods include single-modality detectors (YOLOv8_RGB, YOLOv8_IR, YOLOv10_RGB, YOLOv10_IR), general multimodal fusion methods (CFT, ICAFusion, CMA-Det, QFDet, GLFDet), and remote sensing-optimized detectors (SuperYOLO and the proposed RAPT-Net). The curves exhibit approximate hierarchical stratification: RAPT-Net, SuperYOLO, and GLFDet form the top tier with frequent crossovers among them; CFT, QFDet, and ICAFusion constitute the middle tier; single-modality detectors occupy the bottom tier, showing rapid precision decay as recall increases. Although GLFDet shows competitive or slightly higher precision in certain recall ranges, RAPT-Net achieves the best overall performance in terms of area under the curve. Notably, in the high recall region (>0.6), RAPT-Net maintains a more gradual descent compared to other methods, reflecting its superior capability in retrieving difficult samples without introducing excessive false positives.
Figure 9.
Precision–Recall (PR) curves of different methods on the VEDAI dataset. The compared methods include single-modality detectors (YOLOv8_RGB, YOLOv8_IR, YOLOv10_RGB, YOLOv10_IR), general multimodal fusion methods (CFT, ICAFusion, CMA-Det, QFDet, GLFDet), and remote sensing-optimized detectors (SuperYOLO and the proposed RAPT-Net). The curves exhibit approximate hierarchical stratification: RAPT-Net, SuperYOLO, and GLFDet form the top tier with frequent crossovers among them; CFT, QFDet, and ICAFusion constitute the middle tier; single-modality detectors occupy the bottom tier, showing rapid precision decay as recall increases. Although GLFDet shows competitive or slightly higher precision in certain recall ranges, RAPT-Net achieves the best overall performance in terms of area under the curve. Notably, in the high recall region (>0.6), RAPT-Net maintains a more gradual descent compared to other methods, reflecting its superior capability in retrieving difficult samples without introducing excessive false positives.

Figure 10.
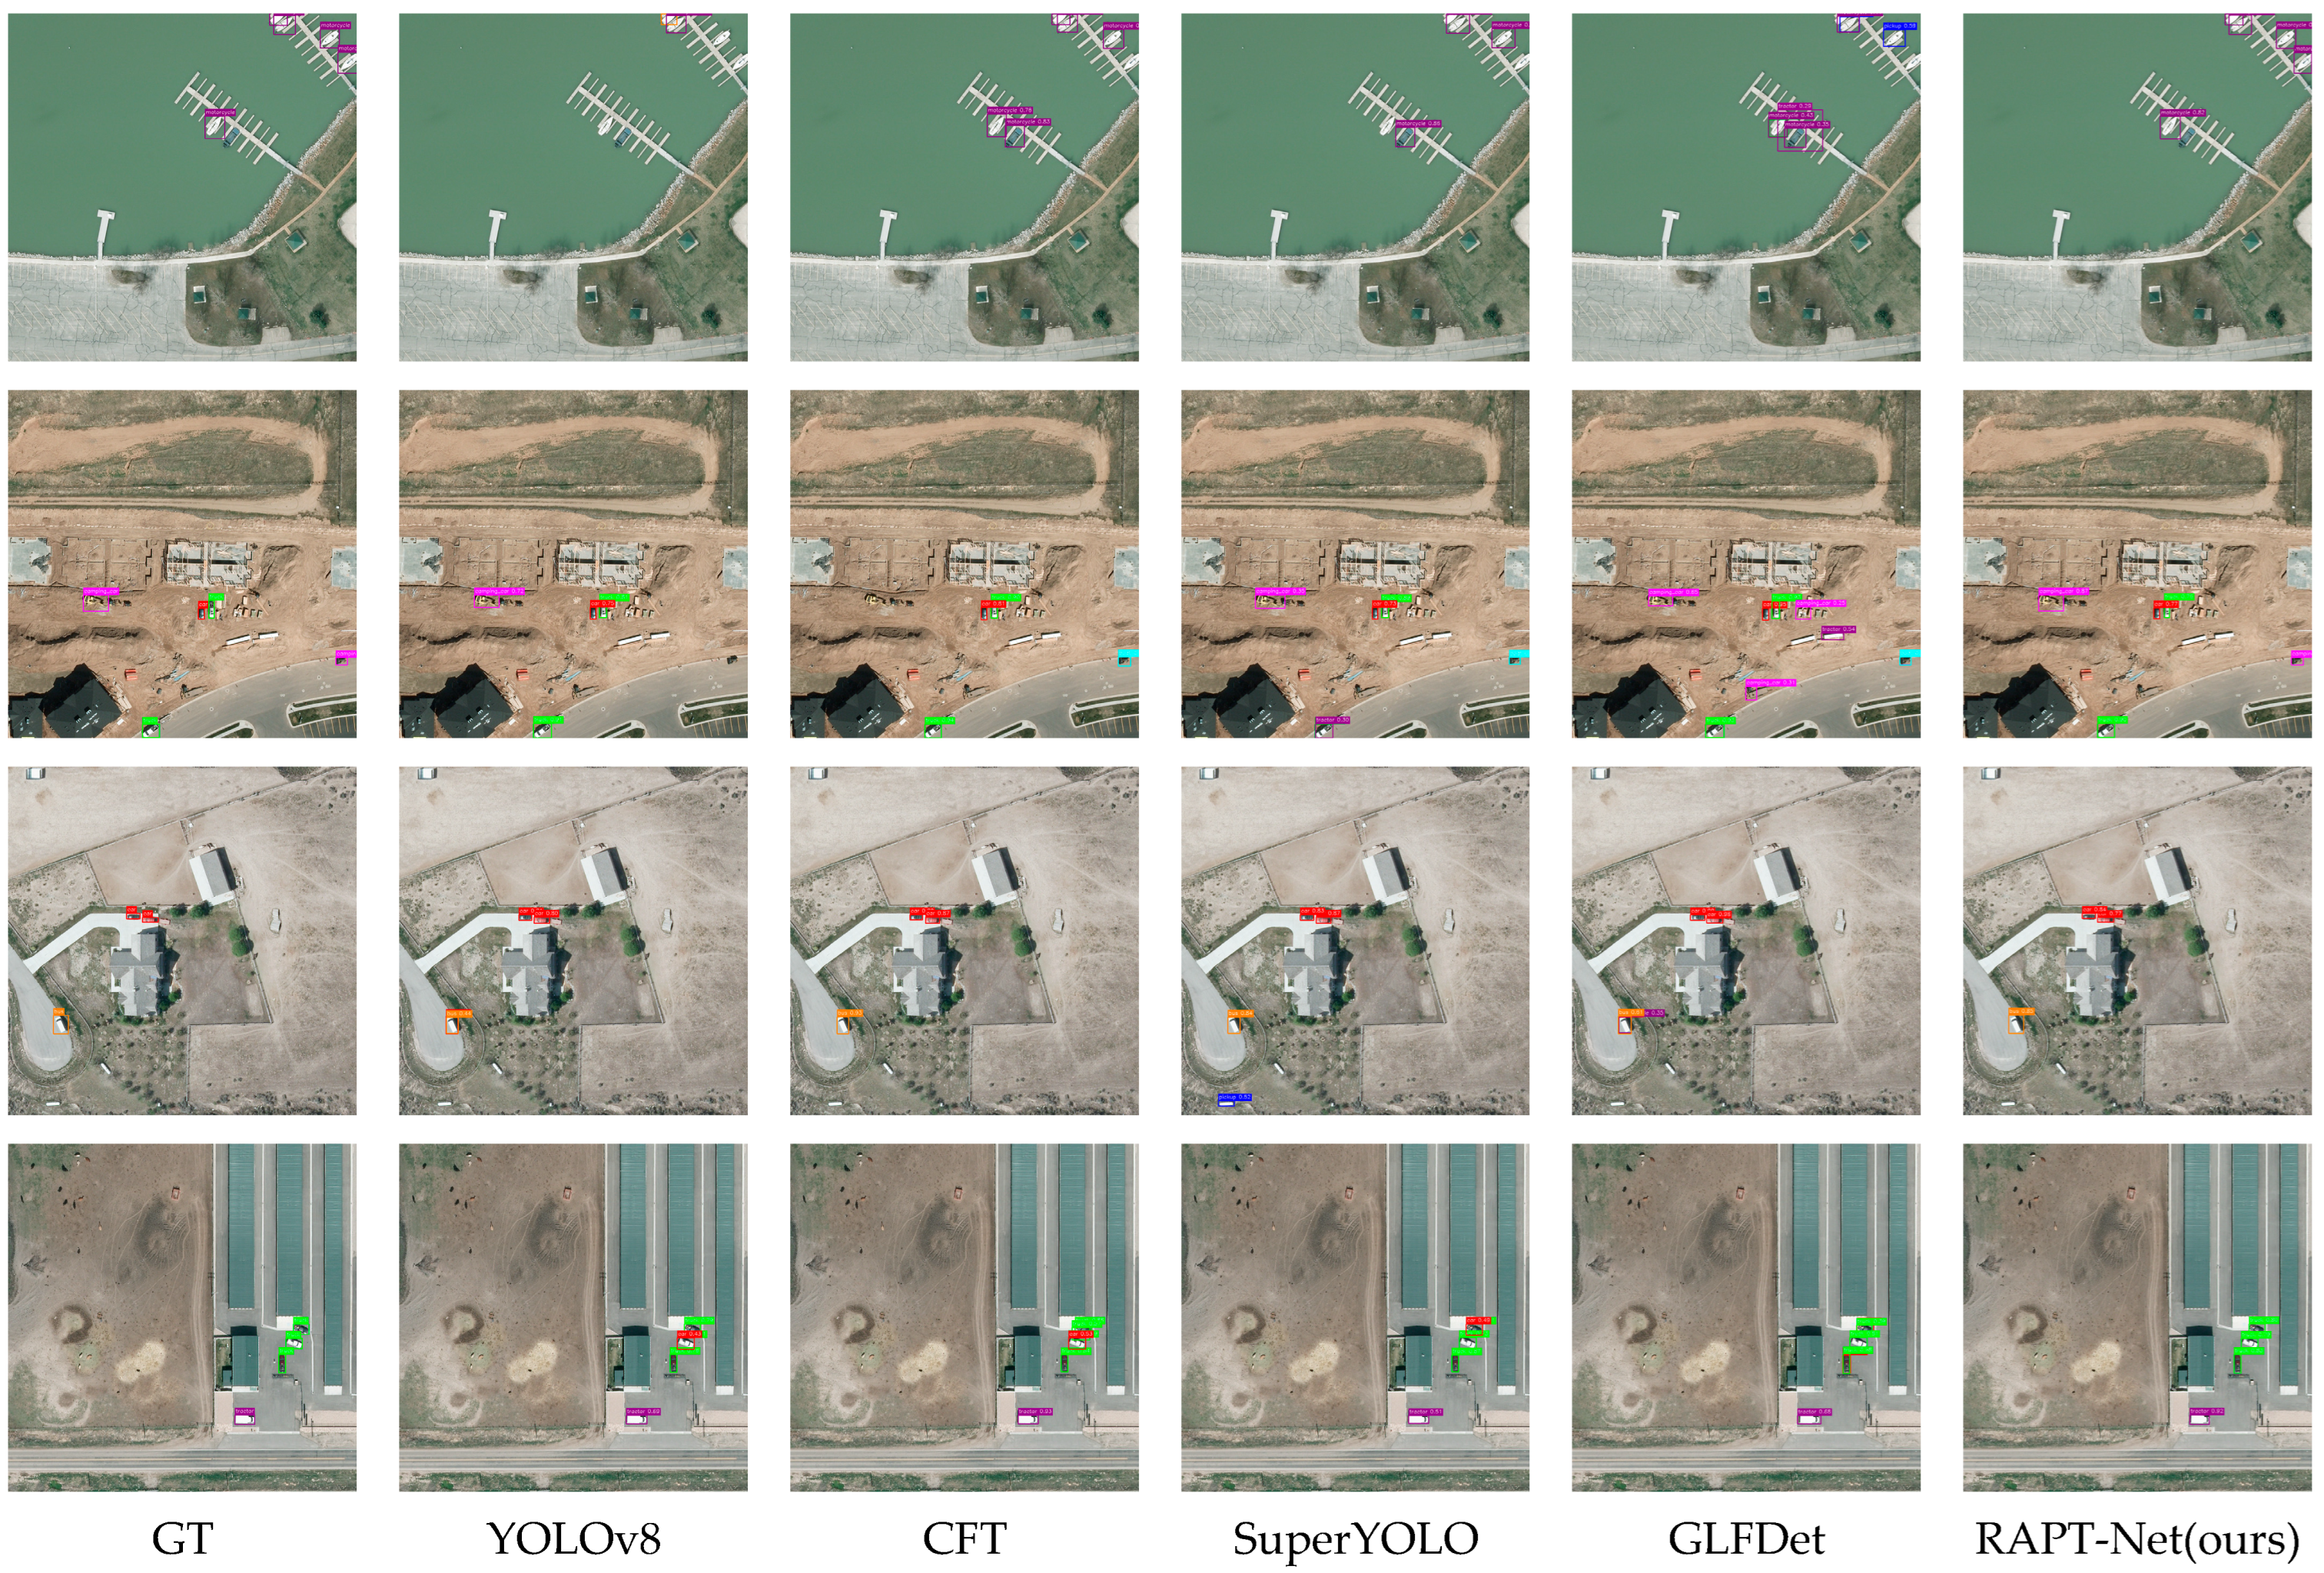
Qualitative detection results of different methods on the VEDAI dataset. Each row displays the same scene processed by different methods, with columns arranged as Ground Truth (GT), YOLOv8, CFT, SuperYOLO, GLFDet, and RAPT-Net (ours). Row 1 shows a waterside scene containing vessels, where RAPT-Net generates clean and accurate bounding boxes, while YOLOv8 exhibits obvious missed detections and GLFDet produces severe false positives. Row 2 presents a parking area with multiple vehicles, where RAPT-Net’s detection boxes precisely cover all targets with consistent box sizes, whereas other methods show missed detections or redundant boxes. Row 3 depicts a scene with cluttered line patterns in the background, where both GLFDet and SuperYOLO exhibit false detections triggered by background interference, while RAPT-Net maintains clean outputs focusing only on actual targets. Row 4 illustrates a complex scene with scattered vehicles, where RAPT-Net consistently generates correct detection boxes, while all competing methods exhibit false detections. Across all visualizations, RAPT-Net demonstrates the most consistent detection behavior with minimal background interference and precise target localization, validating the effectiveness of the proposed MRAAF, CMFE-SRP, and DS-STD modules.
Figure 10.
Qualitative detection results of different methods on the VEDAI dataset. Each row displays the same scene processed by different methods, with columns arranged as Ground Truth (GT), YOLOv8, CFT, SuperYOLO, GLFDet, and RAPT-Net (ours). Row 1 shows a waterside scene containing vessels, where RAPT-Net generates clean and accurate bounding boxes, while YOLOv8 exhibits obvious missed detections and GLFDet produces severe false positives. Row 2 presents a parking area with multiple vehicles, where RAPT-Net’s detection boxes precisely cover all targets with consistent box sizes, whereas other methods show missed detections or redundant boxes. Row 3 depicts a scene with cluttered line patterns in the background, where both GLFDet and SuperYOLO exhibit false detections triggered by background interference, while RAPT-Net maintains clean outputs focusing only on actual targets. Row 4 illustrates a complex scene with scattered vehicles, where RAPT-Net consistently generates correct detection boxes, while all competing methods exhibit false detections. Across all visualizations, RAPT-Net demonstrates the most consistent detection behavior with minimal background interference and precise target localization, validating the effectiveness of the proposed MRAAF, CMFE-SRP, and DS-STD modules.

Figure 11.
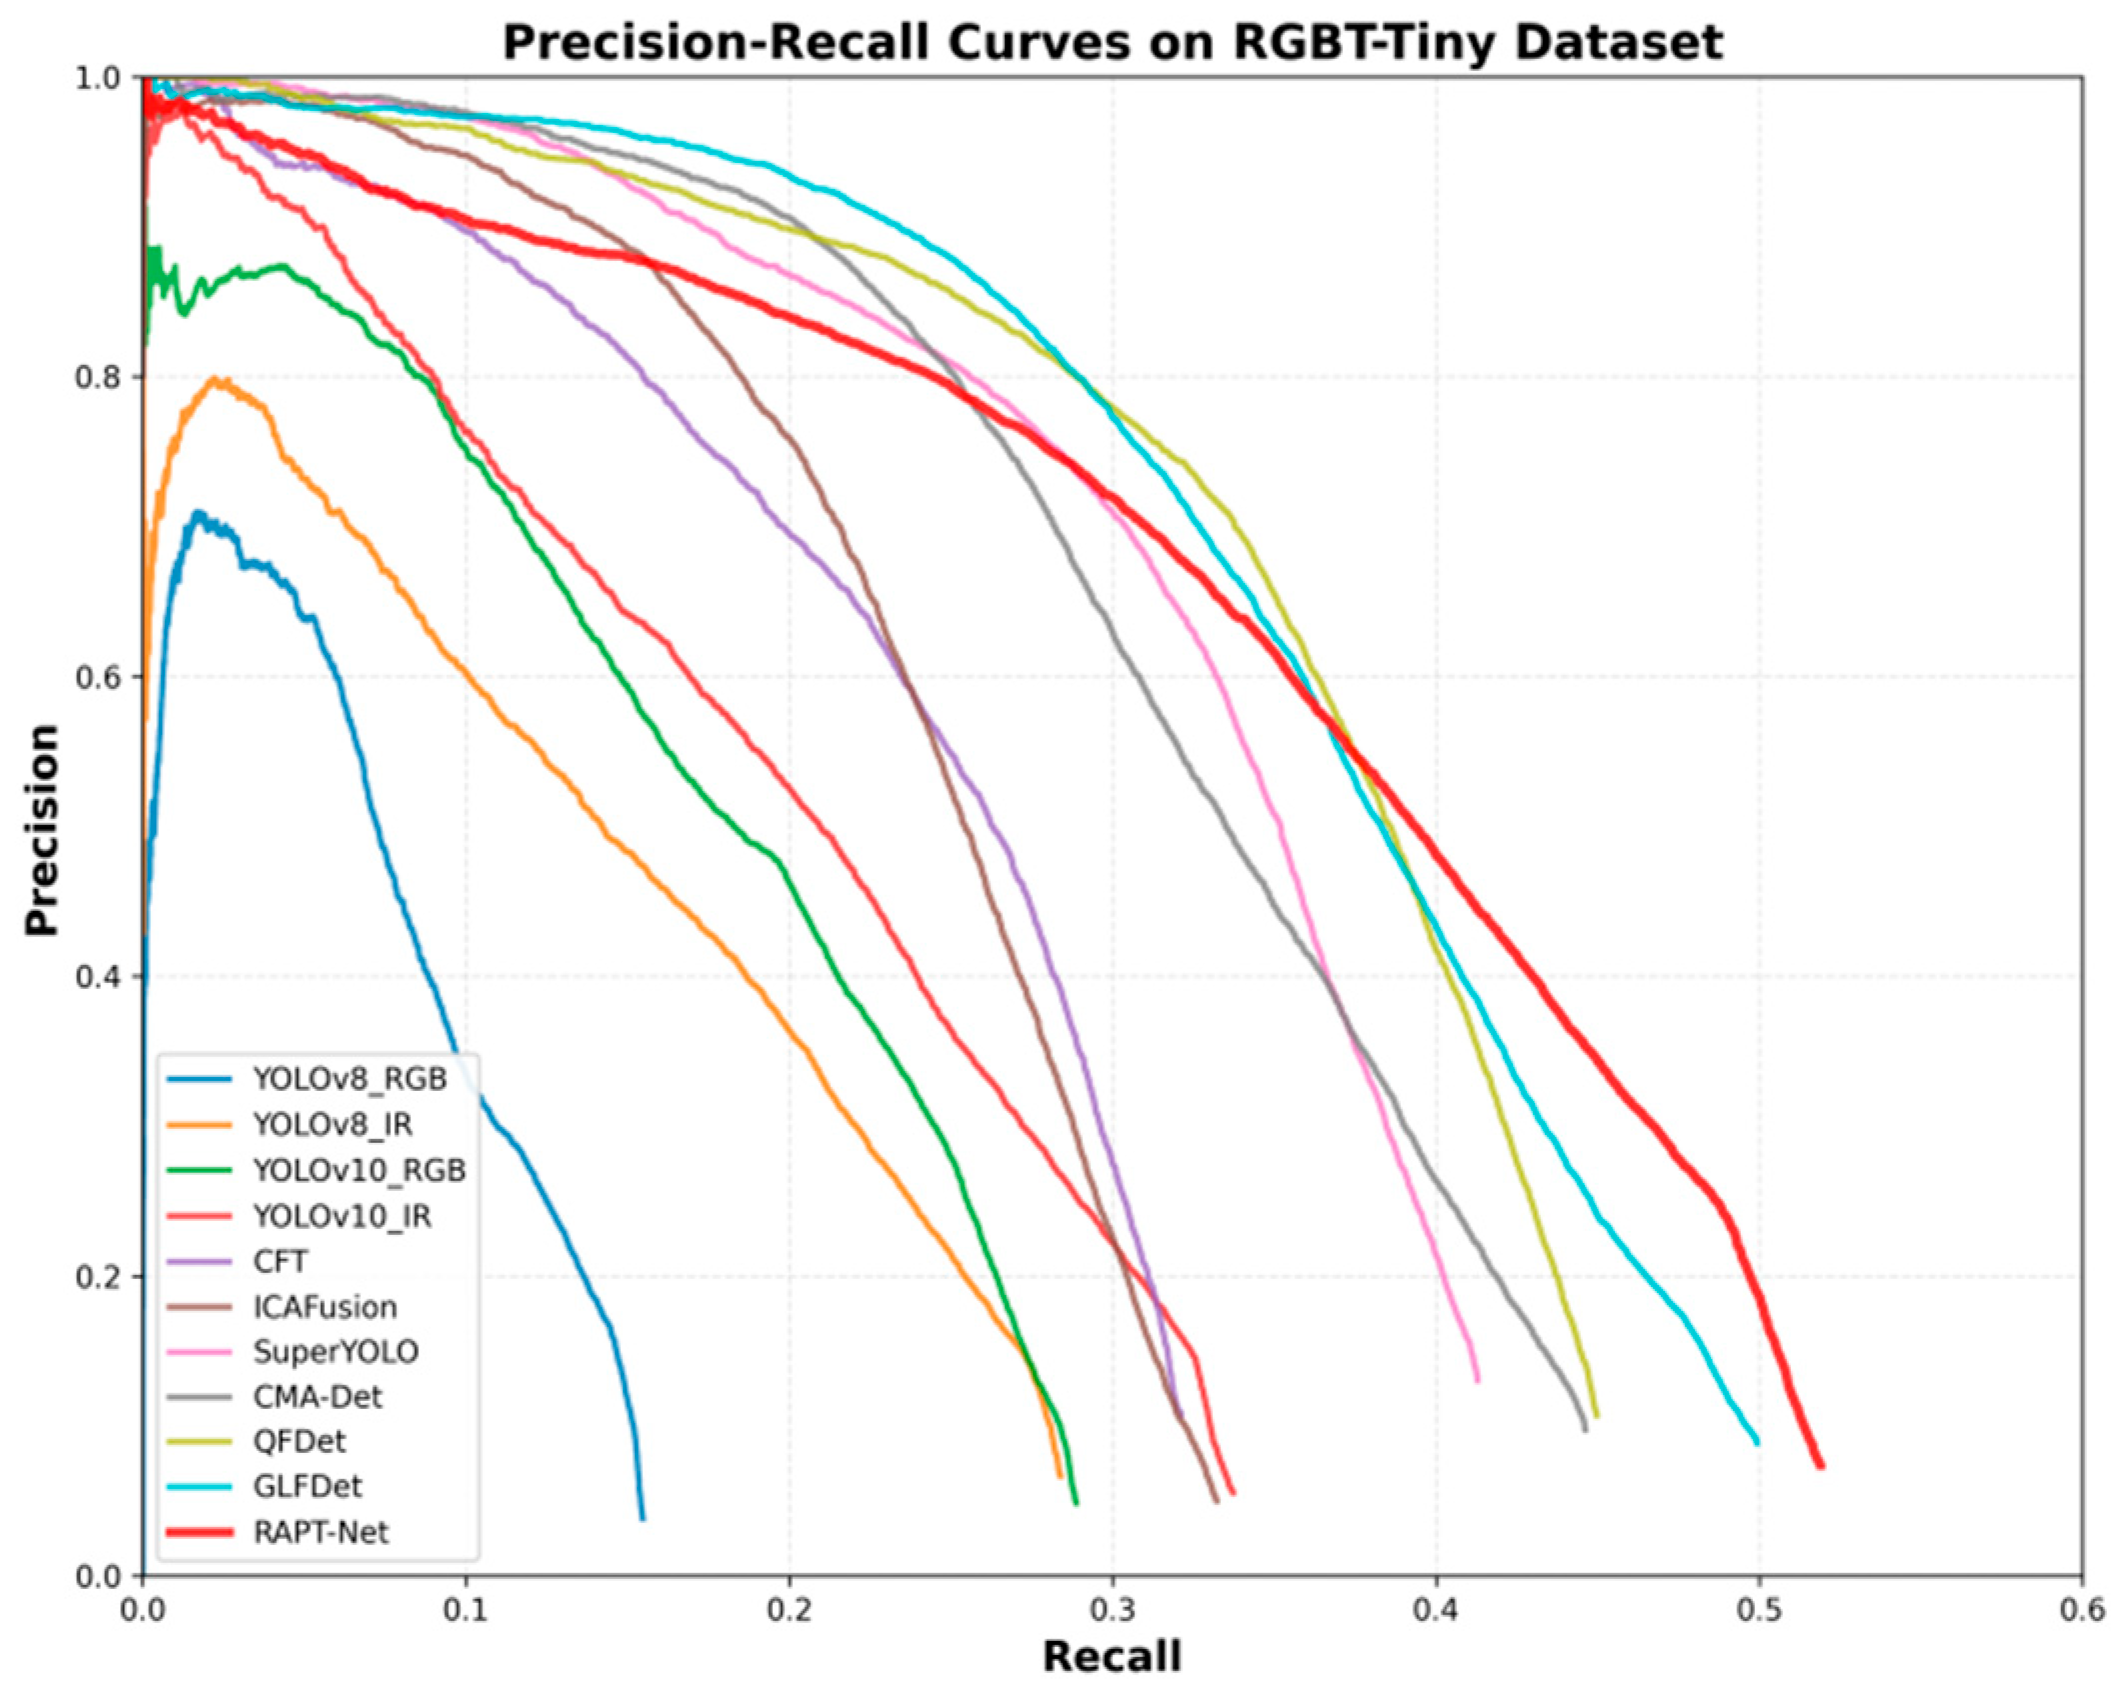
Precision–Recall (PR) curves of different methods on the RGBT-Tiny dataset. The compared methods include single-modality detectors (YOLOv8_RGB, YOLOv8_IR, YOLOv10_RGB, YOLOv10_IR), general multimodal fusion methods (CFT, ICAFusion, CMA-Det, QFDet, GLFDet), and remote sensing-optimized detectors (SuperYOLO and the proposed RAPT-Net). Notably, the effective recall range is constrained to [0, 0.6] rather than [0, 1.0] as observed in VEDAI, reflecting inherent limitations in feature representation for extremely tiny targets. The curves exhibit clear stratification where multimodal fusion methods occupy the upper region, while single-modality detectors cluster at the bottom. In the low recall region (below 0.45), GLFDet, QFDet, and SuperYOLO exhibit higher precision than RAPT-Net; however, in the high recall region (above 0.45), RAPT-Net surpasses all other methods and maintains a more gradual descent, demonstrating stronger capability in retrieving difficult samples. In terms of area under the curve, RAPT-Net achieves the best overall performance. Particularly, YOLOv8_RGB terminates before reaching 0.2 recall, and other single-modality methods approach near-zero precision beyond 0.3 recall, visually demonstrating the essential role of multimodal fusion for extremely tiny target detection.
Figure 11.
Precision–Recall (PR) curves of different methods on the RGBT-Tiny dataset. The compared methods include single-modality detectors (YOLOv8_RGB, YOLOv8_IR, YOLOv10_RGB, YOLOv10_IR), general multimodal fusion methods (CFT, ICAFusion, CMA-Det, QFDet, GLFDet), and remote sensing-optimized detectors (SuperYOLO and the proposed RAPT-Net). Notably, the effective recall range is constrained to [0, 0.6] rather than [0, 1.0] as observed in VEDAI, reflecting inherent limitations in feature representation for extremely tiny targets. The curves exhibit clear stratification where multimodal fusion methods occupy the upper region, while single-modality detectors cluster at the bottom. In the low recall region (below 0.45), GLFDet, QFDet, and SuperYOLO exhibit higher precision than RAPT-Net; however, in the high recall region (above 0.45), RAPT-Net surpasses all other methods and maintains a more gradual descent, demonstrating stronger capability in retrieving difficult samples. In terms of area under the curve, RAPT-Net achieves the best overall performance. Particularly, YOLOv8_RGB terminates before reaching 0.2 recall, and other single-modality methods approach near-zero precision beyond 0.3 recall, visually demonstrating the essential role of multimodal fusion for extremely tiny target detection.

Figure 12.
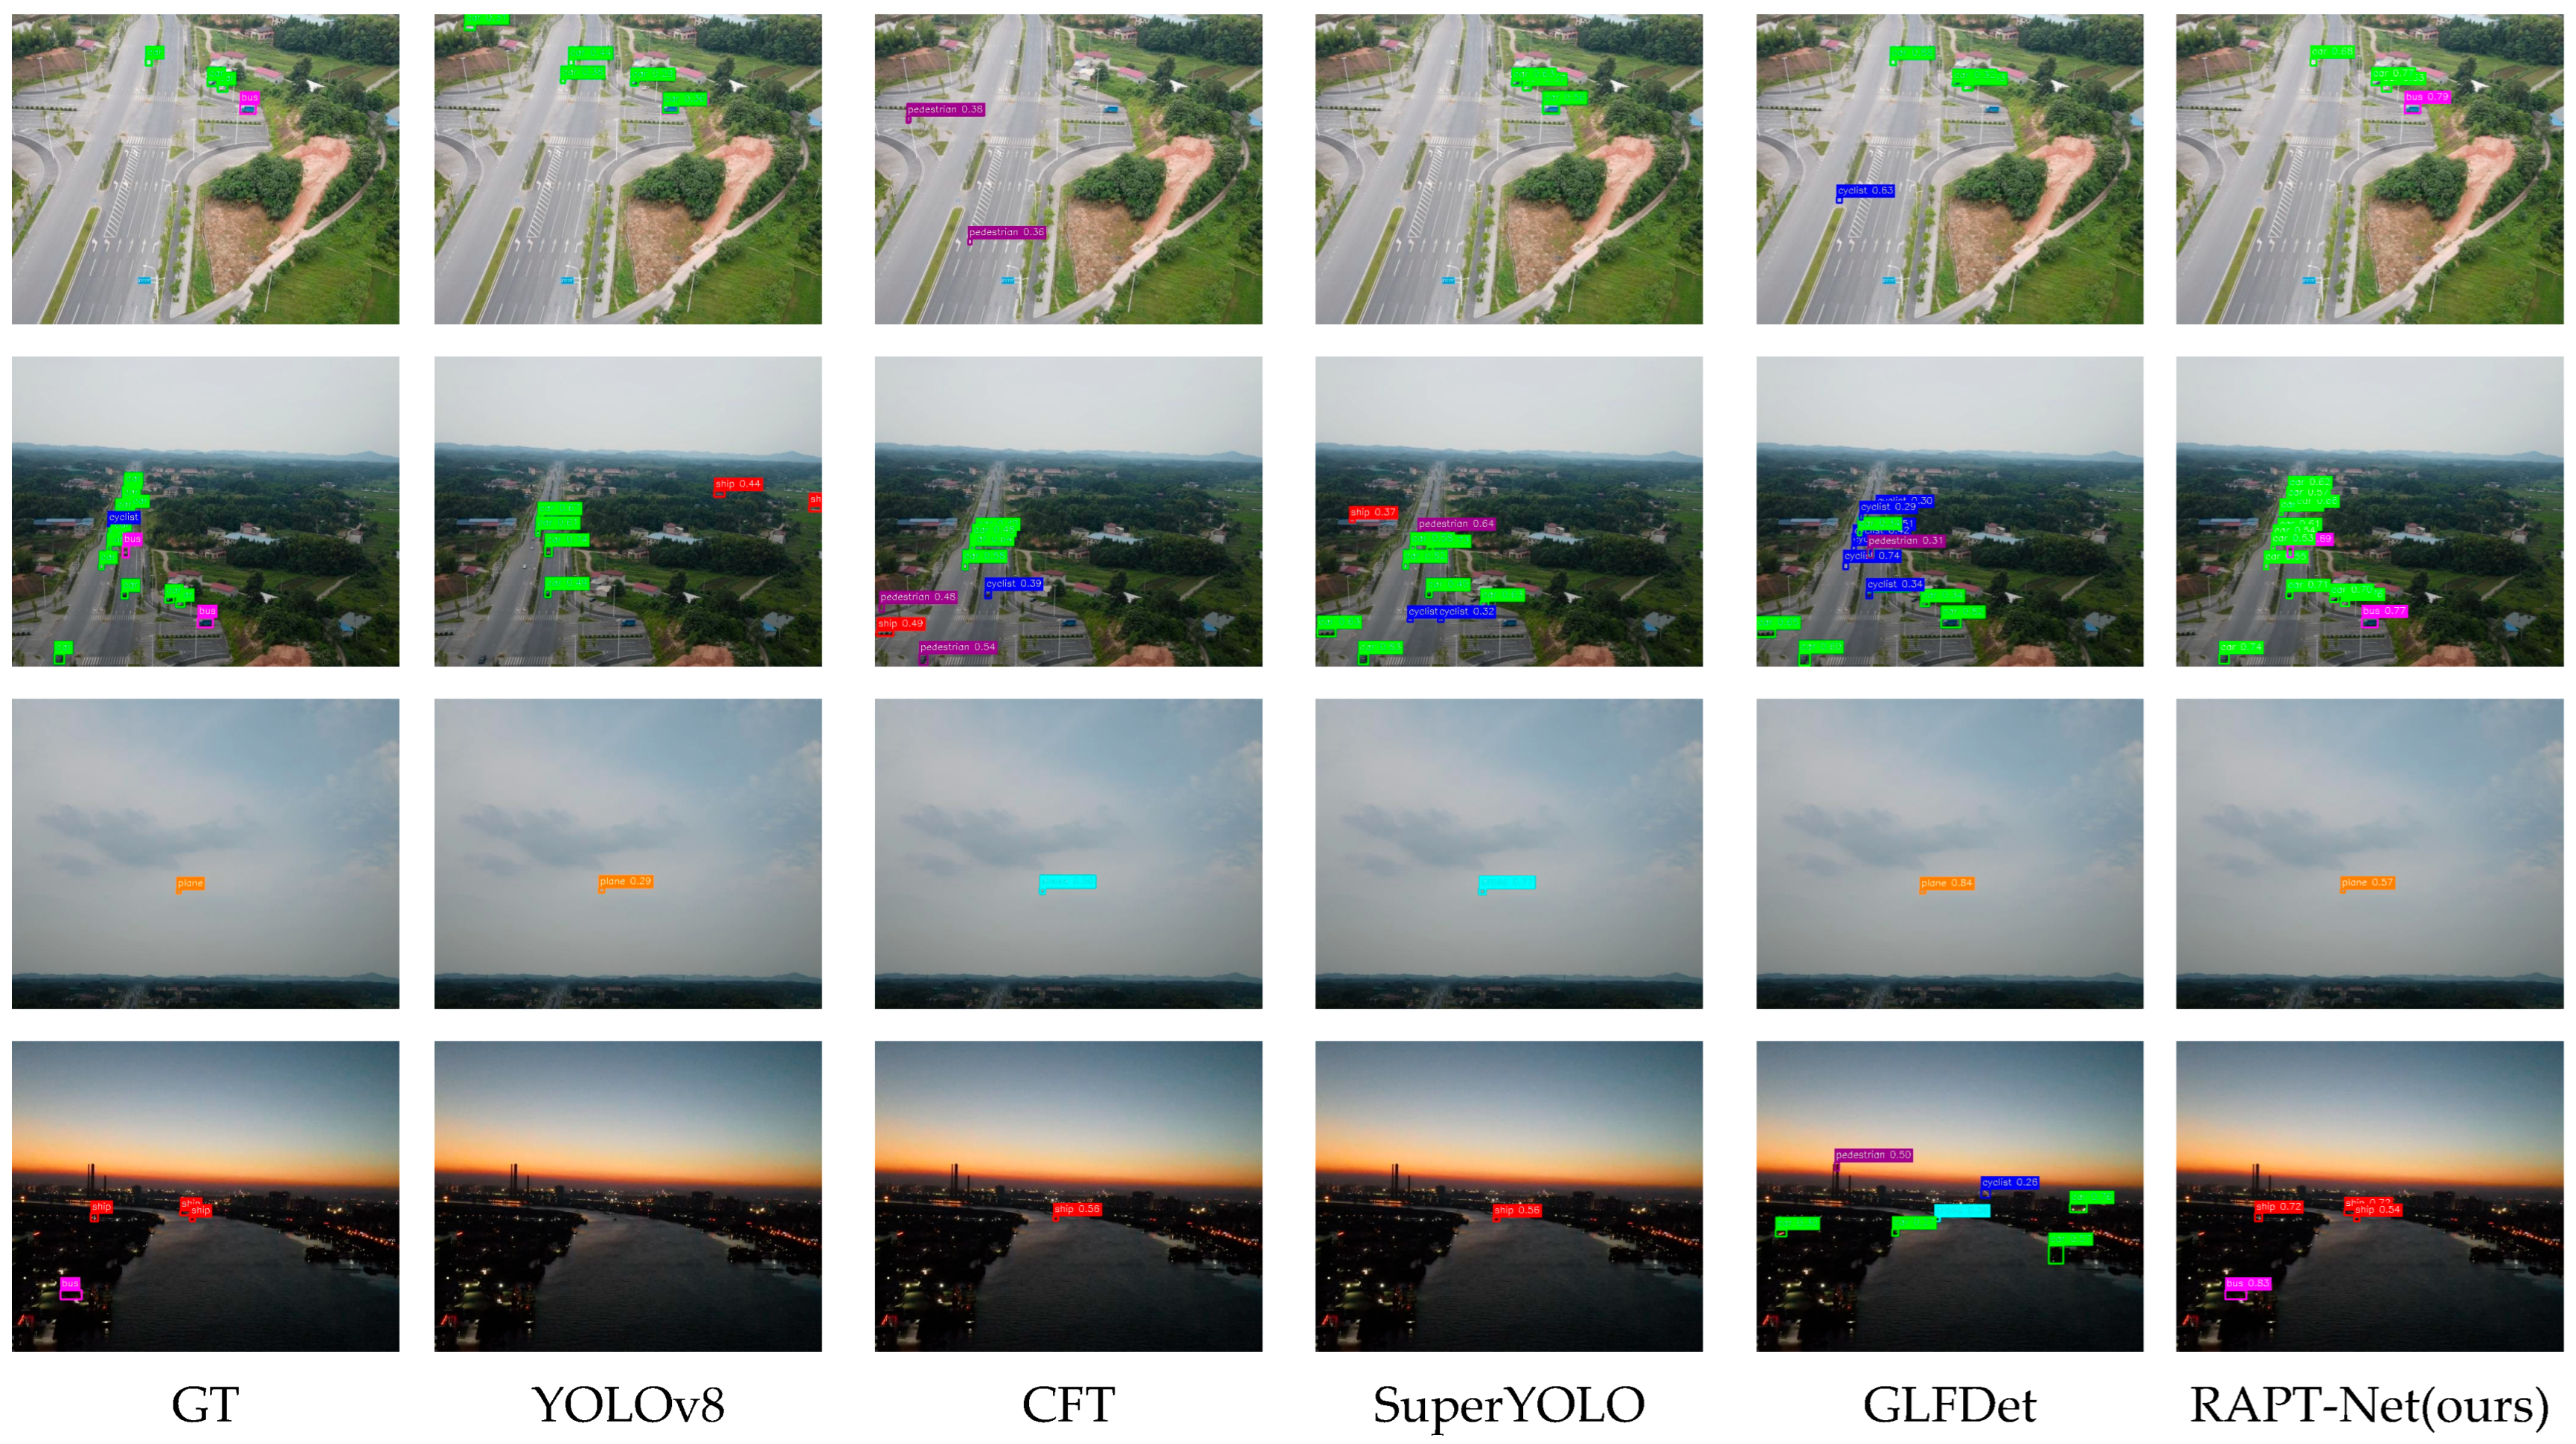
Qualitative detection results of different methods on the RGBT-Tiny dataset. Each row displays the same scene processed by different methods, with columns arranged as Ground Truth (GT), YOLOv8, CFT, SuperYOLO, GLFDet, and RAPT-Net (ours). Row 1 shows an urban road scene containing vehicles and a bus, where RAPT-Net produces comprehensive coverage with detection boxes closely matching ground truth annotations, while YOLOv8 exhibits obvious false detections and missed detections, and CFT, SuperYOLO, GLFDet all fail to detect the bus target. Row 2 presents a dense target scene with increased detection difficulty, where YOLOv8 shows numerous missed detections, CFT, SuperYOLO, and GLFDet exhibit obvious false detections, and although RAPT-Net also has some missed detections, its detection accuracy is significantly improved compared to other methods. Row 3 depicts an extremely challenging scene with very tiny targets, where RAPT-Net still demonstrates precise detection capability, while other methods struggle with accurate localization. Row 4 illustrates a low illumination scene, where YOLOv8 completely fails to detect any targets, CFT and SuperYOLO suffer from severe missed detections, GLFDet exhibits more severe false detections, while RAPT-Net shows neither false detections nor missed detections. Across all visualizations, RAPT-Net demonstrates the highest detection density with minimal background interference, validating its superior capability for extremely tiny target detection under varying illumination conditions and complex backgrounds.
Figure 12.
Qualitative detection results of different methods on the RGBT-Tiny dataset. Each row displays the same scene processed by different methods, with columns arranged as Ground Truth (GT), YOLOv8, CFT, SuperYOLO, GLFDet, and RAPT-Net (ours). Row 1 shows an urban road scene containing vehicles and a bus, where RAPT-Net produces comprehensive coverage with detection boxes closely matching ground truth annotations, while YOLOv8 exhibits obvious false detections and missed detections, and CFT, SuperYOLO, GLFDet all fail to detect the bus target. Row 2 presents a dense target scene with increased detection difficulty, where YOLOv8 shows numerous missed detections, CFT, SuperYOLO, and GLFDet exhibit obvious false detections, and although RAPT-Net also has some missed detections, its detection accuracy is significantly improved compared to other methods. Row 3 depicts an extremely challenging scene with very tiny targets, where RAPT-Net still demonstrates precise detection capability, while other methods struggle with accurate localization. Row 4 illustrates a low illumination scene, where YOLOv8 completely fails to detect any targets, CFT and SuperYOLO suffer from severe missed detections, GLFDet exhibits more severe false detections, while RAPT-Net shows neither false detections nor missed detections. Across all visualizations, RAPT-Net demonstrates the highest detection density with minimal background interference, validating its superior capability for extremely tiny target detection under varying illumination conditions and complex backgrounds.

Figure 13.
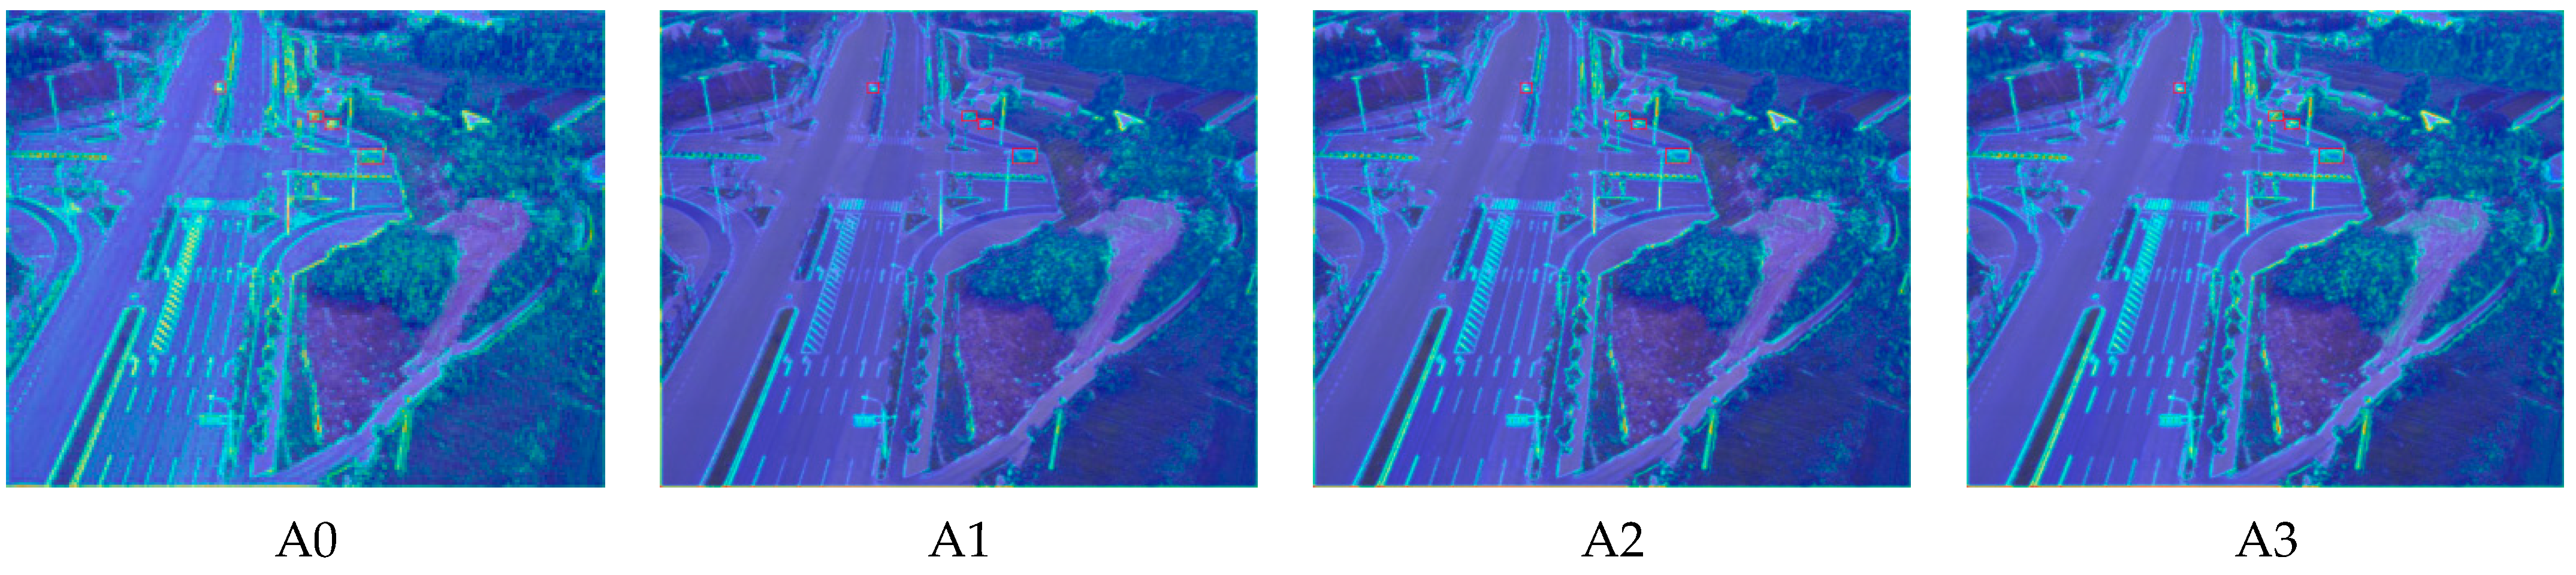
Visualization of MRAAF ablation experiments. A0 (baseline) exhibits diffuse activations with weak target–background discrimination. A1 (single-stage) shows improved spatial localization. A2 (two-stage without feedback) demonstrates further concentration. A3 (complete MRAAF) produces the sharpest responses with optimal target highlighting, validating the effectiveness of two-stage progressive fusion with reliability-guided feedback mechanism. Red boxes are ground truth label.
Figure 13.
Visualization of MRAAF ablation experiments. A0 (baseline) exhibits diffuse activations with weak target–background discrimination. A1 (single-stage) shows improved spatial localization. A2 (two-stage without feedback) demonstrates further concentration. A3 (complete MRAAF) produces the sharpest responses with optimal target highlighting, validating the effectiveness of two-stage progressive fusion with reliability-guided feedback mechanism. Red boxes are ground truth label.
Figure 14.
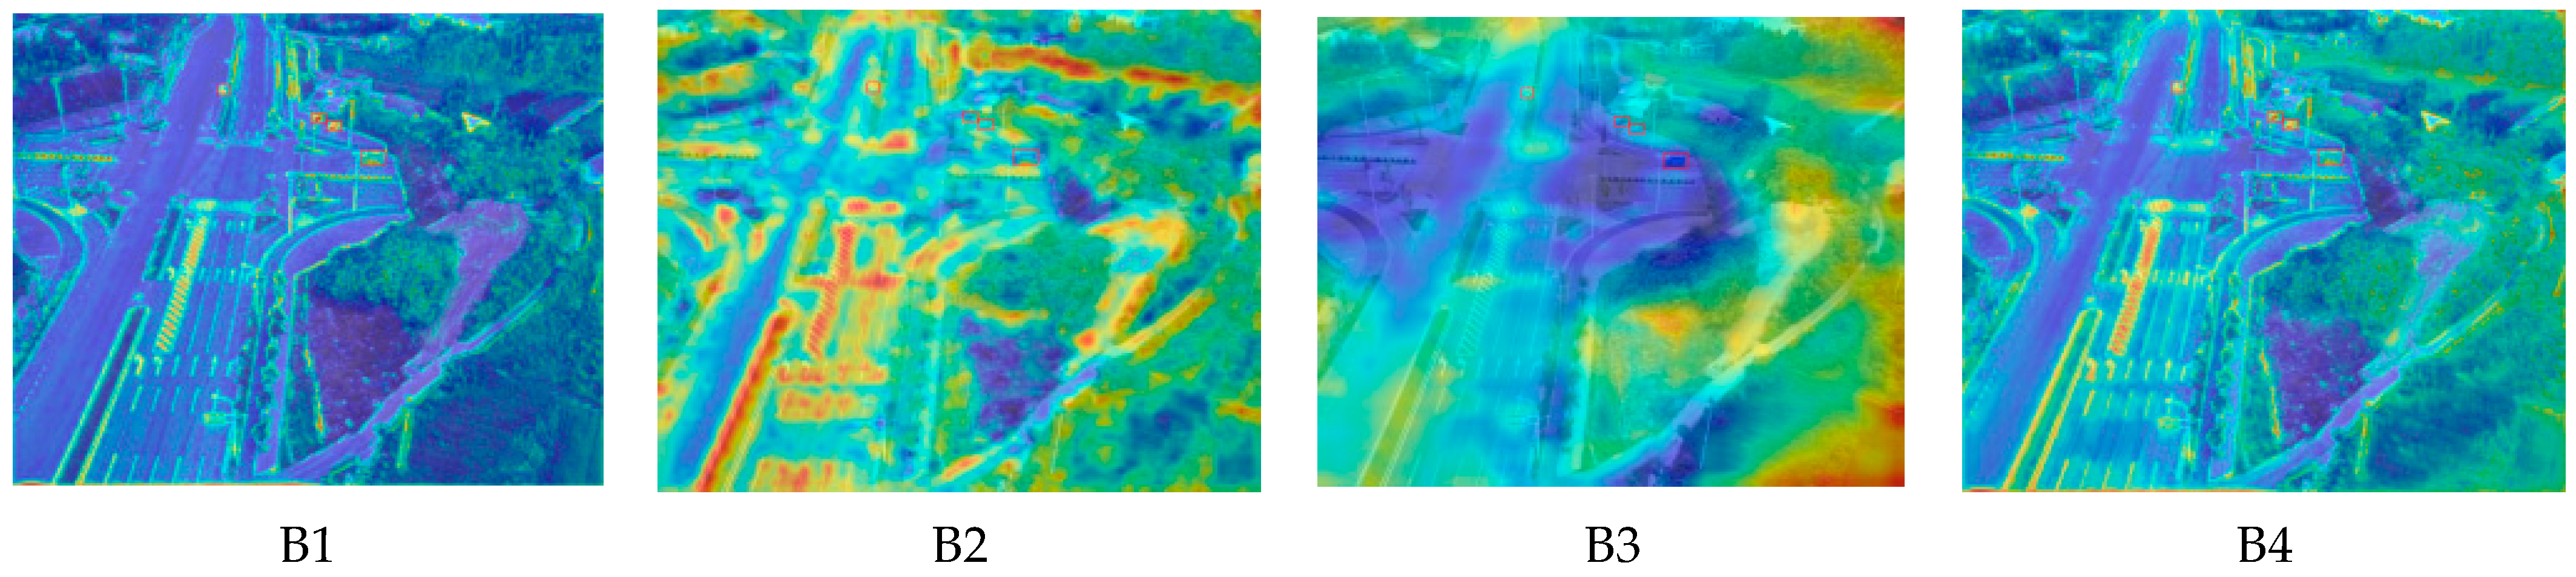
Visualization of CMFE-SRP ablation experiments. B0 is omitted as it shares identical visualization with baseline A0. B1 (RPU at P2/P3) shows uniform activation with moderate responses. B2 (CSAU at P4) produces stronger intensity with prominent high-response regions. B3 (GSAU at P5) exhibits diffuse patterns. B4 (complete CMFE-SRP) achieves optimal balance with concentrated target responses and suppressed background interference, validating synergistic interaction among hierarchy-specific units. Red boxes are ground truth label.
Figure 14.
Visualization of CMFE-SRP ablation experiments. B0 is omitted as it shares identical visualization with baseline A0. B1 (RPU at P2/P3) shows uniform activation with moderate responses. B2 (CSAU at P4) produces stronger intensity with prominent high-response regions. B3 (GSAU at P5) exhibits diffuse patterns. B4 (complete CMFE-SRP) achieves optimal balance with concentrated target responses and suppressed background interference, validating synergistic interaction among hierarchy-specific units. Red boxes are ground truth label.
Figure 15.
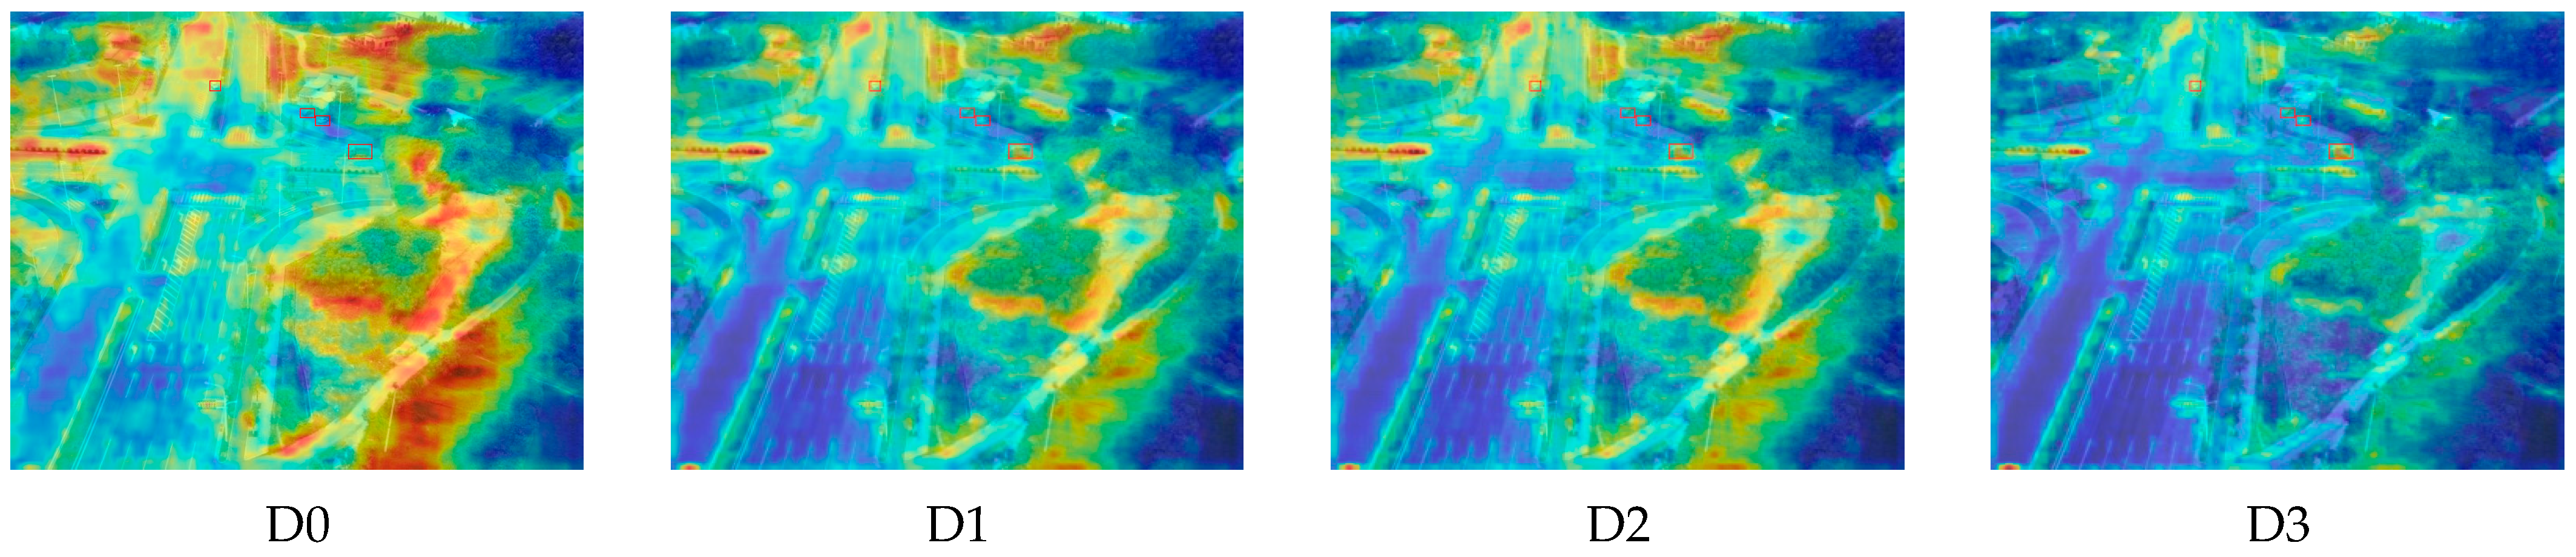
Visualization of DS-STD ablation experiments. D0 (baseline) exhibits scattered responses with substantial background noise. D1 (Boundary Proximity Extension) shows reduced background activation and concentrated target responses. D2 (Aspect Ratio Tolerance) achieves similar improvement in activation focus. D3 (complete DS-STD) produces the cleanest feature map with minimal noise and precise target highlighting, demonstrating synergistic effects of both strategies in mitigating annotation uncertainty. Red boxes are ground truth label.
Figure 15.
Visualization of DS-STD ablation experiments. D0 (baseline) exhibits scattered responses with substantial background noise. D1 (Boundary Proximity Extension) shows reduced background activation and concentrated target responses. D2 (Aspect Ratio Tolerance) achieves similar improvement in activation focus. D3 (complete DS-STD) produces the cleanest feature map with minimal noise and precise target highlighting, demonstrating synergistic effects of both strategies in mitigating annotation uncertainty. Red boxes are ground truth label.
Figure 16.
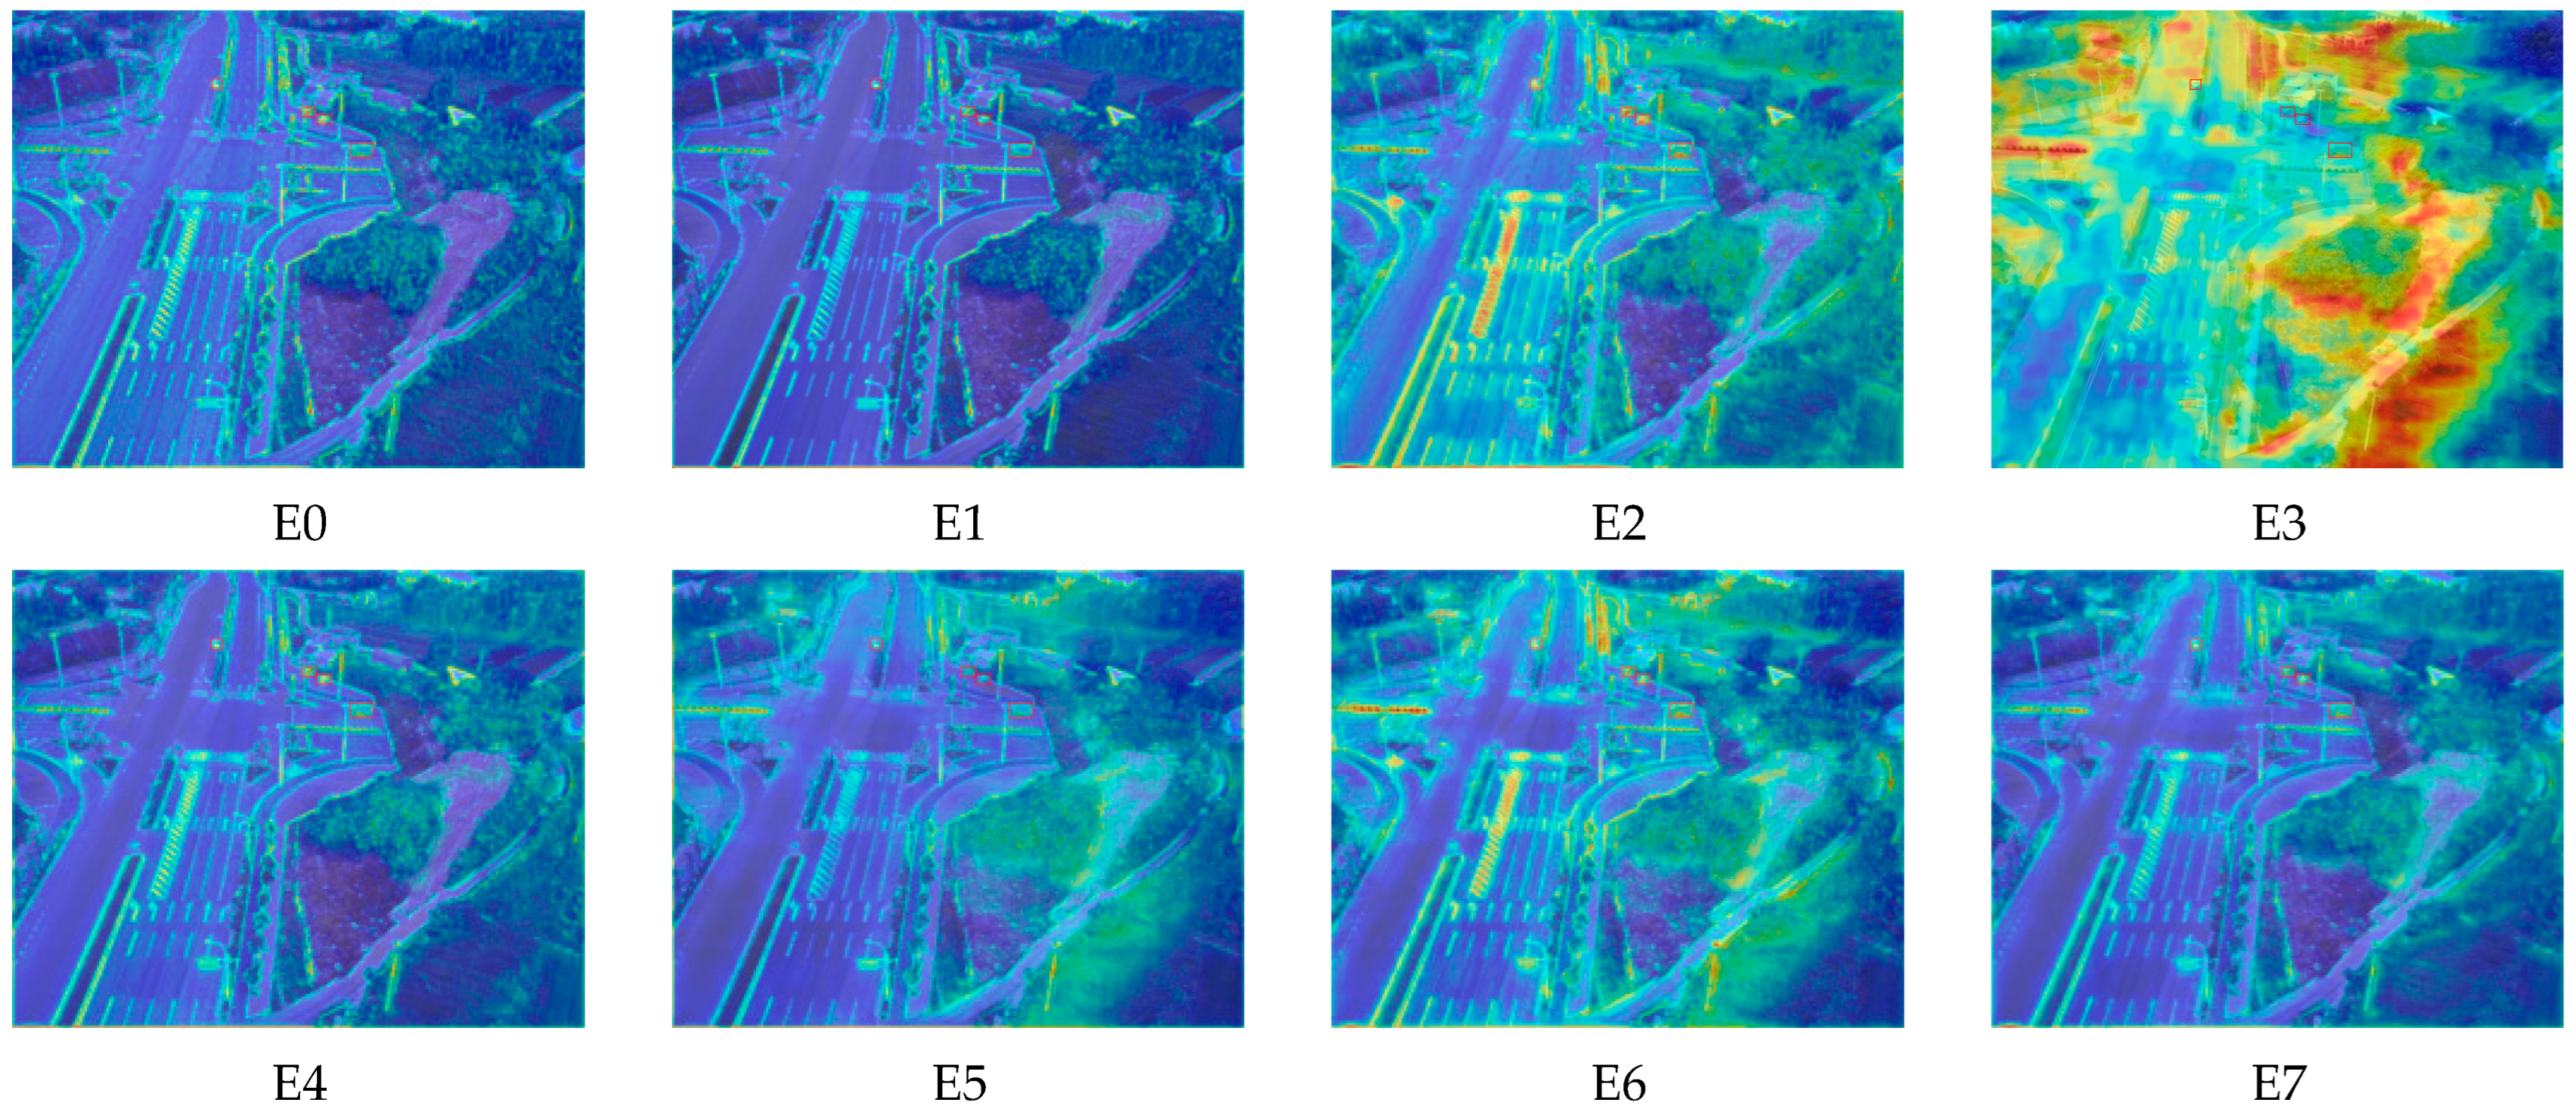
Visualization of comprehensive ablation experiments. E0 (baseline) exhibits weak activations with minimal discrimination. E1 (MRAAF) shows improved modality fusion. E2 (CMFE-SRP) produces enhanced intensity with prominent responses. E3 (DS-STD) generates strong but scattered activations. E4 to E6 (pairwise combinations) demonstrate progressively refined patterns. E7 (complete RAPT-Net) achieves optimal representation with concentrated target responses and effective background suppression, validating synergistic interaction among all modules. Red boxes are ground truth label.
Figure 16.
Visualization of comprehensive ablation experiments. E0 (baseline) exhibits weak activations with minimal discrimination. E1 (MRAAF) shows improved modality fusion. E2 (CMFE-SRP) produces enhanced intensity with prominent responses. E3 (DS-STD) generates strong but scattered activations. E4 to E6 (pairwise combinations) demonstrate progressively refined patterns. E7 (complete RAPT-Net) achieves optimal representation with concentrated target responses and effective background suppression, validating synergistic interaction among all modules. Red boxes are ground truth label.
Table 1.
Target size distribution of multi-platform aerial remote sensing datasets. Size categories are defined as follows: extremely tiny (
pixels), tiny (
pixels), small (
pixels), medium (
pixels), and large (
pixels) following [
10].
Table 1.
Target size distribution of multi-platform aerial remote sensing datasets. Size categories are defined as follows: extremely tiny (
pixels), tiny (
pixels), small (
pixels), medium (
pixels), and large (
pixels) following [
10].
| Dataset | Platform | Extremely Tiny | Tiny | Small | Medium | Large |
|---|
| VEDAI | Satellite | 0.3% | 0.0% | 40.7% | 58.3% | 0.7% |
| DroneVehicle | UAV | 0.0% | 0.0% | 11.6% | 84.9% | 3.5% |
| DVTOD | UAV | 0.0% | 0.0% | 2.4% | 31.8% | 65.8% |
| RGBTDronePerson | UAV | 7.7% | 84.3% | 7.9% | 0.1% | 0.0% |
| RGBT-Tiny | UAV | 36.7% | 44.8% | 15.9% | 2.5% | 0.1% |
Table 2.
Quantitative comparison of different methods on the VEDAI dataset. Methods are categorized into three groups: single-modality detectors (YOLOv8, YOLOv10), general multimodal fusion methods (CFT, ICAFusion, CMA-Det, QFDet, GLFDet), and remote sensing-optimized multimodal detectors (SuperYOLO, proposed RAPT-Net). Evaluation metrics include mean Average Precision (mAP) averaged over SAFit thresholds [0.5:0.05:0.95], scale-specific Average Precision for small targets (APs) and medium targets (APm), and Average Recall (AR). The best results are highlighted in red bold, second-best in blue bold, and third-best in purple bold. RAPT-Net achieves favorable accuracy–efficiency trade-off for practical deployment.
Table 2.
Quantitative comparison of different methods on the VEDAI dataset. Methods are categorized into three groups: single-modality detectors (YOLOv8, YOLOv10), general multimodal fusion methods (CFT, ICAFusion, CMA-Det, QFDet, GLFDet), and remote sensing-optimized multimodal detectors (SuperYOLO, proposed RAPT-Net). Evaluation metrics include mean Average Precision (mAP) averaged over SAFit thresholds [0.5:0.05:0.95], scale-specific Average Precision for small targets (APs) and medium targets (APm), and Average Recall (AR). The best results are highlighted in red bold, second-best in blue bold, and third-best in purple bold. RAPT-Net achieves favorable accuracy–efficiency trade-off for practical deployment.
| Methods | Modality | mAP | mAP50 | mAP75 | APs | APm | AR | Params (M) | GFLOPs | FPS |
|---|
| YOLOv8 | RGB | 0.5428 | 0.7885 | 0.6860 | 0.4437 | 0.5521 | 0.1919 | 3.01 | 8.9 | 230.83 |
| YOLOv8 | IR | 0.5640 | 0.8002 | 0.7092 | 0.4652 | 0.5708 | 0.1991 | 3.01 | 8.9 | 231.08 |
| YOLOv10 | RGB | 0.4908 | 0.7128 | 0.6272 | 0.3924 | 0.4919 | 0.1793 | 2.71 | 8.4 | 138.43 |
| YOLOv10 | IR | 0.5155 | 0.7410 | 0.6590 | 0.4191 | 0.5123 | 0.1937 | 2.71 | 8.4 | 137.55 |
| CFT | RGB-IR | 0.5842 | 0.8162 | 0.7157 | 0.4846 | 0.6061 | 0.2160 | 32.4 | 89.6 | 23.71 |
| ICAFusion | RGB-IR | 0.5781 | 0.8094 | 0.6961 | 0.4768 | 0.5962 | 0.2066 | 35.4 | 98.2 | 45.00 |
| SuperYOLO | RGB-IR | 0.5967 | 0.8380 | 0.7404 | 0.5056 | 0.6119 | 0.2237 | 5.04 | 54.3 | 21.04 |
| CMA-Det | RGB-IR | 0.5717 | 0.7964 | 0.6909 | 0.4701 | 0.5839 | 0.2085 | 27.6 | 141.3 | 15.16 |
| QFDet | RGB-IR | 0.5846 | 0.8151 | 0.7040 | 0.4877 | 0.5924 | 0.2158 | 51.2 | 168.5 | 26.30 |
| GLFDet | RGB-IR | 0.5760 | 0.8077 | 0.6911 | 0.4732 | 0.5886 | 0.2069 | 29.3 | 156.8 | 15.00 |
| RAPT-Net (ours) | RGB-IR | 0.6222 | 0.8483 | 0.7595 | 0.5268 | 0.6452 | 0.2439 | 37.8 | 64.9 | 28.95 |
Table 3.
Quantitative comparison of different methods on the RGBT-Tiny dataset. This dataset serves as the first large-scale benchmark specifically designed for visible-thermal tiny object detection, containing over 81% targets smaller than 16 × 16 pixels, providing an ideal platform for evaluating algorithm performance under extreme scale conditions. Methods are categorized into three groups: single-modality detectors (YOLOv8, YOLOv10), general multimodal fusion methods, and remote sensing-optimized multimodal detectors (SuperYOLO and the proposed RAPT-Net). Evaluation metrics include mean Average Precision (mAP) averaged over SAFit thresholds [0.5:0.05:0.95]; mAP at IoU thresholds of 0.50 and 0.75; scale-specific Average Precision for extremely tiny targets (APet), tiny targets (APt), and small targets (APs); as well as Average Recall (AR). The best results are highlighted in red bold, second-best in blue bold, and third-best in purple bold. All methods are trained and evaluated under identical experimental settings for fair comparison.
Table 3.
Quantitative comparison of different methods on the RGBT-Tiny dataset. This dataset serves as the first large-scale benchmark specifically designed for visible-thermal tiny object detection, containing over 81% targets smaller than 16 × 16 pixels, providing an ideal platform for evaluating algorithm performance under extreme scale conditions. Methods are categorized into three groups: single-modality detectors (YOLOv8, YOLOv10), general multimodal fusion methods, and remote sensing-optimized multimodal detectors (SuperYOLO and the proposed RAPT-Net). Evaluation metrics include mean Average Precision (mAP) averaged over SAFit thresholds [0.5:0.05:0.95]; mAP at IoU thresholds of 0.50 and 0.75; scale-specific Average Precision for extremely tiny targets (APet), tiny targets (APt), and small targets (APs); as well as Average Recall (AR). The best results are highlighted in red bold, second-best in blue bold, and third-best in purple bold. All methods are trained and evaluated under identical experimental settings for fair comparison.
| Methods | Modality | mAP | mAP50 | mAP75 | APet | APt | APs | AR | Params (M) | GFLOPs | FPS |
|---|
| YOLOv8 | RGB | 0.1084 | 0.1987 | 0.1251 | 0.0524 | 0.0992 | 0.1567 | 0.1428 | 3.01 | 2.78 | 230.94 |
| YOLOv8 | IR | 0.0862 | 0.1581 | 0.0976 | 0.0342 | 0.0718 | 0.1236 | 0.1135 | 3.01 | 2.78 | 229.48 |
| YOLOv10 | RGB | 0.1139 | 0.2064 | 0.1317 | 0.0571 | 0.1047 | 0.1639 | 0.1482 | 2.71 | 2.62 | 138.56 |
| YOLOv10 | IR | 0.0904 | 0.1645 | 0.1024 | 0.0378 | 0.0761 | 0.1297 | 0.1188 | 2.71 | 2.62 | 138.92 |
| CFT | RGB-IR | 0.1254 | 0.2276 | 0.1465 | 0.0624 | 0.1178 | 0.1854 | 0.1647 | 32.4 | 27.9 | 45.74 |
| ICAFusion | RGB-IR | 0.1376 | 0.2454 | 0.1618 | 0.0746 | 0.1324 | 0.2076 | 0.1823 | 35.4 | 30.6 | 103.50 |
| SuperYOLO | RGB-IR | 0.1425 | 0.2558 | 0.1684 | 0.0714 | 0.1337 | 0.1984 | 0.1886 | 5.04 | 16.9 | 52.60 |
| CMA-Det | RGB-IR | 0.1205 | 0.2178 | 0.1379 | 0.0593 | 0.1138 | 0.1745 | 0.1571 | 27.6 | 44.0 | 30.32 |
| QFDet | RGB-IR | 0.1679 | 0.3015 | 0.1949 | 0.0926 | 0.1631 | 0.2267 | 0.2174 | 51.2 | 52.5 | 35.94 |
| GLFDet | RGB-IR | 0.1296 | 0.2347 | 0.1484 | 0.0648 | 0.1213 | 0.1924 | 0.1697 | 29.3 | 48.9 | 37.50 |
| RAPT-Net (ours) | RGB-IR | 0.1852 | 0.3287 | 0.2142 | 0.1086 | 0.1859 | 0.2412 | 0.2369 | 37.8 | 20.3 | 58.77 |
Table 4.
Ablation study of MRAAF fusion strategy on the RGBT-Tiny dataset. A0: baseline with simple concatenation fusion. A1: single-stage MRAAF with coarse-grained reliability estimation. A2: two-stage fusion without feedback mechanism. A3: complete MRAAF with learnable aggregation and reliability-guided feedback. Metrics include mAP and scale-specific APet, APt, APs. Results demonstrate progressive improvement from each component.
Table 4.
Ablation study of MRAAF fusion strategy on the RGBT-Tiny dataset. A0: baseline with simple concatenation fusion. A1: single-stage MRAAF with coarse-grained reliability estimation. A2: two-stage fusion without feedback mechanism. A3: complete MRAAF with learnable aggregation and reliability-guided feedback. Metrics include mAP and scale-specific APet, APt, APs. Results demonstrate progressive improvement from each component.
| ID | Fusion Strategy | Guidance | mAP | APet | APt | APs |
|---|
| A0 | Baseline | × | 0.1245 | 0.0629 | 0.1164 | 0.1732 |
| A1 | Single stage | × | 0.1368 | 0.0718 | 0.1285 | 0.1896 |
| A2 | Two stage | × | 0.1456 | 0.0804 | 0.1378 | 0.2014 |
| A3 | Two stage | √ | 0.1521 | 0.0865 | 0.1452 | 0.2108 |
Table 5.
Ablation study of CMFE-SRP hierarchy-specific processing units on the RGBT-Tiny dataset. B0: baseline with standard C3 blocks at all levels. B1: RPU at P2/P3 for spatial preservation. B2: CSAU at P4 for semantic alignment. B3: GSAU at P5 for context aggregation. B4: complete CMFE-SRP integrating all units. Metrics include mAP and scale-specific APet, APt, APs. Results confirm that RPU at shallow layers contributes the most significant improvement for tiny target detection.
Table 5.
Ablation study of CMFE-SRP hierarchy-specific processing units on the RGBT-Tiny dataset. B0: baseline with standard C3 blocks at all levels. B1: RPU at P2/P3 for spatial preservation. B2: CSAU at P4 for semantic alignment. B3: GSAU at P5 for context aggregation. B4: complete CMFE-SRP integrating all units. Metrics include mAP and scale-specific APet, APt, APs. Results confirm that RPU at shallow layers contributes the most significant improvement for tiny target detection.
| ID | P2/P3 | P4 | P5 | mAP | APet | APt | APs |
|---|
| B0 | C3 | C3 | C3+SPP | 0.1245 | 0.0629 | 0.1164 | 0.1732 |
| B1 | RPU | C3 | C3+SPP | 0.1586 | 0.0924 | 0.1518 | 0.2103 |
| B2 | C3 | CSAU | C3+SPP | 0.1412 | 0.0758 | 0.1337 | 0.1894 |
| B3 | C3 | C3 | GSAU | 0.1328 | 0.0694 | 0.1251 | 0.1806 |
| B4 | RPU | CSAU | GSAU | 0.1712 | 0.1015 | 0.1647 | 0.2256 |
Table 6.
Ablation study of DS-STD dense supervision strategy on the RGBT-Tiny dataset. D0: baseline with standard positive sample assignment. D1: Boundary Proximity Extension for grid assignment tolerance. D2: Aspect Ratio Tolerance Matching for shape variation accommodation. D3: complete DS-STD combining both strategies with up to 4× positive sample expansion. Metrics include mAP and scale-specific APet, APt, APs. Results demonstrate synergistic improvement exceeding the sum of individual contributions.
Table 6.
Ablation study of DS-STD dense supervision strategy on the RGBT-Tiny dataset. D0: baseline with standard positive sample assignment. D1: Boundary Proximity Extension for grid assignment tolerance. D2: Aspect Ratio Tolerance Matching for shape variation accommodation. D3: complete DS-STD combining both strategies with up to 4× positive sample expansion. Metrics include mAP and scale-specific APet, APt, APs. Results demonstrate synergistic improvement exceeding the sum of individual contributions.
| ID | Boundary Extension | Aspect Ratio Tolerance | mAP | APet | APt | APs |
|---|
| D0 | × | × | 0.1437 | 0.0768 | 0.1359 | 0.1975 |
| D1 | √ | × | 0.1521 | 0.0845 | 0.1446 | 0.2068 |
| D2 | × | √ | 0.1498 | 0.0821 | 0.1423 | 0.2041 |
| D3 | √ | √ | 0.1612 | 0.0934 | 0.1548 | 0.2187 |
Table 7.
Comprehensive ablation study of module combinations on the RGBT-Tiny dataset. E0: baseline without proposed modules. E1 to E3: individual modules (MRAAF, CMFE-SRP, DS-STD). E4 to E6: pairwise combinations. E7: complete RAPT-Net. Metrics include mAP and scale-specific APet, APt, APs. Results show CMFE-SRP provides the largest individual improvement, and the complete framework achieves 6.07 percentage point mAP improvement, with synergistic gains exceeding the sum of individual contributions.
Table 7.
Comprehensive ablation study of module combinations on the RGBT-Tiny dataset. E0: baseline without proposed modules. E1 to E3: individual modules (MRAAF, CMFE-SRP, DS-STD). E4 to E6: pairwise combinations. E7: complete RAPT-Net. Metrics include mAP and scale-specific APet, APt, APs. Results show CMFE-SRP provides the largest individual improvement, and the complete framework achieves 6.07 percentage point mAP improvement, with synergistic gains exceeding the sum of individual contributions.
| ID | MRAAF | CMFE-SRP | DS-STD | mAP | APet | APt | APs |
|---|
| E0 | × | × | × | 0.1245 | 0.0629 | 0.1164 | 0.1732 |
| E1 | √ | × | × | 0.1521 | 0.0865 | 0.1452 | 0.2108 |
| E2 | × | √ | × | 0.1712 | 0.1015 | 0.1647 | 0.2256 |
| E3 | × | × | √ | 0.1437 | 0.0768 | 0.1359 | 0.1975 |
| E4 | √ | √ | × | 0.1798 | 0.1084 | 0.1731 | 0.2348 |
| E5 | √ | × | √ | 0.1643 | 0.0947 | 0.1576 | 0.2186 |
| E6 | × | √ | √ | 0.1826 | 0.1017 | 0.1764 | 0.2391 |
| E7 | √ | √ | √ | 0.1852 | 0.1086 | 0.1859 | 0.2412 |




 ,
,