Article

RAPT-Net: Reliability-Aware Precision-Preserving Tolerance-Enhanced Network for Tiny Target Detection in Wide-Area Coverage Aerial Remote Sensing

College of Intelligence Science and Technology, National University of Defense Technology, Changsha 410073, China
*
Author to whom correspondence should be addressed.
Remote Sens. 2026, 18(3), 449; https://doi.org/10.3390/rs18030449
Submission received: 4 January 2026 / Revised: 19 January 2026 / Accepted: 26 January 2026 / Published: 1 February 2026
(This article belongs to the Special Issue Small Target Detection, Recognition, and Tracking in Remote Sensing)

Highlights

What are the main findings?
  • The RAPT-Net framework performs exceptionally well on two representative aerial remote sensing datasets (VEDAI and RGBT-Tiny), outperforming existing state-of-the-art methods in detection accuracy. It achieves mAP values of 62.22% and 18.52%, respectively, improving over the best competing methods by 4.3% and 10.3%. Notably, for extremely tiny targets (<8 × 8 pixels), APet reaches 10.86% on RGBT-Tiny, representing a 17.3% relative improvement.
  • The framework demonstrates strong cross-platform adaptability, being applicable to both satellite (12.5–25 cm/pixel resolution) and UAV (60–100 m altitude) remote sensing scenarios without architectural modification. Comprehensive ablation experiments verify the synergistic effectiveness of its three core modules (MRAAF, CMFE-SRP, DS-STD), with combined gains (6.07% mAP improvement) exceeding the sum of individual contributions, enabling robust detection under varying illumination conditions and complex backgrounds while significantly reducing missed detections and false positives.
What are the implications of the main findings?
  • It targets and addresses three coupled core challenges of existing aerial remote sensing small object detection methods: spatial heterogeneity of modality reliability under scene diversity, irreversible spatial information degradation from progressive downsampling, and annotation ambiguity conflicting with IoU-based training. It provides reliable technical support for precision detection in critical applications such as wide-area surveillance, traffic monitoring, maritime security, and search-and-rescue operations.
  • The proposed spatial tolerance supervision strategy (DS-STD) with 4× positive sample expansion offers a generalizable solution to mitigate the inherent 1–2 pixel boundary localization uncertainty in remote sensing imagery. The hierarchy-specific feature processing paradigm (shallow layers for spatial preservation, deep layers for semantic aggregation) provides a new design principle for subsequent research on multi-scale feature extraction in tiny object detection, promoting the deployment of related technologies on operational Earth observation platforms.

Abstract

Multi-platform aerial remote sensing supports critical applications including wide-area surveillance, traffic monitoring, maritime security, and search and rescue. However, constrained by observation altitude and sensor resolution, targets inherently exhibit small-scale characteristics, making small object detection a fundamental bottleneck. Aerial remote sensing faces three unique challenges: (1) spatial heterogeneity of modality reliability due to scene diversity and illumination dynamics; (2) conflict between precise localization requirements and progressive spatial information degradation; (3) annotation ambiguity from imaging physics conflicting with IoU-based training. This paper proposes RAPT-Net with three core modules: MRAAF achieves scene-adaptive modality integration through two-stage progressive fusion; CMFE-SRP employs hierarchy-specific processing to balance spatial details and semantic enhancement; DS-STD increases positive sample coverage to 4× through spatial tolerance expansion. Experiments on VEDAI (satellite) and RGBT-Tiny (UAV) demonstrate mAP values of 62.22% and 18.52%, improving over the state of the art by 4.3% and 10.3%, with a 17.3% improvement on extremely tiny targets.

1. Introduction

Multi-platform aerial remote sensing has become a core technology for geospatial information acquisition, with multi-level platforms ranging from satellites to unmanned aerial vehicles (UAVs) serving critical applications including wide-area surveillance and reconnaissance, traffic monitoring, maritime and airspace security, and search-and-rescue operations [1,2]. However, remote sensing observation is jointly constrained by platform altitude and sensor capabilities, resulting in an inherent trade-off between coverage area and spatial resolution. When observation altitude is increased to achieve wide-area coverage, the distance between the sensor and the observation area enlarges, causing the projected size of targets on the imaging plane to decrease correspondingly, with features being compressed into increasingly smaller pixel footprints. This scale compression is not a limitation of specific sensors or platforms, but rather an intrinsic characteristic of remote sensing geometry [3,4]. Consequently, small object detection performance has become a critical challenge constraining the effectiveness of wide-area remote sensing observation, directly affecting the reliability of downstream tasks such as land cover classification, change detection, and emergency response decision-making [5,6].
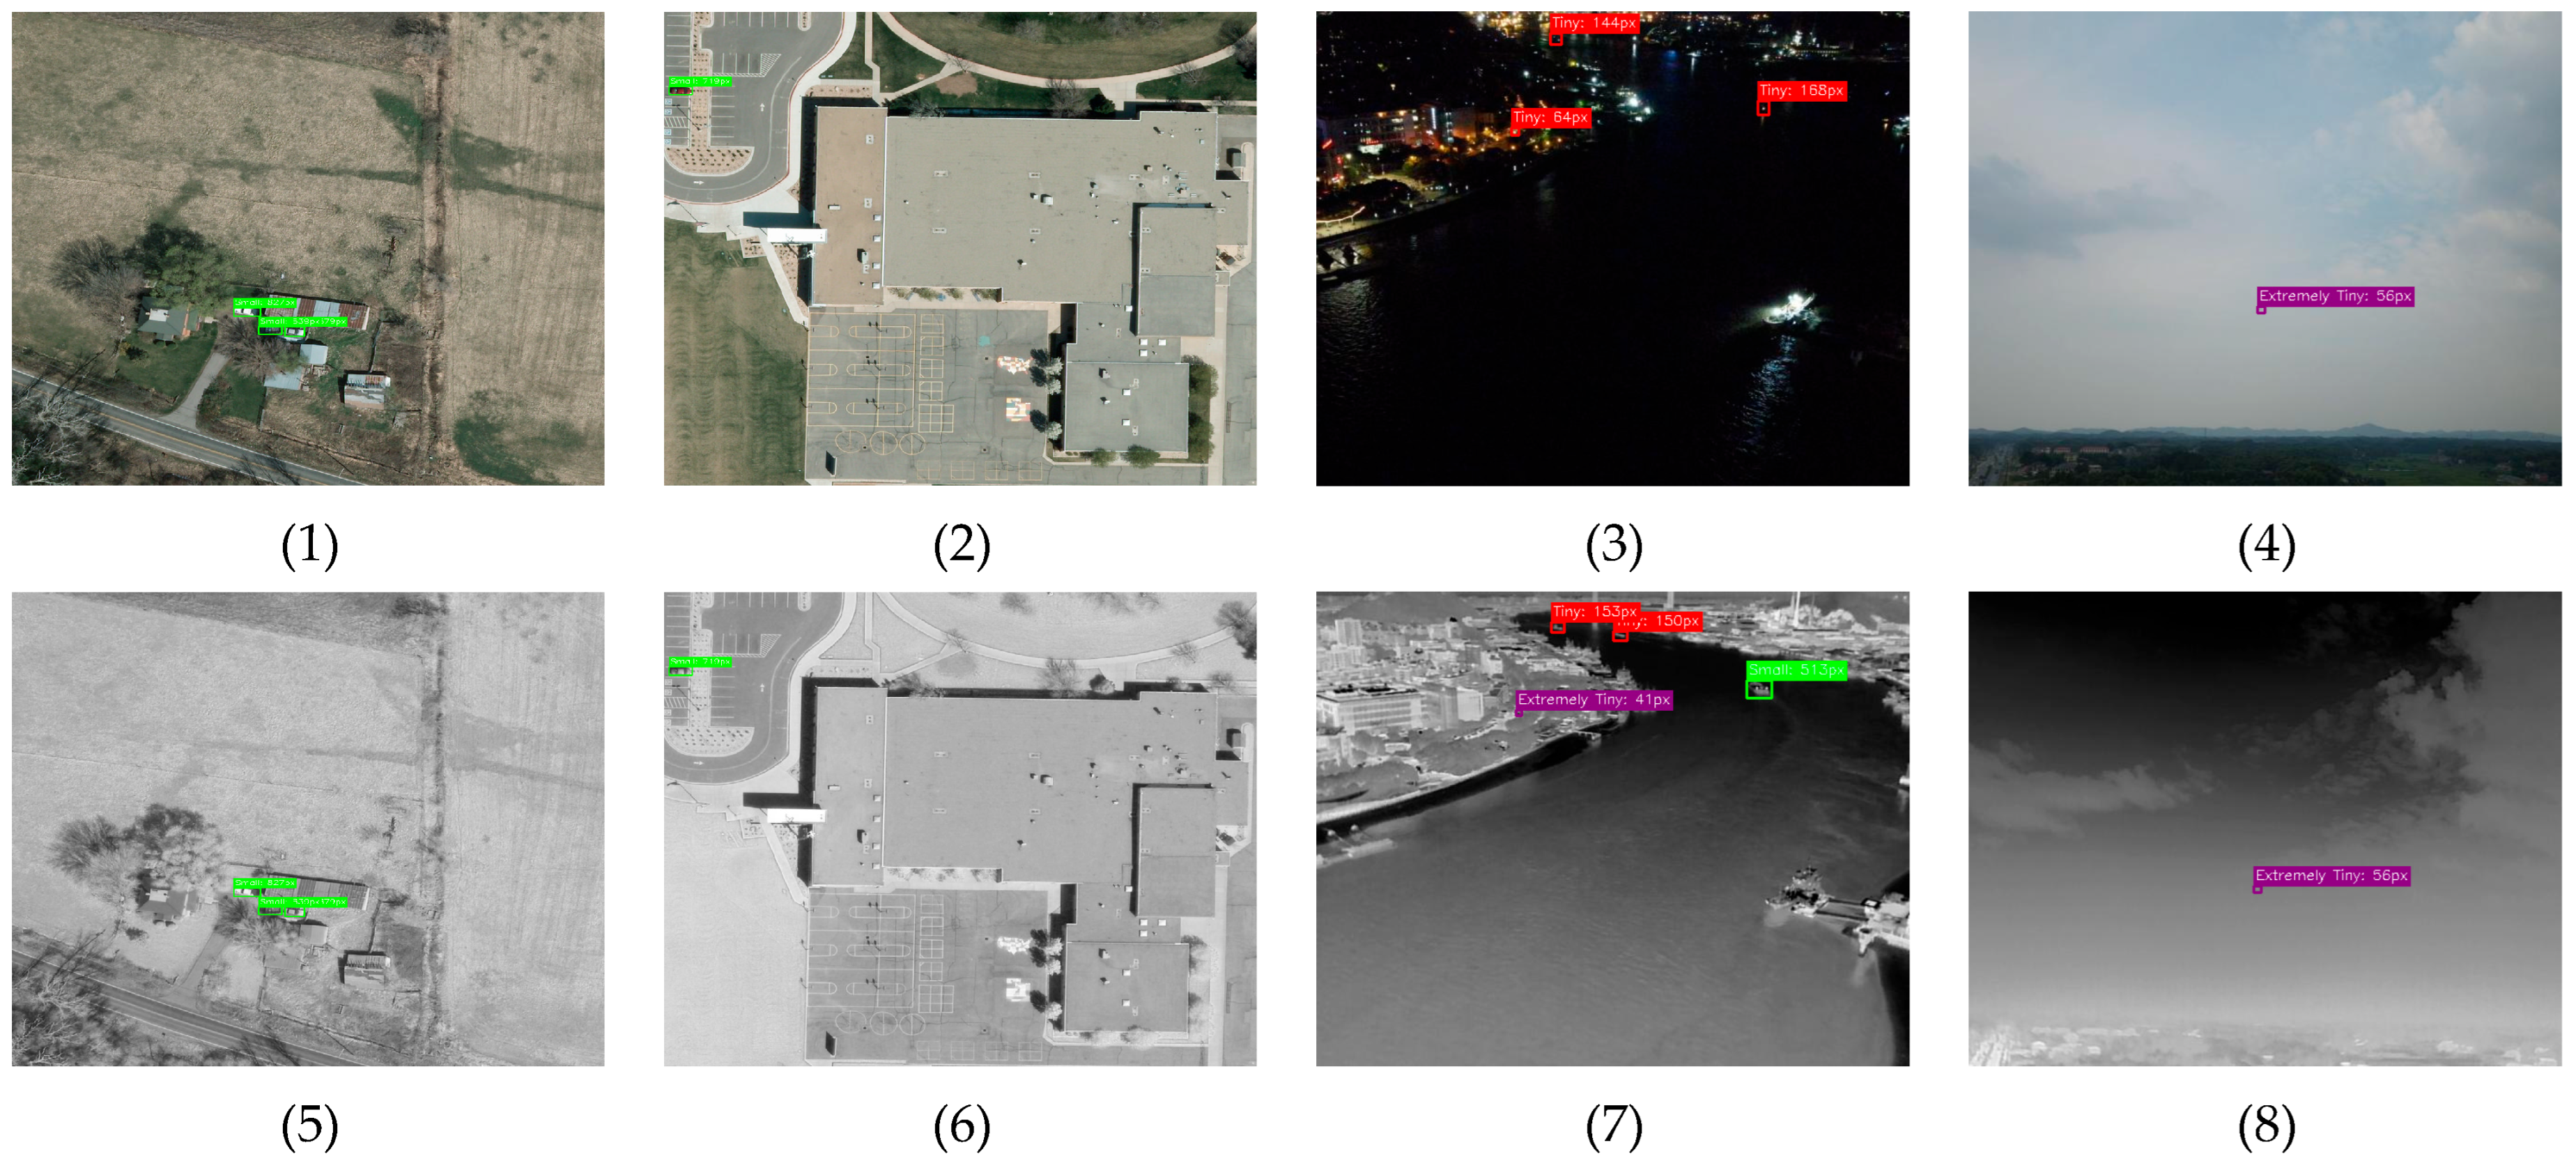
Modern Earth observation relies on multi-level platforms with distinct characteristics. As shown in Figure 1, satellite and high-altitude platforms [7] acquire visible and infrared imagery at 12.5–25 cm/pixel resolution, covering diverse land surface scenes suitable for large-scale urban monitoring and land use analysis [8,9]. Low-altitude UAV platforms [10] enable flexible observation at altitudes of 60–100 m [11], covering scenes such as roads, bridges, and airports. These platforms typically carry visible and infrared sensors to acquire complementary information. Visible imaging provides rich spatial texture details but is susceptible to illumination conditions and atmospheric scattering, while infrared imaging possesses inherent robustness to illumination variations and can provide effective target–background contrast even under low-light or darkness conditions [12,13,14,15]. Effective fusion of these complementary modalities can significantly enhance small object detection capability [16,17]. However, multi-platform remote sensing applications face common challenges. Targets occupy extremely low proportions in images with complex backgrounds posing severe interference [18,19,20,21], altitude variations lead to extreme scale changes [10], and modality quality fluctuates significantly with scene and illumination conditions. How to effectively fuse multi-source heterogeneous remote sensing information to improve small object detection performance remains a critical problem [22,23].
Researchers have explored small object detection in aerial remote sensing from three directions. In multimodal fusion, early methods adopted simple concatenation strategies [24,25], while recent attention-based methods such as GAFF [26], CFT [27], and C2Former [28] have achieved adaptive fusion through dynamic weight adjustment, cross-modal dependency modeling, and dual-branch interaction, respectively. In network architecture, FPN [29] and its variants PANet [30] and BiFPN [31] have been widely introduced for multi-scale feature fusion, while SuperYOLO [14], and ALCNet [32] address remote sensing-specific challenges including feature degradation and weak infrared target detection. In training strategies, Focal Loss [33], ATSS [34], and FCOS [35] have been transferred to remote sensing scenarios, mitigating sample imbalance from perspectives of loss reweighting, adaptive sample assignment, and low-quality prediction suppression, respectively.
Despite significant progress, existing methods suffer from three fundamental limitations. First, scene diversity and dynamic imaging conditions cause modality reliability to exhibit spatial heterogeneity [36,37], where visible modality dominates in well-illuminated regions while infrared remains robust under vegetation shadows, low-light, or darkness conditions. However, existing fusion methods [26,27,28] assume spatially uniform reliability, failing to capture pixel-level differences. Second, wide-area coverage requirements compress targets to extremely low pixel proportions, causing severe spatial information degradation in deep networks [38]. Traditional feature pyramids [29,30,31] apply uniform processing across all levels, neglecting scale-specific requirements and resulting in degraded performance under complex backgrounds [32]. Third, physical limitations such as sensor point spread function, atmospheric turbulence, and platform attitude variations introduce 1–2 pixel boundary localization uncertainty [39], creating fundamental conflicts with IoU threshold-based positive sample assignment strategies [34,35]. These three challenges form a coupled propagation chain: modal reliability heterogeneity introduces fusion noise → spatial information degradation amplifies this noise → annotation uncertainty conflicts with precise matching requirements. Existing works [26,27,28,32,34] address these problems independently, failing to recognize their interdependencies. This paper proposes RAPT-Net as a systematic solution with three synergistic modules designed to break this propagation chain through feedback mechanisms.
To address the aforementioned common technical challenges in small object detection for aerial remote sensing, this paper proposes RAPT-Net (Reliability-Aware Precision-Preserving Tolerance-Enhanced Network), an adaptive multimodal small object detection framework for multi-platform remote sensing applications. The main contributions of this paper include the following four aspects.
(1)
To address the spatial heterogeneity of modality reliability caused by scene diversity and dynamic imaging conditions, we propose the Modality Reliability Assessment and Adaptive Fusion module (MRAAF). MRAAF models modality reliability as a scene-condition joint function, achieving pixel-level adaptive modality integration through two-stage progressive fusion and reliability-guided feedback mechanisms, effectively suppressing the interference of atmospheric disturbances and illumination variations on fusion quality, This differs fundamentally from existing single-stage fusion methods [26,27,28] that lack reliability feedback mechanisms to adjust fusion quality dynamically.
(2)
To address target scale compression and spatial information degradation caused by wide-area coverage observation requirements, we design the Cross-Modal Feature Enhancement with Spatial Resolution Preservation module (CMFE-SRP). The CMFE-SRP module employs a hierarchy-specific processing strategy: shallow layers preserve geometric contour details, middle layers fuse multi-source complementary features, and deep layers aggregate geospatial context, achieving a balance between spatial detail preservation and semantic enhancement. Unlike existing methods [14,31,32] that apply uniform processing across all pyramid levels, CMFE-SRP employs differentiated designs adapted to scale-specific requirements at each hierarchy.
(3)
To address the fundamental conflict between annotation ambiguity introduced by remote sensing physical limitations and IoU-based training strategies, we propose the Dense Supervision with Spatial Tolerance Domain strategy (DS-STD). DS-STD establishes a spatial tolerance mechanism targeting the 1–2 pixel boundary localization uncertainty introduced by imaging physical limitations: boundary proximity extension tolerates grid assignment ambiguity of target centers, and aspect ratio tolerance matching accommodates target shape variations caused by observation angle changes, jointly increasing positive sample coverage by 4×. Distinct from data-driven adaptive thresholding methods [34], DS-STD is physics-driven, directly modeling the inherent 1–2 pixel imaging uncertainty [39] of remote sensing platforms.
(4)
Addressing the coupled nature of these challenges, we design a systematic framework where modules interact through feedback loops: MRAAF’s reliability assessment guides CMFE-SRP’s hierarchical processing, and both influence DS-STD’s spatial tolerance design. Comprehensive ablation studies demonstrate that the synergistic gain (6.07% mAP total improvement) results from this systematic interaction rather than the simple addition of independent contributions. Comprehensive validation on VEDAI [7] and RGBT-Tiny [10] demonstrates mAP values of 62.22% and 18.52%, respectively, improving existing state-of-the-art methods by 4.3% and 10.3%, with a 17.3% improvement on extremely tiny targets, validating the effectiveness of the proposed method across different remote sensing platforms.
The remainder of this paper is organized as follows. Section 2 reviews related work. Section 3 elaborates the network architecture and module design of RAPT-Net. Section 4 presents experimental results and analysis. Section 5 concludes the paper.

2. Materials and Methods

2.1. Characteristics of Small Objects in Remote Sensing Scenarios

Small objects in remote sensing originate from the inherent geometric constraints of aerial observation. The projected size of targets on the imaging plane is inversely proportional to the sensor–target distance: when the observation distance increases from 100 m to 1000 m, the pixel proportion of targets with identical physical dimensions decreases by approximately 100 times. This scale compression is an intrinsic characteristic of imaging geometry, fundamentally distinguishing it from controlled close-range imaging environments.
The academic community primarily defines small objects based on pixel area. The MS COCO standard [40] defines small objects as those with area smaller than 32 × 32 pixels, which has been widely adopted as a reference benchmark. Addressing the unique scale distribution in remote sensing, Ying et al. [10] further subdivided the MS COCO small object category into three sub-levels—extremely tiny objects ( 1 2 8 2 pixels), tiny objects ( 8 2 16 2 pixels), and small objects ( 16 2 32 2 pixels)—to more precisely characterize the dominant distribution of tiny objects in aerial imagery. The infrared detection domain adopts classifications of extremely tiny ( 0 36 pixels), tiny ( 36 81 pixels), and small ( 81 256 pixels) [41]. Satellite surveillance typically encounters targets smaller than 20 × 20 pixels [42]. The relative area criterion defines small objects as those occupying less than 1% of image area [43], such as objects smaller than 30 × 30 pixels in a 2048 × 2048 pixel image [44].

2.2. Multi-Platform Aerial Remote Sensing Datasets

Aerial remote sensing visible–infrared datasets reflect platform-specific imaging geometry, with target scale distributions directly determined by observation altitude. As discussed in Section 2.1, the sensor–target distance fundamentally determines target pixel footprint, which explains the systematic scale differences between high-altitude and low-altitude platforms.
High-altitude and low-altitude platforms exhibit complementary observation characteristics and challenges. High-altitude platforms (primarily satellites) achieve wide-area coverage at the cost of severe scale compression. For example, VEDAI [7] collects 1210 pairs of vehicle images at 12.5–25 cm/pixel resolution, with small and medium targets comprising 40.7% and 58.3%, respectively. Low-altitude platforms (primarily UAVs) introduce extreme scale variations due to flight dynamics, leading to datasets such as DVTOD [45], DroneVehicle [46], and RGBTDronePerson [47]. Among these, RGBT-Tiny [10], as the first large-scale benchmark specifically designed for visible–infrared tiny object detection, contains 115 sequences, 93,000 frames, and 1.2 million annotations, with 81.5% of targets smaller than 16 × 16 pixels, providing an unprecedented platform for algorithm validation under extreme scale conditions.
Table 1 summarizes the target scale distributions of typical multi-platform aerial remote sensing datasets, adopting the classification scheme proposed by Ying et al.: extremely tiny ( 1 2 A 8 2 ), tiny ( 8 2 < A 16 2 ), small ( 16 2 < A 32 2 ), medium ( 32 2 < A 96 2 ), and large ( A > 96 2 ) pixels. Platform-dependent patterns are clearly visible: high-altitude datasets concentrate on small-medium categories due to stable observation geometry, while UAV datasets exhibit bimodal distributions—DVTOD and DroneVehicle primarily contain medium-large targets due to lower flight altitudes, whereas RGBTDronePerson and RGBT-Tiny shift significantly toward extremely tiny and tiny categories. This diversity validates the applicability of the proposed framework under different aerial observation conditions.

2.3. Multimodal Small Object Detection Algorithms for Aerial Remote Sensing

Research on multimodal small object detection in aerial remote sensing can be divided into two categories: methods transferred from general object detection, and methods specifically designed for remote sensing challenges.
Transfer of general methods to remote sensing. In multimodal fusion, early strategies such as channel concatenation [24] and element-wise operations [25] were directly applied to remote sensing scenarios. Although attention mechanisms including GAFF [26], CFT [27], C2Former [28] improved fusion adaptability, they were originally designed for ground-view scenarios such as pedestrian detection, without considering the spatial heterogeneity of modality reliability caused by atmospheric transmission and illumination conditions in aerial remote sensing. In network architecture, multi-scale frameworks such as FPN [29], PANet [30], BiFPN [31] have been widely introduced, but their homogeneous processing strategy across all levels struggles to accommodate the highly concentrated scale distribution of remote sensing targets. In training strategies, methods such as Focal Loss [33], ATSS [34], FCOS [35], and PAA [48] mitigate imbalance issues from loss weighting and sample assignment perspectives, but their assumption of precise annotations fundamentally conflicts with the boundary ambiguity introduced by remote sensing imaging physical limitations. Recent advances in RGB-thermal fusion have explored fine-grained feature alignment strategies. Li et al. [49] proposed pseudo visible feature fusion to handle modality discrepancies in thermal object detection. Zhao et al. [50] recently reconsidered multimodal detection from a mono-modality learning perspective, demonstrating that preserving modality-specific characteristics can enhance fusion quality.
Specialized designs for remote sensing. Addressing ground sampling distance constraints in aerial imagery, SuperYOLO [14] introduces a super-resolution branch to recover feature degradation caused by downsampling. Targeting the low signal-to-noise ratio characteristics of weak infrared small targets, ALCNet [32] leverages local contrast priors to enhance target response. Addressing modality registration difficulties on UAV platforms, QFDet [47] designs quality-aware detection heads, and GLFDet [51] fuses global-local features to enhance tiny target representation. For multi-source information fusion in remote sensing, CMAFF [16] and ICAFusion [52] designed cross-modal attention mechanisms. The aforementioned methods improve remote sensing small object detection performance from specific perspectives, but have not yet formed a systematic solution addressing the three core challenges of modality reliability heterogeneity, spatial information degradation, and annotation physical ambiguity. Recent efforts have also focused on computational efficiency. Liu et al. [53] explored lightweight architectures for tiny object detection in remote sensing, achieving competitive accuracy with reduced computational complexity.

3. Methodology

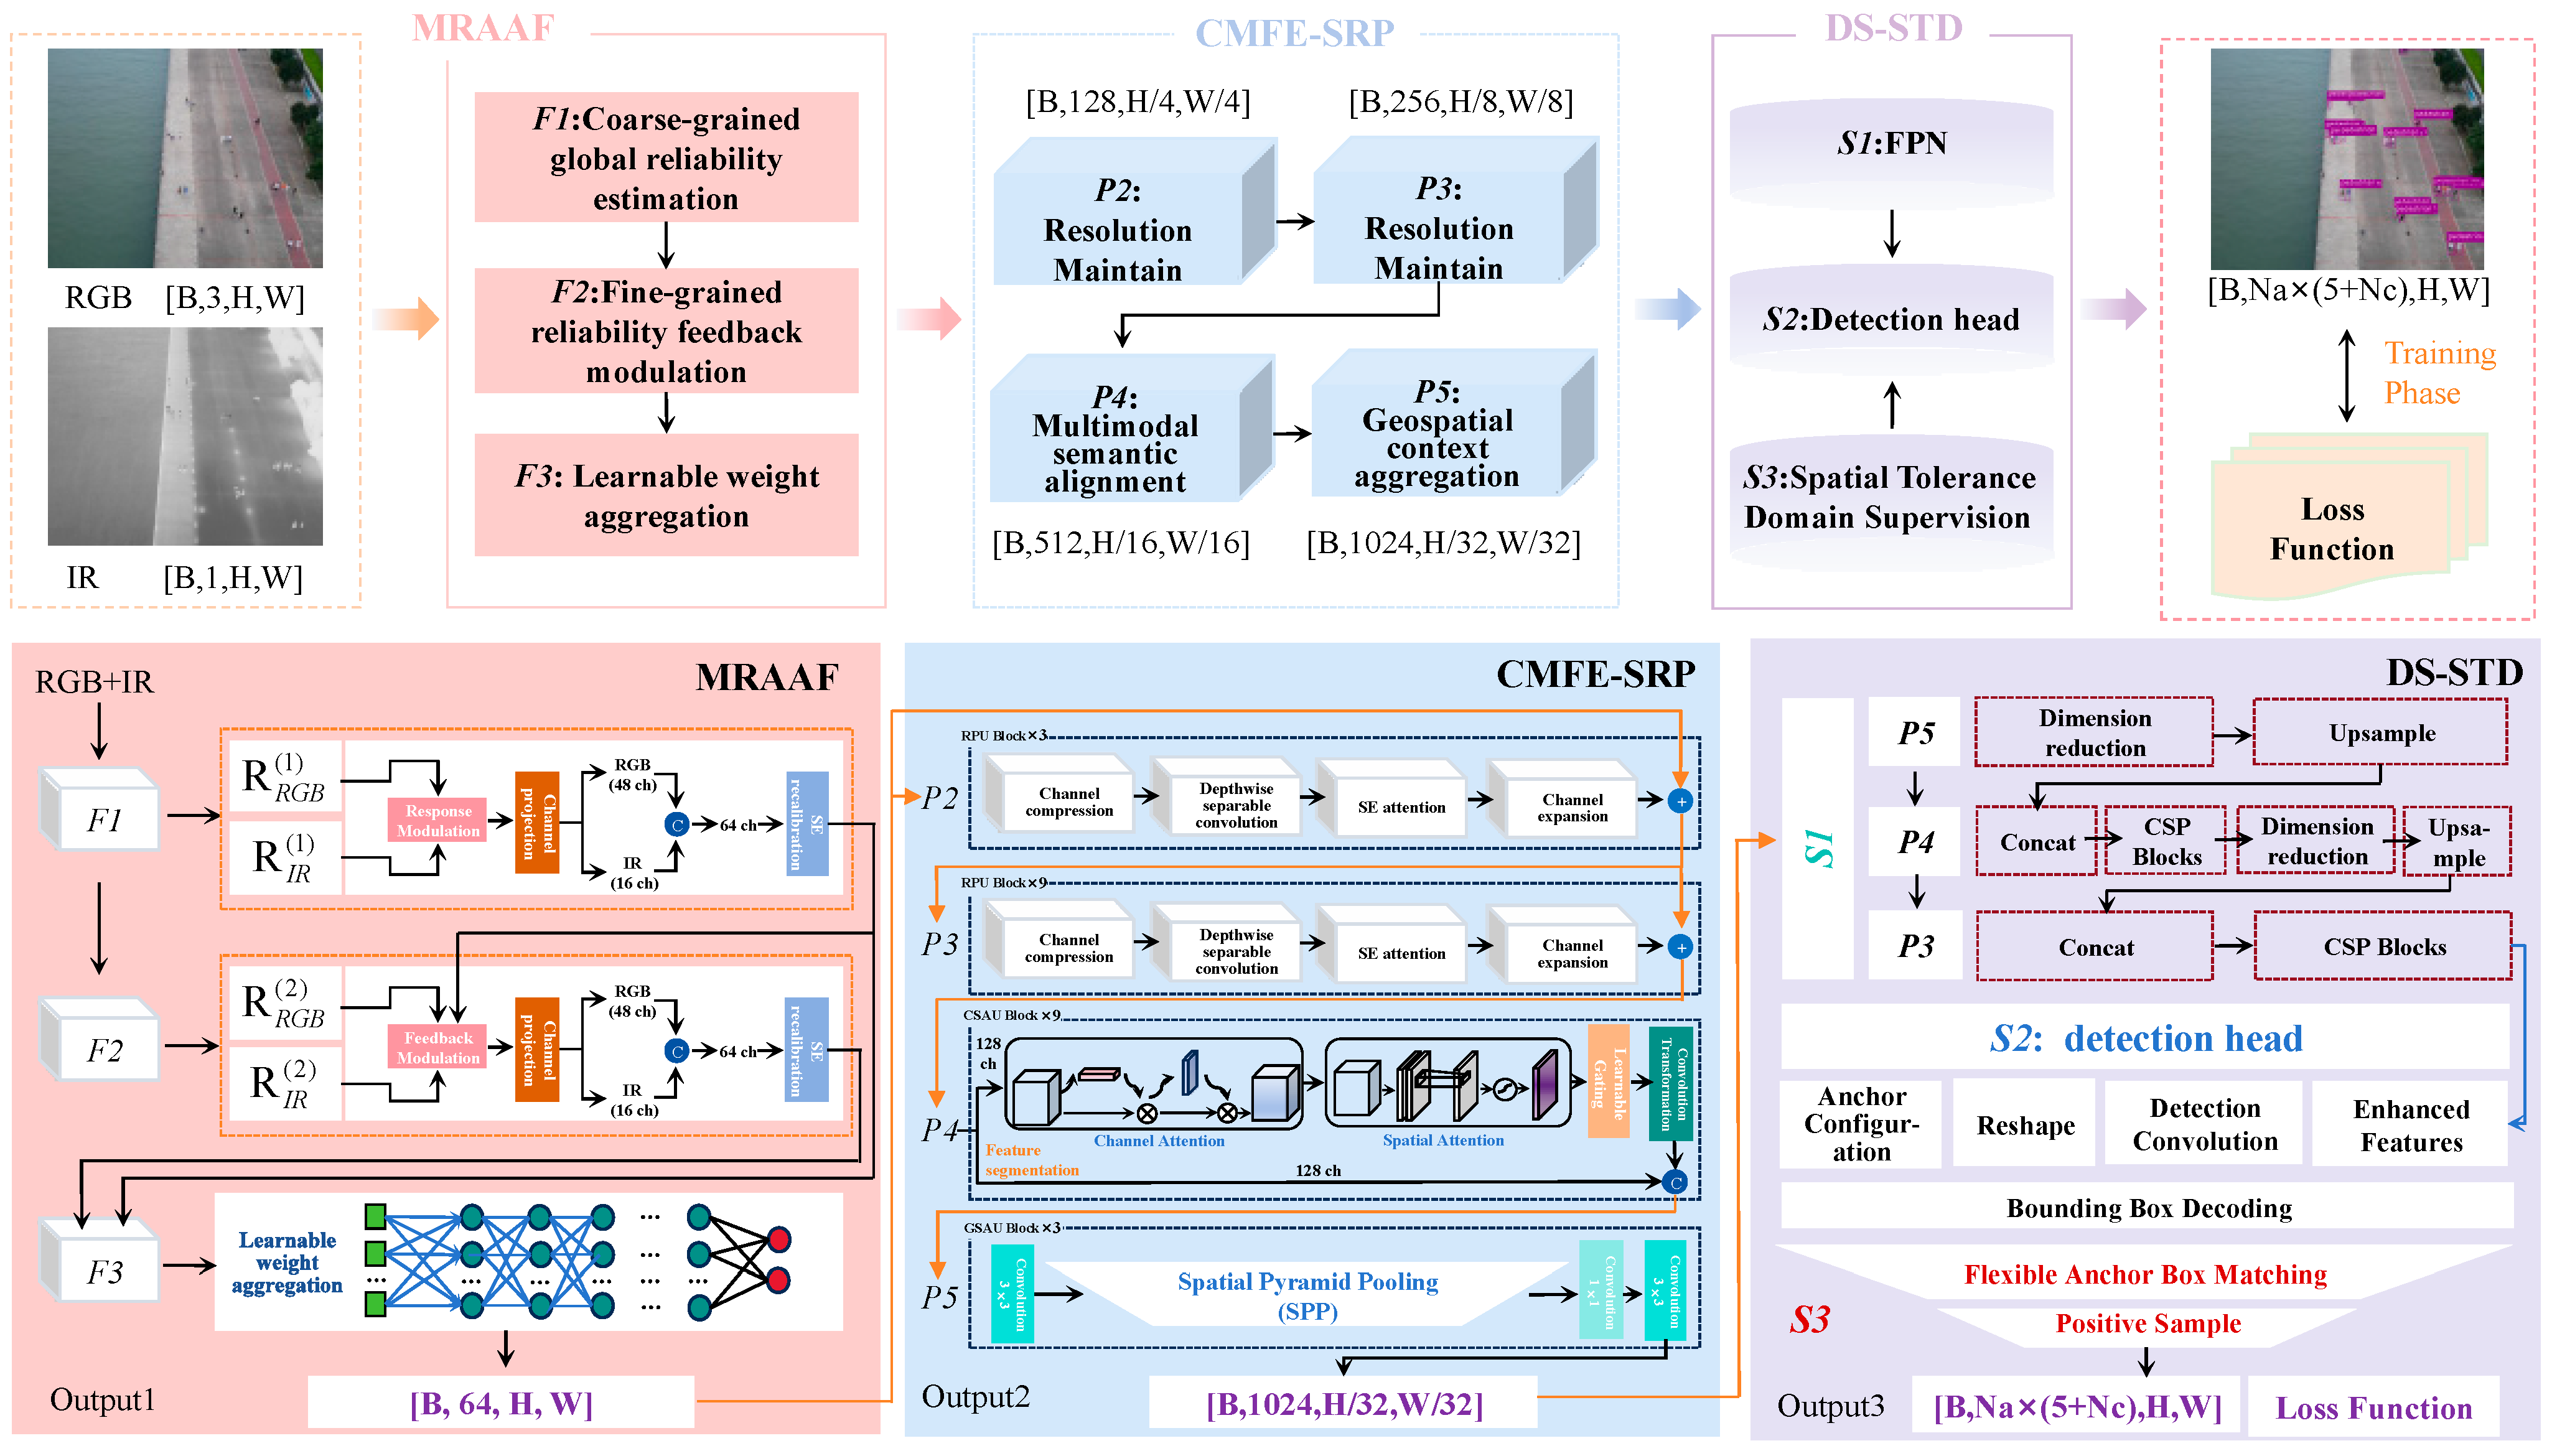
Aerial remote sensing detection algorithms face unique challenges at three stages. At the information acquisition stage, visible imaging relies on reflected solar radiation and degrades severely under low-light conditions, while infrared imaging responds to target radiation characteristics with inherent robustness to illumination variations—this complementarity exhibits spatially varying distributions depending on scene conditions. At the feature extraction stage, wide-area coverage requirements combined with progressive downsampling cause irreversible degradation of small target spatial information. At the model training stage, extremely tiny targets commonly exhibit 1–2 pixel boundary localization uncertainty [39], causing IoU to be overly sensitive to localization deviations. To address the challenges at these three stages, this paper proposes RAPT-Net, comprising three modules, MRAAF, CMFE-SRP, and DS-STD, which systematically address the core problems of multimodal small object detection in aerial remote sensing from three perspectives: fusion strategy, feature extraction, and training optimization. The overall architecture of RAPT-Net is illustrated in Figure 2.

3.1. Modality Reliability Assessment and Adaptive Fusion (MRAAF)

As discussed in Section 3, the differences in imaging mechanisms between visible and infrared sensors cause modality reliability to exhibit spatial heterogeneity. Existing fusion methods assume spatially uniform modality reliability, i.e., R RGB ( x ) = R IR ( x ) = const , failing to capture such pixel-level reliability differences.
MRAAF models modality reliability as a scene-dependent confidence function R m ( x , s ) , where x denotes spatial position and s encodes local scene conditions. This module employs a two-stage progressive fusion strategy: the first stage performs coarse-grained global reliability estimation, and the second stage conducts fine-grained reliability modulation based on feedback from the first stage.
(1) Coarse-grained Global Reliability Estimation (Stage One): Input raw images I RGB H × W × 3 and I IR H × W × 1 ; generate initial modality response maps through a lightweight convolutional network:
R RGB ( 1 ) = σ ( Conv 3 ( 2 ) ( ReLU ( Conv 3 ( 1 ) ( I RGB ) ) ) ) [ 0 , 1 ] H × W × 3
R IR ( 1 ) = σ ( Conv 3 ( 2 ) ( ReLU ( Conv 3 ( 1 ) ( I IR ) ) ) ) [ 0 , 1 ] H × W × 1
Response maps are applied to original images with residual connections:
I ^ RGB ( 1 ) = I RGB + I RGB R RGB ( 1 )
I ^ IR ( 1 ) = I IR + I IR R IR ( 1 )
Enhanced modality features are projected to an intermediate space via 3 × 3 convolution with asymmetric channel allocation (RGB: 48 channels, IR: 16 channels). The concatenated 64-channel features undergo channel response recalibration through squeeze-and-excitation mechanism:
F concat ( 1 ) = [ F RGB ( 1 ) , F IR ( 1 ) ] H × W × 64
F fused ( 1 ) = F concat ( 1 ) σ ( W 2 ReLU ( W 1 GAP ( F concat ( 1 ) ) ) )
where W 1 64 × 4 and W 2 4 × 64 are squeeze–excitation layers with reduction ratio 16.
(2) Fine-grained Reliability Feedback Modulation (Stage Two): The first-stage fusion result F fused ( 1 ) is used to evaluate modality utilization quality. We define the reliability indicator vector:
C ( 2 ) = σ ( W c GAP ( F fused ( 1 ) ) ) [ 0 , 1 ] 1 × 1 × 4
This 4-dimensional vector encodes modality balance, spatial consistency, and complementarity utilization. We decompose it into modality-specific signals:
C RGB ( 2 ) = C ( 2 ) [ 0 : 3 , : , : ] [ 0 , 1 ] 1 × 1 × 3
C IR ( 2 ) = C ( 2 ) [ 3 : 4 , : , : ] [ 0 , 1 ] 1 × 1 × 1
To achieve bidirectional adjustment based on reliability feedback, MRAAF introduces an additive modulation mechanism:
R ˜ RGB ( 2 ) = R RGB ( 2 ) ( 1 + C RGB ( 2 ) )
R ˜ IR ( 2 ) = R IR ( 2 ) ( 1 + C IR ( 2 ) )
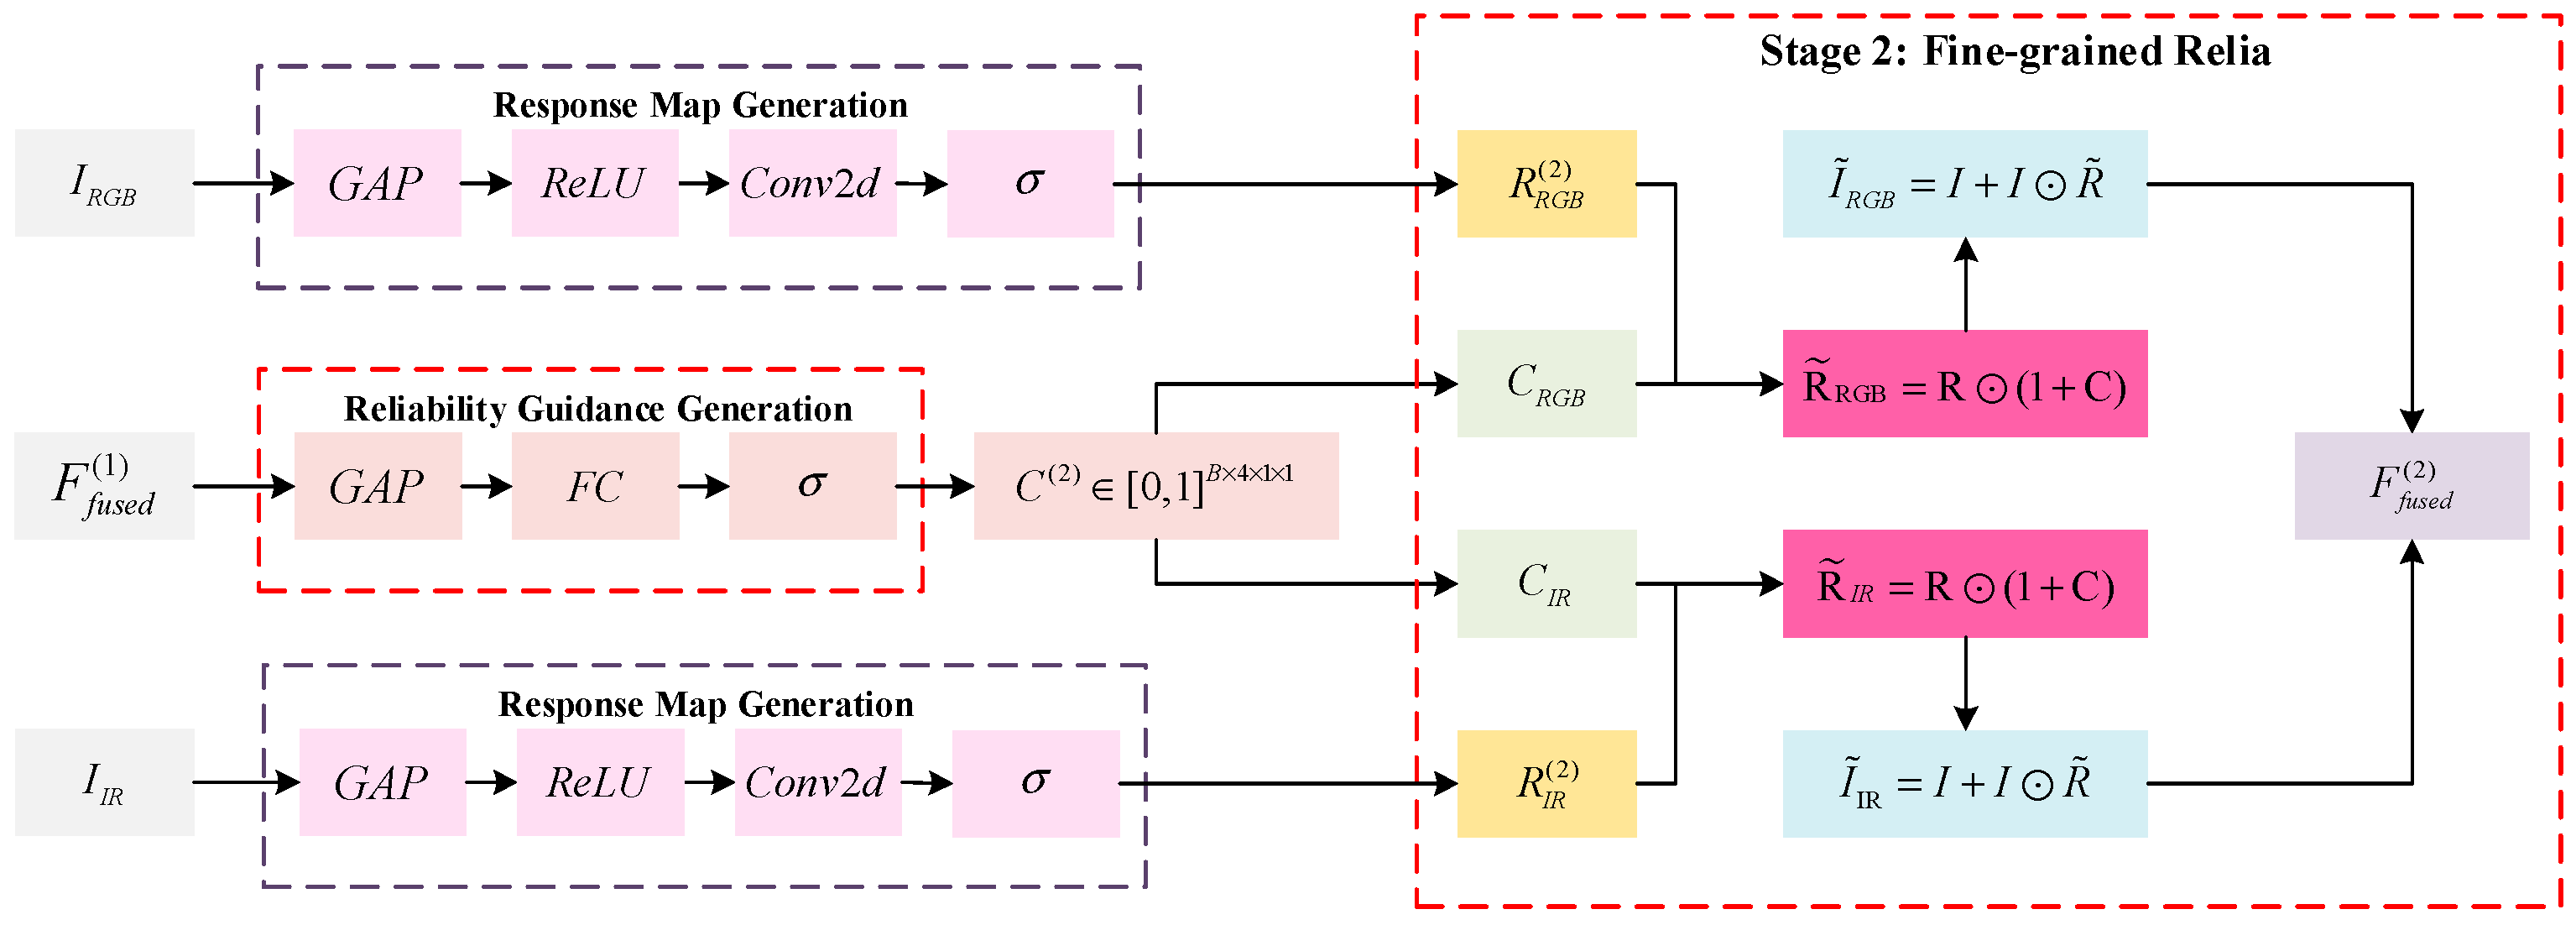
where R RGB ( 2 ) and R IR ( 2 ) are generated by a convolutional network with the same architecture as stage 1. As shown in Figure 3, the modulation factor ( 1 + C ( 2 ) ) varies in [1,2], enabling both maintenance and adaptive enhancement.
The modulated responses are applied to original inputs:
I ^ RGB ( 2 ) = I RGB + I RGB R ˜ RGB ( 2 )
I ^ IR ( 2 ) = I IR + I IR R ˜ IR ( 2 )
(3) Two-stage Weighted Aggregation: To fully utilize fusion information from both stages, we employ a learnable weighted aggregation strategy:
F fused = s = 1 2 w s F fused ( s ) , w s = exp ( α s ) k = 1 2 exp ( α k )
where weight parameters { α s } are automatically optimized through backpropagation, initialized as α 1 = log ( 0.4 ) and α 2 = log ( 0.6 ) following the weighted fusion principle in [31]. These empirically tuned values reflect a 40–60% contribution ratio for the two-stage progressive fusion, enabling MRAAF to achieve optimal balance between computational efficiency and fusion accuracy.
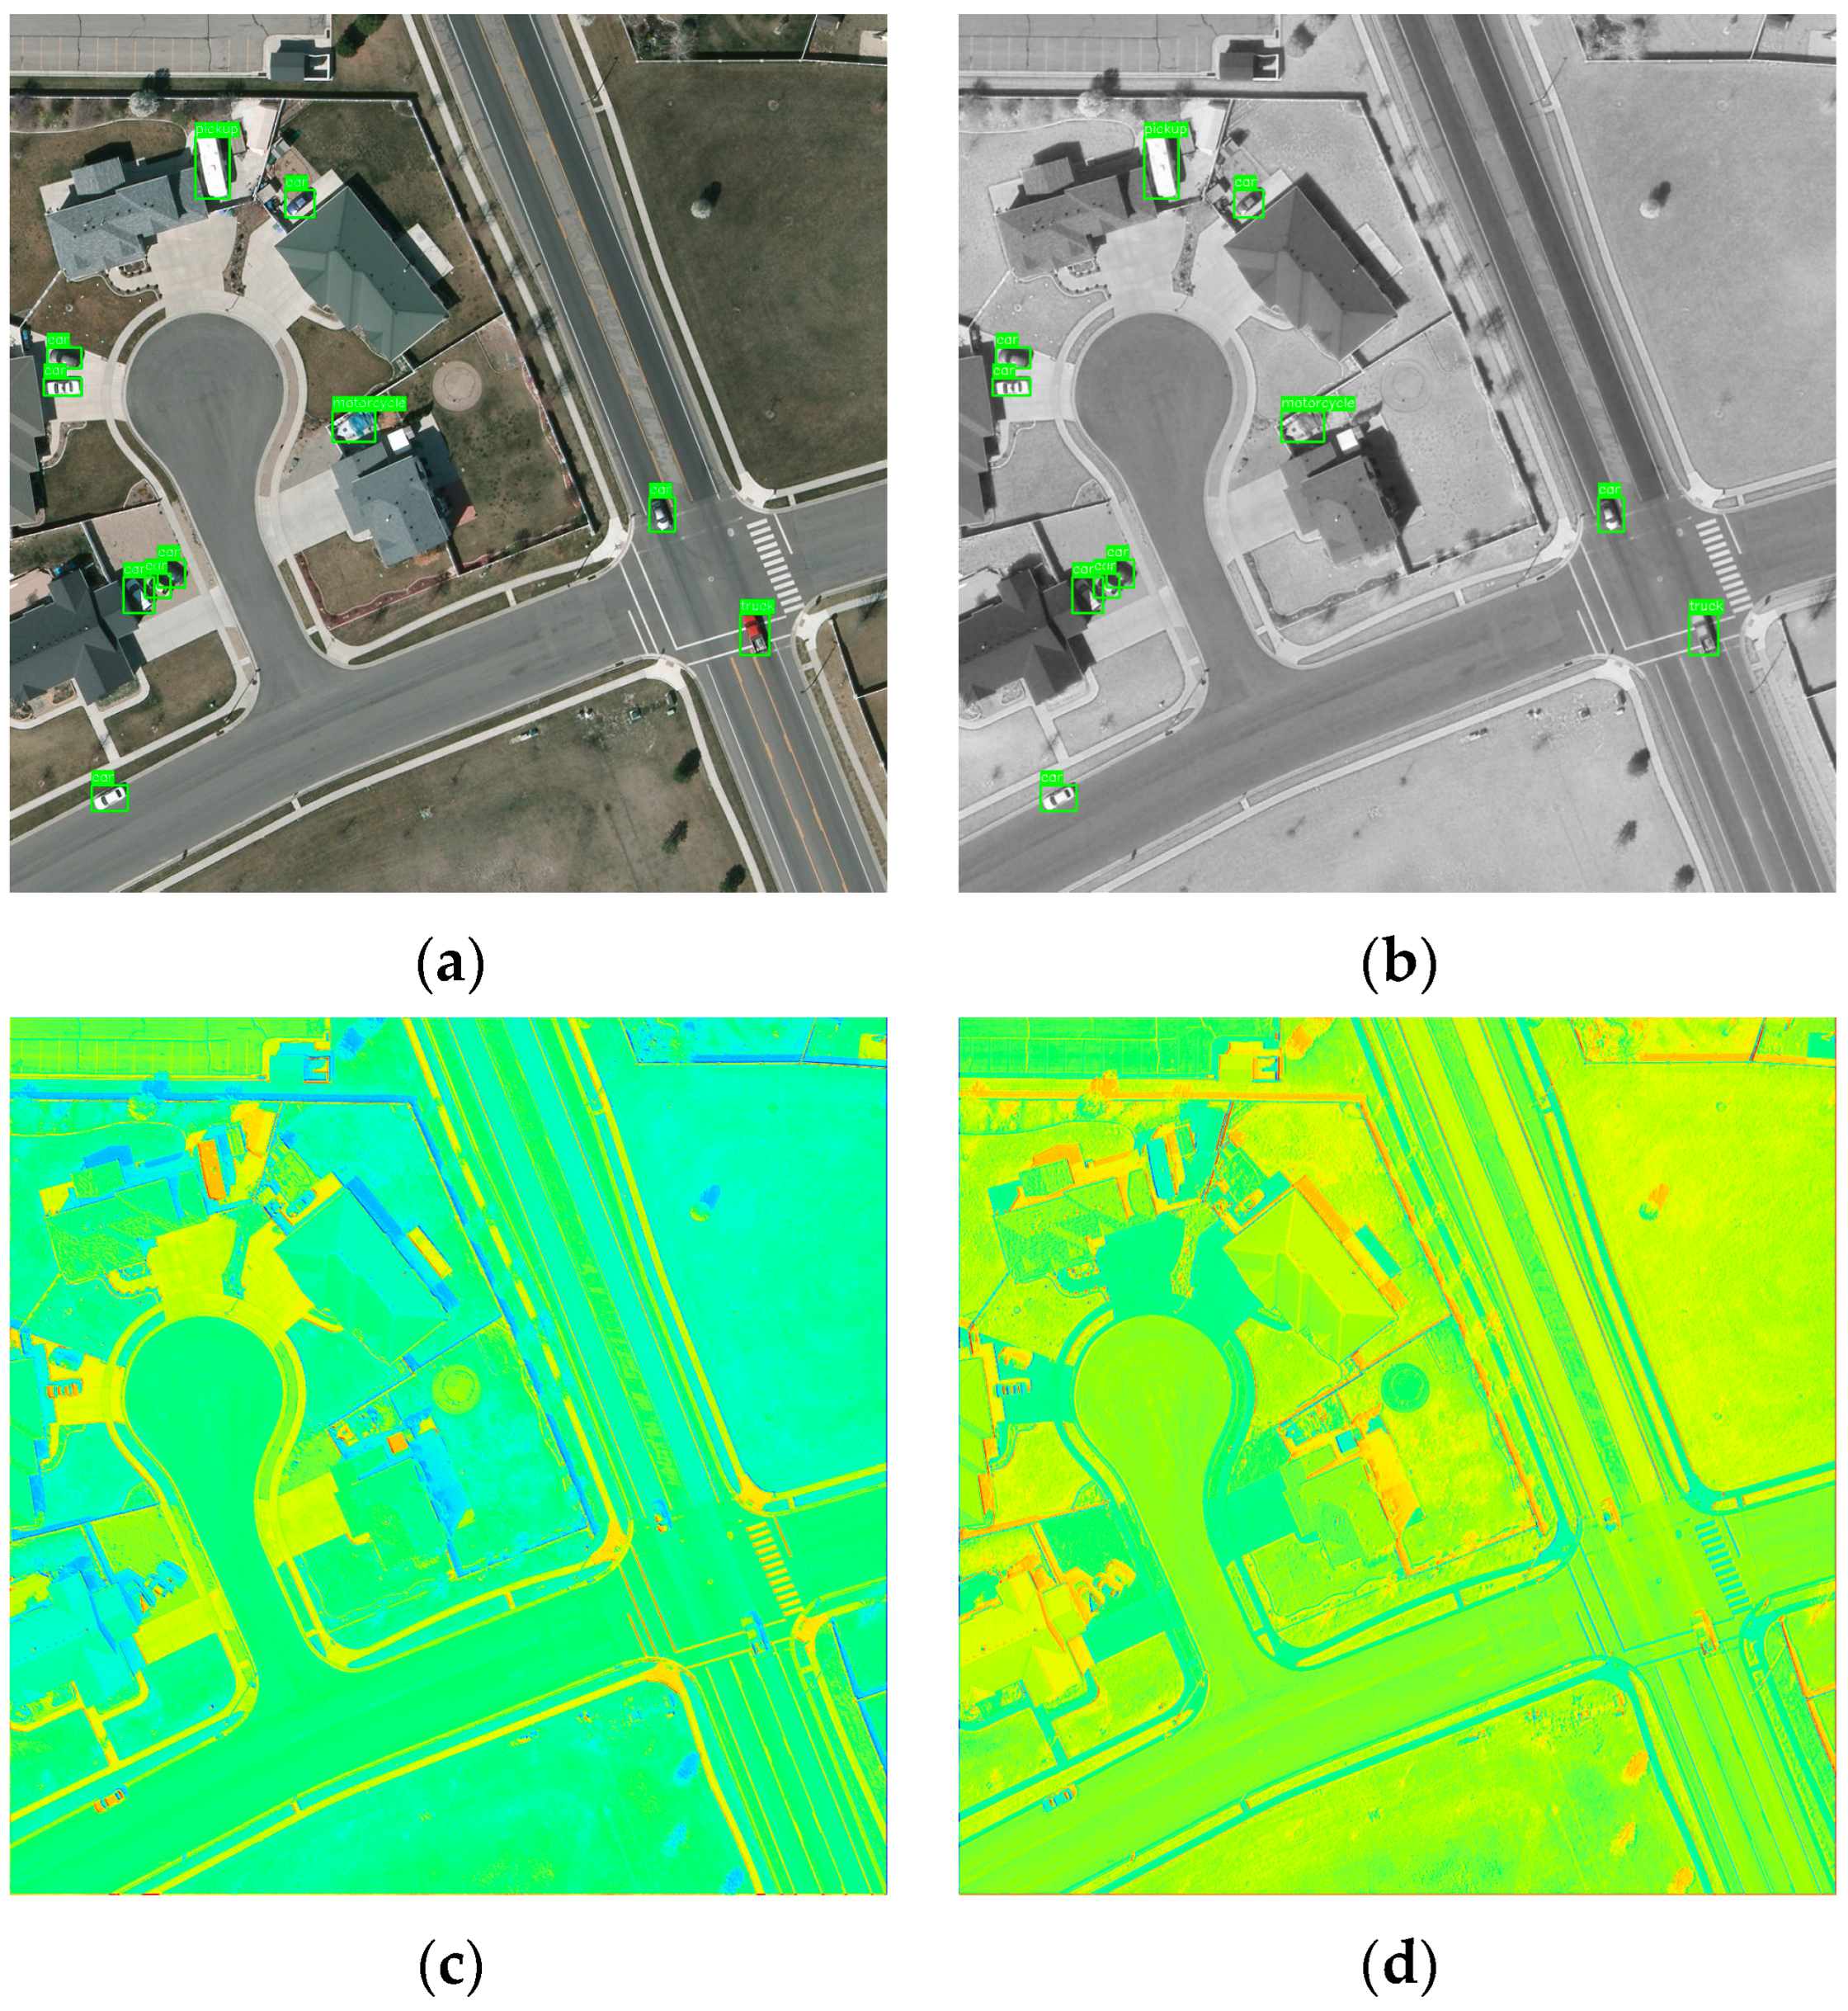
(4) Physical Interpretation of Reliability Modeling: To address the distinction between reliability modeling and conventional attention mechanisms, we provide visualization analysis in Figure 3. Unlike attention mechanisms that learn feature-level importance weights, MRAAF models scene-dependent modality reliability driven by physical imaging conditions. As shown in Figure 4, in well-illuminated regions (upper-left area), RGB modality dominates with higher reliability, yielding sharper detection results. Conversely, in shadowed areas (lower-left buildings) and regions with complex backgrounds, infrared modality maintains stable thermal contrast. The two-stage feedback mechanism progressively refines this reliability assessment: Stage 1 (Figure 4c) performs coarse-grained global estimation, while Stage 2 (Figure 4d) incorporates feedback from Stage 1 fusion quality to achieve fine-grained spatial modulation. This physics-driven design fundamentally differs from data-driven attention in that reliability weights explicitly correspond to observable imaging conditions rather than abstract feature statistics.

3.2. Cross-Modal Feature Enhancement with Spatial Resolution Preservation (CMFE-SRP)

As discussed in Section 3, wide-area coverage requirements combined with progressive downsampling cause irreversible degradation of small target spatial information. Unlike natural scenes where small objects can be treated as negligible background elements, small targets in aerial remote sensing are often core monitoring objects, such as vehicles in traffic monitoring, vessels in maritime surveillance, and personnel in search-and-rescue operations—their detection accuracy directly affects the execution of downstream tasks.
Small targets maintain relatively complete geometric contours in shallow feature maps (stride 4–8), but are compressed to sub-pixel-level representations in deep feature maps (stride 32), with spatial details completely lost. However, standard feature pyramids employ uniform feature extraction strategies across all levels, neither prioritizing the protection of shallow-layer spatial details nor providing differentiated designs for the concentrated scale characteristics.
To address these challenges, CMFE-SRP designs hierarchy-specific processing units: P2/P3 (stride 4/8) use lightweight Resolution Preserving Units (RPUs) for spatial detail preservation, P4 (stride 16) employs Cross-modal Semantic Alignment Units (CSAUs) for semantic alignment, and P5 (stride 32) adopts Geographic Spatial Aggregation Units (GSAUs) for global context aggregation.
(1) Resolution Preserving Unit (RPU): RPU for P2/P3 levels adopts depthwise separable convolution as its core to preserve detail independence of RGB-IR modalities:
F hidden   = ReLU BN Conv 1 × 1 in   α   out   F in
F spatial = Re LU ( BN ( DWConv 3 × 3 ( F hidden ) ) )
F recal = F spatial σ ( W fc 2 ReLU ( W fc 1 GAP ( F spatial ) ) )
F out   = ReLU BN Conv 1 × 1 α   out     out   F recall + F in
The bottleneck ratio α = 0.5 balances parameter efficiency and expressive capability, and the CSP structure prevents gradient vanishing. P2 uses 3 RPU blocks to avoid overfitting, while P3 uses 9 blocks to ensure sufficient feature extraction. Depthwise separable convolution is crucial for maintaining the independence of multi-source remote sensing information, because RGB and infrared images are complementary at the semantic level but spatial details may be inconsistent—shadow regions appear as dark areas in RGB, but may still exhibit thermal features in infrared. By independently processing each channel in the spatial dimension, this design avoids cross-modal interference and maintains geometric accuracy before fusion, which is crucial for precise localization of small targets.
(2) Cross-modal Semantic Alignment Unit (CSAU): CSAU for P4 layer employs sequential dual-attention mechanism. Channel attention selectively enhances modality-specific channels:
F channel = F proj σ ( W c 2 ReLU ( W c 1 GAP ( F proj ) ) )
where RGB channels encode visual features (texture, edges, gradients) and IR channels capture material spectral responses (NIR) or temperature gradients (TIR). Spatial attention follows for target–background discrimination:
M spatial   = σ ( Conv 7 × 7 ( [ AvgPool F channel , MaxPool F channel ] ) )
F spatial = F channel M spatial
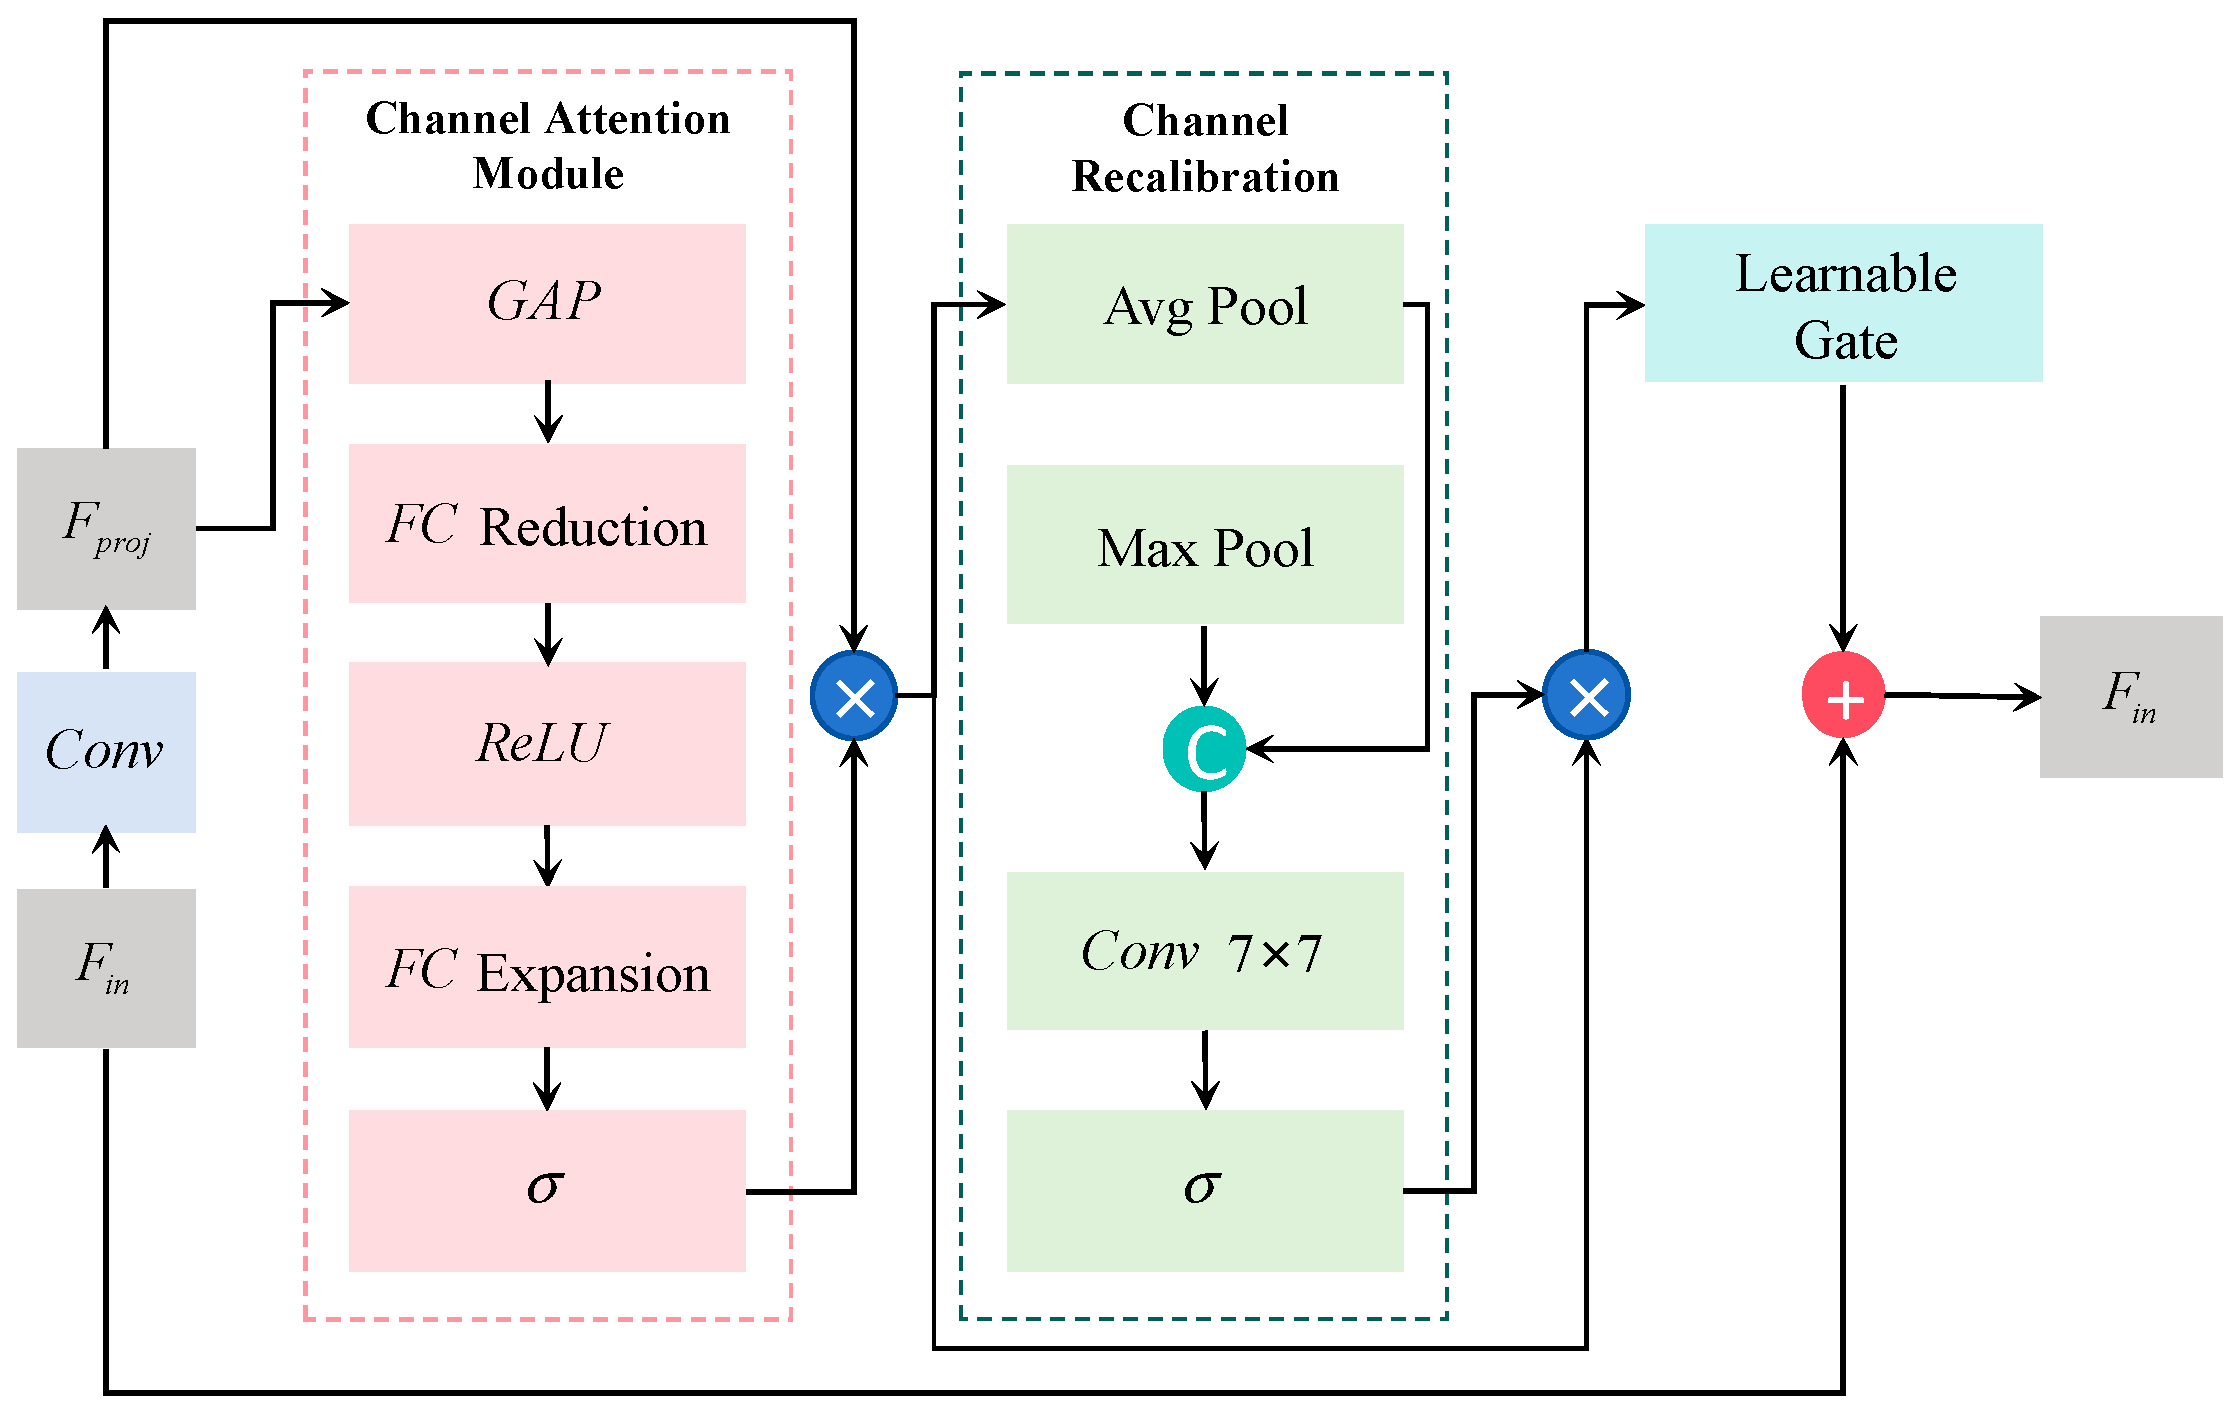
Average pooling captures smooth regional variations while max pooling captures sharp edge features. The 7 × 7 kernel provides sufficient receptive field to cover targets and surrounding context. Adaptive fusion is achieved through learnable gating γ [ 0 , 2 ] :
F out = γ F conv + F in
As shown in Figure 5, the network automatically adjusts γ based on regional characteristics. The range [0,2] enables both feature suppression (γ → 0) and adaptive amplification (γ > 1) when cross-modal complementarity is strong, enhancing weak tiny target responses.
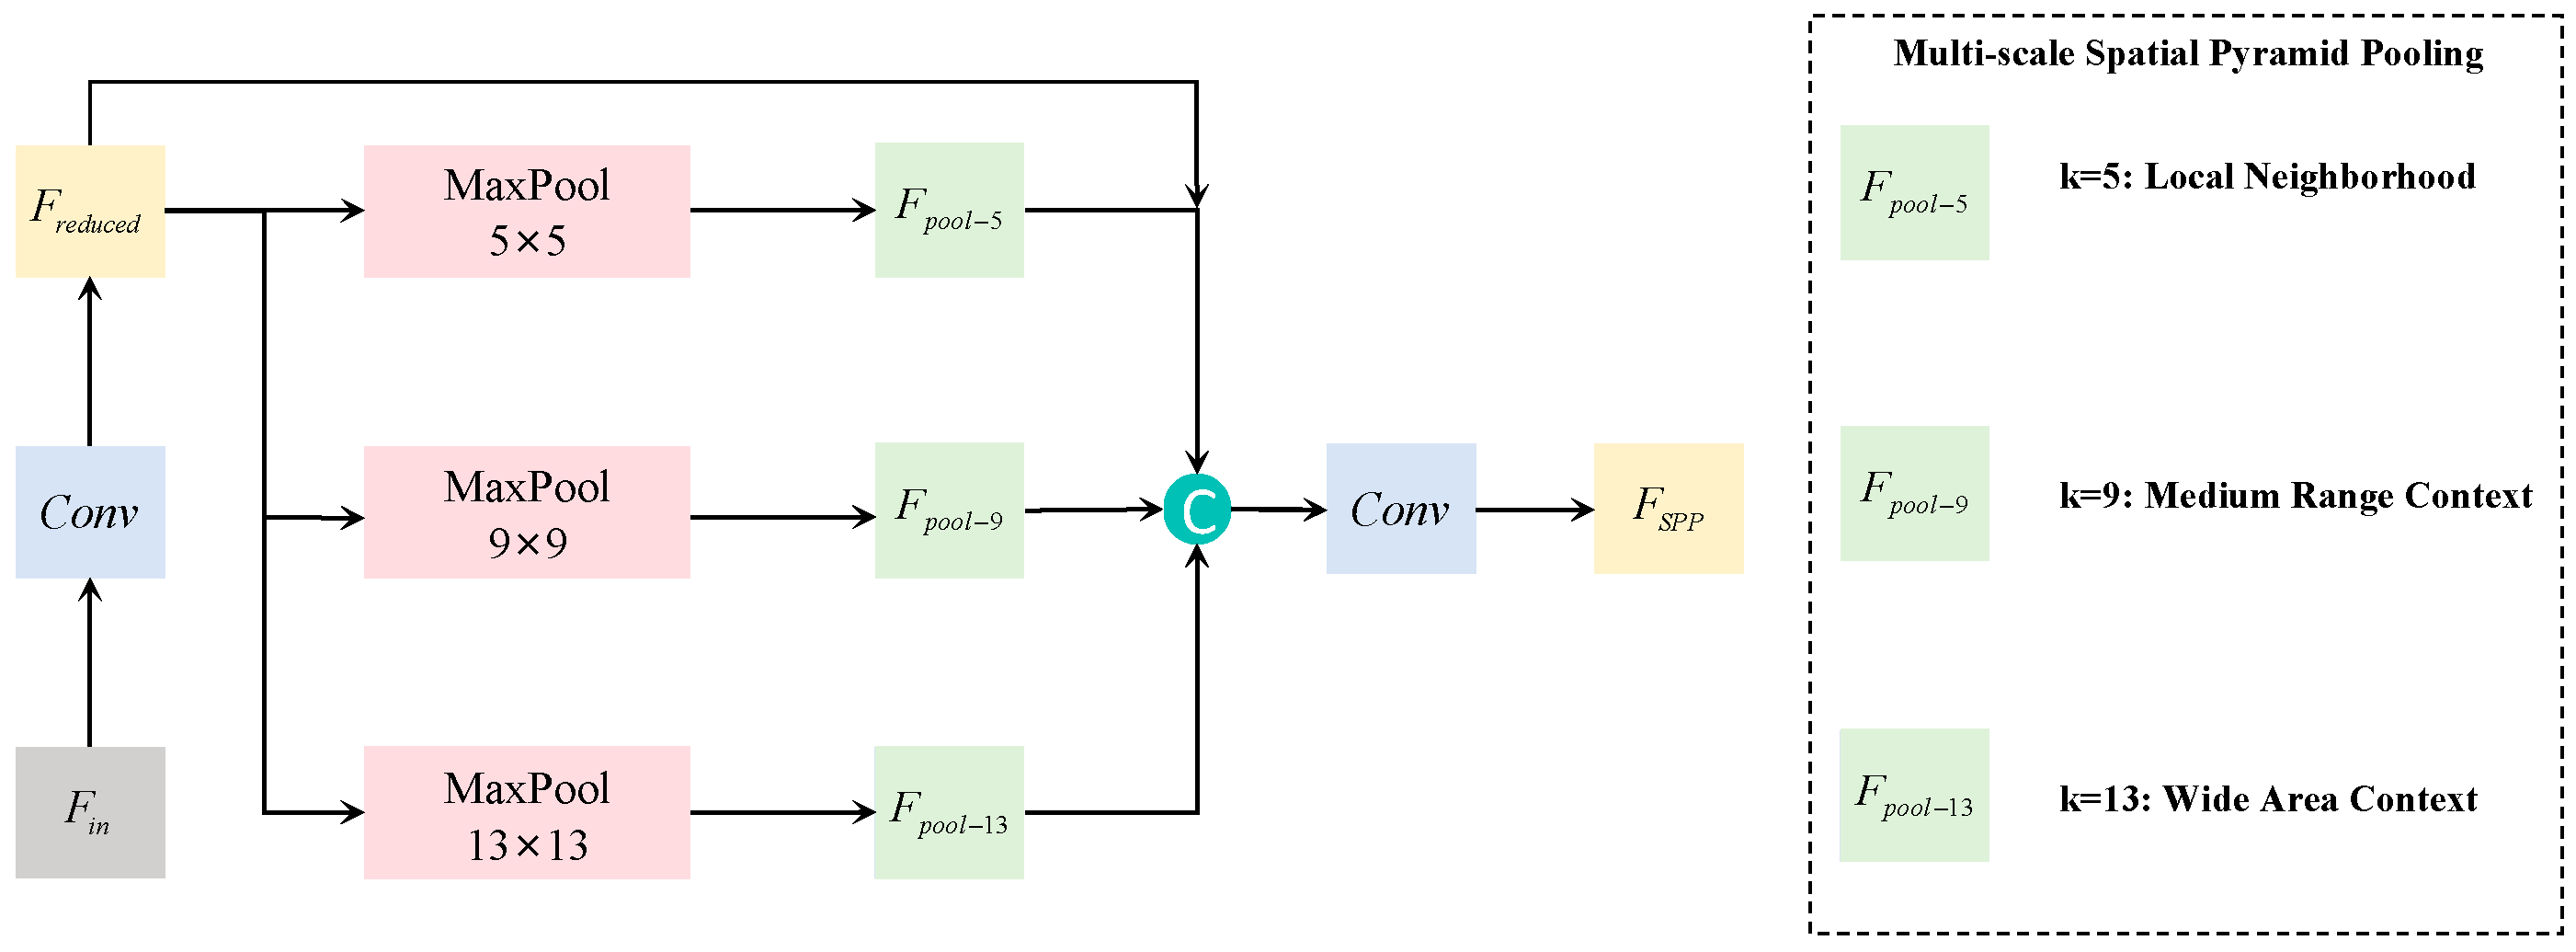
(3) Geographic Spatial Aggregation Unit (GSAU): GSAU for P5 layer employs spatial pyramid pooling to capture multi-scale geospatial context:
F reduced = Conv 1 × 1 ( F in ) H × W × C / 2
F pool - k = MaxPool k × k stride = 1 ( F reduced ) , k { 5 , 9 , 13 }
F SPP = Conv 1 × 1 ( [ F reduced , F pool - 5 , F pool - 9 , F pool - 13 ] )
Reliable identification of targets in remote sensing images relies on contextual cues—vehicles in parking lots, vessels beside docks—requiring the combination of local neighborhood, medium-range, and wide-area background information. Different pooling kernels (k = 5, 9, 13) capture geospatial context at these three levels, respectively, effectively reducing false alarm rates against complex ground surface backgrounds.
As shown in Figure 6, different pooling kernels simulate different geographic scales: k = 5 captures local neighborhoods, k = 9 captures medium-range contexts, and k = 13 captures wide-area contexts. This multi-scale context is crucial for reducing false detections of small targets. P5 uses standard bottleneck rather than lightweight RPU as the feature map size is small with low overfitting risk, and high-level semantics require stronger nonlinear transformation capability.
(4) Complete CMFE-SRP Architecture: The forward propagation follows progressive downsampling with differentiated processing:
F P 2 = CSP - RPU n = 3 ( Conv stride = 2 ( F fused ) ) H / 4 × W / 4 × 128
F P 3 = CSP - RPU n = 9 ( Conv stride = 2 ( F P 2 ) ) H / 8 × W / 8 × 256
F P 4 = CSP - CSAU n = 9 ( Conv stride = 2 ( F P 3 ) ) H / 16 × W / 16 × 512
F P 5 = CSP - Standard n = 3 ( SPP ( Conv stride = 2 ( F P 4 ) ) ) H / 32 × W / 32 × 1024
This design balances spatial–semantic trade-off by prioritizing resolution preservation in shallow layers and semantic enhancement in deep layers. Model capacity is matched to feature map size and target occupancy, while channel independence preserves modality-specific information.

3.3. Dense Supervision with Spatial Tolerance Domain (DS-STD)

Extremely tiny targets exhibit 1–2 pixel boundary localization uncertainty due to physical limitations of remote sensing imaging [39], causing IoU to be overly sensitive to deviations. For an 8 × 8 pixel target, 1-pixel deviation on each side drops IoU from 1.0 to 0.64, easily falling below the typical 0.5 positive sample threshold. Moreover, such targets mapped to stride-8 feature maps occupy only 1 × 1 grid cells, producing positive-to-negative sample ratios exceeding 1:10,000 that overwhelm localization gradients with background signals. To address these problems, DS-STD proposes the spatial tolerance domain concept: the boundary proximity extension rule tolerates grid assignment ambiguity between adjacent cells, while the aspect ratio tolerance matching rule accommodates pixel-level annotation deviations, jointly extending positive sample regions around target centers.
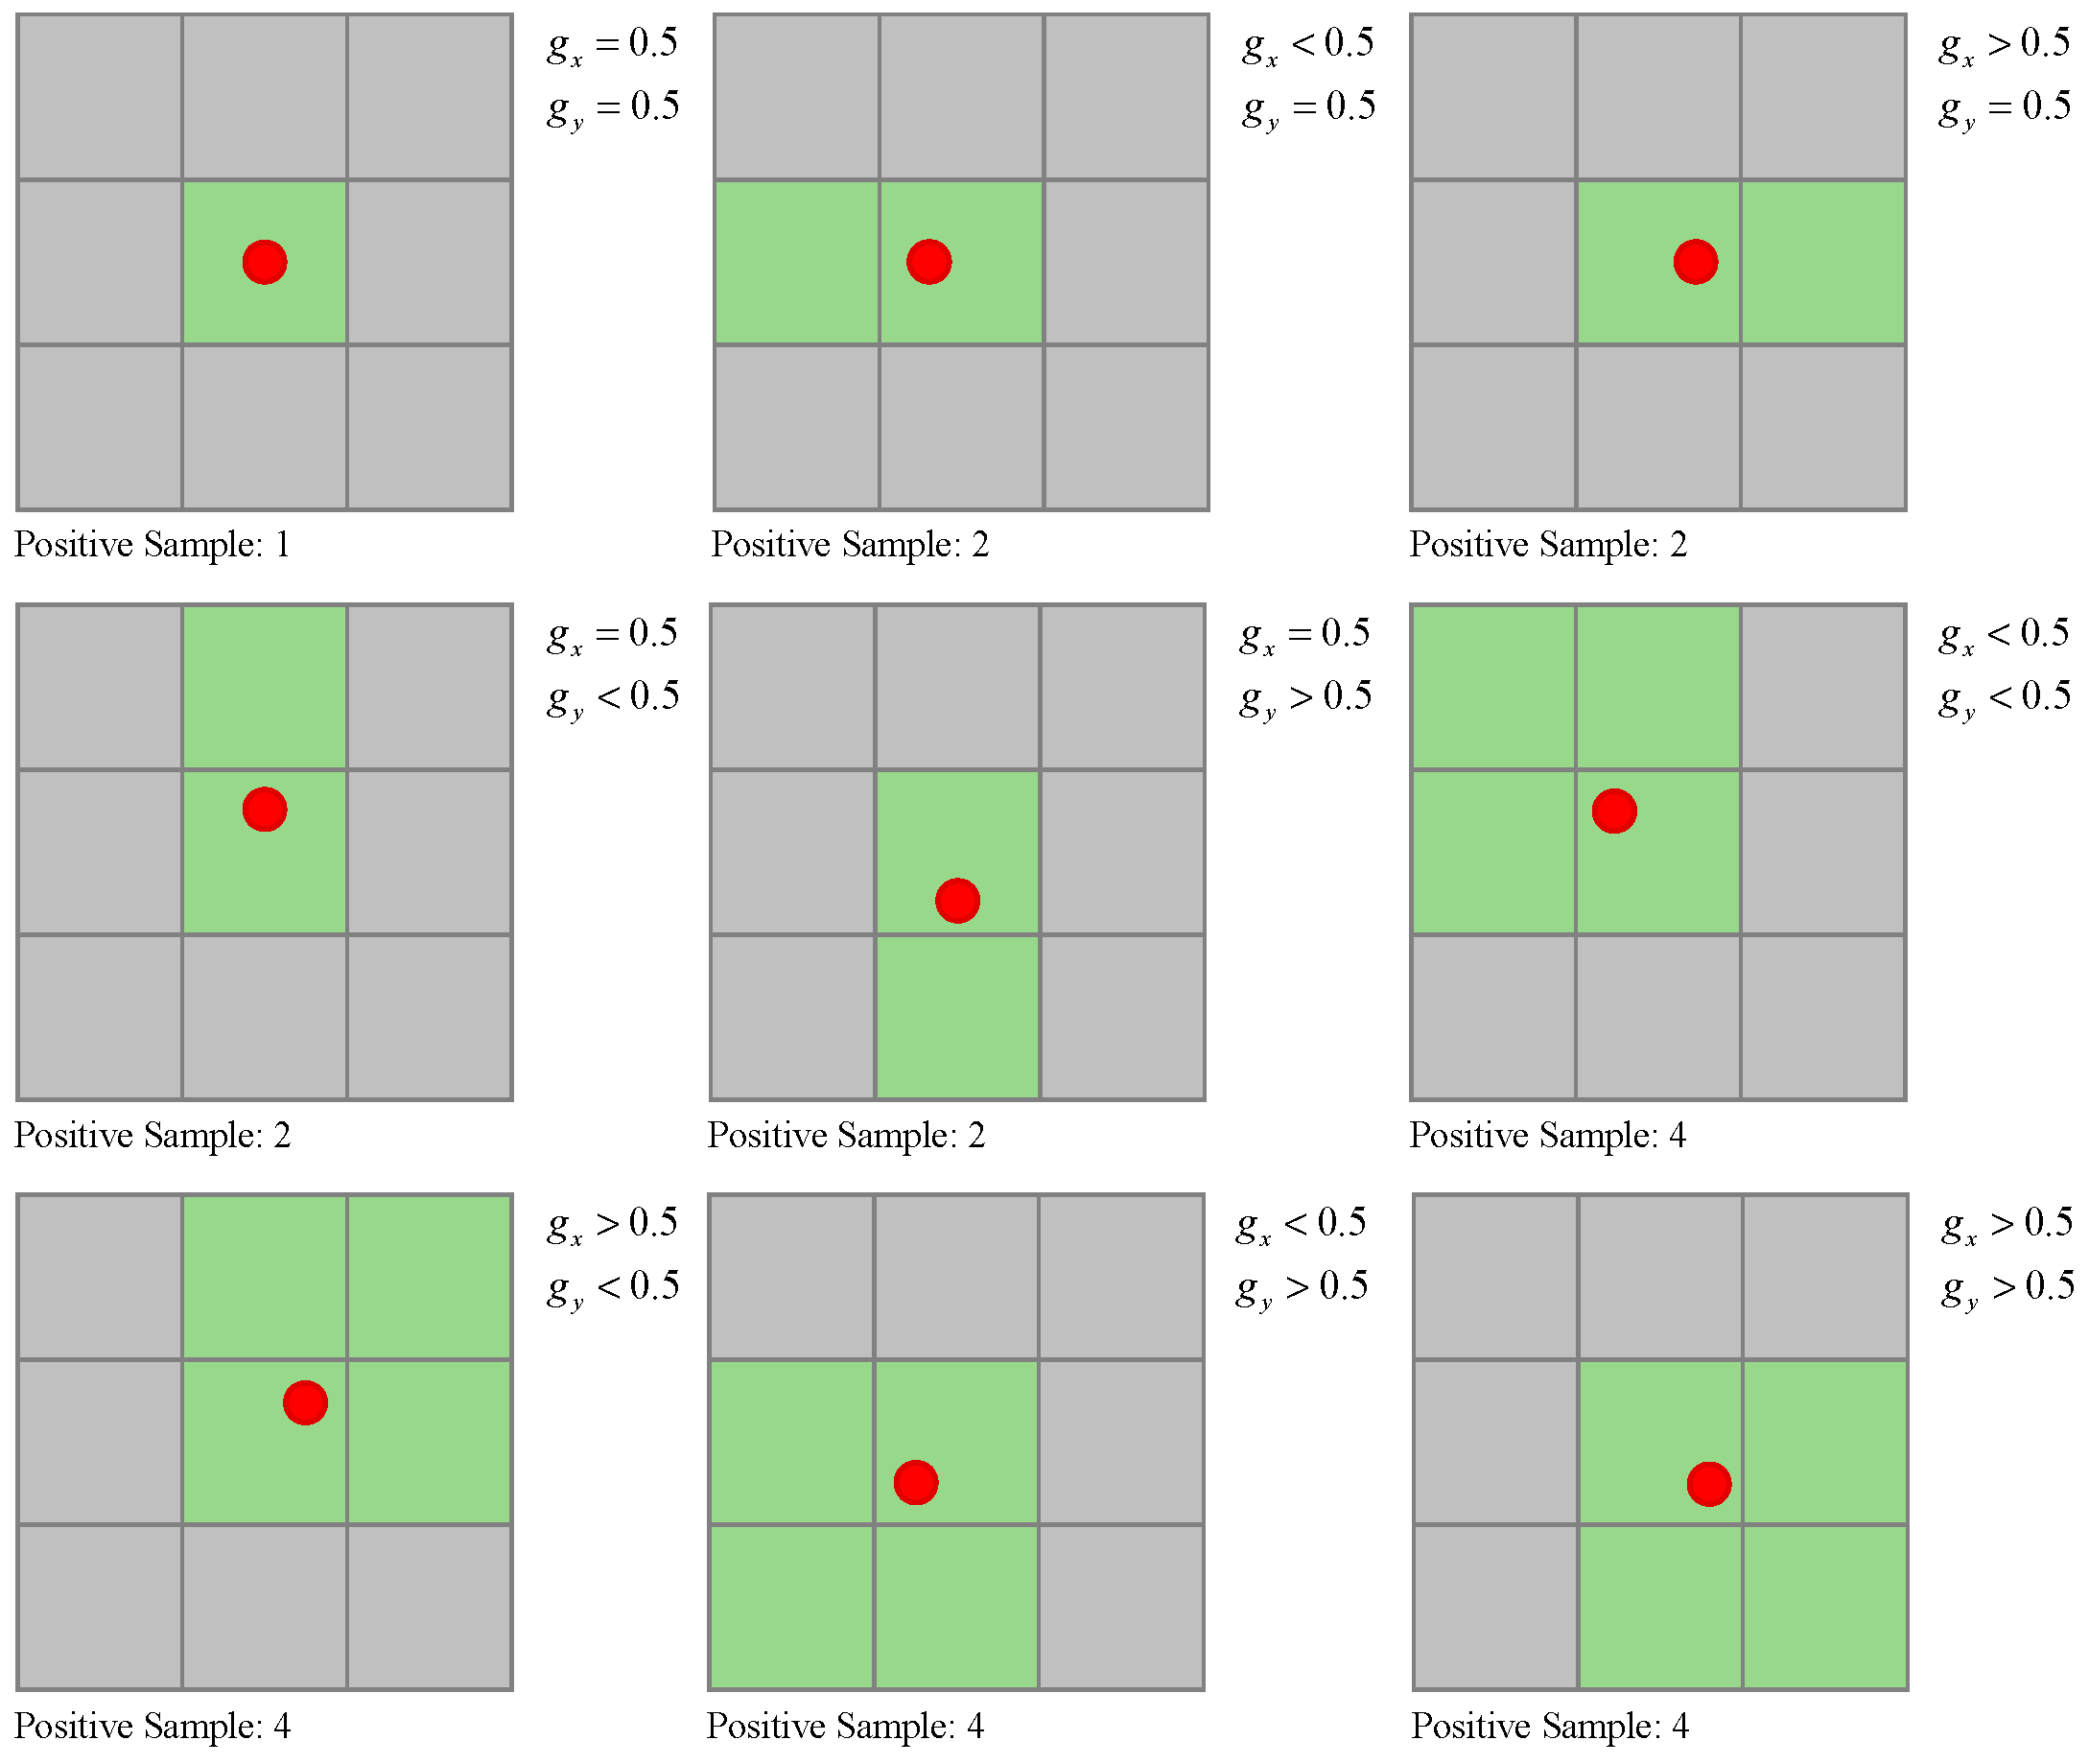
(1) Boundary Proximity Extension Rule: This rule addresses the quantization effect when continuous target coordinates are mapped to discrete feature map grids. We calculate the relative position of the target center within the feature map grid:
g x = x c s mod 1
g y = y c s mod 1
where x c and y c are the target center coordinates, and s is the feature stride. The values g x and g y represent the fractional position within the grid cell, ranging from 0 to 1.
As shown in Figure 7, this extension can increase positive samples from 1 to up to 4 per target. When g x < 0.2 or g x > 0.8 (similarly g y < 0.2 or g y > 0.8 ), the target center lies close to the grid boundary. In such cases, the adjacent grid cell also contains significant target information. We therefore extend the positive sample assignment to include these neighboring units. This extension can increase positive samples from 1 to up to 4 per target, representing a 300% improvement in positive sample coverage.
(2) Aspect Ratio Tolerance Matching Rule: Traditional anchor matching requires strict IoU thresholds, which penalizes small targets disproportionately due to their limited pixel coverage. We propose a shape-based matching criterion that focuses on aspect ratio compatibility:
Match   if :   max w gt w a , h gt h a , w a w gt , h a h gt < 4
where ( w g t , h g t ) are ground truth dimensions and ( w a , h a ) are anchor dimensions. This rule allows a maximum 4:1 aspect ratio difference, accommodating natural shape variations in remote sensing targets while avoiding extreme mismatches that would degrade regression quality.
(3) Extended Prediction Range: To complement the spatial tolerance domain, we extend the detection head’s prediction range beyond the traditional [0,1] grid-relative coordinates:
x = ( σ ( Δ x ) 2 0.5 + c x ) s
w = ( σ ( Δ w ) 2 ) 2 w a s
The center prediction range extends from [0,1] to [−0.5, 1.5], allowing predictions to slightly exceed the current grid cell. This design echoes the spatial tolerance domain expansion, ensuring that targets near grid boundaries can be accurately localized by either the current cell or its neighbors.

4. Experiments

This section is organized as follows: Section 4.1 describes the datasets and evaluation metrics; Section 4.2 details the experimental setup; Section 4.3 presents comparisons with state-of-the-art methods; Section 4.4 conducts ablation studies to validate each proposed component.

4.1. Datasets and Evaluation Metrics

4.1.1. Datasets

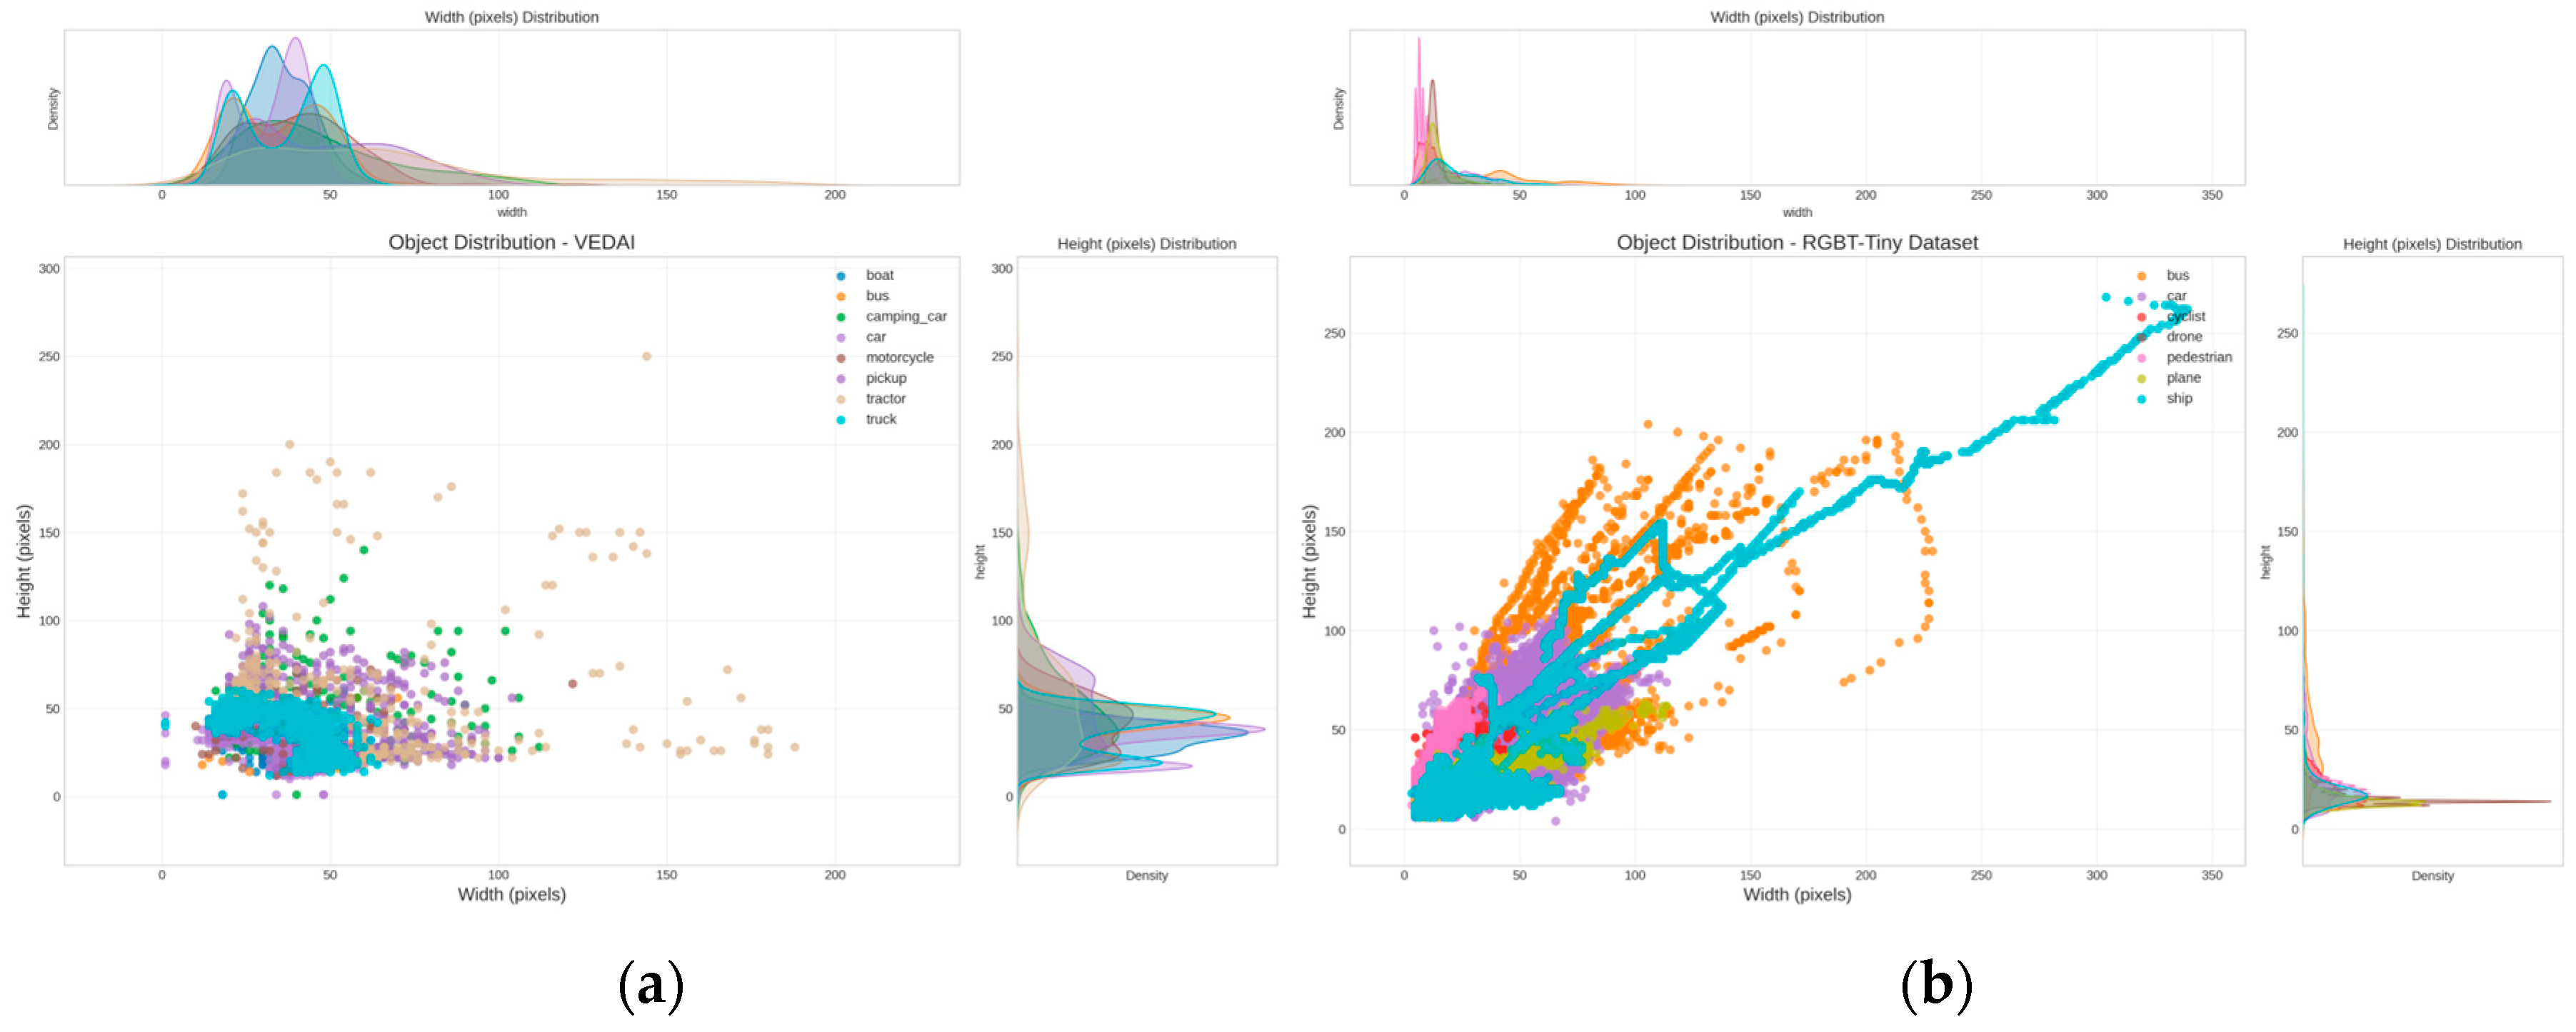
VEDAI [7]. VEDAI is an aerial vehicle detection dataset containing 1210 high-resolution (1024 × 1024) RGB-infrared image pairs with 3706 annotated targets across 8 vehicle categories. As shown in Figure 7, small and medium targets comprise nearly 99% of all instances (40.7% and 58.3%, respectively). This dataset represents typical vehicle monitoring scenarios from medium-to-high altitude aerial remote sensing platforms, with applications in urban traffic flow statistics, parking lot occupancy analysis, and road network vehicle distribution monitoring, providing a reliable benchmark for evaluating algorithm potential in practical traffic monitoring applications.
RGBT-Tiny [10]. RGBT-Tiny is the first large-scale benchmark for visible-thermal tiny object detection, containing 115 sequences, 93,000 frames, and 1.2 M annotations across 7 categories and 8 scene types. As shown in Figure 8, over 81% of targets are smaller than 16 × 16 pixels (36.7% extremely tiny, 44.8% tiny). This dataset represents fine-grained monitoring scenarios from low-altitude UAV platforms, covering diverse urban functional areas including campuses, streets, parking lots, and playgrounds. The extreme scale distribution corresponds to typical imaging conditions for pedestrians and vehicles at 60–100 m flight altitudes, making it an ideal platform for evaluating algorithm performance in personnel search, security surveillance, and emergency response applications. Based on the original RGBT-Tiny dataset [10], we re-partitioned the 115 sequences into 55 for training (20,300 frames), 30 for validation (13,433 frames), and 30 for testing (12,968 frames), expanding from the original binary split to enable proper model validation.

4.1.2. Metrics

We employed the Scale Adaptive Fitness (SAFit) metric [10] as our core criterion. SAFit addresses IoU’s low tolerance to bounding box perturbations for small targets through scale-adaptive weighted fusion:
SAFit = 1 1 + e ( A / C 1 ) × IoU + 1 1 1 + e ( A / C 1 ) × NWD ( C )
where A is the ground truth box area (pixels2) and C is the scale parameter controlling the weights of IoU and NWD; in this paper, C = 32 .
We report: A P ( m A P ) over SAFit thresholds [ 0.5 : 0.05 : 0.95 ] ; A P 50 / A P 75 at thresholds 0.50/0.75; A R (average recall); and scale-specific metrics ( A P e t , A P t , A P s , A P m , A P l ) for extremely tiny ( ( 1 2 , 8 2 ] ), tiny ( ( 8 2 , 16 2 ] ), small ( ( 16 2 , 32 2 ] ), medium ( ( 32 2 , 96 2 ] ), and large ( ( 96 2 , ) ) targets, respectively.

4.2. Experimental Setup

4.2.1. Implementation Details

All experiments used NVIDIA RTX 4090 GPU (24 GB) (NVIDIA Corporation, Santa Clara, CA, USA) with PyTorch 2.4.1 (CUDA 12.1). Input resolutions: VEDAI at 1024 × 1024, RGBT-Tiny at 640 × 512. Batch size was 4. We used SGD optimizer (momentum = 0.937, weight decay = 0.0005) with cosine annealing (0.01→0.01%, 300 epochs) and 5-epoch warmup. Early stopping patience was 30.
Data augmentation: random horizontal flip (p = 0.5), scaling (0.5–1.5×), translation (±10%), brightness/contrast/saturation (±0.2, RGB only), Mosaic (p = 0.5), and MixUp (p = 0.15). Augmentation was disabled during testing.

4.2.2. Training Strategy Configuration and Fair Comparison

To comprehensively evaluate the performance of RAPT-Net on visible–infrared small object detection tasks in aerial remote sensing, comparative experiments were conducted on two benchmark datasets: VEDAI and RGBT-Tiny. The compared methods cover three categories: (1) single-modality detectors, including visible and infrared versions of YOLOv8 [54] and YOLOv10 [55], to establish performance baselines; (2) general multimodal fusion methods, including CFT [27], ICAFusion [52], and CMA-Det [45]; (3) multimodal detectors optimized for remote sensing small objects, including SuperYOLO [14], QFDet [47], and GLFDet [51]. To ensure fair comparison, all baseline methods retain their original training strategies as reported in their respective publications: YOLOv8/YOLOv10 employ standard center-point assignment, SuperYOLO uses resolution-aware sample assignment, while CFT and QFDet adopt IoU threshold-based adaptive assignment. The proposed DS-STD strategy was specifically designed to address the inherent 1–2 pixel boundary localization uncertainty in remote sensing imagery [39], which arises from physical constraints including sensor point spread function, atmospheric turbulence, and platform attitude variations—fundamentally differing from annotation ambiguity in general object detection scenarios.
To address potential concerns regarding training strategy differences and ensure the fairness of performance comparison, we adopted a modular evaluation approach that allows for the independent assessment of each component’s contribution. Table in Section 4.4.4 presents comprehensive ablation studies designed to isolate the impact of DS-STD from other modules (MRAAF and CMFE-SRP), enabling quantification of how much improvement stems from modified training strategies versus novel architectural designs. Furthermore, the evaluation was conducted on two datasets with substantially different characteristics: VEDAI represents satellite platform scenarios with relatively stable imaging geometry, while RGBT-Tiny reflects UAV platform conditions with extreme scale variations and dynamic illumination changes. Additionally, scale-specific analysis across extremely tiny, tiny, and small target categories further validated whether DS-STD addresses a fundamental matching problem inherent to remote sensing imagery or merely exploits dataset-specific characteristics.

4.3. Comparison with State-of-the-Art Methods

4.3.1. On the VEDAI Dataset

The VEDAI dataset, as a classic aerial vehicle detection benchmark, provides a standardized platform for evaluating algorithm performance in medium-complexity remote sensing scenarios.
As shown in Table 2, RAPT-Net achieves optimal performance across all evaluation metrics. Specifically, RAPT-Net’s m A P reaches 62.22%, improving by 2.55 and 5.82 percentage points over the second-best method SuperYOLO (59.67%) and the best single-modality method YOLOv8-IR (56.40%), respectively. For m A P 50 and m A P 75 metrics, RAPT-Net achieves 84.83% and 75.95%, demonstrating advantages in both detection and precise localization. Regarding scale-specific performance, RAPT-Net achieves 52.68% for small targets ( A P s ) and 64.52% for medium targets ( A P m ), outperforming SuperYOLO by 2.12 and 3.33 percentage points, respectively. These results validate that RAPT-Net achieves comprehensive performance improvement by systematically addressing the three core challenges of modality fusion, spatial resolution preservation, and scale matching. Regarding efficiency, RAPT-Net achieves 28.95 FPS with 37.8 M parameters and 64.9 GFLOPs, demonstrating favorable accuracy–efficiency balance. Compared to QFDet (51.2 M parameters, 168.5 GFLOPs) and CFT (32.4 M parameters, 89.6 GFLOPs), RAPT-Net provides superior accuracy with reasonable computational cost.
Notably, YOLOv10 exhibits lower performance than YOLOv8 on VEDAI despite architectural advances in natural scene detection. This performance gap likely stems from YOLOv10’s optimization for general object detection scenarios, where its reduced model capacity (2.71 M vs. 3.01 M parameters) and architecture choices may not effectively capture the specific characteristics of aerial vehicle detection at high altitudes. This observation underscores the necessity of remote sensing-specific designs as implemented in RAPT-Net.
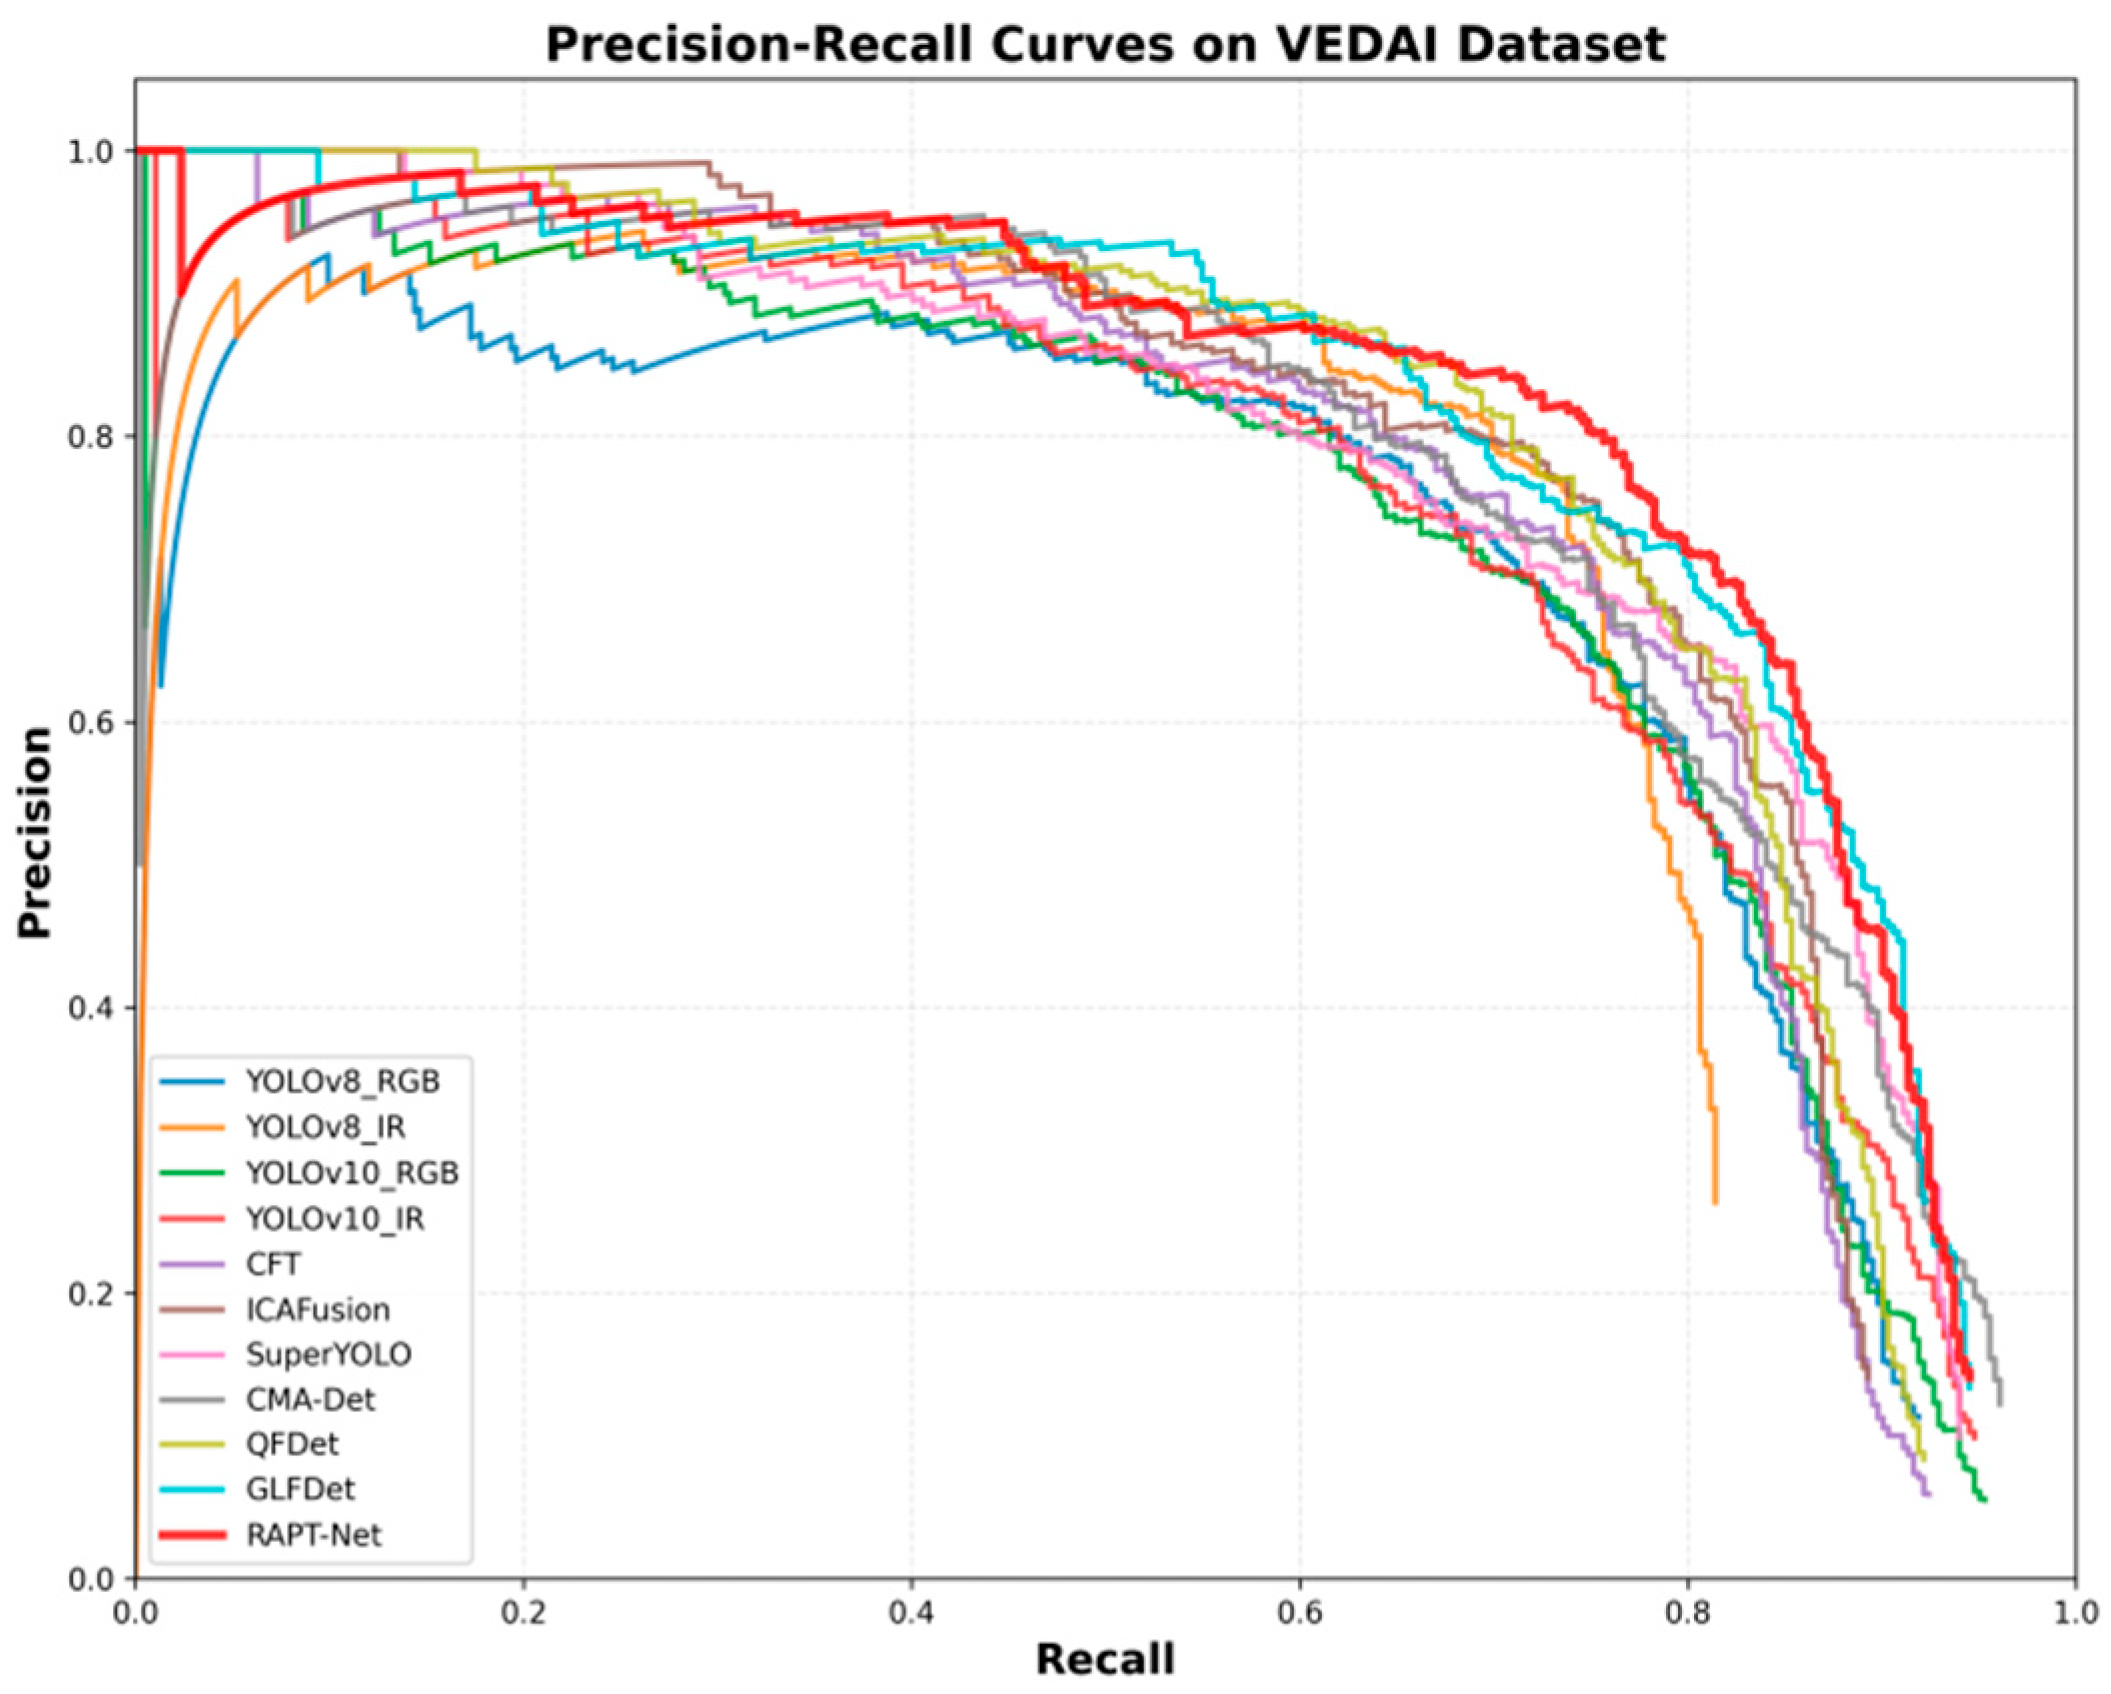
Figure 9 presents the Precision–Recall (PR) curves of all compared methods on the VEDAI dataset. Overall, RAPT-Net achieves the best performance in terms of the area under the curve, though GLFDet shows competitive or slightly higher precision in certain recall ranges. The curves exhibit approximate hierarchical stratification: RAPT-Net, SuperYOLO, and GLFDet form the top tier with frequent crossovers among them; CFT, QFDet, and ICAFusion constitute the middle tier; single-modality detectors (YOLOv8, YOLOv10) occupy the bottom tier, showing rapid precision decay as recall increases. Notably, in the high recall region (>0.6), RAPT-Net maintains a more gradual descent compared to most other methods, reflecting its superior capability in retrieving difficult samples without introducing excessive false positives.
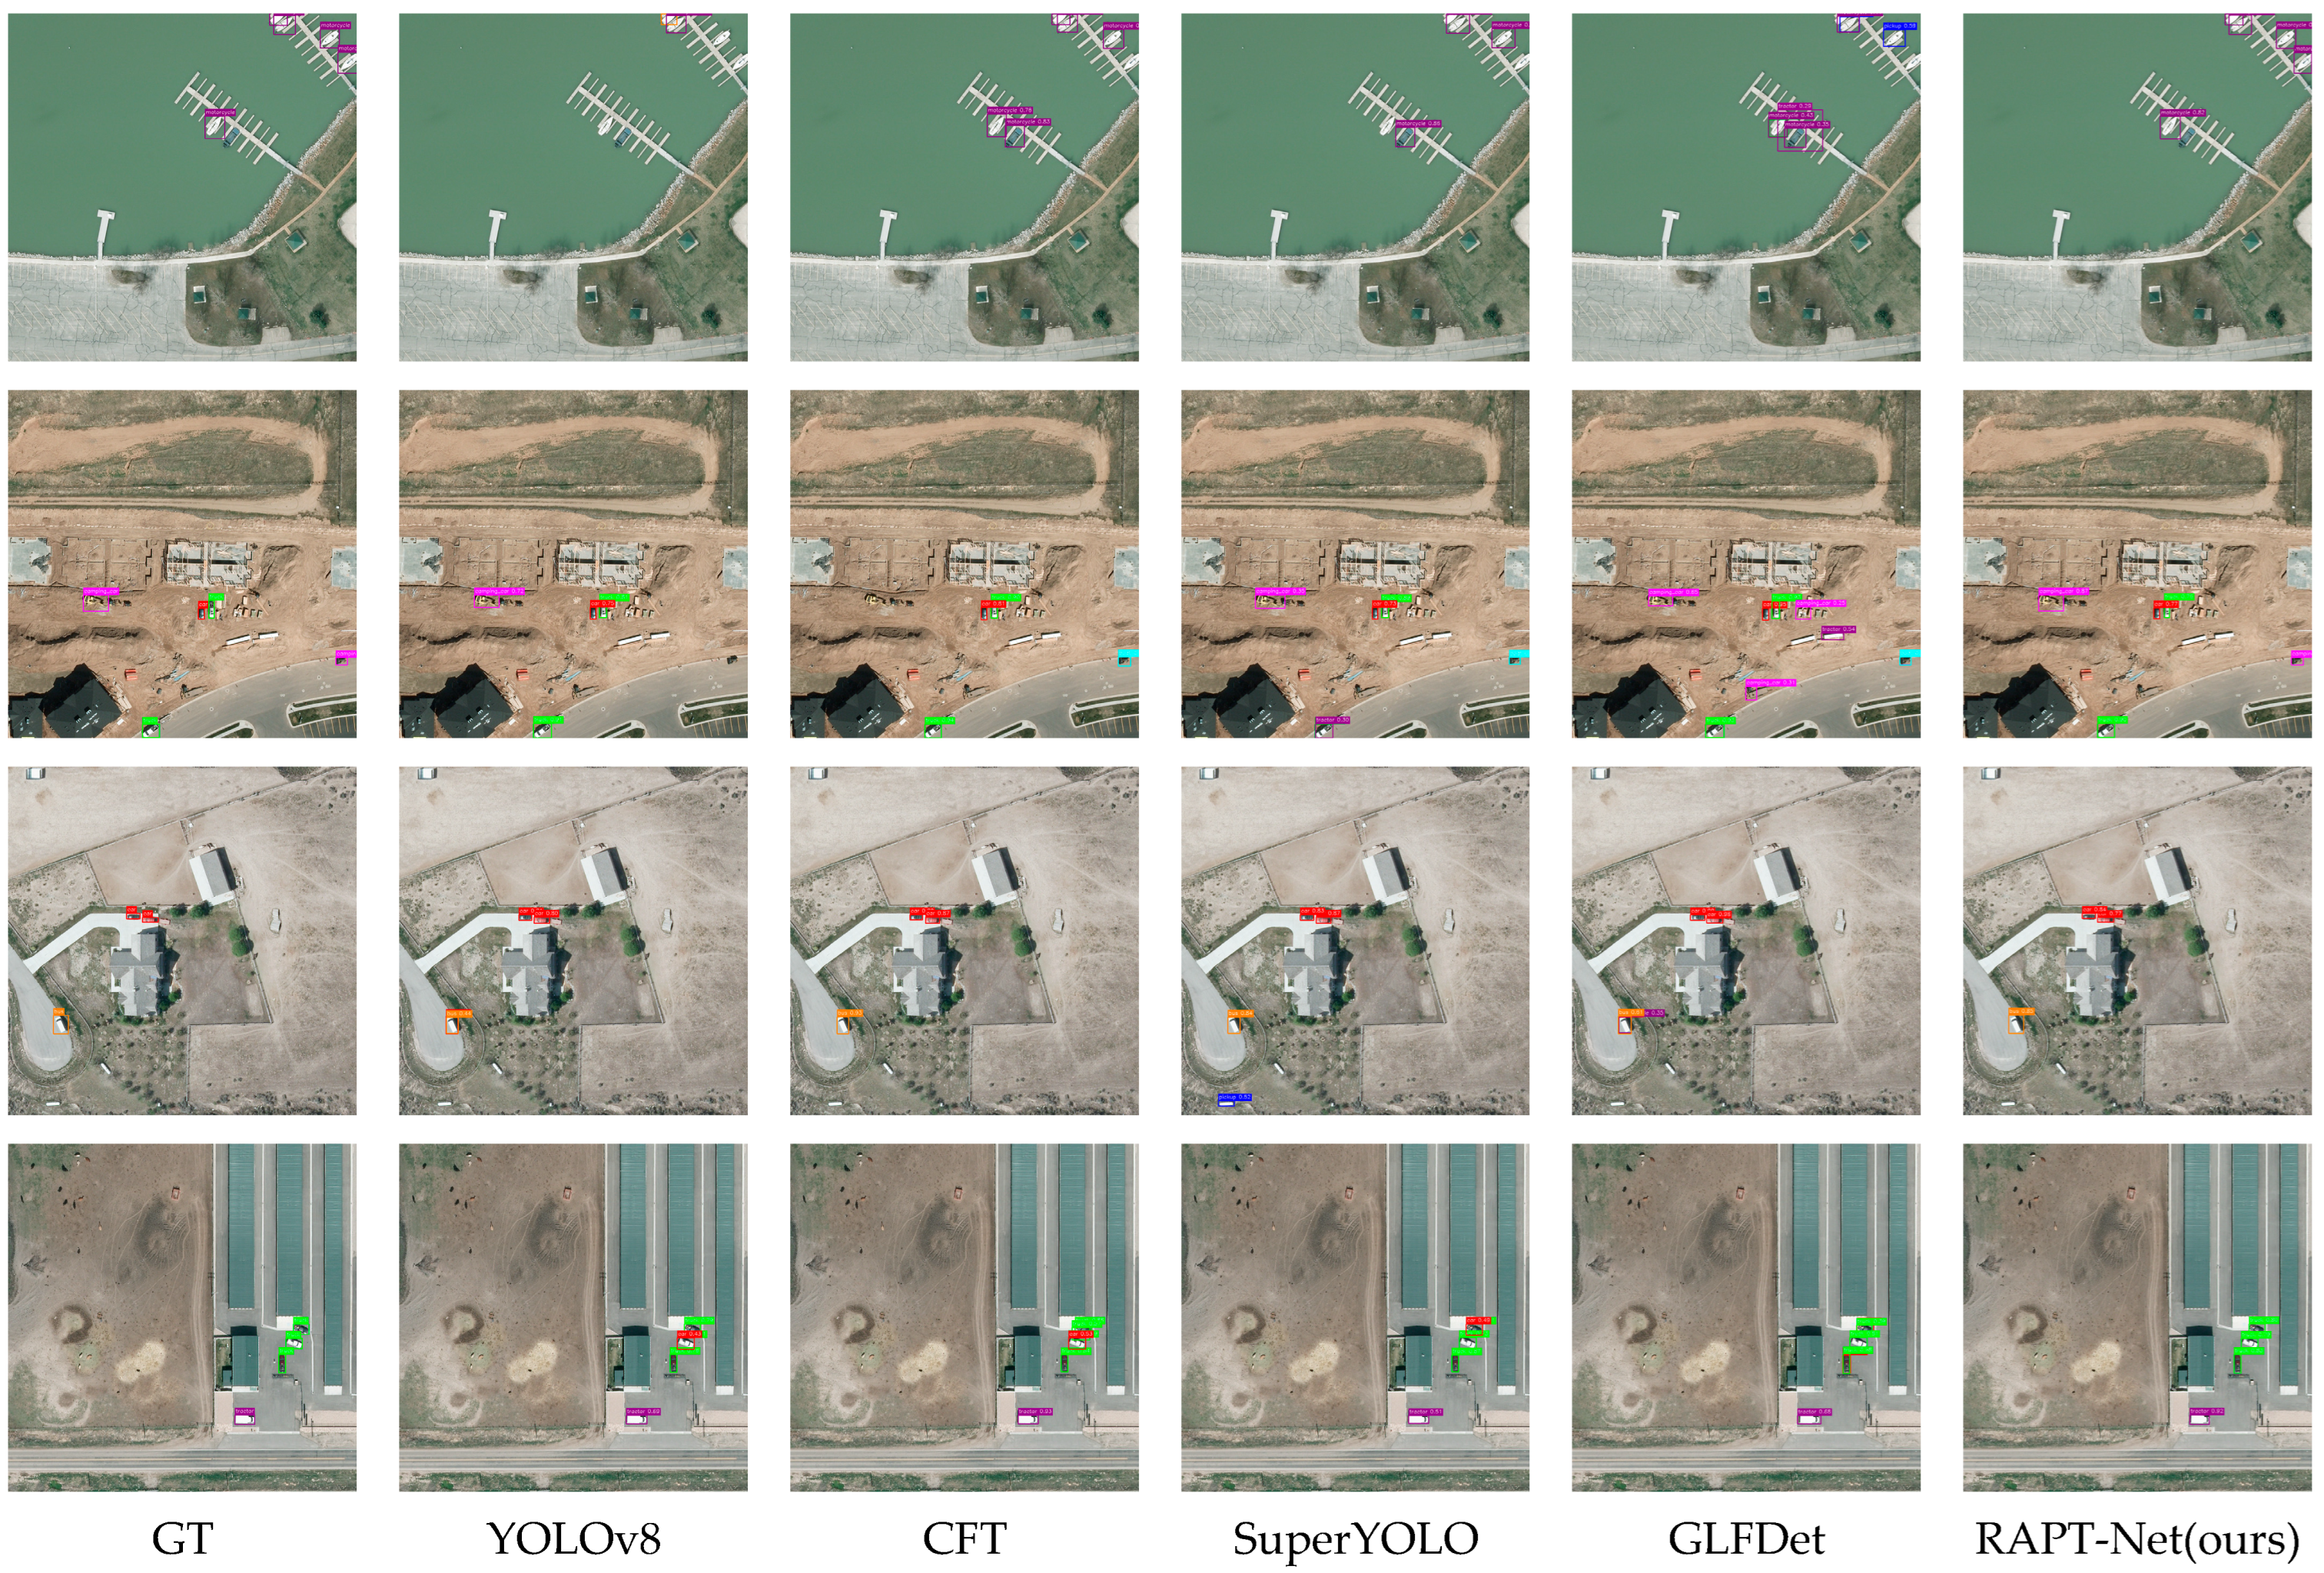
Figure 10 provides qualitative detection results across five representative scenes from the VEDAI dataset. Each row displays the same scene processed by different methods, with ground truth shown in the first column. In the scene of Row 1, RAPT-Net generates clean and accurate bounding boxes on vessels, while YOLOv8 exhibits obvious missed detections, and GLFDet has a serious problem with false positives. In the scene of Row 2, RAPT-Net’s detection boxes precisely cover all vehicles with consistent box sizes, whereas other methods show missed detections or redundant boxes. The scene in Row 3 presents a background with cluttered line patterns; both GLFDet and SuperYOLO exhibit false detections, while RAPT-Net maintains clean outputs focusing only on actual targets. In the scene of Row 4, RAPT-Net consistently generates correct detection boxes, while competing methods all exhibit false detections. Across all visualizations, RAPT-Net demonstrates the most consistent detection behavior with minimal background interference and precise target localization.

4.3.2. On the RGBT-Tiny Dataset

The RGBT-Tiny dataset, as a cutting-edge benchmark for extreme small target detection, served as the primary validation platform for the core innovations of this paper. The dataset contains 81.5% extremely tiny and tiny targets (<16 × 16 pixels), providing an ideal testing scenario for evaluating algorithm detection capability at extreme scales.
As shown in Table 3, RAPT-Net demonstrates significant performance advantages on the RGBT-Tiny dataset. RAPT-Net’s m A P reaches 18.52%, improving by 1.73 and 7.13 percentage points over the second-best method QFDet (16.79%) and the best single-modality method YOLOv10-RGB (11.39%), respectively. For m A P 50 and m A P 75 metrics, RAPT-Net achieves 32.87% and 21.42%, demonstrating advantages in both detection and precise localization. Regarding scale-specific performance, RAPT-Net achieves 10.86% for extremely tiny targets ( A P e t ), 18.59% for tiny targets ( A P t ), and 24.12% for small targets ( A P s ), outperforming QFDet by 1.60, 2.28, and 1.45 percentage points, respectively. Notably, the performance gap between RAPT-Net and other methods is significantly amplified on RGBT-Tiny compared to VEDAI, confirming that the smaller the target size, the greater the value of modality reliability assessment and spatial resolution preservation mechanisms. RAPT-Net achieves 58.77 FPS with 20.3 GFLOPs, outperforming QFDet (+1.73% mAP) with 63% higher FPS and 26% fewer parameters, confirming superior efficiency for UAV-based tiny target detection.
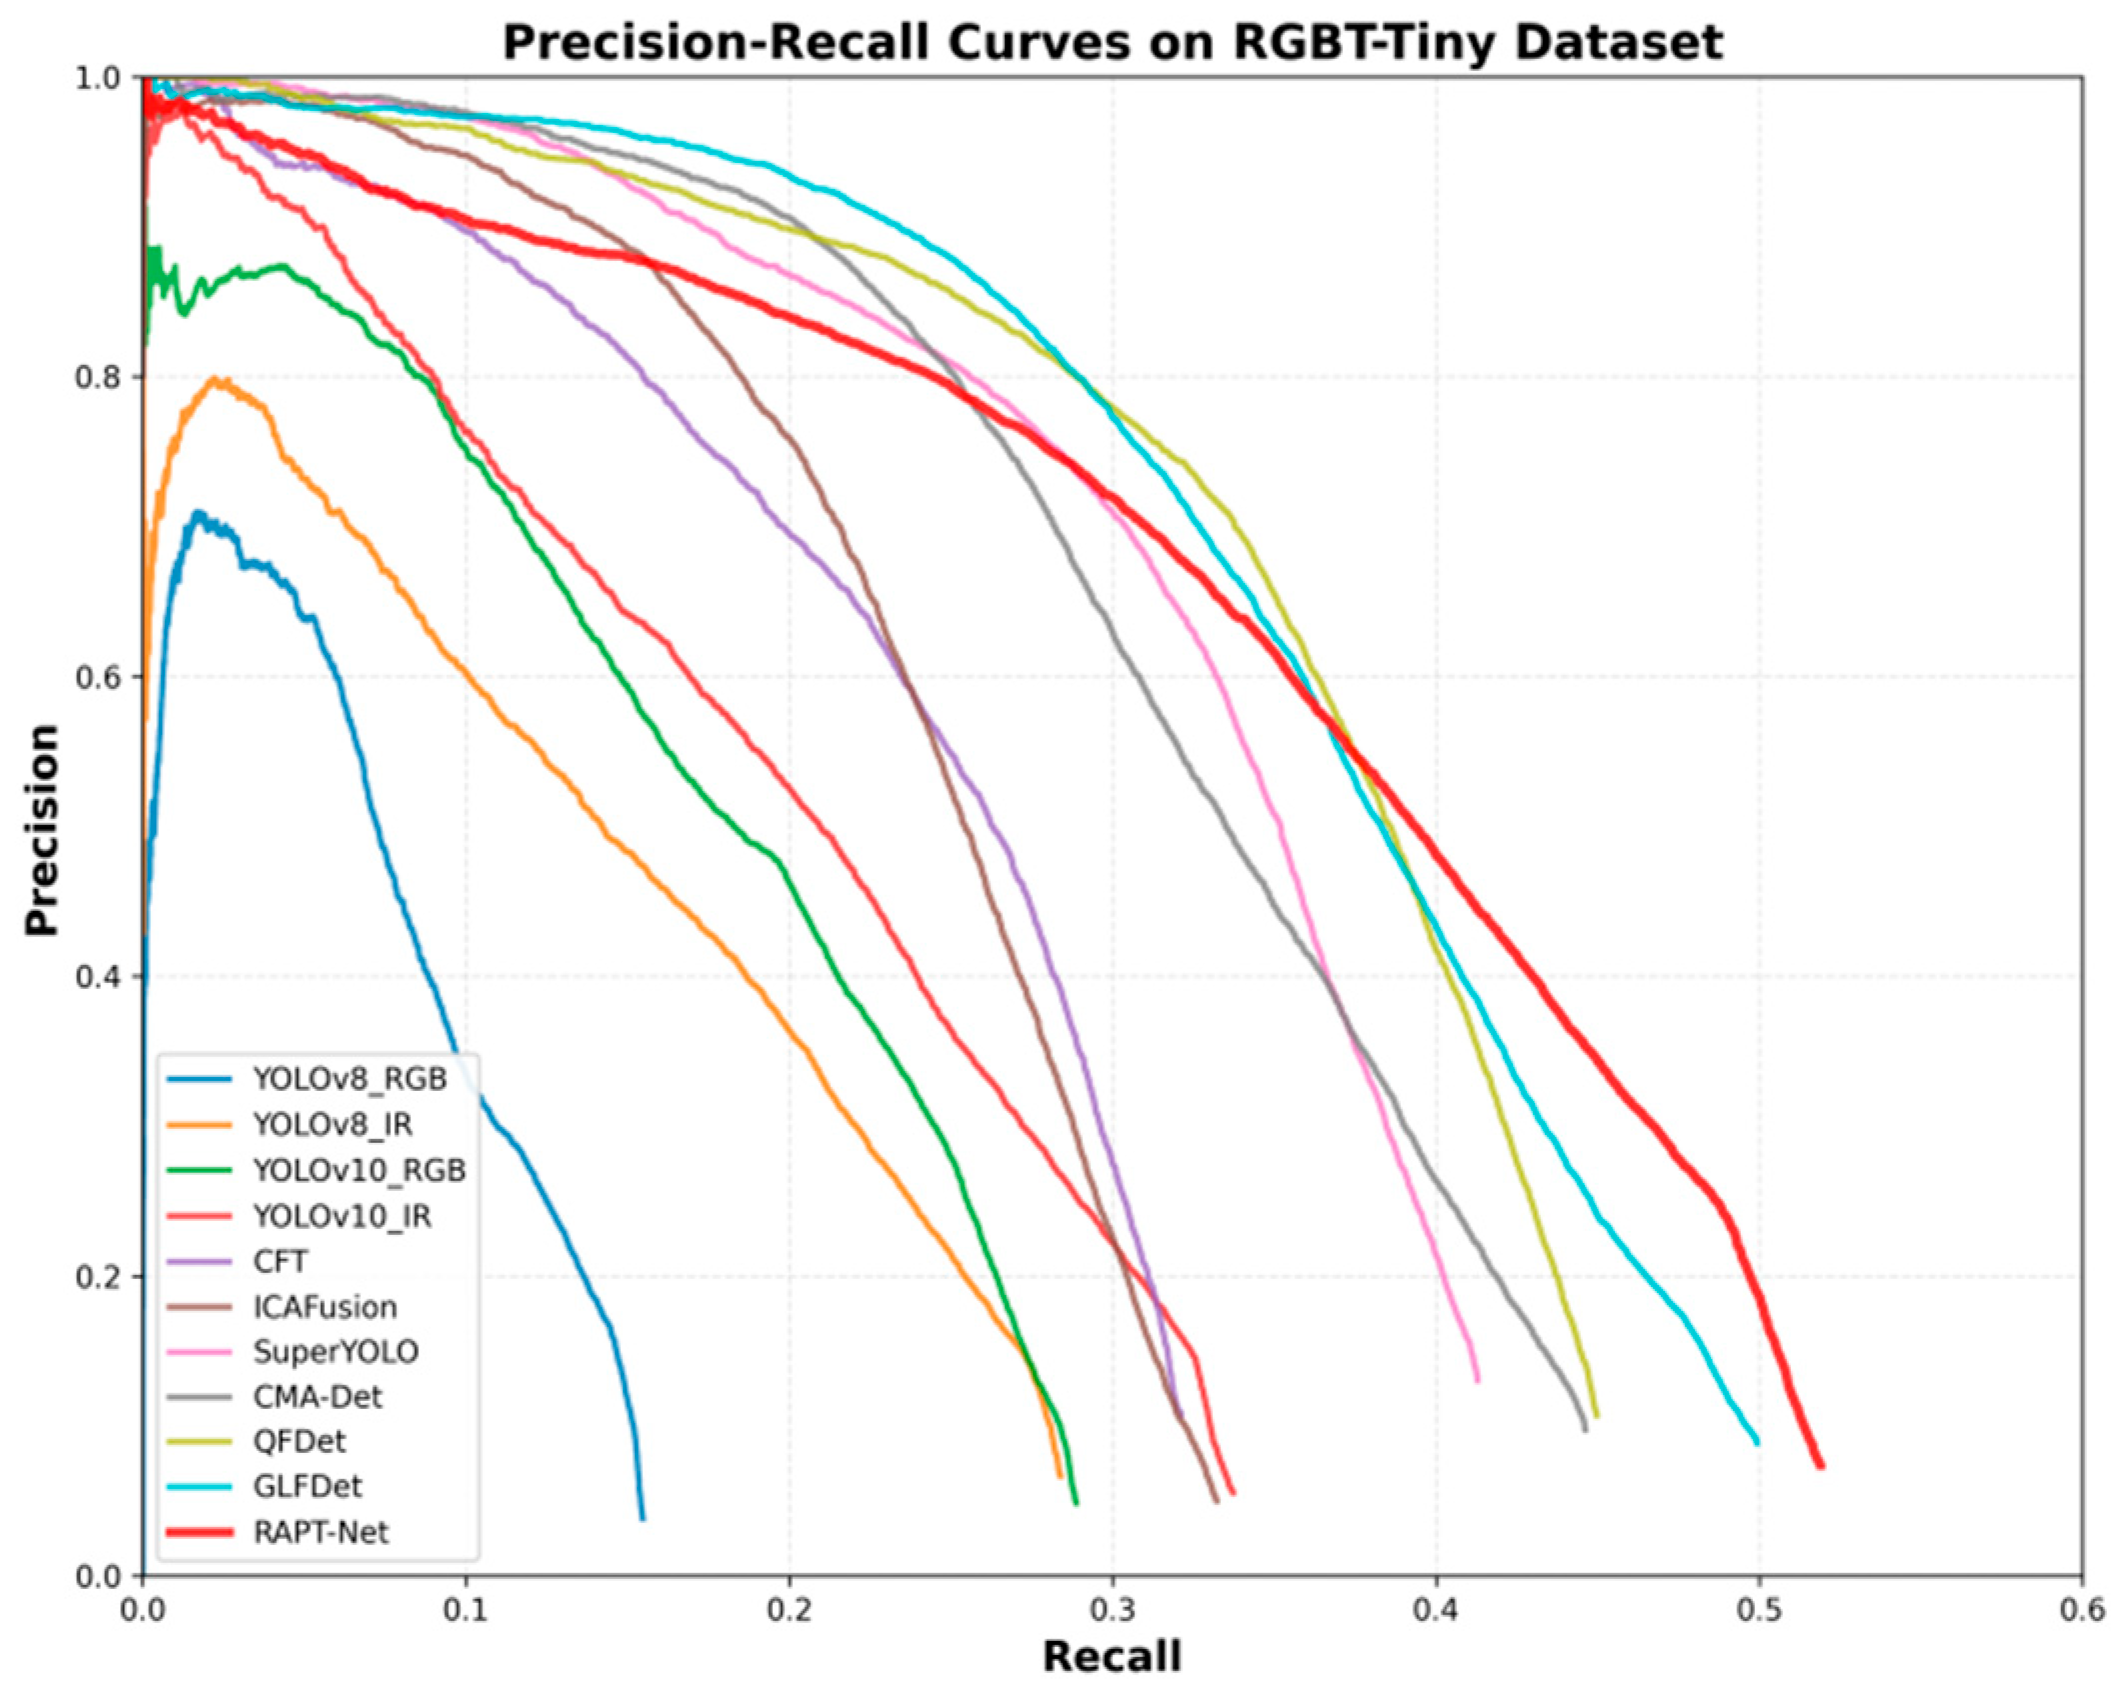
Figure 11 presents the Precision–Recall (PR) curves on the RGBT-Tiny dataset. Notably, the effective recall range is constrained to [0, 0.6] rather than [0, 1.0] as in VEDAI, reflecting inherent limitations in feature representation for extremely tiny targets. In the low recall region (<0.45), GLFDet, QFDet, and SuperYOLO exhibit higher precision than RAPT-Net; however, in the high recall region (>0.45), RAPT-Net surpasses all other methods and maintains a more gradual descent, demonstrating stronger capability in retrieving difficult samples. In terms of area under the curve, RAPT-Net achieves the best overall performance. The curves exhibit clear stratification: multimodal fusion methods (RAPT-Net, QFDet, GLFDet, SuperYOLO, ICAFusion) occupy the upper region, while single-modality detectors cluster at the bottom. Particularly, YOLOv8_RGB terminates before reaching 0.2 recall, and other single-modality methods approach near-zero precision beyond recall of 0.3, visually demonstrating the essential role of multimodal fusion for extremely tiny target detection.
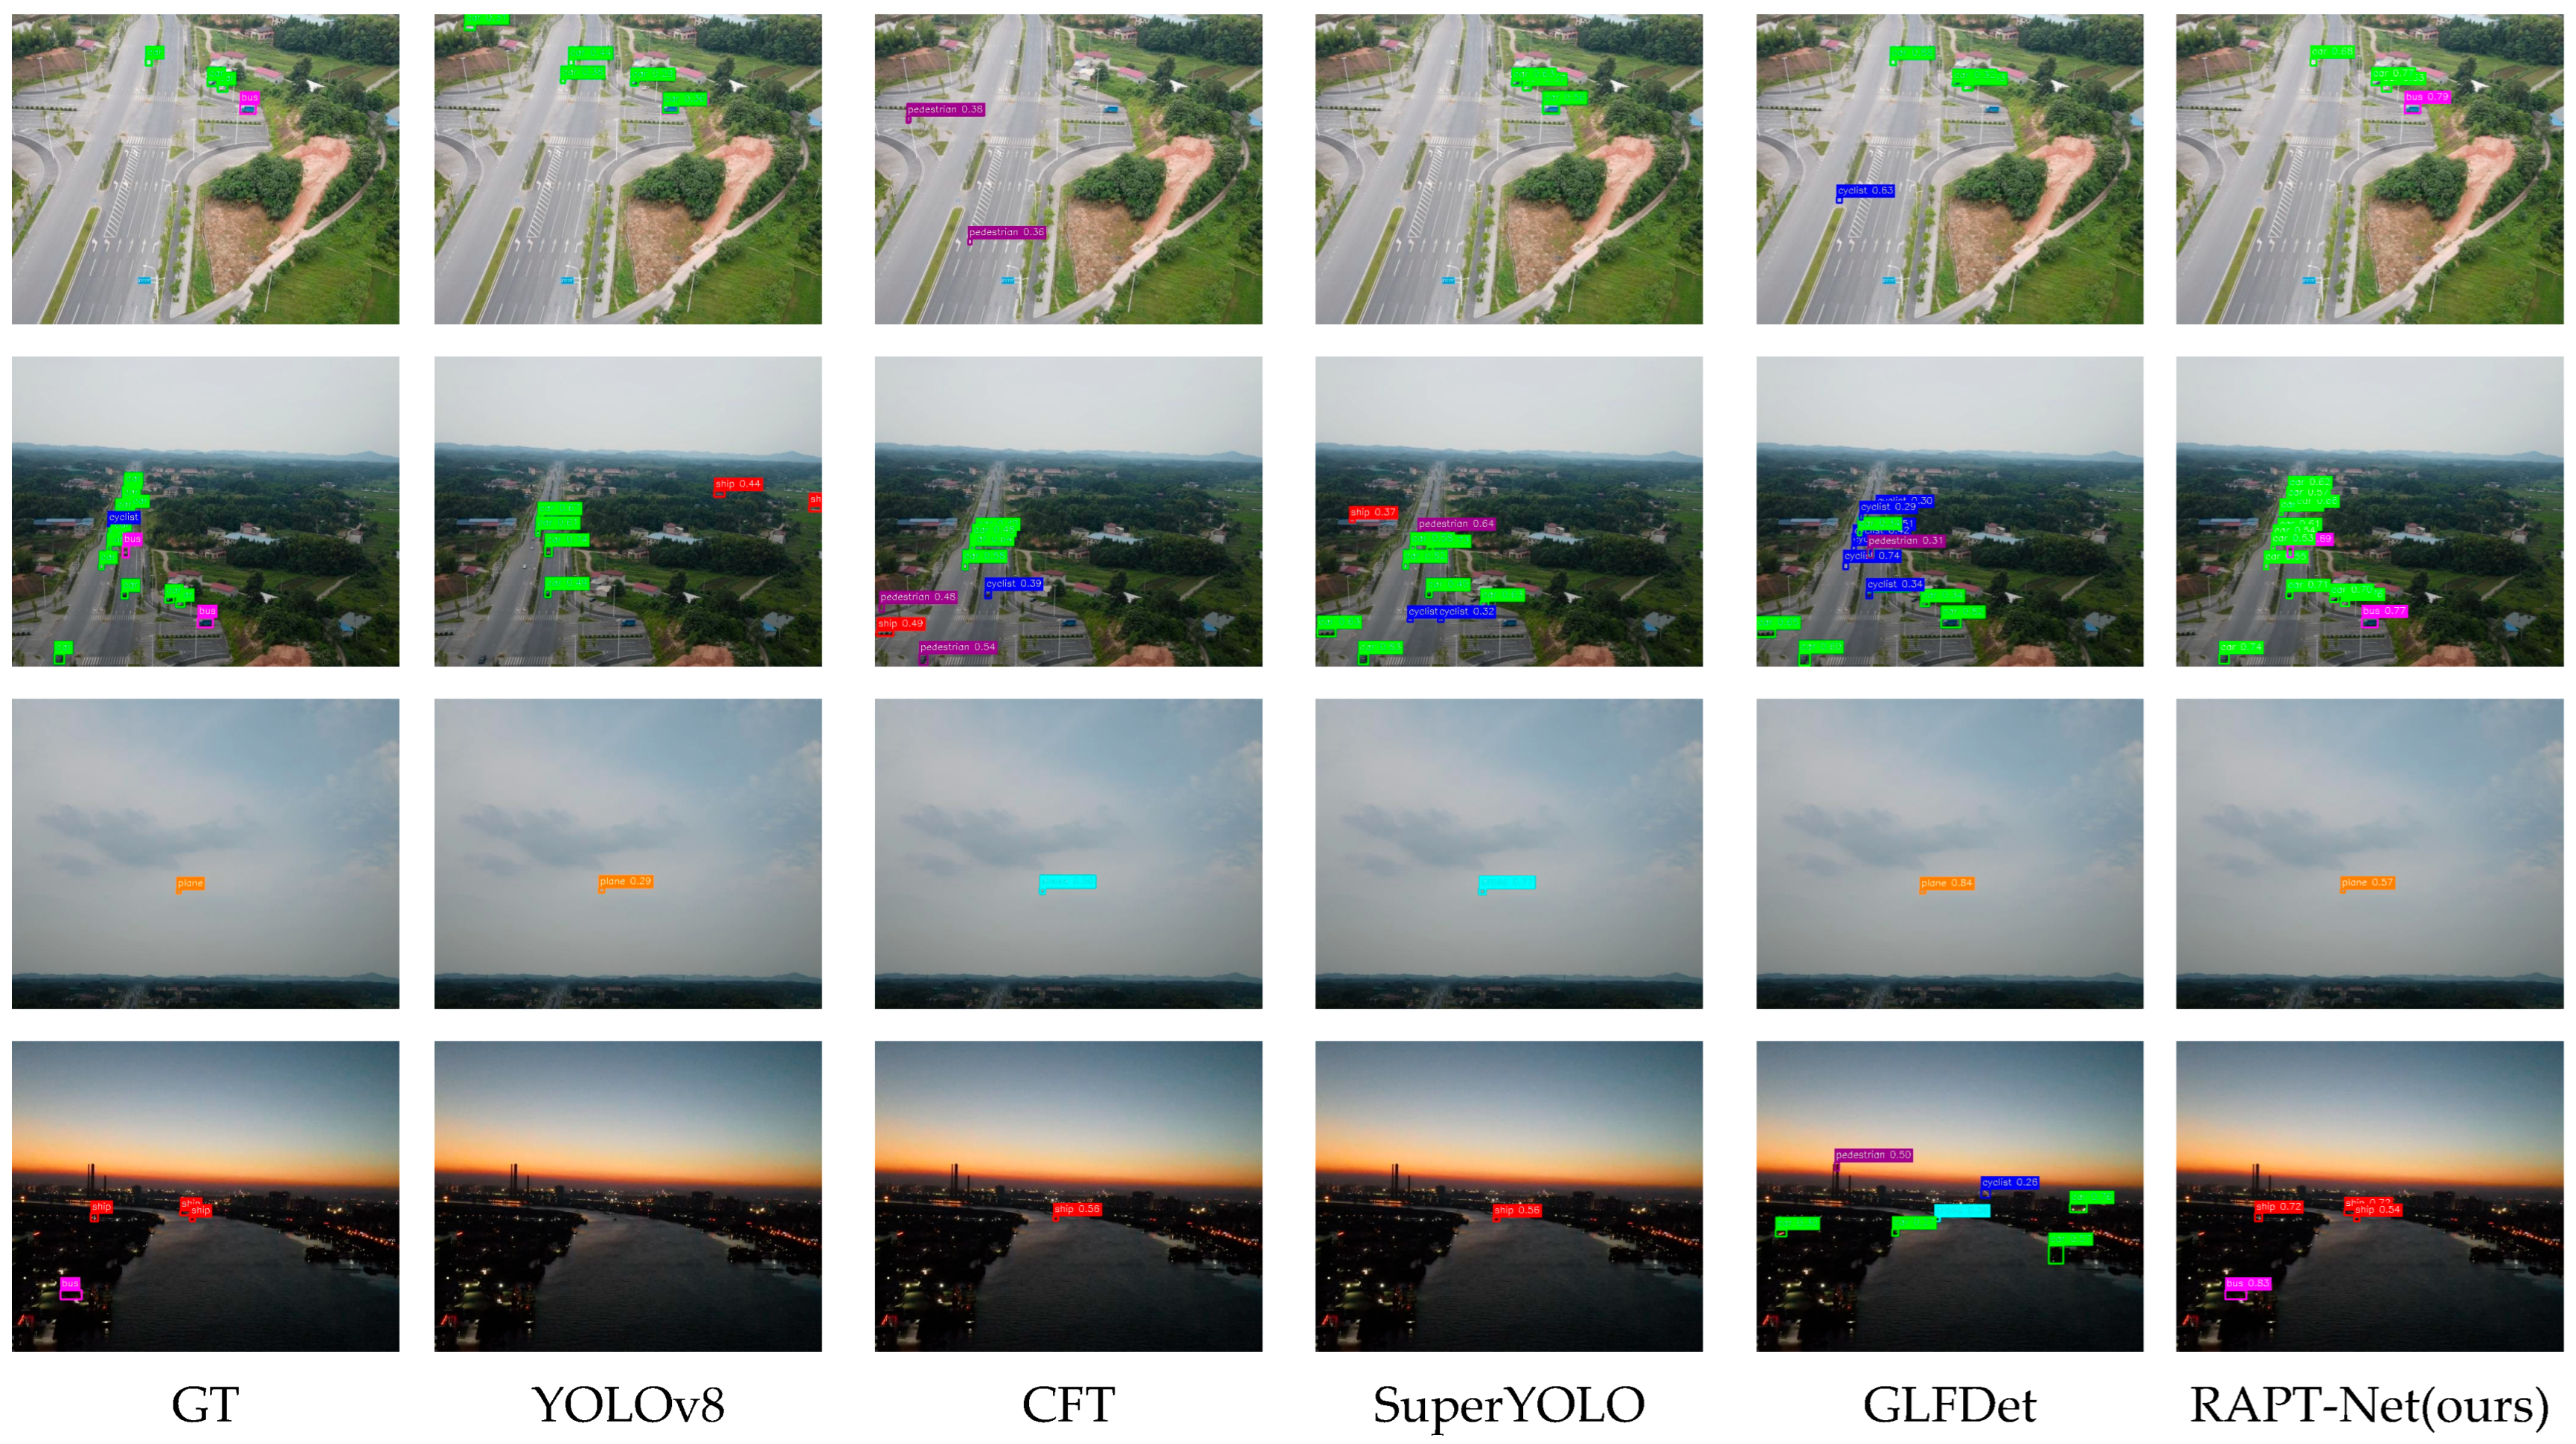
Figure 12 provides qualitative detection results across five representative scenes from the RGBT-Tiny dataset. Each row displays the same scene processed by different methods, with ground truth shown in the first column. In Row 1, YOLOv8 exhibits obvious false detections and missed detections, while CFT, SuperYOLO, and GLFDet all fail to detect the bus target; in contrast, RAPT-Net produces comprehensive coverage with detection boxes closely matching ground truth annotations. In Row 2, targets become dense and detection difficulty increases. YOLOv8 shows numerous missed detections, while CFT, SuperYOLO, and GLFDet exhibit obvious false detections. Although RAPT-Net also has some missed detections, its detection accuracy is significantly improved compared to other methods. In Row 3, under extremely challenging conditions with very tiny targets, RAPT-Net still demonstrates precise detection capability. In Row 4, illumination becomes poor. YOLOv8 completely fails to detect any targets, CFT and SuperYOLO also suffer from severe missed detections, while GLFDet exhibits more severe false detections. In comparison, RAPT-Net shows neither false detections nor missed detections. Across all visualizations, RAPT-Net demonstrates the highest detection density with minimal background interference, validating its superior capability for extremely tiny target detection.

4.4. Ablation Studies

To systematically validate the effectiveness of each proposed module in RAPT-Net, we conducted comprehensive ablation studies on the RGBT-Tiny dataset. The baseline architecture (A0, B0, D0, E0 in Table 4, Table 5, Table 6 and Table 7) adopted YOLOv5 with simple element-wise addition for RGB-infrared fusion, using standard C3 blocks uniformly across all feature pyramid levels without reliability assessment or spatial tolerance mechanisms.
The experiments were organized into four parts: MRAAF fusion strategy ablation, CMFE-SRP hierarchy-specific processing unit ablation, DS-STD dense supervision strategy ablation, and comprehensive module combination ablation.

4.4.1. MRAAF Fusion Strategy Ablation

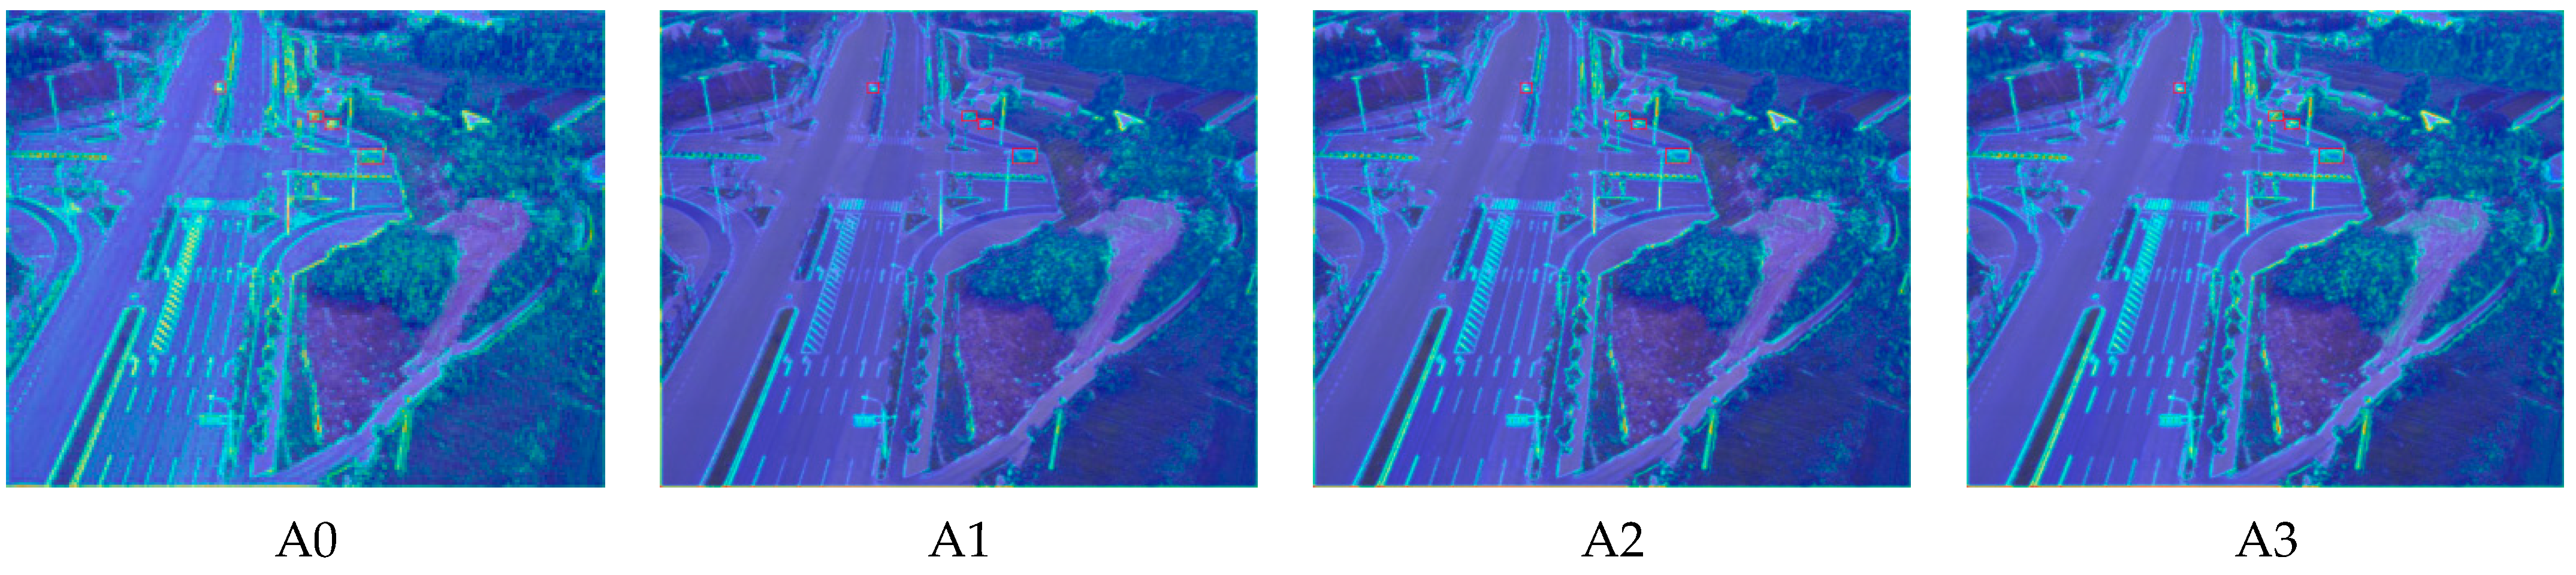
The MRAAF module addresses the spatial heterogeneity of modality reliability through a two-stage progressive fusion strategy. The baseline (A0) employs simple concatenation fusion. Configuration A1 implements single-stage MRAAF with only coarse-grained global reliability estimation. Configuration A2 extends to two-stage fusion without reliability-guided feedback. Configuration A3 represents the complete MRAAF design with both learnable weight aggregation and reliability-guided feedback mechanism.
As shown in Table 4, the results demonstrate progressive improvement from each MRAAF component. Single-stage MRAAF (A1) improves m A P by 1.23 percentage points over baseline, indicating that coarse-grained reliability estimation provides meaningful guidance. Two-stage fusion (A2) further improves m A P by 0.88 percentage points. The complete MRAAF (A3) achieves a m A P value of 15.21%, with A P e t improving from 8.04% to 8.65%. The reliability-guided feedback mechanism contributes an additional 0.65 percentage points in m A P , confirming that the combination of learnable aggregation and reliability-guided feedback enables optimal balance between efficiency and accuracy.
As shown in Figure 13, baseline A0 exhibits diffuse feature activations with weak target–background discrimination due to unresolved modality conflicts. Configurations A1 and A2 show progressively concentrated activation patterns with improved spatial localization. The complete MRAAF in A3 produces the sharpest feature responses, achieving the most prominent target highlighting through reliability-guided adaptive fusion. These results demonstrate that the combination of two-stage progressive fusion and reliability feedback mechanism is essential for addressing the spatial heterogeneity of modality reliability caused by land cover diversity and dynamic imaging conditions in aerial remote sensing imagery.

4.4.2. CMFE-SRP Hierarchy-Specific Processing Unit Ablation

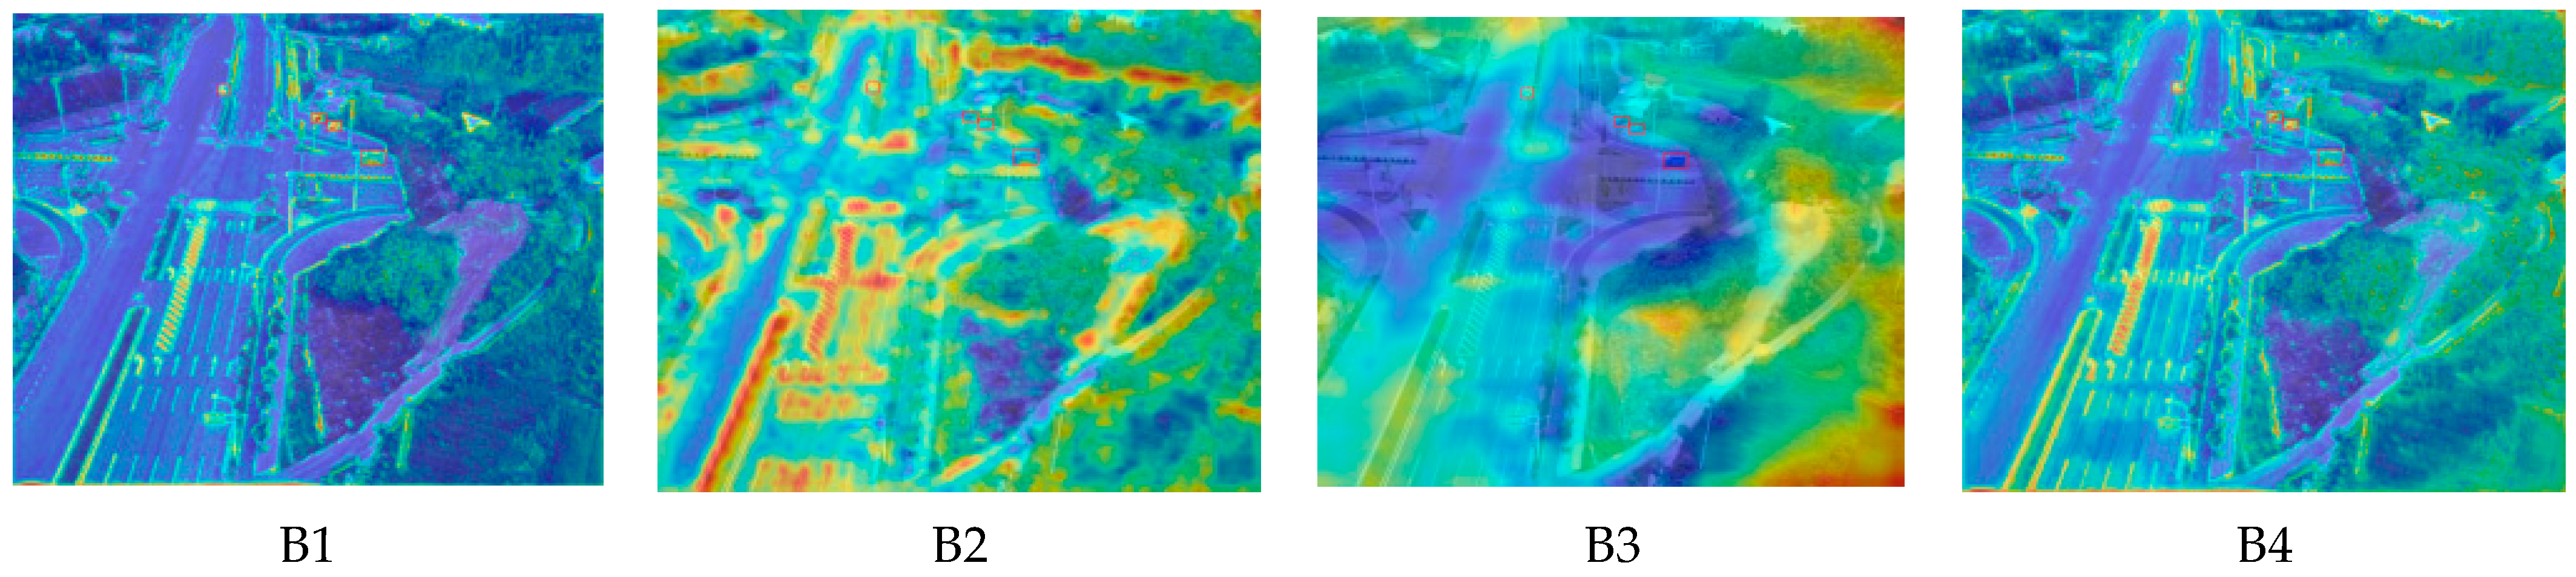
The CMFE-SRP module addresses spatial information loss through hierarchy-specific processing units. Baseline B0 uses standard C3 blocks at all levels. B1 introduces Resolution Preserving Units (RPUs) at P2/P3. B2 employs Cross-modal Semantic Alignment Units (CSAUs) at P4. B3 substitutes Geographic Spatial Aggregation Units (GSAUs) at P5. B4 represents the complete design integrating all units.
As shown in Table 5, the RPU at P2/P3 (B1) contributes the most significant improvement, achieving a m A P value of 15.86% with A P e t increasing from 6.29% to 9.24%, confirming that maintaining spatial detail independence is crucial for extremely small targets—for targets occupying less than 0.04% of image area, geometric information in shallow feature maps is fundamental for precise localization. The CSAU at P4 (B2) and GSAU at P5 (B3) improve m A P by 1.67 and 0.83 percentage points, respectively. The complete CMFE-SRP (B4) achieves a m A P value of 17.12% and A P e t of 10.15%, with the combined gain (4.67 percentage points) exceeding individual improvements, suggesting synergistic interactions among hierarchy-specific units.
As shown in Figure 14, B0 is not displayed as it shares identical visualization with baseline A0. B1 with RPU shows relatively uniform activation distribution with moderate target responses. B2 with CSAU produces stronger activation intensity with prominent high-response regions. B3 with GSAU exhibits diffuse activation patterns. The complete B4 achieves the most balanced distribution with clearly concentrated target responses and suppressed background interference.

4.4.3. DS-STD Dense Supervision Strategy Ablation

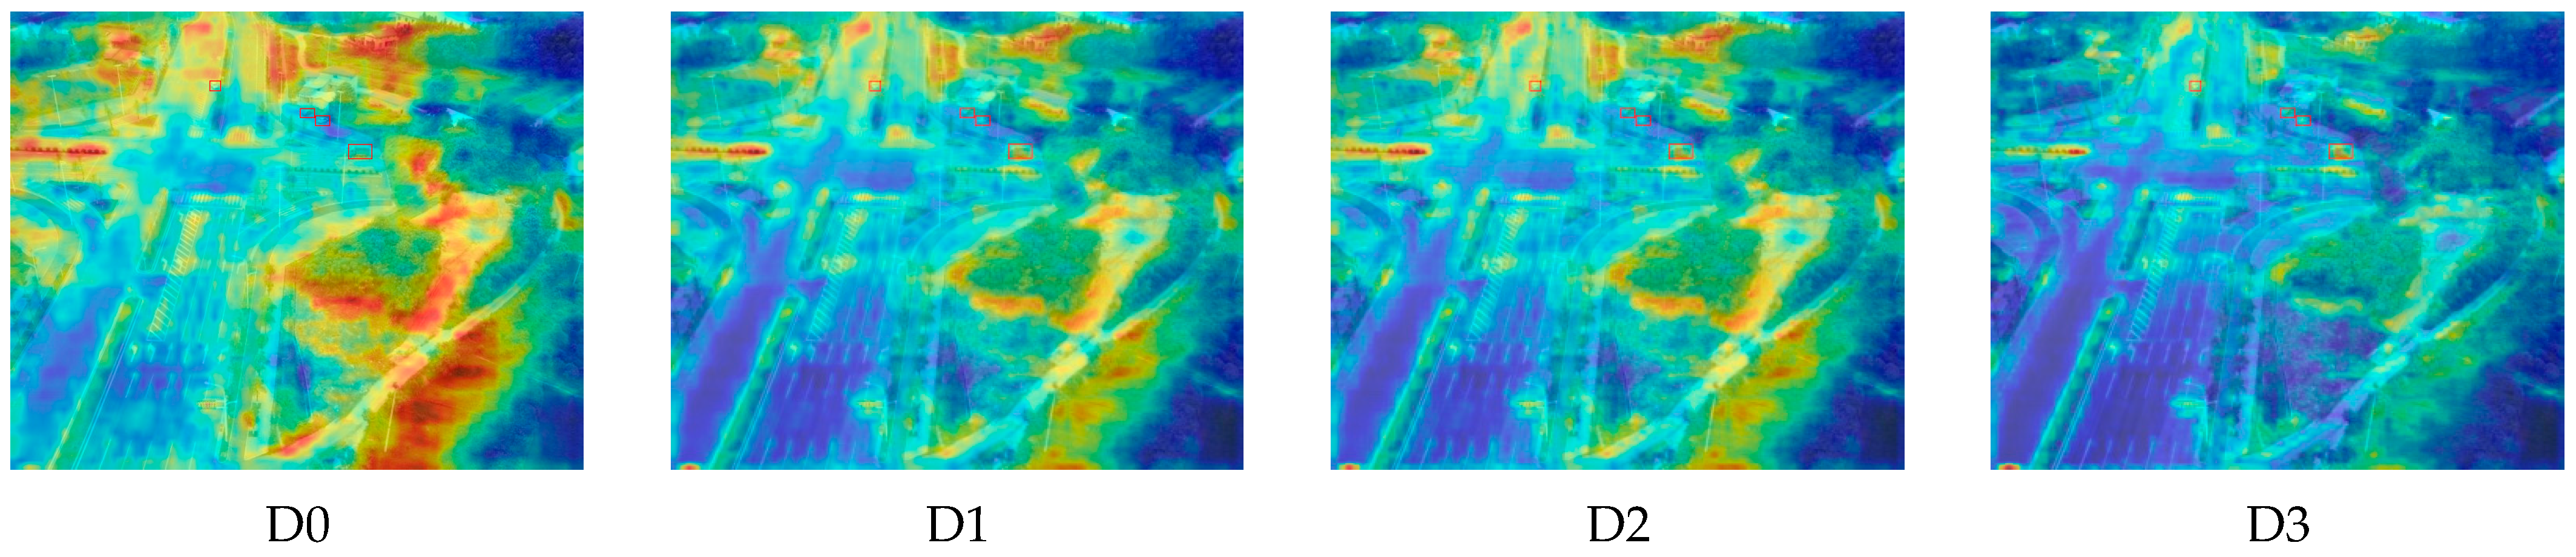
The DS-STD module addresses extreme positive–negative sample imbalance through the spatial tolerance domain concept. D0 serves as the baseline using standard positive sample assignment. D1 implements Boundary Proximity Extension. D2 applies Aspect Ratio Tolerance. D3 combines both strategies.
As shown in Table 6, the Boundary Proximity Extension (D1) improves m A P by 0.84 percentage points, with A P e t increasing from 7.68% to 8.45%, confirming that extremely tiny targets benefit most from increased positive sample coverage. The Aspect Ratio Tolerance (D2) contributes 0.61 percentage points improvement with consistent gains across all target sizes. The combined strategy (D3) achieves a m A P value of 16.12% and A P e t value of 9.34%, with the total improvement (1.75 percentage points) exceeding the sum of individual gains, suggesting synergistic interaction between the two components.
As shown in Figure 15, D0 exhibits scattered high-response regions with substantial background noise interference. D1 with boundary proximity extension shows reduced background activation and more concentrated target responses. D2 with aspect ratio tolerance achieves similar improvement in activation focus. The complete D3 produces the cleanest feature map with minimal background noise and the most precise target highlighting, demonstrating synergistic effects of both strategies.
The effectiveness of DS-STD confirms the impact of inherent ambiguity in aerial remote sensing small target annotation on training: boundary proximity expansion and aspect ratio tolerant matching effectively mitigate the unstable training signal caused by pixel-level annotation uncertainty by increasing positive sample coverage.

4.4.4. Comprehensive Ablation Experiments

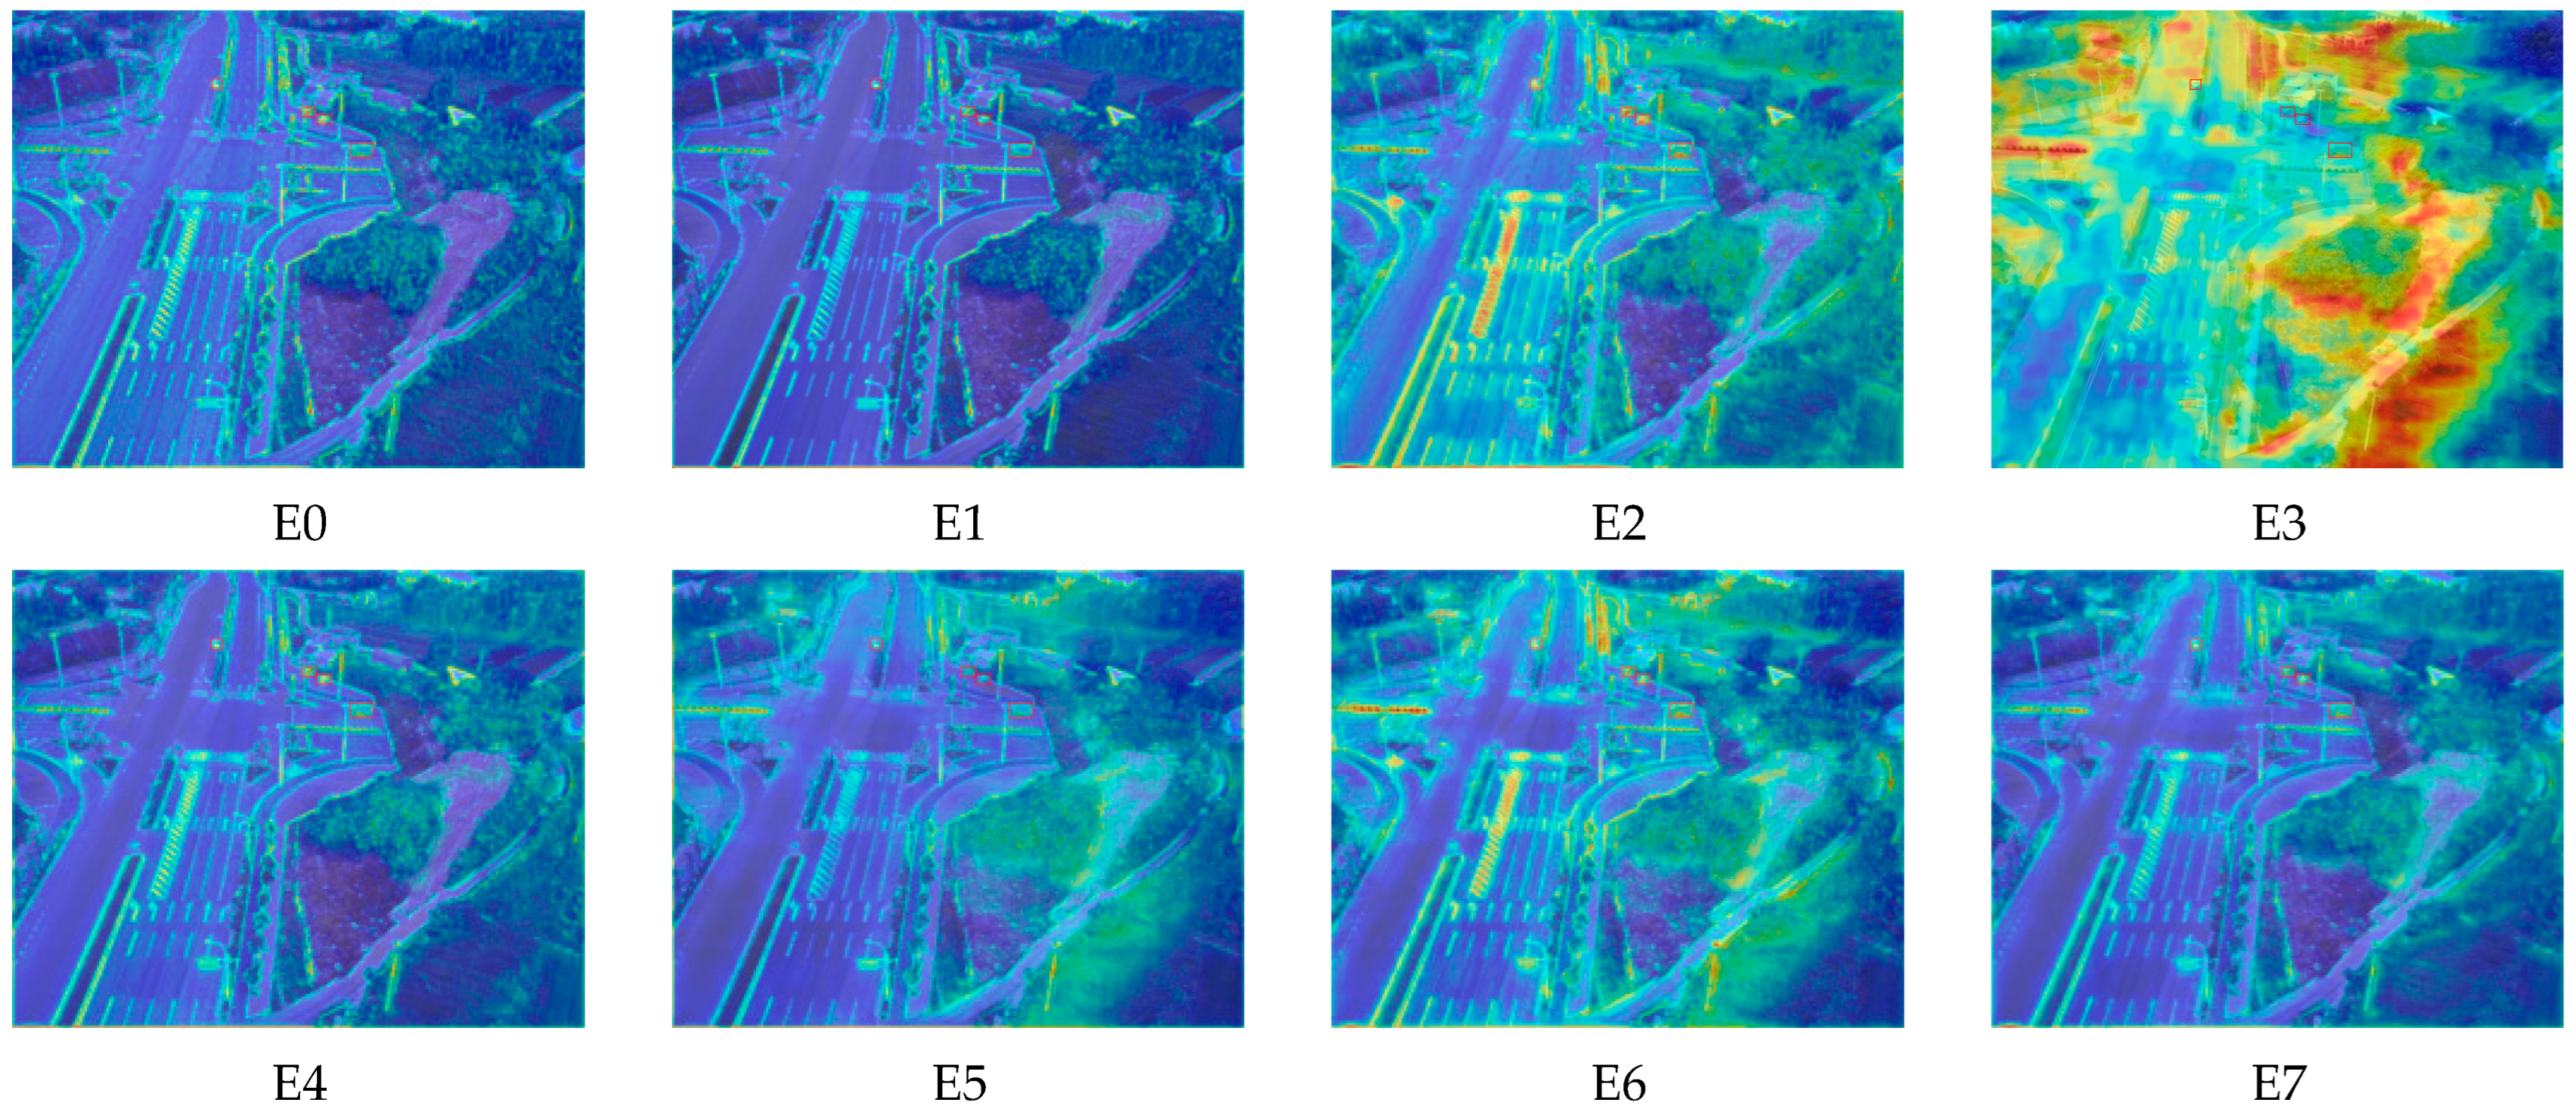
To evaluate overall contribution and interaction effects, we conduct comprehensive experiments with all module combinations. E0 represents baseline, E1–E3 evaluate individual modules, E4–E6 test pairwise combinations, and E7 represents complete RAPT-Net.
As shown in Table 7, among individual modules, CMFE-SRP (E2) provides the largest improvement ( m A P , 17.12%), followed by MRAAF (E1, 15.21%) and DS-STD (E3, 14.37%), aligning with challenge severity where spatial information loss is the most critical bottleneck. The pairwise combinations demonstrate positive synergistic effects: MRAAF with CMFE-SRP (E4) achieves 17.98%, and CMFE-SRP with DS-STD (E6) achieves 18.26%. The complete RAPT-Net (E7) achieves a m A P value of 18.52%, A P e t value of 10.86%, A P t value of 18.59%, and A P s value of 24.12%, with total improvement reaching 6.07 percentage points in m A P and 4.57 percentage points in A P e t (72.7% relative improvement).
As shown in Figure 16, E0 exhibits weak feature activations with minimal target–background discrimination. Since E0, A0, and D0 share identical baseline configuration without any proposed modules, their visualizations are consistent. E1 with only MRAAF shows similar activation patterns to A3, as both employ the complete MRAAF module. E2 with only CMFE-SRP produces significantly enhanced activation intensity with prominent high-response regions. E3 with only DS-STD generates strong but relatively scattered activations. E4–E6 with pairwise module combinations demonstrate progressively refined activation patterns. The complete E7 achieves the most optimal feature representation, combining concentrated target responses with effective background suppression, validating the synergistic interaction among all three modules.
The comprehensive ablation study reveals the relative importance of the three core challenges in aerial remote sensing small object detection: spatial information loss (CMFE-SRP) is the most critical bottleneck, followed by modal fusion (MRAAF) and sample imbalance (DS-STD). The synergistic gain of the three modules combined (6.07 percentage points) exceeds the sum of their individual contributions, indicating that these three challenges are coupled in remote sensing scenarios and require a systematic solution.

5. Discussion

The experimental results reveal several important insights into the proposed framework. First, the performance gap between RAPT-Net and competing methods is substantially larger on RGBT-Tiny (10.3% relative improvement) compared to VEDAI (4.3%), which can be attributed to the different target scale distributions—RGBT-Tiny contains 81.5% targets smaller than 16 × 16 pixels, where the benefits of reliability-aware fusion and spatial preservation become more pronounced. Second, the ablation studies demonstrate that CMFE-SRP contributes the largest individual improvement, followed by MRAAF and DS-STD, aligning with our analysis that spatial information loss represents the most fundamental bottleneck for tiny target detection. Third, the synergistic gain of the complete framework (6.07 percentage point mAP) exceeds the arithmetic sum of individual module contributions, providing empirical evidence for the coupled nature of the three challenges and validating our systematic design philosophy. Unlike existing attention-based fusion methods that learn data-driven feature importance weights, MRAAF explicitly models scene-dependent modality reliability driven by physical imaging conditions, offering more interpretable fusion behavior. Similarly, rather than attempting to recover lost spatial details through learned upsampling as in super-resolution approaches, CMFE-SRP prioritizes preservation of existing spatial information, which proves more effective for extremely tiny targets.
Despite the demonstrated improvements, several limitations warrant acknowledgment. The current implementation requires co-registered RGB-IR image pairs, which may not always be available in operational scenarios; future work could explore fusion strategies robust to moderate misregistration. While RAPT-Net achieves competitive inference speed, the 37.8 M parameter count may pose challenges for deployment on resource-constrained edge platforms such as onboard UAV processors, motivating lightweight architecture design through knowledge distillation or quantization techniques. The current evaluation is limited to visible–infrared modality combinations, and extension to other remote sensing modalities, such as SAR or hyperspectral imagery, could potentially enhance detection robustness but would require modality-specific adaptations. Nevertheless, the demonstrated cross-platform generalization capability and the modular architecture design provide practical value for operational Earth observation applications, enabling incremental deployment pathways where organizations can adopt individual components independently before full system integration.

6. Conclusions

This paper proposes RAPT-Net, an adaptive multimodal small object detection framework addressing three coupled challenges in aerial remote sensing. The MRAAF module achieves scene-adaptive modality integration through two-stage progressive fusion with reliability-guided feedback. The CMFE-SRP module employs hierarchy-specific processing to balance spatial preservation and semantic enhancement. The DS-STD strategy establishes spatial tolerance mechanisms to accommodate annotation physical ambiguity, increasing positive sample coverage by 4×.
Comprehensive experiments on VEDAI and RGBT-Tiny datasets demonstrate that RAPT-Net achieves mAP values of 62.22% and 18.52%, respectively, improving existing state-of-the-art methods by 4.3% and 10.3%, with a 17.3% improvement on extremely tiny targets (<8 × 8 pixels). The framework maintains practical inference speeds (28.95–58.77 FPS) while demonstrating cross-platform adaptability without architectural modification.
Future work will focus on lightweight architecture design for edge computing platforms and extension to additional remote sensing modalities, including SAR and hyperspectral imagery.

Author Contributions

Conceptualization, P.Z., X.S. and X.G.; methodology, P.Z., X.G. and B.S.; software, P.Z.; validation, P.Z.; formal analysis, P.Z.; investigation, P.Z., X.S. and S.H.; resources, X.S. and X.G.; data curation, P.Z., B.S. and R.G.; writing—original draft preparation, P.Z.; writing—review and editing, X.S., X.G. and S.S.; visualization, P.Z. and Z.D.; supervision, X.S., X.G., S.S. and W.J.; project administration, X.S.; funding acquisition, X.S. and X.G. All authors have read and agreed to the published version of the manuscript.

Funding

This research was funded by the Hunan Provincial Postgraduate Research Innovation Programme, grant number XJZH2024033.

Data Availability Statement

The experimental evaluation in this study was conducted on two publicly available datasets. The VEDAI dataset is available at https://downloads.greyc.fr/vedai/ (accessed on 20 October 2025). The RGBT-Tiny dataset is available at https://github.com/XinyiYing/RGBT-Tiny (accessed on 20 October 2025). The trained model weights and implementation code are available upon request from the corresponding author.

Conflicts of Interest

The authors declare no conflicts of interest.

References

  1. Cheng, G.; Han, J. A Survey on Object Detection in Optical Remote Sensing Images. ISPRS J. Photogramm. Remote Sens. 2016, 117, 11–28. [Google Scholar] [CrossRef]
  2. Li, K.; Wan, G.; Cheng, G.; Meng, L.; Han, J. Object Detection in Optical Remote Sensing Images: A Survey and a New Benchmark. ISPRS J. Photogramm. Remote Sens. 2020, 159, 296–307. [Google Scholar] [CrossRef]
  3. Ding, J.; Xue, N.; Xia, G.-S.; Bai, X.; Yang, W.; Yang, M.Y.; Belongie, S.; Luo, J.; Datcu, M.; Pelillo, M.; et al. Object Detection in Aerial Images: A Large-Scale Benchmark and Challenges. IEEE Trans. Pattern Anal. Mach. Intell. 2022, 44, 7778–7796. [Google Scholar] [CrossRef] [PubMed]
  4. Xia, G.-S.; Bai, X.; Ding, J.; Zhu, Z.; Belongie, S.; Luo, J.; Datcu, M.; Pelillo, M.; Zhang, L. DOTA: A Large-Scale Dataset for Object Detection in Aerial Images. In Proceedings of the IEEE Conference on Computer Vision and Pattern Recognition (CVPR), Salt Lake City, UT, USA, 18–23 June 2018. [Google Scholar]
  5. Yuan, Q.; Shen, H.; Li, T.; Li, Z.; Li, S.; Jiang, Y.; Xu, H.; Tan, W.; Yang, Q.; Wang, J.; et al. Deep Learning in Environmental Remote Sensing: Achievements and Challenges. Remote Sens. Environ. 2020, 241, 111716. [Google Scholar] [CrossRef]
  6. Ma, L.; Liu, Y.; Zhang, X.; Ye, Y.; Yin, G.; Johnson, B.A. Deep Learning in Remote Sensing Applications: A Meta-Analysis and Review. ISPRS J. Photogramm. Remote Sens. 2019, 152, 166–177. [Google Scholar] [CrossRef]
  7. Razakarivony, S.; Jurie, F. Vehicle Detection in Aerial Imagery: A Small Target Detection Benchmark. J. Visual Commun. Image Represent. 2016, 34, 187–203. [Google Scholar] [CrossRef]
  8. Tong, X.-Y.; Xia, G.-S.; Lu, Q.; Shen, H.; Li, S.; You, S.; Zhang, L. Land-Cover Classification with High-Resolution Remote Sensing Images Using Transferable Deep Models. Remote Sens. Environ. 2020, 237, 111322. [Google Scholar] [CrossRef]
  9. Tang, J.; Li, L.; Wang, X.; Wang, Y.; Wang, L.; Chen, B. More Diverse Means Better: Multimodal Deep Learning Meets Remote-Sensing Imagery Classification. IEEE Trans. Geosci. Remote Sens. 2022, 60, 4340–4354. [Google Scholar] [CrossRef]
  10. Ying, X.; Xiao, C.; An, W.; Li, R.; He, X.; Li, B.; Cao, X.; Li, Z.; Wang, Y.; Hu, M.; et al. Visible-Thermal Tiny Object Detection: A Benchmark Dataset and Baselines. IEEE Trans. Pattern Anal. Mach. Intell. 2025, 47, 6088–6096. [Google Scholar] [CrossRef]
  11. Yao, H.; Qin, R.; Chen, X. Unmanned Aerial Vehicle for Remote Sensing Applications—A Review. Remote Sens. 2019, 11, 1443. [Google Scholar] [CrossRef]
  12. Ghamisi, P.; Maggiori, E.; Li, S.; Souza, R.; Tarablaka, Y.; Moser, G.; De Giorgi, A.; Fang, L.; Chen, Y.; Chi, M.; et al. New Frontiers in Spectral-Spatial Hyperspectral Image Classification: The Latest Advances Based on Mathematical Morphology, Markov Random Fields, Segmentation, Sparse Representation, and Deep Learning. IEEE Geosci. Remote Sens. Mag. 2018, 6, 10–43. [Google Scholar] [CrossRef]
  13. Li, W.; Chen, C.; Su, H.; Du, Q. Local Binary Patterns and Extreme Learning Machine for Hyperspectral Imagery Classification. IEEE Trans. Geosci. Remote Sens. 2015, 53, 3681–3693. [Google Scholar] [CrossRef]
  14. Zhang, J.; Lei, J.; Xie, W.; Fang, Z.; Li, Y.; Du, Q. SuperYOLO: Super Resolution Assisted Object Detection in Multimodal Remote Sensing Imagery. IEEE Trans. Geosci. Remote Sens. 2023, 61, 5605415. [Google Scholar] [CrossRef]
  15. Li, C.; Liang, X.; Lu, Y.; Zhao, N.; Tang, J. RGB-T Object Tracking: Benchmark and Baseline. Pattern Recognit. 2019, 96, 106977. [Google Scholar] [CrossRef]
  16. Qingyun, F.; Zhaokui, W. Cross-Modality Attentive Feature Fusion for Object Detection in Multispectral Remote Sensing Imagery. Pattern Recognit. 2022, 130, 108786. [Google Scholar] [CrossRef]
  17. Zhang, L.; Zhu, X.; Chen, X.; Yang, X.; Lei, Z.; Liu, Z. Weakly Aligned Cross-Modal Learning for Multispectral Pedestrian Detection. arXiv 2019, arXiv:1901.02645. [Google Scholar] [CrossRef]
  18. Pang, J.; Li, C.; Shi, J.; Xu, Z.; Feng, H. R 2 -CNN: Fast Tiny Object Detection in Large-Scale Remote Sensing Images. IEEE Trans. Geosci. Remote Sens. 2019, 57, 5512–5524. [Google Scholar] [CrossRef]
  19. Cheng, G.; Han, J.; Zhou, P.; Xu, D. Learning Rotation-Invariant and Fisher Discriminative Convolutional Neural Networks for Object Detection. IEEE Trans. Image Process. 2019, 28, 265–278. [Google Scholar] [CrossRef]
  20. Wu, X.; Hong, D.; Chanussot, J. UIU-Net: U-Net in U-Net for Infrared Small Object Detection. IEEE Trans. Image Process. 2023, 32, 364–376. [Google Scholar] [CrossRef]
  21. Chen, C.L.P.; Li, H.; Wei, Y.; Xia, T.; Tang, Y.Y. A Local Contrast Method for Small Infrared Target Detection. IEEE Trans. Geosci. Remote Sens. 2014, 52, 574–581. [Google Scholar] [CrossRef]
  22. Li, C.; Song, D.; Tong, R.; Tang, M. Illumination-Aware Faster R-CNN for Robust Multispectral Pedestrian Detection. Pattern Recognit. 2019, 85, 161–171. [Google Scholar] [CrossRef]
  23. Zhang, Y.; Yu, H.; He, Y.; Wang, X.; Yang, W. Illumination-Guided RGBT Object Detection with Inter- and Intra-Modality Fusion. IEEE Trans. Instrum. Meas. 2023, 72, 2508013. [Google Scholar] [CrossRef]
  24. Liu, J.; Zhang, S.; Wang, S.; Metaxas, D.N. Multispectral Deep Neural Networks for Pedestrian Detection. arXiv 2016, arXiv:1611.02644. [Google Scholar] [CrossRef]
  25. Konig, D.; Adam, M.; Jarvers, C.; Layher, G.; Neumann, H.; Teutsch, M. Fully Convolutional Region Proposal Networks for Multispectral Person Detection. In Proceedings of the 2017 IEEE Conference on Computer Vision and Pattern Recognition Workshops (CVPRW), Honolulu, HI, USA, 21–26 July 2017; IEEE: New York, NY, USA, 2017; pp. 243–250. [Google Scholar] [CrossRef]
  26. Zhang, H.; Fromont, E.; Lefevre, S.; Avignon, B. Guided Attentive Feature Fusion for Multispectral Pedestrian Detection. In Proceedings of the 2021 IEEE Winter Conference on Applications of Computer Vision (WACV), Waikoloa, HI, USA, 3–8 January 2021; IEEE: New York, NY, USA, 2021; pp. 72–80. [Google Scholar] [CrossRef]
  27. Qingyun, F.; Dapeng, H.; Zhaokui, W. Cross-Modality Fusion Transformer for Multispectral Object Detection. arXiv 2021, arXiv:2111.00273. [Google Scholar]
  28. Yuan, M.; Wei, X. C2Former: Calibrated and Complementary Transformer for RGB-Infrared Object Detection. IEEE Trans. Geosci. Remote Sens. 2024, 62, 5403712. [Google Scholar] [CrossRef]
  29. Lin, T.-Y.; Dollár, P.; Girshick, R.; He, K.; Hariharan, B.; Belongie, S. Feature Pyramid Networks for Object Detection. In Proceedings of the IEEE Conference on Computer Vision and Pattern Recognition (CVPR), Honolulu, HI, USA, 21–26 July 2017; IEEE: New York, NY, USA, 2017; pp. 2117–2125. [Google Scholar]
  30. Liu, S.; Qi, L.; Qin, H.; Shi, J.; Jia, J. Path Aggregation Network for Instance Segmentation. In Proceedings of the IEEE Conference on Computer Vision and Pattern Recognition (CVPR), Salt Lake City, UT, USA, 18–23 June 2018; IEEE: New York, NY, USA, 2018; pp. 8759–8768. [Google Scholar]
  31. Tan, M.; Pang, R.; Le, Q.V. EfficientDet: Scalable and Efficient Object Detection. In Proceedings of the IEEE/CVF Conference on Computer Vision and Pattern Recognition (CVPR), Seattle, WA, USA, 13–19 June 2020; IEEE: New York, NY, USA, 2020; pp. 10781–10790. [Google Scholar]
  32. Dai, Y.; Wu, Y.; Zhou, F.; Barnard, K. Attentional Local Contrast Networks for Infrared Small Target Detection. IEEE Trans. Geosci. Remote Sens. 2021, 59, 9813–9824. [Google Scholar] [CrossRef]
  33. Lin, T.-Y.; Goyal, P.; Girshick, R.; He, K.; Dollar, P. Focal Loss for Dense Object Detection. IEEE Trans. Pattern Anal. Mach. Intell. 2020, 42, 318–327. [Google Scholar] [CrossRef] [PubMed]
  34. Zhang, S.; Chi, C.; Yao, Y.; Lei, Z.; Li, S.Z. Bridging the Gap between Anchor-Based and Anchor-Free Detection via Adaptive Training Sample Selection. In Proceedings of the 2020 IEEE/CVF Conference on Computer Vision and Pattern Recognition (CVPR), Seattle, WA, USA, 13–19 June 2020; IEEE: New York, NY, USA, 2020; pp. 9756–9765. [Google Scholar] [CrossRef]
  35. Tian, Z.; Shen, C.; Chen, H.; He, T. FCOS: Fully Convolutional One-Stage Object Detection. In Proceedings of the 2019 IEEE/CVF International Conference on Computer Vision (ICCV), Seoul, Republic of Korea, 27 October–2 November 2019; IEEE: New York, NY, USA, 2020; pp. 9626–9635. [Google Scholar] [CrossRef]
  36. Li, J.; Hong, D.; Gao, L.; Yao, J.; Zheng, K.; Zhang, B.; Chanussot, J. Deep Learning in Multimodal Remote Sensing Data Fusion: A Comprehensive Review. Int. J. Appl. Earth Obs. Geoinf. 2022, 112, 102926. [Google Scholar] [CrossRef]
  37. Roy, S.K.; Deria, A.; Hong, D.; Rasti, B.; Plaza, A.; Chanussot, J. Multimodal Fusion Transformer for Remote Sensing Image Classification. IEEE Trans. Geosci. Remote Sens. 2023, 61, 5515620. [Google Scholar] [CrossRef]
  38. Nikouei, M.; Baroutian, B.; Nabavi, S.; Taraghi, F.; Aghaei, A.; Sajedi, A.; Moghaddam, M.E. Small Object Detection: A Comprehensive Survey on Challenges, Techniques and Real-World Applications. Intell. Syst. Appl. 2025, 27, 200561. [Google Scholar] [CrossRef]
  39. Xu, C.; Wang, J.; Yang, W.; Yu, H.; Yu, L.; Xia, G.-S. Detecting tiny objects in aerial images: A normalized wasserstein distance and a new benchmark. ISPRS J. Photogramm. Remote Sens. 2022, 190, 79–93. [Google Scholar] [CrossRef]
  40. Lin, T.-Y.; Maire, M.; Belongie, S.; Hays, J.; Perona, P.; Ramanan, D.; Dollár, P.; Zitnick, C.L. Microsoft COCO: Common Objects in Context. In Computer Vision—ECCV 2014; Fleet, D., Pajdla, T., Schiele, B., Tuytelaars, T., Eds.; Lecture Notes in Computer Science; Springer International Publishing: Cham, Switzerland, 2014; pp. 740–755. [Google Scholar] [CrossRef]
  41. Zhang, W.; Cong, M.; Wang, L. Algorithms for Optical Weak Small Targets Detection and Tracking: Review. In Proceedings of the International Conference on Neural Networks and Signal Processing, 2003. Proceedings of the 2003, Nanjing, China, 14–17 December 2003; IEEE: New York, NY, USA, 2004; Volume 1, pp. 643–647. [Google Scholar] [CrossRef]
  42. Chen, S.; Ji, L.; Zhu, S.; Ye, M. MICPL: Motion-Inspired Cross-Pattern Learning for Small-Object Detection in Satellite Videos. IEEE Trans. Neural Netw. Learn. Syst. 2025, 36, 6437–6450. [Google Scholar] [CrossRef]
  43. Liu, B.; Jiang, W. LA-YOLO: Bidirectional Adaptive Feature Fusion Approach for Small Object Detection of Insulator Self-Explosion Defects. IEEE Trans. Power Del. 2024, 39, 3387–3397. [Google Scholar] [CrossRef]
  44. Zhu, Z.; Zheng, R.; Qi, G.; Li, S.; Li, Y.; Gao, X. Small Object Detection Method Based on Global Multi-Level Perception and Dynamic Region Aggregation. IEEE Trans. Circuits Syst. Video Technol. 2024, 34, 10011–10022. [Google Scholar] [CrossRef]
  45. Song, K.; Xue, X.; Wen, H.; Ji, Y.; Yan, Y.; Meng, Q. Misaligned Visible-Thermal Object Detection: A Drone-Based Benchmark and Baseline. IEEE Trans. Intell. Veh. 2024, 9, 7449–7460. [Google Scholar] [CrossRef]
  46. Sun, Y.; Cao, B.; Zhu, P.; Hu, Q. Drone-Based RGB-Infrared Cross-Modality Vehicle Detection via Uncertainty-Aware Learning. arXiv 2020, arXiv:2003.02437. [Google Scholar] [CrossRef]
  47. Zhang, Y.; Xu, C.; Yang, W.; He, G.; Yu, H.; Yu, L.; Xia, G.-S. Drone-Based RGBT Tiny Person Detection. ISPRS J. Photogramm. Remote Sens. 2023, 204, 61–76. [Google Scholar] [CrossRef]
  48. Kim, K.; Lee, H.S. Probabilistic Anchor Assignment with IoU Prediction for Object Detection. arXiv 2020, arXiv:2007.08103. [Google Scholar] [CrossRef]
  49. Li, T.; Ye, M.; Wu, T.; Li, N.; Li, S.; Tang, S.; Ji, L. Pseudo Visible Feature Fine-Grained Fusion for Thermal Object Detection. In Proceedings of the IEEE/CVF Conference on Computer Vision and Pattern Recognition (CVPR), Nashville, TN, USA, 11–15 June 2025. [Google Scholar]
  50. Zhao, T.; Liu, B.; Gao, Y.; Sun, Y.; Yuan, M.; Wei, X. Rethinking Multi-Modal Object Detection from the Perspective of Mono-Modality Feature Learning. arXiv 2025, arXiv:2503.11780. [Google Scholar]
  51. Chen, Z.; Ji, H.; Zhang, Y. Global–Local Feature Optimization Based RGB-IR Fusion Object Detection on Drone View. Chin. J. Aeronaut. 2026, 39, 103781. [Google Scholar] [CrossRef]
  52. Shen, J.; Chen, Y.; Liu, Y.; Zuo, X.; Fan, H.; Yang, W. ICAFusion: Iterative Cross-Attention Guided Feature Fusion for Multispectral Object Detection. arXiv 2023, arXiv:2308.07504. [Google Scholar] [CrossRef]
  53. Liu, D.; Zhang, J.; Qi, Y.; Xi, Y.; Jin, J. Exploring Lightweight Structures for Tiny Object Detection in Remote Sensing Images. IEEE Trans. Geosci. Remote Sens. 2025, 63, 5623215. [Google Scholar] [CrossRef]
  54. Jocher, G.; Chaurasia, A.; Qiu, J. Ultralytics/Ultralytics: V8.0.0—Yolov8 Release 2023; Ultralytics: Frederick, MD, USA, 2023; Available online: https://github.com/ultralytics/ultralytics (accessed on 18 January 2026).
  55. Wang, A.; Chen, H.; Liu, L.; Chen, K.; Lin, Z.; Han, J.; Ding, G. YOLOv10: Real-Time End-to-End Object Detection. arXiv 2024, arXiv:2405.14458. [Google Scholar]
Figure 1. Examples of aerospace remote sensing images: (1), (5) and (2), (6) are visible light-infrared images captured by a satellite platform, and (3), (7) and (4), (8) are visible light-infrared images captured by an UAV platform.
Remotesensing 18 00449 g001
Figure 2. Overall architecture of RAPT-Net. Left: MRAAF performs two-stage progressive fusion (F1: coarse-grained reliability estimation; F2: fine-grained feedback modulation; F3: learnable aggregation). Middle: CMFE-SRP employs hierarchy-specific processing with RPU at P2/P3 for spatial preservation, CSAU at P4 for semantic alignment, and GSAU at P5 for context aggregation. Right: DS-STD expands positive sample coverage through spatial tolerance domains during training. S1: FPN; S2: detection head; S3: spatial tolerance supervision.
Remotesensing 18 00449 g002
Figure 3. Reliability-guided feedback modulation in MRAAF. Left: Response map generation for RGB and IR modalities via GAP, ReLU, convolution, and sigmoid activation. Center: Reliability guidance generation from first-stage fused features, producing modality-specific guidance signals. Right: Stage 2 fine-grained reliability modulation with additive scaling factors between 1 and 2, where enhanced features are obtained through element-wise multiplication with residual connection to produce the final fused output.
Remotesensing 18 00449 g003
Figure 4. Physical interpretation of MRAAF reliability modeling under diverse imaging conditions. (a) RGB modality: captures rich spatial texture in well- illuminated regions but exhibits degradation in shadowed areas (e.g., lower-left buildings and vegetation shadows). (b) Infrared modality: maintains stable thermal contrast across all regions regardless of illumination variations, providing complementary information to RGB. (c) Stage 1 fusion: coarse-grained global reliability estimation (Equations (1)–(6)) adaptively balances RGB and infrared contributions, yielding initial fused features with improved robustness. (d) Stage 2 fusion: fine-grained reliability modulation with feedback from Stage 1 (Equations (7)–(11)) further refines spatial adaptation through reliability-guided scaling factors, achieving optimal detection consistency across both well-lit and challenging regions. The progressive enhancement from (c) to (d) demonstrates that MRAAF’s reliability modeling is physics-driven—explicitly responding to observable imaging conditions such as illumination, shadow, and thermal contrast—rather than learning abstract attention weights, with the two-stage feedback mechanism ensuring fusion quality directly influences subsequent modulation.
Remotesensing 18 00449 g004
Figure 5. Cross-modal Semantic Alignment Unit (CSAU) with sequential channel-spatial attention and learnable gating fusion. Blue dashed box: Channel Attention Module with GAP, FC layers, and sigmoid activation for channel-wise recalibration. Green dashed box: Spatial attention via parallel Average Pooling and Max Pooling branches, concatenation, 7 × 7 convolution, and sigmoid activation. Right: Learnable gating mechanism fuses attention-enhanced features with residual input through adaptive weighting.
Remotesensing 18 00449 g005
Figure 6. Geographic Spatial Aggregation Unit (GSAU) with multi-scale spatial pyramid pooling. Input features are reduced via 1 × 1 convolution, then processed by three parallel Max Pooling branches with kernel sizes of 5 × 5, 9 × 9, and 13 × 13, capturing local neighborhood, medium-range context, and wide-area context, respectively. The pooled features are concatenated with reduced features and fused through convolution to aggregate multi-scale geospatial information.
Remotesensing 18 00449 g006
Figure 7. Boundary Proximity Extension Rule for positive sample expansion. Red dots indicate target centers, green cells represent positive samples, and gray cells represent negative samples. Parameters g x and g y denote relative target center positions within grid cells. Center positions ( g x = 0.5, g y = 0.5) yield 1 positive sample; boundary proximity in one dimension yields 2 positive samples; corner proximity yields 4 positive samples, achieving up to 300% improvement in positive sample coverage.
Remotesensing 18 00449 g007
Figure 8. Object size distribution characteristics in multispectral detection datasets. (a) VEDAI dataset with eight vehicle classes, showing targets concentrated in 20–100 pixel width and 10–100 pixel height ranges, reflecting stable high-altitude satellite imaging geometry. (b) RGBT-Tiny dataset with seven object classes, exhibiting strong concentration below 50 pixels in both dimensions with a diagonal aspect ratio pattern, reflecting extreme scale compression from UAV platforms at 60–100 m altitude where over 81% of targets are smaller than 16 × 16 pixels.
Remotesensing 18 00449 g008
Figure 9. Precision–Recall (PR) curves of different methods on the VEDAI dataset. The compared methods include single-modality detectors (YOLOv8_RGB, YOLOv8_IR, YOLOv10_RGB, YOLOv10_IR), general multimodal fusion methods (CFT, ICAFusion, CMA-Det, QFDet, GLFDet), and remote sensing-optimized detectors (SuperYOLO and the proposed RAPT-Net). The curves exhibit approximate hierarchical stratification: RAPT-Net, SuperYOLO, and GLFDet form the top tier with frequent crossovers among them; CFT, QFDet, and ICAFusion constitute the middle tier; single-modality detectors occupy the bottom tier, showing rapid precision decay as recall increases. Although GLFDet shows competitive or slightly higher precision in certain recall ranges, RAPT-Net achieves the best overall performance in terms of area under the curve. Notably, in the high recall region (>0.6), RAPT-Net maintains a more gradual descent compared to other methods, reflecting its superior capability in retrieving difficult samples without introducing excessive false positives.
Remotesensing 18 00449 g009
Figure 10. Qualitative detection results of different methods on the VEDAI dataset. Each row displays the same scene processed by different methods, with columns arranged as Ground Truth (GT), YOLOv8, CFT, SuperYOLO, GLFDet, and RAPT-Net (ours). Row 1 shows a waterside scene containing vessels, where RAPT-Net generates clean and accurate bounding boxes, while YOLOv8 exhibits obvious missed detections and GLFDet produces severe false positives. Row 2 presents a parking area with multiple vehicles, where RAPT-Net’s detection boxes precisely cover all targets with consistent box sizes, whereas other methods show missed detections or redundant boxes. Row 3 depicts a scene with cluttered line patterns in the background, where both GLFDet and SuperYOLO exhibit false detections triggered by background interference, while RAPT-Net maintains clean outputs focusing only on actual targets. Row 4 illustrates a complex scene with scattered vehicles, where RAPT-Net consistently generates correct detection boxes, while all competing methods exhibit false detections. Across all visualizations, RAPT-Net demonstrates the most consistent detection behavior with minimal background interference and precise target localization, validating the effectiveness of the proposed MRAAF, CMFE-SRP, and DS-STD modules.
Remotesensing 18 00449 g010
Figure 11. Precision–Recall (PR) curves of different methods on the RGBT-Tiny dataset. The compared methods include single-modality detectors (YOLOv8_RGB, YOLOv8_IR, YOLOv10_RGB, YOLOv10_IR), general multimodal fusion methods (CFT, ICAFusion, CMA-Det, QFDet, GLFDet), and remote sensing-optimized detectors (SuperYOLO and the proposed RAPT-Net). Notably, the effective recall range is constrained to [0, 0.6] rather than [0, 1.0] as observed in VEDAI, reflecting inherent limitations in feature representation for extremely tiny targets. The curves exhibit clear stratification where multimodal fusion methods occupy the upper region, while single-modality detectors cluster at the bottom. In the low recall region (below 0.45), GLFDet, QFDet, and SuperYOLO exhibit higher precision than RAPT-Net; however, in the high recall region (above 0.45), RAPT-Net surpasses all other methods and maintains a more gradual descent, demonstrating stronger capability in retrieving difficult samples. In terms of area under the curve, RAPT-Net achieves the best overall performance. Particularly, YOLOv8_RGB terminates before reaching 0.2 recall, and other single-modality methods approach near-zero precision beyond 0.3 recall, visually demonstrating the essential role of multimodal fusion for extremely tiny target detection.
Remotesensing 18 00449 g011
Figure 12. Qualitative detection results of different methods on the RGBT-Tiny dataset. Each row displays the same scene processed by different methods, with columns arranged as Ground Truth (GT), YOLOv8, CFT, SuperYOLO, GLFDet, and RAPT-Net (ours). Row 1 shows an urban road scene containing vehicles and a bus, where RAPT-Net produces comprehensive coverage with detection boxes closely matching ground truth annotations, while YOLOv8 exhibits obvious false detections and missed detections, and CFT, SuperYOLO, GLFDet all fail to detect the bus target. Row 2 presents a dense target scene with increased detection difficulty, where YOLOv8 shows numerous missed detections, CFT, SuperYOLO, and GLFDet exhibit obvious false detections, and although RAPT-Net also has some missed detections, its detection accuracy is significantly improved compared to other methods. Row 3 depicts an extremely challenging scene with very tiny targets, where RAPT-Net still demonstrates precise detection capability, while other methods struggle with accurate localization. Row 4 illustrates a low illumination scene, where YOLOv8 completely fails to detect any targets, CFT and SuperYOLO suffer from severe missed detections, GLFDet exhibits more severe false detections, while RAPT-Net shows neither false detections nor missed detections. Across all visualizations, RAPT-Net demonstrates the highest detection density with minimal background interference, validating its superior capability for extremely tiny target detection under varying illumination conditions and complex backgrounds.
Remotesensing 18 00449 g012
Figure 13. Visualization of MRAAF ablation experiments. A0 (baseline) exhibits diffuse activations with weak target–background discrimination. A1 (single-stage) shows improved spatial localization. A2 (two-stage without feedback) demonstrates further concentration. A3 (complete MRAAF) produces the sharpest responses with optimal target highlighting, validating the effectiveness of two-stage progressive fusion with reliability-guided feedback mechanism. Red boxes are ground truth label.
Remotesensing 18 00449 g013
Figure 14. Visualization of CMFE-SRP ablation experiments. B0 is omitted as it shares identical visualization with baseline A0. B1 (RPU at P2/P3) shows uniform activation with moderate responses. B2 (CSAU at P4) produces stronger intensity with prominent high-response regions. B3 (GSAU at P5) exhibits diffuse patterns. B4 (complete CMFE-SRP) achieves optimal balance with concentrated target responses and suppressed background interference, validating synergistic interaction among hierarchy-specific units. Red boxes are ground truth label.
Remotesensing 18 00449 g014
Figure 15. Visualization of DS-STD ablation experiments. D0 (baseline) exhibits scattered responses with substantial background noise. D1 (Boundary Proximity Extension) shows reduced background activation and concentrated target responses. D2 (Aspect Ratio Tolerance) achieves similar improvement in activation focus. D3 (complete DS-STD) produces the cleanest feature map with minimal noise and precise target highlighting, demonstrating synergistic effects of both strategies in mitigating annotation uncertainty. Red boxes are ground truth label.
Remotesensing 18 00449 g015
Figure 16. Visualization of comprehensive ablation experiments. E0 (baseline) exhibits weak activations with minimal discrimination. E1 (MRAAF) shows improved modality fusion. E2 (CMFE-SRP) produces enhanced intensity with prominent responses. E3 (DS-STD) generates strong but scattered activations. E4 to E6 (pairwise combinations) demonstrate progressively refined patterns. E7 (complete RAPT-Net) achieves optimal representation with concentrated target responses and effective background suppression, validating synergistic interaction among all modules. Red boxes are ground truth label.
Remotesensing 18 00449 g016
Table 1. Target size distribution of multi-platform aerial remote sensing datasets. Size categories are defined as follows: extremely tiny ( 1 2 8 2 pixels), tiny ( 8 2 16 2 pixels), small ( 16 2 32 2 pixels), medium ( 32 2 96 2 pixels), and large ( > 96 2 pixels) following [10].
DatasetPlatformExtremely TinyTinySmallMediumLarge
VEDAISatellite0.3%0.0%40.7%58.3%0.7%
DroneVehicleUAV0.0%0.0%11.6%84.9%3.5%
DVTODUAV0.0%0.0%2.4%31.8%65.8%
RGBTDronePersonUAV7.7%84.3%7.9%0.1%0.0%
RGBT-TinyUAV36.7%44.8%15.9%2.5%0.1%
Table 2. Quantitative comparison of different methods on the VEDAI dataset. Methods are categorized into three groups: single-modality detectors (YOLOv8, YOLOv10), general multimodal fusion methods (CFT, ICAFusion, CMA-Det, QFDet, GLFDet), and remote sensing-optimized multimodal detectors (SuperYOLO, proposed RAPT-Net). Evaluation metrics include mean Average Precision (mAP) averaged over SAFit thresholds [0.5:0.05:0.95], scale-specific Average Precision for small targets (APs) and medium targets (APm), and Average Recall (AR). The best results are highlighted in red bold, second-best in blue bold, and third-best in purple bold. RAPT-Net achieves favorable accuracy–efficiency trade-off for practical deployment.
MethodsModalitymAPmAP50mAP75APsAPmARParams (M)GFLOPsFPS
YOLOv8RGB0.54280.78850.68600.44370.55210.19193.018.9230.83
YOLOv8IR0.56400.80020.70920.46520.57080.19913.018.9231.08
YOLOv10RGB0.49080.71280.62720.39240.49190.17932.718.4138.43
YOLOv10IR0.51550.74100.65900.41910.51230.19372.718.4137.55
CFTRGB-IR0.58420.81620.71570.48460.60610.216032.489.623.71
ICAFusionRGB-IR0.57810.80940.69610.47680.59620.206635.498.245.00
SuperYOLORGB-IR0.59670.83800.74040.50560.61190.22375.0454.321.04
CMA-DetRGB-IR0.57170.79640.69090.47010.58390.208527.6141.315.16
QFDetRGB-IR0.58460.81510.70400.48770.59240.215851.2168.526.30
GLFDetRGB-IR0.57600.80770.69110.47320.58860.206929.3156.815.00
RAPT-Net (ours)RGB-IR0.62220.84830.75950.52680.64520.243937.864.928.95
Table 3. Quantitative comparison of different methods on the RGBT-Tiny dataset. This dataset serves as the first large-scale benchmark specifically designed for visible-thermal tiny object detection, containing over 81% targets smaller than 16 × 16 pixels, providing an ideal platform for evaluating algorithm performance under extreme scale conditions. Methods are categorized into three groups: single-modality detectors (YOLOv8, YOLOv10), general multimodal fusion methods, and remote sensing-optimized multimodal detectors (SuperYOLO and the proposed RAPT-Net). Evaluation metrics include mean Average Precision (mAP) averaged over SAFit thresholds [0.5:0.05:0.95]; mAP at IoU thresholds of 0.50 and 0.75; scale-specific Average Precision for extremely tiny targets (APet), tiny targets (APt), and small targets (APs); as well as Average Recall (AR). The best results are highlighted in red bold, second-best in blue bold, and third-best in purple bold. All methods are trained and evaluated under identical experimental settings for fair comparison.
MethodsModalitymAPmAP50mAP75APetAPtAPsARParams (M)GFLOPsFPS
YOLOv8RGB0.10840.19870.12510.05240.09920.15670.14283.012.78230.94
YOLOv8IR0.08620.15810.09760.03420.07180.12360.11353.012.78229.48
YOLOv10RGB0.11390.20640.13170.05710.10470.16390.14822.712.62138.56
YOLOv10IR0.09040.16450.10240.03780.07610.12970.11882.712.62138.92
CFTRGB-IR0.12540.22760.14650.06240.11780.18540.164732.427.945.74
ICAFusionRGB-IR0.13760.24540.16180.07460.13240.20760.182335.430.6103.50
SuperYOLORGB-IR0.14250.25580.16840.07140.13370.19840.18865.0416.952.60
CMA-DetRGB-IR0.12050.21780.13790.05930.11380.17450.157127.644.030.32
QFDetRGB-IR0.16790.30150.19490.09260.16310.22670.217451.252.535.94
GLFDetRGB-IR0.12960.23470.14840.06480.12130.19240.169729.348.937.50
RAPT-Net (ours)RGB-IR0.18520.32870.21420.10860.18590.24120.236937.820.358.77
Table 4. Ablation study of MRAAF fusion strategy on the RGBT-Tiny dataset. A0: baseline with simple concatenation fusion. A1: single-stage MRAAF with coarse-grained reliability estimation. A2: two-stage fusion without feedback mechanism. A3: complete MRAAF with learnable aggregation and reliability-guided feedback. Metrics include mAP and scale-specific APet, APt, APs. Results demonstrate progressive improvement from each component.
IDFusion StrategyGuidancemAPAPetAPtAPs
A0Baseline×0.12450.06290.11640.1732
A1Single stage×0.13680.07180.12850.1896
A2Two stage×0.14560.08040.13780.2014
A3Two stage0.15210.08650.14520.2108
Table 5. Ablation study of CMFE-SRP hierarchy-specific processing units on the RGBT-Tiny dataset. B0: baseline with standard C3 blocks at all levels. B1: RPU at P2/P3 for spatial preservation. B2: CSAU at P4 for semantic alignment. B3: GSAU at P5 for context aggregation. B4: complete CMFE-SRP integrating all units. Metrics include mAP and scale-specific APet, APt, APs. Results confirm that RPU at shallow layers contributes the most significant improvement for tiny target detection.
IDP2/P3P4P5mAPAPetAPtAPs
B0C3C3C3+SPP0.12450.06290.11640.1732
B1RPUC3C3+SPP0.15860.09240.15180.2103
B2C3CSAUC3+SPP0.14120.07580.13370.1894
B3C3C3GSAU0.13280.06940.12510.1806
B4RPUCSAUGSAU0.17120.10150.16470.2256
Table 6. Ablation study of DS-STD dense supervision strategy on the RGBT-Tiny dataset. D0: baseline with standard positive sample assignment. D1: Boundary Proximity Extension for grid assignment tolerance. D2: Aspect Ratio Tolerance Matching for shape variation accommodation. D3: complete DS-STD combining both strategies with up to 4× positive sample expansion. Metrics include mAP and scale-specific APet, APt, APs. Results demonstrate synergistic improvement exceeding the sum of individual contributions.
IDBoundary ExtensionAspect Ratio TolerancemAPAPetAPtAPs
D0××0.14370.07680.13590.1975
D1×0.15210.08450.14460.2068
D2×0.14980.08210.14230.2041
D30.16120.09340.15480.2187
Table 7. Comprehensive ablation study of module combinations on the RGBT-Tiny dataset. E0: baseline without proposed modules. E1 to E3: individual modules (MRAAF, CMFE-SRP, DS-STD). E4 to E6: pairwise combinations. E7: complete RAPT-Net. Metrics include mAP and scale-specific APet, APt, APs. Results show CMFE-SRP provides the largest individual improvement, and the complete framework achieves 6.07 percentage point mAP improvement, with synergistic gains exceeding the sum of individual contributions.
IDMRAAFCMFE-SRPDS-STDmAPAPetAPtAPs
E0×××0.12450.06290.11640.1732
E1××0.15210.08650.14520.2108
E2××0.17120.10150.16470.2256
E3××0.14370.07680.13590.1975
E4×0.17980.10840.17310.2348
E5×0.16430.09470.15760.2186
E6×0.18260.10170.17640.2391
E70.18520.10860.18590.2412
Disclaimer/Publisher’s Note: The statements, opinions and data contained in all publications are solely those of the individual author(s) and contributor(s) and not of MDPI and/or the editor(s). MDPI and/or the editor(s) disclaim responsibility for any injury to people or property resulting from any ideas, methods, instructions or products referred to in the content.