Article

Forest Age Estimation by Integrating Tree Species Identity and Multi-Source Remote Sensing: Validating Heterogeneous Growth Patterns Through the Plant Economic Spectrum Theory


1
Yunnan Key Laboratory of Ecological Environment Evolution and Pollution Control in Mountainous Rural Areas, Southwest Forestry University, Kunming 650233, China
2
National Positioning and Observation Station of Karst Ecosystem in Zhanyi, Yunnan, State Forestry and Grassland Administration, Kunming 650233, China
3
College of Forestry, Southwest Forestry University, Kunming 650224, China
*
Author to whom correspondence should be addressed.
Remote Sens. 2026, 18(3), 407; https://doi.org/10.3390/rs18030407
Submission received: 27 November 2025 / Revised: 9 January 2026 / Accepted: 21 January 2026 / Published: 26 January 2026

Highlights

What are the main findings?
  • A tandem remote sensing framework that integrates species classification and species-aware growth modeling achieves a substantial improvement in plantation age estimation accuracy (R2 increased from 0.62 to 0.84).
  • It provides direct empirical evidence that the Plant Economic Spectrum theory is traceable in remote sensing data, with species’ functional traits driving distinct age–feature relationships.
What are the implications of the main findings?
  • The framework shows high operational robustness (error propagation coefficient γ = 0.23), demonstrating its feasibility for large-scale mapping despite classification uncertainties.
  • This species-informed methodology establishes a reliable basis for enhancing the accuracy of plantation carbon sink quantification and enables precision forest management.

Abstract

Current mainstream remote sensing approaches to forest age estimation frequently neglect interspecific differences in functional traits, which may limit the accurate representation of species-specific tree growth strategies. This study develops and validates a technical framework that incorporates multi-source remote sensing and tree species functional trait heterogeneity to systematically improve the accuracy of plantation age mapping. We constructed a processing chain—“multi-source feature fusion–species identification–heterogeneity modeling”—for a typical karst plantation landscape in southeastern Yunnan. Using the Google Earth Engine (GEE) platform, we integrated Sentinel-1/2 and Landsat time-series data, implemented a Gradient Boosting Decision Tree (GBDT) algorithm for species classification, and built age estimation models that incorporate species identity as a proxy for the growth strategy heterogeneity delineated by the Plant Economic Spectrum (PES) theory. Key results indicate: (1) Species classification reached an overall accuracy of 89.34% under spatial block cross-validation, establishing a reliable basis for subsequent modeling. (2) The operational model incorporating species information achieved an R2 (coefficient of determination) of 0.84 (RMSE (Root Mean Square Error) = 6.52 years) on the test set, demonstrating a substantial improvement over the baseline model that ignored species heterogeneity (R2 = 0.62). This demonstrates that species identity serves as an effective proxy for capturing the growth strategy heterogeneity described by the Plant Economic Spectrum (PES) theory, which is both distinguishable and valuable for modeling within the remote sensing feature space. (3) Error propagation analysis demonstrated strong robustness to classification uncertainties (γ = 0.23). (4) Plantation structure in the region was predominantly young-aged, with forests aged 0–20 years covering over 70% of the area. Despite inherent uncertainties in ground-reference age data, the integrated framework exhibited clear relative superiority, improving R2 from 0.62 to 0.84. Both error propagation analysis (γ = 0.23) and Monte Carlo simulations affirmed the robustness of the tandem workflow and the stability of the findings, providing a reliable methodology for improved-accuracy plantation carbon sink quantification.

1. Introduction

Planted forest ecosystems play a critical role in the global carbon cycle, and precise quantification of their carbon sequestration capacity is crucial for deciphering carbon cycle mechanisms, evaluating terrestrial carbon budgets, and advancing carbon neutrality objectives [1,2]. According to the Global Carbon Budget 2023 report [3], the contribution of plantations to the global forest carbon sink has risen markedly, surpassing that of natural forests in certain regions [4,5]. However, prevailing remote sensing-based monitoring approaches predominantly rely on uniform frameworks that disregard interspecies variation, thereby neglecting the functional trait heterogeneity among tree species, as articulated by the Plant Economic Spectrum (PES) theory [6]. Tree species are distributed along a conservative–acquisitive strategy continuum, embodying fundamental differences in resource allocation, growth rates, and ecological strategies (for instance, slow-growing, conservative Pinus armandii versus fast-growing, acquisitive Cunninghamia lanceolata) [7]. These inherent disparities inevitably lead to species-specific relationships between forest age and remote sensing features, introducing systematic biases into uniform modeling frameworks [8].
Forest age is a key biophysical parameter governing carbon stock accumulation and carbon flux dynamics in plantations, directly determining the magnitude, duration, and saturation point of ecosystem carbon sinks [9]. Compared to natural forests, plantations typically exhibit more uniform age structures, well-defined species composition, and documented management histories, presenting distinct advantages for developing high-precision remote sensing monitoring methodologies [10,11]. Although field surveys and forest inventories can provide accurate age data, their labor-intensive and costly nature limits their application for large-scale, continuous monitoring [12]. With rapid advances in Earth observation technology, multi-source remote sensing has emerged as a vital tool for extracting plantation parameters. Nevertheless, achieving high-precision, operational-scale age estimation in topographically complex and highly heterogeneous landscapes remains a formidable challenge [13,14].
The integration of multi-source remote sensing data offers a promising technical pathway for precision plantation monitoring [15,16]. Optical remote sensing (e.g., Sentinel-2, Landsat) delivers rich spectral information reflective of vegetation physiological status [17,18]; radar remote sensing (e.g., Sentinel-1) penetrates clouds and vegetation canopies, enabling sensitive detection of structural properties [19]; and topographic data help characterize the effects of habitat heterogeneity on species distribution and growth [20]. The synergistic fusion of multi-source data has the potential to overcome the limitations inherent to individual data sources, thereby enabling a more holistic analysis of plantation structure and ecological function [16,21]. However, operationalizing integrated ‘species identification–parameter retrieval’ tandem frameworks remains challenging, primarily due to the propagation of errors from the classification stage to downstream retrieval accuracy—an effect that current research often fails to adequately quantify [22]. This issue is particularly critical given the unavoidable uncertainties in ground-truth forest age, making the objective assessment of the incremental value contributed by incorporating species functional trait heterogeneity a key scientific problem in methodological validation [14].
In the realm of tree species classification, open access to Sentinel satellite data, coupled with the combined use of multi-temporal, multi-spectral, and multi-angle observations, has substantially enhanced classification capabilities [23,24]. For example, Persson et al. [25] improved the classification accuracy of temperate plantation species in Northern Europe to 89% by synergistically fusing Sentinel-1 SAR and Sentinel-2 MSI data [24]. Nonetheless, existing research concentrates largely on temperate, relatively homogeneous landscapes, with comparatively less attention paid to the methodological applicability and regional adaptation of species classification in subtropical areas characterized by complex terrain [26]. In terms of feature engineering, although a growing number of studies have begun to emphasize topographic and temporal dynamic features, as well as feature fusion [27,28], the question of how to systematically harness the synergistic effects of multi-source features (optical, radar, topographic, temporal) to overcome parameter retrieval bottlenecks in specific contexts—such as subtropical karst mountainous plantations—remains a subject requiring further investigation.
Crucially, current studies often treat ‘classification’ and ‘retrieval’ as disconnected steps, and during retrieval, they overlook interspecies growth heterogeneity. Methods for estimating plantation age have evolved from empirical–statistical approaches toward more mechanistic modeling [14]. Early studies primarily established statistical relationships between age and remote sensing metrics but were constrained by spatial resolution, limiting their ability to capture landscape heterogeneity [29,30]. The widespread application of Landsat time-series data promoted the maturation of age estimation methods based on disturbance detection [31]. Algorithms like LandTrendr, developed by Kennedy et al. [32], facilitate the temporal reconstruction of plantation age by detecting vegetation disturbance and recovery processes, yet they still struggle to identify non-significant management interventions [33]. In recent years, machine learning techniques have demonstrated considerable potential; however, most current studies presume a universal age–remote sensing feature relationship across all species, ignoring divergent growth characteristics [34]. According to the Plant Economic Spectrum theory [6,7], the three focal species in this study occupy distinct positions along the conservative–acquisitive strategy continuum: Pinus armandii is a slow-growing, conservative species adapted to high altitudes; Cunninghamia lanceolata is a fast-growing, resource-acquisitive timber species; and Pinus yunnanensis exhibits an intermediate strategy adapted to dry–hot valleys. Our pre-experiments confirmed that a uniform model systematically underestimated the age of conservative P. armandii stands (mean bias: −6.2 years) while overestimating that of acquisitive C. lanceolata stands (mean bias: +2.1 years). This pattern provides preliminary evidence for the critical role of PES-based growth strategy heterogeneity in modulating the age–remote sensing relationship and highlights a theoretical shortcoming in frameworks that ignore it.
A key contribution of this study is the systematic incorporation of Plant Economic Spectrum theory into the remote sensing-based forest age estimation framework, constructing a causal chain: ‘functional trait heterogeneity → remote sensing feature response → age estimation accuracy’. In contrast to prior research [22], our operational model (hereafter referred to as M_operational) utilizes the species probability distribution predicted by the front-end classifier as feature inputs. This approach achieves data-driven, species-specific modeling that enhances adaptability while preserving operational feasibility. The karst ecosystem of southeastern Yunnan provides a compelling regional context [35]. This area is characterized by high habitat heterogeneity, shallow soils, and unique hydrological conditions. In such stressful environments, the influence of interspecific functional trait differences on growth is likely amplified, rendering this region an ideal testbed for our approach. This study systematically constructed three progressively advanced comparative models: M_baseline (baseline model), M_feature (feature selection model), and M_operational (operational model), aiming to address the following scientific questions: (1) Can the incorporation of species information enhance the accuracy of forest age estimation? (2) Is the tandem framework robust to front-end classification errors? (3) What systematic differences exist in the age–remote sensing feature relationships among different species? The three selected tree species exhibit clear niche differentiation along the plant economic spectrum, providing independent ecological evidence for interpreting species-divergent remote sensing response patterns. The core logic of our framework is to use the species probability distribution, derived from multi-source remote sensing data, as a key input feature to represent the inherent growth strategy heterogeneity among species as revealed by the Plant Economic Spectrum theory, thereby constructing a differentiated age estimation model. This differs from an end-to-end learning approach that inputs all raw remote sensing bands into a black-box model. Instead, by introducing “species identity” as an ecological prior, we guide the model to structurally learn heterogeneous patterns, thereby enhancing the interpretability and physical basis of the model. By establishing a comprehensive technical workflow, we quantified the contribution of species identity to age estimation, evaluated the propagation of classification errors, and ultimately delivered a reliable methodology for high-accuracy assessment of plantation carbon sinks.

2. Data and Methods

2.1. Study Area

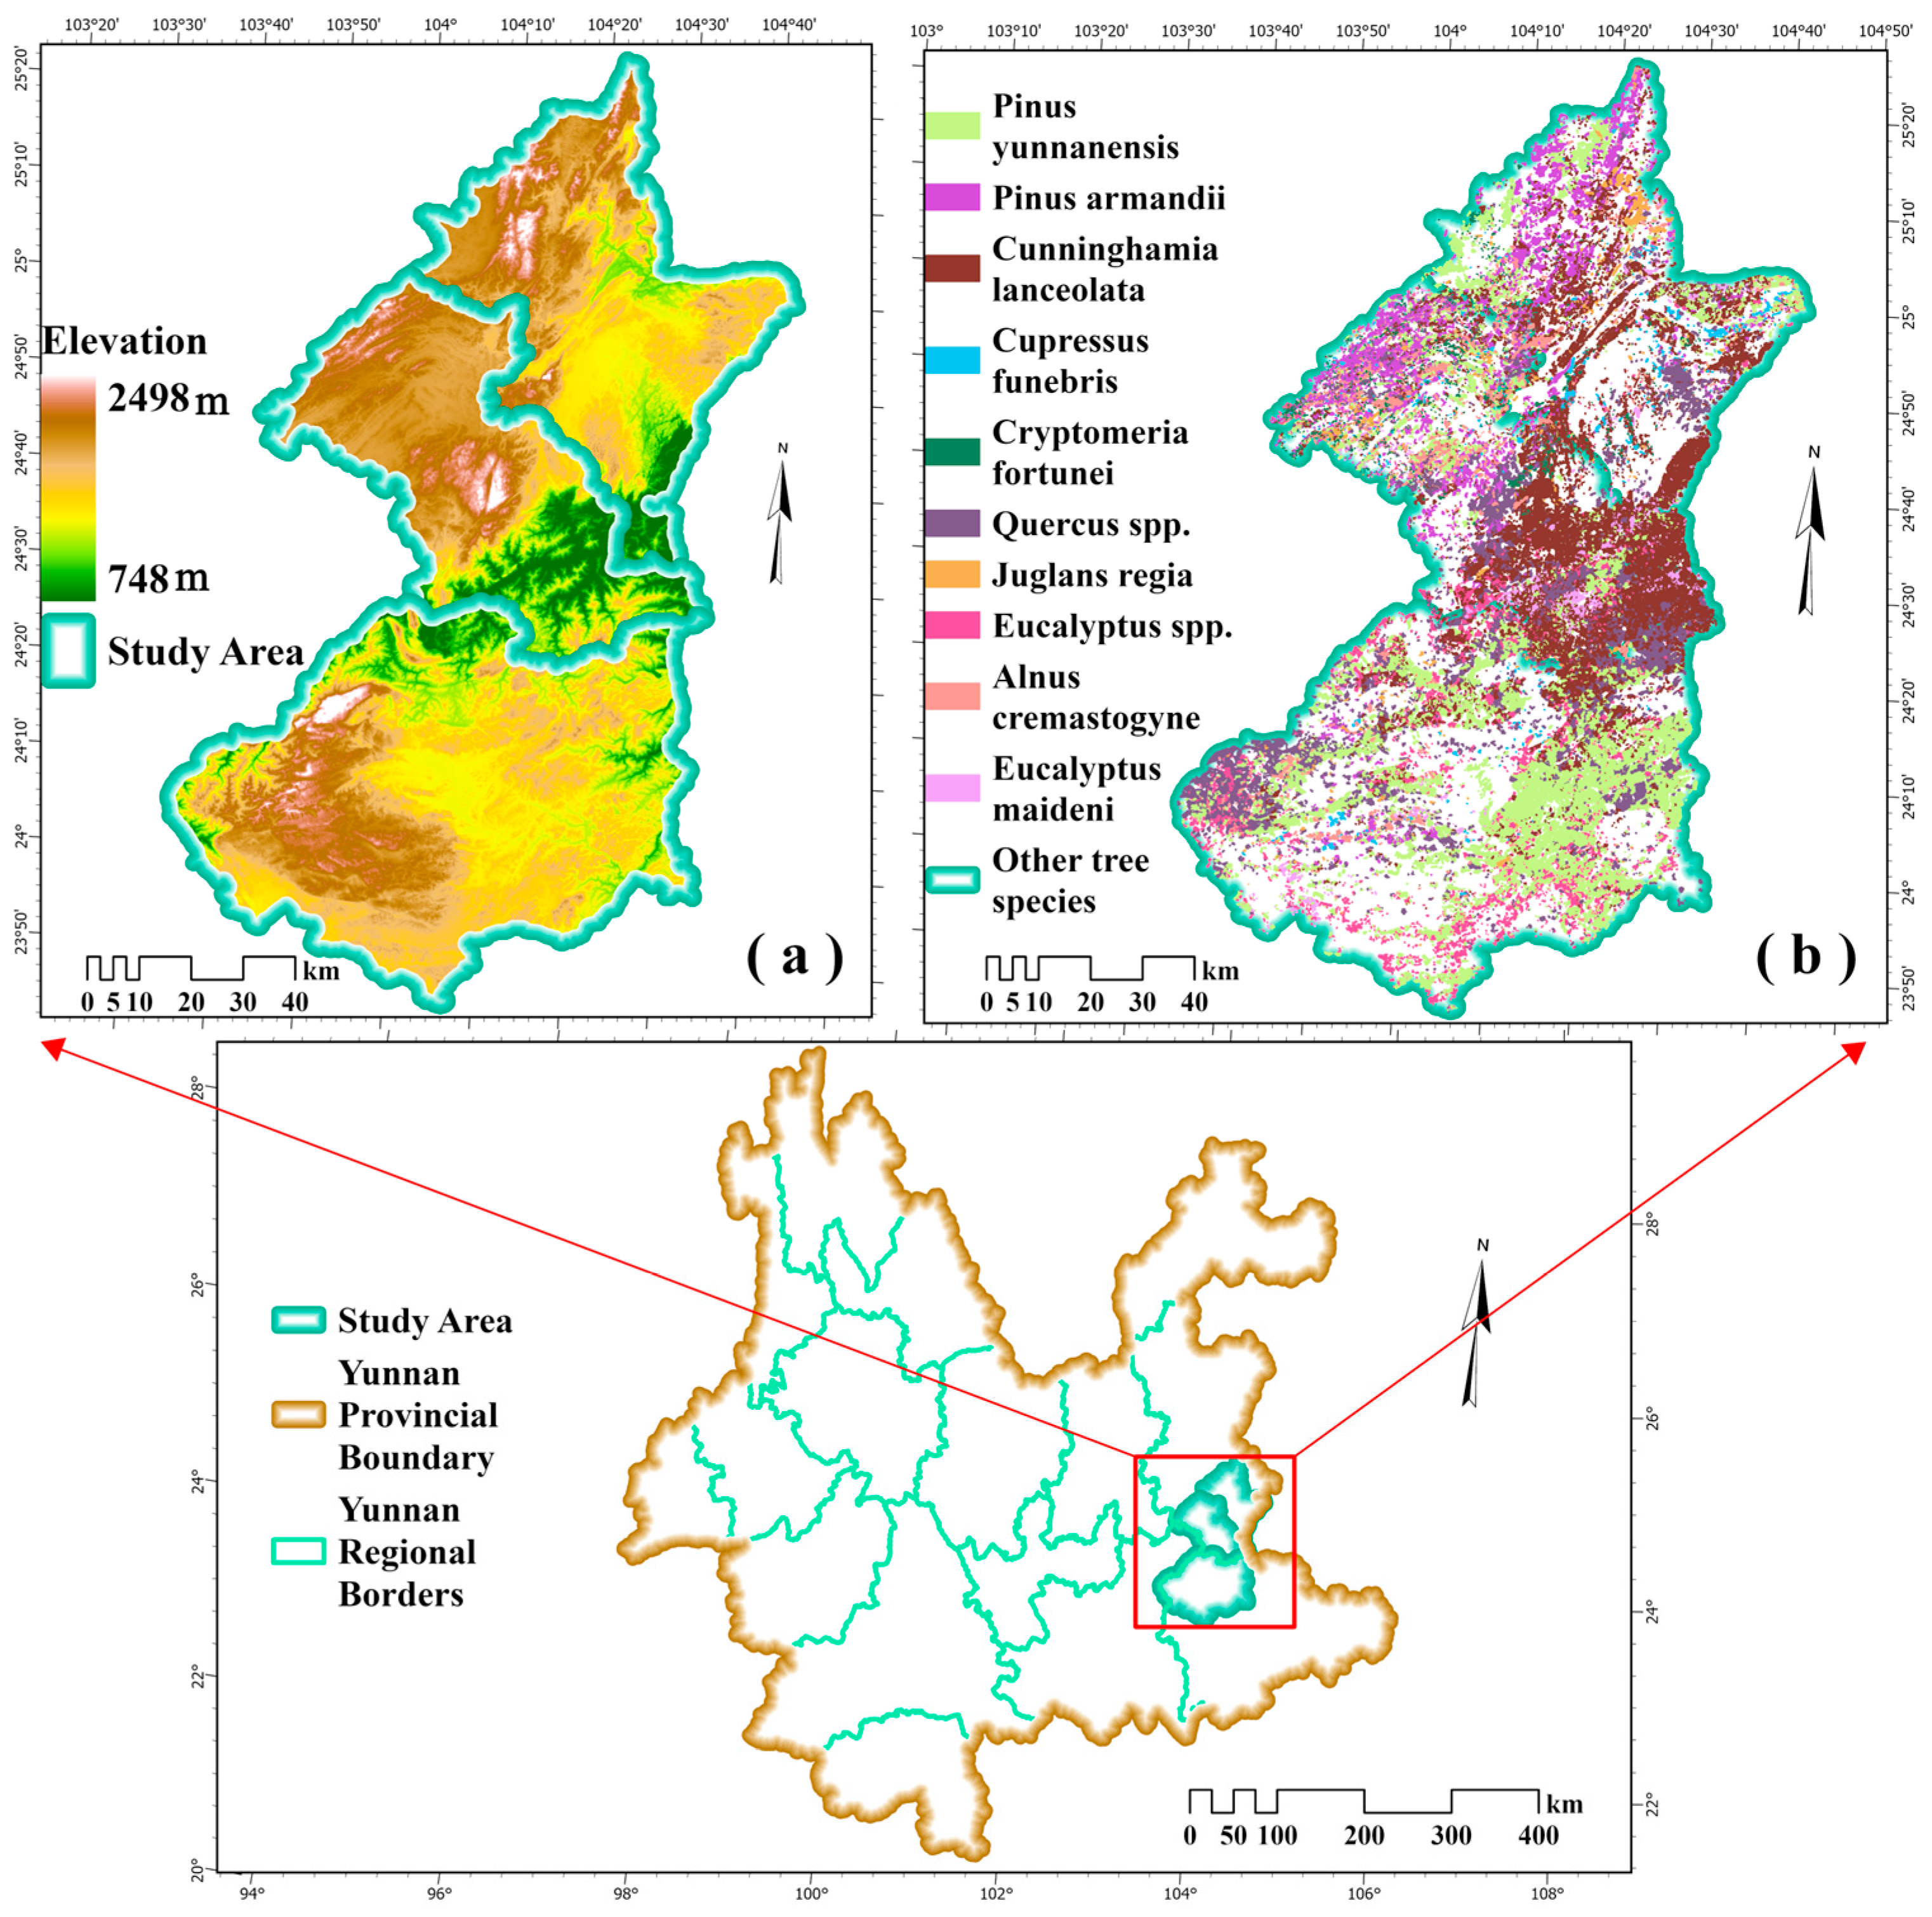
The study area is situated in eastern Yunnan Province, China, covering Luoping, Qiubei, and Shizong counties (103°48′–104°27′E, 24°20′–25°01′N), with a total area of 10,857.39 km2. Located in a transitional zone between the Yunnan–Guizhou Plateau and the Guangxi Hills, the region exhibits complex and varied topography, dominated by mid-elevation mountains, low mountains, and hills, with elevations ranging from 800 to 2400 m. It experiences a subtropical monsoon climate, characterized by a mean annual temperature of approximately 15 °C and annual precipitation of 900–1400 mm, which shows pronounced seasonal variability [36]. Forests cover 52.29% of the area, predominantly composed of plantations. The main afforestation species include Cunninghamia lanceolata (Chinese fir), Pinus armandii (Armand pine), and Pinus yunnanensis (Yunnan pine). According to forest inventory data and regional studies, these three coniferous species constitute the dominant portion of plantations in the study area. In Yunnan Province, plantations are predominantly coniferous. Furthermore, the study area in southeastern Yunnan belongs to the Yunnan–Guizhou Plateau subtropical coniferous forest management zone, where the zonal forest type is subtropical coniferous forest, with P. armandii and P. yunnanensis being typical major coniferous species in the region. Therefore, this study focuses on these three dominant coniferous species, which exhibit clear differentiation in ecological strategy and for which sufficient samples are available, to ensure the representativeness and statistical reliability of the analysis. Driven by the interplay of topography and climate, these species display marked vertical zonation, offering an ideal setting for investigating species–environment interactions [37]. Figure 1 presents the topographic elevation (a) and spatial distribution of the dominant tree species (b).

2.2. Data

2.2.1. Remote Sensing Data

This study leveraged multi-source remote sensing data acquired and processed via the Google Earth Engine (GEE) cloud platform (https://earthengine.google.com/, accessed on 20 July 2025) (Table 1). Sentinel-2 MultiSpectral Instrument (MSI) surface reflectance data were obtained from the COPERNICUS/S2_SR_HARMONIZED dataset (European Space Agency, ESA, Paris, France). Growing-season imagery from 2024 (1 May to 30 September) was used. Cloud, cloud shadow, and snow masking was performed using the provided Scene Classification Layer (SCL) band. A median composite was generated from all quality-filtered pixels to produce a cloud-free growing-season composite image, upon which vegetation indices were calculated to compute vegetation indices, including NDVI, EVI, NDMI, NBR, and SAVI. Sentinel-1 Synthetic Aperture Radar (SAR) Ground Range Detected (GRD) data were sourced from the COPERNICUS/S1_GRD dataset (European Space Agency, ESA, Paris, France), from which VV and VH polarization backscatter coefficients and the Radar Vegetation Index (RVI) were derived. Topographic metrics—elevation, slope, aspect, and the Topographic Position Index (TPI)—were extracted from the Shuttle Radar Topography Mission Digital Elevation Model (SRTM DEM; USGS/SRTMGL1_003, National Aeronautics and Space Administration, NASA, Washington, DC, USA). Despite known penetration errors in forested areas, SRTM DEM provides globally consistent relative topographic information and remains one of the best freely available options. While the terrain is complex in our study area, SRTM DEM is sufficient to capture the dominant topographic gradients. The uncertainty associated with topographic features was incorporated into our Monte Carlo simulations (Section 2.3.3) to assess its impact on the final results. To reconstruct disturbance history, we incorporated the full Landsat archive (U.S. Geological Survey, USGS, Reston, VA, USA) (1992–2024) and applied the LandTrendr algorithm to identify disturbance events.

2.2.2. Sample Data

Forest age samples were primarily derived from the sub-compartment records of the Second Class Forest Inventory conducted in 2015. The initial age for 2024 was calculated by adding 9 years to the 2015 record. To address potential temporal discrepancies and ensure label reliability, we implemented a multi-pronged correction and validation strategy: (1) Forest management archives were consulted to identify areas of new afforestation post-2015; these compartments were assigned ages accordingly. (2) The LandTrendr algorithm was applied to the Landsat archive (2015–2024) to detect clear-cut disturbances; for compartments with a detected disturbance, the age was reset based on the ‘Year of Disturbance’ (YOD). (3) High-resolution Google Earth imagery was used for visual cross-checking to identify any obvious mismatches. Samples with conflicting information or signs of non-significant disturbances (e.g., light thinning) that could not be reliably corrected were excluded. The species labels for training the Gradient Boosting Decision Tree (GBDT) classifier originated from the same source as the age samples. From the 142,434 valid sub-compartments, we extracted their recorded species identity (C. lanceolata, P. armandii, or P. yunnanensis). Each sub-compartment polygon was converted to a raster grid, with all pixels assigned the species label of that compartment. Subsequently, on the Google Earth Engine platform, the spatial location of each pixel was precisely linked to the concurrent Sentinel-1/2 image features and SRTM-derived topographic features to form the feature-label paired dataset for classification. After this rigorous quality control, 142,434 valid samples were retained for analysis. This included cross-checking forestry management archives, LandTrendr-based disturbance detection, and visual interpretation of high-resolution Google Earth imagery. “Non-significant disturbances”—such as light thinning, tending cuts, and pest/disease outbreaks that were not clearly captured by LandTrendr—could bias age estimates: undetected thinning may inflate apparent age, while growth suppression could lead to underestimation. To ensure the reliability of the age labels, we implemented a multi-step validation and cleaning procedure on the initial 142,464 samples: (1) Using the LandTrendr algorithm, 28,541 plots (20.0%) were identified as having experienced a significant disturbance (e.g., clear-cut) between 2000 and 2024; the forest age for these plots was recalculated starting from the detected year of disturbance. (2) Through visual interpretation of high-resolution historical imagery on Google Earth, an additional 5230 plots (3.7%) showing clear changes (e.g., strip harvesting) not detected by LandTrendr were manually corrected. (3) For the remaining 108,693 plots (76.3%) where no significant disturbance was detected, the age was derived by extrapolating the 2015 survey record by 9 years. The correction process showed no systematic bias towards any particular species or topographic condition. After this quality control, 142,434 valid samples were obtained for model training and validation. The multi-validation approach aimed to mitigate such biases (Table 2).

2.3. Methods

The proposed technical framework comprises four core modules:
(1)
An automated data preprocessing module that leverages the GEE platform for streamlined handling of multi-source data.
(2)
A high-precision tree species identification module that employs a Gradient Boosting Decision Tree (GBDT) algorithm to integrate multi-dimensional features from optical, radar, and topographic data.
(3)
A precise forest age estimation module that constructs a system of species-specific growth parameters for developing differentiated estimation models.
(4)
A data output and validation module responsible for generating age distribution products and conducting systematic accuracy assessments.
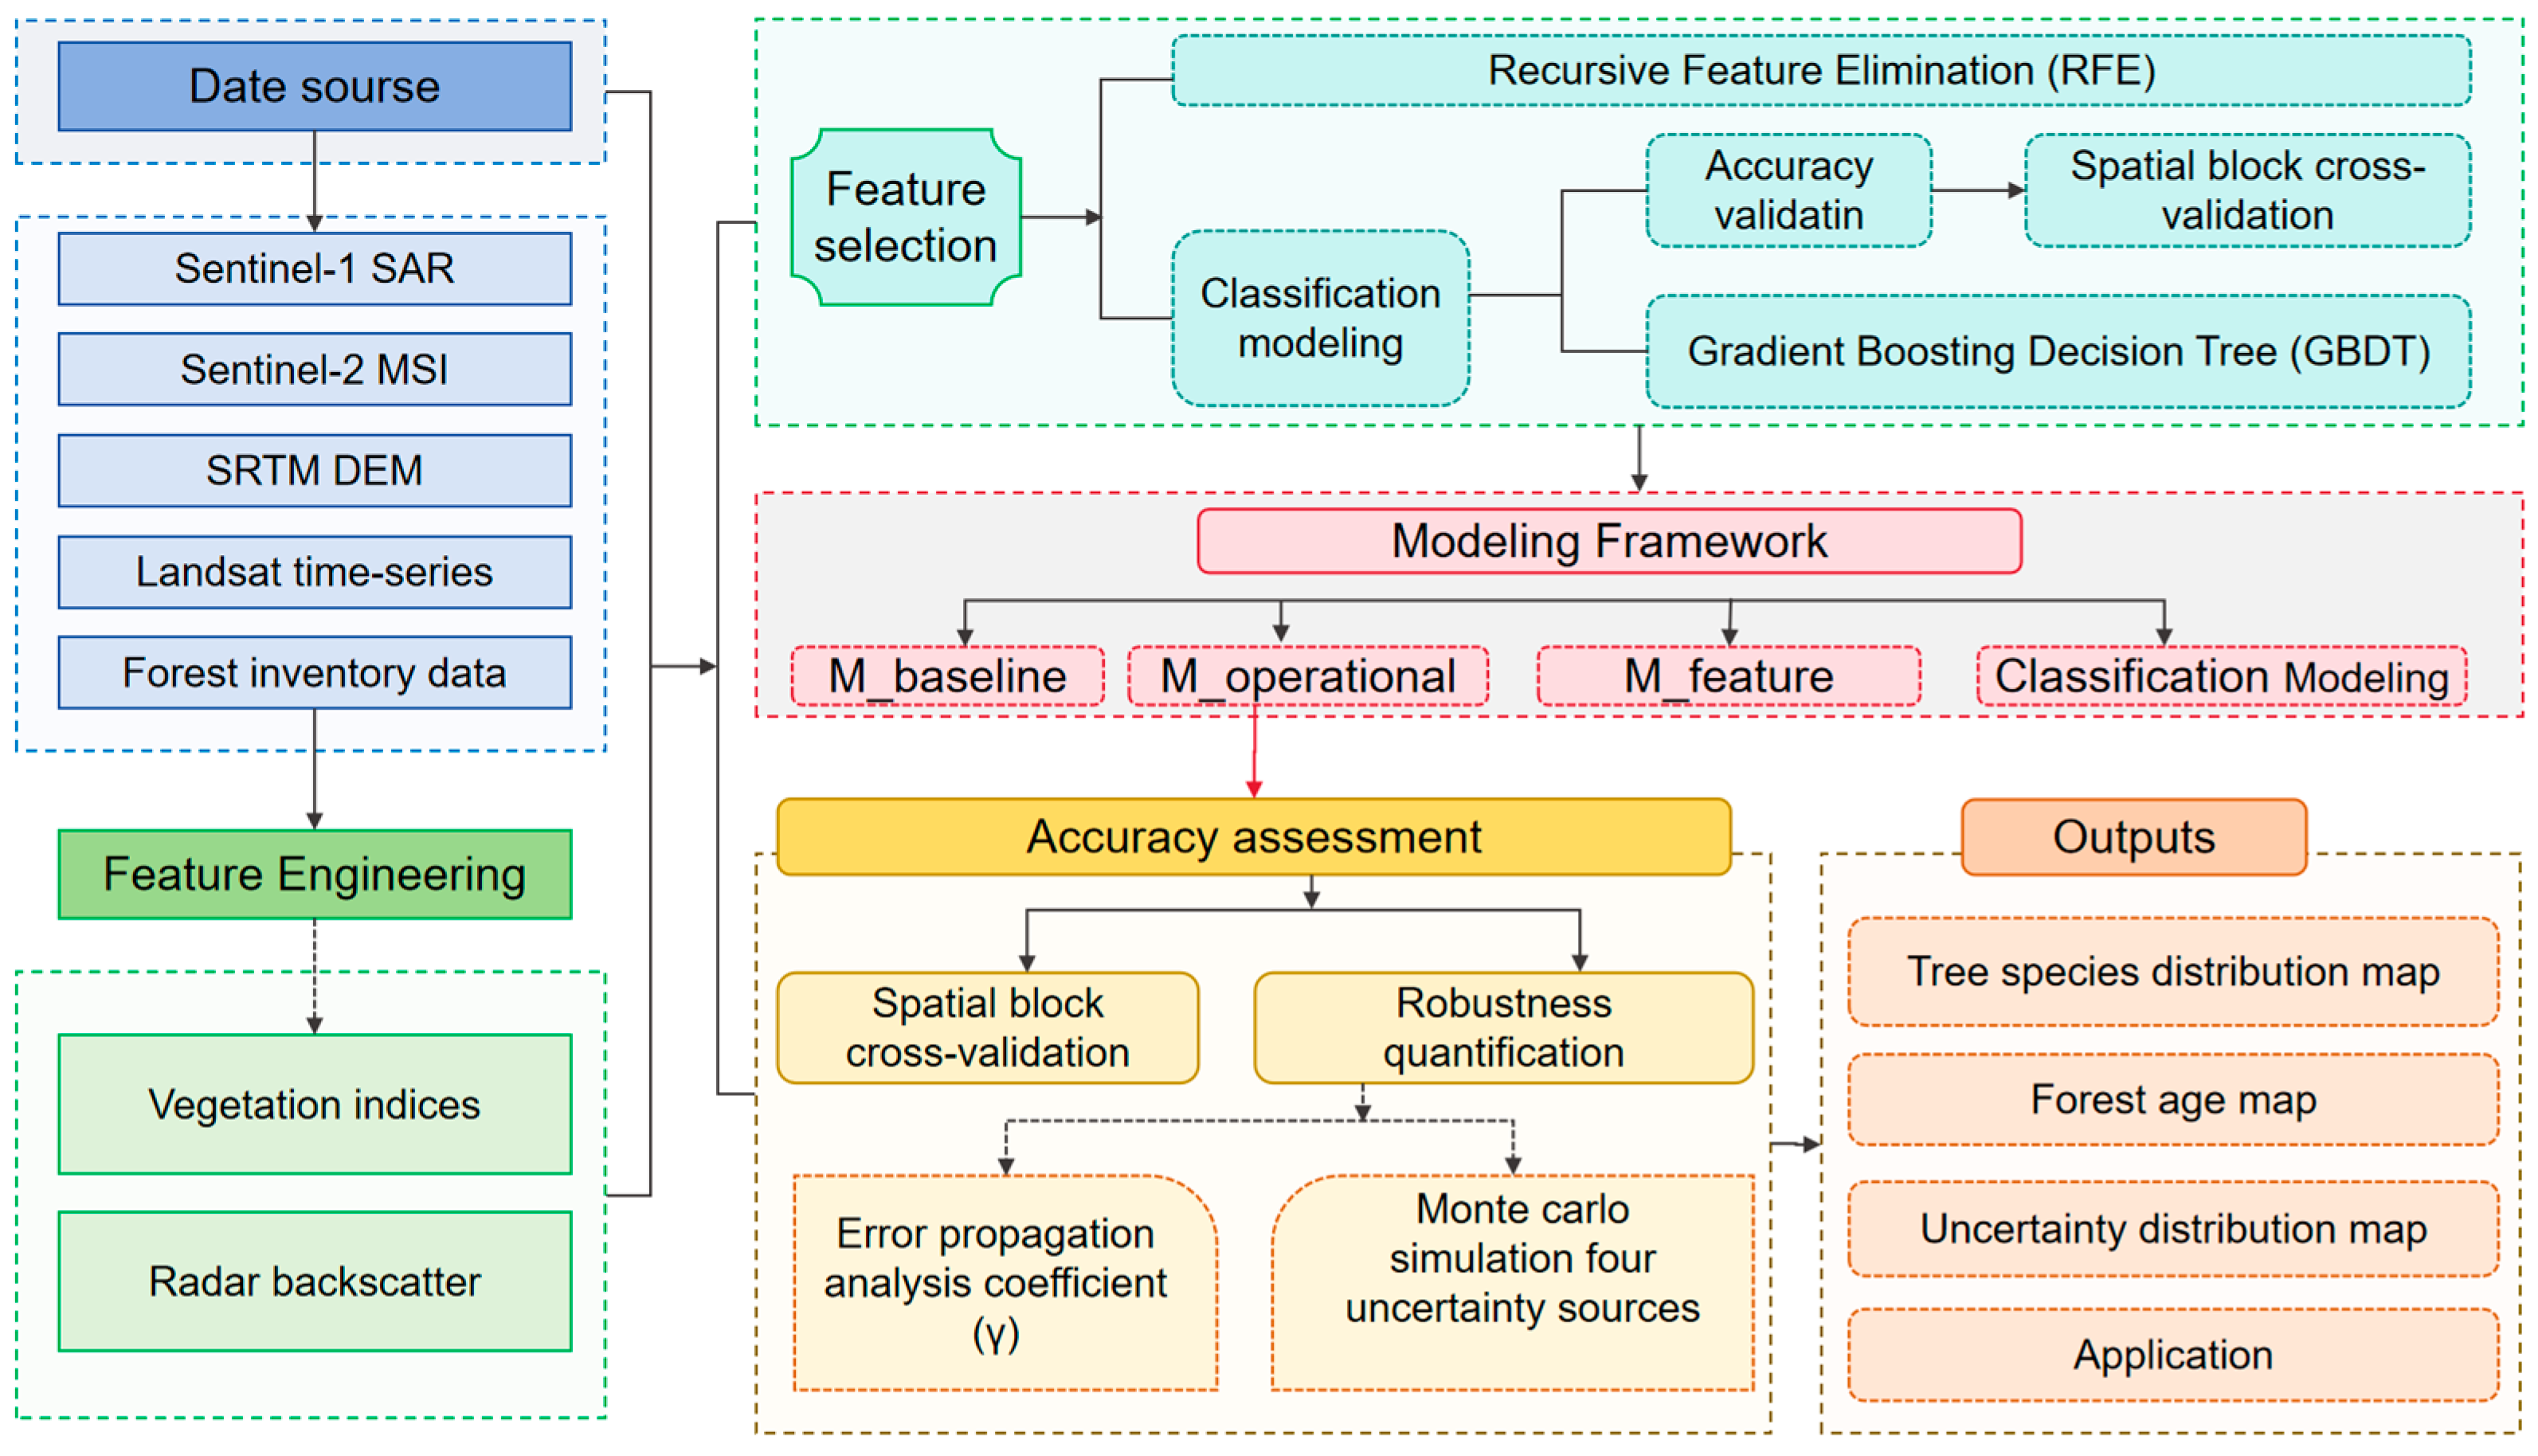
Figure 2 clearly illustrates the sequential relationships among these four core modules. Critically, the output from the species classification module (species categories) serves as direct feature input to the age estimation module. Furthermore, the diagram explicitly indicates the integration node between the primary model (M_operational) and the alternative method based on species-specific parameters (used for non-disturbed areas), with complete age distribution maps generated through spatial mosaicking.

2.3.1. Tree Species Classification

The species classification results presented in this section serve as the foundational step for constructing the subsequent tandem age estimation framework. The goal was to achieve a classification accuracy sufficient to support downstream tasks (OA > 85%) within a complex topographic setting. Building upon our prior exploration in feature engineering and model optimization for this region [38], this section focuses on validating the classifier’s generalizability to spatially independent samples (spatial block cross-validation OA = 89.34%) and analyzing its error structure to assess potential impacts on downstream tasks. The core innovation of this work lies not in the classification algorithm per se, but in the systematic integration of such probabilistic classification results into the forest age estimation model and the demonstration of its substantial value (see Section 3.2).
We employed the Boruta feature selection algorithm for feature screening [38]. This algorithm, based on random forests, creates random shadow copies of original features and conducts statistical tests through importance comparison, enabling stable identification of all relevant features and overcoming the instability of single importance ranking. Compared to methods like Recursive Feature Elimination (RFE), it has demonstrated superior performance in remote sensing estimation of forest parameters [39]. From 36 initial features, Boruta selected the seven most discriminative variables: elevation, topographic roughness, Sentinel-2 B and 9 reflectance, Aerosol Optical Depth (AOT), Atmospheric Water Vapor Content (WVP), and the mean backscatter coefficients for Sentinel-1 VV and VH polarizations.
Feature selection was guided by clear ecological and physical rationale: elevation and topographic roughness directly constrain species distribution habitats; Sentinel-2 B and 9 (water vapor band) is sensitive to vegetation water stress and canopy structural variation in high-altitude regions; it is noteworthy that the Recursive Feature Elimination (RFE) algorithm selected Top-of-Atmosphere Aerosol Optical Depth (AOT) and Water Vapor Content (WVP) as key features [40]. These parameters are auxiliary data from the Sentinel-2 L2A product, acquired synchronously with each multispectral scene. We used the median value from all qualified growing-season images as a summary representation of the atmospheric state at the pixel scale for the season (addressing time aggregation). Although their instantaneous physical meaning reflects atmospheric conditions, their spatial distribution patterns in complex terrain (e.g., valley vs. ridge, windward vs. leeward slope) are coupled with solar illumination, local climate, and surface properties, potentially indirectly reflecting environmental gradients associated with species habitat preferences (clarifying physical meaning in this context). Therefore, they may serve as indirect environmental covariates, providing statistically discriminative information. Ablation experiments indicated that removing AOT and WVP from the feature set led to an approximate 2.1% decrease in overall classification accuracy, suggesting they provide incrementally discriminative information under the current study conditions (directly addressing methodological utility). However, we acknowledge their potential dependency on image acquisition timing, which will be discussed in the limitations section (see Section 4.5). Sentinel-1 dual-polarization backscatter coefficients effectively characterize canopy structure. We implemented a Gradient Boosting Decision Tree algorithm [41] with optimized hyperparameters: number of trees = 50, learning rate = 0.05, subsampling rate = 0.6, maximum nodes = 20, and loss function = least absolute deviation. Model training employed 5-fold cross-validation to ensure parameter robustness.

2.3.2. Forest Age Estimation Model

To systematically evaluate each technical component’s contribution, we designed three progressively advanced comparative models:
(1)
M_baseline (Baseline Model): A Random Forest regressor using 12 multi-source remote sensing features—five vegetation indices (Normalized Difference Vegetation Index, NDVI; Enhanced Vegetation Index, EVI; Normalized Difference Moisture Index, NDMI; Normalized Burn Ratio, NBR; Soil Adjusted Vegetation Index, SAVI), three radar features (vertical transmit/vertical receive backscatter, VV; vertical transmit/horizontal receive backscatter, VH; Radar Vegetation Index, RVI) and four topographic features (elevation, slope, aspect, Topographic Position Index, TPI)—establishing a unified age–remote sensing relationship without species differentiation.
(2)
M_feature (Feature Selection Model): Extending M_baseline by incorporating Boruta algorithm for feature selection, evaluating the contribution of feature optimization to model performance.
(3)
M_operational (Operational Model): The primary model employing a unified Random Forest framework, with its core innovation being the incorporation of species probability distributions from the front-end classifier as continuous features. These species’ probability distributions were then combined with the 12 multi-source features, resulting in a 15-dimensional input vector for the Random Forest regressor. Using probabilistic outputs rather than hard classification provides richer, continuous species identity information, enabling the model to learn transitional characteristics and uncertainties between species, thereby enhancing estimation accuracy and robustness.
For areas lacking clear disturbance history (identified via LandTrendr analysis with YOD confidence < 0.7 and recovery rate < 25%, ≈15% of study area), an alternative estimation method was applied. This method constructed empirical models using species-specific growth parameters (Table 3) and county-level remote sensing features, incorporating base seedling age compensation according to species growth characteristics, adjusting base age estimates using vegetation indices reflecting stand health, and correcting for elevation effects on growth rate. Crucially, all reported primary accuracy metrics are based on M_operational performance on its test set, excluding results from alternative method areas. Alternative method results were spatially mosaicked with primary model results to generate complete age distribution maps.
Species-specific growth parameters were determined from regional forestry management archives, species ecology literature, and expert knowledge. Base seedling age reflects the time required from planting to remotely detectable canopy height; elevation compensation captures growth inhibition through temperature and growing season length; recovery sensitivity characterizes post-disturbance regeneration capacity; and growth rate factor quantifies inherent growth speed differences among species [42].
Feature importance for all Random Forest models was computed using permutation importance, which evaluates feature contribution by randomly shuffling values and observing performance degradation, effectively avoiding biases associated with impurity-based importance for multi-level or correlated features.

2.3.3. Accuracy Assessment and Uncertainty Analysis

We implemented a multi-validation strategy to systematically evaluate model performance and uncertainty. Classification accuracy was assessed using overall accuracy (OA), Kappa coefficient, producer’s accuracy (PA), and user’s accuracy (UA) [43,44]. OA and Kappa were calculated as:
K pa = N [ i = 1 k N ii - i = 1 k N i + N + i ] N 2 - i = 1 k N i + N + i
O A = i = 1 k N ii N
where N is the total number of validation samples, k is the number of classes, Nii is the number of correctly classified samples for class i, Ni+ is the total number of samples classified as class i, and N+i is the total number of reference samples for class i. The F1-score, calculated as the harmonic mean of PA and UA, was also employed.
Forest age estimation accuracy was evaluated using standard regression metrics [31]:
R 2 = 1 i = 1 n ( y i - y ^ i ) 2 i = 1 n ( y i - y - i ) 2
RMSE = i = 1 n ( y i - y ^ i ) 2 n
MAE = 1 n i = 1 n y i - y ^ i
where y i is the measured age for the i-th sample, y ^ i is the predicted age, y ^ is the mean measured age, and n is the sample size.
To assess model generalizability, we combined 5-fold cross-validation with spatial block cross-validation. To rigorously evaluate model generalizability and avoid performance overestimation due to spatial autocorrelation, we adopted a spatial block cross-validation strategy. The study area was partitioned into 1 km × 1 km grid blocks, resulting in N_blocks effective blocks. All samples within a block were treated as an indivisible unit. These blocks (not individual samples) were then randomly shuffled and divided into five folds.
For the tree species classification model (GBDT), we performed standard 5-fold spatial block cross-validation for model training and hyperparameter tuning, reporting the mean overall accuracy (OA = 89.34%) across the five test folds.
For the forest age estimation framework, a stricter hold-out validation strategy was employed to realistically simulate the operational, tandem nature of the workflow. The blocks in one entire fold (20% of total blocks) were held out from the very beginning as a completely independent test set. This test set was used for the final, one-time evaluation of the entire framework. Crucially, these test blocks did not participate in any stage of the species classification model training, nor in the training, feature selection, or hyperparameter tuning of any of the age estimation models (M_baseline, M_feature, M_operational). The remaining 80% of blocks were used for training the species classifier and all age estimation models. All reported age estimation performance metrics (e.g., R2 = 0.84 for M_operational) are based solely on this independent test set. This design ensures that the test data for the final age estimation is spatially independent and has not influenced any part of the model development process, providing a realistic assessment of the operational framework’s performance.
Error propagation analysis aimed to quantify the impact of front-end classification errors on downstream age estimation. We employed two simulation strategies: (1) Global accuracy perturbation: The overall classification accuracy was systematically degraded (from 95% to 70%) by artificially adjusting the classification probability thresholds, and the corresponding changes in age estimation RMSE were observed to calculate the propagation coefficient γ. (2) Spatial transition zone misclassification simulation: To simulate a more realistic misclassification scenario, we identified ecological transition zones for species distribution (e.g., 1600–1800 m elevation) based on the initial classification results and topographic maps. Within these zones, the predicted labels for P. armandii and P. yunnanensis were swapped at specified proportions (simulating 10% and 20% misclassification rates), and the age estimation model was re-run to assess the impact of such localized, structured misclassification on overall accuracy. Experiments under ‘known species’ conditions evaluated the upper performance limit.
Uncertainty analysis employed Monte Carlo simulation [44] (n = 1000) to quantify four primary sources, with variance decomposition used to assess their independent contributions. The distributions for these parameters were set as follows: (1) Classification uncertainty: modeled using a multinomial distribution based on the species probability vector outputs. (2) Year-of-Disturbance detection uncertainty: set as a uniform distribution of ±1 year, based on validation studies of the LandTrendr algorithm in plantation settings [32]. (3) Species growth parameter uncertainty: modeled as a normal distribution with a standard deviation of 15% of the mean, reflecting the typical variation range found in species growth ecology literature. (4) Age label uncertainty: modeled as a normal distribution with a standard deviation of 1.5 years, informed by the empirical error observed during manual correction (Section 2.2.2). Variance decomposition analysis quantified each factor’s independent explanatory proportion. Given temporal extrapolation uncertainty in ground-truth age, we emphasized relative performance differences between models. Monte Carlo sensitivity analysis confirmed that main conclusions remained robust under ±5 years age label uncertainty, verifying the findings’ reliability.

3. Results and Analysis

3.1. Tree Species Classification Results for Plantations

3.1.1. Classification Accuracy Validation

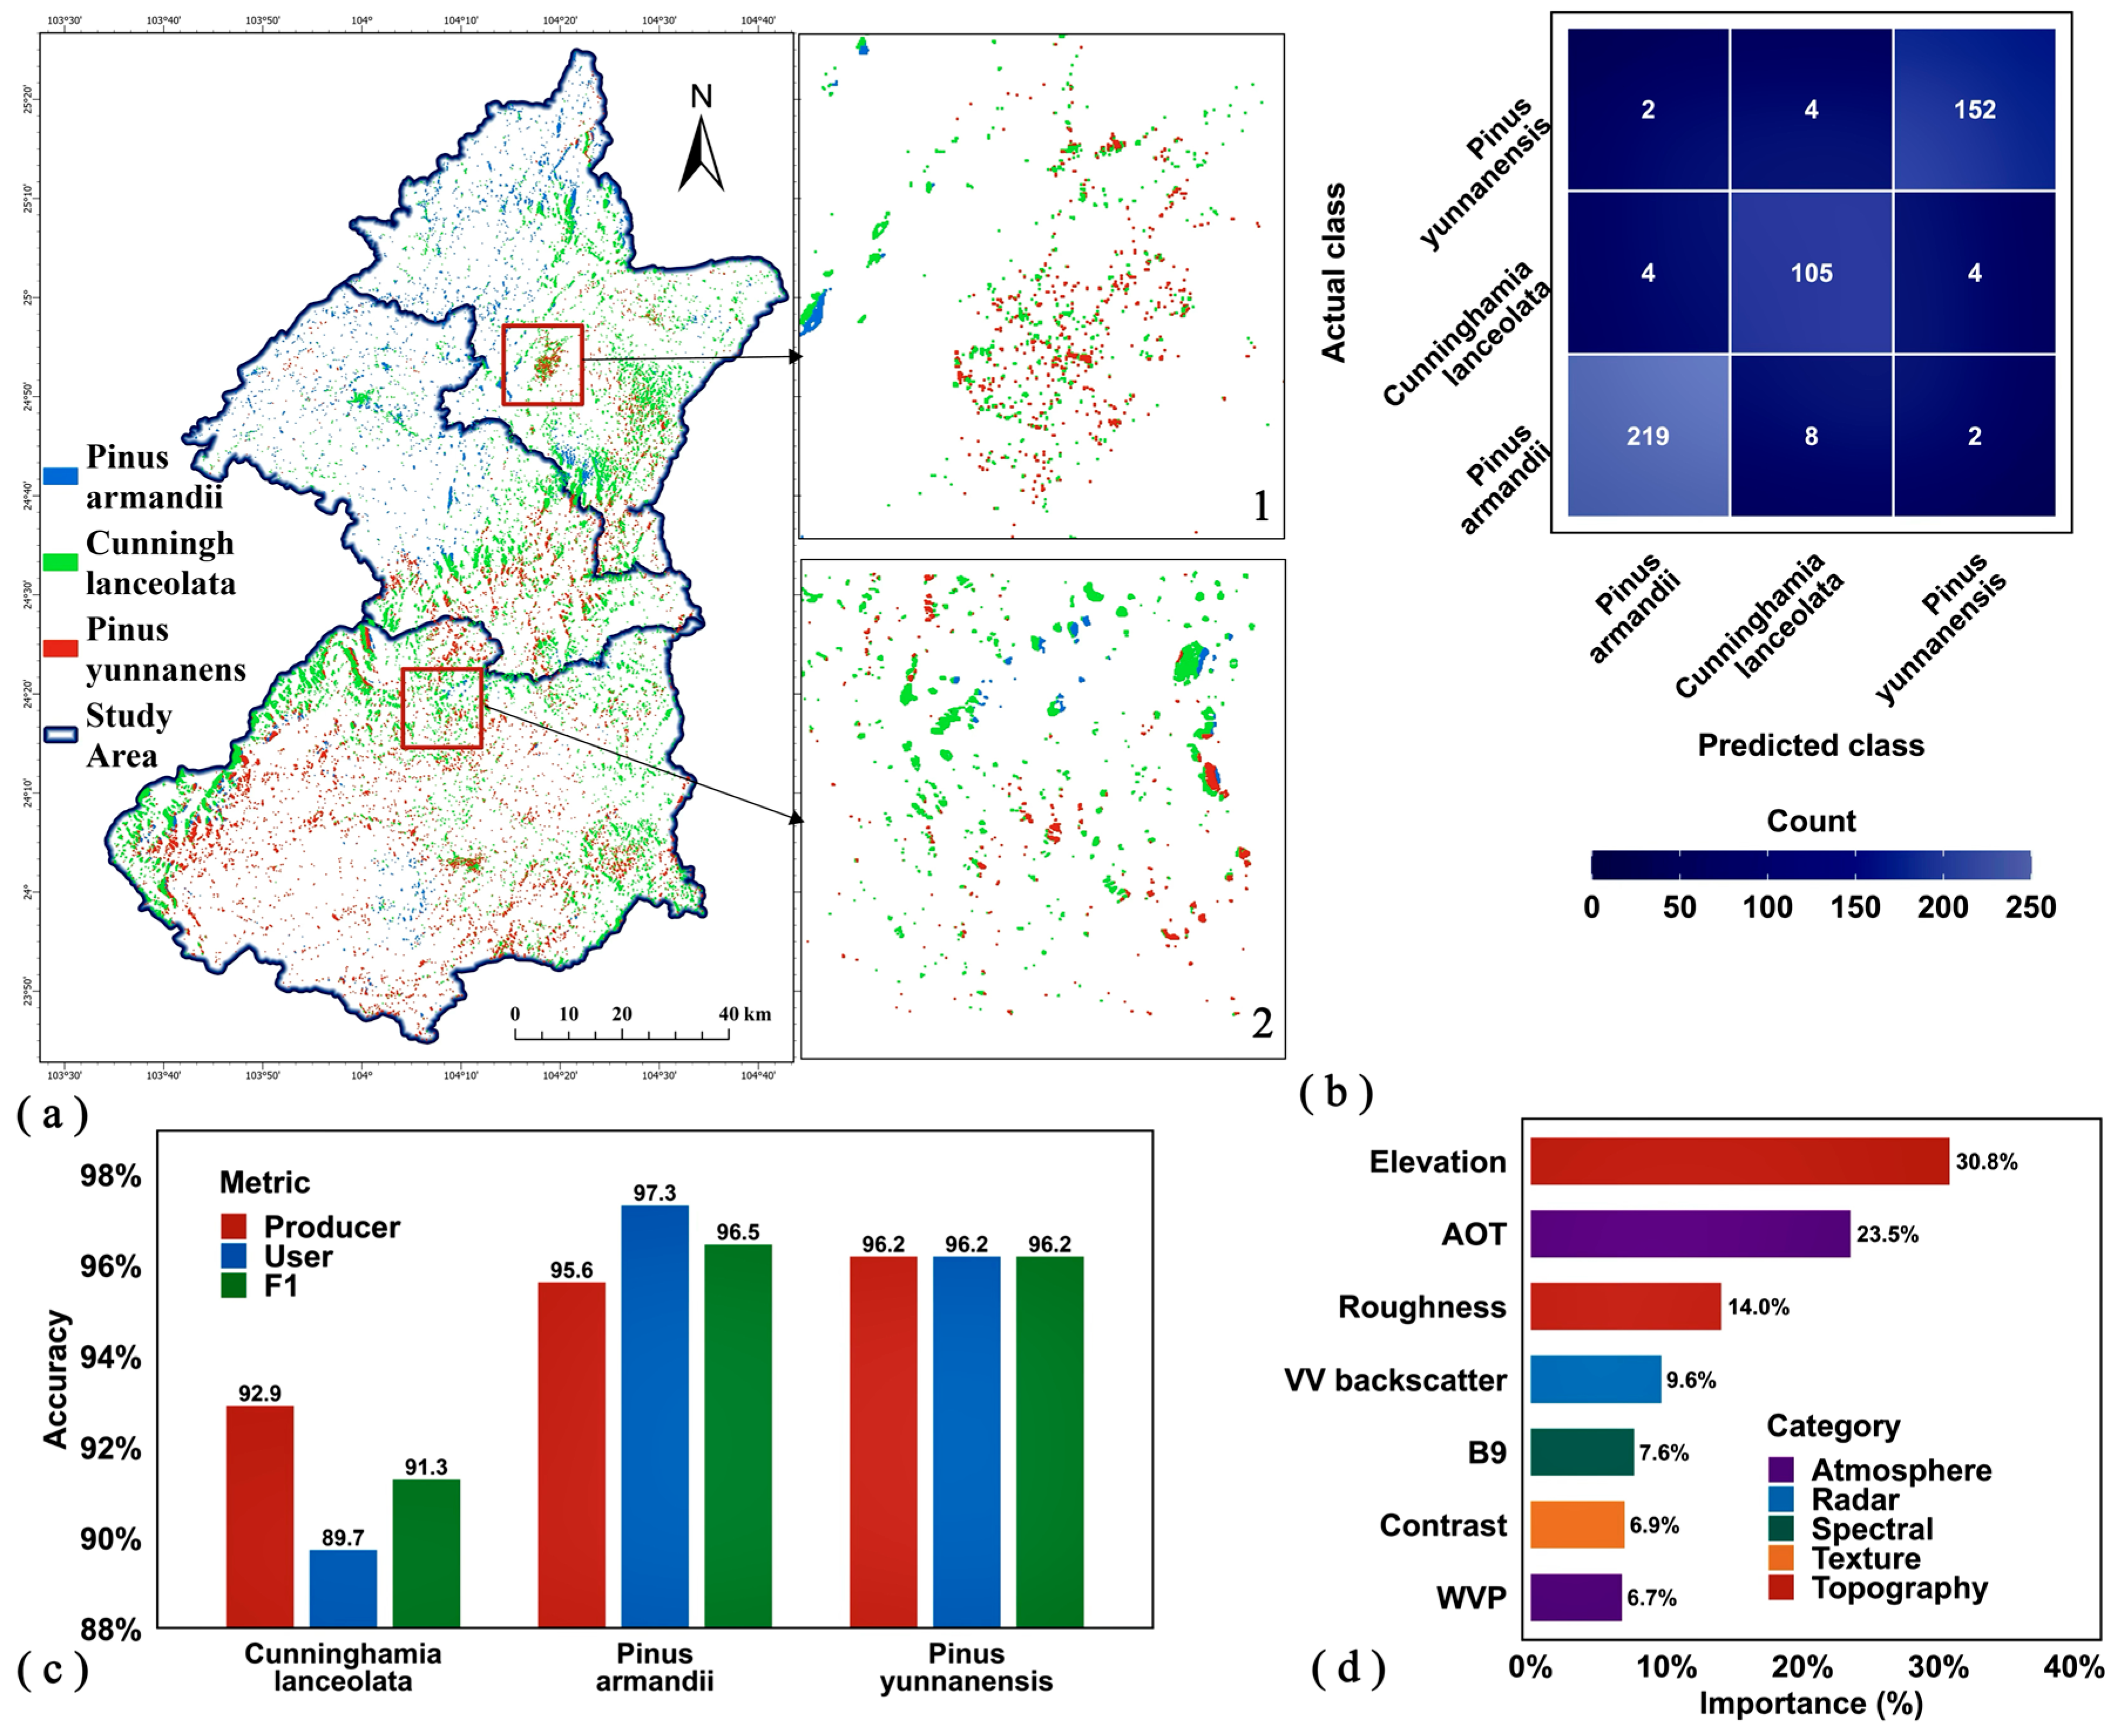
The GBDT-based species classification model demonstrated strong performance. It achieved an overall accuracy (OA) of 95.66% (Kappa = 0.949) under random cross-validation and 89.34% OA (Kappa = 0.865) under spatial block cross-validation. This notable discrepancy highlights that spatial validation provides a more realistic assessment of model generalizability across independent spatial units. While conventional cross-validation results reflect model fitting capacity, we recommend using spatial validation metrics for practical applications.
At the species level, Pinus yunnanensis showed the highest classification consistency (PA = 96.20%, UA = 96.20%), followed by Pinus armandii (PA = 95.63%, UA = 97.33%), while Cunninghamia lanceolata exhibited slightly reduced performance (PA = 92.92%, UA = 89.74%). Misclassification analysis revealed that most confusions occurred between the two pine species, particularly in their distribution transition zones, due to spectral similarity. Ecological niche overlap in the 1600–1800 m elevation range further complicated their discrimination. C. lanceolata maintained the highest distinctiveness with less than 1% misclassification rate, attributable to its unique spectral signature and habitat preference. The model showed excellent stability, with merely 0.35% standard deviation in 5-fold cross-validation accuracy, confirming the strong generalization capability of our feature selection and parameter configuration.

3.1.2. Feature Importance Analysis

Elevation emerged as the most discriminative feature (30.8% importance), followed by aerosol optical thickness (23.5%) and topographic roughness (14.0%). The Sentinel-2 near-infrared band (B8) and mean VV-polarized backscatter contributed 7.6% and 9.6% importance, respectively. Notably, we observed distinct feature response patterns across species.
P. armandii classification relied heavily on elevation (35.2%) and slope (8.7%), consistent with its high-elevation distribution. C. lanceolata showed stronger dependence on the near-infrared band (22.1%) and NDVI (9.8%), reflecting its dense canopy structure. P. yunnanensis exhibited greater association with radar features (VV polarization importance: 15.3%), potentially linked to its adaptation to dry–hot valley environments. These differentiated response patterns highlight the limitation of conventional feature approaches for precise species identification in topographically complex regions.
Figure 3a shows the macroscale distribution of the three species, while Figure 3(a1,a2) provide magnified views of two representative areas for detailed inspection. Figure 3b’s confusion matrix confirms that primary classification errors occurred between the two pine species (6 mutual misclassifications), attributable to spectral similarity. Figure 3c demonstrates P. yunnanensis’s superior classification accuracy and C. lanceolata’s relatively lower user’s accuracy (89.74%). Figure 3d reinforces elevation as the paramount discriminatory feature (30.8% importance), supporting species niche differentiation theory along elevation gradients.

3.2. Plantation Age Estimation Results

3.2.1. Model Accuracy Evaluation

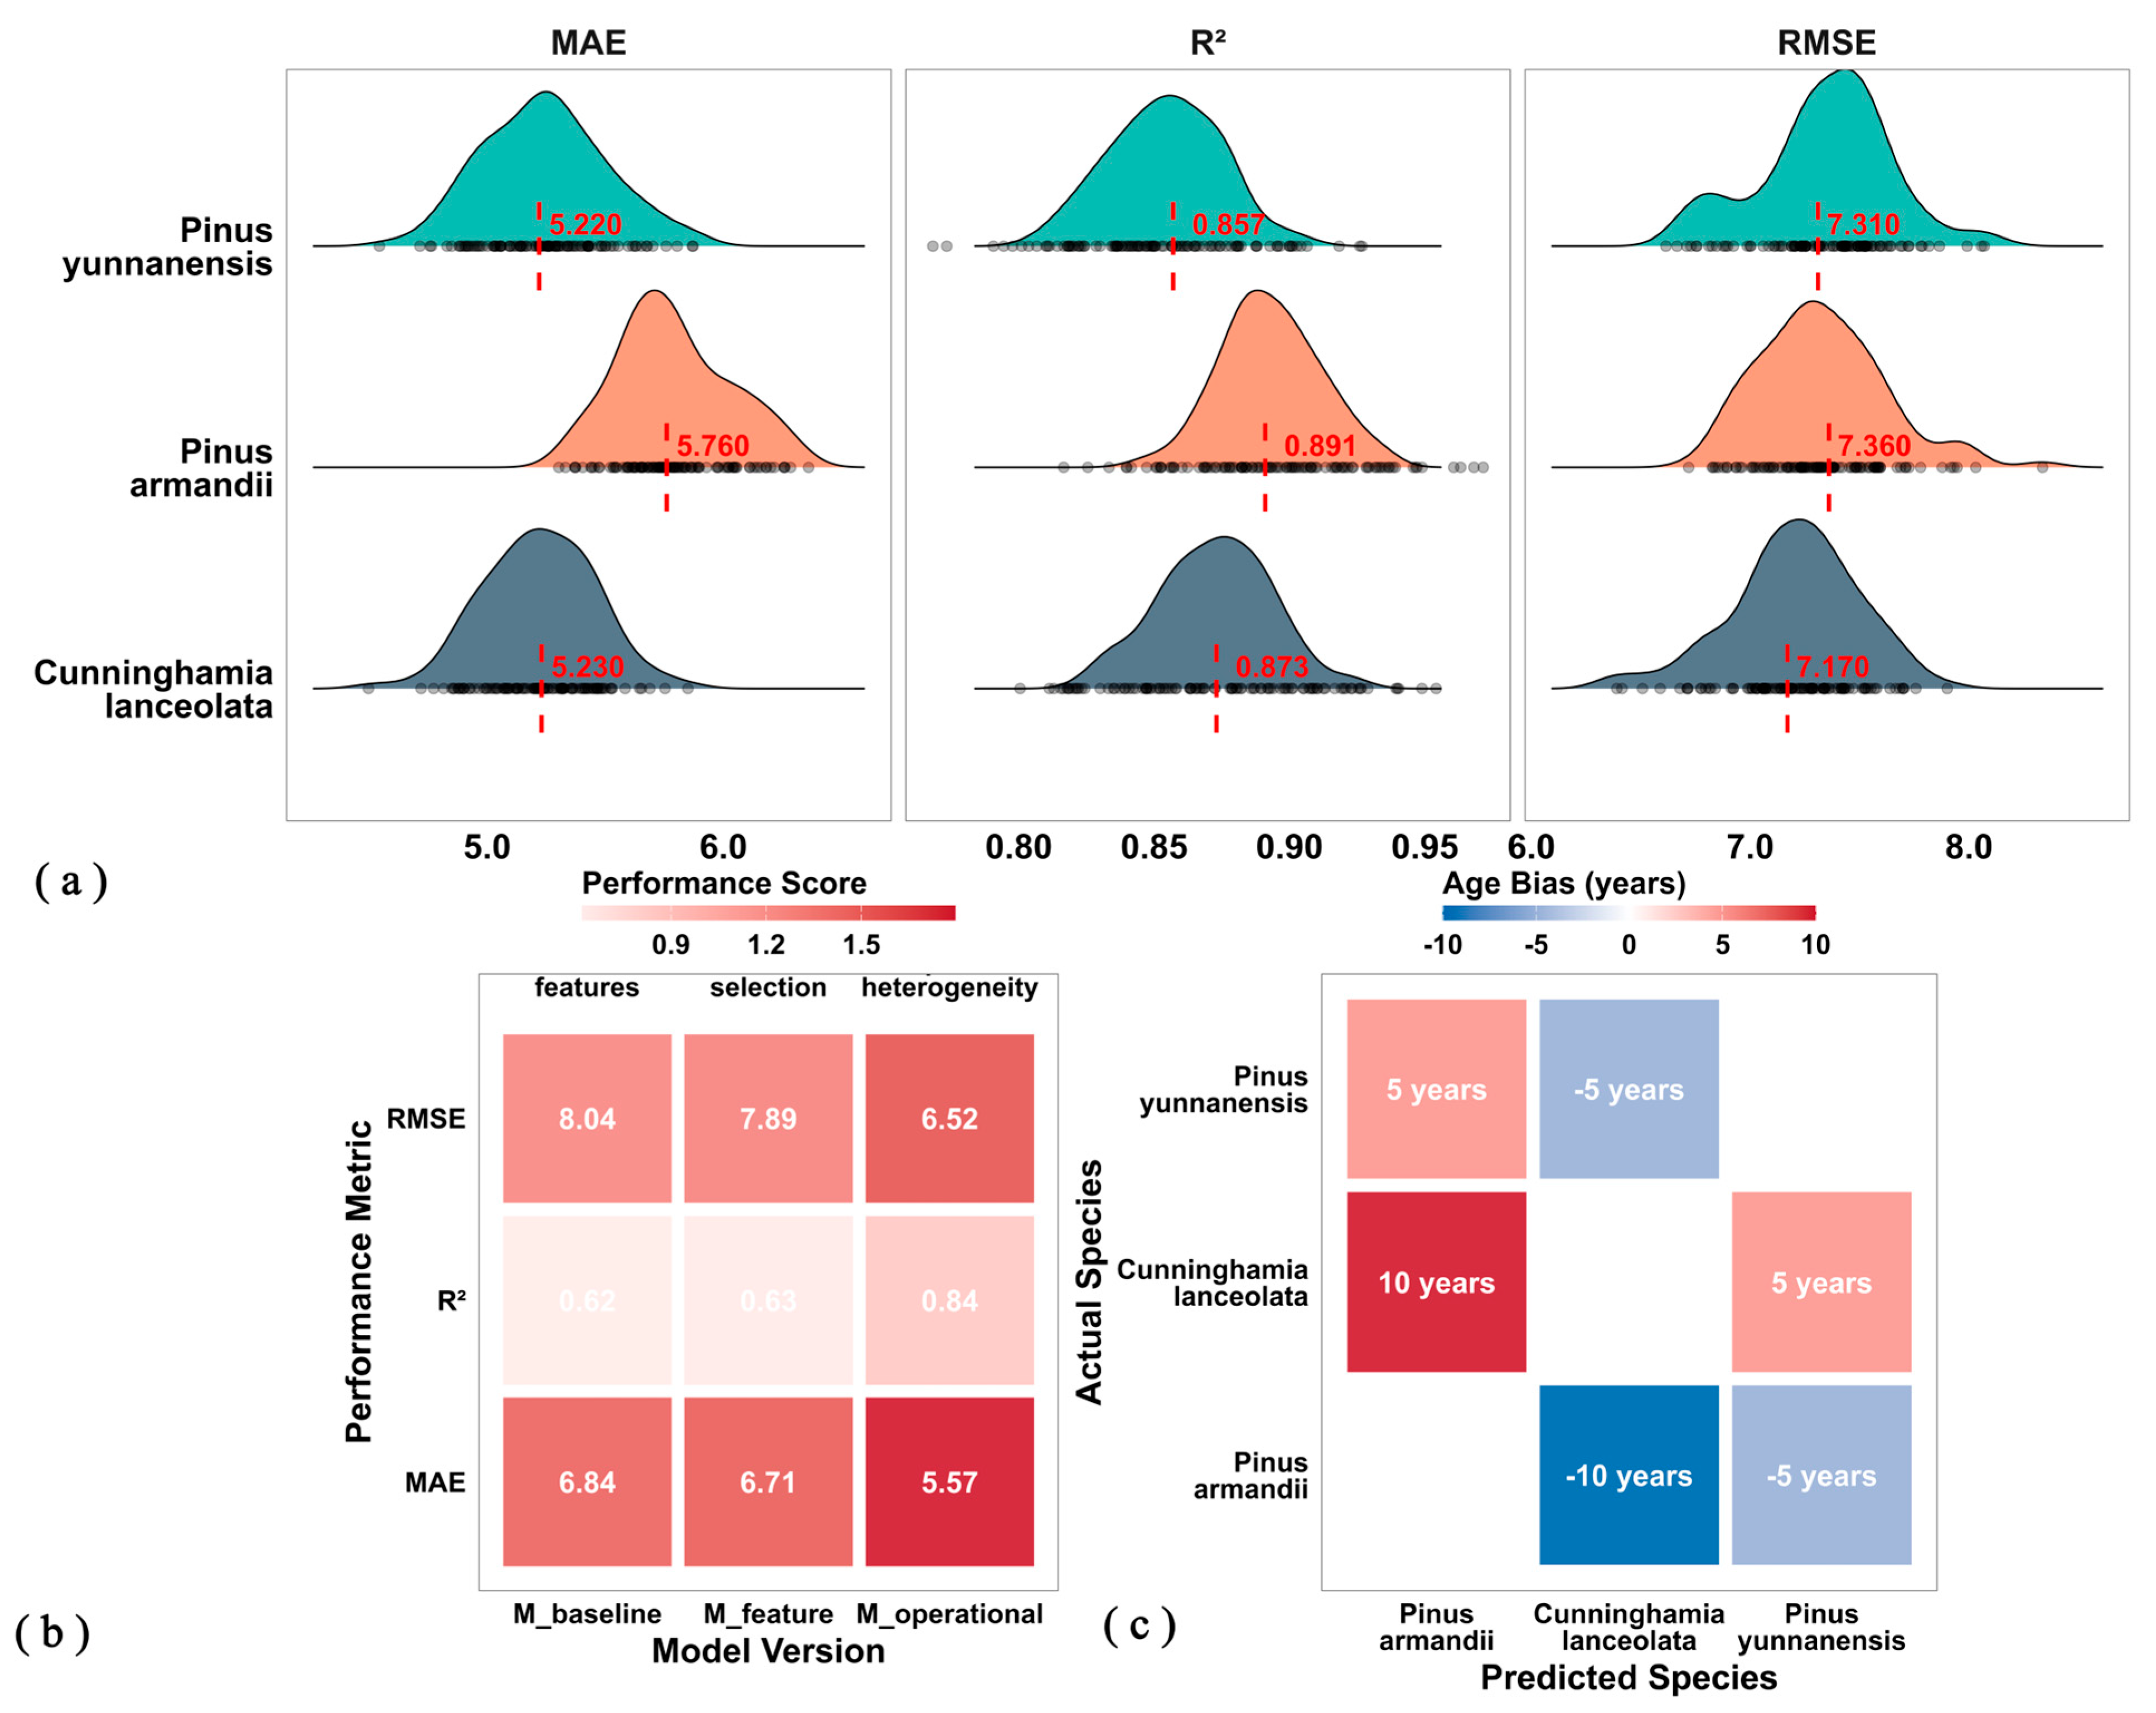
Systematic comparison of the three core models revealed performance trends: M_baseline (R2 = 0.62, RMSE = 8.04 years), M_feature (R2 = 0.63, RMSE = 7.82 years), and M_operational (R2 = 0.84, RMSE = 6.52 years). The feature selection model (M_feature), which used the Boruta algorithm to select key features (such as slope, NDMI, NBR, and elevation), showed only marginal improvement over M_baseline (ΔR2 = +0.01). This indicates that optimizing the feature set alone contributes little to resolving the fundamental heterogeneity in growth patterns across species.
Critically, the operational model’s accuracy (R2 = 0.84, incorporating classification errors) closely approximated the ideal “known species” scenario (R2 = 0.871), with merely 0.031 difference. This minimal gap indicates limited error propagation from front-end classification, thereby supporting the robustness of our tandem framework. Practically, M_operational reduced MAE from 6.84 to 5.57 years (≈1.27-year improvement) compared to M_baseline, validating Plant Economic Spectrum theory’s applicability in remote sensing feature space. Statistical tests confirmed significant RMSE differences between M_operational and both M_baseline (t = 15.37, p < 0.001) and M_feature (t = 8.92, p < 0.001), ensuring performance gains surpassed random variation.
For approximately 15% of the study area where no clear disturbance history was detected (YOD confidence < 0.7 and recovery rate < 25%), forest age was estimated using an alternative method based on species-specific growth parameters (see Section 2.3.2). On the reserved test samples within these areas, this method achieved an R2 of 0.58 and an RMSE of 8.91 years. While this accuracy is lower than that of the primary M_operational model, it still surpasses the performance of the baseline M_baseline model (R2 = 0.62, RMSE = 8.04 years). This indicates that incorporating species information remains beneficial even under conditions of data scarcity. It is important to note that the final, wall-to-wall forest age map is a spatial mosaic of the results from the primary M_operational model and this alternative method.
Figure 4 provides comprehensive performance comparisons: Figure 4a’s density distribution shows M_operational’s consistent accuracy across species; Figure 4b’s heatmap quantifies its superiority across all metrics (R2, RMSE, MAE); and Figure 4c’s heatmap quantifies the mean bias (in years) introduced into age estimation when a specific misclassification occurs. Cells on the diagonal (where true species = predicted species) show near-zero bias. The color and value in off-diagonal cells represent the magnitude and direction of the bias. A key pattern is that misclassifying the slow-growing P. armandii as the fast-growing C. lanceolata leads to a severe underestimation of age (mean −10 years); conversely, misclassifying C. lanceolata as P. armandii causes overestimation. This visually confirms the essential differences in species’ growth rates and demonstrates that ignoring this heterogeneity introduces predictable, systematic bias. Furthermore, misclassification between ecologically similar species (e.g., between the two pines) results in smaller biases, suggesting that errors within similar functional groups have a lesser impact on the downstream task.

3.2.2. Feature Contribution Analysis

Comparative analysis of feature importance between the M_baseline and M_operational models revealed a shift in decision logic upon integrating species information. While elevation dominated the M_baseline feature space, species identity emerged as a decisive factor in M_operational. To isolate the independent contribution of species identity, we conducted stratified analysis by controlling for elevation. The results showed that incorporating species features consistently improved the model performance across all elevation zones (with R2 increases ranging from 0.103 to 0.217). Variance partitioning quantified this contribution, showing that species identity independently explained 18.7% of the variance in forest age—directly validating our core hypothesis. Topographic factors independently accounted for 12.3%, with 9.5% of variance explained jointly by both factors.
At the species level, distinct ecological signatures emerged. The age of slow-growing P. armandii was strongly elevation-dependent (28.7% contribution), consistent with its conservative strategy and adaptation to high-altitude constraints like temperature limitation and shorter growing seasons. In contrast, fast-growing C. lanceolata aligned more closely with disturbance history (35.2% contribution), reflecting its management-driven cycle as a commercial timber species. P. yunnanensis exhibited sensitivity to recovery rate (18.9% contribution) and precipitation, matching its adaptation to dry–hot valley environments.
Figure 4. Model performance validation: (a) Age estimation accuracy distribution by species; (b) Model performance comparison heatmap; (c) Error propagation heatmap (classification-to-age).
Remotesensing 18 00407 g004
These systematic and divergent feature response patterns provide empirical support for the validity of the Plant Economic Spectrum theory at the regional, remote sensing scale. Specifically: (1) The age of conservative-strategy P. armandii was strongly tied to topographic features, aligning with a strategy of investing resources into defense and longevity, where growth is limited by harsh habitat conditions (e.g., low temperatures at high elevation). (2) The age of acquisitive-strategy C. lanceolata was most strongly linked to disturbance history, reflecting a fast-growth, high-turnover strategy that makes its dynamics primarily controlled by anthropogenic management (disturbance). (3) Intermediate-strategy P. yunnanensis showed sensitivity to recovery rate and moisture-related features (e.g., through radar backscatter), indicative of its balanced adaptation to dry–hot stress environments. This indicates that the ecological strategy information implicit in species identity is the underlying ecological mechanism driving the heterogeneity in age–remote sensing feature relationships. All feature importance values (Figure 4 and Figure 5) were computed using permutation importance [45], which measures the drop in R2 after shuffling each feature, avoiding the bias common in impurity-based metrics for multi-level features.
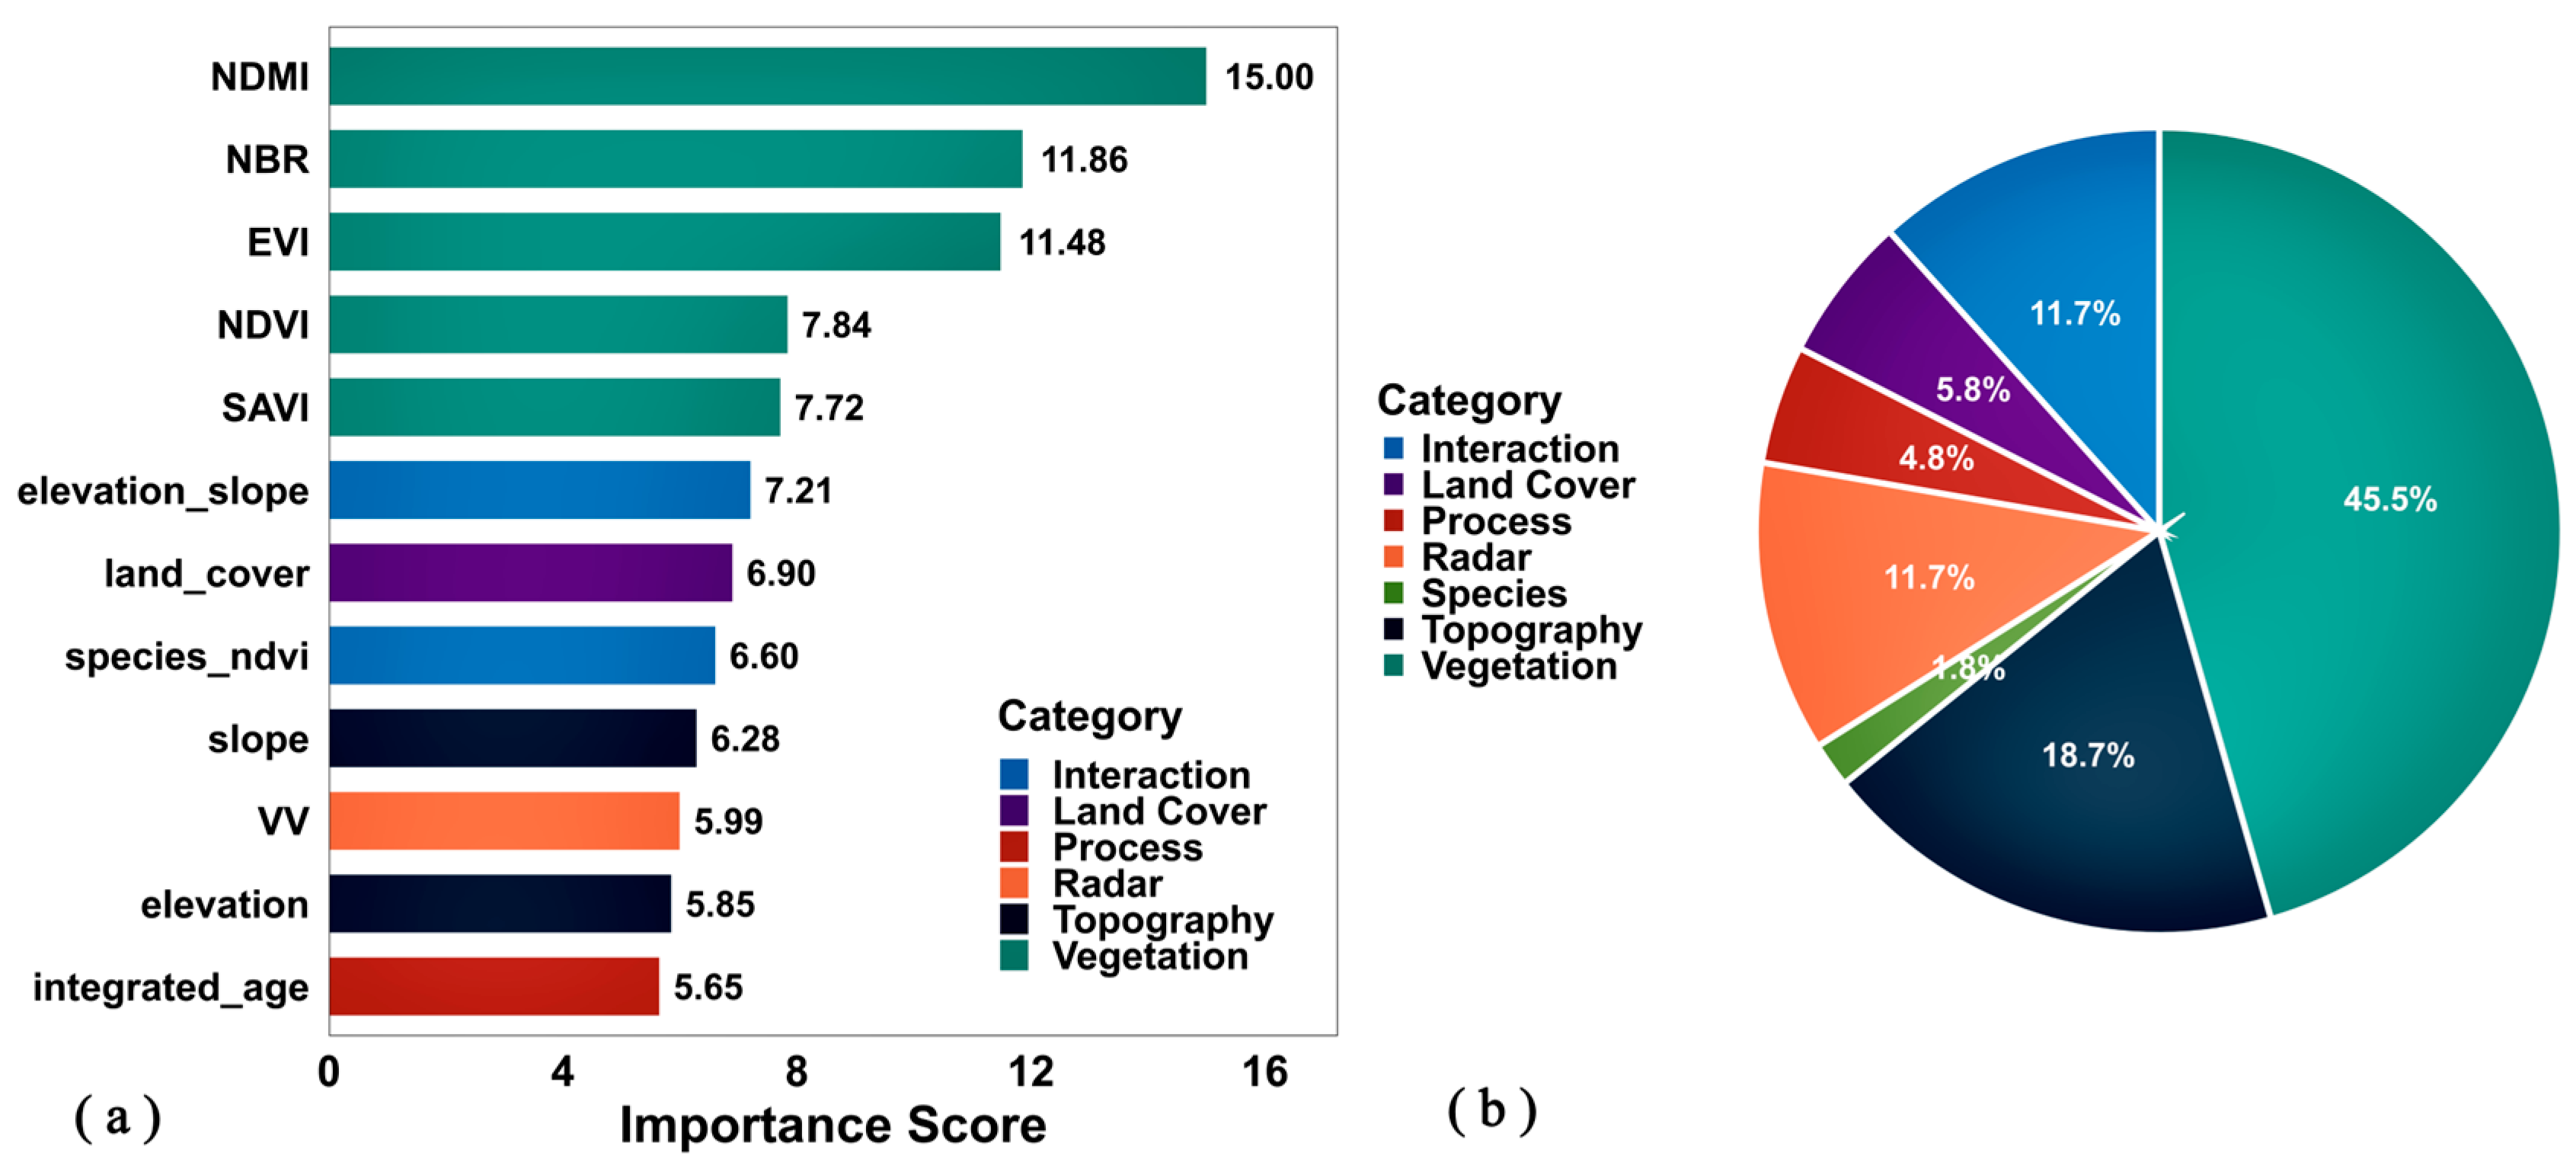
Figure 5 details the feature contribution structure in the operational model. The importance ranking (Figure 5a) identifies slope (6.28), NDMI (15.00), and NBR (11.86) as the most influential predictors. The categorical breakdown (Figure 5b) shows vegetation indices contributed approximately 45.5% of explanatory power, topographic features 18.7%, and radar features 11.7%, illustrating the robustness achieved through multi-source synergy.

3.2.3. Spatial Patterns of Plantation Age

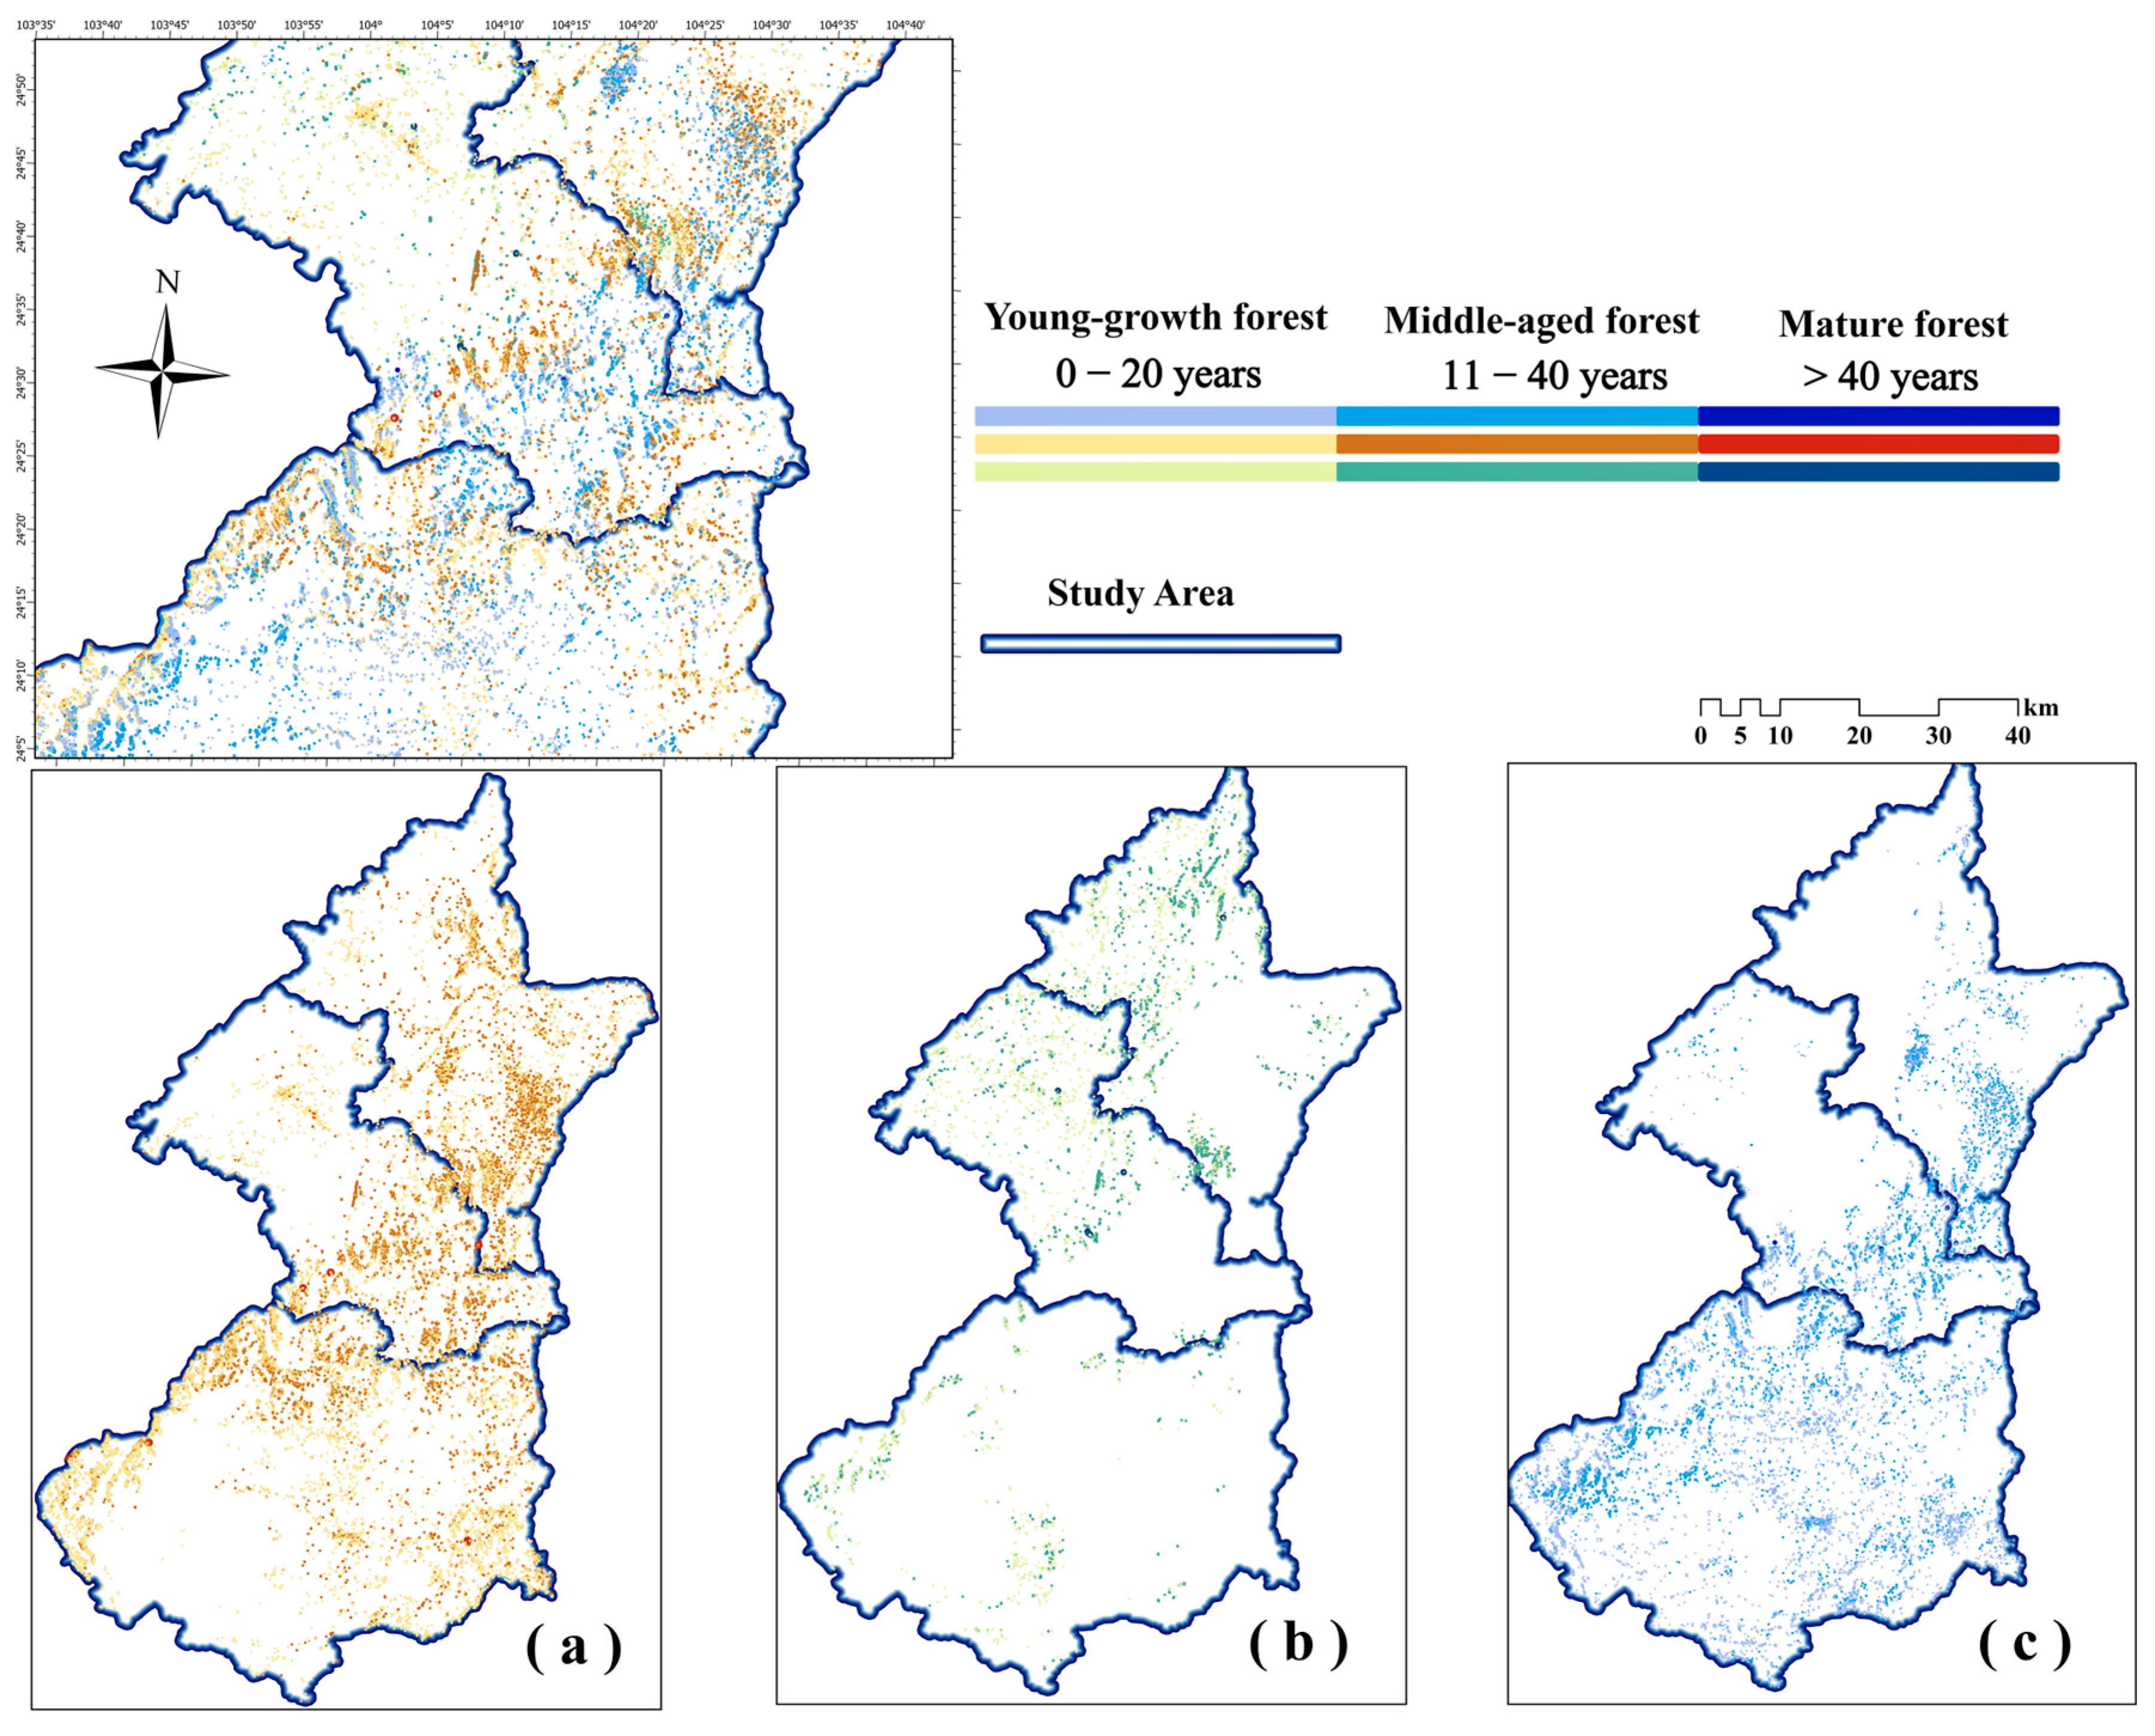
Spatial distribution of plantation age in 2024, derived from the operational model (Figure 6), reveals clear age gradients. Young forests (0–20 years) dominate the north, corresponding to recent afforestation; the southern protected area contains patchy older stands (>40 years); and central regions show a mosaic age structure reflecting varied management histories. This pattern correlates with topography and human activity: accessible low-elevation gentle slopes exhibit uniform ages, while rugged high-elevation terrain preserves older stands due to limited management access.
The age structure is notably youth-dominated: young forests cover 71.58% of the area, middle-aged forests 28.43%, and mature forests (>41 years) only 0.69%. Mature stands persist mainly in protected cores and remote high-elevation zones. Age spatial patterns align with disturbance history—younger stands follow large-scale harvesting, while protected areas maintain older forests such as >35-year-old P. armandii in the south. Topography indirectly shapes age distribution by mediating human impact, producing uniform age classes in accessible lowlands and diverse ages in rugged highlands.
Spatial autocorrelation confirms significant age clustering (Global Moran’s I = 0.68, p < 0.001). Hotspot analysis identified three old-age and five young-age clusters that align with management units and topography, demonstrating joint natural–anthropogenic control. Old-age clusters concentrate in protected and high-elevation areas; young-age clusters match recent cutovers and afforestation sites.

3.3. Uncertainty Analysis

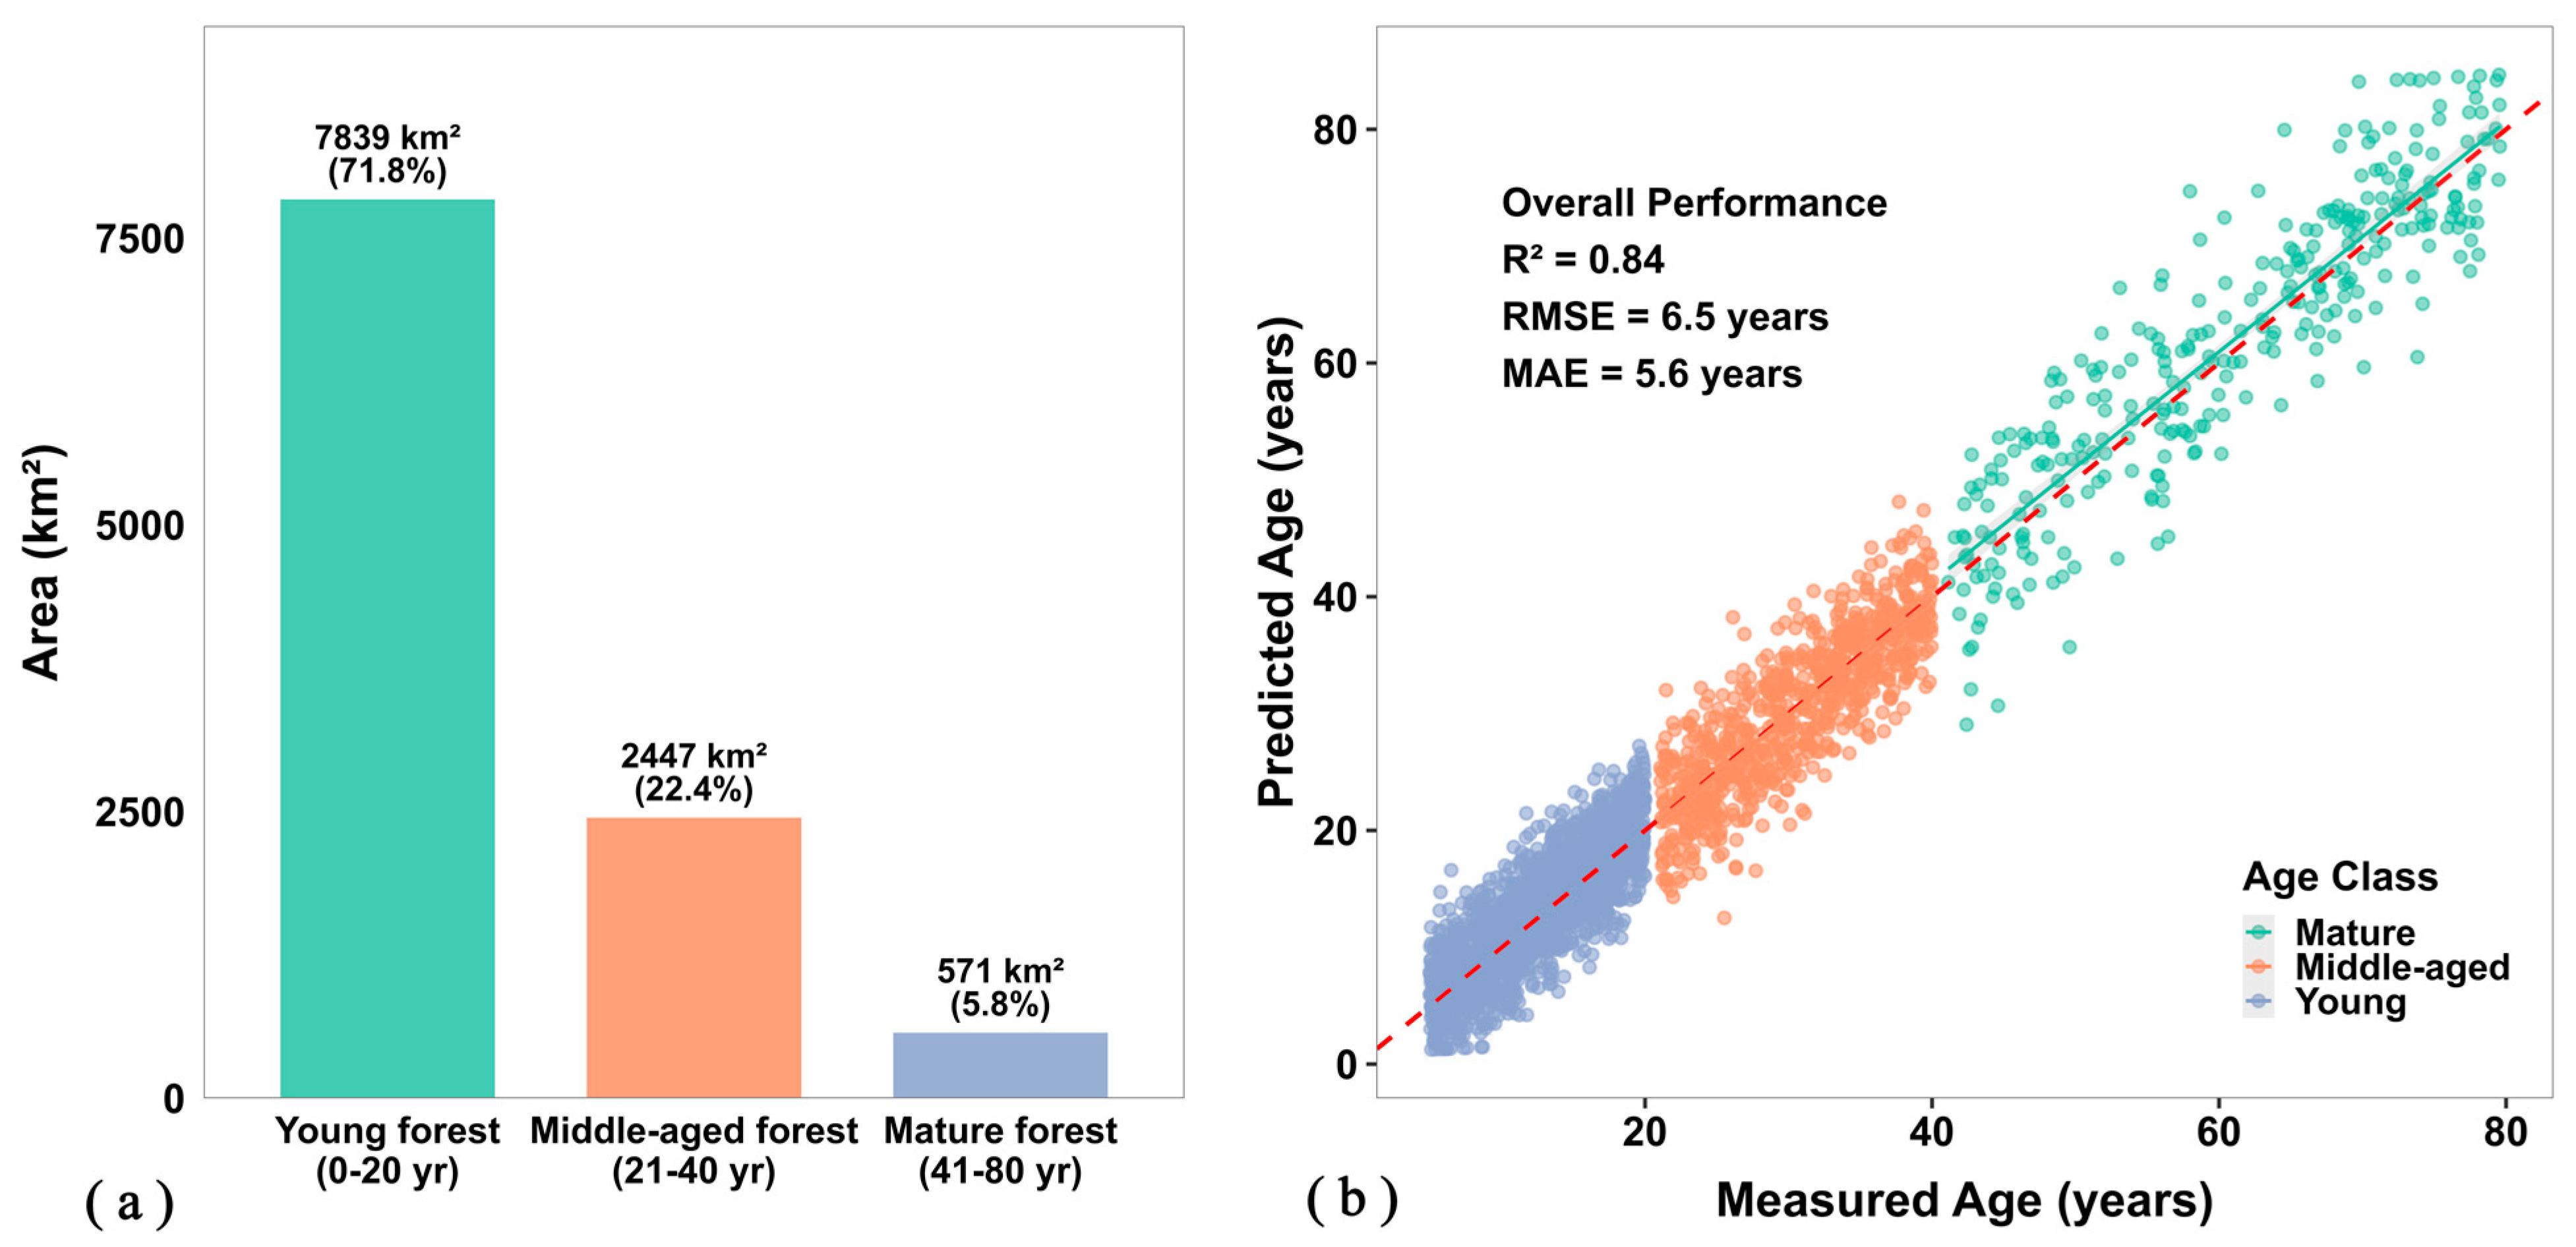
Figure 7 presents the forest age structure and the validation of the M_operational model. Figure 7a shows a youth-dominated age structure (71.76% young forests), which has implications for carbon sink estimates. Figure 7b shows the validation scatterplot, indicating predictions align closely with the 1:1 line, though older stands (>60 years) show more scatter, likely due to limited samples. With a mean age of 23.5 years, the model uncertainty of ±6.3 years represents 26.8% of the mean, potentially blurring three-tier age classification for some pixels.
The quantitative results from Monte Carlo simulation and variance decomposition indicated that model uncertainty was the largest contributor to the total variance in forest age estimation (~35%), followed by parameter uncertainty (~25%), data uncertainty (~25%), and scale uncertainty (15%). Model uncertainty stems from algorithmic and parametric approximations of complex ecological relationships; scale uncertainty arises from resolution mismatches between data and processes; parameter uncertainty reflects growth parameter inaccuracy; and data uncertainty includes sensor error and sample noise.
The error propagation coefficient from classification to age estimation is γ = 0.23, indicating reasonable robustness to classification errors—an important feature given that perfect classification is impractical. To further assess the impact of realistic spatial misclassification patterns, we conducted the spatial transition zone misclassification simulation. When the predicted labels of P. armandii and P. yunnanensis were artificially swapped at a 20% rate within the 1600–1800 m elevation transition zone, the overall age estimation RMSE increased only from 6.52 years to 6.93 years (an increment of approximately 0.41 years). This result further confirms that the tandem framework is robust not only to random, global decreases in classification accuracy but also to specific misclassification patterns between ecologically similar species occurring in spatial transition zones. Low propagation may occur because misclassification often involves ecologically similar species, and complementary environmental features buffer classification errors.
Spatially, uncertainty increases with terrain complexity, peaking in high-elevation steep slopes due to sparse samples, strong topographic effects, and poorer data quality. Uncertainty is lowest in managed lowland gentle slopes with homogeneous stands and better sampling. Uncertainty maps guide reliable application, suggesting cautious use or ground verification in high-uncertainty zones.
Monte Carlo analysis (n = 1000) under ±5-year age label uncertainty shows R2 distributions of 0.57 ± 0.05 for M_baseline and 0.63 ± 0.05 for M_operational, with a difference of >0 in 99% of runs, confirming robust relative superiority. Sensitivity analysis shows the highest sensitivity to species parameters (±20% change → ±15.3% output variation), followed by classification accuracy (±5% → ±8.7%), and lower sensitivity to disturbance year. This highlights the priority of refining species parameters through improved ecological surveys and growth monitoring to enhance model precision.

4. Discussion

4.1. Methodological Contributions and Theoretical Implications

This study developed and validated a tandem analytical framework that integrates multi-source remote sensing with species identity to significantly improve the accuracy of plantation forest age estimation. The core finding demonstrates a substantial improvement: the operational model incorporating species probability information (M_operational, R2 = 0.84, RMSE = 6.52 years) markedly outperformed the baseline model, which ignored species differences (M_baseline, R2 = 0.62). Crucially, feature contribution analysis revealed a systematic pattern wherein forest age estimation for different species relies on distinct remote sensing feature sets. Specifically, the age of the conservative-strategy species Pinus armandii was most strongly associated with topographic features (notably elevation); the age of the acquisitive-strategy species Cunninghamia lanceolata was most closely coupled with disturbance history metrics; and the intermediate-strategy species Pinus yunnanensis showed pronounced sensitivity to canopy moisture status (e.g., NDMI) and recovery rate.
These differentiated feature-response patterns are not coincidental but constitute a direct manifestation of the Plant Economic Spectrum (PES) theory within regional-scale remote sensing feature space [6]. The PES posits that plant functional traits co-vary along a conservative-acquisitive strategy continuum, underpinning distinct resource investment and growth strategies [46]. Our results align with this theoretical framework: P. armandii, as a slow-growing, conservative species, invests in defense and longevity, making its growth dynamics more constrained by harsh habitat conditions (e.g., low temperatures at high elevations) than by disturbance. Consequently, its age is strongly encoded in topographic features that characterize these habitats [47]. In contrast, C. lanceolata, as a fast-growing, acquisitive species, prioritizes rapid growth, rendering its stand dynamics strongly driven by anthropogenic management (e.g., thinning, clear-cutting). Thus, disturbance history serves as the primary indicator of its age [7]. Occupying an intermediate position, P. yunnanensis balances growth with stress tolerance, leading to its greater sensitivity to features reflecting moisture stress and recovery vigor [48]. The “feature-to-strategy” mapping elucidated by our remote sensing approach demonstrates the efficacy of using species identity as a proxy for the growth strategy heterogeneity conceptualized by the PES. This provides novel evidence for advancing remote sensing parameter retrieval from an ecological mechanistic perspective, moving beyond traditional approaches that merely apply species-specific growth parameters for simple correction.

4.2. Methodological Contributions and Framework Robustness

The contribution of this study is twofold: it not only validates the critical importance of accounting for species heterogeneity but also constructs an operational framework that successfully marries high accuracy with practical robustness. Methodologically, this is achieved through a data-driven pathway for modeling heterogeneity and the rigorous quantification of the tandem framework’s resilience to upstream errors.
Conventional approaches either neglect heterogeneity or rely on pre-defined, complex phenological or growth models for individual species, which poses challenges for operational scalability. Our proposed M_operational model adopts a more flexible and scalable strategy by utilizing the species probability distribution from the front-end classifier as a continuous feature input for the downstream regression model [49]. This design enables the model to learn species-specific (and transitional) growth patterns in a data-driven manner, reducing dependency on fixed, and potentially inaccurate, a priori parameters.
Simultaneously, the framework exhibits considerable robustness to errors in the front-end classification. Error propagation analysis yielded a low propagation coefficient (γ = 0.23), indicating that a 1% decrease in classification accuracy leads to only an approximately 0.23% increase in age estimation RMSE [50]. Furthermore, a more realistic simulation of misclassification in spatial transition zones showed that even a 20% species misclassification rate had a minor impact on overall accuracy (RMSE increase of ~0.41 years). This robustness stems from two factors: first, major classification confusion occurs between ecologically similar species (e.g., the two pines), whose growth patterns are comparable, thereby mitigating the impact of mislabeling; second, the age estimation model integrates multi-dimensional remote sensing features, which collectively buffer the uncertainty introduced by any single feature, including species identity [51]. This low sensitivity to front-end classification errors is a pivotal attribute that underpins the operational feasibility of the “classification–retrieval” tandem framework.

4.3. Implications Within the Karst Ecosystem

The distinctive karst ecosystem of southeastern Yunnan provides a compelling regional context that both informs and amplifies the significance of our findings. Characterized by high habitat heterogeneity, shallow soils, and rapid water infiltration, karst landscapes exert a strong environmental filtering effect [52], which accentuates the role of species-specific adaptations.
Our analysis found that topographic factors independently explained up to 12.3% of the variance in age estimation—a proportion notably higher than values reported for some non-karst plantation areas. This strongly suggests that in karst regions, extreme topographic conditions, through their drastic regulation of water and nutrient redistribution and microclimate, intensify their limiting effects on tree establishment, survival, and growth. Consequently, in such stressed habitats, ignoring species-specific adaptation strategies to topography is likely to induce greater estimation bias. Conversely, our framework, which explicitly characterizes the complex “species–topography–growth” relationship, likely holds greater utility and value in karst and similar stressed ecosystems than in more benign environments. This presents a testable hypothesis for future cross-ecosystem comparative studies.
Moreover, the youth-dominated age structure (>70% young forests) mapped in this study reflects the unique management challenges within karst areas, including difficulties with afforestation survival and slow early growth. The high-precision age baseline provided here is thus vital for informing regional sustainable forest management and refining carbon sink assessments [53].

4.4. Uncertainty Analysis and Robustness of Conclusions

While the results are positive, a careful evaluation of uncertainties is imperative [54]. We systematically quantified four primary uncertainty sources via Monte Carlo simulation and variance decomposition: (1) Model uncertainty (~35%), stemming from the approximation error of machine learning algorithms in capturing complex nonlinear relationships; (2) Parameter uncertainty (~25%), primarily from estimation errors in species-specific growth parameters (Table 3); (3) Data uncertainty (~25%), encompassing remote sensing observation errors and sample noise; and (4) Scale uncertainty (~15%), arising from resolution discrepancies among multi-source data and the mismatch between ecological processes and observation scales [55].
Among these, ground-truth age uncertainty warrants particular discussion. Reliance on extrapolating 2015 inventory data to 2024 means that “non-significant disturbances” (e.g., light thinning, pest outbreaks) not captured by LandTrendr or visual interpretation could introduce a systematic bias, estimated at ~±1–5 years [32]. However, our core conclusion—that the species-aware model (M_operational) is significantly superior to the species-agnostic baseline (M_baseline)—remains robust to these ground-truth uncertainties. Monte Carlo sensitivity analysis (n = 1000) confirmed that even with the introduction of ±5 years of random error into the ground-truth age, the performance superiority of M_operational was maintained in 99% of the simulations [56]. This fundamentally underscores that the primary value of this work lies in demonstrating a robust relative improvement in methodological approach, rather than in claiming definitive absolute accuracy.

4.5. Limitations and Future Perspectives

This study has four main limitations that also delineate pathways for future research:
(1)
Species scope and regional specificity: The framework is optimized for three dominant conifers in the study region. Application to more diverse forests or other regions would require expanding the classification system and recalibrating species-specific parameters, which may introduce new error sources.
(2)
Indirect acquisition of ground-truth age: As noted in Section 4.4, future efforts should prioritize building more robust age validation datasets, potentially through integration of multi-temporal LiDAR (e.g., GEDI, ICESat-2) for direct height-growth chronologies or through dedicated permanent plot networks combined with dendrochronology [57].
(3)
Transferability of feature engineering: The inclusion of atmospheric variables (AOT, WVP) in classification, while marginally beneficial (~2.1% accuracy gain), raises concerns about interpretability and temporal generalizability due to potential dependency on acquisition conditions. Future work should investigate more physiographically stable features or spatiotemporal fusion techniques to enhance model portability [58].
(4)
Scope of innovation in classification: The species classification accuracy (OA = 89.34%) is consistent with prior regional work. The principal innovation lies not in this metric per se, but in the novel and systematic integration of the classifier’s probability output as a key driver for downstream heterogeneous growth modeling, coupled with the rigorous quantification of the entire workflow’s robustness.
Looking ahead, research can advance along three promising directions: First, conducting cross-ecosystem comparisons to quantitatively test the hypothesis that the value of species-heterogeneity-aware methods is greater in stressed (e.g., karst) versus non-stressed environments. Second, moving beyond the “species proxy” by attempting to directly link remote sensing feature importance patterns with measured plant functional traits (e.g., wood density, specific leaf area), achieving a “direct trait linkage” [59]. Third, in the context of global change, coupling such empirical remote sensing frameworks with process-based models to dynamically project the response of plantation carbon sinks, comprising different functional types, to future climate scenarios [60].

5. Conclusions

Addressing the neglect of species functional trait heterogeneity in conventional remote sensing age estimation, this study develops and validates a technical framework integrating multi-source remote sensing with Plant Economic Spectrum theory. Its application in southeastern Yunnan’s karst plantations demonstrates:
(1)
Significant accuracy improvement: The operational model (M_operational) achieved an R2 of 0.84 (RMSE = 6.52 years), representing a substantial improvement over the baseline model that ignored species heterogeneity (R2 = 0.62).
(2)
Robust operational potential: Close agreement between overall accuracy and ideal “known species” conditions, combined with low sensitivity to classification errors (γ = 0.23), confirms practical robustness.
(3)
Ecological mechanism validation: Species functional trait differences drive heterogeneity in age–remote sensing relationships, confirming Plant Economic Spectrum theory’s applicability to regional-scale remote sensing inversion.
This methodology provides a viable approach for improved-accuracy, operational plantation carbon sink assessment, contributing significantly to achieving “Dual Carbon” objectives.

Author Contributions

Conceptualization, X.Z.; methodology, X.Z.; software, X.Z. and L.Z.; validation, X.Z. and C.Z.; formal analysis, X.Z.; investigation, X.Z.; resources, C.Z. and W.Y.; data curation, X.Z.; writing—original draft preparation, X.Z. and H.L.; writing—review and editing, C.Z.; visualization, X.Z.; supervision, C.Z. and L.F.; project administration, C.Z.; funding acquisition, C.Z. All authors have read and agreed to the published version of the manuscript.

Funding

This research was supported by the Yunnan Provincial Major Science and Technology Project: Application of Monitoring System and Key Technologies for Migration Process of Agricultural Non-point Source Pollution in Yangzonghai Basin (Project No.: 202502AE090046).

Data Availability Statement

The datasets presented in this article are not readily available because the data are part of an ongoing study and require further curation for public release. Requests to access the datasets should be directed to the corresponding author, Chao Zhang (zhchgis@swfu.edu.cn).

Acknowledgments

We thank the editor and anonymous reviewers for their valuable comments, whose revisions helped to improve the manuscript.

Conflicts of Interest

The authors declare that they have no known competing financial interests or personal relationships that could have appeared to influence the work reported in this paper.

References

  1. Chen, Y.; Zhang, B.; Zhang, Y.; Wu, J. Carbon sequestration in forest plantation ecosystems. Front. For. Glob. Change 2024, 6, 1343488. [Google Scholar]
  2. Li, X.; Bi, C.; Wu, J.; Zhang, C.; Yan, W.; Xiao, Z.; Wang, Y.-P.; Ren, J.; Su, Y. Maximum carbon uptake potential through progressive management of plantation forests in Guangdong Province, China. Commun. Earth Environ. 2025, 6, 9. [Google Scholar] [CrossRef]
  3. Li, B.; Gao, G.; Luo, Y.; Xu, M.; Liu, G.; Fu, B. Carbon stock and sequestration of planted and natural forests along climate gradient in water-limited area: A synthesis in the China’s Loess plateau. Agric. For. Meteorol. 2023, 333, 109419. [Google Scholar] [CrossRef]
  4. Friedlingstein, P.; O’Sullivan, M.; Jones, M.W.; Andrew, R.M.; Bakker, D.C.E.; Hauck, J.; Landschützer, P.; Le Quéré, C.; Luijkx, I.T.; Peters, G.P.; et al. Global Carbon Budget 2023. Earth Syst. Sci. Data 2023, 15, 5301–5369. [Google Scholar] [CrossRef]
  5. Pugh, T.A.M.; Lindeskog, M.; Smith, B.; Poulter, B.; Arneth, A.; Haverd, V.; Calle, L. Role of forest regrowth in global carbon sink dynamics. Proc. Natl. Acad. Sci. USA 2019, 116, 4382–4387. [Google Scholar] [PubMed]
  6. Reich, P.B. The world-wide “fast–slow” plant economics spectrum: A traits manifesto. J. Ecol. 2014, 102, 275–301. [Google Scholar] [CrossRef]
  7. Wright, I.J.; Reich, P.B.; Westoby, M.; Ackerly, D.D.; Baruch, Z.; Bongers, F.; Cavender-Bares, J.; Chapin, T.; Cornelissen, J.H.C.; Diemer, M.; et al. The worldwide leaf economics spectrum. Nature 2004, 428, 821–827. [Google Scholar] [CrossRef]
  8. Nasiri, V.; Hawryło, P.; Tompalski, P.; Wertz, B.; Socha, J. Linking remotely sensed growth-related canopy attributes to interannual tree-ring width variations: A species-specific study using Sentinel optical and SAR time series. ISPRS J. Photogramm. Remote Sens. 2025, 221, 347–362. [Google Scholar] [CrossRef]
  9. Zhang, Y.; Lu, D.; Jiang, X.; Li, Y.; Li, D. Forest structure simulation of eucalyptus plantation using remote-sensing-based forest age data and 3-pg model. Remote Sens. 2022, 15, 183. [Google Scholar]
  10. Yu, Z.; You, W.; Agathokleous, E.; Zhou, G.; Liu, S. Forest management required for consistent carbon sink in China’s forest plantations. For. Ecosyst. 2021, 8, 54. [Google Scholar] [CrossRef]
  11. Farooq, T.H.; Shakoor, A.; Wu, X.; Li, Y.; Rashid, M.H.U.; Zhang, X.; Gilani, M.M.; Kumar, U.; Chen, X.; Yan, W. Perspectives of plantation forests in the sustainable forest development of China. Biogeosci. For. 2021, 14, 166–174. [Google Scholar] [CrossRef]
  12. Wang, X.; Shi, J.; Wang, C.; Gao, C.; Zhang, F. Remote sensing inversion and mapping of typical forest stand age in the loess plateau. Remote Sens. 2023, 15, 5581. [Google Scholar] [CrossRef]
  13. Tian, L.; Wu, X.; Tao, Y.; Li, M.; Qian, C.; Liao, L.; Fu, W. Review of remote sensing-based methods for forest aboveground biomass estimation: Progress, challenges, and prospects. Forests 2023, 14, 1086. [Google Scholar] [CrossRef]
  14. Yang, X.; Liu, Y.; Wu, Z.; Yu, Y.; Li, F.; Fan, W. Forest age mapping based on multiple-resource remote sensing data. Environ. Monit. Assess. 2020, 192, 734. [Google Scholar] [CrossRef] [PubMed]
  15. Donev, P.; Wang, H.; Qin, S.; Li, X.; Zhang, M.; Liu, S.; Wang, X. Cross-modal fusion approach with multispectral, LiDAR, and SAR data for forest canopy height mapping in mountainous region. Phys. Chem. Earth Parts A/B/C 2025, 137, 103819. [Google Scholar] [CrossRef]
  16. Li, J.; Hong, D.; Gao, L.; Yao, J.; Zheng, K.; Zhang, B.; Chanussot, J. Deep learning in multimodal remote sensing data fusion: A comprehensive review. Int. J. Appl. Earth Obs. Geoinf. 2022, 112, 102926. [Google Scholar] [CrossRef]
  17. Zeng, Y.; Hao, D.; Huete, A.; Dechant, B.; Berry, J.; Chen, J.M.; Joiner, J.; Frankenberg, C.; Bond-Lamberty, B.; Ryu, Y.; et al. Optical vegetation indices for monitoring terrestrial ecosystems globally. Nat. Rev. Earth Environ. 2022, 3, 477–493. [Google Scholar] [CrossRef]
  18. Radeloff, V.C.; Roy, D.P.; Wulder, M.A.; Anderson, M.; Cook, B.; Crawford, C.J.; Friedl, M.; Gao, F.; Gorelick, N.; Hansen, M.; et al. Need and vision for global medium-resolution Landsat and Sentinel-2 data products. Remote Sens. Environ. 2024, 300, 113918. [Google Scholar] [CrossRef]
  19. Hu, X.; Li, L.; Huang, J.; Zeng, Y.; Zhang, S.; Su, Y.; Hong, Y.; Hong, Z. Radar vegetation indices for monitoring surface vegetation: Developments, challenges, and trends. Sci. Total Environ. 2024, 945, 173974. [Google Scholar] [CrossRef]
  20. Chaurasia, A.N.; Parmar, R.M.; Dave, M.G.; Krishnayya, N.S.R. Integrating field-and remote sensing data to perceive species heterogeneity across a climate gradient. Sci. Rep. 2024, 14, 42. [Google Scholar] [CrossRef]
  21. Balestra, M.; Marselis, S.; Sankey, T.T.; Cabo, C.; Liang, X.; Mokroš, M.; Peng, X.; Singh, A.; Stereńczak, K.; Vega, C.; et al. LiDAR Data fusion to improve forest attribute estimates: A review. Curr. For. Rep. 2024, 10, 281–297. [Google Scholar] [CrossRef]
  22. Chen, J.; Liang, X.; Liu, Z.; Gong, W.; Chen, Y.; Hyyppä, J.; Kukko, A.; Wang, Y. Tree species recognition from close-range sensing: A review. Remote Sens. Environ. 2024, 313, 114337. [Google Scholar]
  23. Hemmerling, J.; Pflugmacher, D.; Hostert, P. Mapping temperate forest tree species using dense Sentinel-2 time series. Remote Sens. Environ. 2021, 267, 112743. [Google Scholar] [CrossRef]
  24. Ahlswede, S.; Schulz, C.; Gava, C.; Helber, P.; Bischke, B.; Förster, M.; Arias, F.; Hees, J.; Demir, B.; Kleinschmit, B. TreeSatAI Benchmark Archive: A multi-sensor, multi-label dataset for tree species classification in remote sensing. Earth Syst. Sci. Data 2022, 2022, 1–22. [Google Scholar]
  25. Persson, M.; Lindberg, E.; Reese, H. Tree species classification with multi-temporal Sentinel-2 data. Remote Sens. 2018, 10, 1794. [Google Scholar] [CrossRef]
  26. Qin, H.; Zhou, W.; Yao, Y.; Wang, W. Individual tree segmentation and tree species classification in subtropical broadleaf forests using UAV-based LiDAR, hyperspectral, and ultrahigh-resolution RGB data. Remote Sens. Environ. 2022, 280, 113143. [Google Scholar]
  27. Yan, K.; Gao, S.; Yan, G.; Ma, X.; Chen, X.; Zhu, P.; Li, J.; Gao, S.; Gastellu-Etchegorry, J.-P.; Myneni, R.B. A global systematic review of the remote sensing vegetation indices. Int. J. Appl. Earth Obs. Geoinf. 2025, 139, 104560. [Google Scholar]
  28. Liang, X.; Chen, J.; Gong, W.; Puttonen, E.; Wang, Y. Influence of data and methods on high-resolution imagery-based tree species recognition considering phenology: The case of temperate forests. Remote Sens. Environ. 2025, 323, 114654. [Google Scholar]
  29. Fassnacht, F.E.; White, J.C.; Wulder, M.A.; Næsset, E. Remote sensing in forestry: Current challenges, considerations and directions. Forestry 2024, 97, 11–37. [Google Scholar]
  30. Lin, X.; Shang, R.; Chen, J.M.; Zhao, G.; Zhang, X.; Huang, Y.; Yu, G.; He, N.; Xu, L.; Jiao, W. High-resolution forest age mapping based on forest height maps derived from GEDI and ICESat-2 space-borne lidar data. Agric. For. Meteorol. 2023, 339, 109592. [Google Scholar]
  31. Zhang, S.; Xu, H.; Liu, A.; Qi, S.; Hu, B.; Huang, M.; Luo, J. Mapping of secondary forest age in China using stacked generalization and Landsat time series. Sci. Data 2024, 11, 302. [Google Scholar] [CrossRef] [PubMed]
  32. Kennedy, R.E.; Yang, Z.; Cohen, W.B. Detecting trends in forest disturbance and recovery using yearly Landsat time series: 1. LandTrendr—Temporal segmentation algorithms. Remote Sens. Environ. 2010, 114, 2897–2910. [Google Scholar]
  33. Shen, W.J.; Li, M.S. Mapping disturbance and recovery of plantation forests in southern China using yearly Landsat time series observations. Acta Ecol. Sin. 2017, 37, 1438–1449. [Google Scholar] [CrossRef]
  34. Smolina, A.; Illarionova, S.; Shadrin, D.; Kedrov, A.; Burnaev, E. Forest age estimation in northern Arkhangelsk region based on machine learning pipeline on Sentinel-2 and auxiliary data. Sci. Rep. 2023, 13, 22167. [Google Scholar] [CrossRef]
  35. Jiang, Y.; Chen, Z.; Lin, H.; Deng, R.; Liang, Z.; Li, Y.; Liang, S. Trait-based community assembly and functional strategies across three subtropical karst forests, Southwestern China. Front. Plant Sci. 2024, 15, 1451981. [Google Scholar] [CrossRef]
  36. Qin, J.Z.; Dai, J.P.; Li, S.H.; Zhang, J.Z.; Peng, J.S. Construction of ecological network in Qujing city based on MSPA and MCR models. Sci. Rep. 2024, 14, 9800. [Google Scholar] [CrossRef] [PubMed]
  37. Takeda, S.; Takahashi, K. Elevational variation in abundance of coarse woody debris in subalpine forests, central Japan. For. Ecol. Manag. 2020, 473, 118295. [Google Scholar] [CrossRef]
  38. Kursa, M.B.; Rudnicki, W.R. Feature selection with the Boruta package. J. Stat. Softw. 2010, 36, 1–13. [Google Scholar]
  39. Zhang, X.; Zhang, C.; Fu, L. Mechanisms of Spatial Coupling Between Plantation Species Distribution and Historical Disturbance in the Complex Topography of Eastern Yunnan. Remote Sens. 2025, 17, 2925. [Google Scholar]
  40. Cheng, Z.; Aakala, T.; Larjavaara, M. Elevation, aspect, and slope influence woody vegetation structure and composition but not species richness in a human-influenced landscape in northwestern Yunnan, China. Front. For. Glob. Change 2023, 6, 1187724. [Google Scholar]
  41. Yang, B.; Zhao, Y.; Li, J.; Liu, M.; Feng, L.; Zhou, B.; Wu, L. Large-scale mapping and uncertainty assessment of dominant tree species in southern China based on Sentinel-2 time series. J. Environ. Manag. 2025, 390, 126293. [Google Scholar] [CrossRef] [PubMed]
  42. Lin, H.; Liu, X.; Han, Z.; Cui, H.; Dian, Y. Identification of tree species in forest communities at different altitudes based on Multi-Source Aerial Remote sensing data. Appl. Sci. 2023, 13, 4911. [Google Scholar] [CrossRef]
  43. Congalton, R.G. A review of assessing the accuracy of classifications of remotely sensed data. Remote Sens. Environ. 1991, 37, 35–46. [Google Scholar]
  44. Olofsson, P.; Foody, G.M.; Herold, M.; Stehman, S.V.; Woodcock, C.E.; Wulder, M.A. Good practices for estimating area and assessing accuracy of land change. Remote Sens. Environ. 2014, 148, 42–57. [Google Scholar] [CrossRef]
  45. Strobl, C.; Boulesteix, A.L.; Zeileis, A.; Hothorn, T. Bias in random forest variable importance measures: Illustrations, sources and a solution. BMC Bioinf. 2007, 8, 25. [Google Scholar]
  46. Díaz, S.; Kattge, J.; Cornelissen, J.H.C.; Wright, I.J.; Lavorel, S.; Dray, S.; Reu, B.; Kleyer, M.; Wirth, C.; Prentice, I.C.; et al. The global spectrum of plant form and function. Nature 2016, 529, 167–171. [Google Scholar] [CrossRef]
  47. Besnard, S.; Koirala, S.; Santoro, M.; Weber, U.; Nelson, J.; Gütter, J.; Herault, B.; Kassi, J.; N’Guessan, A.; Neigh, C.; et al. Mapping global forest age from forest inventories, biomass and climate data. Earth Syst. Sci. Data 2021, 2021, 1–22. [Google Scholar] [CrossRef]
  48. Messier, J.; McGill, B.J.; Lechowicz, M.J. How do traits vary across ecological scales? A case for trait-based ecology. Ecol. Lett. 2010, 13, 838–848. [Google Scholar]
  49. Stephens, D.; Diesing, M. A comparison of supervised classification methods for the prediction of substrate type using multibeam acoustic and legacy grain-size data. PLoS ONE 2014, 9, e93950. [Google Scholar]
  50. Maxwell, A.E.; Warner, T.A.; Fang, F. Implementation of machine-learning classification in remote sensing: An applied review. Int. J. Remote Sens. 2018, 39, 2784–2817. [Google Scholar]
  51. Gómez, C.; White, J.C.; Wulder, M.A. Optical remotely sensed time series data for land cover classification: A review. ISPRS J. Photogramm. Remote Sens. 2016, 116, 55–72. [Google Scholar] [CrossRef]
  52. Yang, Q.; Zhang, F.; Jiang, Z.; Li, W.; Zhang, J.; Zeng, F.; Li, H. Relationship between soil depth and terrain attributes in karst region in Southwest China. J. Soils Sediments 2014, 14, 1568–1576. [Google Scholar] [CrossRef]
  53. Pan, Y.; Birdsey, R.A.; Fang, J.; Houghton, R.; Kauppi, P.E.; Kurz, W.A.; Phillips, O.L.; Shvidenko, A.; Lewis, S.L.; Canadell, J.G.; et al. A large and persistent carbon sink in the world’s forests. Science 2011, 333, 988–993. [Google Scholar] [CrossRef]
  54. Foody, G.M. Status of land cover classification accuracy assessment. Remote Sens. Environ. 2002, 80, 185–201. [Google Scholar] [CrossRef]
  55. Zhao, K.; Suarez, J.C.; Garcia, M.; Hu, T.; Wang, C.; Londo, A. Utility of multitemporal lidar for forest and carbon monitoring: Tree growth, biomass dynamics, and carbon flux. Remote Sens. Environ. 2018, 204, 883–897. [Google Scholar]
  56. Ogle, K.; Barber, J.J.; Barron-Gafford, G.A.; Bentley, L.P.; Young, J.M.; Huxman, T.E.; Loik, M.E.; Tissue, D.T. Quantifying ecological memory in plant and ecosystem processes. Ecol. Lett. 2015, 18, 221–235. [Google Scholar] [PubMed]
  57. Chen, B.; Xiao, X.; Wu, Z.; Yun, T.; Kou, W.; Ye, H.; Lin, Q.; Doughty, R.; Dong, J.; Ma, J.; et al. Identifying establishment year and pre-conversion land cover of rubber plantations on Hainan Island, China using landsat data during 1987–2015. Remote Sens. 2018, 10, 1240. [Google Scholar] [CrossRef]
  58. Tuia, D.; Persello, C.; Bruzzone, L. Domain adaptation for the classification of remote sensing data: An overview of recent advances. IEEE Geosci. Remote Sens. Mag. 2016, 4, 41–57. [Google Scholar]
  59. Kattge, J.; Bönisch, G.; Díaz, S.; Lavorel, S.; Prentice, I.C.; Leadley, P.; Tautenhahn, S.; Werner, G.D.A.; Aakala, T.; Abedi, M.; et al. TRY plant trait database–enhanced coverage and open access. Glob. Change Biol. 2020, 26, 119–188. [Google Scholar]
  60. Friend, A.D.; Lucht, W.; Rademacher, T.T.; Keribin, R.; Betts, R.; Cadule, P.; Ciais, P.; Clark, D.B.; Dankers, R.; Falloon, P.D.; et al. Carbon residence time dominates uncertainty in terrestrial vegetation responses to future climate and atmospheric CO2. Proc. Natl. Acad. Sci. USA 2014, 111, 3280–3285. [Google Scholar]
Figure 1. Study area overview (a) Topographic elevation; (b) Schematic map of the main study species (Cunninghamia lanceolata, Pinus armandii, Pinus yunnanensis), generated from the Second Class Forest Inventory data and the classification results of this study, generated with the ArcGIS Pro 3.1.6 software (www.esri.com, accessed on 13 September 2025).
Remotesensing 18 00407 g001
Figure 2. Technical workflow of the integrated forest age estimation framework.
Remotesensing 18 00407 g002
Figure 3. Species classification results and feature importance: (a) Schematic map of species spatial distribution; (b) Confusion matrix from spatial block cross-validation; (c) Comparison of classification accuracy metrics: Overall Accuracy (OA), Producer’s Accuracy (PA), User’s Accuracy (UA), and F1-score; (d) Ranking of feature importance for the species classifier.
Remotesensing 18 00407 g003
Figure 5. Feature importance analysis for the M_operational model: (a) Feature importance ranking; (b) Contribution by feature category.
Remotesensing 18 00407 g005
Figure 6. Spatial patterns of forest age distribution: (a) C. lanceolata distribution zone; (b) P. armandii distribution zone; (c) P. yunnanensis distribution zone.
Remotesensing 18 00407 g006
Figure 7. Forest age structure and model validation: (a) Age class area distribution; (b) Validation scatter plot for the M_operational model. (Note: The red dashed line in (b) represents the 1:1 line of perfect agreement between measured and predicted ages, while the shaded band indicates the linear regression trend with confidence interval).
Remotesensing 18 00407 g007
Table 1. Specifications of multi-source remote sensing datasets (all data retrieved from Google Earth Engine (GEE) via geemap library: https://geemap.org/, accessed on 20 July 2025).
Data CategoryData/FeatureSpecificationPurpose
Remote SensingSentinel-2 MSI2024 growing season composite; Spatial res.: 10 m (B2, B3, B4, B8), 20 m (B5–B7, B8A, B11, B12), 60 m (B1, B9, B10); Temporal res.: 5-day revisit.Calculation of vegetation indices.
Sentinel-1 SAR2024; Spatial res.: 10 m (IW GRD); Temporal res.: 12-day revisit. Polarizations: VV, VH.Canopy structure information (RVI-derived).
Landsat series1992–2024; Spatial res.: 30 m; Temporal res.: 16-day revisit. Processed with LandTrendr algorithm.Disturbance history detection (Year of Detection, recovery rate).
EnvironmentalSRTM DEMSpatial res.: 30 m (1 arc-second).Extraction of topographic features (elevation, slope, aspect, TPI).
Forest inventoryTemporal: 2015 survey, updated to 2024; Spatial unit: Subcompartment polygons.Model training and validation (species & forest age labels).
Feature SetsVegetation IndicesNDVI, EVI, NDMI, NBR, SAVI (derived from Sentinel-2).Characterizing biophysical parameters.
Radar FeaturesVV, VH backscatter coefficients, and Radar Vegetation Index (RVI).Providing structural information.
TopographicElevation, slope, aspect, Topographic Position Index (TPI) (derived from SRTM).Representing environmental gradients.
TemporalLandTrendr-derived Year of Disturbance (YOD) and spectral recovery rate.Serving as baseline for age estimation.
Note: All raster data were uniformly resampled and aligned to a 10 m spatial resolution on the Google Earth Engine (GEE) platform to ensure consistency for pixel-level analysis. This process reconciles the inherent resolution inconsistencies among Sentinel-2 (multi-band), Sentinel-1 (10 m), Landsat (30 m), and SRTM (30 m) data sources.
Table 2. Sample distribution and validation statistics.
DatasetTotal SamplesSamples (n) Proportion (%)Validation
Total SamplesValid sample142,434100-
Training set99,70470-
Test set42,73030Spatial CV
Species CompositionChinese fir82,61258R2 = 0.873
Armand pine32,76023R2 = 0.891
Yunnan pine27,06219R2 = 0.857
Model PerformanceM_baseline--R2 = 0.62, RMSE = 8.04
M_operational--R2 = 0.84, RMSE = 6.52
Table 3. Species-specific growth parameters and ecological rationale.
SpeciesBase Seedling Age (yr)Elevation AdjustmentRecovery SensitivityGrowth
Rate Factor
Ecological Rationale
Pinus armandii8+2 yr (>1500 m)0.121.00Slow-growing, high-elevation adapted
Cunninghamia lanceolata4+1 yr (>1500 m)0.151.08Fast-growing, plantation management
Pinus yunnanensis6+2 yr (>1500 m)0.101.05Moderate growth, drought-tolerant
Disclaimer/Publisher’s Note: The statements, opinions and data contained in all publications are solely those of the individual author(s) and contributor(s) and not of MDPI and/or the editor(s). MDPI and/or the editor(s) disclaim responsibility for any injury to people or property resulting from any ideas, methods, instructions or products referred to in the content.