Article

Wind Turbines Small Object Detection in Remote Sensing Images Based on CGA-YOLO: A Case Study in Shandong Province, China

1
Aerospace Information Research Institute, Chinese Academy of Sciences, Beijing 100094, China
2
University of Chinese Academy of Sciences, Beijing 100049, China
3
Kashgar Aerospace Information Research Institute, Kashgar 844000, China
4
School of Geography, Archaeology and Environmental Studies, University of the Witwatersrand, Johannesburg 2050, South Africa
*
Author to whom correspondence should be addressed.
Remote Sens. 2026, 18(2), 324; https://doi.org/10.3390/rs18020324
Submission received: 9 December 2025 / Revised: 14 January 2026 / Accepted: 15 January 2026 / Published: 18 January 2026

Highlights

What are the main findings?
  • CGA-YOLO integrates dynamic convolution, CBAM attention, and GhostBottleneck into a lightweight YOLOv12n backbone, significantly enhancing multi-scale feature representation, background suppression, and fine-grained detail retention for small wind turbines in high-resolution remote sensing imagery.
  • The model achieves state-of-the-art performance with an F1-score of 0.93 and mAP50 of 0.938 on the newly curated SDWT dataset, and consistently outperforms existing detectors on the RSOD and VEDAI benchmarks, demonstrating robust generalization across diverse geographic and imaging conditions.
What are the implications of the main findings?
  • The proposed framework provides a reliable and efficient solution for accurate wind turbine inventory and operational monitoring in complex geographical environments, supporting renewable energy infrastructure management.
  • The SDWT dataset and modular design offer reusable resources and generalizable strategies for small-object detection tasks beyond wind turbines, advancing remote sensing applications in energy and environmental monitoring.

Abstract

With the rapid development of high-resolution satellite remote sensing technology, wind turbine detection based on remote sensing imagery has emerged as a crucial research area in renewable energy. However, accurate identification of wind turbines remains challenging due to complex geographical backgrounds and their typical appearance as small objects in images, where limited features and background interference hinder detection performance. To address these issues, this paper proposes CGA-YOLO, a specialized network for detecting small targets in high-resolution remote sensing images, and constructs the SDWT dataset, containing Gaofen-2 imagery covering various terrains in Shandong Province, China. The network incorporates three key enhancements: dynamic convolution improves multi-scale feature representation for precise localization; the Convolutional Block Attention Module (CBAM) enhances feature convergence through channel and spatial attention mechanisms; and GhostBottleneck maintains high-resolution details while strengthening feature channels for small targets. Experimental results demonstrate that CGA-YOLO achieves an F1-score of 0.93 and an mAP50 of 0.938 on the SDWT dataset, and obtains an mAP50 of 0.9033 on both RSOD and VEDAI public datasets. CGA-YOLO establishes its superior accuracy over multiple mainstream detection models under identical experimental conditions, confirming its potential as a reliable technical solution for accurate wind turbine identification in complex environments.

1. Introduction

With the accelerated global transition to renewable energy, wind power has experienced large-scale development in recent years. Global offshore wind capacity, for instance, is projected to expand from 35 GW in 2020 to 382 GW by 2030 [1]. In China, the total installed wind capacity had already exceeded 470 GW by 2024 [2]. The extensive construction and operation of wind farms have created an urgent need for accurate monitoring, which relies on precise target recognition. While remote sensing offers a non-invasive solution [3,4,5], the transition from generic object detection to specialized wind turbine identification is hindered by three domain-specific imperatives: multi-scale structural characterization, environmental noise suppression, and computational scalability.
First, the morphological diversity of turbines across varying spatial resolutions necessitates specialized feature extraction. While high-resolution imagery captures intricate blade-nacelle geometries, medium-resolution data like Sentinel-2 often presents turbines as sub-pixel anomalies [6]. Consequently, research has shifted toward geometry-aware and attention-driven frameworks. Integrating Convolutional Block Attention Modules (CBAM) into YOLOv5 [7]/and YOLOv8 [8,9] enhances small-target saliency via feature recalibration, while YOLOv9 [10] and multi-view architectures like EGRN-YOLO [11] facilitate perspective-invariant learning to mitigate information loss in heterogeneous terrains. Second, spectral-spatial heterogeneity in deployment environments induces significant target-background ambiguity [12]. Wind farms span diverse landscapes, from specular marine glint to cluttered agricultural fields. In offshore contexts, hybrid CNN-Mamba architectures [13] and imaging geometry-aware CNNs [6] exploit long-range dependencies to counter seasonal spectral fluctuations. Conversely, onshore detection utilizes saliency models [14] and multi-scale feature pyramids [8] to differentiate metallic reflectance from environmental noise [15], underscoring the necessity of context-aware spectral analysis [16,17]. Third, large-scale geospatial analytics require a rigorous balance between detection efficacy and computational throughput. Integrating deep learning with cloud platforms like Google Earth Engine (GEE) [16] facilitates synoptic surveys, but demands accelerated inference engines and optimized architectures [17]. These advancements, such as the CDB-integrated YOLO frameworks [9], demonstrate that high-fidelity identification of sparse turbine distributions can be achieved without compromising the high-throughput processing speeds required for domestic satellite big data streams.
Finally, limited model generalization is exacerbated by the scarcity of datasets specifically tailored for wind turbine detection. While general-purpose benchmarks like DOTA [18] and VisDrone focus on generic small objects, recent efforts have introduced dedicated wind turbine datasets such as WindTurbineNet and LEVIR-WT. These new datasets, sourced from diverse remote sensing platforms, provide larger-scale annotations and cover a broader range of geographical scenarios [19]. To provide a clearer overview of the existing landscape, we systematically summarize the key characteristics of publicly available wind turbine datasets in Table 1.
Despite this progress, challenges persist. The backgrounds in existing collections may still lack the full complexity and variation of real-world deployment environments, and models trained on them can struggle with severe “target-background aliasing” in unseen scenes [20]. Our SDWT dataset offers clear complementarity to these benchmarks. Unlike LEVIR-WT, which is predominantly mountainous or marine, SDWT uniquely focuses on targets situated within agricultural and vegetated environments. This targeted design enables the evaluation of a model’s ability to perceive discriminative features of typical small-scale targets within complex natural backgrounds, bridging the generalization gap toward robust, real-world application.
Dataset for wind turbines (SDWT), covering multiple types of geographical backgrounds to enhance the model’s generalization capability across diverse environments. On this basis, an improved CGA-YOLO detection model is proposed. Using YOLOv12n as the baseline, the model is optimized primarily at three key stages: dynamic convolution is introduced at the front end of the backbone network to improve the adaptability of initial feature extraction; a Convolutional Block Attention Module [21] (CBAM) is embedded in the deeper layers of the network to enhance focus on key features of small targets and suppress background interference; and a GhostBottleneck structure is adopted in the detection head to retain fine-grained features while maintaining lightweight efficiency. These designs collectively improve the model’s ability to discriminate subtle structures of wind turbines and complex scenes, ensuring accuracy while balancing computational efficiency.
The main contributions of this article are listed as follows.
(1)
An efficient small object detector is designed for remote sensing applications. Compared with various benchmark models and current state-of-the-art methods, CGA-YOLO demonstrates superior performance in small object detection tasks and holds potential for future large-scale industrial application.
(2)
Three innovative plug-and-play modules are proposed: the feature extraction dynamic module, the feature fusion module CBAM, and the low-cost feature generation module GhostBottleneck. These modules enhance the network’s ability to suppress complex backgrounds, improve feature enhancement capability, and retain fine-grained features with high efficiency and low cost. They can be embedded into any detection network as general modules to enhance the feature representation of small objects and suppress confusing background information.
(3)
A new small object dataset named SDWT is constructed based on GF-2 remote sensing images. Small objects constitute over 99% of this dataset, which includes a large number of target samples under challenging conditions such as low illumination, mountain vegetation, lake water, and plain farmland backgrounds. Furthermore, SDWT contains various test subsets with interferences including cloud occlusion, image blur, and stripe noise, making it suitable as a reference dataset for wind turbine small object detection tasks in the field of remote sensing.

2. Materials and Methods

2.1. Overview of the Study Area

(1)
SDWT Dataset
Most publicly available datasets are designed for general object detection tasks and lack dedicated samples for medium- and small-sized targets such as wind turbines. This limitation hinders a comprehensive evaluation of a model’s feature extraction and detection capabilities for these specific objects. To address this gap and to rigorously validate the performance of the proposed model for wind turbine detection, this study constructed the Shandong Wind Turbine (SDWT) dataset. The following is a detailed description of this dataset.
The SDWT dataset is based on GaoFen-2 (GF-2) satellite imagery of Shandong Province, with a spatial resolution of 1 m. This resolution permits the clear identification of key structural components of wind turbines, including blades and towers. During data preparation, original images with heavy cloud cover or poor imaging quality were first excluded to ensure data quality. Subsequently, based on the spatial distribution patterns of wind turbines, the remaining images were cropped into sub-images of 1024 × 1024 pixels, with each sub-image containing at least one complete or partially visible turbine.
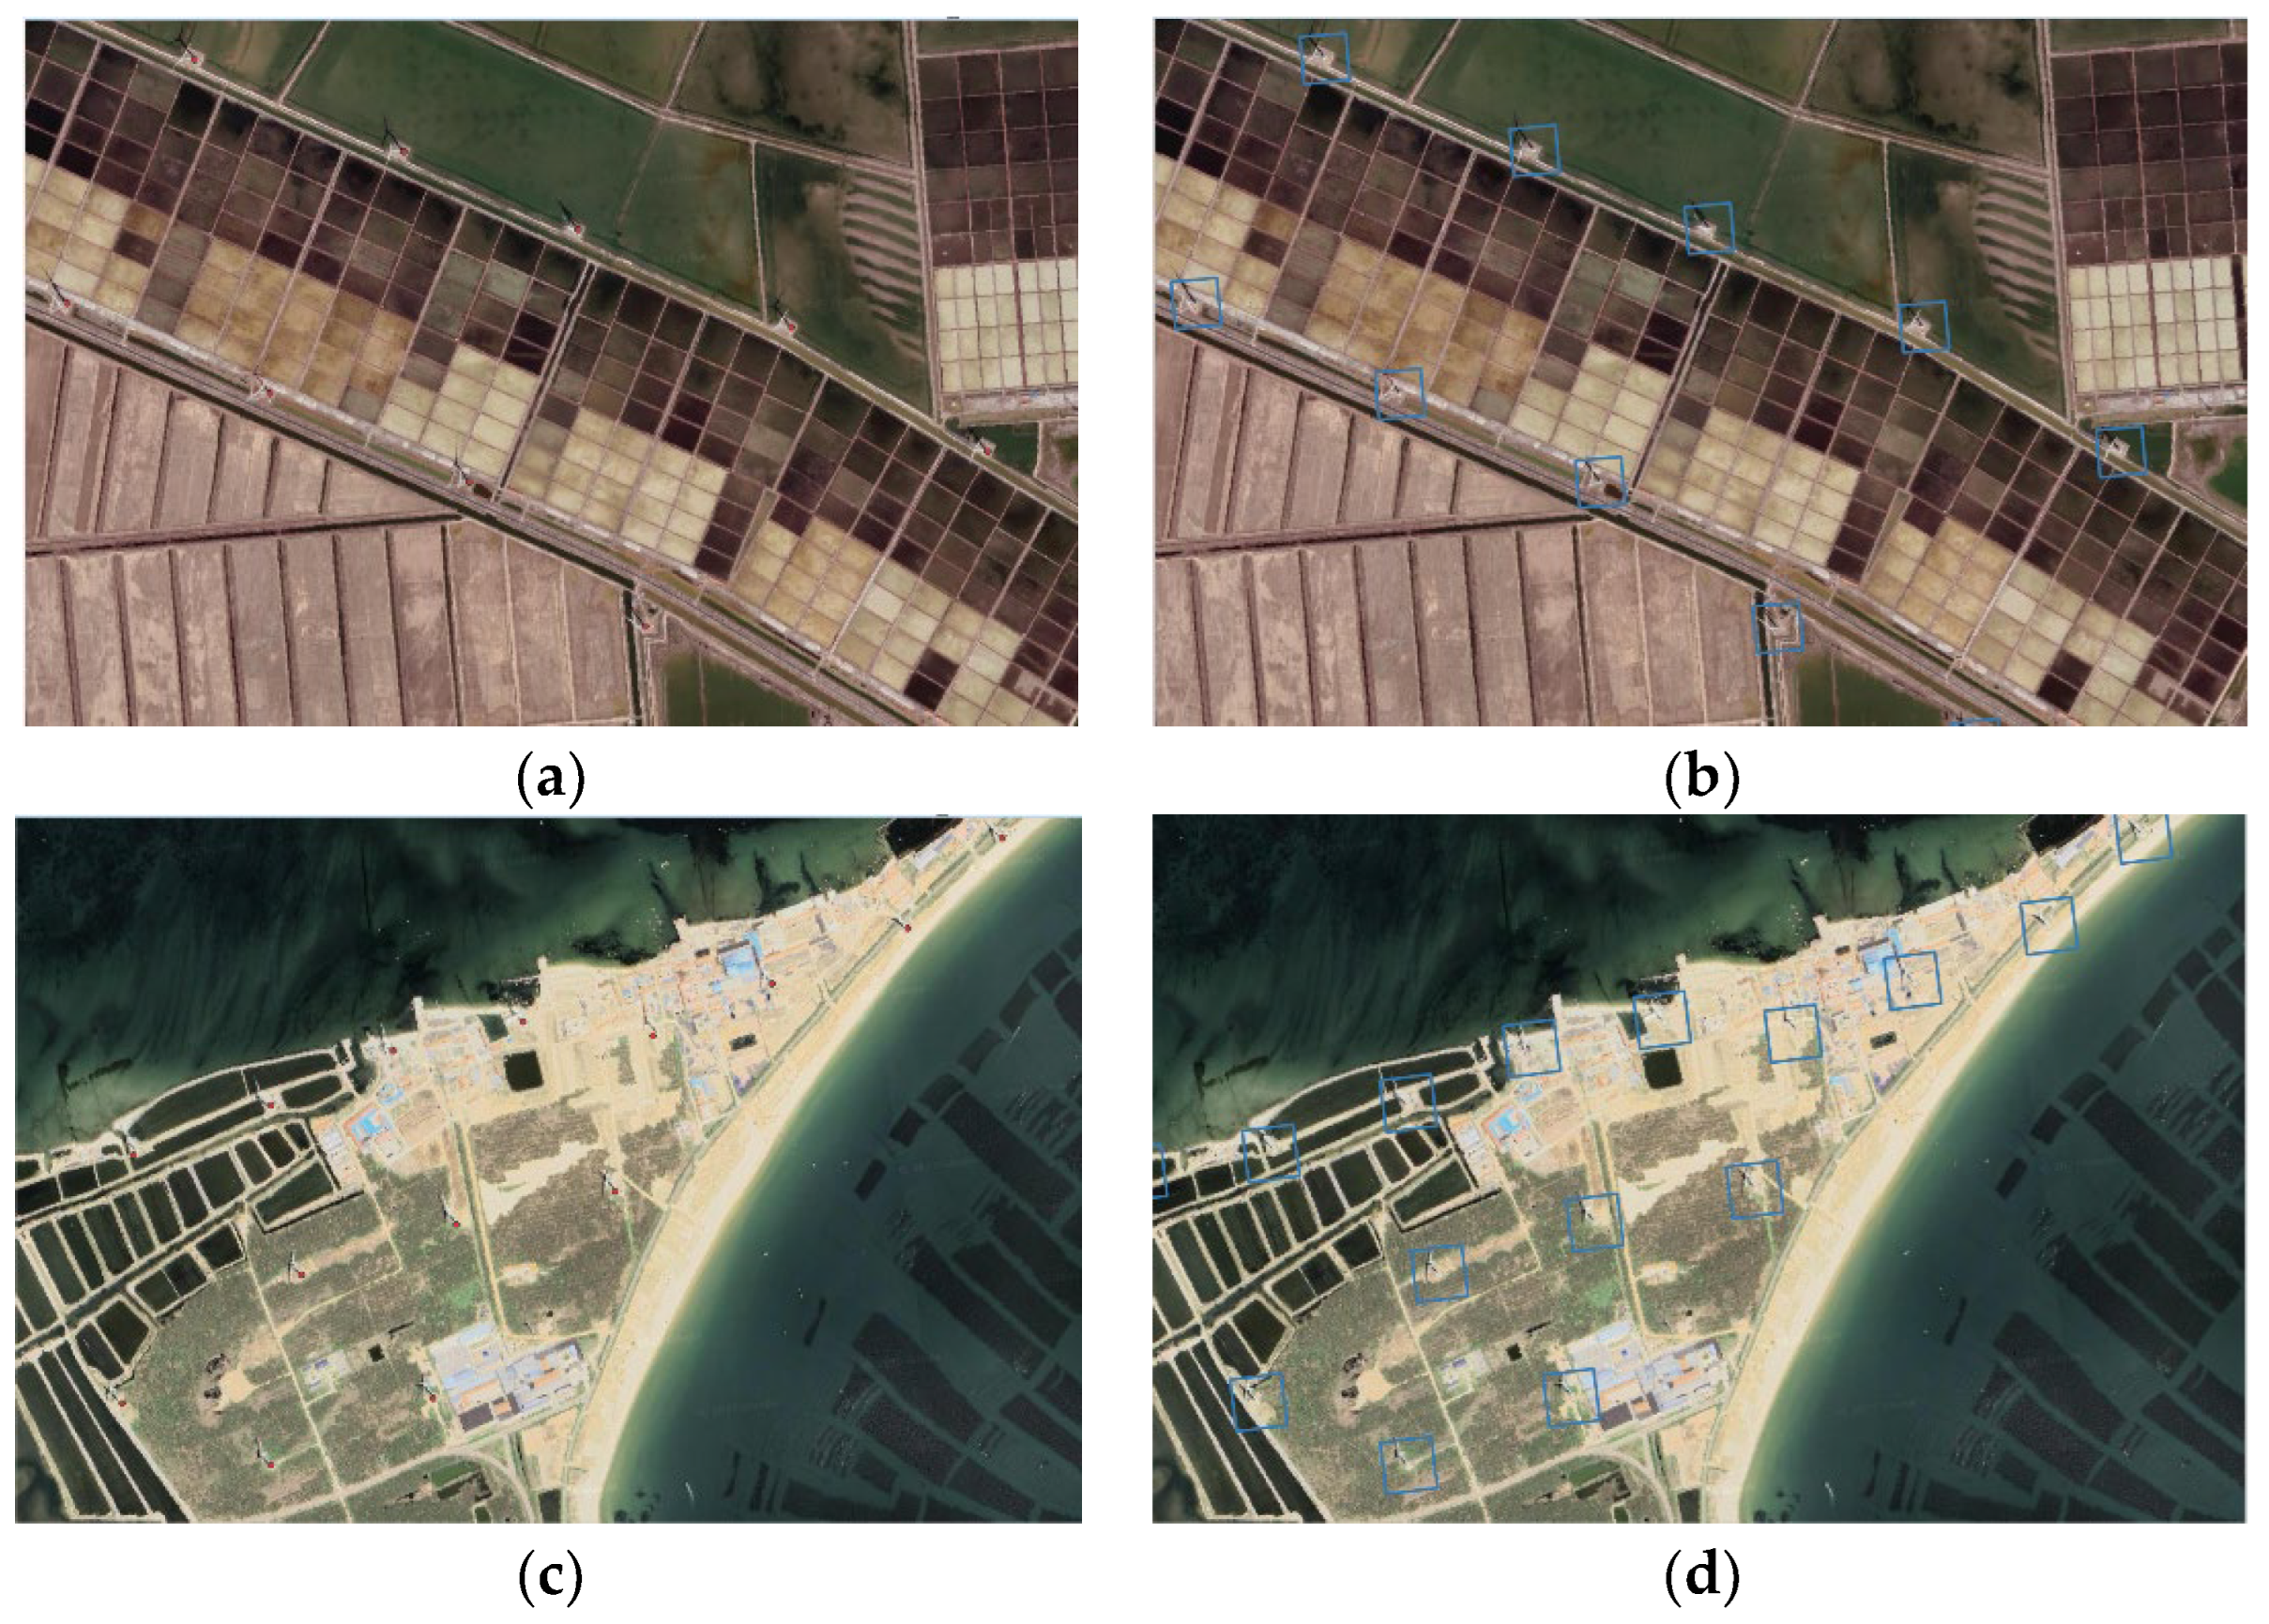
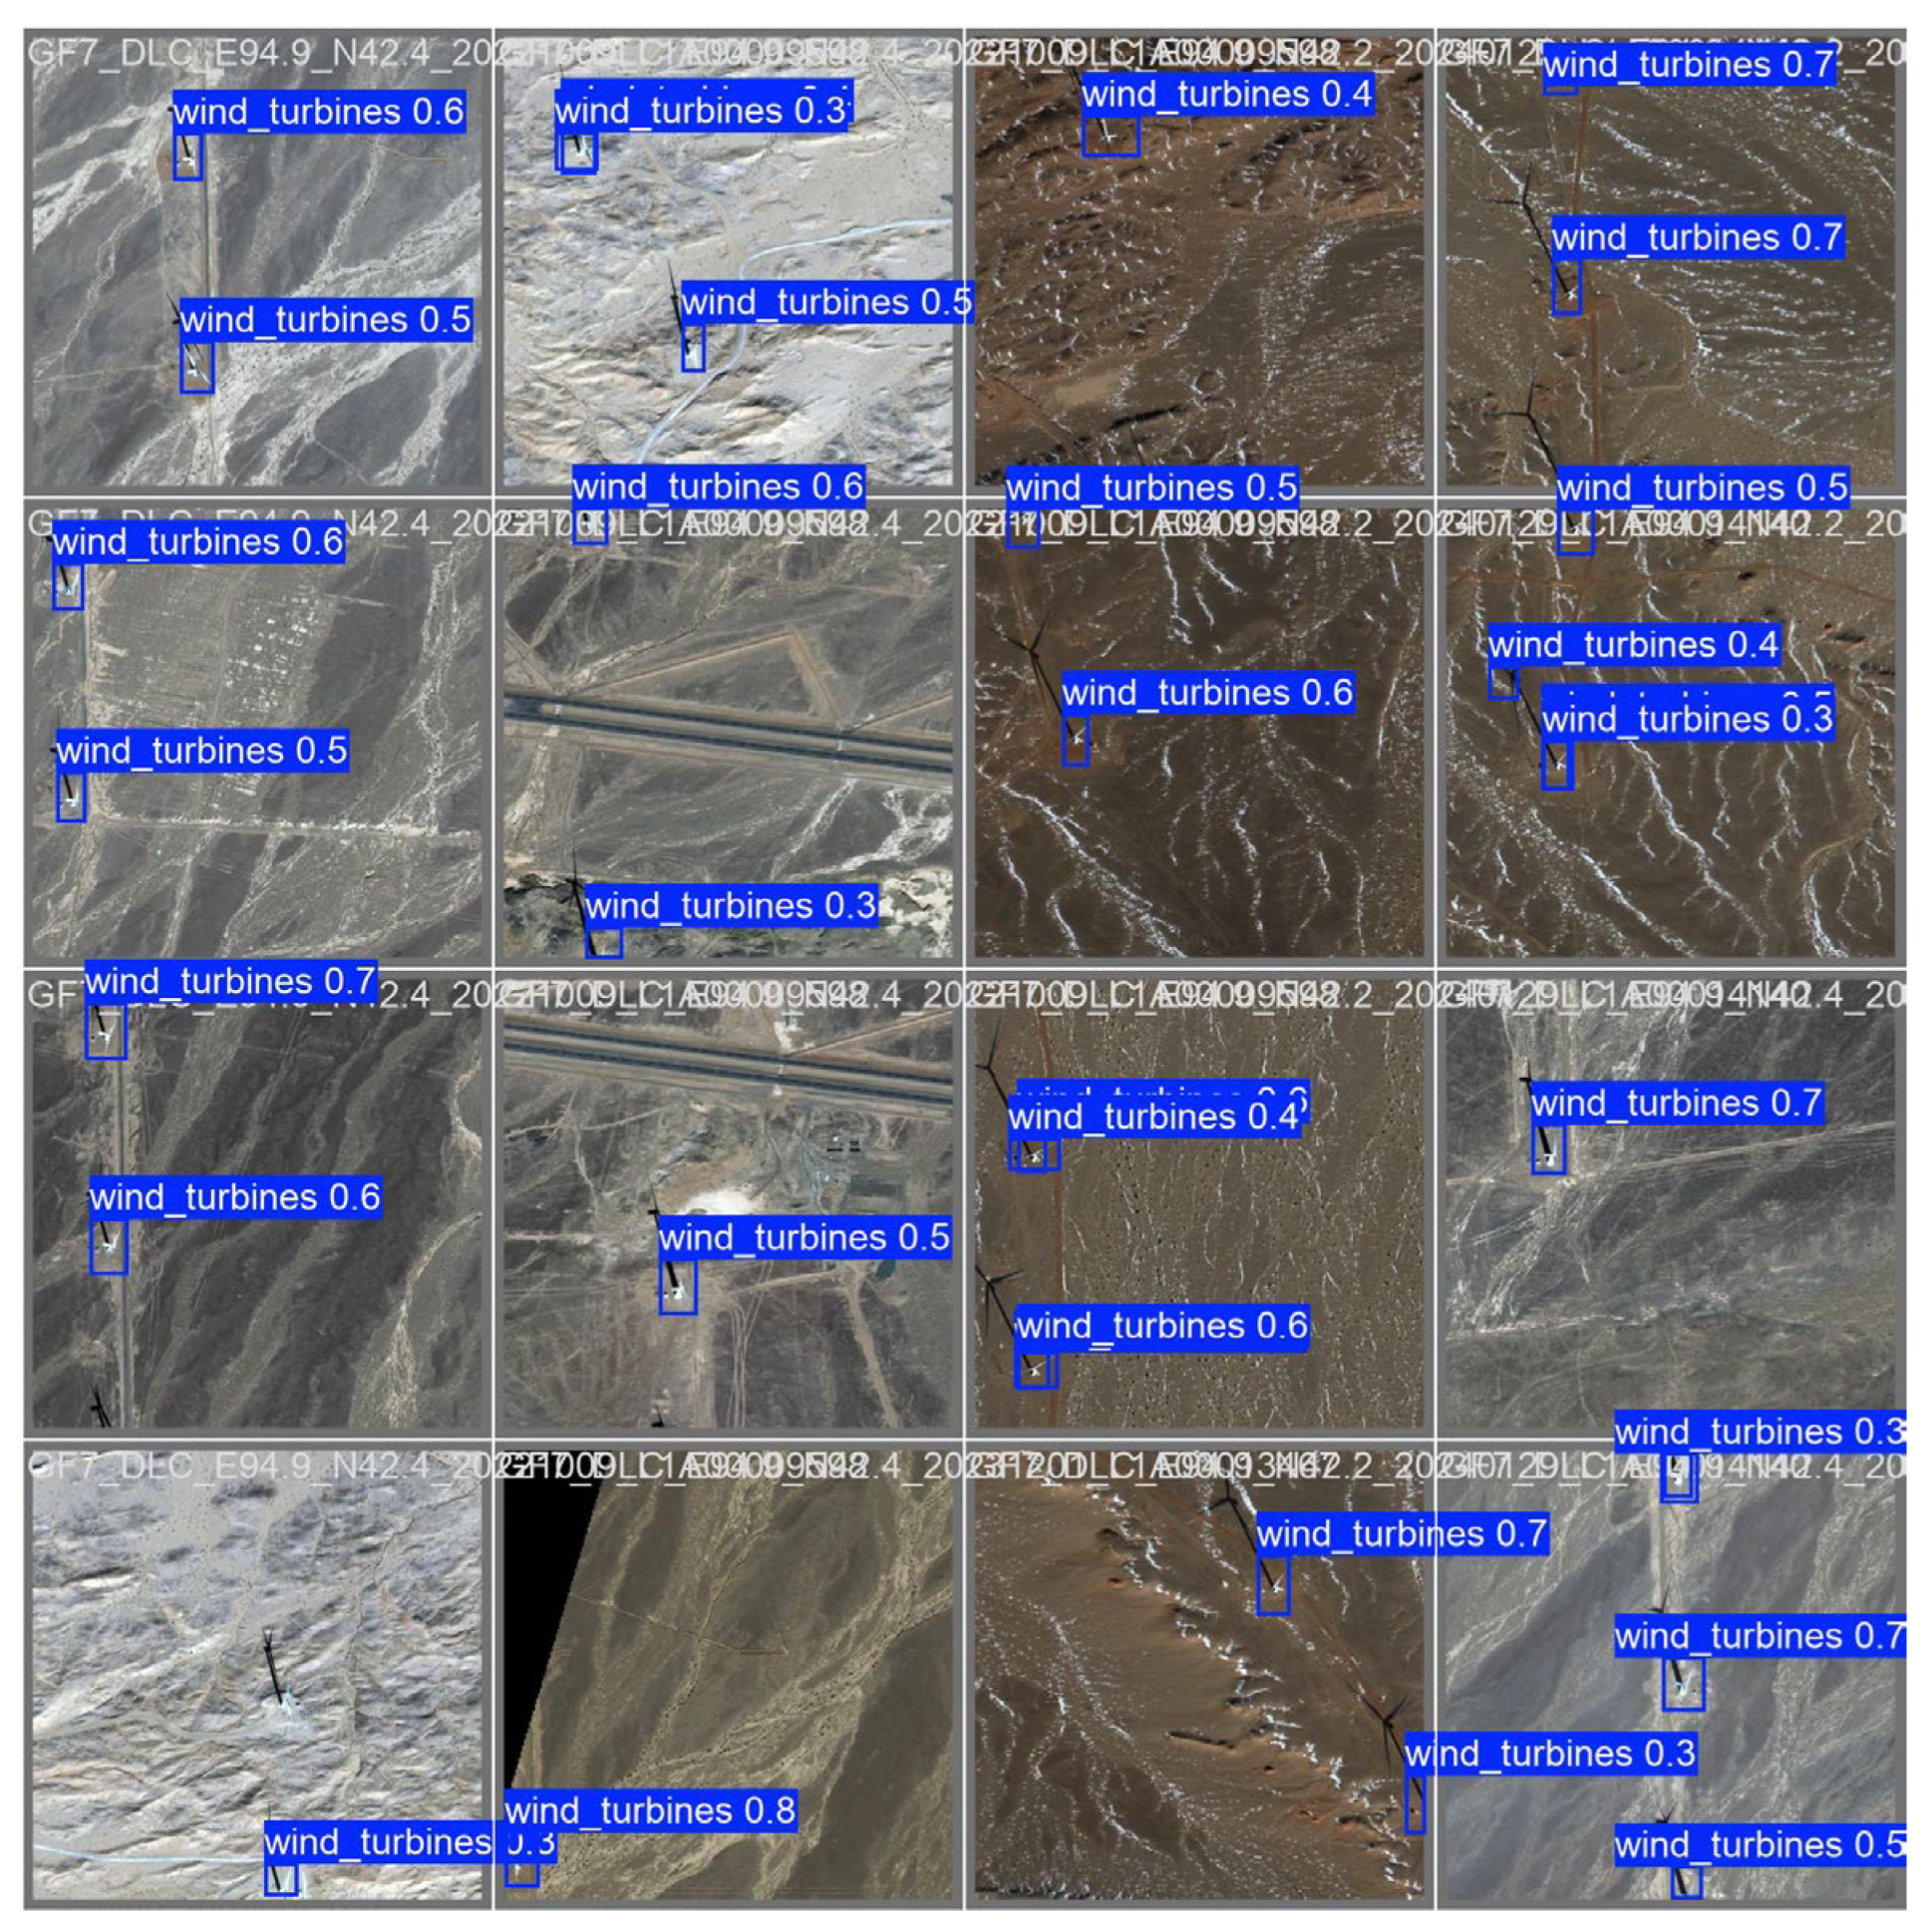
Annotation followed the PASCAL VOC standard and combined semi-automatic pre-annotation with manual refinement. Initial bounding boxes were generated from wind turbine coordinates obtained from OpenStreetMap. These boxes were then manually adjusted in position and size to accurately delineate each target and define its category and boundaries, achieving a verified annotation accuracy exceeding 95%. To enhance data diversity and improve model generalization, several augmentation techniques were applied, including random flipping, rotation, brightness adjustment, Gaussian blur, and noise addition [22]. The geographic distribution of annotated wind turbines within the study area is shown in Figure 1, and example annotations are presented in Figure 2.
Benefiting from this systematic construction process and the inherent siting characteristics of wind farms—which are typically located in open areas with minimal obstructions—the wind turbine targets in the SDWT dataset predominantly appear as complete and independent structures with rare occlusion. This makes the SDWT dataset a targeted, accurately annotated, and high-quality resource specifically designed for training and evaluating wind turbine detection models.
This study constructs the Shandong Wind Turbine (SDWT) dataset, aiming to provide a specialized benchmark for detecting medium- and small-sized wind turbines in high-resolution satellite imagery. The dataset comprises 7467 valid images containing 10,265 wind turbine instances. To ensure reliable evaluation, it is divided into training, validation, and test subsets in an approximate ratio of 6:3:1. The training samples encompass turbines in various geographical environments, capturing morphological variations and providing essential scene diversity for model learning.
Statistical analysis of the annotated targets reveals the core distribution characteristics of the dataset. In terms of scale, following commonly used criteria, small-sized targets account for 72.08% and medium-sized targets for 27.92%, clearly establishing small- and medium-sized targets as the main focus. The average width and height of the bounding boxes are 17.2 pixels and 13.5 pixels, respectively, with an average area of approximately 232.2 pixels2 and a mean aspect ratio of 1.28, indicating an overall regular and slightly elongated horizontal rectangular shape. The average target density is 1.38 instances per image, presenting a typical low-to-medium density distribution, which effectively avoids potential interference from excessively dense annotations during model training. All images have been uniformly processed to a standardized size of 1024 × 1024 pixels.
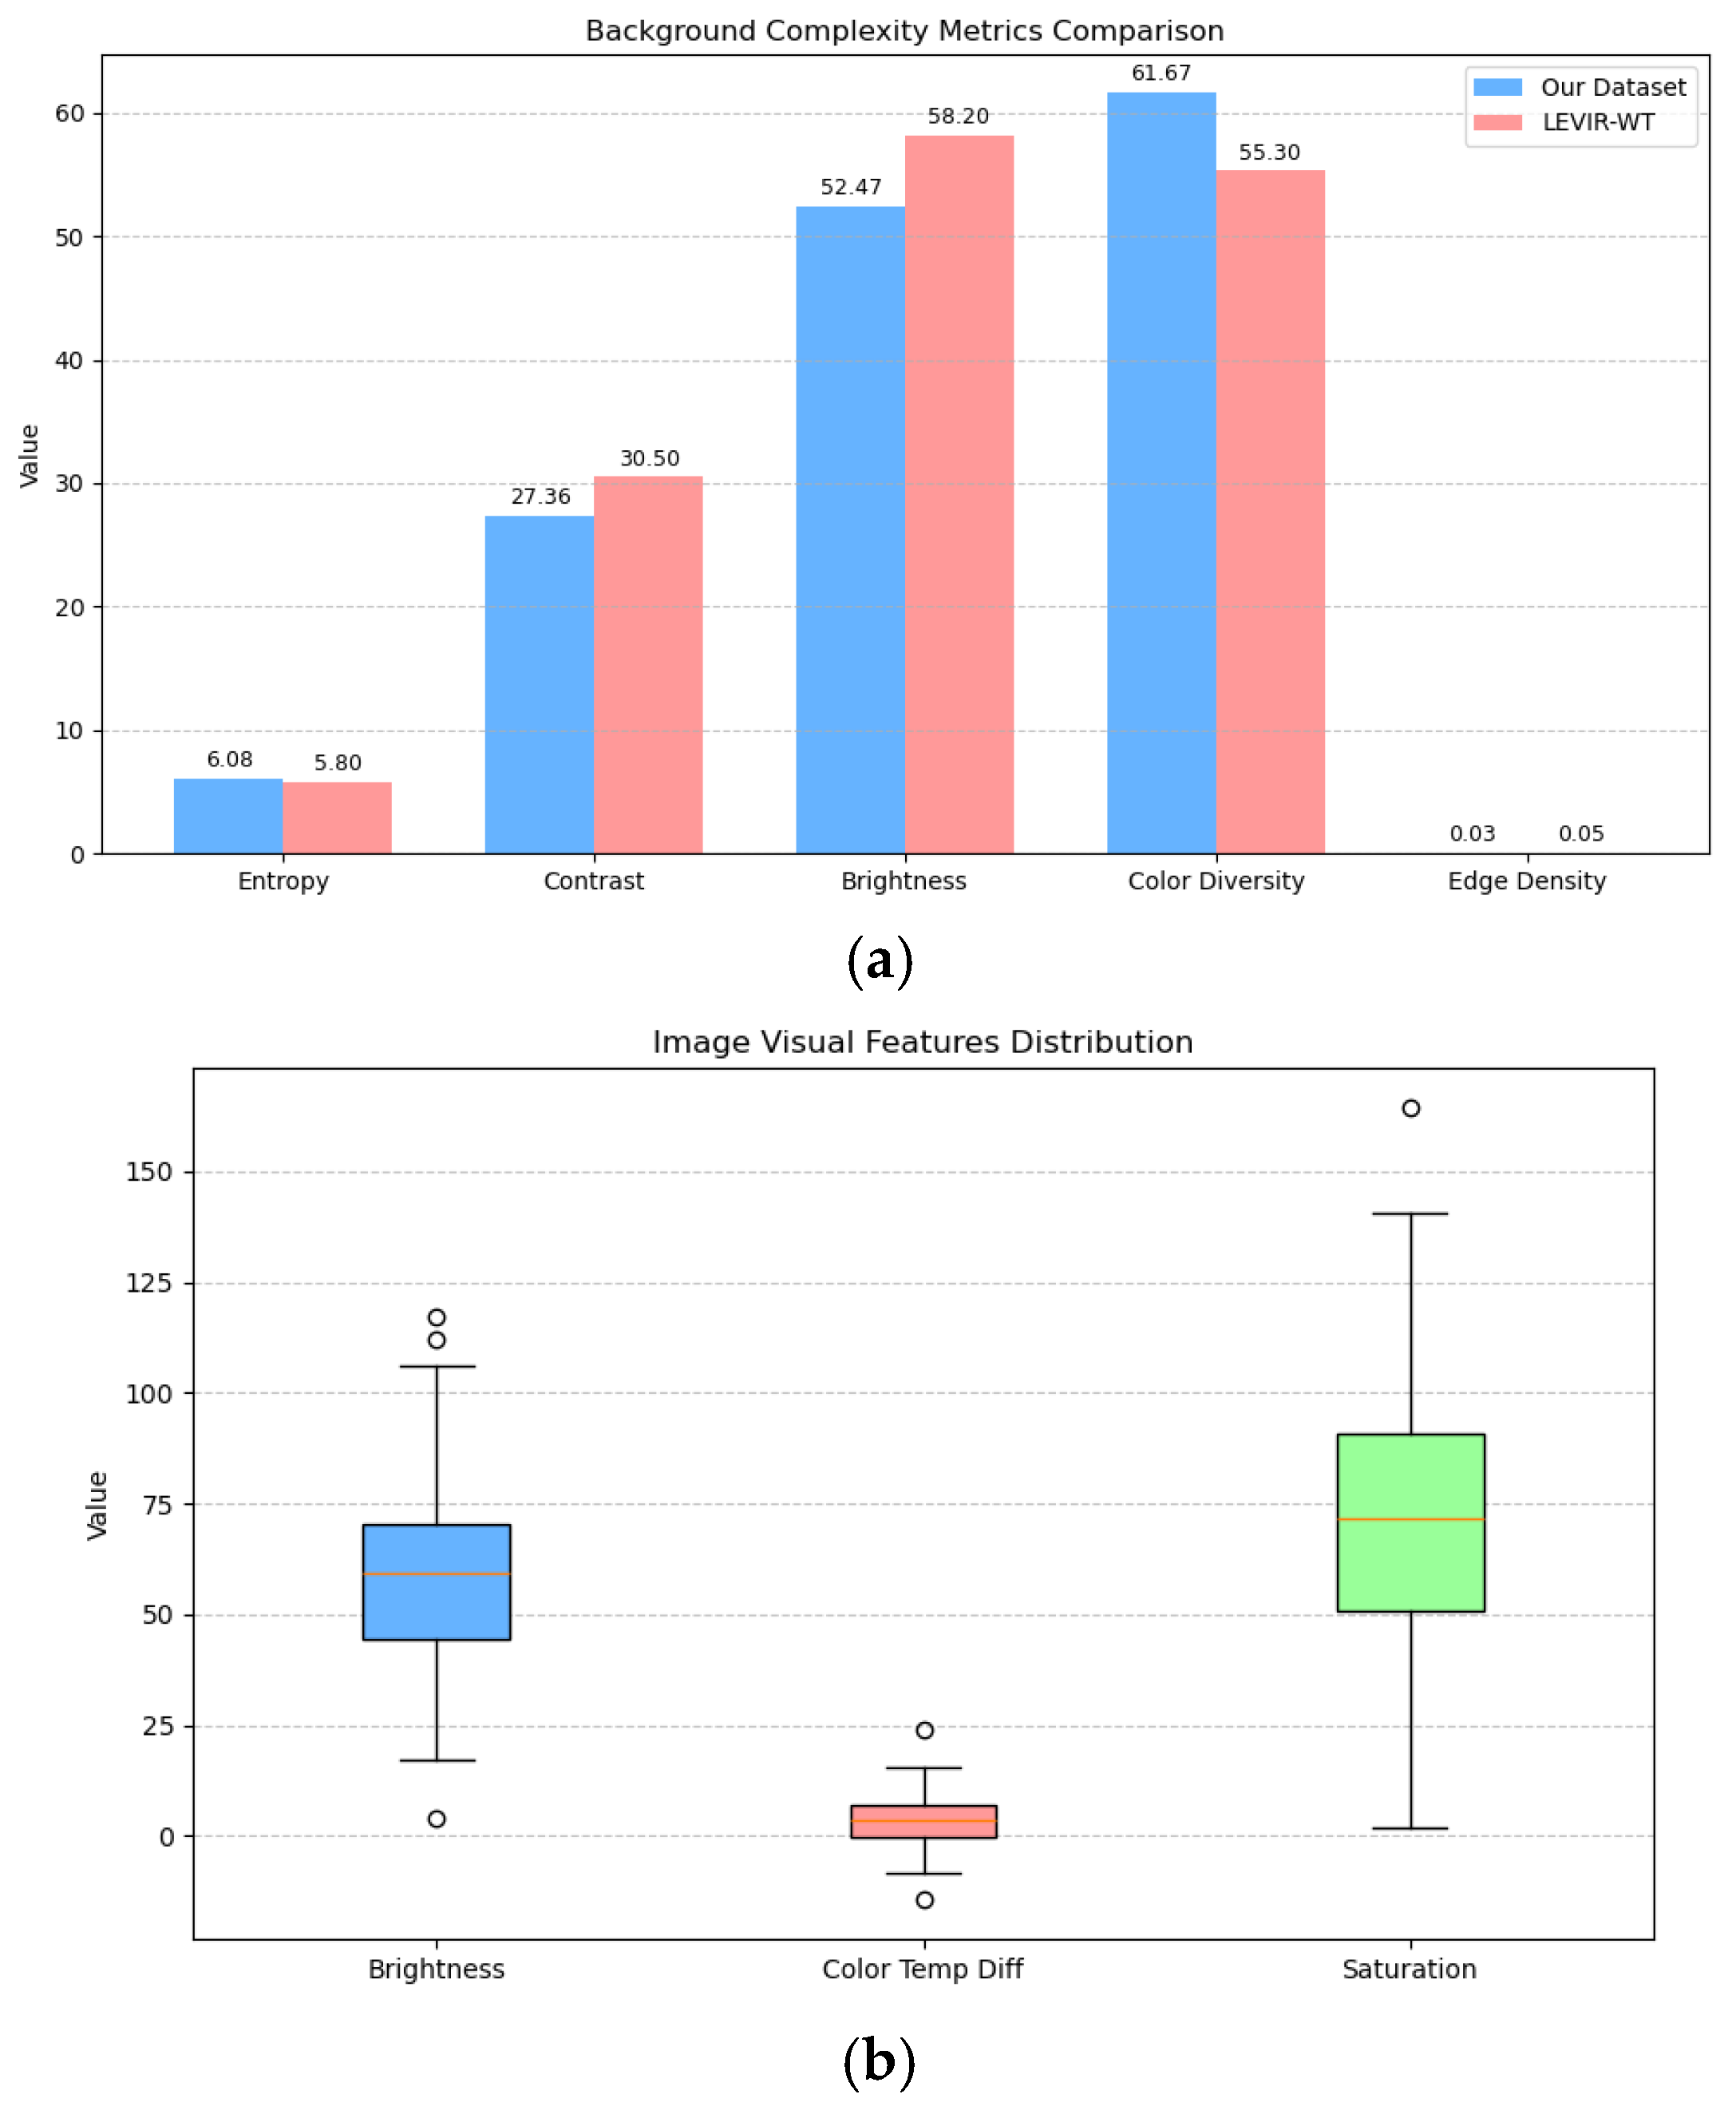
To further quantify the environmental characteristics of the dataset, a multi-dimensional analysis of background complexity was conducted. Color distribution statistics show that the dataset background is predominantly yellow-green (accounting for 56%), corresponding to vast vegetation and farmland scenes, while red-blue backgrounds constitute approximately 26%. Regarding texture complexity, the average image information entropy and contrast are 6.08 and 27.36, respectively, indicating a medium level of background complexity. Furthermore, the average overall edge density and distractor density are at a low level (approximately 0.03), suggesting minimal structural interference in the background, which is conducive to target separation. Visual feature analysis reveals that the images exhibit uniform brightness, an overall warm tone, relatively high saturation, and approximately 69% depict spring or autumn landscapes. In summary, the SDWT dataset exhibits a distinct characteristic profile: it is centered on small- and medium-sized targets, embedded in backgrounds of medium complexity dominated by agricultural and natural vegetation, and primarily consists of high-saturation, warm-toned imagery from spring and autumn seasons.
This characteristic profile offers clear complementarity with existing mainstream wind turbine datasets. As shown in the following Figure 3, compared to datasets like LEVIR-WT [8,23], whose backgrounds are predominantly mountainous or marine, and WindTurbineNet [13,24], which covers a very wide range of target scales, SDWT uniquely focuses on wind turbine targets that are primarily small- to medium-sized and situated within agricultural and vegetated environments. This targeted design enables it to specifically evaluate a model’s ability to perceive discriminative features of typical small-scale targets within complex natural backgrounds [25].
In conclusion, the SDWT dataset ensures its high quality and diversity through a rigorous construction process, precise annotation (with verified accuracy exceeding 99%), and systematic augmentation strategies. Its core value lies in filling the gap for region-specific, agriculturally-contextualized wind turbine detection data, providing crucial training and evaluation resources to enhance model generalization performance in such scenarios. In the future, this dataset can be further extended by incorporating more seasonal and weather-variant imagery or introducing fine-grained component annotations, thereby forming a more comprehensive wind turbine analysis framework.
(2)
VEDAI Dataset
The VEDAI dataset consists of aerial imagery from the Utah AGRC collection, with original images of approximately 16,000 × 16,000 pixels at 12.5 cm ground resolution. Only the RGB version is used in this work, following the official train-test split. Categories containing fewer than 50 instances (e.g., planes, motorcycles) are excluded. Our experiments focus on the same eight object categories as those evaluated in YOLO-fine and SuperYOLO.
(3)
RSOD Dataset
The RSOD dataset contains real high-resolution remote sensing images (from both satellite and aerial platforms) featuring four common ground-object categories: aircraft, oil tanks, playgrounds, and overpasses. Each category exhibits diversity in quantity and scene distribution. Specifically, the dataset includes 446 images with 4993 aircraft instances, 165 images with 1586 oil tanks, 189 playground images with 191 instances, and 176 overpass images with 180 instances. Image resolutions reflect realistic remote sensing characteristics (e.g., 0.3 m/pixel for oil tanks, 0.5–2 m/pixel for aircraft), capturing authentic scale variations. The imagery presents complex backgrounds containing vegetation, buildings, and water bodies, accompanied by precise bounding-box annotations that support both classification and localization in detection tasks.

2.2. Methods

This study selects YOLOv12n as the benchmark framework because, compared to the more recent YOLOv13, it possesses a higher parameter count and demonstrates the ability to maintain satisfactory detection accuracy in small-object detection tasks. The overall architecture of the proposed CGA-YOLO is illustrated in Figure 1. The modifications introduced to the baseline YOLOv12n can be summarized as follows. First, in the backbone network for feature extraction, the standard subsampling operation is replaced with a dynamic convolution module. Second, a Convolutional Block Attention Module (CBAM) is incorporated after the dynamic convolution stage to enhance both channel and spatial information, thereby improving the network’s capacity to discern and prioritize discriminative features. Finally, the detection head is redesigned based on the principles of dynamic convolution, which contributes to further accuracy gains. Detailed descriptions of these modules are provided in Section 3.2.

2.2.1. CGA-YOLO Architecture

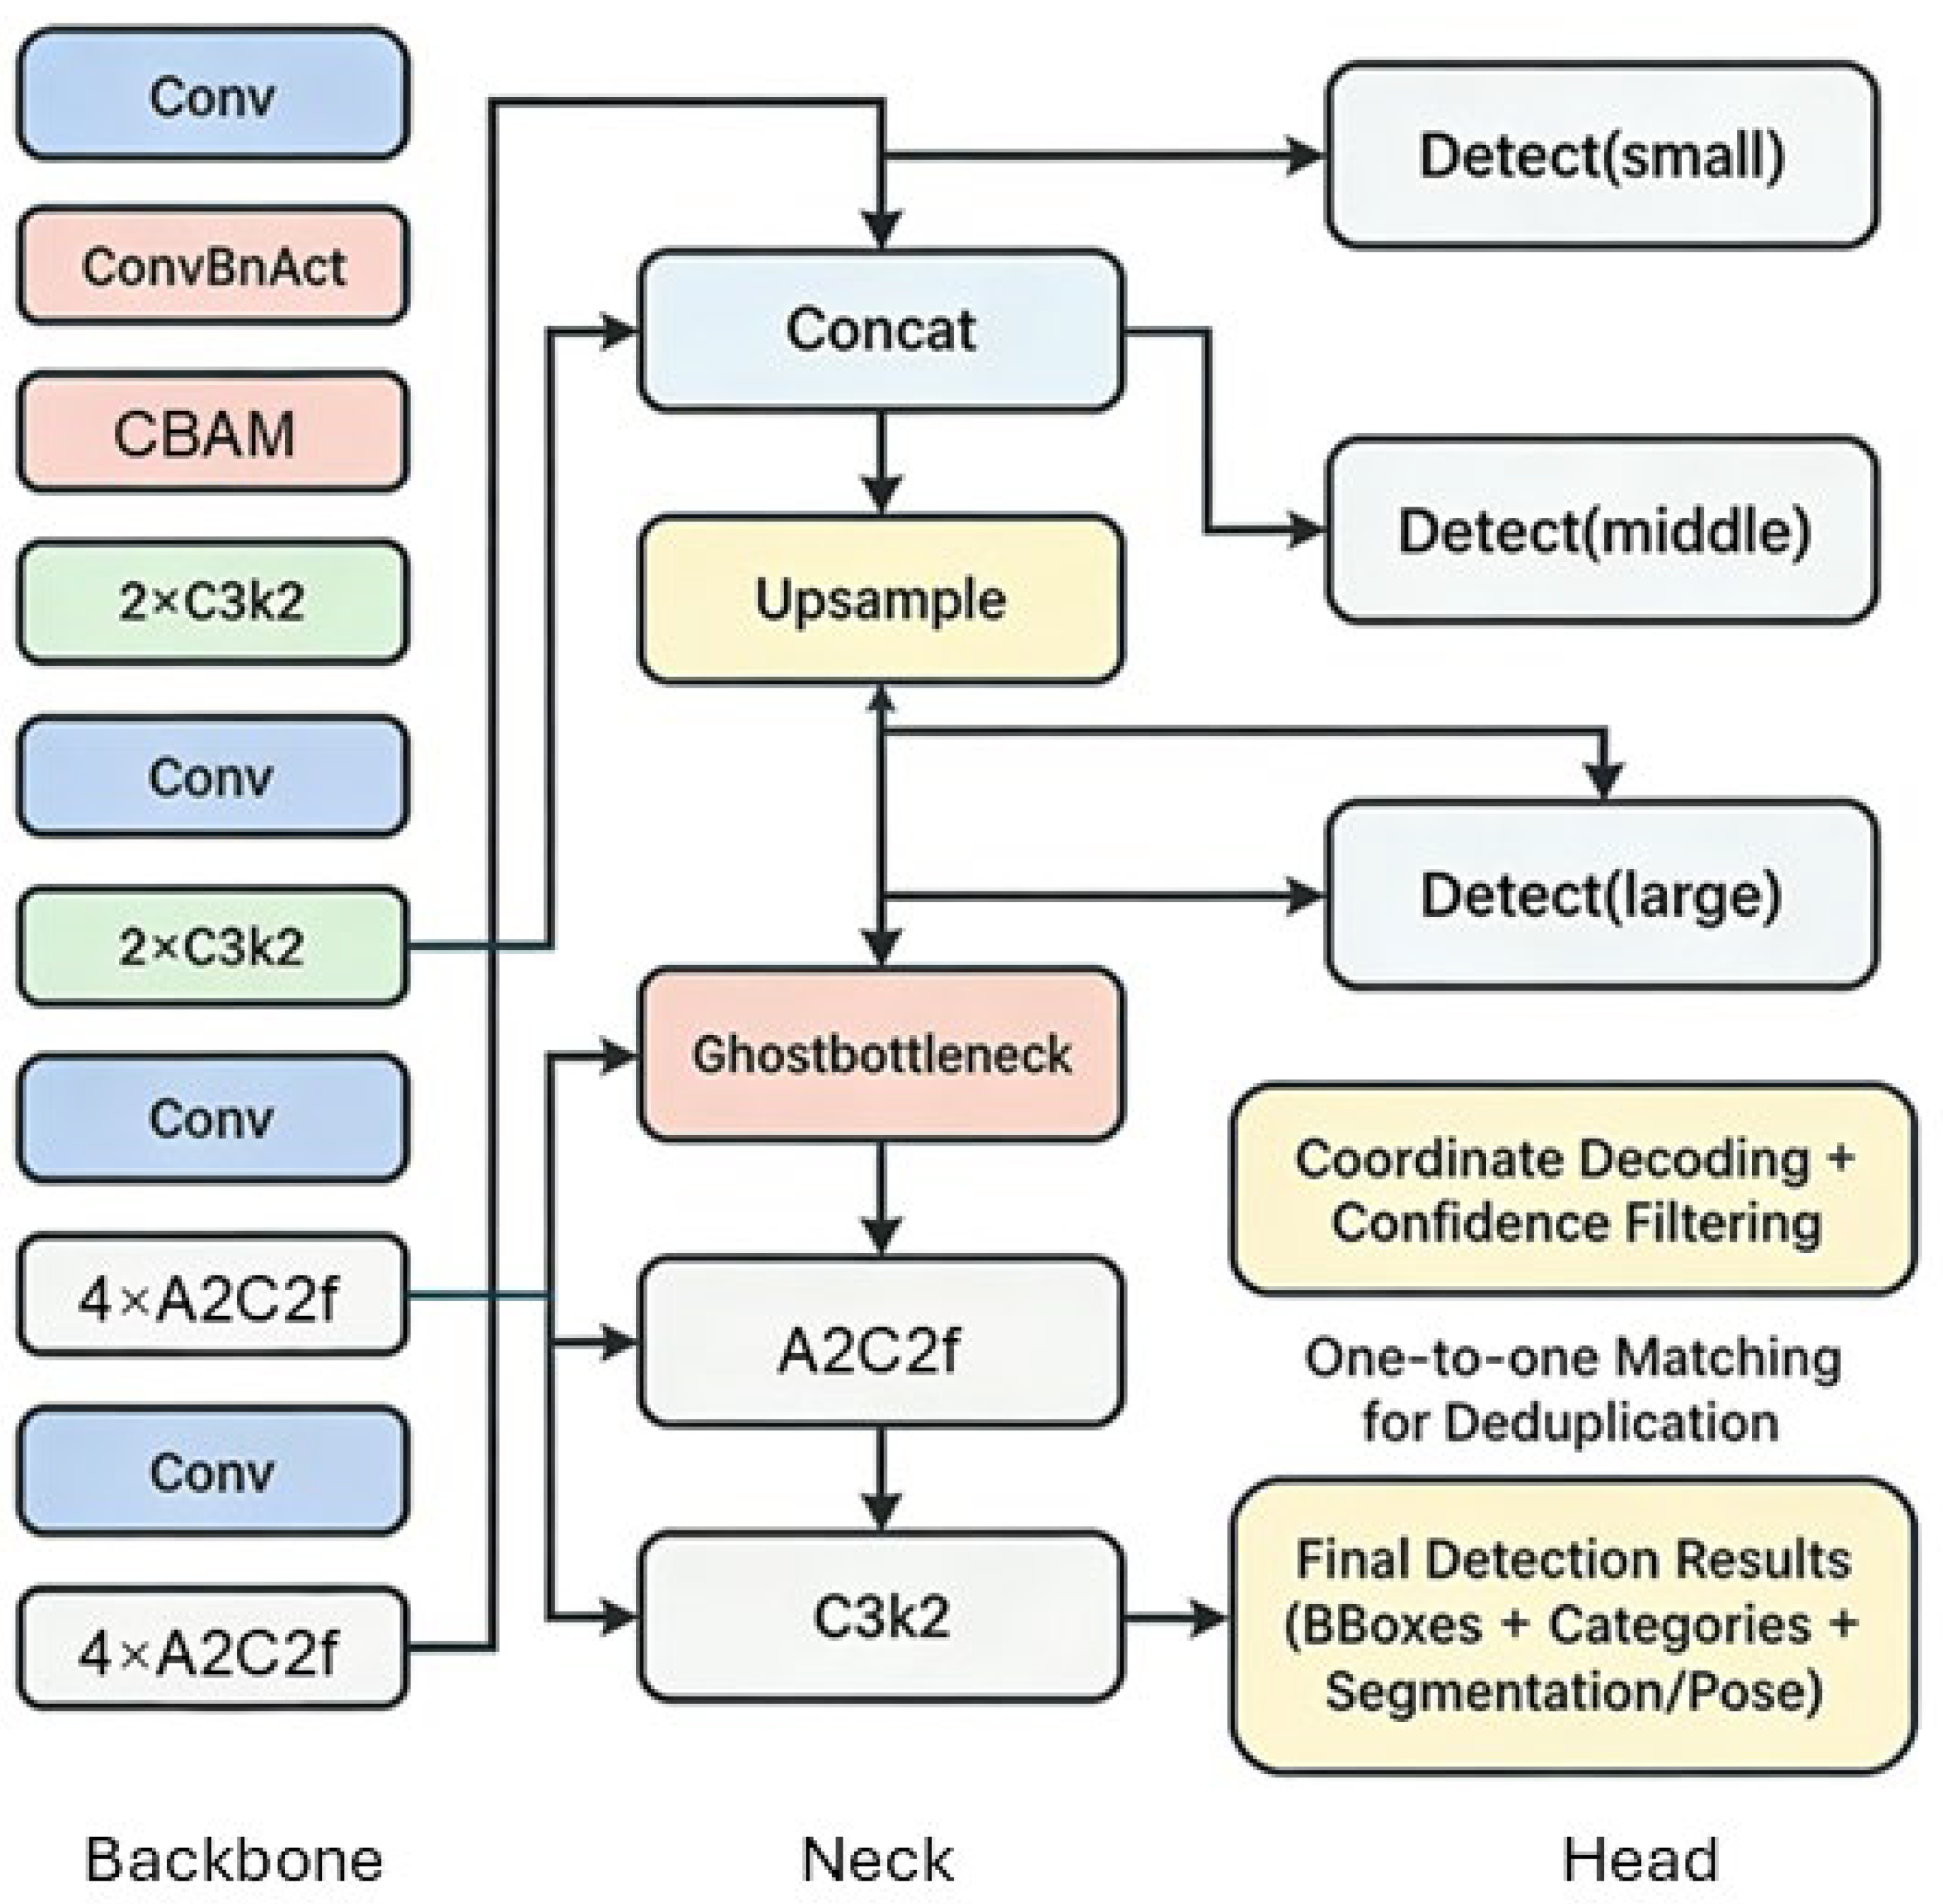
To address the core challenges of wind turbine detection in remote sensing imagery—namely, significant scale variation, complex background interference, and the accuracy-speed trade-off—this study proposes CGA-YOLO. The model enhances the baseline architecture through three integrated modules:
First, a Convolutional Block Attention Module (CBAM) is introduced at the early stage of the backbone. It employs channel and spatial attention to dynamically highlight discriminative features of multi-scale turbines while suppressing background clutter, directly mitigating issues related to scale diversity and scene complexity.
Second, Dynamic Convolution replaces select static convolutions. By adapting kernel weights to input features, it improves the extraction of fine structural details (e.g., blades and towers), enhancing robustness in visually ambiguous scenarios.
Finally, GhostBottleneck modules are incorporated to redesign the network with a lightweight strategy. They maintain representational capacity through efficient linear feature generation, significantly reducing parameters and computation while preserving accuracy, thereby facilitating real-time inference suitable for onboard deployment.
Together, these modules form a cohesive detector that balances high precision, strong robustness, and operational efficiency for wind turbine monitoring in remote sensing applications. The network structure is illustrated in Figure 4, and the parameter configuration of each layer is presented in Table 2.

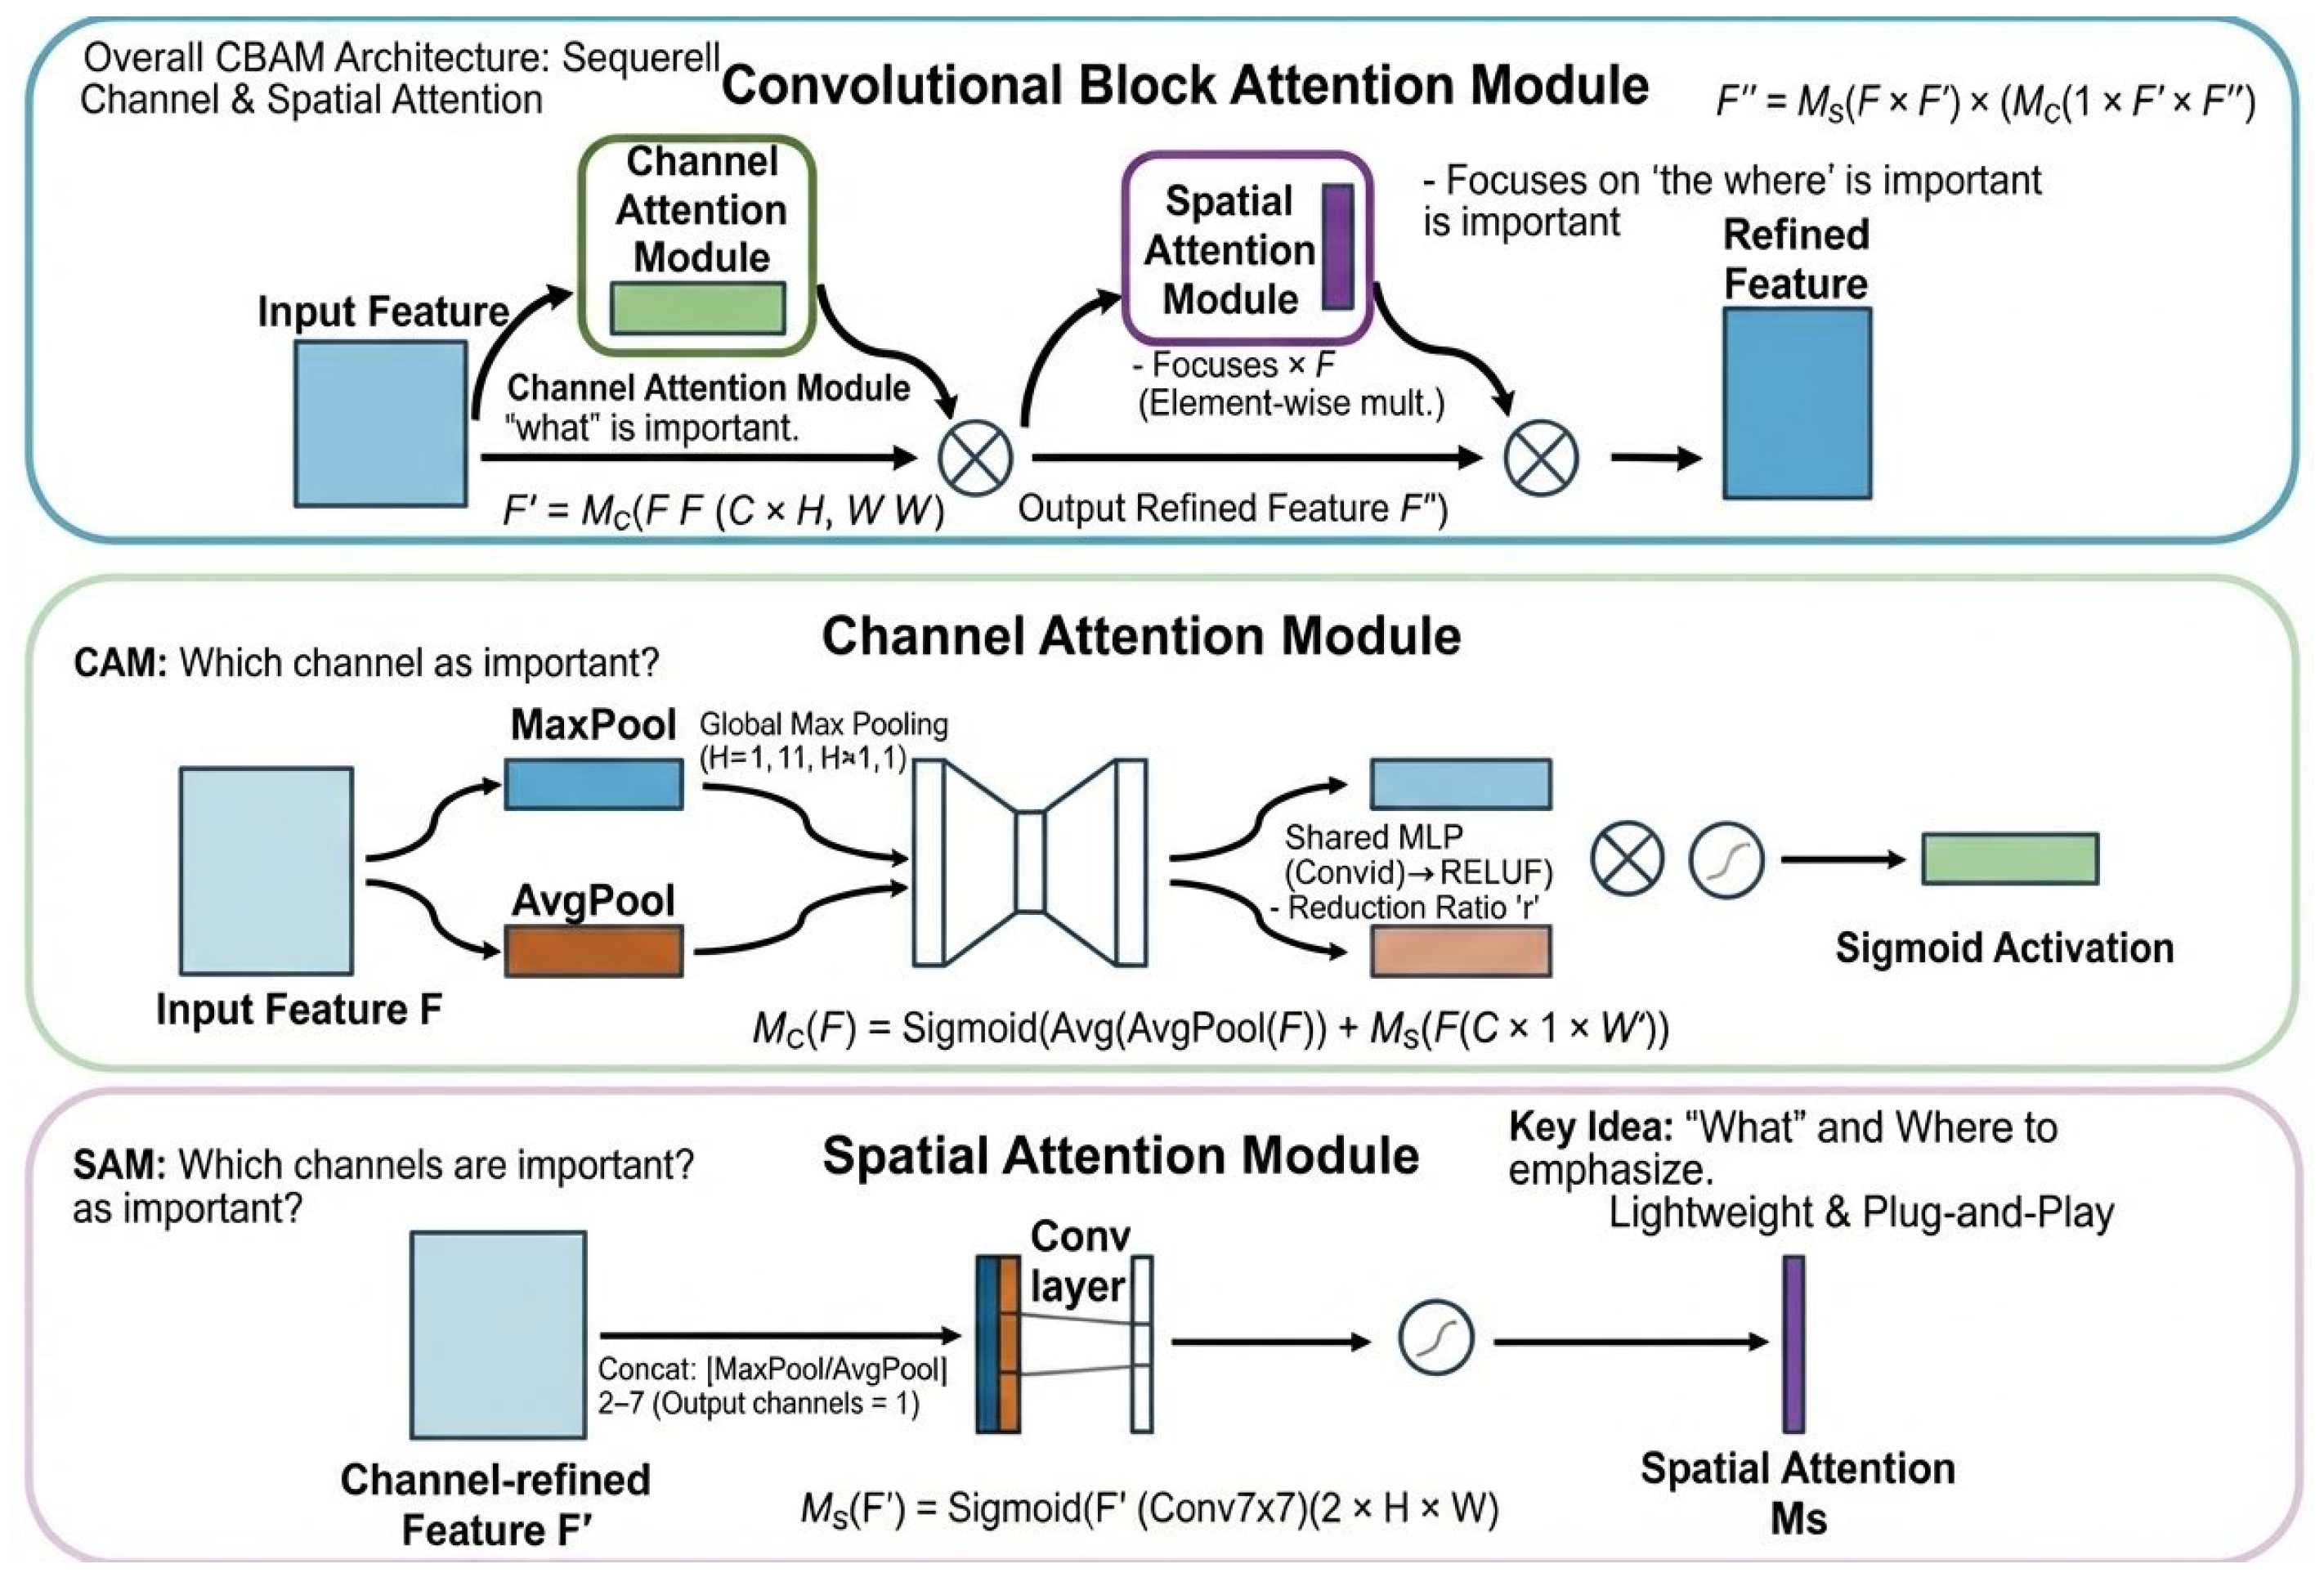
2.2.2. Convolutional Block Attention Module (CBAM)

Small targets occupy only a limited pixel area in an image, resulting in sparse and weak visual features. After multiple layers of convolutional downsampling, these features can easily be diluted or obscured by background information or features of larger objects, hindering effective network learning. To address this issue, the CBAM feature enhancement module proposed in this work strengthens small-target features from two complementary perspectives. First, to mitigate the weakness and difficulty in extracting small-target features, the channel attention module evaluates which feature channels are most sensitive to such targets, emphasizing underlying channels responsible for fine details such as edges and corners. Second, to reduce background interference and false detections, the spatial attention module learns to focus the feature response on spatial regions most likely to contain the target [21].
Given an intermediate feature map F R C × H × W as input, as illustrated in Figure 5, the Convolutional Block Attention Module (CBAM) sequentially infers a 1D channel attention map M C R C × 1 × 1 and a 2D spatial attention map M S R 1 × H × W . The overall refinement process can be summarized as:
F = M c ( F ) F
F = M s ( F ) F
where denotes element-wise multiplication. During multiplication, attention values are broadcast accordingly: channel attention values are broadcast along the spatial dimensions, and spatial attention values along the channel dimension. is the final refined feature map.
Channel Attention Module. This module generates a channel attention map by exploiting inter-channel dependencies of features. In contrast to approaches that rely solely on average pooling, we argue that max pooling can capture additional distinctive information about object characteristics, thereby contributing to more discriminative channel attention [26]. Therefore, both average-pooled and max-pooled features are utilized. Specifically, spatial information of the feature map is aggregated through average pooling and max pooling, producing two spatial context descriptors: F avg c and F max c . These descriptors are then fed into a shared multi-layer perceptron (MLP) with one hidden layer. To limit parameter overhead, the hidden layer’s dimension is set to R ^ { C × 1 × 1 } , where r is the reduction ratio. The outputs from the shared network are merged using element-wise summation, followed by a sigmoid activation. Thus, channel attention is computed as:
M _ c ( F ) = σ ( M L P ( A v g P o o l ( F ) ) + M L P ( M a x P o o l ( F ) ) ) = σ ( W 1 ( W 0 ( F avg c ) ) + W 1 ( W 0 ( F max c ) ) )
where σ denotes the sigmoid function. The MLP weights are shared for both inputs, and a ReLU activation is applied after the hidden layer.
Spatial Attention Module. This module generates a spatial attention map by exploiting spatial relationships across features. In complement to channel attention, spatial attention focuses on “where” informative regions are located within the feature map. To compute spatial attention, average pooling and max pooling are first applied along the channel axis, yielding two 2D feature maps: F avg s R 1 × H × W and F max s R 1 × H × W . These maps are concatenated and processed by a standard convolutional layer with a 7 × 7 kernel to produce the 2D spatial attention map. The process is formulated as:
M _ s ( F ) = σ ( f 7 × 7 ( [ A v g P o o l ( F ) ; M a x P ool ( F ) ] ) ) = σ ( f 7 × 7 ( [ F avg s ; F max s ] ) )
where · denotes concatenation and f 7 × 7 represents a convolution operation with a 7 × 7 kernel.
Arrangement of Attention Modules. The channel attention module answers “what” to focus on, while the spatial attention module determines “where” to focus. These two complementary attentions can be arranged in parallel or sequentially. Empirical results indicate that a sequential arrangement yields better performance than a parallel one, and placing channel attention before spatial attention leads to marginally superior results.

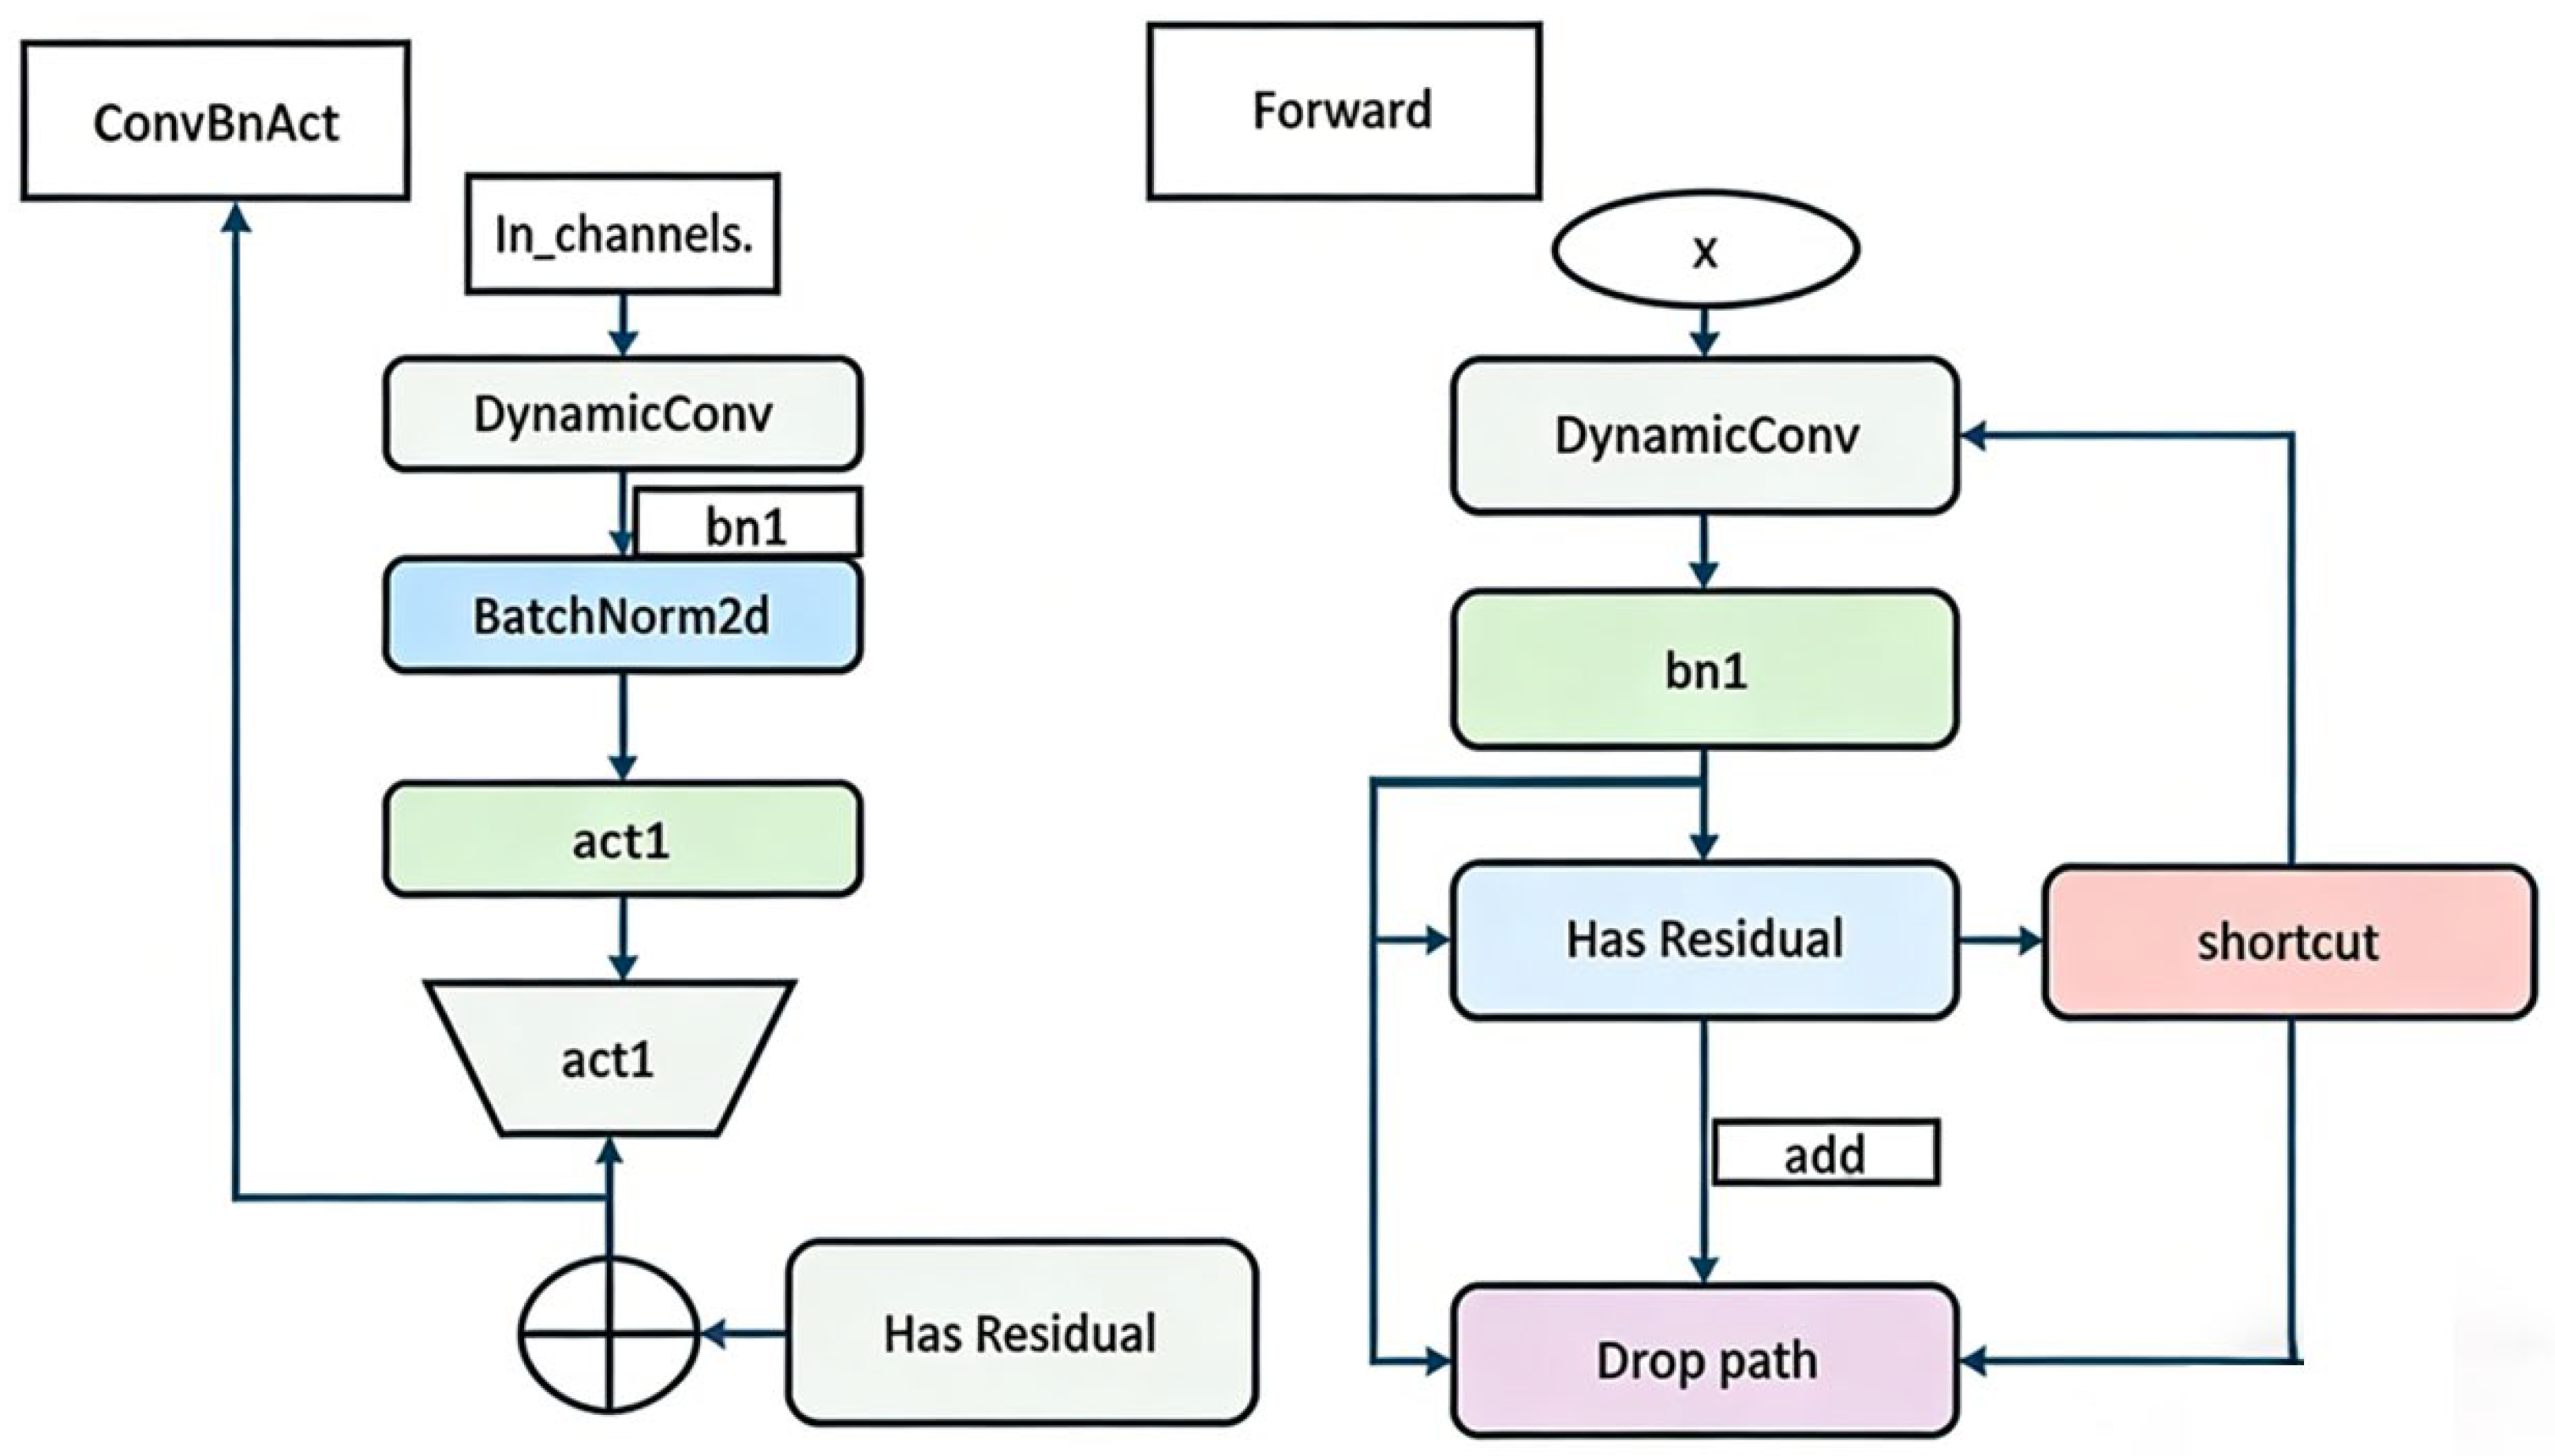
2.2.3. Dynamic ConvBnAct Module

ConvBnAct is a custom-designed dynamic convolution module that integrates the conventional Convolution-BatchNorm-Activation structure with a dynamic convolution mechanism. While lightweight networks typically reduce the number of channels and network depth to minimize parameters and computational cost, this often comes at the expense of representational capacity. The dynamic convolution mechanism compensates for this by adaptively introducing a large set of learnable parameters (experts), effectively countering the loss of representational power and significantly enhancing the model’s ability to extract fine-grained details and complex patterns. This is particularly beneficial for tasks such as small object detection [27].
As illustrated in Figure 6, the module maintains E distinct convolutional kernels (experts). For each input sample, a lightweight routing network computes a set of fusion weights. These weights are used to dynamically aggregate the outputs of these expert kernels, generating a sample-specific convolutional kernel. This enables the network to adapt its feature extraction process to the content of each individual input.
Routing Weight Generation: The routing weights are generated as follows: first, a feature vector Z is obtained by applying Global Average Pooling (GAP) to the input. This vector is then passed through a fully-connected layer (the routing linear layer) with a bias term, and finally normalized via a Sigmoid activation function σ to produce the fusion weight vector α:
α = σ ( W r G A P ( X ) + b r )
Here, W r denotes the weights of the routing linear layer, b r R E is the bias vector, and σ represents the Sigmoid function.
Dynamic Kernel Generation: Assuming there are E expert convolutional kernels, each with weights W e R C o u t × C m × K × K , the dynamic convolutional kernel W d y n a m i c ( b ) for the b-th sample in the batch is generated by a weighted fusion using its corresponding routing weights:
W d y n a m i c ( b ) = e = 1 E α e ( b ) W e
This process is performed independently for each sample in the batch. Consequently, each sample b employs its unique routing weights α ( b ) resulting in a distinct convolutional kernel tailored specifically to it.
Dynamic Convolution Operation: The generated dynamic kernel is then used to perform a standard convolution on the corresponding input sample:
y ( b ) = C o n v ( x ( b ) , W d y n a m i c ( b ) ) + b
where b is an optional bias term (if bias = True). In our implementation, the bias can either be shared or fused in a manner analogous to the convolutional kernels via routing weights.
Optional Skip Connection: Furthermore, the ConvBnAct module incorporates an optional skip connection to facilitate gradient flow and aid in training deeper networks:
If residual is enabled:
y y + x
Overall Forward Propagation: Integrating the above steps, the forward propagation of the entire dynamic convolution layer can be summarized for each sample b in the batch as:
y ( b ) = C o n v ( x ( b ) , e = 1 E σ ( W r G A P ( x ( b ) + b r ) e W e ) + b
By adaptively fusing multiple expert kernels in a sample-wise manner, this design enhances the model’s expressive power and feature adaptability while maintaining a lightweight footprint. In contrast to static convolution or simple attention-based feature weighting, our approach emphasizes the dynamic, on-the-fly generation of sample-specific convolution kernels. This characteristic leads to improved extraction of intricate details, boosting performance in challenging tasks such as small object detection.

2.2.4. GhostBottleneck

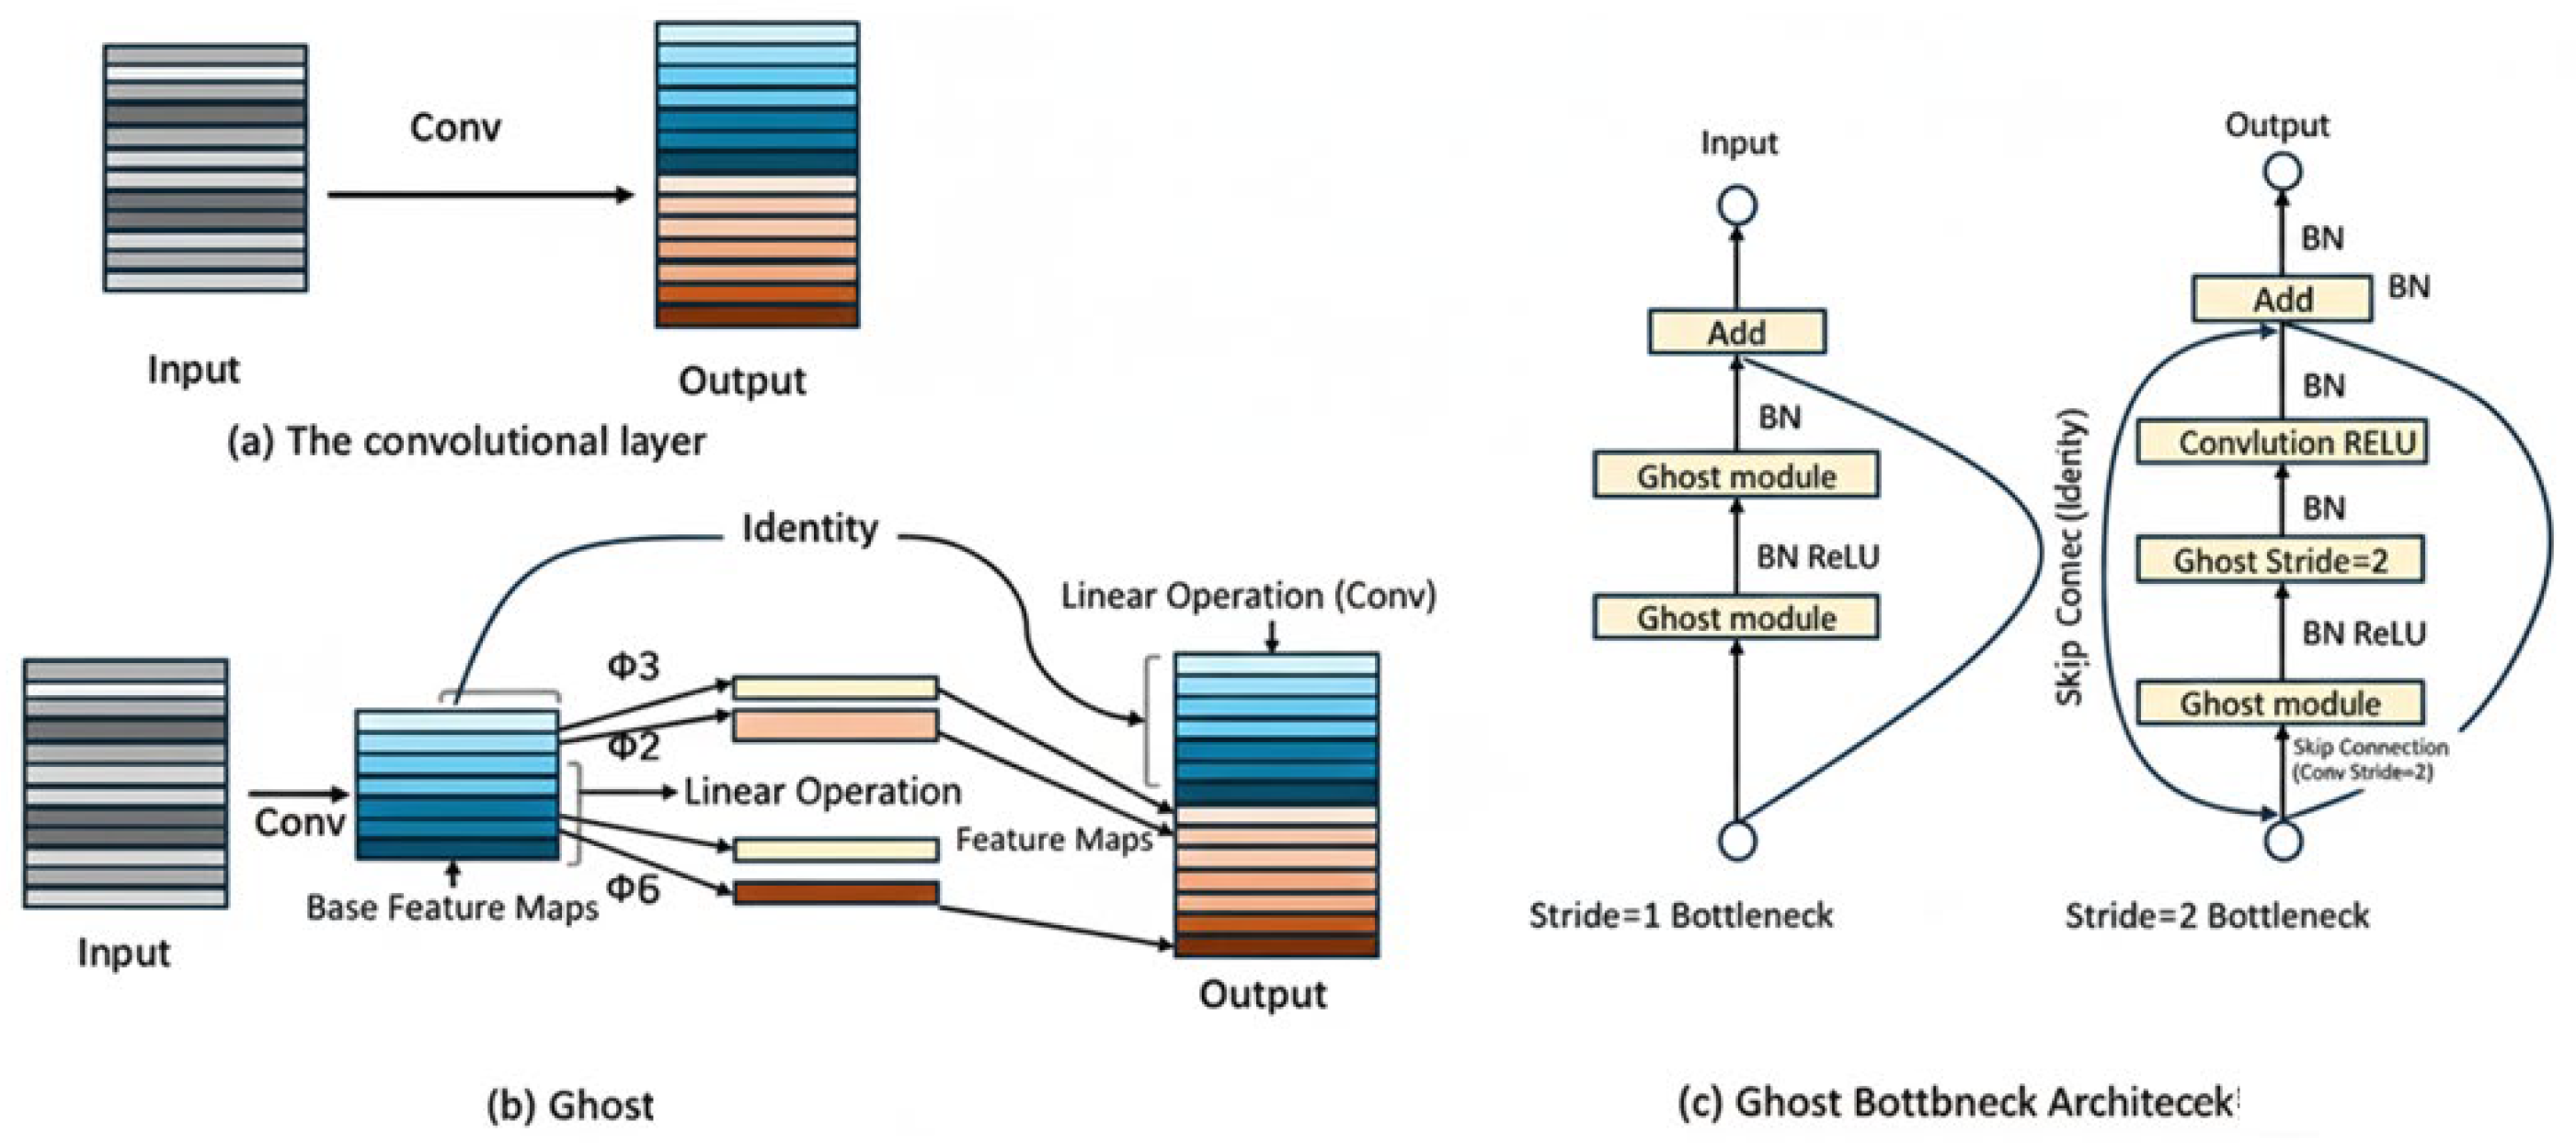
The core innovation of GhostBottleneck is to replace conventional convolutions with a Ghost module. In this design, a primary convolution uses a small number of filters to generate intrinsic feature maps. Depthwise separable convolution (DWConv) is then applied to each of these primary features to produce additional “ghost” feature maps at a very low computational cost. The outputs from the primary convolution and the cheap operations are combined to form the final feature map, where the number of output channels is given by init_channels × ratio, approximating the desired output channels oup.
Integration into CGA-YOLO and Parameter Settings: In CGA-YOLO, GhostBottleneck is employed as the fundamental building block within the backbone and neck sections to enhance feature representation while maintaining low computational overhead. Key parameters are set as follows:
init_channels is typically configured according to the channel width of each stage (e.g., 64, 128, 256, 512). The expansion ratio is commonly set to 2, effectively doubling the number of feature channels with only a modest increase in parameters and FLOPs. Strides of 1 or 2 are used to control downsampling [28], preserving high-resolution details critical for small-target detection.
Optimization for Small Wind Turbine Detection, GhostBottleneck enhances small-target detection in several ways:
Enhanced Feature Richness—As illustrated in Figure 7, by generating a large set of diverse “ghost” features, the model gains increased capacity to capture subtle characteristics of small wind turbines, such as edges, corners, and specific textures. Preservation of High-Resolution Details—the lightweight structure helps retain low-level, high-resolution features that are essential for accurate localization of small targets. Selective Feature Emphasis—an optional Squeeze-and-Excitation (SE) module is integrated to strengthen channels that carry small-target information while suppressing irrelevant background channels, acting as an effective channel-wise attention mechanism.
Computational Efficiency: The essence of the Ghost module is to replace expensive standard convolutions with a combination of one primary convolution and multiple cheap DWConv operations. As presented in Algorithm 1, for example, with ratio = 2, the module approximates the effect of two standard convolutions while requiring far fewer parameters and FLOPs [27].
Algorithm 1: The pseudo-code of Ghostmodule
InputX
1: Extension F = G h o s t M o d u l e 1 ( X )
2: Down sampling (optional)if stripe > 1: F = D W C o n v ( F )
3: Attention (optional)if stripe > 1: F = D W C o n v ( F )
4: Compression F = G h o s t M o d u l e 2 ( F )
5: Connection and integrationif (in_chs == out_chs and stride == 1):
Y = X + F
else: Y = Proj(X) + F
This design ensures that CGA-YOLO maintains a rich, high-resolution feature hierarchy with minimal computational cost, thereby improving both the recall and precision of small wind turbine detection in aerial imagery.

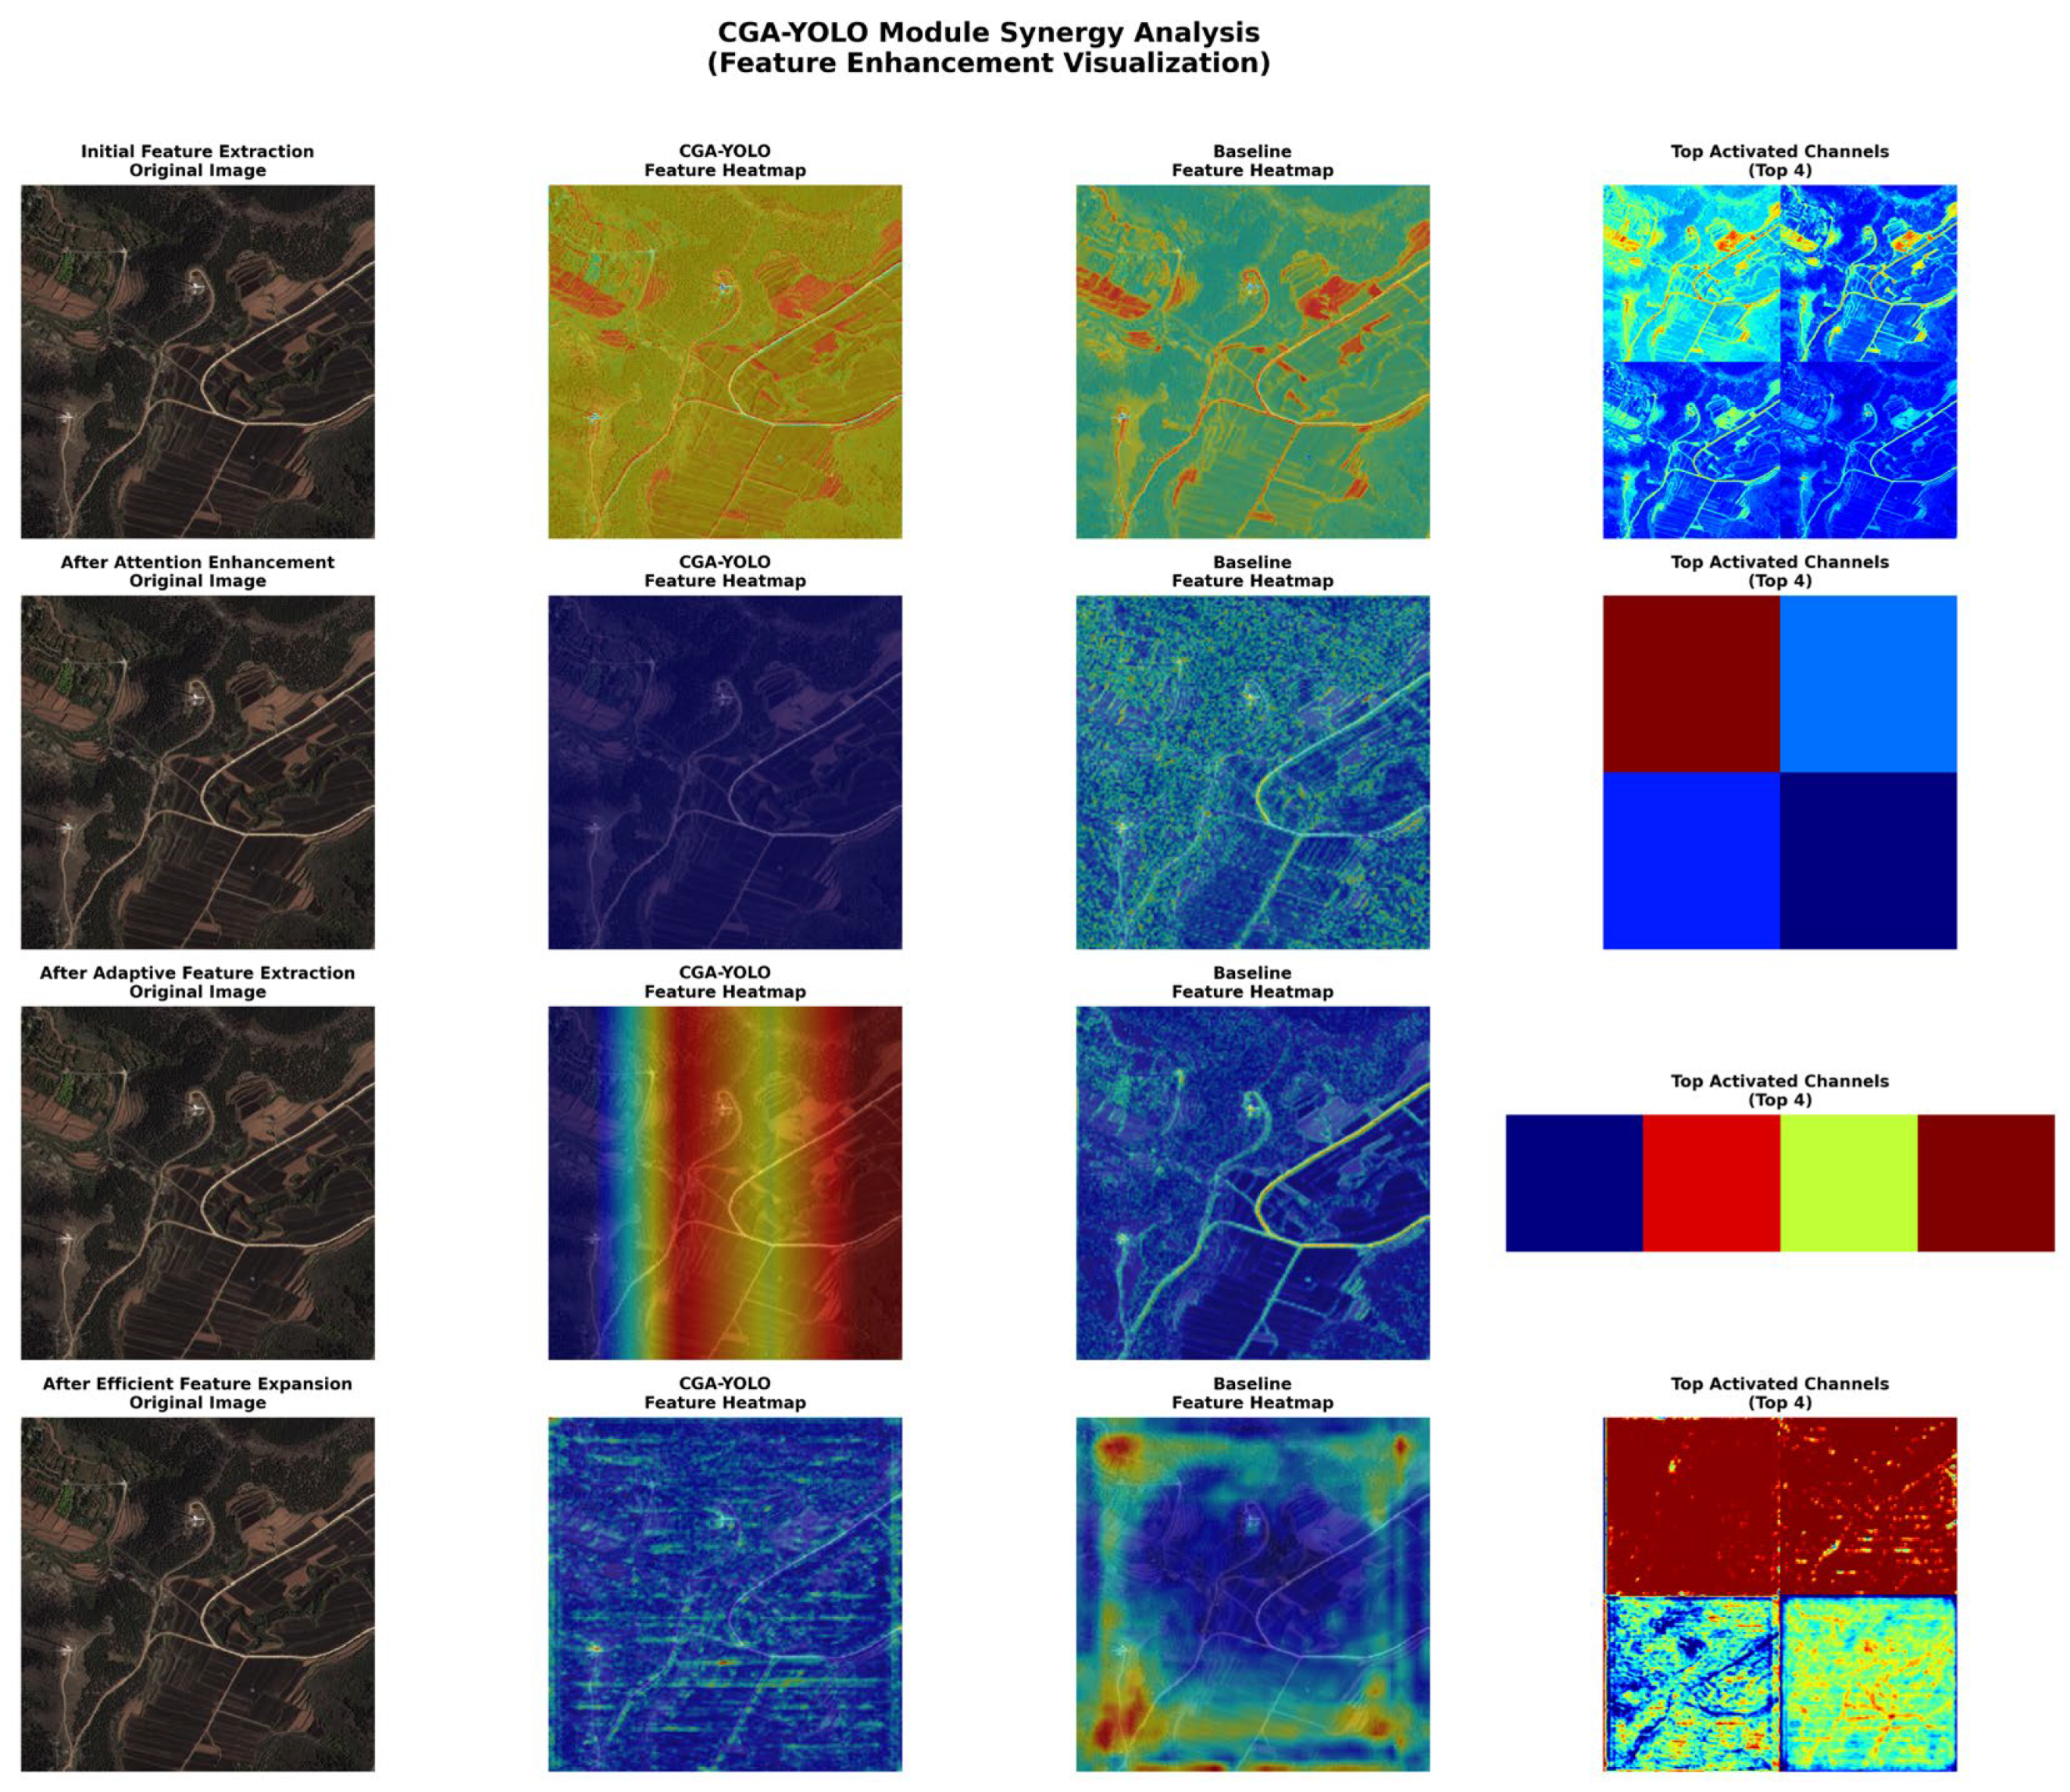
2.2.5. Analysis of Module Collaboration Mechanisms

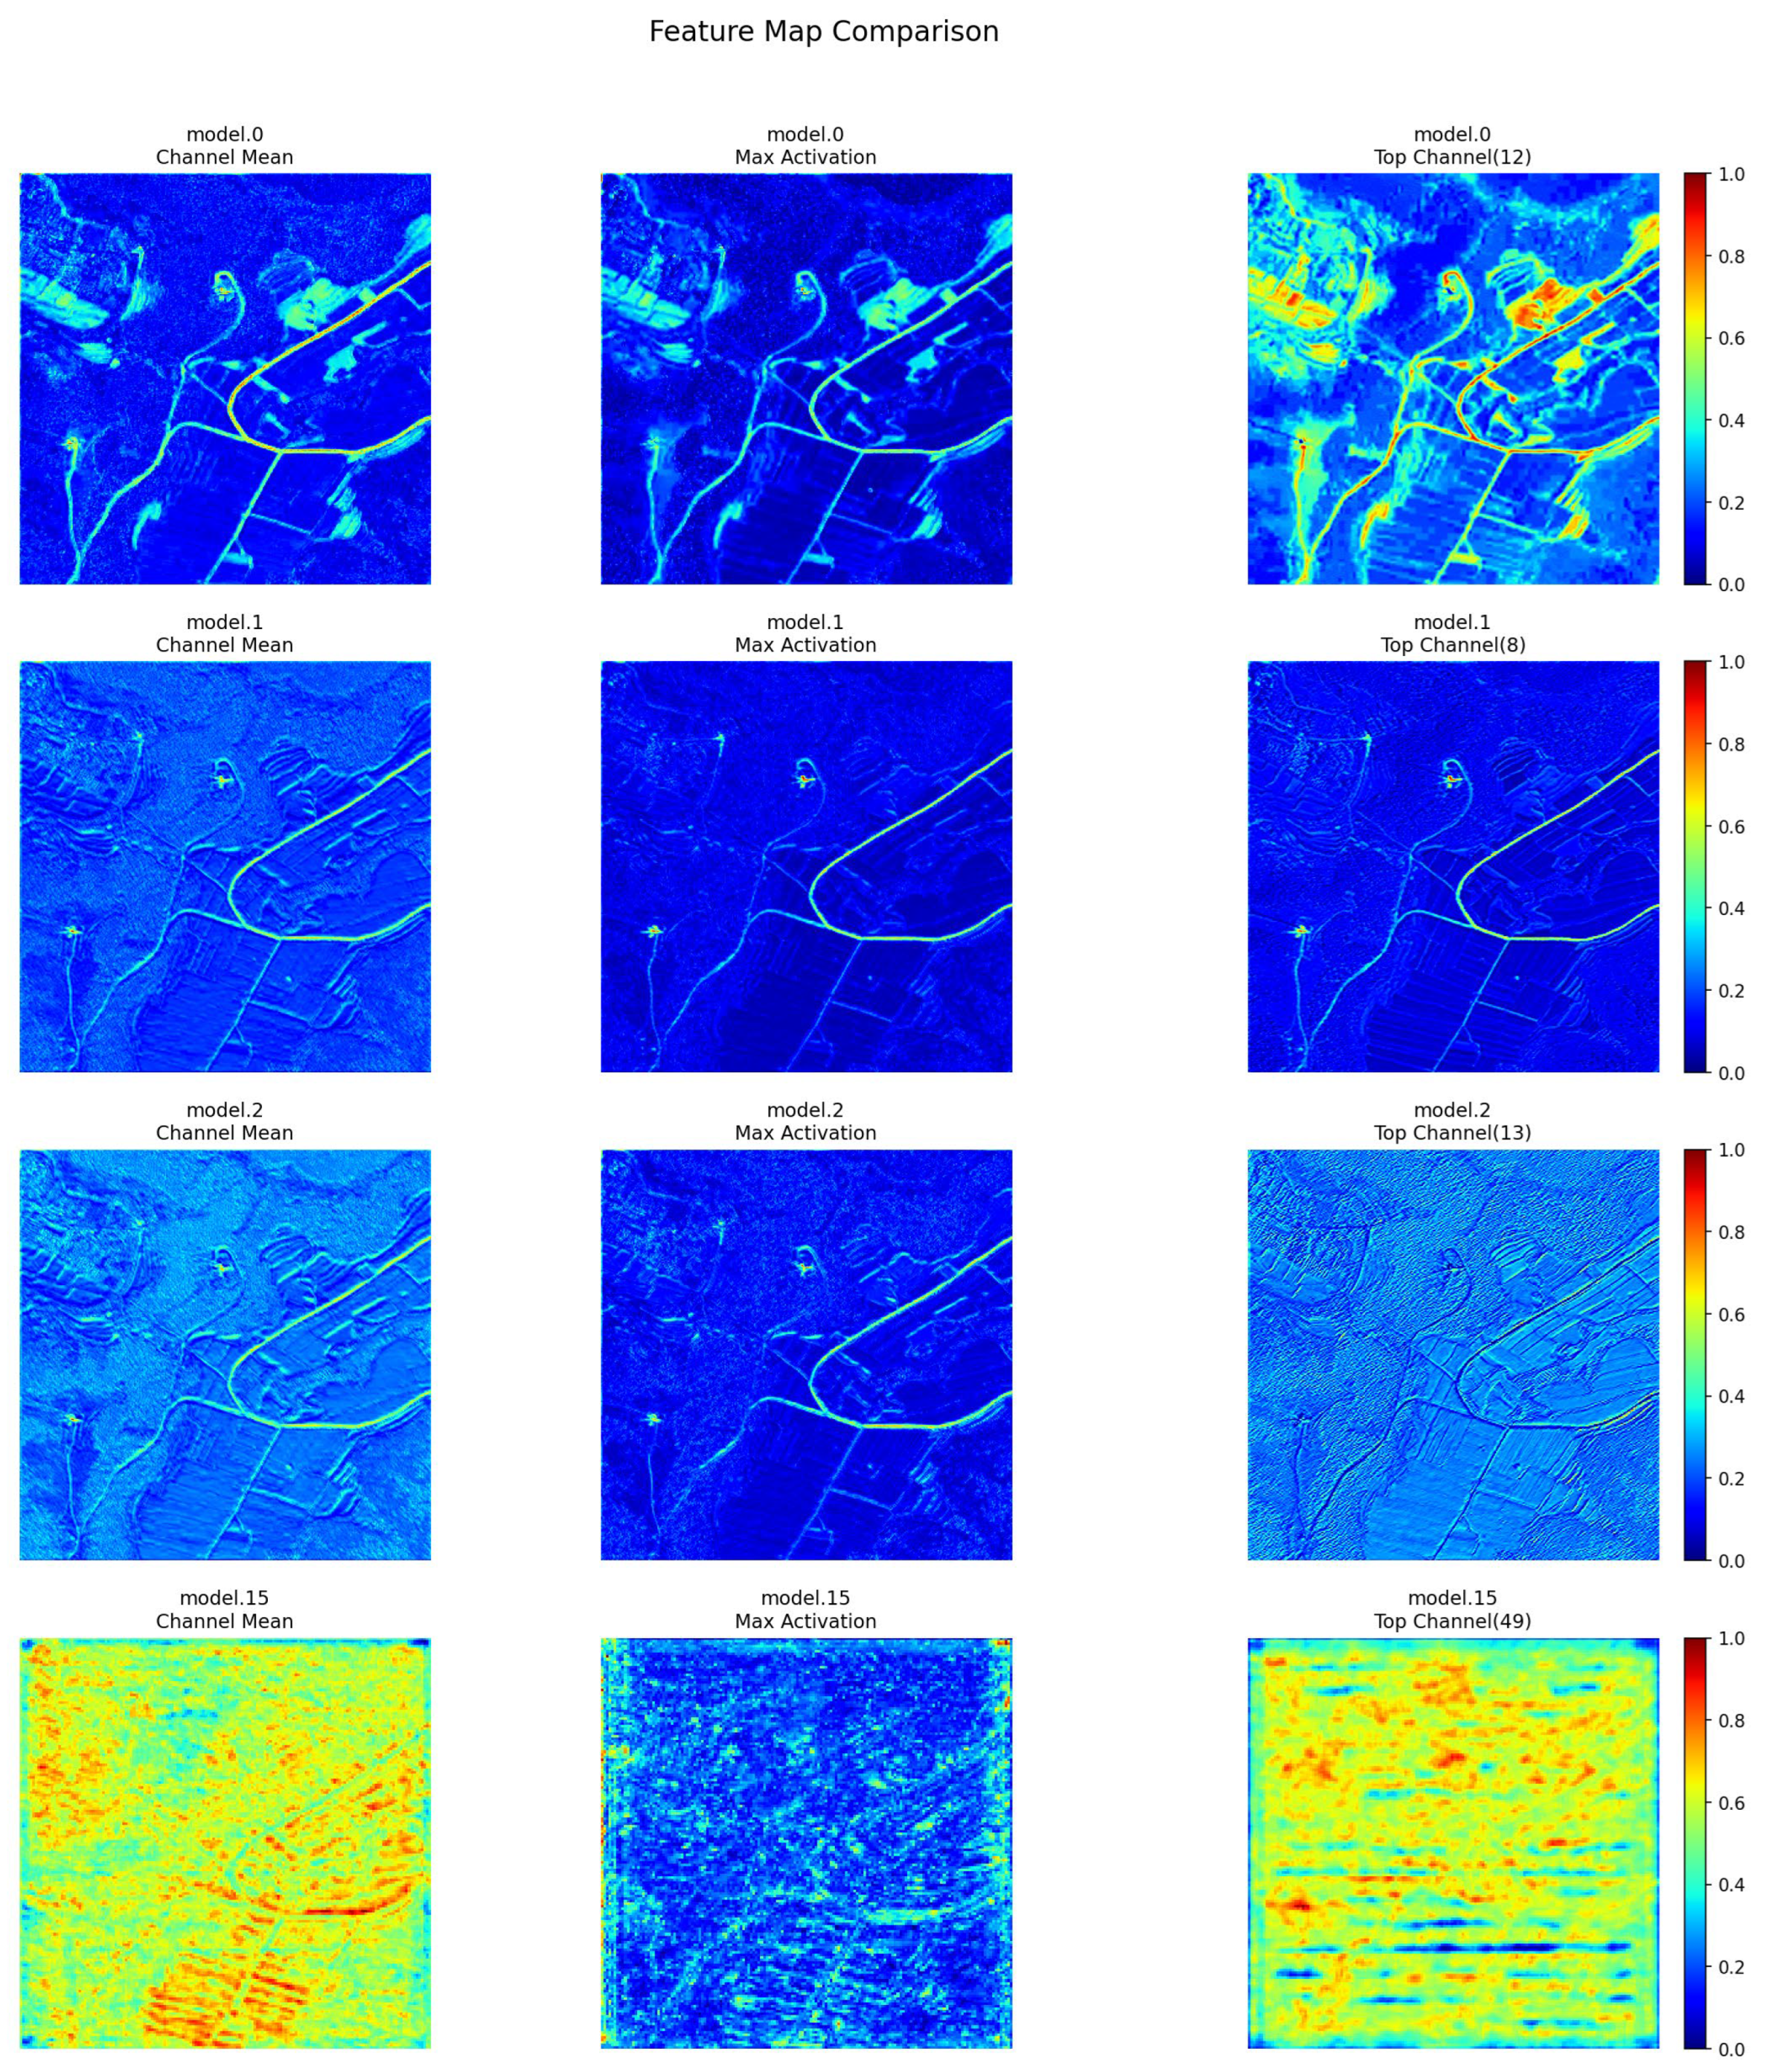
Although Dynamic Convolution (ConvBnAct), CBAM and GhostBottleneck are modules capable of independently enhancing performance, their synergistic integration within CGA-YOLO constructs a logically coherent processing pipeline specifically designed to address the challenges of small object detection. This synergistic effect is not a mere functional stacking but rather a chain reaction of “adaptive enhancement, intelligent focusing, and efficient preservation.” as illustrated in Figure 8.
Firstly, the Dynamic ConvBnAct module serves as an adaptive feature generator, acting at the initial stage of the processing flow. Its core contribution lies in introducing sample-level dynamic perception: for each input wind turbine image, its internal routing mechanism can instantaneously “orchestrate” and fuse a set of most suitable convolutional kernels [29]. This is equivalent to customizing the most appropriate primary feature extractor for each unique scene, thereby enhancing the model’s ability to capture the weak and variable fundamental patterns of small objects at the source. It provides subsequent stages with rich and diverse primary feature representations.
Subsequently, the CBAM module acts as a feature refinement and purification module, performing precise processing on the dynamically generated features from the previous step [21]. Its channel attention mechanism functions like a selective filter, screening and strengthening channels most sensitive to key semantics such as turbine structure and edges [30]. Simultaneously, its spatial attention mechanism operates like a spotlight, accurately highlighting potential target regions while suppressing irrelevant background noise. This step refines the dynamically extracted, potentially redundant features into a purified feature map with high signal-to-noise ratio and strong discriminative power, laying a solid foundation for accurate classification and localization.
Finally, the GhostBottleneck module serves as an efficient feature augmentation and propagation backbone, taking on the crucial role of information preservation and transmission. It receives the refined features purified by the focusing step and, leveraging its unique “cheap operation” mechanism, performs low-cost augmentation and propagation of the key feature information with minimal computational overhead [27]. This design is vital as it ensures that the sparse yet critical small object feature signals, already strengthened by CBAM, can be effectively carried and preserved during propagation through deeper network layers. This significantly mitigates the issue of information attenuation, thereby solidly delivering the outcomes from the preceding modules to the detection head.
As illustrated in Figure 9, to summarize, the three modules form a highly synergistic and organic whole: the dynamic convolution provides adaptable “raw material,” CBAM accomplishes precise “refinement and annotation,” and GhostBottleneck ensures “low-loss and high-fidelity” transmission of this valuable information. It is the tight collaboration within this complete chain that collectively enables CGA-YOLO to achieve high robustness in detecting small wind turbine targets against complex backgrounds.

3. Result

In this study, small targets are defined as objects with dimensions less than 32 × 32 pixels in the image plane. Benchmark evaluation is conducted on two publicly available small-object detection datasets—VEDAI and RSOD—as well as the custom-built wind-turbine dataset (SDWT) introduced in this work. The YOLOv12 series is chosen as the baseline framework, which includes five variants of increasing width and depth: YOLOv12n, YOLOv12s, YOLOv12m, YOLOv12l, and YOLOv12x. Among these, YOLOv12n possesses the fewest parameters while still maintaining a favorable trade-off between inference speed and accuracy. Therefore, YOLOv12n is adopted as the base model and further enhanced through the modifications described in the preceding sections.

3.1. Model Training and Evaluation Metrics

The model is implemented using the PyTorch 2.4.2+cu118 framework and deployed on a workstation equipped with an NVIDIA Tesla V100-PCIe GPU, manufactured in Shenzhen, China. Parameter optimization is performed with the Stochastic Gradient Descent (SGD) optimizer, with an initial learning rate of 0.01, momentum of 0.937, weight decay of 0.0005, and a batch size of 32 during training.
Detection Parameters and Post-Processing: In all detection experiments of this study (including comparative experiments, ablation experiments, and result visualization), a consistent inferential post-processing pipeline was adopted unless otherwise specified. Specifically, an initial confidence threshold of 0.25 was set to filter initial prediction boxes, and the non-maximum suppression (NMS) algorithm was employed for further deduplication with an intersection over union (IoU) threshold of 0.45. These parameters were optimized via grid search on an independent validation set after model training, aiming to achieve an optimal balance between the precision and recall of model outputs. This standardized pipeline ensures the fairness of all comparative experiments and the reproducibility of results.
For evaluation, the mean Average Precision (mAP) serves as the primary metric. Depending on the Intersection-over-Union (IoU) threshold, mAP can be reported as mAP50, mAP75, or mAP50:95 (averaged over IoU thresholds from 0.50 to 0.95 with a step of 0.05). In this study, mAP50 and mAP50:95 are adopted as the core indicators to quantify detection accuracy. To provide a comprehensive performance assessment, precision and recall are also reported as auxiliary metrics: precision reflects the proportion of true positive predictions among all positive detections, while recall measures the model’s ability to identify all positive samples in the dataset. Together, these metrics offer a balanced evaluation of the model’s effectiveness in small-object detection tasks.

3.2. Comparisons with Previous Methods

This section presents the experimental results of the CGA-YOLO model evaluated on three datasets: VEDAI, RSOD, and a specialized Shandong wind turbine dataset. On the RSOD and Shandong datasets, the proposed model is compared against current mainstream methods as well as existing state-of-the-art approaches. The accompanying figure illustrates the detection performance of CGA-YOLO across typical scenarios within these datasets. Comparative analyses are conducted against YOLO-series models and several classical object detection algorithms.

3.2.1. SDWT Dataset

As shown in Table 3, the comparative experiments in this study were conducted under a unified configuration: all models were trained on the SDWT dataset for 500 epochs, with the optimal weights selected based on validation set performance. Training was performed using a single NVIDIA V100 GPU (32 GB memory) with a batch size of 64 and a learning rate of 0.01. Under this fair comparison framework, CGA-YOLO demonstrates comprehensive performance advantages. Compared to the keypoint-based CenterNet, it improves mAP50 by 0.025. When compared to the similarly lightweight architecture YOLOv10n, CGA-YOLO leads by 0.041 in mAP50, 0.108 in mAP50:95—which measures overall detection accuracy—and achieves an even more significant improvement of 0.144 in mAPs, an indicator specifically designed to assess small object detection capability. These results underscore the effectiveness of the enhancements introduced in CGA-YOLO, particularly its optimizations for multi-scale feature fusion and small object perception, in the task of detecting small objects in remote sensing imagery.
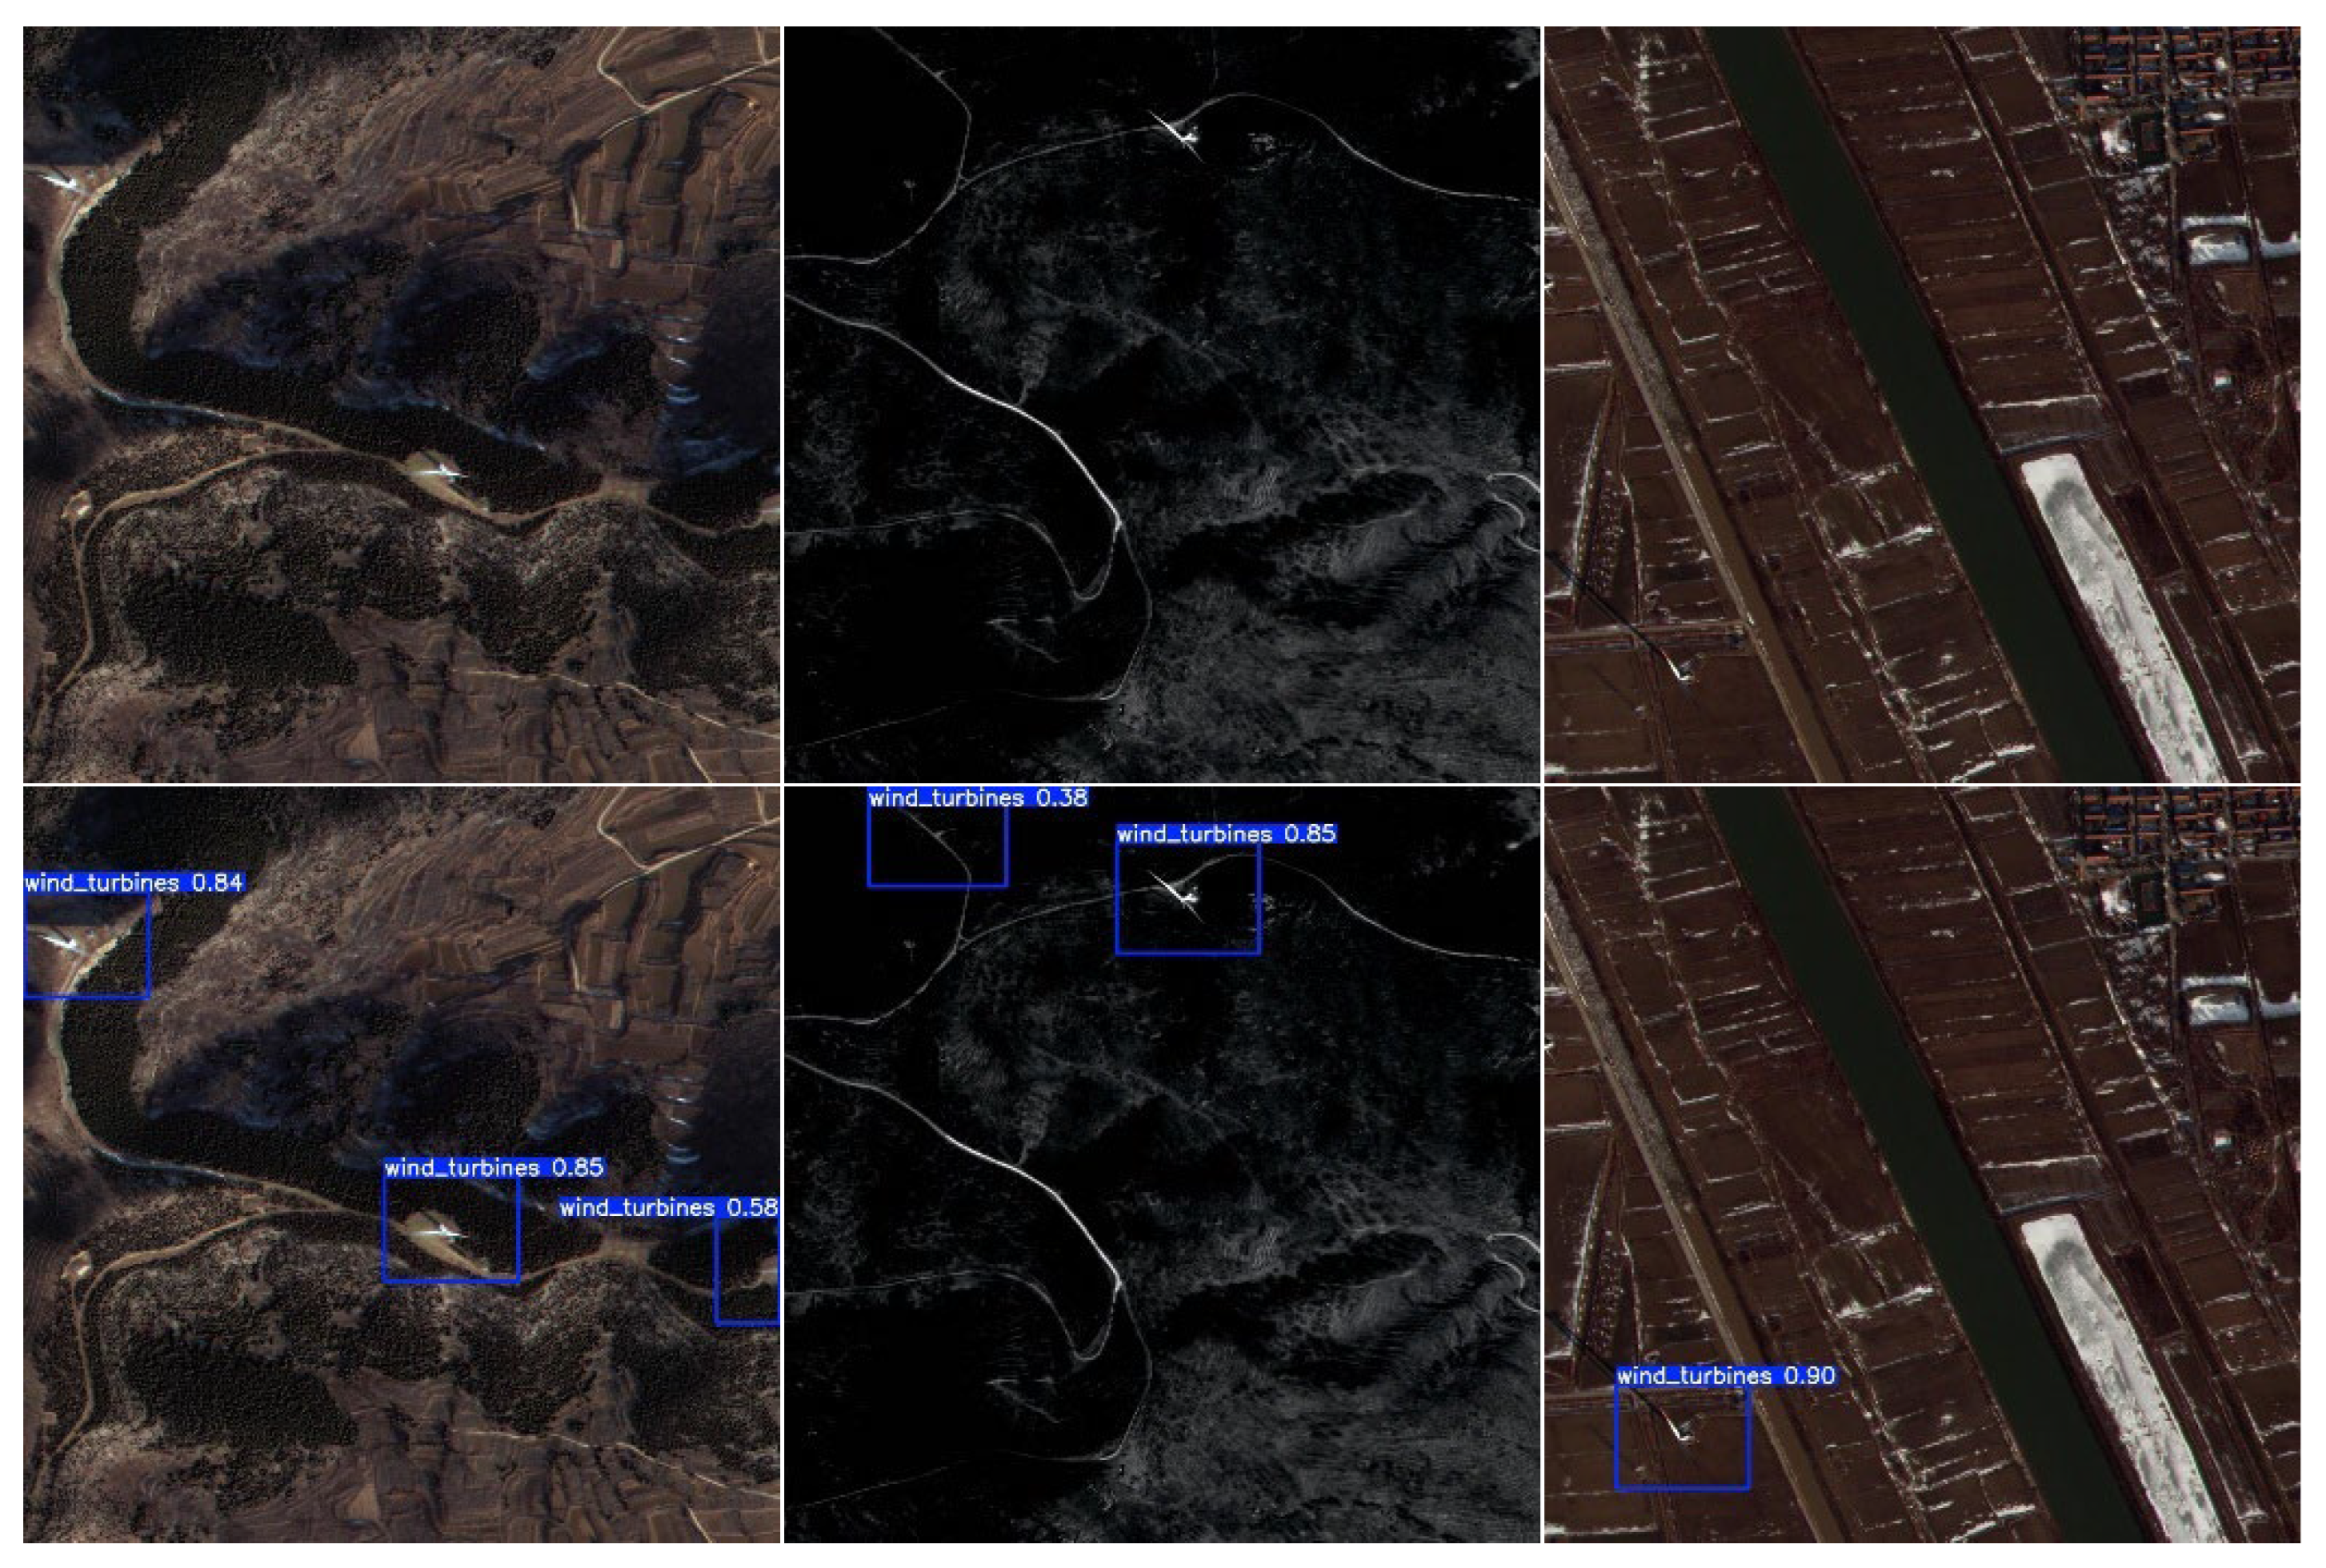
It is worth noting that the structural characteristics of different models are reflected in their metric variations. For instance, the Transformer-based DETR model exhibits a significantly higher recall (0.906) than precision (0.603), resulting in a relatively lower F1-score (0.721). This phenomenon may stem from DETR’s global self-attention mechanism and set prediction loss. Although this architecture allows it to model long-range dependencies and avoid NMS post-processing—thereby capturing more potential objects (manifested as high recall)—in the complex backgrounds typical of remote sensing datasets, its attention mechanism may also be more susceptible to background noise or may misclassify challenging negative samples as objects [31], leading to a higher number of false positives (manifested as low precision). This ultimately contributes to its relatively lower overall mAP50 (0.829) compared to mainstream detectors, suggesting that the original DETR architecture may have room for optimization in its query design and feature matching strategy when applied to high-resolution remote sensing images with complex backgrounds [32]. In contrast, CGA-YOLO achieves the best recall (0.963) while maintaining high precision (0.949), resulting in a more balanced and robust detection performance [33]. Furthermore, the high annotation quality of the dataset provides a solid foundation for the overall performance improvements across models. Against this backdrop, the notable gaps observed among models under the more stringent metrics of mAP50:95 and the small object-specific mAPs further validate the structural advantages of CGA-YOLO in feature extraction and multi-scale understanding. The visualization results provided in Figure 10 also offer intuitive confirmation of the model’s robust detection capability in challenging scenarios.

3.2.2. VEDAI Dataset

The experiments on the VEDAI dataset employed the exact same settings as the aforementioned study: all models were trained for 500 epochs, with the optimal weights selected based on the validation set performance. The hardware consisted of a single NVIDIA V100 GPU, with a batch size of 64 and a learning rate of 0.01. This dataset encompasses a wider variety of small vehicle targets, enabling a more comprehensive evaluation of a model’s detection and classification capabilities for small objects. As shown in Table 4, under these conditions, CGA-YOLO achieves the best overall performance. Its mAP50 on the test set reaches 0.683, which is 0.065 higher than the current best-performing baseline model, YOLOv12n (0.618). Simultaneously, mAP50:95 also increases to 0.427. This result further validates the robustness of CGA-YOLO in remote sensing small object scenarios.
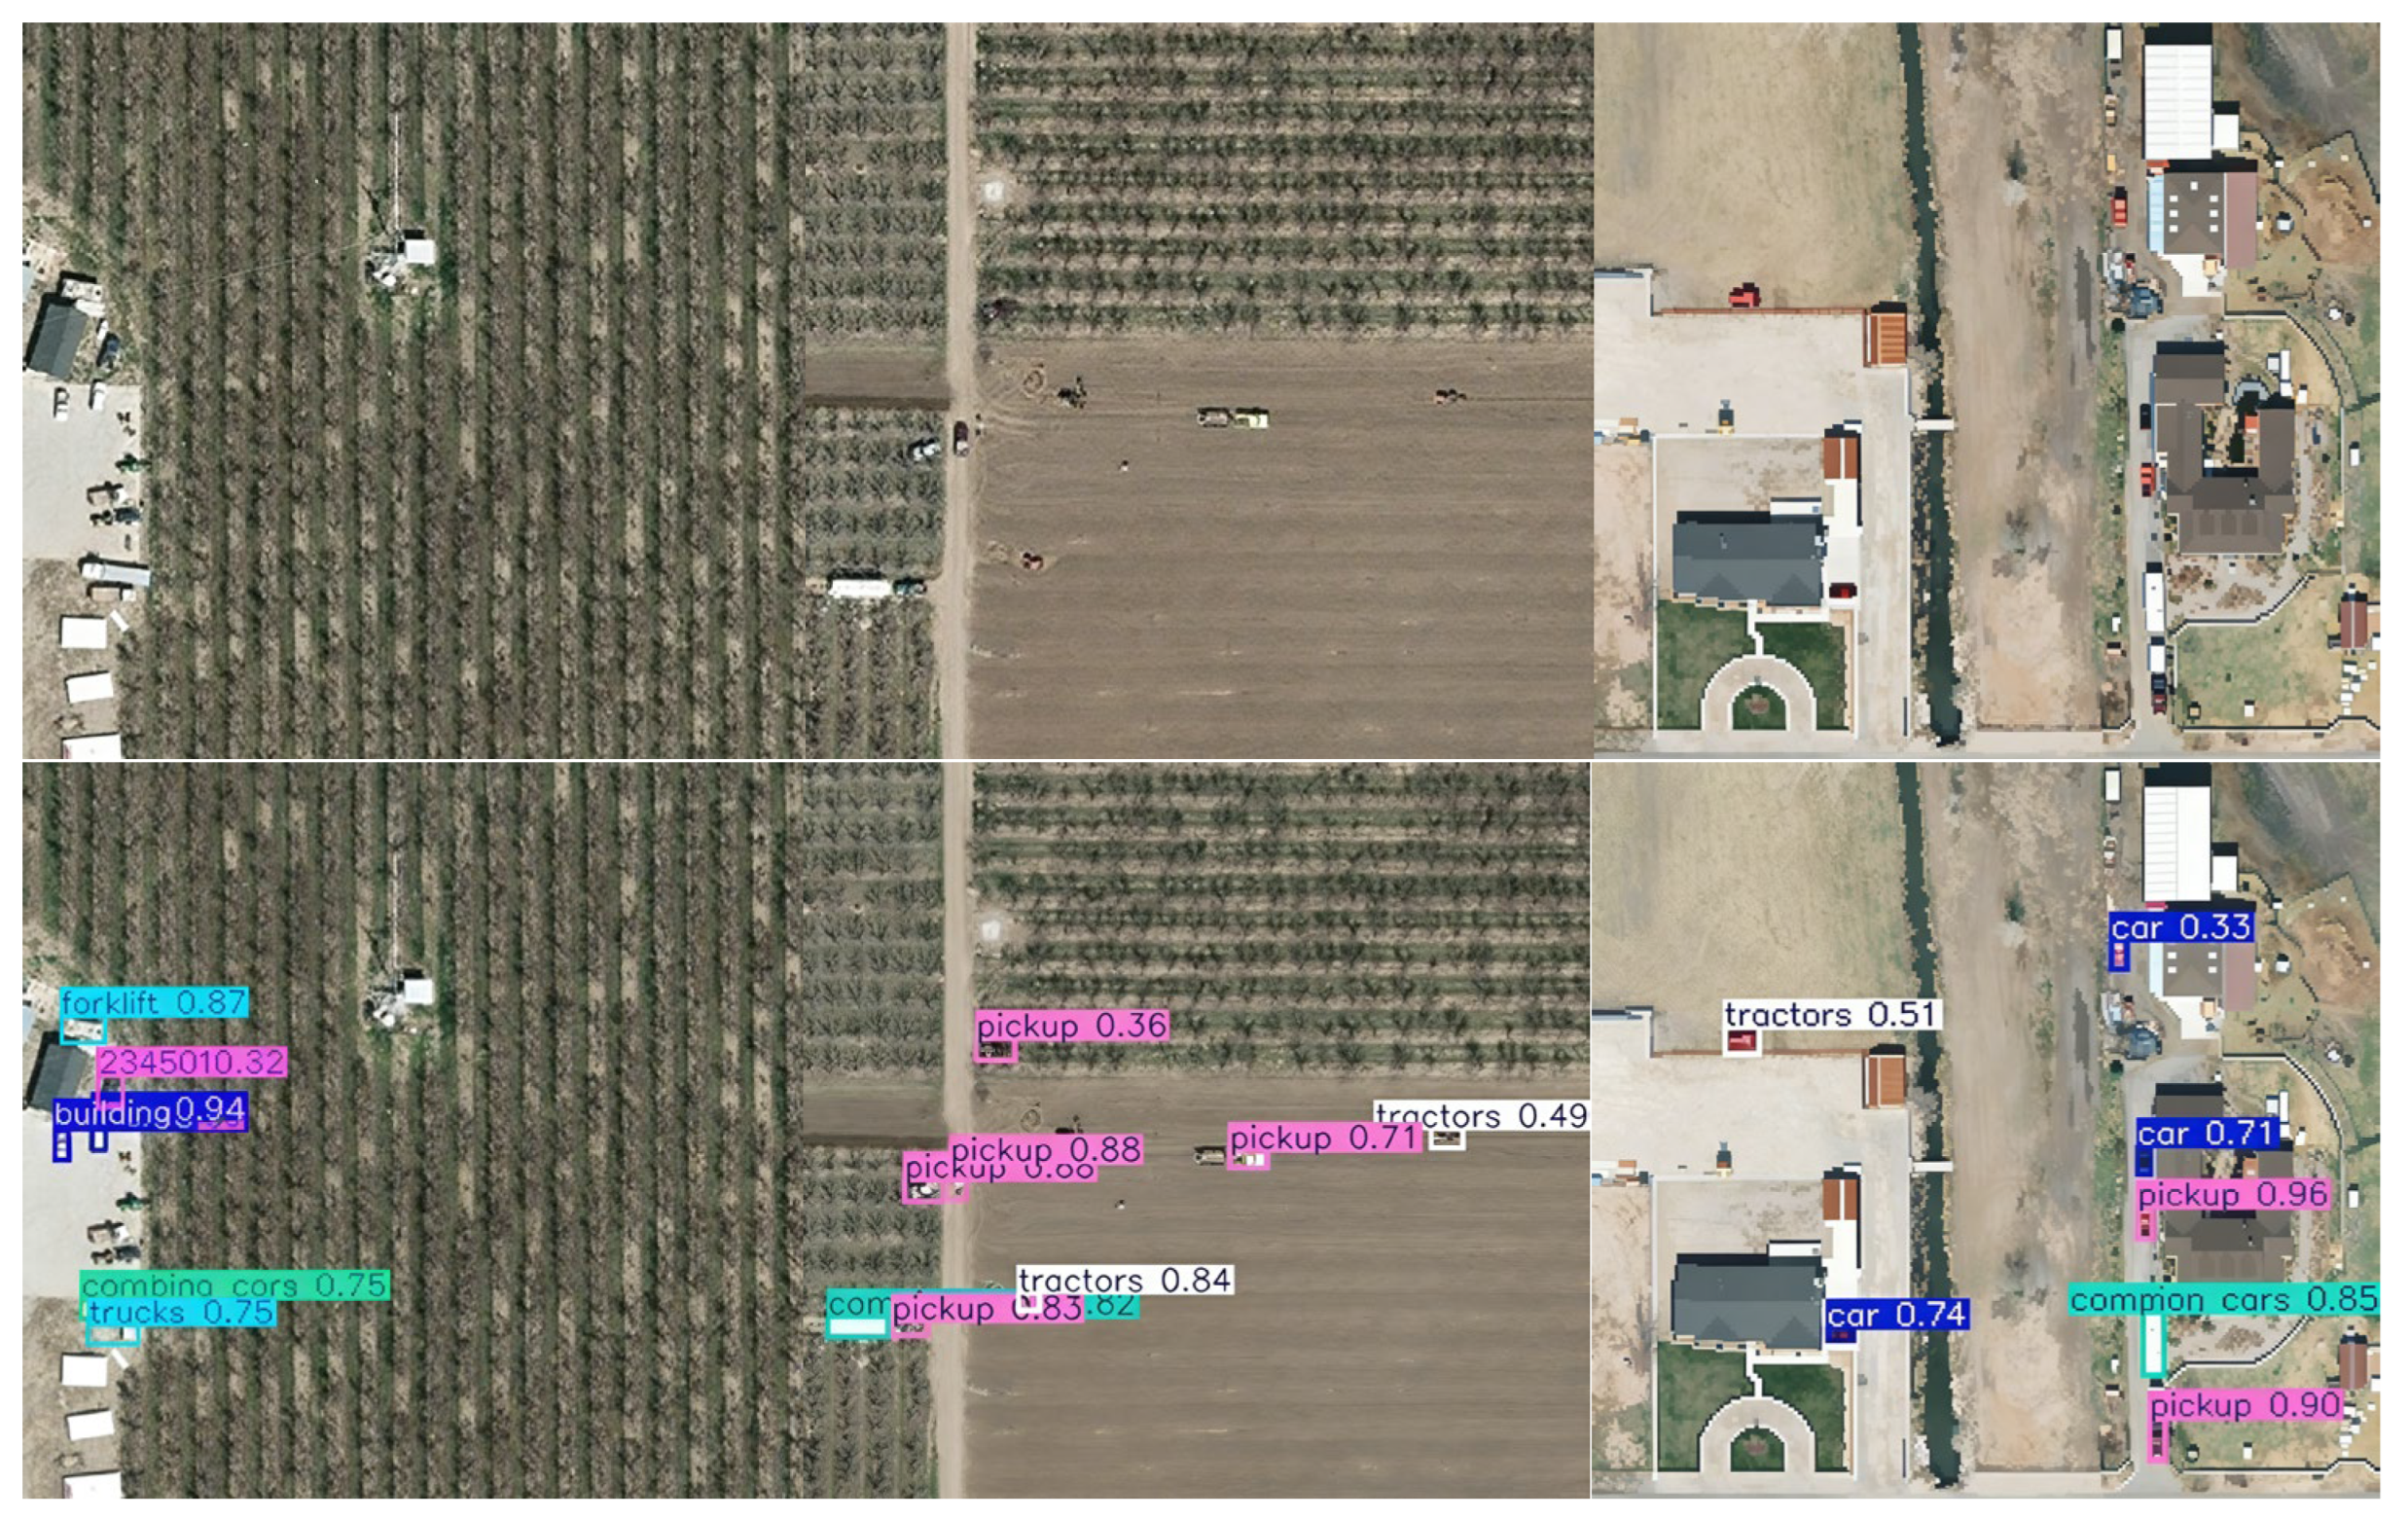
The structural characteristics of different models manifest significant variations in their performance across different categories. For instance, the keypoint-based CenterNet performs exceptionally well on the “pickup” (0.830) and “Car” (0.706) categories but suffers a drastic drop in AP to 0.209 on the “vans” category. This stem from the insufficient adaptability of its center-point localization mechanism to vehicle types with less distinctive shapes or significant size variations, leading to a high number of missed detections. RT-DETR, as a Transformer-based detector, attains a high AP of 0.796 on the “Car” category. However, its performance on the “truck” and “camping” categories is relatively modest. This suggests that when dealing with specific vehicle types potentially plagued by similar background interference, the matching efficiency between its queries and target features within the global attention mechanism may encounter bottlenecks [34]. It is noteworthy that YOLOv10n, which clearly pursues a lightweight design, exhibits the lowest per-category APs and overall mAP50 (0.524) among the baseline models in the table. This likely reflects the compromises made in its feature extraction capacity or network depth in the pursuit of efficiency, consequently impairing its discriminative power for diverse small objects [35]. In contrast, CGA-YOLO not only achieves the highest AP of 0.882 on the “Car” category but also maintains leading or competitive performance on most other categories. Its optimal results on the overall metrics, mAP50 and mAP50:95, demonstrate that its adopted multi-scale feature fusion and targeted optimization design enable a more balanced approach to the detection and classification challenges posed by the diverse, small-sized vehicle targets in remote sensing imagery. The visualization results in Figure 11 intuitively illustrate the model’s accurate detection capability in typical vehicle scenarios.

3.2.3. RSOD Dataset

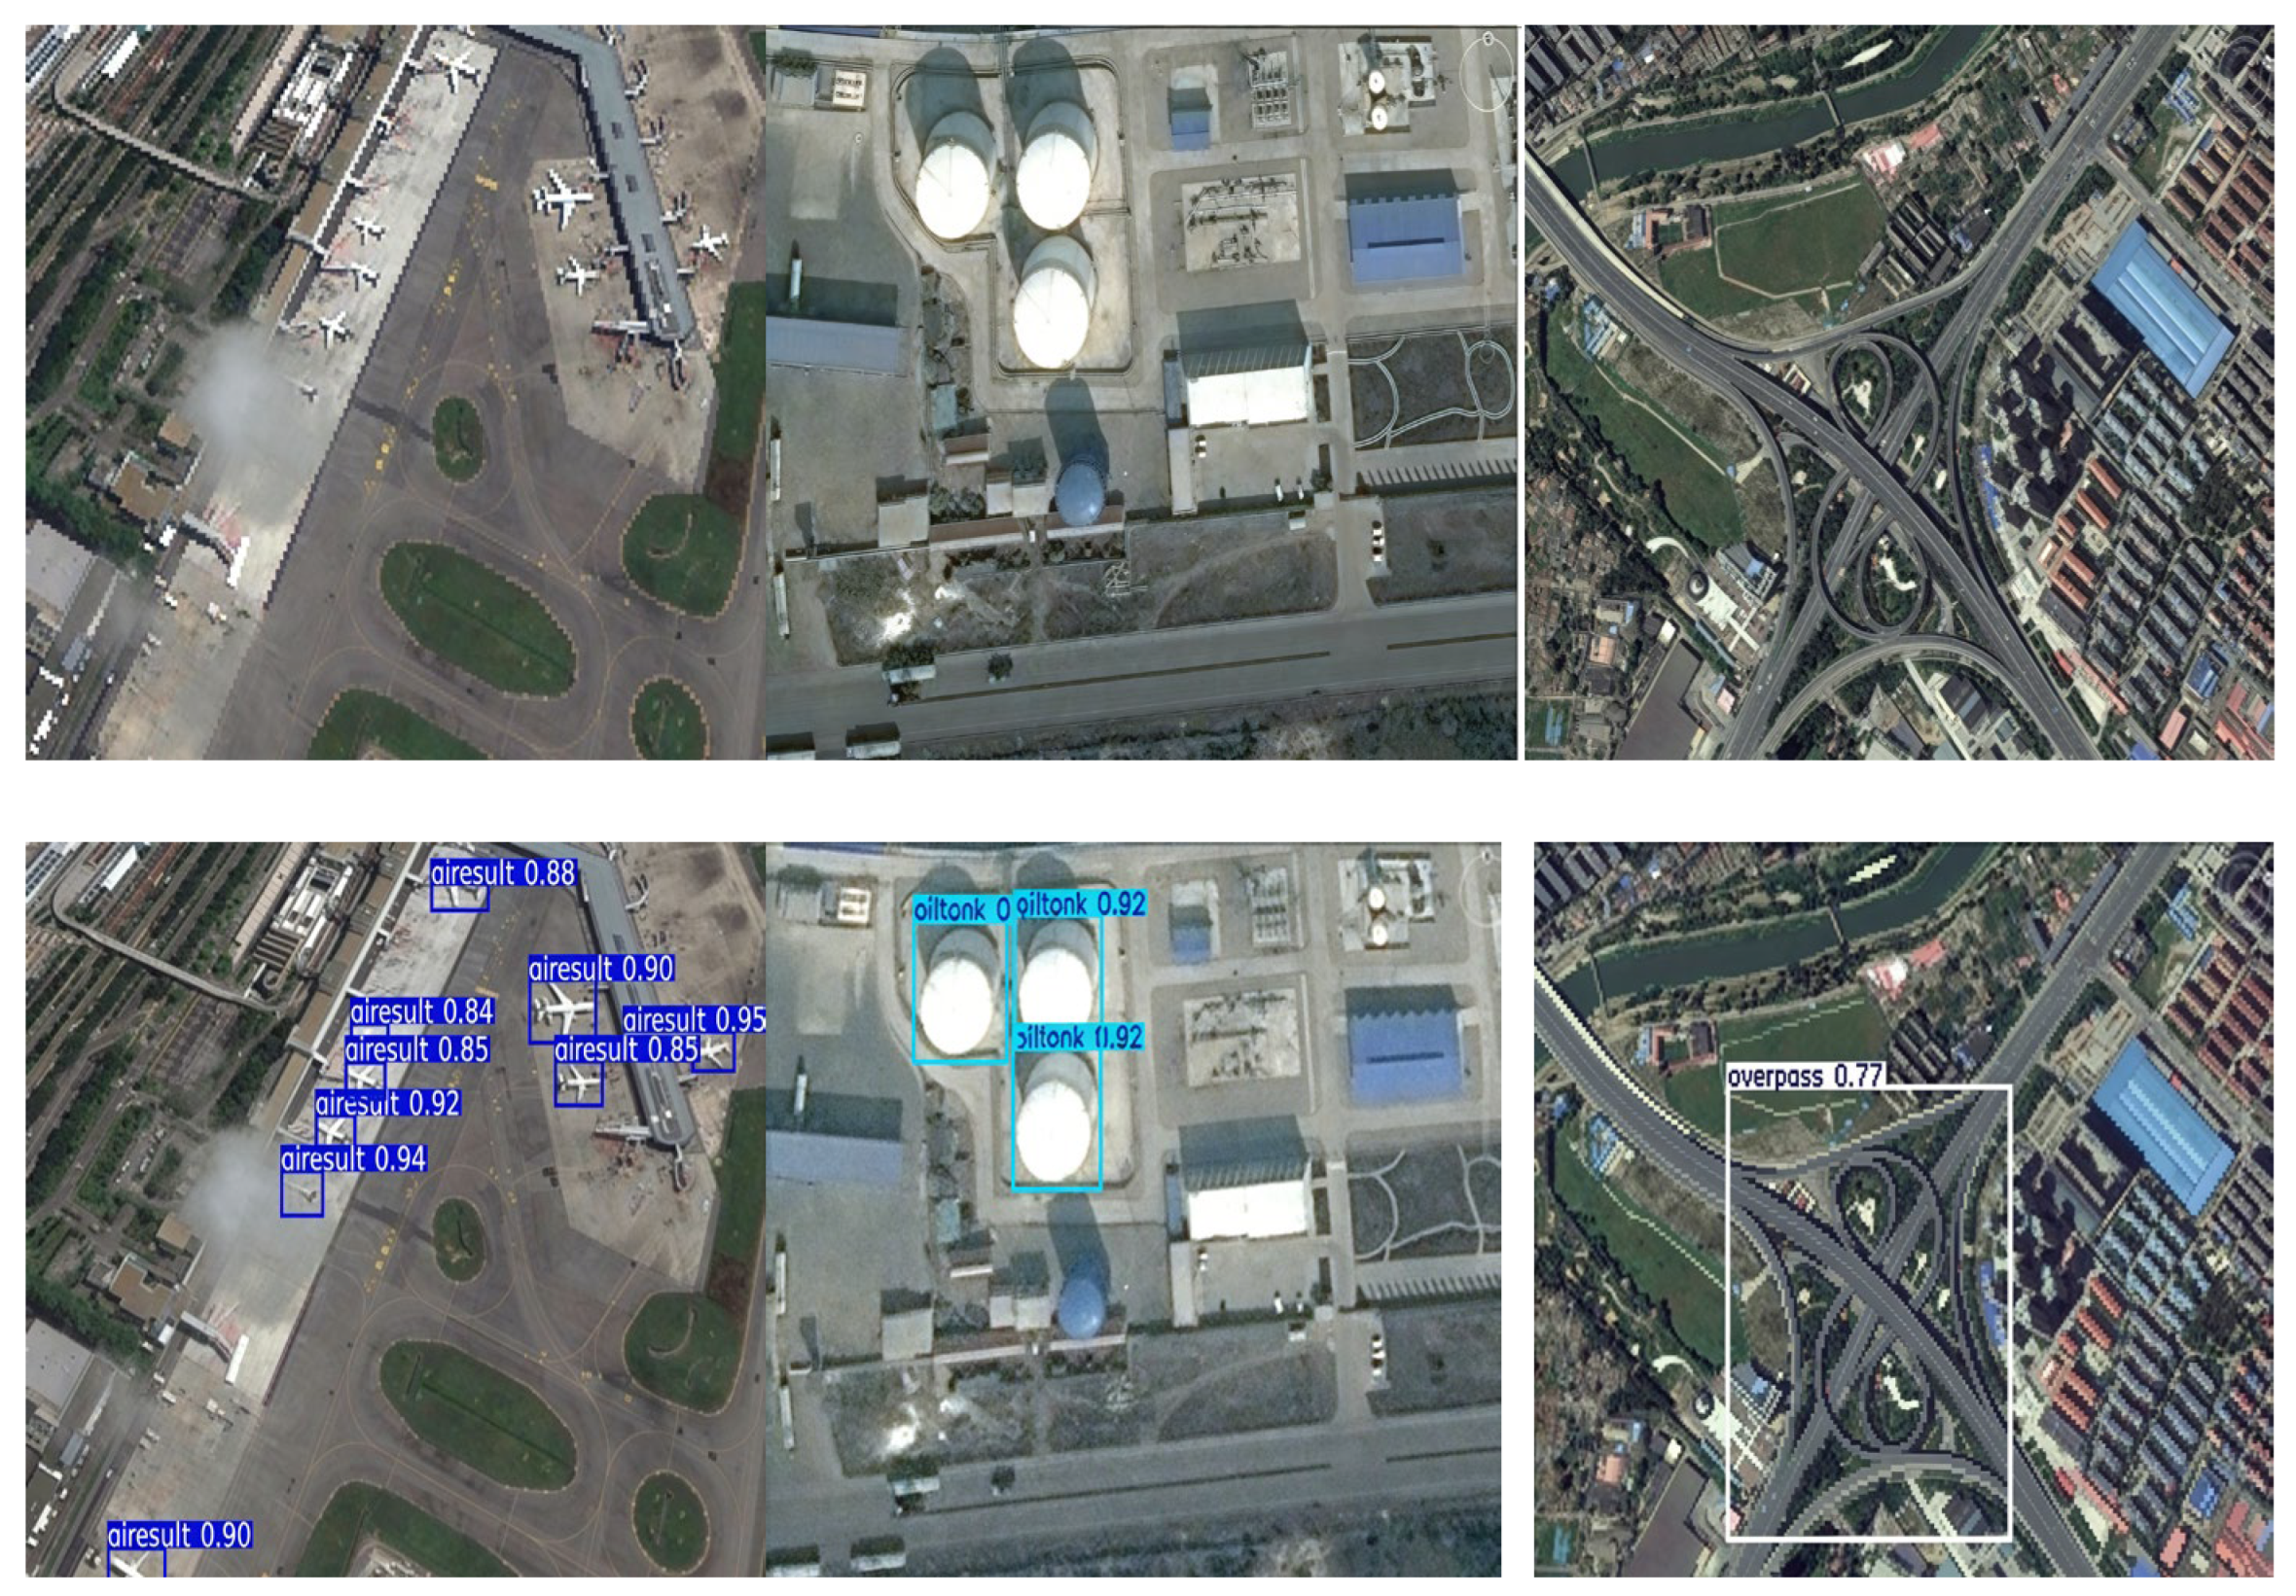
The experiments on the RSOD dataset were conducted under the same unified configuration: all models were trained for 500 epochs with optimal checkpoint selection based on validation performance, utilizing a single NVIDIA V100 GPU, a batch size of 64, and a learning rate of 0.01. This dataset, featuring distinct object categories such as aircraft, oil-tanks, overpasses, and playgrounds, presents a different set of challenges for object detection models. As demonstrated in Table 5, the proposed CGA-YOLO achieves superior overall performance, attaining the highest mAP50 of 0.903 and mAP50:95 of 0.627, thereby reaffirming its robustness across diverse remote sensing scenarios. The visual comparisons in Figure 12 and Figure 13 further substantiate its enhanced detection capability.
A closer examination of the results reveals several noteworthy, and at times counterintuitive, observations tied to model architectures. YOLOv12n, for instance, exhibits a perplexingly low mAP50:95 score of 0.116, which starkly contrasts with its more reasonable mAP50 of 0.802. This significant discrepancy suggests that while YOLOv12n can achieve satisfactory detection under the looser IoU threshold of 50%, its precision in localization degrades severely under stricter thresholds (IoU from 50% to 95%) [36]. This may indicate an inherent limitation in its bounding box regression mechanism or a specific vulnerability in its feature representation for precise spatial alignment on this dataset, meriting further investigation. Another striking case is RT-DETR, which delivers near-perfect performance on the “playground” category (AP 0.99) but struggles markedly with “overpasses” (AP 0.574). This extreme variance highlights a potential instability in the Transformer-based model’s query matching process; its global attention mechanism might excel with relatively uniform and distinctive targets like playgrounds but fail to consistently attend to the more elongated and contextually complex features of overpasses. Conversely, CenterNet shows uniformly lower performance across all categories, with the lowest overall mAP50 (0.764) among contemporary detectors, underscoring the limitations of its pure keypoint estimation approach in handling the scale and appearance diversity present in RSOD. In contrast, CGA-YOLO demonstrates balanced excellence. It not only secures the top AP in “aircraft” (0.954) and matches the best score in “playground” (0.995) but also maintains a robust, leading performance on the more challenging “overpass” category compared to other recent YOLO variants.

3.2.4. Comparison with Other Commonly Used Models on the Shandong Dataset

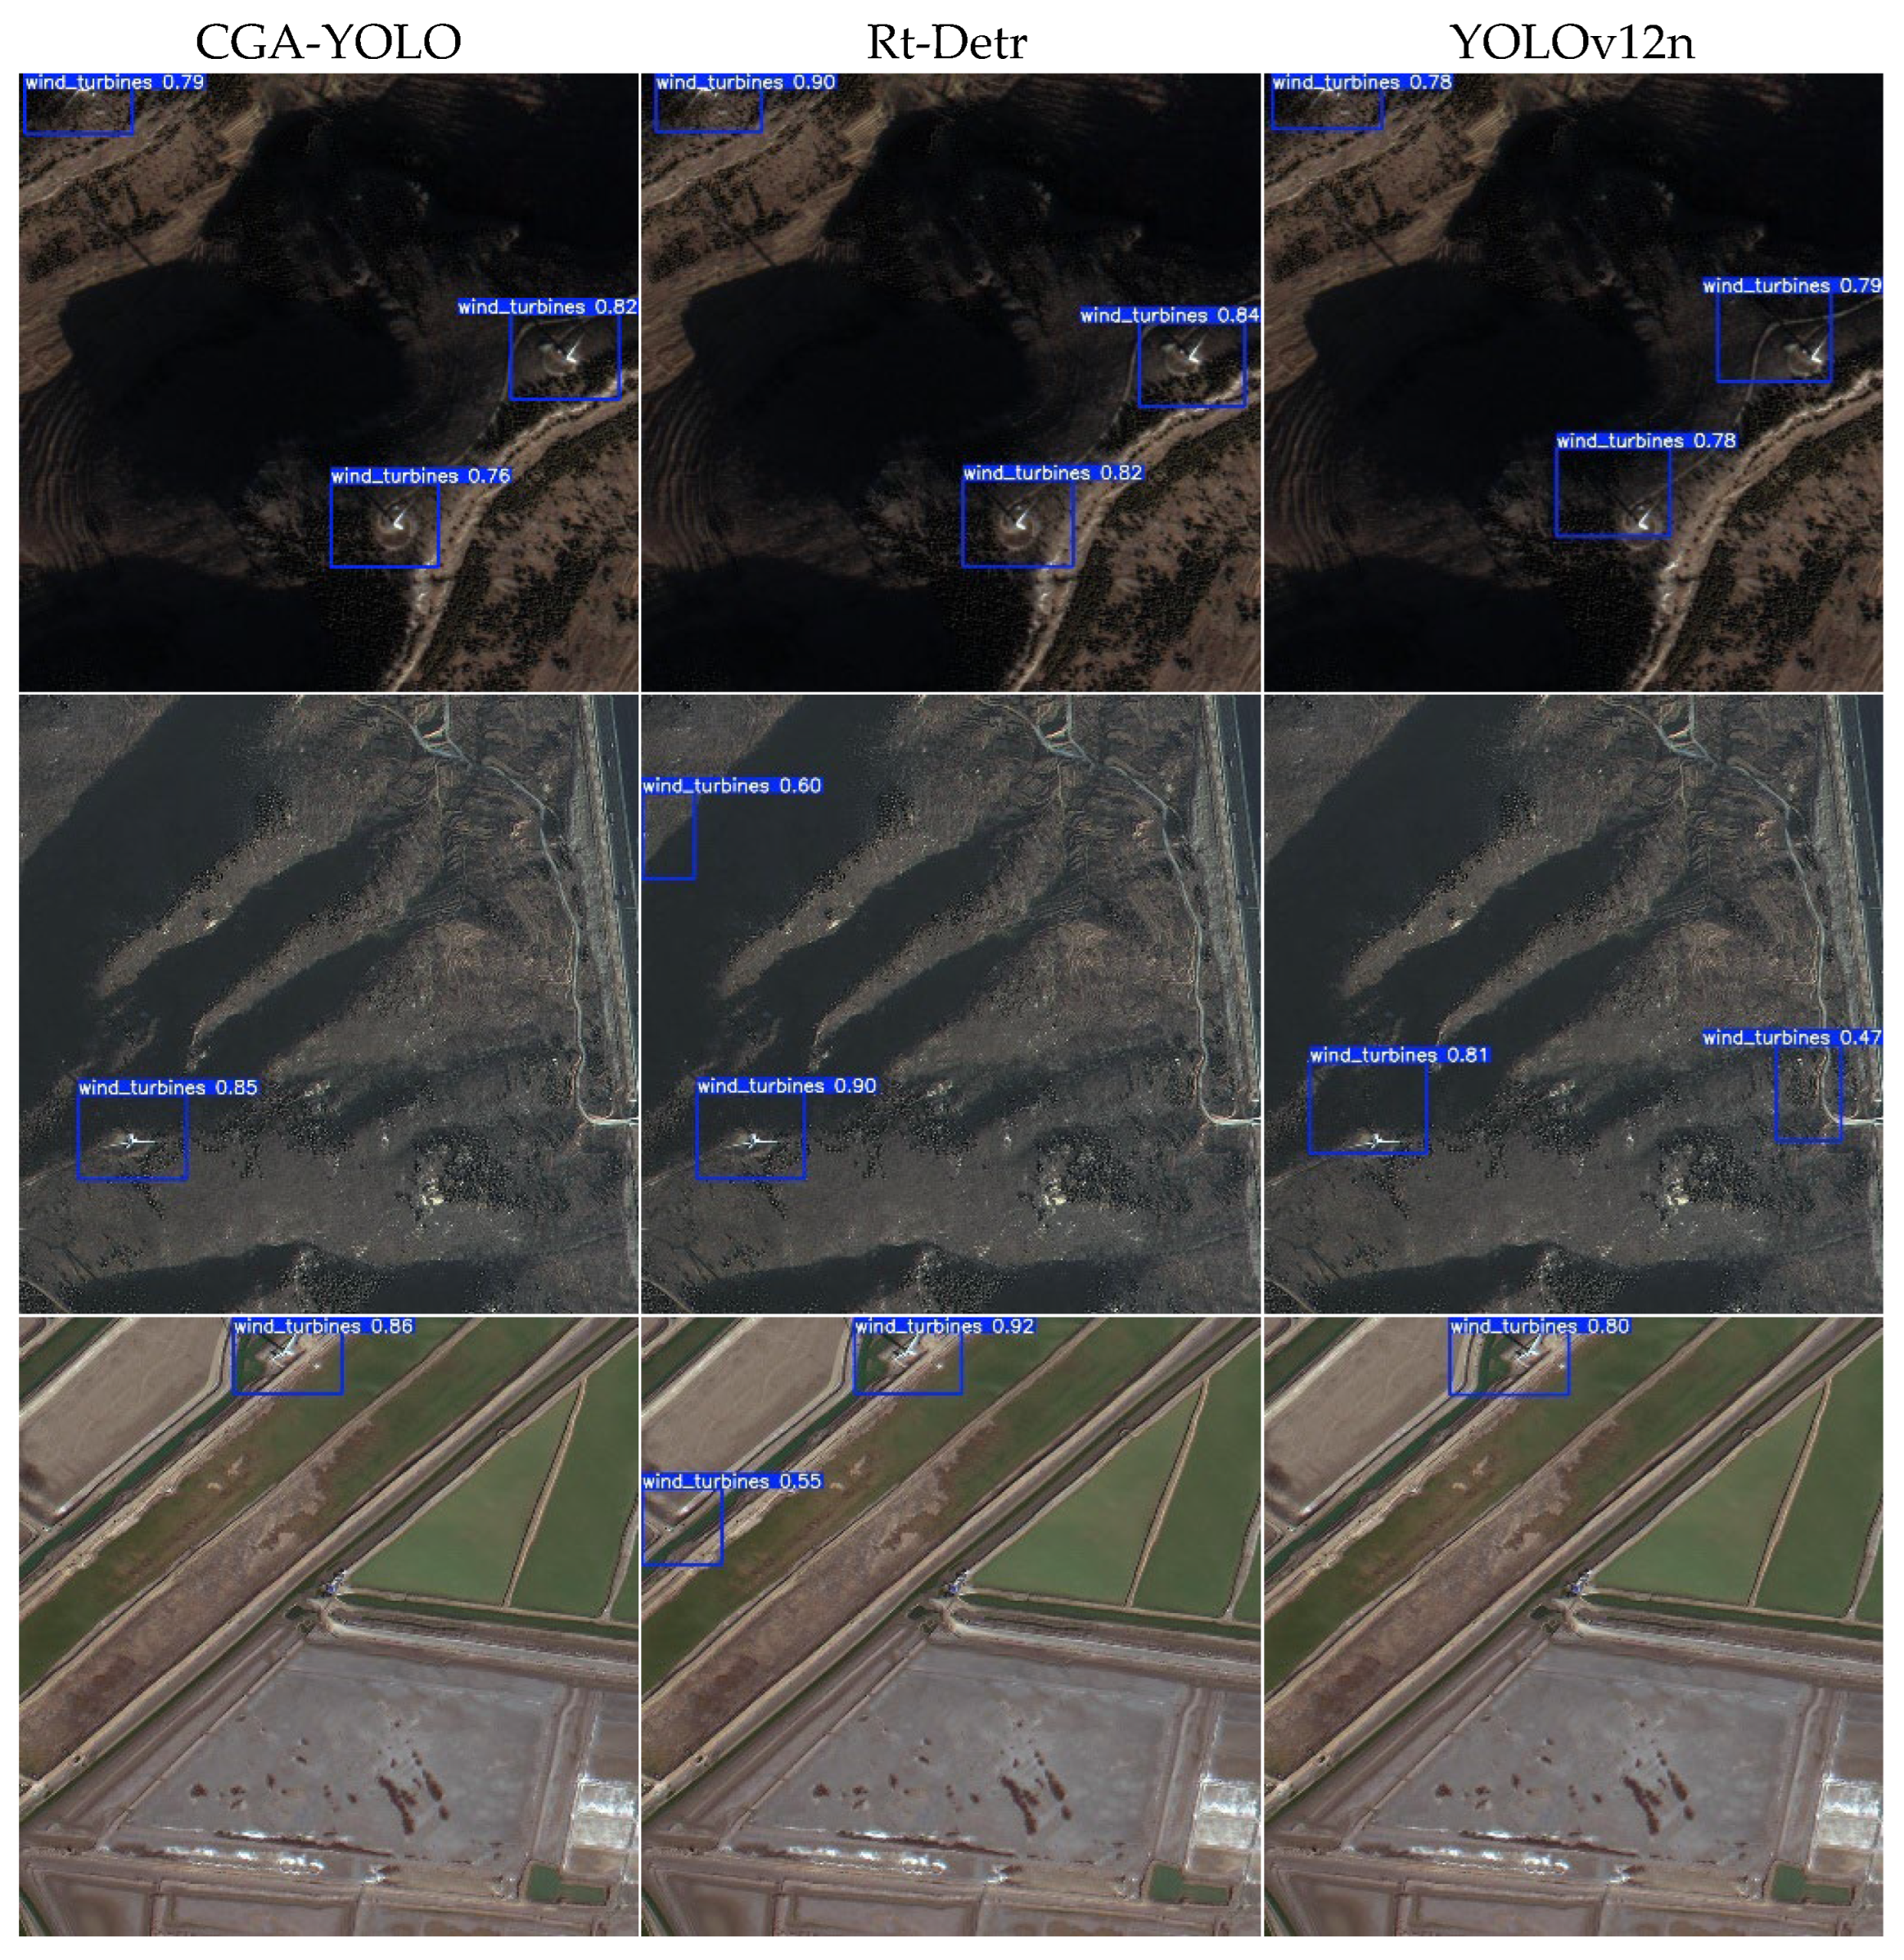
From the perspective of actual detection performance, the improved model demonstrates superior performance. As shown in the Figure 13, its detection results are “complete and accurate”, capable of fully identifying all targets and achieving extremely precise detection box positioning. In comparison, RT-Detr and YOLO12n exhibit significant deficiencies: both have varying degrees of target omissions, and the detection boxes generally suffer from positioning deviations. It is evident that the improved model significantly outperforms typical models in terms of target recognition completeness and positioning accuracy.

4. Discussion

4.1. A Comparative Analysis and Generalization Study of CGA-YOLO for Wind Turbine Detection Across Diverse Datasets

The experimental results across three distinct datasets comprehensively validate the superior performance and robust generalization ability of the CGA-YOLO model for wind turbine detection. As depicted in Table 6, on the training set SDWT, the model achieved an mAP50 of 0.938, laying a solid foundation for its generalization capability. Its performance on LEVIR-WT (mAP50: 0.925) exhibited only minimal fluctuation, demonstrating strong adaptability across diverse domestic scenes. The most rigorous assessment was conducted using the global WindTurbineNet dataset, which encompasses highly varied terrains, climates, and turbine models worldwide, posing a significant challenge to model robustness. On this dataset, CGA-YOLO attained an mAP50 of 0.897 and an F1-Score of 0.915, while maintaining a high recall of 0.923. These results indicate that the deep features extracted by the model possess strong universality, enabling it to overcome substantial cross-domain differences and perform effectively in complex real-world scenarios. The observed slight decrease in precision (0.908) compared to SDWT is anticipated, primarily attributable to unseen background interference in the global data, which leads to a minor increase in false positives. Nevertheless, the high recall rate and maintained precision strike an effective balance, resulting in a consistently robust F1-Score.

4.2. Cross-Regional Generalization Test on Wind Turbines in Qinghai

To further validate the generalization capability of the CGA-YOLO model in unseen geographical areas and under complex topographic conditions, it was tested on remote sensing imagery of wind turbines from the Qinghai Plateau. This region features complex terrain, variable illumination conditions, and a wind turbine distribution density significantly different from the Shandong (SDWT) dataset, providing an effective evaluation of model robustness for practical applications.
The model weights trained on the SDWT dataset were applied directly for inference on the Qinghai test set without any fine-tuning. The test set comprises 1024 images with a resolution of 1024 × 1024, covering diverse terrain and meteorological conditions.
As shown in Table 7, CGA-YOLO maintains optimal performance on the Qinghai wind turbine dataset, achieving an mAP50 of 0.921, an mAP50:95 of 0.698, and an mAPs of 0.587. Compared to YOLOv12n, mAP50 improved by 0.038, indicating the method’s strong adaptability and detection stability for small targets across different geographical environments.
Although the model performs well on preprocessed image tiles, it faces a high risk of false positives in real-world large-scale remote sensing scanning tasks, where targets are often sparsely distributed and most scenes contain no wind turbines. To address this, we have introduced non-target objects with similar morphologies—such as high-voltage towers and certain architectural structures—as negative samples during the training phase, aiming to enhance the model’s ability to distinguish analogous objects and thereby suppress false alarms. Nevertheless, relying solely on an end-to-end detection paradigm remains limited when dealing with entire large-scale remote sensing images. Therefore, future work will focus on exploring a cascaded detection framework based on the principle of “first locating wind farm regions, then identifying individual turbines.” This approach involves initially using a lightweight classification network or saliency detection method to rapidly extract potential regions of interest (ROIs) that may contain wind farms, thereby filtering out the majority of irrelevant background areas. Subsequently, the high-precision CGA-YOLO model will be applied within these candidate regions to achieve fine localization of individual turbines. This strategy is expected to significantly reduce the overall false positive rate in large-scale search scenarios while maintaining detection accuracy, thereby improving the reliability and practicality of the model in complex real-world applications.
Figure 14 showcases the wind turbine detection results of CGA-YOLO in typical mountainous and cloudy scenes in Qinghai. The model demonstrates the ability to identify wind turbine targets more completely even when targets are smaller and background interference is stronger, with precise bounding box positioning and minimal omission or false detection rates, highlighting its excellent generalization performance and practical utility.

4.3. Ablation Experimental Results

The ablation study data demonstrate that the introduction of each module contributes positively to model performance enhancement, and the rationality of the combination strategy is validated. As depicted in Table 8, when only the ConvBnAct module is used, the model achieves an mAP50 of 0.890 and an mAP50:95 of 0.646, indicating its solid foundational feature extraction capability. However, introducing the CBAM or GhostBottleneck modules individually resulted in mAP50 scores of 0.877 and 0.885, respectively, suggesting limited or slightly suboptimal gains from a single module, potentially due to a lack of synergistic integration with the overall network.
Further analysis of module combinations reveals that integrating ConvBnAct with CBAM increases precision to 0.937 while maintaining an mAP50 of 0.888, with no parameter increase (2.56 M). This confirms that CBAM’s attention mechanism effectively enhances the weighting of key features and reduces redundant information interference. Combining ConvBnAct with GhostBottleneck raises mAP50 to 0.894 and mAP50:95 to 0.652, demonstrating GhostBottleneck’s ability to improve model adaptability to complex scenes through feature reuse within a lightweight design, despite a slight parameter increase to 2.66 M.
Finally, the synergistic integration of all three modules leads to a comprehensive performance breakthrough: precision reaches 0.949, recall increases to 0.902, mAP50 and mAP50:95 attain 0.938 and 0.724, respectively—representing improvements of 4.8% and 7.8% over the baseline configuration—while the parameter count increases by only 0.1 M (2.66 M). This outcome indicates that ConvBnAct provides stable feature extraction, CBAM enhances attention, and GhostBottleneck enables efficient feature reuse, forming a complementary mechanism. This synergy avoids functional redundancy and significantly improves detection accuracy and robustness, validating the scientific effectiveness and optimal balance of accuracy and efficiency achieved by the selected module combination.

5. Conclusions

This paper proposes a high-precision remote sensing small-target detector named CGA-YOLO. Specifically, the detector incorporates three modular components: a Convolutional Block Attention Module (CBAM) for feature enhancement, a Dynamic Convolutional Block with Batch Normalization and Activation (Dynamic ConvBnAct), and a GhostBottleneck structure for feature capture. The CBAM consists of two sequential sub-modules: a channel attention module and a spatial attention module, which collectively guide the model towards “what” and “where” to focus on within an input image by computing complementary attention weights. The Dynamic ConvBnAct introduces the concept of dynamic convolution, intelligently integrating a set of learnable parameters (experts) to significantly enhance the model’s representational capacity. The GhostBottleneck module generates a rich set of feature maps through efficient operations, increasing the model’s probability of discovering and utilizing critical visual cues. It helps preserve high-resolution details and low-level features, which are crucial for small target detection, thereby mitigating feature loss. The integration strategy is as follows: first, the Dynamic ConvBnAct structure is incorporated into the backbone network’s feature extraction layers to accelerate and enhance the feature representation of small targets; second, the CBAM is applied within the feature fusion layers of the backbone to accelerate feature convergence and sharpen the network’s focus on small targets; finally, specific bottleneck structures are replaced with GhostBottleneck to improve the detection capability for small targets like wind turbines. Experimental results on the multi-scene VEDAI dataset demonstrate the robust performance of this method in the task of detecting wind turbine targets in satellite remote sensing imagery under complex backgrounds.
Concurrently, this paper constructs the Shandong Wind Turbine (SDWT) satellite remote sensing dataset, which covers diverse landforms within Shandong Province. Based on 1-m resolution imagery from the GF-2 satellite, this dataset encompasses typical terrains including plains, hills, and coastal areas. Through meticulous screening and annotation, it captures fine details of wind turbines, such as blade morphology, tower structure, and nacelles. The dataset employs adaptive processing to account for scale variations of wind turbines across different landforms and incorporates multi-seasonal imagery to enhance scene adaptability. Annotation errors are controlled within a 2-pixel tolerance. This dataset not only addresses the gap in region-specific, high-quality data but also provides a valuable benchmark for the remote sensing detection of small-to-medium-sized energy infrastructure.
This study has certain limitations, which present avenues for future improvement. The primary research directions and suggested enhancements are outlined as follows:
(1)
Integration of Lower-Resolution Imagery: The current model is validated on 1-m high-resolution data. Future work will explore cross-resolution feature transfer learning techniques to improve the model’s adaptability to 2–5 m resolution imagery, thereby expanding its applicability for large-area monitoring.
(2)
Model Efficiency Optimization: Without compromising accuracy, future efforts will focus on lightweight network design and inference acceleration to reduce parameter count and computational cost, meeting the requirements for real-time detection and large-scale surveying.
(3)
Development of a Multi-Task Detection Framework: Future models could be extended to a multi-task learning framework by integrating auxiliary information, such as land use/cover context associated with wind turbine sites. Combining pixel-level wind turbine detection with related tasks (e.g., land cover classification or ecological impact assessment) could improve the overall performance and utility of detecting wind power infrastructure in satellite imagery. The spatial correlation between wind turbine locations and ecological capacity could be leveraged to assist in identifying and monitoring ecosystem conditions in surrounding areas.
(4)
Limitation in Geographic Scenario-Specific Analysis: While the SDWT dataset and the proposed model are evaluated using comprehensive quantitative metrics (e.g., target scale, background complexity), the current work does not include a stratified performance analysis across discrete geographic categories (e.g., mountains, hills, plains, lakes). This limits a fine-grained understanding of model robustness under classical topographic variations. In future work, we plan to augment the dataset with formal geographic scene annotations and conduct a detailed evaluation of model performance per scenario, which will provide deeper insights into its generalization capability.
In summary, by integrating multi-source remote sensing data, advancing feature learning methodologies, and incorporating domain-specific knowledge, this research aims to develop a data- and knowledge-driven detection model for high-resolution satellite imagery. The ultimate goal is to enhance the performance and robustness of wind turbine infrastructure detection in operational scenarios.

Author Contributions

Conceptualization, J.M., G.W. and G.H.; methodology, J.M., G.H., G.W. and R.Y.; software, J.M.; validation, J.M., G.W., R.Y. and E.A.; formal analysis, J.M., E.A. and G.W.; investigation, J.M.; resources, G.W. and T.L.; data curation, J.M., G.W., R.Y. and D.Z.; writing—original draft preparation, J.M.; writing—review and editing, J.M., G.W. and D.Z.; visualization, J.M. and D.Z.; supervision, G.W. and Z.Z.; project administration, G.W. and T.L.; funding acquisition, G.W. and Z.Z.; All authors have read and agreed to the published version of the manuscript.

Funding

This work is supported by the program of the National Natural Science Foundation of China (grant number: 61860206004, 61731022).

Data Availability Statement

The data presented in this study are available upon request from the corresponding author. Access is restricted because the GaoFen-2 satellite data were acquired under a proprietary license for dedicated scientific use and are not authorized for public distribution.

Conflicts of Interest

The authors declare no conflicts of interest.

References

  1. Intergovernmental Panel on Climate Change. Climate Change 2023: Synthesis Report; IPCC: Geneva, Switzerland, 2023. [Google Scholar]
  2. National Energy Administration. Statistics on the National Power Industry from January to July 2024; National Energy Administration (NEA): Beijing, China, 2024.
  3. International Energy Agency. Renewables 2024; IEA: Paris, France, 2024. [Google Scholar]
  4. Development Research Centre of the State Council; Shell International Limited. Embracing the Future, Powering Growth: An Energy System Renewed for China; China Development Press: Beijing, China, 2024.
  5. Li, Y.; Tang, X.; Liu, M.; Chen, G. The benefits and burdens of wind power systems in reaching China’s renewable energy goals: Implications from resource and environment assessment. J. Clean. Prod. 2024, 481, 144134. [Google Scholar] [CrossRef]
  6. Song, X.K.; Li, Z.Y. Seasonally Robust Offshore Wind Turbine Detection in Sentinel-2 Imagery Using Imaging Geometry-Aware Deep Learning. Remote Sens. 2025, 17, 2482. [Google Scholar] [CrossRef]
  7. Chen, X.F.; Zhang, Y.L.; Xue, W.; Liu, S.M.; Li, J.G.; Meng, L.; Yang, J.; Mi, X.F.; Wan, W.; Meng, Q.Y. Quantitative Remote Sensing Supporting Deep Learning Target Identification: A Case Study of Wind Turbines. Remote Sens. 2025, 17, 733. [Google Scholar] [CrossRef]
  8. Deng, F.Y.; Qiao, B.J.; Li, K.T.; Zhao, L.M.; Chen, X.F.; Li, J.G.; Liu, J.; Sun, Y. Wind turbine detection based on high spatial resolution four-band reflectance images. In Proceedings of the 6th International Conference on Geoscience and Remote Sensing Mapping-GRSM, Qingdao, China, 25–27 October 2025. [Google Scholar]
  9. Fei, Y.S.; Gao, Y.N.; Gu, H.Y.; Sun, Y.Q.; Tian, Y.J. YOLOv5_CDB: A Global Wind Turbine Detection Framework Integrating CBAM and DBSCAN. Remote Sens. 2025, 17, 1322. [Google Scholar] [CrossRef]
  10. Yu, E.Z.; Zhang, X.Y. Wind Turbine Detection and Analysis Based On Deep Learning Methods. In Proceedings of the 2nd International Conference on Computer Vision and Intelligent Technology, Huaibei, China, 24–27 November 2024; IEEE: New York, NY, USA, 2024. [Google Scholar]
  11. Xue, R.Z.; Xu, H.Q.; Wu, Q.L. EGRN-YOLO: An Enhanced Multi-View Remote Sensing Detection Algorithm for Onshore Wind Turbines Based on YOLOv7. IEEE Access 2025, 13, 42457–42471. [Google Scholar] [CrossRef]
  12. Zhou, S.L.; Zhou, H.J. Detection Based on Semantics and a Detail Infusion Feature Pyramid Network and a Coordinate Adaptive Spatial Feature Fusion Mechanism Remote Sensing Small Object Detector. Remote Sens. 2024, 16, 2416. [Google Scholar] [CrossRef]
  13. Sha, P.C.; Lu, S.J.; Xu, Z.J.; Yu, J.H.; Li, L.; Zou, Y.B.; Zhao, L.L. OWTDNet: A Novel CNN-Mamba Fusion Network for Offshore Wind Turbine Detection in High-Resolution Remote Sensing Images. J. Mar. Sci. Eng. 2025, 13, 2124. [Google Scholar] [CrossRef]
  14. Chen, J.B.; Yue, A.Z.; Wang, C.Y.; Huang, Q.Q.; Chen, J.S.; Meng, Y.; He, D.X. Wind turbine extraction from high spatial resolution remote sensing images based on saliency detection. J. Appl. Remote Sens. 2018, 12, 016041. [Google Scholar] [CrossRef]
  15. Xie, J.; Tian, T.T.; Hu, R.C.; Yang, X.; Xu, Y.; Zan, L.Y. A Novel Detector for Wind Turbines in Wide-Ranging, Multiscene Remote Sensing Images. IEEE J. Sel. Top. Appl. Earth Obs. Remote Sens. 2024, 17, 17725–17738. [Google Scholar] [CrossRef]
  16. Zhang, S.; Wang, F.X.; Hou, Y.Z.; Wang, J.F.; Guo, J.K. Global offshore wind turbine detection: A combined application of deep learning and Google earth engine. Int. J. Remote Sens. 2024, 45, 6601–6623. [Google Scholar] [CrossRef]
  17. Chen, D.L.; Cheng, T.T.; Lu, Y.Y.; Gao, K.L.; Fatholahi, S.; Li, J. Research on Fast Detection Method of Wind Turbine in Remote Sensing Image Land Area Based on Yolo. In Proceedings of the IEEE International Geoscience and Remote Sensing Symposium (IGARSS), Pasadena, CA, USA, 16–21 July 2023; IEEE: New York, NY, USA, 2023; pp. 2823–2826. [Google Scholar]
  18. Xia, G.S.; Bai, X.; Ding, J.; Zhu, Z.; Belongie, S.; Luo, J.B.; Datcu, M.; Pelillo, M.; Zhang, L.P. DOTA: A Large-scale Dataset for Object Detection in Aerial Images. In Proceedings of the 31st IEEE/CVF Conference on Computer Vision and Pattern Recognition (CVPR), Salt Lake City, UT, USA, 18–23 June 2018; IEEE: New York, NY, USA, 2018; pp. 3974–3983. [Google Scholar]
  19. Bashir, S.M.A.; Wang, Y. Small Object Detection in Remote Sensing Images with Residual Feature Aggregation-Based Super-Resolution and Object Detector Network. Remote Sens. 2021, 13, 1854. [Google Scholar] [CrossRef]
  20. Böhme, G.S.; Fadigas, E.A.; Martinez, J.R.; Tassinari, C.E.M. Analysis of the Use of Remote Sensing Measurements for Developing Wind Power Projects. J. Sol. Energy Eng.-Trans. Asme 2019, 141, 041005. [Google Scholar] [CrossRef]
  21. Woo, S.H.; Park, J.; Lee, J.Y.; Kweon, I.S. CBAM: Convolutional Block Attention Module. In Proceedings of the 15th European Conference on Computer Vision (ECCV), Munich, Germany, 8–14 September 2018; pp. 3–19. [Google Scholar]
  22. Liu, Y.; Zhang, Y.; Wang, Y.X.; Hou, F.; Yuan, J.; Tian, J.; Zhang, Y.; Shi, Z.C.; Fan, J.P.; He, Z.Q. A Survey of Visual Transformers. IEEE Trans. Neural Netw. Learn. Syst. 2024, 35, 7478–7498. [Google Scholar] [CrossRef] [PubMed]
  23. Mandroux, N.; Dagobert, T.; Drouyer, S.; von Gioi, R.G. Wind Turbine Detection on Sentinel-2 Images. In Proceedings of the IEEE International Geoscience and Remote Sensing Symposium (IGARSS), Brussels, Belgium, 12–16 July 2021; IEEE: New York, NY, USA, 2021; pp. 4888–4891. [Google Scholar]
  24. Zhu, M.Y.; Yang, Z.C.; Zhou, H.; Du, C.; Wong, A.; Wei, Y.B.; Deng, Z.; Han, M.; Lai, J.H.; Soc, I.C. TinyWT: A Large-ScaleWind Turbine Dataset of Satellite Images for Tiny Object Detection. In Proceedings of the IEEE/CVF Winter Conference on Applications of Computer Vision (WACV), Waikoloa, HI, USA, 4–8 January 2024; pp. 794–804. [Google Scholar]
  25. Wang, J.W.; Yang, W.; Guo, H.W.; Zhang, R.X.; Xia, G.S.; Ieee Comp, S.O.C. Tiny Object Detection in Aerial Images. In Proceedings of the 25th International Conference on Pattern Recognition (ICPR), Milan, Italy, 10–15 January 2021; pp. 3791–3798. [Google Scholar]
  26. Zhou, H.Y.; Li, J.X.; Peng, J.Q.; Zhang, S.; Zhang, S.H.; Assoc Comp, M. Triplet Attention: Rethinking the similarity in Transformers. In Proceedings of the 27th ACM SIGKDD International Conference on Knowledge Discovery and Data Mining (KDD), online, 14–18 August 2021; pp. 2378–2388. [Google Scholar]
  27. Han, K.; Wang, Y.H.; Tian, Q.; Guo, J.Y.; Xu, C.J.; Xu, C. GhostNet: More Features from Cheap Operations. In Proceedings of the IEEE/CVF Conference on Computer Vision and Pattern Recognition (CVPR), Seattle, WA, USA, 14–19 June 2020; IEEE: New York, NY, USA, 2020; pp. 1577–1586. [Google Scholar]
  28. Ntrougkas, M.V.; Gkalelis, N.; Mezaris, V. T-TAME: Trainable Attention Mechanism for Explaining Convolutional Networks and Vision Transformers. IEEE Access 2024, 12, 76880–76900. [Google Scholar] [CrossRef]
  29. Zheng, X.Y.; Bi, J.X.; Li, K.D.; Zhang, G.; Jiang, P. SMN-YOLO: Lightweight YOLOv8-Based Model for Small Object Detection in Remote Sensing Images. IEEE Geosci. Remote Sens. Lett. 2025, 22, 8001305. [Google Scholar] [CrossRef]
  30. Aguilera, A.C.; Olmos, P.M.; ArtéTs-Rodríguez, A.; Pérez-Cruz, F. Regularizing transformers with deep probabilistic layers. Neural Netw. 2023, 161, 565–574. [Google Scholar] [CrossRef] [PubMed]
  31. Liu, G.Y.; Yang, D.R.; Ye, J.; Lu, H.J.; Wang, Z.; Zhao, Y. A real-time welding defect detection framework based on RT-DETR deep neural network. Adv. Eng. Inform. 2025, 65, 103318. [Google Scholar] [CrossRef]
  32. Liu, F.L.; Zheng, Q.H.; Tian, X.Y.; Shu, F.; Jiang, W.W.; Wang, M.H.; Elhanashi, A.; Saponara, S. Rethinking the multi-scale feature hierarchy in object detection transformer (DETR). Appl. Soft Comput. 2025, 175, 113081. [Google Scholar] [CrossRef]
  33. Chefer, H.; Gur, S.; Wolf, L. Generic Attention-model Explainability for Interpreting Bi-Modal and Encoder-Decoder Transformers. In Proceedings of the 18th IEEE/CVF International Conference on Computer Vision (ICCV), Montreal, QC, Canada, 11–17 October 2021; IEEE: New York, NY, USA, 2021; pp. 387–396. [Google Scholar]
  34. Hou, X.Q.; Liu, M.Q.; Zhang, S.L.; Wei, P.; Chen, B.D.; Lan, X.G. Relation DETR: Exploring Explicit Position Relation Prior for Object Detection. In Proceedings of the 18th European Conference on Computer Vision (ECCV), Milan, Italy, 29 September–4 October 2025; pp. 89–105. [Google Scholar]
  35. Psomas, B.; Kakogeorgiou, I.; Karantzalos, K.; Avrithis, Y. Keep It SimPool: Who Said Supervised Transformers Suffer from Attention Deficit? In Proceedings of the IEEE/CVF International Conference on Computer Vision (ICCV), Paris, France, 2–6 October 2023; IEEE: New York, NY, USA, 2023; pp. 5327–5337. [Google Scholar]
  36. Dong, Y.; Xu, F.C.; Guo, J.H. LKR-DETR: Small object detection in remote sensing images based on multi-large kernel convolution. J. Real-Time Image Process. 2025, 22, 46. [Google Scholar] [CrossRef]
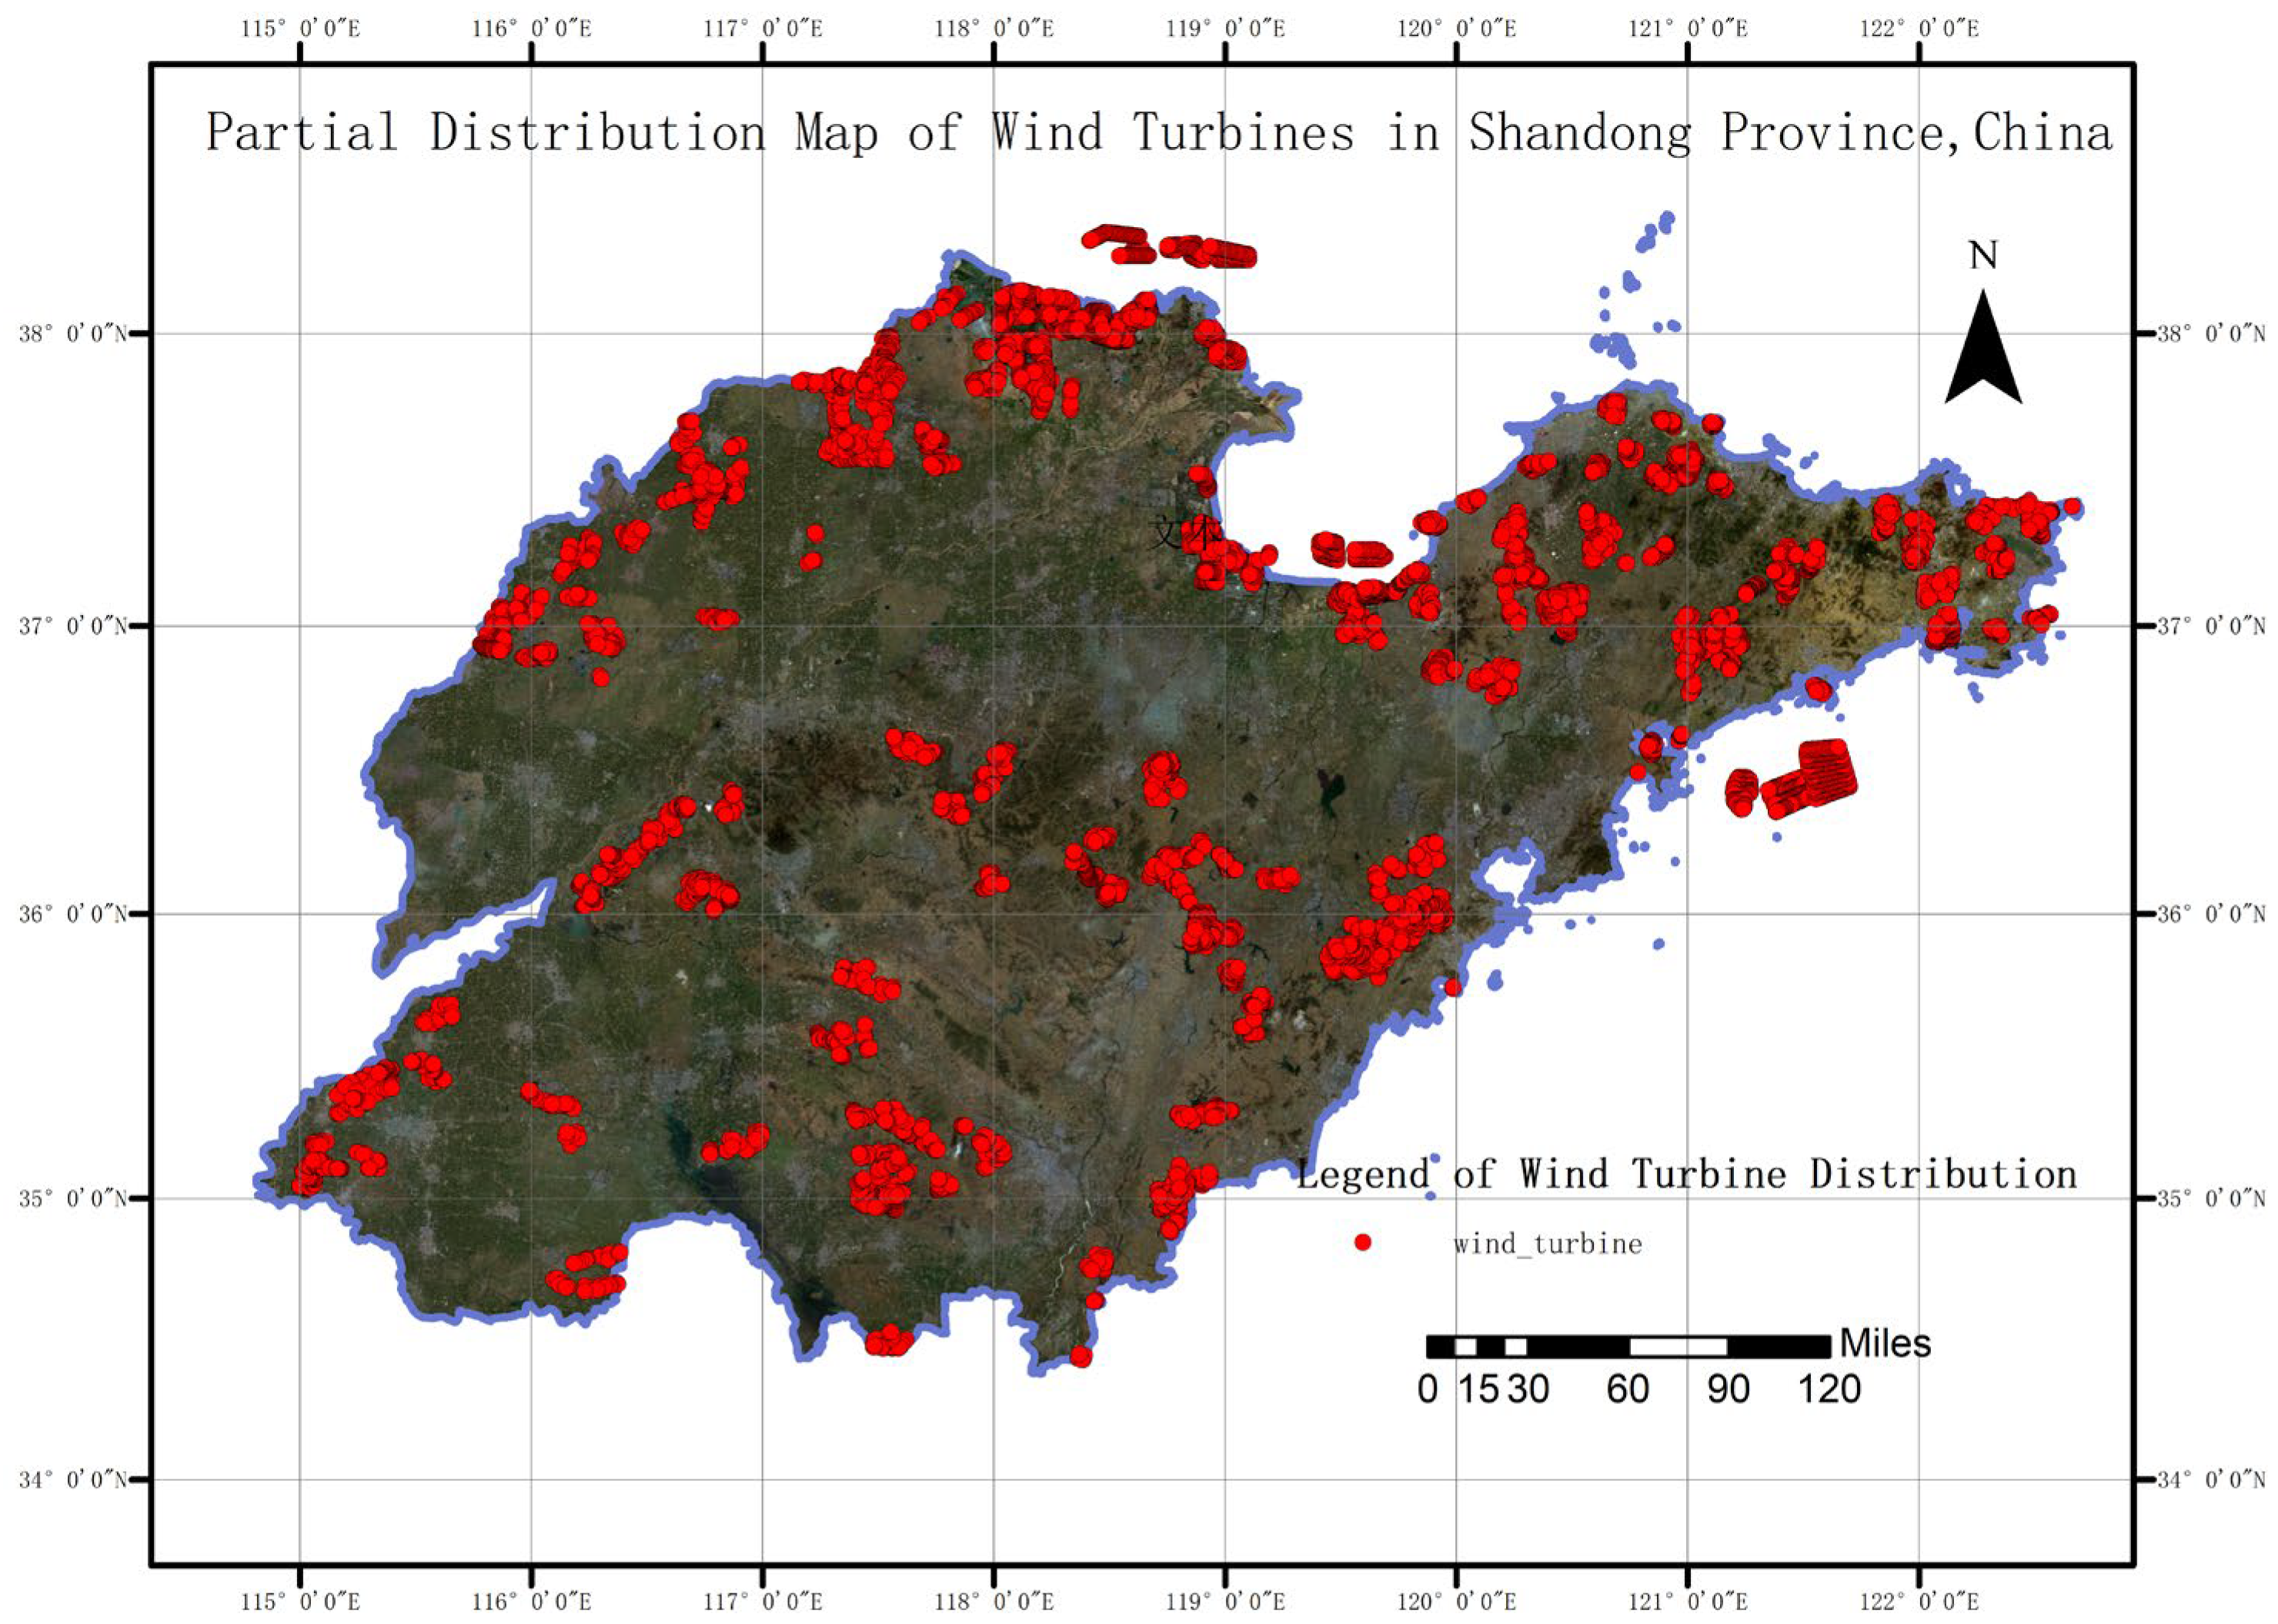
Figure 1. Partial Distribution Map of Wind Turbines in Shandong Province, China.
Remotesensing 18 00324 g001
Figure 2. The processing and labeling results of the SDWT dataset using Gaofen-2 (GF-2) satellite imagery. (a) Cropped sub-image; (b) Manual annotation result (the blue bounding box represents the wind turbine target); (c) Cropped sub-image; (d) Manual annotation result (the blue bounding box represents the wind turbine target).
Remotesensing 18 00324 g002
Figure 3. Demonstration of SDWT Dataset Complexity. (a) Background complexity Metrics comparison; (b) SDWT image visual features distribution.
Remotesensing 18 00324 g003
Figure 4. Overall Framework of CGA-YOLO (Three Core Components).
Remotesensing 18 00324 g004
Figure 5. Diagram of each attention sub-module. As illustrated, the channel sub-module utilizes both max-pooling outputs and average-pooling outputs with a shared network; the spatial sub-module utilizes similar two outputs that are pooled along the channel axis and forward them to a convolution layer.
Remotesensing 18 00324 g005
Figure 6. Structure of Dynamic ConvBnAct.
Remotesensing 18 00324 g006
Figure 7. Structures of GhostBottleneck Module.
Remotesensing 18 00324 g007
Figure 8. Comparison of Different Channel Feature Outputs Between the Baseline Model and Post-Replacement Models at Corresponding Output Layers ((TopDown): Original, Dynamic ConvBnAct, CBAM, GhostBottleneck). Feature heatmaps show network focus regions; red = high activation, blue = low activation.
Remotesensing 18 00324 g008
Figure 9. CGA-YOLO Module Synergy Analysis: Different Channel Feature Outputs After Top-Down Module Replacement (Original, Dynamic ConvBnAct, CBAM, GhostBottleneck). Feature heatmaps show network focus regions; red = high activation, blue = low activation.
Remotesensing 18 00324 g009
Figure 10. Detection results for wind turbines.
Remotesensing 18 00324 g010
Figure 11. Detection results for VEDAI in typical scenarios (e.g., pickup, tractors, cars).
Remotesensing 18 00324 g011
Figure 12. Typical detection performance on the RSOD dataset.
Remotesensing 18 00324 g012
Figure 13. Performance comparison among CGA-YOLO, Rt-Detr and YOLOv12n.
Remotesensing 18 00324 g013
Figure 14. Presentation of Model Results on Wind Turbines in Qinghai Province.
Remotesensing 18 00324 g014
Table 1. Comparison of publicly available datasets for wind turbine detection.
DatasetSourcePrimary BackgroundsTarget ScalesKey Characteristics
DOTAGoogle EarthMixed Urban/
Rural
Multi-scaleGeneral-purpose; limited wind turbine samples.
LEVIR-WTGoogle EarthMountains/
Marine
Large/
Medium
High-resolution; focused on diverse topography.
WindTurbineNetSatelliteGlobal DiversityVery Wide RangeLarge-scale; significant scale variation.
SDWT (Ours)UAV/SatelliteAgricultural/
Vegetation
Small/
Medium
Region-specific; complex natural backgrounds.
Table 2. Parameter counts of CGA-YOLO in backbone.
No.ModuleInputOutputParamsNo.ModuleInputOutputParams
0Conv31546412A2C2f38412886,912
1ConvBnAct1616931613Upsample1281280
2CBAM161613014Concat1921920
3C3k21664612815GhostBottleneck19264122,528
4Conv646436,99216Conv646436,992
5C3k26412826,08017Concat1921920
6Conv128128147,71218A2C2f19212874,624
7A2C2f128128181,12019Conv128128147,712
8Conv128256295,42420Concat3843840
9A2C2f256256689,92021Conv38425637,800
10Upsample256256022C3k2256128438,880
11Concat384384023Detect128128438,880
Table 3. Comparative Experimental Results for CGA-YOLO on SDWT Dataset.
MethodsPrecisionRecallF1mAP50mAP50-95mAPs
Detr0.6030.9060.7210.8290.5630.565
Fasterrcnn0.8820.9040.8900.8860.4620.409
Efficientdet0.8910.9110.8790.9190.4850.427
CenterNet0.9610.8190.8910.9130.5990.492
Rt-detr0.9520.9810.9200.9240.6760.573
YOLOv8n0.8960.9400.9110.8980.6630.496
YOLOv10n0.9240.9330.9000.8970.6160.459
YOLO-World0.8730.8270.8500.7600.5050.439
YOLOv12n0.9150.9070.9110.8760.6890.574
CGA-YOLO0.9490.9630.9340.9380.7240.603
Table 4. Comparative Experimental Results for CGA-YOLO on the VEDAI Dataset.
MethodsCarPickupCampingTruckTractorsVansmAP50mAP50-95
Detr0.6340.6840.5160.5560.6530.3790.5730.381
Fasterrcnn0.5250.6220.6320.6010.6400.5840.6010.423
Efficientdet0.4970.7230.7800.4460.6210.6030.6120.390
CenterNet0.7060.8300.7220.6390.6860.2090.6320418
Rt-detr0.7960.7250.5150.4610.6840.380.5940.367
YOLOv8n0.7930.6920.5160.4930.4580.530.580.341
YOLOv10n0.7610.650.4560.3760.4160.4830.5240.323
YOLOv12n0.7820.6570.5550.5180.6120.520.6180.404
CGA-YOLO0.8820.8080.6270.5390.7060.5340.6830.427
Table 5. Comparison Experiments Results for CGA-YOLO on the RSOD Dataset.
MethodsAircraftOiltankOverpassPlaygroundmAP50mAP50-95
Detr0.7190.9700.8770.9720.8840.578
Fasterrcnn0.7560.9580.8560.9690.8850.593
Efficientdet0.9010.9600.7860.9060.8130.576
CenterNet0.6730.8030.7600.8180.7640.469
Rt-detr0.9480.930.5740.990.8610.598
YOLOv8n0.9280.9640.8570.9950.8860.611
YOLOv10n0.9020.950.5740.950.8440.565
YOLO-World0.7080.9300.6980.8260.7910.582
YOLOv12n0.7820.9580.5140.9540.8020.116
CGA-YOLO0.9540.9660.6970.9950.9030.627
Table 6. CGA-YOLO Performance Data on Different Wind Turbine Datasets.
MethodsPrecisionRecallF1mAP50
LEVIR-WT0.9350.9520.9230.925
WindTurbineNet0.9080.9230.9150.897
SDWT0.9490.9630.9340.938
Table 7. Comparison experiments for CGA-YOLO in Qinghai Province.
MethodsPrecisionRecallF1mAP50mAP50-95
YOLOv8n0.8720.9010.8860.8830.645
RT-DETR0.9350.9450.9400.9070.681
YOLOv12n0.8940.8920.8930.8830.662
CGA-YOLO0.9420.9380.9400.9210.698
Table 8. Ablation Study on the Contributions of ConvBnAct, CBAM, and GhostBottleneck Modules on SDWT Dataset.
ConvBnActCBAMGhostBottleneckPrecisionRecallmAP50mAP50:95Para
×××0.9150.9070.8760.6892.56 M
××0.9310.8720.8900.6462.56 M
××0.9250.8600.8770.5912.56 M
××0.9300.8630.8850.5962.65 M
×0.9370.8680.8880.6462.56 M
×0.9400.8370.8940.6522.66 M
×0.9270.8550.8790.5862.66 M
0.9490.9600.9380.7242.66 M
Disclaimer/Publisher’s Note: The statements, opinions and data contained in all publications are solely those of the individual author(s) and contributor(s) and not of MDPI and/or the editor(s). MDPI and/or the editor(s) disclaim responsibility for any injury to people or property resulting from any ideas, methods, instructions or products referred to in the content.