1. Introduction
Reservoir sedimentation progressively reduces the storage capacity and operational performance of aging reservoirs, compromising their flood-control, water-supply, irrigation, and ecological functions [
1,
2,
3]. Dredging can restore storage capacity and extend infrastructure service life, but large-scale projects also reshape reservoir-bed topography, redistribute substantial volumes of earth material, and create new engineered landforms. Such interventions may therefore transform the physical and engineering setting of an aging reservoir rather than merely restoring its lost storage capacity.
Plain reservoirs are broad, shallow storage systems constructed in low-relief terrain and commonly enclosed by long earthfill embankments [
4]. Compared with valley reservoirs, they are typically characterized by large water surface areas, shallow water depths, low dams, and long embankments [
5]. Their gentle bed gradients favor sediment deposition, while their extensive embankments and frequently alluvial foundations may exhibit spatially variable seepage and deformation. During rehabilitation, excavation may alter reservoir bathymetry and local hydraulic boundary conditions, whereas the placement of dredged or excavated material introduces new loads and fills that may undergo compaction and consolidation. The resulting reservoir system comprises mature hydraulic structures, a reshaped basin, and recently modified ground whose deformation may vary spatially.
Conventional dam safety monitoring relies primarily on leveling, settlement gauges, Global Navigation Satellite System (GNSS) observations, piezometers, seepage measurements, and visual inspections. These observations are essential for safety assessment but generally concentrate on selected structures or cross-sections. Interferometric Synthetic Aperture Radar (InSAR) provides repeated, spatially distributed measurements of line-of-sight (LOS) displacement [
6,
7,
8]. Its sensitivity to small displacements, wide-area coverage, and regular repeat acquisitions make InSAR well suited to monitoring ground and infrastructure deformation [
9,
10,
11].
Over the past two decades, InSAR has been increasingly applied to deformation monitoring across different types of dams and reservoir-related infrastructure. For concrete gravity and arch dams, Wang et al. [
12], Liao et al. [
13], Tavakkoliestahbanati et al. [
14] and Ziemer et al. [
15] used InSAR to characterize millimeter- to centimeter-scale deformation associated with thermal effects, reservoir-level variations, long-term structural responses, and, in some cases, pre-failure deformation. Jänichen et al. [
16] further demonstrated the integration of InSAR with in situ measurements for operational dam monitoring.
Earth and rockfill dams generally exhibit larger and more persistent deformation associated with fill consolidation, foundation compression, seepage, and reservoir loading. Tomás et al. [
17] reconstructed approximately 15 years of deformation at the La Pedrera earthfill dam and attributed the observed displacement primarily to long-term consolidation. Zhou et al. [
18], Li et al. [
19] and Xie et al. [
20] further demonstrated the application of InSAR to post-construction settlement monitoring and highlighted the effects of radar geometry, surface conditions, and seasonal inundation on deformation measurement and spatial coverage. Milillo et al. [
21] combined multi-sensor SAR observations to identify persistent subsidence at the Mosul Dam associated with dissolution of underlying evaporite layers and changes in maintenance grouting.
Long embankments surrounding plain reservoirs share several InSAR monitoring characteristics with levees and other elongated flood-defense structures, including extended linear geometry, spatially variable settlement, and heterogeneous surface conditions. Hanssen and van Leijen [
22] demonstrated systematic PSI monitoring of Dutch flood defenses and found that hard surfaces provided reliable scatterers, whereas vegetated slopes were frequently affected by temporal decorrelation. Özer et al. [
23] detected sub-seasonal swelling and shrinkage of canal levees associated with meteorological and hydrogeological variations, while Nguyen et al. [
24] obtained InSAR deformation patterns consistent with in situ measurements along levees in New Orleans. Xiao et al. [
25] and Xie et al. [
26] independently investigated the Sardoba reservoir failure using InSAR and identified localized differential settlement near the breached section. Xiao et al. [
27] reconstructed seven years of deformation along the 9.6 km long Shuangwangcheng reservoir embankment and identified long-term consolidation as the dominant process.
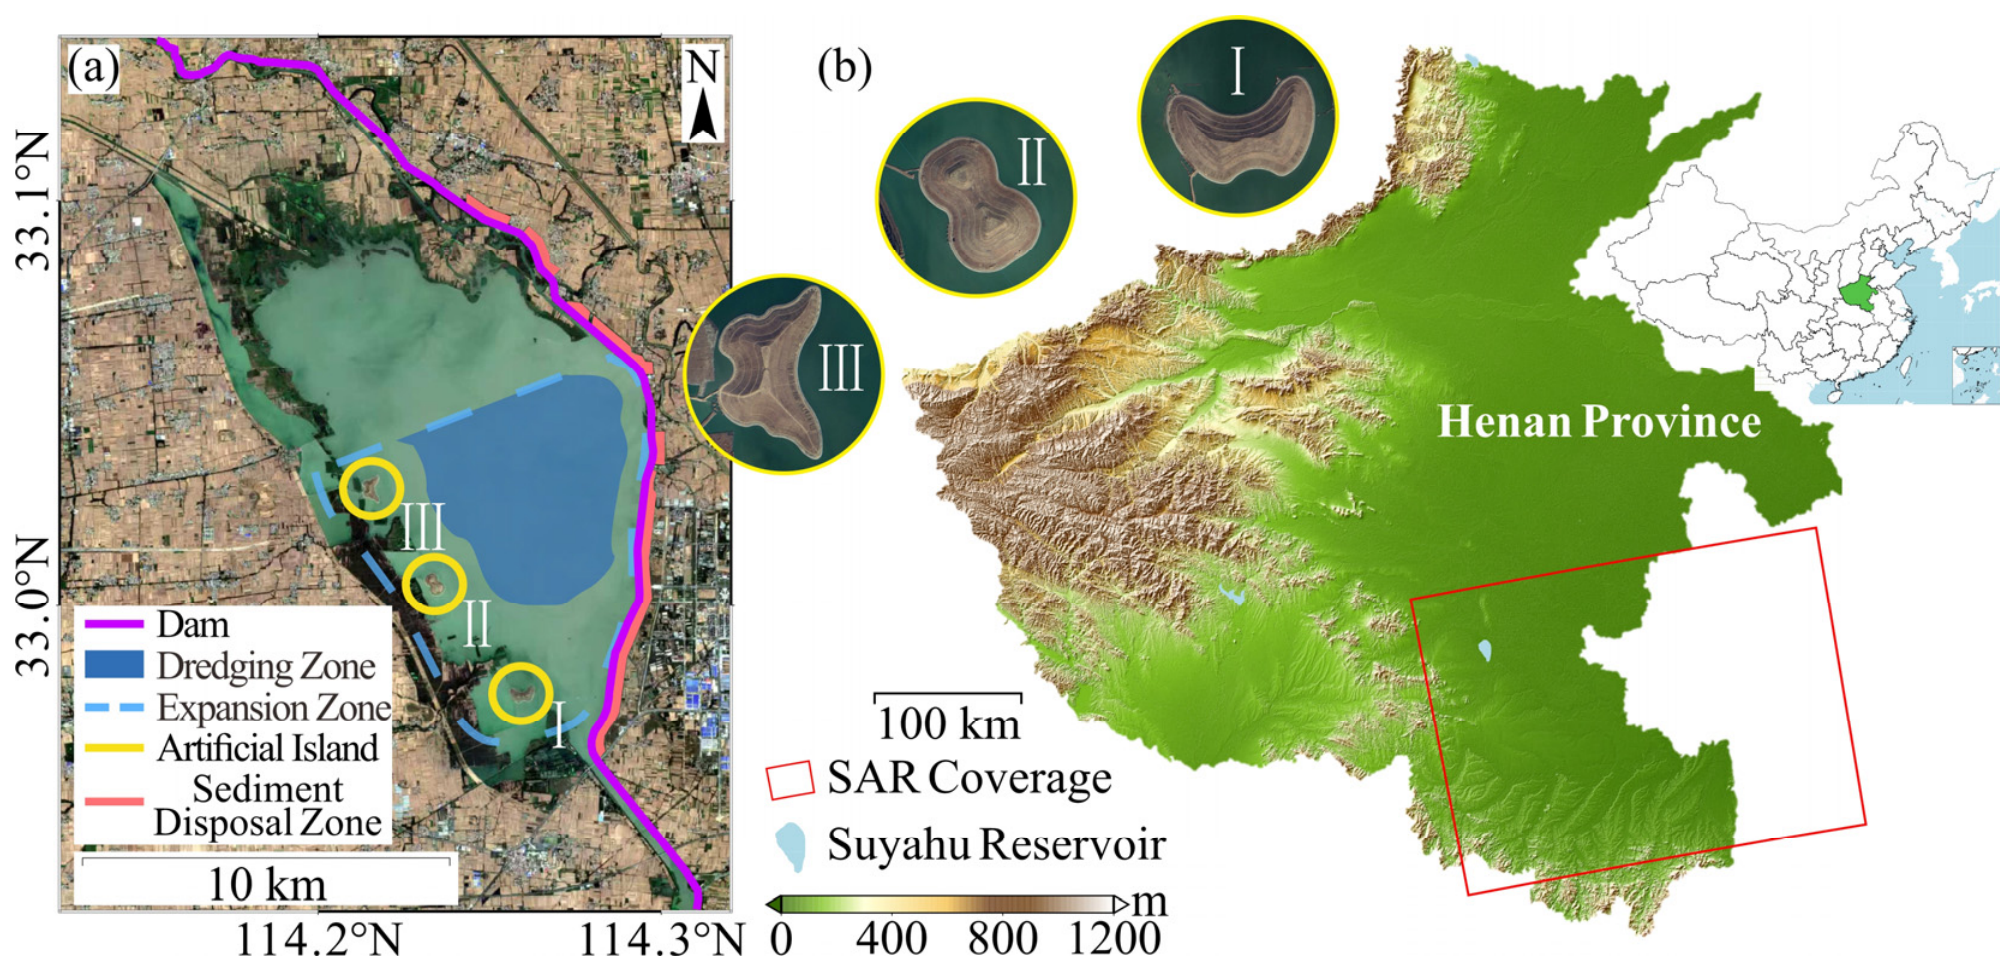
Previous studies have focused on dams as the primary monitoring objects. Comparatively little attention has been paid to system-scale deformation when an aging reservoir undergoes major sediment removal, basin reshaping, and excavated material redistribution. In particular, the spatial and temporal deformation of mature hydraulic structures relative to recently modified ground remains insufficiently documented. Suyahu Reservoir in central China provides a suitable case for investigating this issue [
28]. The reservoir is enclosed by an exceptionally long earthfill embankment and has operated for more than six decades. Following substantial loss of effective storage through sediment accumulation, a large-scale dredging and capacity expansion project was initiated in 2019. The project reshaped parts of the reservoir basin and placed excavated materials in disposal and newly formed engineered areas, producing a spatially heterogeneous reservoir setting.
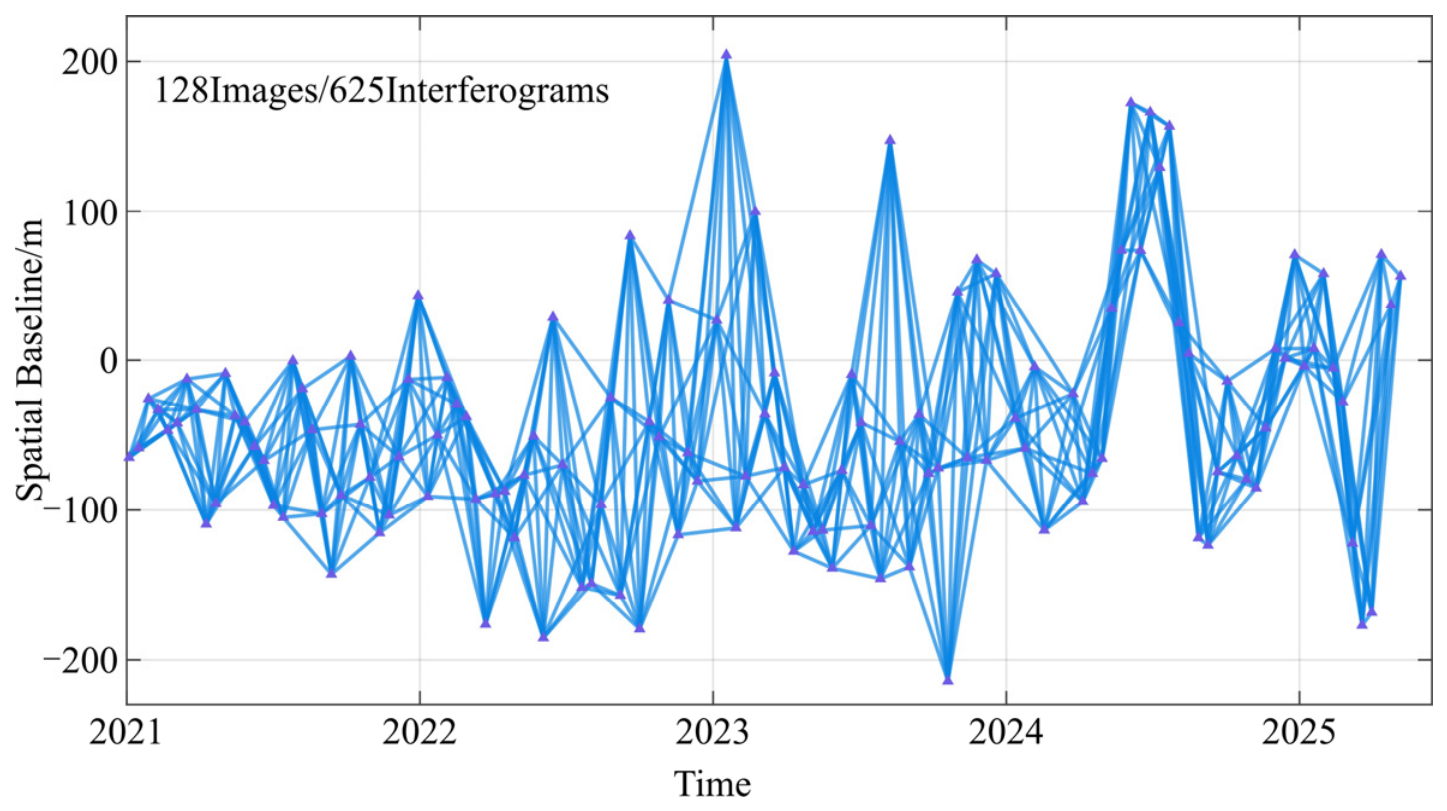
This study uses 128 ascending Sentinel-1 acquisitions, multitemporal optical imagery, ICESat-2 and Sentinel-3A satellite altimetry observations, and available engineering records to characterize LOS deformation at Suyahu Reservoir. It addresses three questions: (1) what LOS deformation patterns are observable along the long earthfill dam and adjacent project-modified ground? (2) Do representative dam sections and modified or filled areas exhibit different time-series behavior? (3) What temporal correspondence, if any, exists between the observed deformation and reservoir water level variations? By addressing these questions, this study extends structure-specific dam monitoring to a system-scale characterization of an aging plain reservoir undergoing and adjusting to large-scale engineering rehabilitation. The results provide remote sensing evidence for identifying areas that warrant further field inspection and illustrate both the potential and limitations of time-series InSAR for characterizing the deformation state of aging reservoirs following large-scale dredging and capacity expansion projects.
4. Results
4.1. Engineering Transformation Revealed by Remote Sensing Imagery
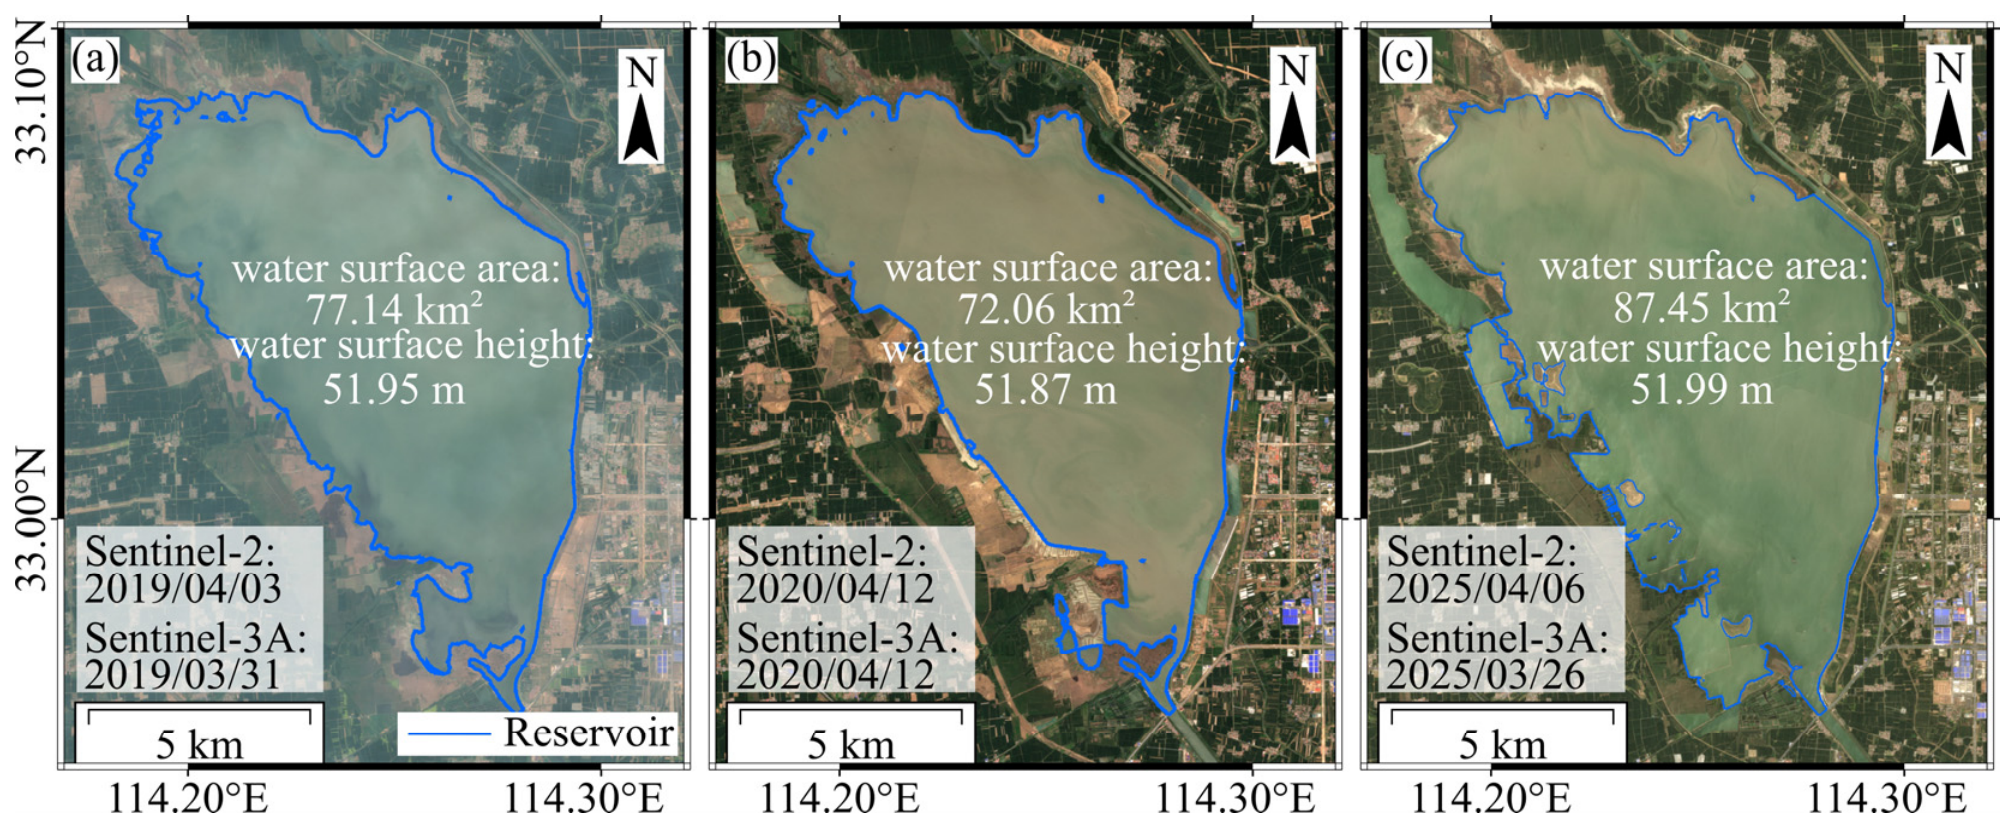
Multi-temporal Sentinel-2 imagery reveals substantial changes in the surface water extent and shoreline configuration of Suyahu Reservoir associated with the dredging and capacity expansion project. Three representative Sentinel-2 images were selected to delineate the reservoir water boundaries, as shown in
Figure 4.
During the initial phase of the project, on 3 April 2019, the mapped water surface area was approximately 77.14 km2. By 12 April 2020, it had decreased to 72.06 km2, representing the smallest extent among the selected images. Construction in the western expansion area involved cofferdams and land-based excavation and coincided with a reduction in the water surface area and extensive exposure of the reservoir bed.
The image acquired on 6 April 2025 shows the late-stage reinundation configuration of the reservoir. The mapped water surface area had expanded to approximately 87.45 km2, representing increases of 15.39 km2 relative to April 2020 and 10.31 km2 relative to April 2019. Areas exposed or excavated during construction in the western expansion area had subsequently been inundated. The comparative imagery illustrates the overall evolution of the site, ranging from shoreline retreat and exposure of the reservoir bed during construction to the expansion of the inundated area in the project’s later stages. This transformation can be broadly divided into three stages: an initial construction stage represented by the 2019 image, a low-inundation and land-based excavation stage represented by the 2020 image, and a late-stage reinundation phase represented by the 2025 image.
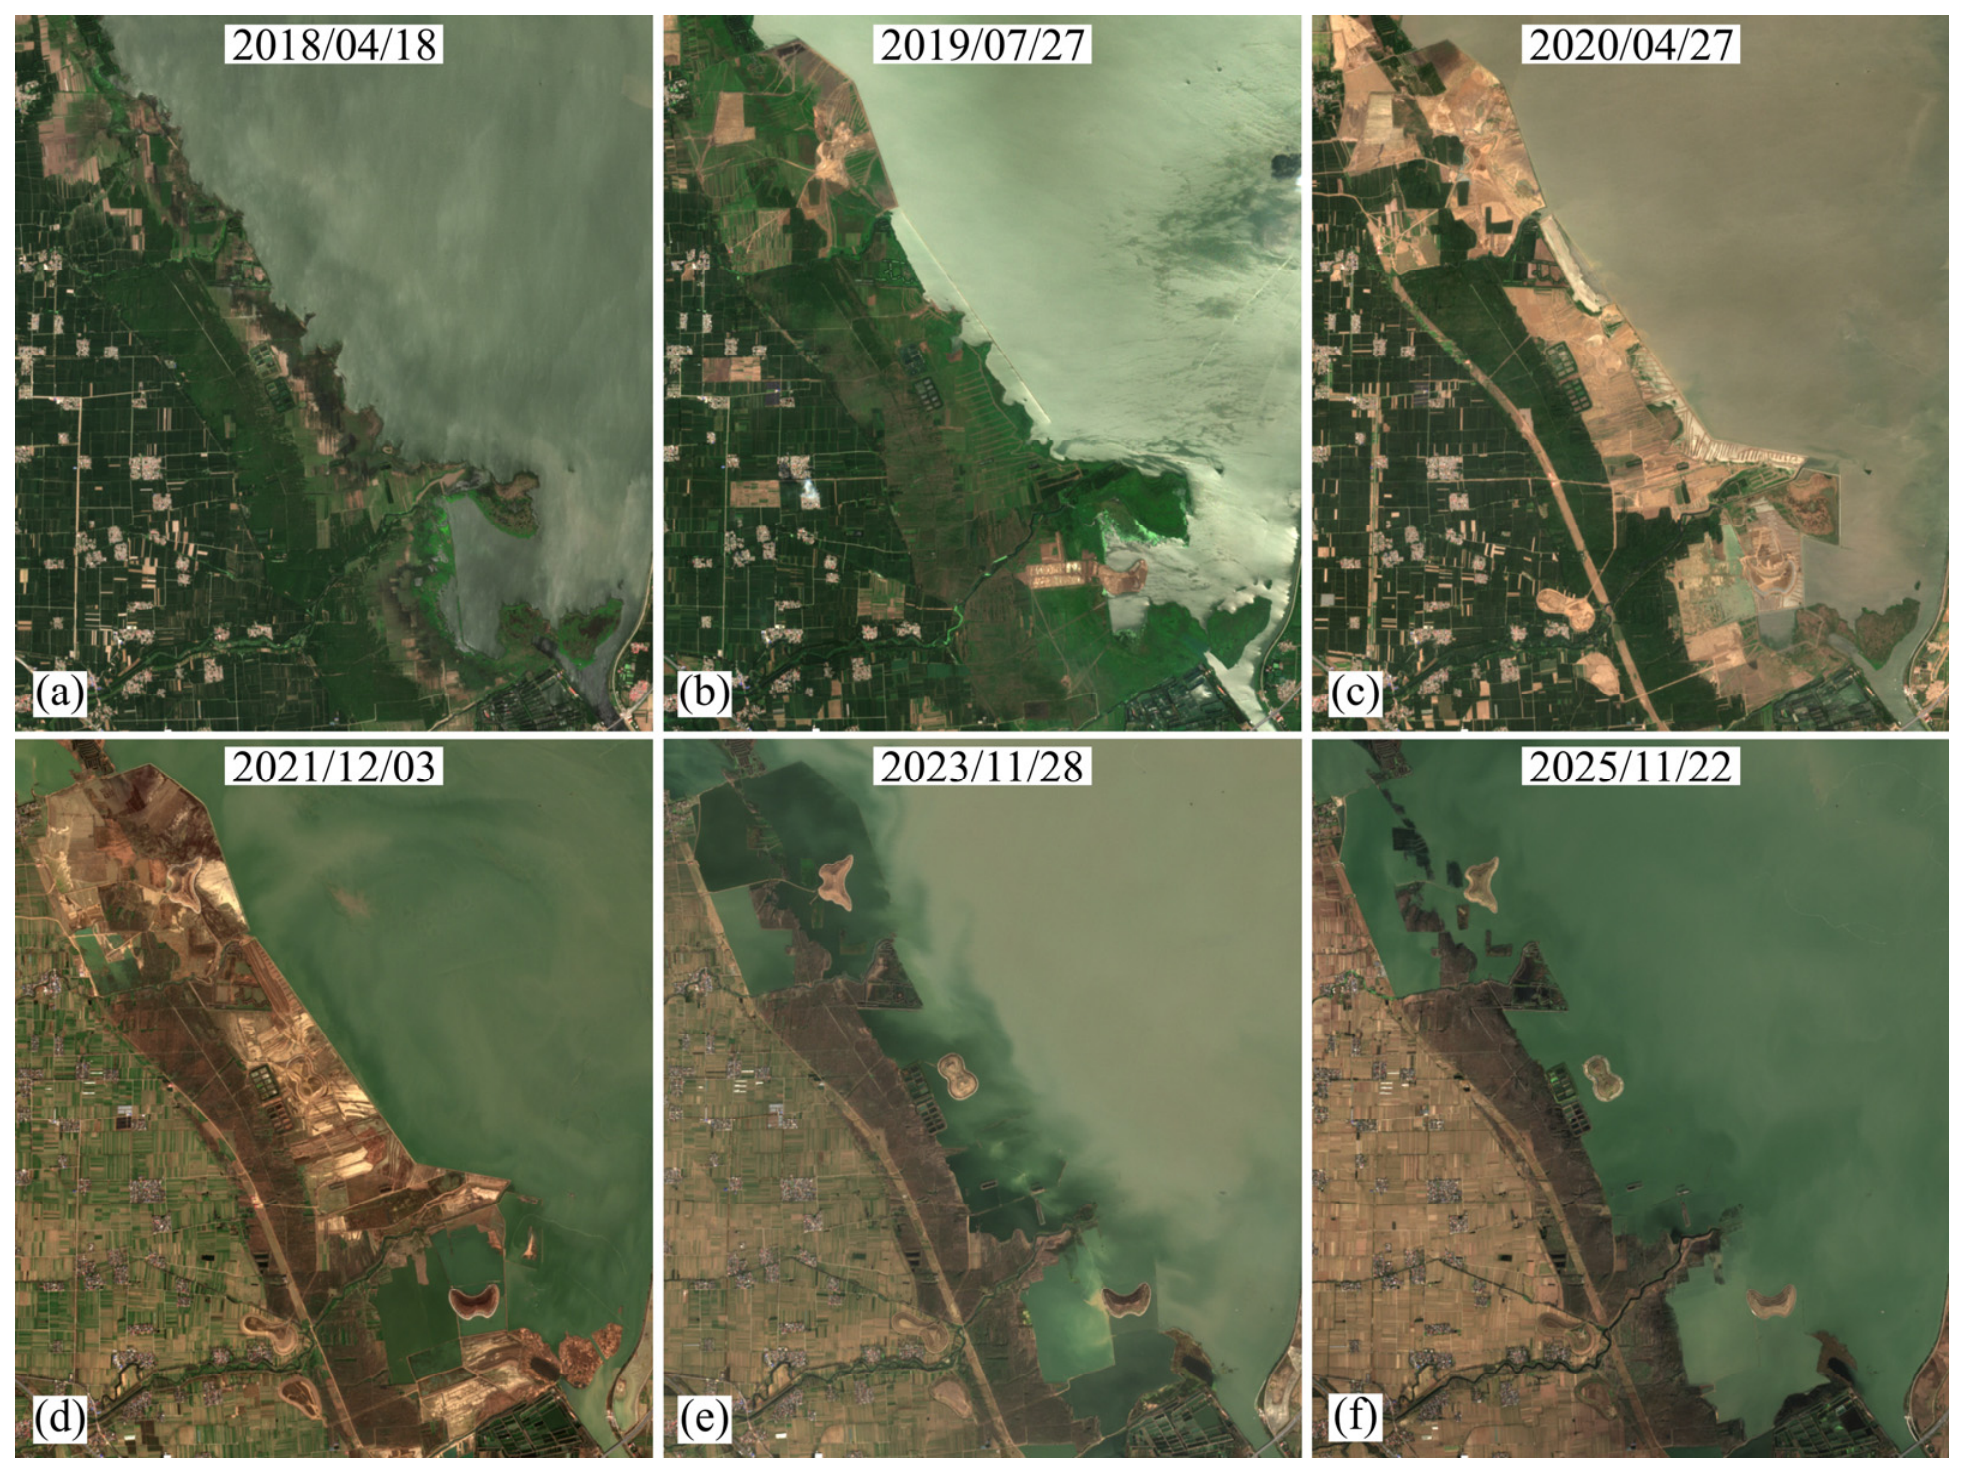
An enlarged view of the western expansion area further illustrates the construction sequence within the project zone (
Figure 5). In April 2020, most of the expansion area remained exposed and was divided by cofferdams, temporary access roads, and excavation surfaces, indicating that land-based excavation was still underway. By December 2021, excavation and terrain reshaping had progressed substantially, and reservoir water had begun to reoccupy parts of the previously enclosed construction areas. Although their degrees of separation from the western shoreline varied, the three artificial islands were clearly distinguishable from the surrounding construction areas.
Comparison of the connections between the islands and the shoreline suggests that cofferdam removal progressed from south to north. Artificial Island 1, the southernmost island, appears to have been separated from the surrounding construction area first and was already largely surrounded by water in the December 2021 image. Artificial Island 2 was separated later, whereas the cofferdams or temporary connections associated with Artificial Island 3, the northernmost island, remained in place for the longest period. By November 2023, a greater proportion of the former excavation area had been inundated, and the three islands had approached their final configurations. This asynchronous construction sequence implies that the islands experienced different durations of filling, compaction, exposure, and contact with reservoir water, providing important temporal context for the differences observed in their deformation time series.
4.2. Reservoir-Level Variations from Satellite Altimetry
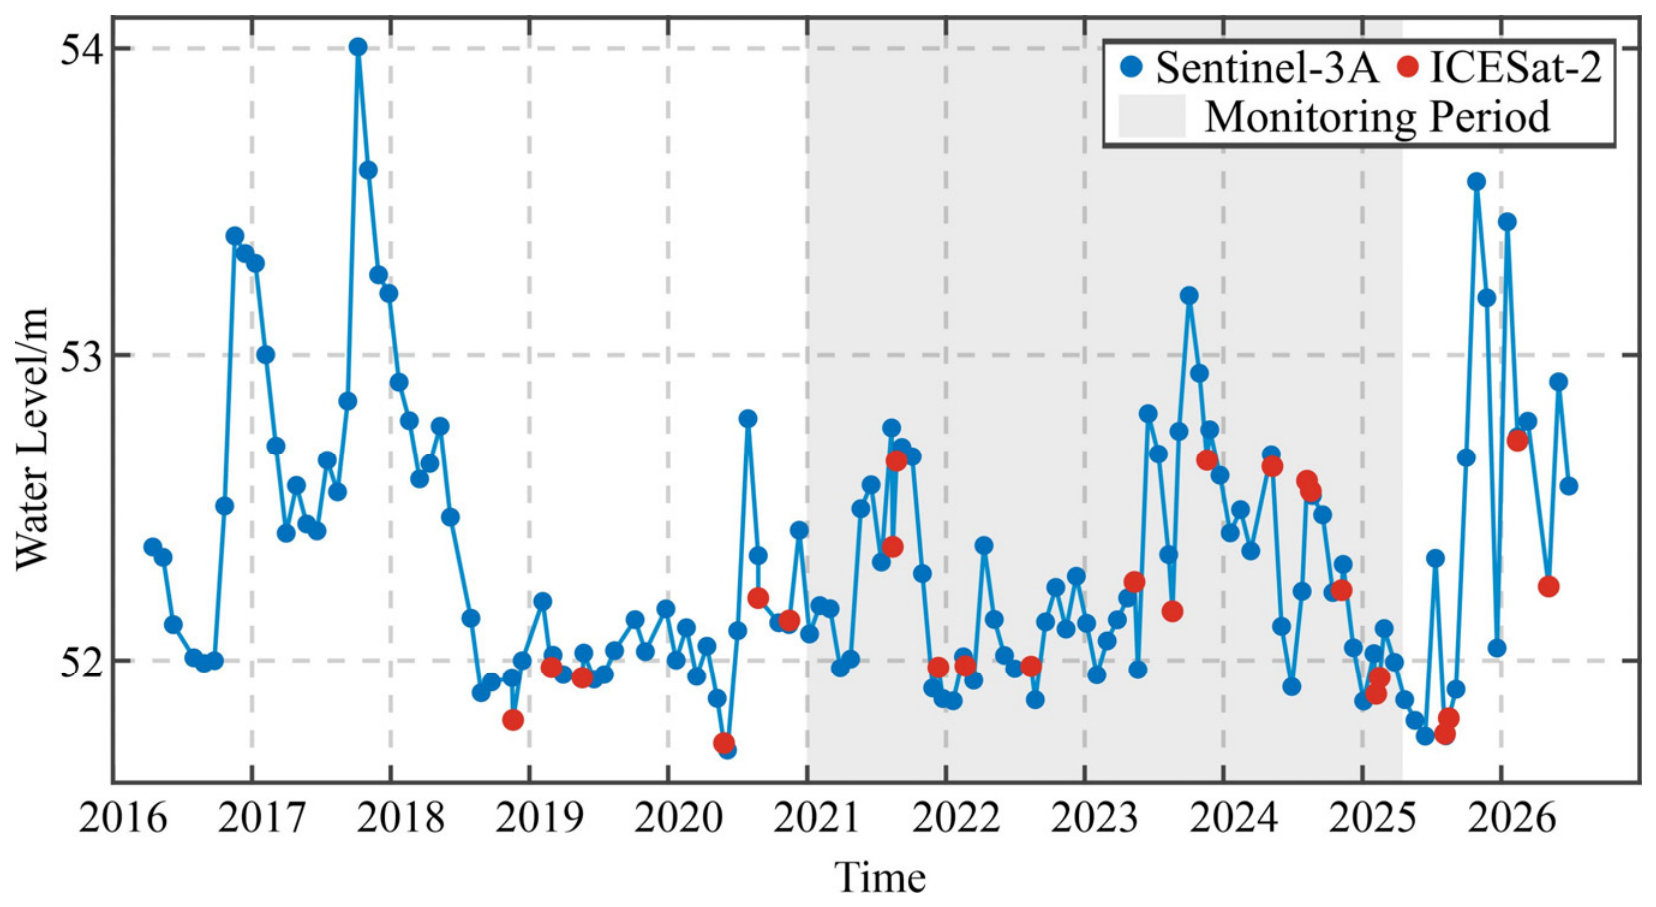
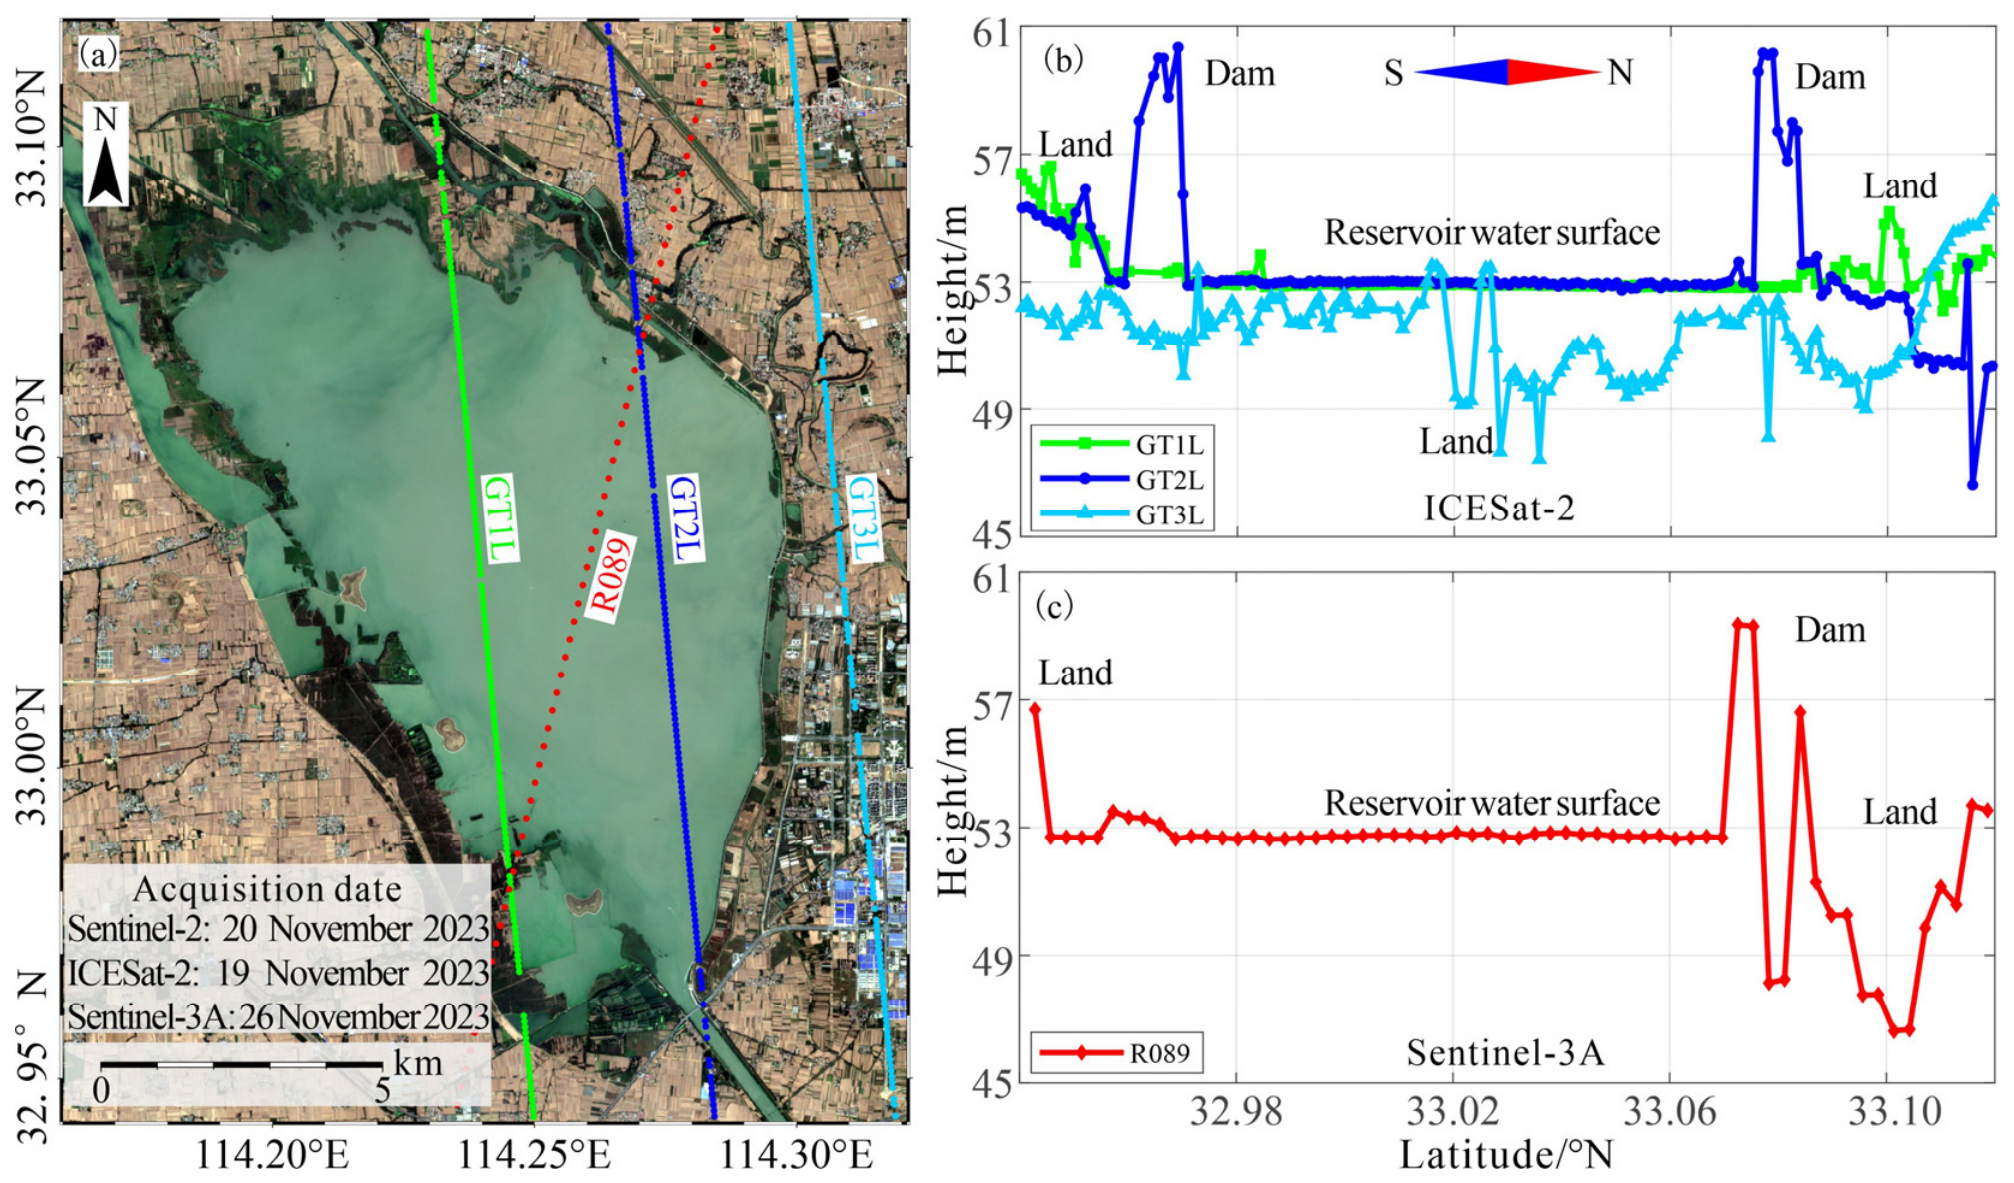
Observations from Sentinel-3A and ICESat-2 reveal distinct changes in the water level regime of Suyahu Reservoir before, during, and after the main construction phase (
Figure 6). Although ICESat-2 provided fewer measurements because of its lower sampling frequency over the reservoir, the two datasets show generally consistent variations when their observation times are close.
Before project implementation, Sentinel-3A observations from 2016 to 2018 indicated a mean water level of approximately 52.62 m and a mean annual observed range of approximately 1.33 m. During the main construction phase from 2019 to 2022, the mean water level decreased to approximately 52.15 m, approximately 0.47 m below the pre-project mean, while the mean annual observed range narrowed to about 0.68 m. Water levels during this period remained largely concentrated around 52 m, despite occasional short-term increases in 2020 and 2021. These lower and less variable water levels coincided with cofferdam construction in the western expansion area and the maintenance of exposed working areas required for land-based excavation.
From 2023 onward, both the water level and the magnitude of its fluctuations began to increase. By 2025, the intra-annual observed range had returned to the typical pre-project range. This change indicates a transition toward the more variable water level regime associated with later-stage reservoir operation.
The altimetry observations also provide useful context for the changes in surface water extent identified from the Sentinel-2 imagery (
Figure 4). The images shown in
Figure 4a–c were acquired on 3 April 2019, 12 April 2020, and 6 April 2025, respectively. The corresponding nearest altimetry observations were acquired on 31 March 2019, 12 April 2020, and 26 March 2025, recording water levels of 51.95 m, 51.87 m, and 51.99 m, respectively. Consequently, the larger inundated area mapped in April 2025 is unlikely to be explained solely by a higher instantaneous water level but is consistent with changes in reservoir bed and shoreline geometry resulting from excavation, capacity expansion, and subsequent reinundation. Quantifying the contribution of reservoir-bed topographic changes to the observed area increase would require bathymetric or elevation data.
4.3. Spatial Distribution and Uncertainty of LOS Deformation
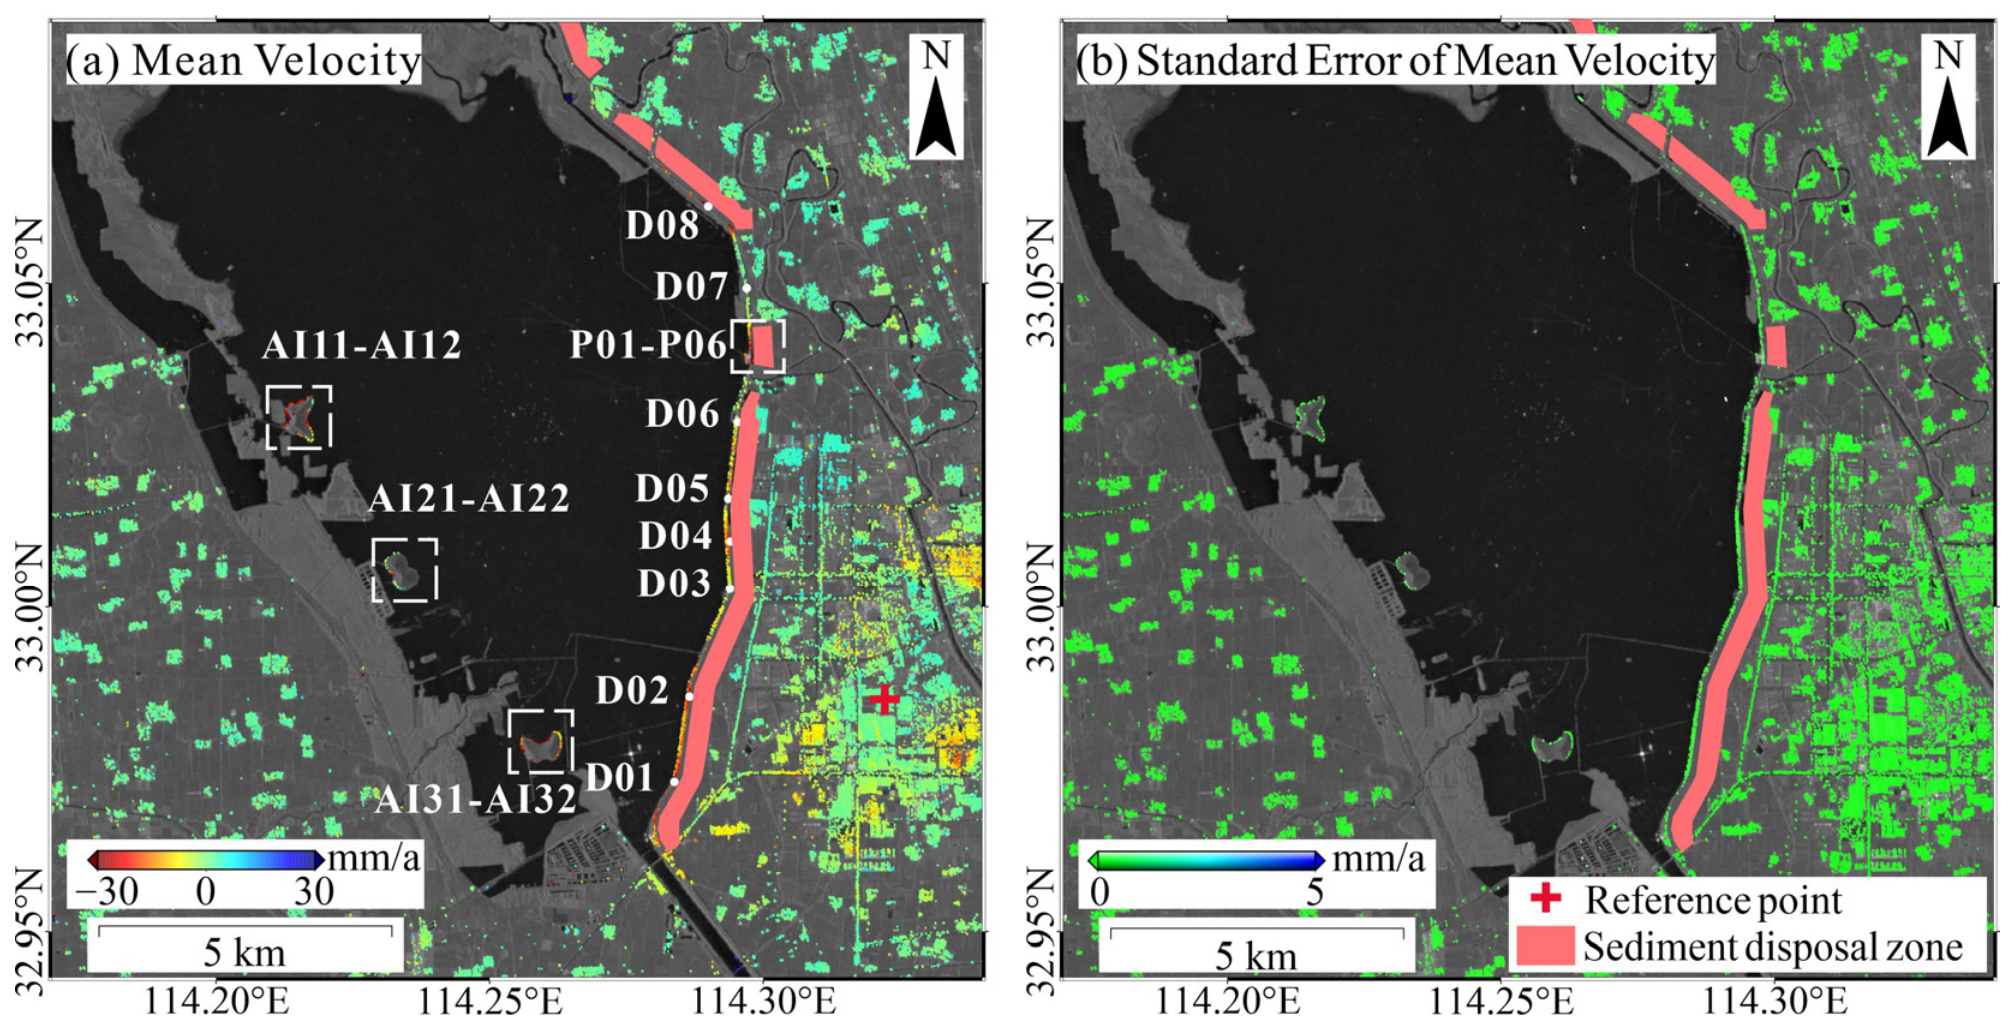
The spatial distributions of the mean LOS velocity derived from InSAR and the formal standard error of the fitted velocity within the study area are shown in
Figure 7a,b, respectively. Valid InSAR measurement points are unevenly distributed across the study area. Open water yields no coherent measurement points, whereas relatively dense measurements are obtained from surfaces with stable radar backscatter, including the dam crest, paved roads, artificial island margins, and residential areas. Although extensive ground surfaces were exposed in the western expansion area during construction, measurement points remain relatively sparse. This limited coverage is consistent with temporal decorrelation caused by frequent excavation, material stockpiling, and surface modification. Pronounced negative LOS velocities are concentrated primarily along sections of the eastern embankment, parts of the artificial island margins, and the built-up area southeast of the reservoir.
The reference point was located in a relatively stable area, with a mean LOS deformation rate of approximately −1 mm/a over the monitoring period. The eastern embankment exhibits relatively continuous linear measurement coverage. LOS velocities are predominantly negative, indicating motion away from the satellite. The velocity distribution along the dam axis is spatially heterogeneous, with sections exhibiting near-zero velocities alternating with localized areas of pronounced negative motion. In some sections, negative LOS velocities reach approximately −40 mm/a, indicating clear along-dam segmentation and localized deformation concentrations.
On the three artificial islands, valid measurement points are concentrated mainly along perimeter roads and marginal structures, whereas coverage within the island interiors is limited. The monitored island margins are characterized primarily by negative LOS velocities, with the most negative values reaching approximately −50 mm/a. Velocity differences are observed both among the three islands and between different margins of the same island.
The negative LOS velocities in the built-up area southeast of the reservoir may be associated with local building construction, as suggested by the temporal correspondence between redevelopment and the observed deformation. A direct link between this urban deformation and the reservoir dredging and capacity expansion project has not been established. Therefore, a detailed investigation of this urban deformation is beyond the scope of the present study.
Based on these spatial patterns, representative points along the embankment and artificial islands were selected for the displacement time-series analysis presented in
Section 4.4. The standard error distribution shown in
Figure 7b indicates low fitted-rate uncertainty for most coherent targets.
4.4. Displacement Time Series of the Dam and Artificial Islands
Representative points were selected from valid InSAR measurements based on their deformation behavior and engineering locations. The selection included both pronounced deformation and relatively stable behavior and covered key engineering features to illustrate spatial differences across the monitored areas. These points are distributed along the embankment, at the dock and in the adjacent sediment disposal zone, and along the margins of the three artificial islands.
4.4.1. Dam and Associated Engineering Features
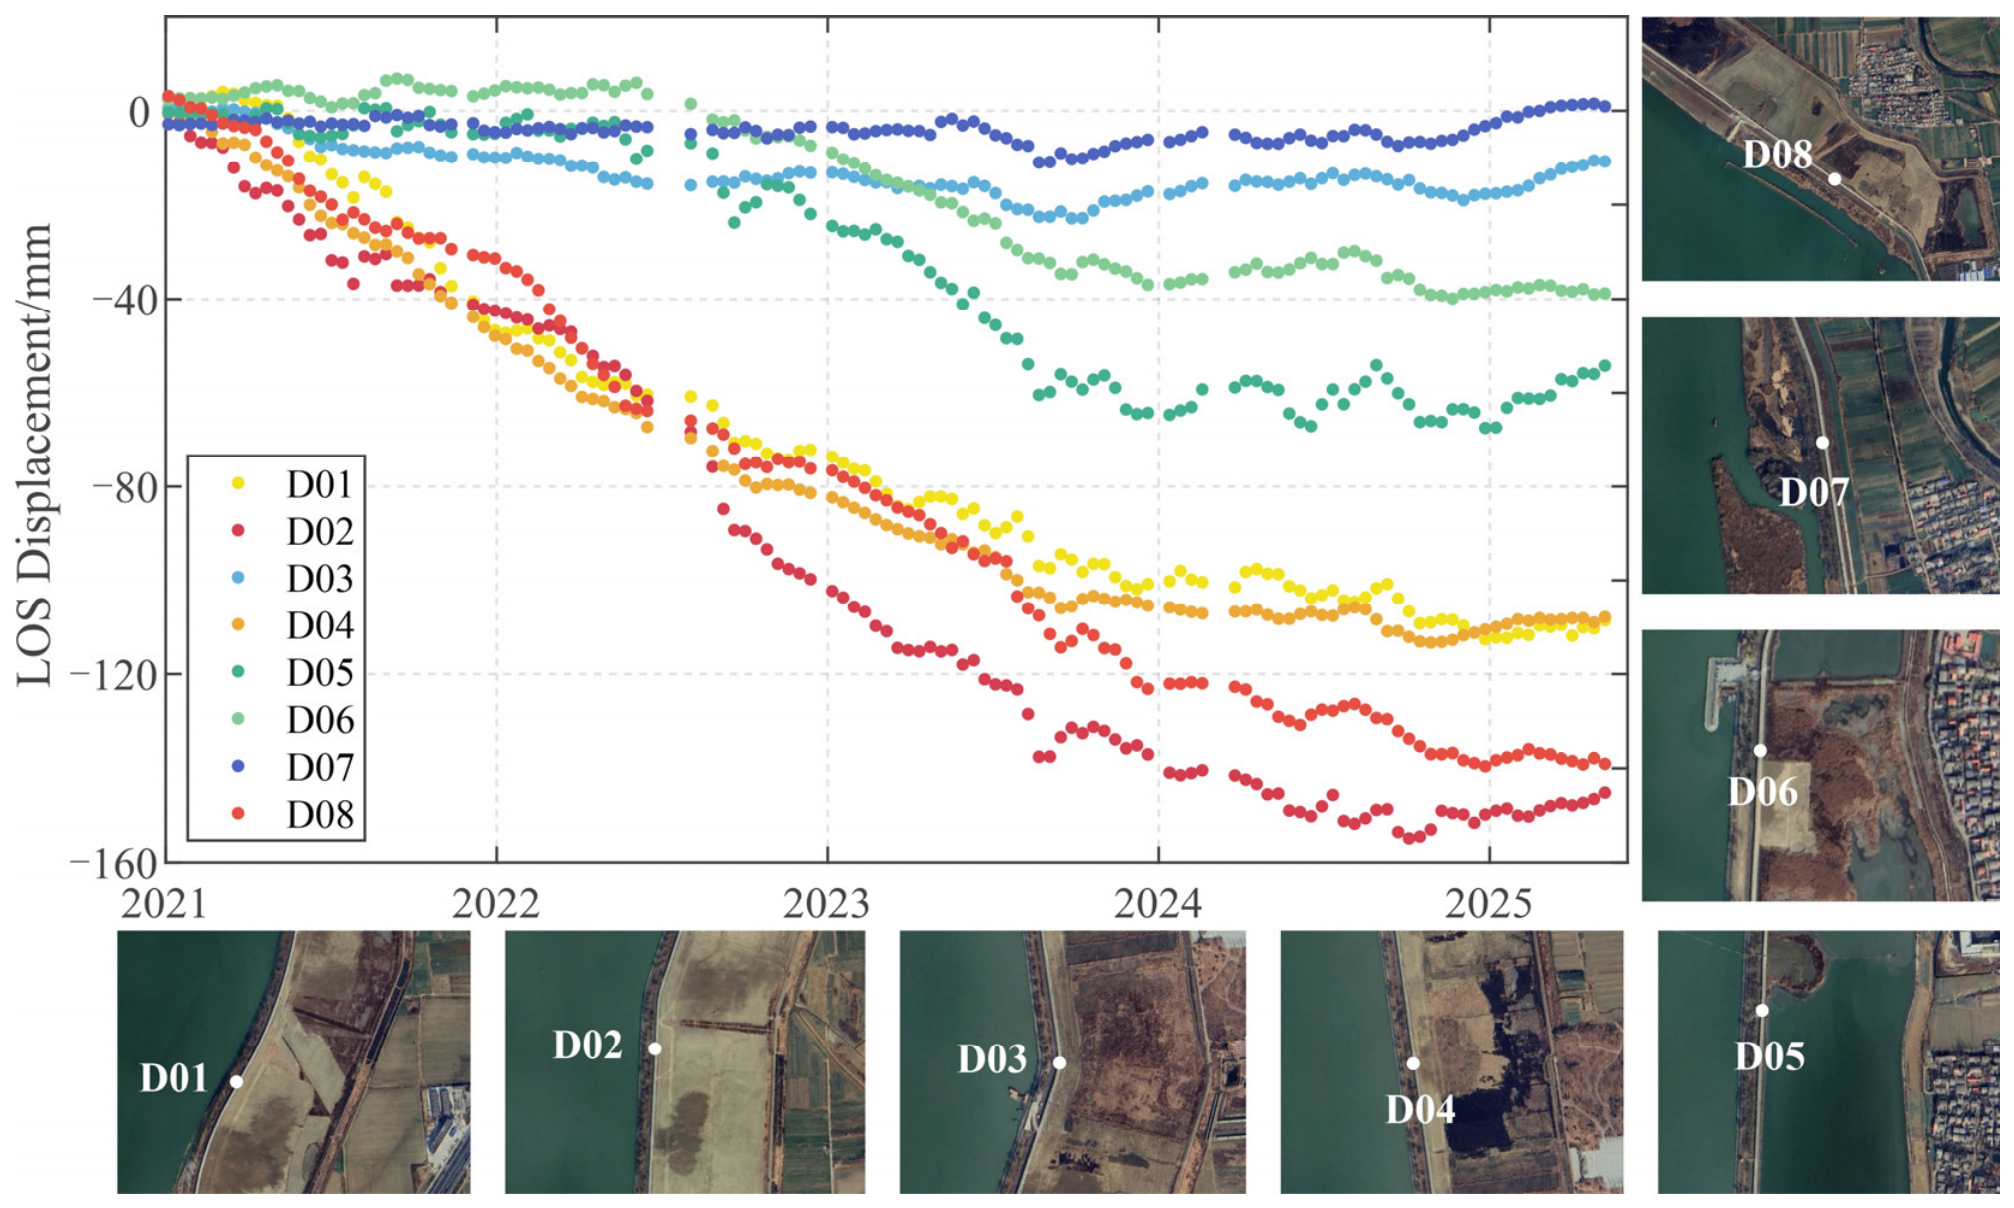
Eight representative monitoring points (D01-D08) were selected along the eastern embankment to characterize distinct temporal deformation patterns (
Figure 8). Among them, D01, D02, D04, and D08 exhibited the largest cumulative negative LOS displacements. D01 and D04 showed nearly continuous negative displacement between 2021 and the second half of 2023, followed by a marked reduction in deformation rate. By the end of the monitoring period, both points had accumulated approximately −110 mm of LOS displacement. D02 and D08 exhibited larger and more persistent negative displacements, reaching approximately −150 and −140 mm, respectively. Despite short-term fluctuations, their time series were dominated by sustained motion away from the satellite. All four points are located along embankment sections adjacent to areas affected by material placement or surface modification.
In contrast, D03 and D07 exhibited the smallest net displacements among the selected embankment points. The D07 time series fluctuated within a narrow range and returned to approximately its initial displacement level by the end of the monitoring period. D03 showed a small long-term negative displacement and several short-term fluctuations, with a final cumulative displacement of approximately −10 mm. The contrasting behavior of these two points relative to the more strongly deforming locations indicates that the observed deformation was localized rather than uniformly distributed along the entire embankment.
D05 and D06 exhibited a distinct three-stage pattern. Both points remained relatively stable during the initial monitoring period but entered a phase of accelerated negative displacement beginning in the second half of 2022. The cumulative displacement reached approximately −60 mm at D05 and −40 mm at D06. From late 2023 onward, the deformation rates at both points decreased markedly, and their cumulative displacement curves remained relatively stable. These time series therefore show a transition from an initially stable stage to a period of pronounced negative displacement and finally to a stage of relative stability.
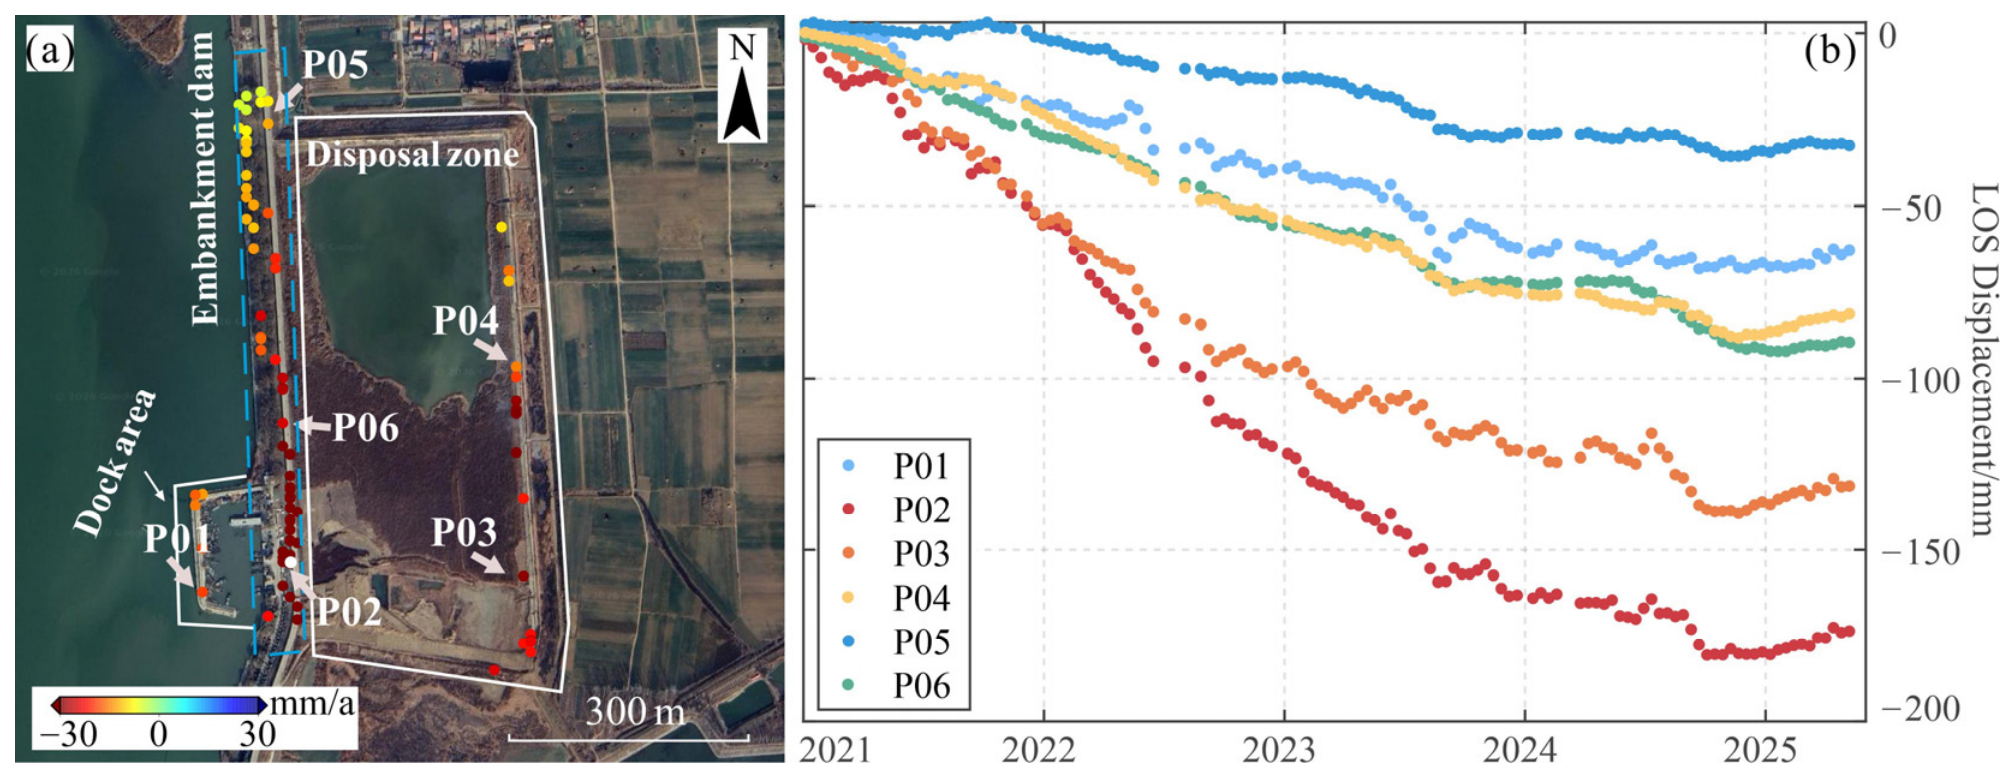
A more detailed analysis was conducted in the dock area, where points P01-P06 are distributed across the dock structure, the embankment, and the disposal area behind the dam (
Figure 9). All six points exhibited cumulative negative LOS displacement, although the magnitudes varied markedly over short distances. P02, located on the embankment near the dock, recorded the largest displacement, reaching approximately −180 mm. P03, situated along the margin of the disposal zone behind the dam, accumulated approximately −130 mm. P04 and P06 exhibited intermediate cumulative displacements of approximately −80 and −90 mm, respectively, whereas P01 on the dock structure and P05 on the embankment showed smaller displacements of approximately −65 and −35 mm, respectively. The pronounced differences among the points on the dock, embankment, and disposal area further indicate that deformation in this section of the reservoir infrastructure was localized and spatially heterogeneous.
4.4.2. Newly Filled Artificial Islands
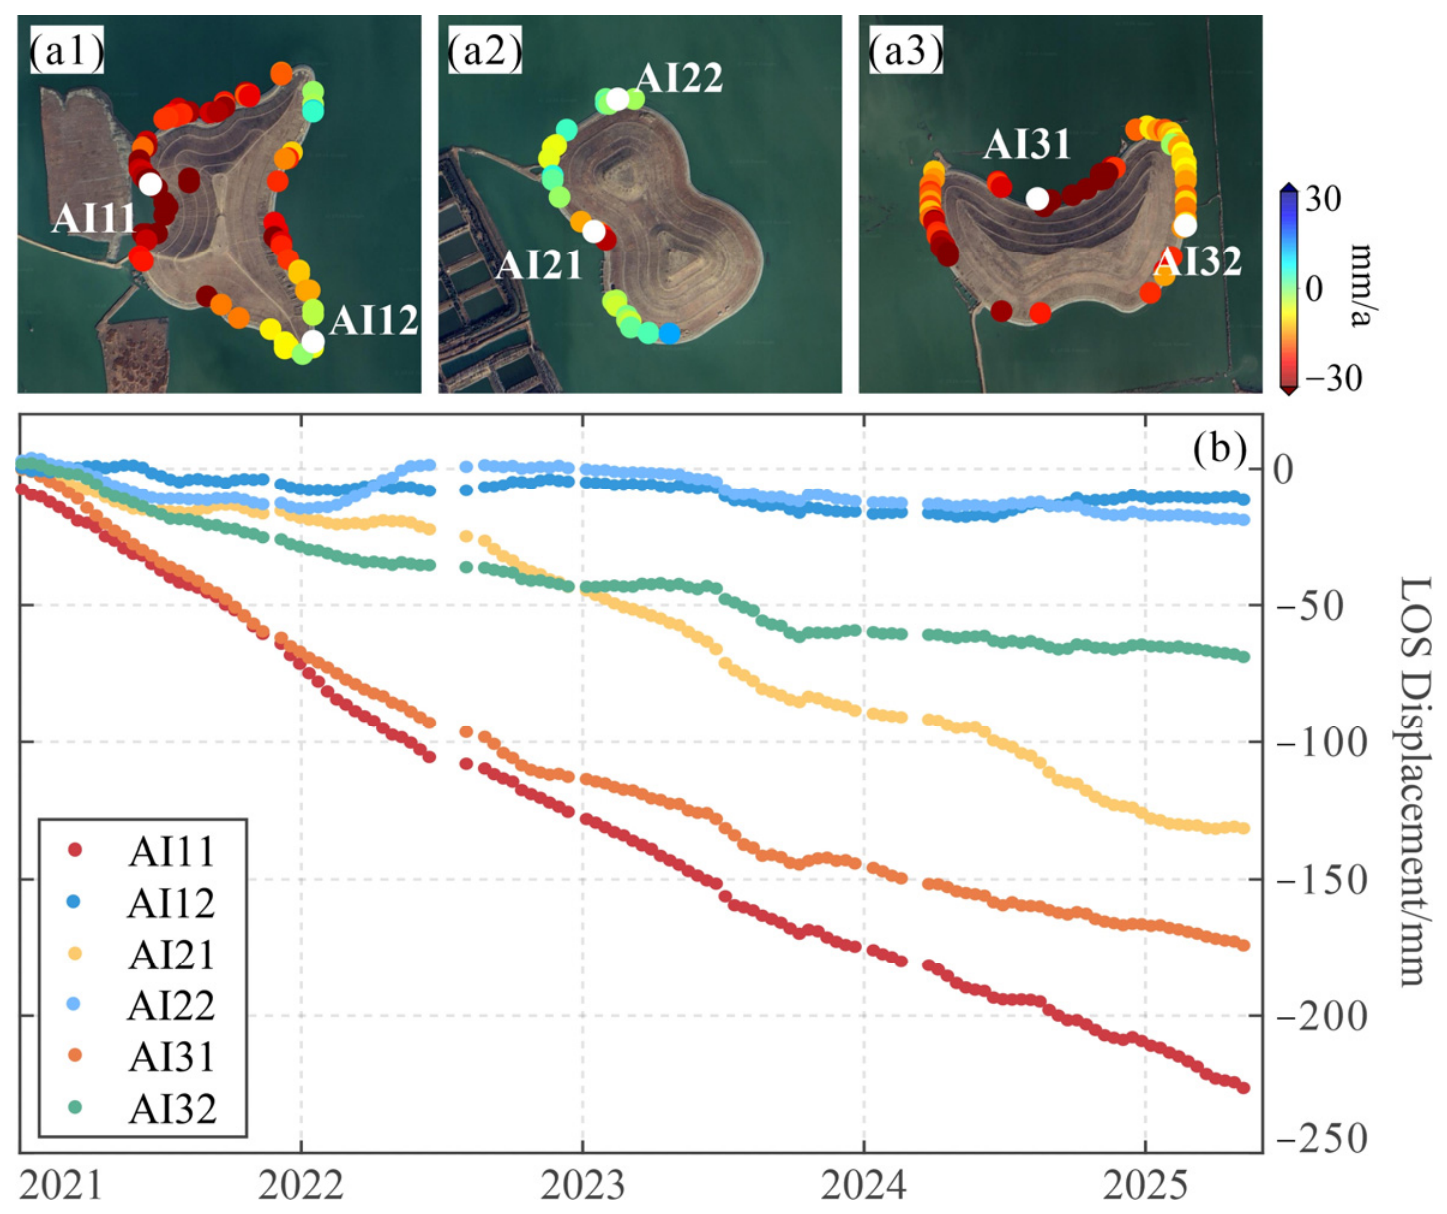
Excavated soil and rock materials from the western capacity expansion area of Suyahu Reservoir were air-dried, placed as fill, and compacted on site to construct three artificial islands. Multitemporal optical imagery showed that the islands underwent repeated fill placement and surface modification as the capacity expansion project progressed. These disturbances resulted in pronounced temporal decorrelation within the island interiors. Consequently, valid InSAR measurement points were concentrated primarily along the island margins, particularly on the perimeter roads. Two representative InSAR measurement points were selected on each artificial island, and their cumulative LOS displacement time series are shown in
Figure 10.
Among the six selected points, AI11 on Artificial Island 1 exhibited the largest cumulative LOS displacement. Its displacement became progressively more negative in a nearly linear manner throughout the monitoring period, ultimately reaching approximately −230 mm. In contrast, AI12 on the same island exhibited relatively minor displacement and remained comparatively stable after 2023, with a final cumulative displacement of approximately −15 mm.
AI21 on Artificial Island 2 showed limited displacement during the initial monitoring period but developed a more pronounced negative displacement trend beginning in the second half of 2022. By the end of the monitoring period, its cumulative displacement had reached approximately −130 mm. AI22 exhibited substantially smaller displacement, with a final cumulative negative LOS displacement of approximately −20 mm.
On Artificial Island 3, AI31 exhibited continuous, nearly linear negative displacement, reaching approximately −170 mm by the end of the monitoring period. AI32 displayed a more moderate, stage-dependent pattern, with its cumulative displacement reaching approximately −70 mm. Although its deformation rate decreased during the later monitoring period, the displacement had not fully stabilized.
The paired time series reveal marked differences not only among the three islands but also between different margins of the same island. Construction-related temporal decorrelation limited InSAR coverage within the island interiors. Consequently, the available measurements mainly characterize selected sections of the perimeter roads and marginal structures and do not fully represent the deformation behavior of the entire island fill bodies. As surface conditions stabilize following project completion, the stability of the filled slopes will require particular attention.
5. Discussion
5.1. Engineering Interpretation of Contrasting Deformation Patterns
The displacement time series presented in
Section 4 reveal contrasting deformation patterns along the embankment and across the three newly constructed artificial islands. Along the embankment, D01, D02, D04, and D08 exhibited pronounced and persistent LOS displacement, whereas D03 and D07 remained relatively stable and D05 and D06 showed stage-dependent deformation. Marked spatial differences were also observed over short distances in the dock area, where the cumulative displacements at P02 and P03 were substantially larger than those at P01 and P05.
The dredging and capacity expansion project involved the large-scale excavation and redistribution of soil and sediment. Part of the excavated material was placed in disposal areas behind the dam, which may have introduced additional loading conditions to the existing ground. Such loading may have contributed to the compression of the newly placed fill and consolidation of the underlying soil layers, particularly where the material has a high-water content, variable compaction, or substantial fill thickness. Dredging and reservoir-bed excavation may also have modified local seepage paths, hydraulic gradients, and soil stress conditions. Moreover, over the 35 km long embankment, spatial variations in embankment materials, foundation conditions, and construction history may have contributed to a heterogeneous deformation response.
Although the Suyahu Reservoir embankment has been in service for approximately 60 years, the major earthworks conducted nearby may have introduced new loading histories and boundary conditions. Consequently, even if long-term consolidation had previously approached stability, sections adjacent to disposal areas may have undergone renewed localized adjustment. The spatial correspondence between the observed deformation and local construction or material-placement areas is consistent with this interpretation. In particular, the pronounced LOS displacements at P02 and P03, in contrast to the smaller displacements at nearby points, are more consistent with a localized response to heterogeneous loading than with uniform movement of the entire embankment. Similarly, the stage-dependent deformation at D05 and D06 may be associated with an interval of construction-related disturbance followed by post-construction adjustment as the loading and surface conditions became more stable.
The artificial islands represent a different engineering setting because they were constructed from excavated soil and rock and underwent repeated fill placement and compaction during the capacity expansion project. Sustained loading may have induced self-weight consolidation of the fill and compression of the underlying reservoir-bed deposits. Variations in fill thickness, material composition, water content, placement history, compaction quality, and interaction with reservoir water may have resulted in strongly heterogeneous deformation. This interpretation is consistent with the marked differences between paired points on the same island. AI11, AI21, and AI31 exhibited substantial and persistent negative LOS displacement, whereas AI12 and AI22 remained comparatively stable and AI32 showed a more moderate, stage-dependent response.
Overall, the observations indicate two contrasting deformation settings: localized adjustment of the mature embankment and adjacent ground potentially associated with construction-related disturbance, and continued deformation along selected margins of the newly constructed island fills. During the later monitoring period, deformation rates at several embankment points decreased markedly, whereas the more strongly deforming island-margin points had not reached a comparable level of stability. Local construction and material-placement histories therefore provide a more plausible first-order explanation for the observed spatial variability than a spatially uniform response to reservoir water-level loading, although secondary hydrological influences cannot be excluded.
5.2. Limited Correspondence Between Dam Deformation and Reservoir Water Level
Using points D01-D08, which represent the main deformation patterns along the embankment, the relationship between reservoir water level variations and deformation was analyzed. These points exhibited different deformation histories but were subject to the same reservoir water level variations. If reservoir level loading were the dominant control, the response amplitudes could differ among embankment sections because of variations in local geometry, material properties, and foundation conditions, but broadly consistent temporal responses and lag relationships would be expected. However, the selected points exhibited distinctly different long-term and stage-dependent displacement patterns.
The maximum absolute cross-correlation coefficients between the detrended and pre-whitened monthly series ranged from 0.19 to 0.32. None of the point-level correlations was statistically significant in the global circular-shift tests, with all global p values exceeding 0.05 even before correction for multiple comparisons across the eight monitoring points. The Benjamini–Hochberg-adjusted q values ranged from 0.41 to 0.69, providing no evidence of statistically robust lagged correlations. The heterogeneous deformation histories and absence of statistically robust lagged correlations provide no strong evidence that reservoir water level fluctuations were the dominant control on the monitored embankment deformation during the study period. An additional analysis using a 0–6-month lag window likewise identified no statistically significant lagged correlations. However, more subtle or complex water level influences cannot be excluded, given the temporal sampling and number of available altimetry and SAR observations.
5.3. Implications for Monitoring Aging Plain Reservoirs
For aging reservoirs with low dams and limited water level fluctuations, long-term consolidation of the original dam body may be assumed to be largely complete after several decades of operation, and the remaining deformation is therefore often expected to be small and relatively stable. However, the InSAR observations at Suyahu Reservoir revealed localized negative LOS displacement during the construction and subsequent adjustment periods of the dredging and capacity expansion project. Negative LOS velocities reached approximately −40 mm/a along some embankment sections and approximately −50 mm/a along monitored margins of the newly constructed artificial islands. The dam, previously considered to be stable, thus entered a new phase of active deformation potentially associated with engineering activities external to the dam itself.
The observed deformation patterns show spatial correspondence with the excavation and material placement configuration of the project. Reservoir bed excavation may have modified local hydraulic boundary conditions, depending on the subsurface materials and hydraulic connectivity. Meanwhile, the placement of large volumes of dredged sediment and excavated earth introduced new loads on disposal areas and the underlying ground. Persistent negative LOS displacement along the monitored margins of the artificial islands is also consistent with continued post-placement adjustment and consolidation of recently deposited fill. Although these observations do not indicate a risk of instability for the entire dam structure, they confirm that even when operational conditions appear stable, localized deformation may still occur following major engineering interventions.
This finding offers practical insights for numerous aging reservoirs that may face similar engineering interventions in the future. First, large-scale engineering works inside or around a reservoir may alter the loading and drainage conditions surrounding existing structures and disturb their previous deformation regime. Engineering activities should be regarded as potential contributors to deformation, and particular attention should be paid to dam sections adjacent to spoil areas, material disposal areas, or excavation zones. Second, time-series InSAR provides an effective system-scale tool for this type of monitoring. With its dense spatial sampling, wide area coverage, and non-contact nature, it is well suited to the routine monitoring of long dams in plain reservoirs; moreover, the availability of archived data supports retrospective analysis of conditions before and during project implementation.
For reservoirs where similar dredging projects are planned, it is recommended that an InSAR baseline monitoring system be established prior to construction, and that newly constructed fill structures (such as artificial islands and spoil areas) be incorporated into the monitoring plan. Particular attention should be directed toward the more strongly deforming island margins, which had not reached a clear state of stabilization by the end of the observation period. InSAR observations should ultimately be integrated with leveling, GNSS, piezometric measurements, and geotechnical inspections to evaluate the engineering significance of the detected deformation.
5.4. Limitations and Future Work
This study used a single ascending-track Sentinel-1 observation geometry. Consequently, the derived deformation reflects only the projection of the three-dimensional displacement onto the line of sight and cannot be uniquely decomposed into vertical and horizontal components. Combined ascending- and descending-track observations could be used to decompose the LOS measurements into vertical and east–west components, although the north–south component would remain poorly constrained [
11,
37]. Given that the main embankment of the Suyahu Reservoir runs roughly north–south, horizontal displacement perpendicular to the dam axis is oriented east–west. The well-known insensitivity of InSAR to north–south displacements therefore poses a limited constraint for this particular structure. Temporal decorrelation restricted the available measurements on the artificial islands mainly to their margins, limiting the extent to which these observations can reflect deformation within the island interiors.
Upcoming SAR missions and the continued expansion of satellite constellations are expected to provide shorter revisit intervals, higher spatial resolution, and more diverse observation geometries. With its broad spatial coverage, dense measurement sampling, and repeat-pass observation capability, time-series InSAR is particularly well suited to the long-term monitoring of long earth and rockfill dams and other aging structures common to plain reservoirs.




 ,
,