Article

A Geometry-Constrained Framework for Automatic Geometric Positioning Accuracy Assessment of Large-Scale Satellite Imagery

by
Jiaming Cui
,
Weibin Wang
*,
Liming Fan
,
Shuhai Yu
,
Xing Zhong
,
Hongguang Jia
and
Zhenjiang Li
Chang Guang Satellite Technology Co., Ltd., Changchun 130000, China
*
Author to whom correspondence should be addressed.
Remote Sens. 2026, 18(17), 3055; https://doi.org/10.3390/rs18173055
Submission received: 9 July 2026 / Revised: 25 August 2026 / Accepted: 4 September 2026 / Published: 7 September 2026
(This article belongs to the Special Issue Calibration and Validation of Remote Sensing Satellites)

Highlights

What are the main findings?
  • A geometry-constrained hierarchical framework is proposed for automatic geometric positioning accuracy assessment of large-scale satellite imagery without ground control points.
  • The proposed framework significantly improves matching robustness and positioning accuracy estimation under challenging remote sensing conditions, including large initial positioning errors, weak textures, cloud contamination, and temporal variations.
What are the implications of the main findings?
  • The proposed framework enables reliable and fully automatic geometric positioning accuracy assessment for industrial satellite image production.
  • The framework has been validated through long-term operational deployment in multiple commercial high-resolution satellite missions, demonstrating its scalability and practical applicability.

Abstract

High-resolution optical satellite constellations continuously generate massive volumes of remote sensing imagery, making automatic, ground-control-point-free (GCP-free) geometric positioning accuracy assessment increasingly important for ensuring the quality of downstream applications. However, conventional GCP-free inspection methods based on local feature matching often exhibit limited robustness under large initial positioning errors, weak-texture regions, cloud contamination, and temporal appearance variations, resulting in poor generalization across large-scale production scenarios. To address these challenges, this paper proposes a geometry-constrained framework that integrates Rational Polynomial Coefficient (RPC) prior constraints, coarse-to-fine registration, adaptive match-density-based block selection, hierarchical geometric verification, and a geolocation residual confidence measure into a unified automatic quality inspection pipeline. The framework leverages LoFTR for dense feature matching, but its principal contribution lies in the system-level integration and operational design for large-scale industrial satellite image production. Extensive experiments on multi-satellite and multi-scene datasets from the Jilin-1 satellite series show that the proposed method achieves a median positioning error below 2 m, an Average Precision (AP) improvement of 0.53 over the baseline, and nearly perfect accuracy on the evaluated test set for confidence thresholds above 0.5. The framework has also been deployed in the operational production system of multiple commercial Jilin-1 missions for more than six months, demonstrating its effectiveness, robustness, scalability, and practical applicability for large-scale optical satellite imagery.

1. Introduction

The rapid development of commercial Earth observation satellites has significantly increased the availability of high-resolution remote sensing imagery, enabling a wide range of applications such as land resource monitoring, urban planning, disaster assessment, precision agriculture, and environmental protection [1,2]. Benefiting from the deployment of large-scale satellite constellations, commercial remote sensing systems are capable of acquiring massive volumes of sub-meter imagery every day [3]. Consequently, modern satellite image production has gradually evolved from manual processing toward highly automated production pipelines. Among the various quality control procedures, geometric positioning accuracy assessment is one of the most critical steps because it directly determines the reliability of subsequent applications, including image mosaicking, change detection, object extraction, and multi-temporal analysis [4]. Traditional manual inspection based on ground control points (GCPs) is labor-intensive, time-consuming, and unsuitable for large-scale commercial production [5]. Therefore, developing an automatic, accurate, and robust geometric positioning accuracy assessment framework has become an essential requirement for modern remote sensing production systems.
Automatic geometric positioning accuracy assessment is fundamentally dependent on reliable image registration between satellite imagery and reference maps. Existing registration methods can generally be classified into area-based methods and feature-based methods [6]. Area-based methods estimate geometric transformations by maximizing similarity measures, including the sum of squared differences (SSD) [7], normalized cross-correlation (NCC) [8], and mutual information (MI) [9]. These methods preserve rich image information and can achieve sub-pixel registration accuracy under favorable imaging conditions [10]. However, their computational complexity is relatively high, and their performance rapidly deteriorates in the presence of nonlinear radiometric differences, seasonal changes, or significant geometric distortions [11,12]. Feature-based methods establish correspondences by extracting distinctive local structures, such as points, lines, or regions. Classical algorithms including SIFT [13], SURF [14], and ORB [15] have been extensively applied in remote sensing image registration because of their relatively high efficiency and geometric invariance. Nevertheless, these handcrafted feature descriptors rely heavily on local texture information and often fail on weakly textured scenes, repetitive patterns, cloud-covered regions, or cross-temporal observations [16].
Recent advances in deep learning have significantly improved the robustness of feature matching. Detector-based methods, such as SuperPoint [17], D2-Net [18], and DISK [19], learn discriminative local features directly from data and generally outperform traditional handcrafted descriptors. SuperGlue [20] further introduces graph neural networks to jointly optimize feature correspondences. More recently, detector-free methods have attracted increasing attention by eliminating the explicit keypoint detection stage and directly performing dense feature matching. Representative approaches, including NCNet [21], DRC-Net [22], and LoFTR [23], exploit global contextual information through convolutional or Transformer-based architectures, demonstrating superior robustness in low-texture and repetitive-pattern scenarios. These advances provide new opportunities for automatic geometric positioning accuracy assessment of satellite imagery.
A related but distinct line of research focuses on ground-control-point-free (GCP-free) geometric accuracy assessment of satellite imagery. Early work in this area used handcrafted feature detectors such as SIFT to automatically match satellite images to reference maps and estimate positioning error without manual ground control. More recent studies have explored dense matching and deep-learning-based descriptors for improved robustness [4]. However, most existing GCP-free methods are evaluated on small public datasets with moderate geometric distortions and rely on sufficient image overlap and stable texture. They often lack mechanisms to handle kilometer-level initial positioning errors, weakly textured or cloud-contaminated regions, and large-scale operational throughput requirements. Consequently, these methods remain difficult to deploy unattended in commercial production pipelines.
Despite the remarkable progress achieved in remote sensing image registration and GCP-free accuracy assessment, existing studies mainly evaluate matching accuracy using small-scale public datasets under laboratory conditions, while relatively few investigations focus on large-scale industrial satellite image production [24]. In practical commercial production systems, automatic geometric positioning accuracy assessment faces substantially more challenging conditions. First, occasional failures of onboard positioning devices or attitude sensors may introduce kilometer-level initial positioning errors, resulting in very limited overlap between the satellite image and the reference map. These large initial errors originate from onboard positioning and attitude-sensor failures and propagate through the Rational Polynomial Coefficient (RPC) model to the ground coordinates of every image pixel. Nonlinear trajectory estimation, orbit uncertainty propagation, and spacecraft navigation filtering methods have been developed to characterize and reduce such state errors [25,26,27]. In this work, however, we focus on the downstream image-to-map registration problem: given the possibly biased RPC model, we automatically assess and compensate for the resulting geolocation error without requiring GCPs. Second, remote sensing images frequently contain challenging land-cover types, including deserts, oceans, glaciers, islands, and sparsely textured regions, where reliable feature extraction is extremely difficult. Third, cloud contamination, seasonal variations, illumination changes, and temporal differences between satellite imagery and reference maps often cause significant appearance inconsistencies. Finally, commercial satellite constellations continuously generate massive volumes of imagery every day, requiring geometric positioning accuracy assessment algorithms to achieve not only high registration accuracy but also excellent computational efficiency, robustness, scalability, and fully unattended operation. These practical requirements have not yet been adequately addressed by existing registration frameworks.
To overcome the above limitations, this paper proposes a geometry-constrained automatic geometric positioning accuracy assessment framework for large-scale satellite imagery. Instead of treating image registration as an isolated computer vision problem, the proposed framework is specifically designed for industrial satellite image production, integrating geometric constraints with deep feature matching to form a hierarchical coarse-to-fine geometric positioning accuracy assessment pipeline. At the orbit level, an adaptive scene ranking strategy based on cloud distribution and texture quality automatically selects representative scenes for inspection. At the scene level, Rational Polynomial Coefficient (RPC) [28] prior information is utilized to constrain the search space, while a coarse registration strategy effectively compensates for large initial positioning deviations. At the block level, adaptive block selection identifies locally reliable matching regions according to feature density. Finally, at the feature level, dense correspondences generated by LoFTR are refined through hierarchical geometric verification, and the geometric positioning accuracy is estimated using geolocation residual statistics together with a confidence evaluation strategy.
The proposed framework has been integrated into the operational production system of multiple commercial high-resolution Jilin-1 series satellite missions and has been continuously employed for automatic geometric positioning accuracy assessment in large-scale image production. Extensive experiments demonstrate that the proposed framework significantly improves matching robustness and automation compared with conventional feature-based methods, particularly in challenging scenarios involving weak textures, cloud contamination, and large initial positioning errors. The framework enables fully automatic geometric positioning accuracy assessment without GCPs while maintaining stable long-term operational performance in industrial production environments.
The main contributions of this work are summarized as follows:
  • We propose a geometry-constrained automatic geometric positioning accuracy assessment framework for large-scale satellite imagery, integrating orbit-level scene ranking, geometry-constrained coarse registration, adaptive block selection, dense feature matching, and hierarchical geometric verification into a unified industrial inspection pipeline.
  • We introduce a robust geometric registration strategy combining RPC prior constraints, match-density-based adaptive block selection, and hierarchical geometric verification. LoFTR (Sun et al. [23]) is used for dense feature matching, while the adaptive block selection and the hierarchical verification strategy are specifically designed to improve matching reliability under large positioning errors, weak textures, cloud contamination, and temporal appearance variations.
  • We introduce a confidence score derived from the dispersion of geolocation positioning residuals, which directly reflects the reliability of the estimated geometric accuracy.
  • The proposed framework has been extensively validated using large-scale production data from multiple commercial sub-meter satellite missions and successfully deployed in an operational automatic image production system. The method achieves a median positioning error below 2 m, an Average Precision (AP) improvement of 0.53 over the baseline, and is nearly completely accurate on the evaluated test set when the confidence threshold is above 0.5.

2. Materials and Methods

2.1. System Overview

The proposed framework aims to automatically estimate the geometric positioning accuracy of large-scale satellite imagery without GCPs in industrial production environments. As illustrated in Figure 1, the framework follows a hierarchical coarse-to-fine strategy consisting of four levels, namely, orbit-level scene ranking, scene-level coarse registration, block-level adaptive selection, and feature-level geometric verification.
At the orbit level, all scenes within the same satellite orbit are evaluated based on cloud coverage and texture quality. The most reliable scene is selected for subsequent processing. At the scene level, the RPC model is utilized to determine the approximate geographic coverage of the target image and extract the corresponding reference map. A coarse registration stage is then performed to eliminate large initial positioning deviations.
At the block level, the coarsely registered image pair is partitioned into regular grids, and the matching reliability of each region is evaluated. Several high-quality blocks are selected for fine-grained feature matching. Finally, at the feature level, dense feature correspondences are extracted and further refined through hierarchical geometric verification. The resulting high-confidence correspondences are transformed into geolocation positioning errors, from which the final positioning errors are computed, and the corresponding accuracy and confidence score are subsequently derived.

2.2. Orbit-Level Scene Ranking

To improve inspection stability and computational efficiency, a quality-aware scene ranking strategy is introduced before image registration. For all N s scenes belonging to the same orbit I orbit I s s = 1 N s , cloud masks M cloud M s s = 1 N s are first generated to exclude invalid regions. Under normal circumstances, cloud mask vectors are stored in SHP files with the same names as the original satellite images. Because cloud-affected pixels are masked as invalid, the subsequent texture quality evaluation is effectively performed only on reliable regions. A Gaussian filter is then applied to suppress image noise:
G ( i , j ) = 1 2 π σ 2 e i 2 + j 2 2 σ 2 , G ( i , j ) = G ( i , j ) m = k g k g n = k g k g G ( m , n ) , I s out ( x , y ) = i = k g k g j = k g k g G ( i , j ) · I s ( x i , y j ) ,
where G ( i , j ) is a ( 2 k g + 1 ) × ( 2 k g + 1 ) normalized Gaussian filter kernel, while I s and I s out represent the image before and after filtering, respectively. The smoothed remote sensing images mitigate spectral spillover caused by local radiometric response anomalies, thereby preserving reliable and effective texture features.
The texture quality of each scene is evaluated using the Gray-Level Co-occurrence Matrix (GLCM) [29]. Two commonly used texture indicators, namely, contrast and entropy, are calculated as
C o n t r a s t = n = 0 N g 1 n 2 i = 1 N g j = 1 N g | i j | = n p ( i , j ) , E n t r o p y = i = 0 N g 1 j = 0 N g 1 p ( i , j ) log ( p ( i , j ) ) ,
where p ( i , j ) denotes the ( i , j ) th entry in a normalized gray-tone spatial-dependence matrix, while N g is the number of distinct gray levels in the quantized image.
The final scene score is defined as
S = α · C o n t r a s t + β · E n t r o p y ,
where α and β are weighting coefficients. A higher score usually indicates that the image has richer edges, more corner points, and more abundant texture information, e.g., areas with a high proportion of urban districts, ports, and road intersections. The scene with the highest score I top is selected as the representative scene for geometric positioning accuracy assessment; see Figure 1.

2.3. Geometry-Constrained Coarse Registration

The RPC model is first utilized to estimate the geographic coverage of the target image. The RPC, also known as the Rational Function Model (RFM), has been widely used in the geometric high-precision processing of high-resolution linear-array push-broom optical satellites due to their excellent approximation accuracy, faster computation speed, general form, and ability to conceal original physical parameters [30,31,32]. The RPC has the following form [33]:
x n = p 1 B n , L n , H n p 2 B n , L n , H n y n = p 3 B n , L n , H n p 4 B n , L n , H n ,
where p i | i = 1 , 2 , 3 , 4 are third-order polynomials. This model, combined with Digital Elevation Model (DEM) reference data, establishes an efficient and accurate coordinate transformation between image pixel coordinates I top ( x n , y n ) and geographic coordinates ( B n , L n , H n ) . The DEM data used in this study are derived from the Shuttle Radar Topography Mission (SRTM) 90 m global digital elevation model. The corresponding reference map I map is then extracted according to the projected image footprint.
Due to the large size of satellite images, it is necessary to process I top and I map in blocks during image registration. Because of possible failures of onboard positioning devices and attitude sensors, the RPC coefficients may be biased, causing some satellite images to contain kilometer-level positioning errors. The positioning error e between the geographic coordinates calculated through RPC ( B r p c , L r p c , H r p c ) and the ground truth (GT) ( B g t , L g t , H g t ) considerably reduce the overlap between the reference map block and the target image block. When the positioning error exceeds the block size, there is no overlap between the reference map block and the target image block, leading to registration failure if not corrected.
To address this problem, we design a geometry-constrained coarse registration module to compensate for large initial deviations. Thumbnail images are generated for both the target image I top thumb and the reference map I map thumb . A pre-trained LoFTR (https://github.com/zju3dv/LoFTR, accessed on 10 October 2025) [23] model is applied to obtain an initial set of coarse correspondences:
M thumb = { ( p i t , q i t , P i t ) } i = 1 N t = LoFTR I top thumb , I map thumb ,
where p i t p t and q i t q t denote matched feature locations in I top and I map , respectively, P i t P t denotes the matching confidence, and N t is the number of matched points.
A global coarse affine transformation is subsequently estimated to compensate for large geometric deviations and improve overlap consistency between the image pair:
q tgt t = A coarse p t + t coarse ,
where q tgt t is calculated by transforming q t into the target image pixel coordinates, while A coarse and t coarse are one-dimensional affine transformation parameters. P t is used to construct the diagonal weight matrix W for the weighted least-squares solution of the affine transformation:
p t = A T W A 1 A T W q tgt t , A = A t 0 1 , W = d i a g ( P i t P t ) .

2.4. Adaptive Block Selection

After coarse registration, the overlap region between the target image I top and the reference map I map can be approximately determined. Although the global geometric deviation has been largely corrected, directly performing dense matching on the entire image remains computationally expensive and may introduce unreliable correspondences from low-texture or cloud-contaminated regions.
To improve matching efficiency and robustness, we introduce a match-density-based adaptive block selection strategy that selects the most reliable regions for fine-grained matching. The coarsely registered image is partitioned into regular grids. Let G { G i } i = 1 n denote the set of image grids. The number of valid coarse correspondences within the grid G i is used as the matching density score D i , where
i = 1 n D i = N t .
The matching density reflects both local texture richness and geometric consistency. Regions with abundant stable features generally produce significantly higher matching densities than texture-degraded areas, e.g., oceans, deserts, glaciers, or cloud-covered regions.
All grids are ranked according to
R a n k ( G k ) = D k ,
and the top- K s grids with the highest scores are selected for fine-grained matching:
G s = TopK ( R a n k ( G k ) ) ,
where G s { G i block } i = 1 K s denotes the selected stable block set. Figure 1 illustrates the adaptive block selection procedure.
Compared with random sampling or uniform grid selection, the proposed strategy effectively avoids unreliable regions caused by cloud contamination, water bodies, or weak texture patterns while maintaining broad spatial coverage over the image. Because the candidate blocks are drawn from a fixed regular grid, the selected top K s blocks naturally span different parts of the scene. Nevertheless, when high-density features are spatially clustered, additional spatial diversity constraints (e.g., non-maximum suppression over neighboring grids or a minimum inter-block distance) can be incorporated to further improve distribution uniformity. In our operational implementation, K s = 16 is large enough relative to the grid resolution that clustered selections rarely occur in practice. We leave a stricter spatial-diversity constraint as an optional refinement for future work.

2.5. Hierarchical Feature Verification

Similar to Section 2.3, all selected stable blocks in G s and their corresponding reference maps sequentially obtain associated feature point pairs through the LoFTR model:
M dense = { { ( p j , i l , q j , i l , P j , i l ) } i = 1 N j } j = 1 K s = { ( p j l , q j l , P j l ) } j = 1 K s = { LoFTR G j block , G j map } j = 1 K s .
Although LoFTR provides dense feature correspondences with strong robustness, mismatches still exist due to cloud contamination, temporal appearance variations, moving objects, and local geometric distortions. To improve correspondence reliability, a hierarchical geometric verification framework is introduced.
The verification process consists of three stages: cloud filtering, local affine consistency verification, and global geometric verification.

2.5.1. Cloud Filtering

Cloud-covered regions often generate unstable correspondences because of their dynamic appearance and weak geometric consistency. Therefore, cloud masks generated during the orbit-level scene ranking stage are utilized to remove feature points located within cloud regions.
Let M cloud ( x , y ) denote the cloud mask, where
M cloud ( x , y ) = 1 , valid region 0 , cloud region .
Only feature correspondences ( p j , i l , q j , i l , P j , i l ) M dense satisfying
M cloud ( p j , i l ) = 1
are retained, denoted as M cf .

2.5.2. Local Affine Consistency Verification

Satellite image pairs usually exhibit locally smooth geometric distortions. Therefore, neighboring correspondences should approximately satisfy the same affine transformation.
For each set of correspondence ( p j cf , q j cf , P j cf ) M cf , a local affine model is estimated in a manner similar to the global coarse affine in Section 2.3:
q tgt , j cf = A j ( A coarse p j cf + t coarse ) + t j ,
where A j and t j denote the local affine parameters.
To further improve the precision of local affine model estimation, a RANSAC-based optimization procedure is adopted to iteratively remove remaining outliers. The local reprojection error is computed as
e j , i l = q tgt , j , i cf ( A j ( A coarse p j , i cf + t coarse ) + t j ) ,
where { p j , i cf p j cf , q tgt , j , i cf q tgt , j cf } i = 1 N j . Correspondences with
e j , i l > θ l
are considered outliers and removed. Multiple iterations are performed until there are no outliers, resulting in the optimized A j omp , t j omp and ( p j lacv , q j lacv , P j lacv ) M lacv . Only the match ( p j v , q tgt , j v ) with the smallest local reprojection error in ( p j lacv , q tgt , j lacv ) is retained for global geometric verification, ensuring that the selected K s matches { p j v p v , q tgt , j v q tgt v } j = 1 K s are locally optimal while also balancing the weights across G j block G s .

2.5.3. Global Geometric Verification

A qualified satellite image should possess good internal accuracy. Thus, all high-quality feature points on the image should exhibit similar geometric distortions to their matching points. A global fine affine model is estimated using all remaining correspondences:
q tgt v = A g p v + t g ,
where A g and t g represent the final affine transformation. A more lenient threshold θ g is used to remove unreasonable matching pairs and eliminate low-quality feature points resulting from poor matching performance in partially selected block regions, ensuring that the final correspondence set { p i out p out , q i out q out } i = 1 K f satisfies global geometric consistency constraints:
e i out = q tgt , i out ( A g p i out + t g ) < θ g .

2.6. Geometric Accuracy Estimation

After the verified correspondence set is obtained, the geometric positioning accuracy of the satellite image is estimated in geolocation.
For each correspondence pair, the target image coordinate p i out ( x i tgt , y i tgt ) p out is projected into geolocation p obj , i out ( B i tgt , L i tgt ) p obj out through the RPC model of the target satellite image. The reference map coordinate q i out ( x i ref , y i ref ) q out is transformed into geographic coordinates q obj , i out ( B i ref , L i ref ) q obj out using the georeferencing information { B 0 ref , L 0 ref , a 1 , a 2 } :
B i ref = B 0 ref + a 1 x i ref , L i ref = L 0 ref + a 2 y i ref .
where B 0 ref , L 0 ref represents the coordinates of the upper left corner of the reference map, while a 1 , a 2 represents the map resolution.
The positioning error of the ith correspondence d i d is computed as
d i = q obj , i out p obj , i out .
A robust median estimator is adopted to reduce the influence of residual outliers:
d ¯ = Median ( d ) ,
where d ¯ denotes the final positioning accuracy without GCPs.
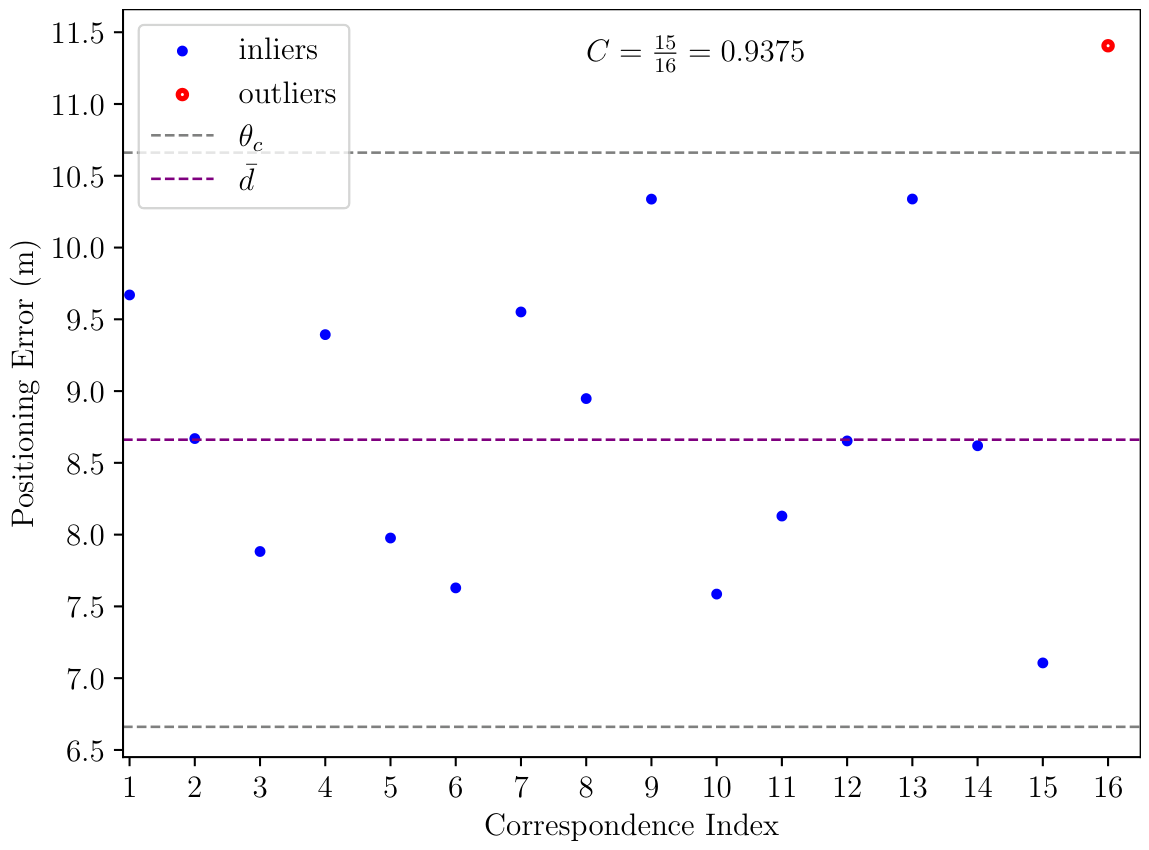
To evaluate the reliability of the estimation result, a confidence score is further introduced based on the dispersion of d . Although ( p out , q tgt out ) satisfy the geometric consistency constraints described in Section 2.5.3, due to factors such as elevation errors and large satellite incidence angles, they do not necessarily have consistent geometric positioning accuracy in the geographic coordinate system. The confidence score is defined as
C = K v K f ,
where K v is the number of matches satisfying
d i d ¯ < θ c ,
in which θ c is an empirical threshold determined by the internal geometric accuracy of the target image and the resolution of the reference map. A smaller error dispersion corresponds to a higher confidence score, indicating a more reliable geometric positioning accuracy assessment result, see Figure 2.
The final output of this framework consists of the positioning accuracy d ¯ without GCPs; the confidence score C; and an automatic quality assessment report, which contains all registered point pairs ( p out , q out ) and global fine affine transformation parameters ( A g , t g ) . This provides effective reference information for subsequent tasks, e.g., quantitative quality assessment of internal geometric accuracy and geometric positioning accuracy correction.

3. Experimental Results

We design our experiments to demonstrate that our system (i) achieves high accuracy and stability in various real-world scenarios and (ii) shows effectiveness and robustness in a real remote sensing production system. Some of the parameters mentioned earlier are shown in Table 1. All experiments are implemented on a server, equipped with a 3.20 GHz Intel Xeon Silver 4215 CPU with 24 GB RAM, and an Nvidia GeForce RTX 3090 with 24 GB RAM.

3.1. Quantitative Results

We manually collected a large-scale sub-meter remote sensing image dataset comprising 12 categories, as summarized in Table 2. All data are obtained by three sub-meter sensors, i.e., JL1GF03D, JL1KF02B, and JXGF07. The reference map is a 1 m resolution Jilin-1 2023 global map, and the DEM resolution is 90 m. The ground truth (GT) positioning accuracy for each scene was verified manually by selecting 10 to 15 well-defined checkpoints on the reference map. Checkpoints were uniformly distributed across the scene, excluding cloud-covered, water-covered, and highly homogeneous regions. The reported median error should be interpreted as the relative positioning error of the satellite image with respect to the 1 m reference map. It is consistent with the map resolution and does not imply sub-meter absolute geodetic accuracy. The GT serves as an independent sanity check rather than a precise absolute reference.
We comparatively evaluate the proposed system using several widely adopted evaluation metrics:
1.
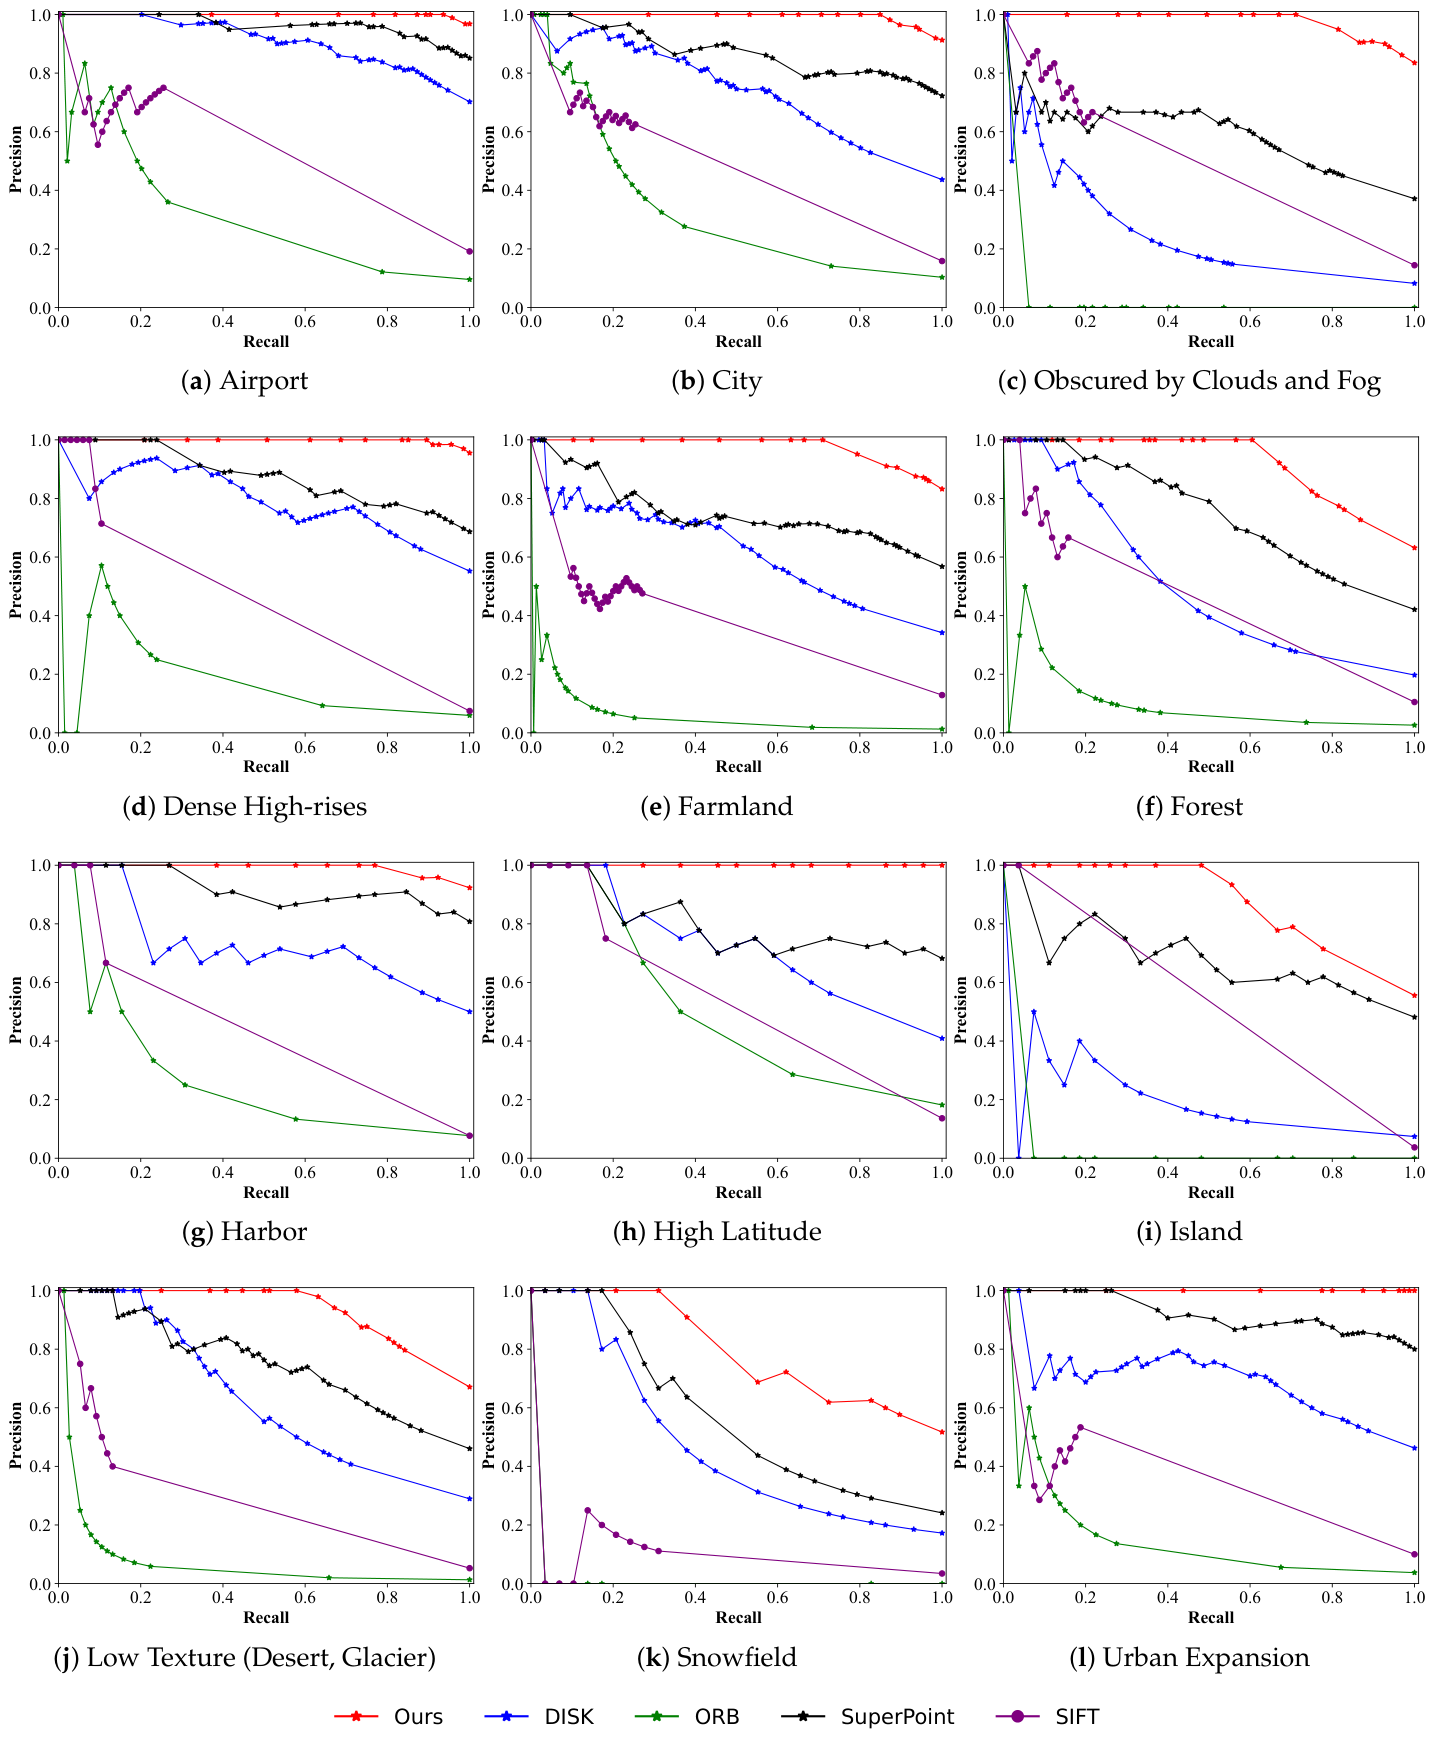
PR-Curve: For each scene, we calculate positioning accuracy d ¯ without GCPs, confidence score C, and positioning error E = | d ¯ d g t | , where d g t is the ground truth. An accurate result requires E to be sufficiently small. By adjusting the confidence threshold, we can obtain a series of Precision and Recall values, where Recall is defined as the proportion of scenes in which C exceeds the threshold to the total number of scenes, while Precision is defined as the proportion of recalled scenes where E < 2 m , i.e., two pixels of the reference map. The PR-Curve (Precision–Recall Curve) [34] shows the trade-off between Precision and Recall across different confidence thresholds, enabling the selection of an optimal threshold that balances these metrics based on the specific requirements of the application.
2.
AP: Average Precision (AP) is calculated as the weighted mean of Precision at each threshold in the PR-Curve, with the increase in Recall from the previous threshold serving as the weight. AP represents the area under the PR-Curve (AUC) [35] and summarizes Precision across varying levels of Recall.
3.
R P 100 , C P 100 : AP does not retain information about specific features of the original PR-Curve, such as the Recall level at which Precision drops from one ( R P 100 ) and the corresponding confidence threshold C P 100 . These two parameters are crucial for some application scenarios that have high requirements for accuracy, such as the automated quality assessment of satellite imagery production. Choosing a reasonable confidence threshold can ensure that the detection results are completely accurate and reliable.
We selected the previous generation of our satellite production system based on the improved SIFT algorithm as the baseline. The improved SIFT algorithm (OpenCV 4.12) [13] computes the geometric positioning accuracy without GCPs for each scene of the orbit without coarse registration, selects block regions according to GLCM scores [29], and uses the SIFT algorithm to extract feature point. The confidence score is directly obtained from the residual of the global affine transformation, rather than by calculating the Euclidean distance in geolocation. In addition, to investigate the impact of feature point matching methods on the final geometric positioning precision, we selected a classical matching algorithm, ORB (OpenCV 4.12) [15] as well as two deep learning-based matching algorithms, namely, SuperPoint [17] and DISK [19], to extract feature points, with LightGlue (https://github.com/cvg/LightGlue, accessed on 10 October 2025) [36] for local feature matching. Except for the baseline method SIFT, all the compared methods share the same proposed system architecture, with only the matching algorithms being different. Specifically, SIFT represents the previous production system without coarse registration, whereas ORB, SuperPoint, DISK, and LoFTR are all evaluated within the same proposed geometry-constrained framework. This distinction should be kept in mind when interpreting the results: the SIFT baseline reflects the performance of the previous production pipeline, while the other methods isolate the effect of the matching algorithm within the proposed system.
As shown in Figure 3 and Table 2, our method outperforms the baseline across all datasets. The accuracy of traditional feature matching algorithms in weakly textured regions sharply decreases as the recall rate increases, as seen in the categories Obscured by Clouds and Fog, Forest, Low Texture, and Snowfield. Traditional block selection strategies based on GLCM texture information tend to select areas that have significant local texture gradient changes but relatively little semantic information, e.g., densely vegetated regions or moving bodies of water, shown in Figure 4. Our adaptive block selection strategy, through coarse registration with a reference map, ensures that the selected regions are semantically rich and contain stable, effective textures. Furthermore, the dense matching and global receptive field design of LoFTR result in a greater number of extracted feature points with higher accuracy. This ensures that our algorithm maintains a high recall rate while achieving extremely high accuracy.
The PR-Curves of other methods exhibits multiple fluctuations, whereas the curve of our method is basically smooth and monotonically decreasing. Confidence scores C are calculated based on distance residuals, representing the dispersion of the positioning accuracy of each feature point. This ensures that the confidence scores C are directly and accurately positively correlated with geometric positioning accuracy without GCPs, making them more practically informative and applicable.

3.2. Qualitative Results

To further demonstrate that our method is applicable to challenging real-world scenarios, we visualized the geometric positioning accuracy without GCP assessment and correction results in four extreme scenarios, shown in Figure 5. We manually applied noise to the attitude sensor, resulting in a kilometer-level initial positioning error. When the initial positioning accuracy is relatively poor, our method ensures, thanks to the affine transformation model fitting in coarse registration, that the selected block regions and the corresponding reference maps have sufficient overlapping regions. The adaptive block selection strategy guarantees that in scenes with considerable map feature variations, texture-stable regions are chosen for dense feature matching. The use of cloud masks for feature point filtering alleviates the negative impact of clouds and fog on feature point extraction. The global receptive field design of the Transformer allows for the output of dense and accurate matching point pairs even in regions with degraded texture. The checkerboard on the right side of Figure 5 demonstrates that, after the positioning error is corrected, the textures of the target image and the reference map can be correctly aligned. The experimental results show that the proposed method can achieve high-precision registration of remote sensing images in challenging real-world scenarios.

3.3. Ablation Studies

To verify the positive contribution of each part of our system to improving the geometric positioning accuracy without GCPs, we removed the geometry-constrained coarse registration (CR, Section 2.3) and adaptive block selection (ABS, Section 2.4), respectively. Since ABS needs to be based on the results of CR, the test results without CR also do not include ABS. We present the testing results of four extremely challenging scenarios in Table 3 to verify the effectiveness of each module. SIFT did not produce valid results in any of the four scenarios, whereas the results from our complete system were manually checked, with an error of less than 2 m. Since when the initial positioning error is greater than the block size, directly reading the reference map based on RPC will result in no effective overlap area with the target block area. Therefore, it is not surprising that both SIFT and Our_wo_CR fail on Poor GEO. As shown in Figure 4, the adaptive block selection strategy guarantees that the selected block areas have stable land feature characteristics and are similar to the reference map, whereas the traditional strategy, which selects solely based on the GLCM scores of the target image, can lead to unstable outputs, as demonstrated by the results in the scenarios of Changes and Clouds. Benefiting from the efficient and accurate feature extraction capability of LoFTR in weak-texture areas, all of our methods have accurate test results on Degradation.

3.4. Production System Deployment

We deployed the proposed geometric positioning accuracy assessment system without GCPs into the Jilin-1 satellite imagery automatic quality assessment system and conducted production testing and verification for over six months. The total test data volume reached the level of millions of images, with a total dataset size on the PB level. After eliminating invalid results, e.g., images with more than 90% cloud cover or missing map areas, we conducted statistics on the effective detection rate for a single week, as shown in Table 4. Regardless of the quality of the images, our method maintains a relatively high effective detection rate, which has increased by 64% compared to the same period last year, further confirming the feasibility of applying our method in real production environments. The tested scenes are typical Jilin-1 sub-meter panchromatic products, with image sizes ranging from approximately 20,000 × 20,000 to 50,000 × 50,000 pixels. The production pipeline requires that daily data (hundreds to thousands of orbits, each orbit containing tens to hundreds of scenes) to be quality-assessed on the same day. Under this requirement, an average detection time of 79 s per scene on the hardware described above satisfies the real-time throughput constraints of the operational production system.

4. Discussion

The proposed framework differs from conventional remote sensing image registration methods in that its primary objective is not to maximize feature matching accuracy under laboratory conditions, but to achieve reliable and fully automatic geometric positioning accuracy assessment in large-scale satellite image production. Most existing studies evaluate registration algorithms using public benchmark datasets with relatively limited image diversity and moderate geometric distortions. In contrast, the proposed framework is specifically designed for industrial production environments, where satellite imagery frequently exhibits kilometer-level initial positioning errors, cloud contamination, weak-texture regions, temporal appearance variations, and heterogeneous imaging conditions. By integrating RPC prior constraints with hierarchical feature matching, the proposed framework effectively narrows the search space while maintaining robust correspondence estimation under these challenging scenarios. The experimental results demonstrate that incorporating geometric constraints into the registration process substantially improves both matching robustness and positioning accuracy estimation, particularly for large-scale commercial satellite imagery.
Another important advantage of the proposed framework lies in its industrial applicability. Instead of treating image registration as an independent computer vision task, the proposed method integrates orbit-level scene ranking, adaptive block selection, hierarchical geometric verification, and confidence-aware accuracy estimation into a unified geometric positioning accuracy assessment pipeline. Our method shares the use of dense correspondences with traditional tie-point/TIN-based geometric correction methods. However, the objective is different: tie-point/TIN methods aim to rigorously correct the sensor model, whereas our framework aims to rapidly assess geometric positioning accuracy and flag unreliable scenes using a confidence score. Therefore, we trade full physical rigor for computational efficiency and unattended scalability. This hierarchical design not only improves registration reliability but also significantly reduces unnecessary computation by focusing matching on representative scenes and high-quality local regions. More importantly, the framework has been successfully deployed in the operational production systems of multiple commercial high-resolution satellite missions and has continuously supported fully automatic geometric positioning accuracy assessment for more than six months. These practical deployments demonstrate that the proposed framework possesses the robustness, scalability, and operational stability required for unattended large-scale satellite image production.
Despite these encouraging results, several limitations remain. First, although the proposed method achieves stable performance for most optical satellite images, extremely widespread cloud coverage or extensive homogeneous regions may still reduce the number of reliable feature correspondences. Second, the current implementation primarily considers affine geometric consistency during feature verification, which may be insufficient for complex nonlinear local distortions caused by terrain or sensor imaging characteristics. Third, the proposed framework has been validated mainly using high-resolution optical satellite imagery, and its generalization to synthetic aperture radar (SAR), hyperspectral, or other multimodal remote sensing data requires further investigation. Future work will therefore focus on extending the framework to multimodal and multi-temporal remote sensing imagery, incorporating more flexible geometric transformation models, and exploring recent foundation models for remote sensing feature matching to further improve robustness and generalization in industrial applications.

5. Conclusions

This paper presented a geometry-constrained framework for automatic geometric positioning accuracy assessment of large-scale satellite imagery. The proposed framework integrates orbit-level scene ranking, geometry-constrained coarse registration, adaptive block selection, dense feature matching, and hierarchical geometric verification into a unified coarse-to-fine geometric positioning accuracy assessment pipeline. By combining Rational Polynomial Coefficient (RPC) prior information with Transformer-based feature matching, the framework effectively addresses the challenges of large initial positioning errors, weakly textured regions, cloud contamination, and temporal appearance variations encountered in industrial satellite image production.
Extensive experiments on multiple commercial sub-meter satellite missions demonstrate that the proposed framework achieves substantially higher matching robustness and positioning accuracy estimation reliability than conventional feature-based approaches while enabling fully automatic positioning accuracy assessment without GCPs. The proposed method achieves a median positioning error below 2 m, AP improvement of 0.53 over the baseline method, and nearly perfect accuracy on the evaluated test set for confidence thresholds above 0.5. The successful deployment of the proposed framework in operational commercial satellite production systems further demonstrates its practical value for large-scale remote sensing image production and provides an effective solution for industrial geometric quality control.

6. Patents

The work presented in this paper has resulted in a Chinese invention patent entitled “An automatic geometric positioning accuracy assessment method and system for remote sensing images”, Chinese Patent No. ZL202511757054.7.

Author Contributions

Conceptualization, data curation, formal analysis, investigation, methodology, resources, software, visualization, writing—original draft preparation, J.C.; validation, W.W. and L.F.; writing—review and editing, W.W., L.F. and Z.L.; supervision, S.Y.; project administration, X.Z.; funding acquisition, H.J. All authors have read and agreed to the published version of the manuscript.

Funding

This research was funded by the Jilin Province Science and Technology Department Development Program, grant number 20260201053GX.

Data Availability Statement

Restrictions apply to the availability of these data.

Acknowledgments

We would like to thank the reviewers for their constructive comments and valuable suggestions. The authors are thankful to Bing Yu, Kangji Du, Mingzhe Liang, and Xin Jin for helping to collect the dataset. During the preparation of this manuscript, the authors used OpenAI’s ChatGPT (GPT-5.5) to assist with English language editing, grammar enhancement, sentence refinement, and improving the overall readability of the manuscript. The AI system was also used to provide suggestions on manuscript organization and academic writing style. No AI-generated scientific results, experimental data, figures, or research conclusions were used in this work. All technical content, including the proposed methodology, implementation, experimental design, data analysis, and conclusions, was conceived, verified, and approved by the authors. The authors accept full responsibility for the content of this publication.

Conflicts of Interest

All authors were employed by the company Chang Guang Satellite Technology Co., Ltd. The authors declare that the research was conducted in the absence of any commercial or financial relationship that could be construed as a potential conflict of interest.

Abbreviations

The following abbreviations are used in this manuscript:
RPCRational Polynomial Coefficient
GCPsGround Control Points
GLCMGray-Level Co-occurrence Matrix
RFMRational Function Model
DEMDigital Elevation Model
SRTMShuttle Radar Topography Mission
GTGround Truth
PR-CurvePrecision–Recall Curve
APAverage Precision
SARSynthetic Aperture Radar

References

  1. Zhu, B.; Zhou, L.; Pu, S.; Fan, J.; Ye, Y. Advances and challenges in multimodal remote sensing image registration. IEEE J. Miniaturization Air Space Syst. 2023, 4, 165–174. [Google Scholar] [CrossRef] [Scilit]
  2. Zhang, Z.; Zhang, M.; Gong, J.; Hu, X.; Xiong, H.; Zhou, H.; Cao, Z. LuoJiaAI: A cloud-based artificial intelligence platform for remote sensing image interpretation. Geo-Spat. Inf. Sci. 2023, 26, 218–241. [Google Scholar] [CrossRef] [Scilit]
  3. Lihong, K.; Jing, T.; Bitao, J. Challenges and research on remote sensing satellite application technology in the Giant Constellation Era. Natl. Remote Sens. Bull. 2024, 28, 1658–1666. [Google Scholar] [CrossRef] [Scilit]
  4. Ge, H.; Li, Y.; Wang, B.; Geng, Y.; Ba, X. Research on automatic quantitative quality inspection method for internal geometric accuracy of remote sensing images. J. Appl. Remote Sens. 2025, 19, 016511. [Google Scholar] [CrossRef] [Scilit]
  5. Jiang, B.; Dong, X.; Deng, M.; Wan, F.; Wang, T.; Li, X.; Zhang, G.; Cheng, Q.; Lv, S. Geolocation accuracy validation of high-resolution SAR satellite images based on the Xianning validation field. Remote Sens. 2023, 15, 1794. [Google Scholar] [CrossRef] [Scilit]
  6. Paul, S.; Pati, U.C. A comprehensive review on remote sensing image registration. Int. J. Remote Sens. 2021, 42, 5396–5432. [Google Scholar] [CrossRef] [Scilit]
  7. Kao, S.C.; Ho, C. Monitoring a process of exponentially distributed characteristics through minimizing the sum of the squared differences. Qual. Quant. 2007, 41, 137–149. [Google Scholar] [CrossRef] [Scilit]
  8. Wu, B.; Hung, C.F. Innovative correlation coefficient measurement with fuzzy data. Math. Probl. Eng. 2016, 2016, 9094832. [Google Scholar] [CrossRef] [Scilit]
  9. Hel-Or, Y.; Hel-Or, H.; David, E. Matching by tone mapping: Photometric invariant template matching. IEEE Trans. Pattern Anal. Mach. Intell. 2013, 36, 317–330. [Google Scholar] [CrossRef] [Scilit]
  10. Ye, Y.; Shan, J.; Hao, S.; Bruzzone, L.; Qin, Y. A local phase based invariant feature for remote sensing image matching. ISPRS J. Photogramm. Remote Sens. 2018, 142, 205–221. [Google Scholar] [CrossRef] [Scilit]
  11. Li, X.; Ai, W.; Feng, R.; Luo, S. Survey of remote sensing image registration based on deep learning. Natl. Remote Sens. Bull. 2023, 27, 267–284. [Google Scholar] [CrossRef] [Scilit]
  12. Xiong, Q.; Fang, S.; Peng, Y.; Gong, Y.; Liu, X. Feature matching of multimodal images based on nonlinear diffusion and progressive filtering. IEEE J. Sel. Top. Appl. Earth Obs. Remote Sens. 2022, 15, 7139–7152. [Google Scholar] [CrossRef] [Scilit]
  13. Lowe, D.G. Distinctive image features from scale-invariant keypoints. Int. J. Comput. Vis. 2004, 60, 91–110. [Google Scholar] [CrossRef] [Scilit]
  14. Bay, H.; Tuytelaars, T.; Van Gool, L. Surf: Speeded up robust features. In Proceedings of the European Conference on Computer Vision; Springer: Berlin/Heidelberg, Germany, 2006; pp. 404–417. [Google Scholar]
  15. Rublee, E.; Rabaud, V.; Konolige, K.; Bradski, G. ORB: An efficient alternative to SIFT or SURF. In Proceedings of the 2011 International Conference on Computer Vision; IEEE: New York, NY, USA, 2011; pp. 2564–2571. [Google Scholar]
  16. Feng, R.; Du, Q.; Luo, H.; Shen, H.; Li, X.; Liu, B. A registration algorithm based on optical flow modification for multi-temporal remote sensing images covering the complex-terrain region. Natl. Remote Sens. Bull. 2021, 25, 630–640. [Google Scholar] [CrossRef] [Scilit]
  17. DeTone, D.; Malisiewicz, T.; Rabinovich, A. Superpoint: Self-supervised interest point detection and description. In Proceedings of the IEEE Conference on Computer Vision and Pattern Recognition Workshops; IEEE: New York, NY, USA, 2018; pp. 224–236. [Google Scholar]
  18. Dusmanu, M.; Rocco, I.; Pajdla, T.; Pollefeys, M.; Sivic, J.; Torii, A.; Sattler, T. D2-net: A trainable cnn for joint detection and description of local features. arXiv 2019, arXiv:1905.03561. [Google Scholar]
  19. Tyszkiewicz, M.; Fua, P.; Trulls, E. Disk: Learning local features with policy gradient. Adv. Neural Inf. Process. Syst. 2020, 33, 14254–14265. [Google Scholar]
  20. Sarlin, P.E.; DeTone, D.; Malisiewicz, T.; Rabinovich, A. SuperGlue: Learning Feature Matching With Graph Neural Networks. In Proceedings of the IEEE/CVF Conference on Computer Vision and Pattern Recognition (CVPR), Seattle, WA, USA, 13–19 June 2020. [Google Scholar]
  21. Rocco, I.; Cimpoi, M.; Arandjelović, R.; Torii, A.; Pajdla, T.; Sivic, J. Neighbourhood consensus networks. Adv. Neural Inf. Process. Syst. 2018, 31, 1651–1662. [Google Scholar]
  22. Li, X.; Han, K.; Li, S.; Prisacariu, V. Dual-resolution correspondence networks. Adv. Neural Inf. Process. Syst. 2020, 33, 17346–17357. [Google Scholar]
  23. Sun, J.; Shen, Z.; Wang, Y.; Bao, H.; Zhou, X. LoFTR: Detector-Free Local Feature Matching With Transformers. In Proceedings of the IEEE/CVF Conference on Computer Vision and Pattern Recognition (CVPR), Nashville, TN, USA, 20–25 June 2021; IEEE: New York, NY, USA, 2021; pp. 8922–8931. [Google Scholar]
  24. Shean, D.E.; Alexandrov, O.; Moratto, Z.M.; Smith, B.E.; Joughin, I.R.; Porter, C.; Morin, P. An automated, open-source pipeline for mass production of digital elevation models (DEMs) from very-high-resolution commercial stereo satellite imagery. ISPRS J. Photogramm. Remote Sens. 2016, 116, 101–117. [Google Scholar] [CrossRef] [Scilit]
  25. Park, R.S.; Scheeres, D.J. Nonlinear semi-analytic methods for trajectory estimation. J. Guid. Control Dyn. 2007, 30, 1668–1676. [Google Scholar] [CrossRef] [Scilit]
  26. Zhou, X.; Armellin, R.; Qiao, D.; Li, X. Time-varying directional state transition tensor for orbit uncertainty propagation. J. Guid. Control Dyn. 2026, 49, 656–672. [Google Scholar] [CrossRef] [Scilit]
  27. Valli, M.; Armellin, R.; Di Lizia, P.; Lavagna, M.R. Nonlinear filtering methods for spacecraft navigation based on differential algebra. Acta Astronaut. 2014, 94, 363–374. [Google Scholar] [CrossRef] [Scilit]
  28. Tao, C.V.; Hu, Y. A comprehensive study of the rational function model for photogrammetric processing. Photogramm. Eng. Remote Sens. 2001, 67, 1347–1358. [Google Scholar]
  29. Haralick, R.M.; Shanmugam, K.; Dinstein, I.H. Textural features for image classification. IEEE Trans. Syst. Man Cybern. 1973, SMC-3, 610–621. [Google Scholar] [CrossRef] [Scilit]
  30. Grodecki, J.; Dial, G. Block adjustment of high-resolution satellite images described by rational polynomials. Photogramm. Eng. Remote Sens. 2003, 69, 59–68. [Google Scholar] [CrossRef] [Scilit]
  31. Fraser, C.S.; Hanley, H.B. Bias-compensated RPCs for sensor orientation of high-resolution satellite imagery. Photogramm. Eng. Remote Sens. 2005, 71, 909–915. [Google Scholar] [CrossRef] [Scilit]
  32. Fraser, C.S.; Dial, G.; Grodecki, J. Sensor orientation via RPCs. ISPRS J. Photogramm. Remote Sens. 2006, 60, 182–194. [Google Scholar] [CrossRef] [Scilit]
  33. Zhang, G.; Zhu, X. A study of the RPC model of TerraSAR-X and COSMO-SkyMed SAR imagery. Remote Sens. Spat. Inf. Sci. 2008, 36, 321–324. [Google Scholar]
  34. Manning, C.; Schutze, H. Foundations of Statistical Natural Language Processing; MIT Press: Cambridge, MA, USA, 1999. [Google Scholar]
  35. Davis, J.; Goadrich, M. The relationship between Precision-Recall and ROC curves. In Proceedings of the 23rd International Conference on Machine Learning; Association for Computing Machinery: New York, NY, USA, 2006; pp. 233–240. [Google Scholar]
  36. Lindenberger, P.; Sarlin, P.E.; Pollefeys, M. Lightglue: Local feature matching at light speed. In Proceedings of the IEEE/CVF International Conference on Computer Vision; IEEE: New York, NY, USA, 2023; pp. 17581–17592. [Google Scholar]
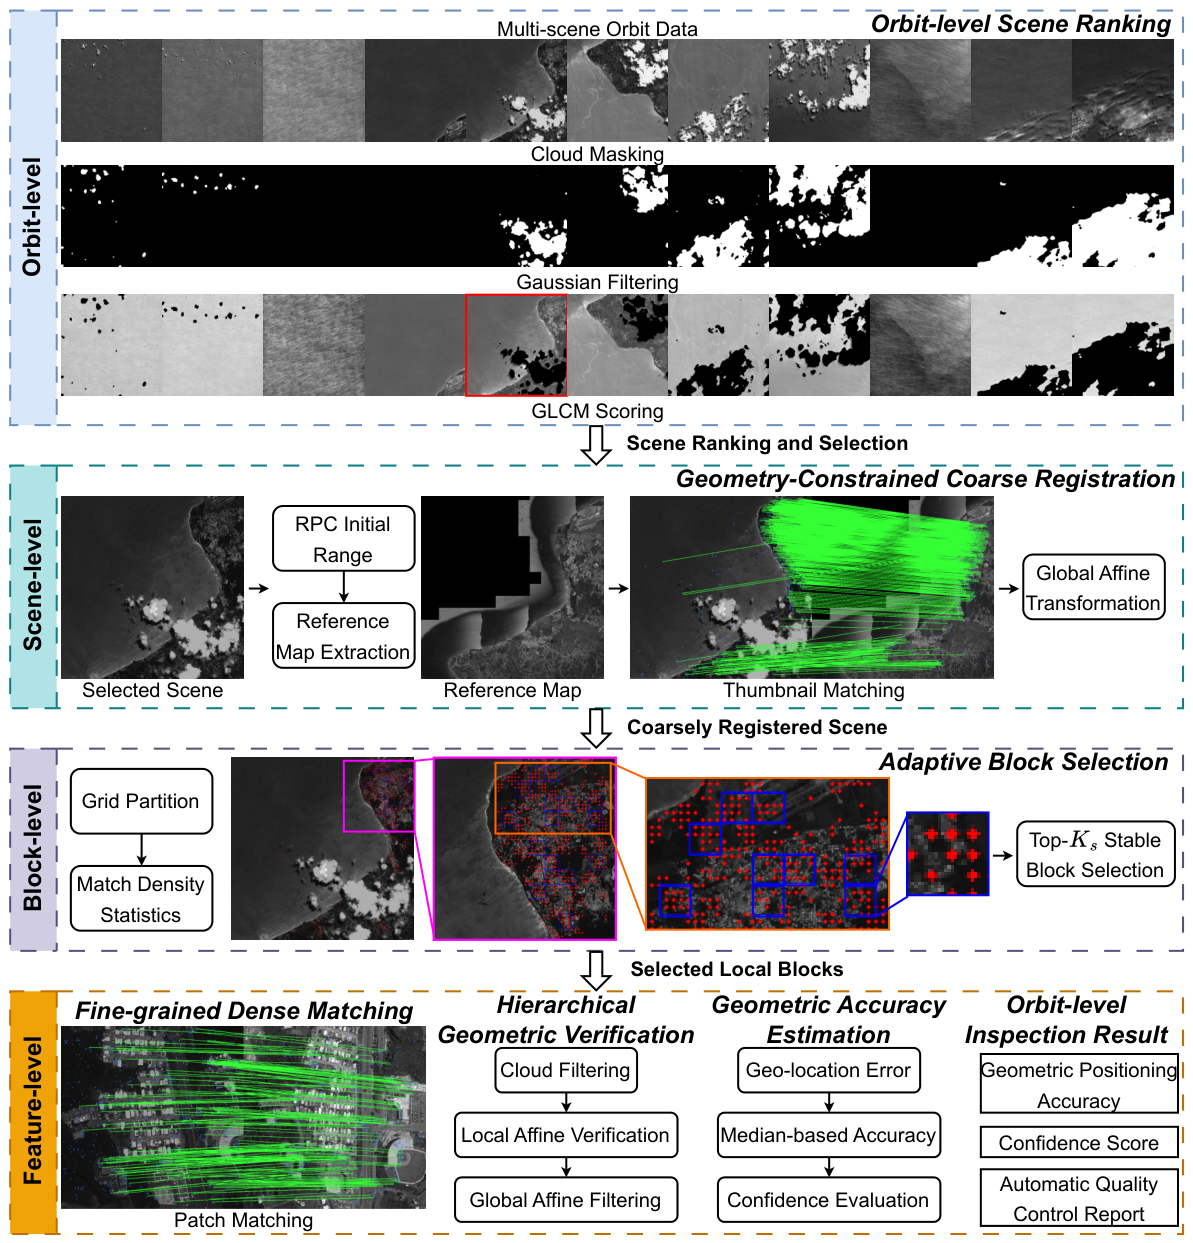
Figure 1. Framework of our system. Our method follows a hierarchical coarse-to-fine strategy consisting of four levels. The red box represents the selected scene. The green connecting lines represent the results of feature matching. The red dots represent the positions of feature points, and the blue boxes represent the selected stable blocks.
Remotesensing 18 03055 g001
Figure 2. Confidence score calculation. The more concentrated the distribution of positioning errors, the higher the confidence score and the more reliable the geometric positioning accuracy assessment result.
Remotesensing 18 03055 g002
Figure 3. Comparison of PR-Curves for all datasets.
Remotesensing 18 03055 g003
Figure 4. Comparison of different block selection strategy. Blue points indicates coarse-registered feature points. Red boxes indicate selected areas. Nt is the number of matched points. The dense and accurate feature point matching of LoFTR and the adaptive block selection (ABS) strategy guarantee that the selected block areas have stable land feature characteristics.
Remotesensing 18 03055 g004
Figure 5. Qualitative results in extremely challenging scenarios. From left to right: target image, reference map, selected blocks (blue points indicates coarse-registered feature points, red boxes indicate selected areas), and the checkerboard diagram of the orthorectified target image and reference map after correction of geometric positioning errors with the final global affine transformation model.
Remotesensing 18 03055 g005
Table 1. Parameters of the proposed system.
SymbolValueFunction
k g 5Gaussian filter kernel size
α 0.4Contrast weighting coefficient
β 0.6Entropy weighting coefficient
S thumb 1024 × 1024Thumbnail size
K s 16Number of fine-grained matching grids
θ l 5Local affine threshold (pixels)
θ g 15Global affine threshold (pixels)
θ c 5Geometric error threshold (m)
Table 2. Dataset specifications and quantitative comparison. C P 100 is marked as / if the corresponding R P 100 is 0. The following categories are used: Airport (AT), City (CY), Obscured by Clouds and Fog (OCF), Dense High-rises (DH), Farmland (FD), Forest (FT), Harbor (HR), High Latitude (HL), Island (ID), Low Texture (Desert, Glacier) (LT), Snowfield (SD), and Urban Expansion (UE). SIFT is the baseline method. ORB, SuperPoint+LightGlue (SuperP), DISK+LightGlue (DISK), and LoFTR (Ours) are the results of different feature point matching methods under our geometry-constrained geometric position accuracy assessment framework. AP is reported as the mean ± standard deviation over 3 repeated runs. An upward arrow ↑ indicates that the higher the value of the metric, the better the performance of the method, while a downward arrow ↓ indicates the opposite. Bold indicates the best performance.
  ATCYOCFDHFDFTHRHLIDLTSDUE
INFOGF03D4151432278301506391142
KF02B48434535543651917321336
GF075329102310634552
Total94126976715576262227762980
AP ↑SIFT0.5350.47690.49120.45310.37940.45110.43790.53870.53640.28680.09990.3522
±0±0±0±0±0±0±0±0±0±0±0±0
ORB0.3130.32940.03090.1740.0580.09660.26270.49670.0370.07480.01720.1502
±0±0±0±0±0±0±0±0±0±0±0±0
SuperP0.96410.87140.5890.87540.75080.74750.91920.7980.67920.7520.57170.9201
±0±0±0±0±0±0±0±0±0±0±0±0
DISK0.90890.73650.25090.78830.61790.5050.72580.71640.19350.63050.47030.6907
±0±0±0±0±0±0±0±0±0±0±0±0
Ours0.99880.99330.97820.99370.9580.91330.994910.87360.93370.79421
±0±0.0001±0±0.0059±0.0264±0.0076±0.0051±0±0±0±0±0
RP100SIFT0000.074600.03950.07690.13640.037000
ORB0.01060.039700000.03850.136400.013200.0125
SuperP0.34040.095200.23880.03230.14470.26920.13640.0370.13160.17240.2625
DISK0.202100.010300.03230.09210.15380.181800.19740.13790.0375
Ours0.93620.84920.71130.89550.70970.60530.769210.48150.57890.31031
CP100SIFT///0.8649/10.94320.87880.775///
ORB0.6250.6875////0.93750.5/0.9375/0.75
SuperP0.93751/0.92860.93330.68750.8750.8750.93750.83330.3750.8667
DISK1/0.9375/0.91670.53850.8750.6667/0.750.51
Ours0.50.50.50.43750.50.43750.50.18750.50.50.50.25
Table 3. Geometric positioning accuracy estimation results without GCPs (m) and confidence score. The four selected images correspond, respectively, to the scenarios in Section 3.2: poor initial positioning accuracy (Poor GEO), significant changes in characteristics (Changes), clouds obscuring (Clouds), feature degradation (Degradation). The failed test cases are marked as /.
 Poor GEOChangesCloudsDegradation
SIFT////
Ours_wo_CR/12.27 (0.56)21.87 (0.31)45.11 (1)
Ours_wo_ABS7726.62 (0.75)12.24 (0.69)26.33 (0.06)45.01 (1)
Ours7727.36 (1)12.64 (0.9375)19.36 (0.875)45.33 (1)
Table 4. Production statistics, from 8 November to 14 November 2025. The quality level assessment is based on a comprehensive evaluation of the radiometric and geometric quality of remote sensing images.
Quality GradeTotalNumber of DetectionsRecall
High41,90340,53597%
Low26,62325,60996%
Disclaimer/Publisher’s Note: The statements, opinions and data contained in all publications are solely those of the individual author(s) and contributor(s) and not of MDPI and/or the editor(s). MDPI and/or the editor(s) disclaim responsibility for any injury to people or property resulting from any ideas, methods, instructions or products referred to in the content.