Article

Detail Versus Certainty: A Metric Multi-Source Reconstruction of the Temple of Bel, Palmyra

1
Cultural Heritage Engineering Initiative, University of California San Diego, La Jolla, CA 92093, USA
2
OpenHeritage3D, 449 15th Street, Oakland, CA 94612, USA
3
Institute of Geomatics, FHNW University of Applied Sciences and Arts Northwestern Switzerland, 4132 Muttenz, Switzerland
4
Department of Chemical, Physical, Mathematical and Natural Sciences, University of Sassari, 07100 Sassari, Italy
5
Department of Humanities and Social Sciences, University of Sassari, 07100 Sassari, Italy
*
Author to whom correspondence should be addressed.
Remote Sens. 2026, 18(17), 3038; https://doi.org/10.3390/rs18173038
Submission received: 24 July 2026 / Revised: 1 September 2026 / Accepted: 3 September 2026 / Published: 5 September 2026

Highlights

What are the main findings?
  • A reproducible framework for integrating heterogeneous historical datasets into a metrically anchored heritage model, transferable to any site documented by archival sources of unequal geometric quality.
  • A hierarchical alignment method that preserves metric accuracy across heterogeneous sources (TLS, panoramas, crowdsourced photos) by registering them in order of decreasing geometric fidelity.
  • A visibility-based pose-recovery method for legacy TLS scans, released as open-source software.
What are the implications of the main findings?
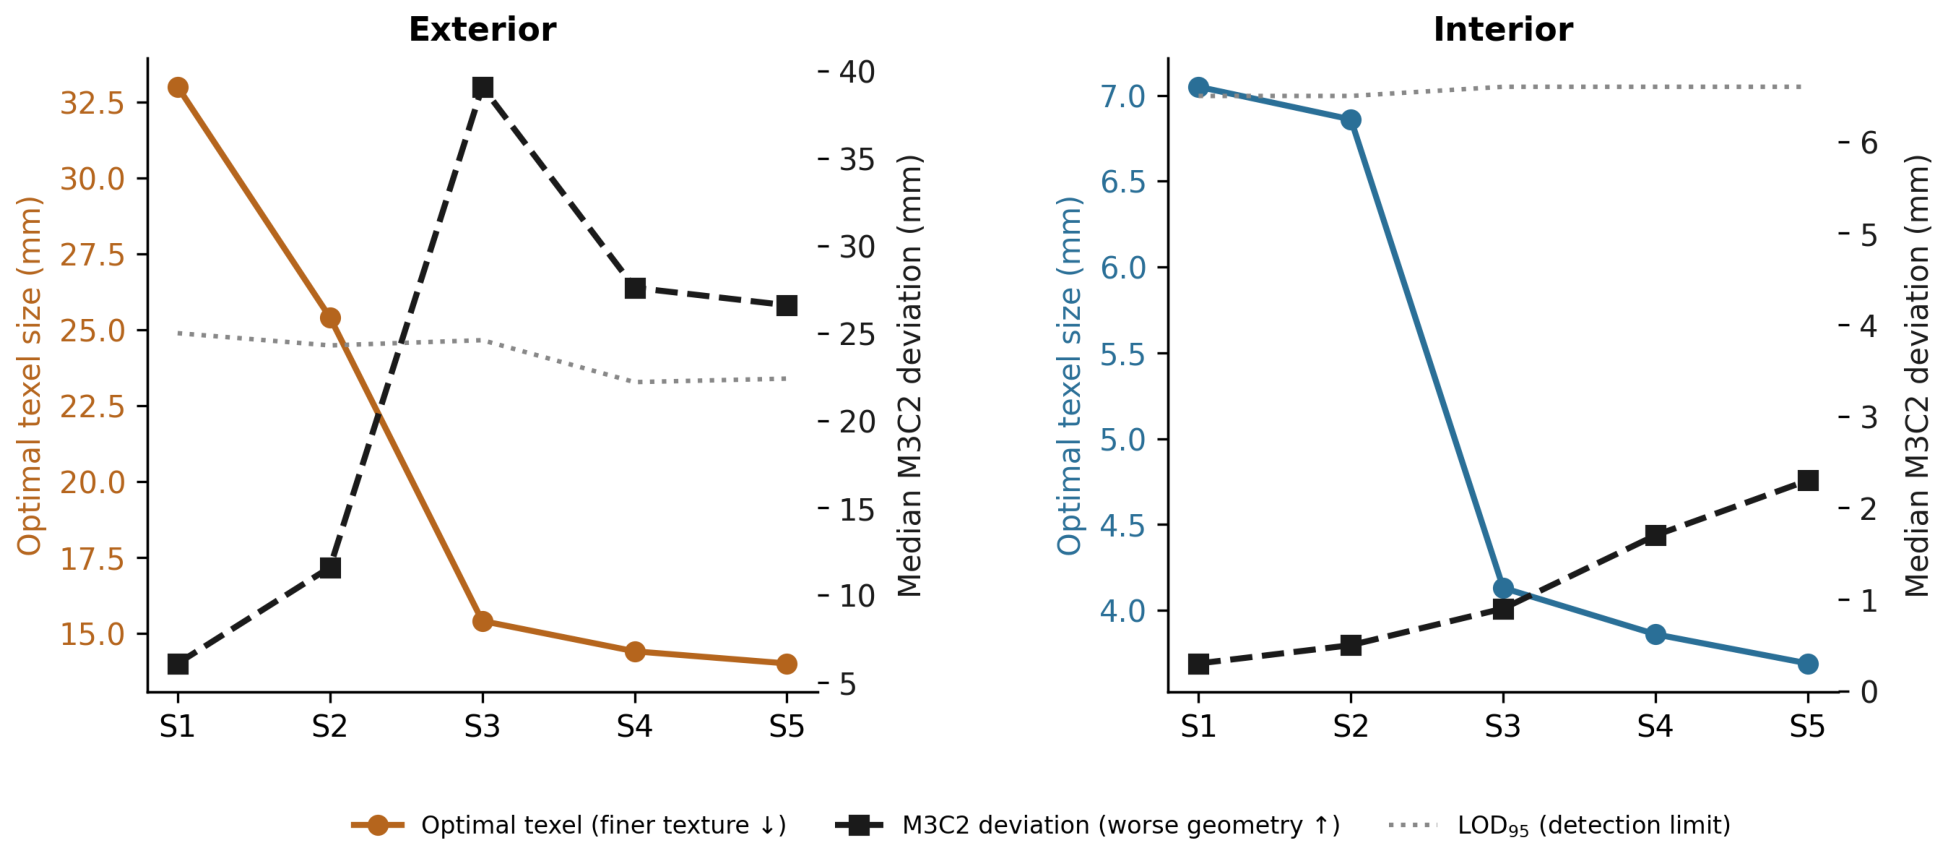
  • Texture detail and geometric certainty diverge across fusion stages, so no single reconstruction serves all uses: laser-and-panorama stages for metric and conservation work, crowdsourced-photo stages for visualization
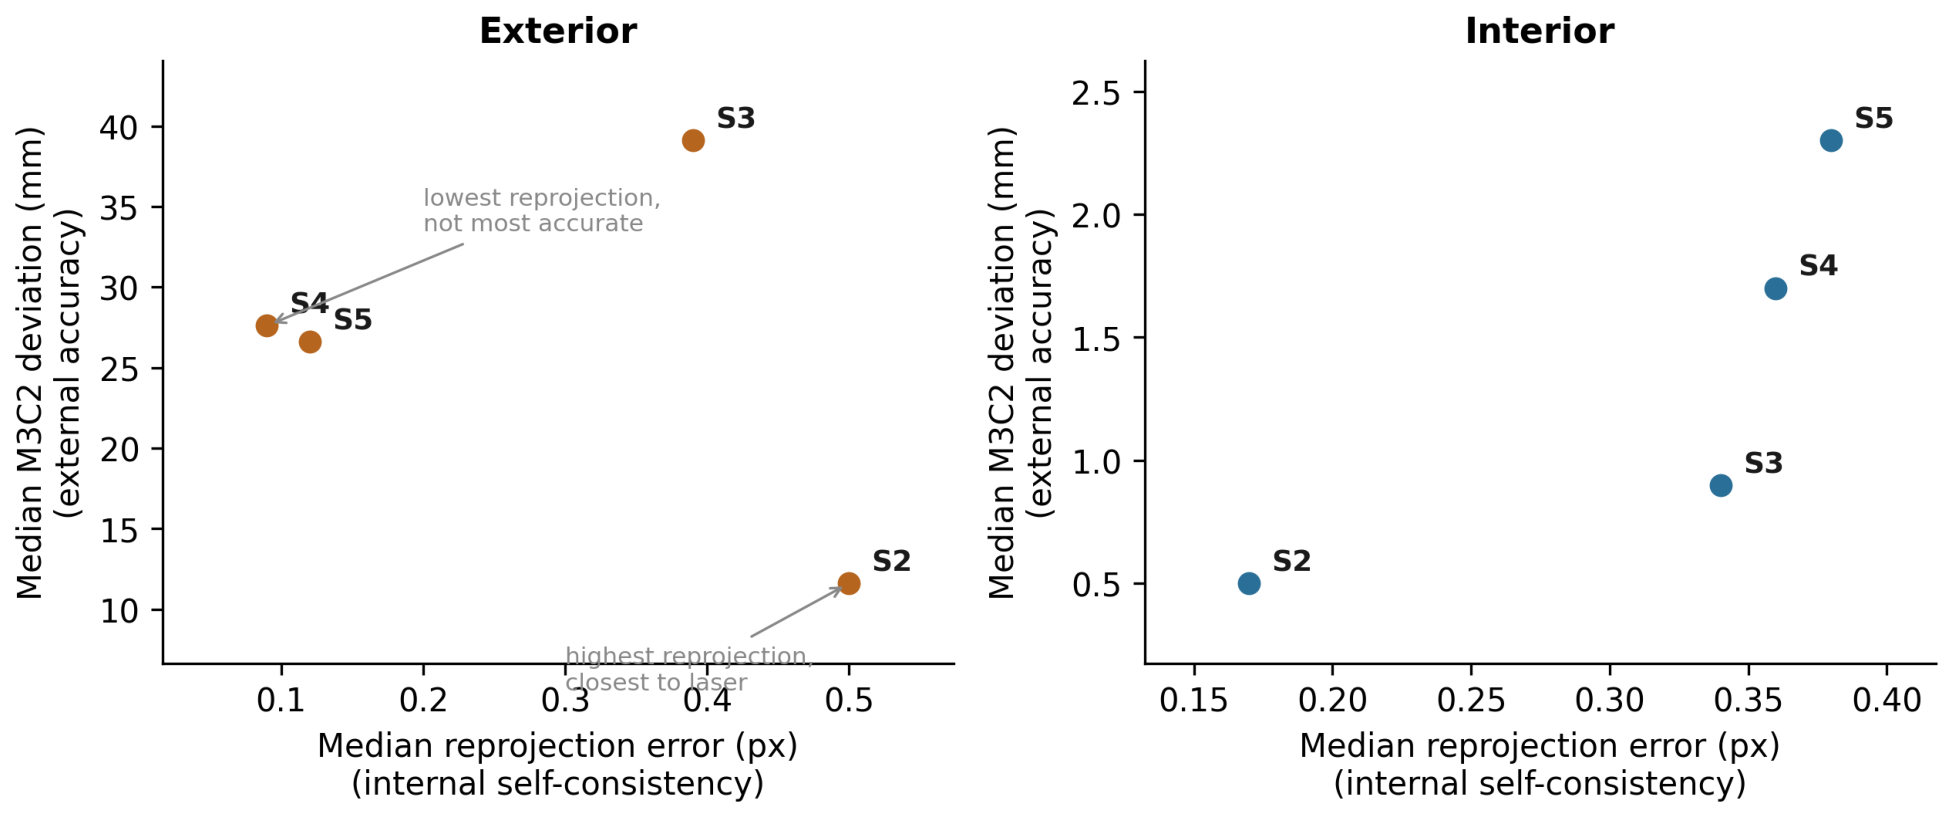
  • Against a laser reference, internal photogrammetric metrics (reprojection error) do not predict geometric accuracy, exposing a resolution-versus-accuracy trade-off.

Abstract

The Temple of Bel in Palmyra, Syria, was destroyed by insurgents in August 2015 after standing for nearly two millennia. This paper presents a new high-resolution digital reconstruction integrating three heterogeneous datasets: terrestrial laser scanning (TLS) captured by Kiyohide Saito in 2010, spherical panoramic imagery from Gabriele Fangi in 2010, and approximately 1580 crowdsourced tourist photographs spanning 1974–2014 from the #NewPalmyra project. We describe a hierarchical alignment methodology that preserves metric accuracy by sequentially registering data sources in order of decreasing geometric fidelity, and document adaptive reconstruction strategies developed in response to observed artifacts when fusing depth sources of disparate resolution. Across the fusion sequence, texture resolution roughly doubles (optimal texel from 33 to 14 mm exterior, 7.1 to 3.7 mm interior) while geometric agreement with the laser moves the other way: from the 6 mm baseline of simply meshing the laser data on the exterior to roughly 3–4 cm once the crowdsourced frame photography is fused in. The laser-and-panorama core stays within the laser’s detection limit, and the geometric cost arrives only with the crowdsourced frame photography. We further find that internal photogrammetric quality metrics do not predict external accuracy: the lowest-reprojection stage is not the most faithful to the laser, and the panorama stage whose surface best matches the laser carries the highest reprojection of all. All primary datasets are published as independent, citable records and served through a web-based environment for full-resolution comparative analysis without specialized software. The reconstruction is presented not as a finished artifact but as an extensible framework for continued development, in which each dataset, stage, and component remains an independently citable, recomposable layer that future imagery and methods can refine.

1. Introduction

Palmyra, known in antiquity as Tadmor, is among the most significant archaeological sites of the ancient world. An oasis city in the Syrian Desert some 215 km northeast of Damascus, it flourished as a caravan station on the Silk Road and reached its zenith in the first through third centuries CE, producing at the crossroads of civilizations a distinctive architecture that blended Greco-Roman building traditions with Persian and local Near Eastern influences [1,2]. At the heart of Palmyrene religious life stood the Temple of Bel, consecrated in 32 CE within a precinct measuring approximately 205 m per side. Its cella, rising over 14 m and measuring 39.45 by 13.86 m at the stylobate (Figure 1), carried the gilded bronze capitals and carved adyton ceilings, with their zodiac and floral patterns, that made it for many scholars the most eloquent monument of the Roman East [3,4].

1.1. The 2015 Destruction

In May 2015, the Islamic State of Iraq and Syria (ISIS) captured Palmyra, initiating a systematic campaign of destruction against the site’s pre-Islamic monuments. On 30 August 2015, ISIS detonated explosives within the Temple of Bel, destroying the cella and collapsing the surrounding portico columns. Satellite imagery from UNITAR-UNOSAT confirmed the destruction of the main building and adjacent columns. When Syrian government forces recaptured Palmyra in March 2016, specialists confirmed that only approximately 20% of the Temple of Bel’s stonework remained whole, with the western gate and foundation walls still partially intact [5].

1.2. Current Situation

Following the fall of the Assad regime in December 2024, Palmyra came under the control of the Syrian Free Army. The site currently faces profound challenges: of the pre-war population of approximately 100,000, only about 10% have returned. The Efqa oasis was devastated by fires set in 2020 and now faces severe water shortages [6]. The Palmyra Museum remains in poor condition, with evidence of extensive illegal excavations and artifact theft. The United Nations Educational, Scientific and Cultural Organization (UNESCO) has provided remote support through satellite analysis since 2015 but has not conducted on-site work due to security conditions. Scholars emphasize that meaningful restoration cannot proceed until the local community returns [5].
In November 2025, UNESCO and the Aliph Foundation convened the first comprehensive post-Assad conference on Palmyra in Lausanne, recommending an international expert task force to oversee restoration [7]; major monumental work including the Temple of Bel is expected to follow under that framework, though no timeline has yet been set [8]. UNESCO’s prior assistance to the site has been modest, at approximately USD 111,250 across six approved requests from 1989–2023, including a 2016 emergency proposal for the still-standing portico of the Temple of Bel [9,10]. Earlier work already demonstrated the role of digital documentation in this planning: in 2016, ICONEM and the Directorate General of Antiquities and Museums of Syria produced a preliminary photogrammetric reconstruction of the temple as a reference for future restoration [11]. By providing open-access geometric and visual documentation independent of physical access, digital reconstructions such as ours are positioned to support both the planning and execution of that work as funding and political conditions permit.

1.3. Digital Preservation Context

The destruction of Palmyra’s monuments catalyzed unprecedented international efforts in digital heritage documentation and reconstruction. These efforts have demonstrated that pre-existing survey data, even when incomplete or captured for unrelated purposes, can provide foundational geometry for reconstructing destroyed monuments. This paper contributes to that effort by integrating previously unpublished datasets with crowdsourced imagery within a metrologically sound archival framework, enabling continued development by the international digital heritage community.

2. Literature Review

2.1. Foundations of Crowdsourced Photogrammetric Reconstruction

The conceptual foundations for reconstructing heritage sites from crowdsourced tourist photography emerged from pioneering work in computer vision. Snavely et al. [12] introduced Photo Tourism, demonstrating that structure-from-motion (SfM) algorithms could extract meaningful geometric information from photographs taken by different cameras, at different times, under varying lighting conditions. The “Building Rome in a Day” project [13] scaled these techniques to city-wide reconstruction from over 150,000 tourist photographs, successfully reconstructing major Roman landmarks including the Colosseum, St. Peter’s Basilica, and the Pantheon.
Recent advances in deep learning have addressed key limitations of traditional feature matching. Morelli et al. [14] demonstrated the potential of photogrammetric AI for “reverse engineering” lost heritage in their study of the Sycamore Gap tree, employing deep-learning-based features to overcome limitations of traditional matching approaches. Their work highlighted that traditional photogrammetric pipelines often struggle with crowdsourced imagery due to extreme variations in lighting, seasonal changes, camera quality, and viewpoint distribution.

2.2. Previous Digital Reconstruction Efforts at Palmyra

Specific efforts to reconstruct Palmyra’s destroyed monuments have demonstrated both the potential and challenges of combining professional and crowdsourced imagery. Wahbeh et al. [4] presented a workflow combining public domain tourist photographs with professional panoramic imagery captured by Professor Gabriele Fangi prior to the site’s destruction, documenting the challenges of reconstructing heritage monuments from “imagery in the wild”: photographs with unknown camera parameters, no control points, and arbitrary distribution of viewpoints.
Professor Fangi developed and applied multi-image spherical photogrammetry (MISP) for metric recording at numerous UNESCO sites throughout Syria prior to the conflict [15,16,17,18,19]. Following his death in January 2020, his panoramic datasets remain among the most valuable pre-destruction documentation resources. Silver et al. [2] synthesized historical research, photogrammetric documentation, and 3D modeling to provide a comprehensive resource. Japanese archaeologist Kiyohide Saito contributed terrestrial laser scanning (TLS) scanning of Palmyra, providing high-accuracy geometric reference data [20].

2.3. Crowdsourced Data Platforms

The #NewPalmyra project represents a significant community-driven effort founded by Bassel Khartabil, who documented Palmyra before his arrest by the Assad regime in 2012 and subsequent execution in 2015. In 2018, #NewPalmyra organized the mass donation of over 3000 high-resolution images, published as open data on Flickr [21]. Datasets released by McAvoy [22] added curated and masked tourist-photo-based reconstructions to the public domain.

2.4. Multi-Source Integration and Depth Map Fusion

The integration of heterogeneous data sources (TLS point clouds, professional panoramic imagery, and crowdsourced tourist photographs) presents specific technical challenges that the literature has only partially addressed. TLS provides accurate geometric reference but typically lacks color information. Panoramic imagery offers high-resolution texture with wide coverage but requires specialized processing. Tourist photographs provide dense coverage of visually distinctive features but often fail to document architecturally significant but visually unremarkable areas [23]. A robust reconstruction workflow must address scale ambiguity inherent in SfM outputs and registration of multi-source point clouds with differing densities and accuracies.
Depth map fusion in multi-view stereo (MVS) pipelines has been extensively studied for homogeneous input sources. Fusion algorithms typically weight depth contributions based on geometric consistency, viewing angle, and confidence measures derived from matching costs [24]. The Total Generalized Variation (TGV) fusion approach, which Agisoft explicitly cites as foundational to Metashape’s depth-map-based processing [25], penalizes discrepancies between depth estimates while enforcing spatial smoothness. However, these algorithms were developed primarily for combining multiple photogrammetric depth maps from similar cameras rather than for arbitrarily heterogeneous sensor data.
Burgdorfer and Mordohai [26] observe that depth map fusion remains “a sequence of heuristic operations” rather than principled multi-resolution arbitration, noting that hand-tuned parameters fail to generalize across input configurations. Their V-FUSE framework attempts to learn fusion weights from data, acknowledging the limitations of current approaches. Similarly, Qin et al. [27] propose uncertainty-guided depth fusion for satellite imagery, observing that fusion methods “rarely consider the use of a priori knowledge inherited from the photogrammetric stereo processing”, a critique equally applicable to TLS integration.
The fusion of TLS and photogrammetric data presents challenges distinct from homogeneous MVS fusion. Maskeliūnas et al. [28] explicitly address “the challenges posed by combining point clouds of differing resolutions,” noting that “weighted averaging techniques can be employed to better integrate the differing resolutions of TLS and photogrammetry data” using weights reflecting “data quality, resolution, and sensor type”. Critically, they observe the need to ensure “high-resolution TLS data do not overly dominate the final fused model”, acknowledging that naive fusion can produce unexpected dominance patterns in either direction. Wang et al. [29] describe heterogeneous point cloud registration as facing “unique challenges due to the inherent discrepancies in density, precision, noise, and overlap.”
For heritage documentation specifically, combinations of TLS and photogrammetry have been studied extensively [30,31], though these works largely treat integration as a post-processing step (point cloud merging) rather than examining depth-level fusion within reconstruction pipelines. The literature reveals a gap between theoretical recognition that heterogeneous sensor fusion requires special treatment and practical implementation in commercial software, which typically assumes relatively homogeneous input quality.
This study addresses that gap by asking what a reconstruction gains, and what it gives up, when sources of sharply unequal quality are fused under an explicit precision hierarchy. Three questions follow. First, can a legacy laser dataset whose acquisition metadata has been lost be restored to service as a metric reference frame? Second, does registering sources in order of decreasing fidelity, locking each layer before the next is admitted, prevent lower-confidence imagery from displacing the laser geometry beneath it? Third, do a pipeline’s internal quality indicators, and the metadata completeness by which crowdsourced imagery is conventionally triaged, predict which stages are the more faithful to that reference? We expected all three to resolve favorably. The results confirm the first and overturn our expectations on the others, and it is those reversals, rather than the reconstruction itself, that we take to be this work’s transferable contribution.

3. Materials and Methods

This reconstruction integrates three disparate datasets, each offering unique utility (Table 1). The following subsections describe each dataset’s characteristics, limitations, and the processing workflows developed to address them.

3.1. Reconstruction Workflow Overview

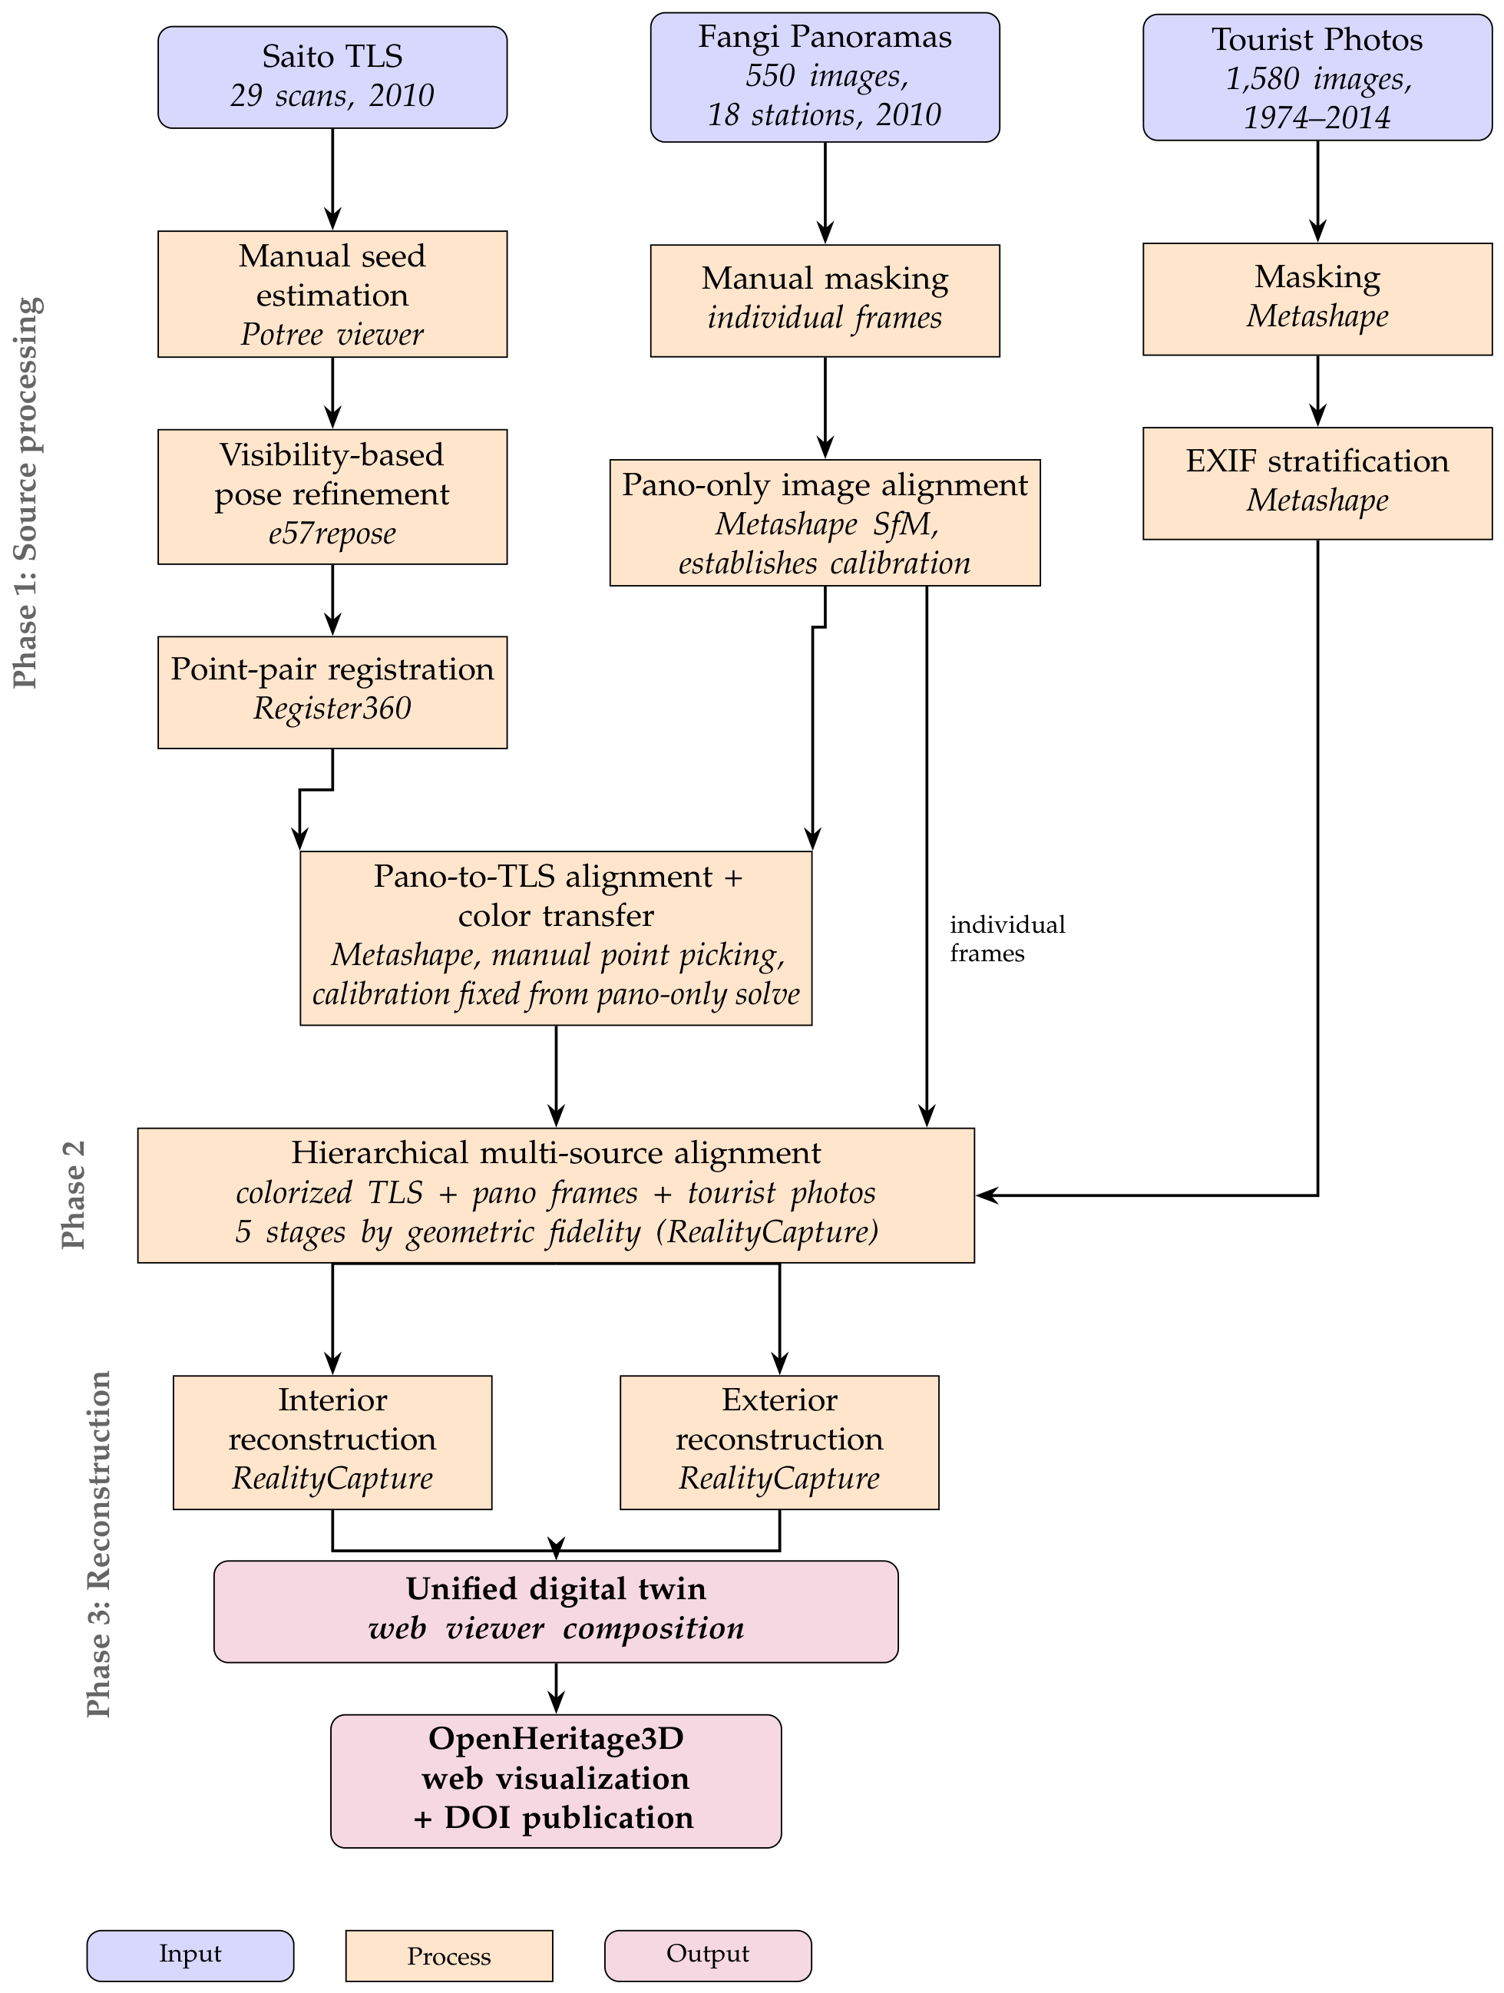
The reconstruction proceeds in three phases (Figure 2). The first processes each source independently, then binds the laser and panoramic streams: the Saito scans recover their lost poses and are registered to one another (Section 3.3), the Fangi frames are masked and aligned to establish a camera calibration from the image network alone, and the panoramas are anchored to the scans by manually picked markers so panoramic color can be projected onto the colorless returns—all of this is performed in Agisoft Metashape (Section 3.3.4). The second aligns all imagery hierarchically against that colorized reference, admitting each cohort in order of decreasing reliability and holding registered geometry fixed as new images enter (Section 3.4). This yields the cumulative stages the Section 5 evaluates: S 1 , colorized laser alone; S 2 , plus panoramic frames; S 3 S 5 , adding crowdsourced photographs in cohorts of decreasing metadata completeness, with the raw unmeshed cloud retained as the reference S 0 . The third performs dense reconstruction in the same environment (Section 3.5), split into independent interior and exterior components so parameters can match each one’s scale and each can be republished separately. Components are layered in the web viewer of Section 4 rather than merged, each with its own Digital Object Identifier (DOI).

3.2. Dataset Descriptions

3.2.1. Panoramic Photogrammetry

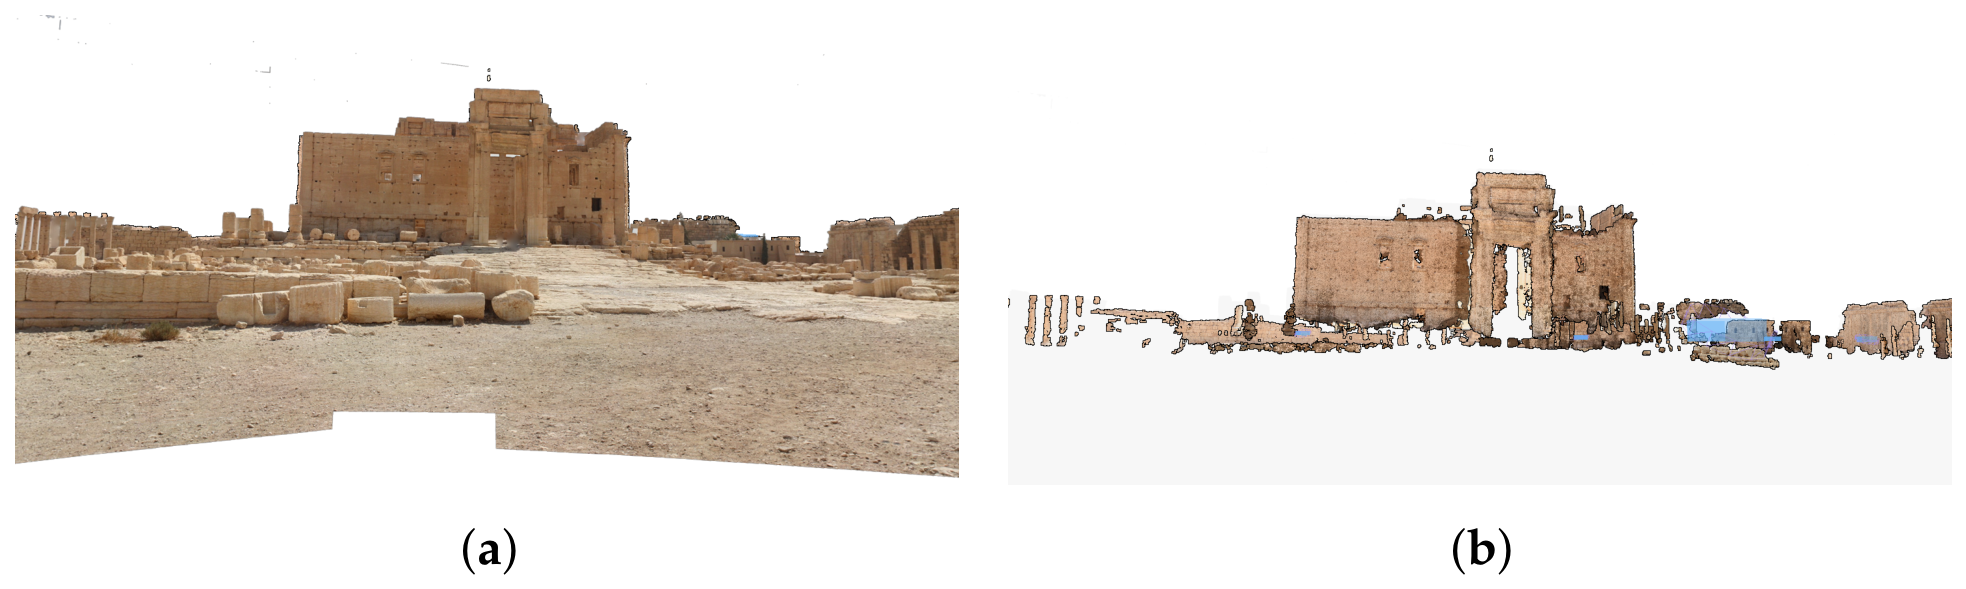
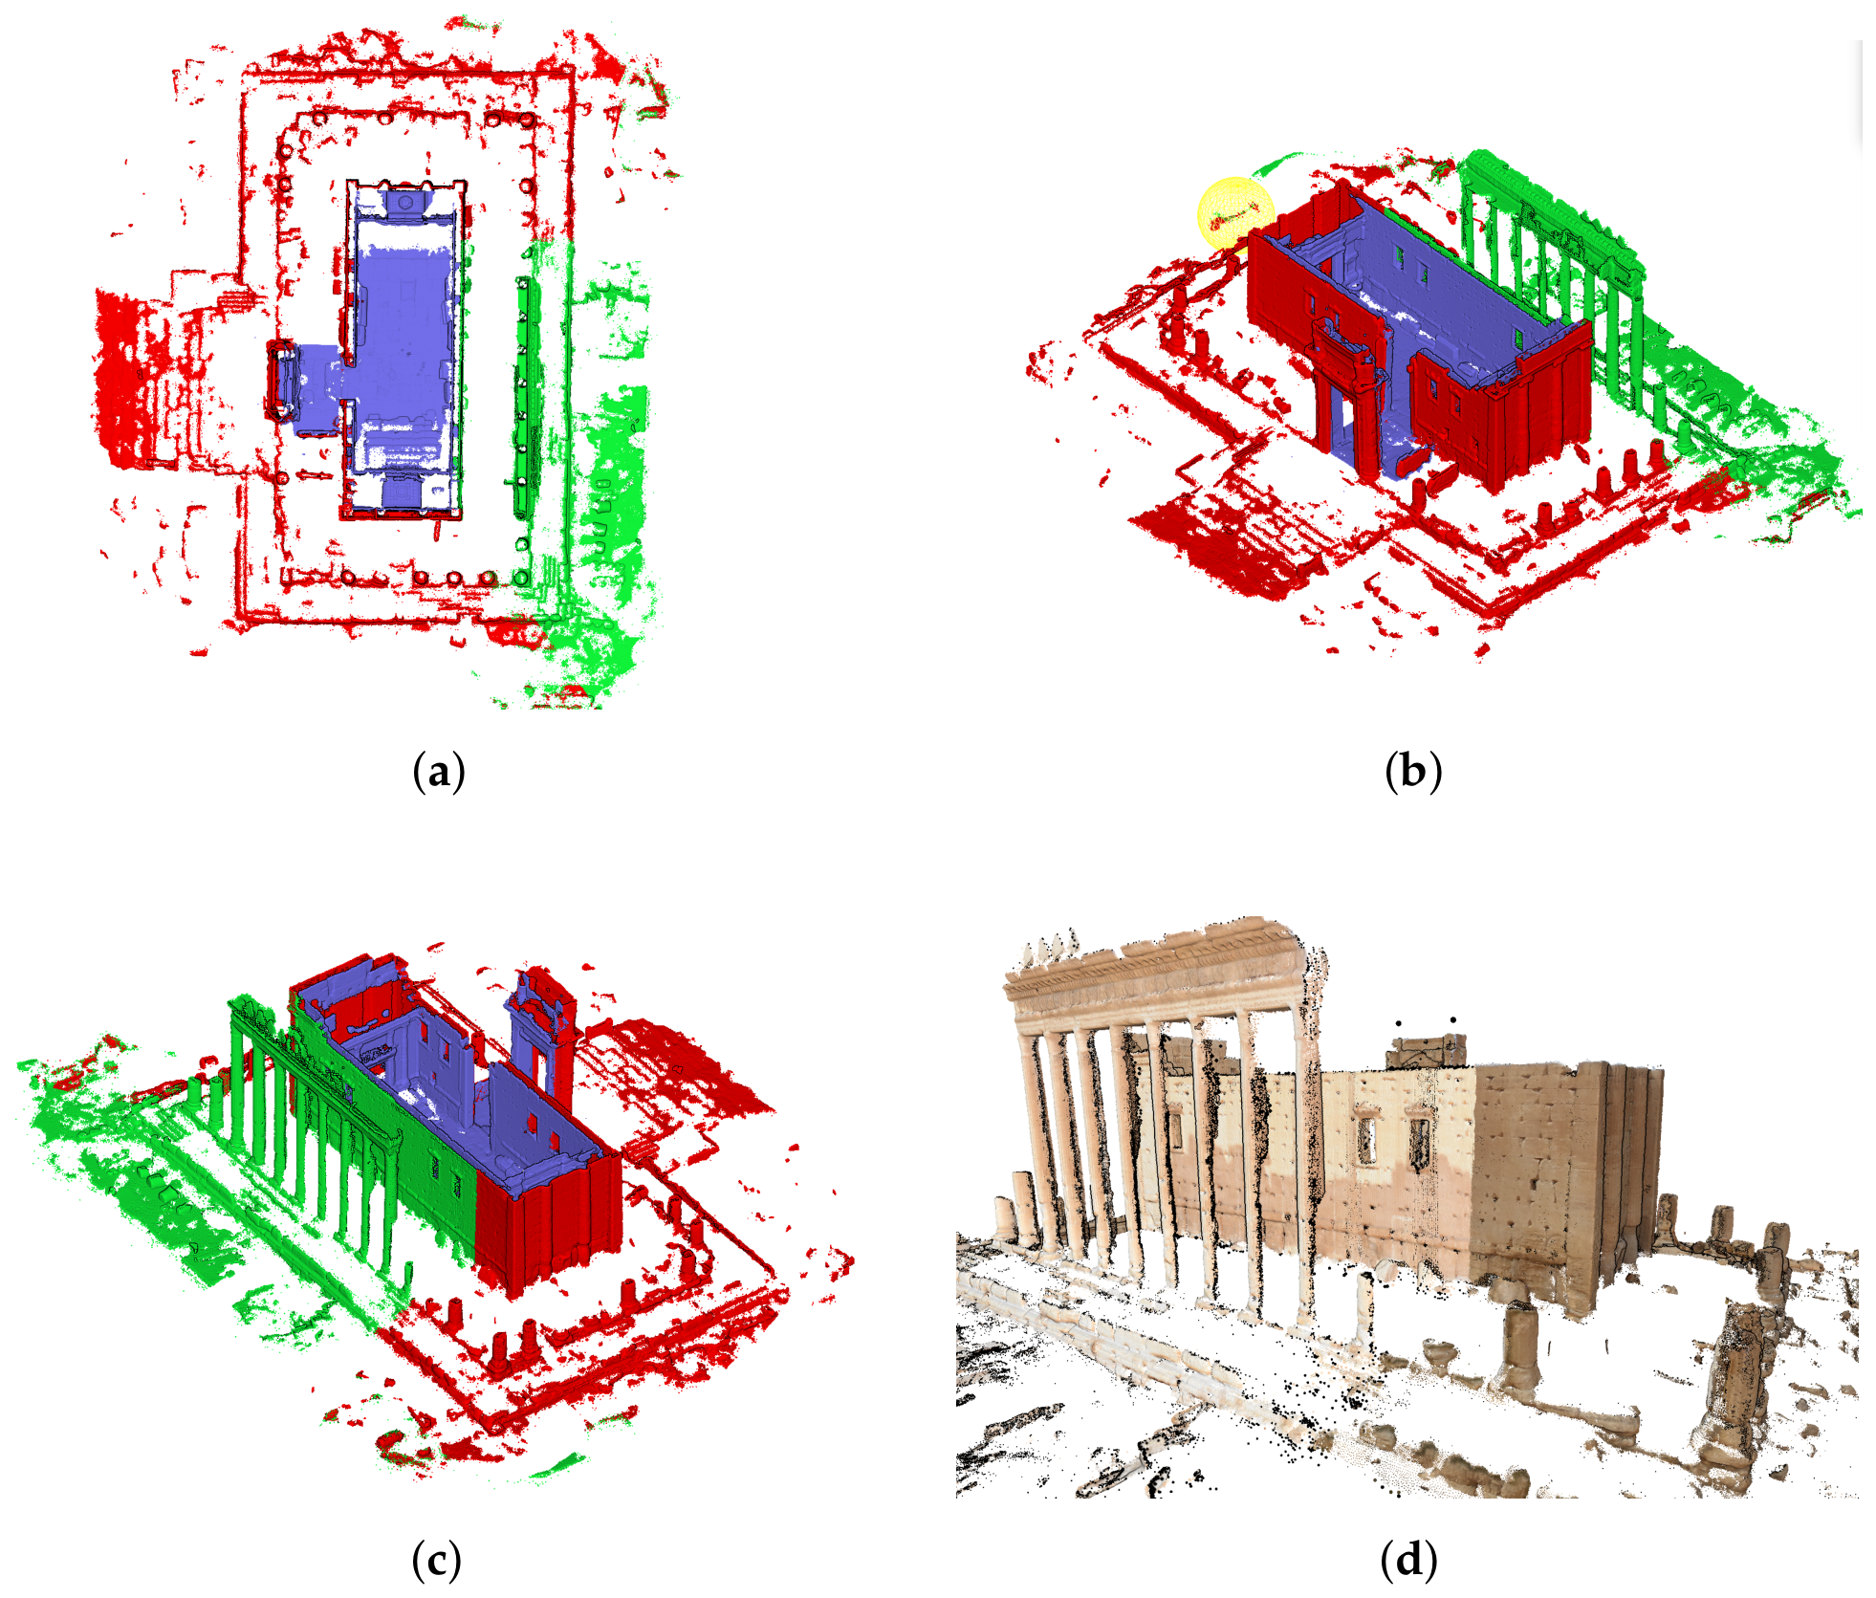
The panoramic dataset was captured by Professor Gabriele Fangi of the Polytechnic University of Marche during a 2010 survey expedition (Appendix A). It comprises 550 individual images forming 18 spherical panoramic stations: 12 exterior stations positioned 30–60 m from the structure, and 6 interior stations at 1–30 m distances (Figure 3). Of the 550 masked frames, 521 were enabled in the alignment described in Section 3.3.4 and 517 registered successfully; the remainder were disabled for redundancy or quality, and the omitted exterior frames account for the difference between the 12 stations used here and the 13 reported by Wahbeh et al. [4] from the same survey.
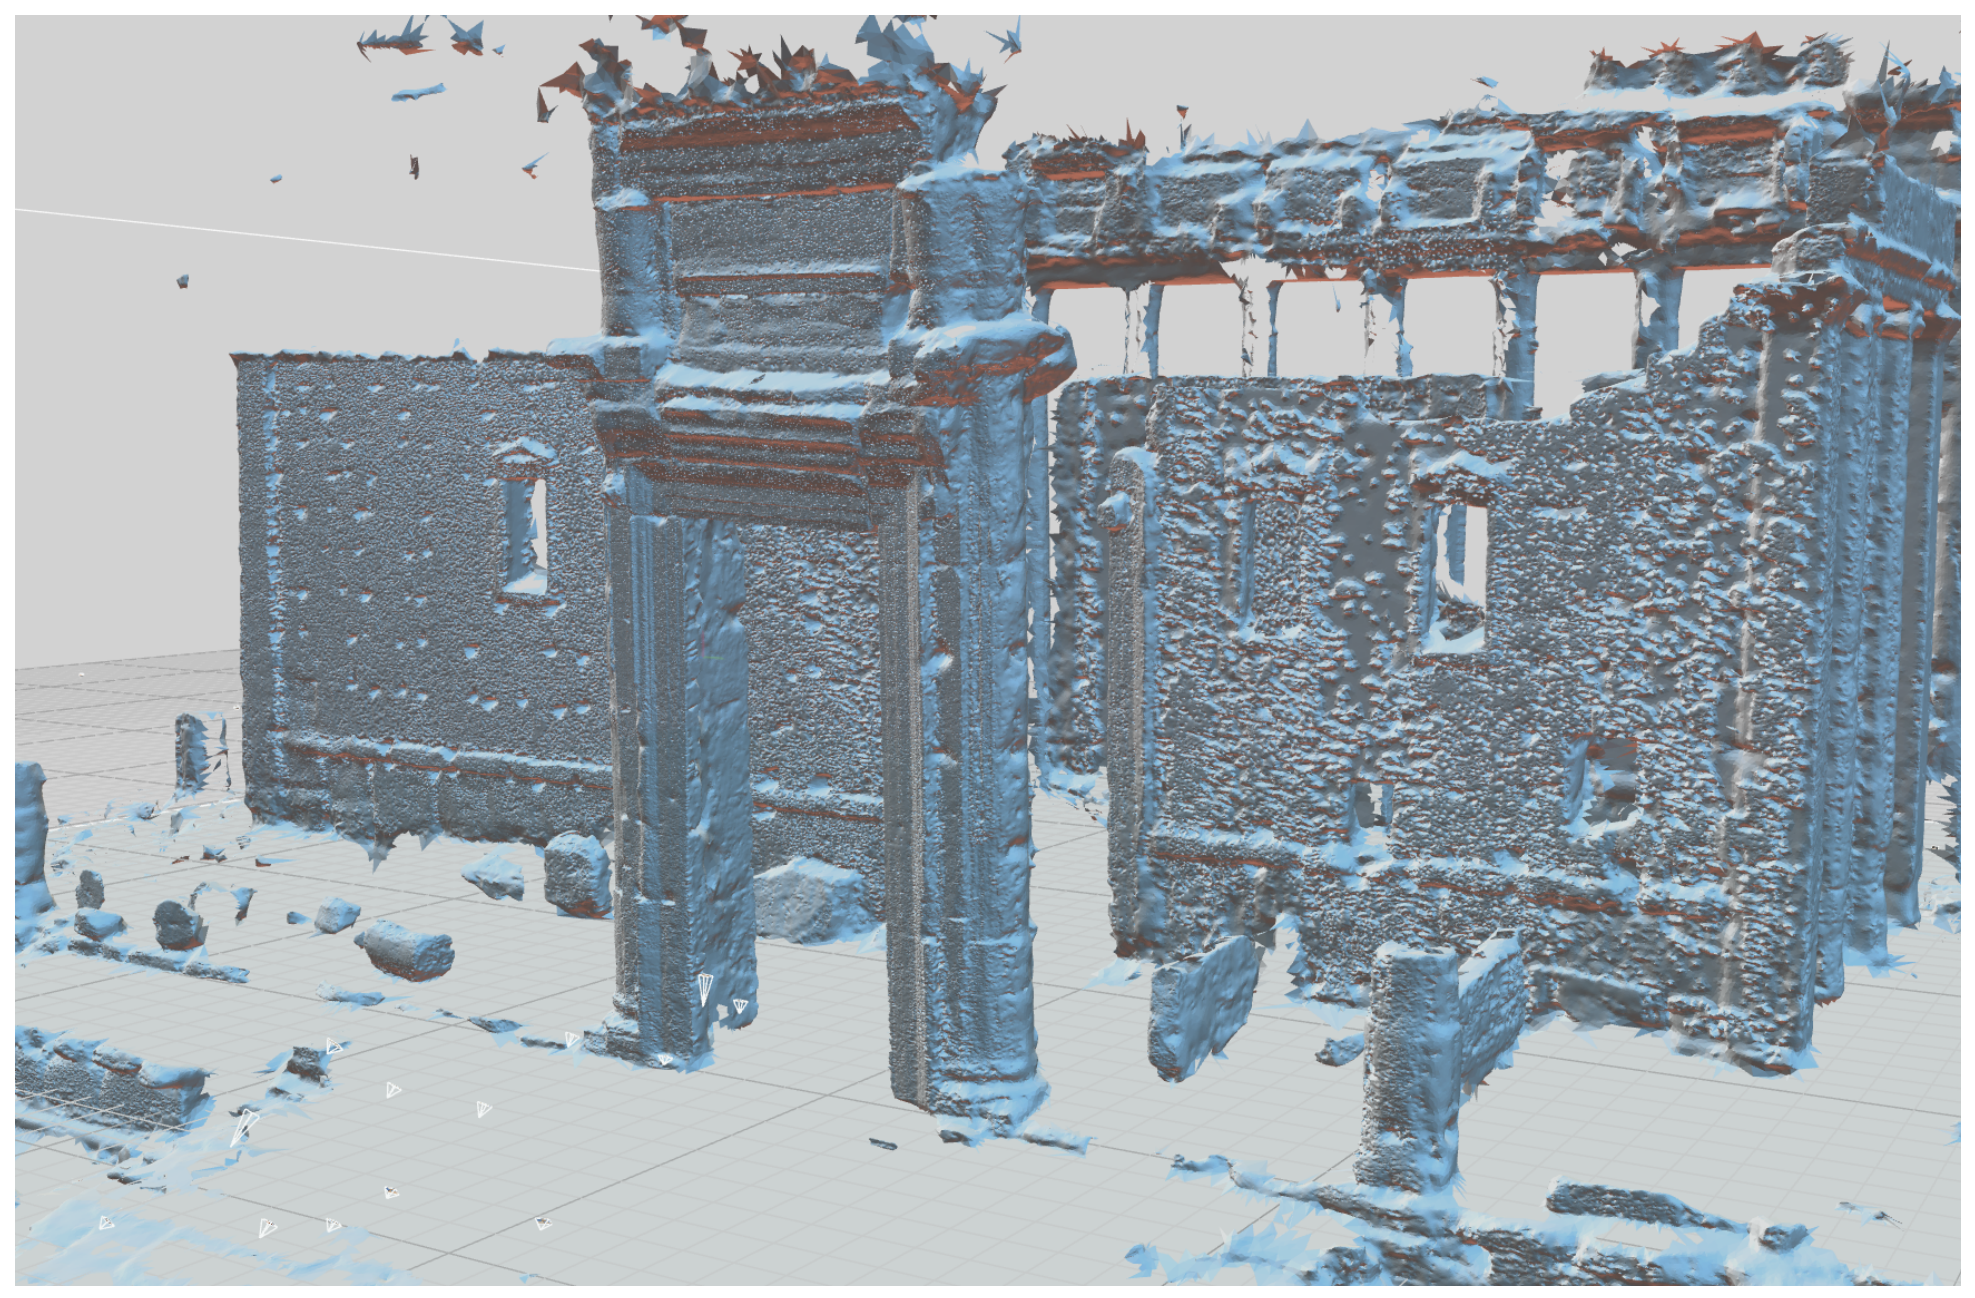
Fangi’s Multi-Image Spherical Photogrammetry (MISP) technique uses consumer-grade cameras on panoramic heads to capture 360-degree views, creating metric 3D models without expensive laser scanning equipment [15,16,17]. For architectural surveys at comparable distances, MISP typically achieves centimeter-level accuracy when well-configured [19]. Used in isolation, however, the dataset supports only a sparse and incomplete dense reconstruction: because the frames comprising each station share a common projection center, the network provides little of the angular baseline that multi-view stereo requires, and the resulting surface is correspondingly poorly constrained (Figure 4). The system, however, functions as a “virtual topographic survey”, providing geometric reference points that can anchor SfM outputs from other sources [4,23].
However, this dataset exhibits a critical geometric limitation: no transitional stations connect the interior and exterior networks. Standard photogrammetric practice requires overlapping coverage across the entire survey area; when interior and exterior stations share few common tie points, the two subnetworks effectively become independent blocks whose relative positioning depends entirely on distant features visible from both. This network discontinuity means relative scale between interior and exterior may diverge, and rotational errors cannot be detected through cross-ties.
Because we did not acquire this dataset, its constraints are inherited rather than chosen, and they warrant setting out with the same explicitness as those of the laser data. Four are consequential for the present work.
Acquisition purpose and station siting. The panoramas were captured during a documentation tour of Syrian heritage sites, not a survey designed for dense reconstruction of this temple [4,19]. Stations were sited for broad visual coverage, the correct choice for the interactive spherical photogrammetry the technique was built for, but this leaves the geometry outside our control and unimprovable after the fact. The absence of transitional stations noted above follows directly: none was needed at the threshold for the original purpose.
Baseline geometry. Wahbeh et al. [4] observe that the very wide baselines between neighboring panoramic stations, which produce the large ray intersection angles that make the network well conditioned for interactive point measurement, are correspondingly ill suited to automated structure-from-motion and dense image matching. This is the same limitation the present workflow encounters at S 2 (Section 3.4), and it is intrinsic to the acquisition design rather than a deficiency of any software applied to it.
Camera calibration state. The frames were captured with a Canon EOS 450D and a fixed 28 mm lens on a nodal-point adapter [4]. No calibration certificate or imagery accompanies the dataset, and the camera is long unavailable for characterization. The calibration used here is therefore recovered from the image network itself (Section 3.3.4): a self-calibration, not a verified instrument model. Its convergence to 1.5 pixel RMS reprojection, and the 0.05% agreement in focal length between the interior free and fixed solutions, suggest the recovered model is stable, but neither is independent validation.
Absence of control. Most consequentially, the survey carries no surveyed ground control. Wahbeh et al. [4] scaled from the published plan dimensions of the cella and were explicit that, lacking true absolute positions for the panorama centers, only relative co-registration was obtainable; their reported 2–3 cm relative against 10–15 cm absolute accuracy, and interior co-registration residuals averaging some 12 cm, follow from this. On its own the dataset can furnish a well-conditioned relative network and an approximate scale, but not an absolute frame. Supplying that frame is the role the Saito data plays here, and the reason the panoramas are registered to the laser rather than the reverse.

3.2.2. Terrestrial Laser Scanning

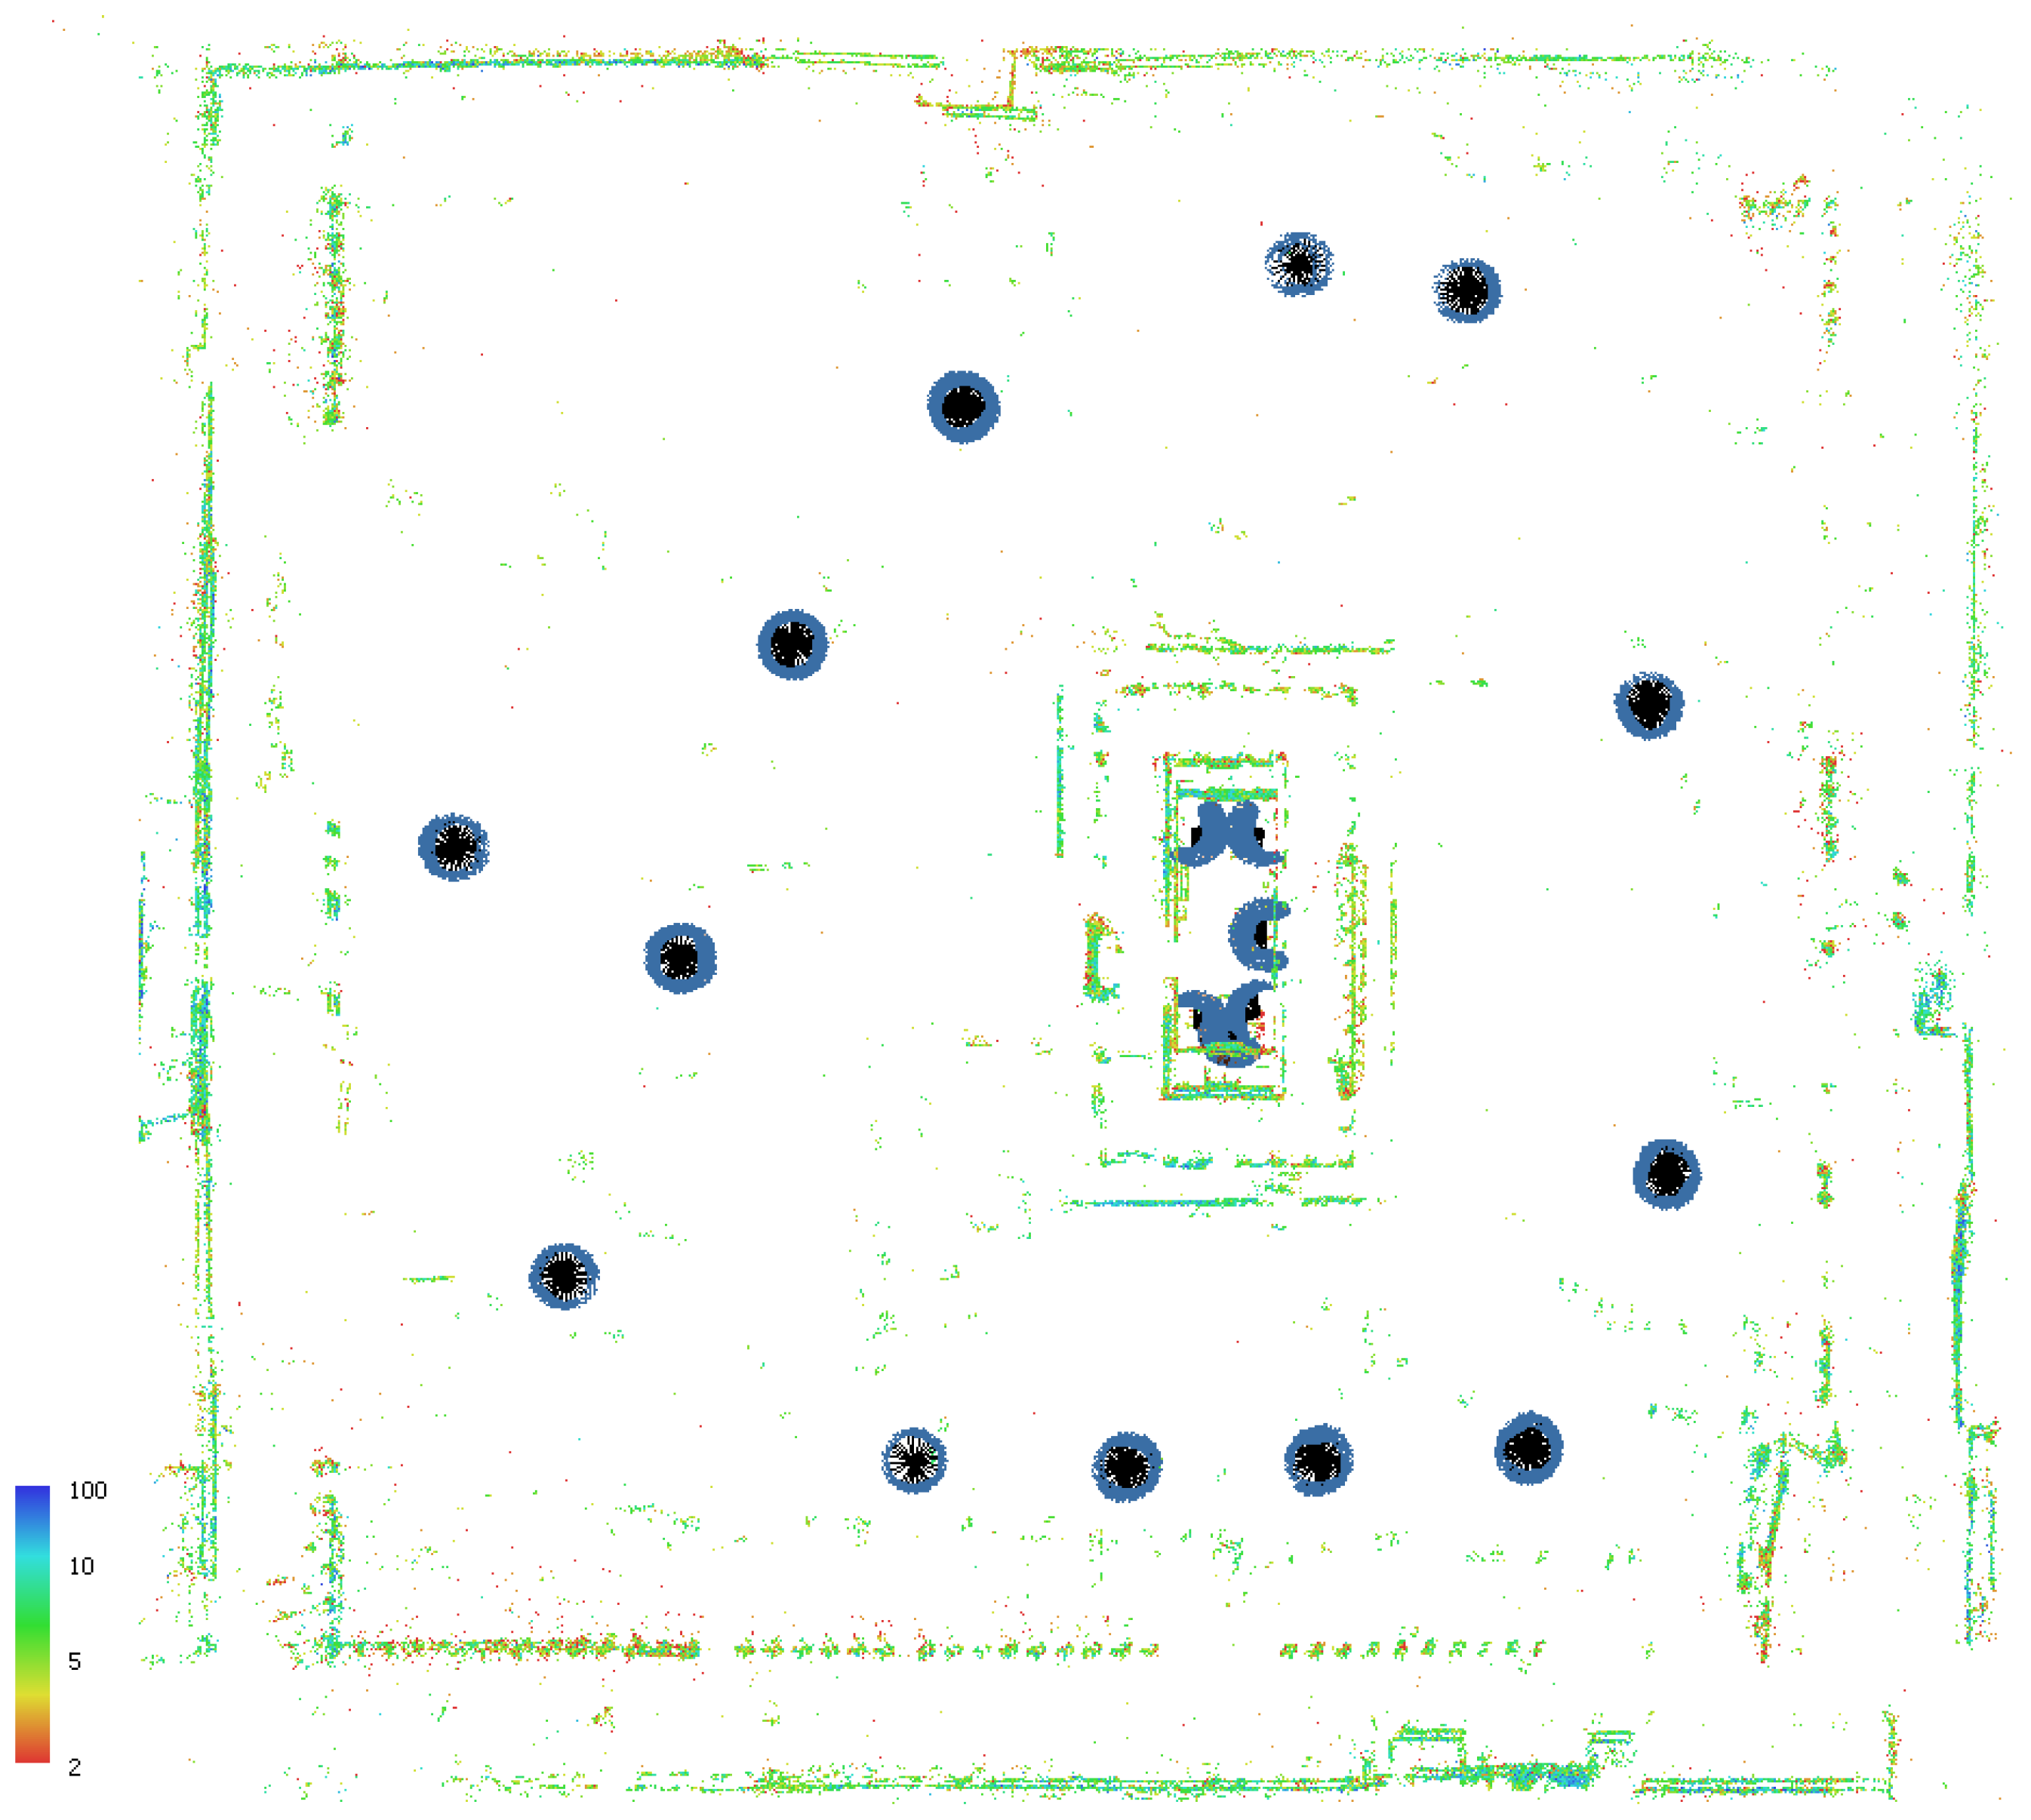
The TLS dataset (Figure 5a) was collected by Dr. Kiyohide Saito and the Nara-Palmyra Archaeological Mission in 2010 (Appendix B). The survey was commissioned by Dr. Michel al-Maqdissi and Dr. Adnan Bounni to document an excavation area behind the temple. As Saito and Sugiyama [32] explain: “In 2010 Dr. Michel al-Maqdissi asked me to draw and scan his and Dr. Adnan Bounni’s excavated area behind the main building of the Temple of BEL. So my team carried out drawings of a stratum of the digging area and made 3D scans of the area including the main building of the Temple of BEL.” For this reason, the majority of the scans are positioned on the southwest side of the temple, with their true targets (the excavation) cut away (Figure 5b). The temple was captured incidentally rather than as the primary survey objective, which explains both the value and limitations of the dataset. The 29 scans divide into two principal coverage regimes. Two scans (numbered 71 and 72 in the Saito series) document the temple interior at high angular resolution, scan 71 covering the cella broadly and scan 72 only the portico threshold (Section 3.5), producing local point spacing of approximately 1–15 mm (median ≈ 4–5 mm) on cella surfaces at scanner ranges of 1–30 m. The remaining 27 scans document the temple exterior and surrounding architectural elements at substantially lower angular resolution. This was a deliberate survey choice that prioritized coverage breadth over per-scan density, producing local point spacing of approximately 2.5–8 cm (median ≈ 3–6 cm) at scanner ranges of 30–60 m. The two regimes therefore differ in resolution by roughly an order of magnitude, and as developed in subsequent sections this asymmetry shapes the workflow at every downstream stage: the high-resolution interior scans serve as the metric authority for the cella, while the low-resolution exterior scans provide coarse-scale skeleton, absolute scale, and coordinate-frame anchoring for the photogrammetric reconstruction of the surrounding temple.
The original instrument files have been lost; this study works with derivative point clouds processed through Geomagic, comprising 29 individual scans exported as ASCII text files containing XYZ coordinates, intensity values, and per-point surface normals. The instrument model is therefore not documented. Judging from the phase-shift scanners in common survey use in 2010 and from the angular sampling of the delivered clouds, it was plausibly a FARO LS-series (±3 mm at 25 m) or Photon-series (±2 mm at 25 m), but this is an inference that we cannot verify and that no part of the following analysis depends upon: all accuracy figures reported here are derived from the delivered point clouds themselves and from the external comparisons of Section 3.6, not from a manufacturer specification. Critically, scan 72 was captured directly beneath the western portico, occupying the threshold between interior and exterior coverage. Geometrically it provides the only direct connection between the dense interior subnetwork and the sparser exterior subnetwork: without scan 72, the two regimes would be effectively unlinked and their relative scale and orientation would depend entirely on weak distant correspondences. This makes scan 72 the geometric anchor that ties the entire TLS network together. However, its position under the portico means it has limited line-of-sight to the surfaces captured by the surrounding Fangi panoramic stations, and panoramic frames that do see this region were captured from positions with poor overlap to scan 72’s coverage. As a result, scan 72 itself is not well-served by the panoramic colorization workflow described in Section 3.3.4 and depends on tourist photographs (Section 3.4) for surface color and fine geometric detail. The export to ASCII format discarded the scanner pose metadata. The precise XYZ position and orientation of the instrument at each station is required for downstream registration in environments that consume the E57 standard [33]. The recovery of these poses is the subject of Section 3.3.

3.2.3. Tourist Photographs

These photographs are not georeferenced in the conventional sense at any point in this workflow. In total, 20 of the 1580 images carry embedded coordinates, but their provenance is unknown and the metadata does not distinguish the possibilities: a camera GPS, a handheld track matched afterwards, or manual placement by the uploader on a web map years later. On inspection those coordinates proved grossly inconsistent with the structure, several placing the photographer outside the temenos or on the wrong side of the temple, at errors far beyond receiver noise. We therefore disabled all embedded coordinates rather than triage them and worked entirely in a local Cartesian frame. This is a deliberate choice: even accurate consumer geolocation, at tens of meters, sits two to three orders of magnitude coarser than the deviations reported here and could only have degraded a solution anchored to laser geometry.
Every photograph instead receives its pose by alignment against the TLS-anchored local frame of Section 3.3 and Section 3.3.4, through feature correspondence with already-registered imagery and scan geometry. Absolute positioning is inherited wholly from the Saito network, and any individual photograph’s placement accuracy is bounded by the hierarchical alignment of Section 3.4 rather than by the photograph itself. Exchangeable Image File Format (EXIF) metadata serves one narrower purpose: it stratifies the images into cohorts of decreasing intrinsic-parameter reliability, setting the order of admission.
A dataset of 1580 individual photographs was assembled from the #NewPalmyra Flickr collection, of which 900 were successfully aligned (Appendix C). The dataset spans 1974–2014, representing exceptional heterogeneity in camera technology and capture conditions. Metadata analysis revealed 1437 images (91%) met minimum “HD” resolution (1280 × 720); only 20 images contained geolocation data; 159 distinct camera models were represented; 357 images lacked stored camera profiles (“NC” = Not Calibrated); and 20 images lacked any intrinsic parameters in EXIF metadata. The 1280 × 720 figure is the 720p broadcast video format, reported here only as a familiar yardstick for a collection spanning four decades of consumer imaging. It is not a photogrammetric criterion, and no image was admitted or excluded on the basis of it. We say so explicitly because pixel count is a poor proxy for reconstruction utility: what governs an image’s geometric contribution is its ground sampling distance on the surface, which depends jointly on resolution, focal length, and standoff, so a low-resolution frame taken close to a relief may resolve it better than a high-resolution frame from across the temenos. Only two criteria were operative here: EXIF completeness, which sets the cohort and order of admission (Section 3.4), and successful alignment. This heterogeneity presents substantial challenges for accurate intrinsic parameter estimation, as consumer cameras frequently report only nominal focal length values that do not account for digital zoom, crop factors, or in-camera lens corrections.
The dataset also includes manually drawn masks, which occlude visitors, vegetation, sky, and gravel (all non-stationary objects). These were drawn by hand by the first author over the full collection and are distributed as part of the cited deposit [22], rather than obtained with the imagery; the panoramic frames were masked in the same way (Section 3.3.4). Masking was manual throughout because the occluders of concern here are visitors and wind-moved vegetation, which recur across four decades of imagery at every scale and lighting condition, and because a false negative admits a transient object into the reconstruction while a false positive merely discards observations of which there is no shortage.
Table 2 summarizes how the collection divides into the three cohorts that structure the alignment sequence and makes explicit the quality gradient the stratification is intended to capture. The cohorts are markedly unequal in size, the metadata-deficient tier amounting to only twenty images, and this asymmetry should be kept in view when reading the stage-to-stage results of Section 5: the geometric differences between S 3 , S 4 , and S 5 are not differences between comparable bodies of imagery.
Table 2. Composition of the crowdsourced collection by EXIF cohort. Membership sets the order of admission to the hierarchical alignment (stages S 3 S 5 , Section 3.4) and is the only role the metadata plays. The final two columns are the per-stage increments in registered cameras from Table 3, and are not counts of distinct photographs: the interior and exterior are independent component projects, so a photograph observing both is registered in each, and an image that failed to register in an earlier pass may register in a later one once the surrounding network has strengthened. This is why the S 5 increments exceed the 20 metadata-deficient images, and why the column totals (505) fall well short of the 900 distinct photographs aligned in the combined solution of Section 3.4, of which the two published components retain a subset.
Cohort (Stage)ImagesIntrinsics in EXIFProfile AvailableReg. at Stage (ext.)Reg. at Stage (int.)
Known profile ( S 3 )1203CompleteYes136180
Uncalibrated ( S 4 )357CompleteNo5394
Metadata-deficient ( S 5 )20AbsentNo1824
Total1,580207298
Table 3. Internal alignment and model statistics by stage, for the exterior and interior components. The “+” in a stage label denotes the data source added at that stage, cumulative on the stage above. Reprojection error is undefined for the colorized-TLS stage S 1 , whose registered images are RealityCapture virtual cameras generated from the imported E57 scans rather than photogrammetric inputs; the stage therefore carries no photographic tie points.
StageReg. ImagesTie PointsMedian Reproj. (px)Mean Reproj. (px)Vertices
Exterior
S 1 Colorized TLS7144,0031,651,636
S 2 +Panoramas8542,6990.500.621,965,947
S 3 +Photos (known)221139,2980.390.526,784,503
S 4 +Photos (uncalib.)274269,8200.090.318,792,120
S 5 +Photos (no EXIF)292287,9170.120.339,299,800
Interior
S 1 Colorized TLS1267,9989,109,288
S 2 +Panoramas47143,6590.170.2610,470,551
S 3 +Photos (known)227409,8870.340.4832,434,207
S 4 +Photos (uncalib.)321556,7640.360.4940,830,867
S 5 +Photos (no EXIF)345598,0490.380.5143,046,895
Two qualifications bear on coverage rather than camera quality and are captured by no metadata field. First, the imagery samples what visitors chose to photograph, not the temple. Wahbeh et al. [4] characterize this bias at the same site: tourist photographs concentrate on parts carrying visible historical signal, visible from the standard route, furnishing a first impression, photogenic, and unrestricted. The consequence is systematic rather than random, since architecturally significant but visually unremarkable surfaces go undocumented however many images accumulate, which is why the gaps in Section 5.4 fall where they do. Second, across four decades the temple weathered and was variously excavated around and re-presented, so the images do not all document the same object; masking removes transient elements but not this slower inconsistency.
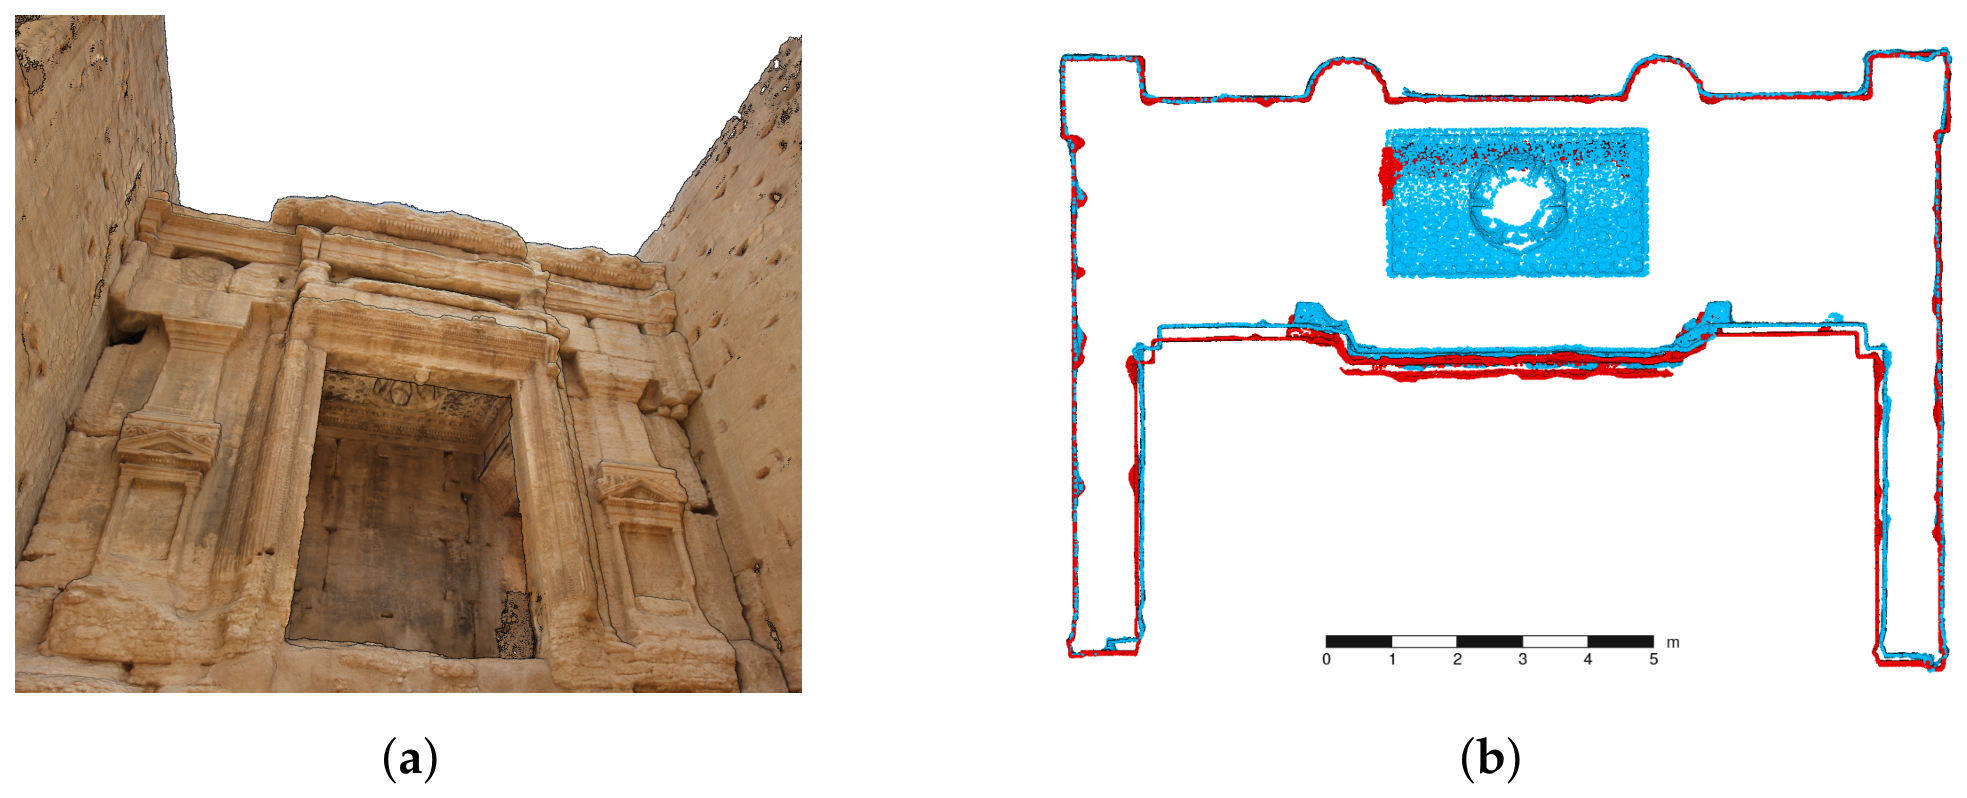
Reconstructed alone, this imagery yields a visually convincing but metrically unreliable surface. Figure 6 shows the tourist-photo-only reconstruction of the northern cella released by McAvoy [22], with a horizontal section placing it against the Saito data: the surface is internally coherent yet stands roughly 20 cm proud of the laser geometry. This offset is the specific failure that motivates anchoring the crowdsourced imagery to an external reference and is revisited quantitatively in Section 6.2.

3.3. TLS Scan Pose Recovery and Registration

Scanner pose recovery for legacy point clouds is an underexplored problem. Most registration literature assumes either that pose metadata is preserved through file format conversion, or that pose is unknown but multiple overlapping scans permit pairwise alignment via Iterative Closest Point (ICP) and its variants [34,35]. Neither assumption holds for the Saito dataset: pose metadata was lost in the Geomagic export, and inter-scan overlap is insufficient between several interior and exterior stations for automated cloud-to-cloud methods to converge reliably [36]. We therefore developed a three-stage workflow (Figure 7) combining manual seeding, visibility-based geometric refinement, and manual point-pair registration in Leica Register360. The refinement stage is implemented in the open-source e57repose package (Appendix D).

3.3.1. Manual Seed Estimation

An initial estimate of each scanner position was obtained by visual inspection of the point cloud in the Potree point cloud viewer [37]. Terrestrial laser scans of architectural interiors generally exhibit a characteristic circular occlusion shadow directly beneath the scanner, produced by the instrument body and tripod blocking returns along near-nadir lines of sight. The center of this shadow, projected onto the floor plane and offset vertically by a plausible instrument height (∼1.5 m), provides a position estimate accurate to within a few meters but rarely better. In the legacy point clouds available for this study, however, many of these occlusion shadows had been removed during the earlier cleaning and export process, so the seed estimate could not be recovered visually for every station. An earlier attempt to estimate positions from the per-point surface normals (by intersecting normal vectors from multiple points and locating the densest cluster of near-intersections) produced estimates within approximately 2 m of correct positions but proved insufficient for downstream registration.

3.3.2. Visibility-Based Pose Refinement

To refine the manual seed positions, we formulate scanner pose recovery as a maximization of point cloud visibility from a candidate position. The underlying observation is that a real scanner can only return points along unobstructed lines of sight from its physical location; consequently, the position that maximizes the fraction of unoccluded rays to observed points, with the most uniform angular distribution, is the position from which the scan was most plausibly taken. This is conceptually the inverse of the classical next-best-view problem in robotics [34], where the goal is to choose where to scan next rather than to recover where a scan was taken.
For a candidate position p R 3 and point cloud Q , we maximize a composite visibility score
S ( p ) = w occ S occ ( p ) + w ang S ang ( p ) · Φ z ( p ) ,
combining an occlusion term S occ , an angular-coverage term S ang , and a soft height prior Φ z (weights w occ = 0.6 and w ang = 0.4 , insensitive within ± 0.1 ). The occlusion term is the fraction of a stratified random subsample ( N 2000 target points) reachable from p along unobstructed sightlines, tested against a 0.2  m voxel occupancy grid with the three-dimensional digital differential analyzer of Amanatides and Woo [38], which advances one voxel face at a time so that no occupied voxel along a ray is missed. The angular term rewards uniform coverage rather than proximity (distance is deliberately omitted, since under line-of-sight a far point is no less visible than a near one) and is the normalized Shannon entropy [39] of the directions to visible points binned into a 16 × 8 azimuth–elevation histogram, equal to one for perfectly uniform spherical coverage and penalizing positions that see points only within a narrow sector. The height prior Φ z is a soft Gaussian penalty (unit plateau over 0.8 2.0  m above the floor, σ = 0.4  m) that suppresses the optimizer’s tendency to drift upward to positions appearing to see floor and ceiling at once; the floor elevation is taken as the modal peak of a 0.05  m Z-histogram of the lowest 30% of the cloud, a datum-independent estimator robust to arbitrary coordinate origins.
Because the voxel occupancy function is piecewise constant, the objective is non-smooth and gradient-free; the refined position p * is obtained by maximizing Equation (1) from the manual seed p 0 with the Nelder–Mead downhill simplex [40] (tetrahedral simplex of side r / 4 for search radius r = 25  m; tolerances 0.05  m on position and 10 4 on the objective), typically converging in 150–300 iterations in under a minute per scan.
Implementation and reproducibility. The full implementation, including support for reading and writing E57 [33], LAS/LAZ [41], and plain ASCII point cloud formats, is released as the open-source Python 3.1 package e57repose (Appendix D). The package provides three command-line tools: e57repose-opt for refining a single scan, e57repose-batch for processing entire directories of E57 files in parallel, and e57repose for direct manual pose insertion when an externally determined position is already known. For each refined scan, a new E57 file is written in which the source points are re-expressed in the scanner-local frame corresponding to the refined translation p * , with the rotation component stored as the identity quaternion in the absence of recoverable orientation information.

3.3.3. Scan-to-Scan Registration

Following pose refinement, the 29 scans were imported into Leica Register360 for final inter-scan alignment. We used point-pair picking with manually identified architectural correspondences rather than automated cloud-to-cloud ICP [34], which had previously failed on the limited-overlap interior-to-exterior connections. Manual point-pair correspondence methods typically achieve 1–2 mm accuracy between scan pairs, compared with 2–5 mm for cloud-to-cloud registration on heritage-scale datasets [35]. Kedzierski et al. [42] directly compared these approaches for TLS data from a historic synagogue, providing precedent for this choice in heritage contexts.
The Register360 bundle adjustment converged to a 6 mm network root-mean-square (RMS) bundle error across 28 inter-scan links, with per-link absolute mean errors ranging from 2 mm to 10 mm. The two interior scans (71 and 72) link to one another and to the nearest exterior scans at sub-3 mm residuals, reflecting the dense overlap and rich feature content of the high-resolution interior coverage. Exterior-to-exterior links range from 4 to 10 mm, comfortably finer than the local exterior point spacing of 2.5–8 cm, indicating a well-conditioned global solution despite the coarse sensor resolution. Register360 reported a network strength of 37%, reflecting the largely linear topology of the 2010 survey’s scan placement: scans were captured to follow the excavation area and the temple’s principal axes rather than to provide maximally redundant cross-network coverage. A single loop-closure link (between scans 56 and 79) bounds drift across the temple’s larger circumference. Despite the moderate network strength, the achieved bundle error confirms that the chosen scan pairs provide sufficient overlap and feature richness to register cleanly within the resolution envelope of the underlying data. This 6 mm figure is an internal measure of the network’s mutual consistency, not a statement of absolute accuracy: a low bundle residual shows that the scans agree with one another, not that they reproduce the true dimensions of the temple. The dataset carries no surveyed control, so no absolute accuracy is claimed. What the residual does license is the network’s use as an internally consistent reference frame, which is exactly its role here: every accuracy figure in Section 5 is a deviation relative to this laser network, not an absolute error.

3.3.4. Panorama-to-TLS Alignment and Color Transfer

Following inter-scan registration, the panoramic frames were brought into the TLS reference frame through a two-stage workflow in Agisoft Metashape. The first stage aligned the panoramic frames to one another using the standard structure-from-motion pipeline with no TLS input, establishing the Canon EOS 450D intrinsic calibration from the image network alone. The second stage imported that calibration as a fixed precalibration into a separate chunk containing both the TLS scans and the same panoramic frames, then solved only the per-camera extrinsics against manually picked TLS markers. This two-stage approach extends the hierarchical alignment principle developed in Section 3.4 to the calibration parameters themselves: the higher-confidence image network is allowed to determine the camera model, and the lower-confidence TLS markers are then prevented from perturbing that calibration during the pose solve. The motivation for this separation is sharper on the exterior than on the interior, as quantified in the alignment results reported below; nonetheless we applied it uniformly across both regimes for methodological consistency.
Stage 1: pano-only image network alignment. The 550 masked panoramic frames were partitioned by capture orientation into two calibration groups, corresponding to the exterior and interior components: 423 landscape frames at 2256 × 1504 and 127 portrait frames at 1504 × 2256 . Of these, 394 landscape and all 127 portrait frames were enabled, and 394 and 123 respectively registered. The frames captured from each tripod setup were additionally grouped into a single camera station in Metashape, constraining all images from that position to share a common projection center about which the panoramic head rotates, in keeping with the physical acquisition geometry. The two groups were then aligned with default tie-point parameters (key point limit 40,000; tie point limit 5000; Highest accuracy). The exterior network of 427 frames converged to a 1.5 pixel RMS reprojection error on 243,189 tie points and 972,963 projections, with 425 of 427 frames successfully aligned; the calibrated focal length was f = 2925.84 ± 0.034  pixels, principal point offset ( c x , c y ) = ( 10.80 , 10.52 )  pixels, and radial distortion coefficients ( k 1 , k 2 , k 3 ) = ( 0.0867 , 0.1428 , 0.8543 ) . The interior network of 123 frames converged to comparable reprojection quality with f = 2943.60 ± 0.12  pixels and a distinctly different distortion profile, reflecting either slightly different focus conditions during the interior captures or sampling along the strongly-correlated distortion-coefficient manifold characteristic of close-range bundle adjustments. These two calibrations established the camera models that the subsequent TLS-constrained stage would treat as fixed.
Stage 2: TLS-constrained pose-only solve. A second Metashape chunk was created containing the registered TLS scans together with the same panoramic frames. The pano-only calibrations from Stage 1 were imported and assigned to the corresponding calibration groups via the Tools → Camera Calibration dialog, with the Adjust flag disabled on both groups. Manually picked markers were then placed on geometrically distinctive features visible in both the TLS and the panoramic imagery, as detailed in the next paragraphs. The Metashape Optimize Cameras operation was invoked with all intrinsic parameter checkboxes (f, cx, cy, k1k3, p1, p2) unchecked, restricting the bundle adjustment to solve only for the per-camera extrinsics against the marker constraints. Because the Saito scans carry only XYZ and intensity values with no color channel, and the panoramas carry only color information with no native geometry, automatic feature matching between the two modalities is not feasible [43]; the geometric correspondence between panoramic stations and the scan reference frame must be established by manually picked control points. The two TLS resolution regimes documented in Section 3.2.2 (high-resolution interior at 3–20 mm point spacing on scans 71 and 72, low-resolution exterior at 2.5–8 cm spacing on the remaining 27 scans) required separate alignment treatments with different marker accuracy budgets and different downstream geometric roles.
Marker placement and validation. Each station received 10–15 markers (floor of 6), spanning all populated octants of the visible hemisphere and paired across distinct ranges and across the upper and lower halves of the scan, so that depth, scale, and tilt were constrained together; each station shared at least 6 markers with its neighbors. Picks were restricted to features co-located within roughly 1 cm (interior) and 1 dm (exterior) in both modalities. Per-marker accuracies were the quadrature sum of local point spacing, registration residual, and pick uncertainty, giving 20 mm (interior) and 80 mm (exterior); the manufacturer’s nominal accuracy was deliberately not used, as it would have over-constrained the adjustment. Validation used post-adjustment RMS and maximum residual, marker reprojection error, and reduced χ 2 near unity, with markers exceeding 3× their entered accuracy re-picked or removed. On the interior, 17 markers were placed and 12 retained. On the exterior all 15 were retained, having been re-picked rather than discarded where their residuals were unacceptable. These criteria were arrived at iteratively; the full derivation, accuracy budget, and validation procedure are given in Supplementary Text S1.
Sensor hierarchy and the inversion on the exterior. A consequence of the order-of-magnitude resolution difference between the interior and exterior TLS is that the conventional sensor hierarchy (TLS as the geometric authority, photogrammetry as texture supplementation) holds for the interior but inverts for the exterior. The Fangi panoramic photogrammetry, captured by a Canon EOS 450D with a 28 mm lens at ground resolutions of approximately 3 mm/pixel, can resolve exterior geometry at a 1–5 cm scale through dense-image-matching reconstruction [19]; the pano-only image network in Stage 1 above achieved 1.5 pixel RMS reprojection on the exterior dataset, providing empirical confirmation that the photogrammetric solution is well-conditioned independent of any TLS constraint. The exterior TLS at 2.5–8 cm point spacing is therefore the coarser sensor on the exterior of the temple. The panoramic photogrammetry contributes fine-scale exterior geometry; the TLS contributes absolute scale, coordinate-frame anchoring, and coarse-scale ground truth that bounds drift in the photogrammetric solution. The reported Stage 2 alignment residual on the exterior accordingly reflects the resolution limit of the TLS’s contribution to the constraint, not a limit on the geometric fidelity of the final exterior reconstruction, as the panorama stage S 2 comparison against the laser confirms (Section 3.6, Table 4). The interior reconstruction follows the conventional hierarchy: dense interior TLS at 3–20 mm spacing is the metric reference, with photogrammetric layers contributing texture and detail at scales the laser cannot resolve.
Interior alignment result. After outlier removal, 12 markers were retained for the interior alignment, with each panoramic station observing at least 6 markers. With the pano-only calibration imported and held fixed, per-marker total residuals ranged from 0.61 to 5.77 cm, yielding a total RMSE of 3.6 cm and an RMS reprojection error of 1.97 pixels (maximum per-marker reprojection 2.7 pixels). For comparison, a parallel run with the intrinsics left free to refine under the marker constraint produced essentially identical results (per-marker range 0.76 to 5.42 cm, total RMSE 3.4 cm, RMS reprojection 1.97 pixels): the bundle adjustment converged to a calibration of f = 2942.10  pixels, in agreement with the Stage 1 pano-only result of f = 2943.60  pixels to 0.05%. The negligible difference between the fixed-calibration and free-calibration interior solutions confirms that on the interior, where the TLS and panoramic photogrammetry sample the surface at comparable, sub-centimeter point spacing, the two modalities agree closely enough that the bundle adjustment has no incentive to distort the calibration to satisfy marker constraints. The 3.6 cm figure should not be confused with that source-data resolution: it is the accuracy of the cross-modal alignment, dominated by the uncertainty of manually picking corresponding features between a colorless point cloud and a photograph, and it is roughly an order of magnitude coarser than the point spacing of either input. Wherever this manuscript describes the interior TLS as sub-centimeter, the claim concerns the sampling density and range precision of the source scans alone and not the accuracy of any alignment, colorization, or reconstruction derived from them. The full per-marker breakdown for the interior alignment is provided in the archived alignment report (Appendix E).
Exterior alignment result. The exterior alignment behaved very differently, and the figures it produced need careful framing before they are read. With the pano-only calibration imported and held fixed, and only per-camera extrinsics solved, the exterior solution carries a total RMSE of 32.3 cm across all 15 markers. Two of those markers, points 5 and 9, were subsequently demoted to check points, so that they are measured by the solution without constraining it; the resulting control-point RMSE over the remaining 13 is 15.8 cm, against 78.7 cm on the two withheld. Marker reprojection is 5.4 pixels, roughly three and a half times the pano-only network’s 1.5 pixels and well above the interior alignment’s 1.97, because the imported calibration is held at its image-network optimum rather than distorted to fit the markers.
These residuals should not be read as a global accuracy figure, and they matter less than their magnitude suggests. A marker RMSE is a fit statistic over control that was deliberately chosen, and ours was placed on the temple surfaces the reconstruction exists to represent. Each panoramic station observes features across a very wide depth range, both toward the structure and away across the temenos, so a holistic station-to-station alignment would spread its residual over that entire scene, with far-field geometry of no interest included. Constraining on the features we care about concentrates accuracy where it is wanted and lets residual accumulate elsewhere, so the 32.3 cm figure describes fit to the controlled features rather than agreement between the two networks everywhere. The 78.7 cm check figure is narrower still, recording how poorly conditioned those two particular picks were rather than any independent estimate of accuracy.
The marker geometry also bears directly on why the calibration was fixed. The 15 exterior markers span roughly 30 by 39 m, some 3% of the 205 m precinct footprint, while the cameras observing them ring the entire precinct at a 30–60 m standoff. Control clustered into a small central patch and viewed by cameras distributed far outside it is a weak configuration for determining intrinsics, with focal length trading against depth with little in the network to separate them. The case for removing that degree of freedom is therefore geometric and holds a priori, independent of the size of any measured improvement.
Asymmetric effect of the calibration-fixing intervention. The interior and exterior alignments responded to the calibration-fixing procedure very differently. Interior residuals were essentially unchanged (3.4 cm free → 3.6 cm fixed); on the exterior we hold no matched free-intrinsic solve against which to quantify the change and make no numerical claim for it. This asymmetry has a principled explanation: when the TLS and panoramic photogrammetry are of comparable precision (the interior case, with both sampling the surface at sub-centimeter spacing), the marker constraints are internally consistent with the image-network solution, and the bundle adjustment finds the same minimum whether the calibration is free or fixed. When the two modalities differ in precision by an order of magnitude (the exterior case, with TLS at decimeter scale and photogrammetry at centimeter scale), the marker constraints are internally inconsistent with the image-network solution at the level of the photogrammetric residual, and a free-intrinsic bundle adjustment will distort the calibration along its strongly-correlated coefficient axes to absorb that inconsistency. Fixing the calibration at the higher-confidence (image-network) value forces the residual to manifest where it belongs, on the TLS-side picks, producing interpretable alignment statistics that reflect each modality’s actual contribution. This is the hierarchical-alignment principle of Section 3.4 extended to the calibration parameters themselves.
Only the interior was solved twice under matched conditions, and there the calibration treatment proves immaterial: the free and fixed solves agree to 0.05% in focal length and to 0.2 cm in total RMSE. That is the outcome the hierarchical argument predicts where the two sources are of comparable resolution, and it is on the exterior, where they are not, that we rely on the geometric reasoning above rather than on a measured contrast. Full per-marker statistics for both components are given in the archived alignment reports (Appendix E).
Scan 72 and the interior-to-exterior tie. Scan 72, captured directly beneath the western portico, occupies a particularly awkward position for the panoramic colorization workflow. As described in Section 3.2.2, scan 72 is the only TLS station that geometrically bridges the interior and exterior coverage regimes, and its presence is essential for resolving relative scale and orientation between the two subnetworks during inter-scan registration. However, its position under the portico means that none of the surrounding Fangi panoramic stations achieve good overlap with its visible surfaces: the panoramic stations were placed for documenting the cella interior or the exterior elevations, not for documenting the threshold region between them. Scan 72 therefore receives no panoramic color projection in the workflow described above, and its surface representation in the final reconstruction depends on tourist photographs captured under the portico (Section 3.4; stages S 3 S 5 ) to supply color and fine geometric detail. This edge case is acknowledged here as a known limitation of the panoramic colorization step rather than as a failure of the alignment methodology; the tie that scan 72 provides between interior and exterior TLS coverage is geometrically intact and is what enables the joint photogrammetric reconstruction in subsequent stages.
Once the panoramic cameras were anchored to the TLS reference frame, color values were projected in Metashape from the aligned panoramas onto the scan points to produce a colorized point cloud, which together with the pano frames then entered the hierarchical alignment workflow described in Section 3.4.

3.4. Hierarchical Multi-Source Alignment

The integration of heterogeneous datasets presents a fundamental challenge: how to combine observations of varying geometric reliability without allowing lower-quality data to degrade higher-quality reference geometry.
SfM algorithms can be categorized as incremental, global, or hierarchical [44]. Incremental SfM builds reconstructions progressively, adding images sequentially with bundle adjustment after each addition [45]. While computationally expensive, incremental methods are more robust than global methods, which solve all camera poses simultaneously but are more susceptible to outliers [46,47]. A critical limitation is that all images participate equally in bundle adjustment, with no mechanism to privilege geometrically superior observations.
RealityCapture’s iterative alignment workflow addresses this limitation by allowing sequential alignment passes where previously registered geometry remains fixed while new images are localized against it. This implements hierarchical registration analogous to approaches in point cloud registration literature, where “optimizations are performed hierarchically on the edges, the loops, and the entire graph” [48]. By anchoring each successive layer to established geometry, lower-confidence observations cannot perturb higher-confidence reference data.

3.4.1. Alignment Sequence

The alignment proceeded in order of decreasing expected geometric accuracy, building the cumulative stages S 1 S 5 that the Section 5 evaluates (the raw, unmeshed TLS is the reference S 0 ):
S 1 : TLS point clouds. The 29 registered Saito scans, colorized in Metashape from the manually aligned Fangi panoramas and exported as E57 files, were imported first. RealityCapture converts laser scans to cube map projections, creating synthetic “images” whose reference geometry carries the sub-centimeter point spacing of the interior scans; the panoramic colorization gives these synthetic images the visual content required for downstream feature matching against the photographic layers. This virtual-camera representation is in fact the principal reason the scanner poses were recovered (Section 3.3): RealityCapture can synthesize these cube maps only from a scan with a known origin, and photogrammetric pipelines generally support TLS supplied as sensor-located range images far better than as an unstructured point cloud. Recovering an explicit position for each Saito scan, beyond what the point-pair registration in Register360 requires, is therefore what unlocks this virtual-camera path and buys all-around compatibility with the photogrammetric tools the reconstruction depends on.
S 2 : panoramic images. A subset of the Fangi panoramic frames (every third frame) was aligned next, establishing geometric correspondence between the photogrammetric and laser-scanning coordinate frames. The full 550-frame set was not re-aligned in RealityCapture: unlike Metashape, which represents a panoramic setup as a camera station sharing one projection center, RealityCapture treats the frames as independent cameras, so the dense, nearly co-located overlap of the complete panoramic network degrades rather than improves the reconstruction. A subsampled set was therefore used to retain coverage while limiting that redundancy.
S 3 : tourist photographs with known camera profiles. Images with complete EXIF metadata were aligned, with intrinsic parameters initialized from manufacturer specifications.
S 4 : tourist photographs with uncalibrated cameras. Images from cameras not in the software database required full self-calibration during bundle adjustment.
S 5 : tourist photographs without metadata. Twenty images lacking camera metadata entirely required full intrinsic parameter estimation.

3.4.2. Advantages

This approach offers several advantages over single-pass alignment. By locking previously aligned components, high-accuracy TLS geometry is not perturbed by lower-accuracy photogrammetric observations, which is particularly important with heterogeneous crowdsourced imagery [49,50]. Alignment can be verified at each stage before proceeding. Anchoring to TLS bounds drift by the accuracy of reference scans rather than accumulating unboundedly [51].
The same hierarchical strategy can in principle be implemented entirely within Agisoft Metashape, avoiding the cross-software handoff used here. Appendix G describes how Metashape’s documented incremental-alignment and marker-constrained mechanisms can be combined to reproduce the alignment topology, with the caveat that the per-cohort freezing must be enforced and verified explicitly; we selected the RealityCapture path for its operational directness and clearer audit trail rather than for any difference in achievable result.

3.5. Adaptive Reconstruction Strategy for Heterogeneous Depth Sources

A significant challenge in multi-sensor photogrammetric reconstruction lies in the fusion of depth sources with disparate resolutions. When combining terrestrial laser scanning data with image-derived depth maps, the resolution differential can span orders of magnitude: a typical TLS scan may achieve sub-centimeter point spacing at close range, while photogrammetric depth maps derived from tourist photographs may resolve features only at centimeter-to-decimeter scales.

3.5.1. Observed Behavior

During preliminary reconstruction attempts in Agisoft Metashape, we observed unexpected artifacts in regions where multiple overlapping TLS scans covered the temple exterior. Paradoxically, reconstruction quality in these densely scanned regions appeared degraded compared to areas with single-scan coverage, the opposite of what one would expect if more data invariably produces better results.
The scope of this observation should be stated plainly. It reports how two packages behaved, at the parameter settings we applied, on this dataset and its particular scan configuration. It is not a claim about the merit of the underlying algorithms, which we cannot evaluate: the fusion mechanisms of both packages are proprietary and inaccessible to us, and we ran no controlled experiment capable of isolating an algorithmic cause. A different scan geometry, overlap regime, or parameter choice could produce a different outcome.
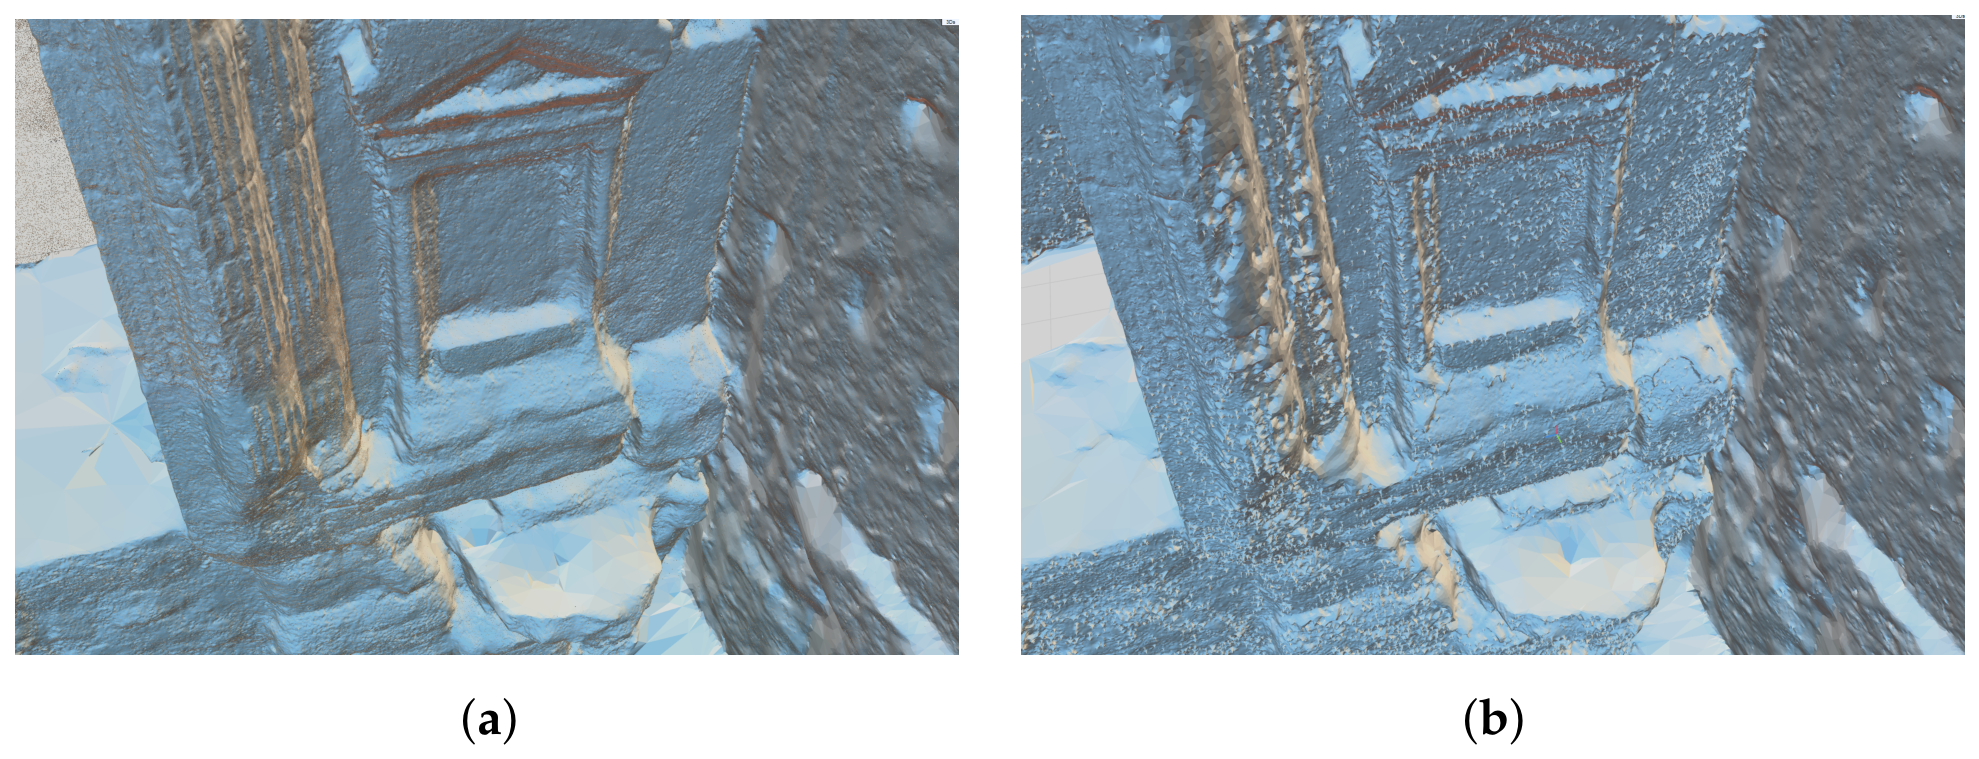
With that scope understood, one mechanism is worth noting as a candidate rather than a conclusion. Metashape converts imported laser scans to depth maps attached to synthetic camera positions, after which they enter the same fusion pipeline as image-derived depth [25]; TV- and TGV-family regularizers penalize surface variation, so where several overlapping high-resolution scans disagree slightly through registration residual or sensor noise, a smoother low-resolution photogrammetric estimate may attract weight that its accuracy does not warrant. We record this as a possible reading of the artifact and pursue it no further, since confirming it would require access to implementations we do not have.
The more useful question is constructive: what about the RealityCapture configuration worked here? Firstly, the exterior used a scan-selection grouping partitioning TLS contributions by proximity and surface coverage (Section 3.5), so disagreements between adjacent stations resolve within a group rather than propagating into a single global integration. Second, the per-image depth-map and meshing controls are user-exposed, so the fusion regime could be tuned deliberately and inspected rather than inferred. We regard this transparency, not demonstrated algorithmic superiority, as the substantive advantage, and it is why we adopted RealityCapture for both components, including the interior, where Metashape would have been equally viable. The wider point is that heterogeneous-resolution fusion currently rewards empirical workflow construction over confidence in any package’s defaults.

3.5.2. Split Reconstruction Strategy

Recognition of the depth-fusion behavior described above motivated two related workflow decisions. First, we elected to perform all dense reconstruction in RealityCapture rather than transferring the aligned cameras into Agisoft Metashape, removing the cross-software handoff and the depth-fusion regime mismatch in a single decision. Second, we organized the reconstruction as multiple independent component projects within RealityCapture rather than as a single monolithic model, so that reconstruction parameters could be matched to each component’s scale and sensor configuration and so that each component could be published as an independently citable archival record. The split was made at the level of which input subset participates in each component reconstruction, which parameter settings are applied, and which model corresponds to a citable scholarly output.
Interior reconstruction. The temple interior was captured by two TLS stations: one interior scan documenting the cella (scan 71) and one transitional scan beneath the western portico (scan 72) that sees only the slice of the interior visible from the threshold. Because scan 71 covers essentially the entire cella and scan 72 overlaps it only across that narrow portico slice, the interior is effectively single-source over almost all of its extent, so the inter-scan depth disagreements that degraded the multi-scan exterior do not arise here, and RealityCapture’s depth-fusion pipeline integrates the TLS depth constraint cleanly with image-derived estimates, combining the geometric authority of laser scanning with the texture detail of photography. We retained RealityCapture as the interior reconstruction environment despite Metashape having been equally capable on geometric grounds in this near-single-scan regime, in order to preserve a single coherent project state across both component reconstructions and avoid the cross-software camera-pose transfer step that would otherwise have been required.
Exterior reconstruction. The temple exterior was captured by numerous overlapping TLS scans. RealityCapture’s reconstruction pipeline produced cleaner geometry in this dense multi-scan regime than initial Metashape trials had achieved. The exterior input set retained the aligned panoramic and tourist imagery to provide texture continuity across the larger surface extent, with scan selection and reconstruction parameters tuned to the multi-scan configuration to balance TLS detail against photogrammetric texture.
Reconstruction parameters. Within RealityCapture, dense reconstruction parameters were tuned to each component’s scale and sensor configuration. The interior project used the default detail of the source TLS scan together with image-derived depth maps; reconstruction was carried out at the model’s native resolution without downsampling. The exterior project used a scan selection that grouped TLS contributions by proximity and surface coverage so that disagreements between adjacent stations did not propagate into the surface integration, while retaining the aligned panoramic and tourist imagery for texture. The aligned camera poses and intrinsics from the hierarchical alignment phase were retained without re-optimization in each component project, preserving the TLS-anchored coordinate frame across both reconstruction tiers.

3.6. Component Outputs and Comparative Geometric Analysis

The hierarchical alignment of Section 3.4 was reconstructed and evaluated as a sequence of five cumulative stages, each adding one input cohort to the TLS-anchored coordinate frame and warm-started from the stage below it: S 1 , the colorized TLS reconstructed as a single merged surface mesh (laser geometry carrying panorama-projected color, with no photogrammetric input); S 2 , the addition of the subsampled Fangi panoramic frames; S 3 , the addition of tourist photographs with known camera profiles; S 4 , the further addition of uncalibrated tourist photographs; and S 5 , the inclusion of the metadata-deficient cohort. The raw, unmerged Saito point cloud (the only product in the project to which no surface-reconstruction operator has been applied, and which therefore retains the individual overlapping per-scan surface layers rather than a single fused surface) serves as the geometric reference S 0 against which every stage is measured. The interior and exterior component reconstructions (Section 3.5) were analyzed independently.

3.6.1. RealityCapture Reports and Exports

For each stage we extracted two classes of output. The first is the set of internal alignment and processing statistics reported by RealityCapture’s component and model reports: the number of registered images, the tie-point count, total projections and mean track length, the mean and median reprojection error in pixels, and the triangle and vertex counts of the reconstructed mesh. These quantities describe the internal self-consistency of each bundle adjustment and the density of the resulting surface; they are not, in themselves, measures of accuracy against an external reference, a distinction the Section 5 bears out.
As a texture-resolution measure we recorded the optimal texel size returned by the RealityCapture unwrapping tool. We ran the unwrap with the texel size set to optimal rather than to a fixed value: for the reconstructed mesh the software projects the registered images onto the surface and, for each region, estimates the ground sampling distance each contributing camera achieves there from its image resolution and its distance and incidence angle to the surface, then selects the texel edge length that the best-resolving imagery on that surface can support and reports a single representative optimal texel for the model. Because the value is derived from the projected resolution of the source imagery rather than from an imposed texture-page size, it reports the texture detail the data actually support, with a smaller value indicating finer texture; it is, in effect, the texture-side analogue of the TLS point spacing reported for the geometry. Per-camera computed extrinsics and intrinsics were additionally exported as internal/external parameter CSV files; because each stage builds upon from the previous one, the stage-to-stage differences in these computed poses quantify how far relaxing the camera constraints moves the solution, independently of the surface comparison below.
The second class of output is the reconstructed surface itself, exported in two distinct forms that are published together in the fusion derivatives archive (Appendix E). The point-cloud products are reconstructed at RealityCapture’s high detail setting and preserve every reconstructed vertex: they carry the full per-vertex geometry of the model but no surface texture, the texels being absent from the point representation. These vertex-complete, texture-free clouds are the products on which the cloud-to-cloud geometric comparison below is computed, since that comparison concerns geometry alone. The textured OBJ products, by contrast, carry the mapped texture (the texels whose resolution the optimal-texel measure above reports) on a meshed surface, and are the products served for visualization and dissemination. The two forms therefore separate along the same detail-versus-certainty axis that organizes the results: the point clouds express the geometry to be measured, the textured meshes express the appearance to be viewed.

3.6.2. Cloud-to-Cloud Comparison Against the Reference TLS

Geometric fidelity was assessed by multiscale model-to-model cloud comparison (M3C2) [52] between each reconstructed surface and the raw reference S 0 , computed with the py4dgeo library [53]. Core points were sampled from the reference cloud, so that every measurement is taken where laser ground truth exists; gap-fill regions, in which the reconstruction interpolates across surfaces the laser never observed, are therefore excluded from the statistics by construction. Surface normals were estimated at a radius of 0.5 m (exterior) and 0.05 m (interior), with projection cylinders of 0.20 m and 0.02 m radius, respectively, scaled to the median point spacing of each component (approximately 3–6 cm exterior, 4–5 mm interior). The cylinder search half-length was bounded to 1.5 m (exterior) and 0.2 m (interior): this prevents a projection from bridging to an adjacent surface across the temple’s columns and reliefs, so that any genuine displacement beyond the bound is recorded as a loss of coverage rather than as a spurious large distance.
For each core point M3C2 returns a signed surface distance and a level of detection at 95% confidence (LOD95), the latter combining the local roughness of both clouds with a registration-error term. We set that registration-error term to the agreement of the colorized-TLS stage S 1 with the raw reference (the reconstruction floor), so that significance is assessed relative to the pipeline’s own irreducible error rather than an arbitrary threshold. Because all stages inherit the single TLS-anchored coordinate frame established in Section 3.4, the surfaces were compared in absolute terms with no iterative-closest-point pre-alignment; registering the stages to the reference would have absorbed precisely the displacement the comparison is intended to measure. We report the median absolute distance (a robust center, as the distributions are heavy-tailed), the 95th percentile, the LOD95, and the fraction of the surface deviating significantly beyond it; distances are additionally normalized by the S 1 floor to permit comparison across the two scales. The report-parsing, pose-differencing, and M3C2 comparison scripts are released in the repository of Appendix D.

4. Archival Infrastructure and Web-Based Visualization

Raw sensor data are routinely forgotten at a project’s end; digital heritage documentation remains at risk of loss [54]. When shared, data are rarely presented in formats enabling re-use outside the original project’s scope [55]. To address these challenges, all primary datasets have been published as independent, citable archival records within OpenHeritage3D.org, integrated into a unified web-based visualization environment.

4.1. Data Publication

Each dataset has been published with its own DOI through DataCite [56], providing canonical references for citation tracking. This separation of data publication from interpretive scholarship treats primary sensor data as foundational sources warranting independent preservation [55].

4.2. Archival Formats

Terrestrial laser scanning is delivered in two forms: the original Geomagic-exported ASCII point clouds as received, and the pose-recovered scans (Section 3.3) written in the E57 format [33], which preserves hierarchical scan structure. Photogrammetric imagery is stored as original JPEGs with EXIF metadata preserved. Derived point clouds are archived in LAS/LAZ format [41] for Geographic Information System (GIS) compatibility, and the reconstructed surfaces are additionally published as textured OBJ meshes for visualization. The recovered camera poses for the full image set are exported both as per-camera parameter tables and in the open COLMAP sparse-reconstruction format, so that the placement of each individual image in space is preserved in a software-independent representation (Appendix E).

4.3. Interactive Viewer

To make the layered reconstruction openly explorable, we developed a custom visualization environment built on the Potree octree-based point-cloud renderer [37], itself built on Three.js [57], and deployed it through the OpenHeritage3D platform (https://openheritage3d.org, accessed on 1 September 2026). The approach adapts the throttled-rendering model that OpenTopography established for geoscience TLS [58] to cultural-heritage requirements, and can layer the Potree assets on Cesium.js globe basemaps [59] for geographic context [60]; the present Temple of Bel viewer is deployed without a global basemap, though the platform supports adding one. The viewer runs entirely in the browser, requiring no specialized software or local download, and streams the multi-resolution octree of each point cloud on demand, so that datasets of several gigabytes can be navigated interactively on consumer hardware.
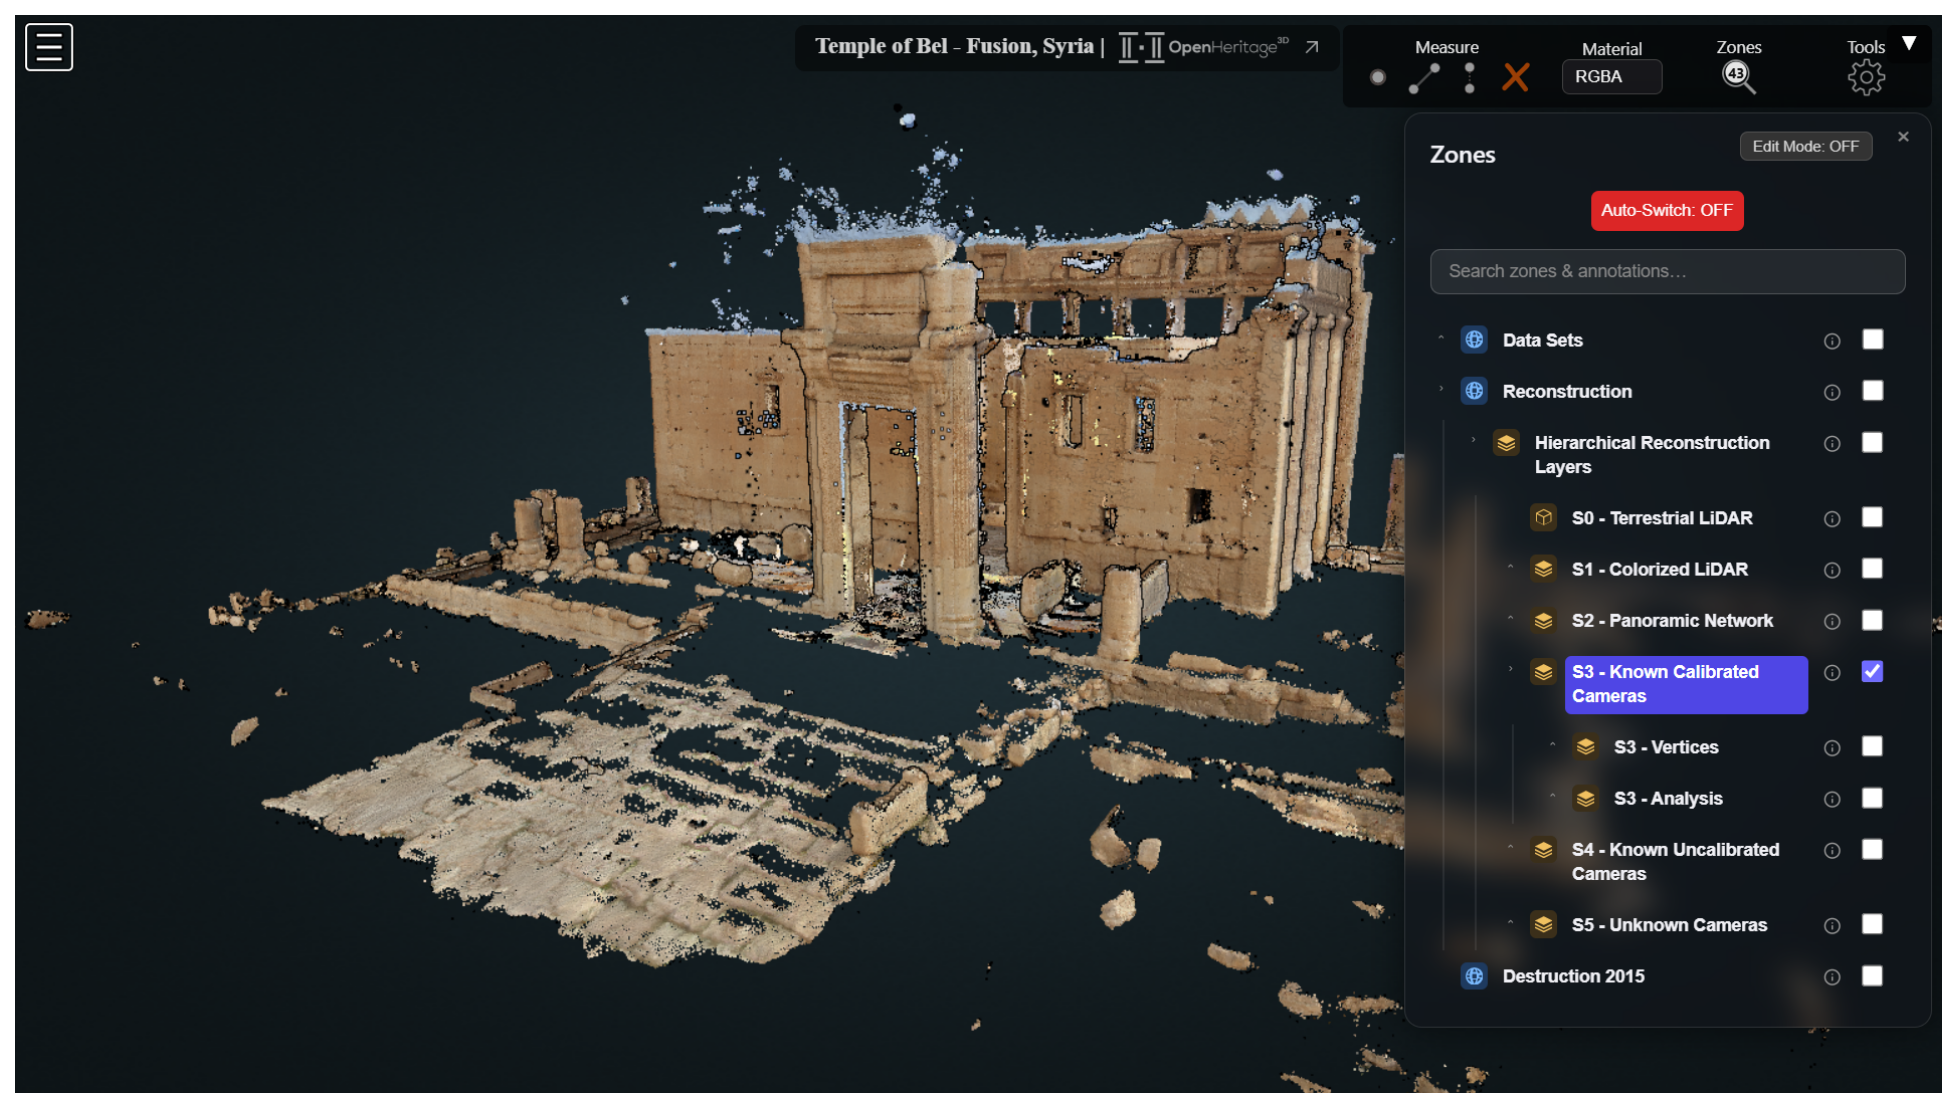
The content is organized into a hierarchical menu of zones accessible from the top-left of the interface. Two top-level branches structure the material: a Data Sets branch exposing the original source surveys, and a Reconstruction branch presenting the fused hierarchical model. Within Data Sets, each raw contribution (the 2010 TLS survey, the spherical panoramic network, and the crowdsourced tourist-photo reconstruction) is an independently toggleable layer, allowing primary sources to be compared directly against one another and against the reconstruction. Every zone carries a short description rendered in the sidebar; for the source surveys these descriptions embed the persistent DOI of the corresponding archived dataset, linking each layer back to its citable record and preserving attribution to the original contributors (Figure 8).
The Reconstruction branch mirrors the methodological hierarchy of the model. Each stage (S0 through S5) is represented as a nested zone, ordered from the most metrologically trusted data to the least: the TLS baseline, the colorized TLS surface, and the successive photogrammetric layers derived from the panoramic network and from the known- and unknown-camera image sets. Because the menu makes the layering explicit, a reader can rebuild the model incrementally, revealing one source at a time, and see exactly which surfaces each stage contributes.
The panoramic network is not presented merely as a separate cloud but is co-registered to the TLS and overlaid in the shared coordinate frame. Its individual capture stations are embedded as navigable 360 panoramas positioned at their surveyed locations within the model; selecting a station immerses the user in the original spherical imagery, providing photographic context that complements the geometric point cloud and supports interpretation of the surfaces, inscriptions, and reliefs that the reconstruction approximates.
Finally, the deviation analyses are included directly beneath each reconstruction stage rather than relegated to static figures. Each analysis derives from a M3C2 comparison of the stage against the S0 TLS baseline, and the result is retained as a per-point scalar field: the M3C2 distance evaluated against its 95% limit of detection (m3c2_lod95). The viewer therefore allows the local deviation to be queried at any individual point, and each analysis layer is colorized across a fixed scalar range so that magnitudes are directly comparable between regions and between stages. This turns the accuracy assessment into an explorable surface in its own right, exposing where each photogrammetric layer agrees with, or departs from, the laser-scanned reference.
Taken together, these features make the platform both a dissemination tool and an analytical instrument: a single interface in which the provenance, geometry, photographic source, and metric reliability of the reconstruction can be inspected layer by layer and point by point. A narrated walkthrough of the viewer and the layered reconstruction is provided as a video in Appendix F.

5. Results

The reconstruction is evaluated at the five cumulative stages S 1 S 5 defined in Section 3.6, separately for the temple interior and exterior, so that the marginal contribution of each input cohort can be read directly. Table 3 reports the internal alignment and model statistics of each stage; Table 4 reports the geometric agreement of each reconstructed surface with the raw reference TLS S 0 alongside its optimal texel size. The reconstruction and art-historical recontextualization of individual monumental artworks are deferred to a forthcoming study (Section 6.6); the coverage gaps bearing on which features are currently well served by the source imagery are noted in the qualitative observations below.

5.1. An Exemplary Composite Reconstruction

Before examining the individual stages, we present the composite reconstruction that the staged analysis ultimately motivates and that serves as the default model in the web viewer (Figure 9). It is deliberately heterogeneous, assembled from whichever stage best serves each region rather than from any single stage, and is offered as a practical “best all-around” model balancing the portrayal of significant features against geometric accuracy and texture resolution. The interior is taken from S 4 , which alone reconstructs the carved adyton ceilings while remaining within the laser’s detection limit (Section 5.4). The exterior is taken from S 5 , the fullest and most completely textured photo-augmented stage, except for the eastern wall behind the colonnade, which is taken from the colorized-TLS stage S 1 : there the columns occlude the tourist cameras so severely that every photo-augmented stage obscures rather than enhances the wall behind them, and only the laser surface with its projected panorama color renders it cleanly (Section 5.5). The portico, spanning the interior-to-exterior boundary, is composited from both component models (its underside from the S 4 interior and its outer faces from the S 5 exterior), since neither alone represents the threshold well (Section 5.4).
This heterogeneity is deliberately left visible rather than blended away: a clear seam runs down the southeastern corner of the building, where the S 1 and S 5 exteriors meet and the coloration changes abruptly between the panorama-derived and tourist-photo textures (Figure 9d). The seam marks a real difference in information, not merely a cosmetic mismatch: the S 5 exterior resolves significant weathering and block-by-block deterioration of the sandstone that the smoother S 1 surface does not capture, so the composite trades a visible discontinuity for the recovery of genuine surface detail on the photographed elevations. Its uncertainty is correspondingly non-uniform and inherited from its parts: the S 4 interior and S 5 exterior regions carry the several-fold departures from the laser floor reported for those stages (median 1.7  mm interior and 26.6  mm exterior; Table 4) and are suited to visualization and feature reading rather than metrology, whereas the S 1 eastern wall remains at the laser floor and is metrically reliable. The composite is thus a visualization-first product whose metric trustworthiness varies by region; the metric reference of record remains the raw TLS S 0 , and the viewer retains the ability to substitute any single stage where uniform, characterized accuracy is required (Section 6.1).

5.2. Internal Alignment Behavior

As imagery accumulates, registered-image counts grow with each cohort, and both tie-point and vertex counts rise sharply once the tourist-photo cohorts enter at S 3 , reflecting the additional image-derived depth (Table 3). Reprojection error, however, does not order the stages by accuracy, and on the exterior it does not even rank them in the same order. The panorama stage S 2 carries the highest median reprojection of any stage (0.50 px) yet produces the surface closest to the laser of any image-bearing stage, whereas the uncalibrated tourist-photo stage S 4 records the lowest reprojection (0.09 px), because releasing the intrinsic parameters grants the bundle adjustment additional freedom to fit the image observations, yet its surface lies more than twice as far from the reference as S 2 (Figure 10). The least accurate stage, the known-calibration cohort S 3 , is likewise not the stage with the worst reprojection. Reprojection error therefore measures internal self-consistency, how closely the bundle solution reproduces its own image observations, rather than fidelity to an external reference.

5.3. Geometric Fidelity Against the Reference TLS

At both scales the colorized-TLS stage S 1 establishes the reconstruction floor: a median surface deviation of 6.1 mm (exterior) and 0.3 mm (interior) from the raw scans, the irreducible error of meshing the laser data; on the exterior this 6.1 mm floor essentially reproduces the 6 mm inter-scan network registration error reported in Section 3.3.3, confirming that the floor is the registration error carried into the meshed surface rather than an independent reconstruction artifact. The panoramic stage S 2 remains effectively at this floor, 11.6 mm ( 1.9 × ) exterior and 0.5 mm ( 1.7 × ) interior, and in both components its median deviation lies below the level of detection (Table 4), meaning the panorama-augmented surface is statistically indistinguishable from the laser geometry while supplying finer texture than the bare TLS mesh (optimal texel 25.4 versus 33.0 mm exterior). The interior figures should be read with the coverage of Section 3.5 in mind: because scan 71 covers almost the entire cella and scan 72 only the portico threshold, the interior is effectively single-source, so its comparison measures the reconstruction largely against the one dense scan it was built from, a less independent test than the many-scan exterior provides.
The tourist-photo stages depart from the floor substantially. Exterior median deviation peaks at S 3 (39.1 mm, 6.4 × the floor) when the known-calibration cohort enters, then declines as further imagery is added, to 27.6 mm ( 4.5 × ) at S 4 and 26.6 mm ( 4.4 × ) at S 5 ; interior deviation, by contrast, rises monotonically across S 3 S 5 (0.9, 1.7, 2.3 mm; 3.0 to 7.7 × ). The signed medians remain near zero throughout, within 2 mm of the laser surface at every exterior stage, so the degradation is symmetric scatter about the laser surface rather than a systematic offset. The effect is substantial at both scales: in both components, adding crowdsourced frame photography displaces the fused surface several-fold beyond the floor at points the laser had already measured correctly.
The character of that degradation differs between the components, and the level of detection makes the distinction precise. At the exterior, the tourist-photo stages exceed the LOD95 at the median (median deviation roughly 1.2 to 1.6 × LOD95), so the displacement is detectable at the typical point and across about half the surface (50–52% significant area). At the interior, every stage (including the photo cohorts) has a median below the LOD95 (6.6 mm), so the typical interior point remains within detection noise; yet 19–26% of the surface still deviates significantly. Interior contamination is thus localized rather than pervasive, concentrated on the surfaces the tourist cameras could observe only obliquely; a residual overlap inconsistency at scan 72 persists even after tourist-photo insertion and is noted there as a known limitation.

5.4. Qualitative Observations: Interior

The aggregate statistics of Table 4 are complemented by stage-by-stage visual inspection of the interior reconstruction, which localizes where each cohort contributes and where each introduces artifacts. The raw and meshed TLS stages ( S 0 / S 1 ) reconstruct the cella walls but do not include the north and south cella ceilings (among the temple’s most significant features, the carved zodiac and floral adyton ceilings) because the two interior scan stations had little upward line-of-sight to them. The panoramic stage S 2 recovers part of the back wall of the south cella, but the panoramas observe the south cella ceiling from effectively a single viewpoint and so cannot reconstruct it: the panoramic network covers the south cella but does not, on its own, support a three-dimensional reconstruction of it. The tourist photographs provide the means for this, supplying the multiple oblique viewpoints the panoramic stations lack.
The frame-photo cohorts introduce the surface noise quantified in Table 4 in a spatially structured way. S 5 introduces substantial high-frequency noise on the interior, with 2–5 cm spiking concentrated around the north cella, while the south cella remains comparatively smooth; S 3 exhibits spiking on the north cella as well, and at a smaller amplitude (approximately 1–2 cm) on the south cella. S 4 is, by comparison, a smooth model that appears to correct for these depth artifacts (Figure 11). Much of this interior spiking occurs at the sub-centimeter level and is therefore only partly captured by the M3C2 statistics, whose interior projection scale averages over the finest spikes; the visual contrast between the smooth S 4 and the spiked S 3 and S 5 is consequently sharper than the stage-to-stage differences in median deviation in Table 4 would suggest. This is why the composite of Section 5.1 draws its interior from S 4 even though S 4 does not record the lowest interior median: the choice privileges the absence of high-frequency spiking, which dominates the visual result, over the sub-millimeter differences in broad deviation. Both S 4 and S 5 introduce tourist photographs taken from the portico exterior, and at the threshold where the outer portico meets the interior there are clear alignment discontinuities around the door border, offset by as much as 10 cm. This transition zone is better represented by the exterior reconstruction; accordingly, any detailed study of the portico (a poorly covered region spanning the interior-to-exterior boundary) should reference the interior and exterior models independently rather than relying on either across the threshold.
Several coverage gaps persist across all stages. Notable gaps remain on the floor of the north cella, the tops of the stairs in the south cella, and the pathways leading to the doors on either side of the south cella stairs. Although the cella back walls and ceilings are largely reconstructed in the photo-augmented stages, the cella floors and side walls are not, and the stairwells leading to the upper temple are essentially uncovered, with very few images available for those areas. Some artifacts of tourist shadows remain on surfaces despite the masking of the tourists themselves. Finally, the floor texture is visibly garbled even where the underlying geometry is well formed, a reminder that the geometric and radiometric quality of a reconstructed surface need not coincide.

5.5. Qualitative Observations: Exterior

The exterior reconstruction shows its largest qualitative disagreements with the TLS on the northern elevation, and these are concentrated in the known-calibration stage S 3 . S 3 is the noisiest exterior surface: it carries pronounced depth error across the surface, with pitting and spiking (Figure 12), and the north wall in particular is poorly reconstructed, with column doubling and local deviations on the order of tens of centimeters. The subsequent cohorts even out this damage rather than compounding it: S 4 and S 5 progressively smooth the S 3 depth artifacts on the north wall, consistent with the decline in exterior median deviation from S 3 to S 4 to S 5 in Table 4, though spiked artifacts of several centimeters and residual column offsets persist on the north and northwest walls. The photo-augmented exterior stages therefore remain visualization products rather than metric ones on the northern elevation. Radiometrically, overall coloration improves markedly at S 4 and S 5 over the panorama-based coloration present at S 2 , with the notable exception of the eastern wall and colonnade: there the tourist photographs contribute substantial error, and the cleanest texture for the east wall and colonnade remains that of the TLS stage S 1 , which carries the panorama-derived coloration, rather than any later stage.

5.6. Detail Versus Certainty

Texture detail and geometric fidelity move in opposite directions along the cascade (Table 4). As each photographic cohort is added, the optimal texel size shrinks (from 33.0 to 14.0 mm exterior and from 7.05 to 3.69 mm interior, a 2.0 to 2.4 × gain in texture resolution) while geometric fidelity stays several-fold worse than the TLS-and-panorama floor across every frame-photo stage. The frame imagery that sharpens the texture is the same imagery that carries the surface away from the laser: S 5 holds both the sharpest texel and the largest significantly-deviant area at both scales. The reconstruction therefore does not present a single optimal stage but a trade between texture detail and geometric certainty (Figure 13), and the appropriate stage depends on which the application privileges.

6. Discussion

The reconstruction reported here differs from earlier image-only efforts at the Temple of Bel chiefly in possessing an independent metric reference. The following subsections first draw out what the detail-versus-certainty trade means in practice, recommending a stage for each class of application, and then place the present results in the context of those earlier reconstructions, examine what the EXIF-based stratification did and did not achieve, discuss the value of preserving imagery beyond its immediate reconstruction utility, and set out the known limitations of the visualization environment and the directions for future work.

6.1. Recommended Stage by Application

The detail-versus-certainty trade implies different reconstructions for different uses (Table 5). For conservation and restoration planning (structural assessment, anastylosis, the fitting of recovered fragments, and any measurement that will inform physical intervention), geometric certainty is paramount and texture is secondary. These uses should draw on S 1 or S 2 , whose surfaces lie at or within the detection limit of the raw laser; the tourist-photo stages should not be used for metric work, as they displace the surface several-fold beyond the floor. S 2 is the practical default where both metric reliability and usable texture are required, since it gains texture over the bare TLS mesh while its surface remains within the laser’s detection limit (median below LOD95 at both scales; Table 4).
For research the choice depends on what is being measured. Form-, proportion-, and deformation-based analysis is geometry-dependent and should use S 1 / S 2 for the same reason as conservation. Surface- and texture-dependent scholarship (iconographic reading of relief, tooling and carving detail, polychromy and weathering) benefits from the finer texel of the photo-augmented stages, but with the explicit caveat that their underlying geometry is less certain; for object-scale study, dedicated close-range artwork reconstructions (planned as future work, Section 6.6) would be the appropriate instrument.
For storytelling, public dissemination, and immersive or virtual-reconstruction contexts, visual completeness and texture richness dominate while centimeter- to millimeter-scale geometric error is imperceptible to a viewer. These uses are best served by the fullest photo-augmented stage, S 5 , which provides the finest texture and the most complete visual coverage of surfaces the laser sampled sparsely. In all cases the reference TLS S 0 remains the metric authority of record: the reconstructed stages are surfaces for measurement, analysis, or display layered upon it, and the web viewer (Section 4) preserves the ability to select the stage matched to the task.
These per-application choices motivate the exemplary composite introduced in Section 5.1 and adopted as the viewer’s default: the interior is drawn from S 4 and the exterior from S 5 for visual completeness, except the colonnade-shadowed eastern wall, which reverts to the colorized-TLS S 1 where the photo stages obscure rather than reveal it, and the portico, which draws its underside from the S 4 interior and its outer faces from the S 5 exterior. That composite is a visualization-first default; the viewer retains the ability to substitute any single stage ( S 1 / S 2 for metric work, S 5 for the fullest texture) for the purpose-specific needs of Table 5.

6.2. Comparison with Prior Panorama-Based Reconstructions

The two principal earlier reconstructions of the Temple of Bel from this imagery (Wahbeh et al. [4], which combined #NewPalmyra-era tourist photographs with the Fangi panoramas, and the tourist-photo-only reconstruction released by McAvoy [22]) were both produced without an independent high-accuracy geometric reference. Wahbeh et al. were explicit on this point: lacking independent high-quality data, they adopted their most complete combined point cloud (tourist imagery with constrained panoramic stations) as the reference against which the other scenarios were judged, and they used spherical photogrammetry as a “virtual topographic survey” to scale and orient the model from the temple’s known plan dimensions. Within that internal frame they estimated a relative accuracy of 2–3 cm and an absolute accuracy of 10–15 cm, the latter equivalent to better than 0.3% of the temple’s dimensions, and they reported interior co-registration residuals of 5–17 cm (mean ≈ 12 cm) when joining the northern and southern cella point clouds through the panorama centers.
The Saito TLS supplies the independent reference those earlier studies lacked, and our results both corroborate their internal estimates and locate them against ground truth. Prior to fusion, comparing the Saito TLS against the McAvoy [22] tourist-photo-only reconstruction built from the #NewPalmyra images, we observe a ≈20 cm discrepancy at the northern cella, where the tourist-only surface is pushed in front of the laser geometry (Figure 6). This decimeter-scale absolute offset is consistent with the 10–15 cm absolute accuracy and the 5–17 cm interior co-registration residuals that Wahbeh et al. inferred without ground truth: the tourist-only network is internally coherent but carries an absolute error that only becomes visible against the laser. Our staged comparison also externally confirms the stabilizing role that Wahbeh et al. attributed to the panoramas on internal evidence. They found that constraining the panoramic stations in the bundle adjustment reduced point-cloud noise by more than a factor of two relative to the tourist-only solution; in the present work the panorama stage S 2 remains within the laser’s detection limit at both scales (median deviation 11.6 mm exterior, 0.5 mm interior; Table 4) while the tourist-photo stages displace the surface several-fold beyond it. The panoramas’ contribution that Wahbeh et al. could only assess relative to their own combined cloud is thus confirmed here against an external metric reference.
The methodological advance over this earlier work is therefore not the imagery but the reference frame: where Wahbeh et al. used spherical photogrammetry as a virtual topographic base to recover relative geometry and approximate scale, the present workflow anchors the entire reconstruction to TLS, converting the earlier internally referenced accuracy estimates into absolute deviations measured against ground truth (Section 3.6). The convergence of the two independent estimates (their internally-derived decimeter absolute accuracy and our externally measured ≈20 cm tourist-only offset) lends confidence to both.

6.3. Effectiveness of EXIF-Based Image Stratification

The crowdsourced photographs were stratified by EXIF completeness and admitted in cohorts of decreasing intrinsic-parameter quality (Section 3.4; stages S 3 S 5 ), on the assumption that better-documented cameras would contribute more reliable geometry. The results bear this assumption out as an ordering but not as an accuracy lever. The stratification did track reliability in the expected direction on the interior, where geometric deviation rises monotonically across the three frame-photo cohorts (0.9, 1.7, and 2.3 mm at S 3 , S 4 , and S 5 ; Table 4). Its practical payoff was nonetheless small, because the dominant cost was admitting tourist frame photography at all rather than the gradient between cohorts: the exterior median deviation jumps from 11.6 mm at the panorama stage S 2 to 39.1 mm the moment the best-documented cohort, the known-profile photographs, enters at S 3 , then declines to 27.6 and 26.6 mm as the uncalibrated and metadata-deficient images are added. The single largest geometric departure is therefore introduced by the first and best-documented crowdsourced cohort, and the less-documented imagery that follows improves the exterior surface rather than degrading it further, consistent with added coverage and redundancy smoothing the dense reconstruction rather than with any geometric superiority of the less-documented cameras. This is consistent with the EXIF intrinsics functioning as rough priors rather than measurements: consumer cameras report nominal focal lengths that ignore digital zoom, crop factor, and in-camera lens correction, so a populated EXIF record does not by itself certify an accurate camera model.
The most consequential qualification concerns the signal one would naturally use to judge calibration quality during processing. Reprojection error does not predict which cohorts help the geometry. The best-documented cohort S 3 does not record the lowest reprojection; the uncalibrated S 4 does (0.09 px, below the EXIF-initialized S 3 at 0.39 px; Table 3), because releasing the intrinsic parameters grants the bundle adjustment additional freedom to fit the image observations. Yet on the exterior the most accurate of the image-augmented stages, the panorama stage S 2 , simultaneously carries the highest reprojection of any stage (0.50 px), so a lower reprojection is no guarantee of a more faithful surface. Within the crowdsourced tier alone, reprojection and accuracy are more nearly aligned, with S 4 and S 5 improving on S 3 on both measures; but across the full stage sequence the two part company, which is the same divergence between internal self-consistency and external accuracy reported as the study’s headline result (Section 3.6). On the interior, reprojection error rises with EXIF degradation (0.34, 0.36, 0.38 px) in step with the geometry, so internal metrics and accuracy remain aligned where the laser reference is dense.
The practical implication is that EXIF stratification is defensible as a sequencing rule but should not be read as a means of selecting geometrically superior crowdsourced imagery: here the best-documented cohort was in fact the most geometrically disruptive on the exterior. None of the frame-photo cohorts competes with the laser on geometry, and there is little geometric basis for preferring the well-calibrated cohort over the others; the reason to reach for any of the photo-augmented stages is texture and coverage, as the use-case guidance of Table 5 sets out.

6.4. The Value of Accumulating and Aligning Imagery Beyond Immediate Reconstruction Needs

A subset of the tourist photographs assembled for this work did not contribute to the final dense reconstruction: 680 of 1580 failed to align, and others were excluded through masking of transient elements. We retained them in the published tourist-photo archive (Appendix C) nonetheless. The capacity of photogrammetric methods to extract geometry from challenging imagery has advanced markedly: Morelli et al. [14] demonstrate this in their Sycamore Gap reconstruction, where deep-learning feature matchers recovered geometric information from crowdsourced photographs that traditional SIFT-based pipelines would have rejected. Similar progress continues across image matching, bundle adjustment, and monocular depth estimation, with no sign of plateau. Images unusable today may yield meaningful information under future tooling, and the cost of preserving them now is modest compared to the cost of re-locating and re-curating them later. Heritage documentation datasets should be preserved at the level of their maximum potential future utility, not pruned to their minimum present usefulness.

6.5. Visualizing Individual Images in Space

A recurring theme of this work is that the value of the crowdsourced collection lies not only in the fused surface but in the individual photographs and their recovered positions: each aligned image is a dated, located observation of the temple before its destruction, and the placement of these images in space is itself a documentary product. The web viewer (Section 4) enables overlay of the panoramic imagery as oriented images, but configuring the heterogeneous tourist-photo cameras within the same viewer proved difficult, given their 159 distinct camera models and widely varying intrinsics. For now, the individually placed tourist-photo cameras are best inspected within the RealityCapture project itself, or in the COLMAP-format export of the alignment that we provide as a more open alternative (Appendix E). Bringing the full set of located tourist photographs into the open web viewer, so that any historical image can be viewed in its recovered pose alongside the TLS reference, remains an outstanding integration task and a priority for the visualization environment.

6.6. Future Work

Several directions extend the present reconstruction. The aligned imagery and TLS-anchored coordinate frame are a natural substrate for Gaussian splatting, which could provide a continuous, view-dependent radiance representation of the temple complementary to the meshed surfaces reported here, particularly for the visually rich but geometrically uncertain photo-augmented regions. Monocular depth estimation, advancing rapidly alongside the image-matching and bundle-adjustment improvements discussed above, offers a route to recovering geometry from the single-viewpoint and weakly-connected images that current multi-view methods reject, of which this collection retains a substantial reserve (Section 6.4). Finally, dedicated close-range reconstruction and art-historical recontextualization of the temple’s individual monumental artworks is planned as a separate study, treating each as a standalone object-scale reconstruction and scoring each artwork and architectural feature (the beam reliefs, lintel sculptures, propylaeum capitals, merlons, and inscriptions) for its reconstruction coverage and source-image support. Such a catalog would convert the qualitative coverage gaps noted in Section 5.4 and Section 5.5 into a per-feature assessment, communicating to conservators and the wider community precisely where additional or higher-quality imagery is needed and which features are currently best served. The most immediate of these gaps are the exterior reliefs on the northwest and south sides of the temple, which the present imagery covers poorly and which are accordingly the priority targets for any future documentation campaign or newly surfaced historical photographs.
Beyond the reconstruction itself, multi-resolution depth fusion remains an underserved problem in photogrammetric software: current implementations assume relatively homogeneous input quality, with fusion algorithms tuned for combining similar-quality depth estimates. When inputs span orders of magnitude in resolution, as when sub-centimeter TLS data meets decimeter-scale tourist-photo depth maps, these algorithms may fail to respect the precision hierarchy. Three directions merit investigation: explicit resolution-aware weighting that privileges higher-precision sources regardless of surface smoothness; hierarchical fusion that processes high-resolution sources separately before integration; and pragmatic software selection informed by observed behavior on the specific input configuration at hand, as we adopted here. Until fusion algorithms explicitly account for sensor-specific accuracy characteristics, practitioners may need similar pragmatic strategies when integrating heterogeneous datasets.

7. Conclusions

This work reconstructed the Temple of Bel from three heterogeneous pre-destruction datasets, terrestrial laser scanning, spherical panoramic imagery, and crowdsourced tourist photographs, within a single metrically anchored and openly archived framework. Two findings and one tool are what we would carry forward from it.
The first is the study’s central, cautionary finding. Texture detail and geometric certainty move in opposite directions across the fusion cascade, and internal quality metrics do not track external accuracy: on the exterior, the stage with the most favorable reprojection error is not the most accurate, and the stage whose surface best matches the laser carries the highest reprojection of all. Judging a fused reconstruction by the statistics its software reports therefore measures self-consistency, not fidelity. No single reconstruction is optimal for every purpose, so we publish each stage with an explicit account of where it is metrically reliable: conservation and metrology should draw on the laser-and-panorama stages, the photo-augmented stages on visualization and dissemination.
The second is that the hierarchical discipline this requires extends past the ordering of image cohorts to the camera model itself. Letting the higher-confidence image network rather than the coarser laser markers determine the calibration is what keeps a bundle adjustment from absorbing cross-modal inconsistency into parameters where it cannot be seen, and it is most consequential precisely where the marker network is weakest for determining that model, as on the exterior, where control confined to the cella is observed by cameras ringing the whole precinct.
The tool is the visibility-based pose-recovery method, released as the open-source e57repose package, which restored scanner positions to a legacy dataset whose acquisition metadata had been lost in format conversion and thereby returned it to service as a metric reference. Archives of comparably stranded scan data are not rare, and the method is not specific to this one.
Underlying all three is an organizational choice: the reconstruction is published not as a single monolithic model but as a cascade of cumulative stages and a set of independently citable components, each carrying a DOI and composable in a web-based viewer. As restoration planning for Palmyra resumes under international coordination, an open, metrically grounded, component-wise citable record of the monument as it stood is offered as one durable foundation for that work, and as a substrate for whatever future methods may recover from the imagery that today’s cannot.

Supplementary Materials

The following supporting information can be downloaded at https://www.mdpi.com/article/10.3390/rs18173038/s1, Text S1, the full marker placement criteria, feature-selection rules, per-marker accuracy budget, and validation procedure for the panorama-to-TLS alignment of Section 3.3.4.

Author Contributions

Conceptualization, S.M., W.W., F.M. and E.N.; Methodology, S.M., W.W., F.M. and E.N.; Software, S.M. and A.A.; Validation, S.M., F.M., E.N. and A.A.; Formal analysis, S.M. and W.W.; Investigation, S.M. and F.K.; Resources, S.M. and F.K.; Data curation, S.M. and A.A.; Writing – original draft, S.M.; Writing – review & editing, S.M., W.W., F.M., E.N., A.A. and F.K.; Visualization, S.M. and A.A.; Supervision, F.K.; Project administration, F.K.; Funding acquisition, F.K. All authors have read and agreed to the published version of the manuscript.

Funding

This research received no external funding.

Data Availability Statement

All data and derived products generated for this study are openly available through OpenHeritage3D.org and are summarized across Appendix A, Appendix B, Appendix C, Appendix D and Appendix E. The complete archive comprises: the Fangi panoramic network (550 individual frames forming 18 spherical stations; Appendix A); the Saito TLS (29 scans, E57 format; Appendix B); the assembled #NewPalmyra tourist-photo collection and its reconstruction (1580 source images with masks, of which 900 aligned; Appendix C); the open-source code for legacy scanner pose recovery (e57repose) and for the report-parsing, pose-differencing, and M3C2 comparison analysis (hierarchical_reconstruction_comparison; Appendix D); and the fusion derivatives package containing the staged reconstructions S 1 S 5 as both vertex-complete point clouds and textured OBJ meshes, the photogrammetry projects (RealityCapture and Agisoft Metashape files), per-camera intrinsic/extrinsic parameter exports, and alignment reports (Appendix E). The full working archive totals approximately 202 GB before compression and is distributed as a single data_derivatives volume under the fusion-derivatives DOI (Appendix E), with a complete content listing provided in the archive README. Each primary dataset and the fusion derivatives carry independent DOIs (Table 1; Appendix A, Appendix B, Appendix C, Appendix D and Appendix E) to support individual citation.

Acknowledgments

The authors acknowledge the sacrifice of the Syrian people in protecting and promoting the site of Palmyra, including Khaled Mohamad al-Asaad, and Bassel Khartabil. This project is the joining of resources created by hundreds of people. We would like to thank Kiyohide Saito for providing access to the TLS dataset, to Gabriele Fangi and Silvana Fangi for sharing the foundational imagery, the #NewPalmyra project, Barry Threw, and Jon Phillips for organizing the acquisition and open source sharing of thousands of important images. Thanks to Kai Evenson, Cori Hoover, and the Institute for Liberal Arts Digital Scholarship (ILiADs) for inspiration. The authors would also like to thank CyArk, Western Digital, the Kinsella Expedition Fund, and Carol Tohsaku for their ongoing support of the OpenHeritage3D project. The AI tool Claude.ai using the Opus 4.5 Large Language Model (Anthropic, 2025) was used in later stages of literature review to search for highly specific relevant sources related to depth map fusion algorithms and multi-sensor integration. It was also employed to suggest grammatical corrections to improve clarity and flow. The authors have reviewed and approved the final manuscript and take full responsibility for its content.

Conflicts of Interest

The authors declare no conflicts of interest.

Abbreviations

The following abbreviations are used in this manuscript:
DOIDigital Object Identifier
EXIFExchangeable Image File Format
GISGeographic Information System
ICPIterative Closest Point
LiDARLight Detection and Ranging
MISPMulti-Image Spherical Photogrammetry
MVSMulti-View Stereo
SfMStructure from Motion
TGVTotal Generalized Variation
TLSTerrestrial Laser Scanning
TVTotal Variation
UNESCOUnited Nations Educational, Scientific and Cultural Organization

Appendix A. Fangi Panoramic Dataset

Gabriele Fangi, Circolo Ricreativo Universitario di Ancona (2026): Temple of Bel, Palmyra, Panoramic Network. Distributed by Open Heritage 3D. https://doi.org/10.34946/D6HC7W (accessed on 25 June 2026).

Appendix B. Saito TLS Dataset

Kiyohide Saito, Archaeological Institute of Kashihara, Nara (2026): Temple of Bel, Palmyra, TLS. Distributed by Open Heritage 3D. https://doi.org/10.34946/D6CP4M (accessed on 25 June 2026).

Appendix C. Tourist Photo Reconstruction

Scott McAvoy, University of California San Diego Library (2020): Temple of Bel Tourist Photo Reconstruction. Distributed by Open Heritage 3D. https://doi.org/10.26301/zjnn-wx58 (accessed on 25 June 2026).

Appendix D. Code Repository

McAvoy, S. (2026). e57repose: Scanner pose recovery tool for E57 point clouds (Version 1.0) [Computer software]. GitHub. https://github.com/smcavoy12/e57repose (accessed on 25 June 2026).
McAvoy, S. (2026). hierarchical_reconstruction_comparison [Computer software]. GitHub. https://github.com/smcavoy12/hierarchichal_reconstruction_comparison (accessed on 25 June 2026).

Appendix E. Full Fusion Project

McAvoy, S., Saito, K., Fangi, G. (2026): Temple of Bel - Fusion - Data Derivatives - 3D photogrammetry. Distributed by Open Heritage 3D. https://doi.org/10.34946/D6VP4Z (accessed on 25 June 2026).

Appendix F. Video Walkthrough

A narrated video walkthrough of the reconstruction and the interactive visualization system accompanies this archive, demonstrating navigation of the hierarchical zone menu, the per-point M3C2 query, the embedded 360 panoramas, and the exemplary composite reconstruction of Section 5.1. It is available at https://www.youtube.com/watch?v=cxFTnkg8uBE (accessed on 25 June 2026) and through the OpenHeritage3D project record.

Appendix G. Metashape-Only Implementation of the Hierarchical Alignment

The same hierarchical strategy can in principle be implemented entirely within Agisoft Metashape, avoiding the cross-software handoff used here. Metashape does not expose a first-class operation analogous to RealityCapture’s component-fixing alignment, but two documented mechanisms can be combined to approximate the equivalent behavior. The first is the incremental image alignment workflow described in the Metashape user manual [61]: with the Keep key points option enabled in the Preferences dialog before processing begins, new images can be added to an aligned chunk and re-aligned via Workflow → Align Photos with the Reset current alignment checkbox left unchecked, causing Metashape to retain existing key points and match the new images against them. This is the closest first-party analog to RealityCapture’s fix-and-extend operation. The second mechanism is constrained bundle adjustment via the marker reference accuracy field: after each cohort is aligned, markers anchored to TLS-derived coordinates can be added or tightened so that subsequent Optimize Cameras passes hold the solution close to the TLS reference, with the previously-aligned cameras’ reference accuracies likewise tightened to discourage drift. Agisoft’s TLS-photogrammetry integration workflow [43] provides the underlying mechanics of co-registering laser scans and photographs in the same chunk using shared tie points from the scanner’s spherical panoramas or intensity maps, and the same marker-based constraint procedure has been employed in published cultural-heritage applications combining TLS ground control with Metashape photogrammetry [62,63].
These two mechanisms, applied iteratively across cohorts of decreasing reliability, can reproduce the alignment topology of the RealityCapture workflow we adopted, but they introduce operational complexity that RealityCapture handles internally. We are not aware of a published methodology paper that describes the full layered strategy as a named Metashape workflow; the incremental-alignment and marker-constrained components are documented individually, but their combination into a hierarchical, cohort-by-cohort scheme appears to be folk practice in the photogrammetry community rather than a codified procedure with peer-reviewed precedent. The constrained bundle adjustment, in particular, is implemented as a soft weighted penalty rather than a hard lock, so a sufficiently strong tie-point constraint from a new cohort can still perturb prior cameras by sub-millimeter amounts; the user must verify after each Optimize Cameras pass that this has not occurred. The multi-chunk alternative (aligning each cohort in its own chunk and rigidly registering chunks to a TLS-anchored reference chunk via Align Chunks [61]) treats each cohort as a rigid body during inter-chunk registration, which discards the per-image bundle adjustment refinement that motivates the hierarchical strategy in the first place. RealityCapture’s component-based registration, by contrast, exposes the fix-and-extend operation as a single workflow step in which the new cameras’ poses are solved as free parameters while the previously-aligned cameras retain their poses exactly. We selected the cross-software workflow on the grounds of operational directness and verifiability rather than capability: the same alignment topology is reachable in either environment, but the RealityCapture path requires fewer configuration decisions and presents a clearer audit trail of which cameras were free or fixed at each stage. Practitioners working in a Metashape-only environment can achieve a comparable result by combining the incremental-alignment and marker-constrained mechanisms above, with the caveat that the per-cohort freezing must be enforced explicitly and verified after each pass.

References

  1. Dieb, R.; Alsalloum, A.; Webb, N. Interactive 360° media for the dissemination of endangered world heritage sites: The ancient city of Palmyra in Syria. Built Herit. 2024, 8, 18. [Google Scholar] [CrossRef] [Scilit]
  2. Silver, M.; Fangi, G.; Denker, A. Reviving Palmyra in Multiple Dimensions: Images, Ruins and Cultural Memory; Whittles Publishing: Dunbeath, UK, 2018. [Google Scholar]
  3. Denker, A. 3D visualization and photo-realistic reconstruction of the Great Temple of Bel. Int. Arch. Photogramm. Remote Sens. Spat. Inf. Sci. 2017, XLII-2/W3, 225–229. [Google Scholar] [CrossRef] [Scilit]
  4. Wahbeh, W.; Nebiker, S.; Fangi, G. Combining public domain and professional panoramic imagery for the accurate and dense 3D reconstruction of the destroyed Bel Temple in Palmyra. ISPRS Ann. Photogramm. Remote Sens. Spat. Inf. Sci. 2016, III-5, 81–88. [Google Scholar] [CrossRef] [Scilit][Green Version]
  5. Abdulkarim, M.; Seigne, J. The future of the Temple of Bel in Palmyra after its destruction. Bull. Am. Sch. Orient. Res. 2024, 391, 93–106. [Google Scholar] [CrossRef] [Scilit] [PubMed]
  6. Palmyrene Voices Initiative. Report on the Current State of Palmyra’s Antiquities After Liberation; Heritage for Peace: Barcelona, Spain, 2025; Available online: https://palmyrenevoices.org/ (accessed on 25 June 2026).
  7. Bakare, L. Heritage Experts Call for International Task Force to Plan Palmyra Rebuild. The Art Newspaper, 4 November 2025. Available online: https://www.theartnewspaper.com/2025/11/04/heritage-experts-call-for-an-international-task-force-to-rebuild-palmyra (accessed on 4 June 2026).
  8. Palmyra Museum Damaged by Shelling to Be Rebuilt with International Funding. The National, 31 October 2025. Available online: https://www.thenationalnews.com/news/mena/2025/10/31/palmyra-museum-damaged-by-shelling-to-be-rebuilt-with-international-funding/ (accessed on 4 June 2026).
  9. UNESCO World Heritage Centre. State of Conservation: Site of Palmyra (Syrian Arab Republic). 2025. Available online: https://whc.unesco.org/en/soc/4659/ (accessed on 4 June 2026).
  10. UNESCO World Heritage Centre. Emergency Safeguarding of the Portico of the Temple of Bel in Palmyra. Available online: https://whc.unesco.org/en/activities/903/ (accessed on 4 June 2026).
  11. ICONEM; Directorate General of Antiquities and Museums of Syria. Temple of Bel: Syrian Heritage Revival. 2016. Available online: http://syrianheritagerevival.org/palmyra/ (accessed on 4 June 2026).
  12. Snavely, N.; Seitz, S.M.; Szeliski, R. Photo tourism: Exploring photo collections in 3D. ACM Trans. Graph. 2006, 25, 835–846. [Google Scholar] [CrossRef] [Scilit]
  13. Agarwal, S.; Furukawa, Y.; Snavely, N.; Simon, I.; Curless, B.; Seitz, S.M.; Szeliski, R. Building Rome in a day. Commun. ACM 2011, 54, 105–112. [Google Scholar] [CrossRef] [Scilit]
  14. Morelli, L.; Mazzacca, G.; Trybała, P.; Gaspari, F.; Ioli, F.; Ma, Z.; Remondino, F.; Challis, K.; Poad, A.; Turner, A.; et al. The legacy of Sycamore Gap: The potential of photogrammetric AI for reverse engineering lost heritage with crowdsourced data. Int. Arch. Photogramm. Remote Sens. Spat. Inf. Sci. 2024, XLVIII-2-2024, 281–288. [Google Scholar] [CrossRef] [Scilit]
  15. Fangi, G. The multi-image spherical panoramas as a tool for architectural survey. In Proceedings of the XXI International CIPA Symposium, Athens, Greece, 1–6 October 2007; ISPRS Archives: Vienna, Austria, 2007; Volume XXXVI-5/C53. [Google Scholar]
  16. Fangi, G. Further developments of the spherical photogrammetry for cultural heritage. In Proceedings of the XXII CIPA Symposium, Kyoto, Japan, 11–15 October 2009. [Google Scholar]
  17. Fangi, G. Multi-scale multi-resolution spherical photogrammetry with long focal lenses for architectural surveys. In Proceedings of the ISPRS Midterm Symposium, Newcastle, UK, 21–24 June 2010; ISPRS Archives: Vienna, Austria, 2010; Volume XXXVIII, Part 5, pp. 228–233. [Google Scholar]
  18. Fangi, G.; Pierdicca, R. Notre Dame du Haut by spherical photogrammetry integrated by point clouds generated by multi-view software. Int. J. Herit. Digit. Era 2012, 1, 461–479. [Google Scholar] [CrossRef] [Scilit]
  19. Fangi, G.; Nardinocchi, C. Photogrammetric processing of spherical panoramas. Photogramm. Rec. 2013, 28, 293–311. [Google Scholar] [CrossRef] [Scilit]
  20. Saito, K. Study on Reconstruction of Historical Monuments and Archaeological Sites Using 3D Images from Photographs (KAKENHI Grant 17K18520); Japan Society for the Promotion of Science: Tokyo, Japan, 2021; Available online: https://kaken.nii.ac.jp/en/grant/KAKENHI-PROJECT-17K18520/.
  21. NewPalmyra. #NEWPALMYRA: A Digital Archaeology Project. 2018. Available online: https://newpalmyra.org/ (accessed on 25 June 2026).
  22. McAvoy, S. Temple of Bel Tourist Photo Reconstruction; Open Heritage 3D: San Diego, CA, USA, 2020. [Google Scholar] [CrossRef]
  23. Wahbeh, W.; Nebiker, S. Three dimensional reconstruction workflows for lost cultural heritage monuments exploiting public domain and professional photogrammetric imagery. ISPRS Ann. Photogramm. Remote Sens. Spat. Inf. Sci. 2017, IV-2/W2, 319–325. [Google Scholar] [CrossRef] [Scilit]
  24. Tola, E.; Strecha, C.; Fua, P. Efficient large-scale multi-view stereo for ultra high-resolution image sets. Mach. Vis. Appl. 2012, 23, 903–920. [Google Scholar] [CrossRef] [Scilit]
  25. Antensteiner, D.; Štolc, S.; Pock, T. A review of depth and normal fusion algorithms. Sensors 2018, 18, 431. [Google Scholar] [CrossRef] [Scilit] [PubMed]
  26. Burgdorfer, N.; Mordohai, P. V-FUSE: Volumetric depth map fusion with long-range constraints. In Proceedings of the IEEE/CVF Conference on Computer Vision and Pattern Recognition, Vancouver, BC, Canada, 17–24 June 2023; pp. 13142–13151. [Google Scholar]
  27. Qin, R.; Ling, X.; Farella, E.M.; Remondino, F. Uncertainty-guided depth fusion from multi-view satellite images to improve the accuracy in large-scale DSM generation. Remote Sens. 2022, 14, 1309. [Google Scholar] [CrossRef] [Scilit]
  28. Maskeliūnas, R.; Maqsood, S.; Vaškevičius, M.; Gelšvartas, J. Fusing LiDAR and photogrammetry for accurate 3D data: A hybrid approach. Remote Sens. 2025, 17, 443. [Google Scholar] [CrossRef] [Scilit]
  29. Wang, C.; Gu, Y.; Li, X. LPRnet: A self-supervised registration network for LiDAR and photogrammetric point clouds. arXiv 2025, arXiv:2501.05669. [Google Scholar] [CrossRef] [Scilit]
  30. Alshawabkeh, Y. Integration of laser scanning and photogrammetry for heritage documentation. In Progress in Cultural Heritage Preservation; Ioannides, M., Fritsch, D., Leissner, J., Davies, R., Remondino, F., Caffo, R., Eds.; Lecture Notes in Computer Science; Springer: Berlin/Heidelberg, Germany, 2014; Volume 7616, pp. 424–431. [Google Scholar]
  31. Abdelhafiz, A. Integrating Digital Photogrammetry and Laser Scanning. Ph.D. Thesis, Deutsche Geodätische Kommission, Munich, Germany, 2009. [Google Scholar]
  32. Saito, K.; Sugiyama, T. (Eds.) Proceedings of the Conference “Saving the Syrian Cultural Heritage for the Next Generation: Palmyra, a Message from Nara”; Archaeological Institute of Kashihara, Nara Prefecture: Nara, Japan, 2018; pp. 88–89. [Google Scholar]
  33. Huber, D. The ASTM E57 file format for 3D imaging data exchange. In Proceedings of the SPIE 7864, Three-Dimensional Imaging, Interaction, and Measurement, San Francisco, CA, USA, 27 January 2011. [Google Scholar] [CrossRef] [Scilit]
  34. Pomerleau, F.; Colas, F.; Siegwart, R. A review of point cloud registration algorithms for mobile robotics. Found. Trends Robot. 2015, 4, 1–104. [Google Scholar] [CrossRef] [Scilit]
  35. Dong, Z.; Yang, B.; Liang, F.; Huang, R.; Scherer, S. Registration of laser scanning point clouds: A review. Sensors 2018, 18, 1641. [Google Scholar] [CrossRef] [Scilit] [PubMed]
  36. Theiler, P.W.; Wegner, J.D.; Schindler, K. Globally consistent registration of terrestrial laser scans via graph optimization. ISPRS J. Photogramm. Remote Sens. 2015, 109, 126–136. [Google Scholar] [CrossRef] [Scilit]
  37. Schütz, M. Potree: Rendering Large Point Clouds in Web Browsers. Master’s Thesis, Vienna University of Technology, Vienna, Austria, 2016. Available online: https://www.cg.tuwien.ac.at/research/publications/2016/SCHUETZ-2016-POT (accessed on 25 June 2026).
  38. Amanatides, J.; Woo, A. A fast voxel traversal algorithm for ray tracing. In Proceedings of Eurographics ’87; Marechal, G., Ed.; Eurographics Association: Amsterdam, The Netherlands, 1987; pp. 3–10. [Google Scholar]
  39. Shannon, C.E. A mathematical theory of communication. Bell Syst. Tech. J. 1948, 27, 379–423. [Google Scholar] [CrossRef] [Scilit]
  40. Nelder, J.A.; Mead, R. A simplex method for function minimization. Comput. J. 1965, 7, 308–313. [Google Scholar] [CrossRef] [Scilit]
  41. American Society for Photogrammetry and Remote Sensing. LAS Specification v.1.4-R15. 9 July 2019. Available online: https://www.asprs.org/divisions-committees/lidar-division/laser-las-file-format-exchange-activities (accessed on 25 June 2026).
  42. Kedzierski, M.; Fryskowska, A.; Wierzbicki, D.; Dabrowska, M.; Grochala, A. Impact of the method of registering Terrestrial Laser Scanning data on the quality of documenting cultural heritage structures. Int. Arch. Photogramm. Remote Sens. Spat. Inf. Sci. 2015, XL-5/W7, 245–248. [Google Scholar] [CrossRef] [Scilit]
  43. Agisoft LLC. Terrestrial Laser Scanning Data Processing. Agisoft Helpdesk Portal, 2024. Available online: https://agisoft.freshdesk.com/support/solutions/articles/31000159101 (accessed on 31 May 2026).
  44. Özyeşil, O.; Voroninski, V.; Basri, R.; Singer, A. A survey of structure from motion. Acta Numer. 2017, 26, 305–364. [Google Scholar] [CrossRef] [Scilit]
  45. Schönberger, J.L.; Frahm, J.-M. Structure-from-motion revisited. In Proceedings of the IEEE Conference on Computer Vision and Pattern Recognition, Las Vegas, NV, USA, 27–30 June 2016; pp. 4104–4113. [Google Scholar] [CrossRef] [Scilit]
  46. Moulon, P.; Monasse, P.; Marlet, R. Global fusion of relative motions for robust, accurate and scalable structure from motion. In Proceedings of the IEEE International Conference on Computer Vision, Sydney, Australia, 1–8 December 2013; pp. 3248–3255. [Google Scholar] [CrossRef] [Scilit]
  47. Zhu, S.; Zhang, R.; Zhou, L.; Shen, T.; Fang, T.; Tan, P.; Quan, L. Very large-scale global SfM by distributed motion averaging. In Proceedings of the IEEE Conference on Computer Vision and Pattern Recognition, Salt Lake City, UT, USA, 18–23 June 2018; pp. 4568–4577. [Google Scholar] [CrossRef] [Scilit]
  48. Dong, Z.; Yang, B.; Liang, F.; Huang, R.; Scherer, S. Hierarchical registration of unordered TLS point clouds based on binary shape context descriptor. ISPRS J. Photogramm. Remote Sens. 2018, 144, 61–79. [Google Scholar] [CrossRef] [Scilit]
  49. Ch’ng, E.; Cai, S.; Zhang, T.E.; Leow, F.T. Crowdsourcing 3D cultural heritage: Best practice for mass photogrammetry. J. Cult. Herit. Manag. Sustain. Dev. 2019, 9, 305–318. [Google Scholar] [CrossRef] [Scilit]
  50. Vincent, M.L.; Gutierrez, M.F.; Coughenour, C.; Manuel, V.; Bendicho, L.-M.; Remondino, F.; Fritsch, D. Crowd-sourcing the 3D digital reconstructions of lost cultural heritage. In Proceedings of the 2015 Digital Heritage, Granada, Spain, 28 September–2 October 2015; IEEE: New York, NY, USA, 2015; Volume 1, pp. 171–172. [Google Scholar] [CrossRef] [Scilit]
  51. Cornelis, K.; Verbiest, F.; Van Gool, L. Drift detection and removal for sequential structure from motion algorithms. IEEE Trans. Pattern Anal. Mach. Intell. 2004, 26, 1249–1259. [Google Scholar] [CrossRef] [PubMed]
  52. Lague, D.; Brodu, N.; Leroux, J. Accurate 3D comparison of complex topography with terrestrial laser scanner: Application to the Rangitikei canyon (N-Z). ISPRS J. Photogramm. Remote Sens. 2013, 82, 10–26. [Google Scholar] [CrossRef] [Scilit]
  53. py4dgeo Development Core Team. py4dgeo: Library for Change Analysis in 4D Point Clouds [Computer Software]. 2024. Available online: https://github.com/3dgeo-heidelberg/py4dgeo (accessed on 25 June 2026).
  54. UNESCO. Guidelines for the Preservation of Digital Heritage; UNESCO: Paris, France, 2003; Available online: https://unesdoc.unesco.org/ark:/48223/pf0000130071 (accessed on 25 June 2026).
  55. McAvoy, S.; Ristevski, J.; Rissolo, D.; Kuester, F. OpenHeritage3D: Building an open visual archive for site scale giga-resolution LiDAR and photogrammetry data. ISPRS Ann. Photogramm. Remote Sens. Spat. Inf. Sci. 2023, X-M-1-2023, 215–222. [Google Scholar] [CrossRef] [Scilit]
  56. DataCite. DataCite Metadata Schema 4.4. 2021. Available online: https://schema.datacite.org (accessed on 25 June 2026).
  57. Three.js Authors. Three.js, Version r126. 2020. Available online: https://github.com/mrdoob/three.js (accessed on 25 June 2026).
  58. Krishnan, S.; Crosby, C.J.; Nandigam, V.; Phan, M.; Cowart, C.; Baru, C.; Arrowsmith, R.J. OpenTopography: A services oriented architecture for community access to LIDAR topography. In Proceedings of the 2nd International Conference on Computing for Geospatial Research & Applications, Washington, DC, USA, 23–25 May 2011. [Google Scholar] [CrossRef] [Scilit]
  59. Cesium. CesiumJS. 2024. Available online: https://cesium.com/platform/cesiumjs/ (accessed on 25 June 2026).
  60. McAvoy, S.; Pérez Rivas, M.E.; Gallegos Flores, J.M.; Dorshow, W.; Stanton, T.; Cortés Arreola, C.; Rissolo, D.; Meacham, S.; Fortin, J.; Osorio León, J.F.J.; et al. Towards a Mexican National Archaeological Atlas: Scalable 3D Web GIS and archival systems for big data. Int. Arch. Photogramm. Remote Sens. Spat. Inf. Sci. 2025, XLVIII-M-9-2025, 1005–1011. [Google Scholar] [CrossRef] [Scilit]
  61. Agisoft LLC. Agisoft Metashape User Manual: Professional Edition, Version 2.2; Agisoft LLC: St. Petersburg, Russia, 2024; Available online: https://www.agisoft.com/pdf/metashape-pro_2_2_en.pdf (accessed on 31 May 2026).
  62. Alshawabkeh, Y.; Baik, A. Integration of photogrammetry and laser scanning for enhancing scan-to-HBIM modeling of Al Ula heritage site. Herit. Sci. 2023, 11, 147. [Google Scholar] [CrossRef] [Scilit]
  63. Oprea, R.-L.; Badea, A.C.; Badea, G. Multi-Source 3D Documentation for Preserving Cultural Heritage. Appl. Sci. 2026, 16, 1834. [Google Scholar] [CrossRef] [Scilit]
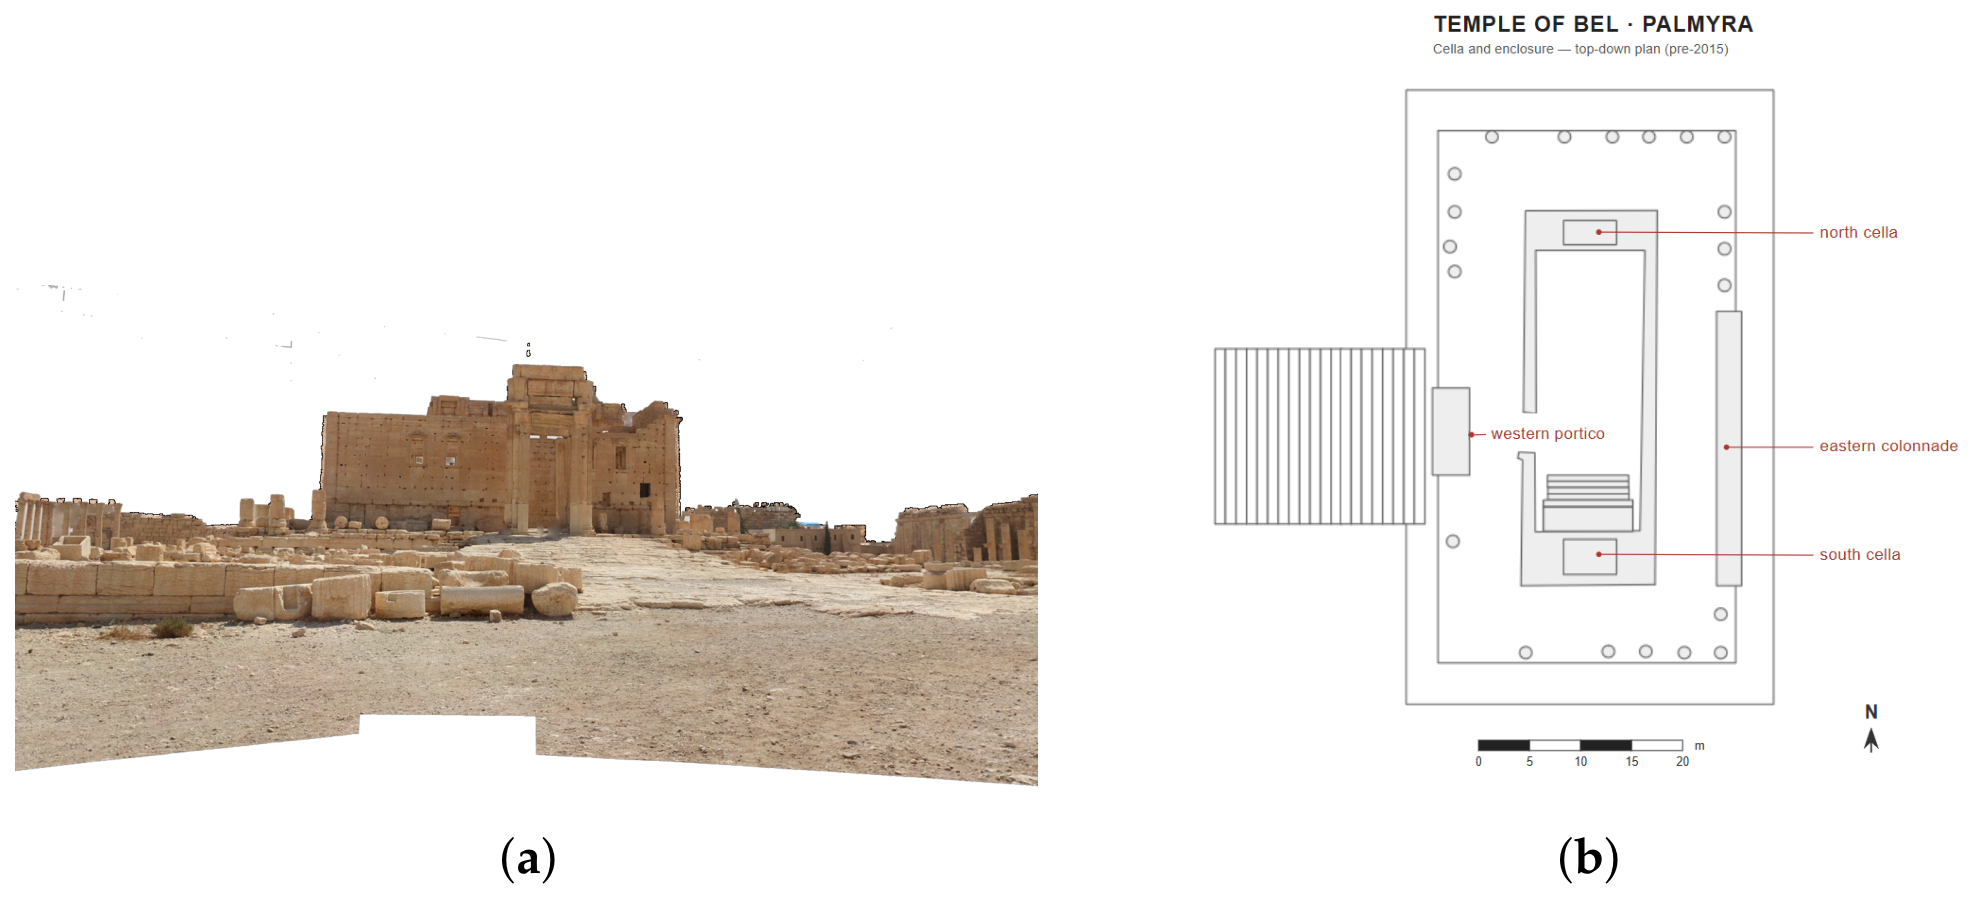
Figure 1. Temple of Bel, western view (a) and basic floorplan (b). In (b), open circles mark the columns of the peristyle surrounding the cella, and rectangles mark the built masses referenced in the text: the two labelled boxes inside the cella are the north and south adyta, the box on the west flank is the western portico, and the elongated box to the east is the eastern colonnade. North is at the top; the bar scale is in metres.
Remotesensing 18 03038 g001
Figure 2. Three-phase reconstruction workflow for the Temple of Bel; italic text under each process indicates the software used, and the TLS pose-recovery sub-pipeline is detailed in Section 3.3.
Remotesensing 18 03038 g002
Figure 3. The Fangi panoramic network in plan view. Tie points of the pano-only alignment are colored by the number of frames observing them (color bar, lower left: red = 2, the triangulation minimum, to blue = 100+); the scale reports redundancy, not accuracy. The 18 stations appear as dense dark-blue rosettes of near-coincident cameras, 13 around the temenos and 5 within the cella.
Remotesensing 18 03038 g003
Figure 4. (a) Fangi panorama depicting western side of temple and (b) resulting 3D reconstruction.
Remotesensing 18 03038 g004
Figure 5. Saito TLS: (a) western view of the temple colored by intensity; (b) scan positions and Register360 registration report. In (b), each green square marks a recovered scanner station and the radiating green lines are the inter-scan links entering the bundle adjustment; the small red markers indicate the stations whose links carry the largest residuals in the bundle report. The underlying grey point cloud is the registered temple, viewed from above.
Remotesensing 18 03038 g005
Figure 6. Bel tourist photo reconstruction of northern cella (a) and horizontal cross-section showing misalignment on walls, with the photo reconstruction in blue, offset from the Saito TLS in red (b).
Remotesensing 18 03038 g006
Figure 7. Workflow for TLS scanner pose recovery and registration applied to the Saito dataset (Appendix B). Stage 1: an initial position estimate p 0 is obtained visually from the characteristic occlusion shadow under each scanner station in the Potree viewer. Stage 2: the position is refined by iterative maximization of the composite visibility score S ( p ) combining occlusion fraction, angular entropy, and a soft height prior; the dashed arrow indicates the Nelder–Mead inner loop, which typically converges in 150–300 iterations. The implementation is released as the e57repose package (Appendix D). Stage 3: refined poses are written to E57 and the scans undergo final point-pair registration in Leica Register360 before passing to the hierarchical alignment of Section 3.4.
Remotesensing 18 03038 g007
Figure 8. The OpenHeritage3D web viewer for the Temple of Bel: the hierarchical zone menu (right), the composited reconstruction in the main view, and the embedded panoramic stations and per-point deviation query.
Remotesensing 18 03038 g008
Figure 9. Resulting composite reconstruction, colored by source: the S 5 exterior (red), the S 4 interior (blue), and the colorized-TLS S 1 exterior used on the eastern colonnade wall (green). (a) Top view, oriented north; (b) isometric view from the southwest; (c) isometric view from the northeast; (d) eastern view, showing the clear seam between datasets.
Remotesensing 18 03038 g009
Figure 10. Internal reprojection error does not predict geometric accuracy. Median reprojection error (internal self-consistency) is plotted against median M3C2 deviation from the reference TLS (external accuracy) across stages S 2 S 5 . On the exterior (left), the panorama stage S 2 carries the highest reprojection of any stage yet the surface closest to the laser among image-bearing stages, while the uncalibrated stage S 4 records the lowest reprojection but a less accurate surface; on the interior (right), reprojection and deviation rise together. Reprojection values are from Table 3, deviations from Table 4.
Remotesensing 18 03038 g010
Figure 11. The northern cella facade is a smooth surface in S 4 (a) but is disrupted by the introduction of metadata-deficient images in S 5 (b), which causes single-pixel-level spiking.
Remotesensing 18 03038 g011
Figure 12. Exterior surface deformation and pitting in S 3 where depth information is unresolved; subsequent stages reduce but do not eliminate it.
Remotesensing 18 03038 g012
Figure 13. Texture detail and geometric certainty move in opposite directions across the fusion cascade. As each cohort is added ( S 1 S 5 ), the optimal texel size falls (finer texture) while the median M3C2 deviation from the reference TLS S 0 departs from the laser-only floor (worse geometry), for both the exterior (left) and interior (right) components. On the exterior the deviation crosses the detection limit (LOD95) between S 2 and S 3 ; on the interior every stage median remains below LOD95. Values are taken from Table 4.
Remotesensing 18 03038 g013
Table 1. Primary datasets employed in this reconstruction.
Data TypeAuthorDateDOI
Terrestrial Laser ScanningDr. Kiyohide Saito201010.34946/D6CP4M
Panoramic ImagesDr. Gabriele Fangi201010.34946/D6HC7W
Tourist PhotosVarious (#NewPalmyra)1974–201410.26301/zjnn-wx58
Table 4. Geometric agreement of each reconstructed surface with the raw reference TLS S 0 , by M3C2, and optimal texel size. Distances are normalized by the S 1 floor (×Floor); significance is the surface fraction exceeding the per-point LOD95, with the registration-error term set to the S 1 floor.
StageMedian |d| (mm)×Floorp95 (mm)LOD95 (mm)Signif. (%)Opt. Texel (mm)
Exterior (floor = 6.1  mm)
S 1 Colorized TLS6.11.019825.011.433.0
S 2 +Panoramas11.61.921124.321.425.4
S 3 +Photos (known)39.16.470624.650.515.4
S 4 +Photos (uncalib.)27.64.567222.252.114.4
S 5 +Photos (no EXIF)26.64.467322.452.314.0
Interior (floor = 0.3  mm)
S 1 Colorized TLS0.31.04.76.50.57.05
S 2 +Panoramas0.51.712.76.57.46.86
S 3 +Photos (known)0.93.027.56.618.94.13
S 4 +Photos (uncalib.)1.75.773.46.619.33.86
S 5 +Photos (no EXIF)2.37.762.06.625.63.69
Table 5. Recommended reconstruction stage by application, following the detail-versus-certainty trade.
ApplicationPrivilegesRecommended Stage
Conservation, restoration, metrologyGeometric certainty S 0 / S 1 , S 2
Geometry-based research (form, proportion, deformation)Geometric certainty S 1 / S 2
Surface/iconographic researchTexture detail (geometry caveat)Photo-augmented stages
Storytelling, dissemination, virtual realityVisual richness S 5
Disclaimer/Publisher’s Note: The statements, opinions and data contained in all publications are solely those of the individual author(s) and contributor(s) and not of MDPI and/or the editor(s). MDPI and/or the editor(s) disclaim responsibility for any injury to people or property resulting from any ideas, methods, instructions or products referred to in the content.