Article

FIRE-BYOL: A Real-Time Grassland Active-Fire Detection Algorithm Fusing VIIRS Fire Products and Himawari-8/9 Data


1
Science College, Inner Mongolia University of Technology, Hohhot 010051, China
2
Institute of Grassland Research, Chinese Academy of Agricultural Sciences, Hohhot 010022, China
3
Arshan Forest and Grassland Disaster Prevention and Mitigation Field Scientific Observation and Research Station of Inner Mongolia Autonomous Region, Arshan 137400, China
4
School of Artificial Intelligence, Inner Mongolia Normal University, Hohhot 010022, China
5
Laboratory of Geoinformatics (GEO-iLAB), Graduate School, National University of Mongolia, Ulaanbaatar 14200, Mongolia
6
Department of Geography, School of Arts and Sciences, National University of Mongolia, Ulaanbaatar 14200, Mongolia
7
Baikal Institute of Nature Management, Siberian Branch of the Russian Academy of Sciences, Ulan-Ude 670047, Russia
*
Author to whom correspondence should be addressed.
Remote Sens. 2026, 18(15), 2553; https://doi.org/10.3390/rs18152553
Submission received: 20 April 2026 / Revised: 1 July 2026 / Accepted: 1 August 2026 / Published: 3 August 2026

Highlights

What are the main findings?
  • We developed FIRE-BYOL, combining BYOL self-supervised pre-training on 1 million unlabeled patches with supervised fine-tuning on limited VIIRS labels. The framework achieved F1 scores of 0.8746 (daytime) and 0.9764 (night-time), outperforming several baseline models and the JAXA WLF product in both early-stage detection and full-event tracking.
  • Feature importance analysis integrating SE attention weights and SHAP values demonstrated that the model relies predominantly on thermal infrared bands with distinct day–night patterns, providing physically interpretable explanations for the fire detection mechanism.
What are the implications of the main findings?
  • The proposed framework enables near-real-time grassland active-fire detection at 10 min temporal and 2 km spatial resolution with minimal labeled data, offering a practical solution for high-frequency fire monitoring on the Mongolian Plateau and similar regions.
  • Our ablation studies validated that the noise injection module, channel dropping module, and SE mechanism each contribute to pre-training quality. Our data efficiency analysis further demonstrated that pre-training consistently improves performance across all data scales, reducing label dependency for small-sample fire detection scenarios.

Abstract

Frequent grassland fires on the Mongolian Plateau endanger the regional environment, human safety, and property, creating a demand for near-real-time active-fire detection with high spatiotemporal resolution. While remote sensing serves as the primary detection method, current fire products struggle to balance high temporal and spatial resolutions for immediate monitoring. Furthermore, although deep learning models may sometimes outperform traditional threshold-based algorithms in generalization, their heavy reliance on extensive, manually annotated datasets severely restricts their application in small-sample, data-scarce scenarios. To address the dual challenges of near-real-time detection and limited sample availability, this study proposes FIRE-BYOL, an active-fire detection framework integrating BYOL self-supervised learning with supervised fine-tuning. Leveraging high-frequency multispectral AHI data from Himawari-8/9 as the primary input, the framework effectively trains on a small sample of high-confidence labels generated from VIIRS fire products. Robust feature extraction is achieved through self-supervised pre-training on large volumes of unlabeled data to mitigate label dependency, followed by supervised fine-tuning for precise active-fire classification. Our experimental results demonstrate that FIRE-BYOL excels under small-sample conditions, achieving F1 scores of 0.8746 during the day and 0.9764 at night. Outperforming Random Forest, XGBoost, FireCNN, and the WLF product, the model exhibits exceptional near-real-time monitoring capabilities for early-stage and entire fire events. By delivering accurate detection at a 10 min temporal and 2 km spatial resolution, FIRE-BYOL offers a highly effective, data-efficient technical solution for high-frequency regional fire monitoring on the Mongolian Plateau and similar environments.

1. Introduction

Among the natural disturbances in the grassland ecosystems of the Mongolian Plateau, grassland fires rank among the most destructive. Approximately 57% of the burned area occurs in spring [1]. Under the combined effects of strong winds and low precipitation, they can easily escalate into large-scale fires. Statistics from 2001 to 2021 indicate that an average of 1 × 10 4 wildfires occur annually on the Mongolian Plateau, and an average of 1.3 × 10 4 km2 of vegetation is burned, with clear peak years. For example, the burned area reached 2.7 × 10 4 km2 in 2003, doubling the annual average. Frequent fires restrict the accumulation of biomass and soil organic matter, while their emissions significantly elevate atmospheric aerosol concentrations and human mortality rates [2,3]. Accordingly, developing grassland active-fire detection techniques with high temporal and spatial resolutions is critical.
In recent years, remote sensing has emerged as a core data source for wildfire detection, providing continuous time series and broad spatial coverage [4]. MODIS active-fire products have been widely utilized since 2000 at a 1 km resolution. VIIRS, designed as its successor, offers 375 m high-resolution bands for enhanced spatial detail and includes a Day–Night Band (DNB) that, when combined with infrared channels, improves sensitivity to nocturnal fire detection for smaller, cooler fires [5,6]. However, both MODIS and VIIRS exhibit relatively low observation frequencies, which limit their ability to monitor small- and medium-scale fires and to provide continuous information regarding active-fire burning conditions [7]. By contrast, the Himawari-8/9 geostationary satellites provide a spatial resolution of 2 km and a temporal resolution of 10 min [8]. On this platform, the Wild Fire (WLF) product from JAXA (Japan Aerospace Exploration Agency) provides near-real-time data. However, its threshold-based detections often differ from those of MODIS products, necessitating further evaluation [9]. Consequently, developing a more precise active-fire detection algorithm using Himawari-8/9 spectral data can enhance early warning and operational management of grassland fires.
Remote sensing-based approaches for active-fire identification primarily fall into three categories: threshold-driven techniques, machine learning models, and deep learning frameworks [10]. Threshold-based methods identify active-fire pixels by applying thresholds to anomalous brightness temperatures or temperature differences in the mid-infrared or thermal-infrared bands [11,12,13,14]. Early threshold-based methods identified active-fire pixels using anomalous mid-infrared or thermal-infrared brightness temperatures [14]. Subsequently, multiband threshold methods combining thermal-infrared, visible, and near-infrared channels were introduced to improve joint monitoring [12]. Moreover, the generalizability of these methods remains limited in large-scale applications due to their sensitivity to regional and seasonal variations in environmental conditions [15]. By contrast, the contextual approach estimates the background temperature from the statistical characteristics of brightness temperatures from adjacent pixels, thereby adaptively determining the fire detection threshold to minimize false alarm rates [16,17,18,19]. However, most algorithms based on the contextual threshold method often ignore the potential contributions of other spectral bands to active-fire detection [8]. Overall, threshold-based methods are simple to implement and computationally efficient, but they are sensitive to threshold settings, background conditions, and data quality [20]. Therefore, their generalization capability in complex scenarios remains limited.
To overcome the limited generalizability of threshold-based methods in complex scenarios, recent studies on active-fire detection have shifted toward machine learning. Such approaches supersede conventional empirical thresholding by modeling the distinction between burning and non-burning pixels using multiband and multisource characteristics. Research in this area follows two main directions. The first builds active-fire classification models directly from remote sensing features. For instance, Zhang et al. [8] developed random forest models for daytime (RF-D) and night-time (RF-N) conditions using Himawari multispectral features and VIIRS fire products, achieving higher recall than the WLF product in small-fire detection. The second approach improves traditional threshold-based methods by incorporating machine learning classifiers. For example, Maeda and Tonooka [21] improved the contextual threshold-based MODIS thermal anomaly (MOD14) algorithm by removing the potential fire-pixel screening step, optimizing the background-pixel search strategy, and introducing a random forest classifier to replace the traditional threshold-based decision process. Overall, machine learning methods alleviate the limitations of fixed thresholds to some extent. Yet, their performance remains strongly dependent on manually designed features and label quality, and their ability to capture complex spatial contextual features remains limited.
To improve the representation of nonlinear relationships and spatial context in active-fire detection, studies have increasingly adopted deep learning. Deep learning automatically learns spatiotemporal–spectral characteristics derived from remotely sensed data via multilayer networks, reducing reliance on manual feature engineering and improving detection in complex scenarios. For instance, Zheng et al. [7] used a temporal convolutional network (TCN) to model background brightness temperatures; these temporal features were then combined with spatial and spectral data and classified using a random forest (RF) algorithm. Furthermore, deep learning methods have evolved from convolutional neural networks (CNNs) to spatiotemporal models that jointly learn multiple types of features. For example, Hong et al. [20] proposed FireCNN, a multi-scale CNN that effectively extracts active-fire features. Building on this work, Hong et al. [22] proposed the SBT-FireNet framework, which uses a Vision Transformer (ViT) for spatial context, an MLP with GELU activation for spectral features, and a Bi-LSTM network for near-real-time monitoring. To capture complex feature relationships, Xu et al. [23] applied a three-layer ConvLSTM with an Otsu-based dynamic threshold. This approach improved spatiotemporal anomaly detection, outperforming the WLF and NSMC products. Q. Zhang et al. [24] applied a recursive Transformer to active-fire detection. The model jointly captures spatial, spectral, and temporal features. It identifies active-fire pixels via anomalous deviations between actual and predicted values. This approach demonstrated stability in long-duration detection. L. Zhang et al. [25] also proposed an approach for early forest fire detection integrating a long short-term Transformer (LSTT) with multi-kernel attention convolution. This method achieved high-accuracy detection of early-stage forest-fire pixels at 10 min intervals.
Although machine learning and deep learning methods improve generalization, their training still relies heavily on expert manual annotation or field-measured data [9,20,22,24,25]. Sourced from specific fire events, these samples are costly to acquire and in limited supply. To address this, Zhang et al. [8] utilized multi-year VIIRS active-fire data as training labels and incorporated threshold-derived spatial features into the model inputs. However, this method relies on rigid threshold rules to screen out clouds, water bodies, and suspected fire pixels. Removing these pixels during background screening results in the loss of key information and prevents the effective exploitation of local deep features.
To reduce reliance on manual annotations and enhance deep feature representations, recent studies have increasingly explored the integration of self-supervised learning with advanced network architectures for active-fire detection. For instance, LaHaye et al. [26] employed a self-supervised machine learning framework to fuse multi-source remote sensing observations, thereby improving the accuracy of active-fire and smoke plume identification. Similarly, Barco et al. [27] introduced a self-supervised approach for analyzing time-series remote sensing data, facilitating automatic feature extraction and near-real-time hotspot detection. Furthermore, Akhyar et al. [28] developed a deep segmentation network that integrates multiscale contextual features with spatial refinement mechanisms, thereby substantially enhancing the robustness of fire segmentation in complex visual environments.
Using VIIRS fire products and Himawari-8/9 satellite data, this study constructs labeled and unlabeled datasets to propose FIRE-BYOL, an active-fire detection method for small-sample conditions. The method employs a Bootstrap Your Own Latent (BYOL) framework that combines ResNet-18 with the SE mechanism for self-supervised training, followed by supervised fine-tuning for grassland active-fire detection on the Mongolian Plateau. To evaluate performance, FIRE-BYOL was compared against random forest (RF), XGBoost, FireCNN, and the WLF product from the Japan Aerospace Exploration Agency (JAXA). Additionally, the overall workflow of FIRE-BYOL, from data construction to model training and active-fire detection, is illustrated in Figure 1.
This research primarily aims to address the shortage of high-quality samples alongside the insufficient extraction of local spatial features in grassland active-fire detection on the Mongolian Plateau. To this end, a method that combines self-supervised training with supervised fine-tuning is adopted to improve active-fire detection under small-sample conditions.

2. Materials and Methods

2.1. Study Area

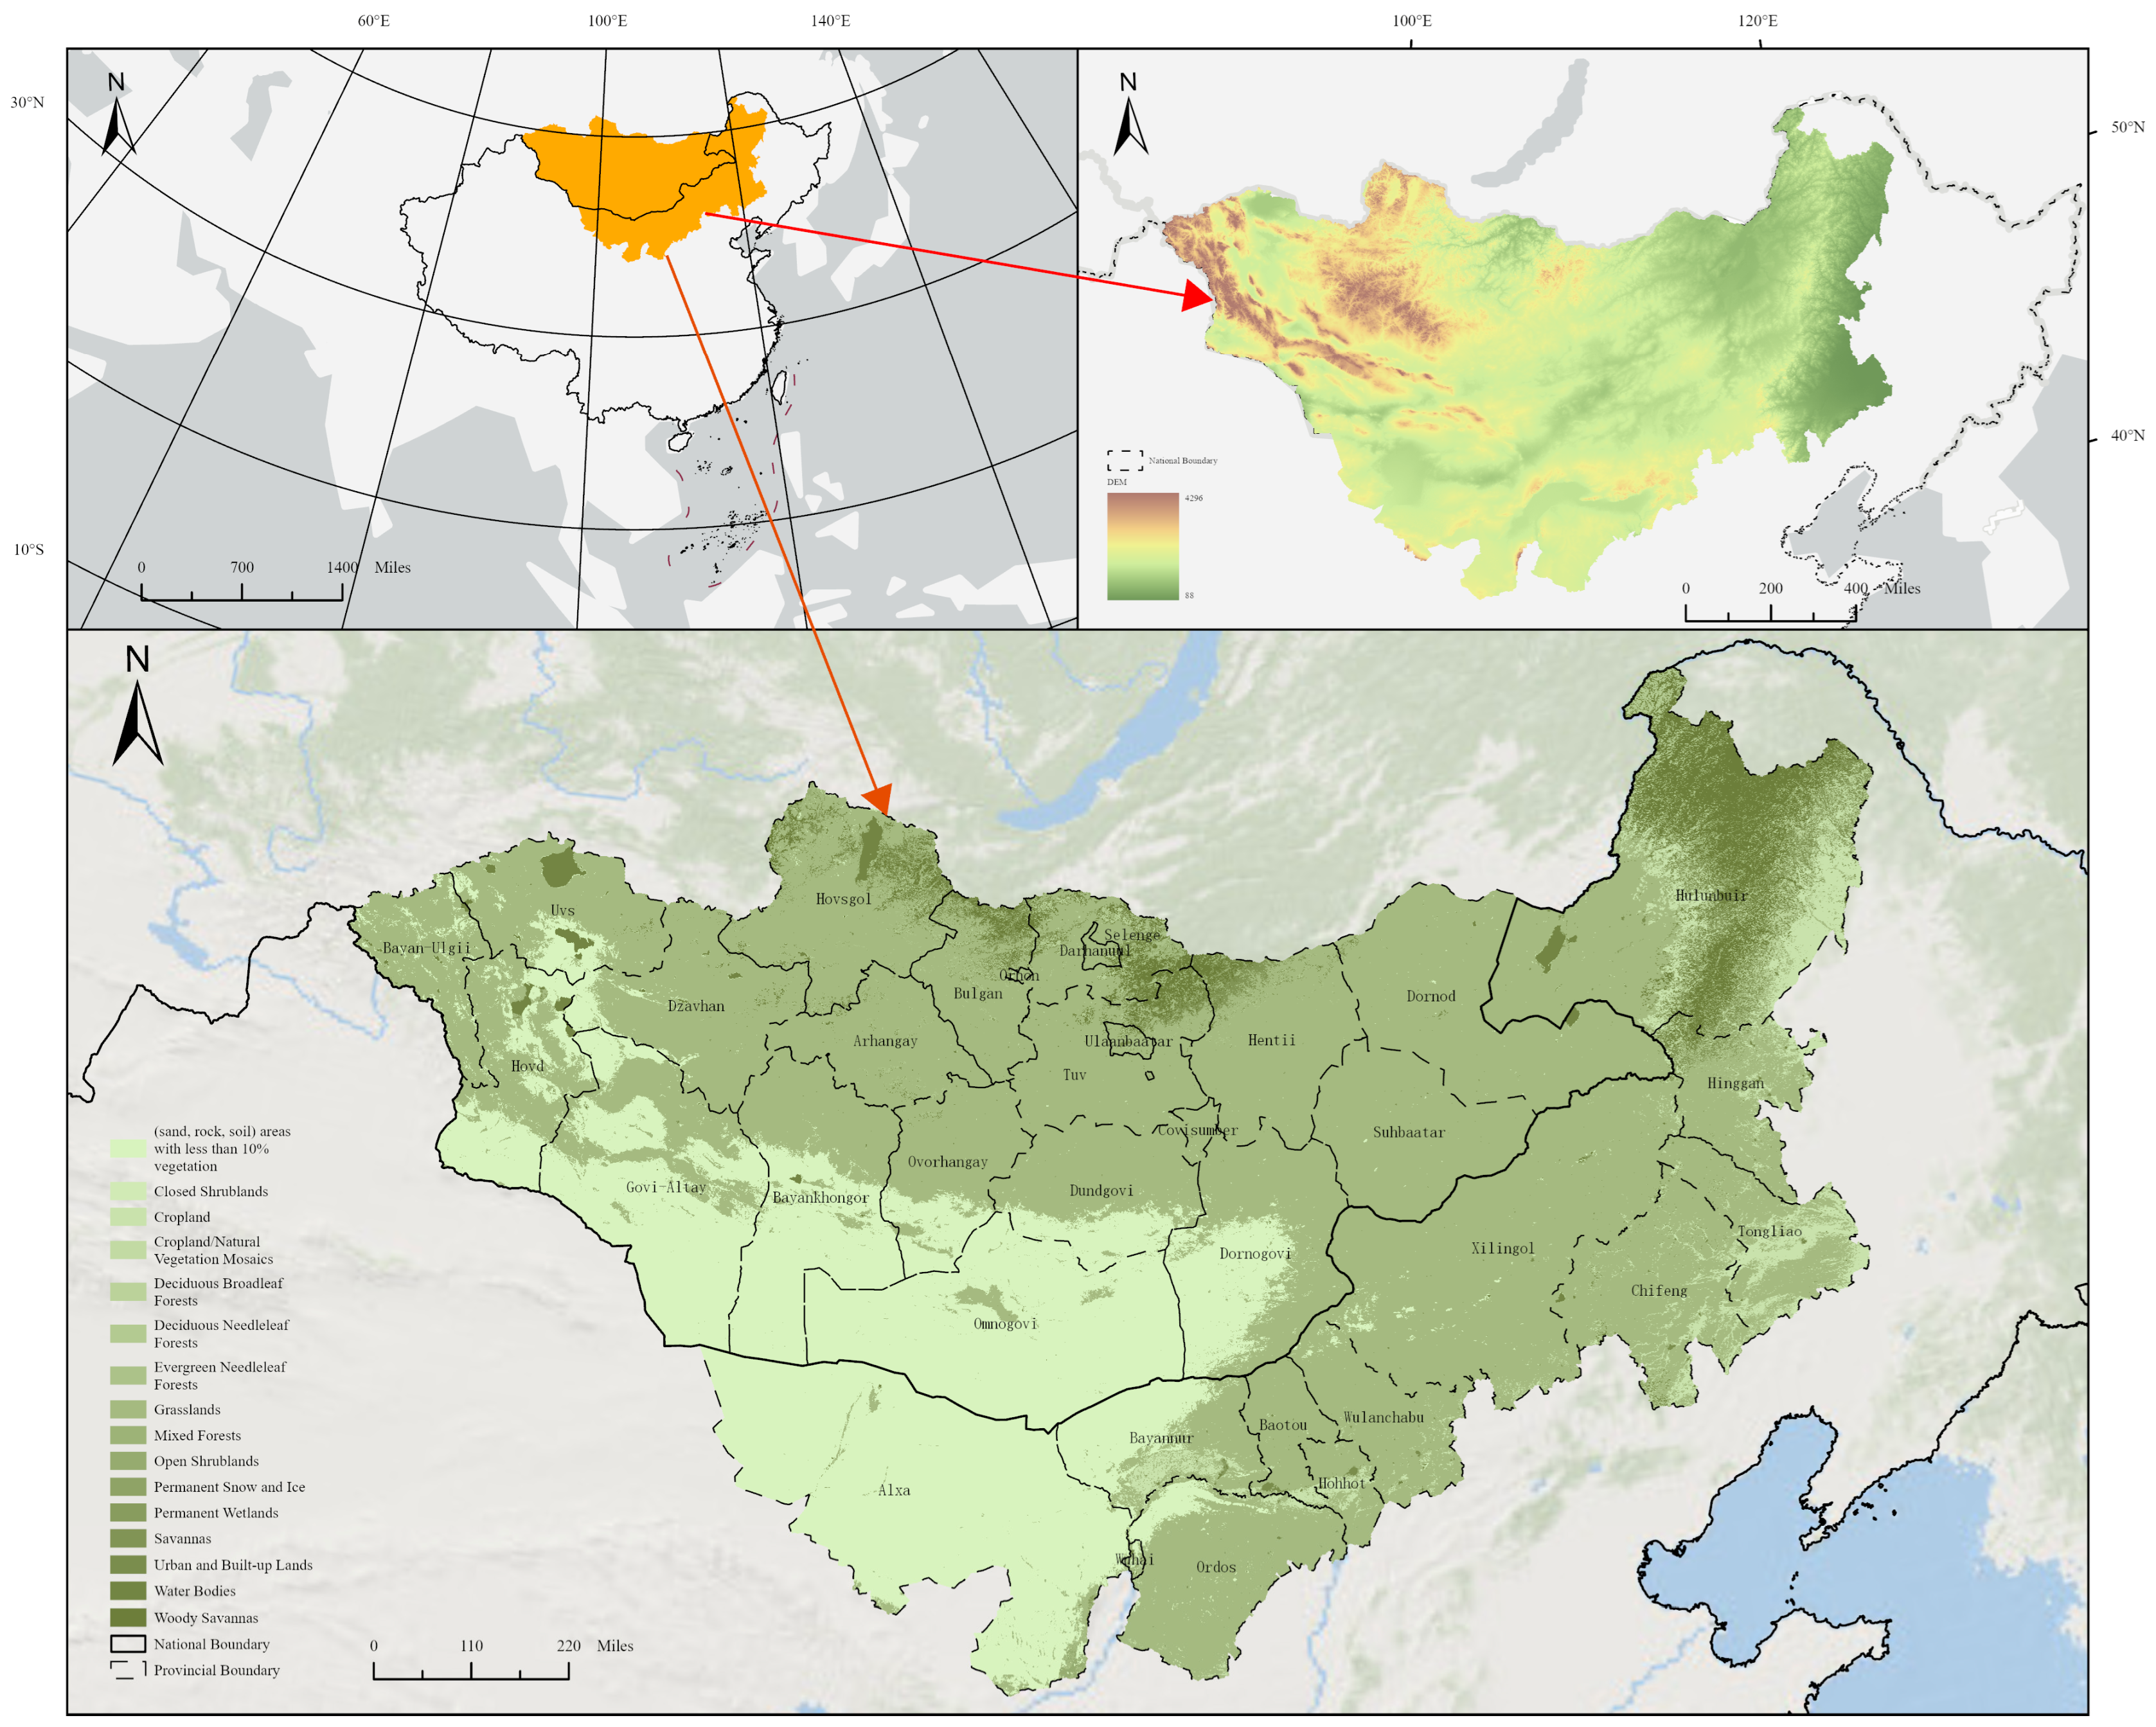
Situated within the Eurasian interior, the study area encompasses all of the Inner Mongolia Autonomous Region of China and Mongolia (Figure 2). The region experiences a typical temperate continental climate dominated by arid and semi-arid conditions, with annual precipitation ranging from 108 to 408 mm exhibiting clear spatial heterogeneity [29]. Grassland is the dominant land-cover type, transitioning along a moisture gradient from desert steppe to typical and meadow steppes, interspersed with forest, barren, and sandy lands [30]. As a vulnerable arid ecosystem, the plateau is increasingly affected by global climate change, with frequent high-temperature and drought events severely exacerbating grassland fire risks. Between 2001 and 2020, 18,138 grassland fires occurred, burning a cumulative area of 20 × 10 4 km2, peaking at 2.13 × 10 4 km2 in 2003 alone [31]. These extensive fires pose a severe threat to regional ecosystems, agricultural production, and human livelihoods.

2.2. Data Sources

This study used three types of data: Himawari-8/9, VIIRS, and WLF products. Among them, Himawari-8/9 data served as the primary input, VIIRS data provided reference labels, and the WLF product acted as a comparative reference.

2.2.1. Himawari-8/9 AHI Data

Operated by the Japan Meteorological Agency (JMA), the Himawari-8/9 geostationary weather satellites are equipped with the Advanced Himawari Imager (AHI). The instrument features sixteen distinct channels: three for visible reflectance, three for near-infrared reflectance, and ten infrared brightness temperature bands. Delivering high temporal resolution, the AHI conducts full-disk imaging at 10-min intervals. This study used full-disk data from JAXA with a spatial resolution of 2 km. These 16 bands over the Mongolian Plateau grassland region served as the primary input dataset.

2.2.2. JAXA WLF Product

Level-2 data from the Wild Fire (WLF) dataset, provided by JAXA (Japan Aerospace Exploration Agency), supported this research. Sourced from Himawari-8/9 AHI imagery, the product maintains 10 min temporal and 2 km spatial resolutions. The WLF product is distributed as point-based CSV files containing the latitude, longitude, and observation attributes of detected fire pixels. For direct comparison with FIRE-BYOL, these point-based detections were matched to the corresponding 2 km Himawari-8/9 grid cells. Based on this processing procedure, WLF data covering several fire events in 2015, 2016, and 2022 were selected to facilitate model comparison.

2.2.3. VIIRS Fire Product

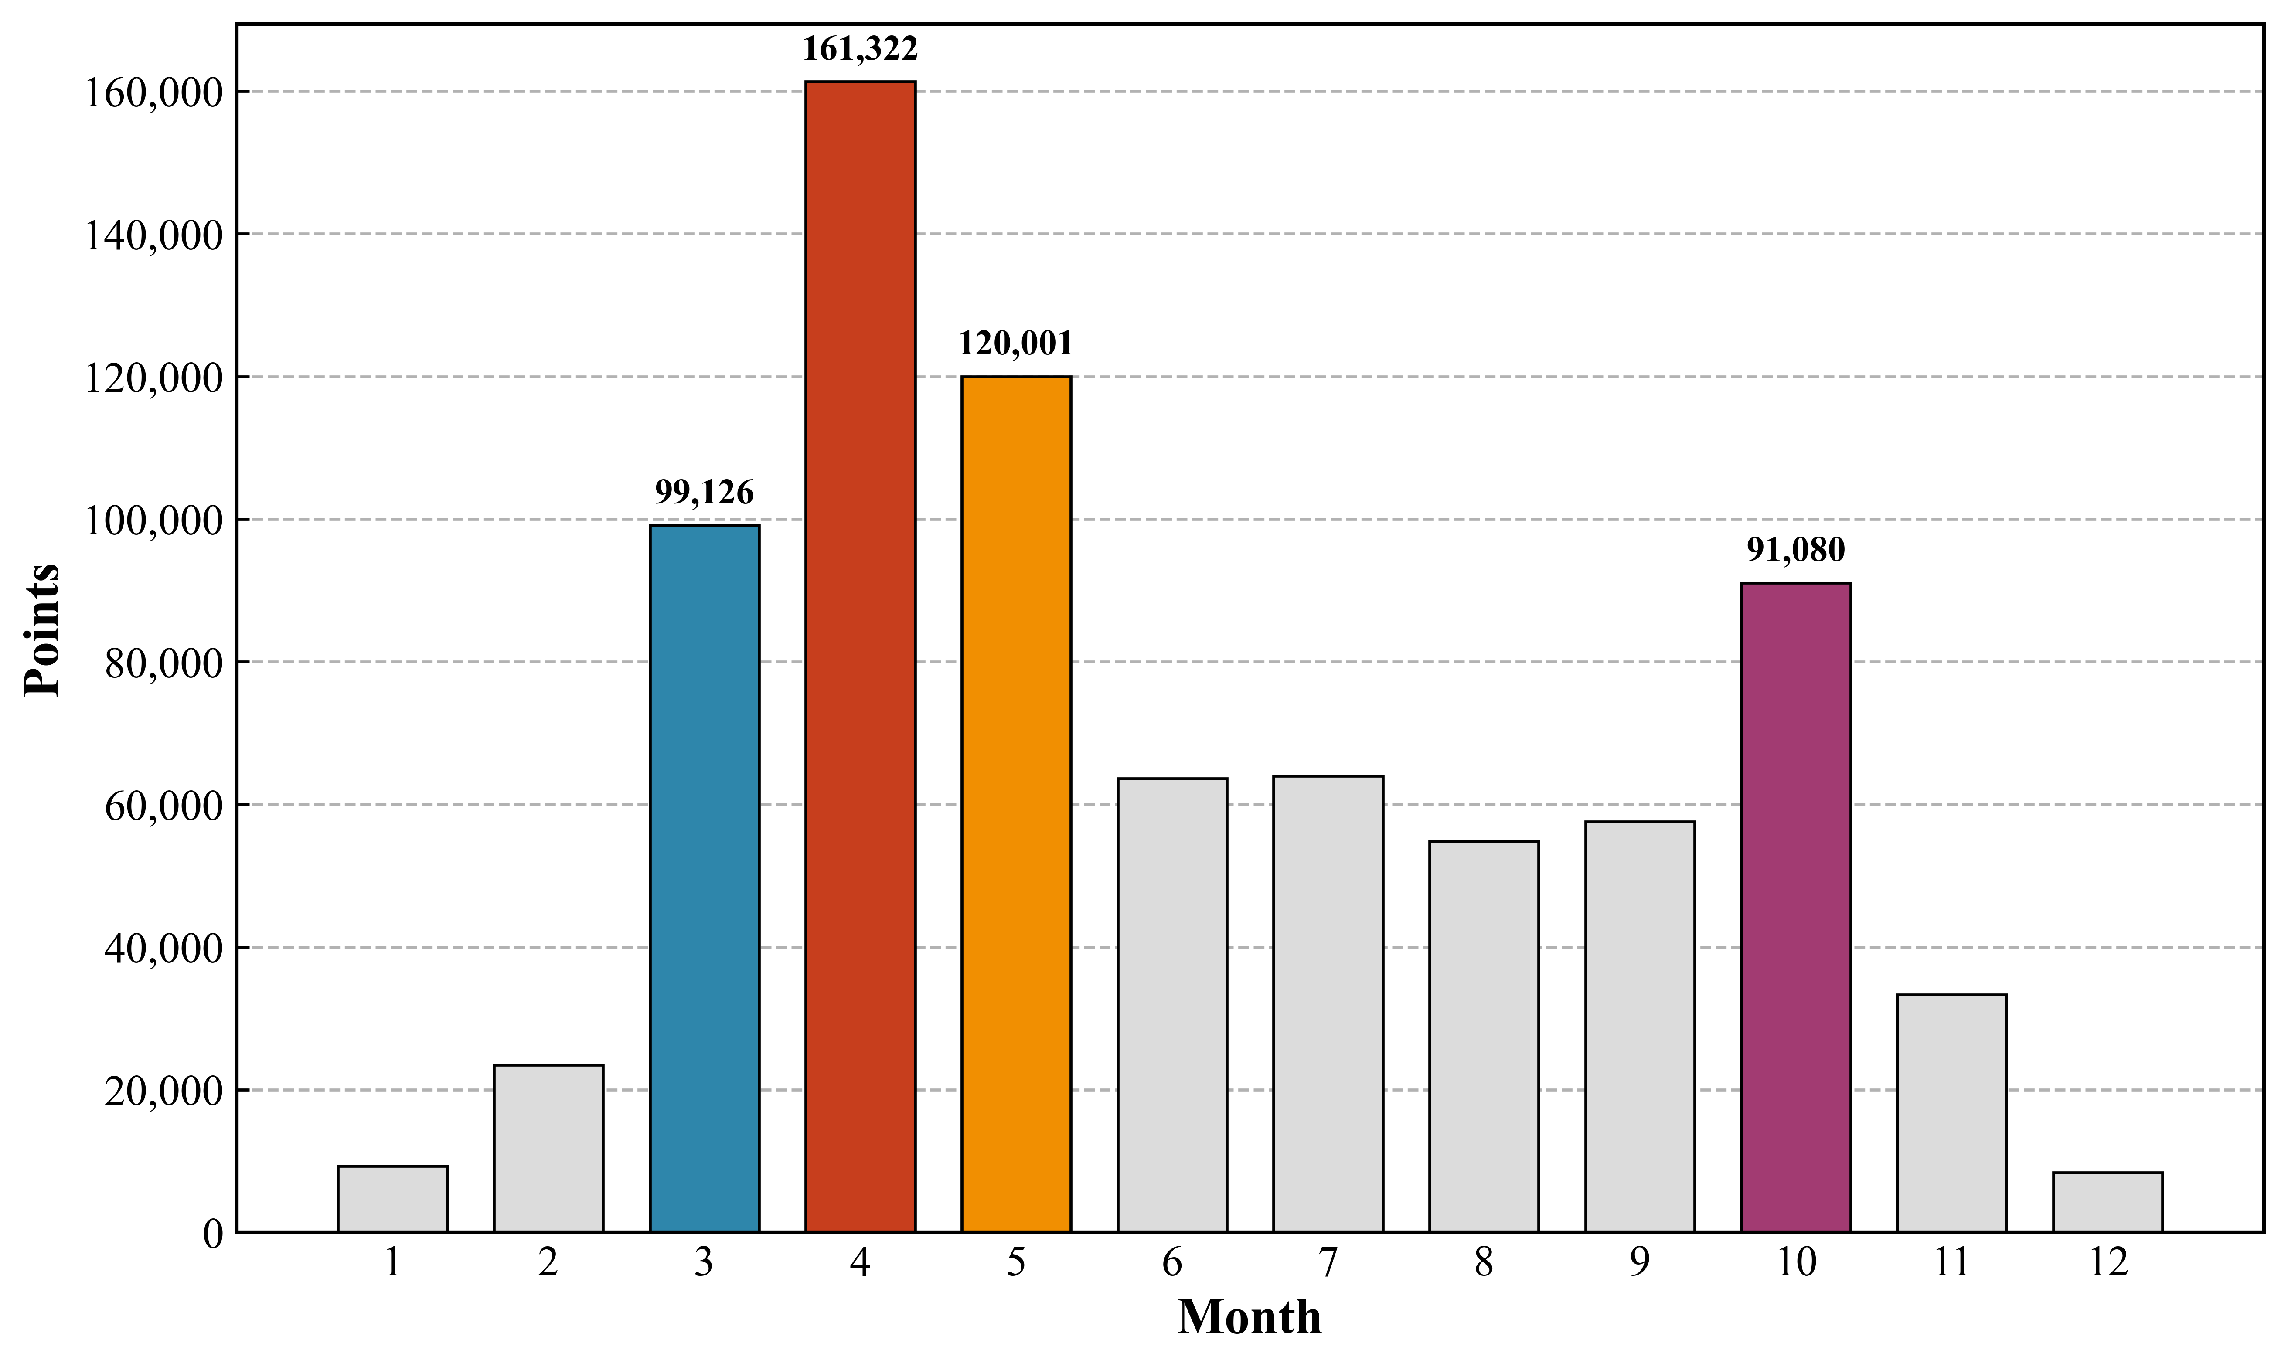
This research incorporated the VIIRS (S-NPP) 375 m fire product provided by FIRMS (Fire Information for Resource Management System), managed by NASA (National Aeronautics and Space Administration). Accessible worldwide within 3 h of observation, these daily active-fire records offer superior performance in detecting small-scale fire pixels compared to MODIS 1 km data. Active-fire data from VIIRS for the Mongolian Plateau grassland region from 2015 to 2025 were selected. To optimize data representativeness and research efficiency, the study focused on active-fire samples from four peak fire months: March, April, May, and October (Figure 3).

2.3. Sample Construction and Data Preprocessing

2.3.1. Labeled Data

To address the spatial resolution difference between 375 m VIIRS data and 2 km Himawari-8/9 AHI data, this study followed the methodology of Zhang et al. [8]. This study applied identical thresholds to spatially cluster the VIIRS active-fire data over the 11 years, thereby constructing the active-fire dataset. Specifically, a 2 km pixel received an active-fire label if it contained more than seven VIIRS active-fire pixels during the daytime (solar zenith angle < 90 ° ) or more than ten at night (solar zenith angle > 90 ° ). After removing samples lacking corresponding band data at the observation time, the final dataset comprised 1807 active-fire samples mapped to a 2 km scale across 466 observation times.
To further improve the quality of the labeled samples, cloud and water masking were required. In active-fire detection, clouds typically have high reflectance and can easily trigger false detections, whereas water bodies are non-flammable. Therefore, cloud and water pixels needed to be excluded. In this study, the method of Xu et al. [32] was adopted to select valid pixels based on thresholds. A pixel was retained without water if it satisfied:
( A 2.3 > 0.05 ) or Night ,
where A 2.3 represents the shortwave infrared reflectance of the Himawari-8/9 Band 6, with a wavelength of 2.3 μ m.
A pixel was retained without cloud if it satisfied:
( A 0.64 + A 0.86 < 1.2 ) and ( T 12.4 > 265 ) and ( ( A 0.64 + A 0.86 < 0.7 ) or ( T 12.4 > 285 ) ) or Night ,
where A 0.64 and A 0.86 denote the visible and near-infrared reflectance for Himawari-8/9 Bands 3 and 4, featuring wavelengths of 0.64 μ m and 0.86 μ m, respectively. Meanwhile, T 12.4 indicates the infrared brightness temperature corresponding to Himawari-8/9 Band 15, which has a wavelength of 12.4 μ m.
After screening, the dataset retained 1694 active-fire pixels across 440 observation times. Table 1 summarizes the pixel counts at selected observations. In the table, Time follows the format year, month, day, hour, and minute (e.g., 202304091750), while Points represents the number of 2 km pixels identified as active fires.
To maintain spatiotemporal consistency between classes, pixels devoid of VIIRS active-fire detections at specific observation times served as reliable non-fire samples. To mirror the temporal distribution of the active-fire dataset, this study performed non-repetitive stratified sampling after excluding cloud and water pixels. Preliminary experiments established an empirical 10:1 sampling ratio to ensure sufficient negative samples given the limited number of positive detections. Ultimately, this study extracted 16 multispectral bands from Himawari-8/9 AHI imagery at the central coordinates of all selected locations. The labeled samples were partitioned chronologically by year, with those from 2015 to 2022 designated as the training set, 2023 as the validation set, and 2024 to 2025 as the test set.

2.3.2. Unlabeled Data

Unlabeled samples were drawn from the observation times that contained labeled samples from 2015 to 2022, thereby preventing data leakage between the pre-training data and the validation and test sets used during fine-tuning. The number of unlabeled samples per observation time was allocated in proportion to each observation’s active-fire pixel count, and from each observation 5 × 5 neighborhood patches were randomly sampled within the investigated region across the Mongolian Plateau, yielding a total of 1 million unique unlabeled samples.
It should be noted that cloud and water masking was not applied during pre-training on the unlabeled data. The purpose of pre-training is to learn general visual representations so that the feature space can produce effective responses even in regions of marginal distribution. If the pre-training data contain only clean samples without clouds or water, the model’s performance may be degraded when it encounters interference, such as smoke, in real-world active-fire detection tasks. In fact, unlabeled data containing clouds and water can be regarded as a natural data augmentation strategy. Such data preserve the inherent noise of real-world observations and compel the model to extract more robust feature representations.

2.3.3. Data Normalization

The multispectral bands of Himawari-8/9 exhibit inconsistent numerical ranges. This disparity can cause larger values to dominate model training. To eliminate this bias, this study applied Z-score normalization independently to each band of the unlabeled data. The formula is expressed as follows:
Z = X μ σ .
In this equation, Z denotes the normalized feature value, X represents the original feature data, μ denotes the mean of this feature across the entire dataset, and σ denotes its standard deviation.
During fine-tuning, the mean and standard deviation of this unlabeled imagery were used to normalize the labeled dataset. This maintained distribution consistency with the pre-training phase and prevented distribution shift.

2.4. ResNet-18-BYOL Self-Supervised Pre-Training Framework

This study proposes a self-supervised pre-training method based on the BYOL framework with an improved ResNet-18 backbone, specifically tailored for active-fire detection.

2.4.1. Data Augmentation

Unlike standard RGB imagery, the 5 × 5 patches in this study exhibit high channel dimensionality within a small spatial footprint. To align with this structure and the BYOL framework, this study tailored a data augmentation strategy for remote sensing-based active-fire detection.
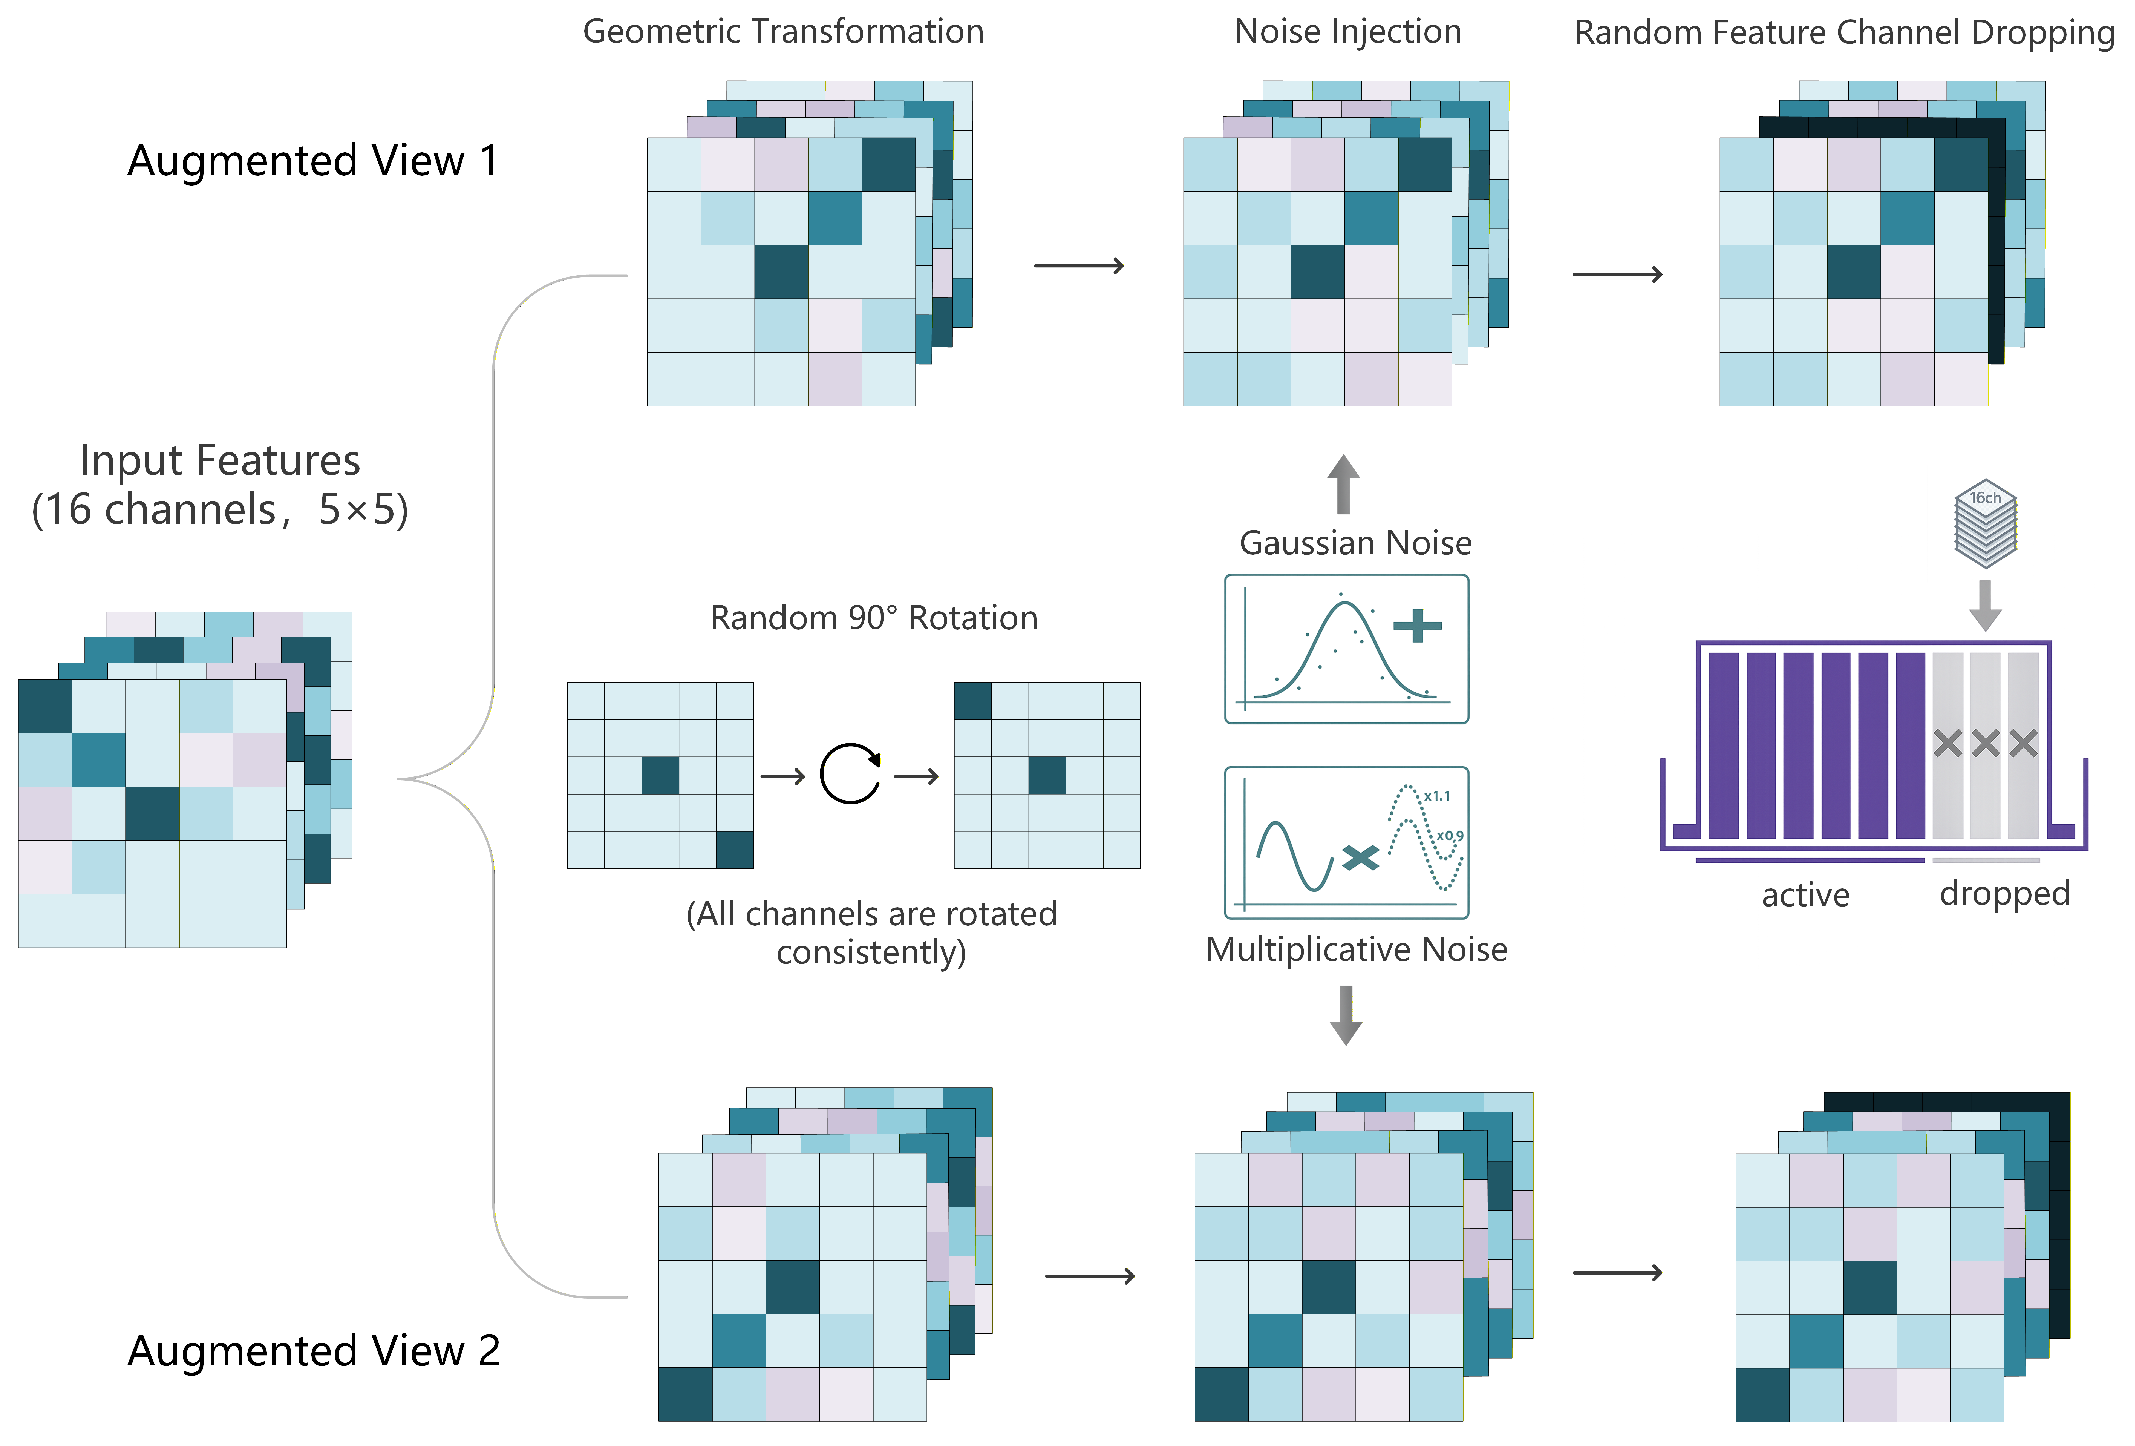
Following the BYOL paradigm, each sample generated two independent augmented views through shared transformation modules. Tailored to the patch structure, three augmentation modules were developed to execute the following operations (Figure 4):
(1) Geometric transformation module: This module includes random 90 ° rotation, horizontal flipping, and vertical flipping. It preserves the positional invariance of the center pixel while changing the spatial configuration of the surrounding environment.
(2) Noise injection module: This module includes two noise types, namely Gaussian noise and multiplicative noise. Specifically, Gaussian noise is added to feature channels to simulate random sensor errors. Multiplicative noise scales the features by a factor to simulate illumination variations and sensor-gain fluctuations.
(3) Feature channel dropping module: This module randomly selects and drops several feature channels by setting their values to zero.

2.4.2. ResNet-18 Network with the SE Mechanism

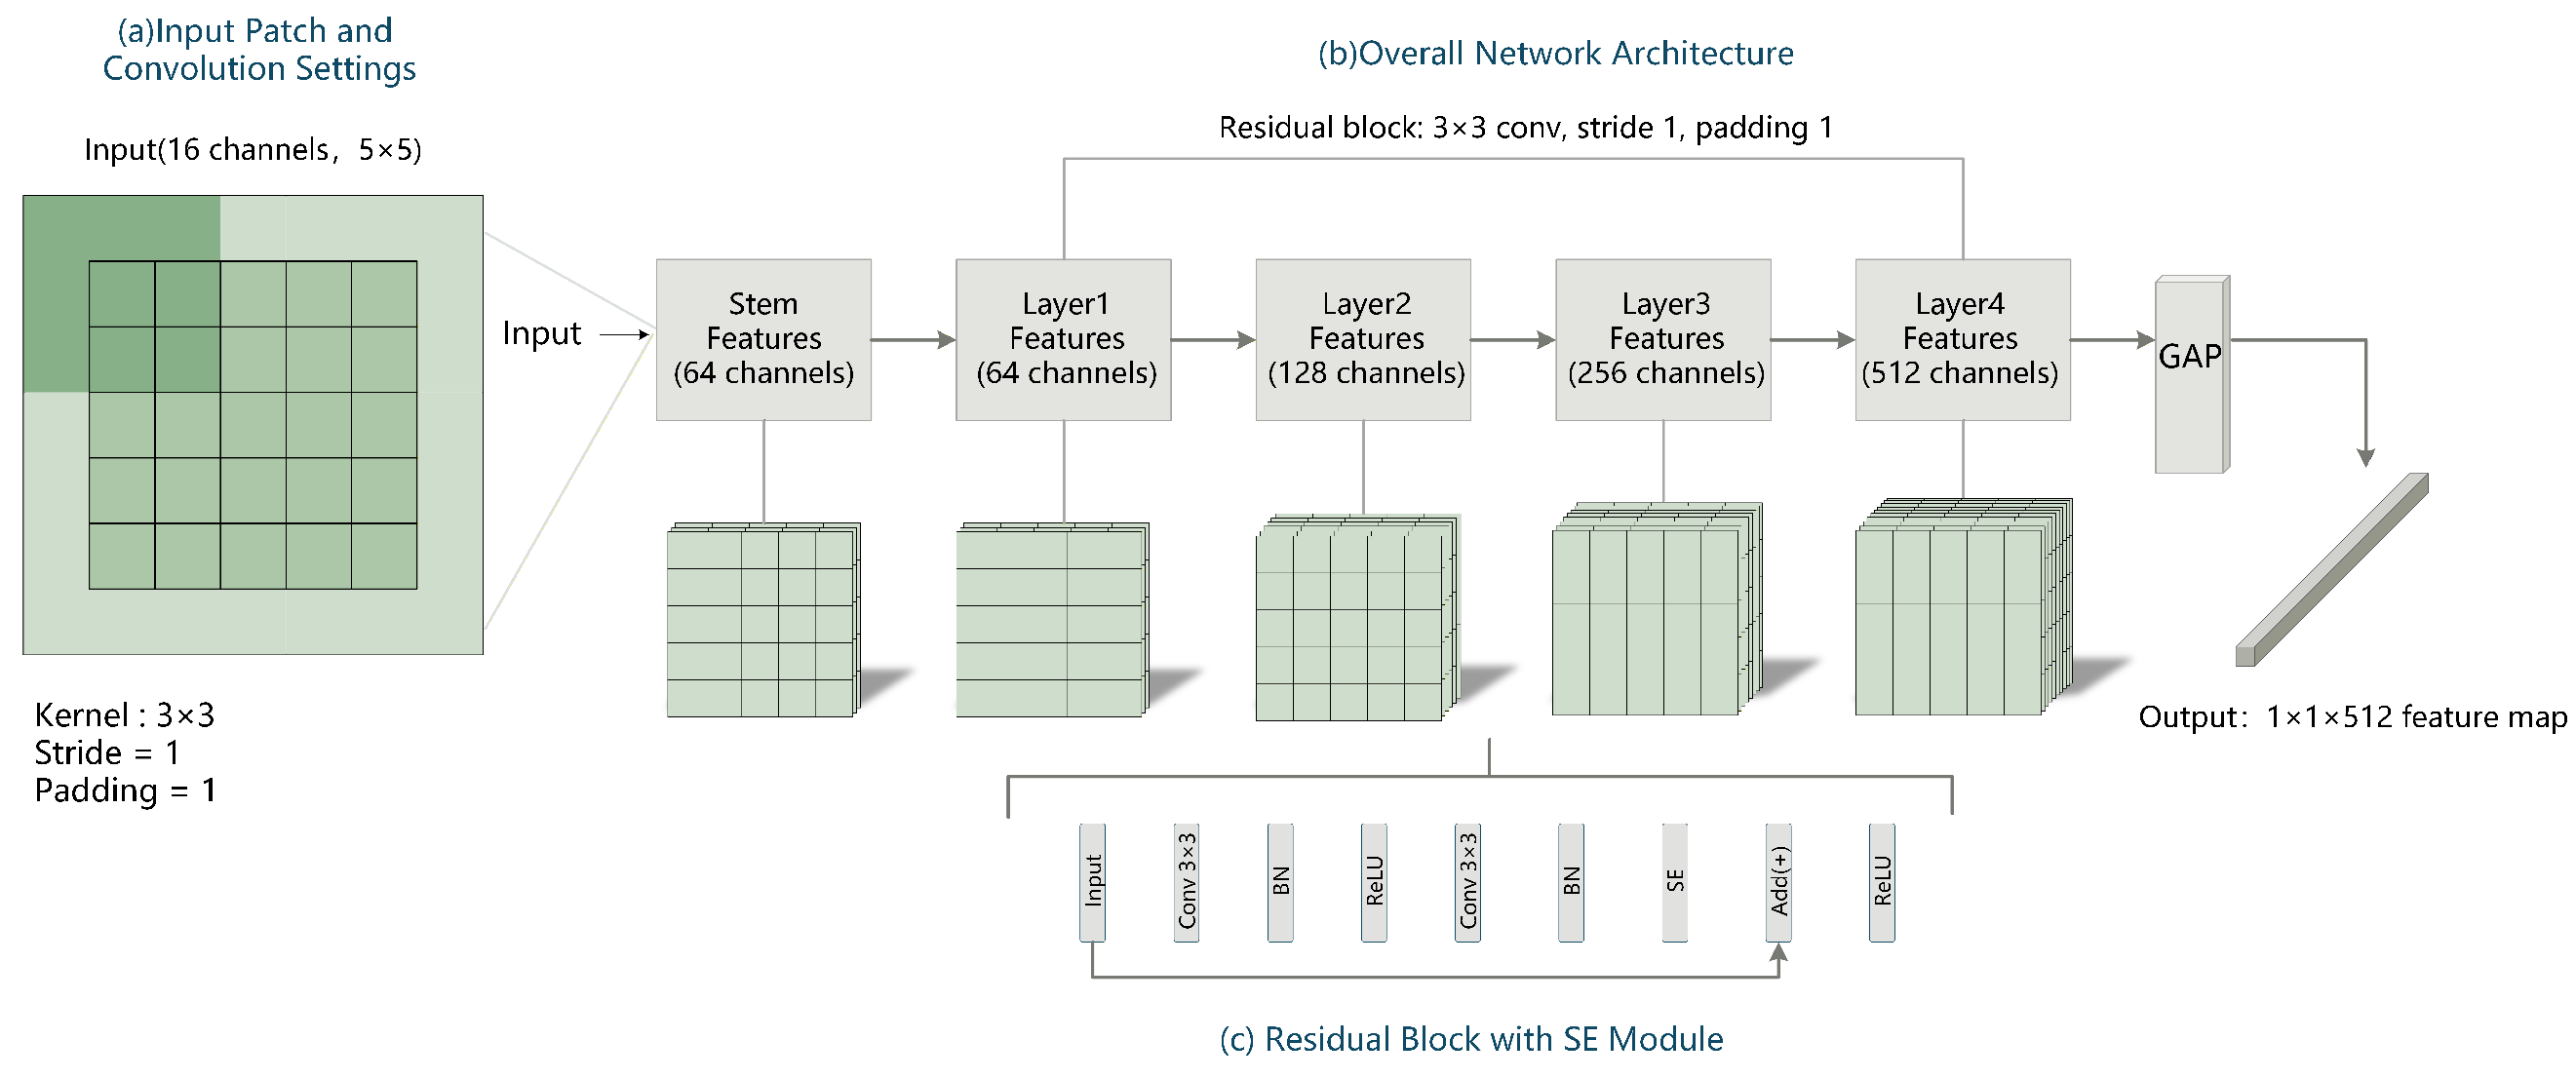
ResNet-18 is a lightweight residual network architecture proposed by He et al. [33]. For the small local patches in this study, it facilitated rapid convergence and gradient stability. Furthermore, the low parameter count of ResNet-18 minimizes computational complexity. This study constructed a ResNet-18 network integrated with the SE mechanism (Figure 5). The architecture comprised the following core components:
(1) Input layer and initial convolution module
The network accepted a 5 × 5 local neighborhood patch with 16 channels, corresponding to distinct Himawari-8/9 bands. The initial convolution layer applied a 3 × 3 kernel with a stride and padding of 1. This configuration maintained the 5 × 5 feature map dimension to preserve the local spatial structure and the position of the center pixel. Simultaneously, this layer mapped the input into a 64-dimensional feature space.
(2) Residual feature extraction module
The network comprised four residual layers, forming a hierarchical feature-extraction structure. Each layer consisted of two basic residual blocks, with the four layers having channel counts of 64, 128, 256, and 512, respectively. Each block contained a pair of 3 × 3 convolutional layers incorporating batch normalization and ReLU activation.
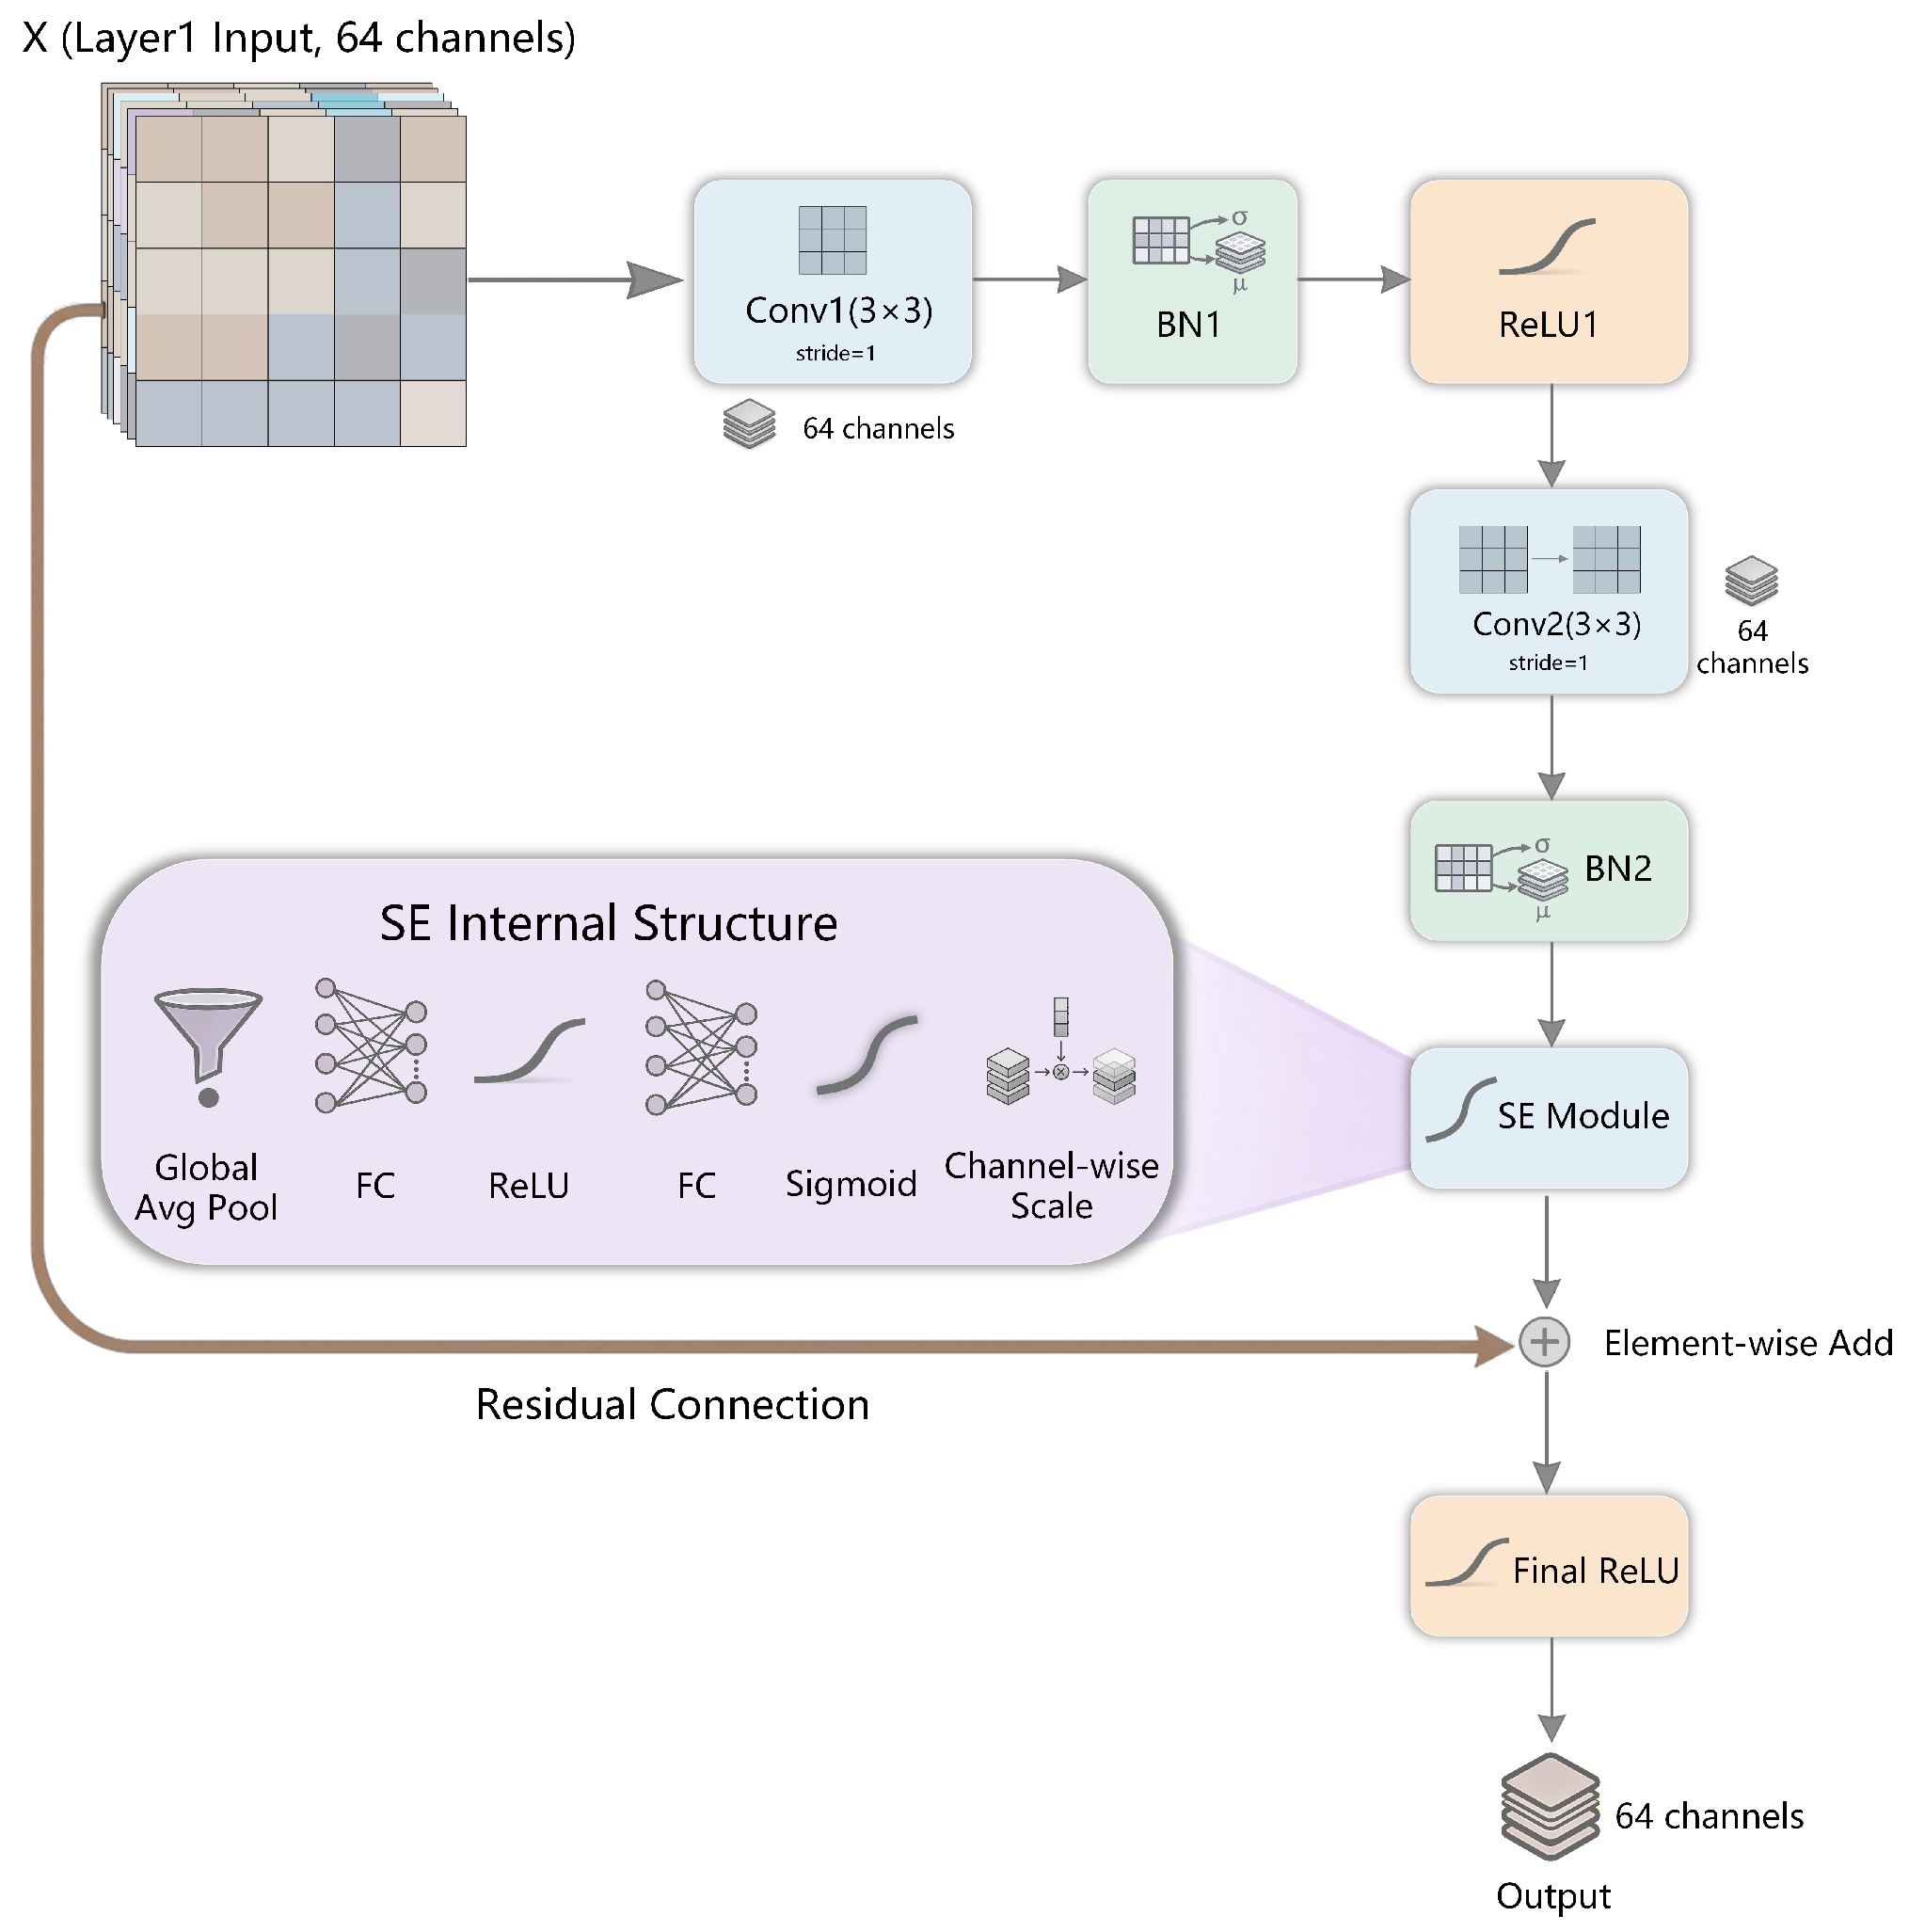
Introduced by Hu et al. [34], the lightweight Squeeze-and-Excitation (SE) module enhances feature representation capability. The network embedded this mechanism between the second batch normalization layer (BN2) and the residual connection within each residual layer. Figure 6 illustrates this configuration for Layer 1, which applied identically to all the other layers.
(3) Feature aggregation and output module
After the residual layers, a global average pooling operation was utilized to compress the feature maps from 5 × 5 to 1 × 1 , yielding a 512-dimensional feature vector. This 512-dimensional feature vector was then directly used to construct the subsequent classifier.

2.4.3. BYOL Self-Supervised Learning Framework

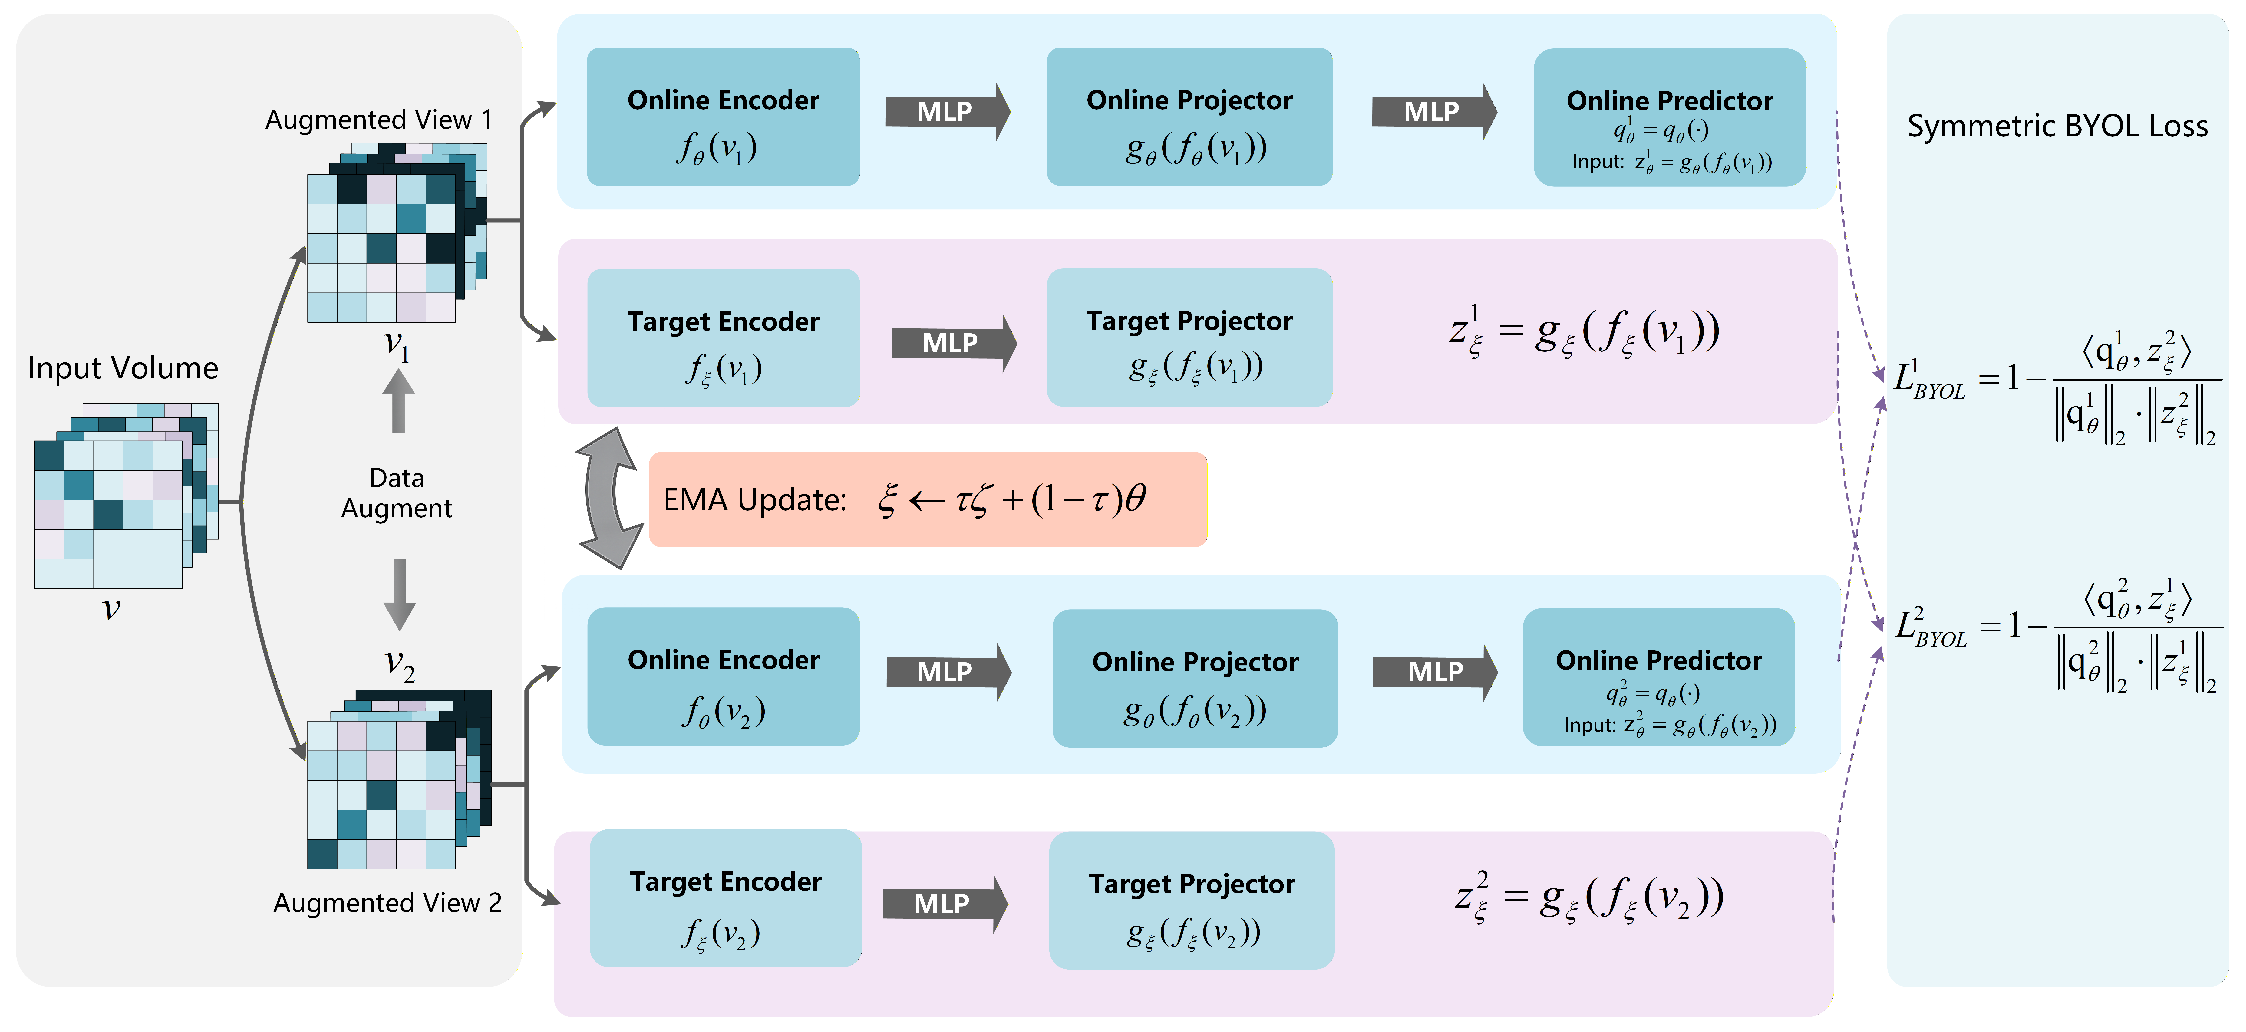
BYOL (Bootstrap Your Own Latent), proposed by Grill et al. [35], operates as a self-supervised learning architecture that does not require explicit negative samples. As shown in Figure 7, its core architecture consists of an online network θ and a target network ξ . Through pre-training on large volumes of unlabeled data, it learns transferable feature representations that provide effective information for downstream tasks.
The online network includes an encoder f θ (designed in Section 2.4.2), a projector g θ , and a predictor q θ . Both the projector and the predictor are multilayer perceptrons equipped with batch normalization and ReLU activation. The target network shares this exact structure but omits the predictor. An exponential moving average (EMA) computed from the weights of the online network is utilized to adjust the target network parameters ξ , employing a decay rate τ :
ξ τ ξ + ( 1 τ ) θ .
During training, data augmentation generates two semantically consistent views, v 1 and v 2 , for each batch sample. The online network outputs predictions q θ 1 = q θ ( g θ ( f θ ( v 1 ) ) ) and q θ 2 = q θ ( g θ ( f θ ( v 2 ) ) ) , while the target network outputs projections z ξ 1 = g ξ ( f ξ ( v 1 ) ) and z ξ 2 = g ξ ( f ξ ( v 2 ) ) .
BYOL optimizes the model using a symmetric loss that fully exploits the bidirectional constraint between the two augmented views. For the view pair ( v 1 , v 2 ) , the normalized negative cosine similarity loss is calculated as follows, where · , · denotes the inner product and · 2 denotes the L2 norm:
L BYOL 1 = 1 q θ 1 , z ξ 2 q θ 1 2 · z ξ 2 2 = 1 q θ 1 ¯ , z ξ 2 ¯ .
Similarly, for the view pair ( v 2 , v 1 ) , the normalized negative cosine similarity loss is:
L BYOL 2 = 1 q θ 2 , z ξ 1 q θ 2 2 · z ξ 1 2 = 1 q θ 2 ¯ , z ξ 1 ¯ .
Finally, to maintain consistent gradient magnitudes with the mean squared error formulation, the BYOL optimization objective combines and scales these two symmetric losses. By minimizing this objective, the model achieves feature alignment between the two augmented views:
L = 2 L BYOL 1 + L BYOL 2 .

2.4.4. Learning Rate Scheduling Strategy

This study employed stochastic gradient descent (SGD) to optimize the BYOL pre-training. To balance training stability and convergence accuracy, the study implemented a staged learning-rate schedule comprising linear warm-up and cosine annealing.
Initially, a linear warm-up mitigated unstable gradients caused by random parameter initialization. This phase linearly increased the learning rate from the initial value to a preset base rate. Subsequently, the schedule transitioned to cosine annealing. This mechanism smoothly decayed the learning rate to guide optimization toward flatter local minima on the loss surface. The dynamic adjustment formula is as follows:
η t = 1 2 η base 1 + cos π · t T ,
where η base denotes the base learning rate, t is the current training step, and T is the total number of training steps.

2.5. Supervised Fine-Tuning Model Based on BYOL Pre-Trained Features

Following pre-training, the BYOL projector was discarded, and the pre-trained ResNet-18 encoder was transferred to the downstream active-fire detection task. During initial fine-tuning, the backbone parameters remained frozen. Specific layers were subsequently unfrozen according to the training strategy.

2.5.1. Network Construction

The fine-tuning architecture inherited the pre-trained backbone and introduced a new classifier. Following data augmentation, the system employed the pre-trained ResNet-18 model. Retaining the 16-channel input from the pre-training stage, the SE-integrated backbone encoded the data into a 512-dimensional feature vector.
The new classifier mapped these extracted features into the target class space using a two-layer fully connected network. The first layer reduced the 512-dimensional input to 256 dimensions, utilizing batch normalization, ReLU activation, and a Dropout layer. The second layer projected this output into a two-dimensional space to generate classification scores for the non-fire and fire classes. These final scores determined the burning state of the center pixel.

2.5.2. Model Optimization Strategy

To retain the features learned during pre-training, the optimization strategy integrated the AdamW optimizer, progressive parameter unfreezing, and adaptive learning rate scheduling.
The supervised fine-tuning phase utilized the AdamW optimizer to improve generalization via a decoupled weight-decay mechanism. All backbone layers were directly unfrozen and fully fine-tuned with a relatively low learning rate, thereby retaining the features learned during pre-training while adapting to the active-fire detection task.
To address the imbalance across categories, the network was optimized by minimizing a weighted cross-entropy loss. This formulation allocated higher weights to minority classes, thereby mitigating majority-class bias and stabilizing the training process:
L = 1 N i = 1 N w y i y i log ( y ^ i ) + ( 1 y i ) log ( 1 y ^ i ) .
In this equation, N represents the total number of samples within each batch, y i denotes the ground-truth label, y ^ i indicates the predicted probability, and w y i represents the corresponding class weight.

2.6. Model Evaluation

Evaluation Metrics

To numerically evaluate the classification capability of the proposed framework, this study calculated the F1 score, precision, recall, and accuracy. Accuracy denotes the overall proportion of correct predictions across the entire dataset. Precision indicates the proportion of true positives among all positive predictions, whereas recall measures the fraction of true positive instances successfully detected. The F1 score is the harmonic mean of precision and recall, providing a balanced assessment. The corresponding equations are expressed as follows:
Accuracy = TP + TN TP + TN + FP + FN ,
Precision = TP TP + FP ,
Recall = TP TP + FN ,
F 1 = 2 1 Precision + 1 Recall .
In these expressions, TP and TN represent the numbers of correctly classified positive and negative samples. Meanwhile, FP represents the number of actual negative samples incorrectly predicted as positive, and FN denotes the number of actual positive samples misclassified as negative.

3. Results

3.1. Model Performance Evaluation

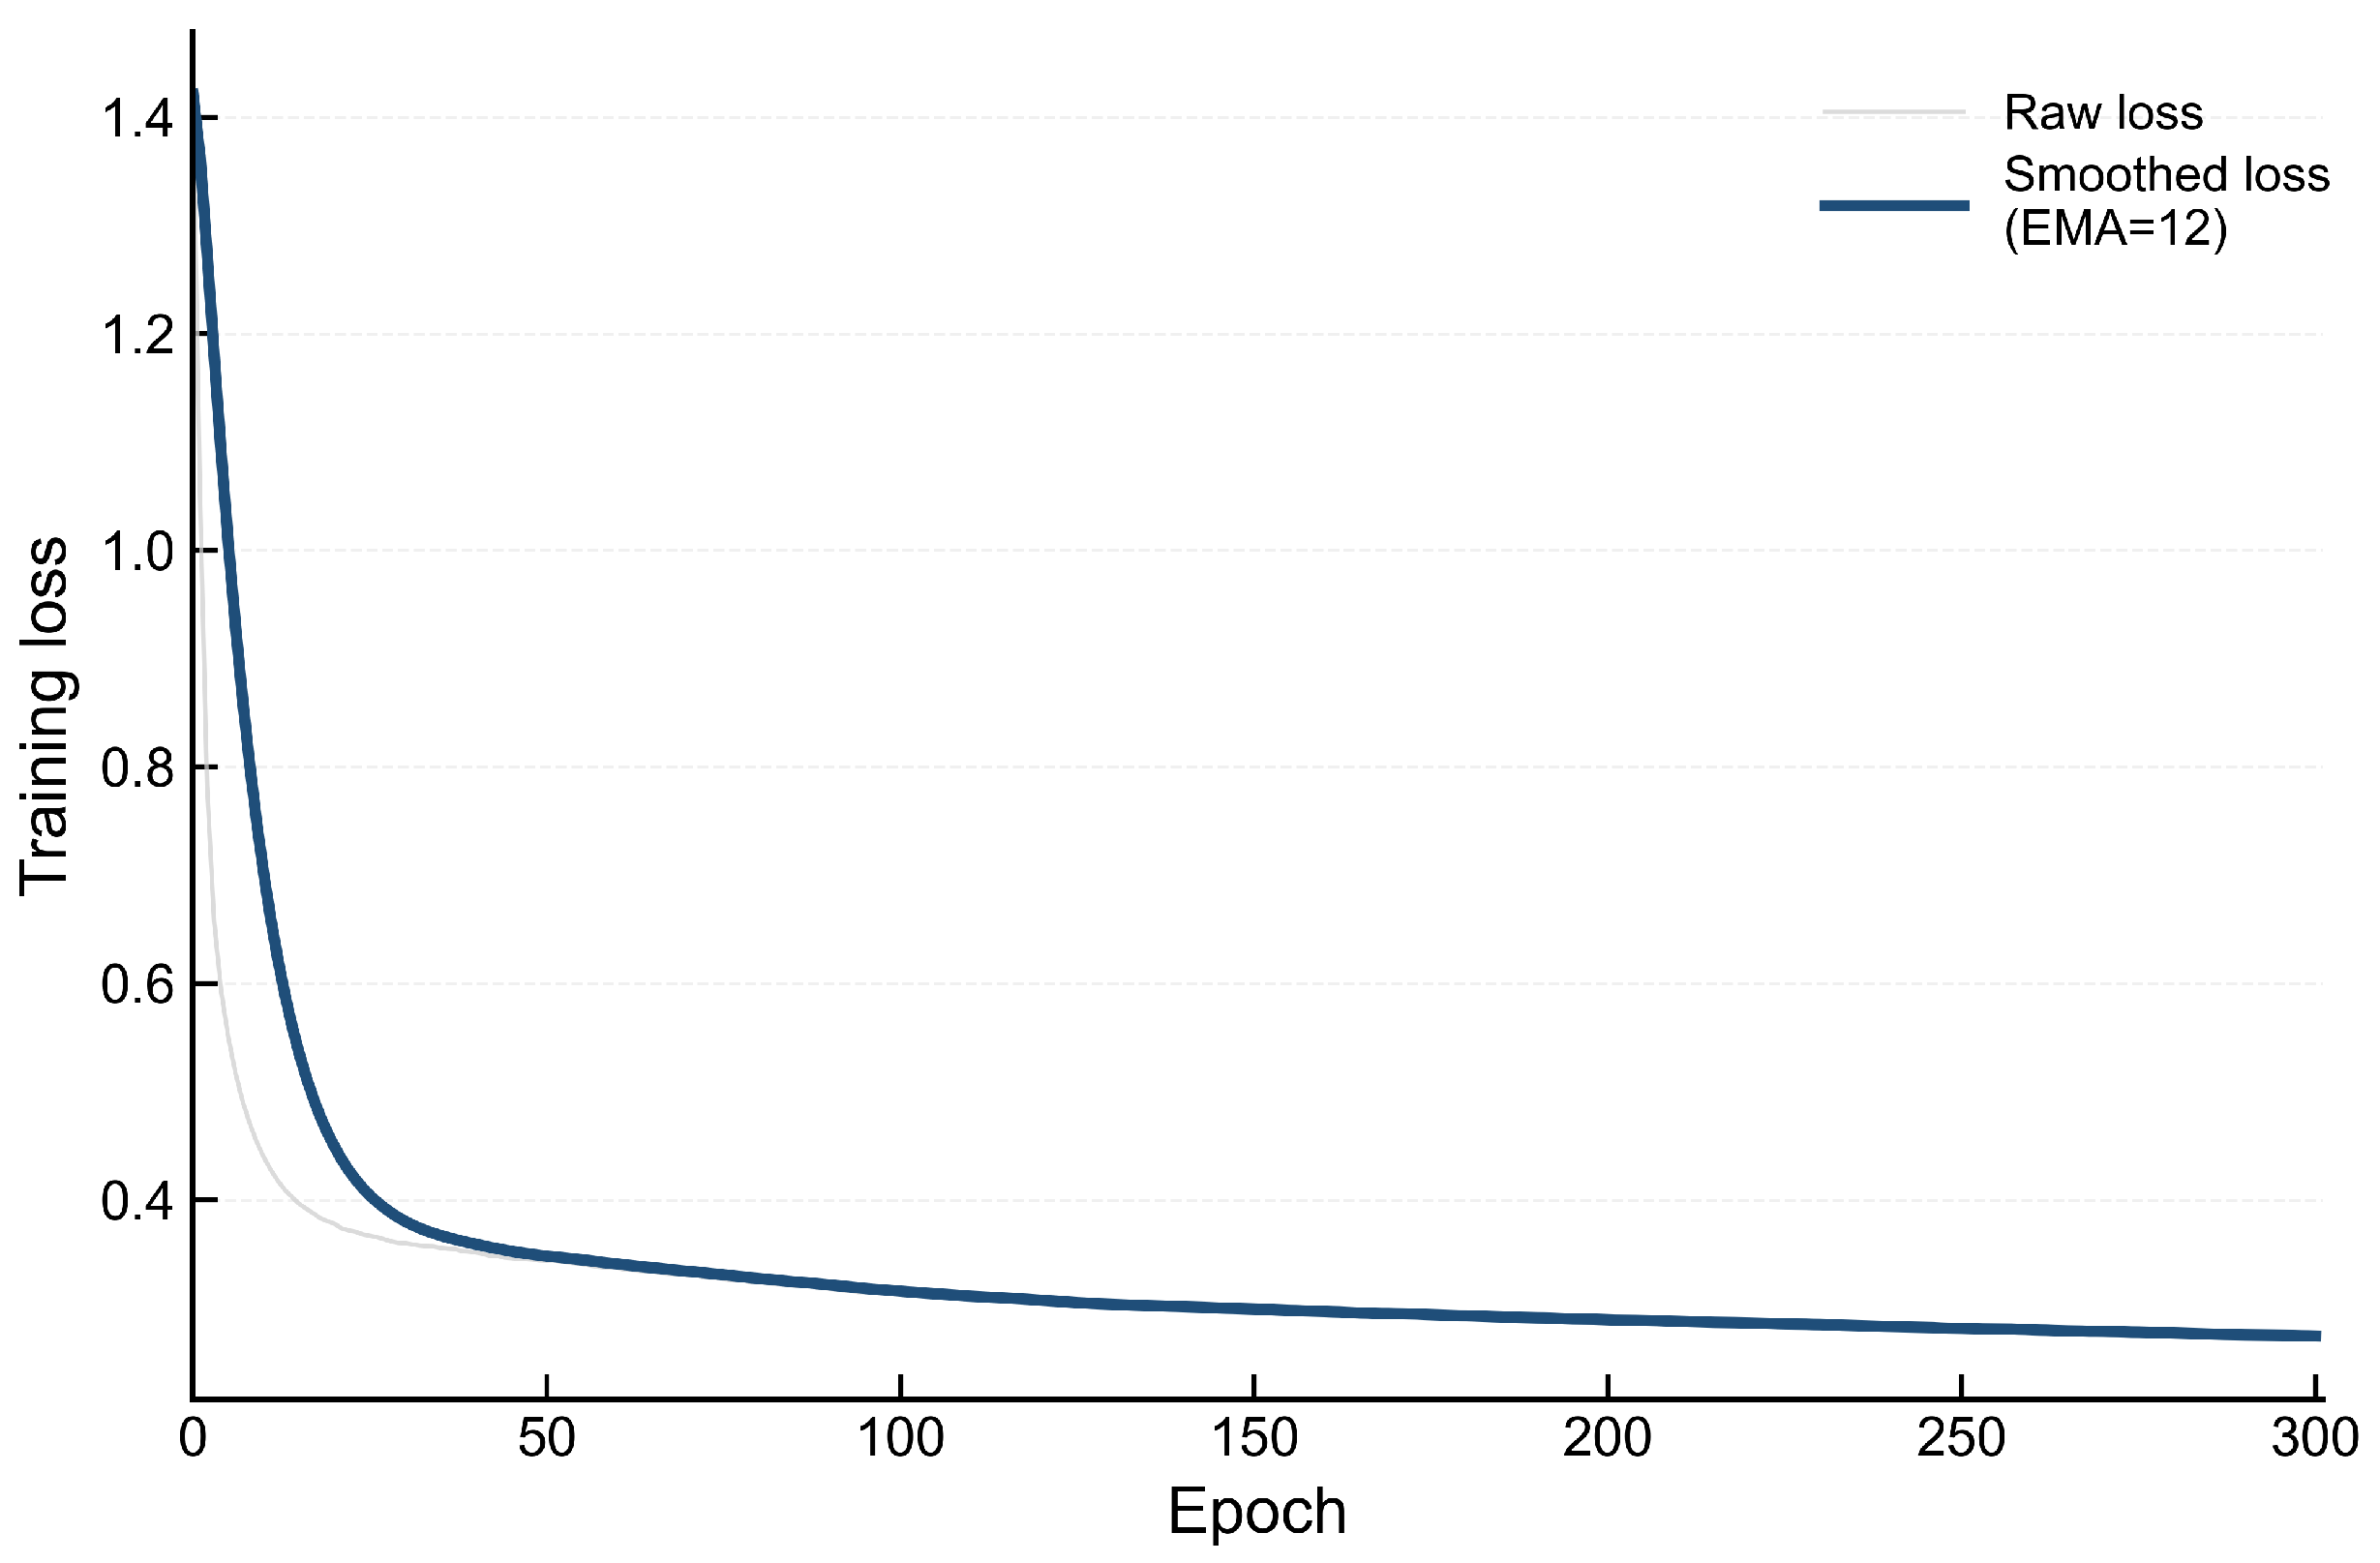
After data augmentation, the ResNet-18 architecture was pre-trained using the BYOL framework on 1 million unlabeled 5 × 5 patches derived from Himawari-8/9 AHI data. The pre-training loss curve demonstrated steady convergence (Figure 8). Ultimately, the model parameters from epoch 300 were extracted to initialize the subsequent supervised fine-tuning phase.
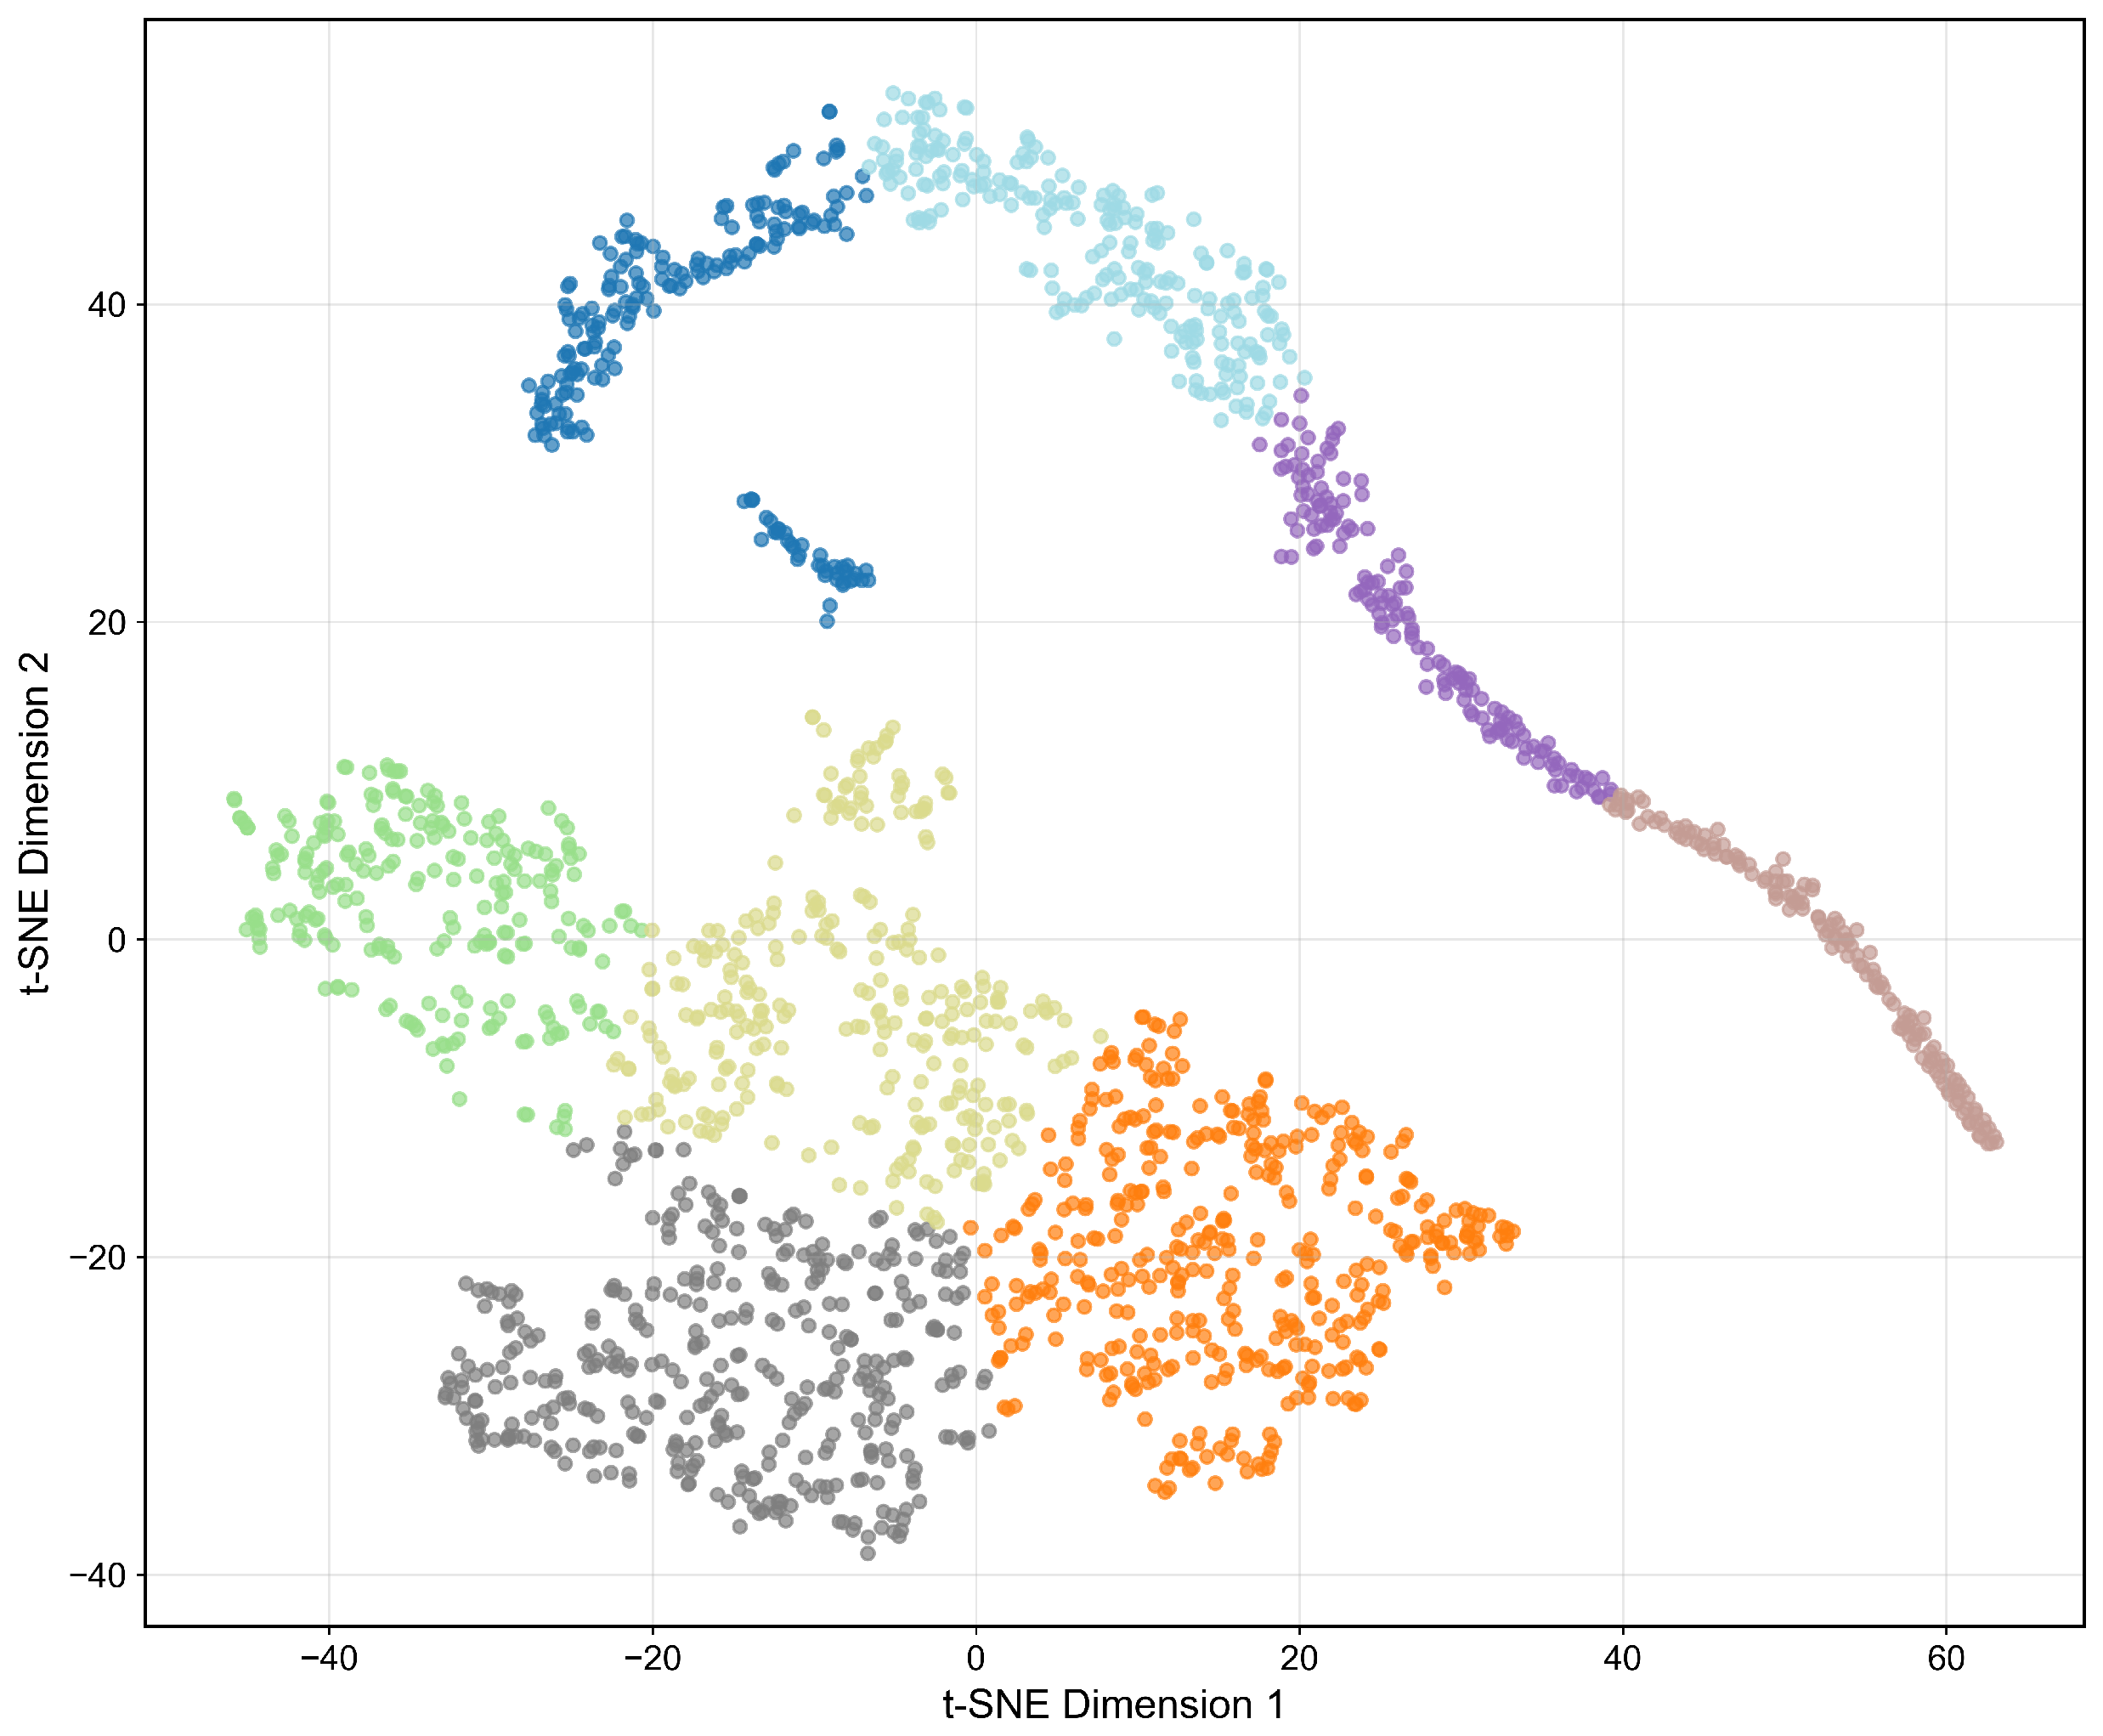
Next, t-SNE was employed to visualize the feature representations learned through BYOL pre-training and analyze their distribution. As shown in Figure 9, the features of different classes were clearly separated into distinct clusters after pre-training, validating its effectiveness.
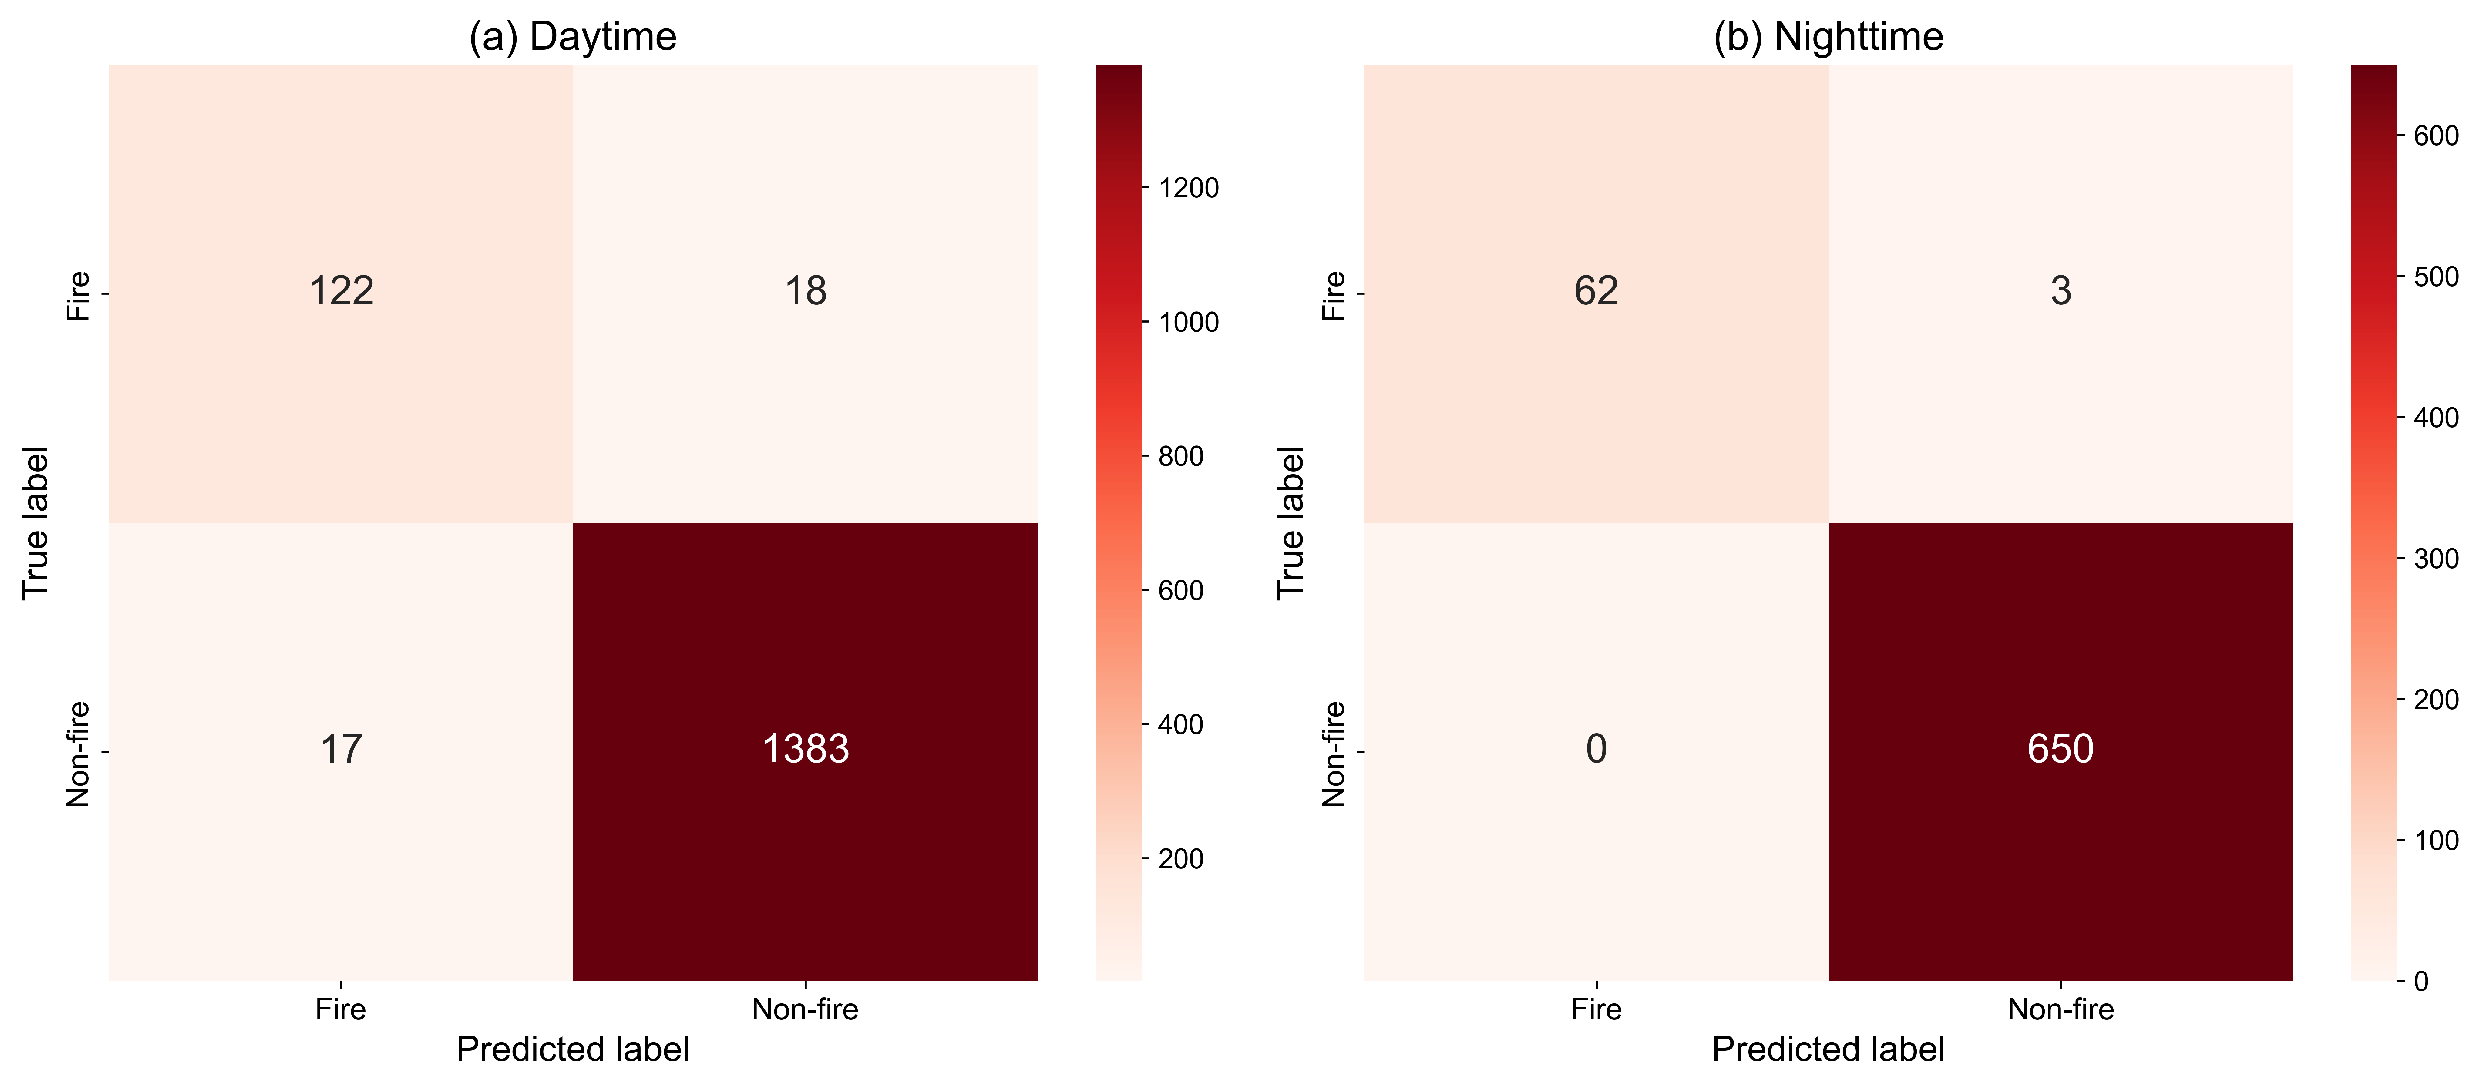
The pre-trained model was subsequently fine-tuned using supervised learning to obtain the final model. As shown in Figure 10, FIRE-BYOL achieved high classification accuracy on both the daytime and night-time test sets, with only minimal false-positives and false-negatives.

3.2. Comparison of Model Performance

Under small-sample conditions, parameter-heavy deep learning models are susceptible to overfitting due to insufficient training data. Therefore, this study selected Random Forest (RF), XGBoost, and the lightweight neural network FireCNN [20] as baseline models, and we constructed separate daytime and night-time models for comparison with FIRE-BYOL.
Table 2 reports the training results. With a relatively sufficient number of daytime samples, FIRE-BYOL achieved performance comparable to FireCNN and outperformed RF and XGBoost. When night-time samples were scarce, FIRE-BYOL performed best, accurately identifying positive samples while effectively reducing false-positives among negative samples. Overall, FIRE-BYOL performed consistently well under both daytime and night-time conditions.

3.3. Ablation Study

During pre-training, two data augmentation modules tailored for remote sensing imagery were adopted, namely the noise injection module and the feature channel dropping module. The SE mechanism was also embedded in the network to enhance its representational capability and downstream performance. To evaluate the effectiveness of these three design choices in BYOL pre-training, an ablation study was conducted. In the experiment, all weights of the pre-trained network were frozen, and only a linear classifier was trained on top of the extracted features.
Table 3 presents the ablation study results. Removing either the noise injection module or the feature channel dropping module reduced model performance, and removing the feature channel dropping module caused a particularly substantial degradation across all metrics. In addition, incorporating the SE mechanism improved the feature representation capability of the model.
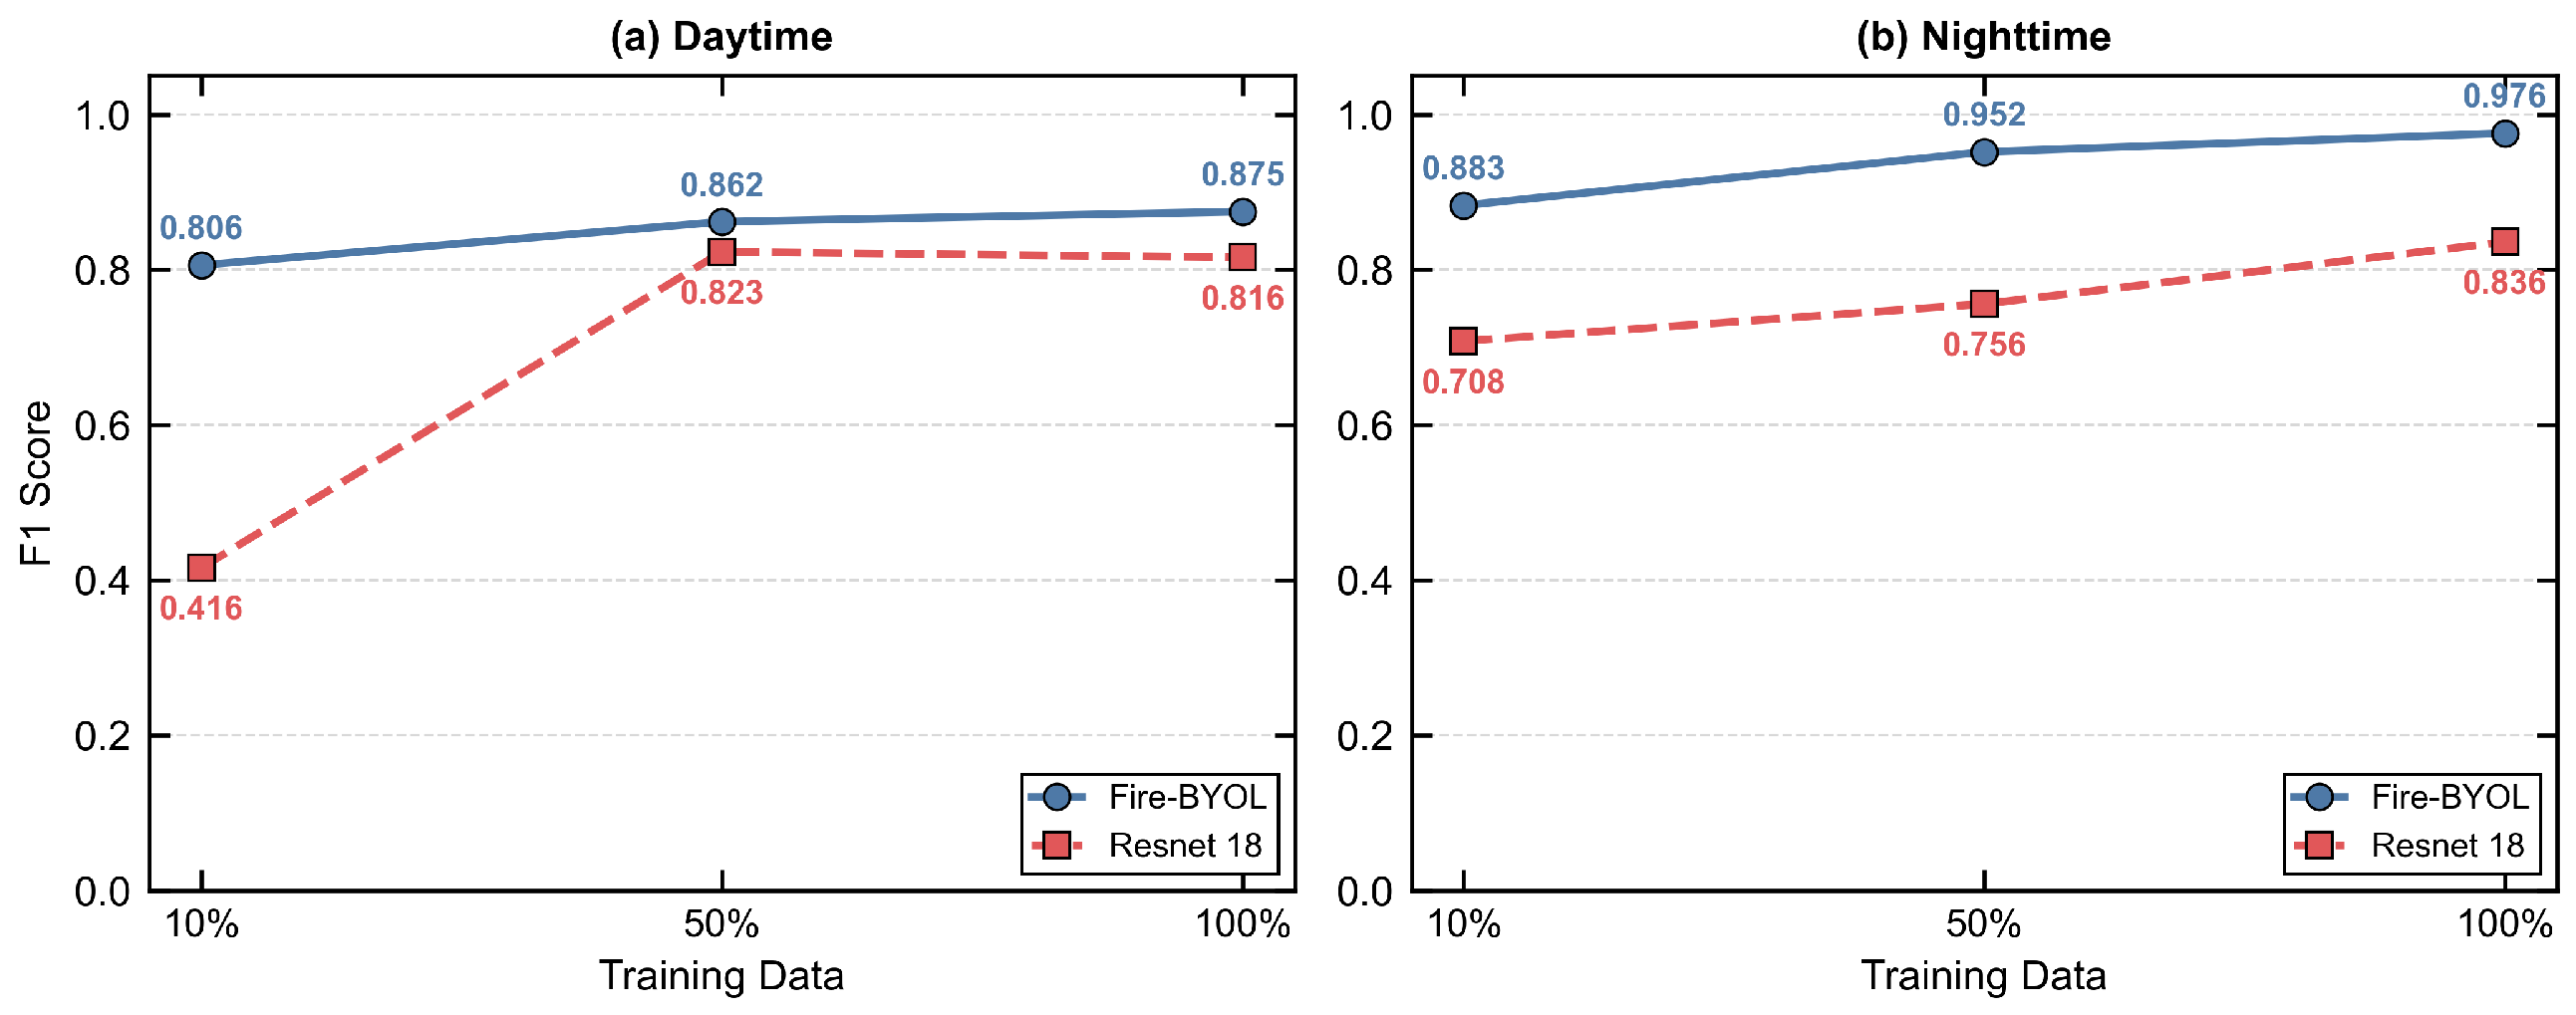
An ablation study was conducted on the BYOL pre-training framework by training the model with 10%, 50%, and 100% of the labeled samples, both with and without pre-training, to evaluate the effectiveness of pre-training across different data scales. Figure 11 shows that across all sample sizes, the model with pre-training outperformed that without pre-training, demonstrating that BYOL pre-training effectively improves model performance under small-sample conditions and reduces reliance on labeled samples.

3.4. Analysis of Typical Grassland Fire Cases

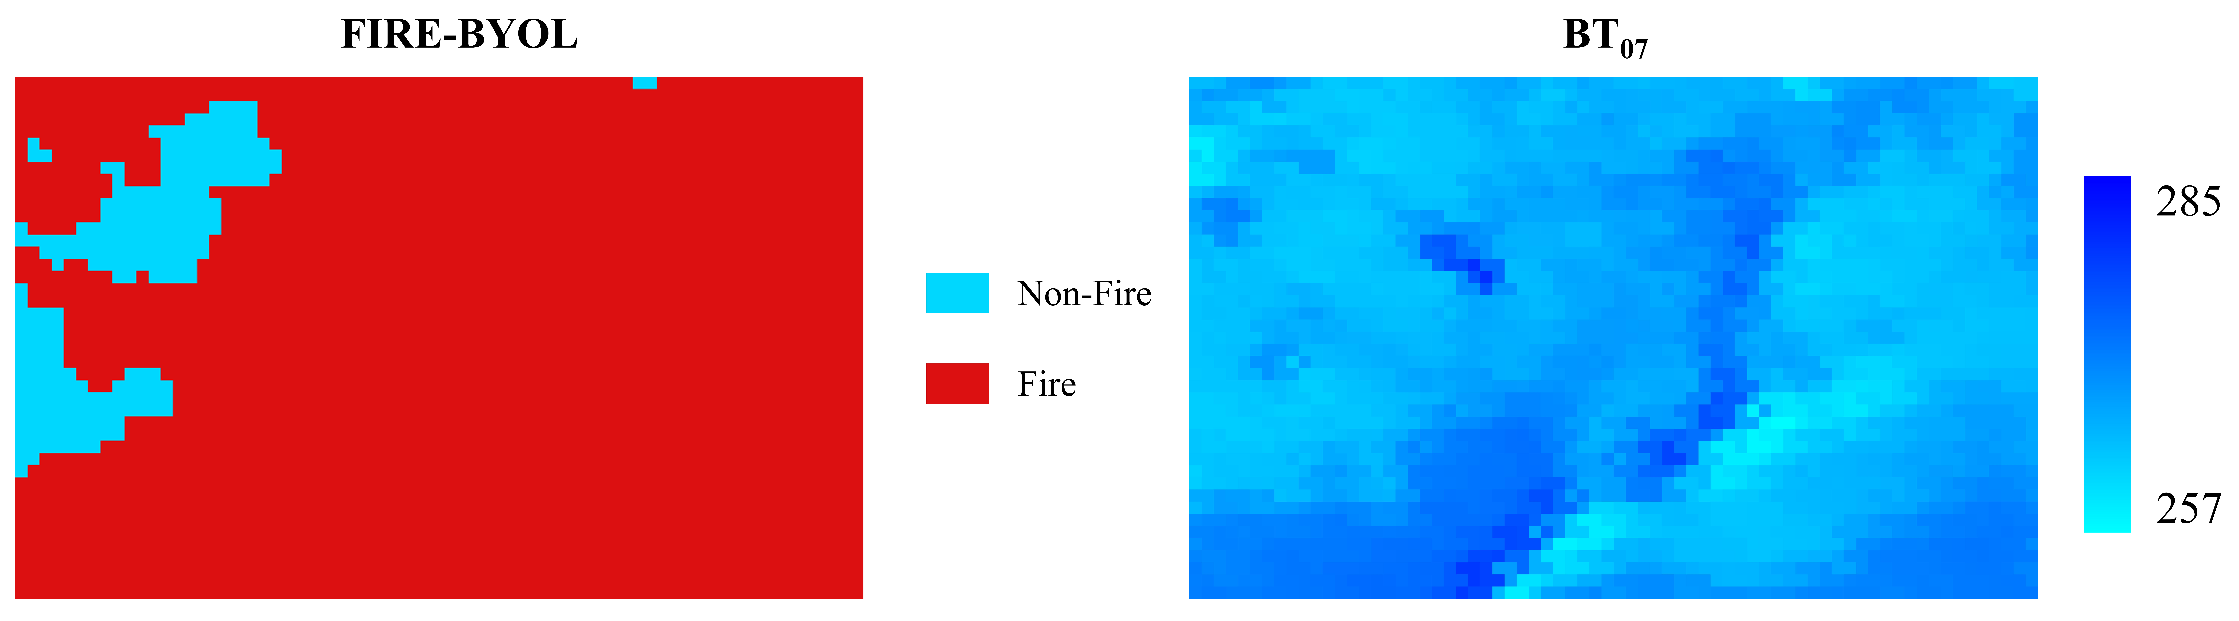
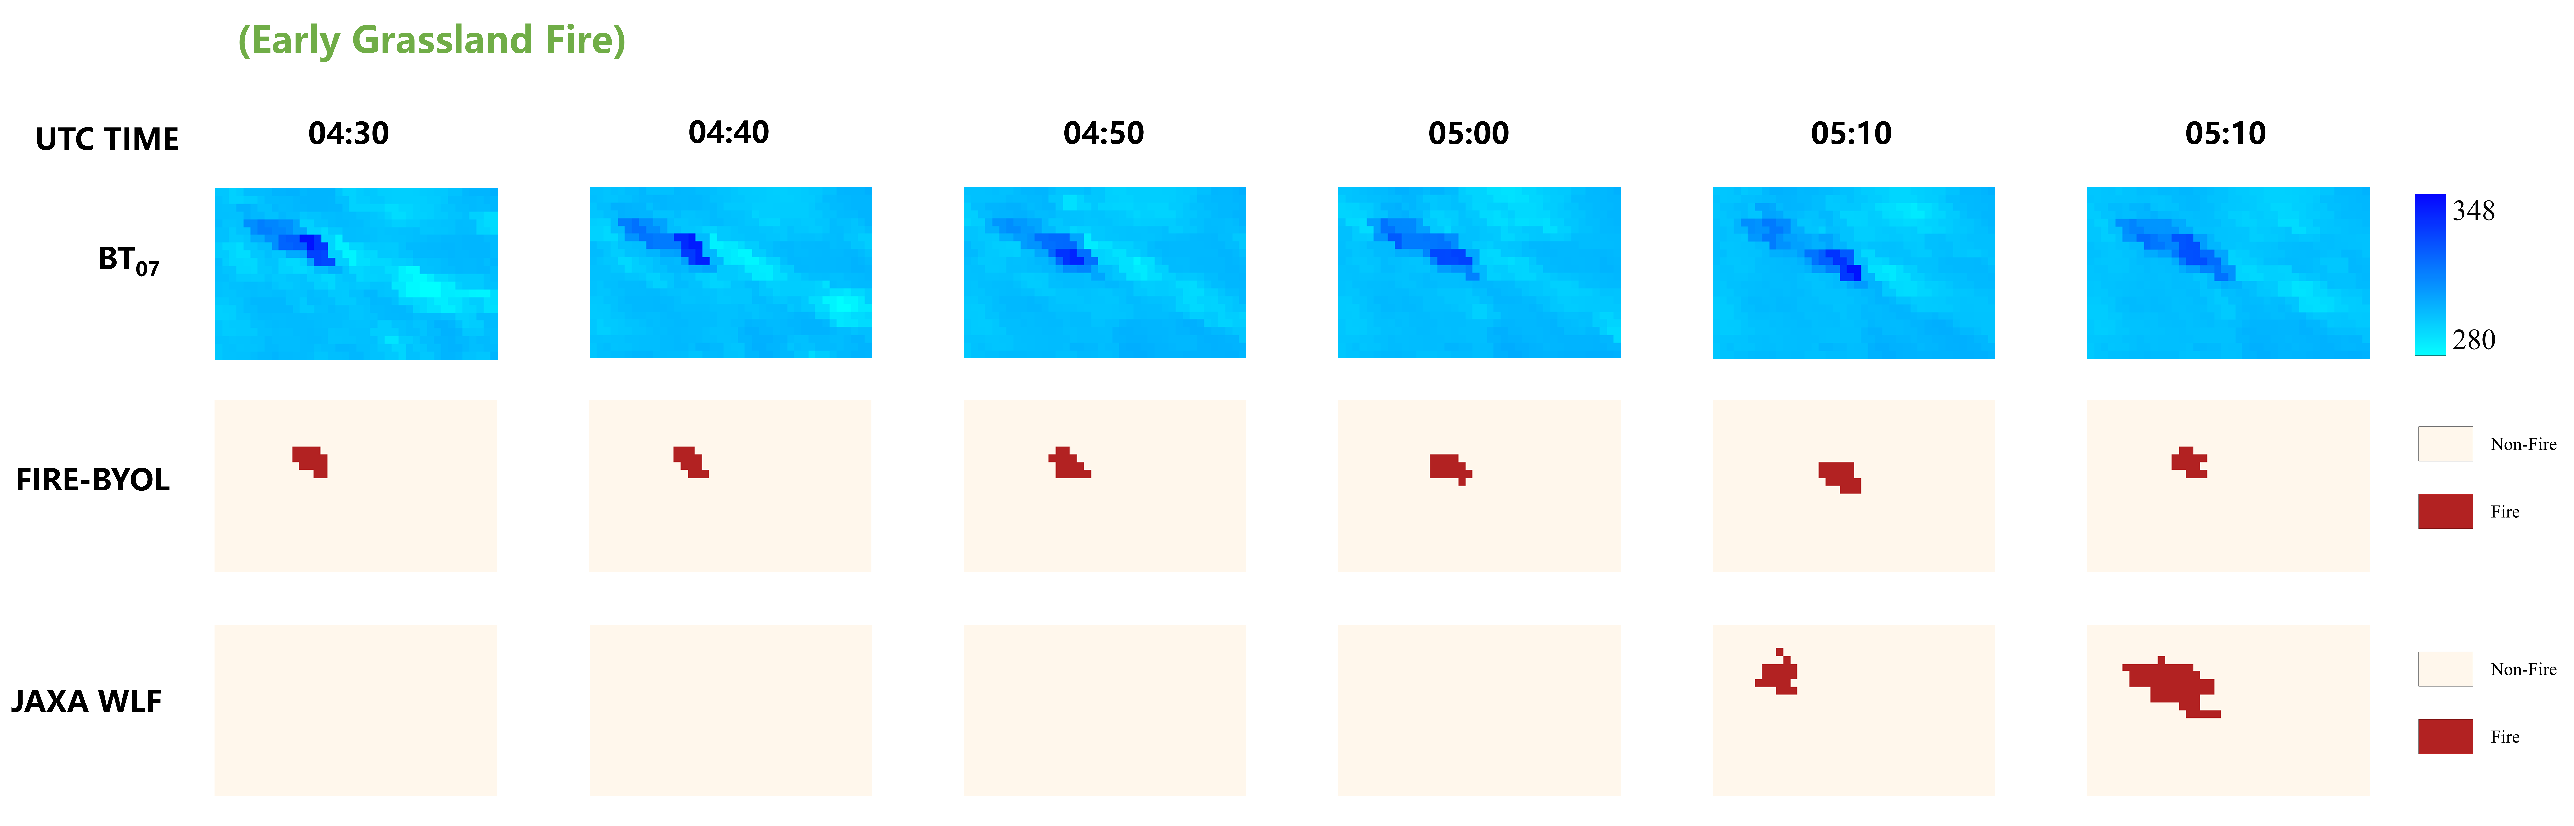
Timely detection of early-stage fires is a critical metric for evaluating active-fire detection models, as prompt intervention can substantially reduce both loss of life and economic damage. Figure 12 compares the early-stage detection results of a grassland fire from the Himawari BT07 band, the JAXA WLF product, and our FIRE-BYOL algorithm. Anomalous brightness temperatures appeared in the Himawari BT07 band at 04:30 UTC, but the WLF product did not detect any active-fire pixels until 05:10 UTC. In contrast, FIRE-BYOL identified active-fire pixels as soon as the anomaly emerged, and the detected pixels coincided with all regions exhibiting pronounced brightness–temperature anomalies in the satellite imagery.
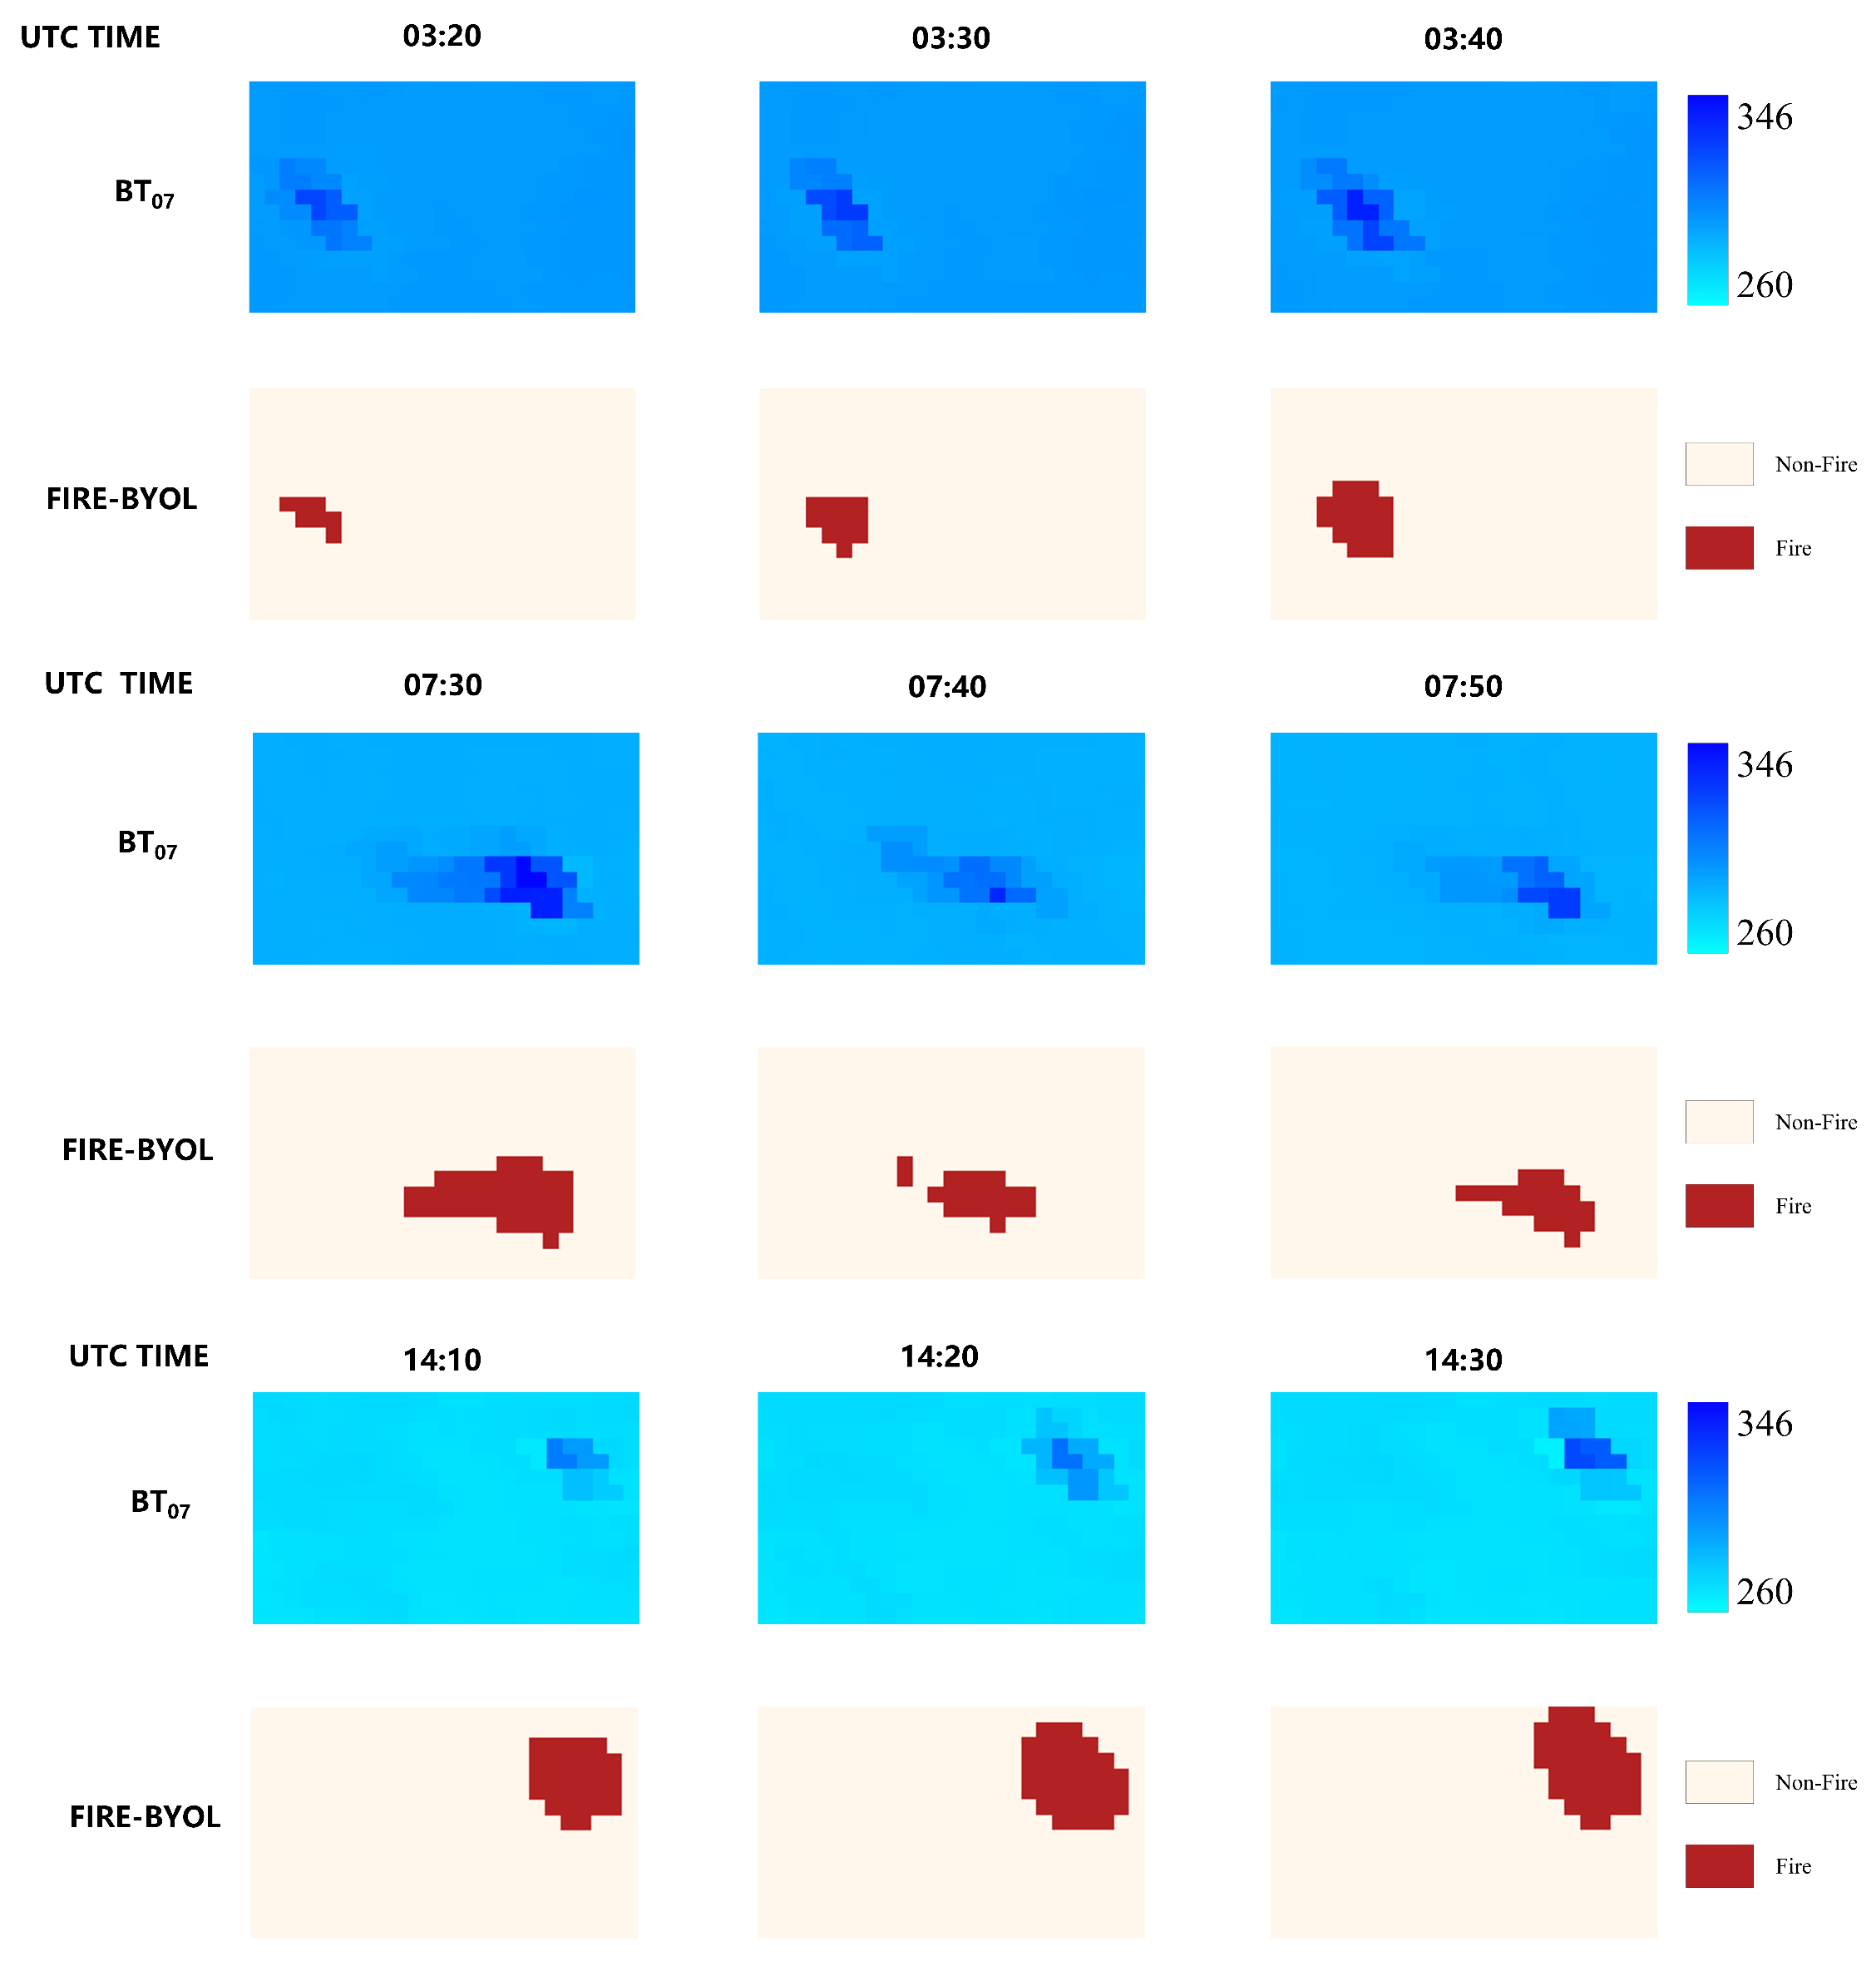
FIRE-BYOL was capable of relatively accurately detecting and tracking an entire grassland fire event. On 7 October 2024, a grassland fire ignited on the Mongolian Plateau at approximately 03:00 UTC and spread rapidly, lasting about 10 h. Figure 13 presents visualizations of the Himawari BT07 band and the active-fire pixels detected by FIRE-BYOL during the early, middle, and late stages of this fire. From 03:20 UTC onward, the Himawari BT07 band continuously exhibited brightness–temperature anomalies with marked differences relative to adjacent pixels. FIRE-BYOL successfully detected these active-fire pixels, and the detected area closely coincided with the anomalous brightness–temperature region. By 07:30 UTC, as the fire continued to expand and formed a large-scale burning area, the model effectively captured the spatial distribution of burning pixels. During the decay stage, although the anomalous brightness–temperature signals in the satellite band weakened, FIRE-BYOL still accurately identified the residual active-fire pixels.

4. Discussion

4.1. Analysis of Feature Importance

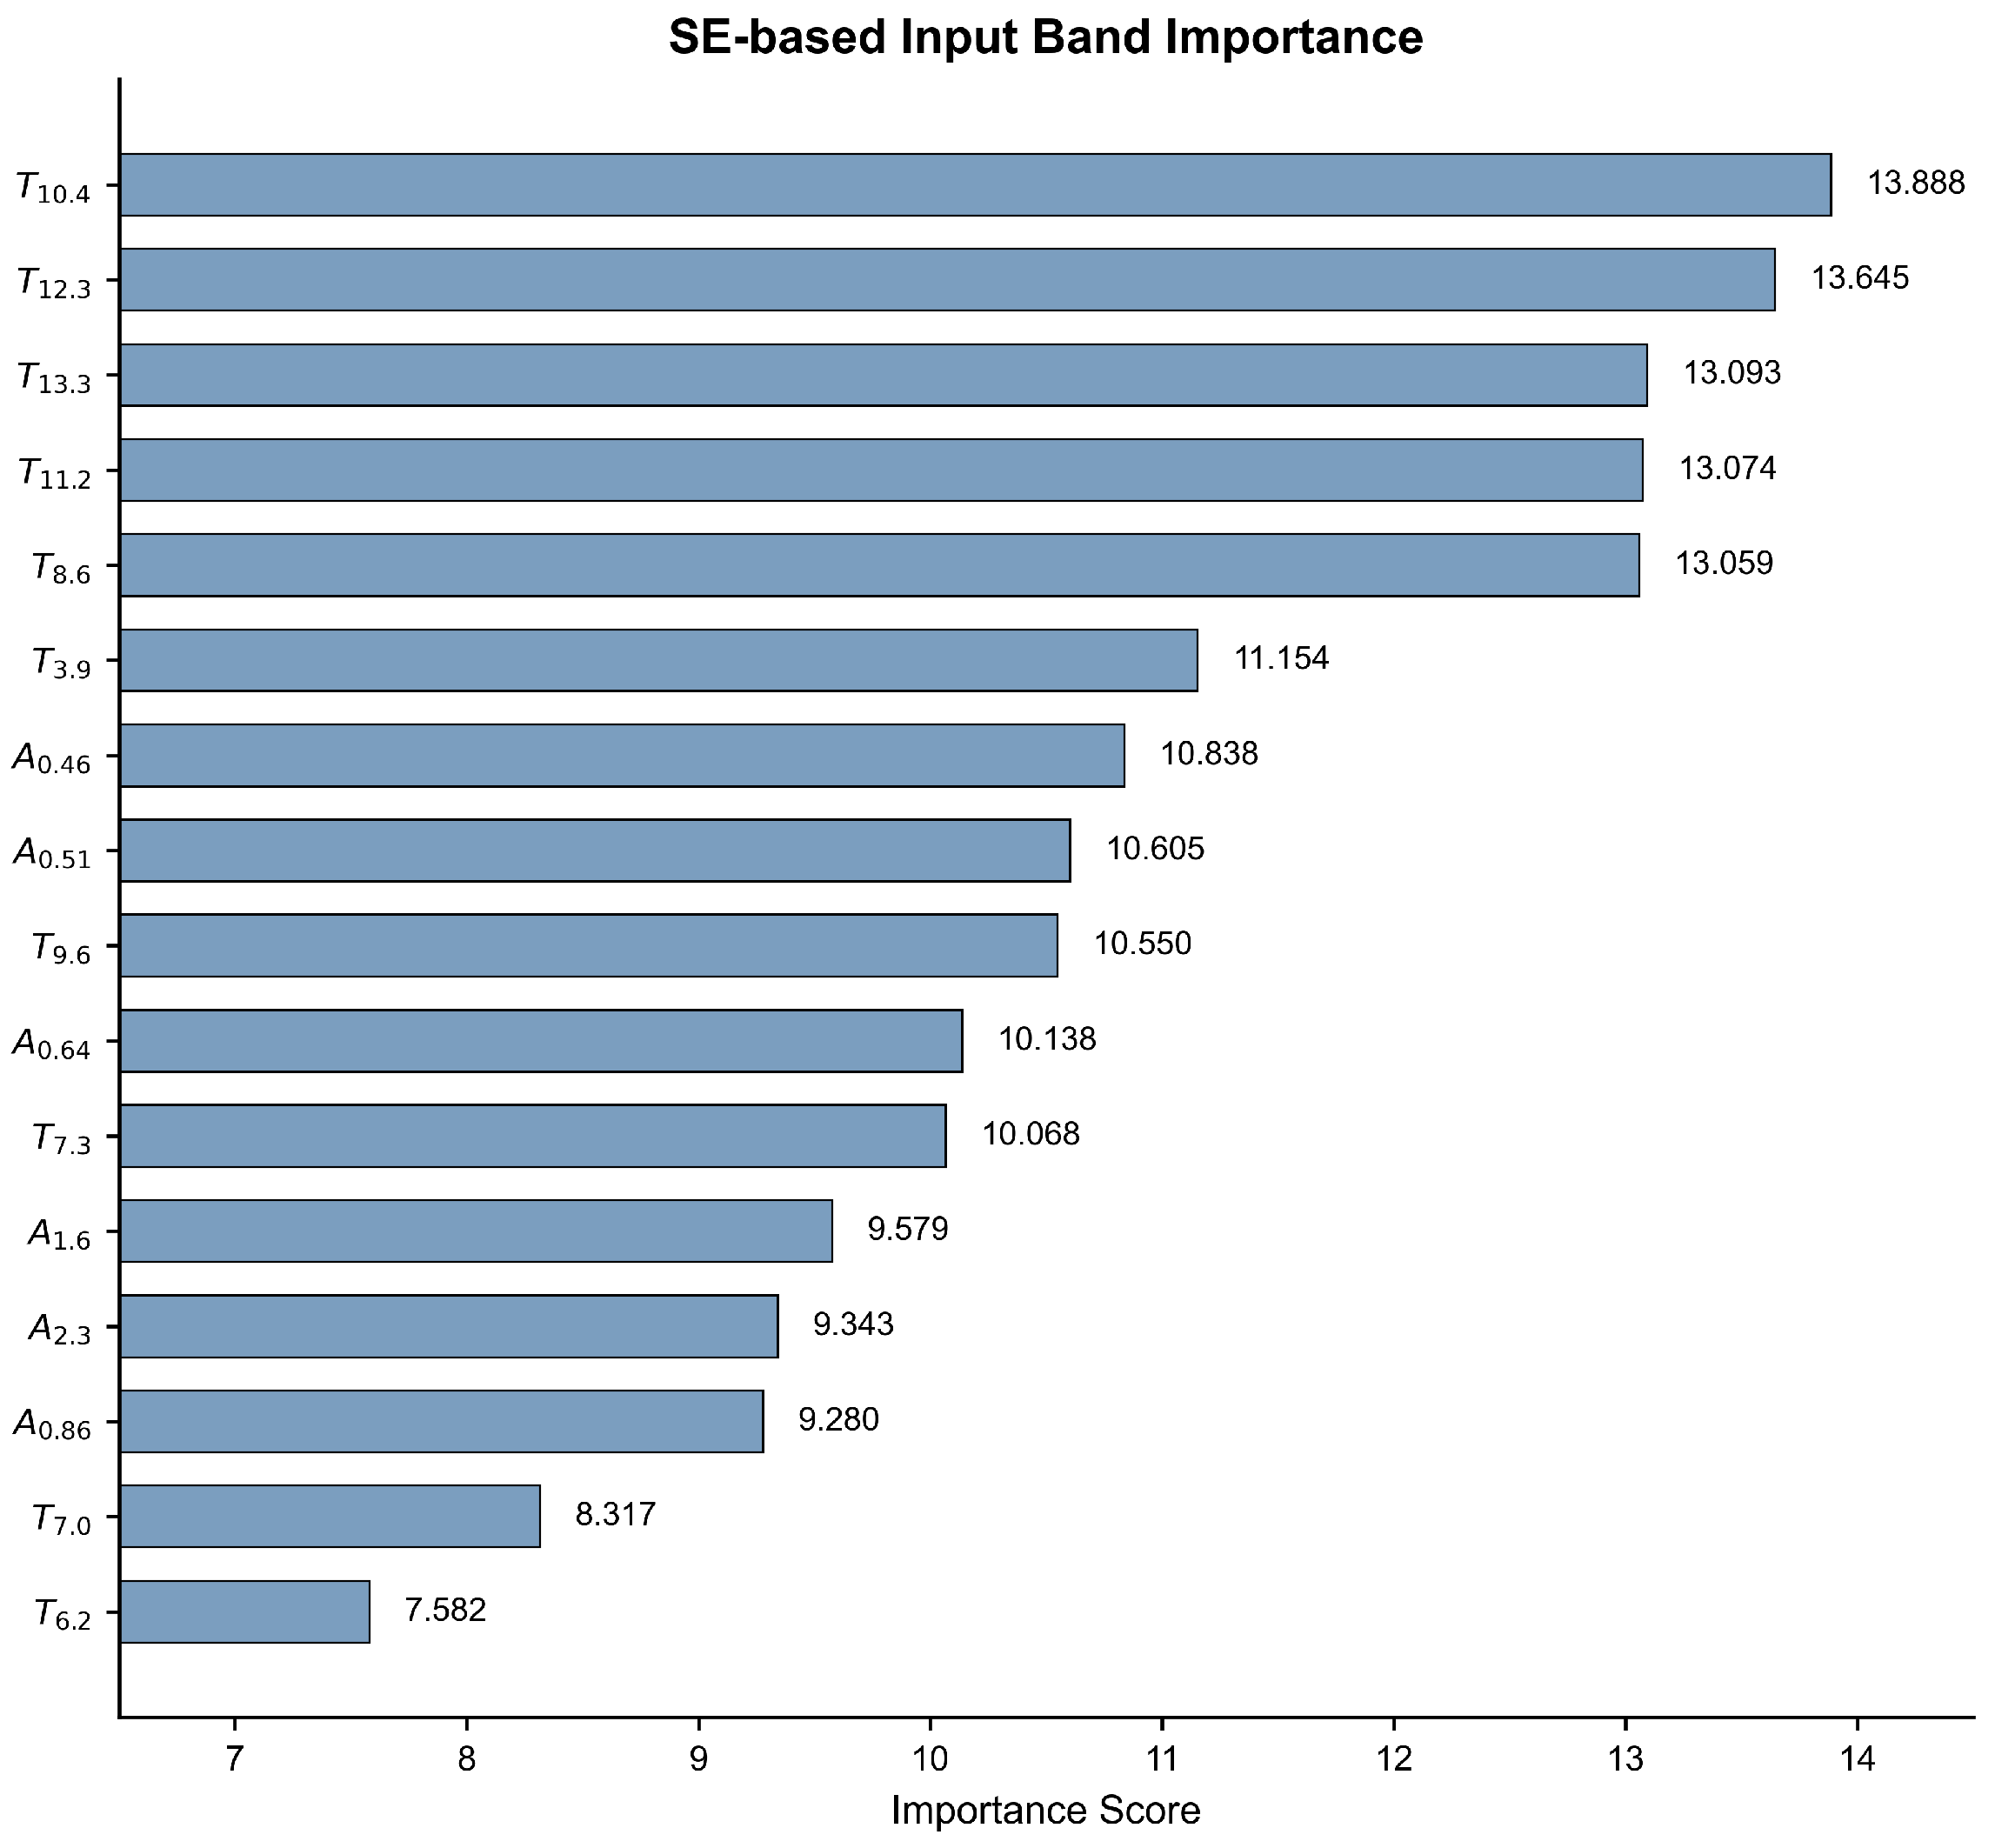
Leveraging the channel attention mechanism of the SE module in the pre-trained encoder, the importance weights of each feature channel in Layer 1 were extracted and fused with the response intensity of the Conv1 convolution kernel across the input bands. The resulting attention distribution in the high-dimensional feature space was then back-projected onto the original input bands to generate a relative importance ranking for each spectral band. Figure 14 shows that the encoder assigned all thermal infrared bands similar importance, whereas near-infrared channels that captured vegetation and mineral information—specifically the 0.86 µm, 1.6 µm, and 2.3 µm bands—were ranked lower. This indicates that BYOL unsupervised pre-training learned a general and balanced representation space dominated by thermal infrared bands.
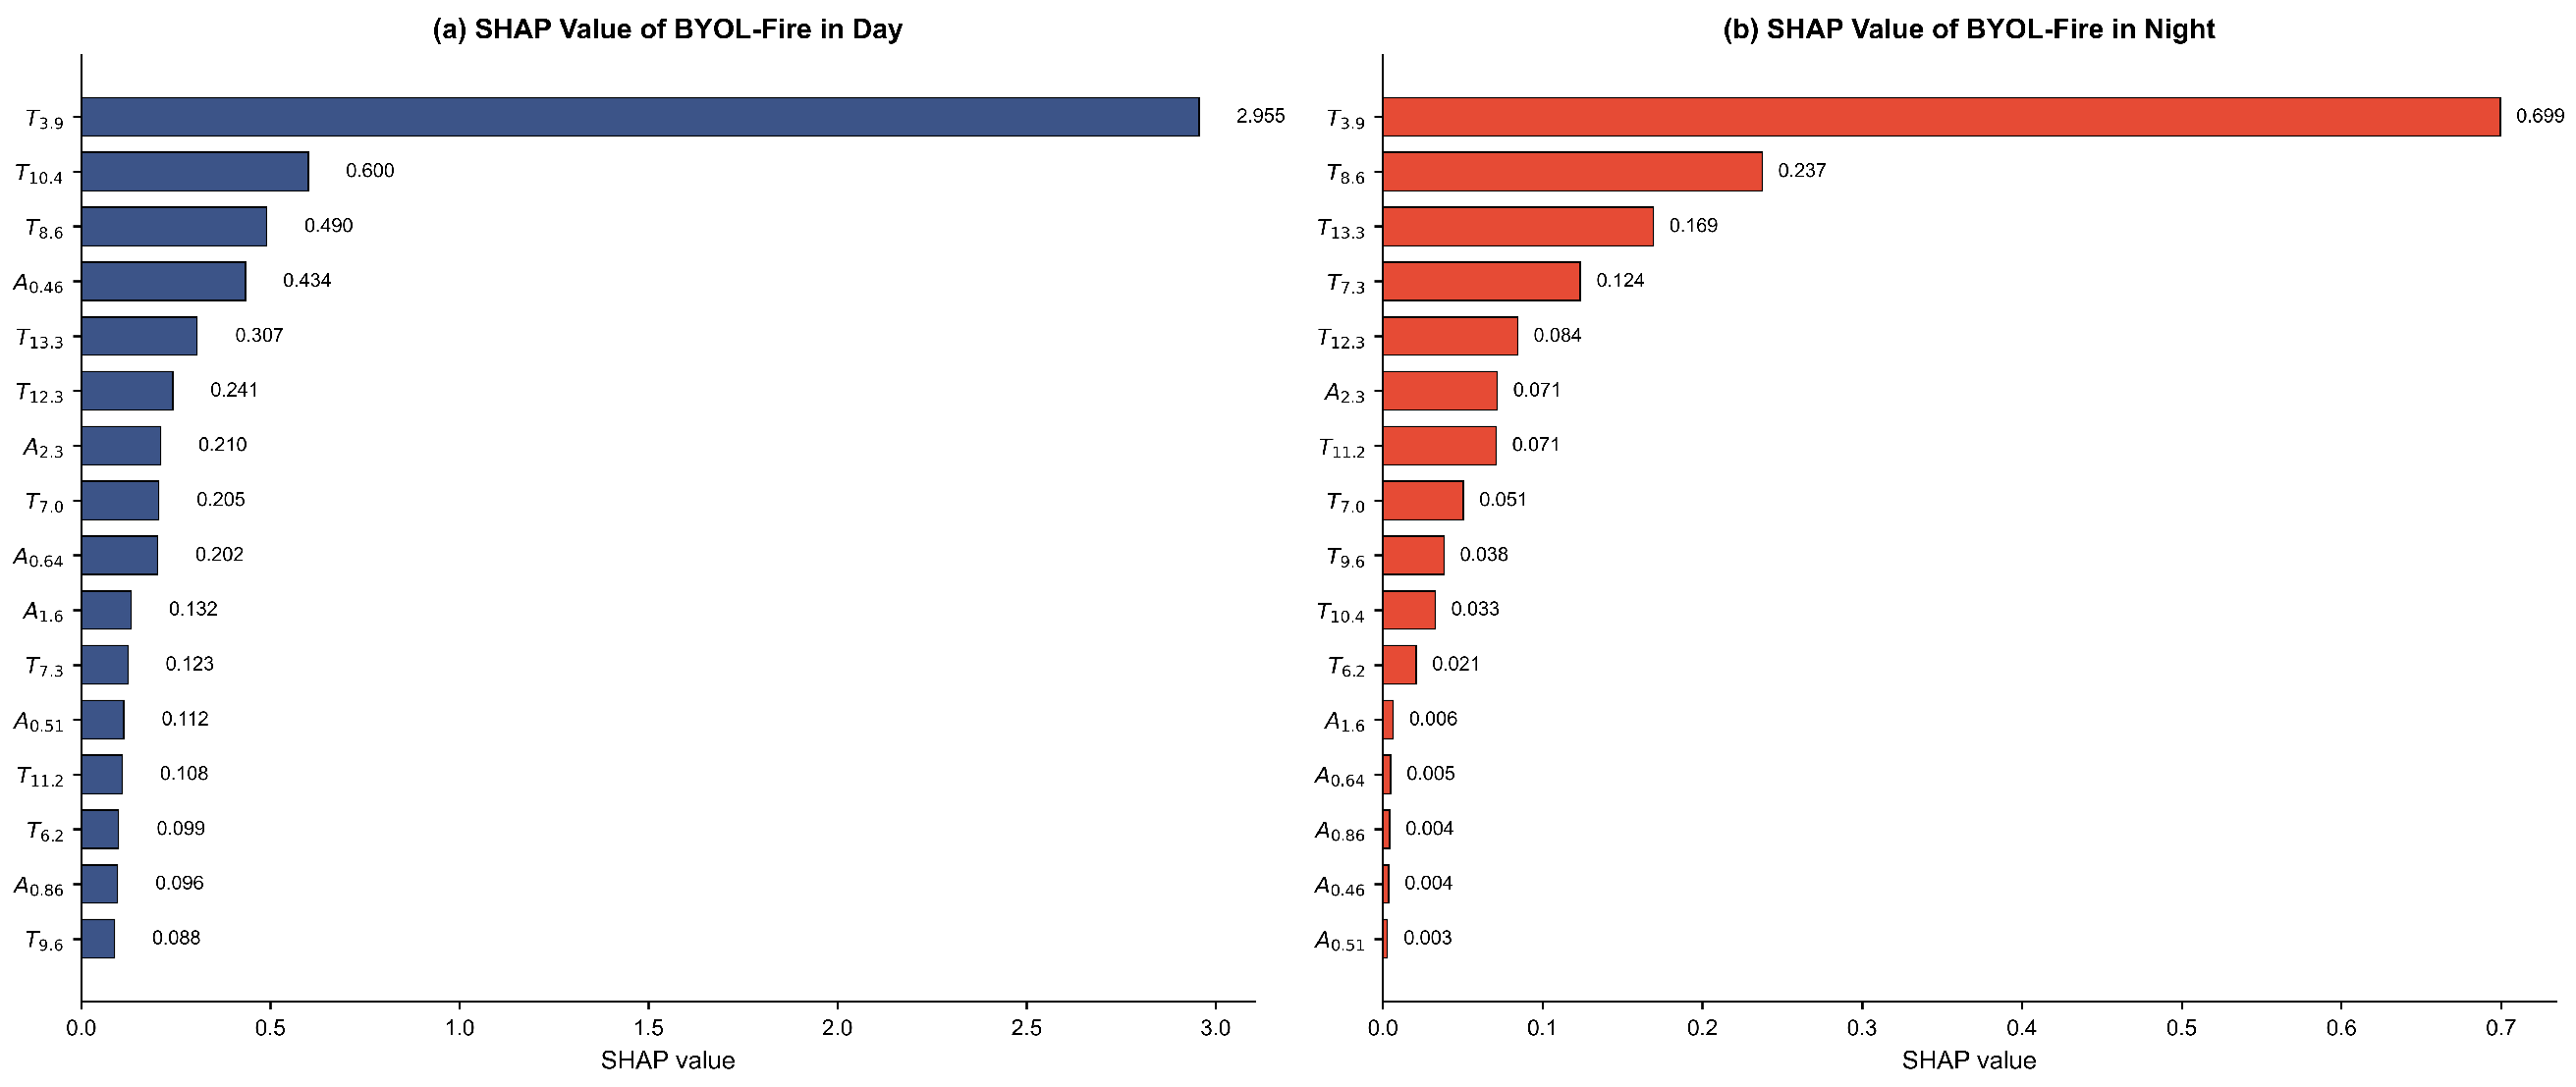
Beyond the pre-trained encoder, we further examined the band-level decision logic of the fine-tuned models using SHAP. Figure 15 shows that for both the daytime and night-time models, the mid-infrared channel T 3.9 (Band 7, 3.9 μ m) exhibited the highest contribution. T 3.9 simultaneously received solar shortwave radiation reflected by the Earth’s surface and mid-infrared thermal radiation emitted by the fire itself. During the daytime, solar reflection further amplified this signal, resulting in a SHAP value 4.9 times that of the second-ranked channel T 10.4 , a finding consistent with the observations in Section 3.3. The daytime SHAP value of T 10.4 was substantially higher than that of T 11.2 , likely because the 10.4 μ m band exhibited a stronger radiative response to high-temperature fire pixels. At night, however, the importance of T 10.4 decreased while that of T 11.2 rose to seventh place. This diurnal variation reflects the daytime synergy between 10.4 μ m and 3.9 μ m rather than the independent brightness–temperature detection capability of the 11.2 μ m channel. Furthermore, water vapor channels at 6.2 μ m and 7.0 μ m showed relatively low and stable importance in both the daytime and night-time models, as they did not directly respond to land surface temperature anomalies.

4.2. Analysis of Detection Errors

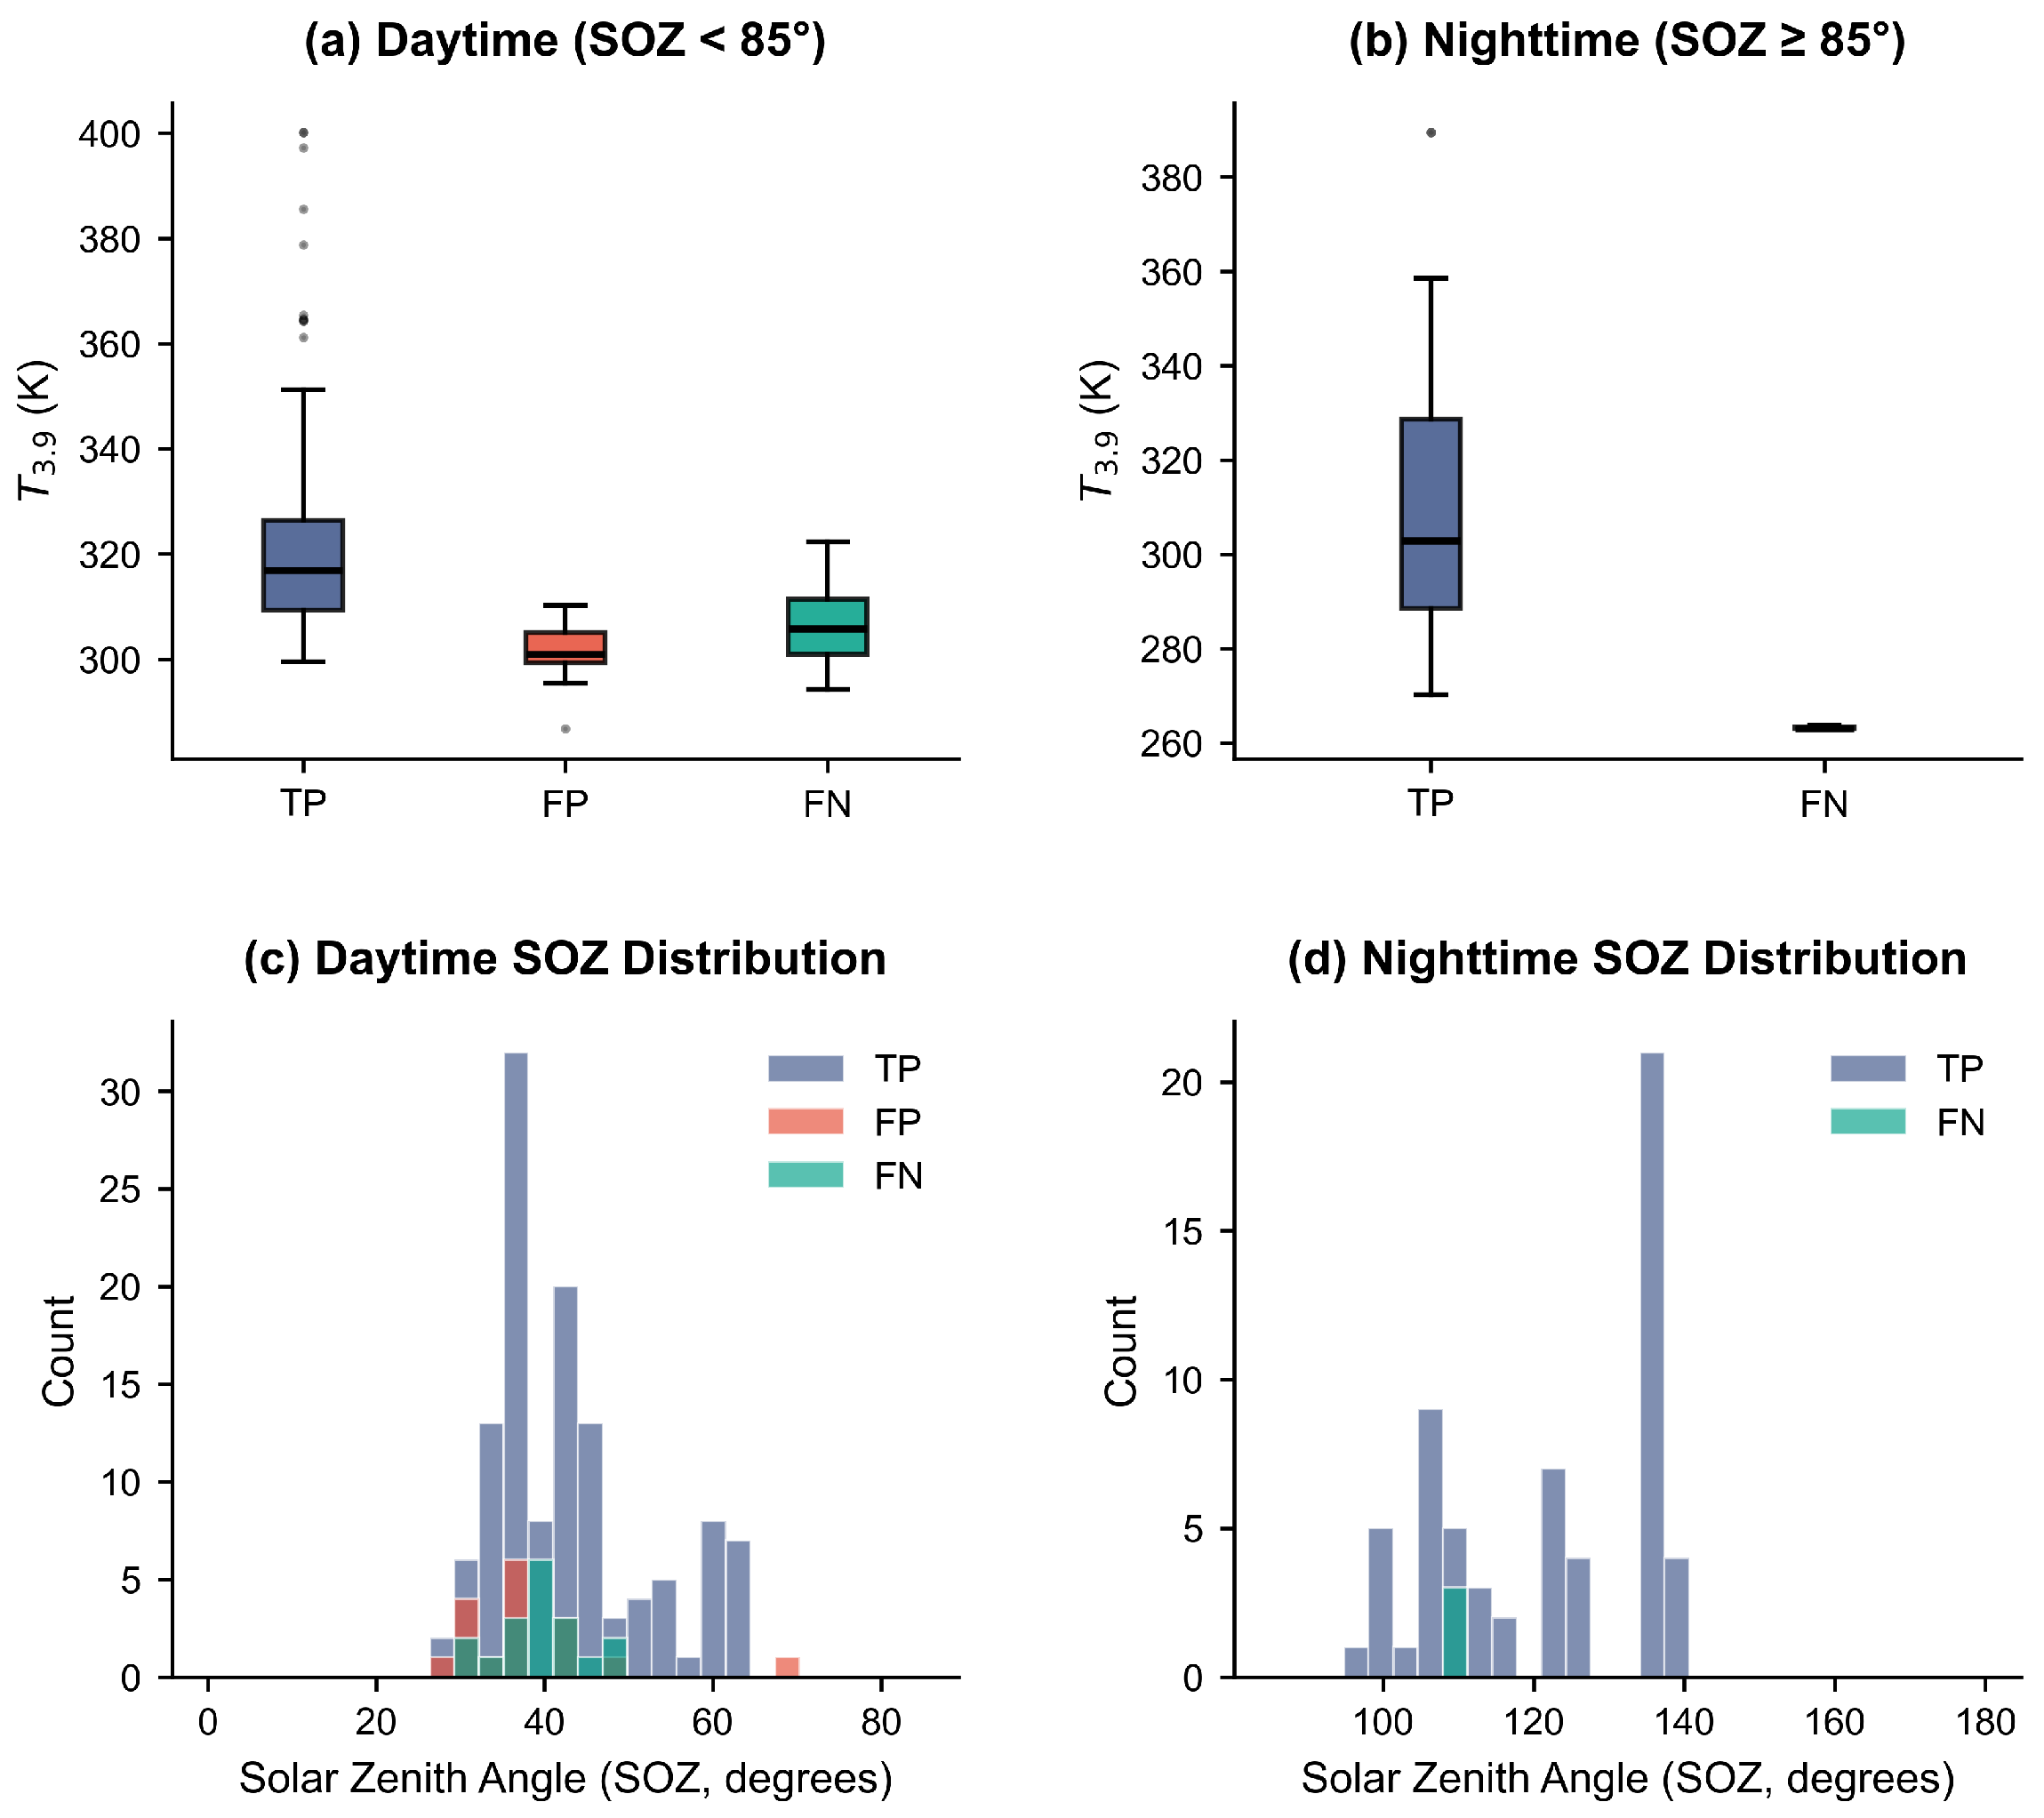
To investigate the false-positive and false-negative issues, we analyzed the response differences of T 3.9 and SOZ on the test set. Figure 16 presents the results. During the daytime, in complex radiative-mixing backgrounds, false-positive samples exhibited notably lower T 3.9 brightness temperatures than correctly detected samples, with their SOZ values concentrated between 30 ° and 50 ° . This suggests that the model tends to misclassify sun glint effects from highly reflective surfaces such as bare soil or sandy land as thermal anomalies. In addition, daytime false-negative samples had lower brightness temperatures than true-positive samples, indicating that weak fire pixels with relatively low brightness temperatures are more likely to be missed. At night, a small number of false-negative samples exhibited extremely low brightness temperatures, far below those of true-positive samples, a phenomenon that may be attributed to severe thermal signal attenuation caused by thin cloud cover or sub-pixel very weak fire activity.
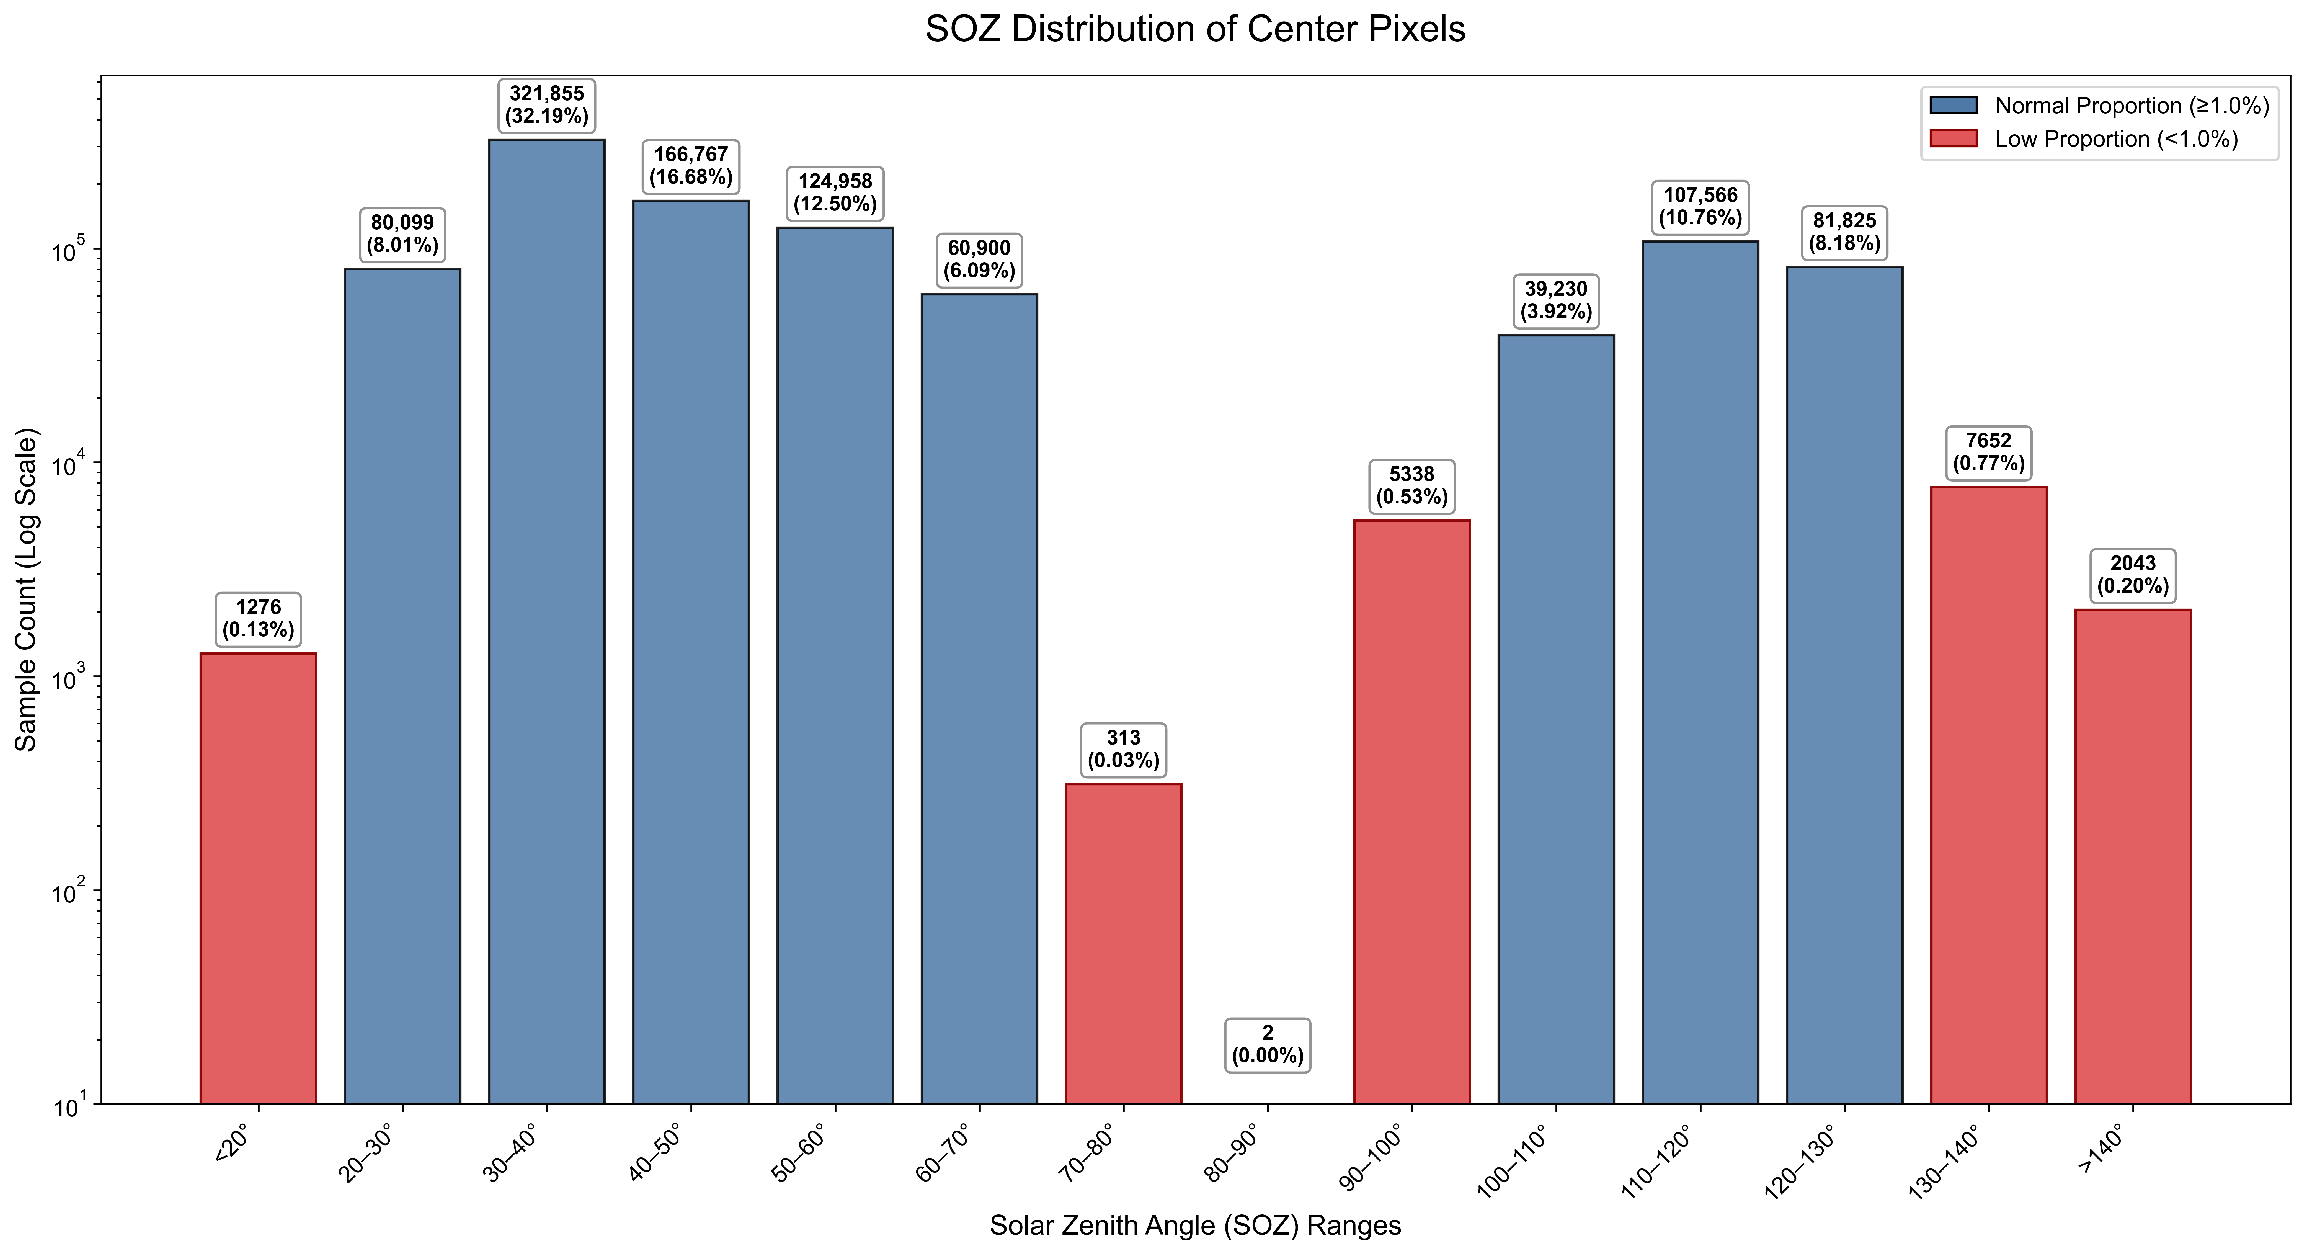
In addition to the distributional patterns discussed above, we also observed that the model exhibited systematic large-area false detections under specific conditions. As shown in Figure 17, at approximately 09:40 UTC, the model produced large-area false detections in the study area, with the SOZ near 85°.
Further analysis of the SOZ distribution of the pre-training unlabeled data revealed that the proportion of samples within the 80° to 90° SOZ range was extremely low (Figure 18). This was because the unlabeled data were sampled from observation times based on VIIRS active-fire overpasses over the Mongolian Plateau. Specifically, the statistics indicate that from 2015 to 2025 the VIIRS satellite did not detect any active-fire pixels over the Mongolian Plateau between 09:00 and 16:00 UTC. Consequently, this gap in the SOZ transitional range stemmed from a temporal coverage blind spot inherent in the VIIRS fire product, which was the root cause of the model’s large-area false detections.

4.3. Limitations

This study has several limitations. First, the input patch size was set to 5 × 5 in the current framework. While this choice was informed by the minimum effective window size established by contextual threshold methods, extending to 7 × 7 or larger patches may capture richer spatial context and warrants future exploration under relaxed computational constraints. Second, as discussed in Section 4.2, the large-area false detections during dawn–dusk transition periods stemmed from a temporal coverage blind spot in the VIIRS fire product, resulting in a severe deficiency of pre-training data in the 80° to 90° SOZ range. Addressing this issue requires introducing multi-source satellite data to construct a pre-training dataset with more uniform spatiotemporal coverage. Third, the generalization capability of the model remains to be fully evaluated. The training and validation were conducted exclusively within the grassland ecosystems of the Mongolian Plateau, and the labeled dataset was constructed using active-fire samples from the four peak fire months, which limits the model’s applicability to other land-cover types, different satellite sensors, and all seasons. Extending the spatial and temporal coverage of the training data would be an important direction for improving the robustness of the method.

5. Conclusions

In this study, we developed FIRE-BYOL, a grassland active-fire detection method based on BYOL self-supervised learning. Using Himawari-8/9 AHI multispectral data with a small set of VIIRS active-fire labels, and employing a ResNet-18 backbone integrated with the SE mechanism, the framework achieved high-precision detection at a 10 min temporal resolution and 2 km spatial resolution, with F1 scores of 0.8746 during the daytime and 0.9764 at night. Our monitoring results for multiple grassland fires on the Mongolian Plateau show that FIRE-BYOL outperforms the WLF product and baseline models, including RF, XGBoost, and FireCNN, in both early-stage fire detection and full fire-event tracking.
Our ablation studies validated the effectiveness of the noise injection module, feature channel dropping module, and SE mechanism in improving pre-training feature quality, while our data efficiency analysis further demonstrated that BYOL pre-training improves model performance under small-sample conditions and reduces reliance on labeled samples. Through band importance analysis based on the SE module in the pre-trained encoder and SHAP analysis of the fine-tuned model, this study revealed the model’s reliance on thermal infrared bands and its diurnal differences from both representation and decision-making perspectives, providing a physically interpretable explanation.
Our analysis of false-positives indicated that large-area false detections during dawn-dusk transition periods stemmed from a temporal coverage blind spot in the VIIRS fire product, and filling this gap with multi-source satellite data represents a key direction for future improvement. In summary, FIRE-BYOL achieves high spatiotemporal-resolution active-fire detection with limited labeled samples, providing a methodological reference for grassland fire monitoring on the Mongolian Plateau and similar regions.

Author Contributions

Conceptualization, Y.H. and W.D.; methodology, Y.H., S.Y., Z.H., B.G. and E.G.; software, Y.H., M.L. and D.Z.; validation, S.Y., Z.H., B.G., E.G., M.L. and D.Z.; formal analysis, Y.H.; investigation, Y.H.; resources, W.D.; data curation, Y.H., M.L. and D.Z.; writing—original draft preparation, Y.H.; writing—review and editing, W.D., S.Y., Z.H., B.G., E.G., M.L. and D.Z.; visualization, Y.H.; supervision, W.D., S.Y., Z.H., B.G. and E.G.; project administration, W.D.; funding acquisition, W.D. All authors have read and agreed to the published version of the manuscript.

Funding

This research was funded by the Science and Technology Planning Project of Inner Mongolia Autonomous Region (grant numbers 2024KJHZ0002, 2024KJHZ0007); the Open Competition Program of Darhan Muminggan Joint Banner (grant number 2025DMJBGS003); the Inner Mongolia Technology Revitalization Action Plan Key Special Project (grant number 2020ZD0028); the Science and Technology Breakthrough Project of Inner Mongolia Autonomous Region (grant number 2025KJTW0026); the Open Fund of Inner Mongolia Academy of Forestry Science (grant number KF2025ZD08); the Re-approved Project of Inner Mongolia Normal University (grant number 2025JYJFZX001); and the Science and Technology Planning Project of Hangjin Banner (grant number 2025HJGJ05). This work was also supported in part by the key research and technology transfer (in the field of social public welfare) project funded by the Inner Mongolia Autonomous Region (grant number 2026YFSH0053) and in part by the Natural Science Foundation of Inner Mongolia (grant number 2026MS0312). The APC was funded by the aforementioned grants.

Institutional Review Board Statement

Not applicable.

Informed Consent Statement

Not applicable.

Data Availability Statement

The original data that support the findings of this study are publicly available. The labeled active-fire data (VIIRS) were obtained from the NASA Fire Information for Resource Management System (FIRMS) at https://firms.modaps.eosdis.nasa.gov/ (accessed on 31 July 2026). The unlabeled multispectral satellite data (Himawari-8/9 AHI) and the baseline WLF product were provided by the Japan Aerospace Exploration Agency (JAXA) at https://www.eorc.jaxa.jp/ptree/ (accessed on 31 July 2026). The source code for this paper is currently being prepared for public release. During the review process, the code can be provided by the corresponding author upon reasonable request.

Acknowledgments

Sincere gratitude is extended to the Inner Mongolia Autonomous Region Key Laboratory of Ecological Environment Collaborative Intelligence and the Arxan Forest and Grassland Disaster Prevention and Mitigation Field Scientific Observation and Research Station of Inner Mongolia Autonomous Region for providing essential research infrastructure and vital technical and administrative support.

Conflicts of Interest

The authors declare no conflicts of interest. The funders had no role in the design of the study; in the collection, analyses, or interpretation of the data; in the writing of the manuscript; or in the decision to publish the results.

References

  1. Bao, Y.; Shinoda, M.; Yi, K.; Fu, X.; Sun, L.; Nasanbat, E.; Li, N.; Xiang, H.; Yang, Y.; Javzmaa, B. Satellite-Based Analysis of Spatiotemporal Wildfire Pattern in the Mongolian Plateau. Remote Sens. 2023, 15, 190. [Google Scholar] [CrossRef] [Scilit]
  2. Andela, N.; Morton, D.C.; Giglio, L.; Chen, Y.; Van Der Werf, G.R.; Kasibhatla, P.S.; DeFries, R.S.; Collatz, G.J.; Hantson, S.; Kloster, S.; et al. A Human-Driven Decline in Global Burned Area. Science 2017, 356, 1356–1362. [Google Scholar] [CrossRef] [Scilit] [PubMed]
  3. Park, C.Y.; Takahashi, K.; Fujimori, S.; Jansakoo, T.; Burton, C.; Huang, H.; Kou-Giesbrecht, S.; Reyer, C.P.O.; Mengel, M.; Burke, E.; et al. Attributing Human Mortality from Fire PM2.5 to Climate Change. Nat. Clim. Change 2024, 14, 1193–1200. [Google Scholar] [CrossRef] [Scilit]
  4. Chuvieco, E.; Aguado, I.; Salas, J.; García, M.; Yebra, M.; Oliva, P. Satellite remote sensing contributions to wildland fire science and management. Curr. For. Rep. 2020, 6, 81–96. [Google Scholar] [CrossRef] [Scilit]
  5. Fu, Y.; Li, R.; Wang, X.; Bergeron, Y.; Valeria, O.; Chavardès, R.D.; Wang, Y.; Hu, J. Fire Detection and Fire Radiative Power in Forests and Low-Biomass Lands in Northeast Asia: MODIS versus VIIRS Fire Products. Remote Sens. 2020, 12, 2870. [Google Scholar] [CrossRef] [Scilit]
  6. Polivka, T.N.; Wang, J.; Ellison, L.T.; Hyer, E.J.; Ichoku, C.M. Improving nocturnal fire detection with the VIIRS day-night band. IEEE Trans. Geosci. Remote Sens. 2016, 54, 5503–5519. [Google Scholar] [CrossRef] [Scilit]
  7. Zheng, Z.; Hu, H.; Huang, W.; Zhou, F.; Ma, Y.; Liu, Q.; Jiang, L.; Wang, S. Wildfire Detection Based on the Spatiotemporal and Spectral Features of Himawari-8 Data. IEEE Trans. Geosci. Remote Sens. 2024, 62, 5408213. [Google Scholar] [CrossRef] [Scilit]
  8. Zhang, D.; Huang, C.; Gu, J.; Hou, J.; Zhang, Y.; Han, W.; Dou, P.; Feng, Y. Real-Time Wildfire Detection Algorithm Based on VIIRS Fire Product and Himawari-8 Data. Remote Sens. 2023, 15, 1541. [Google Scholar] [CrossRef] [Scilit]
  9. Chen, J.; Lv, Q.; Wu, S.; Zeng, Y.; Li, M.; Chen, Z.; Zhou, E.; Zheng, W.; Liu, C.; Chen, X.; et al. An Adapted Hourly Himawari-8 Fire Product for China: Principle, Methodology and Verification. Earth Syst. Sci. Data 2023, 15, 1911–1931. [Google Scholar] [CrossRef] [Scilit]
  10. Yang, S.; Huang, Q.; Yu, M. Advancements in Remote Sensing for Active Fire Detection: A Review of Datasets and Methods. Sci. Total Environ. 2024, 943, 173273. [Google Scholar] [CrossRef] [Scilit] [PubMed]
  11. Kaufman, Y.J.; Justice, C.O.; Flynn, L.P.; Kendall, J.D.; Prins, E.M.; Giglio, L.; Ward, D.E.; Menzel, W.P.; Setzer, A.W. Potential Global Fire Monitoring from EOS-MODIS. J. Geophys. Res. 1998, 103, 32215–32238. [Google Scholar] [CrossRef] [Scilit]
  12. Justice, C.O.; Giglio, L.; Korontzi, S.; Owens, J.; Morisette, J.T.; Roy, D.; Descloitres, J.; Alleaume, S.; Petitcolin, F.; Kaufman, Y. The MODIS fire products. Remote Sens. Environ. 2002, 83, 244–262. [Google Scholar] [CrossRef] [Scilit]
  13. Giglio, L.; Descloitres, J.; Justice, C.O.; Kaufman, Y.J. An Enhanced Contextual Fire Detection Algorithm for MODIS. Remote Sens. Environ. 2003, 87, 273–282. [Google Scholar] [CrossRef] [Scilit]
  14. Kennedy, P.J.; Belward, A.S.; Gregoire, J.M. An Improved Approach to Fire Monitoring in West Africa using AVHRR Data. Int. J. Remote Sens. 1994, 15, 2235–2255. [Google Scholar] [CrossRef] [Scilit]
  15. Ding, Y.; Wang, M.; Fu, Y.; Zhang, L.; Wang, X. A Wildfire Detection Algorithm Based on the Dynamic Brightness Temperature Threshold. Forests 2023, 14, 477. [Google Scholar] [CrossRef] [Scilit]
  16. Lee, T.F.; Tag, P.M. Improved detection of hotspots using the AVHRR 3.7-um channel. Bull. Am. Meteorol. Soc. 1990, 71, 1722–1730. [Google Scholar] [CrossRef] [Scilit]
  17. Schroeder, W.; Oliva, P.; Giglio, L.; Csiszar, I.A. The New VIIRS 375 m Active Fire Detection Data Product: Algorithm Description and Initial Assessment. Remote Sens. Environ. 2014, 143, 85–96. [Google Scholar] [CrossRef] [Scilit]
  18. Wooster, M.J.; Xu, W.; Nightingale, T. Sentinel-3 SLSTR Active Fire Detection and FRP Product: Pre-Launch Algorithm Development and Performance Evaluation Using MODIS and ASTER Datasets. Remote Sens. Environ. 2012, 120, 236–254. [Google Scholar] [CrossRef] [Scilit]
  19. Zhang, H.; Sun, L.; Zheng, C.; Ge, S.; Chen, J.; Li, J. A Weighted Contextual Active Fire Detection Algorithm Based on Himawari-8 Data. Int. J. Remote Sens. 2023, 44, 2400–2427. [Google Scholar] [CrossRef] [Scilit]
  20. Hong, Z.; Tang, Z.; Pan, H.; Zhang, Y.; Zheng, Z.; Zhou, R.; Ma, Z.; Zhang, Y.; Han, Y.; Wang, J.; et al. Active Fire Detection Using a Novel Convolutional Neural Network Based on Himawari-8 Satellite Images. Front. Environ. Sci. 2022, 10, 794028. [Google Scholar] [CrossRef] [Scilit]
  21. Maeda, N.; Tonooka, H. Early Stage Forest Fire Detection from Himawari-8 AHI Images Using a Modified MOD14 Algorithm Combined with Machine Learning. Sensors 2022, 23, 210. [Google Scholar] [CrossRef] [Scilit] [PubMed]
  22. Hong, Z.; Tang, Z.; Pan, H.; Zhang, Y.; Zheng, Z.; Zhou, R.; Zhang, Y.; Han, Y.; Wang, J.; Yang, S. Near Real-Time Monitoring of Fire Spots Using a Novel SBT-FireNet Based on Himawari-8 Satellite Images. IEEE J. Sel. Top. Appl. Earth Obs. Remote Sens. 2024, 17, 1719–1733. [Google Scholar] [CrossRef] [Scilit]
  23. Xu, Z.; Zhang, Z.; He, G.; Zhang, S.; Long, T.; Wang, G. Adaptive Early Wildfire Monitoring Based on Spatiotemporal Prediction and Himawari 8/9. IEEE J. Sel. Top. Appl. Earth Obs. Remote Sens. 2025, 18, 9396–9408. [Google Scholar] [CrossRef] [Scilit]
  24. Zhang, Q.; Zhu, J.; Dong, Y.; Zhao, E.; Song, M.; Yuan, Q. 10-Minute Forest Early Wildfire Detection: Fusing Multi-Type and Multi-Source Information via Recursive Transformer. Neurocomputing 2025, 616, 128963. [Google Scholar] [CrossRef] [Scilit]
  25. Zhang, L.; Zhang, Q.; Yang, Q.; Yue, L.; He, J.; Jin, X.; Yuan, Q. Near-Real-Time Wildfire Detection Approach with Himawari-8/9 Geostationary Satellite Data Integrating Multi-Scale Spatial–Temporal Feature. Int. J. Appl. Earth Obs. Geoinf. 2025, 137, 104416. [Google Scholar] [CrossRef] [Scilit]
  26. LaHaye, N.; Easley, A.; Yun, K.; Lee, H.; Linstead, E.; Garay, M.J.; Kalashnikova, O.V. Development and Application of Self-Supervised Machine Learning for Smoke Plume and Active Fire Identification from the Fire Influence on Regional to Global Environments and Air Quality Datasets. Remote Sens. 2025, 17, 1267. [Google Scholar] [CrossRef] [Scilit]
  27. Barco, L.; Urbanelli, A.; Rossi, C. Rapid Wildfire Hotspot Detection Using Self-Supervised Learning on Temporal Remote Sensing Data. In Proceedings of the IGARSS 2024—2024 IEEE International Geoscience and Remote Sensing Symposium, Athens, Greece, 2024; IEEE: Piscataway, NJ, USA, 2024; pp. 2061–2065. [Google Scholar] [CrossRef] [Scilit]
  28. Akhyar, A.; Lee, J.; Shahar, N.; Saputro, A.H.; Zulkifley, M.A. Automated forest fire detection in ecological monitoring using enhanced deep learning networks. Sci. Rep. 2026, 16, 2039. [Google Scholar] [CrossRef] [Scilit] [PubMed]
  29. Li, Z.; Li, Z.; Tong, X.; Zhang, J.; Dong, L.; Zheng, Y.; Ma, W.; Zhao, L.; Wang, L.; Wen, L.; et al. Climatic Humidity Mediates the Strength of the Species Richness–Biomass Relationship on the Mongolian Plateau Steppe. Sci. Total Environ. 2020, 718, 137252. [Google Scholar] [CrossRef] [Scilit] [PubMed]
  30. Wang, J.; Wei, H.; Cheng, K.; Ochir, A.; Shao, Y.; Yao, J.; Wu, Y.; Han, X.; Davaasuren, D.; Chonokhuu, S.; et al. Updatable Dataset Revealing Decade Changes in Land Cover Types in Mongolia. Geosci. Data J. 2022, 9, 341–354. [Google Scholar] [CrossRef] [Scilit]
  31. Tan, N.; Alateng, T.; Bao, Y.G.; Gao, Y.Z.; Aori, G.L. Spatiotemporal evolution characteristics of high-frequency grassland fire area in Mongolian Plateau based on a space-time cube. Pratacult. Sci. 2023, 40, 2763–2774. [Google Scholar] [CrossRef]
  32. Xu, G.; Zhong, X. Real-Time Wildfire Detection and Tracking in Australia Using Geostationary Satellite: Himawari-8. Remote Sens. Lett. 2017, 8, 1052–1061. [Google Scholar] [CrossRef] [Scilit]
  33. He, K.; Zhang, X.; Ren, S.; Sun, J. Deep residual learning for image recognition. In Proceedings of the IEEE Conference on Computer Vision and Pattern Recognition; IEEE: Piscataway, NJ, USA, 2016; pp. 770–778. [Google Scholar] [CrossRef] [Scilit]
  34. Hu, J.; Shen, L.; Sun, G. Squeeze-and-excitation networks. In Proceedings of the IEEE Conference on Computer Vision and Pattern Recognition; IEEE: Piscataway, NJ, USA, 2018; pp. 7132–7141. [Google Scholar] [CrossRef] [Scilit]
  35. Grill, J.-B.; Strub, F.; Altché, F.; Tallec, C.; Richemond, P.; Buchatskaya, E.; Doersch, C.; Pires, B.A.; Guo, Z.; Azar, M.G.; et al. Bootstrap Your Own Latent: A New Approach to Self-Supervised Learning. Adv. Neural Inf. Process. Syst. 2020, 33, 21271–21284. [Google Scholar]
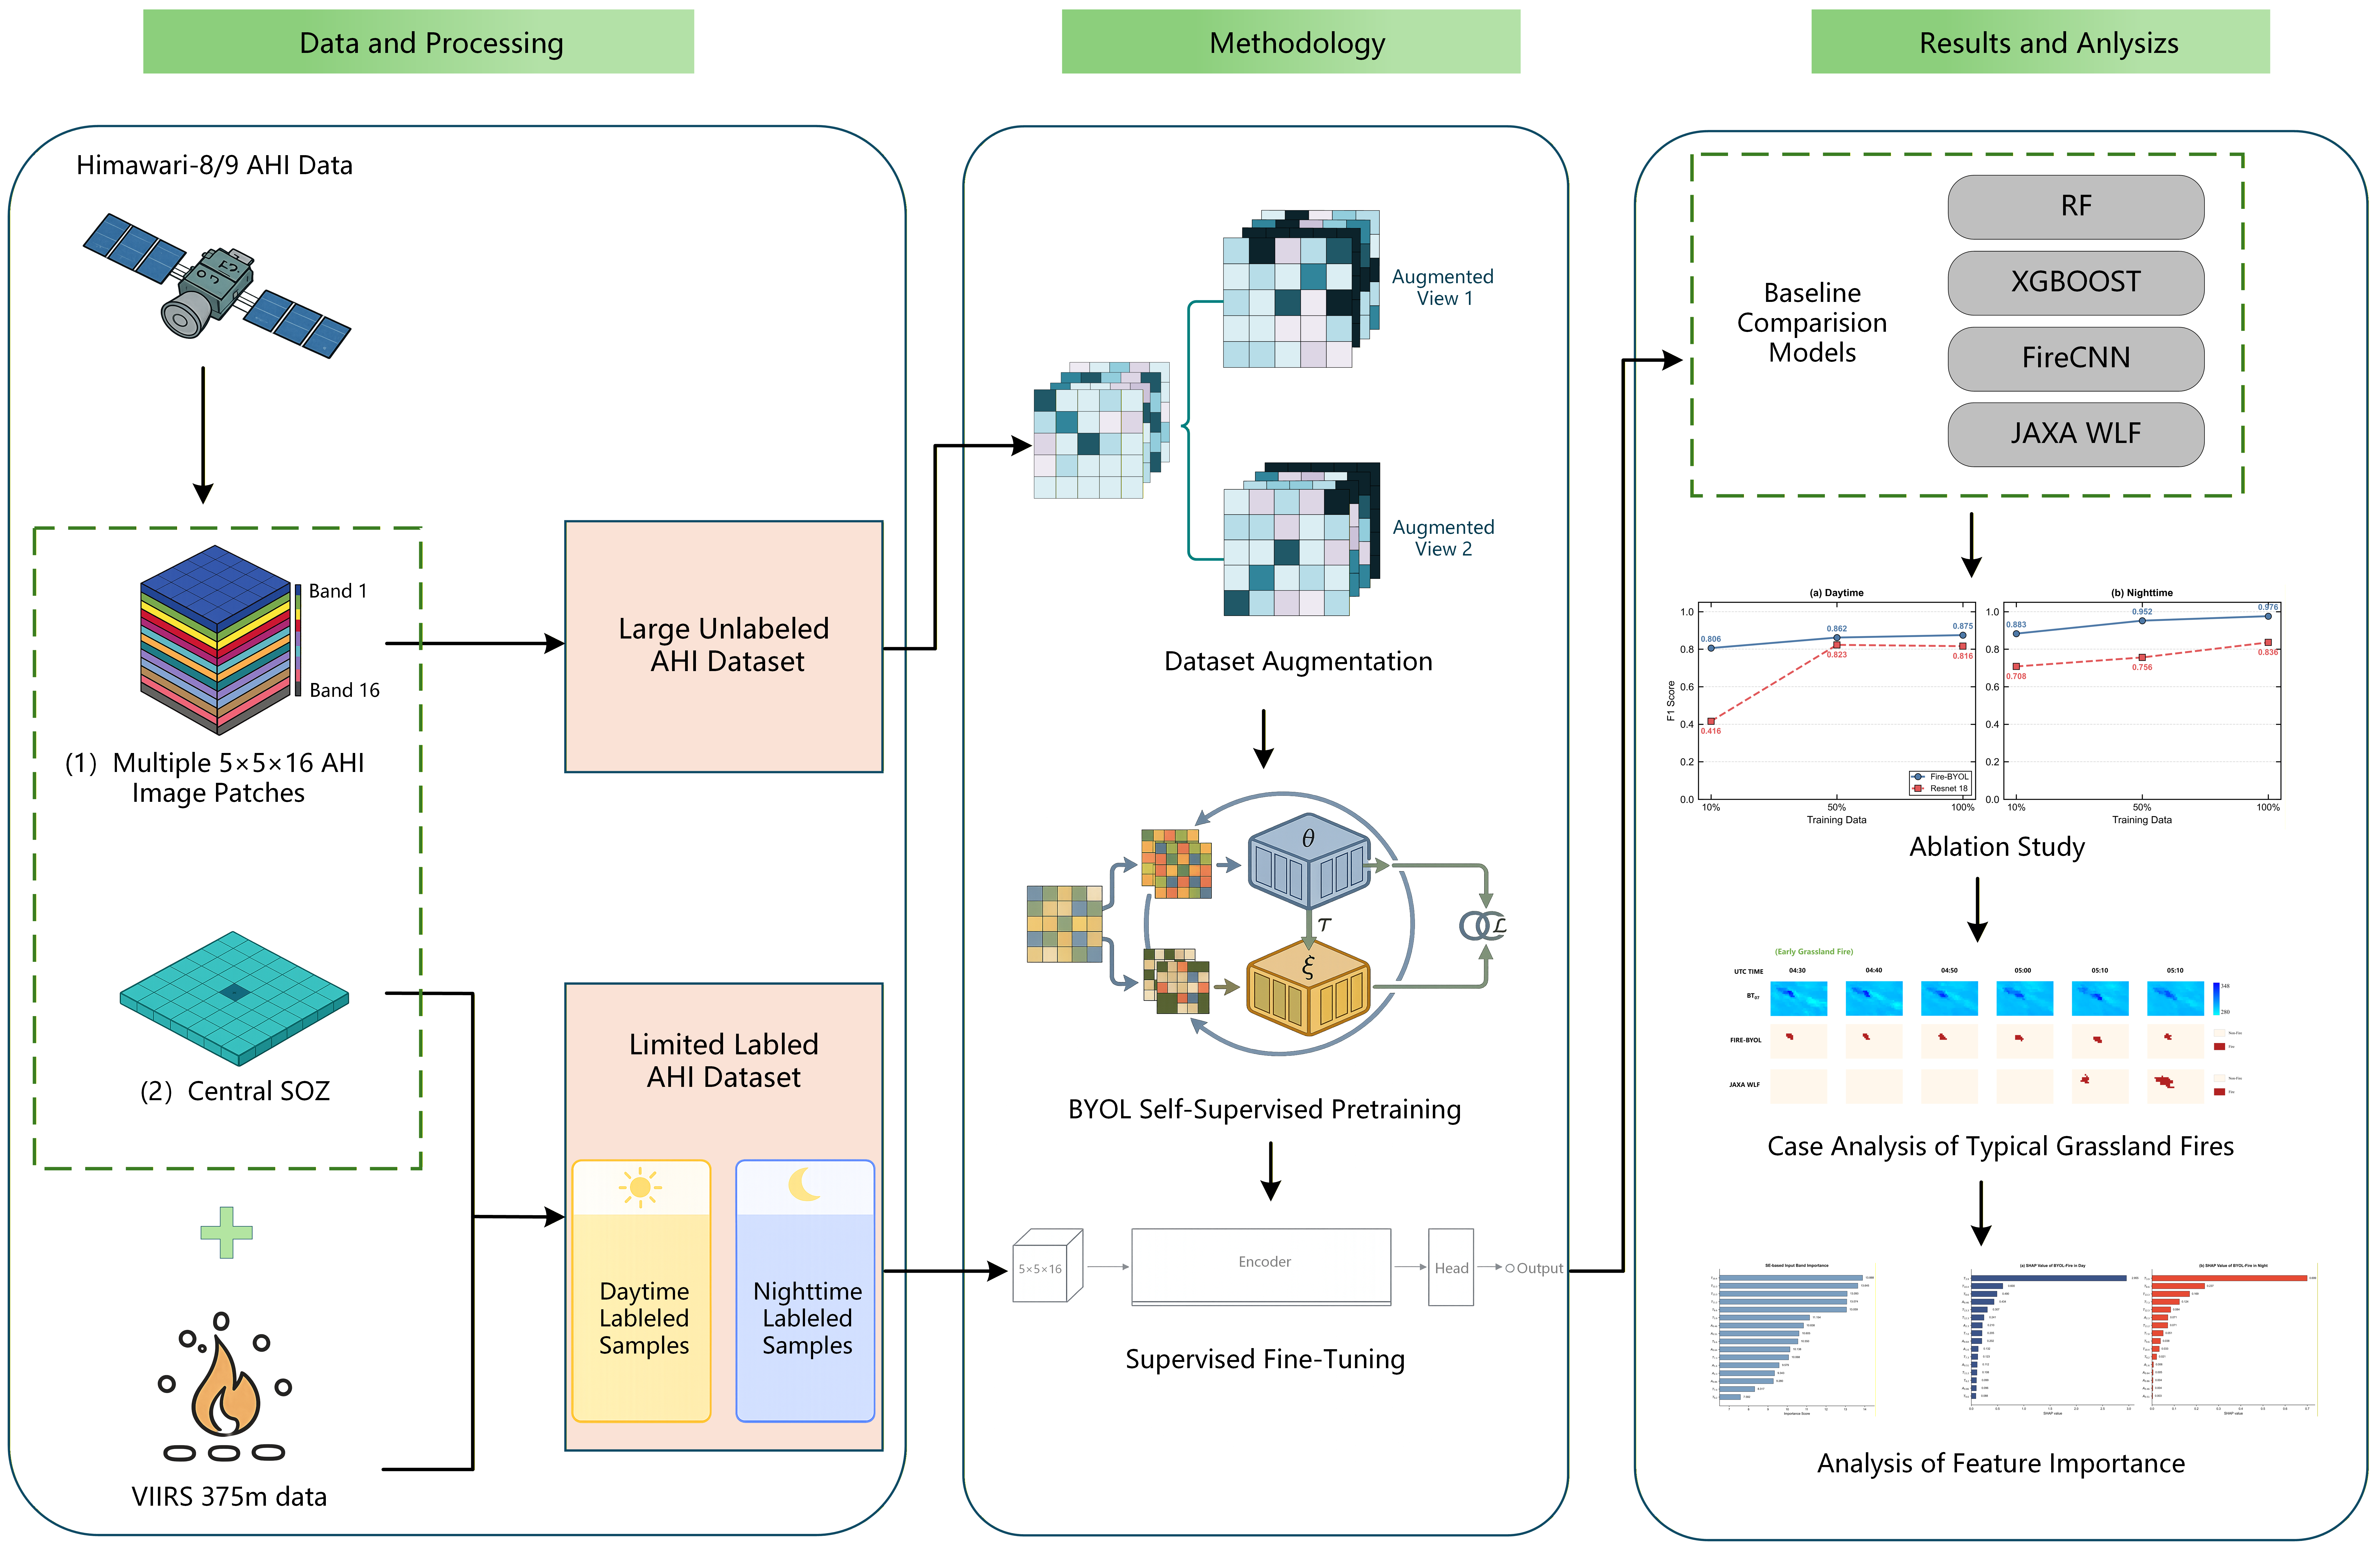
Figure 1. Technical workflow.
Remotesensing 18 02553 g001
Figure 2. Study area. The national boundary is based on the standard map provided by the Ministry of Natural Resources of the People’s Republic of China (Approval No. GS(2024)0650).
Remotesensing 18 02553 g002
Figure 3. Monthly number of VIIRS active-fire pixels during 2015–2025.
Remotesensing 18 02553 g003
Figure 4. Data augmentation methods.
Remotesensing 18 02553 g004
Figure 5. Improved ResNet-18 architecture.
Remotesensing 18 02553 g005
Figure 6. Embedding of the SE mechanism in the network, with Layer 1 as an example.
Remotesensing 18 02553 g006
Figure 7. Principle of BYOL self-supervised learning.
Remotesensing 18 02553 g007
Figure 8. Variation curve of the pre-training loss function.
Remotesensing 18 02553 g008
Figure 9. Above, t-SNE density map of BYOL pre-trained features.
Remotesensing 18 02553 g009
Figure 10. Confusion matrices of the daytime and night-time models on the test sets.
Remotesensing 18 02553 g010
Figure 11. Performance comparison of FIRE-BYOL with and without pre-training under different training data proportions.
Remotesensing 18 02553 g011
Figure 12. Visualization of the Himawari BT07 band and detection results from FIRE-BYOL and the JAXA WLF product for the grassland fire on 20 April 2023.
Remotesensing 18 02553 g012
Figure 13. Visualization of the Himawari BT07 band and detection results from FIRE-BYOL for the grassland fire on 7 October 2024.
Remotesensing 18 02553 g013
Figure 14. Input band importance ranking derived from the SE module in the pre-trained encoder.
Remotesensing 18 02553 g014
Figure 15. Comparison of SHAP-based band importance between the daytime and night-time FIRE-BYOL models.
Remotesensing 18 02553 g015
Figure 16. Distribution of T 3.9 and SOZ for TP, FP, and FN samples in the daytime and night-time test sets.
Remotesensing 18 02553 g016
Figure 17. Large-area false detections produced by FIRE-BYOL at 10:00 UTC.
Remotesensing 18 02553 g017
Figure 18. Histogram of the pre-training unlabeled data classified by SOZ.
Remotesensing 18 02553 g018
Table 1. Number of 2 km active-fire pixels at selected time steps.
TimePointsTimePoints
20230409175010420230501192021
2022041904509520250309172021
2023040818107120230410052019
2022041918505820230409193018
2023050117405120190501052017
2022041917105020180531185016
2018032705202520191028054014
2022102804502520160420181013
2016043006102220190505054013
Table 2. Performance evaluation of FIRE-BYOL, RF, FireCNN, and XGBoost on the daytime and night-time test sets.
ModelAccuracyPrecisionRecallF1TPFPTNFN
Daytime
FIRE-BYOL0.97730.87770.87140.874612217138318
FireCNN0.97660.87140.87140.871412218138218
RF0.97470.95500.75710.84461065139534
XGBoost0.97400.84720.87140.859212222137818
Nighttime
FIRE-BYOL0.99581.00000.95380.97646206503
FireCNN0.98740.98280.87690.92685716498
RF0.99300.92861.00000.96306556450
XGBoost0.99300.98390.93850.96066116494
Table 3. Results of pre-training ablation study under linear evaluation.
ModelAccuracyPrecisionRecallF1TPFPTNFN
FIRE-BYOL0.96100.90340.63900.748613114203674
Without noise0.95790.88730.61460.726212616203479
Without channel dropping0.93350.87670.31220.46046492041141
Without SE0.94860.77640.60980.683112536201480
Disclaimer/Publisher’s Note: The statements, opinions and data contained in all publications are solely those of the individual author(s) and contributor(s) and not of MDPI and/or the editor(s). MDPI and/or the editor(s) disclaim responsibility for any injury to people or property resulting from any ideas, methods, instructions or products referred to in the content.