Review

Deep Learning Applications in Remote Sensing for Forest Inventory Methods

1
Department of Forestry and Natural Resources, Purdue University, West Lafayette, IN 47907, USA
2
Department of Geography & Earth Sciences, US Military Academy, West Point, NY 10996, USA
3
School of Life Resources, Dankook University, Cheonan 31116, Republic of Korea
4
Lyles School of Civil and Construction Engineering, Purdue University, West Lafayette, IN 47907, USA
*
Author to whom correspondence should be addressed.
Remote Sens. 2026, 18(15), 2490; https://doi.org/10.3390/rs18152490
Submission received: 1 May 2026 / Revised: 2 July 2026 / Accepted: 11 July 2026 / Published: 31 July 2026

Highlights

What are the main findings?
  • Deep learning can support forest inventory tasks, including tree counting and localization, species identification, and structural measurements, across diverse remote sensing platforms.
  • Integrating complementary data sources (e.g., optical imagery and LiDAR) generally improves inventory accuracy and robustness, although performance remains strongly shaped by forest complexity and reference-data quality.
What are the implications of the main findings?
  • The field needs to shift from reporting peak accuracy to demonstrating transferability across forest types, regions, species compositions, and acquisition conditions.
  • Shared, standardized reference datasets and consistent validation protocols are needed to move deep learning from promising demonstrations to reliable operational forest inventory.

Abstract

Forests play an important role in timber and fiber production, carbon storage, biodiversity conservation, and various other ecosystem services, necessitating accurate and scalable inventory methods. Recent advances in remote sensing have enabled large-scale forest monitoring; however, challenges remain in extracting reliable information across varying spatial, temporal, and environmental conditions. Deep learning has emerged as a promising tool for addressing these limitations by learning complex patterns from diverse remote sensing data sources. This review synthesizes deep learning applications in forest inventory methods across three tasks: tree counting and localization, tree species identification, and tree measurement. In total, we evaluated 122 unique primary studies (37 for tree counting and localization, 57 for species identification, and 29 for tree measurement, with one study contributing to both the counting/localization and measurement tasks) spanning terrestrial, unmanned aerial vehicle (UAV), airborne, and satellite platforms, with a primary focus on optical imagery, Light Detection and Ranging (LiDAR) data, and their fusion. Across these studies, deep learning models frequently outperformed conventional machine learning and statistical baselines, with reported gains including up to 18% improvements in biomass estimation accuracy from data fusion and individual-tree species classification accuracies exceeding 90% for select architectures. However, performance differences were influenced strongly by forest structure, species complexity, sensor capability, and validation design. Counting and localization were generally more reliable in plantations than in complex natural or urban forests, while LiDAR was particularly valuable in dense, multilayer canopies. Species-identification accuracy was highest in studies with small, distinctive species sets, whereas mixed stands with many species showed lower accuracy. Only about a third of the reviewed studies (42 of 122) were externally validated on data or sites independent of model training, and reference data for tree measurement tasks were rarely based on direct destructive sampling. External validation often revealed lower performance than within-study testing, suggesting that reported accuracies may overestimate performance in new locations or conditions. Major advances are evident in the growing use of high-resolution UAV and smartphone-based imagery for tree-level analysis, the continued value of LiDAR for structural characterization, and the increasing integration of multimodal data fusion to improve detection, classification, and measurement accuracy. Persistent challenges include the limited availability of high-quality reference data, class imbalance and inconsistent species coverage, and weak model transferability across forest types, environmental conditions, and geographic regions. Future progress will likely depend on three priorities: development of larger and more standardized labeled datasets, stronger integration of structural, spectral, and phenological information, and the design of more transferable and application-oriented deep learning frameworks. Overall, this review provides a comprehensive, quantitatively grounded overview of deep learning-driven forest inventory methods and outlines future directions for improving scalability and applicability in forest monitoring and management.

1. Introduction

Forests cover approximately 31%, or 40 million square kilometers, of the Earth’s surface and provide important ecosystem services. These vital ecosystems store roughly 861 gigatons of carbon, equivalent to about 24 years’ worth of all carbon emissions at current levels [1,2]. Additionally, forests serve as a primary biome, harboring approximately 80% of land-based plant, animal, and insect species according to the United Nations [3]. Their importance, therefore, cannot be overstated, and effective monitoring and managing of forested land requires the ability to count and localize individual trees, identify tree species, and measure morphological features.
Quantifying forest resources is crucial for estimating productivity, assessing ecosystem functions, and supporting efficient management practices. However, current forest inventory methods face several challenges. Remote sensing techniques have advanced to address these needs across spatial and temporal scales [4]. Nevertheless, remote sensing data collection presents unique challenges in forested environments. Current and traditional remote sensing approaches for forest inventory do not always extrapolate well across spatial resolutions, as individual-tree measurements are often limited to high-resolution Light Detection and Ranging (LiDAR) data and can be challenging to integrate effectively into satellite-based multispectral image analysis [5]. Seasonality also poses challenges in forests where consistent temporal coverage from remotely sensed data is limited and the environment is affected by seasonal changes such as cloud cover, snow, and phenological variation [6,7]. Individual tree-level analysis using remote sensing has been an active area of research for several decades; early methods for automated tree-crown detection and delineation relied on hand-engineered algorithms such as local maximum filtering, watershed segmentation, and template matching applied to high-resolution optical imagery [8], approaches that deep learning has since substantially extended in both accuracy and applicability.
Deep learning tools may help address these challenges because they can learn complex problems from large amounts of data [5,9,10,11]. Wang et al. [12] provide a broad overview of deep learning applications across forestry domains, including timber quality evaluation, forest resource survey, and tree species identification, demonstrating that deep learning can outperform traditional machine learning methods across diverse forestry tasks when sufficient training data are available. Remote sensing datasets often consist of high spatial resolution or density at small spatial scales, but lower spatial resolution or density at large scales. In both cases, they present data challenges that are well-suited for deep learning methods [13,14,15,16]. Current deep learning applications in forestry can be broadly categorized into several research areas, including land cover and ecosystem mapping, forest health monitoring, and tree inventory. An increasing number of studies appear to incorporate multi-temporal imagery and attention-based temporal models to capture phenological changes that may improve species identification and disturbance detection [17,18,19].
Land cover and ecosystem mapping uses deep learning to analyze large-scale datasets, identifying and delineating the boundaries of natural forests, urban forests, and plantations. This process may also involve categorizing forests by type based on phenological characteristics (e.g., deciduous, coniferous, mixed) or by climatic zones (e.g., boreal, temperate, tropical) [20,21,22,23]. The resulting products may help inform stakeholders on a range of topics including deforestation and reforestation, biomass estimation, or climate change impacts.
Deep learning applications for forest health monitoring encompass the detection of environmental stressors such as disease, pest infestations, and drought [24,25]. Additionally, deep learning has also been applied to wildfire detection, monitoring, and prediction, suggesting its potential utility in resource management [26,27]. These applications range from identifying and assessing the health of individual trees to monitoring the condition of forest landscapes across regions or countries, often based on unique multispectral or hyperspectral features [14,16,28].
The goal of this review paper is to examine how deep learning can be applied to forest inventory methods. Here, we review deep learning applications in forest inventory methods, including tree counting and localization, tree species identification, and tree measurement. We consider studies using terrestrial, UAV, airborne, and satellite platforms, with an emphasis on LiDAR data, optical imagery, and optical-LiDAR fusion. By leveraging these insights, our study contributes to the evolving landscape of deep learning applications in forestry, offering new perspectives for remote sensing in forestry applications. Lastly, we identify research gaps, thereby providing a comprehensive overview and advancing the field.

2. Methodology and Study Selection

This review was conducted as a narrative literature review with structured search elements rather than as a fully systematic review. Literature was identified through keyword searches conducted by topic leads responsible for major sections of the manuscript, including tree counting and localization, tree species identification, and tree measurement. Searches were conducted using Google Scholar and academic database or publisher search tools available to the authors, with additional studies identified through backward and forward citation tracing from highly relevant articles and prior review papers. Search terms combined deep learning and model-related terms, including “deep learning”, “convolutional neural network”, “CNN”, “artificial intelligence”, “machine learning”, “semantic segmentation”, “instance segmentation”, “object detection”, and “data fusion”, with remote sensing and forest inventory terms, including “remote sensing”, “LiDAR”, “UAV”, “drone”, “airborne”, “satellite”, “forest inventory”, “tree detection”, “tree counting”, “tree localization”, “tree crown”, “tree species identification”, “DBH” (diameter at breast height), “tree height”, “biomass”, and “volume”. Searches emphasized peer-reviewed, English-language publications relevant to remote sensing-based forest inventory and deep learning applications published through March 2026.
Studies were retained when they applied, evaluated, or reviewed deep learning or closely related machine learning methods for one or more forest inventory tasks aligned with the scope of this review: tree counting and localization, tree species identification, and tree measurement. Citations used only to explain general deep learning concepts, model architectures, remote sensing principles, or broader ecological context were included as background references but were not treated as reviewed forest-inventory studies. Studies focused primarily on general land-cover mapping, forest health monitoring, wildfire detection, disturbance mapping, or non-remote-sensing inventory methods were excluded unless they directly informed one of the three inventory tasks reviewed here. Because the manuscript was developed collaboratively across topical writing teams rather than through a preregistered systematic review protocol, initial retrieval counts, duplicate removal counts, and full screening counts were not recorded consistently across all sections. As a result, this review should not be interpreted as Preferred Reporting Items for Systematic Reviews and Meta-Analysis (PRISMA) compliant, and potential omission or selection bias is acknowledged as a limitation.
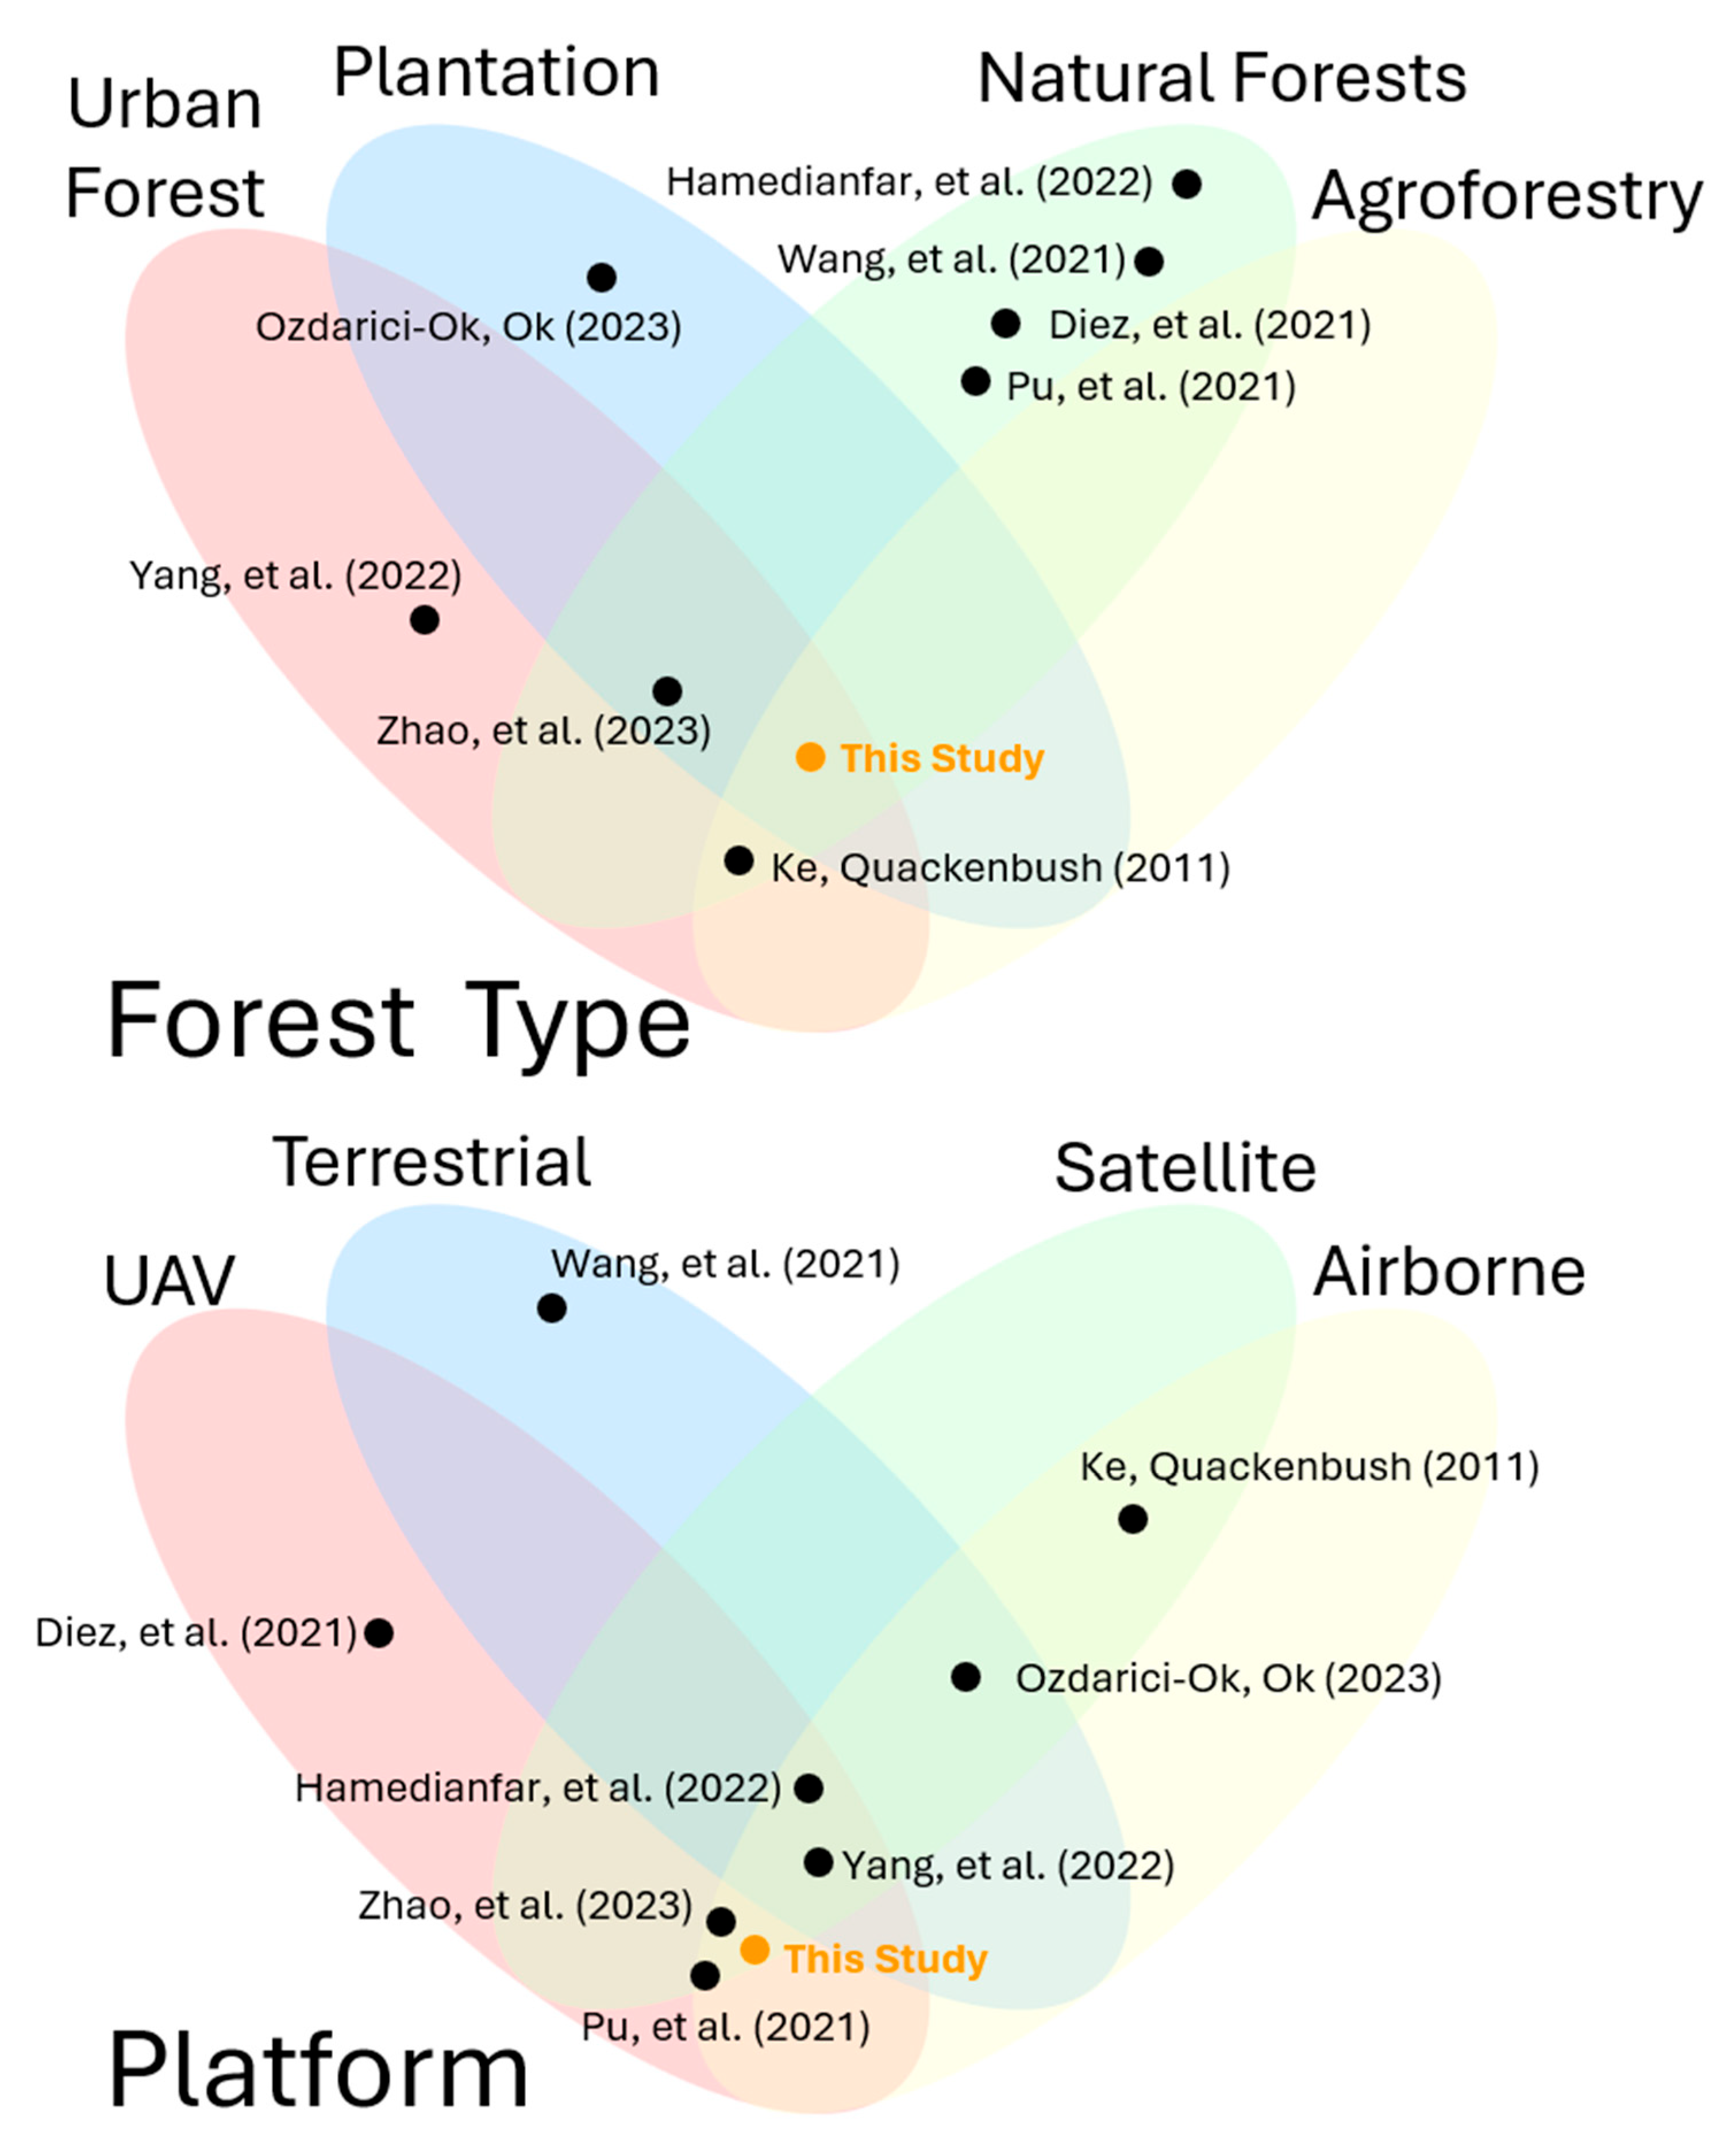
Prior review papers were screened to identify review papers at the intersection of remote sensing and tree inventory, specifically focused on deep learning. We found eight deep learning-focused review papers which form a critical foundation for understanding the integration of deep learning techniques with forestry and remote sensing. Our work uniquely extends beyond the limitations of urban forests, natural forests, agroforestry, plantation forests, or their combinations. Some prior reviews predate the widespread adoption of deep learning and focus exclusively on species classification without addressing tree counting, localization, or measurement [29,30]. Others are constrained by forest type or setting, covering only urban environments [31], cultivated orchard contexts [32], or UAV data exclusively, without addressing natural or plantation forests across the full inventory pipeline. Our literature review is one of only three, alongside Hamedianfar et al. [10] and Yang et al. [5], that is not limited by data collection platform type, exploring terrestrial, UAV, airborne, and satellite platforms (Figure 1). Citations used only to explain general deep learning concepts, model architectures, remote sensing principles, or broader ecological context were included as background references but were not treated as reviewed forest-inventory studies.

3. Deep Learning Basics

3.1. Summary of Deep Learning

Deep learning is a subset of machine learning where models recognize patterns in large amounts of data by passing information through multiple analytical layers, forming what is called a neural network [33,34,35]. These layers consist of neurons (or nodes), which receive data input, multiply the input by learnable weights, and add a bias. Each neuron then applies an activation function to introduce non-linearity, allowing the model to learn more complex patterns beyond just simple, straight-line relationships. The result from each layer is passed on to the next, creating a hierarchy of learning.
The weights of the neurons are adjusted through a method called backpropagation, in which the error in model prediction (measured through a loss function) is used to calculate gradients to determine distance and direction for individual weight changes [35,36]. This optimization is carried out using an algorithm such as gradient descent, which adjusts the weights step by step to minimize errors. Repetition of this process through training epochs, where the entire dataset is passed through the model per epoch, results in gradual but consistent improvement in model performance. As more epochs are completed, the network refines its understanding of the data, learning to generalize and make accurate predictions on unseen examples.
In contrast to deep learning, traditional machine learning models such as Random Forests (RF) and Support Vector Machines (SVMs) rely on manually selected features and simpler structures [37,38]. With these models, the process often begins with feature engineering, where analysts prescribe the features or patterns as input for the model. For example, in RF, the model creates many decision trees based on these features and averages their results to make predictions. Similarly, SVMs try to find the best boundary (or hyperplane) that separates different classes in the data in multi-dimensional space, but again, this depends on the features provided.
The key difference is that deep learning models can automatically learn and extract relevant features from raw data (like images or text) through multiple layers of neurons, while traditional models rely on predefined, simpler feature sets. Additionally, deep learning models generally perform better with large, complex datasets and can capture more intricate patterns, whereas RFs and SVMs are often more efficient and interpretable on smaller, structured datasets. However, they may struggle with highly complex problems without significant preprocessing or feature engineering.

3.2. Deep Learning Models and Architectures

Deep learning models applied to remote sensing data sources generally fall into one of two categories: object detection and segmentation. Object detection models identify specific objects in remote sensing scenes and draw bounding boxes, or other object-specific shapes, around those objects as a method of identification. This approach is useful for tasks such as detecting individual trees, locating buildings, or identifying vehicles in optical imagery. Object detection models, such as YOLO (You Only Look Once), Faster Region-Based Convolutional Neural Network (Faster R-CNN), and SSD (Single Shot MultiBox Detector), excel in scenarios where the goal is to detect and classify distinct objects across a scene [39,40,41].
Segmentation models, on the other hand, focus on the arrangement and characteristics of individual pixels to classify them into a prescribed category. There are two main types of segmentation: semantic segmentation and instance segmentation. Semantic segmentation assigns a label to every pixel in an image, grouping pixels with similar characteristics. Common applications include land cover/land use classification, building segmentation, and crop and vegetation mapping. In contrast, instance segmentation provides more detail by not only classifying each pixel but also differentiating between separate instances of the same class (e.g., distinguishing between individual trees). Popular architectures for semantic segmentation include U-Net, DeepLab, and Fully Convolutional Networks (FCN) [42,43,44]. Common instance segmentation architectures include Mask R-CNN, Detectron2, and Segmenting Objects by Locations (SOLO) [45,46,47]. More recently, foundation model approaches such as generic segmentation networks that can be fine-tuned with only a few tree crown annotations may reduce the amount of manual labeling required for new inventories.
Recently, transformer-based models have emerged as powerful tools in remote sensing applications. Transformers were originally developed for natural language processing but have been adapted to operate with other data forms, such as imagery and 3D point clouds. Popular transformer architectures in vision tasks include the Vision Transformer (ViT), which operates directly on image patches; Swin Transformer, which uses hierarchical feature maps to capture both local and global contexts; and Data-efficient Image Transformer (DeiT), known for its efficient training requirements [48,49,50]. A key feature of transformers is the presence of an “attention” mechanism, which excels at capturing long-range data dependencies, allowing for the contextualizing of data relationships beyond the spatial extent of traditional convolutions. Hybrid designs that combine a CNN backbone with a transformer head are now commonly used to fuse image and LiDAR features within a single network.
Recent advances in LiDAR sensing technologies have expanded the potential for long-range, high-resolution, and rapid acquisition of 3D point clouds with millimeter-level accuracy, providing practical alternatives to conventional forest inventory methods. A point cloud is a widely used 3D data format that represents a scene as a collection of discrete points in space, preserving geometric information without requiring a regular grid or mesh structure. This representation captures the direct 3D geometry of trees, terrain, and infrastructure, while also retaining point-level attributes such as intensity, return number, and spectral information that are useful for classification. It also supports multi-scale data integration across a range of platforms, including terrestrial LiDAR systems (TLS), airborne LiDAR systems (ALS), uncrewed aerial vehicle LiDAR systems (ULS), and mobile LiDAR systems (MLS) deployed on handheld or backpack platforms. In addition, LiDAR point clouds are well suited to deep learning-based analysis, which has further expanded opportunities for automation and advanced interpretation. PointNet and PointNet++ [51,52] are among the commonly used backbone architectures for deep learning on unordered 3D point clouds, making them effective for applications such as tree segmentation and species classification.

4. Tree Counting and Localization

Accurate counting and localization of individual trees are fundamental to comprehensive tree inventory and are important for estimating productivity, assessing ecosystem functions, and mapping tree distribution for efficient management. Studies focused on tree counting and localization seldom cross the boundaries of different forest types, such as plantations, natural forests, and urban forests, due to differences in growth patterns, planting techniques, and species composition. This clear distinction provides a useful way to classify the 37 studies we reviewed here, which span optical imagery, LiDAR, and their fusion across plantation, natural, and urban settings.

4.1. Plantations

Tree counting and localization in plantation settings are often more straightforward than in other forest types because planting patterns are relatively consistent; however, many studies primarily focus on inventorying growth and loss because of their economic implications. We reviewed nine plantation studies, four of which used optical data and five of which used LiDAR data. Given this structure, we first summarized optical-based approaches before turning to LiDAR, noting that explicit deep learning-based fusion of the two data sources remains relatively limited in plantation contexts compared with natural forest studies.

4.1.1. Optical Data

Among plantation studies using optical data, oil palm is the most frequently studied species, owing to its ecological importance, economic value, and distinctive appearance in remote sensing imagery. For example, Ammar et al. used a high-resolution Red, Green, Blue (RGB) imagery dataset collected with a UAV to develop a deep learning model for automated counting and geolocation of palm trees in two regions of Saudi Arabia [53]. They analyzed approximately 11,000 images with several CNN-based models (Faster R-CNN, YOLOv3, YOLOv4, and EfficientDet), achieving the best results with YOLOv4 and EfficientDet, which achieved up to 99% accuracy and a processing speed of 7.4 frames per second (FPS). Similarly, Li et al. used RGB satellite imagery (spatial resolution of 0.6 m to 2.4 m) to develop a deep learning model for detecting and counting oil palm trees in southern Malaysia [54]. Despite variation in training dataset size, the consistently high precision reported across these studies suggests that these methods can support automated inventory of uniformly planted oil palm using high-resolution RGB imagery.
While oil palm accounts for much of the plantation-focused optical research, deep learning has also been applied to other economically important species, often with improved agricultural management and yield prediction as the primary motivation. For example, Wu et al. used aerial imagery collected with a low-cost UAV system to develop a deep learning model for extracting apple tree crowns to improve agricultural management and yield prediction [55]. They collected 50 high-resolution images during dormancy, manually interpreted them, and used a U-Net CNN deep learning algorithm to automatically detect and segment individual trees. Precision and recall metrics were used to evaluate tree counting, achieving accuracies of 91.1% and 94.1%, respectively. Neupane et al. developed a deep learning approach for detecting and counting banana plants using UAV-collected high-resolution imagery for improved agricultural management and yield estimation for a commercial banana farm [56]. They applied a CNN to the imagery and evaluated its performance using precision, recall, and overall accuracy, with respective accuracies of 96.4%, 85.1%, and 75.8% for tree counting. The authors also captured data at altitude variants of 40, 50, and 60 m and found that combining detections from the 40 and 50 m altitude variants increased recall to 99%. These results suggest that model performance in plantation settings is sensitive to acquisition parameters such as flight altitude, a factor that becomes increasingly important in more structurally complex environments.
The combination of CNN-based methods and high-resolution optical imagery generally achieved strong performance for tree counting and localization in plantation systems with regular planting patterns, uniform species composition, and distinctive crown morphology. The reviewed studies also show that detection performance is shaped not only by model architecture, but also by data acquisition and image characteristics, including image spatial resolution, crown overlap in dense plantations, UAV acquisition altitude, and the availability of training samples.

4.1.2. LiDAR

LiDAR remote sensing has been widely applied to individual tree segmentation and structural characterization; however, operational difficulties and high acquisition costs limit the size of achievable training datasets. Two studies explored approaches to address this constraint. Bryson et al. explored the utility of synthetic tree data for training a supervised PointNet++ model to segment individual tree structures from LiDAR point cloud data [57]. The models were tested on several real ALS and mobile laser scanning MLS datasets from different forests, including a commercial pine (Pinus spp.) plantation (ALS data), a commercial plantation (Pinus caribaea, MLS data), and a recreational forest with various species (MLS data). They found that training with synthetic tree data increased the Intersection over Union (IoU) by 1–7%. Taking a different approach to the same problem, Hu et al. developed a point transformer with added self-attention layers and hierarchical clustering to remove non-stem point clouds prior to semantic segmentation [58]. Their algorithms were tested on TLS data acquired in an experimental forest, ranging from coarse to high resolution. The results showed that the mean Intersection over Union (mIOU) of their proposed methods was greater than that of the PointNet++ model (0.976 vs. 0.892).
Beyond training data quality, a second focus in plantation LiDAR research is understanding how environmental configuration factors, such as stem distance, tilted trunks, and point density, affect segmentation accuracy. For example, Liu et al. investigated the factors affecting tree crown segmentation models using UAV-LiDAR data at a density of 105 points/m2 [59]. They tested three different segmentation algorithms—PointNet++, Li2012, and layer stacking—on two 3D tree point clouds derived from LiDAR and photogrammetry in mixed and broadleaf plantations. Their findings indicate that tree species have the most significant impact on segmentation accuracy, followed by the choice of segmentation algorithm. Windrim and Bryson similarly focused on adaptability, developing an automated segmentation framework for high-density ALS data in pine plantations that was designed to handle variable point cloud densities and partial occlusions [60]. The F1-scores, or the harmonic mean of precision and recall, for their methods were 0.962 and 0.780 respectively for their study areas. Similarly, Wang et al. used the Faster R-CNN algorithm for tree point cloud segmentation with MLS data collected in rubber plantations [61]. Their approach addressed challenges posed by tilted tree trunks and adventitious twigs and leaves. The point clouds were voxelized and transformed into deep images using a projection strategy suitable for Faster R-CNN. Their method achieved recall, precision, and F1-scores of 0.98, 0.99, and 0.98, respectively.
The LiDAR-based plantation studies generally show promising performance, but these results should be interpreted in relation to the regular structure of planted forests. Uniform spacing and simpler stand composition make individual stems and crowns easier to separate than in natural forests. At the same time, plantation datasets still present important challenges, including tilted stems, overlapping branches, foliage, and variation in point density. Direct point-cloud models such as PointNet++, point transformer networks, and self-attention-based point models can preserve 3D stem and crown geometry and are therefore more suitable when the task requires separating stems from branches or handling non-vertical tree forms. Projection-based methods, such as Faster R-CNN applied to voxelized point clouds or depth-image representations, are more practical when plantation structure is clearly expressed in 2D and when mature image-based detectors are desired. However, projection may discard vertical or occluded structural cues that are important for complex branching. These findings suggest that high accuracy in plantation LiDAR studies reflects both model capability and the relatively simple structure of the target stands, while broader transfer will depend on how well models handle non-ideal stem form, foliage, and point-density variation.

4.2. Natural Forests

Segmenting individual trees for counting and localization in natural forests poses challenges because of their complex morphological and environmental characteristics. Most of the studies covered in this review focused on mixed deciduous and coniferous forests, with variation in training data availability, resolution or point density, study area size, species traits, and forest structures (e.g., stem density), all of which influenced model results. We reviewed 22 natural-forest studies, of which four used optical data, 15 used LiDAR data, and three combined both data sources, which are discussed in Section 4.2.1, Section 4.2.2 and Section 4.2.3.

4.2.1. Optical Data

Deep learning applied to high-resolution imagery has produced reasonably good tree counting and localization accuracies in natural forests. For example, Li et al. achieved moderately high accuracy in tree counting (F1-score of 0.77, recall of 0.69, and precision of 0.96) and extended conventional plot-scale approaches by using deep learning techniques that provide inventory data at a national scale [62]. Yao et al. similarly achieved high accuracy with their CNN model, designed to extract spatial features pertinent to tree crowns [63]. The authors reported an R2 score of 0.93 on their independent test set; however, this figure should be interpreted with caution, as training and test sets were established through visual inspection of available imagery rather than field-validated reference data, and the model showed systematic underestimation in dense canopies where occlusion was common. These factors may inflate the reported accuracy relative to what would be expected against independently collected ground truth.
Many other studies highlight the difficulty of tree localization in natural environments, even with advanced deep learning algorithms. For example, Culman et al. used 20 cm resolution RGB orthophoto imagery collected in a natural palm forest in the remote Alicante province of Spain to test the sensitivity of a RetinaNet model to natural environmental variability [25]. A pre-training dataset of palm trees from the Canary Islands was used to train the model, which was then transferred and retrained on the Alicante imagery. They found that the variable appearance and size of natural palm trees influenced model performance, with an accuracy of 84.7%. Similarly, Tao et al. reported that environmental variability reduced model performance for detecting individual dead pine trees in natural settings [64]. They collected high-resolution UAV imagery and applied CNN-based classifiers, finding that variations in color and texture cause accuracies to drop to 65–80%; however, applying the trained CNN models increased accuracies to 93.3% and 97.38% for AlexNet and GoogLeNet, respectively.
More recently, semi-supervised approaches have been explored to reduce annotation costs while maintaining accuracy in complex environments. To address the high annotation costs of supervised models and the poor boundary delineation of unsupervised methods, Wang et al. proposed a semi-supervised framework applied to Chinese fir plantations [65]. Their approach integrates unsupervised pseudo-label generation, derived from canopy height model [CHM] outputs, with a staged Mask R-CNN fine-tuning strategy. Requiring only 40% of standard expert annotations, it yielded a 0.42 F1 improvement over unsupervised baselines. Notably, the higher native spatial resolution of UAV RGB imagery consistently outperformed resampled LiDAR-derived inputs for precise crown boundary delineation, highlighting the value of high-resolution optical data for this task.
Despite more variable performance than in plantation settings, using optical data for tree counting and localization in natural forests has achieved promising results. Compared with plantations, natural forests lack regular spacing and uniform crown morphology, making optical-image-based detection more sensitive to canopy occlusion, variation in crown size and appearance, and differences in color and texture. Reported accuracies also depend on how reference labels are generated, particularly when training and validation data are based on visual interpretation of imagery rather than field-validated observations. Semi-supervised approaches may reduce the need for dense expert annotations, but their effectiveness can still be influenced by pseudo-label quality and the difficulty of delineating crowns in dense or structurally complex stands.

4.2.2. LiDAR

Optical and LiDAR data share the challenge of localizing trees with overlapping crowns; however, LiDAR offers the advantage of canopy penetration, particularly when collected during leaf-off seasons. Early deep learning applications often focused on broad estimation rather than precise structural delineation. For instance, Ayrey and Hayes developed a deep learning model for directly estimating the number of individual trees at the plot level (10 m × 10 m) using sparse ALS data (9–15 points/m2) from eight natural mixed forests [66]. Testing five CNN architectures, they found that Inception-V3 produced results most consistent with field survey data (Pseudo R2 = 0.43). While this approach allowed for application across a larger spatial extent, it came at the cost of accuracy in finer detail.
As the field progressed, models shifted toward region-based detection algorithms applied to 2D LiDAR derivatives to capture finer structural detail. Xi and Hopkinson applied CenterNet, an anchor-free model, to TLS-derived crown height maps, achieving an F1-score of 0.754, though distinct morphological traits across species introduced variability [67]. Similarly applying region-based methods, You et al. evaluated multiple algorithms on UAV-LiDAR data in mangrove forests [68]. While their bird’s eye view (BEV) Faster R-CNN model performed well in areas with low stem density (F1-score of 0.931), localization accuracy declined in denser regions.
Because these 2D region-based approaches struggle with dense canopies, recent studies have shifted toward advanced 3D LiDAR point cloud clustering techniques to resolve inherent under- and over-segmentation issues. Zhong et al. developed a robust instance segmentation network that replaced conventional geometric centers with a breast-height centroid anchoring strategy to mitigate canopy overlap errors [69]. Their adaptive clustering strategy dynamically adjusted search radii based on local point density, achieving a 91.55% correct detection rate. Also focusing on density-sensitive adjustments, Ma et al. introduced a dynamic two-stage approach using UAV LiDAR point clouds [70]. Their novel climbing algorithm filters false canopy peaks and performs adaptive top-down clustering based on local tree spacing, maintaining an F1-score of 0.86 in severely overlapping conditions. In a separate study, Ma et al. developed a multi-branch framework that incorporates contextual semantic information [71]. Using cross-attention and contrastive learning through Semantic-Driven and Online Semantic Clustering modules, this approach achieved competitive F1-scores across both urban MLS (80.26%) and forest UAV LiDAR (79.5%) datasets.
Recent deep learning-based segmentation models for forestry have increasingly shifted their focus from semantic segmentation alone to tree instance segmentation. ForAINet is one such example, using UAV point clouds to jointly perform semantic and instance segmentation while estimating per-tree attributes such as height, crown structure, and DBH [72]. The model achieved an F1-score of over 85% for individual tree detection and a mean IoU of over 73% across five semantic categories, including ground, low vegetation, stems, live branches, and dead branches. Building on this, ForestFormer3D [73] extended the approach into a unified transformer-based end-to-end pipeline with improved generalization in structurally complex forests, while TreeLearn pursued greater automation through a fully automated approach to tree instance segmentation from ground-based LiDAR data [74]. More broadly, sensor- and platform-agnostic networks such as SegmentAnyTree [75] and Point2Tree [76] highlight the potential of deep learning to reduce the gap between different data sources, particularly within terrestrial and mobile scanning scenarios.
To further improve these advanced models, researchers have addressed training data quality and environmental noise. Sun et al. applied generative adversarial networks (GANs) to generate synthetic height maps, augmenting their dataset to improve YOLO-v4 segmentation accuracy [15]. Similarly, Kim et al. focused on preprocessing MLS data by downsampling point clouds to optimize PointNet++ training, achieving a marked accuracy increase from 79.8% to 92.2% [77]. Beyond point density adjustments, Shao et al. focused on understory vegetation separation and removal in natural environments, as understory vegetation increases scene clutter and occlusion and thus makes it more difficult to reliably isolate stem and crown points for segmentation and subsequent biometric estimation [78]. Their U-Net-based tree-understory segmentation separates tree points from understory points, thereby improving the quality of segmented inputs and increasing the robustness of subsequent geometric estimation for DBH, tree height, and stem volume (89.2% IoU for understory removal, 99.4% F-score for stem detection, and 91.5% IoU for stem segmentation).
Addressing the computational constraints of processing dense point clouds, Jarahizadeh and Salehi introduced Tree-Net, an efficient one-stage deep learning architecture [79]. Using multi-band rasterized UAV LiDAR inputs, including vertical density and canopy height, Tree-Net addresses the feature extraction constraints that cause false detections in dense canopies. This optimized architecture improved computational efficiency by 60% compared to Modified YOLO, achieving an F1-score of 0.90 on the Heiberg dataset and demonstrating robust cross-domain generalization.
In natural forests, the relative advantages of different LiDAR-based models are closely tied to forest structure, data resolution, and the way 3D information is represented. Methods based on LiDAR-derived height maps can be effective when individual crowns are clearly expressed on the canopy surface, but their performance tends to decline when crowns overlap, stem density increases, or tree forms vary substantially among species. Within these projected representations, anchor-free detectors such as CenterNet are useful when crown size and morphology are variable because they avoid predefined anchor settings and localize trees from flexible center-based cues. However, center-based localization becomes less reliable when crown centers are obscured or merged in multilayer canopies. Region-based detectors such as Faster R-CNN are better suited to low- or moderate-density stands where BEV or canopy-height representations preserve distinct object boundaries, but their proposal quality can deteriorate in dense natural forests where overlapping crowns collapse into ambiguous 2D regions. Recent 3D point-cloud-based approaches, including ForAINet, ForestFormer3D, TreeLearn, SegmentAnyTree, and Point2Tree, address some of these limitations by using vertical structure, local point density, and stem-crown relationships more directly. Therefore, the reviewed studies do not suggest that one model family is consistently superior under all conditions. Instead, anchor-free and region-based detectors remain useful for efficient crown-level localization in structurally simpler stands, whereas dense, overlapping, or multilayer natural forests are better suited to 3D instance-level methods when the goal is reliable stem localization or complete tree segmentation.

4.2.3. Data Fusion

In natural forests, where spectral and structural complexity often limits single-sensor performance, data fusion has been explored as a way to combine the complementary strengths of optical imagery and LiDAR. This approach may be advantageous in forests with diverse tree species, where optical remote sensing contributes spectral and textural information and LiDAR contributes structural and three-dimensional characteristics [14,80]. Our review also suggests that data fusion has become more common in recent years.
For example, Ball et al. applied Detectree2, based on the Mask R-CNN algorithm, to recognize heterogeneous shapes of individual tree crowns from airborne RGB imagery collected in tropical forests [28]. They achieved individual tree segmentation with precision, recall, and F1-scores of 0.640, 0.629, and 0.634, respectively. In a similar approach, Weinstein et al. used LiDAR data for hand annotation and training while employing RetinaNet to detect tree crowns in optical imagery of an oak-dominated woodland, achieving precision and recall of 0.61 and 0.69 [13].
Zhu et al. took a more direct fusion approach, combining UAV-based RGB and LiDAR data within a single pipeline for individual tree segmentation [16]. They conducted a comparative analysis with classical watershed and layer stacking algorithms across plots with varying densities in coniferous, broadleaved, and mixed forests, with training data manually labeled and augmented with horizontal rotations. Tree detection in RGB images with RetinaNet yielded precision, recall, and F1-scores of 0.91, 0.98, 0.94, respectively. Compared with the watershed and layer stacking algorithms, their method improved the F-measure by 6–29% and 7–20%, respectively.
The reviewed fusion studies indicate that combining optical imagery and LiDAR may improve individual tree segmentation in natural forests by linking spectral information with three-dimensional canopy structure. Optical imagery contributes crown texture, color, and boundary information, while LiDAR provides height and structural cues that help separate overlapping crowns. For example, Detectree2 and RetinaNet demonstrate how optical imagery can support crown detection, while LiDAR-derived annotations or structural layers can improve training quality. More direct fusion approaches, such as RGB-LiDAR segmentation pipeline [16] compared against watershed and layer-stacking algorithms, are more suitable when spectral boundaries and vertical structure are both informative. However, using LiDAR only to generate labels or crown masks is different from integrating LiDAR features directly into the model. The former can improve annotation quality but still leaves prediction dependent on optical imagery, whereas feature-level or attention-based fusion allows the model to jointly learn spectral and structural relationships. Fusion does not guarantee better performance in all cases. Its effectiveness depends on spatial co-registration, consistency between sensor resolutions, annotation quality, and the way information from each modality is combined within the model.

4.3. Urban Forests

Urban environments feature complex landscapes containing extensive impervious surfaces dotted with green spaces such as street trees, gardens, parks, and urban forests. Deep learning, coupled with optical or LiDAR remote sensing, may help address some of the challenges of urban forest management in rapidly evolving environments. Although applications in urban settings are less common than in plantation or natural forest contexts, the field is developing, driven in part by the need for detailed and consistent tree monitoring [81]. We reviewed seven urban studies, three of which used optical data and four of which used LiDAR data (one study, Ma et al. [71], also appears in the natural-forest LiDAR discussion above as it was evaluated on both urban and forest benchmarks). Given this context, we summarize optical-based and LiDAR-based approaches in turn, noting that explicit fusion of the two data sources for individual tree localization remains relatively limited in urban studies compared with natural forest research.

4.3.1. Optical Data

Lumnitz et al. applied a Mask R-CNN-based model to count and map trees along urban street networks in the Metro Vancouver area using sub-80 cm street-level imagery from public datasets [81]. They achieved an average precision of 0.68 against ground truth data, demonstrating the model’s transferability across different image sources. The study extended this approach using street-level sources from other urban areas, including Google Street View and Mapillary, validating the model in four additional cities. A related challenge, the positional and identification inaccuracies common in both airborne and ground-level urban sensing, was addressed by Kwon et al. [82] whose deep learning approach achieved approximately 2.0 m positional uncertainty for individual urban trees in Suwon, South Korea. Moving from local to national scale, Firoze et al. developed a generative AI-based approach to automatically localize and monitor urban trees across the United States using satellite imagery [83]. Their fully automated framework was applied to 330 U.S. cities and completed processing in less than a day of computing. The study identified and counted more than 278 million trees, achieving an average tree count accuracy of 92.5% and a spatial accuracy of about 1.5 m. Beyond tree detection, the authors noted the potential of their framework for tracking urban forest change over time and informing sustainable urban planning and management decisions.
Because urban trees occur in highly accessible built environments, they can be observed using a broader range of data sources than trees in many other settings. Urban tree information can be collected from multiple perspectives, including satellite, airborne, and street-level imagery, each of which has distinct strengths and limitations. Satellite imagery is useful for large-scale and repeated monitoring, whereas airborne imagery can provide finer spatial detail but is often more limited in coverage or availability. Street-level imagery offers detailed views of trees along road networks, but its use depends on accurate geolocation and may be affected by occlusion in complex urban scenes. Therefore, future urban tree mapping efforts will likely benefit from integrating complementary data sources to improve tree counting, localization, species identification, and repeated monitoring across urban environments.

4.3.2. LiDAR

Three studies examined in this review reflect the diversity of LiDAR-based approaches to urban forest inventory. Li and Yan focused on street tree inventory using MLS data to segment individual street trees [84]. They first converted LiDAR point clouds to 2D RGB images, and then conducted tree annotation and trained deep-learning models (YOLACT, BlendMask, YOLOv8). Afterward, the 2D segmentation masks were projected back onto the 3D point cloud to generate per-point tree segmentations. They found that the YOLOv8-based achieved the highest segmentation accuracy, with recall: 0.9986, precision: 0.9988, and F1-score: 0.9987. In contrast, Chen et al. addressed individual tree crown segmentation for biomass monitoring and management purposes by applying a PointNet framework to UAV-LiDAR data collected from a nursery base, monastery garden, and mixed and defoliated forest habitats in suburban areas [85]. They voxelized the point clouds before running the PointNet algorithm and used height-related gradient information to distinguish individual tree boundaries. The training dataset included individual tree boundaries along with species labels, building features, and understory vegetation. To increase the number of samples, they used data augmentation by rotating all points in each voxel by a random angle along the vertical axis. Accuracy across all sites, nursery base, monastery garden, mixed forest, and defoliated forest showed recall: 0.85, precision: 0.87, and F1-score: 0.86. Complementing these segmentation-focused studies, Gupta et al. focused on using deep learning to assist with tree annotation in urban environments, evaluating three automatic tree identification methods using ALS data: Multi-return, TreeNet, and sPointNet++ [86]. The multi-return method used hand-annotated features with LiDAR attributes to identify trees when point density exceeded 20 points/m2. TreeNet was based on a 3D CNN applied to voxelized data, which could be trained using results from the multi-return method. sPointNet++ was applied as a method for 3D shape classification. Accuracy results were as follows: multi-return achieved precision: 0.88, recall: 0.89, and F1: 0.88; TreeNet achieved precision: 0.60, recall: 0.64, and F1: 0.62; and sPointNet++ achieved precision: 82.9%, recall: 85.4%, and F1: 84.1%. More recently, Ma et al. proposed a contrastive learning-based framework for individual tree instance segmentation from MLS point clouds in urban street environments [71]. Their method introduced two key modules: Semantic-Driven Instance Clustering, which injects semantic probability priors into instance embeddings to reduce interference from non-tree objects, and Online Semantic Clustering, which uses dual-level contrastive learning to separate overlapping tree crowns. Evaluated on the Paris-Lille-3D urban dataset, their approach achieved an F1-score of 80.26%, mean recall of 78.56%, and mean precision of 82.04%, representing a 4.82% F1 improvement over the previous best method. The framework was additionally validated on the FOR-instance forest dataset, where it achieved an F1-score of 79.5%, suggesting cross-domain applicability between urban and natural forest scenes.
LiDAR-based tree mapping in urban environments differs from plantation and natural forest applications because the surrounding scene is often as challenging as the trees themselves. Buildings, roads, poles, vehicles, signs, and other artificial objects create com-plex non-tree backgrounds that can interfere with tree segmentation and localization. Projection-based MLS approaches, including YOLACT and BlendMask are efficient for corridor-scale street-tree segmentation when side-view geometry is clear. Direct 3D methods such as PointNet, TreeNet, and sPointNet++ better preserve spatial relationships among crowns, stems, and surrounding objects, making them more suitable for cluttered scenes. MLS data are particularly useful for street-tree inventories because they provide dense side-view observations of stems and lower crowns, but their coverage is often biased toward road corridors. UAV-LiDAR and ALS provide broader overhead coverage, making them more suitable for city- or neighborhood-scale canopy mapping, but they may provide less detail on lower stems and tree-object interactions. The reviewed studies therefore suggest that projection-based methods are efficient for street corridors, while direct 3D models are better suited to cluttered urban scenes where object geometry and vertical context are essential.

4.4. Research Trends

Deep learning applications for tree counting and localization with optical data tend to rely heavily on very high-resolution UAV and airborne imagery for automated counting and geolocation of trees [25,53,55,56,64]. This allows for more accurate segmentation and counting at the local level, although it can limit spatial coverage and transferability to new areas. The deep learning models applied (e.g., Faster R-CNN, YOLOv3, YOLOv4, EfficientNet, and RetinaNet) are primarily designed for object detection and predict bounding boxes and class labels. These models are generally influenced by species composition and surrounding environmental factors, with model accuracy typically decreasing in natural forests, as demonstrated by Tao et al. [64]. Object detection is more common than segmentation in tree localization, possibly because annotation is simpler and less computationally demanding, particularly in relatively uniform planting systems.
For LiDAR-based segmentation, much of the reviewed research addressed training data quantity and quality as a primary route to improving model performance [57,58,77]. Beyond training data, data fusion and ensemble approaches have also been explored to improve crown segmentation accuracy. Data fusion of optical and LiDAR data can enhance tree crown segmentation by using the physiological and morphological traits of trees [16,28,87]. Ensemble approaches combining region-based deep learning with clustering methods have also been explored [15,16]. Other research focuses more on algorithmic improvements that influence semantic segmentation model accuracy, such as point density, hyperparameter tuning, species composition, and stem density [59,60,61].

4.5. Challenges

Overall, two main challenges remain across all forest types. First, there is still a lack of sufficient and high-quality training datasets. To address this, some studies have enhanced training datasets by manually augmenting samples [16,85] or using GAN model frameworks [15]. As remote sensing data collection and in situ data increase globally, this challenge is being addressed, although it remains unresolved. Ongoing efforts to expand the availability of pre-trained models using open-source datasets, such as the National Ecological Observatory Network [NEON] and DeepForest, have also helped address this challenge [13]. Beyond data availability, model performance is also sensitive to environmental factors. Extensive forest coverage, overlapping tree crowns, diverse species compositions, complex environmental settings (e.g., topography, soil, and anthropogenic features), varying stem densities, and tree sizes all impact model performance. While the reviewed studies have made progress in addressing these challenges [25,60,61,66,67,68], the low transferability of models across different environmental settings remains an issue. Further research is therefore needed to improve model robustness and adaptability. To support readers in evaluating the strength of evidence across the tree counting and localization studies reviewed above, Table A1 summarizes the sample size, validation approach, and key quality considerations for each study.

4.6. Research Gaps

In plantation forestry, most reviewed models were developed with uniform species composition and relatively plain topography, which may limit their applicability to plantations with more complex environmental settings [57,60]. Additionally, none of the plantation studies reviewed considered data fusion between optical and LiDAR datasets. Data fusion could aid in counting and localizing individual trees by accounting for various tree species and environmental factors, potentially improving transferability by incorporating both spectral and structural attributes.
In natural forests, heterogeneous environmental settings such as species composition, stem density, topography, soil, climate, and tree age and size influence deep learning model performance for counting and localizing individual trees. A trade-off exists between optimizing model accuracy and generalizing model performance across forest types, current work appears to place more emphasis on the former, which may reflect the difficulty of obtaining sufficient training and testing data in natural environments. Sensors that capture richer spectral information, such as hyperspectral imagers, or richer structural information, such as full-waveform LiDAR systems, may also help improve deep learning model capabilities. Data fusion studies in urban environments remain scarce. Our review suggests that urban trees can often be identified or segmented using LiDAR data alone; however, there could be meaningful improvements in certain tasks with fused data, particularly in urban forests or suburban neighborhoods with extensive canopy cover.

5. Tree Species Identification

Species identification is a key task for forest inventory. In the field, species are identified from phenological and morphological traits such as leaves, flowers, bark, and crown shape, interpreted by technicians or experts. A similar concept applies to remote sensing-based species identification; however, these traits are not equally detectable across sensor types (e.g., multispectral, hyperspectral, LiDAR, etc.) or platforms (e.g., UAV, airborne, satellite, etc.). For instance, leaf and flower color are readily captured in optical data (RGB, multispectral, hyperspectral), whereas crown shape and tree height are more often derived from LiDAR point clouds. Many studies therefore focus on methodological advances to extract these traits reliably for tree species identification. Among these advances, deep learning has proven effective for automatically extracting salient features from optical and LiDAR data, both separately and in combination, to improve tree species identification. We reviewed 57 studies addressing tree species identification, most of which either demonstrate the potential of deep learning or refining model architectures for higher accuracy, commonly using CNNs and, more recently, transformer-based models.
Because forest composition strongly conditions which traits are detectable and how well models transfer, we structure the following sections into three forest types: tropical/subtropical forests, with complex vertical and horizontal structure and predominantly broadleaved species; temperate forests, with mixed conifer-broadleaved stands and comparatively simpler structure; and boreal forests, dominated by conifers and featuring the simplest stand structure. Within each forest type, we summarize advances using optical data (RGB, hyperspectral, and multispectral data), LiDAR, and fused datasets, and then highlight emerging deep learning applications for bark-based tree species identification. Finally, because species composition and species count strongly influence model accuracy, we provide cross-references between studies and their species sets in Table A2. Taken together, this structure allows us to compare methods across highly different forest conditions while keeping sensor types and model choices in view.

5.1. Tropical Forests

According to the Global Forest Review by the World Resources Institute, tropical and subtropical forests accounted for 61% of global tree cover in 2020 and have the most abundant and complex species composition, which presents unique challenges for tree species identification [88]. Of the studies we reviewed, 14 (~25%) focused on tropical and subtropical forests, including several that targeted urban trees. Despite their importance as major ecological systems, tropical forests remain relatively under-explored. Only four of the 14 studies we reviewed rely on fused data (~29%), while the remainder are based solely on optical imagery, and we found a noticeable lack of studies that use only LiDAR in tropical and subtropical forests, likely due to the high complexity of the understory. Given this imbalance, we first summarize optical-only approaches before turning to fusion-based studies.

5.1.1. Optical Data

Among the optical imagery studies, two focused on palm trees, which are abundant in tropical landscapes. Owing to their distinctive morphological traits, these studies commonly achieved high F1-scores. Ferreira et al. identified three palm species (Attalea butyracea, Euterpe precatoria, and Iriartea deltoidea) achieving average producer’s and user’s accuracies of 87.8 ± 4.4% and 86 ± 4.5%, respectively, across all palm classes using ResNet-18 incorporated into a DeepLabv3+ architecture [89]. Gibril et al. achieved an F1-score, recall, precision, and mean IoU of 92%, 0.91, 0.92, and 85%, respectively, by applying a reconstructing U-Net with a ResNet-50 backbone to very-high resolution UAV images to classify a single date palm species (Phoenix dactylifera L.) [90]. Transformer-based semantic segmentation has also been applied to dryland tree mapping; for example, Gibril et al. used UAV RGB imagery and a Mask2Former model with a vision transformer backbone to map Acacia tortilis over 25 km2 in arid and semi-arid farm and urban landscapes in the United Arab Emirates, obtaining 83.43% mean IoU and an F1-score of 90.27% for this single species [91]. Martins et al. utilized a multi-task CNN model to segment and detect nine and five tree species in an urban setting and obtained an average F1-score of 79.3 ± 8.6% and 87.6 ± 4.4%, respectively [92]. In contrast, Zhang et al. classified ten tree species and achieved overall accuracy of 92.60% with a kappa coefficient of 0.91 using a ResNet-50 architecture and RGB imagery [93]. Combining hyperspectral imagery with photogrammetric point clouds, Sothe et al. identified 16 tree species in southern Brazil and found that a CNN trained on visible and near-infrared (VNIR) hyperspectral imagery alone achieved 84.37% overall accuracy, exceeding VNIR-based SVM and RF classifiers by roughly 20–25 percentage points [20]. Working in similar forest types, La Rosa et al. proposed a multi-task FCN trained with sparse polygon-level annotations for semantic segmentation of 14 species in tropical forests, reporting 85.91% overall accuracy, an F1-score of 0.88, and Kappa coefficient of 0.84 [94]. Introducing a partial loss function for training and a distance regression branch into the multi-task model improved semantic segmentation 8–11% for overall accuracy, average F1-score, and Kappa coefficient. In subtropical natural forests, combining UAV RGB texture metrics with satellite multispectral imagery and deep CNNs such as DenseNet-121 has yielded overall accuracies of roughly 81–94% for five dominant species, clearly surpassing random forest baselines in the same setting [95]. Beyond model design and sensor choice, the method used to obtain reference labels also strongly constrains tropical species mapping.
Traditional label generation relies on interpreting imagery and collecting reference species information during fieldwork. This process is time-consuming and costly, making it difficult to obtain reliable reference data at scale. As a result, verified citizen-science data are sometimes used as a proxy, despite known errors and biases in collection and reporting. Pierdicca et al. used citizen observations from the iNaturalist platform as labels, matched to UAV RGB imagery [96]. They compared the performance of ResNet-152 (53%), DenseNet-161 (72%), Visual Geometry Group (VGG)-19 (57%), InceptionV3 (37%), and Vision Transformer B16 (68%) for classifying four species using overall accuracy on the original dataset. After applying a super-resolution technique (SRGAN), Vision Transformer achieved 75% overall accuracy, outperforming DenseNet-161 (69%) and InceptionV3 (54%), with InceptionV3 showing the largest improvement (+17 percentage points). Branson et al. instead used Google Street View and other publicly available imagery from multiple viewpoints and scales, capturing tree form through to bark texture, and trained CNN-based models to classify urban tree species, achieving average class precisions above 0.80 for the most frequent species [97].
The contrast across tropical optical-based studies tracks species distinctiveness more than model architecture sophistication. Palm-focused studies using ResNet-based segmentation backbones consistently achieved F1-scores of 0.86–0.92 regardless of whether the underlying task was semantic segmentation [89] or instance-level classification [90,91], because palms’ distinctive crown silhouette dominates the discriminative signal. Performance diverges sharply once richness increases: multi-task CNN and FCN architectures applied to 9–16 co-occurring species dropped to F1-scores of 0.79–0.88 [92,93,94], and the lowest reported accuracy in this review (51% for 31 species in subtropical Florida [98]) occurred not because of weaker architecture but because species richness exceeds what any single-sensor optical model could reliably separate. Reference label quality compounds this effect independently of model choice; Pierdicca et al.’s comparison of five architectures on iNaturalist-sourced labels found accuracy ranging from 37% to 72% for the same four species, with the gap closing only after super-resolution preprocessing, not after switching architectures [96]. This indicates that for tropical species identification, model architecture choice matters primarily at low species counts with distinctive morphology; as richness increases, gains depend more on reference data quality and multi-source integration (addressed in Section 5.1.2) than on which CNN variant is used.

5.1.2. Data Fusion

The ability of LiDAR point clouds to capture three-dimensional (3D) tree structure has led to a rapid growth in tree detection and classification applications. As noted above, we found very few studies that rely solely on LiDAR data for tree species identification in tropical and subtropical forests. Given the structural complexity of these forests, data fusion has received more attention than single-source data for improving tree species classification. We reviewed four studies that use data fusion in tropical and subtropical forests for tree species classification. These studies combine LiDAR and optical data in two main ways. The first uses LiDAR-derived CHMs to delineate crowns for labeling or segmentation, with optical imagery used for classification [27,99,100]. The second performs feature-level fusion by combining LiDAR- and image-derived features within a single deep learning model, either by stacking features or through multi-branch backbones with attention mechanisms [101,102]. In the following, we focus on this latter feature-level fusion paradigm, where selected LiDAR and image features are combined as input to deep learning architectures. Essential features from each modality are typically selected using machine learning (e.g., random forest), dimensionality reduction with methods such as principal component analysis (PCA), or CNN-based feature extraction. Across these feature-level fusion studies, gains in classification accuracy still depend strongly on the number and types of species, environmental conditions, and specific fusion architectures; for example, reported overall accuracies range down to 51% for 31 species in subtropical forests in Florida [98].
Several studies demonstrate that feature-stack fusion improves classification accuracy in tropical and subtropical forests compared with classical fusion approaches that simply stack CHMs with RGB imagery. Li et al. developed Attention Complementary and Edge Detection (ACE) R-CNN to combine CHM and RGB imagery and, across three study areas, improved overall F1-scores from 0.06 to 0.24 with a classical fusion baseline to 0.26–0.50 with the ACE R-CNN fusion [27]. Similarly, Ferreira et al. evaluated two ResU-Net encoder–decoder architectures that learn features from LiDAR-derived metrics (surface normals, intensity, tree height, leaf area index) and red, green, blue, near-infrared (RGB-NIR) imagery and showed that adding selected LiDAR features increased Kappa coefficient from 0.69 with RGB-NIR alone to as high as 0.73 for six species [103]. However, it is difficult to attribute performance differences solely to model design (ACE R-CNN vs. ResU-Net) because these studies differ in sensor configurations (RGB vs. RGB-NIR), LiDAR inputs (CHM alone vs. multiple metrics), and species richness (four vs. six species). More recently, Sablon and Bajgain extended this fusion paradigm to Mediterranean ecosystems in California, proposing MXAT, a multimodal attention-based CNN that fuses LiDAR-derived depth images with satellite surface reflectance [104]. Tested across 20 tree taxa, MXAT increased mean sensitivity from 57.5% for a LiDAR-only depth-view model to 62.2%, demonstrating that cross-modal attention can effectively bridge structural and spectral information for large-scale species classification in diverse temperate and Mediterranean forest types. Together, these results suggest that in tropical and other structurally complex forests, the main benefits of LiDAR come when its structural cues are tightly integrated with spectral information rather than simply stacked as additional bands.
Fusion-based studies in tropical and subtropical forests highlight the value of combining spectral and structural information for species identification. LiDAR-derived canopy height, crown geometry, and structural metrics can complement optical or hyperspectral imagery, especially when different species have similar spectral responses but distinct crown forms. However, the role of LiDAR depends on whether it is used only for crown delineation or integrated as a predictive feature. CHM-assisted workflows [27,99,100] are useful when crown boundaries are difficult to annotate manually, but they do not fully exploit 3D structural differences among species. In contrast, feature-level and attention-based models such as ACE R-CNN, and MXAT can combine canopy height, crown geometry, intensity, and spectral reflectance within the model. These approaches are more suitable when species differ in both spectral and structural traits. At the same time, fusion benefits remain species- and site-dependent. Co-registration errors, imbalanced species samples, and redundant structural features can reduce or obscure the value of adding LiDAR. Overall, fusion appears especially promising in structurally complex forests, but its advantages are task- and species-dependent rather than universal.

5.2. Temperate Forests

Temperate forests typically contain both coniferous and broadleaf deciduous trees and exhibit distinct phenological changes across seasons, including monthly canopy variation, flowering, and autumn leaf coloration, which can challenge model transferability. Because of their mixed composition and strong seasonality, temperate forests were the focus of most studies we reviewed (Table A2): 37 studies were conducted in temperate forests, two additional studies spanned temperate forests together with other biomes, for a total of 39 temperate-involving studies (68% of the 57 studies reviewed). Of these 39 studies, 16 used only optical data, 12 used LiDAR, six used fused datasets, and five used ground-level bark imagery. Given this mix of sensors, we first consider optical-only approaches before turning to LiDAR, fusion, and bark-based identification.

5.2.1. Optical Data

A couple of studies have combined high spatial resolution optical imagery with CNNs to classify individual trees, sometimes aided by LiDAR-derived tree masks rather than fully end-to-end crown delineation [105,106]. For example, Yan et al. used WorldView-3 multispectral imagery, including RGB bands and near-infrared (NIR) bands at 1.6 m spatial resolution, to identify six species [106]. They generated crown slices using an image-based crown delineation algorithm to produce a tree map and achieved the highest overall accuracy of 82.7% with GoogLeNet, followed by ResNet-18 (74.8%), ResNet-50 (71.7%), and ResNet-34 (70.9%), while AlexNet achieved 52%, still outperforming random forest (44.1%) and support vector machine (48.8%). Similarly, Fricker et al. focused on mixed oak-conifer forests and classified seven tree species and dead trees as separate classes with a CNN [105]. The CNN model correctly classified species using hyperspectral imagery (average F1-score of 0.87) compared to the CNN using RGB only (average F1-score of 0.64). Additional studies in heterogeneous temperate forests using high-resolution RGB imagery and CNNs have reported similarly strong performance, with crown-level F1-scores up to 0.92 for four dominant species from Faster R-CNN models [107] and average accuracies around 90% from lightweight UAV-based CNN classifiers that remain robust across illumination and phenological variation [108].
In contrast to these individual-crown studies, other work targets species classification at the pixel or patch level using CNN-based semantic segmentation, without explicit individual tree delineation. Bolyn et al. mapped nine classes using super-resolved Sentinel-2 imagery at 2.5 m resolution and achieved 73% overall accuracy at the genus level with U-Net++ [17]. Schiefer et al. mapped nine tree species, three genus-level classes, forest floor, and deadwood, with an average F1-score of 0.73 [109]. Beyond single-sensor segmentation, Wang and Ren proposed a double-branch multi-source-fusion (DBMF) network that fuses spectral features from HJ-1A hyperspectral imagery with spatial features from Sentinel-2 multispectral imagery via a CNN-bidirectional long short-term memory (Bi-LSTM) architecture with triple attention [110], achieving higher pixel-level tree species classification accuracy than other multi-source methods. Building on these single-date segmentation approaches, several recent studies have leveraged multi-temporal image stacks to exploit species-specific phenological signals over larger extents. Mu et al. developed ForestFormer, a dual-branch transformer trained on Sentinel-2 time series, achieving 84% overall accuracy for eight species across Germany at 10 m resolution [111], while Tan et al. combined Sentinel-1/2 time series with temporal attention mechanisms for eight species in Taiyue Mountain, China, achieving 82% overall accuracy, an average Kappa coefficient of 0.78, and a macro-F1-score of 0.80, and further reducing overestimation by incorporating mixed-species plots through pseudo-labeling [112]. Overall, coarse- and medium-scale imagery (spatial resolution > 1 m per pixel) provides relatively low-cost data, broad spatial coverage, and high temporal resolution.
Complementing these satellite-based efforts, high-resolution aerial and UAV imagery has become popular for resolving individual crowns and phenological cues in temperate forests. Pearse et al. used multitemporal aerial RGB imagery to exploit the strong flowering phenology signal of pōhutukawa, increasing overall accuracy to 97.4%, a 4.7% gain relative to non-phenological imagery in a deep learning model [18]. As a counterpoint, Onishi et al. highlighted the fragility of such models to time and location when trained from single-capture UAV imagery [113]. They classified 56 species, canopy gaps, and dead trees using EfficientNet-B7, achieving a Kappa coefficient of 0.97 at the training site, but transferring to a different site and time reduced Kappa coefficient to 0.47. This limitation of site- and time-specific models is partly addressed by multi-source fusion approaches. Qin and Zhao proposed MMTSC, a multi-branch DenseNet-121-based architecture that simultaneously processes UAV imagery, Sentinel-1, and Sentinel-2 data in parallel branches for multi-label classification of 15 tree genera across German temperate forests, achieving an F1-score of 72% and precision of 82% [114]. By treating forest patches as containing multiple co-occurring species, this approach more realistically reflects mixed-species conditions that challenge model transferability.
Crown-level and pixel-level deep learning approaches show a clear accuracy-versus-resolution trade-off in temperate forests rather than one being categorically superior. Crown-level CNNs and transformer models applied to multispectral or hyperspectral imagery achieved overall accuracies of 80–92% and F1-scores of 0.87–0.92 [105,106,107,108], while pixel- and patch-based segmentation methods using medium-resolution satellite data (>1 m resolution) typically yield more modest performance of 73–84% overall accuracy and F1-scores of 0.73–0.80 [17,109,111,112], a gap attributable to spatial resolution rather than model sophistication since both approaches use comparable CNN backbones. Within crown-level methods, spectral richness matters more than spatial resolution alone: Fricker et al.’s CNN gained 23 percentage points in F1-score (0.64 to 0.87) simply by switching from RGB to hyperspectral input on the same architecture and site [105]. Temporal strategy produces a similarly sharp contrast: Pearse et al.’s phenology-timed RGB imagery reached 97.4% accuracy by exploiting a single flowering event [18], while Onishi et al.’s single-capture UAV model, despite similar architecture, saw accuracy collapse from a Kappa of 0.97 at the training site to 0.47 under cross-site, cross-date trans-fer [113]. This suggests that for temperate species identification, resolution and spectral richness govern within-site accuracy, but acquisition timing and multi-temporal design govern whether that accuracy transfers beyond the original site and season.

5.2.2. LiDAR

Where optical approaches primarily exploit spectral and phenological differences, LiDAR-based studies focus on structural traits captured in 3D point clouds. We evaluated a growing body of work on LiDAR-based tree species identification in temperate forests, including both natural and urban stands and a mix of TLS, mobile, airborne, and multispectral LiDAR acquisitions. Many sought to improve model performance by tuning hyperparameters or introducing more complex architectures. Recent deep learning approaches applied directly to 3D laser scanning data have further advanced temperate and Mediterranean applications, with multiview CNNs on airborne LiDAR boosting overall accuracy by up to ~16–19 percentage points over previous methods in mixed forests [115] and point-cloud-based networks on TLS data in structurally complex Mediterranean stands achieving per-species and overall accuracies comparable to or higher than earlier techniques without extensive pre-processing [116]. PointNet and PointNet++ were commonly used as baselines to compare the accuracy of proposed architectures and demonstrate gains in classification performance. More recently, Zhang et al. compared traditional machine learning (random forest, SVM) with deep learning models (PointMLP, PointNet++) for four tree species in shelterbelt forests planted as windbreaks in Shanxi, China [117]. PointMLP achieved the highest overall accuracy (96.94%), outperforming both traditional machine learning and PointNet++, reinforcing that more recent architectures can surpass earlier models for point cloud-based tree species classification even when using only LiDAR-derived structural features. Ohamouddou et al. proposed MS-DGCNN++, a graph-based deep learning model for classifying tree species from TLS point clouds [118]. Unlike earlier approaches that treat all scales of the point cloud uniformly, MS-DGCNN++ explicitly distinguishes among local point geometry, branch-level structure, and overall canopy form, allowing information to flow hierarchically across these scales during feature extraction. This design closely mirrors how land managers recognize species, where bark texture, branching patterns, and crown shape each contribute differently to identification. Tested on both the STPCTLS dataset and the multi-biome FOR-species20K benchmark, the model achieved overall accuracies of 94.96% and 67.25%, respectively, with the latter corresponding to a 6.1 percentage points improvement over its predecessor MS-DGCNN. Using multispectral airborne LiDAR in an urban setting, Hamdani et al. compared PointNet, DGCNN, and RandLA-Net on the open MS-ALS-SPECIES dataset in Espoonlahti, Finland, reporting overall accuracies up to 82% with PointNet, a macro-F1 of 0.73, and very high per-class accuracy for pine (around 94%), while DGCNN and RandLA-Net provided better representation of some minority classes but lower overall accuracy [119]. Complementing these point-based networks, Straker et al. projected TLS point clouds into 2D views and trained a YOLOv8 detector to classify seven temperate species in the FORSpecies20K benchmark, achieving 96% average overall accuracy while using explainable AI methods to highlight which structural crown and stem features drove the model’s decisions [120].
In addition, many studies have examined optimal point density for tree species identification to enable scaling deep learning models across platforms and larger areas. All point-cloud-based deep learning models reviewed here demonstrate strong potential for species classification. Early architectures, especially PointNet, tend to classify conifer species more accurately than broadleaved species. For example, Sun et al. tested seven models and found that the point cloud transformer (PCT) achieved the highest performance (overall accuracy 88.3%, Kappa coefficient 0.81), slightly outperforming the two closely related transformer variants PT2 (87.8%, Kappa 0.81) and PT1 (87.3%, Kappa 0.8), while all PointNet-based models and the random forest baseline lagged behind (overall accuracies ≤ 85.5%, Kappa ≤ 0.77) [121]. However, Liu et al. showed that more advanced point-based architectures trained on LiBackpack DGC50 backpack laser scanning data can achieve very high accuracy for mixed compositions of seven deciduous and one conifer species, with models such as PointConv and PointNet++ (MSG) reaching test balanced accuracies about 97% and Kappa coefficients above 0.96, far exceeding PointNet and a random forest baseline [122]. PCT achieved lower test accuracy than PointConv (balanced accuracy 0.922 vs. 0.995), and the authors noted that point-based transformer architectures can be more data hungry than simpler CNN-based models because of their greater complexity. Current close-range LiDAR studies typically use on the order of tens to a few hundred trees per species (roughly 19–640 samples per species in recent work; [121,122,123]), suggesting that larger per-species training sets might further improve classification accuracy.
Beyond these controlled experiments, several recent studies have extended LiDAR-based work to more complex urban forests. Huo et al. combined UAV and handheld LiDAR with a YOLOv11-based detector to segment and identify ten street tree species in a temperate city, achieving individual-tree F1-score around 0.9 for fused point clouds using a scale-variant proposal strategy tailored to heterogeneous crown sizes [124]. Hamdani et al. [119] and Puliti et al. [125] further demonstrated that multispectral airborne LiDAR and proximally sensed TLS data can support benchmarking of point-based networks across multiple urban sites, with overall accuracies up to about 82% on the MS-ALS-SPECIES dataset and around 76–80% on the FOR-species20K benchmark, thereby laying the foundation for open evaluations of LiDAR-based tree species classifiers.
Data augmentation offers an alternative way to increase effective training data. Seidel et al. projected single-tree ALS point clouds into multi-view 2D images and used CNNs to classify seven species, increasing overall accuracy from 80.2% to 86% when applying image augmentation [126]. Augmentation particularly benefited species with small initial sample sizes (improvements of 13–24 percentage points for ash (Fraxinus spp.), oak (Quercus spp.), and pine), whereas red oak (Quercus rubra) performed better without augmentation (81% vs. 63% with augmentation) due to increased confusion within other deciduous species.
Studies also differ in how many points are retained per tree crown during preprocessing. For example, Sun et al. downsampled ALS to 4096 points per tree and achieved about 88% overall accuracy for three species [121], while Liu et al. uniformly sampled 2048 points per tree and reported accuracies above 90% for eight species using several point-based deep networks [127]. Wang et al. worked with ALS data where individual trees contained from fewer than 256 to over 1024 points, with a mean of 5516 points per sample, and reached overall accuracy around the mid-80% range for eleven species [123]. Complementary work has focused more on tree detection and structural parameter estimation than on multi-species classification. For example, Ottoy et al. used mobile LiDAR to collect dense point clouds (~1790 points/m2) in the city of Hasselt, Belgium, achieving an individual tree detection F1-score of 0.83 and estimating key attributes such as height and DBH with (relative) root mean square error (RMSE) values of about 0.96 m (10%) for height and 0.58 m (259%) for DBH, which improved to 0.05 m (21%) for DBH after excluding incorrectly segmented trees [128]. Together, these results indicate that very high raw point densities are not strictly necessary for high classification accuracy, since many pipelines explicitly downsample trees to a few thousand points before modeling.
For LiDAR-based tree species identification in temperate forests, performance depends largely on how well the model captures structural traits that differ among species. These traits include crown shape, branching pattern, stem form, and the distribution of points within the crown. Early point-based networks such as PointNet and PointNet++ demonstrated that species classification from 3D point clouds is feasible, while newer models such as PointMLP, PointConv, DGCNN, RandLA-Net provide more flexible ways to represent local and whole-tree structure. Point-based networks are efficient for learning global 3D shape, but they may underrepresent fine-scale branching or multiscale crown architecture. Graph-based and multiscale models are better suited when diagnostic traits occur at several levels, from local geometry to branch arrangement and whole-crown form. Transformer-based models can capture broader spatial relationships, but they may require larger and more balanced training datasets. Improvements are not uniform across species. Conifers are often easier to distinguish because of their more distinctive crown forms, whereas broadleaved species with similar canopy structures are more easily confused. Overall, LiDAR-based species classification appears most effective when the model architecture and sampling strategy are matched to the structural separability of the target species.

5.2.3. Data Fusion

Given the mixed broadleaf-conifer composition of temperate forests and the complementary strengths of spectral and structural data, many studies combine multispectral or hyperspectral imagery with LiDAR to improve classification accuracy. Spectral data alone (especially hyperspectral) already shows strong potential for discriminating temperate tree species, with overall accuracies around 60–70% for hyperspectral imagery (HSI)-only CNN models in Ma et al. [129] and nearly 80% for hyperspectral image classification in Liao et al. [21]. These studies further show that adding LiDAR, particularly when combined with feature selection or advanced fusion architecture, can increase overall accuracy by roughly 5–15 percentage points relative to the best single-sensor baselines. Complementing these pixel-level fusion approaches, Wang et al. proposed SAMFormer, a self-attention-guided spectral-structural multimodal fusion transformer that jointly processes ultrahigh-resolution UAV RGB and LiDAR data, achieving an F1-score of 86.3% and mAP@0.5 of 88% for instance-level tree identification and enabling large-scale mapping of species-specific structural parameters and carbon stock [130]. However, feature selection or dimensionality reduction (e.g., PCA) is usually required before or after fusing LiDAR with imagery to reduce redundancy and improve computational efficiency [129]. In addition, short-wave infrared (SWIR) bands appear especially important for certain species; for example, green ash (Fraxinus pennsylvanica) accuracy improved from 34.9% to 81.4% when eight SWIR bands were fused to the eight visible + near-infrared (V-NIR) bands in WorldView-3 data [131]. Overall, recent temperate fusion studies using combinations of hyperspectral and LiDAR data tend to report high accuracies, often in the upper 70s to 80s, with the fused configurations consistently outperforming single-sensor baselines.
Early work often relied on complex LiDAR metrics, such as height percentiles, intensity, and 3D structural descriptors, to boost accuracy [132], and fusing UAV-based LiDAR metrics with multispectral imagery in a PointNet++ framework increased overall accuracy from 79.4% for LiDAR alone to 90.2% for four classes including standing dead trees in central European temperate forests. However, improvements were not consistent across species when LiDAR metrics were added to imagery. For instance, green ash accuracy in Hartling et al. [131] declined from 81.40% with V-NIR+SWIR WorldView-3 data to 62.79% when LiDAR was added, and accuracy changes for larch (Larix spp.), poplar (Populus spp.), cottonwood (P. deltoides), and pin oak (Quercus palustris) were small (on the order of ±1–3 percentage points). By contrast, sugar maple (Acer saccharum) showed a marked benefit from LiDAR, increasing from 55.26% with V-NIR alone to 60.53% including SWIR and 76.32% including SWIR+LiDAR.
Different fusion strategies, such as simple stacking, feature-level fusion, and more recent multi-level fusion, have not shown clear, systematic advantages in overall accuracy. However, several studies indicate that the convolutional block attention module (CBAM) can improve performance regardless of the fusion scheme or underlying deep learning architecture [102,129]. CBAM also shows promise across different optical modalities: Zhong et al. achieved a best mAP@50 of 81% overall using RGB imagery combined with CHMs [102], whereas Ma et al. reported up to 83% overall accuracy for six classes using selected hyperspectral features fused with LiDAR in a 1D-CNN with attention [129]. Vahrenhold et al. examined the benefits of combining multiple LiDAR data types, proposing MMTSCNet, which fuses airborne laser scanning (ALS) point clouds, full-waveform (FWF) data, and color-coded depth images via a Dynamic Modality Scaling (DMS) module that adaptively weights each modality during training [133]. Applied to Central-European mixed forests, their best configuration (ALS + FWF) achieved approximately 97% overall accuracy (Kappa ≈ 0.96), with FWF consistently improving macro-average F1-scores over ALS or ULS alone, highlighting FWF information as an underused yet valuable signal for species discrimination.
Fusion studies in temperate forests show that combining optical and LiDAR data can improve species classification, but the magnitude of improvement varies across species, sensors, and model designs. Spectral data are often highly informative for distinguishing species with different leaf chemistry, phenology, or canopy color, while LiDAR contributes structural traits such as crown height, shape, branching form, and vertical distribution. Models such as SAMFormer and CBAM illustrate different ways to combine these signals. Species that are already well separated by multispectral or hyperspectral imagery may gain little from LiDAR, and structural features can even add redundancy or noise. By contrast, species with similar spectral responses but different crown height, branching form, or vertical structure can benefit substantially from LiDAR. Attention modules, feature selection, and multi-branch networks can help address this problem by allowing models to weight spectral and structural cues differently across species rather than forcing all modalities to contribute equally. These findings suggest that data fusion should not be treated as simply adding more data. Instead, effective fusion should be species- and task-aware, identifying which classes are better distinguished by spectral traits, which require structural cues, and how these signals interact within the model.

5.2.4. Bark-Based Identification

Beyond canopy- and LiDAR-based approaches, a separate body of work has used ground-level images of bark, and sometimes leaves, to identify tree species using deep learning methods. Although bark-based identification is not inherently limited to any single forest type, the studies we reviewed were conducted almost exclusively in temperate contexts, where species diversity is high, individual stems are accessible, and the year-round stability of bark features partly offsets the seasonal limitations that affect canopy-based approaches in deciduous forests.
Bark-based CNN classifiers have achieved over 90% overall accuracy for 42 species while revealing interpretable diagnostic patterns such as lenticels, stripes, and crevices through class activation mapping [134]. One study used Google Street View images, which offer large, open-source datasets but relatively low resolution [97,135]. Consequently, those models either did not reach species-level precision or were limited to a subset of urban street-tree species. To enhance accuracy, Robert et al. proposed a deep-learning feature descriptor combining color and texture for bark re-identification across images taken under different conditions [136], while Wu et al. developed a portable bark identification system using knowledge distillation to compress model size for field deployment [137]. Taking a different approach to bark-based identification, Mizoguchi et al. used terrestrial LiDAR rather than optical imagery, creating depth images from TLS point clouds of individual tree trunks and classifying Japanese cedar and cypress using a CNN applied to bark surface geometry, achieving 89.3% overall accuracy [138]. This demonstrates that bark texture signals useful for species discrimination can be captured through structural sensing as well as optical means.
A practical advantage of bark-based approaches is that image acquisition is relatively low-cost compared with airborne remote sensing, and several publicly available datasets have been released, including Barknet 1.0, Bark-101, DeepBark, the Indiana Bark Dataset, BarkID, and Auto Arborist dataset, facilitating reuse and benchmarking across research groups [135,136,137,139,140].
Notably, none of the reviewed bark studies incorporated data fusion with airborne sensors such as LiDAR or multispectral imagery. This is likely attributable to the fundamental platform mismatch between ground-level bark acquisition and airborne remote sensing: images captured at stem level and data acquired from altitude differ substantially in viewing geometry, spatial scale, and registration reference, making co-registration non-trivial and currently without a standardized workflow in forestry literature. As a result, bark-based identification currently operates as a largely separate pipeline from the canopy-level and LiDAR-based approaches reviewed in earlier subsections. Integrating bark-derived species signals with airborne canopy maps, for example, by using ground-based bark observations to refine or validate airborne classifications in structurally complex stands, represents a gap worth exploring, particularly in mixed temperate forests where canopy-level spectral and structural signals alone can be insufficient to discriminate closely relate species.

5.3. Boreal Forests

Boreal forests are the world’s largest terrestrial biome, stretching across North America, Europe, and Asia. In contrast to the mixed broadleaf-conifer composition and varied data modalities reviewed for temperate forests, boreal forests are dominated by conifer species such as pine, spruce (Picea spp.), and fir (Abies spp.), with fewer deciduous species such as birch (Betula spp.) and maple (Acer spp.). Conifers often have distinctive canopy shapes (e.g., conical crowns), branching patterns, and needle foliage that are easier to discern in remote sensing data, so tree detection and species classification can often be achieved with simpler models and high accuracy in this biome. We reviewed five boreal studies, three using optical data and two using fused data, from northern Europe and Canada that applied deep learning for tree species identification.

5.3.1. Optical Data

As in other forest types, classification accuracy in boreal forests depends on species composition and class set size. Natesan et al. used a DenseNet-121-based architecture with UAV RGB imagery acquired in leaf-on and leaf-off seasons, together with LiDAR, to classify five dominant conifer species in Canada, achieving between 83 and 84% overall accuracy across three yearly datasets [22]. Nezami et al. used a 3D-CNN to classify three boreal species (pine, spruce, birch) from UAV data, obtaining overall accuracies of about 97% with either hyperspectral or RGB inputs alone and up to 98.3% when HS and RGB were combined [23]. Across these studies, pine generally emerged as one of the easiest to classify, often reaching very high producer’s or user’s accuracies (frequently above 95%), though performance still varied somewhat with network architecture and input features. Building on these promising results for conifer classification, Chadwick et al. evaluated the transferability of a pre-trained Mask R-CNN model for simultaneous crown delineation and species classification of lodgepole pine (Pinus contorta) and white spruce (Picea glauca) in managed forests of Alberta, Canada, near the southern edge of the boreal region [141]. Using UAV RGB imagery acquired in leaf-off conditions, they reported a mean average precision of 72% and class F1-scores of 69% for lodgepole pine and 78% for white spruce.
The boreal-optical studies show that simplified species composition narrows the accuracy gap between architectures more than it does in other biomes, but it does not eliminate the gap between training and transfer conditions. Natesan et al.’s DenseNet-121 and Nezami et al.’s 3D-CNN achieved comparable overall accuracies (83–84% an up to 98.3%, respectively) despite substantially different architectures, both benefitting from conifers’ distinctive crowns and needle texture [22,23]. The clearer contrast is between input modality, not architecture. Nezami et al. found that combining hyperspectral and RGB inputs added only a marginal 1.3 percentage points over hyperspectral alone (98.3 versus ~97%), indicating that for boreal conifers, spectral information beyond RGB offers limited additional separability once crown shape is captured [23]. Transfer to independent sites reduces performance substantially (F1-scores of 0.69–0.78 in Chadwick et al.) [141], high-lighting that within-site accuracy does not guarantee transferability, even in structurally simple boreal stands. This indicates that architecture choice in boreal forests is largely interchangeable once species are conifer-dominated, but transferability remains governed by site- and acquisition-specific factors. The relatively small number of boreal studies re-viewed, and their geographic concentration in northern Europe and Canada, limits broader conclusions about how these methods would perform in more species-diverse boreal or hemiboreal contexts.

5.3.2. Data Fusion

Because stand-alone RGB or hyperspectral imagery already yields high accuracies in boreal forests, there have been few attempts to explore data fusion or deep learning architecture innovations in this biome, and we found only two relevant fusion studies. Li et al. compared classical machine learning (random forest, SVM) with CNN-based models in an urban setting using WorldView-2 imagery and LiDAR [142]. Deep learning models outperformed conventional ML models overall, but differences among CNN architectures were small: for four species (maple, spruce, pine, and locust (Robinia pseudoacacia), ResNet-18 achieved 90.9% overall accuracy and DenseNet-40 86.9% when WV-2 imagery and LiDAR data were combined. 3D-CNNs applied to hyperspectral imagery supported by LiDAR-derived canopy height have likewise delivered high performance (overall F1-score ≈ 0.86, overall accuracy ≈ 87%) and outperformed SVMs, random forest, and other machine learning baselines [143].
The two fusion studies reviewed here suggest that adding LiDAR or hyperspectral imagery to optical data in boreal forests yields measurable gains over single-sensor approaches, yet the magnitude is modest and the baseline is already high; CNN and ResNet-based models combining WorldView-2 imagery with LiDAR achieved overall accuracies above 87% for four species [142], while 3D-CNN fusion of hyperspectral imagery with LiDAR-derived canopy height reached an F1-score of 0.86 and outperformed SVM, RF, and other machine learning baselines [143]. The limited number of boreal fusion studies, and their concentration in urban or semi-urban boreal settings, means that the relative value of fusion versus optical-only approaches in structurally diverse natural boreal stands remains largely untested.

5.4. Research Trends

Many studies sacrificed methodological novelty to demonstrate the superior performance of deep learning models by comparing them with conventional machine learning approaches (e.g., SVM, XGBoost, random forest) or shallower neural networks such as basic ResNet variants, and across the papers we reviewed, deep learning models generally outperformed these traditional approaches and simple baseline networks for tree species classification, often yielding noticeably higher overall accuracies and F1-scores [18,20,94,106,144]. The most frequently explored model families include ResNet, DenseNet, AlexNet, VGG, U-Net, and 3D CNNs, with more recent work adopting autoencoders and Vision Transformers. In parallel with this architectural diversification, sensor choices have also evolved.
High-resolution RGB imagery has expanded rapidly with the increased availability of UAV platforms, making data collection relatively inexpensive over moderate spatial extents. Early deep learning applications in forestry were primarily developed for RGB imagery and remain active areas of research in agroforestry and plantation contexts. However, the limited spectral information in RGB has motivated greater use of hyperspectral data. Most hyperspectral studies apply dimensionality reduction (e.g., PCA) as a preprocessing step to manage high dimensionality prior to deep learning modeling. Studies have reported high accuracies for temperate and subtropical broadleaved species when using hyperspectral data, often combined with LiDAR or multispectral imagery, with overall accuracies around 80–90% for mixed-species forests in southern Brazil and northwest China [20,110]. However, comparable accuracies have also been achieved for conifer-dominated boreal stands using UAV hyperspectral and RGB data [23], so current evidence does not clearly show a consistent broadleaf advantage. At the global scale, Mu et al. introduced GlobalGeoTree and GeoTreeCLIP, a vision-language model that links Sentinel-2 time series with taxonomic labels for 21,001 tree species worldwide [145]. In zero-shot evaluation on a 10,000-species benchmark, GeoTreeCLIP substantially outperformed general models such as CLIP and RemoteCLIP, achieving species-level top-1 and top-5 accuracies of 16.7% and 47.5%, respectively, with higher accuracies at genus and family levels, and few-shot fine-tuning further increased species-level top-1 accuracy to about 26–34% while maintaining relatively balanced performance across rare and common species and across continents. Beyond optical data, eight studies focused exclusively on LiDAR point clouds for species classification, all in temperate forests. Fusion of optical (RGB or hyperspectral) with LiDAR is becoming more common, with 13 studies in our review, but gains in accuracy still depend strongly on the number and types of species, environmental conditions, and specific fusion architectures. In parallel with this architectural diversification, sensor choices have also evolved. Ground-level bark imagery, reviewed in Section 5.2.4, represents one such complementary modality that operates independently of airborne remote sensing but has yet to be integrated with canopy-level or LiDAR-based pipelines.

5.5. Challenges

Although remote sensing greatly increases the efficiency of assessing species composition, field data collection remains both essential and expensive. These challenges are especially acute in remote regions such as tropical forests, where limited ground data constrain model development and validation. In addition to these logistical limitations, dense and structurally complex tropical canopies may also help explain the relative lack of LiDAR-only deep learning studies in tropical and subtropical forests identified in our review, as understory occlusion and high vertical complexity can complicate extraction of species-discriminating structural features from point clouds alone. Moreover, tree morphology is highly variable, shaped by local environmental conditions and genetic differences, which complicates species identification. Current sensing technologies and models still struggle to capture this variation reliably, making full automation of species recognition difficult. These limitations are compounded by issues of model transferability and species coverage.
Beyond morphology, model transferability is hindered by inconsistent species sets across studies and limited understanding of how scale and region affect performance. As noted above, classification accuracy is influenced by both the number of species included and the specific remote sensing sources used. Accuracy for a given species naturally tends to decline as the total number of modeled species increases. Across the studies we reviewed, 158 species from 90 genera were considered, yet only a few, such as birch (four studies), European beech (Fagus sylvatica; four), larch (Larix spp.; four), Norway spruce (Picea abies; four), Douglas fir (Pseudotsuga menziesii; three), and pine (Pinus spp.; three), appeared repeatedly. This sparse overlap in species composition across sites limits the transferability of models trained in one location with a particular species set to other regions with different communities. To support readers in evaluating the strength of evidence across the tree species identification studies reviewed above, Table A3 summarizes the sample size, validation approach, and key quality considerations for each study.

5.6. Research Gaps

Limited training data remains a fundamental challenge for deep learning, whose performance depends heavily on the quantity and diversity of labeled examples. Manual labeling of individual trees is costly and time-consuming, and most datasets also suffer from class imbalance or long-tailed distributions, which is inherent to species-rich ecosystems. Although some studies have explored data augmentation, further work is needed to develop broadly applicable strategies. In addition, greater effort is required to share research-specific datasets to establish common protocols for data collection and labeling, which would support the development of more robust and transferable models across regions. Beyond data volume and sharing, temporal coverage is another important gap.
Tree species exhibit distinctive phenological stages, such as flowering and autumn coloration, which can aid in identification; however, most previous work has relied on optical and LiDAR data acquired in a single season, especially during the growing season. Our review revealed a particular lack of studies using leaf-off LiDAR for species classification, even though deep learning models could exploit leaf-off structure, especially in temperate regions where deciduous species shed leaves in winter. In terms of fusion, several studies have found that optical imagery alone can already provide strong species discrimination, but that adding LiDAR or canopy height information often yields modest yet measurable gains in accuracy [102,129]. By contrast, Briechle et al. showed that LiDAR alone achieved 79.4% overall accuracy for four classes (pine, birch, alder (Alnus spp.), and standing dead trees), which increased to 90.2% when multispectral imagery was added, underscoring the complementary value of structural and spectral information [132]. Despite these advances in fusion, a further limitation is the small overlap in species, which constrains model transferability.
To address this, developing and combining deep learning models that focus on individual species may improve transfer across environmental gradients and community compositions. Ultimately, building robust species-level models will benefit a wide range of interest-holders and research communities. Future work should prioritize increasing the number of species considered, acquiring imagery that captured key phenological stages, and incorporating LiDAR metrics that describe tree morphological traits to enable broad-scale implementation.

6. Tree Measurement

Accurate measurements of individual trees are an important aspect of any thorough tree inventory, typically involving several standardized quantitative attributes. Common measured attributes include DBH, height, basal area, crown class, volume, and aboveground biomass (AGB). The management objectives of a given setting will often dictate which measurements are required. No matter the type of environment, however, accurate tree measurements at scale are a time-consuming and labor-intensive process. The increased use of remote sensing data, coupled with deep learning approaches, has opened new avenues for conducting many common tree measurements.
Studies coupling deep learning with remotely sensed data are inherently limited to measuring externally observable tree characteristics. Therefore, measurements such as basal area that depend on internal or below-canopy properties cannot be reliably derived from remote sensing alone. Additionally, a classification metric such as crown class is not a direct measurement but rather an interpretation and therefore cannot be objectively derived from remotely sensed data. With these limitations in mind, this review of deep learning-based tree measurement is organized by two-dimensional measurements, such as DBH, height, and crown area, and three-dimensional measurements, such as volume and biomass.

6.1. Two-Dimensional Measurements—DBH, Height, and Crown

Measurements of DBH, height, and crown dimensions can often be derived directly from LiDAR data without complex inference models; however, the limitations of LiDAR in certain environments and across large spatial scales motivate the exploration of optical-based deep learning and data fusion approaches. As such, we focus on six optical-based deep learning studies and highlight three instances of data fusion where measurements were improved through the inclusion of multiple data sources.

6.1.1. Optical Data

Recent advances in deep learning and optical remote sensing have enabled more precise and automated methods for tree measurement, particularly through UAV and smartphone-based platforms. The reviewed literature reflects a trend toward applying deep learning methods to estimate DBH, height, and crown size using RGB or hyperspectral imagery. The studies also highlight the effectiveness of integrating traditional tools, such as ultrasonic or laser rangefinders, to validate and refine the deep learning models.
Shen et al. demonstrated the potential of smartphones equipped with augmented reality (AR) and deep learning models such as Attention-UNet to measure tree height accurately [146]. Using MidasNet (version not reported) and the ARCore (version 1.36.0) software development kit (ARCore SDK) (Google LLC, Mountain View, CA, USA), they found that combining deep learning with consumer-grade devices for collecting RGB images and depth data can yield accuracy comparable to traditional methods. The relative height errors ranged from 1.92% (minimum) to 4.87% (maximum), with an average of 3.2%.
At a larger scale, UAV platforms have been applied for automated tree crown detection and measurement in both urban and natural environments. Xia et al. [147] and Gan et al. [148] used UAV RGB imagery with region-based CNNs to detect tree crowns and estimate morphological features such as crown width and height. Xia et al. applied Faster R-CNN with a Feature Pyramid Network (FPN) to detect urban tree crowns, reporting crown width accuracies of mean absolute error (MAE): 0.37 m, mean absolute percentage error (MAPE): 8.71%, and RMSE: 0.495 m, and tree height accuracies of MAE: 0.68 m, MAPE: 7.33%, and RMSE: 0.987 m. Similarly, Gan et al. explored the use of pre-trained and transfer-learned Mask R-CNN models, showing that transfer learning improved tree crown area estimation accuracy in temperate forests [148]. The pre-trained Detectree2 model achieved an R2 of 0.68 and RMSE of 6.64 m2, while the transfer-trained model achieved an R2 of 0.71 and RMSE of 4.75 m2. In contrast to RGB-based approaches, Yao et al. integrated hyperspectral imagery with Mask R-CNN to segment tree crowns in forests with diverse species and dense planting structures [149], capturing a wider spectral range to improve crown delineation accuracy. Crown area extraction was assessed using RMSE and rRMSE, yielding accuracies of 3.16 m2 and 0.26, respectively; crown width accuracies were 0.51 m and 0.12.
Crown segmentation has also been used as an intermediate step for estimating DBH, a metric not directly measurable from optical data alone. Xu et al. investigated the use of UAV RGB imagery for tree crown segmentation to estimate DBH [150]. They applied the BlendMask algorithm together with a Bayesian Neural Network (BNN) to improve the precision of DBH estimates derived from crown metrics. Crown area estimates achieved a relative error of 0.05653, MAE of 0.3290 m2, and RMSE of 0.4563 m2. DBH estimates based on the segmented crown measurements achieved a relative error of 0.03308, MAE of 92.18 cm, and RMSE of 106.4 cm, with overall average DBH errors for three studied species of 0.11 cm, 0.28 cm, and 0.31 cm. Lastly, Tolan et al. demonstrated that a self-supervised model trained on Maxar imagery could generate high-resolution canopy maps at meter-scale resolution with an MAE of 2.8 m and an ME of 0.6 m [151]. Their results suggest that self-supervised optical models may approach LiDAR-level performance for canopy height mapping.
The reviewed 2D optical measurement studies show that direct regression and crown-segmentation-then-inference approaches achieve comparable error rates, but the latter is more sensitive to species and local allometry. Shen et al.’s direct smartphone-based depth regression for height achieved a 3.2% average relative error without any intermediate crown delineation step [146], comparable to the crown segmentation pipelines of Xia et al. and Gan et al., which derived height and crown width via Faster R-CNN and Mask R-CNN detection followed by geometric calculation (MAE of 0.37–0.68 m) [147,148]. Where segmentation-based pipelines diverge sharply is in DBH estimation, which cannot be measured directly from canopy-view optical imagery. Xu et al.’s BlendMask-plus-Bayesian neural network pipeline achieved species-specific DBH errors as low as 0.11 cm for one species but as high as 0.31 cm for another using the same architecture [150], indicating that crown-to-DBH allometric relationships, not the segmentation model, are the binding constraint on accuracy once crown boundaries are reliably detected. This suggests that for height and crown width measurement, direct regression and segmentation-based approaches are largely interchangeable in accuracy, but DBH estimation specifically requires species-aware allometric calibration regardless of which detection architecture delineates the crown.

6.1.2. Data Fusion

Several studies combine optical remote sensing with LiDAR or other laser scanning methods to improve the accuracy of deep learning-based tree measurements. These studies range from handheld-device approaches for DBH estimation to those integrating spaceborne optical imagery with national LiDAR datasets for forest-scale measurements. At the handheld scale, Song et al. [152] developed a device that incorporated both a digital camera and laser rangefinder for DBH estimation. The rangefinder data calibrated the pixel-to-distance scale in the digital image, which was then applied to measure the segmented trunk. Trunks were segmented using a CNN, with half of the collected images being manually annotated for use as training data. DBH estimation accuracy was an average absolute relative error of 3.38%.
Taking a similar approach but with a different reference mechanism, Wang et al. [19] similarly developed a handheld device for DBH measurement that combined an optical sensor with a laser module. Rather than measuring a simple range, the laser module projected a reference spot onto the tree, which was then used by an improved U2-Net model with a Spot Detection Algorithm (SDA). Tree images and reference data were collected in both the urban and semi-forested regions of three districts surrounding Beijing, China. They measured 526 reference trees for testing and manually annotated 1600 images for training data. The improved U2-Net model achieved a DBH measurement accuracy ranging from a minimum absolute deviation of 0.10 cm to a maximum of 1.34 cm.
Moving beyond the individual tree measurements to stand-level estimation, Safarov et al. developed the ForestIQNet framework, which incorporates high-resolution multispectral UAV imagery and voxelized CHM captured from photogrammetric reconstructions in a deep learning model to estimate above-ground biomass and carbon sequestration [153]. This fusion addresses the limitations of conventional methods that rely on 2D vegetation indices and are often unable to capture the spectral and structural heterogeneity of forest canopies. Their model achieved an R2 of 0.93, and an RMSE of 6.1 kg.
Fusion approaches for two-dimensional tree measurements show how optical imagery can be strengthened by adding range, depth, or structural information. Optical images provide detailed visual boundaries for trunk or crown segmentation, while laser rangefinders, depth sensors, or LiDAR-derived products help convert image-space measurements into physical dimensions. This combination is particularly useful for DBH and height estimation, where scale and distance are difficult to recover from RGB imagery alone. However, these methods still depend on accurate alignment between image and range information, reliable trunk or crown segmentation, and consistent acquisition geometry. The reviewed studies suggest that fusion is most beneficial when each modality plays a clearly defined role, such as using optical data for segmentation and laser-based information for scale calibration or structural measurement.

6.2. Three-Dimensional Measurements—AGB, Volume

Research on estimating tree volume and biomass using remote sensing and deep learning has been progressing toward more accurate, efficient, and scalable methodologies. Traditional geometric methods are increasingly being supplemented by deep learning models that can directly estimate biomass and volume from imagery. This shift reflects growing interest in automating complex forest metrics through deep learning, with the potential for broader scalability. We reviewed eight studies that apply deep learning to optical remote sensing, seven that use only LiDAR data, and five that combine both data sources. Because volume and biomass depend on both surface form and 3D structure, the choice of sensor shapes what kinds of measurements are possible and which allometric relationships can be leveraged.

6.2.1. Optical Data

A prominent trend in forestry measurement is the use of deep learning for tree trunk segmentation to estimate essential metrics such as DBH and height, which can then be used to calculate volume. For example, Juyal and Sharma demonstrated the effectiveness of a Mask R-CNN model for estimating trunk volume from RGB images captured at eye level, using segmentation and reference objects to estimate tree height and DBH [154]. This approach reflects growing interest in using segmentation models to automate volume estimation and reduce reliance on traditional field measurements. Deep learning models have also been explored with diverse imaging data, such as multispectral and RGB imagery, to estimate forest metrics at a larger scale. Liu et al. applied a U-Net model with transfer learning from VGG16 for segmentation and volume estimation across natural forests, reporting a DBH estimation accuracy of 0.92 mAP and height detection accuracy of 0.86 mAP across different forest types and regions [155]. Together, these studies indicate that segmentation and transfer learning techniques may support the use of deep learning for forest inventory tasks.
Beyond trunk-level segmentation approaches, multispectral imagery has also been applied with deep learning for biomass estimation across diverse vegetation types. Tamiminia et al. applied a CNN to multispectral UAV imagery to estimate AGB in shrublands, using high-resolution spectral data to achieve reasonable accuracy [156]. The spectral only model achieved RMSE: 2.69 Mg/ha and R2: 0.89, while the spectral-plus-structural model achieved RMSE: 4.09 Mg/ha and R2: 0.84. Although structural data such as CHMs showed limited impact on performance, this study illustrates the potential of enriched spectral data for volume and biomass estimation in non-forest settings. Extending this to more structurally complex environments, Chang et al. combined classification and regression tasks into a single R-CNN capable of identifying forest type and estimating AGB, quadratic mean diameter, basal area, and canopy cover [157]. The model used freely available imagery from the National Agriculture Imagery Program (NAIP) and Landsat, applied to Forest Inventory and Analysis (FIA) plots across California and Nevada, and achieved an R2 of 0.84 and RMSE of 37.28 Mg/ha for AGB. To address the limitations of optical imagery alone in dense canopies, Hanan et al. presented DeepBioFusion, which combines optical imagery with multi-band synthetic aperture radar (SAR) for improved canopy penetration in a deep learning framework [158], reporting an MAE of 0.55 and RMSE of 0.71 in the log-transformed biomass space (log[kg]).
More broadly, optical remote sensing supports biomass estimation by capturing vegetation reflectance across multiple wavelengths. However, challenges such as spectral saturation, particularly in high-biomass regions, often hinder accurate biomass density estimation. Recent deep learning models have helped address these limitations by using multispectral data. Pascarella et al. introduced the REgressive U-Net to achieve high accuracy in carbon storage and AGB mapping [159], while Ghosh and Behera demonstrated the advantage of deep learning over semi-empirical models for estimating mangrove forest biomass using Sentinel-1 SAR data [160]. Extending these approaches to a global scale, Weber et al. developed a unified model using multi-sensor, multispectral satellite data for biomass prediction at 10 m resolution worldwide [161]. Together, these studies illustrate the potential of deep learning and multispectral integration for biomass and volume estimation across complex and diverse ecosystems.
Across the optical-based AGB and volume studies reviewed, performance was generally stronger for plot-level or stand-level estimates than for individual-tree prediction, and models using multispectral or SAR data tended to outperform those relying on RGB imagery alone. Reported AGB accuracies span a wide range, R2 of 0.84 for multi-task CNNs applied to NAIP and Landsat imagery [157] to 0.89 for UAV multispectral models in shrublands [156], but these figures are difficult to compare directly because reference data, spatial scales, and vegetation types differ substantially across studies. A consistent limitation is spectral saturation in high biomass stands, where optical signals plateau regardless of the model architecture used. No optical-only deep learning approach reviewed here simultaneously achieved high accuracy, broad spatial coverage, and validation against direct destructive measurements, pointing to a fundamental constraint that will require either improved fusion strategies or denser field campaigns to resolve.

6.2.2. LiDAR

LiDAR technology offers significant advantages over optical methods for biomass estimation, primarily because of its ability to capture the three-dimensional structure of vegetation, including canopy height and density. This level of structural detail comes at the cost of limited spatial extent, as high-density LiDAR acquisition over large areas remains challenging.
A key trend in this line of research is the transition from traditional geometric methods to deep learning-based models that can process LiDAR point clouds and produce more accurate volume and biomass estimates. Narine et al. were among the first to propose using ICESat-2 with deep learning for biomass estimation, providing an initial assessment of its potential as a basis for upscaling [162]. Where spaceborne LiDAR offers broad spatial coverage, airborne LiDAR provides greater point density and has been more widely applied for stand-level biomass estimation. For example, Oehmcke et al. demonstrated that using a Minkowski convolutional neural network with airborne LiDAR point clouds produced more accurate biomass estimates than traditional statistical models relying on summary point cloud statistics [163]. Building on this, Pan et al. proposed a Biomass Prediction Network (BioNet) that further enhanced LiDAR-based biomass estimation by accounting for plant structure occlusion using a multi-module deep learning framework [164]. Autoencoder architectures have also been explored for LiDAR-based biomass estimation, achieving better performance than multiple linear regression (García-Gutiérrez et al. [165]). However, deep learning does not always outperform simpler approaches. Seely et al. found that Octree CNN and DGCNN provided only modest improvements over traditional RF models when estimating AGB from airborne LiDAR data, suggesting that more substantial gains may require larger training datasets [166]. Shifting from aerial to terrestrial acquisition, Jung et al. proposed a projection-based deep learning framework that estimates individual tree biomass directly from single-scan TLS data [167]. The method projects point clouds into multiple 2D representations that encode structural information, which are then processed by a CNN to regress individual tree biomass. These results reflect the still-developing potential of deep learning in this domain. Addressing a different aspect of the pipeline, Shao et al. developed a three-stage framework for stand-level stem volume estimation using mobile laser scanning [78], achieving a volume estimation RMSE of 0.18 m3 and an R2 of 0.97 when compared with reference data from destructive sampling.
LiDAR-based biomass and volume estimation studies show a gradual shift from traditional metric-based regression toward deep learning models that use point clouds or LiDAR-derived representations more directly. This shift is important because tree volume and biomass are closely related to vertical structure, crown architecture, and stem form, which are not fully captured by simple height or density metrics. Metric-based approaches are easier to interpret and can work with limited training data, but they may miss stem form, branch architecture, and occlusion patterns. Deep models such as Minkowski CNNs, BioNet, and DGCNN can represent these structural cues in more detail. The appropriate LiDAR platform depends on scale: ICESat-2 or GEDI-like spaceborne LiDAR supports broad-area upscaling, airborne LiDAR balances coverage and structural detail, and TLS or MLS provides denser stem-level information but over smaller extents. However, the advantage of deep learning is not always consistent, largely because reliable reference data for biomass and volume remain difficult to obtain. Many studies still rely on inventory-derived estimates or allometric equations rather than destructive measurements, which limits the strength of model training and validation. Future work should therefore focus not only on more advanced architecture, but also on better reference datasets and model designs that make the structural basis of biomass and volume predictions more interpretable.

6.2.3. Data Fusion

Data fusion between optical remote sensing and LiDAR has emerged as a promising approach for addressing the limitations of using either method in isolation. Combining the structural information from LiDAR with the spectral information from optical sensors may improve the robustness and accuracy of biomass estimates.
For example, Narine et al. demonstrated that combining ICESat-2 photon-counting LiDAR data with Landsat imagery using deep learning methods improved biomass estimation accuracy [168]. The study employed a deep neural network that learned to integrate vertical structure from LiDAR with spectral vegetation indices, producing higher-resolution and more accurate biomass maps. Extending this to multispectral fusion, Zhang et al. showed that combining LiDAR with Landsat 8 data improved biomass prediction, particularly in forested areas where deep learning could better handle data complexity [26]. Moving to active structural sensors, Dong et al. proposed an Attention U-Net (AU) combining the Global Ecosystem Dynamics Investigation (GEDI) and Sentinel data to estimate AGB, which outperformed conventional methods such as RF in terms of accuracy and spatial detail [169]. So et al. combined UAV LiDAR for crown delineation with a self-supervised RGB deep learning model trained on LiDAR-derived annotations, reporting an 18% improvement in biomass estimation accuracy [170]. These studies suggest that data fusion approaches, in which deep learning models draw on both structural and spectral data, may support more detailed biomass estimation and potentially contribute to more scalable forest monitoring applications.
The five AGB fusion studies show a consistent pattern: LiDAR’s structural contribution is most valuable when the optical signal saturates, and the mode of integration determines how much of that structural advantage is captured. Narine et al.’s deep neural network fusing ICESat-2 with Landsat achieved R2 of 0.64–0.67 [168], a gain over Land-sat-only approaches but substantially lower than Safarov et al.’s ForestIQNet (R2 0.93) using UAV LiDAR with multispectral imagery [153]. The difference partly attributable to spaceborne LiDAR’s sparse sampling versus UAV LiDAR’s dense coverage, but also to the design of the fusion. Safarov et al.’s cross-attention architecture explicitly weighted structural and spectral features, while Narine et al.’s network concatenate derived indices. The 18% biomass accuracy improvement reported by So et al., who combined UAV LiDAR for crown delineation with a self-supervised RGB model [170], is consistent with this pattern. LiDAR contributed crown geometry that the optical model could not recover, and the downstream self-supervised optical component then estimated biomass from delineated crowns rather than from raw spectral features. Dong et al.’s Attention U-Net fusing GEDI with Sentinel reached R2 of 0.66 [169], slightly above a Random Forest baseline of R2 0.62, a narrow margin that reflects GEDI’s geolocation noise at 10 m pixel resolution. Across these studies, the ceiling for fusion gains is set not by model architecture but by the spatial density and accuracy of the LiDAR input. Spaceborne LiDAR (GEDI, ICESat-2) provides broad coverage at the cost of sampling density, limiting what any fusion model can recover. UAV LiDAR provides the density needed for large gains but limits spatial extent. Architecture matters at the margin, with attention-based designs outperforming concatenation, but the dominant factor is which LiDAR platform is available.

6.3. Research Trends

Across the tree measurement studies reviewed, three prominent trends emerge: the shift from handcrafted to learned feature representations, the growing adoption of multi-modal sensing, and the persistent gap between research-scale methods and operational deployment [171].
Early deep learning approaches to tree measurement often relied on handcrafted geometric or spectral features derived from point clouds or imagery, such as height percentiles, crown width ratios, and vegetation indices, that were fed into relatively shallow networks or used alongside traditional regression models. More recent work has moved toward end-to-end architectures that learn feature representations directly from raw data, whether from point clouds, RGB imagery, or multispectral inputs, without requiring manual feature engineering. This shift is particularly evident in LiDAR-based volume and biomass estimation, where deep point-cloud networks such as Minkowski CNNs and projection-based CNNs now process raw point distributions rather than summary statistics, and in optical-based crown measurement, where region-based CNNs learn crown boundaries directly from pixel values rather than from analyst-defined spectral thresholds. The practical implication being that model performance has become less dependent on domain expertise in feature design and more dependent on the quantity and quality of labeled training data, a trade-off that shapes many of the challenges discussed in Section 6.4 below.
The adoption of multi-modal sensing has also grown substantially across the reviewed studies. Across various environment types and deep learning models, high-resolution optical imagery acquired from UAV platforms emerged as a key trend, owing to the increasing affordability and accessibility of UAV systems relative to manned aircraft and low-resolution satellites. LiDAR-based methods contribute a complementary set of capabilities, offering direct structural measurements from point clouds that do not depend on spectral contrast between species or illumination conditions. Fusion of optical and LiDAR data has shown promise for biomass and volume estimation, where neither modality alone captures both the spectral and structural information needed for accurate prediction across heterogeneous environments. Contreras et al. illustrated this by integrating GEDI LiDAR, optical, SAR, and topographical variables to predict AGB in Mediterranean olive orchards [171], suggesting potential for broader scalability in forest monitoring. However, as discussed in Section 6.2.3, fusion does not consistently outperform single-sensor approaches, and its effectiveness depends on how well the model can exploit the complementary information rather than simply processing more inputs.
A third and persistent trend is the gap between the performance reported in research settings and the requirements of operational forest inventory. Most reviewed studies were conducted at single sites, over small spatial extents, with manually annotated training data, and evaluated against reference measurements collected under controlled conditions. Individual tree-level estimates of volume and biomass in particular remain largely confined to research-scale demonstrations, and few studies have tested whether models trained in one forest type, region, or acquisition configuration transfer reliably to others. The computational and logistical demands of acquiring sufficient labeled training data at scale remain a fundamental constraint. Bridging this gap will likely require not only more robust and transferable model architectures, but also coordinated efforts to build shared, openly licensed reference datasets that span multiple forest types, geographic regions, and acquisition platforms.

6.4. Challenges

The primary challenge discussed in many of these papers relates to the availability of quality training data. Many of the reviewed studies described the time and effort required for training data generation. This labor-intensive step, which was often approached similarly across studies, effectively transfers the burden of manual tree measurement from the forester to the lab researcher. While several studies explored pre-trained models, these often performed less accurately than task-specific models.
For LiDAR-based volume and biomass estimation specifically, the scarcity of accurate reference data presents a further and more fundamental constraint. For volume and biomass estimation, regression networks are common. However, existing studies used forest inventory data to derive plot-level or forest-level attributes as a supervised signal to optimize neural nets, but accuracy is substantially limited by the absence of direct field measurements. Even in a recent biomass study conducted by Hanan et al., the ground truth validation was generated by using LiDAR-derived tree heights to employ allometric equations [158]. This reliance on remotely sensed reference data highlights the shortage of direct measurements for training and validation. To support readers in evaluating the strength of evidence across the tree measurement studies reviewed above, Table A4 summarizes the sample size, validation approach, and key quality considerations for each study.

6.5. Research Gaps

A key research gap, particularly in optical imagery studies, is the limited translation of segmentation outputs into real-world measurements. While many studies focused on deep learning applications for tree trunk and canopy segmentation, few succeeded in translating pixel-based segmentation outputs into validated real-world measurements. This limitation is largely due to insufficient ground-truth and training data.
Beyond the translation of segmentation outputs, there is a need for dedicated neural networks tailored specifically to volume and biomass estimation. While some studies applied 3D neural networks developed for general point cloud analysis, these models often overlook unique features of forest and tree point clouds. Thus, forest-specific methods are warranted for more accurate estimates. A further gap is the limited interpretability of deep learning approaches for volume and biomass estimation. Because these methods typically operate as implicit regression models, they do not sufficiently explain how different components of a tree (e.g., stem, branches, foliage) contribute to the final volume or biomass estimates, constraining transparency and limiting ecological insight. Additionally, few studies have evaluated whether models trained in one forest type, region, or acquisition configuration transfer reliably to others, limiting confidence in reported accuracies beyond the specific conditions under which models were developed.

7. Discussion

In general, we observed consistent performance gradients across forest type, sensor modality, and inventory tasks that reflect structural and methodological factors rather than differences in model sophistication (Table 1). For tree counting and localization, plantation studies report the highest and most stable accuracies (precision and recall generally above 0.90), while natural and urban forests show wider ranges and lower floors. This gradient is explained primarily by stand structure. Regular spacing and uniform crown morphology in plantations reduce ambiguity in individual tree separation regardless of model family, whereas crown overlap, species mixing, and complex backgrounds in natural and urban settings create detection challenges that no architecture fully resolves. The performance advantage of LiDAR over optical data in natural forests (F1-scores of approximately 0.75–0.93 versus 0.63–0.94 for fusion and 0.65–0.97 for optical alone) is similarly structural. LiDAR provides vertical canopy penetration and 3D crown geometry that 2D optical imagery cannot recover under occlusion. A difference that is most pronounced in dense, multi-layer stands where 2D detection fails most severely.
For tree species identification, the sharpest performance predictor is number of species studied rather than forest type or sensor modality. Accuracies above 90% appear across tropical, temperate, and boreal biomes but are consistently associated with small species sets featuring morphologically distinctive taxa (e.g., palms, dominant conifers, single-species mapping), while studies with more than ten species in mixed stands typically report overall lower accuracies (below 85%), regardless of sensor or architecture. The apparent advantage of boreal optical studies (83–98% overall accuracy) over tropical optical studies (80–93%) therefore reflects the simpler species composition of boreal forests rather than a methodological advance, and the cross-study comparison in Table 1 should be interpreted accordingly.
For tree measurement, the contrast between optical-only, LiDAR-based, and fused approaches is most interpretable not in terms of accuracy ranges, which vary enormously by measurement type and scale, but in terms of what constrains accuracy in each case. Optical-only crown and height measurement is constrained by scale recovery. Without a ranging component, image-space measurements cannot be converted to physical dimensions without allometric assumptions, and reported errors (height MAE of 0.37–0.68 m, crown area RMSE of 3.16–4.75 m2) reflect the quality of those assumptions as much as the segmentation model. LiDAR-based biomass estimation, by contrast, is constrained by reference data quality. The reviewed studies consistently relied on allometric equations or inventory-derived estimates rather than destructive measurements, meaning that reported R2 values of 0.80–0.97 characterize agreement with modeled reference data rather than with direct physical measurements, a distinction that Table 1 cannot capture in performance metrics alone. Fusion approaches (R2 up to 0.93 for UAV-scale biomass, 18% improvement for crown delineation-aided estimation) outperform single-sensor approaches primarily when LiDAR’s structural contribution resolves the scale or canopy penetration limitation that constrains the optical component, and this complementarity is most pronounced at fine spatial scales (UAV LiDAR + multispectral) and least pronounced when spaceborne LiDAR’s sparse sampling limits what fusion can recover.
Across all three tasks, a common thread is that external validation substantially moderates reported accuracy. Only 42 of the 122 reviewed studies were externally validated on sites or conditions independent of model training (Table A1, Table A2, Table A3 and Table A4), and the studies that were externally validated consistently showed larger performance drops than within-study variation suggested. This means the performance ranges in Table 1 are anchored primarily by within-study validation results, and operational accuracy in new sites or conditions should be expected to fall toward the lower bounds of each range rather than the medians.

8. Conclusions

The increasing use of remote sensing and deep learning has broadened the range of approaches available for forest inventory, enabling more detailed assessments of individual tree counting and localization, species identification, and tree measurement. Deep learning, in particular, appears valuable because of its ability to learn complex patterns from large and diverse datasets, helping to automate tasks that were traditionally labor-intensive, time-consuming, and prone to human error. Across the reviewed studies, deep learning models, combined with high-resolution UAV imagery, smartphone-based optical imagery, and LiDAR data, have shown strong potential for improving the accuracy and efficiency of tree-level analysis, thereby supporting more accessible, scalable, and repeatable approaches to forest monitoring (Table 2).
The quantitative synthesis in Table 1 shows that reported performance varies substantially across forest types, sensor modalities, and inventory tasks, and that the sources of this variation are largely structural and methodological rather than architectural. Tree counting and localization studies in homogeneous plantations generally report higher and more stable accuracy than those in heterogeneous natural forests or urban landscape. For species identification, the pattern is governed more by number of species involved and morphological distinctiveness among species than by forest type. For tree measurement, the distinction between what constrains optical-only and LiDAR-based approaches is particularly important for interpreting reported accuracy figures. Optical-based crown and height measurement is constrained by the inability to recover physical scale from image-space measurements, whereas LiDAR-based estimation is constrained by the scarcity of direct destructive field measurements. Both constraints are non-architectural, they will not be resolved by further advances in model design alone, and addressing them will require coordinated investment in acquisition protocols, reference dataset standards, and cross-site validation infrastructure alongside continued methodological innovation.
At the same time, the review highlights that these advances are accompanied by persistent challenges that are present across all three areas. A major limitation remains the availability of high-quality training and reference data, as the creation of labeled datasets is often highly labor-intensive and can shift the burden of measurement from field foresters to researchers preparing training data in the lab. This issue is especially pronounced in tree measurement, where accurate reference data for volume and biomass are scarce, and direct field validation is often impractical. In counting and localization, model performance is still strongly influenced by environmental complexity, including crown overlap, species composition, topography, and forest structure, which reduces transferability across sites. In species identification, differences in species composition, morphology, region, and sensing modality similarly limit the ability of models trained in one setting to generalize to another. Although pre-trained models have been explored, they often perform less accurately than models specifically developed for the target task and environment.
Several research gaps also remain evident. One important gap is that, although many studies can successfully segment trunks, crowns, or canopy features, relatively few are able to translate these pixel- or point-based outputs into reliable real-world measurements, largely because of insufficient reference data. For measurement tasks, there is also a clear need for neural networks specifically designed for estimating attributes such as volume and biomass, rather than relying on general 3D point-cloud models that may overlook the structural characteristics of trees and forests. More broadly, future work should place greater emphasis on increasing the number of species represented in training datasets, incorporating imagery from different phenological stages, including leaf-coloration and leaf-off conditions where relevant, and using LiDAR-derived metrics that better capture tree morphology. Stronger efforts are also needed to share research datasets and establish more consistent protocols for data collection and labeling, which would support the development of more robust and transferable models across regions and forest types.
Although this review focuses primarily on optical imagery, LiDAR, and their fusion, other sensors such as synthetic aperture radar (SAR) represents an important complementary data source for forest inventory. SAR can provide information related to forest structure, moisture, and biomass, and it has the advantage of operating under cloud-covered and low-light conditions. These characteristics make SAR especially valuable in tropical and subtropical forests, where persistent cloud cover often limits optical remote sensing. Recent studies have shown that SAR, either alone or in combination with optical imagery and LiDAR, can support aboveground biomass estimation and broad-scale forest monitoring [172,173]. Future deep learning research should therefore further investigate multimodal fusion frameworks that integrate optical, LiDAR, and SAR data. Such approaches may improve model robustness, scalability, and transferability, particularly for biomass estimation and long-term forest monitoring across regions with diverse environmental conditions.
Overall, the literature suggests that deep learning/artificial intelligence may be beginning to influence forest inventory practices from a largely manual process into one that is increasingly automated, precise, and scalable. However, the next stage of progress will depend less on isolated gains in model accuracy, but more on the development of transferable, data-efficient, and interpretable frameworks that can perform reliably across diverse plantation, natural, and urban environments. Addressing these challenges will be essential not only for improving forest inventory methods, but also for strengthening the role of remote sensing and deep learning in long-term forest management, ecological monitoring, and conservation planning.

Author Contributions

Conceptualization, C.M.A., D.H.C., K.A.G., Y.H., N.S.L., S.P., J.S., B.T., S.K.W., C.P.W., J.W., I.J. and S.F.; investigation, C.M.A., D.H.C., K.A.G., Y.H., N.S.L., S.P., J.S., B.T., S.K.W., C.P.W., J.W., I.J. and S.F.; writing—original draft preparation, C.M.A., D.H.C., K.A.G., Y.H., N.S.L., S.P., J.S., B.T., S.K.W., C.P.W., J.W., I.J. and S.F.; writing—review and editing, C.M.A., D.H.C., K.A.G., Y.H., N.S.L., S.P., J.S., B.T., S.K.W., C.P.W., J.W., I.J. and S.F.; supervision, I.J. and S.F. All authors have read and agreed to the published version of the manuscript.

Funding

This research was funded by the U.S. Department of Agriculture’s National Institute of Food and Agriculture, grant number 2023-68012-38992 and 2024-67021-42879.

Data Availability Statement

No new data were created or analyzed in this study. Data sharing is not applicable to this article.

Acknowledgments

We thank Jaein Choi for reviewing the manuscript and providing helpful feedback.

Conflicts of Interest

The authors declare no conflicts of interest.

Abbreviations

The following abbreviations are used in this manuscript:
AGBAboveground Biomass
AIArtificial Intelligence
ALSAirborne LiDAR Systems
ARAugmented Reality
BEVBird’s Eye View
BioNetBiomass Prediction Network
BNNBayesian Neural Network
CBAMConvolutional Block Attention Module
CHMCanopy Height Model
CNNConvolutional Neural Network
DBMFDouble-branch Multi-source Fusion
DeITData-Efficient Image Transformer
DGCNNDynamic Graph Convolutional Neural Network
DMSDynamic Model Scaling
EVIEnhanced Vegetation Index
F1Harmonic Mean of Precision and Recall
FCNFully Convolutional Networks
FIAForest Inventory and Analysis
FPNFeature Pyramid Network
FPSFrames per second
FWFFull-waveform
GANsGenerative Adversarial Networks
GEDIGlobal Ecosystem Dynamics Investigation
HSIHyperspectral Imagery
IoU Intersection over Union
LiDARLight Detection and Ranging
LSTMLong Short-term Memory
MAEMean Absolute Error
MAPEMean Absolute Percentage Error
mIOUMean Intersection over Union
MLSMobile LiDAR systems
NAIPNational Agriculture Imagery Program
NDVINormalized Difference Vegetation Index
NIRNear-infrared
NEONNational Ecological Observatory Network
PCAPrincipal Component Analysis
PCTPoint Cloud Transformer
R-CNNRegion-Based Convolutional Neural Network
RFRandom Forests
RGBRed, Green, Blue
RMSERoot Mean Square Error
SARSynthetic Aperture Radar
SDASpot Detection Algorithm
SDKSoftware Development Kit
SOLOSegmenting Objects by Locations
SRGANSuper-resolution Generative Adversarial Network
SSD Single Shot MultiBox Detector
SVMsSupport Vector Machines
SWIRShort-wave infrared
TLSTerrestrial LiDAR systems
UAVUnmanned Aerial Vehicle
ULSUncrewed Aerial Vehicle LiDAR Systems
ViTVision Transformer
VGGVisual Geometry Group
VNIRVisible and Near-Infrared
YOLOYou Only Look Once

Appendix A

Table A1. Summary of sample size, validation approach, and key quality considerations for the tree counting and localization studies reviewed in this study. Studies marked as externally tested were evaluated on data from sites or conditions not represented in training. Where external testing was not reported, results should be interpreted with caution, as model performance may not generalize beyond the original study area.
AuthorsSample Size (Trees or Plots)Validation ApproachExternally TestedKey Limitations
Ammar et al. [53]13,071 instances 80/20 random splitNoOne region; palm-dominant; no cross-region test
Li et al. [54]9000 samples 80/20 splitNoOne image/date; small sample; manual labels limit accuracy
Wu et al. [55]50 UAV images (5351 trees)5-fold cross-validation NoOne orchard, one species/site; limited generalizability
Neupane et al. [56]2695 plants; 7212 samplesSeparate farm areaNoOne farm/species/date; altitude-sensitive; no cross-farm test
Bryson et al. [57]270 real trees; 12,800 synthetic50/50 split + cross-siteYesFew real trees/site; synthetic trees weaker; low species diversity
Hu et al. [58]100 trees; 14 regionsRegional splitNoOne site; two species; even-aged plantation; no external data
Liu et al. [59]144 trees; 1165 samples (10,485 augmented)70/30 within subregionsNoOne campus; small area; simple species mix
Windrim and Bryson [60]156 trees (2 sites)3-fold cross-validationNoOne species; 2 similar plantations; no heterogeneous forests
Wang et al. [61]802 train, 359 test images (3 plots) Non-overlapping plotsNoOne rubber plantation; no understory; visual labels only
Li et al. [62]24,466 crowns; 4208 NFI plotsTest set + NFI fieldYesMisses understory; underestimates crown area; height bias for very tall/short trees
Yao et al. [63]24 images; ~800–60k trees/image6-fold cross-validationNoOne province/sensor; RGB only; visual labels; no field data
Culman et al. [25]18,532 palms + small Alicante set5-fold cross-validation + independent test setYesPalms only; small transfer site; RGB only; no inventory-based validation
Tao et al. [24]4 plots (14–51 trees/plot)Against manual labelsNoVery small n; rule-based; trunk occlusion hurts accuracy; no cross-site test
Ayrey and Hayes [66]17,537 plots (8 sites)1000-plot test setNoSingle region; area-based only; older inventories; mixed sensors
Xi and Hopkinson [67]1181 crowns (12 plots)8 train/4 test plotsNoSmall test set; overfitting; poor bounding-box accuracy
You et al. [68]188 trees (3 plots)Field-crown test setNoOne site/ecosystem; LiDAR–field time gap; fails in dense stands
Zhong et al. [69]~401 trees (8 datasets)Independent test set + FOR-instanceYesSmall per-dataset n; mainly pure stands; trunk detection required
Ma et al. [70]200 ULS samples; 3 plots70/30 split + plot evaluationNoVery small plots; one region; weak in severe overlap/low quality
Ma et al. [71]Paris-Lille-3D + FOR-instanceBenchmark datasetYesNo new field data; urban-centric training; uncertain in natural forests
Xiang et al. [72]67 plots; FOR-instance ALS-HDBenchmark splitYesSingle dataset; drops in complex stands and low densities
Xiang et al. [73]FOR-instanceV2 (9 regions)Train/val/test within benchmarkYesOne benchmark suite; no training on fully independent datasets
Henrich et al. [74]6665 MLS trees + 156 stemsHeld-out plots/datasetsYesMostly temperate beech; no cross-biome large-scale test
Wielgosz et al. [75]FOR-instance ULS + 16 MLS plotsHeld-out + external setsYesDegrades at sparse ALS and very complex multilayer broadleaf stands
Wielgosz et al. [76]16 MLS plotsRadial hold-out + LAUTxYesManaged boreal only; graph stage needs retuning per forest type
Sun et al. [15]2269 ITCs (3 ALS sites)9 held-out plotsYesSubtropical mixed stands; weaker in multilayer, overlapping canopies
Kim et al. [77]435 trees (TLS/BLS)306/72/57 splitYesManaged conifers; strong results only with clear branch spacing and high-res sampling
Shao et al. [78]4 MLS datasets; 42 stems destructively measuredHeld-out testsYesTemperate forests only; MLS-only; stem-centric; one destructive site
Jarahizadeh and Salehi [79]~25,000 trees (2 datasets)Heiberg split + FOR-instanceYesTwo datasets; raster UAV LiDAR only; no crown/stem field metrics
Ball et al. [28]3797 crowns (4 sites); 65,786 applied5-fold cross-validationYesTropical upper canopy only; RGB-based; struggles in compact, interwoven crowns
Weinstein et al. [13]~30M LiDAR crowns; >10k RGB labels; 5852 eval treesSpatial train/test splits + case studiesYesRGB-only; no explicit understory; needs local fine-tuning in novel structures
Zhu et al. [16]6 UAV–LiDAR plotsWithin-plot testsNoOne region; few plots; tuned for regular crowns; weak in multilayer overlap
Lumnitz et al. [81]36,560 images; 782 GT trees City-wise splits + external cities YesUrban street trees only; monocular depth; under-detects distant/occluded/leaf-off trees
Kwon et al. [82]~1.29M trees; 100 plotsPlot-level ALS/GPS evaluationNoOne city; ≥2 m crowns only; understory excluded; species limited to 21 urban types
Firoze et al. [83]278M trees in 330 U.S. citiesCity-level inventory/aggregate checksYesSatellite-only; no species/height/understory; U.S. cities only; misses in occluded canyons
Li and Yan [84]146 street trees; 84.5M MLS pts Single-street splits NoOne street side; 2D MLS only; no georeferencing; no parks/yards
Chen et al. [85]4 UAV-LiDAR subsets; ~1300 test treesWithin-site splitsNoPer-stand voxel tuning; drops in complex/defoliated canopies; no external sites
Gupta et al. [86]313–535 labeled trees/siteIndependent multi-city/dataset testsYesTree vs. non-tree only; small trees lost; shrubs vs. trees confused
Table A2. Summary of species used across reviewed studies.
AuthorsStudyData TypeRegionNumber of Species
Allen et al. 2022 [116]Tree species classification from complex laser scanning data in Mediterranean forests using deep learningLiDARTemperate5 (Casuarina equisetifolia, Pinus pinaster, P. sylvestris, Quercus faginea, Q. ilex)
Beery et al. 2022 [135]A Large-Scale Benchmark for Multiview Urban Forest Monitoring under Domain ShiftOpticalTemperate344 genera (genus, not listed)
Beloiu et al. 2023 [107]Individual Tree-Crown Detection and Species Identification in Heterogeneous Forests Using Aerial RGB Imagery and Deep LearningOpticalTemperate4 (Picea abies, Abies alba, Pinus sylvestris, Fagus sylvatica)
Bolyn et al. 2022 [17]Mapping tree species proportions from satellite imagery using spectral–spatial deep learningOpticalTemperate8 (Quercus robur, Quercus petraea, Fagus sylvatica, Pseudotsuga menziesii, Populus x euramericana, Pinus, Larix, Betula)
Branson et al. 2018 [97]From Google Maps to a fine-grained catalog of street treesOpticalSubtropical40 (Washingtonia robusta, Cinnamomum camphora, Quercus virginiana, Quercus ilex, Magnolia grandiflora, Phoenix dactylifera, Brachychiton populneus, Washingtonia filifera, Ficus microcarpa, Ulmus parvifolia, Jacaranda mimosifolia, Ceratonia siliqua, Syzygium australe, Lophostemon confertus, Cupaniopsis anacardioides, Cupressus sempervirens, Phoenix dactylifera, Fraxinus uhdei, Podocarpus gracilior, Liquidambar styraciflua)
Branson et al. 2018 [97]From Google Maps to a Fine-Grained Catalog of Street treesOpticalSubtropical7 (Acer, Jacaranda, Liquidambar, Melia, Platanus, Prunus, Quillaja)
Briechle et al. 2020 [132]Classification of tree species and standing dead trees by fusing UAV-based lidar data and multispectral imagery in the 3D deep neural network PointNet++Optical, LiDARTemperate3 + standing dead (Pinus sp., Betula sp., Alnus sp., and standing dead trees)
Carpentier et al. 2018 [139]Tree Species Identification from Bark Images Using Convolutional Neural NetworksOpticalTemperate23 (Abies balsamea, Acer platanoides, Acer rubrum, Acer saccharum, Betula alleghaniensis, Betula papyrifera, Fagus grandifolia, Fraxinus americana, Larix laricina, Ostrya virginiana, Picea abies, Picea glauca, Picea mariana, Picea rubens, Pinus rigida, Pinus resinosa, Pinus strobus, Populus grandidentata, Populus tremuloides, Quercus rubra, Thuja occidentalis, Tsuga canadensis, Ulmus americana)
Chadwick et al. 2024 [141]Transferability of a Mask R–CNN model for the delineation and classification of two species of regenerating tree crowns to untrained sitesOpticalBoreal2 (Pinnus contorta, Picea glauca)
Chen et al. 2023 [95]Tree Species Classification in Subtropical Natural Forests Using High-Resolution UAV RGB and SuperView-1 Multispectral Imageries Based on Deep Learning Network Approaches: A Case Study within the Baima Snow Mountain National Nature Reserve, ChinaOpticalSubtropical5 (Pinus yunnanensis, Alnus nepalensis, Populus davidiana, Quercus aliena, Acer forrestii)
Egli and Hopke 2022 [108]CNN-Based Tree Species Classification Using High Resolution RGB Image Data from Automated UAV ObservationsOpticalTemperate4 (Quercus robur, Fagus sylvatica, Larix decidua, Picea abies)
Ferreira et al. 2020 [89]Individual tree detection and species classification of Amazonian palms using UAV images and deep learningOpticalTropical3 (Attalea butyracea, Euterpe precatoria, Iriartea deltoidea)
Ferreira et al. 2024 [103]Improving urban tree species classification by deep-learning based fusion of digital aerial images and LiDAROptical, LiDARTropical6 (Terminalia catapa, Pachira aquatica, Licania tomentosa, Senna siamea, Tamarindus indica, Caesalpinia pluviosa)
Fricker et al. 2019 [105]A Convolutional Neural Network Classifier Identifies Tree Species in Mixed-Conifer Forest from Hyperspectral ImageryOpticalTemperate7 (Abies concolor, Abies magnifica, Calocedrus decurrens, Pinus jeffreyi, Pinus lambertiana, Quercus kelloggii, Pinus contorta)
Gibril et al. 2021 [90]Deep Convolutional Neural Network for Large-Scale Date Palm Tree Mapping from UAV-Based Images.”OpticalTropical1 (Phoenix dactylifera)
Gibril et al. 2025 [91]Efficient Large-scale Mapping of Acacia tortilis Trees Using UAV-based Images and Transformer-based Semantic Segmentation ArchitecturesOpticalTropical and subtropical1 (Acacia tortilis)
Hamdani et al. 2026 [119]Urban Tree Classification from Multispectral Airborne LiDAR Using PointNet, DGCNN & RandLA-NetLiDARTemperate7 taxa (Pinus sylvestris, Picea spp., Betula spp., Acer platanoides, Populus tremula, Sorbus spp., Quercus robur, Tilia spp., Alnus spp.)
Hartling et al. 2019 [131]Urban tree species classification using a WorldView-2/3 and LiDAR data fusion approach and deep learningOptical, LiDARTemperate8 taxa (Fraxinus pennsylvanica, Larix sp., Populus sp., P. deltoides, Quercus palustris, Acer saccharum, and 2 additional species not specified in this review; see original study)
Huo et al. 2026 [124]Precise urban tree species identification and biomass estimation using UAV–Handheld LiDAR Synergy and YOLOv11 deep learningLiDARTemperate17 genera (Syringa reticulata subsp. Amurensis, Pyrus calleryana, Acer palmatum, Malus spp., Zelkova serrata, Cornus walteri, Celtis sinesis, Aesculus hippocastanum, Cerus eodara, Platanus oreintalis, Ginkgo biloba, Prunus serrulata, Ulmus pumila, Catalpa bungei, Fraxinus chinesis, Magnolia denudata, Metasequoia glyptostroboides)
Kim et al. 2022 [134]Identifying and extracting bark key features of 42 tree species using convolutional neural networks and class activation mappingOpticalTemperate42 (Abies balsamea, Acer palmatum var. amoenum, Acer rubrum, Acer saccharum, Aesculus turbinata, Betula alleghaniensis, Betula papyrifera, Castanea crenata, Chamaecyparis pisifera, Fraxinus americana, Ginkgo biloba, Larix laricina, Magnolia obovata, Metasequoia glyptostroboides, Ostrya virginiana, Picea abies, Picea glauca, Picea mariana, Picea rubens, Pinus densiflora, Pinus koraiensis, Pinus resinosa, Pinus rigida, Pinus strobus, Platanus occidentalis, Populus tremuloides, Prunus serrulata, Prunus yedoensis, Quercus acutissima, Quercus aliena, Quercus rubra, Quercus serrata, Quercus variabilis, Robinia pseudoacacia, Sophora japonica, Sorbus alnifolia, Taxodium distichum, Thuja accidentals, Tsuga canadensis, Ulmus americana, Zelkova serrata)
Li et al. 2021 [142]CNN-Based Individual Tree Species Classification Using High-Resolution Satellite Imagery and Airborne LiDAR DataOptical, LiDARBoreal4 (Acer, Robinia, Pinus, Picea)
Li et al. 2022 [27]ACE R-CNN: An Attention Complementary and Edge Detection-Based Instance Segmentation Algorithm for Individual Tree Species Identification Using UAV RGB Images and LiDAR DataOptical, LiDARTropical and subtropical7 (Betula alnoides, Michelia macclurei, Acacia melanoxylon, Eucalyptus urophyllus, Castanopsis hystrix, Pinus elliottii, Camellia oleifera)
Liu et al. 2021 [127]Tree species classification of LiDAR data based on 3D deep learningLiDARTemperate2 (Betula, Larix)
Liu et al. 2022 [122]Tree species classification using ground-based LiDAR data by various point cloud deep learning methodsLiDARTemperate8 (Betula, Cunninghamia lanceolata, Ulmus, Eucalyptus, Larix, Robinia, Populus, Salix)
Ma et al. 2024 [129]A deep-learning-based tree species classification for natural secondary forests using unmanned aerial vehicle hyperspectral images and LiDAROptical, LiDARTemperate4 (Pinus koraiensis, Ulmus pumila, Fraxinus mandshurica, Acer mono)
Marinelli et al. 2022 [115]An Approach Based on Deep Learning for Tree Species Classification in LiDAR Data Acquired in Mixed ForestLiDARTemperate7 (Abies alba, Picea abies, Betula pendula, Larix, Alnus glutinosa, Pinus cembra, Populus tremula)
Martins et al. 2021 [92]Deep Learning-Based Tree Species Mapping in a Highly Diverse Tropical Urban SettingOpticalTropical9 (Caesalpinia pluviosa, Delonix regia, Ficus spp., Licania tomentosa, Pachira aquatica, Plumeria rubra, Senna siamea, Tamarindus indica, Terminalia catappa)
Mayra et al. 2021 [143]Tree species classification from airborne hyperspectral and LiDAR data using 3D convolutional neural networksOptical, LiDARTemperate4 (Pinus sylvestris, Picea abies, Betula pubescens/B. pendula, Populus tremula)
Mu et al. 2025 [111]National-scale tree species mapping with deep learning reveals forest management insights in GermanyOpticalTemperate8 genera (Picea spp., Pseudo-tsuga spp., Abies spp., Fagus spp., Larix spp., Quercus spp., Pinus spp., Other.)
Mu et al. 2026 [145]GlobalGeoTree: a multi-granular vision-language dataset for global tree species classificationOpticalGlobal (all biomes)21,001 (not listed; global vision-language benchmark)
Natesan et al. 2020 [22]Individual tree species identification using Dense Convolutional Network (DenseNet) on multitemporal RGB images from UAVOpticalBoreal5 (Thuja occidentalis, Abies balsamea, Picea glauca, Pinus resinosa, Pinus strobus)
Nezami et al. 2020 [23]Tree Species Classification of Drone Hyperspectral and RGB Imagery with Deep Learning Convolutional Neural NetworksOpticalBoreal3 (Pinus sylvestris, Picea abies, Betula pendula)
Ohamouddou et al. 2025 [118]MS-DGCNN++: A multi-scale fusion dynamic graph neural network with biological knowledge integration for LiDAR tree species classificationLiDARTemperateSTPCTLS: 7 (Fagus sylvatica, Psuedotsuga menziesii, Quercus spp., Fraxinus excelsior, Picea abies, Pinus sylvestris, Quercus rubra); HeliALS: 9 (Pinus spp., Picea spp., Betula spp., Acer spp., Populus spp., Quercus spp., Sorbus spp., Tilia spp., Alnus spp.)
Onishi et al. 2021 [144]Explainable identification and mapping of trees using UAV RGB image and deep learningOpticalTemperate3 (Pinus strobus, Pinus elliottii, Chamaecyparis obtuse)
Onishi et al. 2022 [113]Practicality and Robustness of Tree Species Identification Using UAV RGB Image and Deep Learning in Temperate Forest in JapanOpticalTemperate56 (Chamaecyparis obtusa, Cryptomeria japonica, Abies firma, Pinus densiflora, Tsuga sieboldii, Ilex chinensis, Ilex latifolia, Ilex macropoda, Ilex micrococca, Ilex pedunculosa, Chengiopanax sciadophylloides, Evodiopanax innovans, Kalopanax septemlobus, Betura grossa, Carpinus cordata, Carpinus japonica, Carpinus laxiflora, Carpinus tschonoskii, Ostrya japonica, Cercidiphyllum japonicum, Lyonia ovalifolia var. elliptica, Castanea crenata, Castanopsis cuspidata, Fagus crenata, Fagus japonica, Quercus acuta, Quercus crispula, Quercus glauca, Quercus salicina, Quercus serrata, Pterocarya rhoifolia, Cinnamomum camphora, Magnolia obovata, Magnolia salicifolia, Morella rubra, Fraxinus lanuginosa f. serrata, Ternstroemia gymnanthera, Hovenia dulcis, Hovenia tomentella, Aria alnifolia, Aria japonica, Malus tschonoskii, Prunus grayana, Prunus jamasakura, Meliosma myriantha, Populus tremula var. sieboldii, Acer carpinifolium, Acer mono Maxim, Acer nipponicum, Acer palmatum, Acer palmatum var. amoenum, Acer sieboldianum, Aesculus turbinata, Symplocos prunifolia, Stewartia monadelpha, Zelkova serrata)
Pearse et al. 2021 [18]Deep Learning and Phenology Enhance Large-Scale Tree Species Classification in Aerial Imagery during a Biosecurity ResponseOpticalTemperate1 (Metrosideros excelsa)
Pierdicca et al. 2023 [96]uav4tree: deep learning-based system for automatic classification of tree species using rgb optical images obtained by an unmanned aerial vehicle.OpticalSubtropical4 (Acer opalus, Castanea sativa, Olea europaea, Quercus pubescens)
Puliti et al. 2025 [125]Benchmarking tree species classification from proximally sensed laser scanning data: Introducing the FOR-species20K datasetLiDARTemperate33 taxa (not specified in this review; see original study)
Qin and Zhao 2025 [114] Multi-branch and multi-label tree species classification using deep learning for UAV aerial photography and Sentinel remote sensing imagesOpticalTemperate15 genera (Abies, Acer, Alnus, Betula, Fagus, Fraxinus, Larix, Picea, Pinus, Populus, Prunus, Psuedotsuga, Quercus, Tilia, Cleared land)
Robert, Dallaire, and Giguère 2020 [136]Tree bark re-identification using a deep-learning feature descriptorOpticalTemperate2 (Pinus resinosa, Ulmus spp.)
La Rosa et al. 2021 [94]Multi-task fully convolutional network for tree species mapping in dense forests using small training hyperspectral dataOpticalTropical14 (Luehea, Araucaria, Mimosa, Lithraea, Campomanesia, Cedrela, Cinnamodendron, Cupania, Matayba, Nectandra, Ocotea, Podocarpus, Schinus sp1, and Schinus sp1, Schinus sp2.)
Sablon and Bajgain 2025 [104]A multimodal attention-based model for tree species classification using LiDAR and satellite imageryOptical, LiDARTemperate and Mediterranean20 taxa (Pinus radiata, Pinus ponderosa, Pinus sabiniana, Ecualytpus spp., Sequoia sempervirens, Quercus spp., Quercus agrifolia/Quercus wislizeni, Psueotsuga menziesii, Calocedrus decurrens, Liquidambar styraciflua, Pinus lambertiana, Quercus kelloggii, Umbllularia californica, Juglans spp., Notholithocarpus ensiflorus, Abies spp., Quercus lobata, Populus spp., Arbutus menziesii, Other)
Schiefer et al. 2020 [109]Mapping forest tree species in high resolution UAV-based RGB-imagery by means of convolutional neural networksOpticalTemperate9 (Abies alba, Betula pedula, Carpinus betulus, Fagus sylcatica, Fraxinus excelsior, Larix decidua, Picea abies, Pinus sylvestris, Pseudotsuga menziesii)
Scholl et al. 2021 [98]Fusion neural networks for plant classification: learning to combine RGB, hyperspectral, and lidar dataOptical, LiDARSubtropical and Temperate31 (Pinus palustris, Quercus rubra, Acer pensylvanicum, Q. alba, Q. laevis, Q. coccinea, Amelanchier laevis, Nyssa sylvatica, Liriodendron tulipifera, Q. geminata, Magnolia sp., Q. montana, Oxydendrum sp., Beluta sp., Pinus sp., Prunus serotina, Acer rubrum, P. elliottii, Carya glabra, Fagus grandifolia, P. taeda, Q. hemisphaerica, Robinia pseudoacacia, Tsuga canadensis, A. saccharum, C. tomentosa, Gordonia lasianthus, Lyonia lucida, Nyssa biflora, Quercus sp., Q. laurifolia)
Seidel et al. 2021 [126]Predicting Tree Species From 3D Laser Scanning Point Clouds Using Deep LearningLiDARTemperate7 (Fagus, Pseudotsuga menziesii, Quercus, Fraxinus, Picea, Pinus, Quercus rubra)
Sothe et al. 2020 [20]Comparative performance of convolutional neural network, weighted and conventional support vector machine and random forest for classifying tree species using hyperspectral and photogrammetric dataOpticalTropical14 (Araucaria, Campomanesia, Cedrela, Cinnamodendron, Cupania, Lithraea, Luehea, Matayba, Nectandra, Ocotea, Podocarpus, Schinus sp1, Schinus sp2.)
Straker et al. 2025 [120]Enhancing Tree Species Classification: Insights from YOLOv8 and Explainable AI Applied to TLS Point Cloud ProjectionsLiDARTemperate7 taxa (Betula spp., Fagus spp., Fraxinus spp., Quercus spp., Pinus spp., Picea spp., Pseudotsuga spp.)
Sun et al. 2019 [100]Deep Learning Approaches for the Mapping of Tree Species Diversity in a Tropical Wetland Using Airborne LiDAR and High-Spatial-Resolution Remote Sensing ImagesOptical, LiDARTropical18 (Ceiba speciosa, Ficus benghalensis, Delonix regia, Dimocarpus longan, Musa, Carica papaya, Bauhinia, Eucalyptus, Averrhoa carambola, Prunus serrulata, Taxodium ascendens, Alstonia scholaris, Bischofia javanica, Hibiscus tiliaceus, Litchi chinensis, Mangifera indica, Cinnamomum camphora)
Sun et al. 2023 [121]Classification of Individual Tree Species Using UAV LiDAR Based on TransformerLiDARTemperate3 (Betula spp., Quercus mongolica, Pinus sylvestris)
Tan et al. 2025 [112]Leveraging Sentinel-1/2 time series and deep learning for accurate forest tree species mappingOpticalTemperate7 + other class (Larix principisrupprechtii, Pinus tabuliformis, Pinus bungeana, Platyclaus orientalis, Quercus wutaishanica, Betlua spp., Populus spp., Other)
Vahrenhold et al. 2025 [133]MMTSCNet: multimodal tree species classification network for classification of multi-source, single-tree LiDAR point cloudsLiDARTemperate7 taxa (Carpinus betulus, Fagus sylvatica, Picea abies, Pinus sylvestris, Pseudotsuga menziesii, Quercus Petraea, Quercus rubra)
Wang et al. 2023 [123]Tree Species Classfifcation Using Deep Learning Based 3d Point Cloud Transformer on Airborne Lidar DataLiDARTemperate11 (Abies alba, Acer pseudoplatanus, Carpinus betulus, Fagus sylvatica, Juglans regia, Larix decidua, Picea abies, Pinus sylvestris, Pseudotsuga menziesii, Quercus petraea, Quercus rubra)
Wang and Ren 2021 [110]DBMF: A Novel Method for Tree Species Fusion Classification Based on Multi-Source ImagesOpticalTemperate6 (Cunninghamia lanceolata, Pinus massoniana, Cinnamomum camphora, Schima superba, Liquidambar formosana)
Wang et al. 2026 [130]Species-specific tree structural parameters extraction via UAV RGB-LiDAR data and multimodal instance segmentationOptical, LiDARTemperate5 + deadwood (Picea crassifolia, Sabina przewalskii, Betula platyohylla, Populus daviiana, Salix cheilophila)
Wu et al. 2021 [137] Deep BarkID: a portable tree bark identification system by knowledge distillationOpticalTemperate10 (Fagus grandifolia, Prunus serotina, Robinia pseudoacacia, Carpinus caroliniana, Acer saccharum, Platanus occidentalis, Quercus rubra, Liriodendron tulipifera, Juglans nigra, Quercus alba)
Yan et al. 2021 [106]A new individual tree species recognition method based on a convolutional neural network and high-spatial resolution remote sensing imageryOpticalTemperate6 (Fraxinus chinensis Roxb., Populus tomentosa, Sabina chinensis, Sophora japonica, Salix babylonica, Pinus)
Zhang et al. 2021 [93]Tree species classification using deep learning and RGB optical images obtained by an unmanned aerial vehicleOpticalSubtropical10 (Celtis sinensis, Cinnamomum camphora, Ginkgo biloba, Metasequoia glyptostroboides, Magnolia grandiflora, Michelia chapensis, Osmanthus fragrans, Platanus acerifolia, Sapindus mukorossi)
Zhong et al. 2024 [102]Individual Tree Species Identification for Complex Coniferous and Broad-Leaved Mixed Forests Based on Deep Learning Combined with UAV LiDAR Data and RGB ImagesOptical, LiDARTemperate7 (Populus davidiana, Ulmus pumila, Betula platyphylla, Fraxinus mandshurica, Pinus koraiensis, Larix gmelinii, Salix alba)
Zhang et al. 2025 [117]Efficient tree species classification using machine and deep learning algorithms based on UAV-LiDAR data in North ChinaLiDARTemperate4 genera (Populus alba, Populus simonii, Pinus sylvestris, Pinus tabuliformis)
Table A3. Summary of sample size, validation approach, and key quality considerations for the tree species identification studies reviewed in this study. Given the diversity of species sets and forest types represented, particular attention should be paid to whether results were validated externally, as classification accuracy is known to decline when models are applied to species compositions or environmental conditions not represented in training.
AuthorsSample Size (Trees or Plots)Validation ApproachExternally TestedKey Limitations
Ferreira et al. [89]28 palm-rich plots; all visible ITCs (3 palm spp.)22/6 plot split (resampled)NoOne Amazon site; three palms; single UAV RGB campaign
Gibril et al. [90]1 UAV orthomosaic → 17,954 tiles; all date-palm pixels labeledFixed 65/15/20 tile splitNoOne emirate/campaign; palm vs. background only; no cross-region/species test
Gibril et al. [91]9100 field Acacia trees; 11,067 train, 1010 val, 800 test tilesSpatial train/val/test zonesNoOne region/country; Acacia tortilis only; no cross-region or multi-species eval
Martins et al. [92]370 urban ITCs (9 spp.)60/40 ITC split, 8 resamplingNoOne neighborhood; few crowns per species; no external city/sensor
Zhang et al. [93]19,302 UAV RGB canopy images (10 spp.)80/20 train/val + held-out testNoOne city/campaign; patch-level only; no cross-city/sensor transfer
Sothe et al. [20]1121 ITCs, 16 spp., 2 fragments~50% ITCs per area held outNoTwo small fragments; few, imbalanced ITCs; no full-extent or external test
La Rosa et al. [94]70 ITCs (14 spp.) in 30 ha38 train/32 test ITCs, 25 runsNoOne stand/flight; very small, imbalanced sample; same-site only
Chen et al. [95]450 trees (5 spp.) → 2250 crown images Single area; 80/20 train/val on crowns; 90 field trees for testNoOne reserve, 5 spp.; segmentation F1 ≈ 72%; no external region/sensor/date
Pierdicca et al. [96]2690 ground images train; 2650 UAV images test (4 spp.) Train on iNaturalist; UAV only for held-out testNoExtreme domain gap (ground vs. UAV); image-level labels only; one region; no mapping
Branson et al. [97]~80k Pasadena street trees; >100k imagesCity-wide train/val/test in PasadenaNoOne city/inventory; street trees only; common spp. only; no cross-city tests
Li et al. [27]3 plantation subareas, 7 spp.; all crowns in 512 × 512 tiles60/40 crown split per subareaNoOne managed plantation; limited species/structure; no cross-stand/year/sensor
Ferreira et al. [103]288 urban ITCs (6 spp.)60/40 ITC split; 70/30 patch split; 5 resamplingsNoOne Rio neighborhood; 6 spp.; relies on existing ITCs; no cross-city/year/sensor
Sablon and Bajgain [104]~450k labeled trees (20 taxa) in CA; ~16k test treesRegion-stratified split within CANoOne utility + LiDAR/PlanetScope campaign in California; some taxa sparse; no other regions/sensors/years
Scholl et al. [98]1052 NEON RGB crowns (31 taxa)2 sites train/val, 1 unseen site testYesSmall, imbalanced sample; 3 NEON sites only; NEON-specific; big drop on unseen site
Fricker et al. [105]713 trees (7 live spp. + dead) in 1 NEON stripSpatial train/val/test along same stripNoOne mixed-conifer site/flight; modest n, few species; no cross-site/year/sensor
Yan et al. [106]801 trees (6 spp.) in Olympic Forest Park, 1 WV3 imageSubregions for train; separate region held out for testNoOne small urban park; 6 spp.; single date/sensor; easier than natural stands; no external test
Beloiu et al. [107]22k train+val trees; 823 trees in 8 test sites (4 spp.)Spatial 90/10 then 8 held-out sitesYesSwiss forests only; 4 spp.; RGB only; weaker in dense/heterogeneous stands; no cross-country transfer
Egli and Hopke [108]59,987 tiles, 477 trees (4 spp.)Leave-location-and-time-out (LLTO) cross-validation (exclude 1 region + 1 date)YesOne German forest; 4 spp.; tile-level only; no georeferenced ITCs; site/sensor-specific
Bolyn et al. [17]~120k parcels train; 4746 inventory plots test (9 spp./genera)Independent RFI plot validationYesWallonia only; Sentinel-2 coarse for ITCs; stand-level labels; strong class imbalance; basal-area proportions, not trees
Schiefer et al. [109]51 ha plots, 14 classes; 62.8k/15.1k/3.1k tiles10% test area; 75/25 train/val; one held-out plotNoTwo German sites; visual labels; rare spp. poorly learned; needs <2 cm imagery; no external transfer
Wang and Ren [110]3 areas; 6 spp.; ~30% pixels train, 70% testRandom pixel 30/70, 5 runsNoOne boreal region; resampled hyperspectral; pixel-level split (no spatial separation); temporal mismatch; no external test
Mu et al. [111]~35k train/val patches; 2364 NFI plots (8 spp.)Four ROIs fully held-out; extra visual siteYesSentinel-2 10 m (dominant spp. only); label/temporal uncertainty; Germany only; Douglas fir weaker
Tan et al. [112]65,868 samples (7 spp. + other); 39,525 test; 380k unlabeledStratified 60/40 + 5-fold CV; independent test NoOne mountain region; temporal mismatch; pseudo-labels restricted; Sentinel-2 10 m; no external transfer
Pearse et al. [18]4600 canopy images (binary: pōhutukawa vs. other)70/15/15 tree-level split; 2 timepointsNoBinary only; one NZ city; depends on phenology and manual ITCs; uncalibrated RGB; no external transfer
Onishi et al. [113]13,937 crowns (58 spp.) at 3 train, 3 test sites3 tiers: random, polygon, cross-siteYesCross-site Kappa drops to 0.47; needs many samples/class; imperfect crowns; UAV RGB only; small areas/flight
Qin and Zhao [114]50,381 images (15 spp.) from TreeSatAIRandom 70/30 train/val; no test setNoOne regional dataset; strong imbalance; multi-label; no external transfer
Marinelli et al. [115]1216 trees (7 spp.) in 800 ha Alpine forestCV + independent test; single siteNoOne Italian site; <1k training trees; manual ITCs; underrepresented broadleaf spp.; no external transfer
Allen et al. [116]2478 trees (5 spp.) from 38 TLS plotsRandom 70/15/15 tree-level splitNoOne Mediterranean region; 5 spp.; rare species small; no cross-site/sensor test
Zhang et al. [117]2622 trees (4 spp.) from 12 plotsStratified 80/20 splitNoOne plantation; 4 spp.; uniform structure; no external transfer
Ohamouddou et al. [118]STPCTLS: 691 trees (7 spp.); HeliALS: 6326 trees (9 spp.)STPCTLS: 5-fold CV; HeliALS: fixed splitYes (HeliALS)/No (STPCTLS)Only 2 temperate datasets; no tropical/boreal/urban; sensitive to outliers; geometry-only HeliALS
Hamdani et al. [119]3935 trees (7 spp.) from MS-ALS-SPECIES Random 75/25 splitNoOne Finnish suburb; 7 spp.; no spatial holdout; no cross-site/sensor; signs of overfitting
Straker et al. [120]2445 TLS trees (7 spp.)5-fold cross-validation on 90% + 10% testNoTemperate TLS only; possible spatial autocorrelation; low Ash/Oak/Birch counts; no external transfer
Sun et al. [121]1109 trees (3 spp.) → 2000 augmented cloudsRandom 80/20 splitNoOne urban forest; 3 spp.; dense crowns reduce LiDAR info; no external or sensor transfer
Liu et al. [122]8 spp. from 3 MLS sites in ChinaStratified 80/20 across pooled dataNo3 sites but no cross-site holdout; small per-species n; MLS only; no cross-sensor/region tests
Liu et al. [127]1200 trees (2 spp.) + 40 ground-LiDAR treesSpatial west/east split; extra GB-LiDAR checkNoBinary task; one forest park; small dataset; only limited ground-LiDAR cross-check
Wang et al. [123]1291 trees (11 spp.) from 6 ALS plotsSplit unclear; single German datasetNo6 of 12 plots; strong imbalance; sparse ALS; upsampling harms; no external transfer; limited details
Ottoy et al. [128]464 detected trees, 47 field-measuredStreet inventory + 47 trees for DBH/heightYesOne urban street; mostly Acer; no species classification; DBH error high; not a species study
Huo et al. [124]3935 train/val trees; 2079 test trees (17 spp.) in QingdaoIndependent 2079-tree test; structural params vs. 1697 field treesYesOne city; planted/pruned trees; 25–65 training trees/species; no cross-city/sensor
Puliti et al. [125]20,158 trees (33 spp.) from 25 datasets; 2254-tree testStratified 90/10 dev/test; test labels hiddenYesTest from same pool; some spp. 1-platform only; poor for small trees; unknown sensors outside dataset
Seidel et al. [126]690 trees (7 spp.) TLS (DE/US)Random train/test splitNoSmall n for some spp.; multiple sites increase intra-species variability; no cross-site/sensor transfer
Ma et al. [129]2104 trees (6 spp. + other) + 351 external treesRandom 70/30 split + separate Muling testYesOne main area; small minority classes; “Other” mixes spp.; overlap induces label noise; limited cross-sensor test
Wang et al. [130]5676 ITCs (6 classes) in 55 ha4-fold cross-validationNoOne alpine site; heavy class imbalance; DBH via models; no external transfer
Hartling et al. [131]1552 polygons (8 spp.) in 1 urban parkRandom 70/30 train/test splitNoSingle US park; multi-year imagery/LiDAR mismatch; 8 spp.; no cross-site transfer
Briechle et al. [132]668 samples (4 classes) in Chernobyl siteRandom 70/30 train/test splitNoOne unique site; tiny sample; visual labels only; no external/sensor transfer
Vahrenhold et al. [133]7 spp. from 12 plots in GermanyStratified 90/10 train/test splitNoOne region; 7 spp. subset; sparse ALS; no independent forest/sensor transfer
Zhong et al. [102]1260 trees (8 classes) in 13 ha forestRandom 60/20/20 train/validation/test splitNoOne NE China forest; small minority classes; box labels in crowded crowns; no external transfer
Natesan et al. [22]~300+ conifers (5 spp.) in one 20-ha site; 3 yearsIndependent test trees; multi-year same-sitNoSingle site; conifers only; pine-biased; no cross-site/region tests
Nezami et al. [23]3896 trees (3 spp.) in Finnish forestFixed 803-tree test setNoOne site/date; 3 boreal spp.; pine dominant; 2014 imagery only; no external transfer
Chadwick et al. [141]2022 field trees (2 spp.) + 241 tiles5 independent test sites; leave-1-site-outYesTwo conifers in 13-year stands; many trees invisible; one leaf-off flight; no other regions/ecosystems
Li et al. [142]1503 samples (4 spp.) from York campusRandom 70/30 splitNoOne campus; 4 spp.; LiDAR/imagery year mismatch; small spruce n; no external transfer
Mayra et al. [143]2826 trees (4 spp.) in Evo, FinlandColumn-wise spatial train/val splitNoOne boreal site; 4 spp.; many trees unsegmented; one date; no external transfer
Kim et al. [134]Large bark dataset (42 spp.)Standard train/test + zero-shotNoBark only; one dataset; no remote sensing; no cross-site validation; lower genus/family zero-shot accuracy
Beery et al. [135]2.6M trees, 344 genera, 23 citiesWithin-city splits; holdout citiesYesGenus-level; noisy census labels; long-tail imbalance; varying quality; limited field ground truth
Robert et al. [136]2400 bark images (2 spp.)Surface-level split; cross-species testsYes2 species at one site/night; bark re-ID task; limited real-world use
Wu et al. [137]IBD: 18,540 patches, 61 trees; BarkNet: 23,359 images, 998 trees5-fold CV (tree-/image-level)NoBark only; small IBD; image-level split risk; single sites; no spatial validation
Carpentier et al. [139]23,616 bark images (23 spp., 1006 trees)5-fold cross-validation (tree-level)NoQuébec region only; bark only; 3 rare spp. dropped; device/region transfer untested
Mu et al. [145]6.3M occurrences (21k spp.); 10kEval ~10k samples/90 spp.Pretrain on 6M; disjoint eval subsetsYesSentinel-2 5 × 5 + ancillary data; occurrence-based labels; many rare spp.; eval still covers limited global diversity
Table A4. Summary of sample size, validation approach, and key quality considerations for the tree measurement studies reviewed in this study. For biomass and volume estimation in particular, the distinction between studies validated against direct field measurements and those relying on inventory-derived or allometric reference data is especially important, as the latter introduces additional uncertainty into report accuracies.
Author(s)Sample Size (Trees or Plots)Validation ApproachExternally TestedKey Limitations
Shen et al. [146]110 trees; 300 images (aug. to 1000)8:1:1 splits for depth and seg.; height vs. Vertex IVNoOne campus; limited species/structure; smartphone + controlled distances only
Xia et al. [147]2593 train crowns; 213 Ginkgo test crownsTrain/test from different UAV blocks in one cityNoOne city; one ornamental species; same-flight RGB+CHM; no cross-city/sensor test
Gan et al. [148]499 canopy crowns (4 spp.) in 1.5 ha plotSingle temperate stand; pretrain vs. local fine-tuneNoOne small complex stand; canopy tops only; needs very high-res UAV RGB; no external forest/sensor
Yao et al. [149]4 plantation spp.; 5 UAV hyperspectral plotsRandom 80/20 tree split within same plotsNoOne managed plantation; 4 spp.; ideal hyperspectral; no independent stand/year/sensor
Xu et al. [150]820 UAV chips; Pinus crownsRandom train/val/test from one orthomosaicNoOne farm; one conifer; DBH tied to local allometry; no external stand or acquisition
Tolan et al. [151]US-wide Maxar RGB + lidar labels; CA/SP mapsR Held-out lidar tiles; GEDI + Brazilian NFI testsYesTrained where lidar exists; shown for 2 regions; height only (no species); uncertain in low/shrubby/complex agroforestry
Song et al. [152]Handheld unit; cylinder + tree testsCylinders and trees vs. tape DBHYesCustom device; few sites/species; assumes clear trunk view at 1.3 m and good framing
Wang et al. [19]1600 trunk images train; 526 stems testField SD vs. tape across 3 scenariosYesSingle purpose SD device; needs visible stem and controlled geometry; no species/height; dense tropical stands untested
Safarov et al. [153]Thousands of UAV plots; 1800 test plotsFixed train/val/test within Korean carbon datasetYesOne national program; plot-level AGB only; no tests in other biomes/sensors/coarser imagery
Juyal and Sharma [154]~400 images; 3 demo treesMask R-CNN on same-site images; 3 trees for volumeNoTiny demo (3 trees); one site; needs reference board; no independent field or generalization test
Liu et al. [155]64 plots; 3000 train + 512 plot imagesSame plots for UNet and GSV modelNoOne forest (Daxing’anling), 4 spp.; fixed ground-photo protocol; single pixel-fraction feature; no external site/sensor
Tamiminia et al. [156]48 shrub-willow plotsRandom 67/33 plot splitNoOne site/date; 2 cultivars; small n; unclear transfer to other shrubs or growth stages
Chang et al. [157]9967 FIA plots (CA/NV)Independent 500-plot testNoCA–NV only; >50% plots discarded; dead class rare; no tests beyond these ecotypes
Hanan et al. [158]23,885 trees (3 spp.) in NorwaySingle-site train/val/test splitNoOne site, 3 spp.; AGB truth from allometry, not harvest; SAR 10 m; moderate r ≈ 0.57
Pascarella et al. [159]3 regions; ESA CCI biomass + S28-fold geographic CV + one field case studyYesBiomass truth from coarse satellite product; 100 m pixels; one field site with wide uncertainty; no species info
Ghosh and Behera [160]185 mangrove quadratsSame plots for DL and IWCMNoOne mangrove site; small n; C-band limits canopy signal; canopy height input needs field data; no external region
Weber et al. [161]~1M train/60k val tiles; 14,745 global testGlobal GEDI test + independent AGB/CH/CC checksYesAGB/CH from GEDI models; saturation at high biomass/height; moderate R2 vs. external data; no species-level outputs
Narine et al. [162]205–220 ICESat-2 segments, one transectSingle-site train/test; RF upscalingNoNot DL; one transect/site; AGB from upscaled lidar; weak beams poor; 2010–2019 temporal gap
Oehmcke et al. [163]4270 train/918 val/911 test Danish subplotsHeld-out subplot testNoDenmark only; AGB from allometry; up to 1-year LiDAR–field gap; no external forest types
Pan et al. [164]306 cereal plots; PhenoMobile-Lite204 train/102 test with destructive AGBYesOne crop trial, crop-specific platform and rows; plot-scale only; other crops/layouts/sensors untested
García-Gutiérrez et al. [165]9 + 54 LiDAR plots (2 sites, 2 spp.)5 × 5-fold CV; MLR vs. autoencoder+MLRNoTwo Galician sites; small plot counts; only linear models; broader forest/algorithms not tested
Seely et al. [166]2336 ALS plots (NB, Canada)Held-out 351-plot testNoSingle province; biomass from allometry; rare species weak; some DNN overfitting; poor broadleaf foliage R2
Jung et al. [167]616 TLS-derived trees8:1:1 split; 60-tree testNoOne hardwood site; AGB from generic allometry; big errors for small trees due to occlusion
Shao et al. [78]4 MLS datasets; 42 destructively sampled stemsIndependent destructive DBH/volume checksYesOnly 42 trees with destructive truth at one site; other sets only algorithmic comparison; temperate MLS only
Narine et al. [168]1448 train/620 test pixels (sim. ICESat-2)Held-out test; DNN vs. RFNoSimulated data; one site; AGB labels from upscaled lidar; DNN underestimates high AGB
Zhang et al. [26]236 30 × 30 m plots (China)177 train/59 testNoOne subtropical forest; AGB from volume allometry; low lidar density; small n for DL
Dong et al. [169]39k train/11k val/5.6k test patchesHeld-out test; GEDI-derived AGB labelsNoSingle province; labels from GEDI equations; geolocation noise vs. 10 m grid; underestimates high AGB
So et al. [170]14 ha pine plantation; 72 ground trees43–67 trees for independent AGB checksNoOne red-pine site; Tallo-based allometry; small validation; performance variable by thinning; species grouping coarse
Contreras et al. [171]44,393 GEDI footprints; 4782 ALS checks75/25 internal split + independent ALS validationYesOlive orchards only; GEDI height poorly matches ALS; big drop from internal to ALS; SAR models underperform

References

  1. Liu, Z.; Deng, Z.; Davis, S.J.; Ciais, P. Global carbon emissions in 2023. Nat. Rev. Earth Environ. 2024, 5, 253–254. [Google Scholar] [CrossRef]
  2. Pan, Y.; Birdsey, R.A.; Fang, J.; Houghton, R.; Kauppi, P.E.; Kurz, W.A.; Phillips, O.L.; Shvidenko, A.; Lewis, S.L.; Canadell, J.G.; et al. A large and persistent carbon sink in the world’s forests. Science 2011, 333, 988–993. [Google Scholar] [CrossRef] [PubMed]
  3. United_Nations. Fast Facts: Life on Land. Available online: https://www.un.org/sustainabledevelopment/biodiversity/ (accessed on 21 April 2026).
  4. Lechner, A.M.; Foody, G.M.; Boyd, D.S. Applications in Remote Sensing to Forest Ecology and Management. One Earth 2020, 2, 405–412. [Google Scholar] [CrossRef]
  5. Yang, M.; Zhou, X.; Liu, Z.; Li, P.; Tang, J.; Xie, B.; Peng, C. A review of general methods for quantifying and estimating urban trees and biomass. Forests 2022, 13, 616. [Google Scholar] [CrossRef]
  6. Zhu, Z.; Woodcock, C.E. Automated cloud, cloud shadow, and snow detection in multitemporal Landsat data: An algorithm designed specifically for monitoring land cover change. Remote Sens. Environ. 2014, 152, 217–234. [Google Scholar] [CrossRef]
  7. Schwartz, M.D. Phenology: An Integrative Environmental Science, 2nd ed.; Springer: New York, NY, USA, 2013. [Google Scholar]
  8. Ke, Y.; Quackenbush, L.J. A review of methods for automatic individual tree-crown detection and delineation from passive remote sensing. Int. J. Remote Sens. 2011, 32, 4725–4747. [Google Scholar] [CrossRef]
  9. Diez, Y.; Kentsch, S.; Fukuda, M.; Caceres, M.L.L.; Moritake, K.; Cabezas, M. Deep learning in forestry using uav-acquired rgb data: A practical review. Remote Sens. 2021, 13, 2837. [Google Scholar] [CrossRef]
  10. Hamedianfar, A.; Mohamedou, C.; Kangas, A.; Vauhkonen, J. Deep learning for forest inventory and planning: A critical review on the remote sensing approaches so far and prospects for further applications. For. Int. J. For. Res. 2022, 95, 451–465. [Google Scholar] [CrossRef]
  11. Zhao, H.; Morgenroth, J.; Pearse, G.; Schindler, J. A systematic review of individual tree crown detection and delineation with convolutional neural networks (CNN). Curr. For. Rep. 2023, 9, 149–170. [Google Scholar] [CrossRef]
  12. Wang, Y.; Zhang, W.; Gao, R.; Jin, Z.; Wang, X. Recent advances in the application of deep learning methods to forestry. Wood Sci. Technol. 2021, 55, 1171–1202. [Google Scholar] [CrossRef]
  13. Weinstein, B.G.; Marconi, S.; Aubry-Kientz, M.; Vincent, G.; Senyondo, H.; White, E.P. DeepForest: A Python package for RGB deep learning tree crown delineation. Methods Ecol. Evol. 2020, 11, 1743–1751. [Google Scholar] [CrossRef]
  14. Aubry-Kientz, M.; Laybros, A.; Weinstein, B.; Ball, J.G.; Jackson, T.; Coomes, D.; Vincent, G. Multisensor data fusion for improved segmentation of individual tree crowns in dense tropical forests. IEEE J. Sel. Top. Appl. Earth Obs. Remote Sens. 2021, 14, 3927–3936. [Google Scholar] [CrossRef]
  15. Sun, C.; Huang, C.; Zhang, H.; Chen, B.; An, F.; Wang, L.; Yun, T. Individual tree crown segmentation and crown width extraction from a heightmap derived from aerial laser scanning data using a deep learning framework. Front. Plant Sci. 2022, 13, 914974. [Google Scholar] [CrossRef] [PubMed]
  16. Zhu, W.; Zhu, C.; Zhang, Y. Research on deep learning individual tree segmentation method coupling RetinaNet and point cloud clustering. IEEE Access 2021, 9, 126635–126645. [Google Scholar] [CrossRef]
  17. Bolyn, C.; Lejeune, P.; Michez, A.; Latte, N. Mapping tree species proportions from satellite imagery using spectral–spatial deep learning. Remote Sens. Environ. 2022, 280, 113205. [Google Scholar] [CrossRef]
  18. Pearse, G.D.; Watt, M.S.; Soewarto, J.; Tan, A.Y. Deep learning and phenology enhance large-scale tree species classification in aerial imagery during a biosecurity response. Remote Sens. 2021, 13, 1789. [Google Scholar] [CrossRef]
  19. Wang, S.; Li, R.; Li, H.; Ma, X.; Ji, Q.; Xu, F.; Fu, H. An automated method for stem diameter measurement based on laser module and deep learning. Plant Methods 2023, 19, 68. [Google Scholar] [CrossRef] [PubMed]
  20. Sothe, C.; De Almeida, C.; Schimalski, M.; La Rosa, L.; Castro, J.; Feitosa, R.; Dalponte, M.; Lima, C.; Liesenberg, V.; Miyoshi, G. Comparative performance of convolutional neural network, weighted and conventional support vector machine and random forest for classifying tree species using hyperspectral and photogrammetric data. GIScience Remote Sens. 2020, 57, 369–394. [Google Scholar] [CrossRef]
  21. Liao, W.; Van Coillie, F.; Gao, L.; Li, L.; Zhang, B.; Chanussot, J. Deep learning for fusion of APEX hyperspectral and full-waveform LiDAR remote sensing data for tree species mapping. IEEE Access 2018, 6, 68716–68729. [Google Scholar] [CrossRef]
  22. Natesan, S.; Armenakis, C.; Vepakomma, U. Individual tree species identification using Dense Convolutional Network (DenseNet) on multitemporal RGB images from UAV. J. Unmanned Veh. Syst. 2020, 8, 310–333. [Google Scholar] [CrossRef]
  23. Nezami, S.; Khoramshahi, E.; Nevalainen, O.; Pölönen, I.; Honkavaara, E. Tree species classification of drone hyperspectral and RGB imagery with deep learning convolutional neural networks. Remote Sens. 2020, 12, 1070. [Google Scholar] [CrossRef]
  24. Tao, S.; Wu, F.; Guo, Q.; Wang, Y.; Li, W.; Xue, B.; Hu, X.; Li, P.; Tian, D.; Li, C. Segmenting tree crowns from terrestrial and mobile LiDAR data by exploring ecological theories. ISPRS J. Photogramm. Remote Sens. 2015, 110, 66–76. [Google Scholar] [CrossRef]
  25. Culman, M.; Delalieux, S.; Van Tricht, K. Individual palm tree detection using deep learning on RGB imagery to support tree inventory. Remote Sens. 2020, 12, 3476. [Google Scholar] [CrossRef]
  26. Zhang, L.; Shao, Z.; Liu, J.; Cheng, Q. Deep learning based retrieval of forest aboveground biomass from combined LiDAR and landsat 8 data. Remote Sens. 2019, 11, 1459. [Google Scholar] [CrossRef]
  27. Li, Y.; Chai, G.; Wang, Y.; Lei, L.; Zhang, X. ACE R-CNN: An attention complementary and edge detection-based instance segmentation algorithm for individual tree species identification using UAV RGB images and LiDAR data. Remote Sens. 2022, 14, 3035. [Google Scholar] [CrossRef]
  28. Ball, J.G.C.; Hickman, S.H.M.; Jackson, T.D.; Koay, X.J.; Hirst, J.; Jay, W.; Archer, M.; Aubry-Kientz, M.; Vincent, G.; Coomes, D.A. Accurate delineation of individual tree crowns in tropical forests from aerial RGB imagery using Mask R-CNN. Remote Sens. Ecol. Conserv. 2023, 9, 641–655. [Google Scholar] [CrossRef]
  29. Pu, R. Mapping tree species using advanced remote sensing technologies: A state-of-the-art review and perspective. J. Remote Sens. 2021, 2021, 9812624. [Google Scholar] [CrossRef]
  30. Fassnacht, F.E.; Latifi, H.; Stereńczak, K.; Modzelewska, A.; Lefsky, M.; Waser, L.T.; Straub, C.; Ghosh, A.J.R.S.o.E. Review of studies on tree species classification from remotely sensed data. Remote Sens. Environ. 2016, 186, 64–87. [Google Scholar] [CrossRef]
  31. Velasquez-Camacho, L.; Cardil, A.; Mohan, M.; Etxegarai, M.; Anzaldi, G.; de-Miguel, S. Remotely sensed tree characterization in urban areas: A review. Remote Sens. 2021, 13, 4889. [Google Scholar] [CrossRef]
  32. Ozdarici-Ok, A.; Ok, A.O. Using remote sensing to identify individual tree species in orchards: A review. Sci. Hortic. 2023, 321, 112333. [Google Scholar] [CrossRef]
  33. LeCun, Y.; Bengio, Y.; Hinton, G. Deep learning. Nature 2015, 521, 436–444. [Google Scholar] [CrossRef] [PubMed]
  34. Schmidhuber, J. Deep learning in neural networks: An overview. Neural Netw. 2015, 61, 85–117. [Google Scholar] [CrossRef] [PubMed]
  35. Goodfellow, I.; Bengio, Y.; Courville, A.; Bengio, Y. Deep Learning; MIT Press: Cambridge, MA, USA, 2016; Volume 1. [Google Scholar]
  36. Rumelhart, D.E.; Hinton, G.E.; Williams, R.J. Learning representations by back-propagating errors. Nature 1986, 323, 533–536. [Google Scholar] [CrossRef]
  37. Breiman, L. Random forests. Mach. Learn. 2001, 45, 5–32. [Google Scholar] [CrossRef]
  38. Cortes, C.; Vapnik, V. Support-vector networks. Mach. Learn. 1995, 20, 273–297. [Google Scholar] [CrossRef]
  39. Ren, S.; He, K.; Girshick, R.; Sun, J. Faster r-cnn: Towards real-time object detection with region proposal networks. IEEE Trans. Pattern Anal. Mach. Intell. 2016, 39, 1137–1149. [Google Scholar] [CrossRef] [PubMed]
  40. Redmon, J.; Divvala, S.; Girshick, R.; Farhadi, A. You only look once: Unified, real-time object detection. In Proceedings of the IEEE Conference on Computer Vision and Pattern Recognition; IEEE: Las Vegas, NV, USA, 2016; pp. 779–788. [Google Scholar] [CrossRef]
  41. Liu, W.; Anguelov, D.; Erhan, D.; Szegedy, C.; Reed, S.; Fu, C.-Y.; Berg, A.C. SSD: Single shot multibox detector. In Proceedings of the European Conference on Computer Vision; Springer International Publishing: Cham, Switzerland, 2016; pp. 21–37. [Google Scholar]
  42. Long, J.; Shelhamer, E.; Darrell, T. Fully convolutional networks for semantic segmentation. In Proceedings of the IEEE Conference on Computer Vision and Pattern Recognition; IEEE: Boston, MA, USA, 2015; pp. 3431–3440. [Google Scholar] [CrossRef]
  43. Ronneberger, O.; Fischer, P.; Brox, T. U-net: Convolutional networks for biomedical image segmentation. In Proceedings of the International Conference on Medical Image Computing and Computer-Assisted Intervention; Springer: Cham, Switzerland, 2015; pp. 234–241. [Google Scholar] [CrossRef]
  44. Chen, L.-C.; Papandreou, G.; Kokkinos, I.; Murphy, K.; Yuille, A.L. Deeplab: Semantic image segmentation with deep convolutional nets, atrous convolution, and fully connected crfs. IEEE Trans. Pattern Anal. Mach. Intell. 2017, 40, 834–848. [Google Scholar] [CrossRef] [PubMed]
  45. He, K.; Gkioxari, G.; Dollár, P.; Girshick, R. Mask r-cnn. In Proceedings of the IEEE International Conference on Computer Vision; IEEE: Venice, Italy, 2017; pp. 2961–2969. [Google Scholar] [CrossRef]
  46. Wu, Y.; Kirillov, A.; Massa, F.; Lo, W.-Y.; Girshick, R. Facebook Research—Detectron2. Available online: https://github.com/facebookresearch/detectron2 (accessed on 22 April 2026).
  47. Wang, X.; Kong, T.; Shen, C.; Jiang, Y.; Li, L. SOLO: Segmenting objects by locations. In Proceedings of the European Conference on Computer Vision; Springer International Publishing: Cham, Switzerland, 2020; pp. 649–665. [Google Scholar] [CrossRef]
  48. Dosovitskiy, A.; Beyer, L.; Kolesnikov, A.; Weissenborn, D.; Zhai, X.; Unterthiner, T.; Dehghani, M.; Minderer, M.; Heigold, G.; Gelly, S. An image is worth 16x16 words: Transformers for image recognition at scale. arXiv 2020, arXiv:2010.11929. [Google Scholar]
  49. Liu, Z.; Lin, Y.; Cao, Y.; Hu, H.; Wei, Y.; Zhang, Z.; Lin, S.; Guo, B. Swin transformer: Hierarchical vision transformer using shifted windows. In Proceedings of the IEEE/CVF International Conference on Computer Vision, Montreal, QC, Canada, 10–17 October 2021; pp. 10012–10022. [Google Scholar] [CrossRef]
  50. Touvron, H.; Cord, M.; Douze, M.; Massa, F.; Sablayrolles, A.; Jégou, H. Training data-efficient image transformers & distillation through attention. In Proceedings of the International Conference on Machine Learning; PMLR: Cambridge, MA, USA, 2021; pp. 10347–10357. Available online: https://proceedings.mlr.press/v139/touvron21a.html (accessed on 10 July 2026).
  51. Qi, C.R.; Su, H.; Mo, K.; Guibas, L.J. Pointnet: Deep learning on point sets for 3d classification and segmentation. In Proceedings of the IEEE Conference on Computer Vision and Pattern Recognition; IEEE: Honolulu, HI, USA, 2017; pp. 652–660. [Google Scholar] [CrossRef]
  52. Qi, C.R.; Yi, L.; Su, H.; Guibas, L.J. Pointnet++: Deep hierarchical feature learning on point sets in a metric space. Adv. Neural Inf. Process. Syst. 2017, 30, 5105–5114. [Google Scholar]
  53. Ammar, A.; Koubaa, A.; Benjdira, B. Deep-learning-based automated palm tree counting and geolocation in large farms from aerial geotagged images. Agronomy 2021, 11, 1458. [Google Scholar] [CrossRef]
  54. Li, W.; Fu, H.; Yu, L.; Cracknell, A. Deep learning based oil palm tree detection and counting for high-resolution remote sensing images. Remote Sens. 2016, 9, 22. [Google Scholar] [CrossRef]
  55. Wu, J.; Yang, G.; Yang, H.; Zhu, Y.; Li, Z.; Lei, L.; Zhao, C. Extracting apple tree crown information from remote imagery using deep learning. Comput. Electron. Agric. 2020, 174, 105504. [Google Scholar] [CrossRef]
  56. Neupane, B.; Horanont, T.; Hung, N.D. Deep learning based banana plant detection and counting using high-resolution red-green-blue (RGB) images collected from unmanned aerial vehicle (UAV). PLoS ONE 2019, 14, e0223906. [Google Scholar] [CrossRef] [PubMed]
  57. Bryson, M.; Wang, F.; Allworth, J. Using synthetic tree data in deep learning-based tree segmentation using LiDAR point clouds. Remote Sens. 2023, 15, 2380. [Google Scholar] [CrossRef]
  58. Hu, X.; Hu, C.; Han, J.; Sun, H.; Wang, R. Point cloud segmentation for an individual tree combining improved point transformer and hierarchical clustering. J. Appl. Remote Sens. 2023, 17, 034505. [Google Scholar] [CrossRef]
  59. Liu, Y.; You, H.; Tang, X.; You, Q.; Huang, Y.; Chen, J. Study on Individual Tree Segmentation of Different Tree Species Using Different Segmentation Algorithms Based on 3D UAV Data. Forests 2023, 14, 1327. [Google Scholar] [CrossRef]
  60. Windrim, L.; Bryson, M. Detection, segmentation, and model fitting of individual tree stems from airborne laser scanning of forests using deep learning. Remote Sens. 2020, 12, 1469. [Google Scholar] [CrossRef]
  61. Wang, J.; Chen, X.; Cao, L.; An, F.; Chen, B.; Xue, L.; Yun, T. Individual rubber tree segmentation based on ground-based LiDAR data and faster R-CNN of deep learning. Forests 2019, 10, 793. [Google Scholar] [CrossRef]
  62. Li, S.; Brandt, M.; Fensholt, R.; Kariryaa, A.; Igel, C.; Gieseke, F.; Nord-Larsen, T.; Oehmcke, S.; Carlsen, A.H.; Junttila, S. Deep learning enables image-based tree counting, crown segmentation, and height prediction at national scale. PNAS Nexus 2023, 2, pgad076. [Google Scholar] [CrossRef] [PubMed]
  63. Yao, L.; Liu, T.; Qin, J.; Lu, N.; Zhou, C. Tree counting with high spatial-resolution satellite imagery based on deep neural networks. Ecol. Indic. 2021, 125, 107591. [Google Scholar] [CrossRef]
  64. Tao, H.; Li, C.; Zhao, D.; Deng, S.; Hu, H.; Xu, X.; Jing, W. Deep learning-based dead pine tree detection from unmanned aerial vehicle images. Int. J. Remote Sens. 2020, 41, 8238–8255. [Google Scholar] [CrossRef]
  65. Wang, Q.; Zhao, Y.; Che, Y.; Shen, H.; Qiu, Y.; Wang, Y. A semi-supervised framework for UAV-based individual tree crown segmentation in structurally heterogeneous planted forests. Int. J. Appl. Earth Obs. Geoinf. 2026, 146, 105078. [Google Scholar] [CrossRef]
  66. Ayrey, E.; Hayes, D.J. The use of three-dimensional convolutional neural networks to interpret LiDAR for forest inventory. Remote Sens. 2018, 10, 649. [Google Scholar] [CrossRef]
  67. Xi, Z.; Hopkinson, C. Detecting individual-tree crown regions from terrestrial laser scans with an anchor-free deep learning model. Can. J. Remote Sens. 2021, 47, 228–242. [Google Scholar] [CrossRef]
  68. You, H.; Liu, Y.; Lei, P.; Qin, Z.; You, Q. Segmentation of individual mangrove trees using UAV-based LiDAR data. Ecol. Inform. 2023, 77, 102200. [Google Scholar] [CrossRef]
  69. Zhong, Y.; Liu, S.; Sun, H. A 3D point cloud instance segmentation network for extracting individual trees from complex forest scenes. Comput. Electron. Agric. 2026, 242, 111333. [Google Scholar] [CrossRef]
  70. Ma, H.; Zhang, F.; Chen, S.; Yu, J. Individual Tree Segmentation Using Deep Learning and Climbing Algorithm: A Method for Achieving High-precision Single-tree Segmentation in High-density Forests under Complex Environments. Photogramm. Eng. Remote Sens. 2025, 91, 101–110. [Google Scholar] [CrossRef]
  71. Ma, J.; Han, T.; Wang, C.; Zhang, X.; Zhang, X.; Zhang, W.; Chen, Y. Individual tree segmentation via contrastive learning and semantic priors in point clouds. Urban For. Urban Green. 2025, 113, 129018. [Google Scholar] [CrossRef]
  72. Xiang, B.; Wielgosz, M.; Kontogianni, T.; Peters, T.; Puliti, S.; Astrup, R.; Schindler, K. Automated forest inventory: Analysis of high-density airborne LiDAR point clouds with 3D deep learning. Remote Sens. Environ. 2024, 305, 114078. [Google Scholar] [CrossRef]
  73. Xiang, B.; Wielgosz, M.; Puliti, S.; Král, K.; Krůček, M.; Missarov, A.; Astrup, R. Forestformer3d: A unified framework for end-to-end segmentation of forest lidar 3d point clouds. In Proceedings of the IEEE/CVF International Conference on Computer Vision; IEEE: Honolulu, HI, USA, 2025; pp. 24717–24727. [Google Scholar] [CrossRef]
  74. Henrich, J.; van Delden, J.; Seidel, D.; Kneib, T.; Ecker, A.S. TreeLearn: A deep learning method for segmenting individual trees from ground-based LiDAR forest point clouds. Ecol. Inform. 2024, 84, 102888. [Google Scholar] [CrossRef]
  75. Wielgosz, M.; Puliti, S.; Xiang, B.; Schindler, K.; Astrup, R. SegmentAnyTree: A sensor and platform agnostic deep learning model for tree segmentation using laser scanning data. Remote Sens. Environ. 2024, 313, 114367. [Google Scholar] [CrossRef]
  76. Wielgosz, M.; Puliti, S.; Wilkes, P.; Astrup, R. Point2Tree (P2T)—Framework for parameter tuning of semantic and instance segmentation used with mobile laser scanning data in coniferous forest. Remote Sens. 2023, 15, 3737. [Google Scholar] [CrossRef]
  77. Kim, D.-H.; Ko, C.-U.; Kim, D.-G.; Kang, J.-T.; Park, J.-M.; Cho, H.-J. Automated Segmentation of Individual Tree Structures Using Deep Learning over LiDAR Point Cloud Data. Forests 2023, 14, 1159. [Google Scholar] [CrossRef]
  78. Shao, J.; Choi, D.H.; Liu, J.; Tian, X.; Thapa, B.; Lee, S.; Habib, A.; Fei, S. A three-stage framework for stand-level automated stem volume estimation in temperate forests using Mobile laser scanning. Remote Sens. Environ. 2026, 335, 115246. [Google Scholar] [CrossRef]
  79. Jarahizadeh, S.; Salehi, B. Tree-Net: A novel deep learning tree detection architecture using UAV LiDAR data. Remote Sens. Environ. 2026, 332, 115088. [Google Scholar] [CrossRef]
  80. Alonzo, M.; Bookhagen, B.; Roberts, D.A. Urban tree species mapping using hyperspectral and lidar data fusion. Remote Sens. Environ. 2014, 148, 70–83. [Google Scholar] [CrossRef]
  81. Lumnitz, S.; Devisscher, T.; Mayaud, J.R.; Radic, V.; Coops, N.C.; Griess, V.C. Mapping trees along urban street networks with deep learning and street-level imagery. ISPRS J. Photogramm. Remote Sens. 2021, 175, 144–157. [Google Scholar] [CrossRef]
  82. Kwon, R.; Ryu, Y.; Yang, T.; Zhong, Z.; Im, J. Merging multiple sensing platforms and deep learning empowers individual tree mapping and species detection at the city scale. ISPRS J. Photogramm. Remote Sens. 2023, 206, 201–221. [Google Scholar] [CrossRef]
  83. Firoze, A.; Uppala, A.; Darling, L.; Yeh, R.A.; Benes, B.; Hardiman, B.; Fei, S.; Aliaga, D. Where Are the City Trees? Monitoring Urban Trees across the U.S. Using Generative AI. Commun. ACM 2026, 69, 50–59. [Google Scholar] [CrossRef]
  84. Li, Q.; Yan, Y. Street tree segmentation from mobile laser scanning data using deep learning-based image instance segmentation. Urban For. Urban Green. 2024, 92, 128200. [Google Scholar] [CrossRef]
  85. Chen, X.; Jiang, K.; Zhu, Y.; Wang, X.; Yun, T. Individual tree crown segmentation directly from UAV-borne LiDAR data using the PointNet of deep learning. Forests 2021, 12, 131. [Google Scholar] [CrossRef]
  86. Gupta, A.; Byrne, J.; Moloney, D.; Watson, S.; Yin, H. Tree annotations in LiDAR data using point densities and convolutional neural networks. IEEE Trans. Geosci. Remote Sens. 2019, 58, 971–981. [Google Scholar] [CrossRef]
  87. Weinstein, B.G.; Marconi, S.; Bohlman, S.; Zare, A.; White, E. Individual tree-crown detection in RGB imagery using semi-supervised deep learning neural networks. Remote Sens. 2019, 11, 1309. [Google Scholar] [CrossRef]
  88. World_Resources_Institute. Global Forest Review—Indicators of Forest Extent. Available online: https://gfr.wri.org/forest-extent-indicators/forest-extent (accessed on 22 April 2026).
  89. Ferreira, M.P.; De Almeida, D.R.A.; de Almeida Papa, D.; Minervino, J.B.S.; Veras, H.F.P.; Formighieri, A.; Santos, C.A.N.; Ferreira, M.A.D.; Figueiredo, E.O.; Ferreira, E.J.L. Individual tree detection and species classification of Amazonian palms using UAV images and deep learning. For. Ecol. Manag. 2020, 475, 118397. [Google Scholar] [CrossRef]
  90. Gibril, M.B.A.; Shafri, H.Z.M.; Shanableh, A.; Al-Ruzouq, R.; Wayayok, A.; Hashim, S.J. Deep convolutional neural network for large-scale date palm tree mapping from UAV-based images. Remote Sens. 2021, 13, 2787. [Google Scholar] [CrossRef]
  91. Gibril, M.B.A.; Shanableh, A.; Al-Ruzouq, R.; Hammouri, N.; Lamghari, F.; Ahmed, S.M.; Mansour, A.; Jena, R.; Shanableh, H.; Almarzouqi, M.A. Efficient Large-scale Mapping of Acacia tortilis Trees Using UAV-based Images and Transformer-based Semantic Segmentation Architectures. ISPRS Ann. Photogramm. Remote Sens. Spat. Inf. Sci. 2025, X-G-2025, 285–290. [Google Scholar] [CrossRef]
  92. Martins, G.B.; La Rosa, L.E.C.; Happ, P.N.; Coelho, L.C.T.; Santos, C.J.F.; Feitosa, R.Q.; Ferreira, M.P. Deep learning-based tree species mapping in a highly diverse tropical urban setting. Urban For. Urban Green. 2021, 64, 127241. [Google Scholar] [CrossRef]
  93. Zhang, C.; Xia, K.; Feng, H.; Yang, Y.; Du, X. Tree species classification using deep learning and RGB optical images obtained by an unmanned aerial vehicle. J. For. Res. 2021, 32, 1879–1888. [Google Scholar] [CrossRef]
  94. La Rosa, L.E.C.; Sothe, C.; Feitosa, R.Q.; de Almeida, C.M.; Schimalski, M.B.; Oliveira, D.A.B. Multi-task fully convolutional network for tree species mapping in dense forests using small training hyperspectral data. ISPRS J. Photogramm. Remote Sens. 2021, 179, 35–49. [Google Scholar] [CrossRef]
  95. Chen, X.; Shen, X.; Cao, L. Tree species classification in subtropical natural forests using high-resolution UAV RGB and superview-1 multispectral imageries based on deep learning network approaches: A case study within the Baima snow mountain national nature reserve, China. Remote Sens. 2023, 15, 2697. [Google Scholar] [CrossRef]
  96. Pierdicca, R.; Nepi, L.; Mancini, A.; Malinverni, E.; Balestra, M. UAV4TREE: Deep learning-based system for automatic classification of tree species using RGB optical images obtained by an unmanned aerial vehicle. ISPRS Ann. Photogramm. Remote Sens. Spat. Inf. Sci. 2023, 10, 1089–1096. [Google Scholar] [CrossRef]
  97. Branson, S.; Wegner, J.D.; Hall, D.; Lang, N.; Schindler, K.; Perona, P. From Google Maps to a fine-grained catalog of street trees. ISPRS J. Photogramm. Remote Sens. 2018, 135, 13–30. [Google Scholar] [CrossRef]
  98. Scholl, V.M.; McGlinchy, J.; Price-Broncucia, T.; Balch, J.K.; Joseph, M.B. Fusion neural networks for plant classification: Learning to combine RGB, hyperspectral, and lidar data. PeerJ 2021, 9, e11790. [Google Scholar] [CrossRef] [PubMed]
  99. Ecke, S.; Stehr, F.; Frey, J.; Tiede, D.; Dempewolf, J.; Klemmt, H.-J.; Endres, E.; Seifert, T. Towards operational UAV-based forest health monitoring: Species identification and crown condition assessment by means of deep learning. Comput. Electron. Agric. 2024, 219, 108785. [Google Scholar] [CrossRef]
  100. Sun, Y.; Huang, J.; Ao, Z.; Lao, D.; Xin, Q. Deep learning approaches for the mapping of tree species diversity in a tropical wetland using airborne LiDAR and high-spatial-resolution remote sensing images. Forests 2019, 10, 1047. [Google Scholar] [CrossRef]
  101. Gong, Y.; Zhu, D.e.; Li, X.; Lv, L.; Zhang, B.; Xuan, J.; Du, H. Using UAV LiDAR intensity frequency and hyperspectral features to improve the accuracy of urban tree species classification. IEEE J. Sel. Top. Appl. Earth Obs. Remote Sens. 2023, 17, 2849–2865. [Google Scholar] [CrossRef]
  102. Zhong, H.; Zhang, Z.; Liu, H.; Wu, J.; Lin, W. Individual tree species identification for complex coniferous and broad-leaved mixed forests based on deep learning combined with UAV LiDAR data and RGB images. Forests 2024, 15, 293. [Google Scholar] [CrossRef]
  103. Ferreira, M.P.; dos Santos, D.R.; Ferrari, F.; Coelho, L.C.T.; Martins, G.B.; Feitosa, R.Q. Improving urban tree species classification by deep-learning based fusion of digital aerial images and LiDAR. Urban For. Urban Green. 2024, 94, 128240. [Google Scholar] [CrossRef]
  104. Sablon, H.; Bajgain, R. A multimodal attention-based model for tree species classification using LiDAR and satellite imagery. In Proceedings of the ICLR 2025 Workshop on Tackling Climate Change with Machine Learning; Climate Change AI: Pittsburgh, PA, USA, 2025; p. 16. Available online: https://www.climatechange.ai/papers/iclr2025/16 (accessed on 22 April 2026).
  105. Fricker, G.A.; Ventura, J.D.; Wolf, J.A.; North, M.P.; Davis, F.W.; Franklin, J. A convolutional neural network classifier identifies tree species in mixed-conifer forest from hyperspectral imagery. Remote Sens. 2019, 11, 2326. [Google Scholar] [CrossRef]
  106. Yan, S.; Jing, L.; Wang, H. A new individual tree species recognition method based on a convolutional neural network and high-spatial resolution remote sensing imagery. Remote Sens. 2021, 13, 479. [Google Scholar] [CrossRef]
  107. Beloiu, M.; Heinzmann, L.; Rehush, N.; Gessler, A.; Griess, V.C. Individual tree-crown detection and species identification in heterogeneous forests using aerial RGB imagery and deep learning. Remote Sens. 2023, 15, 1463. [Google Scholar] [CrossRef]
  108. Egli, S.; Höpke, M. CNN-based tree species classification using high resolution RGB image data from automated UAV observations. Remote Sens. 2020, 12, 3892. [Google Scholar] [CrossRef]
  109. Schiefer, F.; Kattenborn, T.; Frick, A.; Frey, J.; Schall, P.; Koch, B.; Schmidtlein, S. Mapping forest tree species in high resolution UAV-based RGB-imagery by means of convolutional neural networks. ISPRS J. Photogramm. Remote Sens. 2020, 170, 205–215. [Google Scholar] [CrossRef]
  110. Wang, X.; Ren, H. DBMF: A novel method for tree species fusion classification based on multi-source images. Forests 2021, 13, 33. [Google Scholar] [CrossRef]
  111. Mu, Y.; Guo, J.; Shahzad, M.; Zhu, X.X. National-scale tree species mapping with deep learning reveals forest management insights in Germany. Int. J. Appl. Earth Obs. Geoinf. 2025, 139, 104522. [Google Scholar] [CrossRef]
  112. Tan, J.; Li, J.; Ma, T.; Yan, X.; Huo, Z. Leveraging Sentinel-1/2 time series and deep learning for accurate forest tree species mapping. Front. Glob. Change 2025, 8, 1599510. [Google Scholar] [CrossRef]
  113. Onishi, M.; Watanabe, S.; Nakashima, T.; Ise, T. Practicality and robustness of tree species identification using UAV RGB image and deep learning in temperate forest in Japan. Remote Sens. 2022, 14, 1710. [Google Scholar] [CrossRef]
  114. Qin, T.; Zhao, Q. Multi-branch and multi-label tree species classification using deep learning for UAV aerial photography and Sentinel remote sensing images. Sci. Rep. 2025, 15, 32710. [Google Scholar] [CrossRef] [PubMed]
  115. Marinelli, D.; Paris, C.; Bruzzone, L. An approach based on deep learning for tree species classification in LiDAR data acquired in mixed forest. IEEE Geosci. Remote Sens. Lett. 2022, 19, 1–5. [Google Scholar] [CrossRef]
  116. Allen, M.J.; Grieve, S.W.D.; Owen, H.J.F.; Lines, E.R. Tree species classification from complex laser scanning data in Mediterranean forests using deep learning. Methods Ecol. Evol. 2023, 14, 1657–1667. [Google Scholar] [CrossRef]
  117. Zhang, H.; Liu, B.; Yang, B.; Guo, J.; Hu, Z.; Zhang, M.; Yang, Z.; Zhang, J. Efficient tree species classification using machine and deep learning algorithms based on UAV-LiDAR data in North China. Front. Glob. Change 2025, 8, 1431603. [Google Scholar] [CrossRef]
  118. Ohamouddou, S.; Afia, A.E.; Afia, H.E.; Chiheb, R. MS-DGCNN++: A multi-scale fusion dynamic graph neural network with biological knowledge integration for LiDAR tree species classification. arXiv 2025, arXiv:2507.12602. [Google Scholar] [CrossRef]
  119. Hamdani, N.; Abouhat, I.; Ait El Kadi, K.; Bensiali, S.; Sebari, I. Urban Tree Classification from Multispectral Airborne LiDAR Using PointNet, DGCNN & RandLA-Net. Int. Arch. Photogramm. Remote Sens. Spat. Inf. Sci. 2026, 48, 55–61. [Google Scholar] [CrossRef]
  120. Straker, A.; Magdon, P.; Zullich, M.; Freudenberg, M.; Kleinn, C.; Breidenbach, J.; Puliti, S.; Noelke, N. Enhancing Tree Species Classification: Insights from YOLOv8 and Explainable AI Applied to TLS Point Cloud Projections. arXiv 2025, arXiv:2512.16950. [Google Scholar] [CrossRef]
  121. Sun, P.; Yuan, X.; Li, D. Classification of Individual Tree Species Using UAV LiDAR Based on Transformer. Forests 2023, 14, 484. [Google Scholar] [CrossRef]
  122. Liu, B.; Huang, H.; Su, Y.; Chen, S.; Li, Z.; Chen, E.; Tian, X. Tree Species Classification Using Ground-Based LiDAR Data by Various Point Cloud Deep Learning Methods. Remote Sens. 2022, 14, 5733. [Google Scholar] [CrossRef]
  123. Wang, L.; Lu, D.; Tan, W.; Chen, Y.; Li, J. Tree Species Classfifcation Using Deep Learning Based 3d Point Cloud Transformer on Airborne Lidar Data. In Proceedings of the IGARSS 2023–2023 IEEE International Geoscience and Remote Sensing Symposium, Pasadena, CA, USA, 16–21 July 2023; pp. 974–977. [Google Scholar] [CrossRef]
  124. Huo, Z.; Fang, L.; Chu, Y.; Dang, S.; Yang, J.; Li, L.; Li, X.; Ren, S.; Chen, J.; Peng, Y. Precise urban tree species identification and biomass estimation using UAV–Handheld LiDAR Synergy and YOLOv11 deep learning. Int. J. Appl. Earth Obs. Geoinf. 2026, 146, 105049. [Google Scholar] [CrossRef]
  125. Puliti, S.; Lines, E.R.; Müllerová, J.; Frey, J.; Schindler, Z.; Straker, A.; Allen, M.J.; Winiwarter, L.; Rehush, N.; Hristova, H. Benchmarking tree species classification from proximally sensed laser scanning data: Introducing the FOR-species20K dataset. Methods Ecol. Evol. 2025, 16, 801–818. [Google Scholar] [CrossRef]
  126. Seidel, D.; Annighöfer, P.; Thielman, A.; Seifert, Q.E.; Thauer, J.-H.; Glatthorn, J.; Ehbrecht, M.; Kneib, T.; Ammer, C. Predicting tree species from 3D laser scanning point clouds using deep learning. Front. Plant Sci. 2021, 12, 635440. [Google Scholar] [CrossRef] [PubMed]
  127. Liu, M.; Han, Z.; Chen, Y.; Liu, Z.; Han, Y. Tree species classification of LiDAR data based on 3D deep learning. Measurement 2021, 177, 109301. [Google Scholar] [CrossRef]
  128. Ottoy, S.; Nedelkou, J.; De Witte, W.; De Vocht, A. Mobile LiDAR applications to monitor the urban forest in the city of Hasselt, Belgium. Urban For. Urban Green. 2025, 114, 129171. [Google Scholar] [CrossRef]
  129. Ma, Y.; Zhao, Y.; Im, J.; Zhao, Y.; Zhen, Z. A deep-learning-based tree species classification for natural secondary forests using unmanned aerial vehicle hyperspectral images and LiDAR. Ecol. Indic. 2024, 159, 111608. [Google Scholar] [CrossRef]
  130. Wang, J.; Zhang, H.; Qiu, H.; Lei, K.; Yu, H.; Wang, X. Species-specific tree structural parameters extraction via UAV RGB-LiDAR data and multimodal instance segmentation. Plant Phenomics 2026, 8, 100171. [Google Scholar] [CrossRef] [PubMed]
  131. Hartling, S.; Sagan, V.; Sidike, P.; Maimaitijiang, M.; Carron, J. Urban tree species classification using a WorldView-2/3 and LiDAR data fusion approach and deep learning. Sensors 2019, 19, 1284. [Google Scholar] [CrossRef] [PubMed]
  132. Briechle, S.; Krzystek, P.; Vosselman, G. Classification of tree species and standing dead trees by fusing UAV-based lidar data and multispectral imagery in the 3D deep neural network PointNet++. ISPRS Ann. Photogramm. Remote Sens. Spat. Inf. Sci. 2020, 2, 203–210. [Google Scholar] [CrossRef]
  133. Vahrenhold, J.R.; Brandmeier, M.; Müller, M.S. MMTSCNet: Multimodal tree species classification network for classification of multi-source, single-tree liDAR point clouds. Remote Sens. 2025, 17, 1304. [Google Scholar] [CrossRef]
  134. Kim, T.K.; Hong, J.; Ryu, D.; Kim, S.; Byeon, S.Y.; Huh, W.; Kim, K.; Baek, G.H.; Kim, H.S. Identifying and extracting bark key features of 42 tree species using convolutional neural networks and class activation mapping. Sci. Rep. 2022, 12, 4772. [Google Scholar] [CrossRef] [PubMed]
  135. Beery, S.; Wu, G.; Edwards, T.; Pavetic, F.; Majewski, B.; Mukherjee, S.; Chan, S.; Morgan, J.; Rathod, V.; Huang, J. The auto arborist dataset: A large-scale benchmark for multiview urban forest monitoring under domain shift. In Proceedings of the IEEE/CVF Conference on Computer Vision and Pattern Recognition; IEEE: New Orleans, LA, USA, 2022; pp. 21294–21307. [Google Scholar] [CrossRef]
  136. Robert, M.; Dallaire, P.; Giguère, P. Tree bark re-identification using a deep-learning feature descriptor. In Proceedings of the 2020 17th Conference on Computer and Robot Vision (CRV); IEEE: New York, NY, USA, 2020; pp. 25–32. [Google Scholar] [CrossRef]
  137. Wu, F.; Gazo, R.; Benes, B.; Haviarova, E. Deep BarkID: A portable tree bark identification system by knowledge distillation. Eur. J. For. Res. 2021, 140, 1391–1399. [Google Scholar] [CrossRef]
  138. Mizoguchi, T.; Ishii, A.; Nakamura, H.; Inoue, T.; Takamatsu, H. Lidar-based individual tree species classification using convolutional neural network. In Proceedings of the Videometrics, Range Imaging, and Applications XIV; SPIE: Bellingham, WA, USA, 2017; pp. 193–199. [Google Scholar] [CrossRef]
  139. Carpentier, M.; Giguere, P.; Gaudreault, J. Tree species identification from bark images using convolutional neural networks. In Proceedings of the 2018 IEEE/RSJ International Conference on Intelligent Robots and Systems (IROS); IEEE: New York, NY, USA, 2018; pp. 1075–1081. [Google Scholar] [CrossRef]
  140. Ratajczak, R.; Bertrand, S.; Crispim-Junior, C.F.; Tougne, L. Efficient bark recognition in the wild. In Proceedings of the International Conference on Computer Vision Theory and Applications (VISAPP 2019); SciTePress: Prague, Czech Republic, 2019; pp. 240–248. [Google Scholar] [CrossRef]
  141. Chadwick, A.J.; Coops, N.C.; Bater, C.W.; Martens, L.A.; White, B. Transferability of a Mask R–CNN model for the delineation and classification of two species of regenerating tree crowns to untrained sites. Sci. Remote Sens. 2024, 9, 100109. [Google Scholar] [CrossRef]
  142. Li, H.; Hu, B.; Li, Q.; Jing, L. CNN-based individual tree species classification using high-resolution satellite imagery and airborne LiDAR data. Forests 2021, 12, 1697. [Google Scholar] [CrossRef]
  143. Mäyrä, J.; Keski-Saari, S.; Kivinen, S.; Tanhuanpää, T.; Hurskainen, P.; Kullberg, P.; Poikolainen, L.; Viinikka, A.; Tuominen, S.; Kumpula, T.; et al. Tree species classification from airborne hyperspectral and LiDAR data using 3D convolutional neural networks. Remote Sens. Environ. 2021, 256, 112322. [Google Scholar] [CrossRef]
  144. Onishi, M.; Ise, T. Explainable identification and mapping of trees using UAV RGB image and deep learning. Sci. Rep. 2021, 11, 903. [Google Scholar] [CrossRef] [PubMed]
  145. Mu, Y.; Xiong, Z.; Wang, Y.; Shahzad, M.; Essl, F.; Kreft, H.; van Kleunen, M.; Zhu, X.X. GlobalGeoTree: A multi-granular vision-language dataset for global tree species classification. Earth Syst. Sci. Data 2026, 18, 1379–1403. [Google Scholar] [CrossRef]
  146. Shen, Y.; Huang, R.; Hua, B.; Pan, Y.; Mei, Y.; Dong, M. Automatic tree height measurement based on three-dimensional reconstruction using smartphone. Sensors 2023, 23, 7248. [Google Scholar] [CrossRef] [PubMed]
  147. Xia, K.; Wang, H.; Yang, Y.; Du, X.; Feng, H. Automatic detection and parameter estimation of Ginkgo biloba in urban environment based on RGB images. J. Sens. 2021, 2021, 6668934. [Google Scholar] [CrossRef]
  148. Gan, Y.; Wang, Q.; Iio, A. Tree crown detection and delineation in a temperate deciduous forest from UAV RGB imagery using deep learning approaches: Effects of spatial resolution and species characteristics. Remote Sens. 2023, 15, 778. [Google Scholar] [CrossRef]
  149. Yao, Z.; Chai, G.; Lei, L.; Jia, X.; Zhang, X. Individual tree species identification and crown parameters extraction based on mask R-CNN: Assessing the applicability of unmanned aerial vehicle optical images. Remote Sens. 2023, 15, 5164. [Google Scholar] [CrossRef]
  150. Xu, J.; Su, M.; Sun, Y.; Pan, W.; Cui, H.; Jin, S.; Zhang, L.; Wang, P. Tree crown segmentation and diameter at breast height prediction based on BlendMask in unmanned aerial vehicle imagery. Remote Sens. 2024, 16, 368. [Google Scholar] [CrossRef]
  151. Tolan, J.; Yang, H.-I.; Nosarzewski, B.; Couairon, G.; Vo, H.V.; Brandt, J.; Spore, J.; Majumdar, S.; Haziza, D.; Vamaraju, J. Very high resolution canopy height maps from RGB imagery using self-supervised vision transformer and convolutional decoder trained on aerial lidar. Remote Sens. Environ. 2024, 300, 113888. [Google Scholar] [CrossRef]
  152. Song, C.; Yang, B.; Zhang, L.; Wu, D. A handheld device for measuring the diameter at breast height of individual trees using laser ranging and deep-learning based image recognition. Plant Methods 2021, 17, 67. [Google Scholar] [CrossRef] [PubMed]
  153. Safarov, F.; Khojamuratova, U.; Komoliddin, M.; Ibragim Ismailovich, X.; Cho, Y.I. A Multimodal Deep Learning Framework for Accurate Biomass and Carbon Sequestration Estimation from UAV Imagery. Drones 2025, 9, 496. [Google Scholar] [CrossRef]
  154. Juyal, P.; Sharma, S. Estimation of tree volume using mask R-CNN based deep learning. In Proceedings of the 2020 11th International Conference on Computing, Communication and Networking Technologies (ICCCNT); IEEE: New York, NY, USA, 2020; pp. 1–6. [Google Scholar] [CrossRef]
  155. Liu, J.; Wang, X.; Wang, T. Classification of tree species and stock volume estimation in ground forest images using Deep Learning. Comput. Electron. Agric. 2019, 166, 105012. [Google Scholar] [CrossRef]
  156. Tamiminia, H.; Salehi, B.; Mahdianpari, M.; Beier, C.M.; Klimkowski, D.J.; Volk, T.A. Comparison of machine and deep learning methods to estimate shrub willow biomass from UAS imagery. Can. J. Remote Sens. 2021, 47, 209–227. [Google Scholar] [CrossRef]
  157. Chang, T.; Rasmussen, B.P.; Dickson, B.G.; Zachmann, L.J. Chimera: A multi-task recurrent convolutional neural network for forest classification and structural estimation. Remote Sens. 2019, 11, 768. [Google Scholar] [CrossRef]
  158. Hanan, A.; Khan, M.; Fernandez-Anez, N.; Arghandeh, R. DeepBioFusion: Multi-modal deep learning based above ground biomass estimation using SAR and optical satellite images. Ecol. Inform. 2025, 90, 103277. [Google Scholar] [CrossRef]
  159. Pascarella, A.E.; Giacco, G.; Rigiroli, M.; Marrone, S.; Sansone, C. ReUse: REgressive unet for carbon storage and above-ground biomass estimation. J. Imaging 2023, 9, 61. [Google Scholar] [CrossRef] [PubMed]
  160. Ghosh, S.M.; Behera, M.D. Aboveground biomass estimates of tropical mangrove forest using Sentinel-1 SAR coherence data-The superiority of deep learning over a semi-empirical model. Comput. Geosci. 2021, 150, 104737. [Google Scholar] [CrossRef]
  161. Weber, M.; Beneke, C.; Wheeler, C. Unified deep learning model for global prediction of aboveground biomass, canopy height, and cover from high-resolution, multi-sensor satellite imagery. Remote Sens. 2025, 17, 1594. [Google Scholar] [CrossRef]
  162. Narine, L.L.; Popescu, S.C.; Malambo, L. Using ICESat-2 to Estimate and Map Forest Aboveground Biomass: A First Example. Remote Sens. 2020, 12, 1824. [Google Scholar] [CrossRef]
  163. Oehmcke, S.; Li, L.; Trepekli, K.; Revenga, J.C.; Nord-Larsen, T.; Gieseke, F.; Igel, C. Deep point cloud regression for above-ground forest biomass estimation from airborne LiDAR. Remote Sens. Environ. 2024, 302, 113968. [Google Scholar] [CrossRef]
  164. Pan, L.; Liu, L.; Condon, A.G.; Estavillo, G.M.; Coe, R.A.; Bull, G.; Stone, E.A.; Petersson, L.; Rolland, V. Biomass prediction with 3d point clouds from lidar. In Proceedings of the IEEE/CVF Winter Conference on Applications of Computer Vision; IEEE/CVF: Waikoloa, HI, USA, 2022; pp. 1330–1340. [Google Scholar] [CrossRef]
  165. García-Gutiérrez, J.; González-Ferreiro, E.; Mateos-García, D.; Riquelme-Santos, J.C. A Preliminary Study of the Suitability of Deep Learning to Improve LiDAR-Derived Biomass Estimation; Springer International Publishing: Cham, Switzerland, 2016; pp. 588–596. [Google Scholar] [CrossRef]
  166. Seely, H.; Coops, N.C.; White, J.C.; Montwé, D.; Winiwarter, L.; Ragab, A. Modelling tree biomass using direct and additive methods with point cloud deep learning in a temperate mixed forest. Sci. Remote Sens. 2023, 8, 100110. [Google Scholar] [CrossRef]
  167. Jung, M.; Choi, J.; Carpenter, J.; Fei, S.; Jung, J. Individual Tree Biomass Estimation using Single-Scan Terrestrial Laser Scanner with Efficient Projection-Based Deep Learning. J. For. 2025, 1–27. [Google Scholar] [CrossRef]
  168. Narine, L.L.; Popescu, S.C.; Malambo, L. Synergy of ICESat-2 and Landsat for mapping forest aboveground biomass with deep learning. Remote Sens. 2019, 11, 1503. [Google Scholar] [CrossRef]
  169. Dong, W.; Mitchard, E.T.; Yu, H.; Hancock, S.; Ryan, C.M. Forest aboveground biomass estimation using GEDI and earth observation data through attention-based deep learning. arXiv 2023, arXiv:2311.03067. [Google Scholar] [CrossRef]
  170. So, K.; Chau, J.; Rudd, S.; Robinson, D.T.; Chen, J.; Cyr, D.; Gonsamo, A. Direct estimation of forest aboveground biomass from UAV LiDAR and RGB observations in forest stands with various tree densities. Remote Sens. 2025, 17, 2091. [Google Scholar] [CrossRef]
  171. Contreras, F.; Cayuela, M.L.; Sánchez-Monedero, M.A.; Pérez-Cutillas, P. Multi-Source Remote Sensing for large-scale biomass estimation in mediterranean olive orchards using GEDI LiDAR and Machine Learning. Biogeosciences 2025, 22, 7625–7646. [Google Scholar] [CrossRef]
  172. Meng, Q.; Leau, Y.-B.; Shi, J.; Zhou, J. Multi-Source Remote Sensing Data Fusion for Aboveground Biomass Estimation in Tropical Forests: Recent Advances, Challenges, and Future Trends. IEEE Access 2025, 14, 4688–4732. [Google Scholar] [CrossRef]
  173. Li, Y.; Xiao, X. Deep learning-based fusion of optical, radar, and LiDAR data for advancing land monitoring. Sensors 2025, 25, 4991. [Google Scholar] [CrossRef] [PubMed]
Figure 1. The eight most similar literature reviews [5,8,9,10,11,12,29,32] focused on deep learning, categorized by forest type (urban forest, plantation, natural forest, and agroforestry) and platform (UAV, terrestrial, satellite, and airborne).
Remotesensing 18 02490 g001
Table 1. Quantitative synthesis of representative deep learning studies for forest inventory.
Inventory TaskForest TypeSensor ModalityRepresentative StudiesModel ArchitecturePerformance
Tree counting and localizationPlantationOptical imageryAmmar et al. [53]; Wu et al. [55]; Neupane et al. [56]YOLOv4, EfficientDet, U-Net, CNNPrecision up to 0.99; recall 0.85–0.99; overall accuracy 0.76–0.96
LiDARWindrim and Bryson [60]; Wang et al. [61]; Hu et al. [58]PointNet++, Faster R-CNN, improved point transformerF1-score 0.78–0.98; recall up to 0.98; precision up to 0.99; mIoU up to 0.976
Natural forestOptical imageryLi et al. [62]; Yao et al. [63]; Tao et al. [64]CNN, encoder–decoder CNN, AlexNet, GoogLeNetF1-score 0.77; R2 up to 0.93; accuracy 0.65–0.97
LiDARXi and Hopkinson [67]; You et al. [68]; Ma et al. [71]; Jarahizadeh and Salehi [79]CenterNet, Faster R-CNN, 3D U-Net, Tree-NetF1-score approximately 0.75–0.93; 0.80 for urban MLS and 0.795 for forest UAV LiDAR in cross-domain testing
Optical-LiDAR fusionBall et al. [28]; Weinstein et al. [13]; Zhu et al. [16]Mask R-CNN, RetinaNetF1-score 0.63–0.94; precision 0.61–0.91; recall 0.63–0.98
Urban forestOptical imageryLumnitz et al. [81]; Kwon et al. [82]; Firoze et al. [83]Mask R-CNN, YOLOv3, U-Net and cGAN-based generative AI frameworkAverage precision 0.68; count accuracy up to 0.925; spatial accuracy approximately 1.5–2.0 m
LiDARLi and Yan [84]; Chen et al. [85]; Gupta et al. [86]; Ma et al. [71]YOLOv8, PointNet, 3D CNN, sPointNet++, 3D U-NetF1-score 0.62–0.99; recall 0.64–0.99; precision 0.60–0.99
Tree species identificationTropical and subtropical forestsOptical imageryFerreira et al. [89]; Gibril et al. [90,91]; Martins et al. [92]; Zhang et al. [93]; La Rosa et al. [94]DeepLabv3+, U-Net, Mask2Former, CNN, ResNet-50, FCNF1-score 0.79–0.92; overall accuracy up to 0.926; mean IoU up to 0.85
Optical-LiDAR fusionLi et al. [27]; Ferreira et al. [103]; Sablon and Bajgain [104]ACE R-CNN, ResU-Net, multimodal attention CNNF1-score 0.26–0.50 for ACE R-CNN across sites; Kappa up to 0.73; mean sensitivity improved from 0.575 to 0.622
Temperate forestsOptical imageryFricker et al. [105]; Yan et al. [106]; Beloiu et al. [107]; Mu et al. [111]; Tan et al. [112]CNN, GoogLeNet, Faster R-CNN, ForestFormer, Self-supervised TransformerF1-score 0.72–0.92; overall accuracy 0.73–0.90; hyperspectral CNN F1-score up to 0.87
LiDARSun et al. [121]; Liu et al. [122]; Zhang et al. [117]; Ohamouddou et al. [118]; Hamdani et al. [119]PointNet, PointNet++, PointMLP, PCT, MS-DGCNN++, DGCNN, RandLA-NetOverall accuracy 0.82–0.97 in individual datasets; macro-F1 up to 0.73 for multispectral ALS; FOR-species 20K accuracy approximately 0.67
Optical-LiDAR fusionMa et al. [129]; Wang et al. [130]; Briechle et al. [132]; Zhong et al. [102]; Vahrenhold et al. [133]1D-CNN with attention, SAMFormer, PointNet++, CBAM-based fusion, MMTSCNetOverall accuracy generally 0.80–0.97; F1-score up to 0.863; LiDAR-fusion gains approximately 5–15 percentage points in several studies
Boreal forestsOptical imageryNatesan et al. [22]; Nezami et al. [23]; Chadwick et al. [141]DenseNet, 3D-CNN, Mask R-CNNOverall accuracy 0.83–0.983; species-level F1-score 0.69–0.78 in transfer testing
Optical-LiDAR fusionLi et al. [142]; Mayra et al. [143]CNN, ResNet-18, DenseNet-40, 3D-CNNOverall accuracy 0.87–0.91; overall F1-score approximately 0.86
Tree measurementNatural, urban, and mixed forestsOptical imageryShen et al. [146]; Xia et al. [147]; Gan et al. [148]; Yao et al. [149]; Xu et al. [150]Attention-UNet, MidasNet, Faster R-CNN, Mask R-CNN, BlendMask, Bayesian neural networkHeight relative error 1.92–4.87%; crown width RMSE 0.495–0.51 m; crown area RMSE 3.16–4.75 m2; DBH errors as low as 0.11–0.31 cm in selected cases
Optical-LiDAR fusionSong et al. [152]; Wang et al. [19]CNN, improved U2-Net with spot detectionDBH average absolute relative error 3.38%; absolute DBH deviation 0.10–1.34 cm
Natural and mixed forestsOptical imageryJuyal and Sharma [154]; Liu et al. [155]; Chang et al. [157]; Pascarella et al. [159]Mask R-CNN, U-Net with transfer learning, recurrent CNN, Regressive U-NetmAP 0.86–0.92 for trunk/height detection; AGB R2 up to 0.84 with RMSE 37.28 Mg/ha
LiDARNarine et al. [162]; Oehmcke et al. [163]; Pan et al. [164]; Seely et al. [166]; Jung et al. [167]; Shao et al. [78]Deep neural network, Minkowski CNN, BioNet, Octree CNN, DGCNN, projection-based CNNReported performance varies by scale and reference data; individual stem volume R2 up to 0.97 and RMSE 0.18 m3 in MLS-based stem volume estimation
Optical-LiDAR fusionNarine et al. [168]; Zhang et al. [26]; Dong et al. [169]; So et al. [170]; Safarov et al. [153]Deep neural network, Attention U-Net, DeepForest, ForestIQNetAGB and biomass R2 up to 0.93; RMSE as low as 6.1 kg in UAV-scale biomass estimation; reported improvement up to 18% in biomass estimation accuracy
Table 2. Summary of trends, challenges, and research gaps in forest remote sensing applications.
AreaMain TrendsMain ChallengesMain Research Gaps
Counting and localizationResearch increasingly uses high-resolution optical imagery and LiDAR, with object detection appearing more commonly than segmentation in the reviewed studies, possibly because bounding-box annotation requires less effort than pixel-level labeling. Data fusion and ensemble approaches are also growing to improve detection performance.Limited high-quality training data and strong sensitivity to environmental conditions such as crown overlap, species composition, and topography reduce model transferability.Plantation studies remain narrow in scope, natural forest studies still struggle to balance accuracy and generalization, and urban studies underuse fused optical–LiDAR approaches despite their potential.
Species identificationDeep learning architectures are diversifying, with increasing use of hyperspectral, LiDAR, fused data, and bark imagery for species classification. Bark-based methods are particularly attractive because they are low-cost and usable year-round.Reliable field reference data are expensive to collect, and species variability across environments makes consistent classification difficult. Transferability is also limited because studies often use different species sets and regions.There is a need for larger and more shareable labeled datasets, broader species coverage, more multi-season data, and stronger integration of canopy, bark, and LiDAR-based approaches.
MeasurementUAV optical imagery is increasingly used for detailed tree measurements, while LiDAR remains essential for structural attributes such as height and DBH. Optical–LiDAR fusion is growing for more complex estimates such as biomass and volume.High-quality training and validation data are difficult and expensive to obtain, especially for volume and biomass, where destructive field measurements are rare.Many studies stop at segmentation without converting outputs into reliable real-world measurements, and forest-specific deep learning models for biomass and volume estimation are still lacking.
Disclaimer/Publisher’s Note: The statements, opinions and data contained in all publications are solely those of the individual author(s) and contributor(s) and not of MDPI and/or the editor(s). MDPI and/or the editor(s) disclaim responsibility for any injury to people or property resulting from any ideas, methods, instructions or products referred to in the content.