Article

Phenology-Guided Early Prediction of Crop Damage Under Long-Duration Inundation Using Multi-Source SAR–Optical Imagery


1
School of Electronics, Peking University, Beijing 100871, China
2
China Centre for Resources Satellite Data and Applications, Beijing 100094, China
3
College of Geoscience and Surveying Engineering, China University of Mining and Technology, Beijing 100083, China
*
Author to whom correspondence should be addressed.
Remote Sens. 2026, 18(15), 2481; https://doi.org/10.3390/rs18152481
Submission received: 6 June 2026 / Revised: 20 July 2026 / Accepted: 22 July 2026 / Published: 29 July 2026

Highlights

What are the main findings?
  • Sentinel-2-derived annual EVI AUC loss effectively characterized the spatial pattern of crop growth suppression caused by long-duration flood inundation.
  • Integrating multi-source SAR and optical observations improved crop damage prediction, with Random Forest achieving pixel-wise R 2 values of 0.62 using early-period features and 0.77 using later-period features, while village-scale prediction reached an R 2 of 0.78.
What are the implications of the main findings?
  • Phenology-guided regression using SAR–optical imagery provides a feasible approach for early quantitative crop damage assessment when field-based yield-loss data are unavailable.
  • The proposed framework can support rapid disaster response, agricultural insurance assessment, and village-level agricultural risk management under long-duration flooding events.

Abstract

Long-duration flood inundation can substantially suppress crop growth and cause yield loss, particularly in semi-arid agricultural regions increasingly affected by extreme rainfall. Timely crop damage assessment is critical for disaster response and insurance-related decision-making, but direct yield-loss observations are often unavailable during or shortly after flooding. This study proposes a phenology-guided regression framework for early crop damage assessment using multi-source SAR–optical observations. The study was conducted on the Tumochuan Plateau, Inner Mongolia, China, where severe rainfall beginning on 23 July 2025 caused widespread cropland inundation. Sentinel-2 EVI time series from 2022 to 2025 were fitted using a Savitzky–Golay (SG) filter, and annual area under the EVI curve (AUC) loss in 2025 relative to the 2022–2024 historical mean was used as a proxy for flood-induced crop damage. Optical features from Landsat-8/9 and Sentinel-2, together with SAR backscatter features from Sentinel-1, Lutan-1, and Gaofen-3, were incorporated into machine learning regression models. SAR features improved pixel-wise prediction, with the Random Forest model achieving the highest R 2 of 0.62 using early-period features and 0.77 using later-period features. Village-scale aggregation further improved performance, yielding an early-period R 2 of 0.84 across 123 and 0.78 across 122 villages. These results demonstrate the feasibility of SAR–optical and phenology-guided regression for early crop damage assessment under long-duration inundation.

1. Introduction

Driven by increasing carbon emissions and global warming, the tropical rain belt is expected to shift northward in the coming decades [1]. This shift may increase the likelihood of intense and prolonged rainfall events in semi-arid to arid regions, potentially leading to unexpected flooding disasters and substantial damage to croplands, infrastructure, and other socio-economic assets [2]. As flood risks become increasingly frequent and severe, near-real-time monitoring and damage assessment are critical for providing governmental agencies with timely, large-scale information on flood extent and impacts, thereby supporting rapid and informed decision-making [3].
For large-scale crop flood monitoring, remote sensing offers an effective means of mapping inundation extent, particularly through SAR imagery, which is highly sensitive to surface water and can be acquired under all-weather conditions. Compared with traditional gauge-based water-level measurements, field visits, and survey-based assessments, remote sensing provides a more efficient approach for timely and spatially continuous flood monitoring and crop damage assessment [4]. For instance, Qiu et al. [5] mapped flood extents across China using 10-m Sentinel-1 imagery from 2017 to 2021, revealing that nearly half of the identified flooded areas were croplands. Multi-source remote sensing data, including pre- and post-flood Sentinel-1 imagery for flood extent mapping, Sentinel-2 imagery for crop cover characterization, and auxiliary meteorological data, were integrated to assess large-scale potential crop damage in Pakistan [6]. Current studies demonstrate the strong capability of SAR remote sensing for rapid, large-scale inundation monitoring in agricultural regions.
Beyond inundation mapping, the effectiveness of multi-temporal remote sensing also lies in its capacity to characterize crop growth processes affected by flooding [7]. Optical imagery can capture crop growth dynamics through spectral responses, providing important information for understanding flood-induced vegetation disturbance and recovery [8]. For example, Bofana et al. [9] investigated flood duration in Sofala, Mozambique, using multi-source remote sensing observations from Sentinel-1, Sentinel-2, Landsat 8, and MODIS, and reported that crops could survive inundation for up to 24 days. Chen et al. [10] investigated localized variations in crop growth responses to flooding across Northeast China by extracting positive and negative responses from MODIS Enhanced Vegetation Index (EVI) time series from 2005 to 2013. These studies suggest that crop flood damage assessment should move beyond flood extent mapping and incorporate crop growth and phenological responses [11]. Therefore, phenological indicators derived from optical time series can provide valuable references for characterizing flood-induced crop damage, even though optical observations may not always be available during flooding events.
During a crop flooding event, governmental agencies and insurance companies require not only information on flood extent but also timely crop damage assessments to support disaster management and decision-making [4]. Crop damage is more difficult to estimate than flood extent because it depends not only on inundation extent and duration, but also on crop growth stage and post-flood vegetation response. Remote sensing serves as an efficient technique to frequently monitor flood impacts on crop loss, as well as plant recovery [12,13]. When in-situ crop damage measurements are available, regression models can be developed with remote sensing data to estimate flood-induced crop production loss [14]. However, estimating crop damage from remote sensing observations is often indirect and challenging because crop-damage ground truth, such as yield loss, is usually unavailable.
For decision-making and management purposes, it is important to explore approaches for mapping flood extent and assessing crop damage in a timely manner without relying on ground-truth data collection [15]. For example, Internet of Things (IoT) sensor data have been combined with machine learning (ML) approaches to enable real-time prediction of crop health status [16]. Given the limited availability of yield-loss ground truth, recent studies using remote sensing observations have increasingly explored categorical damage-level mapping as an alternative to direct yield-loss estimation. For example, damage assessments based on flood-frequency statistics have been reported to be consistent with farmer-reported damage levels, suggesting the potential of remote-sensing-based approaches for crop flood damage assessment in data-limited settings [13]. SAR imagery and pre- and post-flood NDVI loss values have also been combined to classify damage levels in an unsupervised manner [17,18]. However, most existing studies remain post-event assessments, in which crop damage is evaluated after sufficient optical observations or ancillary information becomes available. This limits their ability to provide timely crop damage information during ongoing or shortly after long-duration flooding events.
This study focuses on the Tumochuan Plain in Inner Mongolia, northern China, a representative agricultural region that is increasingly exposed to flood risk under the observed northward shift of the East Asian rain belt. The region is an important crop-production area, with maize, sunflower, potato, and other field crops widely cultivated. Its flat terrain, dense river and drainage-canal networks, and location near several river/canal intersections make croplands particularly vulnerable to flood inundation and prolonged waterlogging. The flood event investigated in this study lasted for more than one month and caused persistent disturbance to crop growth, providing a suitable case for evaluating whether early crop damage can be mapped using SAR imagery and phenology- guided regression.
Motivated by these research gaps and the reported strong linear relationship between yield loss and NDVI changes [19], this study uses Sentinel-2-derived phenological damage indicator of AUC as a proxy for crop damage, as supported by the feasibility of the EVI time series for potential yield loss in some existing studies [20], and proposes a phenology-guided early prediction framework for crop damage assessment under long-duration inundation. The main contributions of this work are threefold. First, this study investigates the sensitivity of different SAR bands and SAR-derived features to crop flooding, with particular attention to the capacity of SAR signals to penetrate crop canopies and detect inundation beneath vegetation. Second, it explores the relationship between SAR-derived flood response features and Sentinel-2-derived phenological damage indicators under long-duration inundation, and develops a regression-based model for crop damage assessment. Third, it maps crop-flood damage from an early prediction perspective using available SAR observations during a long-duration flooding event, reducing dependence on optical imagery that may be constrained by cloud contamination, adverse weather, and delayed vegetation responses. This study is expected to provide timely crop damage information for governmental agencies, insurance companies, and other stakeholders, particularly as long-duration flooding events are expected to become more frequent under global climate change.

2. Study Area and Data

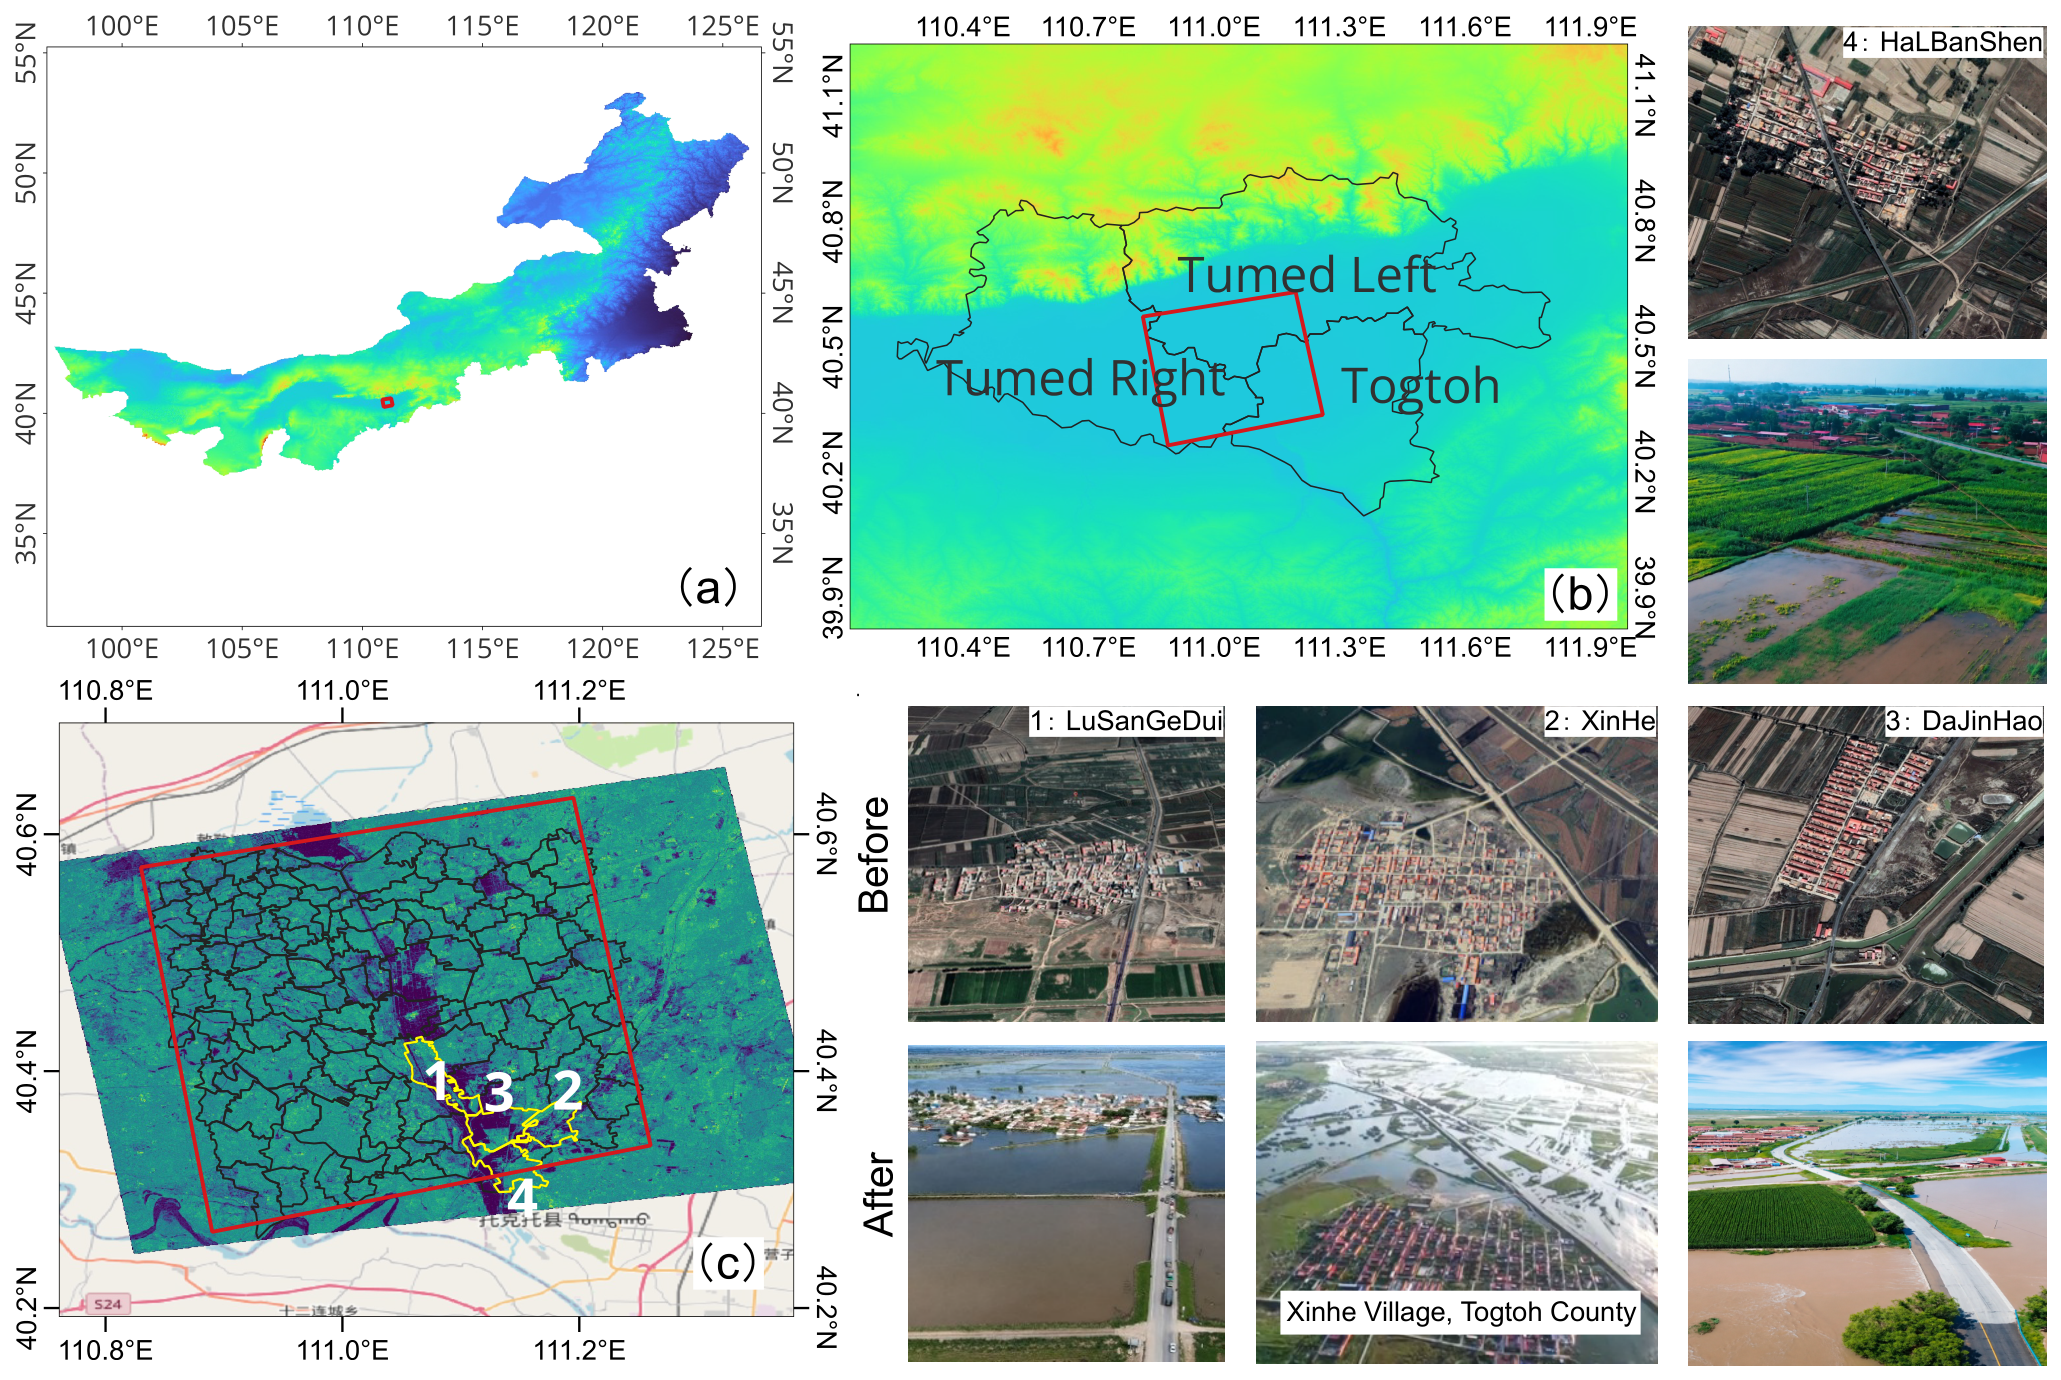
The study area is located near the central part of the Tumochuan Plateau in Inner Mongolia, China, covering Tumed Left Banner, Tumed Right Banner, and Togtoh County, as shown in Figure 1. This region is an important agricultural area in the Hetao–Tumochuan Plain, where croplands are widely distributed along river networks and low-lying terrain [21]. To characterize the climatic background of the study area, annual mean temperature (T), annual precipitation (P), July–August precipitation (P7,8), annual mean solar radiation (R), and annual mean relative humidity (H) from 2022 to 2025 were extracted from the ERA5-Land reanalysis dataset [22,23], as illustrated in Table 1. It should be noted that relative humidity was not directly obtained from ERA5-Land reanalysis data, but was calculated from 2 m air temperature and 2 m dew-point temperature using the August–Roche–Magnus approximation [24]. Due to its relatively flat topography and dense agricultural activities, the area is vulnerable to flood inundation when extreme rainfall and river runoff occur simultaneously.
Since 23 July 2025, the region has experienced a series of extreme precipitation events, with the maximum accumulated precipitation reaching 121.0 mm, exceeding the historical record since 1961. Under the combined influence of intense local rainfall and upstream runoff convergence, water levels in major rivers and drainage channels within the region, including the Dahei River and the Hasuhai drainage canal, rose sharply. The rapid increase in river discharge resulted in breaches and failures of river embankments at multiple locations, causing widespread inundation across surrounding croplands.
This long-duration inundation event provides a representative case for investigating crop flood impacts in semi-arid to arid agricultural regions. The availability of multi-source SAR observations during the flooding period, together with optical observations before and after the event, makes this event in the area suitable for evaluating the feasibility of early crop damage mapping using SAR imagery and phenology-guided regression. Specifically, the study included Landsat 8/9 and Sentinel-2 images in August 2025 as optical sensor features to capture the vegetation response during the flood. Besides, the study also utilized SAR images of Sentinel-1, Lutan-1, and Gaofen-3 during August 2025 to observe flood evolution. Data used in this study can be found in Table 2.

3. Methods

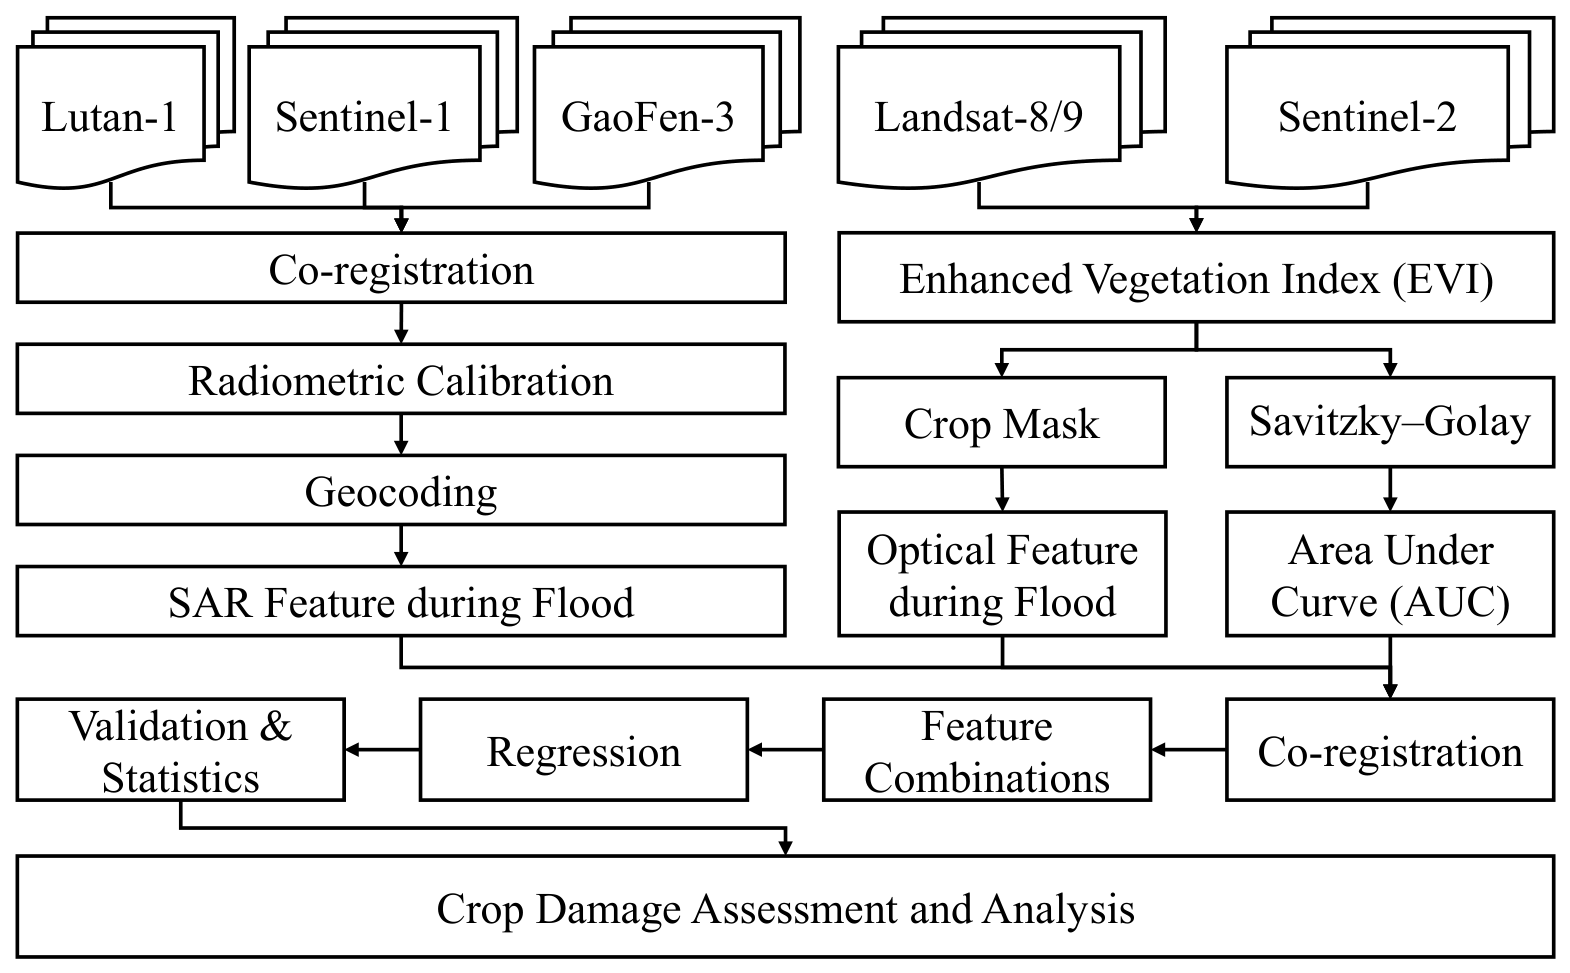
Figure 2 illustrates the overall workflow of the proposed crop damage assessment framework. The framework consists of three main components: multi-source SAR feature extraction, optical vegetation-index and phenological feature derivation, and regression-based crop damage assessment. Specifically, Lutan-1, Sentinel-1, and GaoFen-3 SAR images were co-registered, radiometrically calibrated, and geocoded to derive flood-period SAR features. Landsat-8/9 and Sentinel-2 optical images were used to calculate the Enhanced Vegetation Index (EVI), generate the crop mask, extract flood-period optical features, and estimate the area under the EVI curve (AUC) after Savitzly-Golay smoothing. These SAR, optical, and phenology-based features were then spatially aligned and combined as predictors for regression modeling. Model validation and statistical analysis were finally performed to evaluate crop damage and support subsequent interpretation.

3.1. Phonology-Based AUC

3.1.1. EVI

In this study, EVI [25] was used to characterize vegetation growth conditions, from which the phenology-based AUC and flood-period vegetation responses were derived. EVI was selected because it is relatively robust to atmospheric effects and can reduce the effects of canopy background and soil variations while maintaining improved sensitivity in densely vegetated areas. EVI is defined as follows [26]:
EVI = 2.5 × N R N + 6 R 7.5 B + 1
where N, R, and B denote the near-infrared, red, and blue bands, respectively, of the optical sensors onboard Landsat-8/9 and Sentinel-2. For EVI calculation, the “COPERNICUS/S2_SR_HARMONIZED” product was used for Sentinel-2, while the “LANDSAT/LC08/C02/T1_L2” and “LANDSAT/LC09/C02/T1_L2” products were used for Landsat 8 and Landsat 9, respectively.

3.1.2. EVI Time Series Reconstruction with Savitzky-Golay Filtering

To reduce data gaps and reconstruct continuous vegetation trajectories, EVI time series are commonly fitted or smoothed using methods such as Gaussian process regression [27], HANTS [28], and double logistic functions [29]. In this study, the Savitzky-Golay filtering was adopted because of its effectiveness in modeling time series [30]. The seasonal EVI trajectory derived from Sentinel-2 data in 2025, as well as between 2022 and 2024, was fitted using the SG filtering to reduce noise from cloud contamination, atmospheric effects, and irregular satellite observations. Sentinel-2 surface reflectance images were first masked using the QA60 and SCL bands, and only cropland pixels identified by the ESA WorldCover cropland mask were retained. EVI was calculated from the blue, red, and near-infrared bands and then composited at 10-day intervals using the median value. A five-point Savitzky–Golay (SG) filter with a second-order polynomial was then applied to the 10-day EVI composites using the five-point smooth to reconstruct smoother intra-annual EVI trajectories while preserving the seasonal crop growth pattern. The equation of the SG filtering can be found in Equation (2):
EVI t SG = 3 EVI t 2 + 12 EVI t 1 + 17 EVI t + 12 EVI t + 1 3 EVI t + 2 35
where EVI t SG denotes the SG-smoothed EVI value at the central time step t, and EVI t 2 , EVI t 1 , EVI t + 1 , and EVI t + 2 represent four neighboring consecutive 10-day EVI observations within the smoothing window.

3.1.3. AUC Modeling

The area under the fitted EVI curve was then calculated to represent the cumulative vegetation growth condition over the entire year. In this study, the AUC was approximated by summing the daily fitted EVI values during the year:
AUC = t = 1 365 EVI t SG
where A U C denotes the cumulative annual vegetation growth, and EVI t SG is the SG-smoothed EVI value at the day of year (DOY) t. A larger AUC indicates stronger cumulative vegetation growth, whereas a smaller AUC suggests suppressed vegetation development or potential crop damage.
To quantify the vegetation growth anomaly associated with the 2025 flood event, the AUC of 2025 was compared with the mean AUC during the reference period from 2022 to 2024:
A U C loss = A U C 2025 A U C 2022 2024
where A U C l o s s represents the AUC anomaly, A U C 2025 is the AUC derived from the fitted EVI trajectory in 2025, and A U C 2022 2024 is the multi-year mean AUC calculated from 2022 to 2024. Negative A U C l o s s values indicate a reduction in cumulative vegetation growth in 2025 relative to the historical baseline and were therefore used as an indicator of potential flood-induced crop damage.
The 365-day integration window was used to represent the complete annual phenological trajectory smoothed by the SG filter. Although positive pre-flood EVI deviations may partially offset the post-flood EVI decline in the annual integral, the main contribution to A U C l o s s was concentrated from July to August.

3.2. Crop Damage Regression

3.2.1. Regression Models

Before co-registration, the SAR data underwent multilook processing to reduce speckle noise. Data from different sensors were then co-registered and resampled to a common 30 m grid using average resampling, followed by outlier removal to construct the SAR–optical feature stack. To establish the regression mapping between the multi-source remote sensing variables and the target variable (AUC), five mainstream machine learning regressors were comprehensively employed and evaluated, including Random Forest (RF), Extreme Gradient Boosting (XGBoost), Light Gradient Boosting Machine (LightGBM), CatBoost, and AdaBoost.This predictive relationship can be mathematically formalized as follows:
y = f m ( X )
where y represents the target variable AUC, X denotes the composite feature vector derived from the multi-sensor data, and f m ( m { RF , XGBoost , LightGBM , CatBoost , AdaBoost } ) signifies the specific regression mapping function constructed by the corresponding machine learning algorithm [31,32].
To model the relationship between multi-source remote sensing variables and crop damage severity represented by the AUC loss of EVI time series during flood events, five ensemble-based machine learning regressors, including Random Forest (RF), eXtreme Gradient Boosting (XGBoost, XGB), Light Gradient Boosting Machine (LightGBM, LGBM), CatBoost (Cat), and Adaptive Boosting (AdaBoost, Ada), were employed due to their capability to capture nonlinear relationships and complex feature interactions between SAR, optical observations, and vegetation responses. RF is an ensemble learning method based on bootstrap aggregation (bagging), where multiple decision trees are independently constructed using randomized feature sub-spacing to improve model generalization and reduce overfitting. XGBoost, an efficient implementation of the Gradient Boosting Decision Tree (GBDT) framework, sequentially minimizes residual errors through gradient optimization with regularization constraints, and has been widely applied in remote sensing regression tasks because of its strong predictive performance and computational efficiency. Similarly, LGBM is a GBDT-based algorithm that adopts a leaf-wise tree growth strategy with depth limitations and histogram-based optimization to improve computational efficiency for high-dimensional datasets. CatBoost further enhances boosting performance by introducing ordered boosting and symmetric tree structures, which help reduce overfitting and improve prediction stability. In addition, the AdaBoost algorithm iteratively adjusts sample weights to emphasize difficult observations during training, and a DecisionTreeRegressor was adopted as the base estimator in this study to model nonlinear relationships between flood-related remote sensing features and EVI AUC loss.
To ensure a fair comparison among different regression algorithms, the hyperparameters of all machine learning models were optimized using Optuna before model evaluation. Optuna is an automated hyperparameter optimization framework that enables efficient and flexible search for optimal model hyperparameters. In this study, it was adopted to optimize the configurations of different machine learning models and improve their predictive performance. Five tree-based regression models were considered, including Random Forest (RF), XGBoost (XGB), LightGBM (LGBM), CatBoost (Cat), and AdaBoost (Ada). The optimized hyperparameters mainly controlled model complexity, ensemble size, sampling strategy, and regularization strength. The detailed search ranges for each model are summarized in Table 3.

3.2.2. Validation Metric

To evaluate the predictive capability of the RF model, multiple evaluation metrics were adopted, including the coefficient of determination ( R 2 ), Pearson correlation coefficient (r), root mean square error (RMSE), and mean absolute error (MAE) [33]. The R 2 metric [34] was calculated during both parameter tuning and model validation to assess the goodness of fit between the predicted and observed AUC loss values. It is defined as:
R 2 = 1 i = 1 m y i f ( x i ) 2 i = 1 m ( y i y ¯ ) 2
where y i is the observed AUC loss value, f ( x i ) is the predicted AUC loss value, y ¯ represents the mean value of the observed AUC loss values, and m is the number of samples. To further quantify the magnitude of prediction errors, RMSE and MAE [35] were also calculated as follows:
R M S E = 1 m i = 1 m y i f ( x i ) 2
M A E = 1 m i = 1 m y i f ( x i )
The Pearson correlation coefficient (r) was additionally adopted to assess the linear association between the predicted and observed AUC loss values. Moreover, it was used to explore the interrelationships among SAR and/or optical features.

3.3. Feature Importance Assessment Methods

Machine-learning models usually provide stronger nonlinear fitting and generalization capabilities than traditional linear statistical models, but their decision-making processes are often less transparent. To improve model interpretability, SHAP (SHapley Additive exPlanations) was used in this study to quantify the contribution of each input feature to model predictions [36]. SHAP is based on a game-theoretic framework and assigns a Shapley value to each feature, thereby measuring both the magnitude and direction of its contribution to the predicted AUC loss. By decomposing each prediction into feature-level contributions, SHAP provides a consistent way to evaluate the relative importance and influence of multisource remote-sensing variables. In this study, TreeExplainer was used to explain the predictions of RF, XGBoost, LightGBM, and CatBoost, which are tree-based ensemble models supported by the SHAP framework. The mean absolute SHAP values were further summarized to compare the contributions of different sensors and features.

4. Results

4.1. Sentinel-2 Phonology-Based AUC

This study preprocessed Sentinel-2 Surface Reflectance Harmonized data and extracted cropland phenological anomalies using the Google Earth Engine platform. First, the QA60 band was used to remove cloud- and cirrus-contaminated pixels, while the Sentinel-2 Scene Classification Layer (SCL) was used to exclude no-data pixels, saturated or defective pixels, dark-area pixels, cloud shadows, water, unclassified pixels, medium- and high-probability clouds, thin cirrus, and snow/ice pixels. Subsequently, cropland pixels were extracted from the ESA WorldCover v200 land-cover product, where pixels with a class value of 40 were identified as cropland. This cropland mask was then applied to retain only cropland areas within the study region for subsequent analysis.
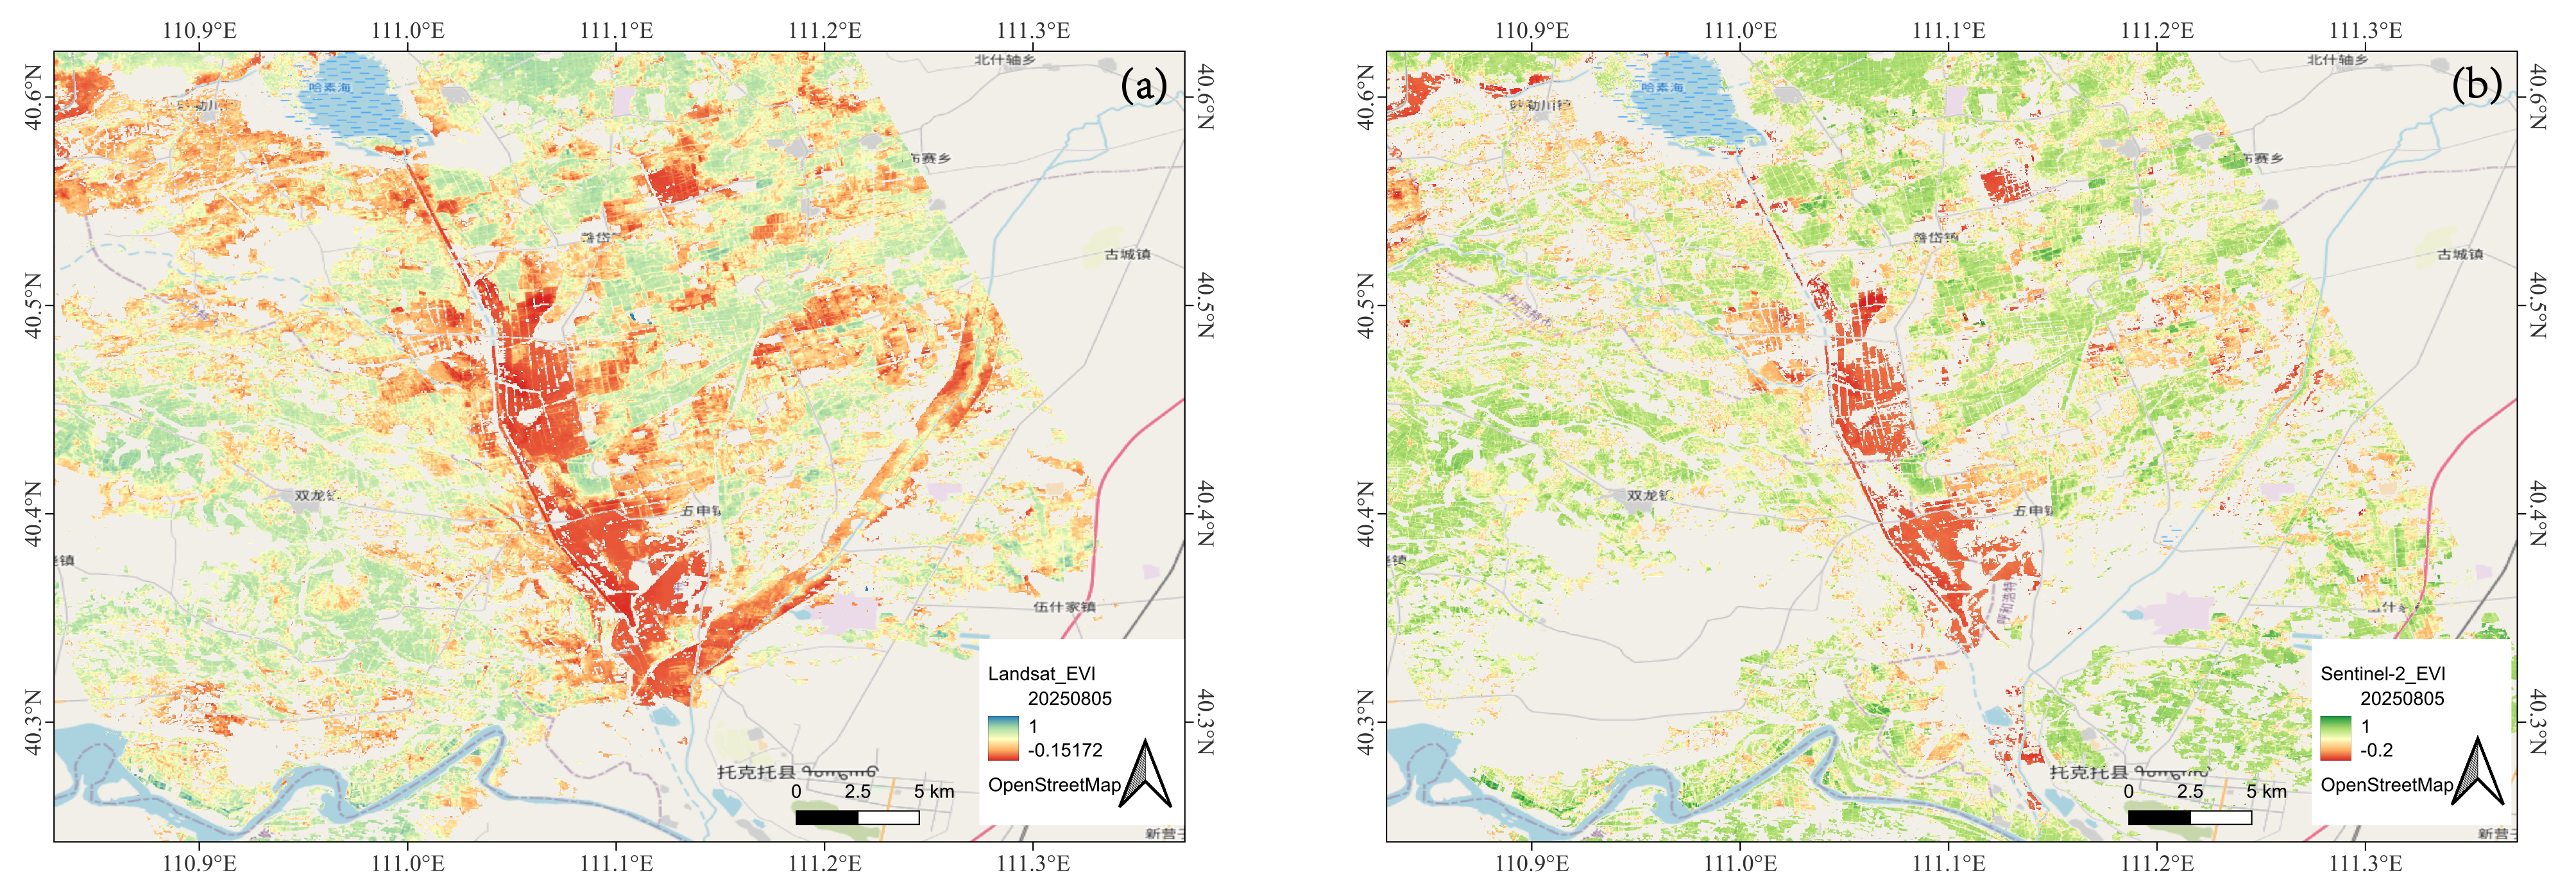
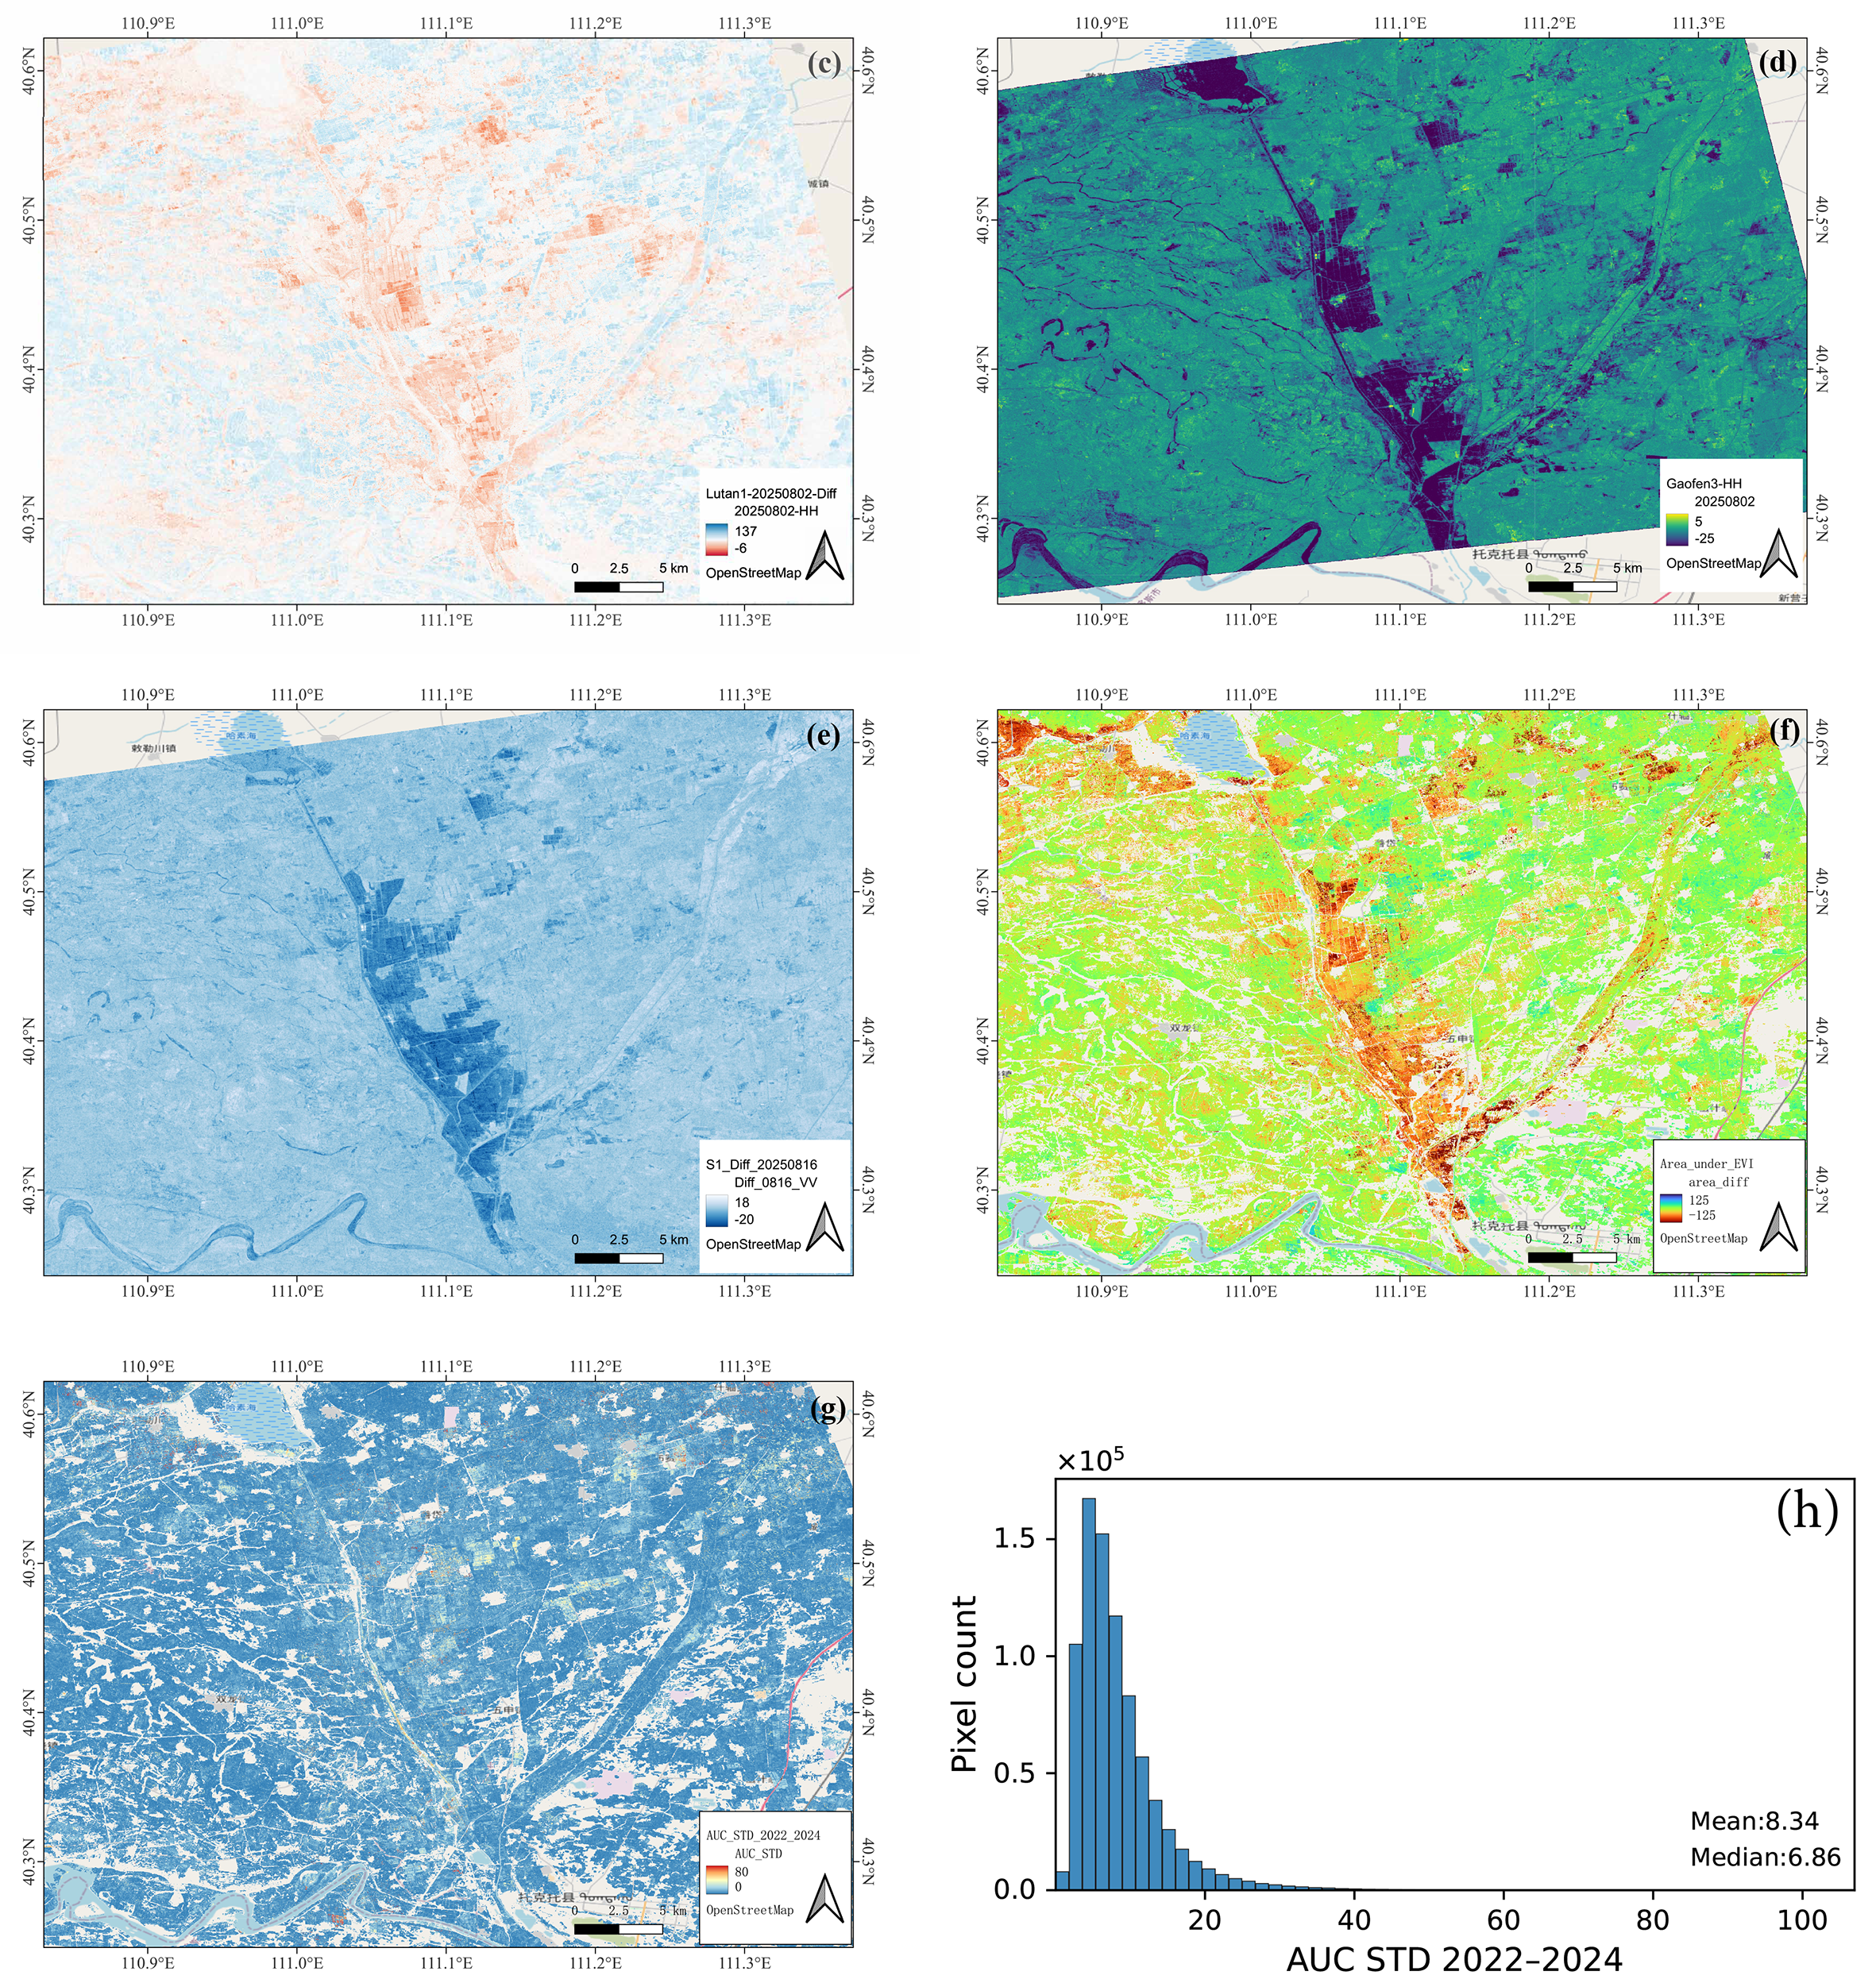
Figure 3f shows the spatial distribution of the Sentinel-2-derived AUC difference between 2025 and the historical reference period of 2022–2024. Negative AUC differences were observed across parts of the cropland area, indicating that cumulative vegetation growth in 2025 was lower than the historical mean. These negative anomalies were mainly represented by the red areas in the figure and were interpreted as crop-growth reductions associated with the 2025 flood event. In contrast, areas with AUC differences close to zero showed relatively limited deviations from the historical vegetation-growth condition.

4.2. SAR Response to Flood

4.2.1. SAR Signal Interactions

Water bodies generally appear dark in SAR imagery because specular reflection leads to low radar backscatter. Following the flood event, SAR signals over inundated croplands were substantially attenuated, resulting in a distinct contrast between flooded and non-flooded areas. A comparison between the AUC loss in Figure 3f and the SAR observations in Figure 3c–e reveals strong spatial consistency between vegetation growth reduction and low-backscatter flood signatures. These affected areas are mainly distributed along the Hasuhai River, corresponding to the central part of the subplots in Figure 3.
During the early flood period before 15 August 2025, Sentinel-1 observations were not available. However, both Lutan-1 and Gaofen-3 SAR sensors, launched by China, acquired images over the flooded areas on 2 August 2025, only several days after the heavy rainfall event, which shows the advantage of multi-source. It should be noted that absolute radiometric calibration was not available for both Gaofen-3 and Lutan-1 in this study. Therefore, the relatively calibrated dB backscatter values derived from these two sensors are less directly comparable and physically interpretable than those from Sentinel-1.
In addition, the SAR signal in Figure 3c appears to indicate a larger flood-affected area than that in Figure 3d,e, although both images were acquired on the same date. This difference may be related to the longer wavelength of L-band Lutan-1 SAR, which has stronger vegetation penetration capability and is therefore more sensitive to inundation beneath crop canopies. However, SAR backscatter over flooded croplands can be influenced by complex interactions among radar signals, vegetation, and water surfaces, such as double-bounce scattering between the water surface and crop stalks, particularly for long-wavelength L-band SAR [37,38]. A detailed analysis of these scattering mechanisms is beyond the scope of this study.

4.2.2. Correlation Analysis

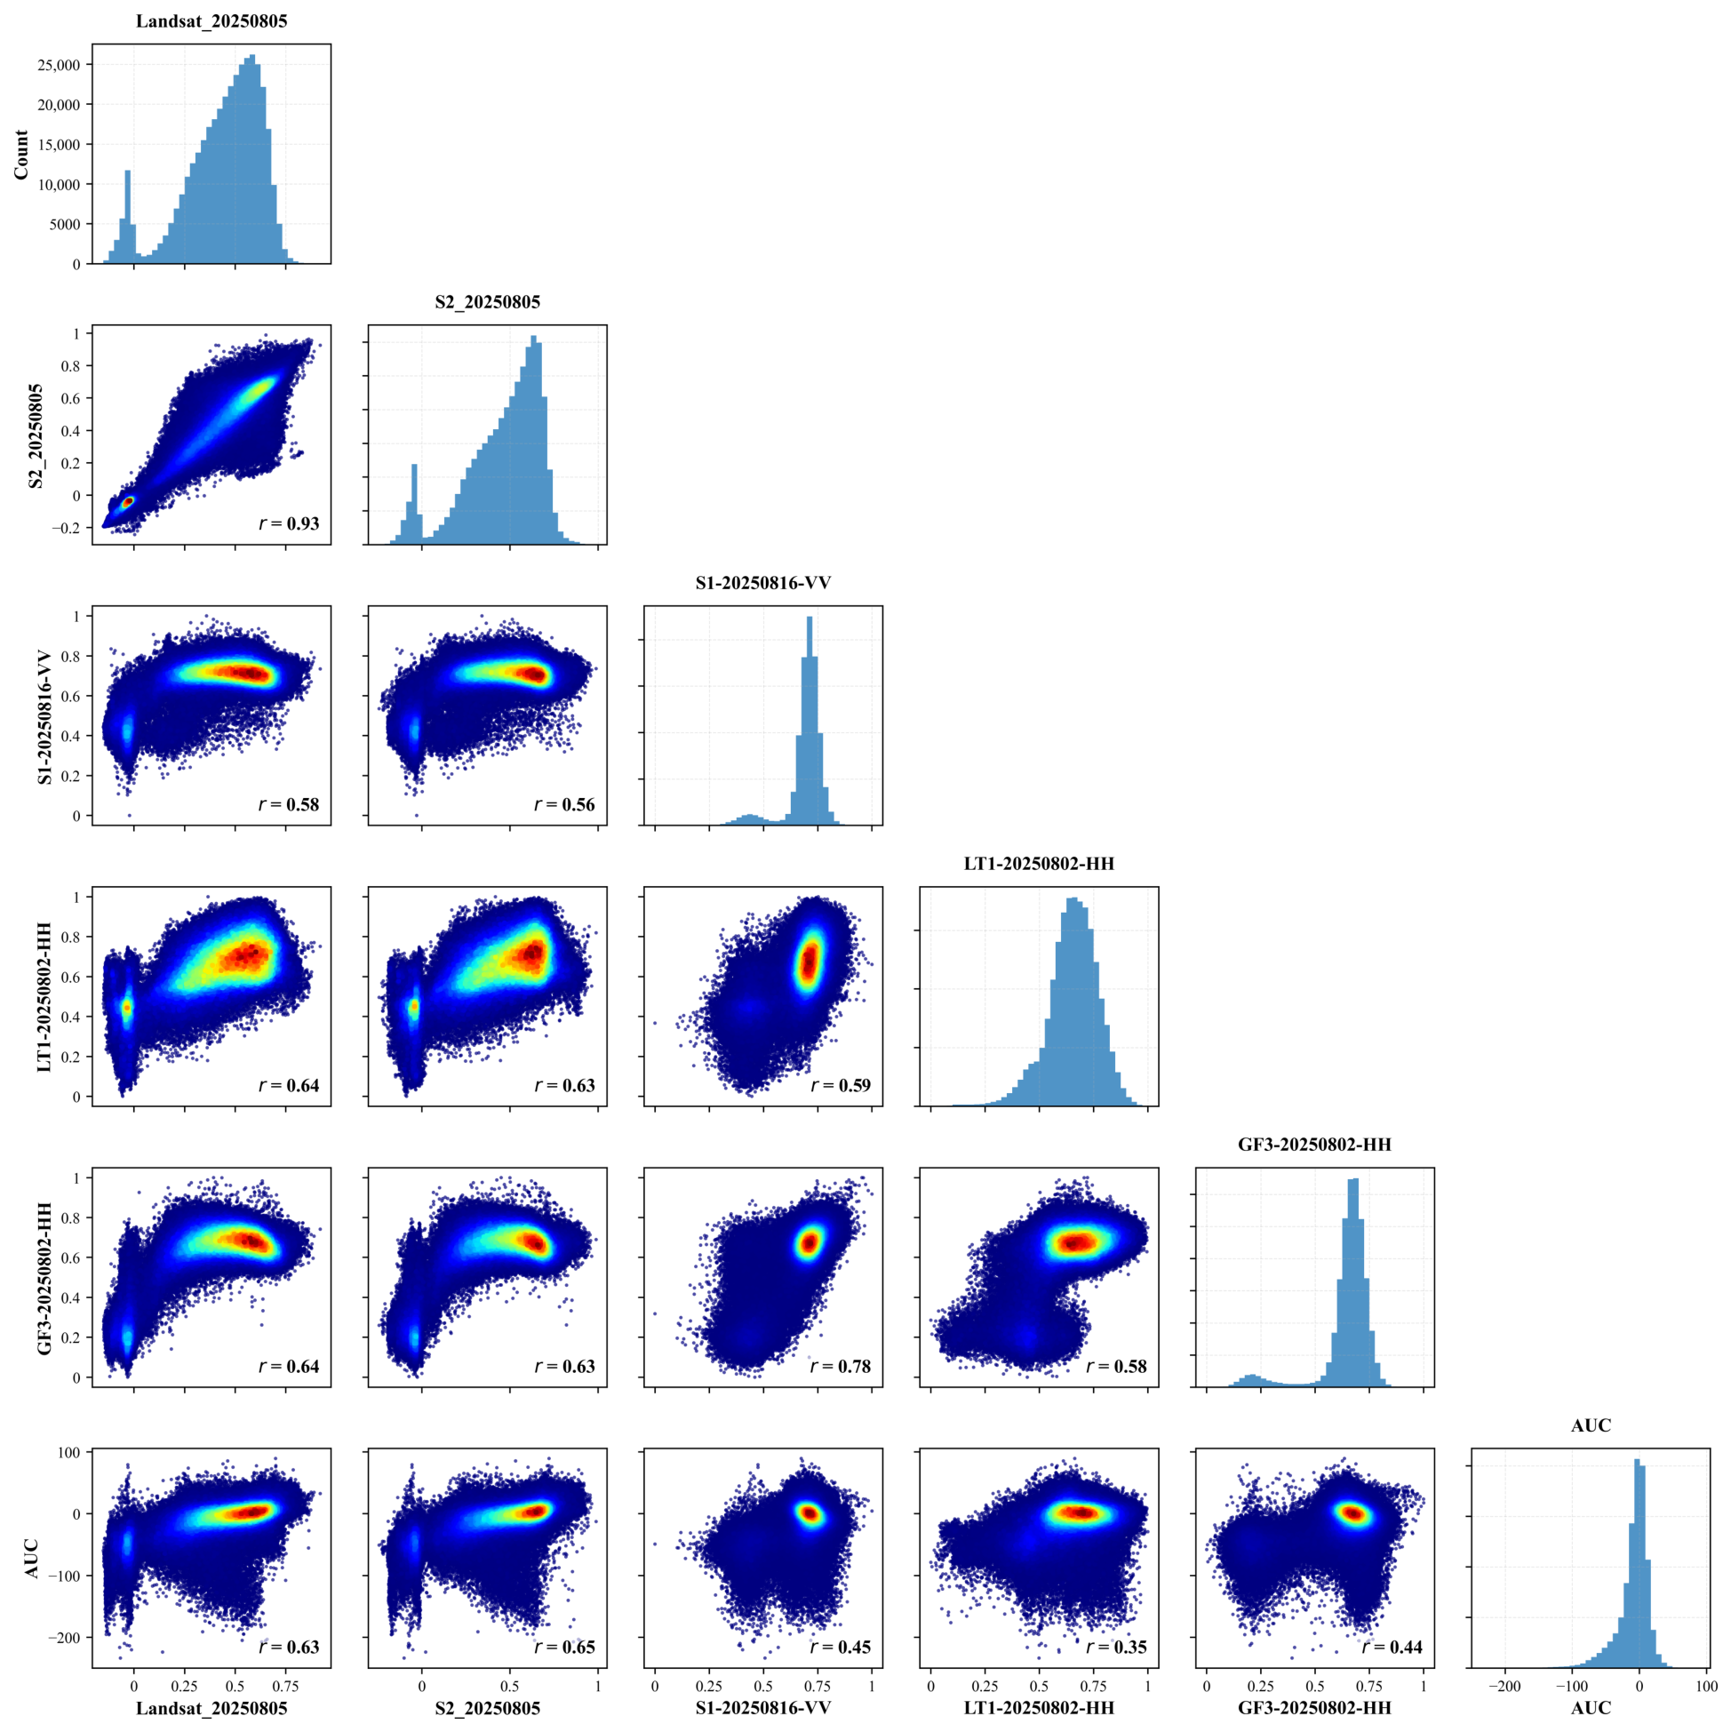
Correlation analysis was performed using the earliest available SAR and optical images acquired in August 2025, including Landsat-8/9 (5 August 2025), Sentinel-2 (5 August 2025), Sentinel-1 (16 August 2025), Lutan-1 (2 August 2025), and Gaofen-3 (2 August 2025) observations. As shown in Figure 4, the EVI derived from optical observations shows a strong linear correlation with AUC loss, with Pearson’s correlation coefficient reaching approximately 0.6 for both Landsat-8/9 and Sentinel-2. This is likely because AUC loss was directly estimated from the Sentinel-2 EVI time series and is therefore closely related to vegetation growth status. Although most pixels show only weak correlations between AUC loss and SAR images because SAR signals are sensitive to water and therefore reflect flood, however, a partial positive linear relationship can still be observed in the scatterplots shown in Figure 4.
Regarding the correlations among SAR and optical features during the early flood period, represented by all subplots except those in the last row of Figure 4, the correlation coefficients can reach approximately 0.6 or higher, suggesting a certain degree of consistency across different sensors. Notably, Lutan-1, shown in the fourth row of Figure 4, appears to exhibit visually stronger correlations with Landsat-8/9 and Sentinel-2. This may be partly attributed to its longer wavelength and stronger penetration capability through crop canopies, suggesting its potential advantage for crop flood damage assessment. Regarding the EVI derived from optical sensors, some discrepancies may arise from differences in the spectral response functions of Sentinel-2 and Landsat. Nevertheless, as shown in the subplot of the 2nd row and 1st column of Figure 4, the Sentinel-2 and Landsat observations acquired on the same date (i.e., 20260805) exhibit good consistency in their EVI values. A more comprehensive assessment of the influence of sensor-specific spectral response characteristics warrants further investigation but is beyond the scope of the present study.

4.3. ML AUC Loss Early Prediction

After SAR–optical image co-registration, the multi-temporal EVI and SAR-derived backscatter features acquired in August 2025 were grouped into two periods: the early flood period from 1 August 2025 to 15 August 2025 and the later flood period from 16 August 2025 to 31 August 2025. Different feature combinations were then designed to evaluate their effects on AUC loss modeling. These combinations were constructed progressively by starting with optical features and sequentially incorporating SAR features, including [Landsat], [Landsat, S2], [Landsat, S2, S1], [Landsat, S2, S1, LT1], and [Landsat, S2, S1, LT1, GF3]. It should be noted that the LT-1, GF-3, and Sentinel-1 SAR observations were independently normalized to the range of [0, 1] to improve the comparability of SAR features across sensors, particularly given the lack of absolute radiometric calibration for LT-1 and GF-3. Machine learning models were subsequently constructed to examine the relationships between the annual AUC loss in 2025 and the aforementioned feature combinations. The regression analysis was conducted only for cropland pixels, which were identified using the ESA WorldCover v200 land-cover product as described earlier.
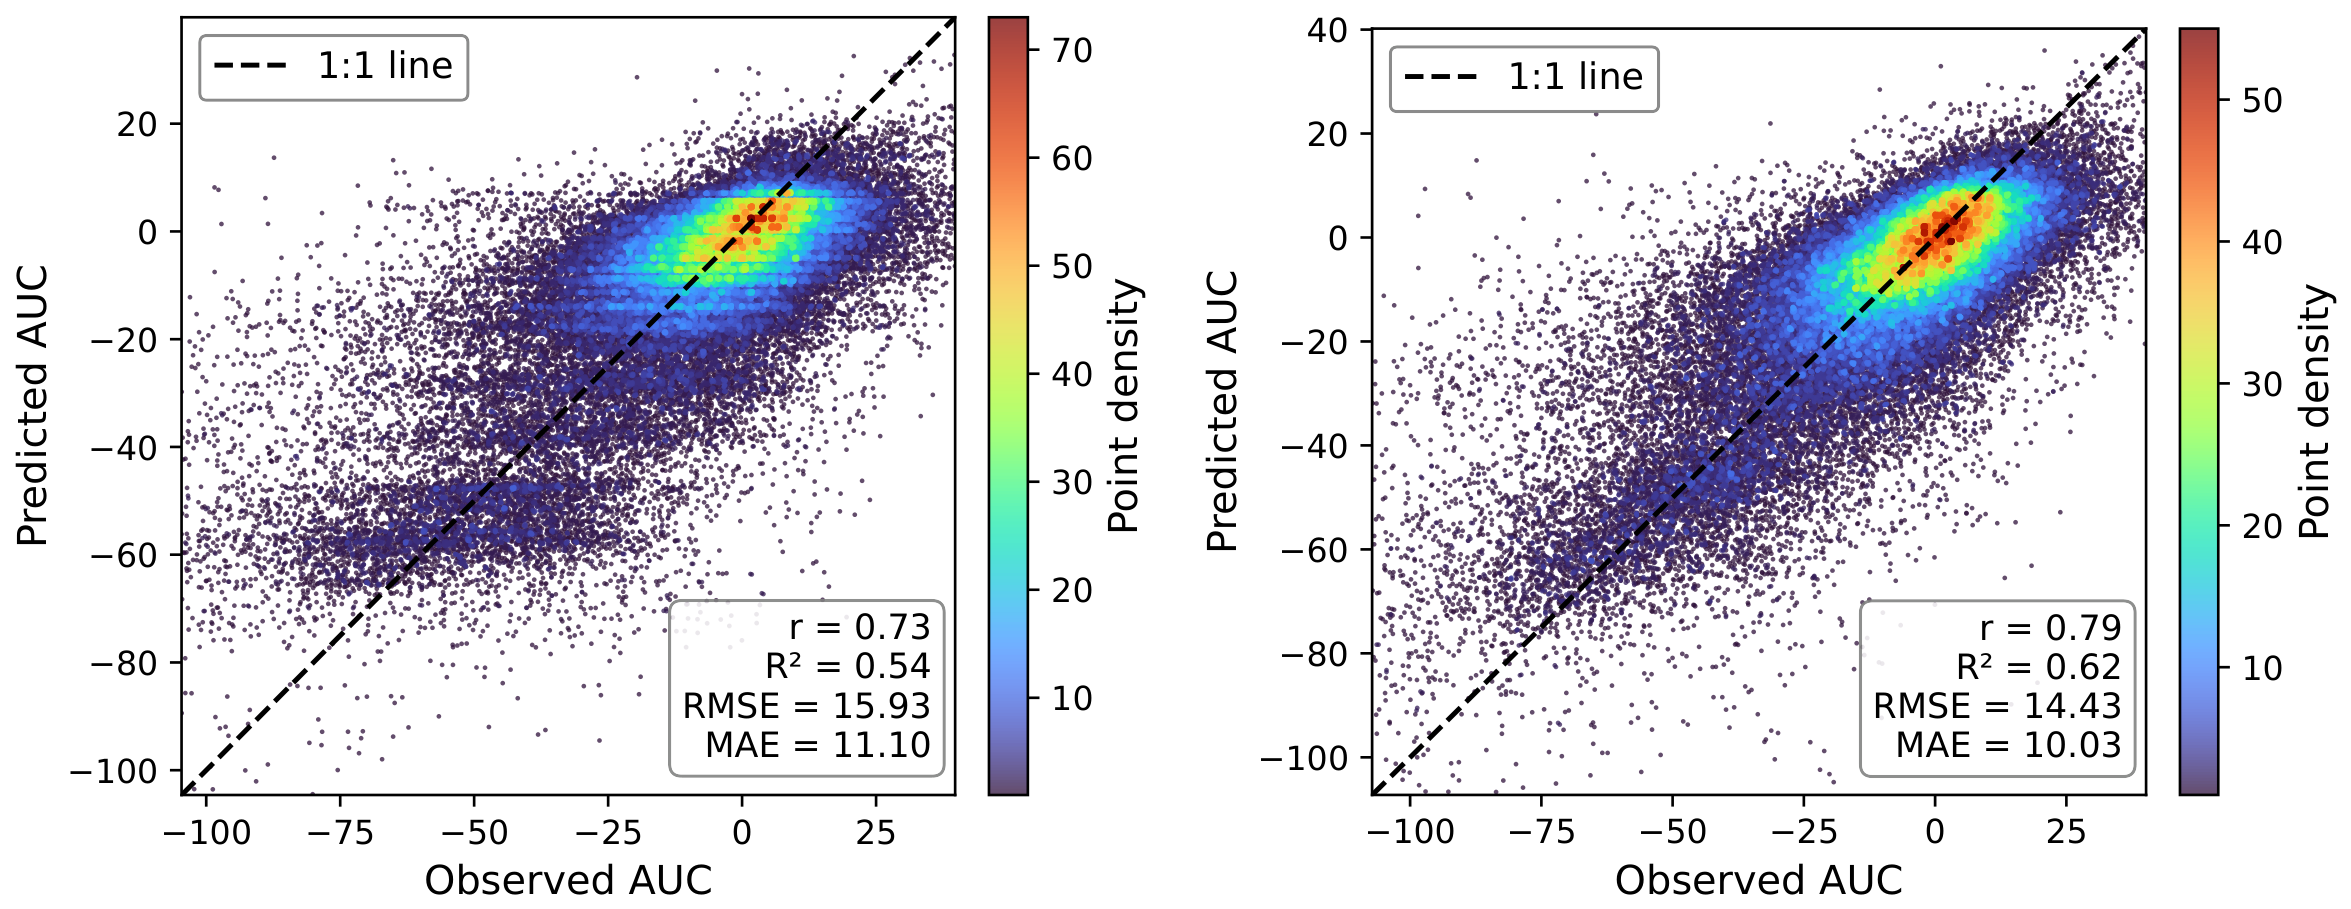
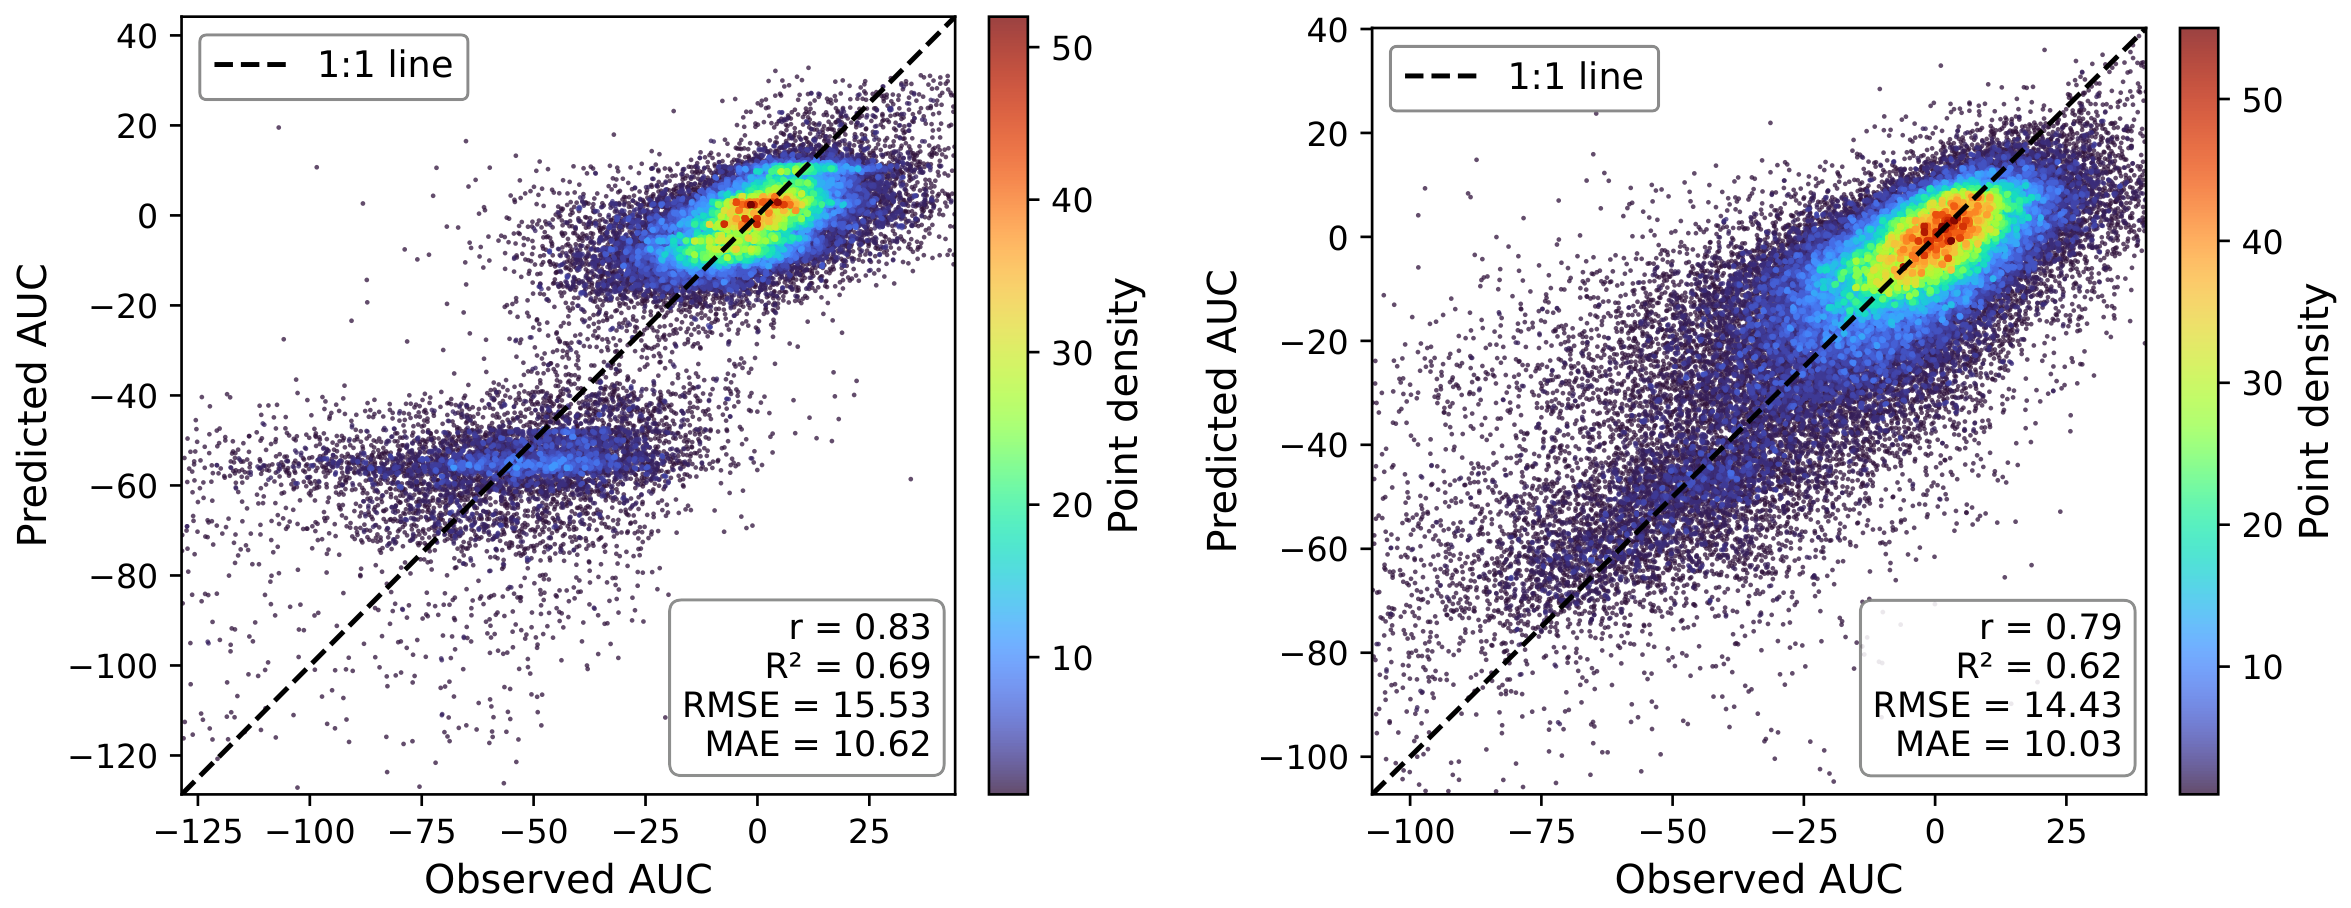
The cropland pixels were randomly split into training, validation, and testing samples at proportions of 60%, 20%, and 20%, respectively. Random pixel-wise splitting may assign spatially adjacent pixels to different subsets, and spatial autocorrelation may therefore lead to optimistic pixel-level R 2 estimates. To provide a spatially independent assessment, data from Bingzhouhai Village were completely withheld from model development, including training, validation, and testing, and were used only for independent village-level validation. Before model training, all data were cleaned by removing outliers, invalid values, and observations in the AUC_STD variable exceeding three times the median absolute deviation. The training samples were used to fit the model parameters, while the validation samples were used for hyperparameter tuning and model selection. The independent testing samples were reserved for the final evaluation of model generalization performance, i.e., R 2 . The optimal ML models were developed using Optuna-based hyperparameter optimization under different SAR–optical feature combinations. The corresponding R 2 values of the RF, XGBoost, LightGBM, CatBoost, and AdaBoost regressor models, using features acquired during the early flood period (1 August 2025 to 16 August 2025) and the later flood period (16 August 2025 to 31 August 2025), are presented in Table 4. For a given feature combination, RF generally outperformed the other models, with the highest R 2 of 0.77 achieved using the all-feature combination. However, the differences in R 2 among the five ML models were relatively small, suggesting that the performance improvement was mainly driven by feature enrichment rather than model selection.
Table 4 quantitatively shows that the incorporation of SAR features improved the predictive performance. For the full SAR–optical feature combination, as shown in Table 4, XGBoost and RF achieved the best performance during the early and late flood-affected periods, respectively. However, the differences in ( R 2 ) among the models were small, possibly because they share similar tree-based learning structures. Therefore, RF was selected for the subsequent analyses to maintain methodological consistency and simplicity. Figure 5 and Figure 6 present scatter plots of the observed and predicted AUC losses obtained using the Landsat-only and full SAR–optical feature combinations during the early and late flood-affected periods, respectively. Overall, the predicted values were distributed close to the 1:1 line, particularly for samples with large AUC losses. Comparisons between the feature combinations further indicate that incorporating additional SAR features improved model performance during both periods. Nevertheless, the improvement remains moderate, likely because flood-affected pixels accounted for only a small fraction of all cropland pixels in the study area, whereas non-flooded pixels dominated the sample distribution. In addition, comparison of the R 2 values between the two studied periods indicates that the later-period features produced better model performance than the early-period features. This may be because, after nearly one month of continuous flooding, the SAR–optical features more effectively captured vegetation stress and flood-induced growth reduction, thereby showing stronger correlations with the AUC loss.
Taking the RF model as an example, the optimized hyperparameters were further compared across the different feature combinations. As shown in Table 5, the optimal RF hyperparameters changed noticeably as SAR features sensitive to flood conditions were progressively incorporated. Specifically, the increases in n_estimators and max_depth indicate that the optimization procedure favored a larger and deeper ensemble structure following the inclusion of multi-source SAR features. This increased model capacity may facilitate the representation of complex nonlinear relationships between flood-induced backscatter variations and crop damage. Similarly, the decreases in min_samples_split and min_samples_leaf allowed finer node partitioning, potentially increasing the model’s sensitivity to local variations in flood response and vegetation conditions. The reduction in max_features indicates that a smaller subset of predictors was considered at each split, which may reduce inter-tree correlation. However, the increased tree depth and finer node partitioning also raise the risk of fitting pixel-level noise and spatially localized patterns. Therefore, the improved predictive performance cannot be attributed solely to increased model complexity or interpreted as unrestricted evidence of model generalization. To further evaluate this issue, an additional RF model with more restrictive hyperparameter settings was tested and compared with the Optuna-optimized model. The results showed that, on the held-out test dataset, the deeper Optuna-optimized RF model provided a better fit for severely flood-affected pixels characterized by large-magnitude AUC loss than the constrained RF model. Because the accurate characterization of severely flood-affected pixels is a central objective of this study, the original Optuna-optimized model was retained. Nevertheless, this model selection should be regarded as a trade-off between stronger regularization and greater sensitivity to severe crop damage, rather than as evidence of unrestricted spatial or temporal generalizability.

4.4. Feature Importance by SHAP Analysis

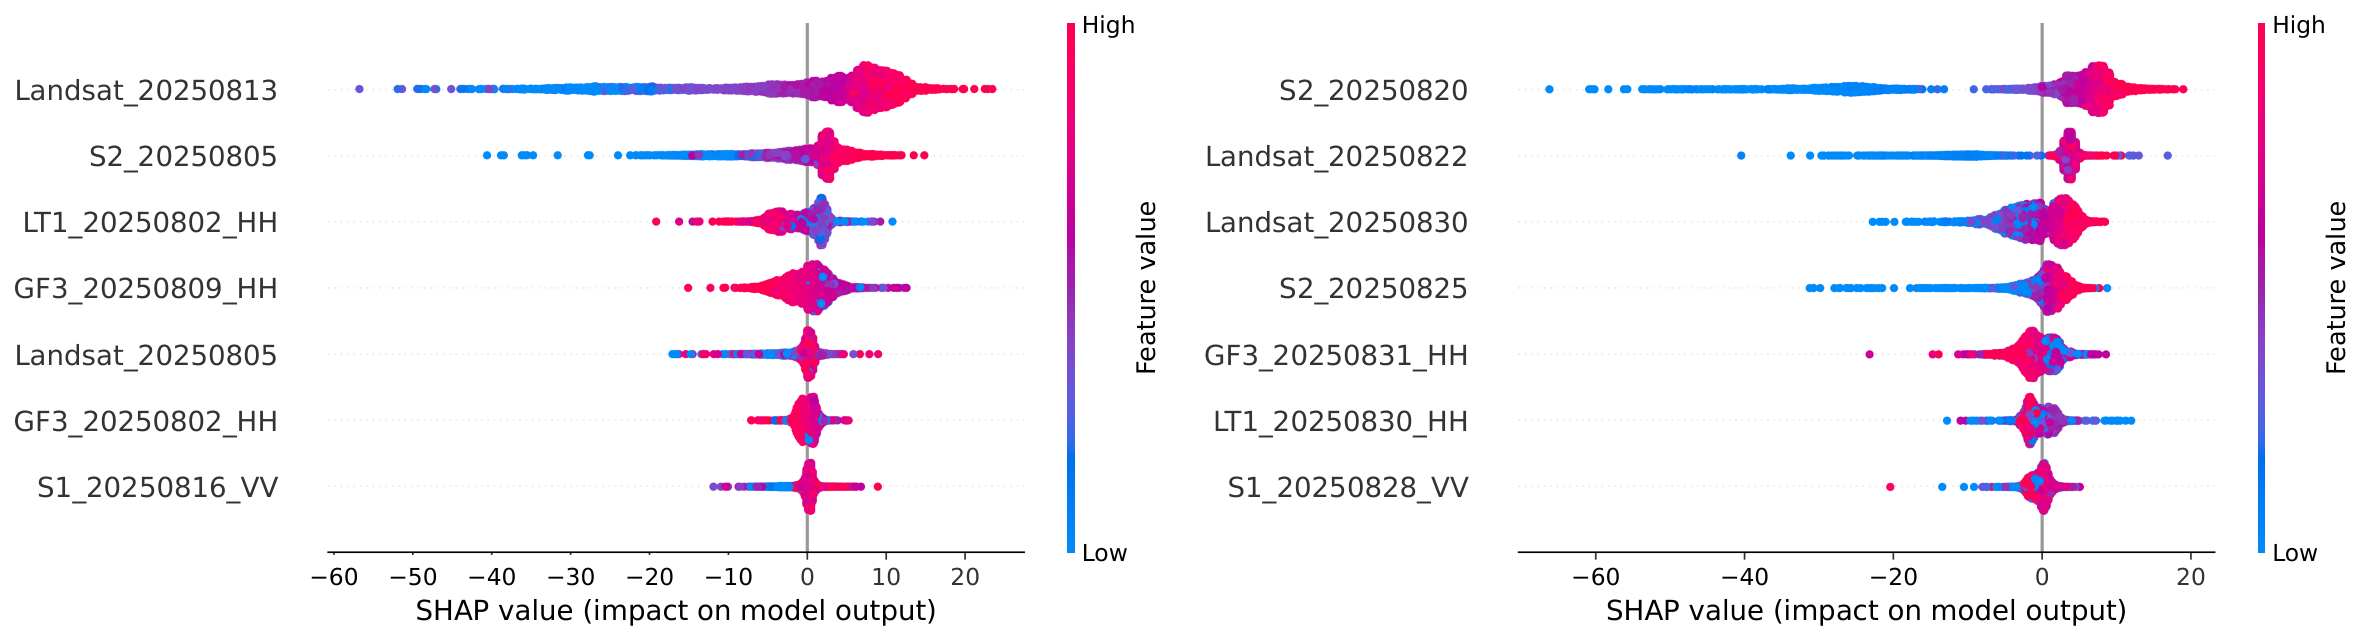
Understanding the complex relationships between multisource remote-sensing variables and crop flood-loss estimation is essential for identifying the dominant information sources and interpreting the physical basis of model predictions. In this study, SHAP values were calculated for the input variables of the tree-based ensemble models, including RF, XGBoost, LightGBM, and CatBoost, to quantify the influence of each variable on the predicted AUC loss. Figure 7 presents the distributions of SHAP values for the different features in the optimal RF model. The results show that both SAR and optical features contributed to model predictions during the early and late flood-affected periods, while optical EVI features generally exhibited greater importance than SAR features.
The relative contribution of individual SAR features varied between the two periods. The SHAP results indicate that the LT-1 features made relatively important contributions to the model predictions during the early flood period. This result suggests that the LT-1 observations contained useful information related to flood-induced changes in crop and surface conditions. However, the LT-1 and GF-3 data used in this study were not converted to absolute radiometrically calibrated backscatter coefficients and were independently normalized to the range of [0, 1]. Therefore, the SHAP values represent the relative predictive contributions of the normalized input features rather than the physical sensitivity of the original radar backscatter. Although the longer wavelength of L-band SAR may theoretically provide greater sensitivity to vegetation structure and interactions between crop canopies, stems, soil, and standing water, the present results cannot be used to directly confirm specific scattering mechanisms, such as double-bounce scattering. A rigorous interpretation of these mechanisms would require calibrated backscatter measurements, consistent cross-sensor radiometric processing, and additional polarimetric or field observations. By late August, the contribution difference of LT1, S1, and GF3 SAR observations may not be significant given the post-flood vegetation degradation. However, detailed SAR signal response to flooded crops requires further investigation, especially with in-situ field experiments.

4.5. Village-Scale AUC Loss Mapping

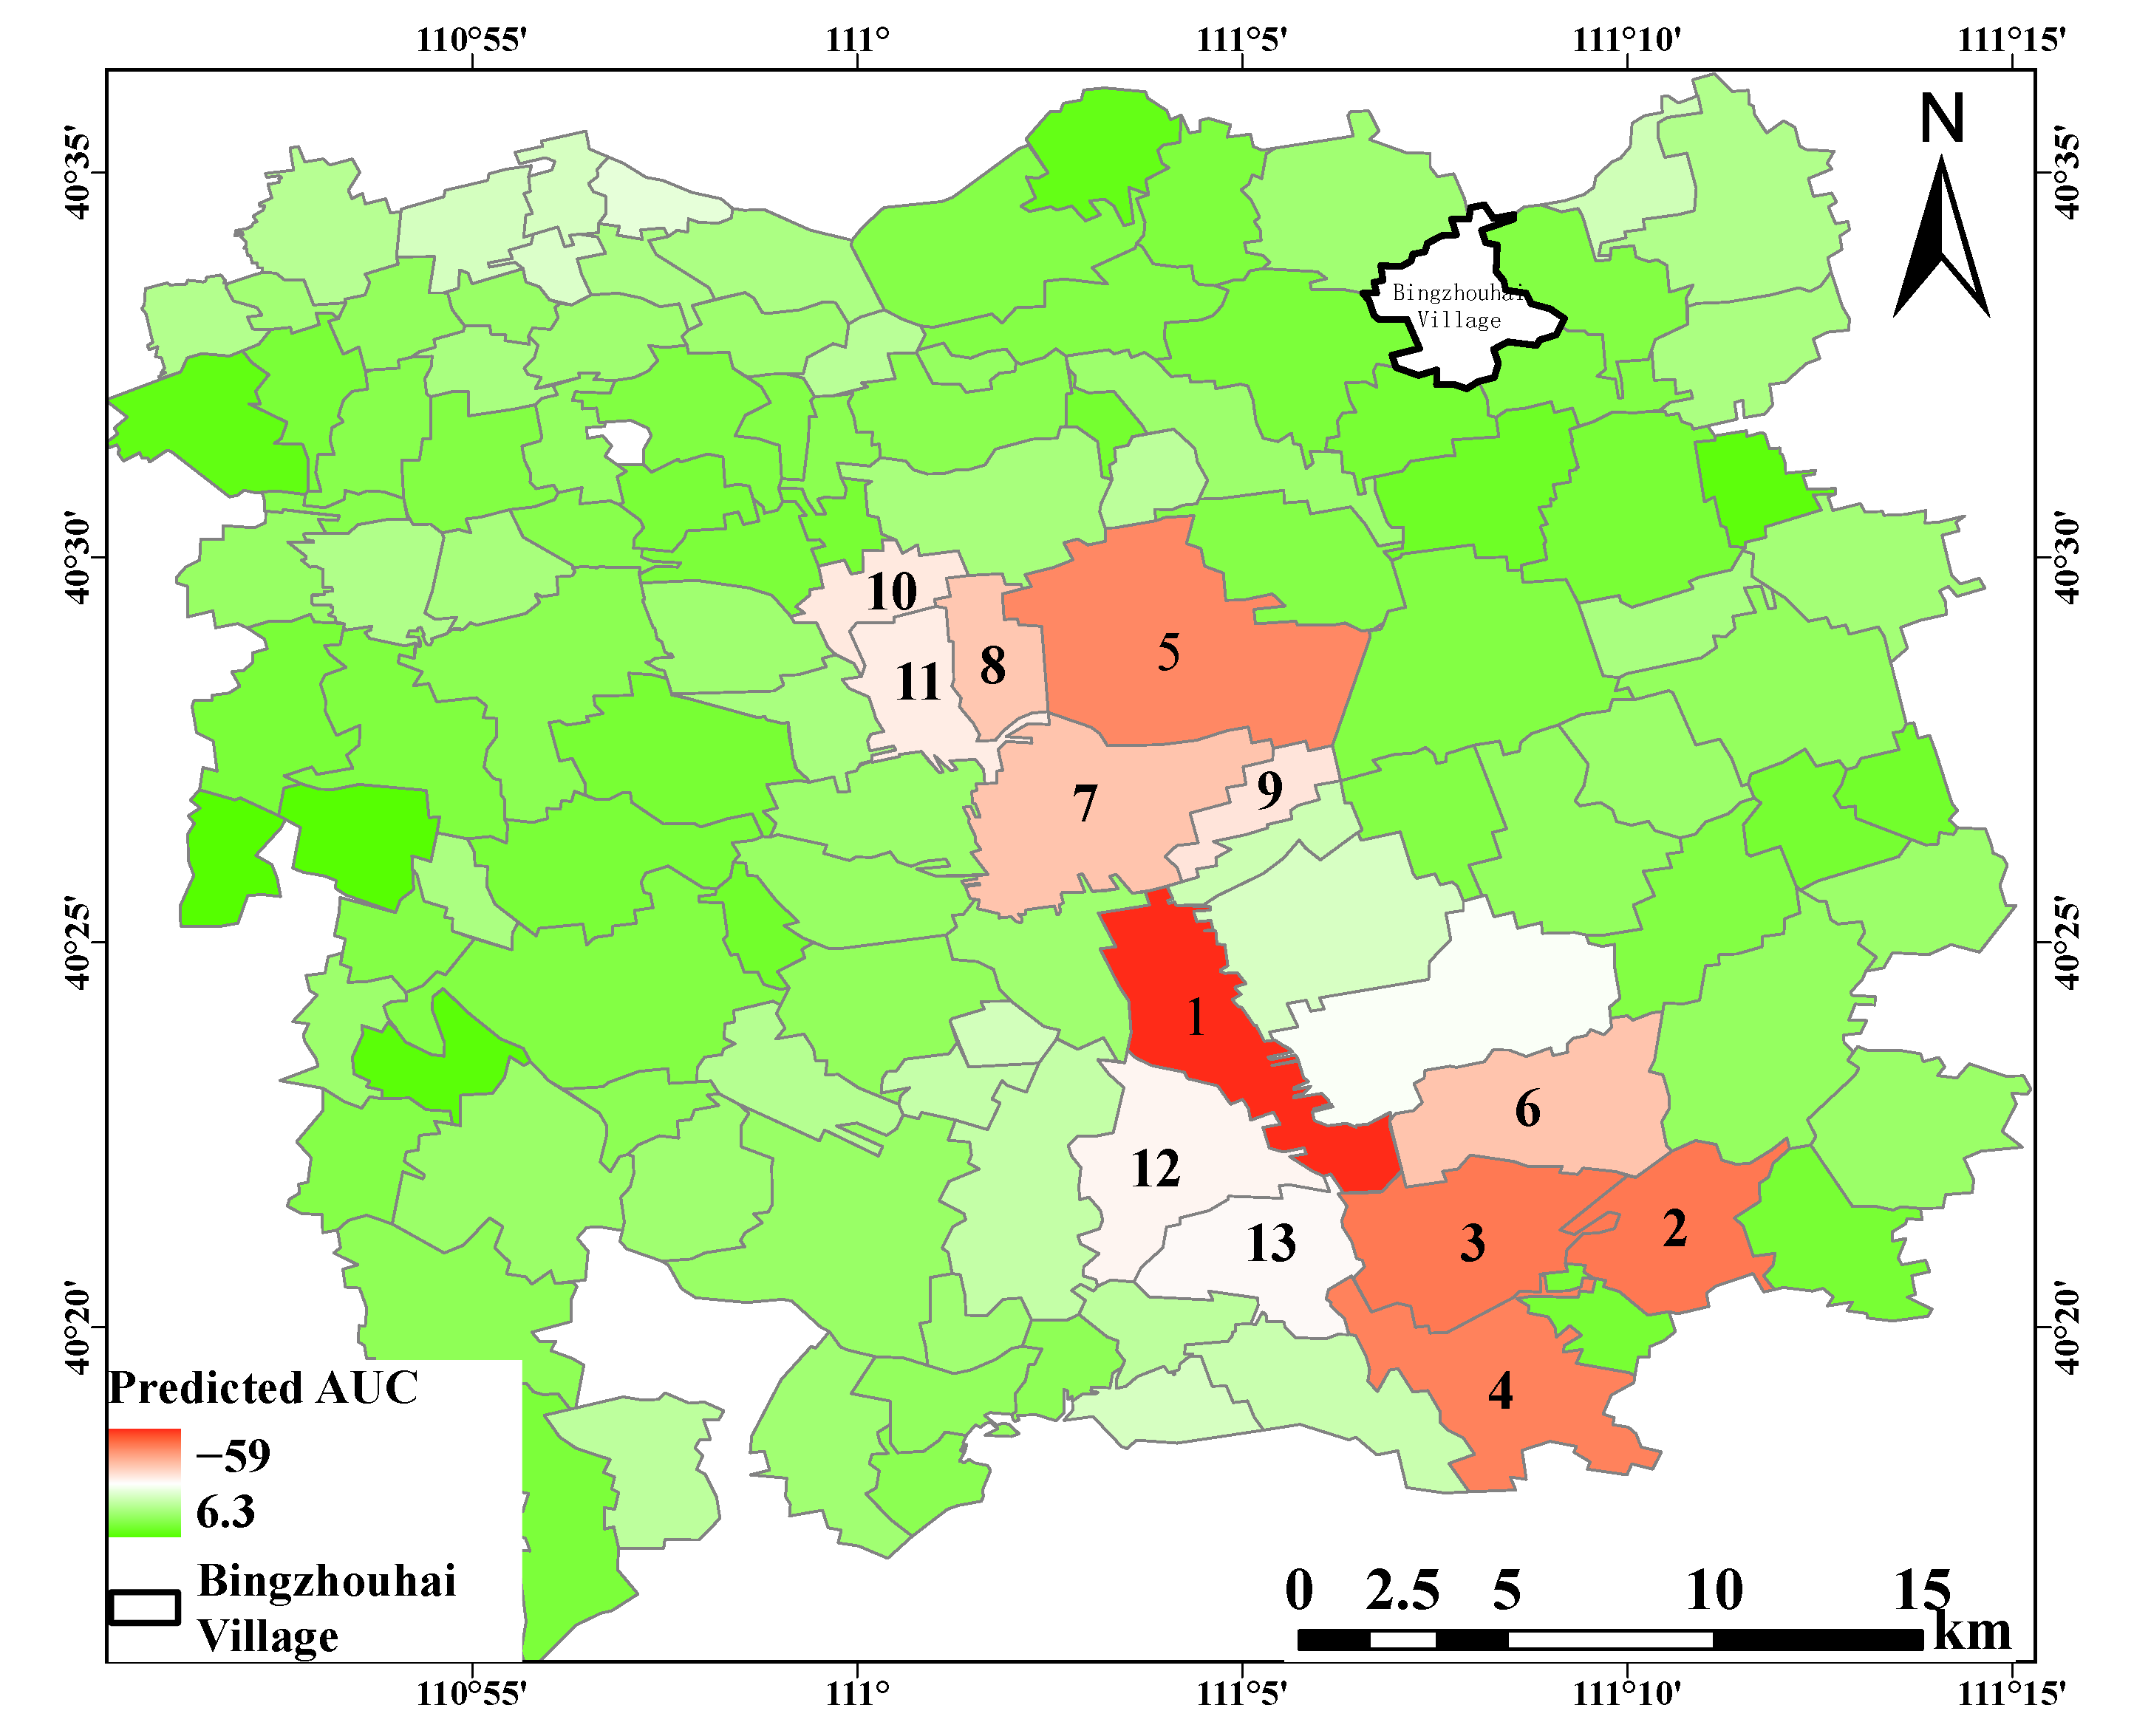
From an application perspective, a robust model trained with study-area-wide samples could potentially be transferred to predict AUC loss for all pixel samples in another region, thereby supporting early crop damage estimation. In this study, village-scale AUC loss was predicted using the early-flooding-period dataset. Specifically, 60% of the samples were used for model training, 20% for validation, and the remaining 20% for independent testing. The resulting AUC loss map for the 122 villages is shown in Figure 8, where red indicates areas with high potential AUC loss under long-duration inundation.
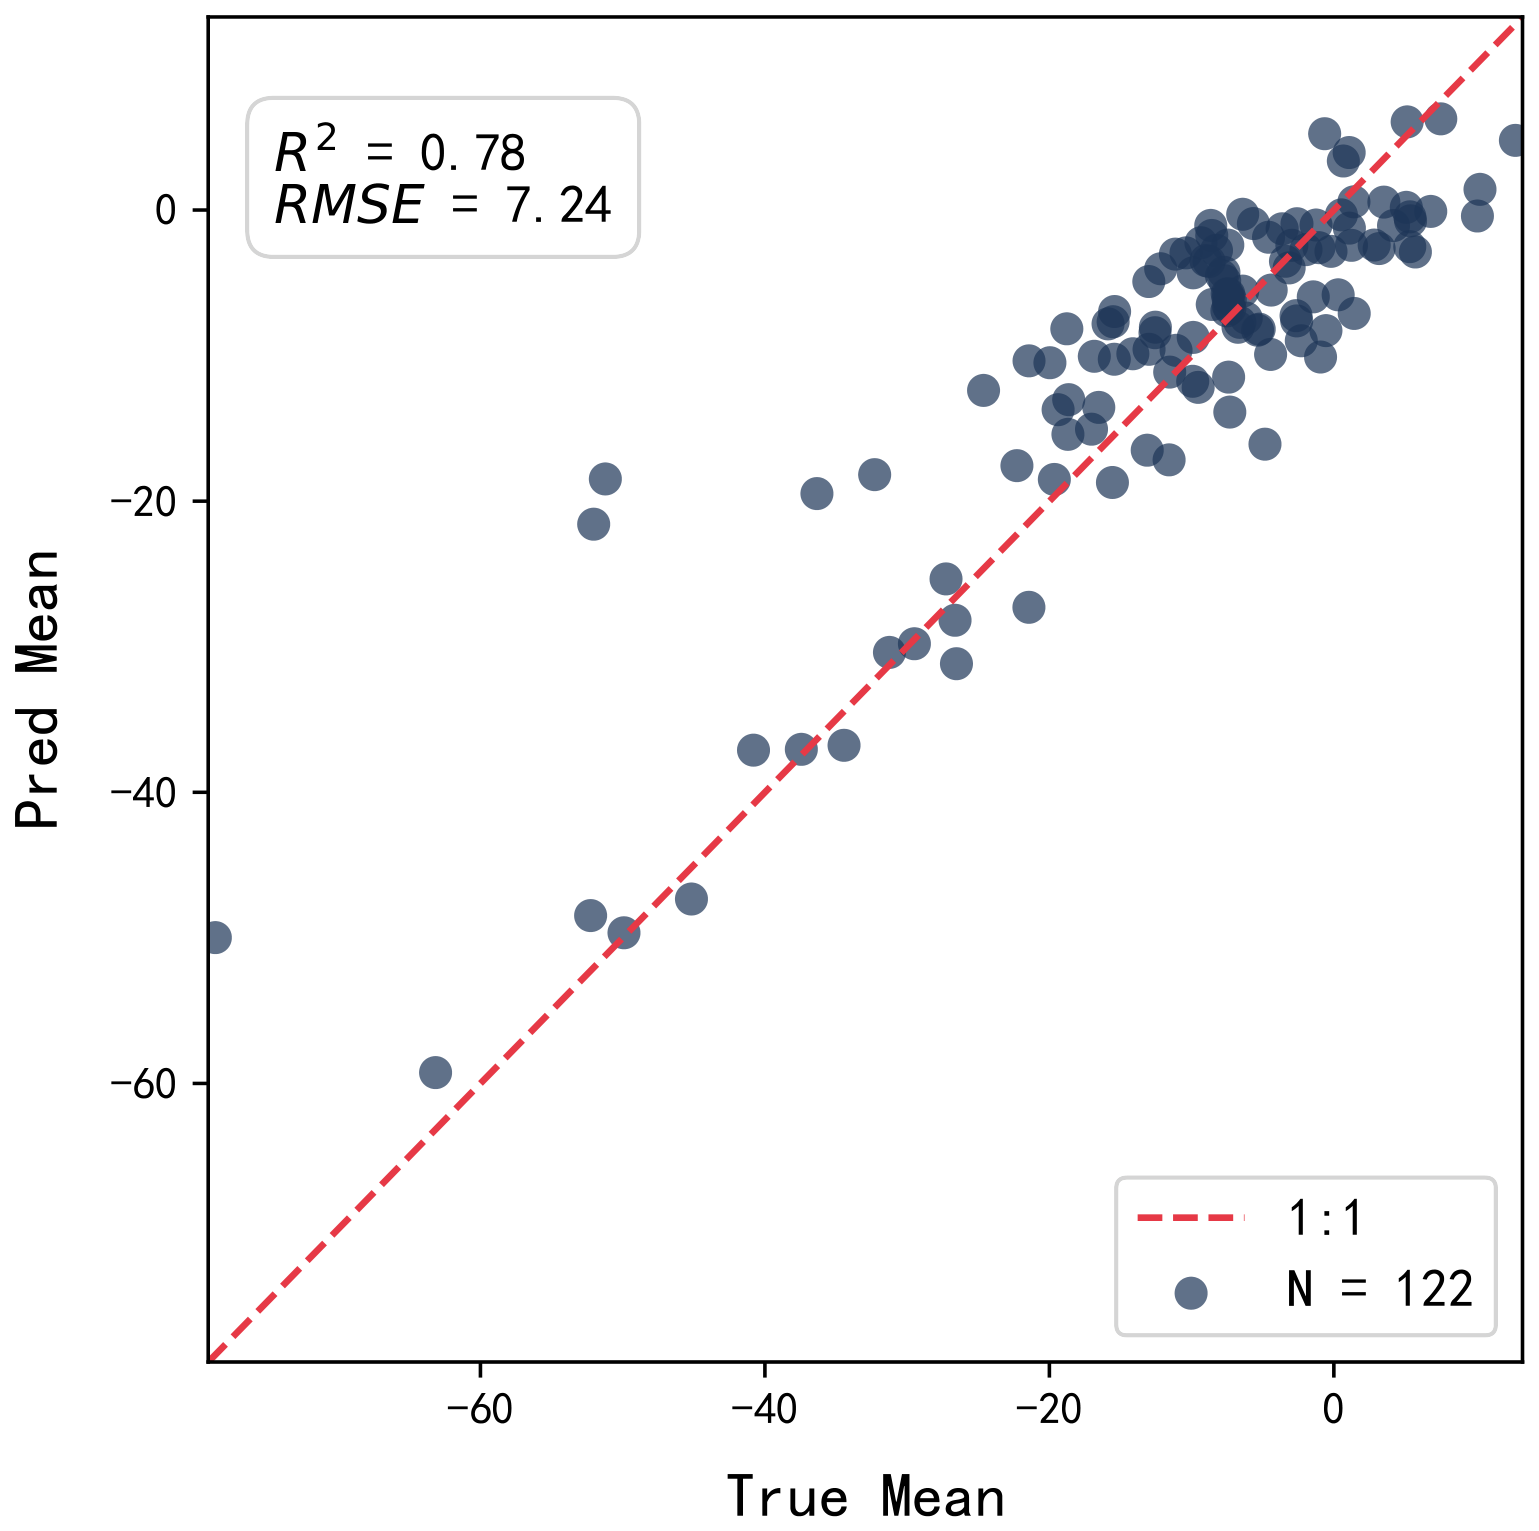
To evaluate the prediction performance at the village scale, the predicted AUC loss derived from the early-flooding-period data was compared with the annual Sentinel-2-based AUC loss across the 122 villages, as shown in Figure 9. The village-scale prediction achieved an R 2 of 0.78, which is higher than the pixel-wise result. This improvement can likely be attributed to the spatial aggregation effect within village polygons, which helps suppress the influence of noisy pixels and local-scale heterogeneity.
As shown in Figure 8, villages with substantial predicted AUC loss exhibit good spatial consistency with the annual AUC loss distribution, as well as with the EVI and SAR backscatter patterns shown in Figure 3. Based on multi-source remote sensing observations acquired before 15 August 2025, the thirteen villages with the highest predicted AUC loss were identified as potentially heavily affected by continuous flooding. Among them, LuSanGeDui, XinHe, DaJinHao, and HaLaBanShen were spatially clustered near the confluence of the Hasuhai drainage canal and the Dahei River, which further flows into the Yellow River, the second-longest river in China. The predicted AUC loss in these four villages is consistent with the in-situ images shown in Figure 1. This spatial pattern suggests that prolonged inundation near river confluence zones may have contributed to substantial crop growth reduction. Since AUC loss is assumed to be closely related to crop damage, village-scale assessment from an early-flooding perspective is expected to provide valuable information for governmental departments and insurance companies to support disaster management, damage assessment, and insurance-related decision-making.

5. Discussion

5.1. AUC Modeling

The basic premise of crop flooding damage assessment in this study is that the AUC of the annual EVI time series can serve as an indirect indicator of actual crop yield loss [19]. However, discrepancies are expected between AUC loss and real yield loss because crop productivity can be affected by crop type, growth stage, management practices, local environmental conditions, and post-flood recovery processes. Although efforts to collect field-based yield ground-truth data were unsuccessful in this study, such information is essential for validating and improving AUC-loss modeling. Therefore, future work should incorporate in-situ yield-loss measurements as ground-truth data to calibrate the relationship between predicted AUC loss and actual yield loss, thereby enabling a more direct and reliable estimation of crop damage.
Both crop growth status and flood duration are key factors controlling final crop damage. In this study, flood duration was not explicitly incorporated into the AUC loss model because the investigated event was dominated by long-duration inundation. Under this condition, the main objective was to examine whether early-flooding-period observations could be used to estimate final crop growth reduction and support early damage assessment. The results suggest that both EVI and SAR backscatter coefficients are important features for modeling AUC loss, indicating the value of integrating optical vegetation information and SAR-derived flood-sensitive signals. This finding further highlights the importance of integrating multi-modal remote sensing data for crop damage assessment [39]. Nevertheless, quantifying crop growth responses under different flood durations remains important for establishing a more general relationship between flooding processes and crop damage. This would require collecting training samples from flood events across different regions worldwide, covering diverse crop types, growth stages, flood intensities, and inundation durations.
The observed bi-cluster pattern in scatter plots of Figure 5 and Figure 6 suggests that separate models could potentially be developed for the affected and unaffected pixel groups. However, this study retained a unified regression framework to enhance its practical applicability, because distinguishing the two groups using predefined thresholds or similar rules would introduce an additional decision step, increase model complexity, and potentially reduce transferability across regions and flood events. Nevertheless, analyzing and modeling the data from a bi-cluster perspective provides a valuable alternative framework and deserves further investigation in future studies.
Regarding model selection, this study considered only tree-based regression algorithms, including RF, XGBoost, LightGBM, CatBoost, and AdaBoost, because of their widespread use and suitability for tabular features. However, more advanced convolutional neural networks (CNNs) and deep neural networks (DNNs) may better characterize the complex relationships among SAR and optical multi-source remote sensing imagery, particularly by exploiting spatial-contextual information and textural changes associated with flood-affected crops. Besides, regarding feature contribution, though some multicollinearity may exist across features, these variables were retained because they capture complementary aspects of flood dynamics and crop physiological responses given that the tree-based models used in this study are generally less sensitive to multicollinearity in terms of predictive performance. Nevertheless, future studies should further examine this issue using feature-selection or dimensionality-reduction approaches.

5.2. AUC Loss Prediction at a Leave-Out Village

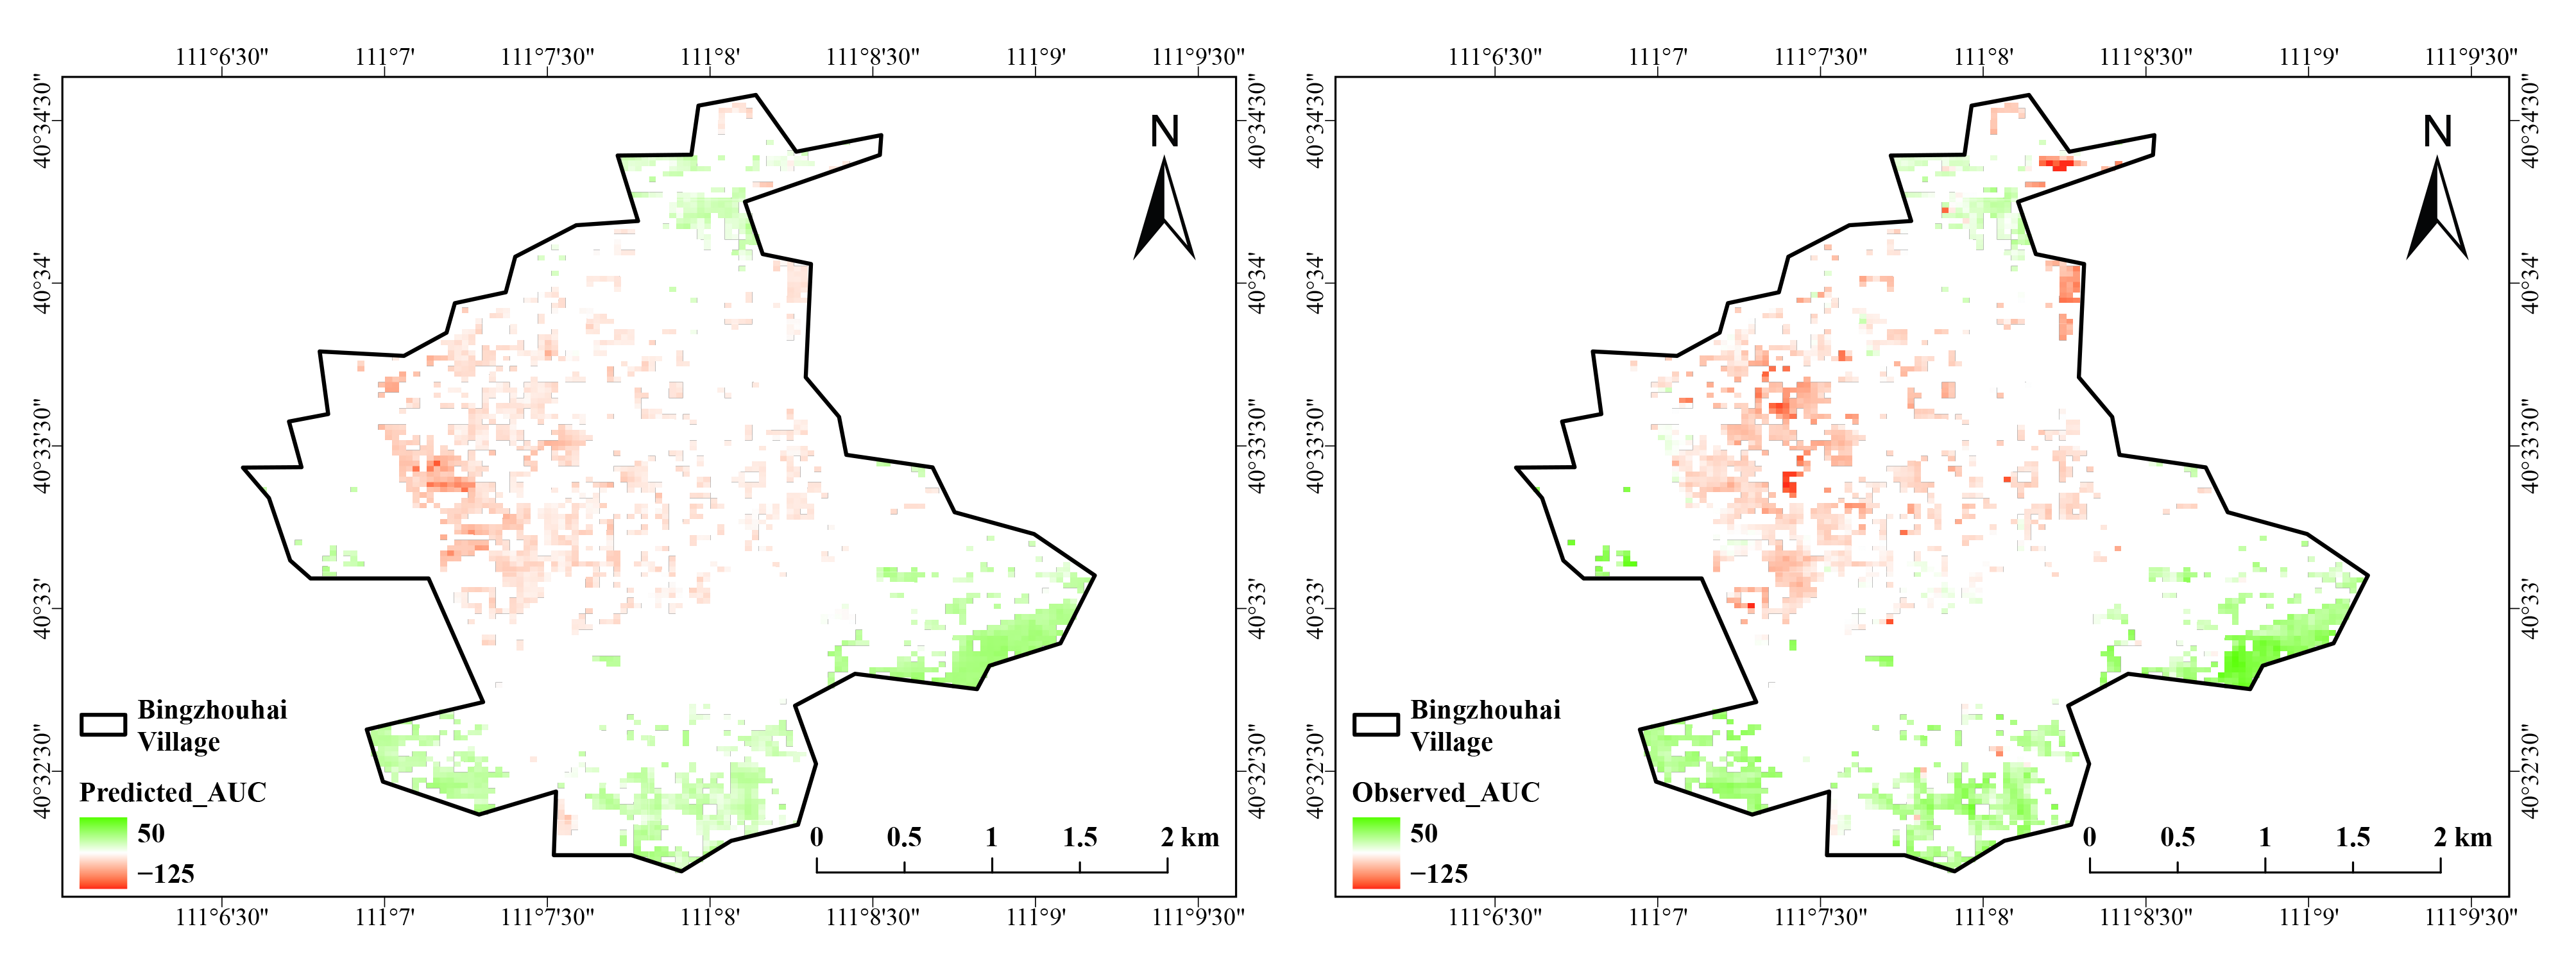
To evaluate the spatial generalizability of the model, Bingzhouhai Village in the Tumed Left County (as marked in Figure 8) was selected as an independent validation area. All data from this village, including observations acquired before and after 15 August 2026, were excluded from the preceding model-training process. The pixel-wise prediction results for Bingzhouhai Village are presented in Figure 10. Overall, the model successfully captured the pixel-level spatial variability in AUC loss, achieving an R 2 of 0.66, an RMSE of 18.54, and an MAE of 13.56. Nevertheless, its predictive performance was relatively limited for pixels with extremely large AUC losses, particularly those with values below 100 . This limitation may be attributed to the small proportion of such extreme samples in the training dataset, which prevented the machine-learning model from adequately learning their characteristics. Future studies incorporating larger study areas and more representative samples, especially samples with severe AUC losses, are expected to improve the model’s ability to predict extreme damage levels.

5.3. Practical Application of AUC Prediction

Although this study demonstrates the feasibility of predicting AUC loss and assessing crop flooding damage using multi-source remote sensing observations from an early-flooding perspective, further work is still needed to develop a robust model for operational applications. First, consistent and well-calibrated remote sensing observations should be incorporated as model inputs. For example, discrepancies in SAR backscatter coefficients may arise among different sensors, particularly when absolute radiometric calibration is unavailable for some SAR datasets. Second, crop heterogeneity, including differences in crop type, growth stage, planting density, and management practices, should be explicitly considered to improve regression performance and model transferability. Third, the uncertainty associated with the AUC-loss-based damage proxy should be systematically evaluated, especially when the model is applied to specific disaster assessment and insurance-related scenarios. Finally, incorporating more case studies from different regions and flood events would be beneficial for improving model robustness and generalization capability, thereby reducing the moderate degree of overfitting observed in the RF model developed in this study.
The results of this study indicate that the village-scale ( R 2 ) values were generally higher than those obtained at the pixel level, likely because spatial aggregation averages out high-frequency pixel-level noise. From an operational application perspective, damage assessment at the crop-field scale may provide more actionable information than the village-scale assessment conducted in this study. To achieve this, field boundary vectors could be collected, or cropland parcels could be segmented using high-resolution remote sensing images [40]. In addition, constructing high-resolution DEMs from stereo optical images could support hydrological analysis of flood evolution, which would help better interpret the spatial patterns of inundation duration, floodwater accumulation, and crop damage [41].

6. Conclusions

This study investigated the feasibility of early quantitative prediction of crop damage under long-duration inundation by integrating multi-source SAR–optical remote sensing observations with Sentinel-2-derived phenological indicators. Using the 2025 flood event in the Tumochuan Plateau, Inner Mongolia, China, as a case study, annual EVI trajectories were reconstructed using Savitzky-Golay (SG) filtering, and the AUC loss between 2025 and the 2022–2024 historical baseline was used as an indirect indicator of flood-induced crop growth reduction. Multi-temporal optical and SAR features acquired during August 2025 were then used to model the relationship between flood-sensitive remote sensing signals and phenology-based AUC loss.
The results show that Sentinel-2-derived AUC loss can effectively characterize the spatial pattern of crop growth suppression caused by long-duration flooding. Optical EVI features from Landsat-8/9 and Sentinel-2 showed relatively strong correlations with AUC loss, while SAR backscatter features provided complementary information on flood inundation conditions. In particular, Lutan-1 L-band SAR exhibited potential advantages in capturing inundation signals beneath crop canopies due to its longer wavelength and stronger penetration capability. The progressive incorporation of SAR features improved the predictive performance of machine learning models, indicating that multi-source SAR observations can enhance the early prediction of flood-induced crop damage when optical observations are limited by cloud contamination or delayed vegetation response.
Among the tested machine learning models, Random Forest generally achieved the best performance, although the differences among different ensemble models were relatively small. The highest pixel-wise R 2 reached 0.62 using early-flood-period features and 0.77 using later-period features, suggesting that later observations more effectively captured accumulated vegetation stress and flood-induced growth reduction. More importantly, the village-scale prediction achieved an R 2 of 0.78 across 122 villages, demonstrating that spatial aggregation can reduce pixel-level noise and improve the reliability of damage assessment. The villages with high predicted AUC loss were mainly distributed near river confluence and drainage-channel areas, showing good agreement with SAR flood signatures, optical vegetation anomalies, Sentinel-2-derived AUC loss, and available post-flood images.
Overall, this study demonstrates that phenology-guided regression using multi-source SAR–optical imagery provides a feasible approach for early crop damage assessment under long-duration inundation. By using annual Sentinel-2 AUC loss as a damage proxy and SAR–optical observations acquired during the flood period as predictive features, the proposed framework reduces dependence on field-based yield-loss measurements and post-event optical observations. The resulting village-scale damage information can provide valuable support for governmental agencies, insurance companies, and agricultural disaster management.
Several limitations remain. First, AUC loss is an indirect indicator of crop damage and may differ from actual yield loss because of crop type, growth stage, management practices, and post-flood recovery processes. Future studies should incorporate in-situ yield-loss observations to calibrate the relationship between AUC loss and real agricultural loss. Second, flood duration was not explicitly modeled in this study because the investigated event was dominated by long-duration inundation. However, considering additional factors related to the flood-crop interactions, like flood duration, terrain, water depth, crop type, and phenological stage, would help improve model transferability across different flooding scenarios. Third, differences in radiometric calibration among SAR sensors may introduce uncertainty into multi-source feature fusion. Future work should include more flood events, better-calibrated SAR datasets, crop-field boundary information, and hydrological constraints to improve the robustness and operational applicability of the proposed framework.

Author Contributions

Conceptualization, H.Z. and B.Z.; methodology, H.Z. and X.Q.; software, X.Q.; validation, S.H. and B.Z.; formal analysis, X.Q.; investigation, H.Z.; resources, S.H.; data curation, S.H. and X.Q.; writing—original draft preparation, H.Z.; writing—review and editing, X.Q.; visualization, S.H.; supervision, B.Z.; project administration, B.Z.; funding acquisition, B.Z. All authors have read and agreed to the published version of the manuscript.

Funding

The research was supported by the National Natural Science Foundation of China (Grant No. 42501415), the Fundamental Research Funds for the Central Universities of China University of Mining and Technology-Beijing (Grant No. 2025XJDC02, 2025ZKPYDC03, and 2026ZKPYDC03), and the China Postdoctoral Science Foundation (Grant No. 2025M780227).

Data Availability Statement

The optical remote sensing imagery and Sentinel-1 SAR data used in this study are openly accessible. Lutan-1 and Gaofen-3 SAR data are available upon reasonable request.

Acknowledgments

The authors would like to thank the providers of the satellite datasets used in this study, including the Landsat-8/9, Sentinel-2, Sentinel-1, Lutan-1, and Gaofen-3 missions. The authors also acknowledge the support from Google Earth Engine for satellite data processing and analysis. We are grateful to the local information sources and field photographs that helped support the interpretation and validation of flood-affected croplands in the study area.

Conflicts of Interest

The authors declare no conflicts of interest.

Abbreviations

The following abbreviations are used in this manuscript:
AdaAdaBoost
AUCArea under the Curve
CatCatBoost
DEMDigital Elevation Model
DOYDay of Year
ESAEuropean Space Agency
EVIEnhanced Vegetation Index
GBDTGradient Boosting Decision Tree
GF3Gaofen-3
LGBMLight Gradient Boosting Machine
LT1Lutan-1
MLMachine Learning
NDVINormalized Difference Vegetation Index
RFRandom Forest
SARSynthetic Aperture Radar
S1Sentinel-1
S2Sentinel-2
SGSavitzky-Golay
XGBXGBoost

References

  1. Liu, W.; Li, S.; Li, C.; Rugenstein, M.; Thomas, A.P. Contrasting fast and slow intertropical convergence zone migrations linked to delayed Southern Ocean warming. Nat. Clim. Change 2024, 14, 732–739. [Google Scholar] [CrossRef]
  2. Zhang, S.; Zhou, L.; Liang, H.; Obulkasim, O.; Dai, Y. Underestimated agricultural losses due to flooding. Sci. Adv. 2026, 12, eaed2754. [Google Scholar] [CrossRef] [PubMed]
  3. Han, J.; Zhang, Z.; Xu, J.; Chen, Y.; Jägermeyr, J.; Cao, J.; Luo, Y.; Cheng, F.; Zhuang, H.; Wu, H.; et al. Threat of low-frequency high-intensity floods to global cropland and crop yields. Nat. Sustain. 2024, 7, 994–1006. [Google Scholar] [CrossRef]
  4. Shrestha, R.M.; Rahman, M.S. Flood monitoring and crop damage assessment. In Agro-Geoinformatics: Theory and Rractice; Springer: Berlin/Heidelberg, Germany, 2021; pp. 321–349. [Google Scholar]
  5. Qiu, J.; Yang, X.; Zheng, Z.; Tarolli, P. High-resolution mapping of China’s flooded croplands. Sci. Bull. 2025, 7, 1165–1173. [Google Scholar] [CrossRef]
  6. Qamer, F.M.; Abbas, S.; Ahmad, B.; Hussain, A.; Salman, A.; Muhammad, S.; Nawaz, M.; Shrestha, S.; Iqbal, B.; Thapa, S. A framework for multi-sensor satellite data to evaluate crop production losses: The case study of 2022 Pakistan floods. Sci. Rep. 2023, 13, 4240. [Google Scholar] [CrossRef] [PubMed]
  7. Tavus, B.; Kocaman, S.; Gokceoglu, C. Flood damage assessment with Sentinel-1 and Sentinel-2 data after Sardoba dam break with GLCM features and Random Forest method. Sci. Total Environ. 2022, 816, 151585. [Google Scholar] [CrossRef] [PubMed]
  8. Wang, J.; Wang, Y.; Li, G.; Qi, Z. Integration of remote sensing and machine learning for precision agriculture: A comprehensive perspective on applications. Agronomy 2024, 14, 1975. [Google Scholar] [CrossRef]
  9. Bofana, J.; Zhang, M.; Wu, B.; Zeng, H.; Nabil, M.; Zhang, N.; Elnashar, A.; Tian, F.; da Silva, J.M.; Botão, A.; et al. How long did crops survive from floods caused by Cyclone Idai in Mozambique detected with multi-satellite data. Remote Sens. Environ. 2022, 269, 112808. [Google Scholar] [CrossRef]
  10. Chen, H.; Liang, Q.; Liang, Z.; Liu, Y.; Xie, S. Remote-sensing disturbance detection index to identify spatio-temporal varying flood impact on crop production. Agric. For. Meteorol. 2019, 269, 180–191. [Google Scholar] [CrossRef]
  11. Miao, S.; Zhao, Y.; Huang, J.; Li, X.; Wu, R.; Su, W.; Zeng, Y.; Guan, H.; Abd Elbasit, M.A.; Zhang, J. A comprehensive evaluation of flooding’s effect on crops using satellite time series data. Remote Sens. 2023, 15, 1305. [Google Scholar] [CrossRef]
  12. Liu, R.; Dong, J.; Ge, Y.; Lin, H.; Che, X.; Di, Y.; Chen, X.; Qi, S.; Ding, M.; Xiao, X.; et al. Tracking paddy rice acreage, flooding impacts, and mitigations during El Niño flooding events using Sentinel-1/2 imagery and cloud computing. ISPRS J. Photogramm. Remote Sens. 2024, 217, 165–178. [Google Scholar] [CrossRef]
  13. Lateef, L.O.; Costa, H.; Cabral, P. Improved integrated framework for flooded crop damage and recovery assessment: A multi-source earth observation and participatory mapping in Hadejia, Nigeria. J. Environ. Manag. 2025, 384, 125542. [Google Scholar] [CrossRef]
  14. Bocchino, F.; Belloni, V.; Ravanelli, R.; Zaccarini, C.; Crespi, M.; Lindenbergh, R. Crop flood damage assessment integrating Sentinel-2 imagery and in situ data: The 2023 Emilia-Romagna case. Remote Sens. Appl. Soc. Environ. 2025, 2025, 101852. [Google Scholar]
  15. Srivastava, H.; Rajesh, C.; Shankar, M. Feasibility of Temporal Monitoring of Flood Inundated Areas and Crop Damage Assessment using Multi- polarised Temporal SAR Data without any Ground Truth Campaign. J. Remote Sens. GIS 2020, 11, 35–44. [Google Scholar]
  16. Rezk, N.G.; Attia, A.F.; El-Rashidy, M.A.; El-Sayed, A.; Hemdan, E.E.D. An efficient IoT-based crop damage prediction framework in smart agricultural systems. Sci. Rep. 2025, 15, 27742. [Google Scholar] [CrossRef] [PubMed]
  17. Wen, C.; Sun, Z.; Li, H.; Han, Y.; Gunasekera, D.; Chen, Y.; Zhang, H.; Zhao, X. Flood Mapping and Assessment of Crop Damage Based on Multi-Source Remote Sensing: A Case Study of the “7.27” Rainstorm in Hebei Province, China. Remote Sens. 2025, 17, 904. [Google Scholar] [CrossRef]
  18. Zhang, M.; Liu, D.; Wang, S.; Xiang, H.; Zhang, W. Multisource remote sensing data-based flood monitoring and crop damage assessment: A case study on the 20 July 2021 extraordinary rainfall event in Henan, China. Remote Sens. 2022, 14, 5771. [Google Scholar] [CrossRef]
  19. Shrestha, R.; Di, L.; Eugene, G.Y.; Kang, L. Regression model to estimate flood impact on corn yield using MODIS NDVI and USDA cropland data layer. J. Integr. Agric. 2017, 16, 398–407. [Google Scholar] [CrossRef]
  20. Duan, K.; Vrieling, A.; Schlund, M.; Nidumolu, U.B.; Ratcliff, C.; Collings, S.; Nelson, A. Detection and attribution of cereal yield losses using Sentinel-2 and weather data: A case study in South Australia. ISPRS J. Photogramm. Remote Sens. 2024, 213, 33–52. [Google Scholar] [CrossRef]
  21. Dong, S.; Liu, B.; Chen, Y.; Ma, M.; Liu, X.; Wang, C. Hydro-geochemical control of high arsenic and fluoride groundwater in arid and semi-arid areas: A case study of Tumochuan Plain, China. Chemosphere 2022, 301, 134657. [Google Scholar] [CrossRef] [PubMed]
  22. Hersbach, H.; Bell, B.; Berrisford, P.; Hirahara, S.; Horányi, A.; Muñoz-Sabater, J.; Nicolas, J.; Peubey, C.; Radu, R.; Schepers, D.; et al. The ERA5 global reanalysis. Q. J. R. Meteorol. Soc. 2020, 146, 1999–2049. [Google Scholar] [CrossRef]
  23. Muñoz-Sabater, J.; Dutra, E.; Agustí-Panareda, A.; Albergel, C.; Arduini, G.; Balsamo, G.; Boussetta, S.; Choulga, M.; Harrigan, S.; Hersbach, H.; et al. ERA5-Land: A state-of-the-art global reanalysis dataset for land applications. Earth Syst. Sci. Data 2021, 13, 4349–4383. [Google Scholar] [CrossRef]
  24. Zhu, M.; Zhu, D.; Huang, M.; Gong, D.; Li, S.; Xia, Y.; Lin, H.; Altan, O. Assessing the impact of climate change on the landscape stability in the Mediterranean world heritage site based on multi-sourced remote sensing data: A case study of the causses and cévennes, France. Remote Sens. 2025, 17, 203. [Google Scholar] [CrossRef]
  25. Zeng, L.; Wardlow, B.D.; Xiang, D.; Hu, S.; Li, D. A review of vegetation phenological metrics extraction using time-series, multispectral satellite data. Remote Sens. Environ. 2020, 237, 111511. [Google Scholar] [CrossRef]
  26. Somvanshi, S.S.; Kumari, M. Comparative analysis of different vegetation indices with respect to atmospheric particulate pollution using sentinel data. Appl. Comput. Geosci. 2020, 7, 100032. [Google Scholar] [CrossRef]
  27. Salinero-Delgado, M.; Estévez, J.; Pipia, L.; Belda, S.; Berger, K.; Paredes Gómez, V.; Verrelst, J. Monitoring cropland phenology on Google Earth Engine using gaussian process regression. Remote Sens. 2021, 14, 146. [Google Scholar] [CrossRef]
  28. Roerink, G.; Menenti, M.; Verhoef, W. Reconstructing cloudfree NDVI composites using Fourier analysis of time series. Int. J. Remote Sens. 2000, 21, 1911–1917. [Google Scholar] [CrossRef]
  29. Li, S.; Xu, L.; Jing, Y.; Yin, H.; Li, X.; Guan, X. High-quality vegetation index product generation: A review of NDVI time series reconstruction techniques. Int. J. Appl. Earth Obs. Geoinf. 2021, 105, 102640. [Google Scholar] [CrossRef]
  30. Chen, J.; Jönsson, P.; Tamura, M.; Gu, Z.; Matsushita, B.; Eklundh, L. A simple method for reconstructing a high-quality NDVI time-series data set based on the Savitzky–Golay filter. Remote Sens. Environ. 2004, 91, 332–344. [Google Scholar] [CrossRef]
  31. Muhammad, A.; Mashori, A.S.; Jan, M.; Han, Z.; Li, F.; Jan, S.; Shah, S.A. A review of remote sensing-based crop yield estimation: Machine learning techniques and environmental, algorithmic, and hardware limitations. Front. Plant Sci. 2026, 17, 1742689. [Google Scholar] [CrossRef] [PubMed]
  32. Li, M.; Yan, Y. Comparative analysis of machine-learning models for soil moisture estimation using high-resolution remote-sensing data. Land 2024, 13, 1331. [Google Scholar] [CrossRef]
  33. Shawon, S.M.; Ema, F.B.; Mahi, A.K.; Niha, F.L.; Zubair, H. Crop yield prediction using machine learning: An extensive and systematic literature review. Smart Agric. Technol. 2025, 10, 100718. [Google Scholar] [CrossRef]
  34. Akossou, A.; Palm, R. Impact of data structure on the estimators R-square and adjusted R-square in linear regression. Int. J. Math. Comput. 2013, 20, 84–93. [Google Scholar]
  35. Carneiro, F.M.; de Brito Filho, A.L.; Ferreira, F.M.; Junior, G.d.F.S.; Brandão, Z.N.; da Silva, R.P.; Shiratsuchi, L.S. Soil and satellite remote sensing variables importance using machine learning to predict cotton yield. Smart Agric. Technol. 2023, 5, 100292. [Google Scholar] [CrossRef]
  36. Lundberg, S.M.; Erion, G.; Chen, H.; DeGrave, A.; Prutkin, J.M.; Nair, B.; Katz, R.; Himmelfarb, J.; Bansal, N.; Lee, S.I. From local explanations to global understanding with explainable AI for trees. Nat. Mach. Intell. 2020, 2, 56–67. [Google Scholar] [CrossRef] [PubMed]
  37. Martinis, S.; Rieke, C. Backscatter analysis using multi-temporal and multi-frequency SAR data in the context of flood mapping at River Saale, Germany. Remote Sens. 2015, 7, 7732–7752. [Google Scholar] [CrossRef]
  38. Guan, H.; Huang, J.; Li, L.; Li, X.; Miao, S.; Su, W.; Ma, Y.; Niu, Q.; Huang, H. Improved Gaussian mixture model to map the flooded crops of VV and VH polarization data. Remote Sens. Environ. 2023, 295, 113714. [Google Scholar] [CrossRef]
  39. Karmakar, P.; Teng, S.W.; Murshed, M.; Pang, S.; Li, Y.; Lin, H. Crop monitoring by multimodal remote sensing: A review. Remote Sens. Appl. Soc. Environ. 2024, 33, 101093. [Google Scholar] [CrossRef]
  40. Jiang, W.; Sun, Y.; Lei, L.; Kuang, G.; Ji, K. AdaptVFMs-RSCD: Advancing Remote Sensing Change Detection from binary to semantic with SAM and CLIP. ISPRS J. Photogramm. Remote Sens. 2025, 230, 304–317. [Google Scholar] [CrossRef]
  41. Li, M.; Zhang, T.; Tu, Y.; Ren, Z.; Xu, B. Monitoring Post-Flood Recovery of Croplands Using the Integrated Sentinel-1/2 Imagery in the Yangtze-Huai River Basin. Remote Sens. 2022, 14, 690. [Google Scholar] [CrossRef]
Figure 1. Study area overview: (a) Location of the study area, outlined by the red polygon, in Inner Mongolia, China, with terrain variation as the background; (b) enlarged view of the study area across Tumed Right, Tumed Left, and Togtoh counties; and (c) spatial distribution of 123 villages within the study area, shown in black, overlaid on the GF-3 SAR backscatter image acquired on 2 August 2025. For some heavily affected villages highlighted in yellow, pre-flood Google Earth images and post-flood images collected from online sources are shown as inset non-map panels.
Remotesensing 18 02481 g001
Figure 2. Data processing flow of the study.
Remotesensing 18 02481 g002
Figure 3. Multi-temporal SAR–optical observations and AUC-based indicators over the study area during the early flooding period: (a) Landsat EVI on 5 August 2025; (b) Sentinel-2 EVI on 5 August 2025; (c) Lutan-1 SAR image on 2 August 2025; (d) Gaofen-3 SAR image on 2 August 2025; (e) Sentinel-1 SAR image on 16 August 2025; (f) AUC loss; (g) AUC standard deviation during 2022–2024; and (h) histogram of the AUC standard deviation during 2022–2024.
Remotesensing 18 02481 g003aRemotesensing 18 02481 g003b
Figure 4. Scatter plot and correlation among SAR and optical features over the study area.
Remotesensing 18 02481 g004
Figure 5. Pixel-wise scatter plots between Sentinel-2-observed AUC loss and predicted AUC loss using features acquired during the early flooding period. The upper panel presents the prediction results based only on optical observations, whereas the right panel presents the results based on combined SAR–optical features.
Remotesensing 18 02481 g005
Figure 6. Pixel-wise scatter plots between Sentinel-2-observed AUC loss and predicted AUC loss using features acquired during the later flooding period.
Remotesensing 18 02481 g006
Figure 7. Distribution of feature importance based on the SHAP analysis.
Remotesensing 18 02481 g007
Figure 8. Predicted AUC loss potential based on the early-flooding-period SAR–optical dataset acquired between 1 August 2025 and 15 August 2025, with the 13 most affected villages highlighted in red.
Remotesensing 18 02481 g008
Figure 9. Scatter plot of predicted AUC values against Sentinel-2-derived true values for the 122 study villages. Each point represents one village.
Remotesensing 18 02481 g009
Figure 10. Predicted and observed AUC-loss maps for independent spatial validation of the model in Bingzhouhai Village using observations acquired from 1 August 2025 and 15 August 2025.
Remotesensing 18 02481 g010
Table 1. Historical climatic conditions of the study area in recent years.
YearT (°C)P (mm)P7,8 (mm)R (MJ/m2)H (%)
20228.39516.37326.5516.9842.98
20238.91333.15119.9616.7842.50
20249.24719.86257.7515.8350.25
20258.13838.43568.0216.2249.25
Note: MJ (i.e., megajoule) is a metric unit of energy, and 1 MJ equals to 106 J (i.e., joules).
Table 2. Multi-source satellite datasets used in this study.
SensorAcronymeBandImage DatesResolutionMain Use
Sentinel-2S2Optical2025 relative to 2022–202410 mPhenology-based AUC loss
Sentinel-2S2Optical5 August 2025, 20 August 2025, 25 August 202510 mVegetation growth
Landsat-8/9LandsatOptical5 August 2025, 13 August 2025, 22 August 2025, 30 August 202530 mVegetation growth
Sentinel-1S1C-band SAR16 August 2025, 28 August 202510 mSAR features
LuTan-1LT1L-band SAR2 August 2025, 30 August 20253 mSAR features
GaoFen-3GF3C-band SAR2 August 2025, 9 August 2025, 31 August 20253 mSAR features
Table 3. Hyperparameters settings for different ML regression models.
ModelHyperparameterCandidate Value Range
RFn_estimators100–800
max_depth5–30
min_samples_split2–20
min_samples_leaf1–20
max_features0.5–1.0
XGBn_estimators200–1000
learning_rate0.005–0.15
max_depth5–12
min_child_weight1–20
subsample0.6–1.0
colsample_bytree0.6–1.0
gamma 10 8 –1.0
reg_alpha 10 5 –5.0
reg_lambda0.1–10.0
LGBMn_estimators200–1000
num_leaves31–150
max_depth5–12
min_child_samples5–100
learning_rate0.005–0.15
subsample0.6–1.0
colsample_bytree0.6–1.0
reg_alpha 10 5 –5.0
reg_lambda0.1–10.0
Catiterations200–1000
depth4–10
learning_rate0.005–0.15
l2_leaf_reg1.0–10.0
Adabase_depth3–8
n_estimators50–400
learning_rate0.01–1.0
losslinear, square
Table 4. R 2 scores across ML models using SAR and/or optical features before and after 15 August 2025, with values separated by slashes.
Model[Landsat][Landsat, S2][Landsat, S2, S1][Landsat, S2, S1, LT1][Landsat, S2, S1, LT1, GF3]
RF0.54/0.690.56/0.740.57/0.750.60/0.760.62/0.77
XGBoost0.51/0.680.56/0.720.58/0.730.60/0.750.63/0.76
LightGBM0.54/0.690.56/0.720.57/0.730.60/0.750.62/0.76
CatBoost0.54/0.690.57/0.720.58/0.730.60/0.750.62/0.76
AdaBoost0.54/0.690.56/0.700.57/0.710.58/0.720.59/0.72
Table 5. Optimal RF Model Hyperparameters Identified Using Optuna for Different Sensor Feature Combinations.
Parameter[Landsat][Landsat, S2][Landsat, S2, S1][Landsat, S2, S1, LT1][Landsat, S2, S1, LT1, GF3]
n_estimators 400/250550/450500/550600/450600/500
max_depth11/1315/2016/2720/2825/29
min_samples_split10/133/34/46/23/3
min_samples_leaf16/1614/11/12/12/1
max_features0.99/0.760.99/0.550.63/0.580.76/0.630.53/0.85
Disclaimer/Publisher’s Note: The statements, opinions and data contained in all publications are solely those of the individual author(s) and contributor(s) and not of MDPI and/or the editor(s). MDPI and/or the editor(s) disclaim responsibility for any injury to people or property resulting from any ideas, methods, instructions or products referred to in the content.