1. Introduction
Terrestrial water storage (TWS) represents the vertically integrated amount of water stored above and below the land surface, including surface water, soil moisture, groundwater, snow and ice, and canopy water storage. TWSA denotes the deviation of TWS from a specified long-term mean, thereby providing an integrated measure of changes in the terrestrial water cycle. Through its coupling with evapotranspiration, runoff generation, infiltration, and groundwater recharge, TWSA plays a central role in regulating land–atmosphere interactions, water-resource availability, ecosystem stability, and hydroclimatic extremes such as droughts and floods. As climate change and human activities continue to intensify, understanding the long-term evolution of TWSA has become increasingly important for diagnosing hydrological responses to environmental change and for supporting sustainable water-resource management [
1,
2,
3,
4].
The launch of the Gravity Recovery and Climate Experiment (GRACE) and its successor mission, GRACE Follow-On (GRACE-FO), has revolutionized large-scale monitoring of terrestrial water storage by enabling direct observation of time-variable gravity signals associated with mass redistribution on Earth [
5]. Over the past two decades, extensive efforts have been devoted to improving the reliability of GRACE-derived TWSA products through destriping algorithms, leakage correction, scaling approaches, and mascon solutions [
6,
7,
8,
9,
10]. These developments have substantially enhanced the capability of satellite gravimetry to detect groundwater depletion, drought evolution, flood impacts, and long-term hydrological change. Nevertheless, the GRACE/GRACE-FO observational period remains relatively short for investigating low-frequency hydroclimatic variability and long-term regime transitions. This limitation constrains the ability to distinguish persistent trends from decadal oscillations and episodic extremes. To address this issue, recent studies have increasingly focused on reconstructing long-term TWSA records using machine-learning approaches and multi-source hydroclimatic datasets. In particular, the GTWS-MLrec dataset developed by Yin et al. [
11] extends monthly TWSA back to 1940 and demonstrates strong consistency with GRACE observations, thereby providing a valuable basis for investigating long-term terrestrial water storage variability and its potential drivers.
At the global scale, previous studies have identified pronounced TWSA changes in many regions worldwide, driven by the combined influences of climate variability and anthropogenic activities. Climatic factors such as precipitation variability, evaporative demand, and drought conditions often interact with irrigation, groundwater abstraction, reservoir regulation, urbanization, and land-cover change to shape regional water-storage evolution [
12,
13,
14,
15,
16]. In parallel, hydrological models and gridded observational or reanalysis products, including GLDAS, MERRA-2, GPCP, and CRU, provide key inputs for water-balance analyses involving precipitation, evapotranspiration, runoff, and soil moisture [
17,
18,
19,
20]. More recently, Lu et al. [
21] integrated multiple TWSA datasets, uncertainty assessments, and trend-consistency constraints to identify global hotspots of significant TWSA change during 1982–2019 and quantified the relative contributions of different driving factors using an elasticity-based framework. These studies collectively highlight that terrestrial water storage change is rarely controlled by a single process, but instead emerges from the interaction of multiple climatic and anthropogenic drivers operating across different spatial and temporal scales.
China represents one of the most complex regions globally for investigating TWSA evolution because of its strong climatic gradients, monsoon-dominated hydroclimate, heterogeneous topography, active cryospheric processes, and intensive human intervention. Previous studies have reported substantial terrestrial water losses over the North China Plain, primarily associated with long-term groundwater abstraction [
22]. In the middle and lower Yangtze River basin, lake and water-storage variability are strongly affected by hydroclimatic variability, whereas the contribution of Three Gorges Dam regulation to the reported decadal lake decline was comparatively limited [
23]. Over the Tibetan Plateau and surrounding regions, glacier retreat, permafrost degradation, and lake expansion jointly contribute to highly complex cryosphere–hydrology interactions [
24,
25,
26]. Research on TWSA in China has gradually evolved from regional case studies toward broader national-scale assessments. Early studies mainly relied on GRACE observations to characterize groundwater depletion and terrestrial water loss in water-stressed regions, particularly the North China Plain, thereby demonstrating the applicability of satellite gravimetry for hydrological monitoring in China [
27]. With the continuous accumulation of satellite observations and improvements in retrieval techniques, subsequent studies began to systematically investigate the spatial and temporal characteristics of TWSA across China and explored potential controls related to precipitation variability, land-surface processes, and hydrological dynamics [
28]. More recently, increasing attention has been devoted to attribution analysis by integrating GRACE observations with groundwater datasets, meteorological variables, hydrological models, and human water-use information to separate the relative contributions of climate change and anthropogenic forcing [
29,
30]. Meanwhile, the emergence of GRACE–GRACE-FO merged products and machine-learning-based reconstructions has further enabled investigations of long-term TWSA evolution beyond the relatively short satellite observation period [
31].
Multidimensional hotspot assessment is not a newly developed concept. Diffenbaugh and Giorgi [
32] established an SED-based framework that integrates multiple dimensions of seasonal temperature and precipitation change within a unified hotspot metric. Turco et al. [
33] subsequently applied a related framework to observational data to examine changes in climatic means, variability, and extremes. More recent studies have further investigated the temporal evolution of climate hotspots and the influence of seasonal structure on composite hotspot patterns [
34,
35]. In hydrological research, composite indicators and multi-dataset approaches have also been used to identify regions undergoing pronounced water-resource change. For example, Lu et al. [
21] identified global hotspots of significant TWSA trends and examined their potential climatic and anthropogenic drivers using multiple datasets and trend-consistency constraints. These studies demonstrate that integrating multiple statistical dimensions into hotspot assessment is already well established in both climate and hydrological research.
Nevertheless, the systematic application of this multidimensional concept to long-term TWSA change across China remains comparatively limited. Existing national- and basin-scale studies have primarily examined long-term TWSA trends, regional variability, groundwater depletion, and climatic or anthropogenic influences, with these characteristics generally evaluated separately [
27,
28,
29,
30,
31]. Climate-hotspot studies have focused mainly on temperature and precipitation, whereas existing TWSA-hotspot assessments have largely emphasized the locations, consistency, and possible drivers of long-term storage trends [
21,
32,
33,
34,
35]. Consequently, it remains insufficiently understood how changes in seasonal TWSA mean state, detrended interannual variability, and the occurrence of historically unprecedented wet and dry conditions are spatially combined across China. It is also unclear whether river basins with comparable long-term TWSA trends exhibit similar or distinct q-value structures among the selected component indicators.
The four indicators used in this study were selected as parsimonious descriptors of complementary statistical dimensions of TWSA change. Mean-state change represents the shift in the central storage condition between the two climatological periods. The change in the standard deviation of detrended seasonal TWSA characterizes changes in interannual variability after removing the influence of the long-term linear trend. Wet- and dry-extreme frequencies describe changes in the occurrence of seasonal TWSA values exceeding the historical upper and lower bounds of the baseline period, respectively. Collectively, the four indicators represent changes in the central state, dispersion, upper tail, and lower tail of the seasonal TWSA distribution. Seasonality is explicitly retained by calculating each indicator separately for DJF, MAM, JJA, and SON before their integration within the SED framework. These indicators are not intended to provide an exhaustive representation of all hydrological characteristics or physical processes involved in terrestrial water-storage change. Properties such as persistence, temporal autocorrelation, recovery rate, groundwater-recharge dynamics, and within-season variability are not explicitly represented. Some of these characteristics require event-based definitions, higher-frequency observations, or additional groundwater and hydrological-process datasets. Accordingly, the constructed SED index should be interpreted as a multidimensional statistical measure of changes in selected TWSA characteristics rather than as a complete representation of hydrological hotspot-formation processes.
The present study therefore adapts, rather than develops, the established multidimensional SED framework for the analysis of reconstructed TWSA across China during 1961–2020. Specifically, this study aims to: (1) characterize spatial and seasonal changes in TWSA mean state, detrended interannual variability, and wet- and dry-extreme occurrence; (2) integrate these component indicators to identify regions in which multiple statistical dimensions of TWSA change are spatially concentrated; (3) evaluate the sensitivity of the resulting hotspot patterns to the reconstruction product and normalization scheme; (4) characterize basin-scale differences in the q-value structures and spatial associations between SED and its component indicators. The contribution of this study therefore lies in the domain-specific application, robustness assessment, and regional synthesis of an established multidimensional framework, rather than in the development of a new hotspot methodology or the causal attribution of physical hydrological processes.
3. Results
3.1. Spatial Patterns of Long-Term TWSA Trends
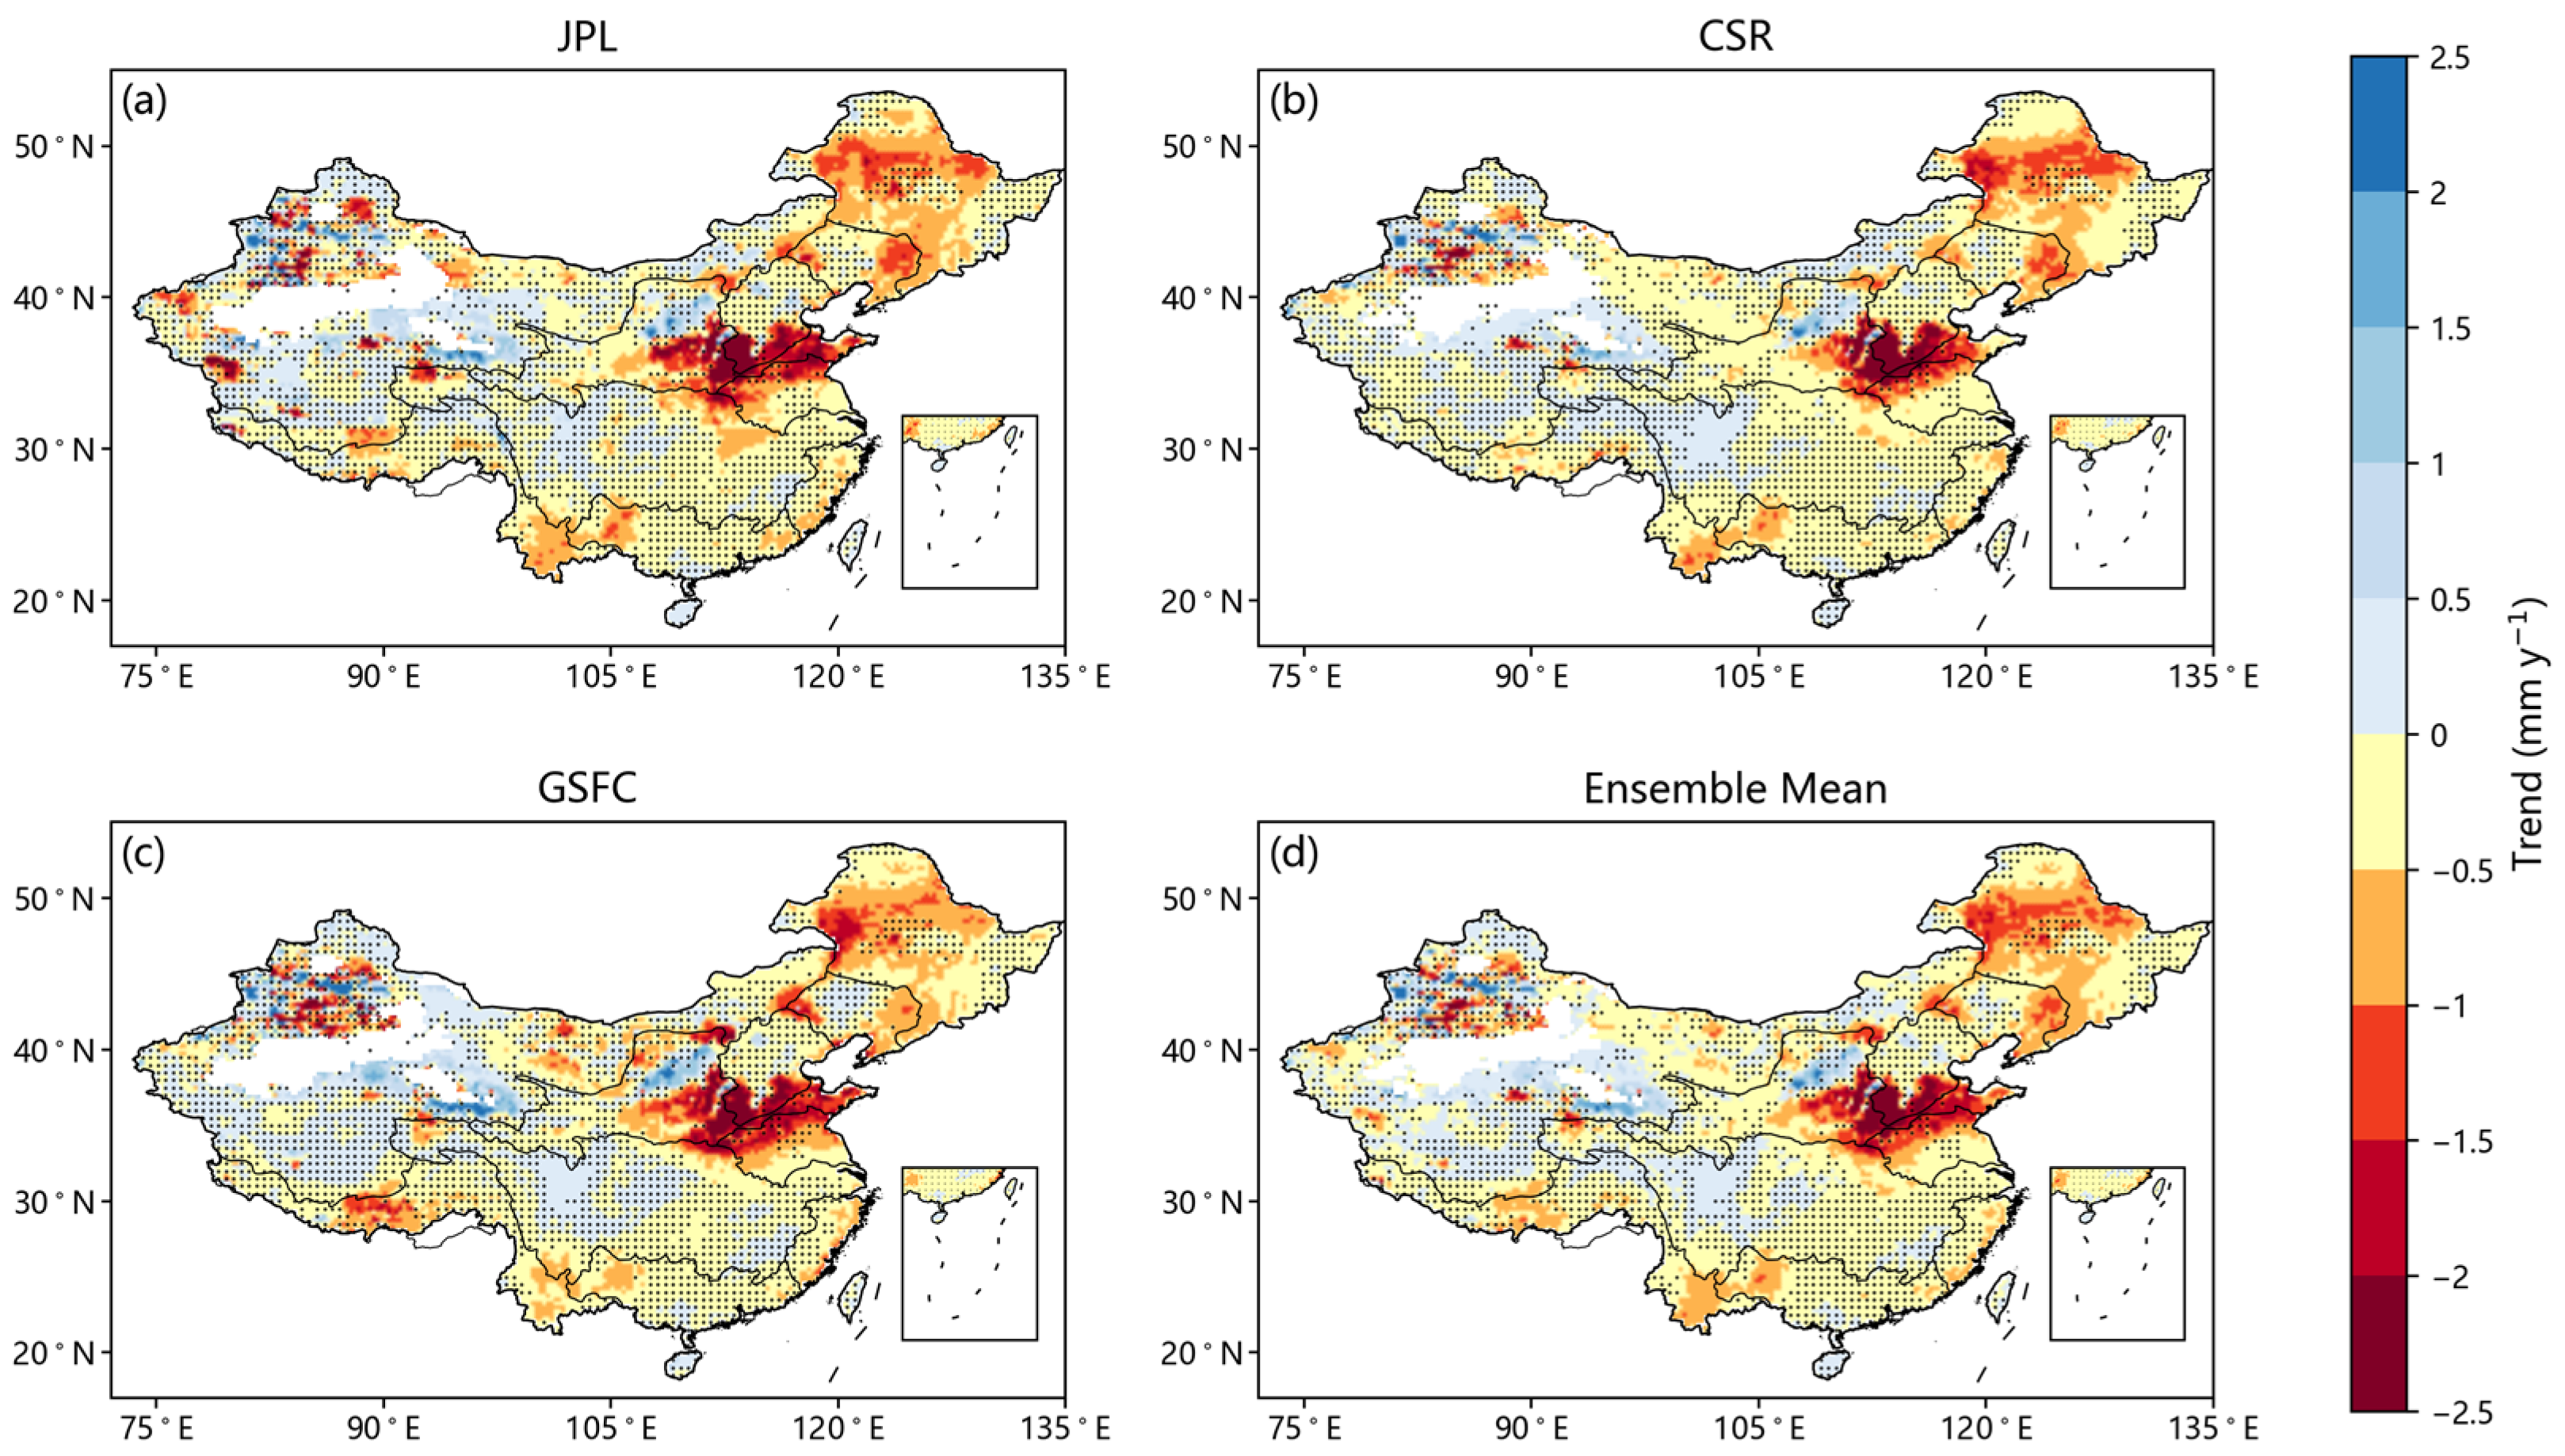
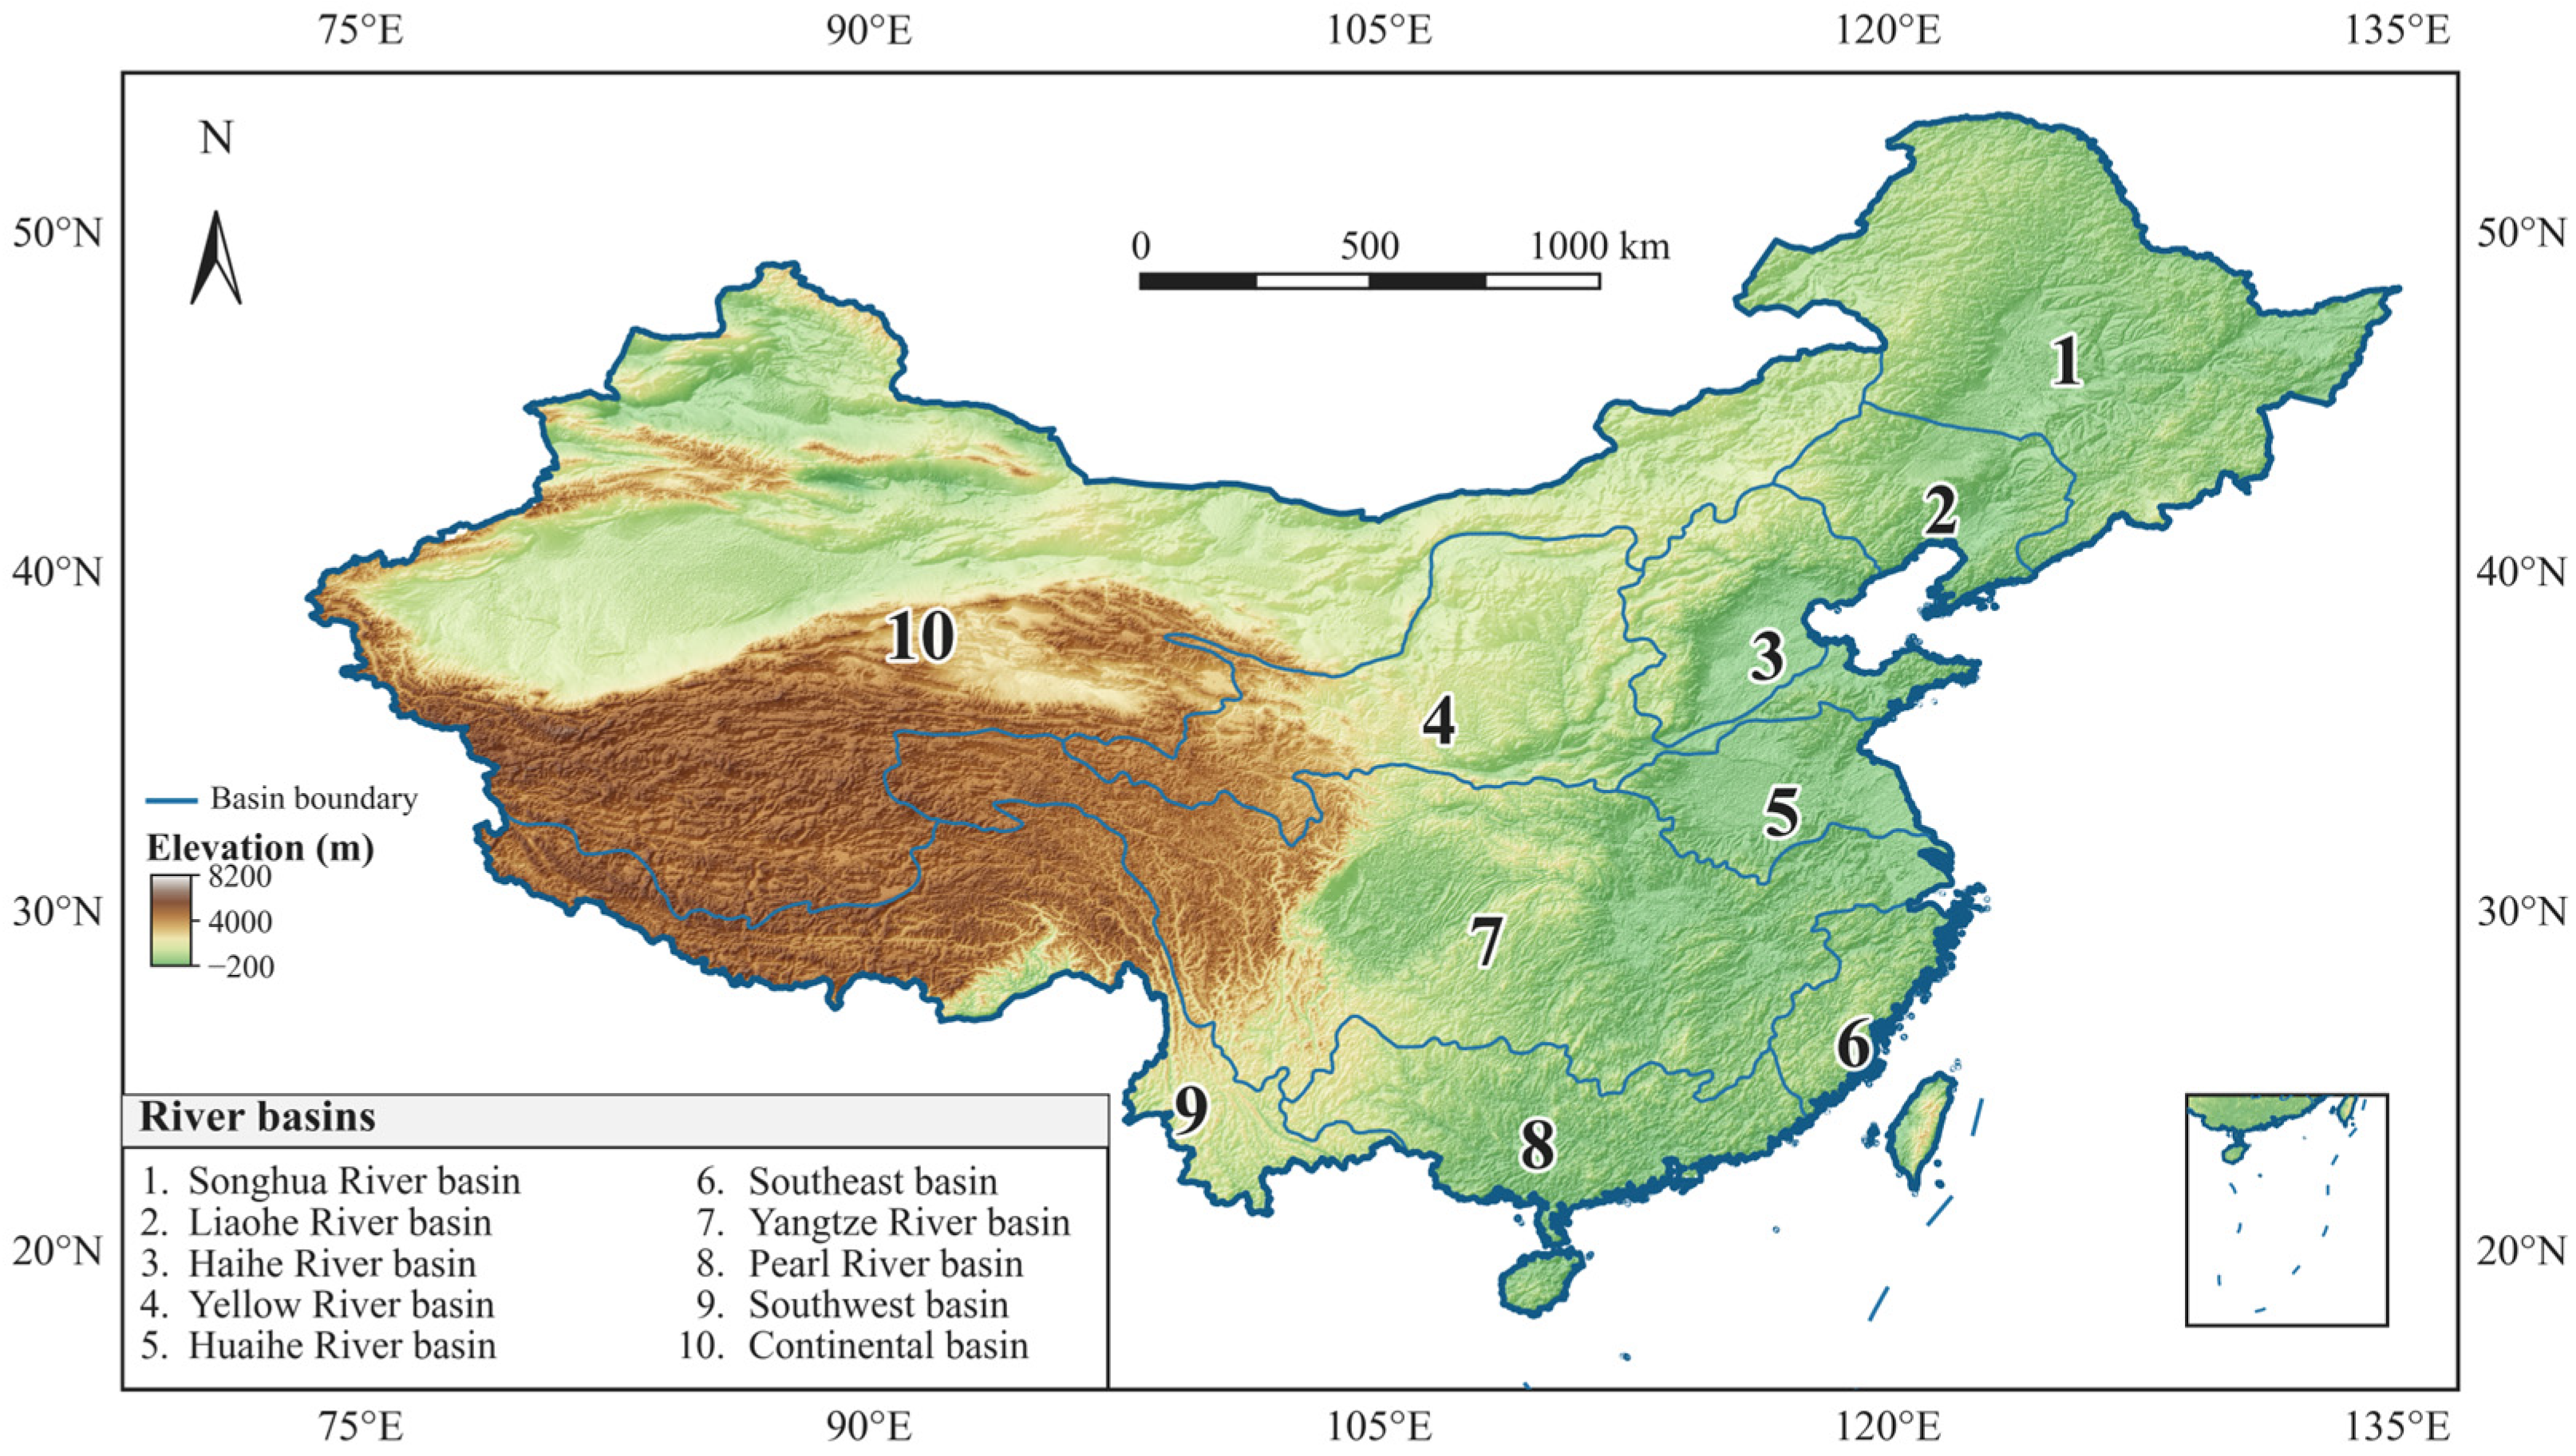
Figure 2 presents the spatial distribution of linear TWSA trends derived from the three GTWS-MLrec reconstructions (JPL, CSR, and GSFC) and their ensemble mean during the study period. Overall, the three reconstructions exhibit a high degree of consistency in both trend direction and large-scale spatial structure, indicating that the principal large-scale patterns are consistently reproduced across the three mascon-based reconstructions. Although some local differences are evident, particularly in regions characterized by complex topography and relatively strong interannual variability, the principal patterns are remarkably similar among the three products. A prominent feature shared by all reconstructions is the extensive decline in terrestrial water storage across northern China. The strongest negative trends are concentrated within the Hai River Basin (HRB), Huai River Basin (HHRB), and the lower reaches of the Yellow River Basin (YRB), forming a coherent center of persistent water-storage loss extending across the North China Plain (
Figure 2d). Beyond this core region, widespread negative trends are also observed in parts of the Liao River Basin (LRB) and Songhua River Basin (SRB), suggesting that long-term terrestrial water storage reduction extends across much of northern and northeastern China. Compared with the individual reconstructions, the ensemble mean exhibits enhanced spatial coherence and reduces small-scale noise, thereby providing a clearer depiction of the dominant trend pattern.
In contrast, TWSA changes in southern and western China exhibit substantially greater spatial heterogeneity. The Continental Basin (CB) is characterized primarily by weak trends or localized increases in terrestrial water storage, particularly in parts of northwestern China. Similarly, the Southwest River Basin (SWB) displays a mosaic of positive and negative trends, reflecting the complex hydrological conditions associated with mountainous terrain and the Tibetan Plateau. In the Yangtze River Basin (YZRB), Southeast River Basin (SEB), and Pearl River Basin (PRB), long-term trends are generally weaker and spatially fragmented compared with those observed in northern China. Viewed within the ten-basin framework, the results reveal pronounced regional contrasts in the magnitude and spatial organization of TWSA trends across China. Rather than exhibiting a uniform national-scale response, terrestrial water storage changes show distinct hydrogeographical patterns among different basin systems. This spatial heterogeneity indicates that long-term TWSA change cannot be fully characterized by trend magnitude alone and supports the use of a multidimensional framework that also considers interannual variability and wet- and dry-event frequencies.
3.2. Spatial and Seasonal Variations in TWSA Indicators
To move beyond the trend-based perspective presented in
Figure 2,
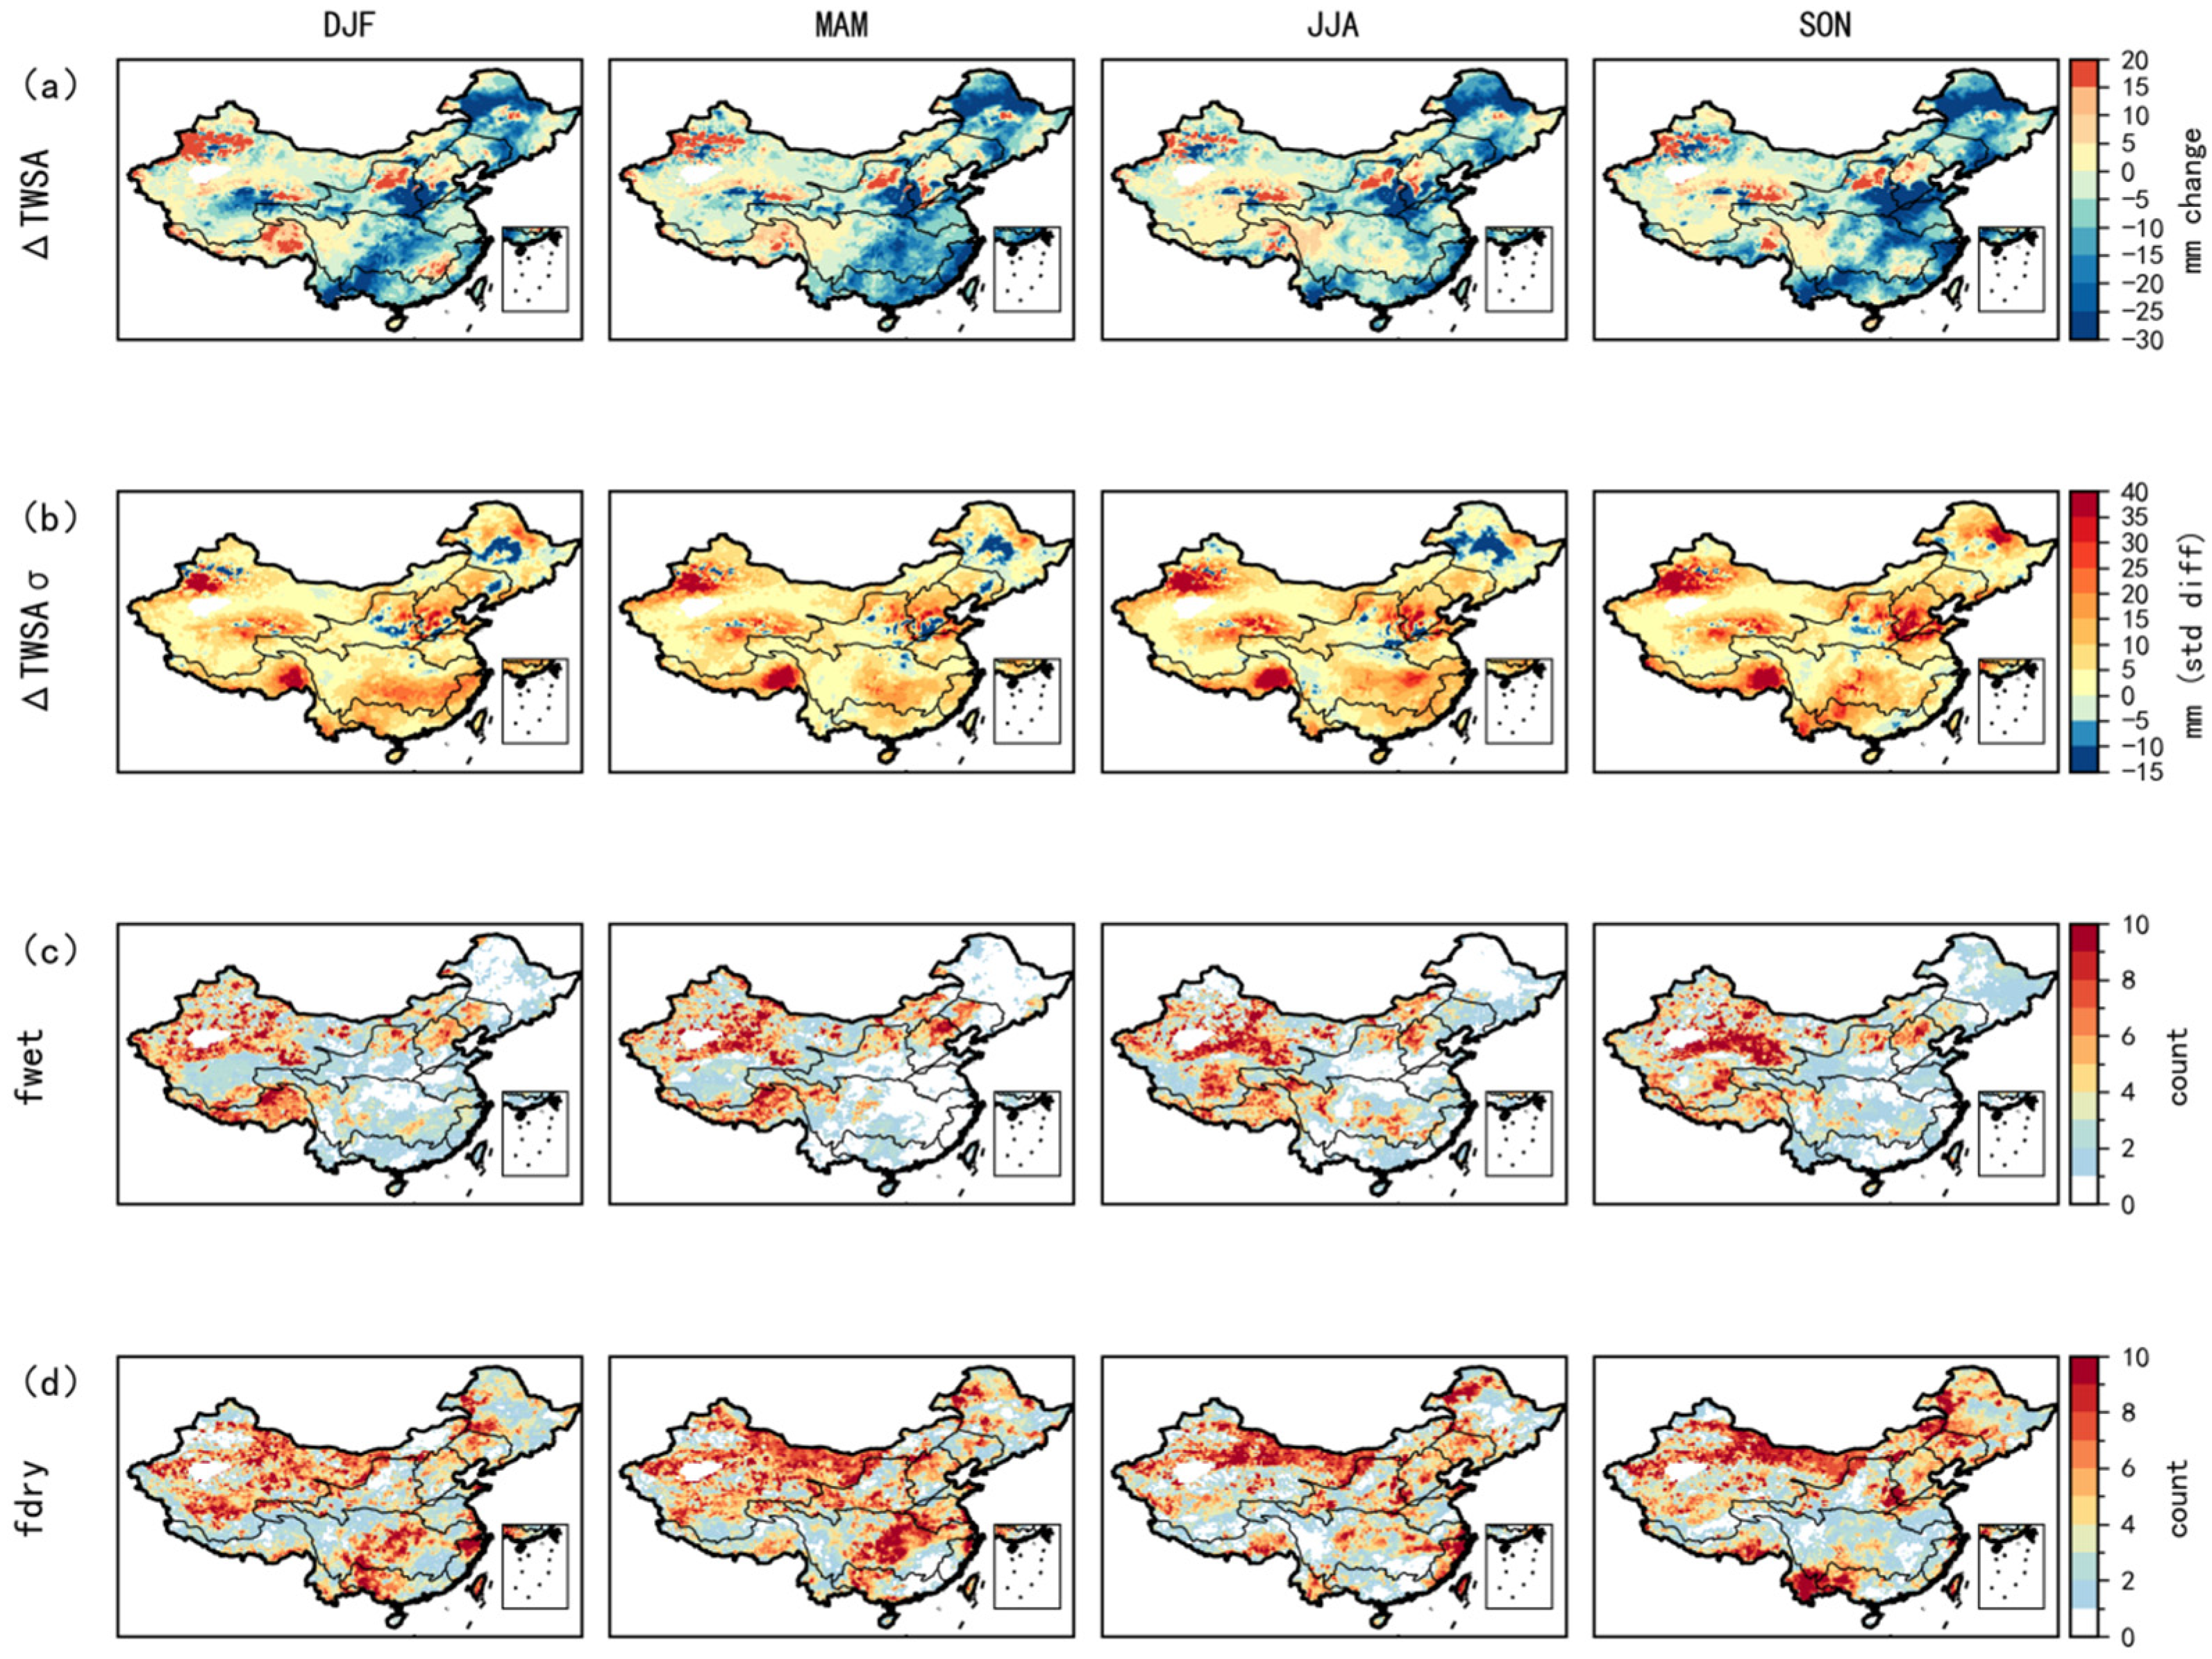
Figure 3 examines four complementary indicators describing changes in the mean state, interannual variability, and extreme-event frequency of TWSA between 1961 and 1990 as well as 1991 and 2020. Together, these indicators reveal that long-term terrestrial water storage change across China is inherently multidimensional and that different aspects of change often exhibit distinct spatial patterns. The mean-state indicator (Δ
TWSA;
Figure 3a) largely reproduces the broad pattern identified in the linear trend analysis. Negative changes dominate much of northern and eastern China, with the strongest declines concentrated in HRB, YRB, and HHRB, forming a coherent center of long-term water-storage reduction across the North China Plain. Negative shifts are also evident in parts of SRB and LRB. In contrast, weak or positive changes are observed in the CB, parts of the SWB, and regions surrounding the Tibetan Plateau. These results indicate pronounced spatial contrasts in the long-term evolution of mean terrestrial water storage among China’s major hydrogeographical regions.
A markedly different pattern emerges for changes in interannual variability (Δ
TWSAσ;
Figure 3b). Increased variability is widespread across most of China, but the strongest amplification occurs in the northwestern inland basins, the upper and middle reaches of the Yellow River Basin, and parts of the southwestern mountainous regions. Notably, several of these areas exhibit only modest mean-state changes in
Figure 3a. This discrepancy suggests that substantial hydrological change can occur through enhanced year-to-year fluctuations even in regions where persistent gains or losses in mean storage are relatively weak. Therefore, variability changes provide information that cannot be inferred directly from mean-state trends alone.
The two extreme-event indicators further highlight the complexity of TWSA evolution. The wet-extreme frequency indicator (
fwet;
Figure 3c) identifies localized hotspots of increasing wet anomalies, particularly in the northwestern inland basins, parts of the Tibetan Plateau margins, and sections of the Southwest River Basin. In contrast, the dry-extreme frequency indicator (
fdry;
Figure 3d) exhibits a much broader spatial footprint, with elevated frequencies occurring across large portions of northern China, including the North China Plain, northeastern China, and several transition zones between humid and arid regions. In many of these areas, increases in dry extremes coincide with declining mean storage, indicating a compound signal of persistent water loss and heightened hydrological stress.
A comparison among the four indicators reveals that regions experiencing the largest mean-state changes are not necessarily those exhibiting the strongest increases in variability or extreme-event frequency. Likewise, areas with relatively weak mean-state shifts may still undergo substantial changes in hydrological variability or extreme behavior. These differences demonstrate that terrestrial water storage change cannot be adequately characterized by a single metric. Instead, mean-state shifts, variability changes, and extreme-event occurrence represent complementary dimensions of hydrological change, providing the rationale for integrating multiple indicators within the hotspot framework developed in this study.
The four seasonal maps presented in
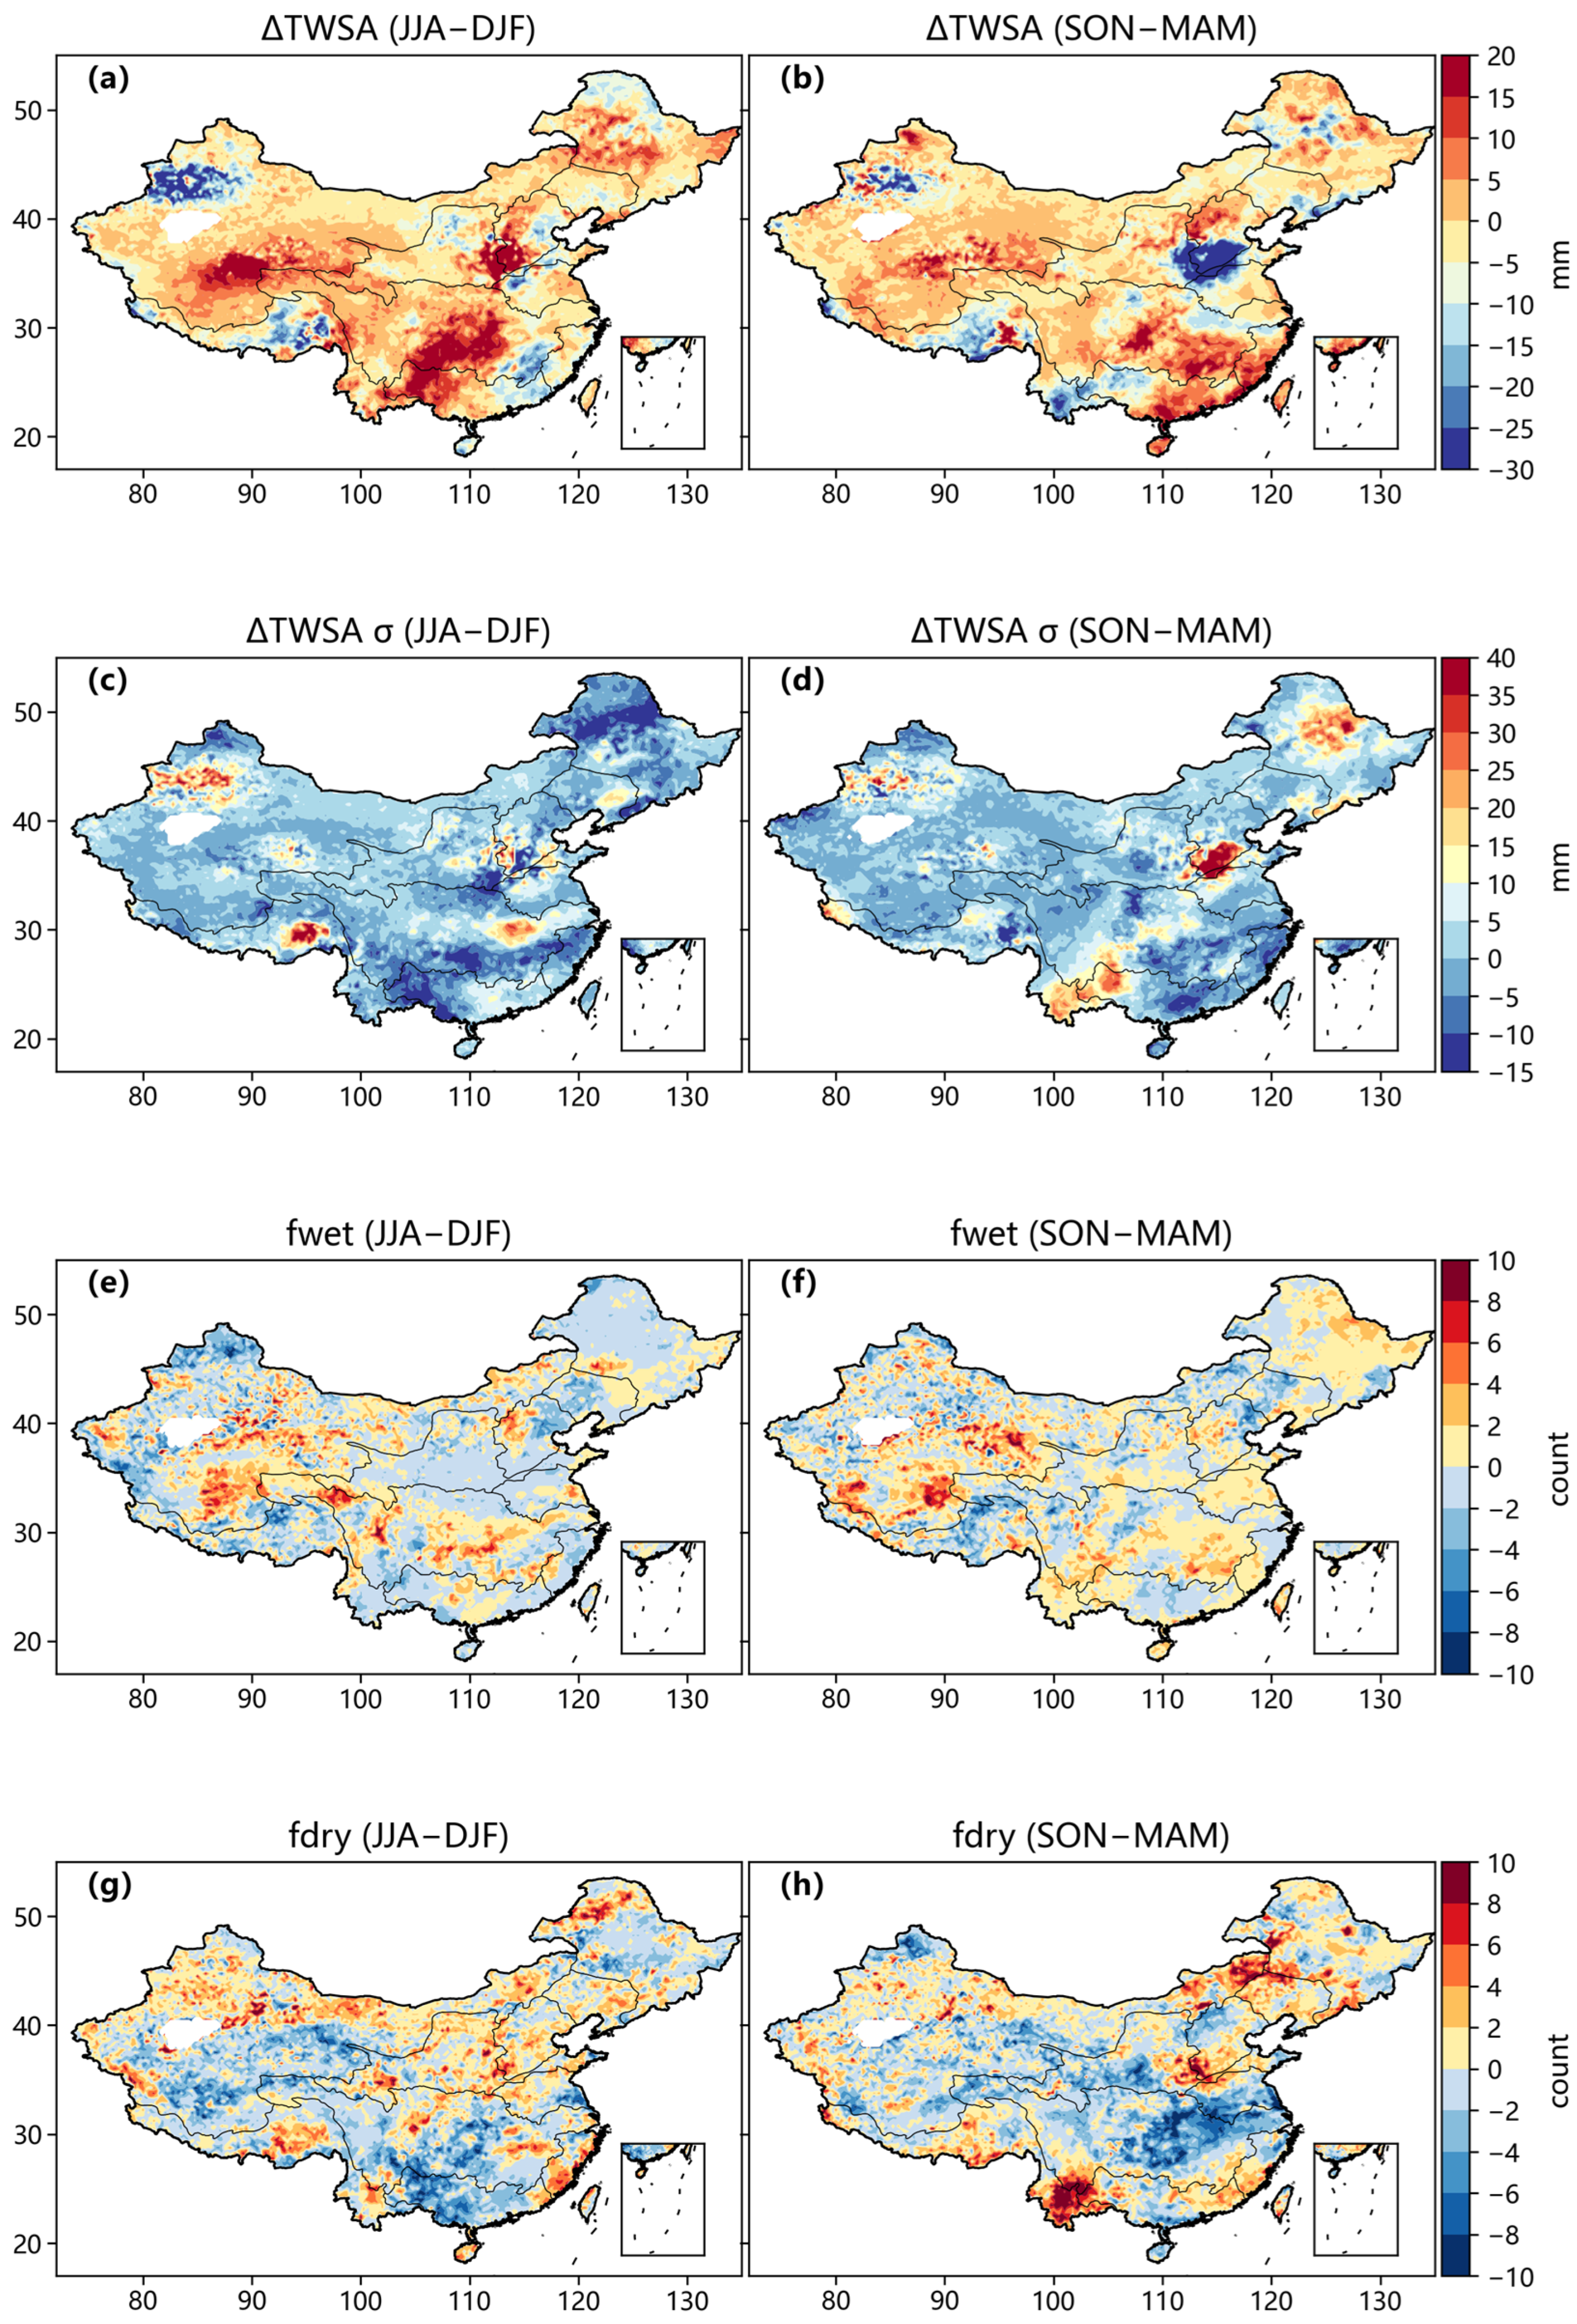
Figure 3 show broadly similar large-scale spatial patterns for each indicator, whereas differences among DJF, MAM, JJA, and SON are generally less apparent in the individual panels. To make these relatively subtle contrasts more visible,
Figure 4 presents within-grid differences for two pairs of fixed calendar-season aggregates: JJA–DJF and SON–MAM. Positive values indicate larger indicator values in JJA or SON, whereas negative values indicate larger values in DJF or MAM, respectively. Because each contrast is calculated at the same grid cell,
Figure 4 is intended as a diagnostic visualization of local calendar-season differences rather than as a comparison of climatologically equivalent seasonal transitions among different regions. For the mean state metric (Δ
TWSA), pronounced seasonal asymmetry is evident (
Figure 4a,b). The summer–winter contrast (JJA–DJF) shows predominantly positive values across large portions of SEB, and parts of the south CB, indicating that long-term mean-state changes are more strongly expressed during the warm season. In contrast, portions of the northwestern Tibetan Plateau, and several high-elevation regions exhibit stronger cold-season signals. Similar spatial contrasts are also apparent in the SON–MAM comparison, suggesting that seasonal contributions to long-term TWSA change vary substantially among hydrogeographical regions rather than occurring uniformly throughout the year.
Changes in interannual variability exhibit an even stronger seasonal dependence (
Figure 4c,d). In the JJA–DJF comparison, negative values dominate much of China, indicating that variability enhancement is generally more pronounced during winter than during summer. This pattern is particularly evident across northeastern China, northern China, and large parts of western China. A similar signal is observed in the SON–MAM comparison, although several localized hotspots emerge, including the North China Plain and parts of northeastern China, where variability changes are considerably stronger in autumn than in spring. These results suggest that increases in hydrological instability are often concentrated within specific seasons rather than being distributed evenly throughout the annual cycle.
The seasonal contrasts of extreme-event frequency further reveal distinct temporal structures. For wet extremes (
fwet;
Figure 4e,f), positive anomalies are primarily concentrated in northwestern China, the Tibetan Plateau margins, and parts of southwestern China, indicating that increases in extreme wet events tend to be more strongly associated with summer and autumn conditions in these regions. In contrast, negative values dominate many humid and monsoon-influenced regions, suggesting relatively stronger increases in wet extremes during winter or spring. The spatial distribution of dry extremes (
fdry;
Figure 4g,h) displays a different pattern. Enhanced dry-extreme occurrence during autumn is particularly evident in northeastern China, southwestern China, and parts of northern China, whereas stronger spring signals appear across portions of central and eastern China.
Taken together, the four seasonal maps exhibit broadly similar large-scale spatial patterns, whereas the within-grid difference fields reveal localized contrasts that are difficult to distinguish from the individual seasonal panels. These contrasts indicate that the magnitudes of mean-state change, variability change, and wet- and dry-extreme frequencies are not identical among the selected calendar-season aggregates at all locations. However, they should not be interpreted as evidence of climatologically equivalent seasonal responses across China. Because the climatic and hydrological meanings of DJF, MAM, JJA, and SON differ among regions, the spatial patterns shown in
Figure 4 may reflect both local differences among calendar-season aggregates and broader contrasts among regional hydroclimatic regimes.
3.3. Multidimensional TWSA Hotspots and Sensitivity Assessment
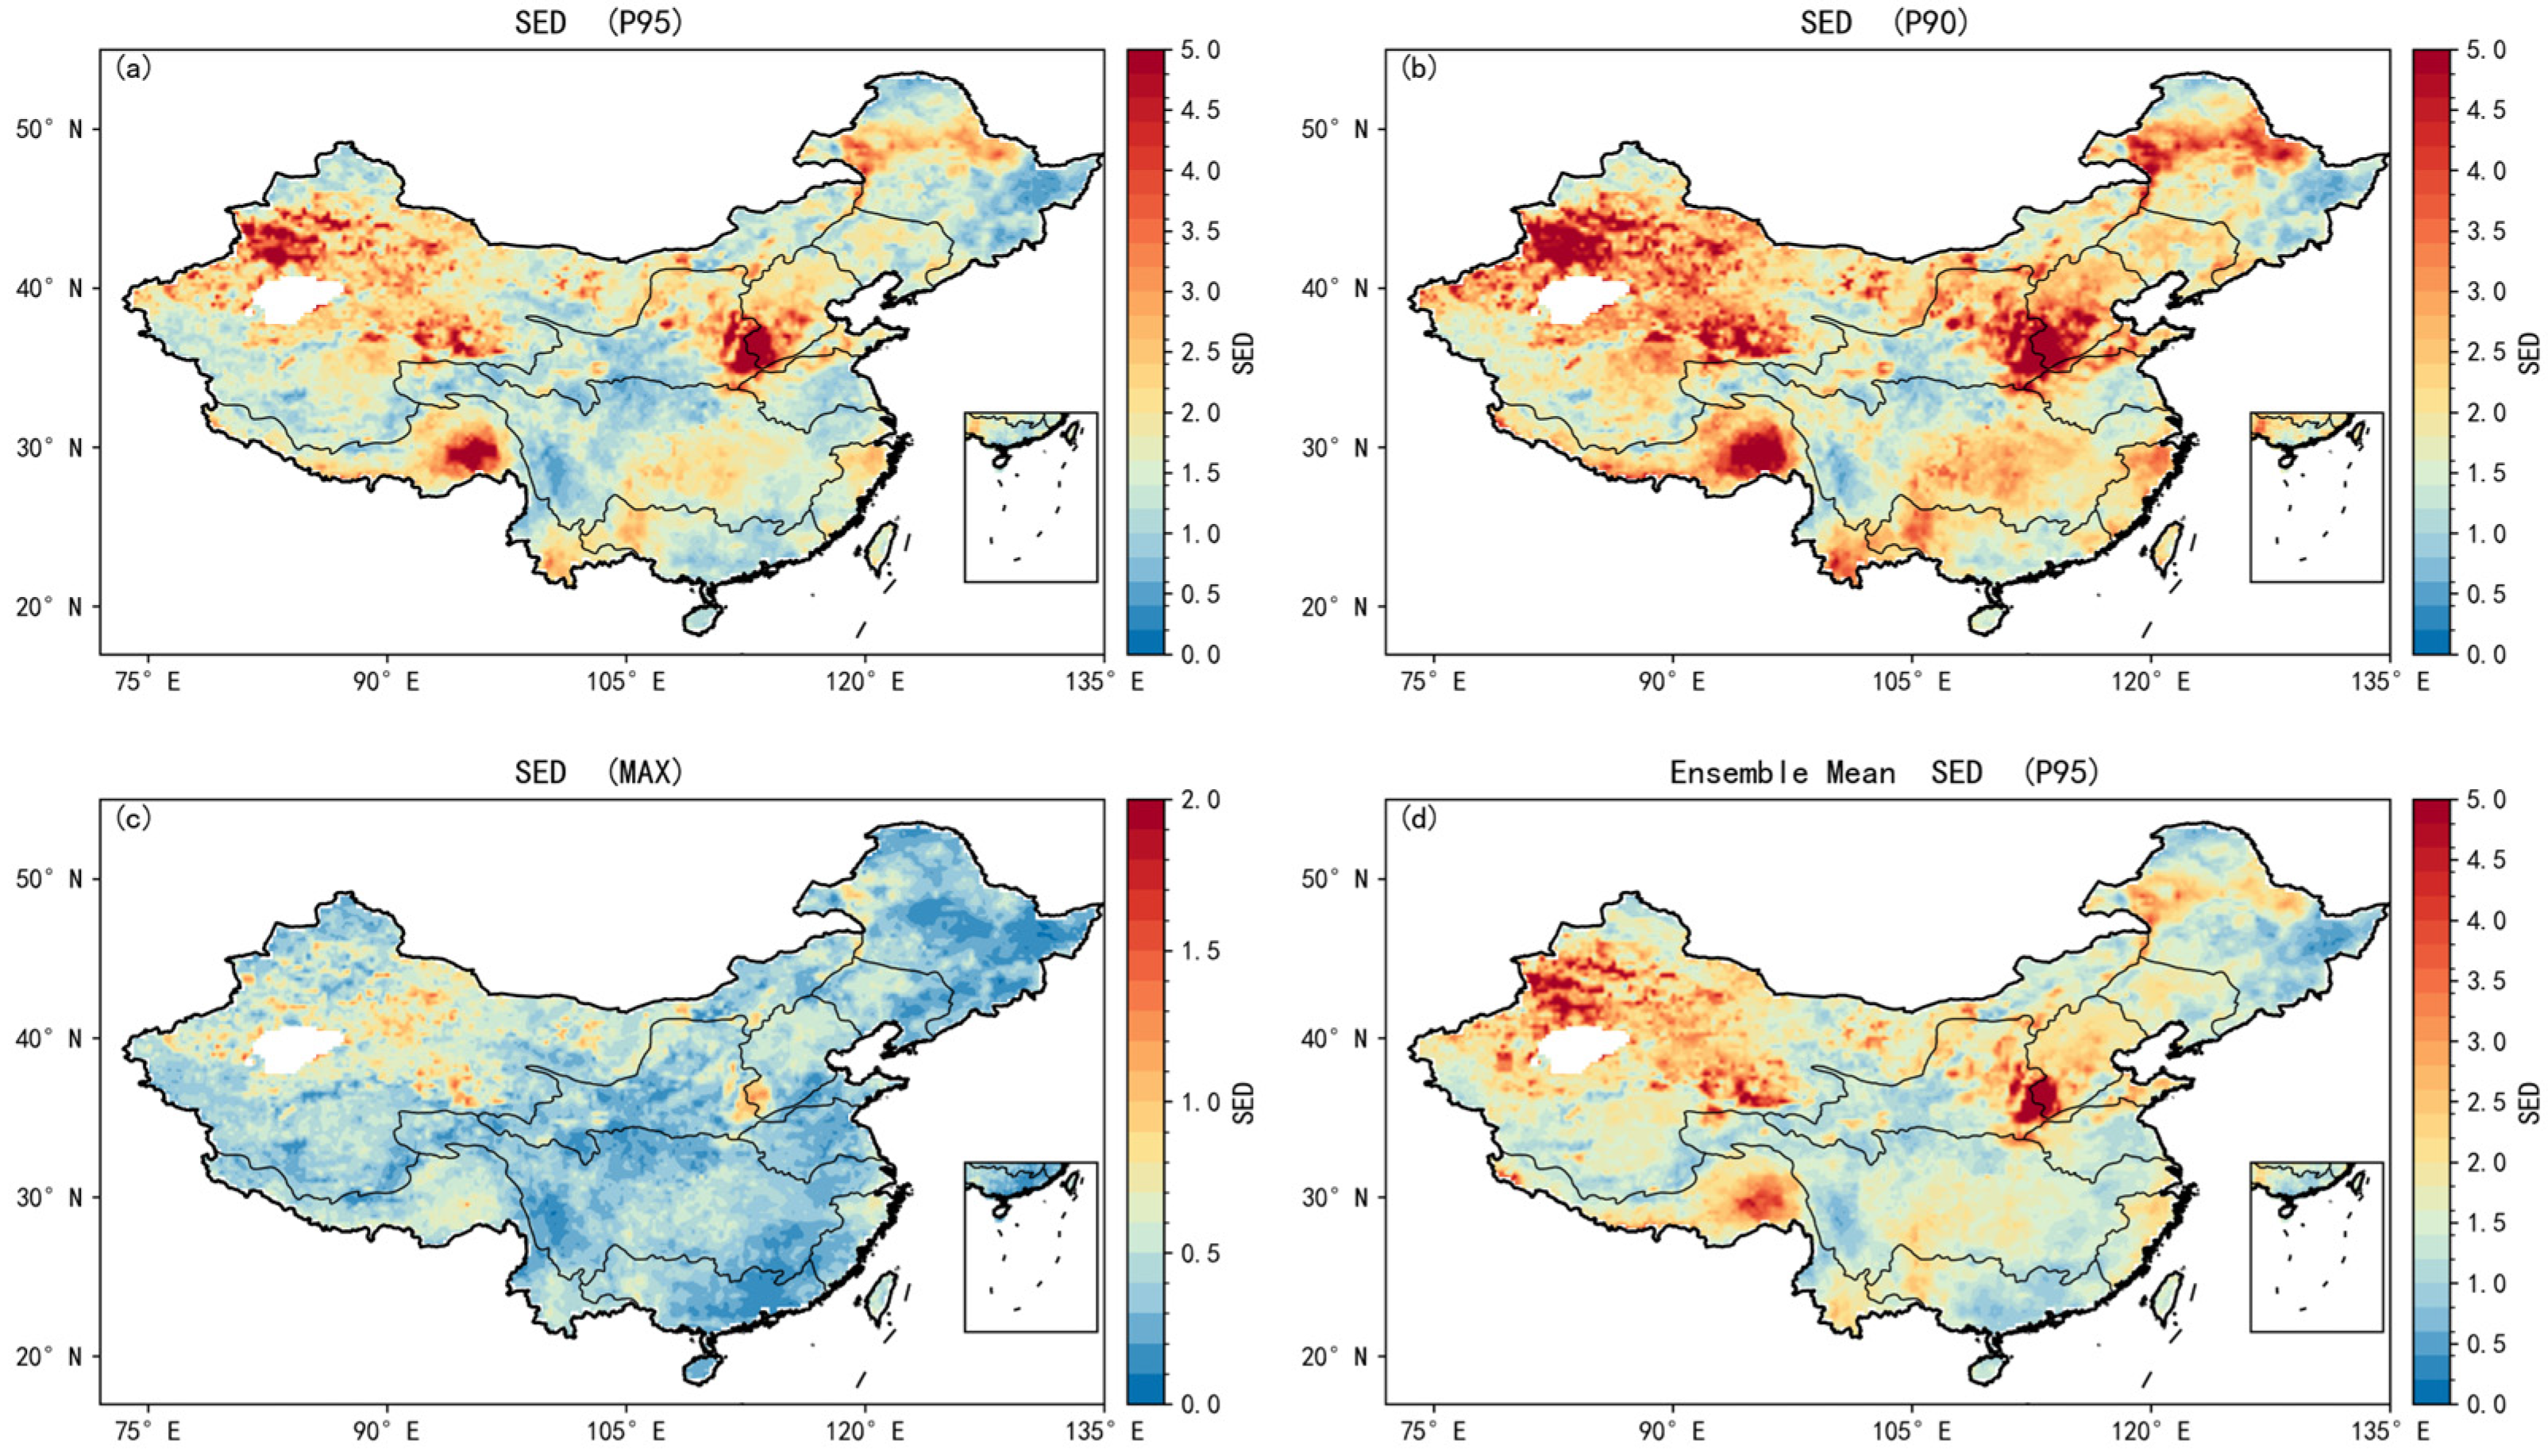
Figure 5 compares the spatial distribution of TWSA hotspot intensity under alternative normalization schemes and reconstruction products. By integrating changes in mean state, interannual variability, and wet- and dry-extreme frequency, the SED analysis identifies several spatially coherent high-value regions that differ from the pattern obtained using linear trends alone. These regions represent areas in which multiple statistical dimensions of TWSA change are spatially concentrated. Under the primary
P95 normalization scheme (
Figure 5a), three spatially coherent high-SED regions are identified. The first is located in northwestern China and extends across substantial parts of the CB. The second and most pronounced high-SED region is centered on the North China Plain and the lower reaches of the YRB. The third is located along the eastern and southeastern margins of the Tibetan Plateau and adjacent parts of the SWB. These regions do not necessarily coincide with areas exhibiting the largest mean-state changes alone. Rather, elevated SED values occur where changes in mean state, interannual variability, and wet- and dry-event frequency are jointly large. The multi-indicator framework therefore identifies areas in which several statistical dimensions of TWSA change are spatially concentrated. A notable feature of these hotspot regions is that they do not necessarily correspond to the areas exhibiting the strongest mean-state changes alone (
Figure 3a). Instead, they emerge where changes in mean state, variability, and extremes reinforce one another. This result highlights the added value of the multi-indicator framework and confirms that hotspot formation is characterized by the combined adjustment of multiple hydrological characteristics rather than by a single dimension of change.
The
P90-based result retains the principal spatial configuration identified under
P95 normalization (
Figure 5b). Elevated SED values remain concentrated in northwestern China, the North China Plain, and southwestern China, although their magnitudes are generally larger and the high-value areas are more spatially extensive. This increase is expected because the
P90 normalization factors are smaller than the corresponding
P95 values, resulting in larger normalized component indicators and SED values. Therefore, the higher SED magnitudes under
P90 normalization represent a scaling effect rather than stronger underlying TWSA change. The broad agreement between the
P90- and
P95-based patterns indicates that the major hotspot locations are relatively insensitive to the selected percentile threshold, although their estimated intensity and spatial extent remain normalization-dependent. As expected, the choice of normalization scheme primarily affects the magnitude and spatial contrast of SED, while the principal high-value regions remain broadly similar. Under domain-maximum normalization (
Figure 5c), the normalization factor for each indicator–season field is defined by the largest absolute indicator value across the study domain. Consequently, a single exceptionally large value can increase the normalization factor and reduce the normalized values at most other grid cells, resulting in lower overall SED magnitudes and weaker spatial contrast. In comparison,
P95 normalization reduces the influence of the most extreme grid-cell values while retaining sensitivity to relatively large changes. Therefore,
P95 normalization was retained as the primary scheme, whereas the MAX result was used to evaluate the sensitivity of the hotspot magnitude and spatial contrast to the selected scaling method. The ensemble-mean SED derived from the CSR-, JPL-, and GSFC-based GTWS-MLrec reconstructions (
Figure 5d) shows a broadly similar hotspot configuration to that obtained from the CSR-based reconstruction. The broadly consistent locations of the high-SED regions in northwestern China, the North China Plain, and southwestern China indicate that the principal spatial pattern is not highly sensitive to the choice of GRACE/GRACE-FO mascon training target. This agreement reflects within-framework consistency among the three GTWS-MLrec products and should not be interpreted as independent validation of the reconstructed hotspot pattern.
Overall, the hotspot analysis reveals that the most spatially coherent high-SED regions in China are concentrated in three major regions: northwestern China, the North China Plain, and southwestern China. These regions are characterized by the spatial co-occurrence of pronounced changes in multiple TWSA indicators and therefore represent priority areas for subsequent process-based investigation.
3.4. Basin-Scale Spatial Association Between SED and Its Component Indicators
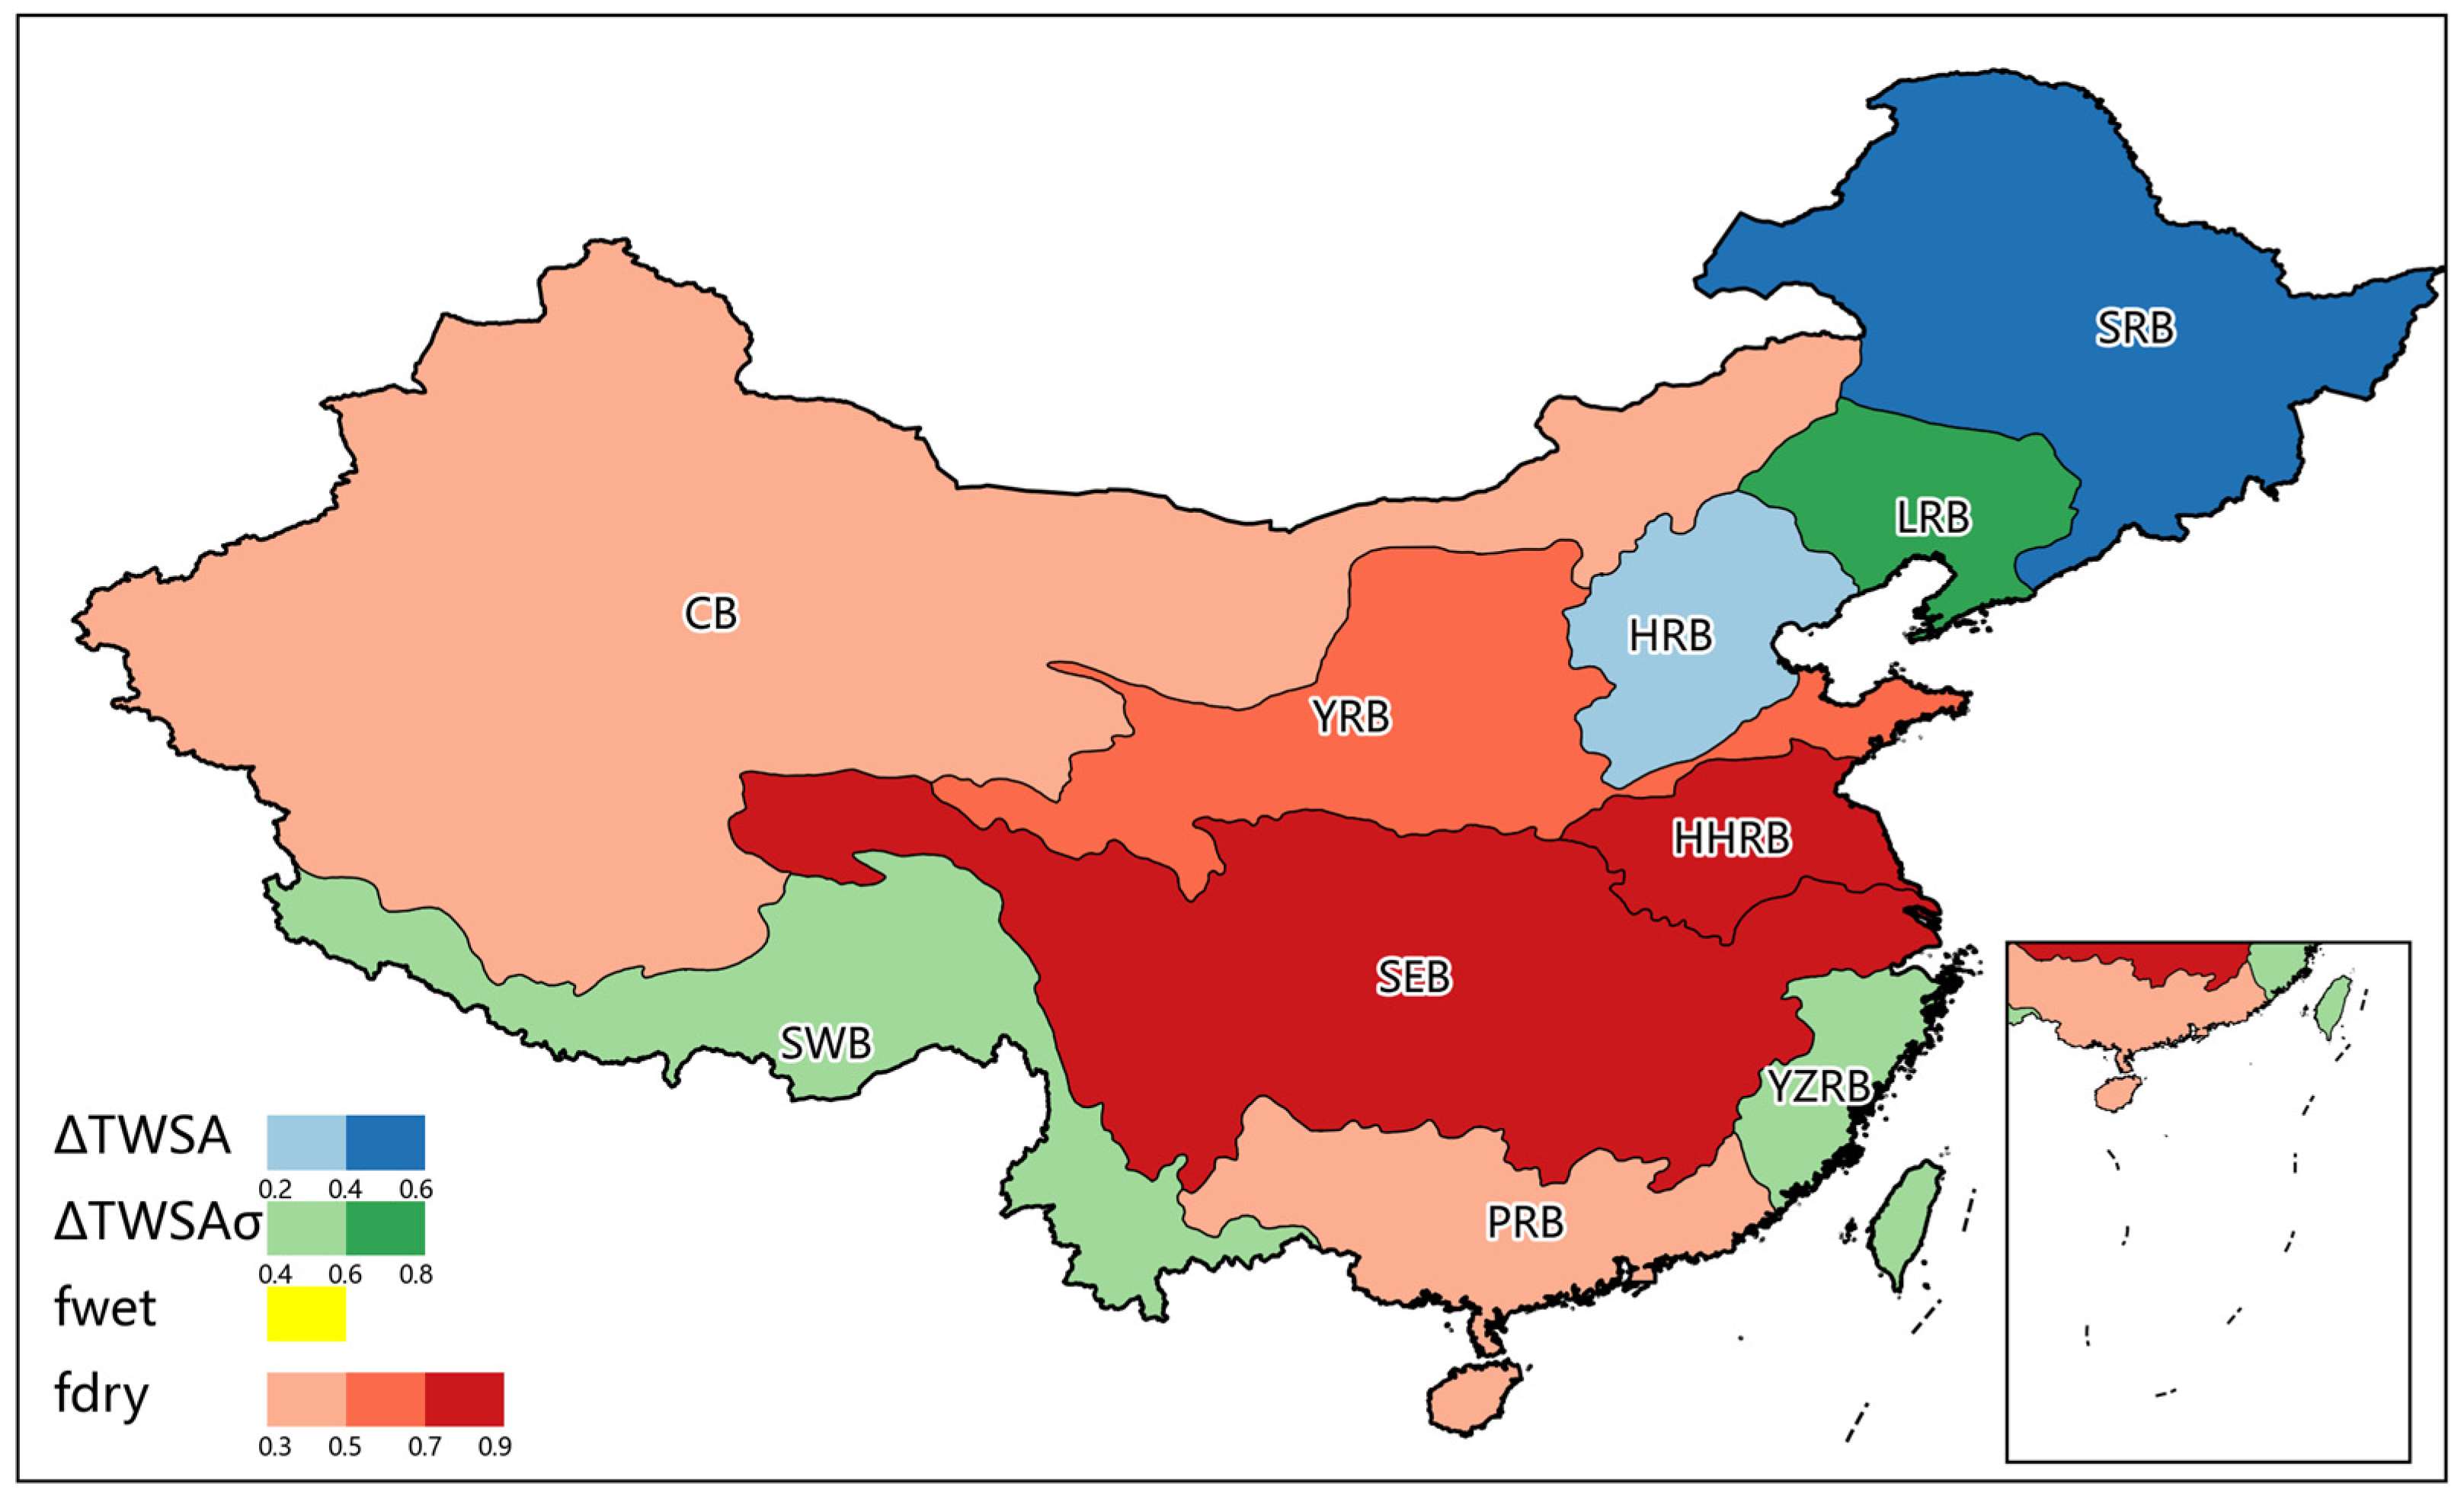
Next, we examined how the spatial associations between SED and its four component indicators varied among China’s major river basins. Because these indicators are mathematically incorporated into the construction of SED, the analysis is descriptive and does not represent an independent attribution of hotspot formation. The GDM q value quantifies the extent to which the spatial stratification of each component indicator corresponds to the spatial variation in SED within a given basin. Accordingly, the indicator with the highest q value was identified as the component exhibiting the strongest spatial association with SED (
Figure 6).
The results reveal pronounced regional differences in the component with the highest q value associated with TWSA hotspot intensity. Two broad patterns emerge. First, hotspots in several basins are primarily associated with systematic shifts in the long-term water-storage state. This is particularly evident in the SRB and HRB, where Δ
TWSA exhibits the highest q value and therefore shows the strongest spatial association with SED. The relatively high q value in SRB suggests that the spatial pattern of SED corresponds more closely to mean-state change than to the other component indicators. A similar, although somewhat weaker, pattern is observed in HRB. Second, the spatial distribution of SED corresponds more closely to changes in hydrological variability or extremes than to mean-state shifts alone. Δ
TWSAσ exhibits the highest q value in the LRB, YZRB, and SWB, indicating that increasing interannual variability is the component most closely associated with the spatial pattern of SED within these basins. This result is consistent with the enhanced variability identified previously in southwestern China and parts of eastern China (
Figure 3), suggesting that hydrological instability represents an important dimension of long-term TWSA change in these regions.
An even more striking pattern emerges across northwestern and southeastern China. The CB, YRB, HHRB, SEB, and PRB are all primarily associated with
fdry. Among these basins, the highest q values occur in HHRB and SEB, followed by YRB, indicating that increases in the frequency of historically unprecedented dry conditions show the strongest spatial association with hotspot intensity. This finding suggests that the spatial distribution of hotspots in these regions is closely linked not only to declining terrestrial water storage but also to the growing occurrence of extreme dry anomalies. The dominance of
fdry across multiple basins further indicates that changes in hydrological extremes constitute a key component of contemporary TWSA evolution in China. A noteworthy feature of
Figure 6 is that no major basin is primarily associated with
fwet. Although elevated wet-extreme frequencies occur locally in several high-SED regions (
Figure 3), they do not emerge as the component with the highest q value at the basin scale. This result suggests that long-term hotspot development across China is more closely associated with background storage shifts, enhanced variability, and especially the intensification of dry extremes than by increases in unusually wet conditions.
Overall, the component indicator with the highest q value varies substantially among China’s major basins, demonstrating that the spatial distribution of hotspots cannot be summarized by a single nationwide pattern. Instead, different regions are characterized by distinct combinations of long-term storage adjustment, hydrological instability, and extreme-event dynamics. These contrasting indicator patterns may be related to regional differences in climate forcing, cryospheric influences, land-surface processes, and human water use. Consequently, understanding hotspot formation requires consideration not only of where TWSA changes occur, but also of the specific hydrological dimensions through which those changes are expressed.
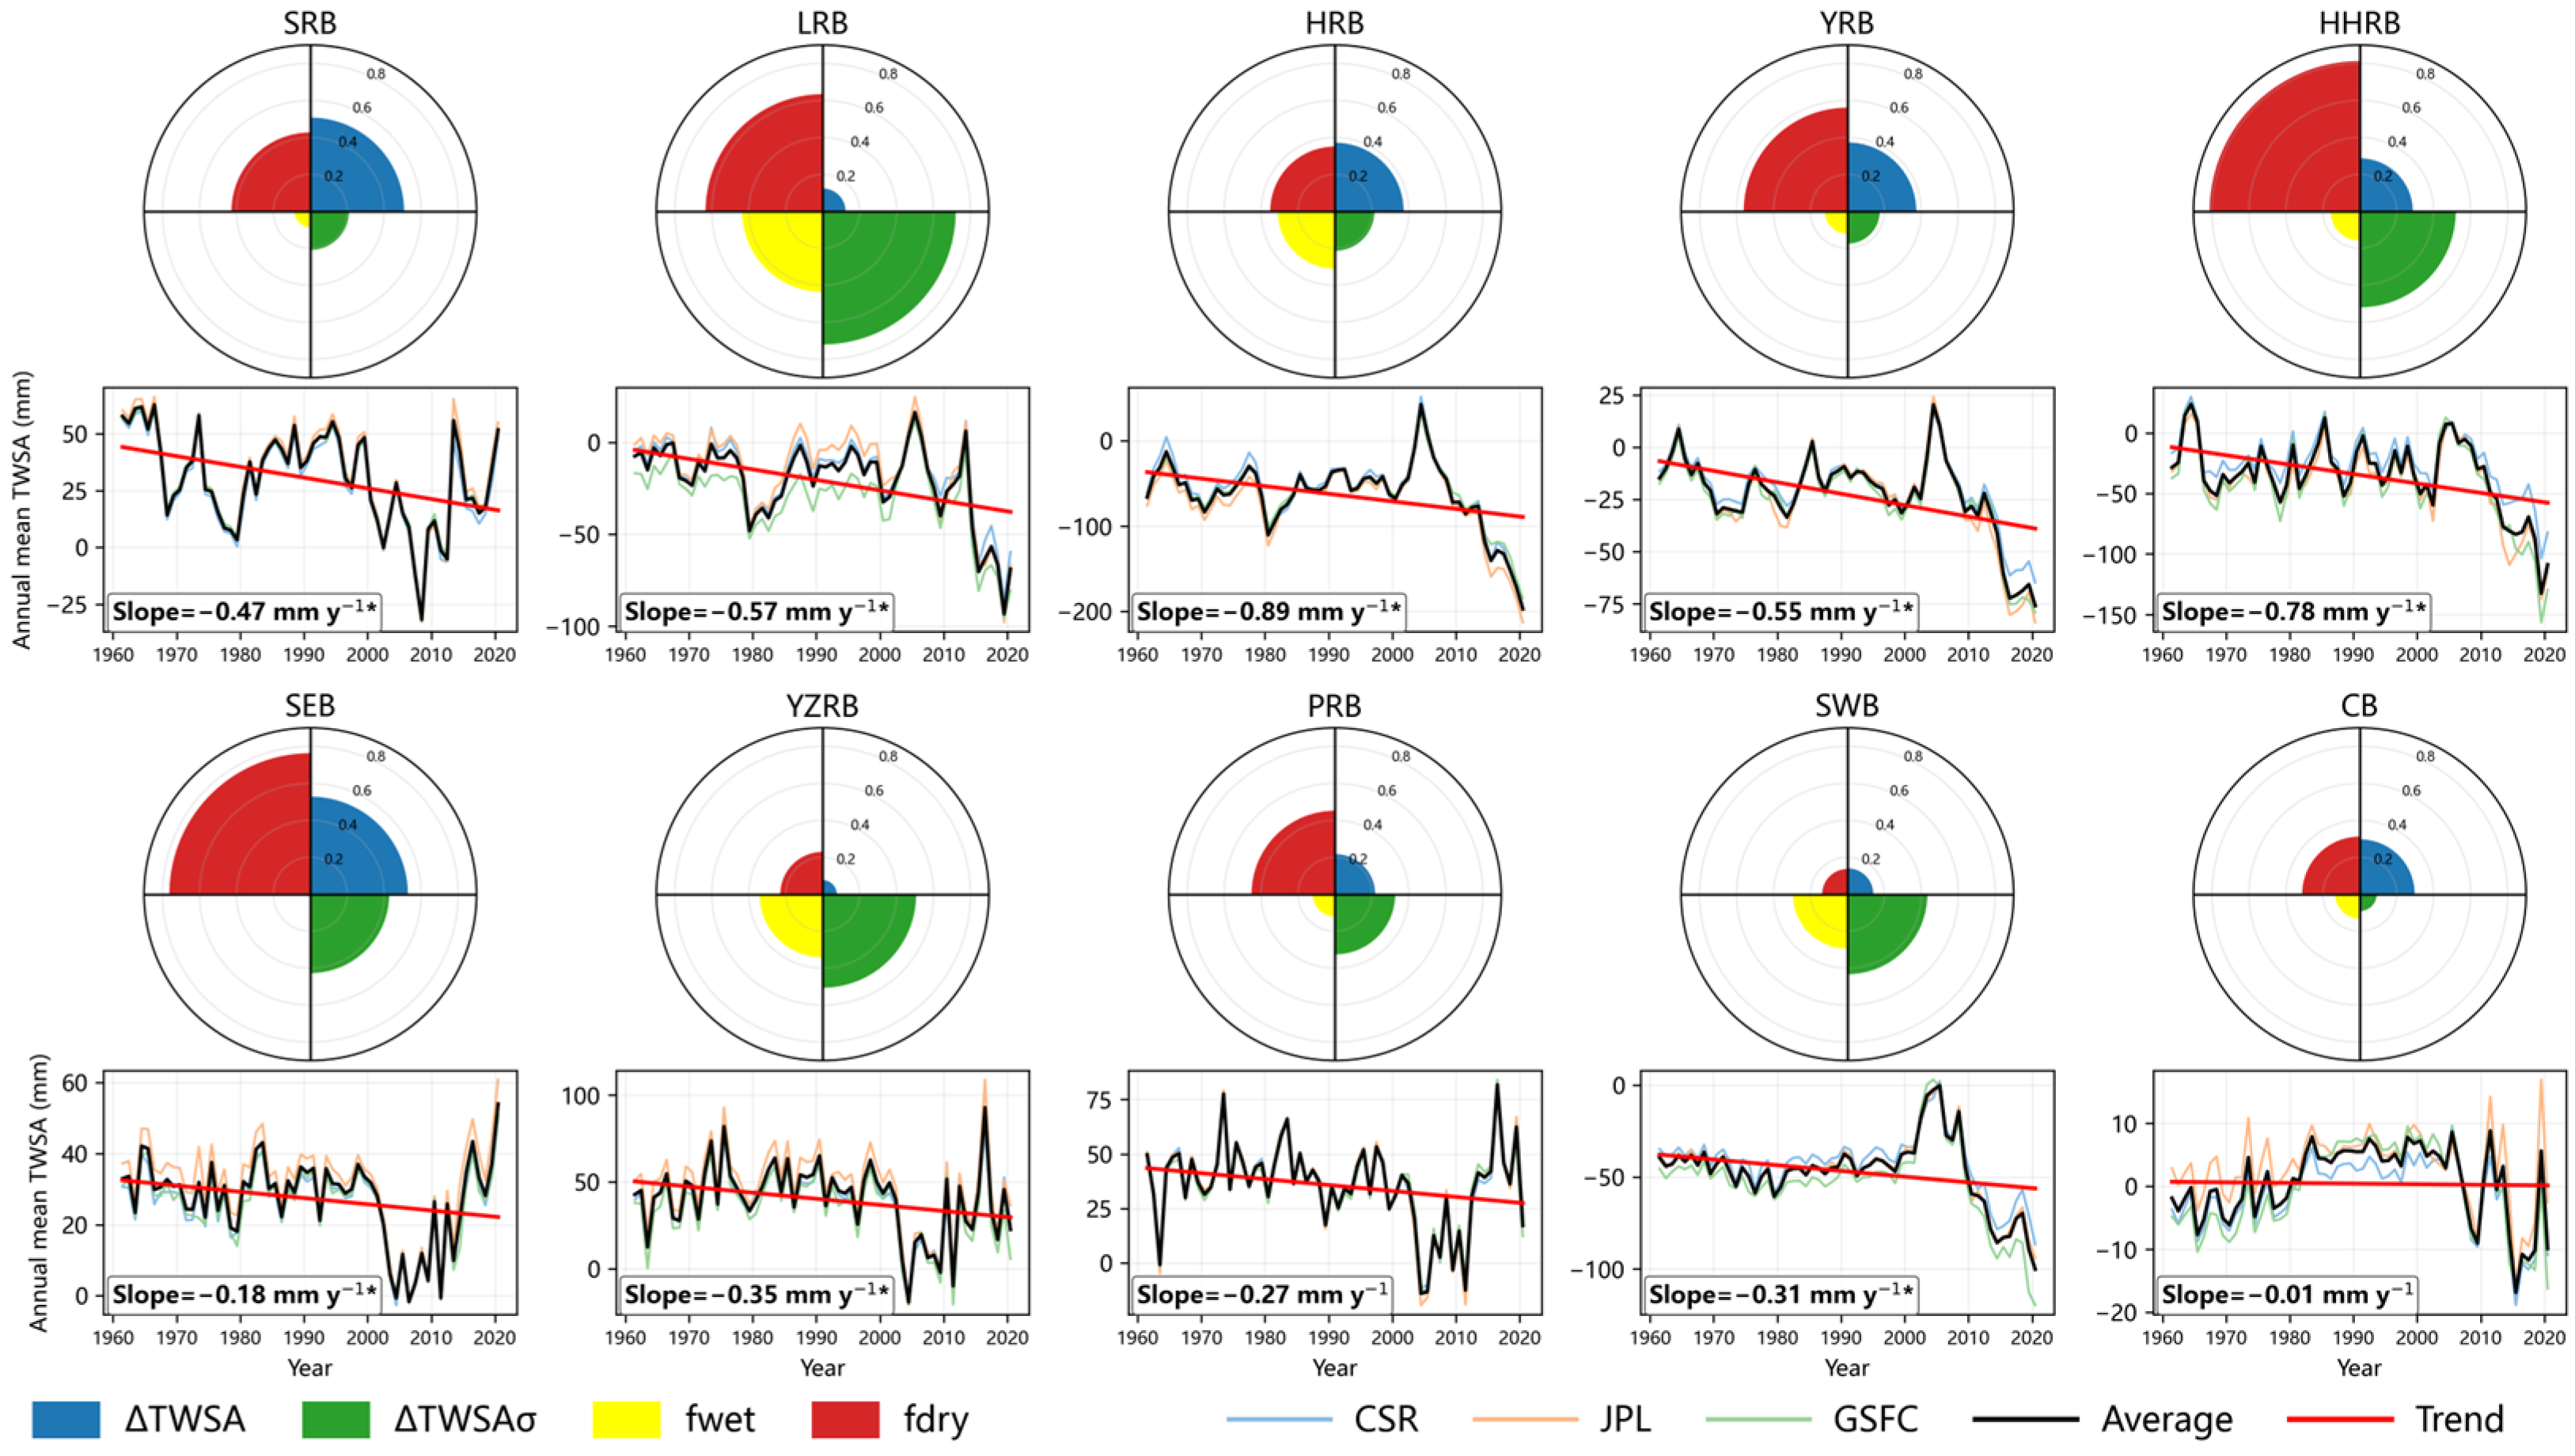
Figure 7 further compares the q-value structures of the four component indicators with long-term basin-mean TWSA evolution. Whereas
Figure 6 identifies the indicator with the highest q value in each basin,
Figure 7 shows the complete q-value structure together with the corresponding annual TWSA series. The q-value structures vary substantially among basins. In the SEB and HHRB,
fdry exhibits markedly higher q values than the other indicators, whereas several other basins show more balanced structures. These patterns describe differences in the internal component structure of SED rather than independent causal contributions.
In contrast, several basins exhibit a more balanced q-value structure. The HRB provides a representative example, with relatively small differences among the four indicators and no overwhelmingly dominant component. Such a pattern suggests that the spatial distribution of SED is associated with multiple dimensions of hydrological change, including long-term storage adjustment, variability enhancement, and shifts in extreme-event frequency. Similar mixed indicator structures can also be identified in parts of northeastern and western China, where the spatial pattern of SED corresponds to several component indicators rather than being closely aligned with a single one. Intermediate behavior is observed in the SRB, CB, YZRB, and SWB, where although one indicator exhibits the highest q value, the differences relative to the remaining indicators are comparatively modest. These basins therefore represent transitional cases in which the component with the highest q value coexists with substantial spatial associations involving other dimensions of TWSA change. This result indicates that the internal indicator structure of SED forms a continuum ranging from strongly differentiated q-value patterns to comparatively balanced patterns rather than a simple binary classification.
Comparison with the annual basin-mean TWSA series shows that the magnitude of the long-term TWSA trend does not necessarily correspond to the relative q-value structure of the four component indicators. All ten basins exhibit negative-trend slopes in basin-mean TWSA during 1961–2020, indicating a widespread decline in terrestrial water storage. The trends are statistically significant at p < 0.05 in the SRB, LRB, HRB, YRB, HHRB, SEB, YZRB, and SWB, whereas the trends in the PRB and CB are not statistically significant. The strongest decreases occur in the HRB (−0.89 mm y−1), HHRB (−0.78 mm y−1), LRB (−0.57 mm y−1), and YRB (−0.55 mm y−1), whereas the CB shows little long-term change (−0.01 mm y−1). However, basins experiencing comparable storage declines do not necessarily exhibit the same relative q-value structure. For example, the HHRB and SEB are primarily associated with increasing dry extremes, whereas the YZRB and SWB show stronger spatial associations with enhanced interannual variability. Similarly, mean-state change exhibits the highest q value in the SRB, despite its long-term decline being comparable to those of several basins characterized by other component indicators.
Despite the predominantly negative trends over the full study period, the annual TWSA series in the SRB, SEB, YZRB, and PRB exhibit a discernible increase from approximately 2002 to 2020. This shorter-term upward tendency broadly coincides with the GRACE/GRACE-FO observation period, indicating that the long-term storage declines were not temporally uniform. Instead, the basin-scale records show substantial decadal variability, with recent increases in terrestrial water storage partially offsetting earlier declines. Because the present study does not explicitly attribute temporal changes to individual physical or anthropogenic drivers, the late-period increase may reflect the combined influences of hydroclimatic variability and regional water regulation. It should therefore not be interpreted as evidence of a persistent reversal of the longer-term declining trends.
The q-value structures of the four component indicators vary substantially among river basins. Basins characterized by weak long-term TWSA trends, such as the CB, generally exhibit relatively low q values across all indicators, whereas basins undergoing more pronounced TWSA changes tend to show higher indicator-specific q values. Nevertheless, the indicator with the highest q value differs among basins, and basins with comparable long-term trends may exhibit distinct q-value structures. These results indicate that the spatial variation in the constructed SED index is associated with different dimensions of TWSA change across regions, including mean-state shifts, changes in interannual variability, and the occurrence of wet and dry extremes. Accordingly, the GDM results quantify regional differences in the spatial associations between the component indicators and SED, rather than identifying independent physical controls on hotspot formation. Such multidimensional information cannot be fully derived from linear trend analysis alone.
4. Discussion
Traditional assessments of terrestrial water storage change have relied predominantly on linear trends derived from GRACE observations or reconstructed TWSA products. Although trend analysis effectively characterizes long-term directional change, it does not fully describe concurrent shifts in interannual variability or the occurrence of wet and dry extremes. The results of this study show that these dimensions are not spatially coincident across China. Regions exhibiting pronounced mean-state declines do not necessarily experience the largest changes in variability or extreme-event frequency. For example, the North China Plain is characterized by substantial storage depletion and increasing dry extremes, whereas parts of northwestern and southwestern China exhibit comparatively weaker mean-state changes but more pronounced changes in interannual variability. These contrasts indicate that long-term TWSA evolution cannot be adequately represented by a single statistical metric. By integrating mean-state change, variability change, and extreme-event frequency within a unified SED framework, the present analysis identifies regions in which multiple statistical dimensions of TWSA change are spatially concentrated.
The three major statistical hotspot regions identified in this study exhibit distinct multidimensional characteristics. The North China Plain shows the strongest and most spatially coherent hotspot signal, characterized by pronounced mean-state decline and increasing dry-extreme frequency across multiple seasons. These features are directly supported by the SED analysis and the spatial distributions of the component indicators. Previous studies have documented substantial groundwater depletion in this region, largely associated with groundwater abstraction for agricultural irrigation, urban water supply, and industrial development [
22,
27]. Reservoir operation and interbasin water transfer can further alter regional water-storage and groundwater conditions [
48,
49,
50]. Global aquifer assessments and regional studies based on in situ observations, GRACE estimates, and land-subsidence records provide additional evidence of persistent groundwater stress across the North China Plain and the Hai River Basin [
51,
52,
53,
54,
55]. Groundwater-management interventions may nevertheless stabilize groundwater levels in some subregions [
56]. These studies provide relevant hydrological context for the observed hotspot pattern. However, because the present study does not explicitly quantify groundwater withdrawal, reservoir operation, or water-transfer effects, their individual contributions cannot be determined from the current analysis.
The northwestern hotspot exhibits a heterogeneous statistical structure. Elevated SED values in the CB coincide with spatial variations in several component indicators, while the basin-mean long-term trend remains relatively weak. Although
fdry has the highest basin-scale q value in the CB, the differences among the indicator-specific q values are comparatively modest, indicating a relatively mixed q-value structure. This result indicates that the northwestern hotspot is not characterized by a spatially uniform decline in terrestrial water storage, but rather by substantial changes in several statistical properties of TWSA. Previous studies have shown that terrestrial water storage in arid northwestern China is influenced by precipitation variability, evapotranspiration, mountain runoff, snow and glacier melt, and groundwater recharge [
12,
57,
58]. Variations in these processes may contribute to the heterogeneous TWSA changes identified here. Nevertheless, the present results do not directly establish which of these processes is primarily responsible for the observed hotspot pattern.
The southwestern hotspot is concentrated near the eastern and southeastern margins of the Tibetan Plateau and adjacent mountainous regions. The results demonstrate that this region is characterized by pronounced changes in interannual variability and strong seasonal contrasts. Previous studies have reported that terrestrial water storage in and around the Tibetan Plateau is affected by glacier mass change, permafrost degradation, lake expansion, monsoon variability, and topographically controlled runoff processes [
24,
25,
26,
59,
60,
61,
62]. These regional hydrological and cryospheric characteristics may provide a physical context for the observed SED pattern. However, because glacier, permafrost, lake, precipitation, and runoff changes were not explicitly analyzed in this study, the relative importance of these processes remains uncertain.
The basin-scale GDM analysis further shows that the relative spatial associations between the four component indicators and SED vary among river basins. This result is directly reflected in the basin-specific q-value structures. Basins with comparable long-term TWSA trends may exhibit different indicators with the highest q values and distinct q-value patterns, indicating that the spatial variation in SED is associated with different dimensions of TWSA change across regions. However, the GDM analysis does not identify independent physical drivers of these regional differences. The observed contrasts may be related to variations in climate, cryospheric influence, land-surface processes, and human water use, but these possible explanations require further evaluation using independent environmental and socioeconomic datasets.
Although a new quantitative validation using independent hydrological datasets was not conducted in the present study, the principal regional patterns identified from GTWS-MLrec are broadly consistent with independent evidence reported in previous studies. The pronounced terrestrial water-storage decline over the North China Plain agrees with groundwater observations, GRACE-based estimates, and land-subsidence studies documenting sustained groundwater depletion [
22,
27,
52,
53,
54,
55]. The heterogeneous changes identified in northwestern China are consistent with previous GRACE-based and regional hydrological studies reporting pronounced spatial and temporal variability in terrestrial water storage across arid and semi-arid regions [
57,
58]. Similarly, the enhanced variability near the Tibetan Plateau and adjacent southwestern regions is consistent with independent evidence of glacier mass change, groundwater variation, lake expansion, and cryospheric influences [
24,
25,
26,
59,
60,
61,
62]. This qualitative agreement provides external support for the broad regional interpretation of the hotspot patterns, but it does not replace a systematic validation of the reconstructed pre-GRACE TWSA record.
The annual basin-mean TWSA series also indicate that long-term changes were not temporally uniform. Despite predominantly negative trends over 1961–2020, the SRB, SEB, YZRB, and PRB exhibit a discernible upward tendency from approximately 2002 to 2020. These recent increases partially offset earlier declines and highlight the influence of decadal variability on basin-scale TWSA evolution. They may reflect the combined effects of hydroclimatic variability and regional water regulation but should not be interpreted as evidence of a persistent reversal of the longer-term trends, because the present study does not explicitly attribute temporal changes to individual drivers.
Several uncertainties should be acknowledged. First, although the CSR-, JPL-, and GSFC-based reconstructions show broadly consistent large-scale patterns, the three products share the same general machine-learning reconstruction framework and therefore do not constitute fully independent validation. Further comparisons with groundwater observations, reservoir-storage records, streamflow data, lake-level measurements, and hydrological-model outputs would strengthen the regional evaluation of reconstructed TWSA. Second, an additional limitation concerns the use of uniform calendar seasons across China. The DJF, MAM, JJA, and SON groupings provide a consistent temporal framework for nationwide grid-cell calculations, and the seasonal contrasts in
Figure 4 were calculated locally at each grid cell. Nevertheless, these calendar-based groupings do not necessarily represent climatologically or hydrologically equivalent seasons among regions. Monsoon timing, precipitation seasonality, snowmelt processes, temperature regimes, and runoff timing differ substantially among northern, southern, arid, and high-elevation basins. Consequently, part of the spatial variation shown by the seasonal-contrast fields may reflect differences among regional hydroclimatic regimes rather than directly comparable seasonal responses. Future studies could define region-specific climatic or hydrological seasons based on temperature, precipitation, monsoon progression, snowmelt, or runoff timing and compare the resulting patterns with those obtained using fixed calendar seasons. Third, the SED framework identifies multidimensional statistical changes but does not separate climatic and anthropogenic contributions. Future studies could integrate precipitation, evapotranspiration, runoff, groundwater abstraction, reservoir operation, land-use change, and cryospheric datasets to establish a process-based attribution framework. Finally, hotspot identification depends on the selected periods, component indicators, normalization scheme, and extreme-event thresholds. Moving-window analyses and time-evolving hotspot assessments would help determine when hotspots emerge, intensify, or weaken under ongoing climate variability and human influence.
5. Conclusions
This study assessed long-term TWSA change across China during 1961–2020 using three GTWS-MLrec reconstructions and their ensemble mean. An SED-based hotspot framework adapted from previous climate-hotspot studies was applied to integrate changes in seasonal mean state, detrended interannual variability, and the frequencies of wet and dry extremes. This approach provides a multidimensional statistical characterization of TWSA change and complements conventional linear trend analysis.
The results reveal widespread terrestrial water-storage decline across northern China, with the strongest negative changes concentrated in the North China Plain. The multidimensional analysis identifies three major statistical hotspot regions: the northwestern CB, the North China Plain, and the SWB. These hotspot patterns are broadly consistent among the three reconstructed datasets, although their statistical structures differ. Mean-state decline and increasing dry-extreme frequency are relatively prominent in the North China Plain and several northern basins, whereas variability-related changes show greater spatial association in parts of northwestern and southwestern China.
The basin-scale GDM analysis further demonstrates that basins with comparable long-term TWSA trends may exhibit distinct q-value structures. This indicates that the spatial distribution of SED is associated with different combinations of mean-state change, interannual variability, and wet and dry extremes across regions. These results should be interpreted as a descriptive characterization of the internal component structure of the constructed hotspot index rather than as a causal attribution of physical drivers. Overall, the applied framework identifies regions in which multiple dimensions of terrestrial water-storage change are spatially concentrated and provides a basis for subsequent independent validation, process-based attribution, and basin-specific assessment.