Article

Evaluating Waterlogging Risk Inequality in a Megacity

1
College of Water Sciences, Beijing Normal University, Beijing 100875, China
2
Beijing Tongzhou District Water Authority Bureau, Beijing 101100, China
*
Author to whom correspondence should be addressed.
Remote Sens. 2026, 18(14), 2428; https://doi.org/10.3390/rs18142428
Submission received: 1 May 2026 / Revised: 1 July 2026 / Accepted: 16 July 2026 / Published: 22 July 2026
(This article belongs to the Special Issue Study on Hydrological Hazards Based on Multi-Source Remote Sensing)

Highlights

What are the main findings?
  • Urban waterlogging susceptibility and resilience in Beijing present a core-periphery spatial pattern.
  • Spatial inequality of urban waterlogging risk exists in Beijing.
What are the implications of the main findings?
  • The core-periphery spatial differentiation of waterlogging risk provides a spatial reference for targeted waterlogging prevention and governance.
  • The uneven risk distribution highlights the necessity of prioritizing risk mitigation in outer suburban areas to optimize waterlogging control efficiency and achieve urban environmental distributive justice.

Abstract

Urban waterlogging poses increasing threats to megacities; however, the spatial distribution of waterlogging risk inequality remains poorly understood. In this work, a comprehensive framework to evaluate urban waterlogging risk and its spatial inequality in Beijing is developed. The framework integrates machine learning-based waterlogging susceptibility, urban waterlogging resilience quantified using the entropy weight method, and population exposure data. The Gini index and Lorenz curves are employed to quantify risk inequality at both district and township scales. The central urban area is characterized by high- and very-high-susceptibility levels, while low-susceptibility areas are mainly concentrated in the outer suburbs. A distinct “core-periphery” pattern characterizes urban resilience: high resilience concentrates in the central urban area, while resilience drops significantly in the outer suburbs. The integration of susceptibility, resilience, and exposure reveals a profound spatial waterlogging risk disparity. The urban core has the highest waterlogging risk, but the burden is evenly spread across its dense population (Gini < 0.4). In contrast, outer suburbs and mountainous areas show severe inequality (Gini > 0.6), where a tiny fraction of the population bears most of the risk. This framework supports region-specific strategies to improve control efficiency and achieve environmental distributive justice.

1. Introduction

Urban waterlogging ranks among the most devastating natural hazards and poses severe threats to human communities [1,2,3]. As documented in the 2024 Global Natural Disaster Assessment Report, waterlogging caused 5883 fatalities worldwide, accounting for 35.12% of the total 16,753 natural-disaster-related deaths and representing the leading mortality source across all disaster types. Moreover, most of the global population currently dwells in cities, and the urban population ratio is projected to hit 68% by 2050. Satellite-derived assessments from Tellman et al. suggest that 255–290 million people suffered direct waterlogging impacts between 2000 and 2018, with adverse exposure trends set to worsen by 2030 [4]. Accordingly, systematic urban waterlogging risk evaluation and tailored mitigation measures are urgently needed to tackle escalating global waterlogging risks.
China is highly vulnerable to frequent and severe urban waterlogging, which continuously causes substantial casualties and economic losses each year [5]. A typical extreme case is the unprecedented torrential rainfall that struck Henan Province during 17–23 July 2021. This catastrophic event affected 14.786 million residents across 150 counties, resulting in 398 fatalities and direct economic losses of 120.06 billion yuan [6]. More recently, a severe rainstorm disaster impacted Beijing, the neighboring Hebei Province, and northern Tianjin from 23 to 29 July 2025. The maximum accumulated rainfall reached 573.5 mm in the Miyun District of Beijing, approaching the city’s average annual precipitation of 649.6 mm. This extreme event affected over 300,000 people, causing 64 deaths, 39 missing persons, widespread infrastructure damage, and direct economic losses exceeding 100 billion yuan [7]. In this context, systematic assessment of urban waterlogging risk and the development of robust disaster management strategies are essential to improve urban waterlogging resilience in Chinese cities.
Four mainstream approaches are currently widely adopted for urban waterlogging risk assessment [8], namely historical disaster data-based methods [8,9], multi-index comprehensive evaluation methods [10,11], remote sensing and GIS-coupling approaches [12], and scenario-based simulation methods utilizing hydrological-hydrodynamic physical models [9,13,14]. Among these techniques, multi-index evaluation and physical model-based simulation have gained increasing scholarly attention. For instance, Huang et al. constructed a comprehensive waterlogging risk assessment system for Jiangxi Province using thirteen indicators, covering waterlogging hazard intensity, disaster-forming environmental sensitivity, exposure of hazard-affected bodies, and flood prevention and mitigation capacity [15]. Similarly, Li et al. established an eight-indicator urban waterlogging risk framework based on hazard characteristics, social-ecological vulnerability, and population exposure, and further mapped the spatiotemporal patterns of waterlogging risk in Zhengzhou across multiple years [16]. For physical simulation-based assessment, prevalent hydrological and hydrodynamic models include SWMM, MIKE series, InfoWorks ICM, LISFLOOD-FP, and HEC-RAS [14,17].
Despite the inherent limitations of each method, they offer valuable and complementary perspectives for quantifying urban waterlogging risk. In particular, multi-index comprehensive evaluation methods, which characterize core determinants of integrated waterlogging risk through a set of screening indicators, have attracted growing research interest [8,18] and serve as the methodological foundation of this study. Most existing indicator-based waterlogging risk assessments primarily incorporate conventional risk components, including hazard, exposure, and vulnerability [10]. Nevertheless, urban systemic resilience constitutes a critical but underemphasized dimension of waterlogging risk regulation. A resilient urban system can withstand waterlogging shocks, mitigate adverse disaster impacts, adapt to dynamic environmental changes, and accelerate post-disaster recovery. For example, regions with sophisticated drainage infrastructure can efficiently discharge surface floodwater and alleviate inundation severity [5]. Economically advanced areas, equipped with sufficient fiscal reserves and mature municipal facilities, are capable of launching rapid drainage emergency responses and restoring critical lifeline infrastructure after waterlogging disasters [19,20]. Furthermore, proximity to essential emergency facilities (e.g., hospitals, fire stations, and police stations) directly determines emergency response efficiency and rational resource deployment, substantially mitigating overall disaster losses [21]. Additionally, populations with higher educational levels typically exhibit superior emergency response capabilities, better disaster mitigation skills, and active participation in community rescue activities, further reducing regional waterlogging risk [22,23]. Accordingly, integrating urban systemic resilience into conventional evaluation frameworks is essential to achieve a more comprehensive and robust assessment of urban waterlogging risk.
More importantly, urban waterlogging risk equity emphasizes that waterlogging exposure, access to disaster mitigation resources, and post-disaster recovery support should not be systematically stratified by economic status, residential location, population age structure, or social attributes [24,25]. Nevertheless, real-world waterlogging events reveal prominent disparities in disaster impacts across different social groups. For instance, during the extreme “23·7” rainstorm that struck Beijing in 2023, suburban districts including Fangshan and Mentougou experienced far more severe inundation and slower post-disaster recovery compared with urban core areas [22]. From a social equity perspective, waterlogging hazards tend to amplify pre-existing social vulnerability. A typical case occurred in July 2025, when a severe waterlogging event affected an elderly care center in Taishitun Town, Miyun District, Beijing. The disaster caused 31 casualties, most of whom were elderly residents with limited or impaired mobility. This tragedy demonstrates that socially vulnerable groups with poor mobility are systematically disadvantaged during waterlogging disasters. Therefore, exploring the equity of urban waterlogging risk is not only consistent with the advocacy of climate justice but also practically necessary for improving integrated urban resilience and protecting residents’ basic safety rights [19,26]. In the practice of resilient urban construction, neglecting the uneven spatial distribution of waterlogging risk may further solidify or even widen internal urban resilience disparities. However, current research inadequately addresses the spatial inequality of urban waterlogging risk distribution [25]. To fill this gap and respond to climate justice demands for waterlogging risk governance, this study constructs a targeted framework to characterize urban waterlogging risk and its inherent social inequality, which is critical for improving integrated urban waterlogging resilience.
To address these issues, this study develops an integrated framework for urban waterlogging risk that incorporates both urban system resilience and related inequalities. By taking Beijing, a highly urbanized megacity, as a representative case, we produce a risk map and examine the spatial patterns of risk inequality at both district and township levels. Key drivers of waterlogging risk are further identified, leading to the formulation of equity-oriented risk management strategies tailored to Beijing. These strategies are designed to support policymakers in implementing region-specific and targeted actions, thereby enhancing waterlogging control efficiency while achieving environmental distributive justice.
The structure of this study is arranged as follows. Section 2 describes the research area, outlines the proposed evaluation framework, and presents the datasets collected for analysis. Section 3 introduces the methodology employed, including the processing of datasets and the procedures for evaluating waterlogging risk and associated inequality. Section 4 presents the results for spatial patterns of risk levels, the distribution of risk inequality, and the interpretation of key model outputs. Finally, Section 5 provides the concluding remarks from this study.

2. Research Area, Framework and Dataset

2.1. Research Area

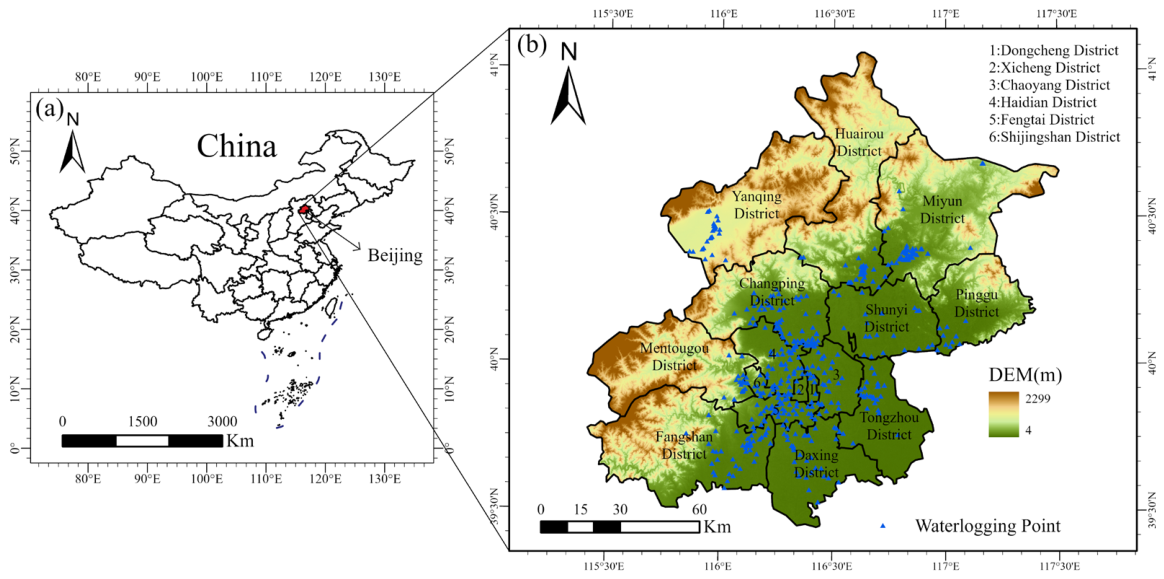
As a highly urbanized megacity, Beijing, China, is selected as the study area for waterlogging risk and risk inequality assessment. Geographically, Beijing spans approximately 16,000 km2, located at 39°28′–41°05′N and 115°20′–117°30′E. The terrain presents a typical northwest-high and southeast-low pattern, covering 16 administrative districts across the city (Figure 1a,b) [27]. By the end of 2024, Beijing had a permanent resident population of 21.832 million, 86.6% of whom resided in urban regions. The population exhibits distinct spatial heterogeneity, with dense population aggregation in central urban districts and relatively sparse distribution in suburban areas [28].
Furthermore, Beijing features a semi-humid and semi-arid monsoon climate, with a mean annual precipitation of 542.6 mm. Precipitation is highly concentrated in July and August, resulting in frequent short-duration intense rainfall events. Accelerated urbanization has substantially expanded impervious surfaces, including buildings, roads, and public squares, further altering surface hydrological processes and exacerbating inundation risks. Consequently, urban waterlogging has become a recurrent disaster in Beijing, causing persistent socioeconomic losses and threatening public safety [29]. Multiple extreme rainstorm events in recent decades have demonstrated the city’s severe waterlogging vulnerability. For instance, the catastrophic rainstorm that occurred on 21–22 July 2012 caused 79 fatalities and forced the emergency resettlement of 96,000 residents, accompanied by extensive damage to roads, bridges, hydraulic facilities, and vehicles, with direct economic losses exceeding 16 billion yuan [30,31]. Another severe rainstorm event affected Beijing and its surrounding areas from 29 July to 2 August 2023, impacting approximately 1.29 million residents, severely damaging 147,000 buildings, and inundating 15,000 hectares of cropland [22]. Most recently, during 23–29 July 2025, Beijing received an average rainfall of 210.4 mm, with a record-breaking maximum rainfall of 573.5 mm recorded in Miyun District. This event led to 44 deaths and nine missing persons citywide, among whom 31 elderly individuals lost their lives in a local nursing facility in Miyun District. These successive extreme events highlight the severe and ongoing threat of urban waterlogging in Beijing, emphasizing the necessity of conducting refined waterlogging risk prediction and inequality evaluation to protect vulnerable groups and support equitable waterlogging risk management.

2.2. Proposed Framework and Datasets

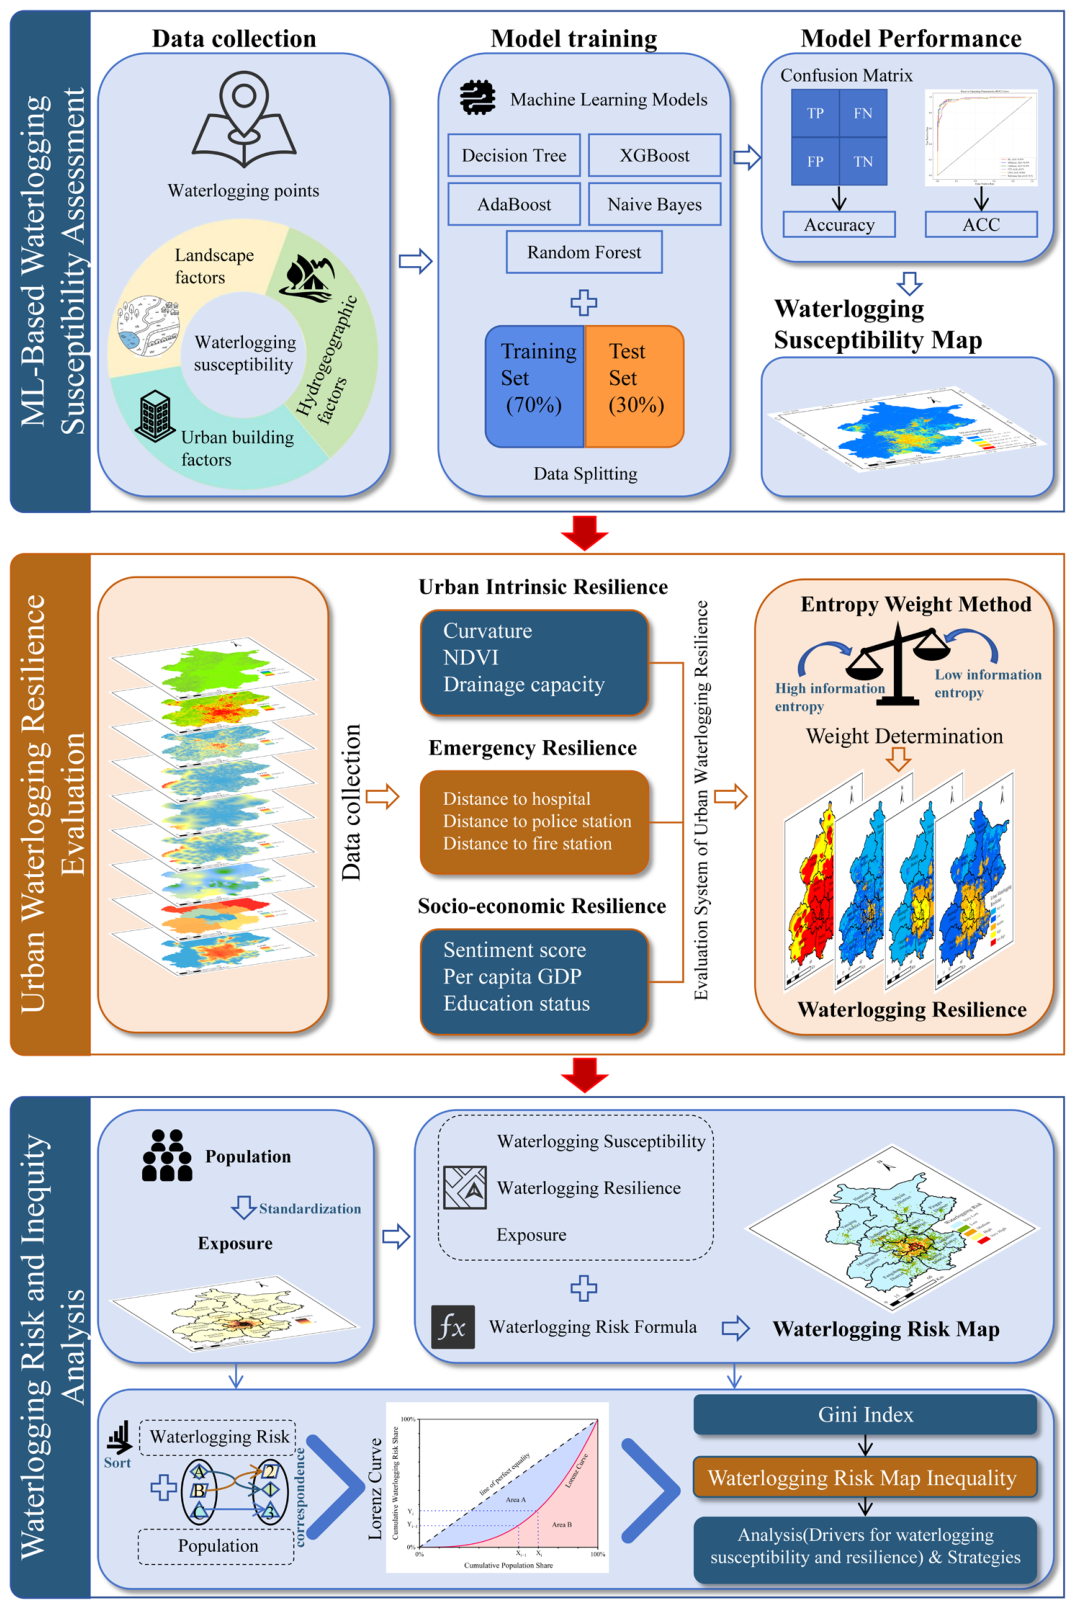
Figure 2 presents the framework for evaluating the urban waterlogging risk inequality proposed in this study, which comprises four parts: (i) determination of waterlogging susceptibility level based on five kinds of machine learning (ML) models, including collection and processing of waterlogging inventories and their twenty-four explanatory indicators, performance evaluation of models and waterlogging susceptibility mapping; (ii) quantification of urban waterlogging resilience using the entropy weight method (EWM); (iii) evaluation of waterlogging risk by combining susceptibility, resilience and exposure and its equality using the Gini index; and (iv) model interpretation of multiple drivers. Some basic datasets needed for the proposed framework are described in detail below.

2.2.1. Waterlogging Point Information

Historical waterlogging points in Beijing from 2011 to 2021 are identified through monitoring data analysis, network information extraction, etc. These points are located mainly in sunken bridge areas, railway bridges and culverts, and municipal trunk roads that are prone to waterlogging risk. In real-world urban waterlogging events, when inundation depth remains below 15 cm, pedestrian and vehicle movement is generally unaffected. However, once the water depth exceeds this threshold, both pedestrians and drivers may struggle to discern wet ground conditions or lane markings, thereby increasing the risk of accidents [32]. Therefore, 482 geospatial positions with inundation depths greater than 15 cm are selected and collected to be labeled as waterlogging points across Beijing in this study, as shown in Figure 1b.
This urban waterlogging inventory dataset during 2011–2021 was derived from the official distribution map of historically typical waterlogging sites released by the Beijing WaterAuthority. Specifically, the dataset was compiled following a multi-step collection procedure. First, locations with recorded water depth exceeding 15 cm were systematically archived based on in situ water depth measurements from hydrological monitoring instruments deployed at flood-prone zones during annual flood seasons, as well as routine administrative patrol logs and flood control duty records from competent authorities. Second, web-scraping techniques for open-access online information were adopted to extract citizen-reported waterlogging incidents and road obstruction records from news reports, government public mailboxes, and social media platforms, enabling the identification of geospatial sites with verified waterlogging damage signatures. Third, field investigations and positional verification were implemented by district-level water and flood control staff to validate all candidate hazard locations refined from the above clues, which finalized detailed attributes including accurate geographic coordinates, historical inundation depth, and practical impacts on pedestrian mobility and roadway traffic. Benefiting from the multi-source fusion of instrumental monitoring data, administrative archival records, social media crowdsourced information, and field surveys, the compiled dataset substantially mitigates information omissions inherent to single-data-source approaches. However, it should be noted that since the publicly available dataset only documents whether a given location has experienced severe waterlogging rather than recording the full temporal frequency of inundation occurrences, we cannot reliably quantify the inundation frequency at each site or derive the frequency distribution corresponding to varying inundation depths. Lastly, it should be acknowledged that citizen-reported and web-scraped waterlogging records tend to overrepresent densely populated central urban districts while underrepresenting sparsely populated outer suburbs and communities with limited reporting capacity. Such sampling bias may distort the derived susceptibility map and further interfere with the subsequent Gini-coefficient-based inequality analysis conducted in this study, which merits in-depth exploration in future research.

2.2.2. Explanatory Indicators for Waterlogging Susceptibility

In reference to previous studies on urban waterlogging susceptibility assessment [33,34,35,36,37] and actual waterlogging situations in Beijing, twenty-four indicators, including hydrogeographic, urban building, and landscape indicators, are adopted for waterlogging susceptibility analysis.
Regarding hydrogeographic indicators, precipitation (P) serves as a triggering indicator of urban waterlogging. Elevation (digital elevation model, DEM) and slope (Slope) are two basic indicators that influence urban floodwater accumulation [38]. Land cover (LC) significantly influences waterlogging via complicated floodwater–earth surface interactions [39]. The stream power index (SPI) is a geomorphological index that measures the erosive power of water flow [40], whereas the topographic wetness index (TWI) is an index that predicts the tendency of a landscape to accumulate water [41,42]. Since municipal roads affect the infiltration and convergence process of rainwater, we choose road density (ROD) as an indicator for the susceptibility prediction. River density (RID) is also adopted as an indicator to characterize a possible effect of river networks on the occurrence of waterlogging [42,43].
Among urban building indicators, Leandro et al. and Li et al. clearly demonstrated the role of urban building form (including building density and building coverage) in floodwater routing and associated flooding hazards [43,44]. Therefore, both the density of buildings (DB) and building coverage ratio (BCR) are chosen to characterize their possible effects on floodwater dynamics and the resulting patterns in this study. Moreover, we choose six representative three-dimensional building metrics, namely, mean building height (MBH), mean building volume (MBV), standard deviation of building height (SDBH), standard deviation of building volume (SDBV), building shape coefficient (BSC), and the degree of building congestion (BCD), to identify their potential impacts on urban waterlogging in this study [35,45]. Table 1 lists all of these urban building indicators adopted in this study.
In terms of landscape indicators, we choose eight landscape metrics, including patch density (PD) and edge density (ED) (which represent the area/perimeter/edge of the landscape), landscape shape index (LSI) (which represents the landscape configuration), aggregation index (AI), contagion (CONTAG) and division (DIVISION) (which describe the sprawl/spread of the landscape), and Shannon’s evenness index (SHEI) and Shannon’s diversity index (SHDI) (which describe the diversity of the landscape), to explore their relationships with urban waterlogging susceptibility [34,46]. Definitions for these landscape metrics are listed in Table 2.

2.2.3. Urban Waterlogging Resilience Indicator

Urban resilience, as a core indicator for evaluating urban capacity to resist, absorb, recover from, and adapt to diverse disruptive disturbances, has emerged as a prominent research hotspot in urban planning and disaster risk management [47]. Existing urban resilience studies commonly decompose resilience into multiple dimensional indicators to quantify urban disaster resistance, with representative frameworks including the Pressure-State-Response (PSR) model [48,49] and the Robustness-Recovery-Adaptation (RRA) model [50]. Following these classical evaluation paradigms, this study develops a three-dimensional assessment framework for urban waterlogging resilience, consisting of urban intrinsic resilience (UIR), emergency response resilience (ER), and social-economic resilience (SER). This framework comprehensively integrates urban inherent anti-disturbance capacity, dynamic risk response efficiency, and socioeconomic adaptive guarantee capacity to achieve a holistic evaluation of urban waterlogging resilience.
The UIR reflects the degree to which a city, leveraging its natural geography and built infrastructure, can fend off the detrimental impacts of waterlogging. It is constructed using three representative indicators, as listed in Table 3: terrain curvature (Curvature), normalized difference vegetation index (NDVI), and drainage capacity (DRC). Curvature describes how much the terrain undulates, influencing whether surface runoff tends to concentrate or disperse. As a highly urbanized metropolis, the NDVI can be adopted to characterize the role of urban green spaces in mitigating waterlogging through rainfall interception and infiltration in Beijing [29]. In highly urbanized areas where natural infiltration paths are blocked by impervious surfaces, the coverage and drainage capacity (DRC) of the pipe network directly affect the ability of the city to rapidly remove excessive surface ponding [5].
ER measures how quickly a city can restore its normal operational functions following a waterlogging event by leveraging public services. For characterizing this dimension, we adopt the distance to hospitals (DTH), distance to fire stations (DTF), and distance to police stations (DTP) as three core evaluation indicators [51], as listed in Table 3. Hospitals offer critical medical resources, including medicine, equipment, and trained personnel, which are essential for treating waterlogging-related injuries and illnesses. Residents near these facilities could benefit from quicker access to care, which supports faster disaster recovery [52]. Fire stations enable rapid emergency response, helping to reduce casualties and property loss by shortening rescue times. Police stations leverage their information networks and coordinate with fire and medical services to issue waterlogging alerts and guidance, enabling residents to respond effectively. Herein, it should be pointed out that adopting straight-line Euclidean distances to hospitals, fire stations, and police stations as a proxy for accessibility within ER merely constitutes a simplification, as this approach disregards real-world constraints including actual road networks, traffic volumes, road hierarchies, one-way traffic regulations, and potential road breakdowns amid waterlogging disasters. However, such a simplified treatment remains reasonable for the macroscale assessment framework of urban waterlogging risk inequality. The adoption of Euclidean distance targets the identification of relative inequities in access to emergency services across disparate urban social groups under waterlogging hazards, instead of estimating the precise arrival time of individual rescue operations. Euclidean distance effectively delineates the spatial agglomeration of emergency facilities, uncovered service gaps, and inter-unit disparities in proximity. This metric prioritizes the consistency of overall spatial patterns rather than the absolute accuracy of distance values. Nonetheless, the effect of the transportation network also warrants an investigation in future studies.
The focus of SER lies in assessing the capacity of a city for learning, evolution, and long-term adaptation after a waterlogging hazard event. For characterizing this dimension, we adopt four representative indicators, as also listed in Table 3: The educational status of residents (ES), gross domestic product (GDP), public sentiment score (STS), and proportion of vulnerable population (VP) for waterlogging. A high level of education among residents is often accompanied by stronger community organization capabilities, enabling them to participate more rationally in community reconstruction and the summarization of lessons learned after a waterlogging disaster [26]. The GDP represents the capacity of the city for reconstruction and adaptation [53]. The public sentiment score for waterlogging, as a characteristic indicator, can accurately capture the “social psychological adaptability” of a city during a waterlogging hazard. During waterlogging disasters, social media, as an emerging big data platform, becomes a primary channel through which the public can express emotions, share information, and seek help. The social media-based sentiment score reflects the level of public panic and social cohesion when facing waterlogging disasters [22], and indicates the adaptive capacity of a city at the spiritual level. The VP is quantified as the proportion of residents aged 65 years and older derived from the Seventh National Population Census of China. Regions with a higher share of elderly population impose greater demands on emergency medical support and evacuation services during waterlogging disasters, which elevates local reliance on social resources and exacerbates adaptive pressure.

3. Methodology

Some methodologies for the proposed framework shown in Figure 2 are described in detail below.

3.1. Data Collection and Processing for Susceptibility

In this study, a total of 482 historical waterlogging locations recorded in Beijing from 2011 to 2021 are compiled into the waterlogging inventory dataset for subsequent machine learning modeling. To prepare these samples for model input, the impact zone of each waterlogging point is defined as a circular area within a 500 m radius around the corresponding site. For the generation of non-waterlogging samples, strict spatial separation constraints were implemented in the GIS environment using the random point generation tool to avoid spatial overlap between positive and negative samples and establish an unbiased binary classification dataset. Specifically, all randomly generated non-waterlogging points are constrained to lie outside the 500 m buffered zones, with a minimum separation distance of 500 m from any recorded historical waterlogging site. In practice, 500 m buffer polygons are first generated around all 482 waterlogging locations and then dissolved into a unified integrated impact boundary. Non-waterlogging points are subsequently randomly distributed across the entire study area but exclusively within regions beyond this merged buffered extent. Following existing empirical studies [54,55], the number of non-waterlogging samples is set to twice the count of waterlogging sites, yielding 964 non-waterlogging points. Consequently, the final dataset contains 482 positive samples (waterlogging sites, coded as 1) and 964 negative samples (non-waterlogging sites, coded as 0), constructing a complete binary dataset for waterlogging susceptibility modeling. Nevertheless, it is important to clarify that these samples should be treated as pseudo-absences or presumed non-waterlogging observations instead of fully validated true absence points. This limitation may compromise the unbiasedness and completeness of the binary dataset and warrants further investigation in follow-up research. Such sample configuration conforms to conventional schemes widely adopted in previous machine-learning-driven hazard susceptibility and zonation assessments [56,57].
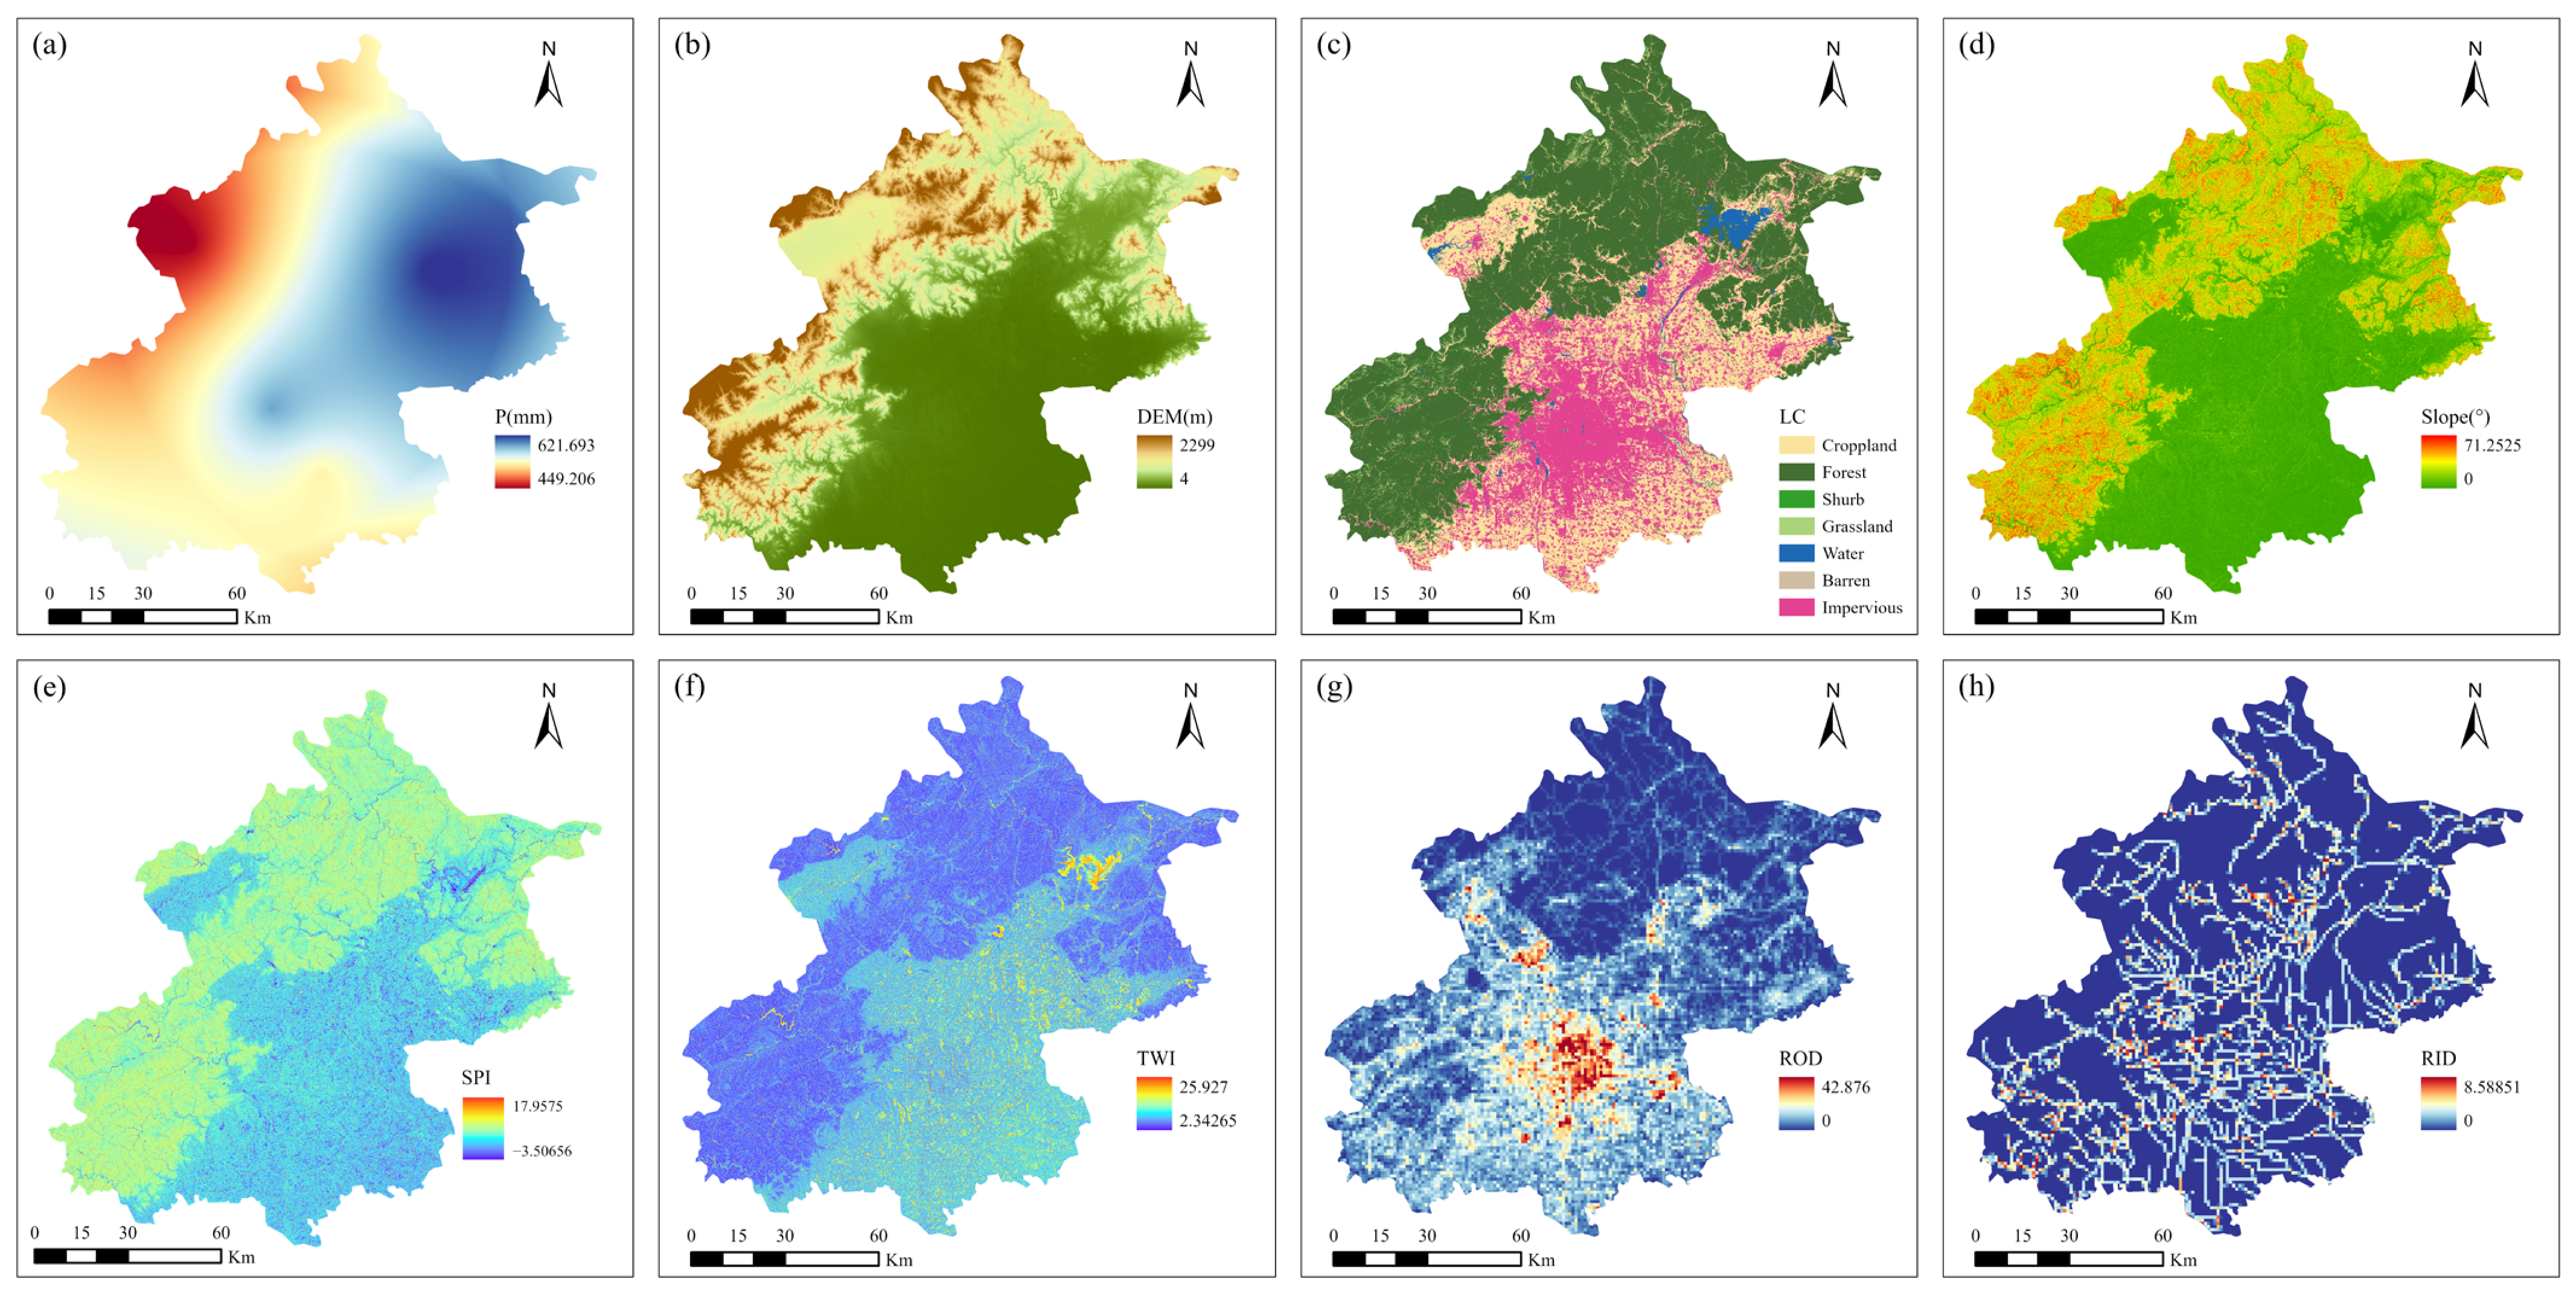
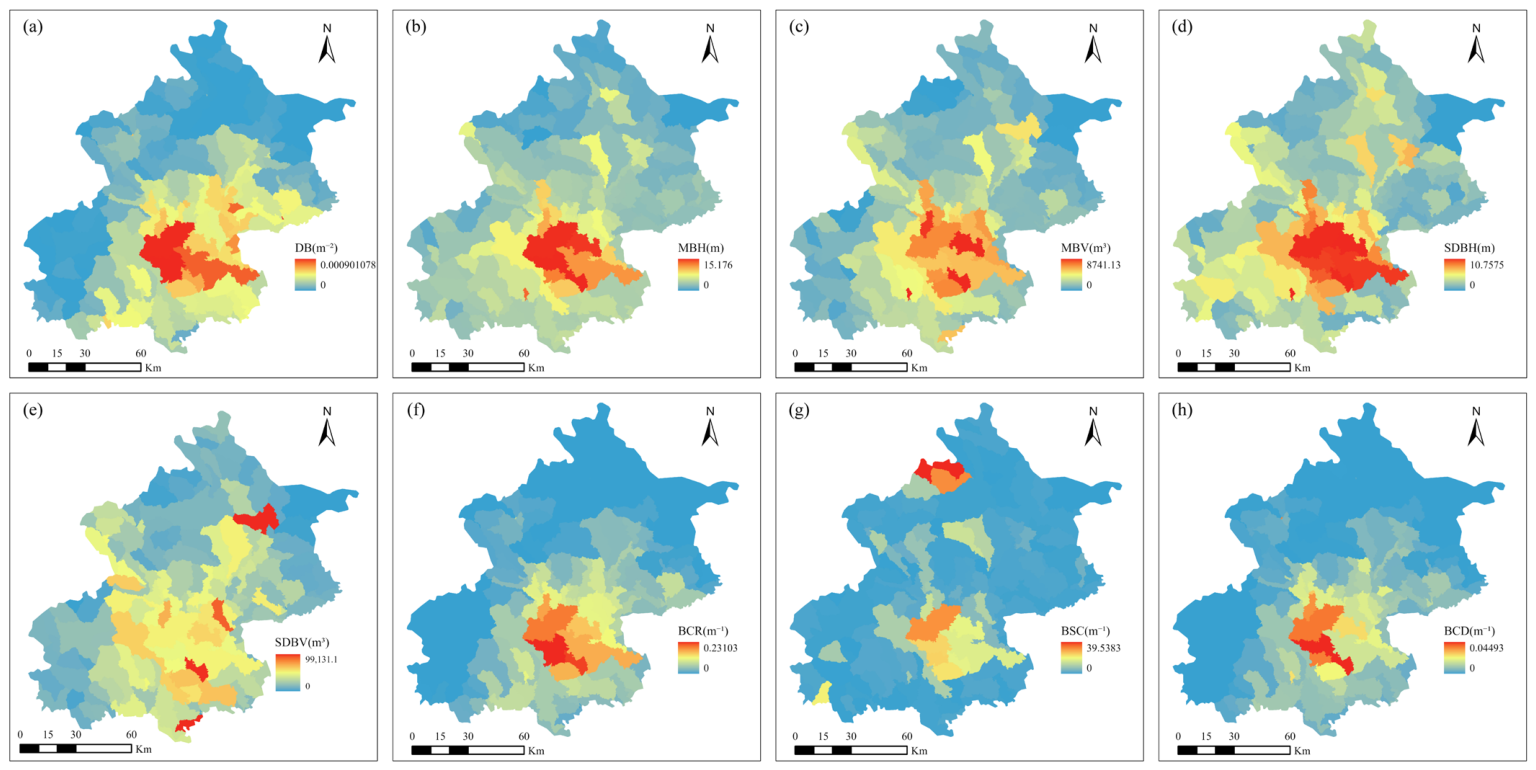
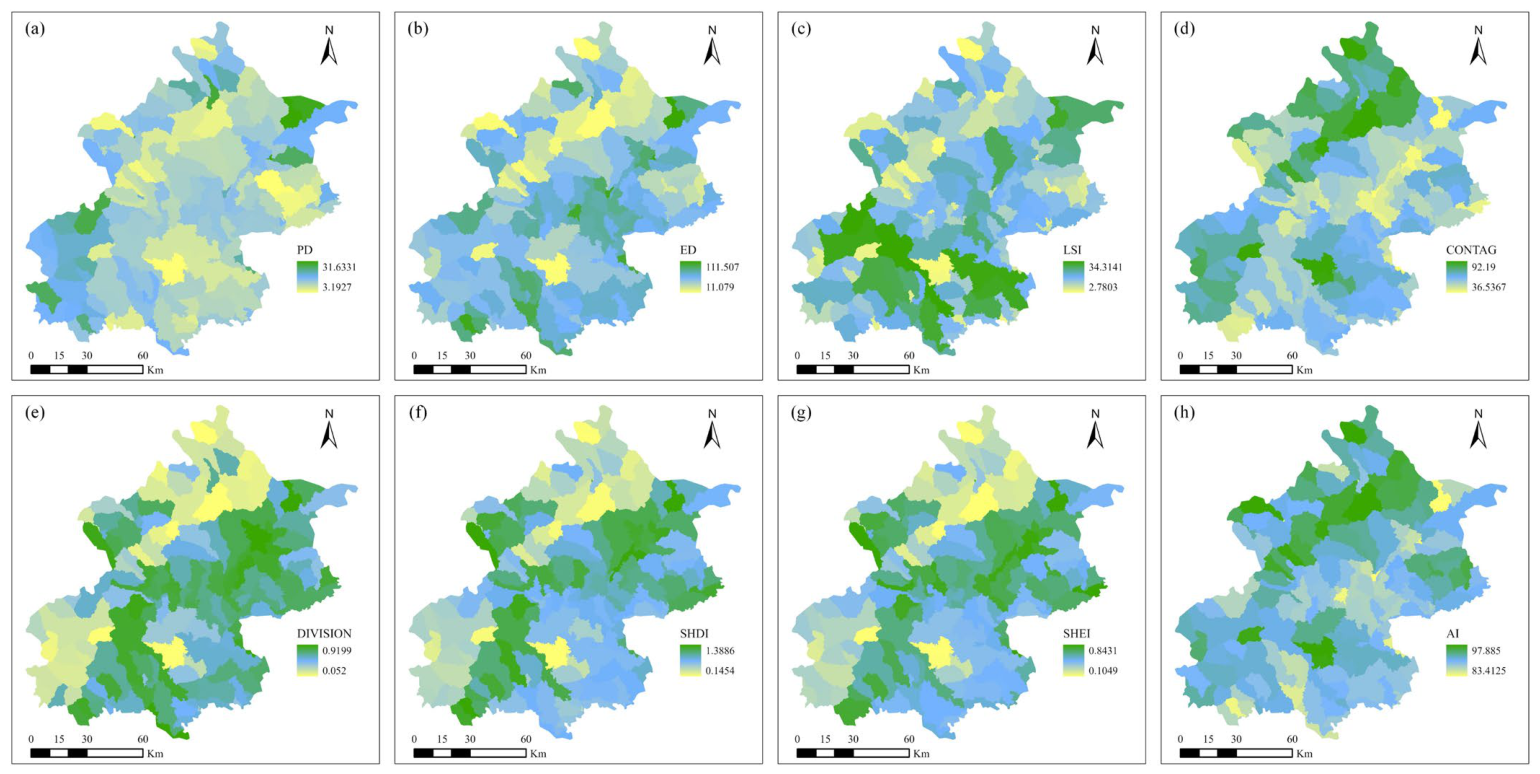
We collect and handle twenty-four indicator datasets within a GIS framework, and we generate twenty-four raster layers at a spatial resolution of 30 m × 30 m using the resampling tools. Specifically, annual average precipitation (P) for Beijing (1990–2020) is obtained from the Beijing Open Data Platform, with spatial contours generated via kriging interpolation. A 30 m resolution DEM is sourced from the Geospatial Data Cloud (http://www.gscloud.cn). Land-use data comes from the China Land Cover Dataset (1985–2022) (https://zenodo.org/records/8176941) (accessed on 10 December 2025), where codes 1–9 represent nine land cover types (e.g., cropland, forest, and impervious land). Slope is derived using ArcToolbox-3D Analyst, and SPI and TWI were calculated accordingly [58,59]. Road and river network data for Beijing are extracted from Open Street Map (OSM). Their densities were calculated within a GIS-based fishnet grid as the respective lengths per grid cell. Figure 3a–h present the spatial distributions of eight hydrogeographic indicators across Beijing: P, DEM, LC, Slope, SPI, TWI, ROD, and RID. The mathematical methods for calculating urban building indicators are also listed in Table 1. The complete building datasets for building height, footprint, and floor number across Beijing are sourced from “Building height of Asia in 3D-GloBFP” provided by Che et al. [60] (https://zenodo.org/records/11397015) (accessed on 10 December 2025). By assuming that each building is a column, the building volume is calculated by multiplying the base area and the height. These indicators are estimated within each sub-catchment unit. Sub-catchment units are delineated based on street boundaries and the terrain. Figure 4a–h presents spatial maps of eight urban building indicators: DB, MBH, MBV, SDBH, SDBV, BCR, BSC and BCD. Table 2 also presents the approaches for quantifying landscape metrics. In this study, on the basis of land-use types, these landscape pattern metrics within each sub-catchment are calculated using FRAGSTATS 4.2 software [34], including PD, ED, LSI, CONTAG, DIVISION, SHDI, SHEI and AI, as shown in Figure 5a–h, respectively. Finally, Table 4 lists all of the source information for the twenty-four indicators adopted in this study.

3.2. Information on Application of ML-Based Susceptibility Prediction

In reference to previous studies [61,62], in this study, five kinds of ML models, namely, decision tree (DT), random forest (RF), naïve Bayes (NB), adaptive boosting (AdaBoost), and extreme gradient boosting (XGBoost), are chosen to perform waterlogging susceptibility mapping for Beijing. The DT model has good interpretability. By building a tree structure and dividing the dataset according to features, it can intuitively show a complete decision-making process [63]. The RF model is essentially an integrated ML algorithm that builds multiple decision trees and combines their outputs to improve accuracy and robustness while minimizing overfitting [45]. The NB model is a classification method grounded in Bayes’ theorem, performing well in terms of effectively handling complex and incomplete data when making large-scale predictions [64]. The AdaBoost model focuses on samples that were previously misclassified, and it can combine multiple weak classifiers into a strong classifier [65]. The XGBoost model optimizes the gradient boosting algorithm, including parallel computing and the introduction of regularization, and can effectively process large-scale datasets [66]. More introductory details regarding DT [67], RF [56,61,68], NB [69], AdaBoost [67] and XGBoost [66] can be found in relevant studies.
These ML models are built and evaluated using the open-source Sklearn package within Python 3.10 for this study. The performance of five kinds of ML models is evaluated using the receiver operating characteristic (ROC) curve, the area under the ROC curve (AUC), and the accuracy [63,70]. Hyperparameter tuning is crucial to the performance of ML models [37]. In this respect, we adopt the Optuna method, a hyperparameter tuning method that was proposed by [71,72,73], to optimize the hyperparameters of each model. After 100 experiments are conducted using the Optuna algorithm, the best hyperparameter combinations are identified, as presented in Table 5. Some untuned hyperparameters are set to use default values in this study. The accuracy values are listed in the last column in Table 4, revealing a satisfactory performance for the training datasets. Finally, we split the dataset for Beijing into two parts: 70% for training models, and the remaining 30% for validation. Then, the trained model is used to make probability predictions for each grid, and the probability value is regarded as the waterlogging susceptibility within the grid.
To interpret the ML models, we apply the SHapley Additive exPlanations (SHAP) method to measure the influence of each explanatory indicator on the waterlogging susceptibility outputs. SHAP is based on the concept of cooperative game theory for interpreting ML predictions [37]. This approach aims to demonstrate the overall impact of each explanatory indicator on model outputs across the entire dataset and provides interpretations of how each indicator affects the prediction results for given samples at the global and local levels [70,74]. More introductory details regarding the theory and application of the SHAP values can be found in previous studies [69,74].

3.3. Resilience-Related Data Gathering and Handling

Basic datasets of ten indicators for waterlogging resilience assessment are also processed in an ArcGIS 10.8 software environment. We extract the terrain curvature for Beijing by applying the “Curvature” tool in ArcGIS. The NDVI data for Beijing in 2024 employed in this study is derived from a high-quality monthly NDVI dataset for China covering the period 2000 to 2024 at 250 m resolution, which was generated by Gao et al. [75]. Regarding the drainage capacity in Beijing, in consideration of the deficient pipe network data due to a limitation in data availability, this study attempts to evaluate it using the density of the road network as presented in previous studies [76,77]. The drainage capacity D R C i for raster grid i could be expressed as a function of the density λ i of the road network relative to the average road network density λ ¯ : D R C i = λ i / λ ¯ . For quantifying it, we extract the road network for Beijing from OpenStreetMap (OSM), and then calculate road network density via a fishnet grid. Finally, we estimate the drainage capacity for Beijing using the above formula. However, it should be acknowledged that this compromise is inevitable. In practice, owing to the exorbitant cost of acquiring detailed sewer network datasets, proxying regional drainage capacity via road density has become a practice for large-scale assessments of urban resilience and waterlogging risk in many previous studies. In a waterlogging exposure risk evaluation across the mid-southern Liaoning urban agglomeration, Wang et al. [76] adopted road density as an alternative indicator of drainage capacity due to unavailable pipe network data and verified the reliability of this surrogate in capturing the spatial pattern of waterlogging hazards. Lastly, we acknowledge that the DRC index adopted herein serves as a road-density-based proxy for drainage capacity, rather than a direct metric quantifying underground sewer and pipe network performance. This limitation may overestimate urban flood resilience within aged, densely built central districts, an issue that merits deeper examination in future research.
We extract point of interest (POI) data for hospitals, fire stations, and police stations from Gaode maps of Beijing and calculate the Euclidean distances to each facility type in ArcGIS. GDP data for Beijing are obtained from a 1 km × 1 km gridded product of revised real GDP compiled by Chen et al. [78], while education status data are sourced from Beijing statistical yearbooks. The gridded GDP dataset was produced via an allocation approach modified with true growth rates. The core procedure employs the PSO-BP algorithm to fit the nonlinear correlation between national aggregate GDP and total nighttime light for deriving gridded allocation weights. The coefficient of determination (R2) between official national GDP and model-estimated GDP exceeds 0.99 across all countries, revealing outstanding goodness-of-fit and explanatory capacity of the model in capturing the intricate linkage between economic output and nighttime light intensity. Accordingly, uncertainties originating from the gridded GDP disaggregation for the base year are substantially reduced. To quantify the social media-based public sentiment toward waterlogging, we collect Weibo check-in data for Beijing during the “23·7” extreme rainstorm event using a Python crawler. Prompt words are set using “DeepSeek-v3.2” to assign a positive probability score (varying between 0 and 1) to each data entry, with higher scores indicating a greater likelihood that the entry reflects positive public emotions toward waterlogging events. We apply the Kriging interpolation method to generate the distribution map of public sentiment scores (STS) across Beijing.
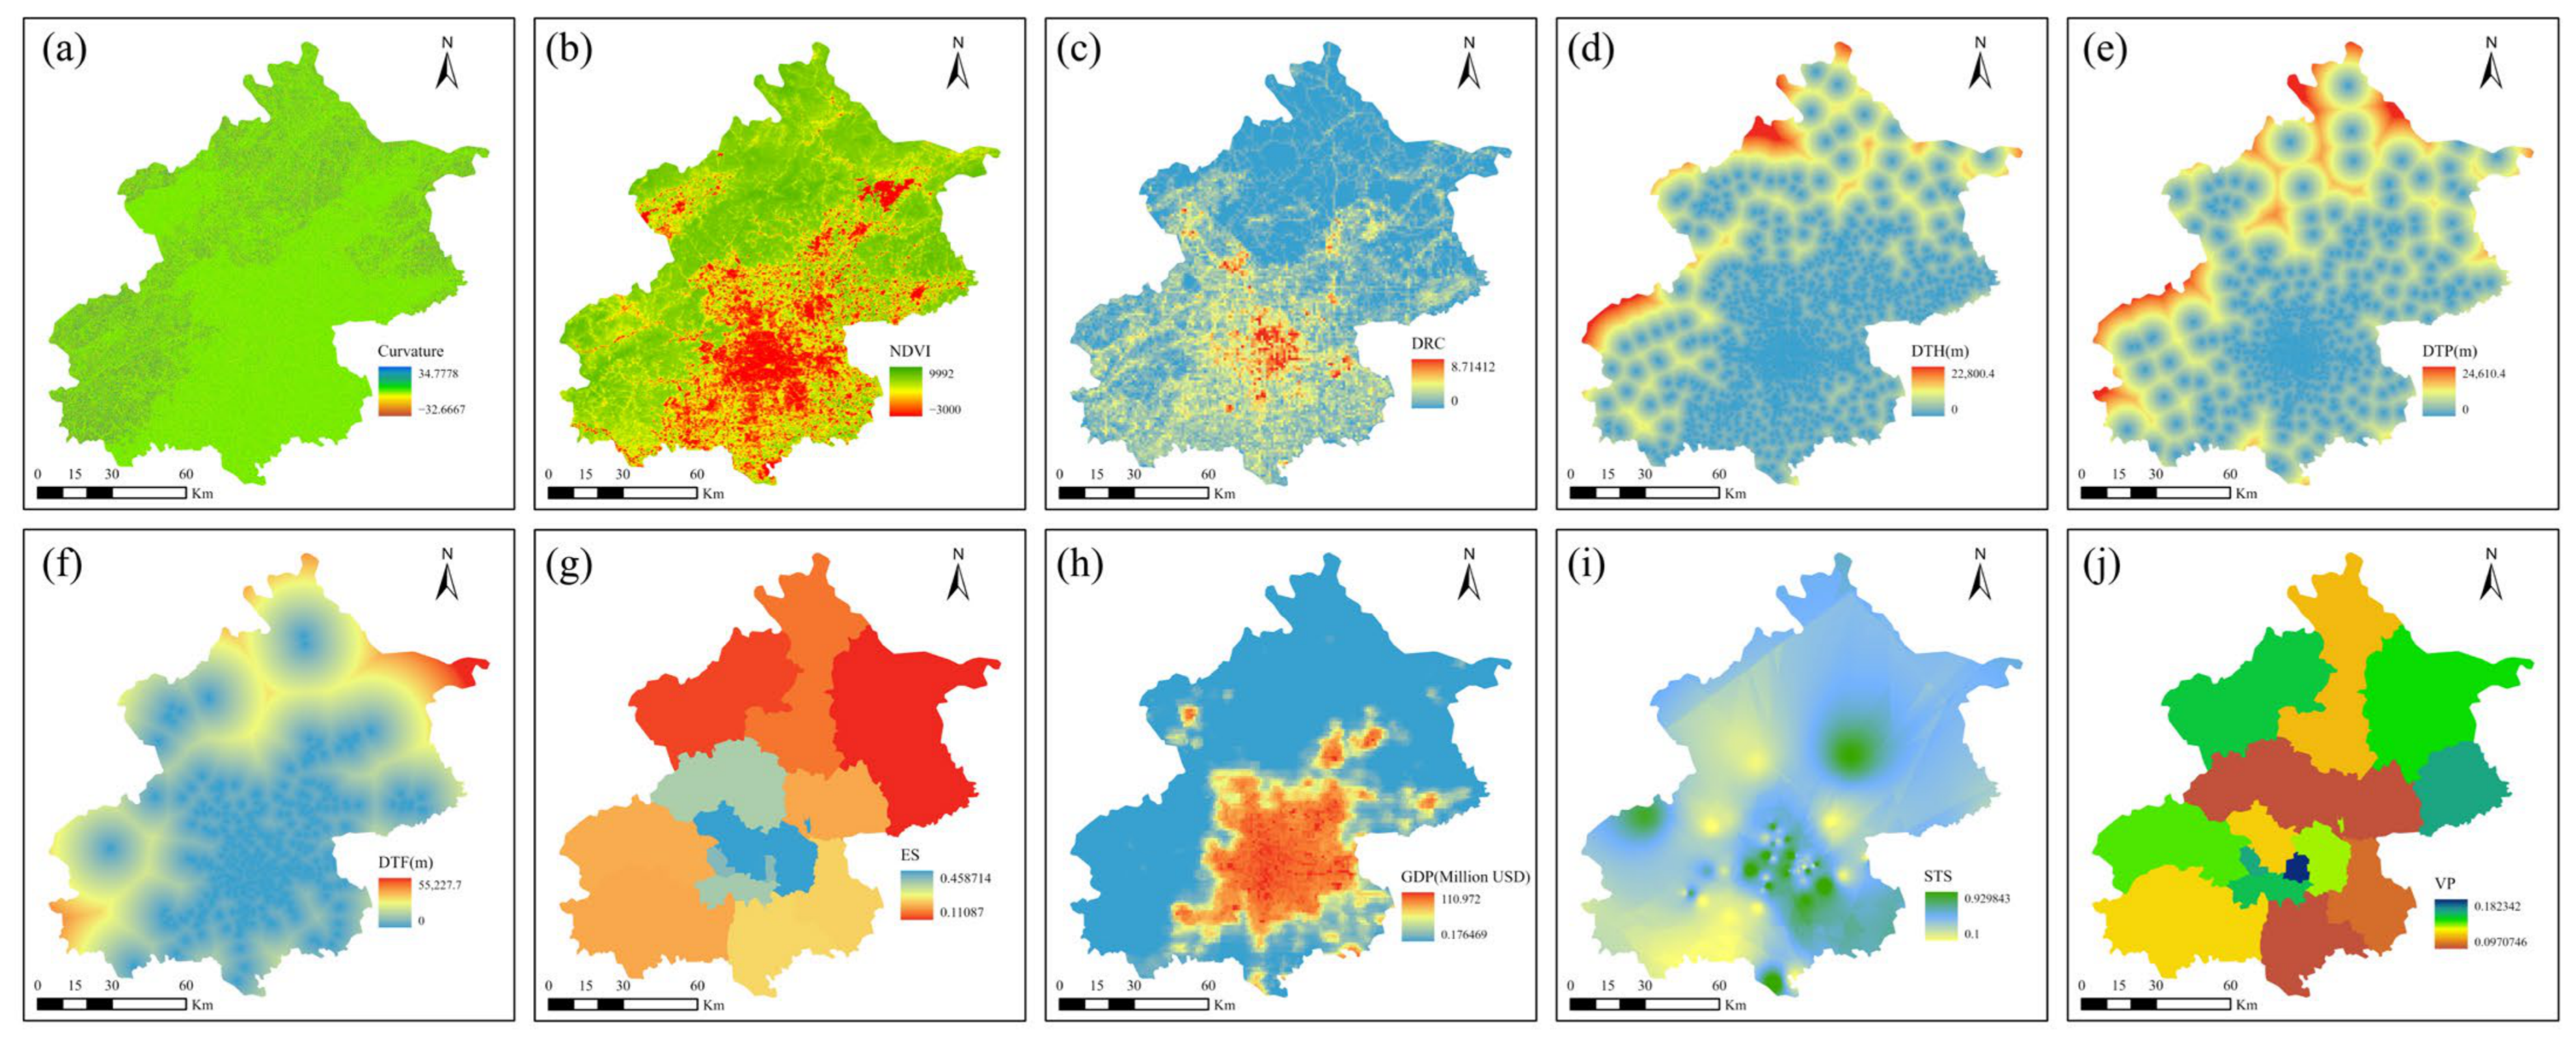
Finally, we resample the raster layers to a 30 m resolution using ArcGIS tools, producing ten layers for later resilience prediction (Curvature, NDVI, DRC, DTH, DTP, DTF, GDP, ES, STC and VP), as shown in Figure 6a–j.

3.4. Entropy Weight Method for Resilience Prediction

We adopt the EWM to estimate the weights of each of the ten indicators within the resilience multi-indicator assessment framework. EWM is an objective weighting approach grounded in information theory [79,80]. Determining indicator weights using EWM involves three key steps: data normalization, information entropy calculation, and weight determination. Further details on the estimation procedures are available in Xiang & Lyu [79] and Wu et al. [81]. All of the weight values for ten resilience indicators are also listed in the fourth column of Table 3.
After determining the urban intrinsic resilience, emergency response resilience, and social-economic resilience using the above method, urban waterlogging resilience can be estimated by integrating them using Equation (1), which indicates their equal importance [82]:
UWR = UIR × ER × SER 3
where UWR, UIR, ER and SER denote the urban waterlogging resilience, urban intrinsic resilience, emergency response resilience, and social-economic resilience respectively.

3.5. Waterlogging Risk and Its Inequality Assessment

Risk can be estimated by considering some basic elements, such as hazard, exposure, and vulnerability. Given that urban residents represent one of the most critical disaster-affected entities in waterlogging events, and that urban resilience has the potential to mitigate associated risks, we propose a framework to estimate the urban waterlogging risk level by comprehensively integrating the susceptibility, exposure, and resilience in the study, as expressed by Equation (2):
R = S × E × 1 UWR
where R denotes the integrated urban waterlogging risk and S and E are waterlogging susceptibility and population exposure, respectively. The calculation method for S is presented in Section 3.1 and Section 3.2, and Equation (1) in Section 3.4 is adopted to estimate UWR. For E , we adopt the population density as an indicator to characterize the waterlogging exposure across Beijing in 2023, which is derived from the LandScan population dataset platform (LandScan Global Database) [83]. However, since this dataset has a spatial resolution of only 1 km × 1 km, we apply spatial resampling techniques to upscale the susceptibility and resilience results from a 30 m resolution to a 1 km scale to ensure the logical consistency of risk assessment across spatial dimensions. Although this scale transformation smooths local features to a certain extent, it enables a more accurate alignment with exposure at the macro level.
Furthermore, we employ the Gini index to assess the inequality of spatial distribution of waterlogging risk across Beijing. The Gini index is derived from the Lorenz curve and captures the degree of resource concentration among a small portion of the population. Its application has recently expanded to environmental inequality on heat risk [84] and urban green space accessibility [85]. Following these works, we adopt the Gini index to evaluate inequality in urban waterlogging exposure as follows, considering both population distribution and risk levels:
Gini = 1 i = 1 n p i × j = 1 i R j × p j + j = 1 i 1 R j × p j j = 1 n R j p j
where n denotes the total number of units across the research area, p i is the ratio of the population in the i -th unit to the total population, and R j and p j represent the waterlogging risk level and population proportion within the j -th unit, respectively. Elaborate descriptions and derivation processes are presented in Figure S1 and Section S1 in the Supplementary Materials. The Gini index takes values between 0 and 1, where larger values indicate more severe inequality. Specifically, values approaching 0 (e.g., below 0.3) reflect a low level of inequality, whereas values nearing 1 (e.g., above 0.4) denote a high level of inequality.

4. Results

4.1. Urban Waterlogging Susceptibility

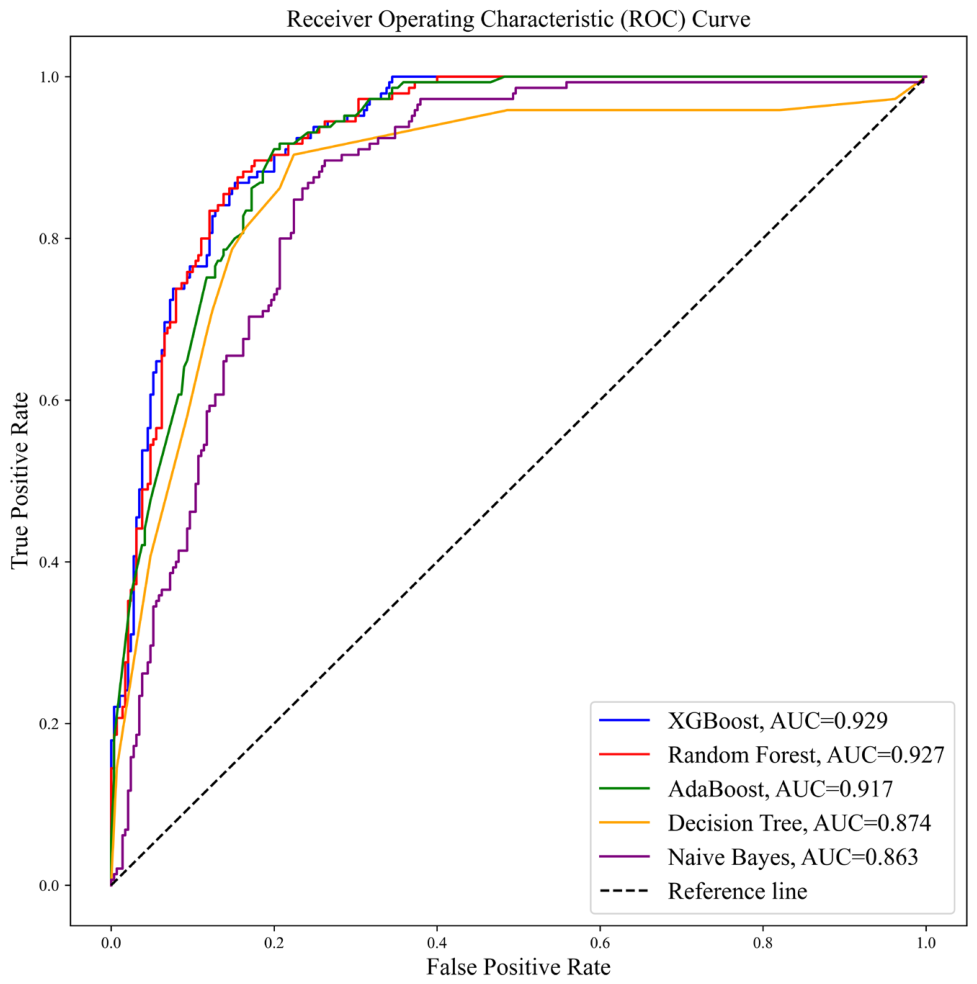
As shown in the last column of Table 5, all five ML models perform well on the training datasets in terms of accuracy; however, XGBoost achieves a marginally higher accuracy than RF, while RF in turn performs substantially better than AdaBoost, DT, and NB. This finding indicates that XGBoost has the strongest predictive ability and generalization performance when applied to the current dataset. Furthermore, Figure 7 shows the ROC curves for all the ML models with the largest AUC scores. Among these five ML models, the AUC score for XGBoost is slightly higher than that for RF, and AdaBoost, DT, and NB are in descending order. This result suggests that XGBoost achieves the best performance in discriminating between positive and negative classes while also optimizing the trade-off between false positives and true positives. Therefore, herein, we show the urban waterlogging susceptibility map in Beijing developed using XGBoost and adopt it for later waterlogging risk and its inequality assessment. Additionally, given the opaque nature of the waterlogging inventory, we also perform a sensitivity analysis toward the XGBoost-based susceptibility model. All details are presented in Section S2 in the Supplementary Materials. The test results show the robustness and stability of XGBoost model.
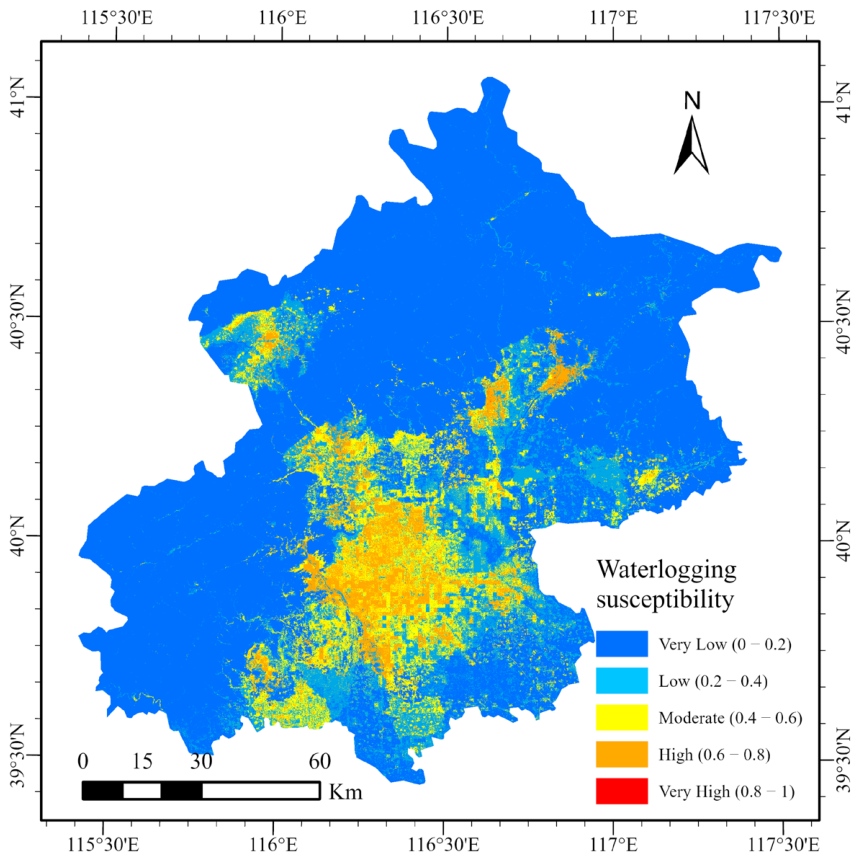
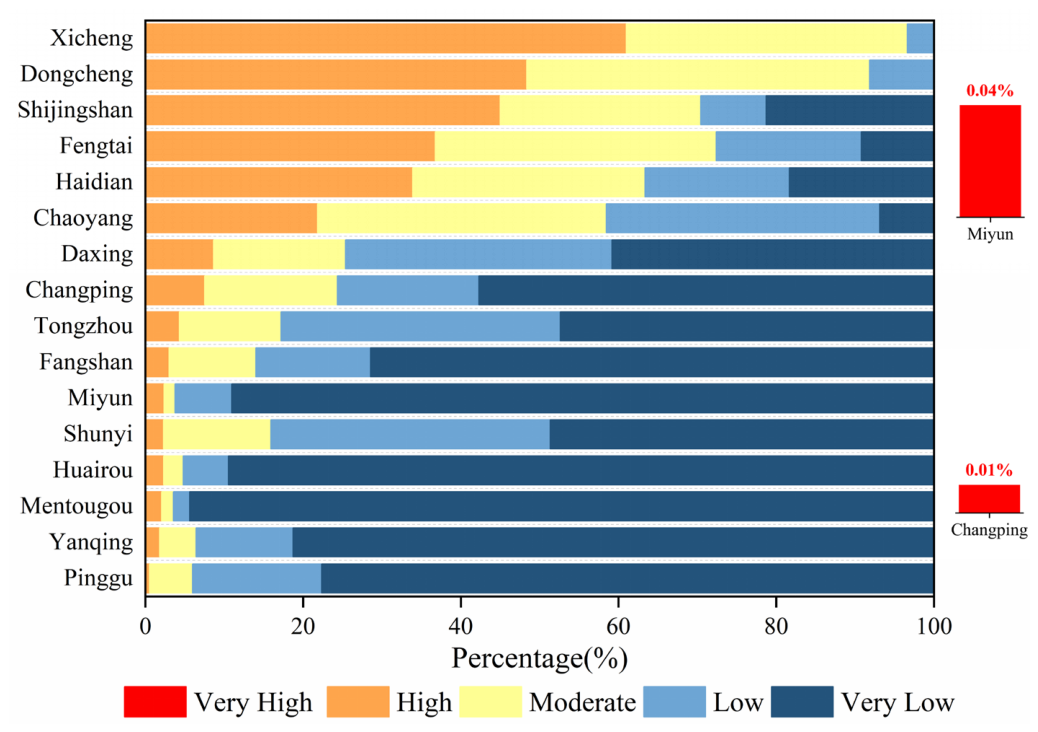
Figure 8 presents the XGBoost-derived waterlogging susceptibility map of Beijing, with susceptibility scores classified into five levels: very low (0–0.2), low (0.2–0.4), moderate (0.4–0.6), high (0.6–0.8), and very high (0.8–1). Obvious spatial heterogeneity is observed in the distribution of waterlogging susceptibility across the study area. High- and very-high-susceptibility areas are predominantly concentrated in central urban regions, accounting for only 5.69% and 0.01% of Beijing’s total area, respectively. In contrast, suburban areas are dominated by very low and low-susceptibility zones, which collectively occupy 84.62% of the entire study area, while moderate-susceptibility regions account for the remaining 9.67%. The area proportions of five susceptibility levels across all administrative districts are further quantified in Figure 9. Very-high-susceptibility areas are extremely limited across the city, sporadically distributed in Changping (0.01%), Miyun (0.04%), and Huairou (0.03%) districts. High susceptibility exhibits distinct spatial aggregation in central urban districts, with Xicheng District recording the highest proportion (60.99%), followed by Dongcheng (48.38%), Shijingshan (45.01%), and Fengtai (36.78%) districts. By comparison, suburban districts show considerably lower high-susceptibility ratios, including Daxing (8.67%), Changping (7.53%), and Tongzhou (4.34%), while remote suburbs such as Miyun (2.34%), Huairou (2.31%), and Mentougou (2.06%) present the lowest proportions. Moderate-susceptibility areas are scattered across the city, with the highest proportions observed in Dongcheng (43.47%), Chaoyang (36.63%), Fengtai (35.61%), and Xicheng (35.66%) districts. Suburban areas, including Tongzhou (12.87%), Shunyi (13.61%), and Changping (16.83%), show moderate proportions, whereas remote suburbs such as Miyun (1.40%), Mentougou (1.50%), and Huairou (2.46%) have negligible moderate-susceptibility coverage. Low-susceptibility zones are mainly distributed in Tongzhou (35.42%), Shunyi (35.42%), Daxing (33.80%), and Chaoyang (34.66%) districts. Central urban districts, namely Xicheng (3.35%) and Dongcheng (8.14%), show low proportions of low susceptibility, consistent with remote suburban regions including Miyun (7.20%), Mentougou (2.06%), and Huairou (5.75%). Conversely, very-low-susceptibility areas are predominantly concentrated in outer suburbs. Mentougou (94.38%), Huairou (89.45%), Miyun (89.02%), Yanqing (81.26%), and Fangshan (71.43%) districts all have over 70% coverage of very low-susceptibility zones, while central urban districts only contain a small fraction of such areas. Overall, urban waterlogging susceptibility in Beijing presents a clear spatial gradient, gradually decreasing from the urban core to outer suburbs. Central urban areas are dominated by moderate and high waterlogging susceptibility, whereas outer suburban regions are characterized by low susceptibility levels.

4.2. Urban Waterlogging Resilience

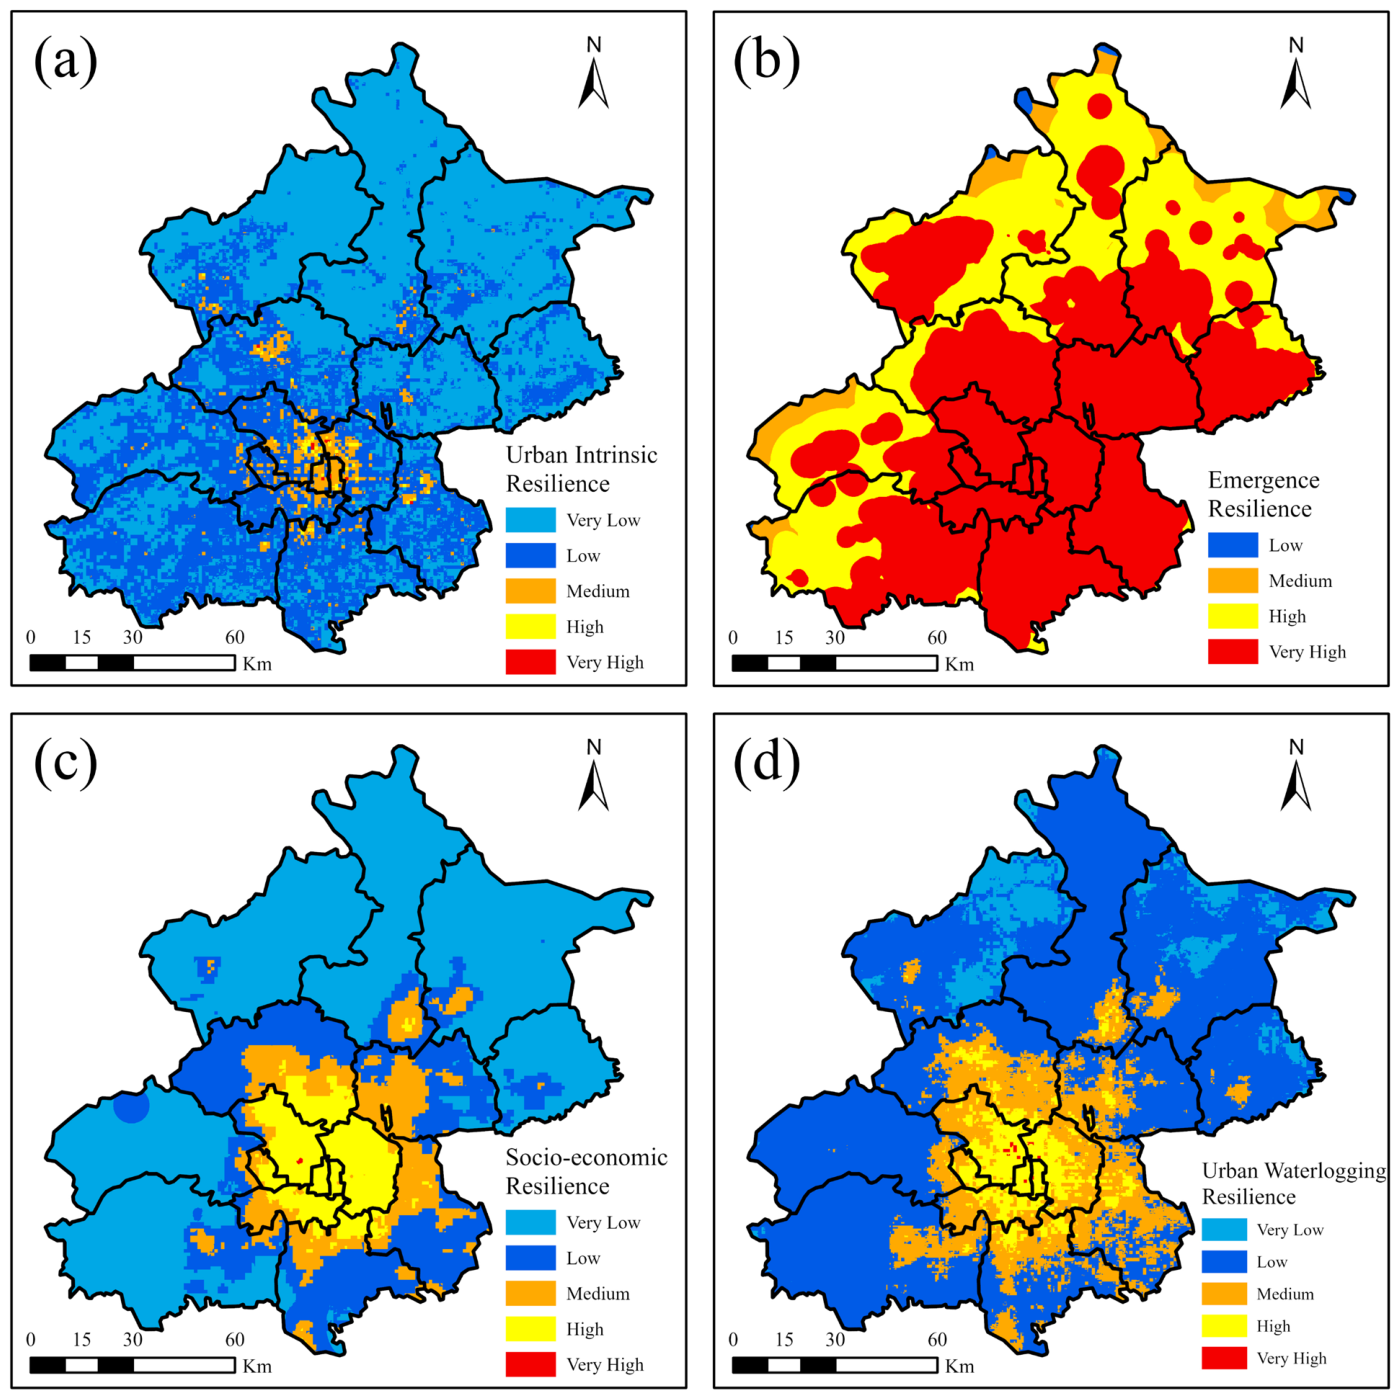
Figure 10a–d illustrates the spatial distributions of urban intrinsic resilience (UIR), emergency response resilience (ER), socioeconomic resilience (SER), and integrated urban waterlogging resilience (UWR) across Beijing. All resilience indicators are classified into five levels (very low, low, moderate, high, and very high) using the natural breakpoint method. For UIR (Figure 10a), very low and low resilience areas widely dominate the western, northern, and northeastern regions of Beijing. By comparison, high and very high UIR areas occupy a relatively small proportion and present spatially discontinuous and patchy distributions. These high-resilience patches are primarily clustered in central urban areas and are fragmented and surrounded by moderate-resilience zones. In contrast, ER exhibits strong spatial connectivity of high-value regions (Figure 10b). Low ER zones are scarce and limited to the northern suburban fringe, including Yanqing, Huairou, and Miyun districts, while no very low ER areas exist across the study area. This pattern is attributable to the dense distribution of medical, fire, and public security facilities in urban built-up areas, which sustains robust emergency response capacity throughout populated regions. SER presents a typical core–periphery spatial pattern (Figure 10c). Very high and high SER values are exclusively concentrated in urban core zones, and resilience values decline sharply toward suburban areas. Near suburbs, including Changping, Tongzhou, and Daxing districts, are dominated by low-to-moderate SER levels, while remote outer suburbs (Yanqing, Huairou, Miyun, Mentougou, and Fangshan) predominantly feature low and very low SER. The integrated UWR, derived from three resilience components, displays a clear center-to-periphery decreasing gradient (Figure 10d). High UWR values are concentrated in Dongcheng, Xicheng, Chaoyang, Haidian, Fengtai, and Shijingshan districts, forming a robust core region for waterlogging disaster resistance with prominently higher resilience than surrounding areas. Away from this urban core, resilience gradually transitions from moderate to low, and remote districts such as Mentougou, Yanqing, Huairou, Miyun, and Pinggu are extensively covered by low UWR levels. This spatial feature indicates an unbalanced urban flood resilience pattern, characterized by extremely strong resilience in the urban center and considerably weak resilience in peripheral suburban areas.

4.3. Urban Waterlogging Risk

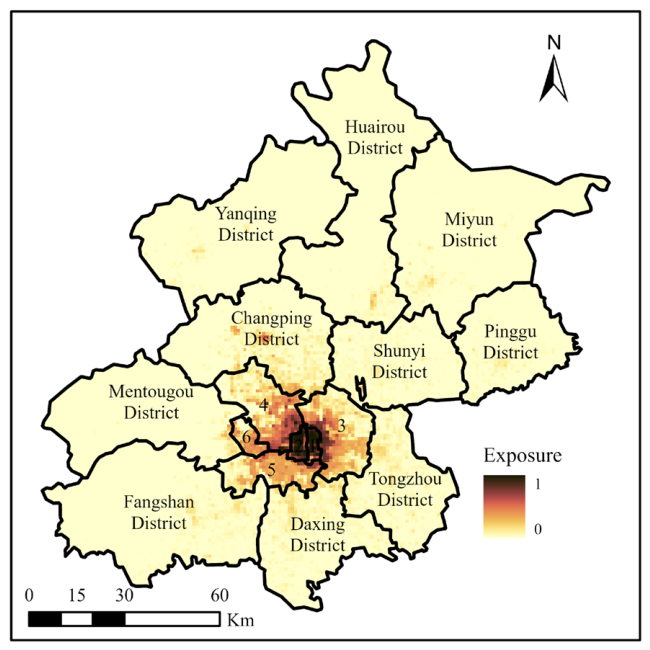
As shown in Figure 11, waterlogging exposure in Beijing follows a clear center-to-periphery gradient. The core districts, including Dongcheng, Xicheng, Chaoyang, and Haidian, have the highest exposure. Exposure then declines in a ladder-like fashion outward: surrounding districts (Fengtai, Shijingshan, Tongzhou, Shunyi, and Changping) show moderately high exposure, and remote districts (Mentougou, Fangshan, Daxing, Huairou, Miyun, Yanqing, and Pinggu) have the lowest exposure.
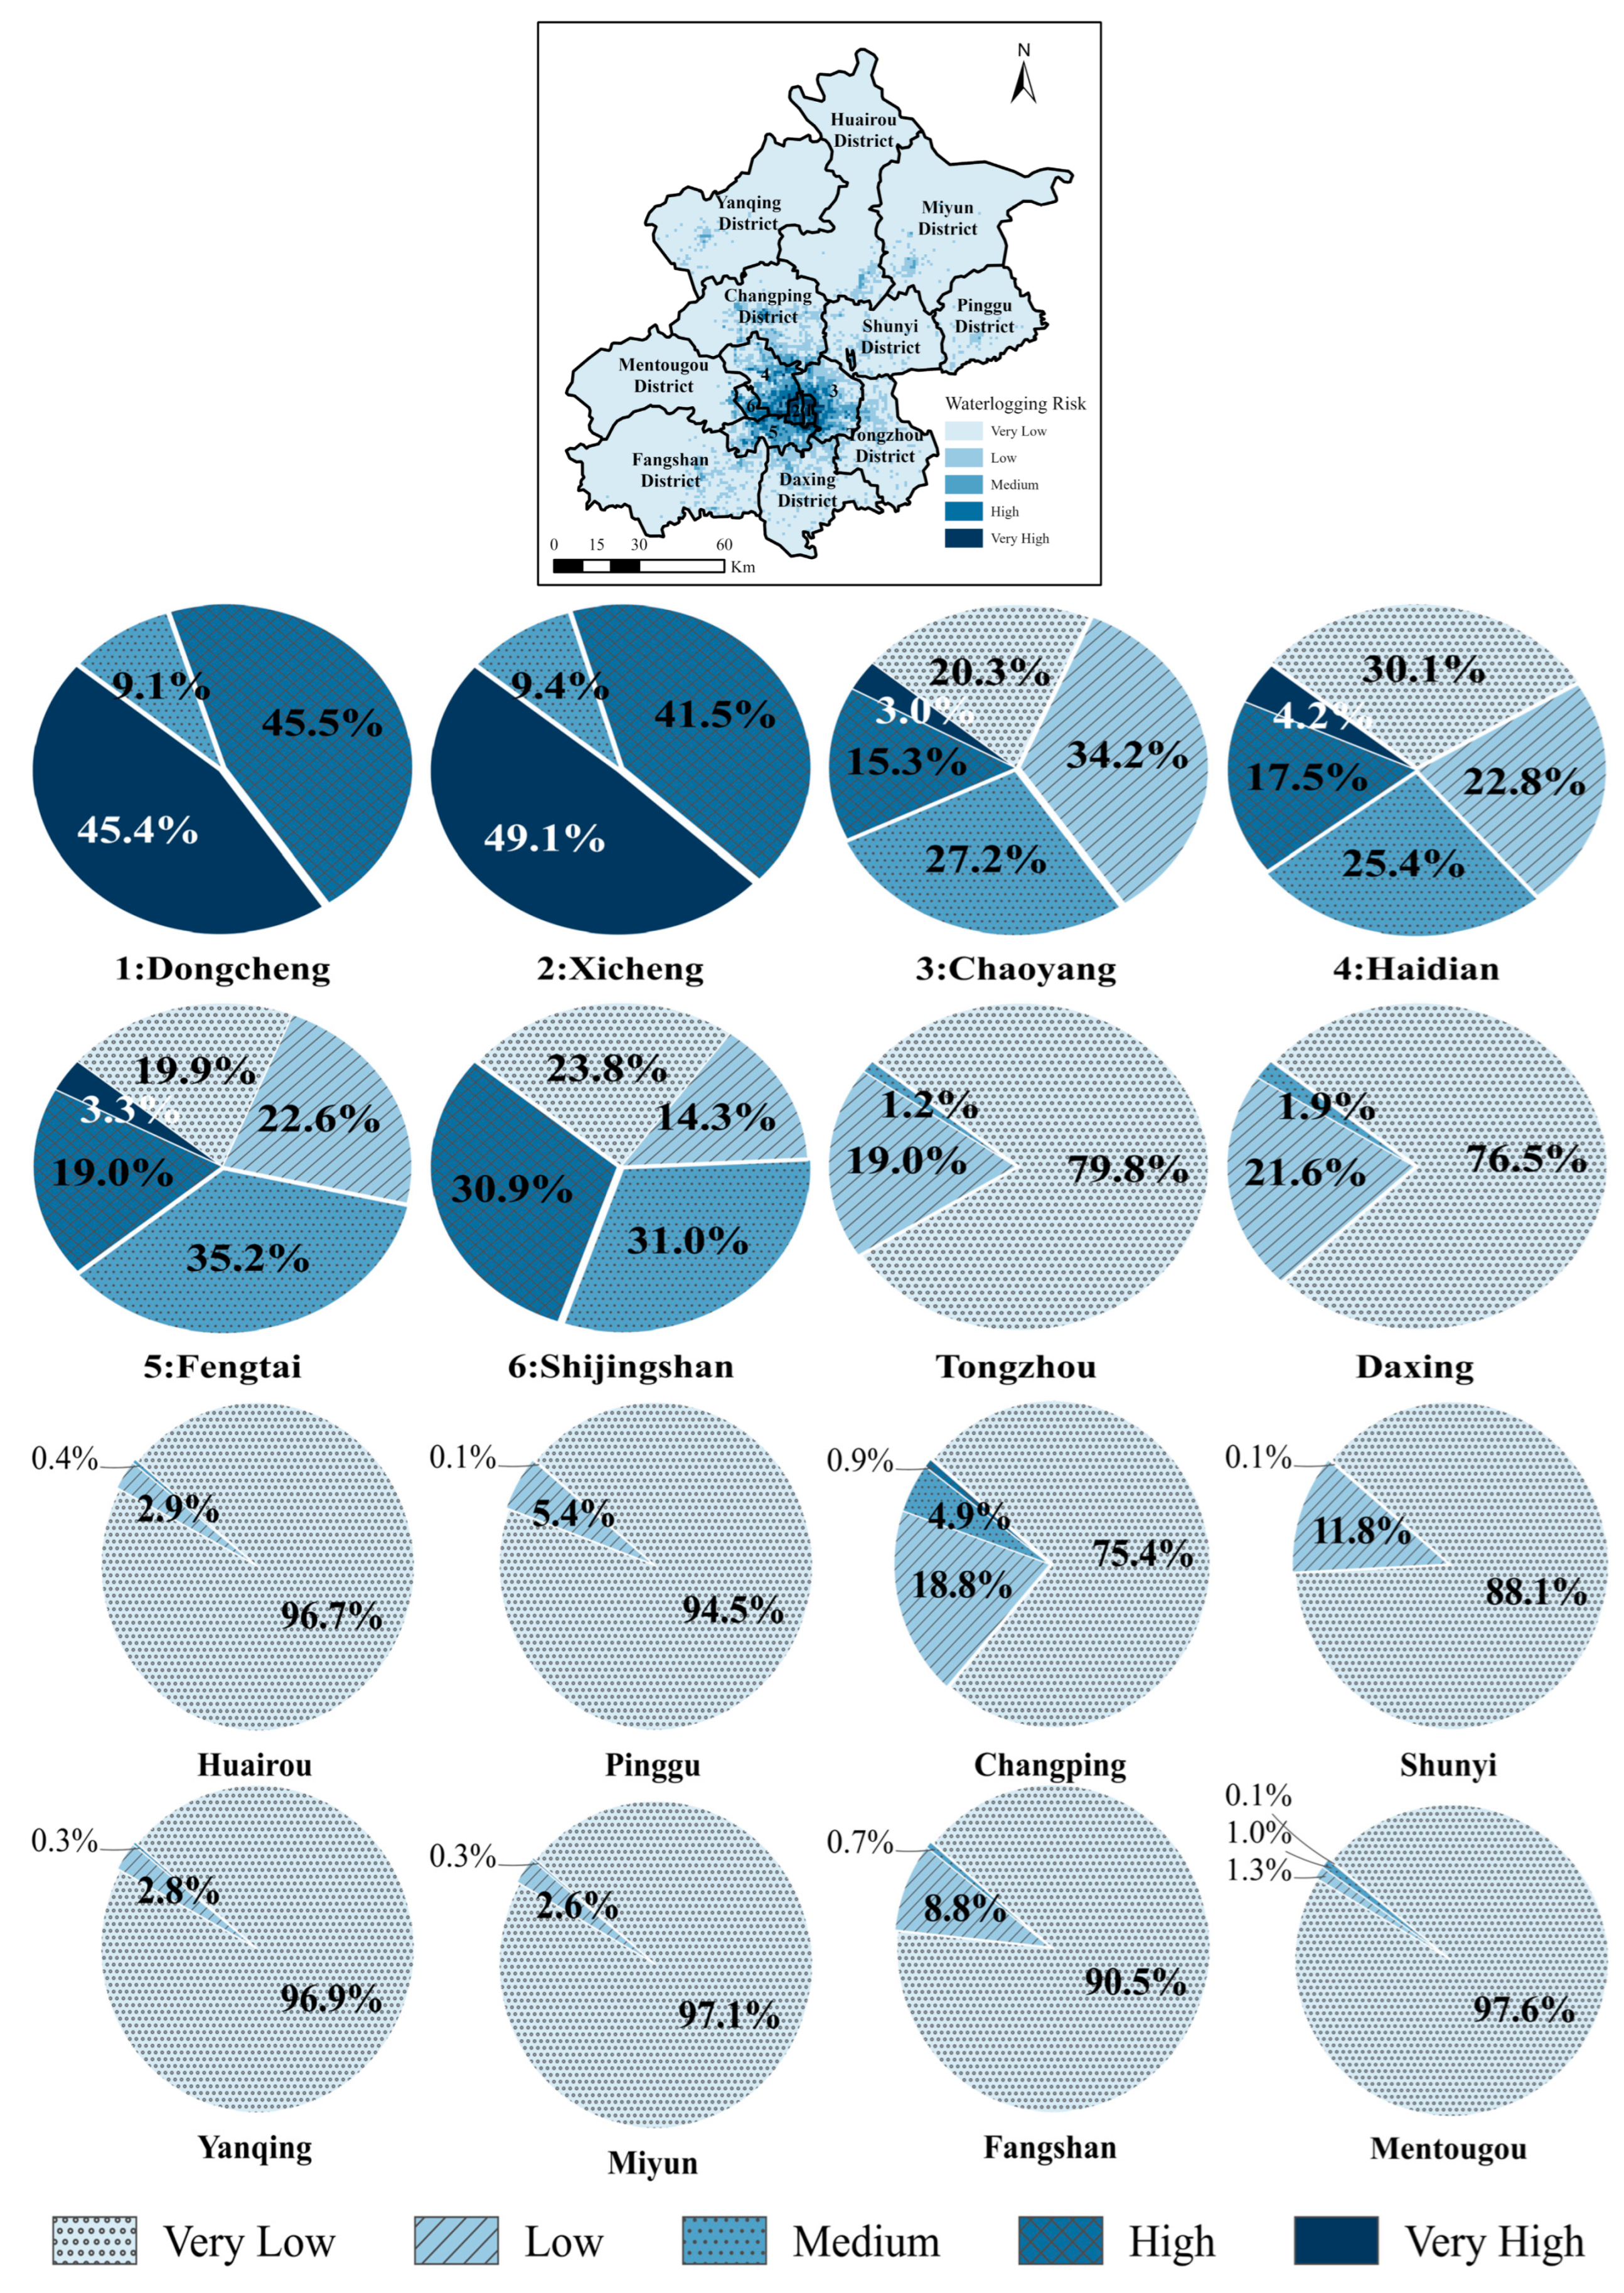
Figure 12 illustrates both the spatial patterns and areal percentages of waterlogging risk levels across districts, with the natural breakpoint method used to define five classes: very low, low, medium, high, and very high. A pronounced urban-rural divide characterizes the overall risk distribution. Within the central urban area, Dongcheng and Xicheng Districts experience predominantly very high and high risks, with very-high-risk zones occupying 45.45% and 49.06% of their respective areas. By contrast, other central districts such as Chaoyang, Haidian, and Fengtai exhibit only a minor share of very-high-risk areas, while five risk levels are more evenly mixed. Moving to the suburbs and outer suburbs, the very-high-risk class disappears entirely, and even the high-risk proportion remains small. In suburban districts like Changping, Tongzhou, Daxing, and Shunyi, low- and medium-risk zones appear sporadically, whereas very-low-risk areas dominate. For instance, in Daxing District, although the very-low-risk area still accounts for 76.46%, low-risk areas have reached 21.58%, forming localized small-scale risk patches. This pattern becomes even more striking in remote suburbs such as Miyun, Yanqing, Huairou, Pinggu, and Mentougou, where the very-low-risk share exceeds 97%. Overall, Beijing’s waterlogging risk can be spatially divided into three distinct layers: (1) the very-high-risk core of Dongcheng and Xicheng; (2) a transitional zone of mixed risk levels in central districts including Chaoyang, Haidian, and Fengtai; and (3) vast, stable very-low-risk areas in outer suburbs such as Miyun, Yanqing, Huairou, and Pinggu. This clear three-tier structure reveals an extreme spatial imbalance in waterlogging risk across Beijing.

4.4. Waterlogging Risk Inequality

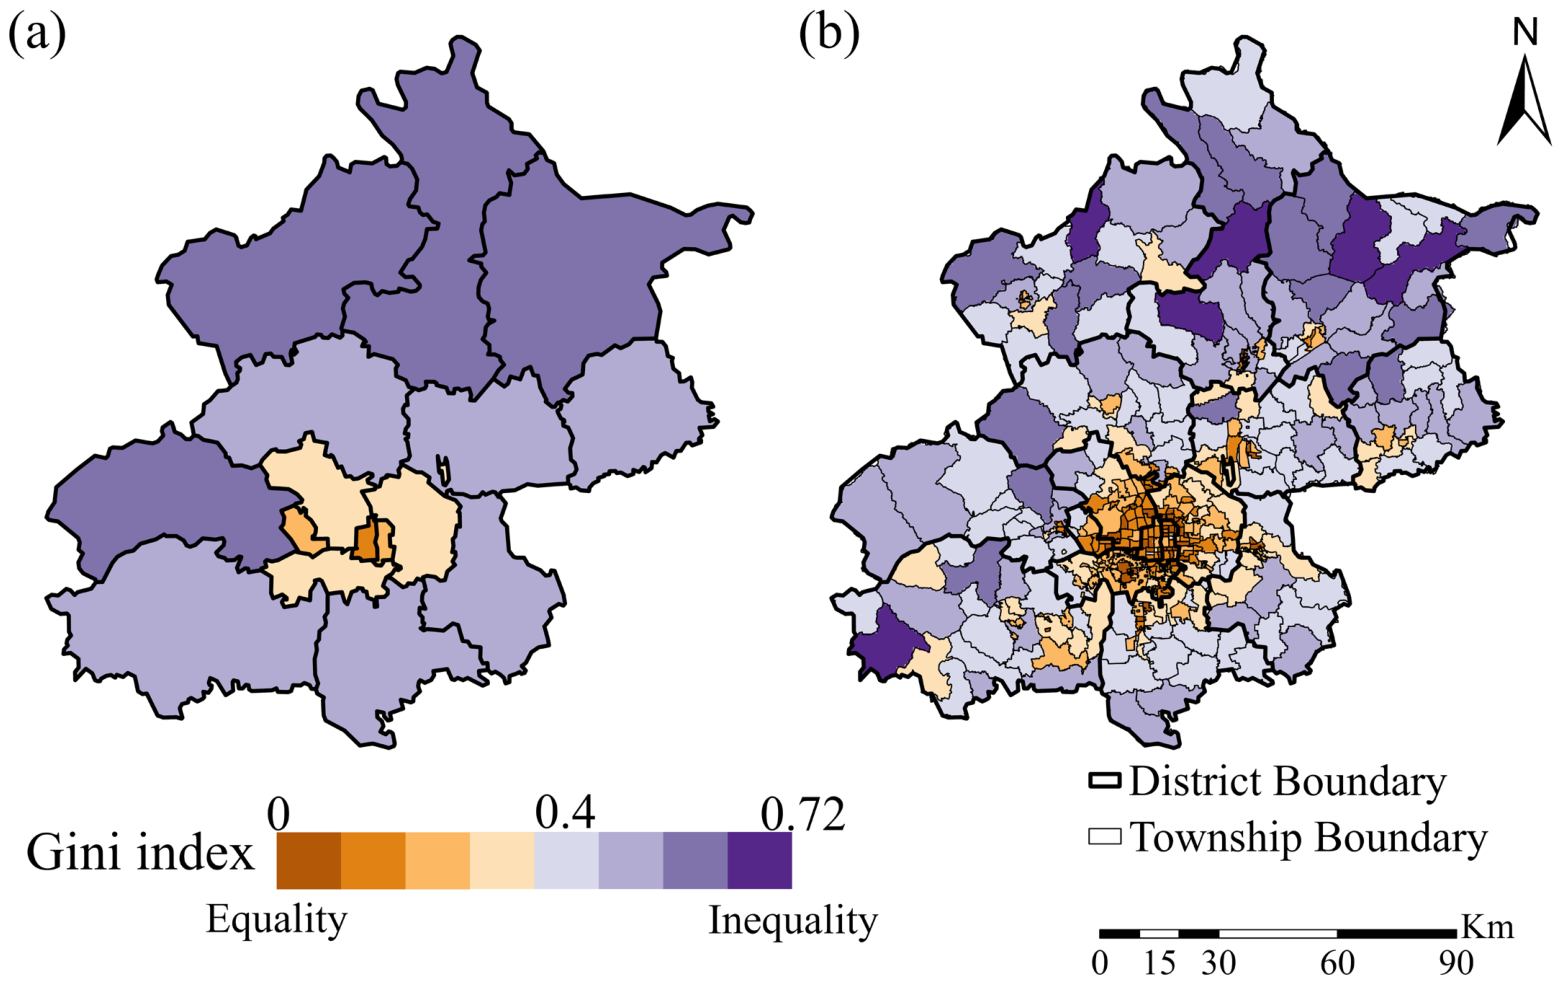
Figure 13a,b presents the spatial distribution of the Gini index for waterlogging risk inequality across Beijing at both district and township scales, divided into eight equal intervals for clearer visualization of spatial patterns. As shown in Figure 13a, the Gini index in Beijing’s suburban areas is substantially higher than in the central urban region. All six core districts, Xicheng, Dongcheng, Chaoyang, Haidian, Fengtai, and Shijingshan, record Gini values below the World Bank’s inequality warning line of 0.4. This indicates that, despite facing extremely high waterlogging risks, these districts distribute the risk burden relatively equitably, meaning the majority of the population bears the majority of the risk. In contrast, suburban districts such as Changping and Shunyi show Gini values slightly above 0.4, while Tongzhou and Daxing Districts have Gini coefficients around 0.49, pointing to some disparities in individual risk exposure. Notably, Miyun, Huairou, and Yanqing Districts rank as the top three in the Gini index, with Miyun exceeding 0.6. In these areas, high inequality prevails: most of the waterlogging risk falls upon a small subset of the population.
At the township level (Figure 13b), all towns within Dongcheng and Xicheng Districts remain relatively equitable. However, inequality starts to emerge as one moves outward from the core urban area. The peripheral zones of Chaoyang, Fengtai, and Haidian Districts show a transition from relative equity to inequity. Suburban districts such as Tongzhou, Changping, and Daxing exhibit overall inequality, although some towns within them, particularly those adjacent to the core urban area, stay relatively equitable. More strikingly, four remote suburban districts, including Fangshan, Huairou, Yanqing, and Miyun, contain numerous towns with highly unequal risk distributions. For instance, Bulaotun Town in Miyun District has a Gini index of 0.7. Additionally, several towns have Gini values exceeding 0.6: Bohai Town and Baoshan Town in Huairou District; Xiangying Township in Yanqing District; Shidu Town in Fangshan District; Liuliumiao Town and Baoshan Town in Huairou District; and Liucun Town in Changping District. These figures point to substantial disparities in living conditions within these areas, where a minority of residents face disproportionately severe waterlogging risks.
Table 6 lists the Gini index values for waterlogging risk inequality across Beijing’s districts, revealing a pronounced spatial imbalance. The overall Gini index for Beijing is 0.492, indicating that the distribution of waterlogging disaster impacts is highly selective with respect to population distribution. As illustrated by the solid black Lorenz curve, the cumulative risk percentage increases slowly when the cumulative population percentage rises from 0 to 0.4, but then accelerates sharply between 0.4 and 1.0. This pattern shows that 60% of the population bears only about 20% of the waterlogging risk, while the remaining 40% of the population carries a disproportionately large share of the risk. The Lorenz curve for the outer suburbs exhibits the most pronounced concave shape, reflecting extremely high spatial inequality. Taking the Miyun District as an example, when the horizontal axis (cumulative population proportion) reaches 0.8, the vertical axis (cumulative risk proportion) remains at a very low level. This means that the majority of Miyun’s population lives in very-low-risk geographic units, while a very small number of people are concentrated in areas facing extremely high waterlogging risk. By contrast, the Lorenz curves for all central urban districts lie significantly closer to the line of absolute equality, suggesting that, regardless of how the population is distributed within these areas, the share of waterlogging risk faced by the population is relatively balanced.

4.5. Model Interpretation

Since waterlogging risk is evaluated by integrating susceptibility, population exposure, and resilience via Equation (2), for which different indicator systems have been adopted, we identify the key drivers for waterlogging susceptibility and waterlogging resilience individually in this study.
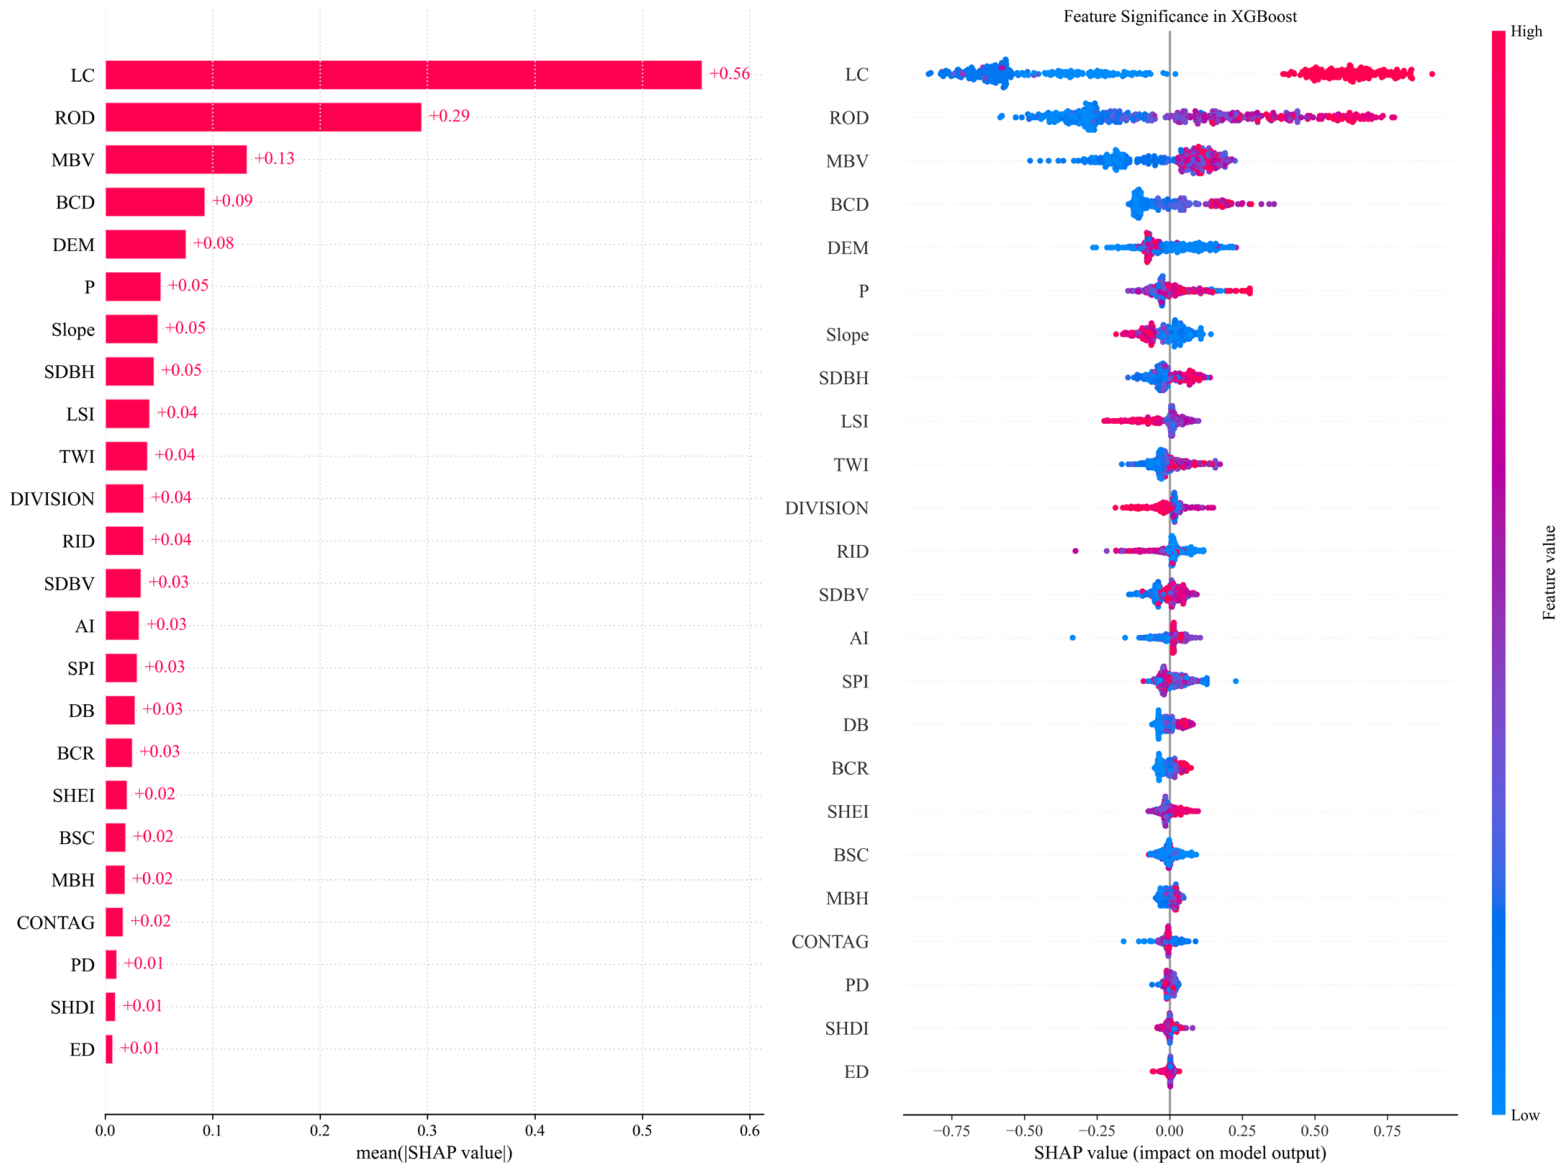
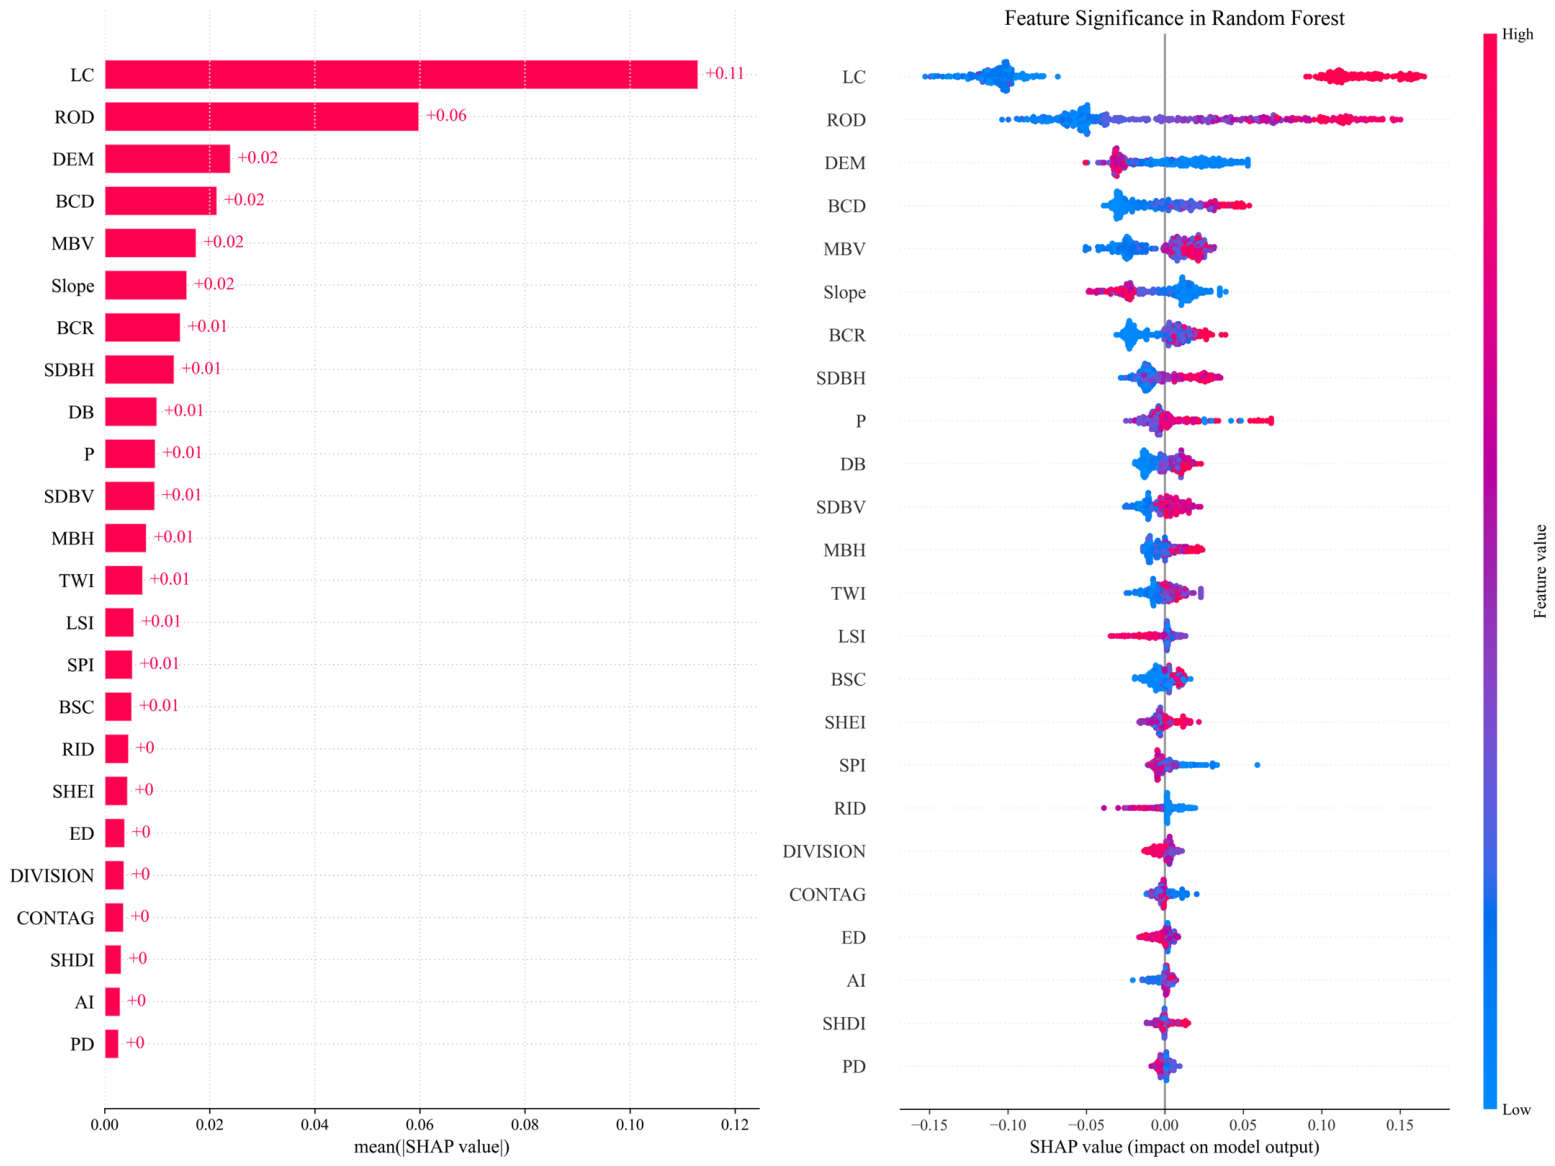
Figure 14 and Figure 15 visualize the SHAP value distributions of explanatory features for the two best-performing machine learning (ML) models, namely XGBoost and random forest (RF). The results indicate that land cover (LC) and road density (ROD) serve as the dominant contributors to urban waterlogging susceptibility in Beijing across both models. Regions with extensive impervious surfaces and dense road networks, primarily distributed in central urban areas, generate and accumulate substantial surface runoff, thereby exacerbating inundation severity. Terrain factors (elevation and slope) exert negative influences on waterlogging occurrence. Under gravitational effects, floodwater tends to converge in low-lying and gentle-slope areas, further increasing inundation risks. Heavy precipitation also acts as a critical driving factor for severe waterlogging, particularly in the XGBoost model. Additionally, the standardized precipitation index (SPI) presents a weak negative correlation with waterlogging risk, while the topographic wetness index (TWI) contributes positively to inundation occurrence. This phenomenon occurs because low-lying and humid regions with high TWI values exhibit limited surface runoff flushing capacity, favoring floodwater accumulation [70]. Moreover, high river network density (RID) corresponds to negative SHAP values, demonstrating that densely distributed river systems effectively promote floodwater drainage and mitigate urban waterlogging risks in Beijing.
Among the urban building indicators, both MBV and BCD are high in both models, indicating their significant impact on waterlogging in Beijing. MBV has a wide SHAP value distribution; especially in the high-value part, MBV has a significant positive effect on waterlogging susceptibility. The same is true for BCD. However, two-dimensional building metrics, such as the BCR and DB, have relatively narrow SHAP distributions, especially for XGBoost. Furthermore, as two parameters that characterize building height, MBH has a narrow SHAP distribution, and SDBH has a moderate distribution. These findings underscore the complex influence of three-dimensional building configurations on waterlogging occurrence: the vertical structure of complex buildings, together with their planar features, can play an important role in affecting waterlogging in Beijing [37]. The reason may be that the vertical building structure reshapes the spatial distribution of precipitation through complex interactions between buildings and airflow, and the planar features of the building affect the generation and movement of surface runoff. Overall, in developed areas with a vertically and horizontally compact pattern, paths for surface runoff are restricted, and it becomes difficult to drain floodwater effectively, thus accelerating waterlogging occurrence in Beijing. In addition, BSC, which characterizes building shape, has a minor effect on waterlogging susceptibility.
The contributions of landscape indicators to urban waterlogging are far less significant than those of hydrogeographic indicators and urban building indicators, regardless of the ML model used. Despite this, the LSI is still found to have a negative effect on waterlogging susceptibility. A large DIVISION value leads to a negative SHAP distribution, especially for the XGBoost model, whereas CONTAG contributes less to the occurrence of urban waterlogging. According to the XGBoost model, AI has a subtly positive effect on waterlogging susceptibility, although the SHAP distribution is very narrow. SHEI is also found to play a slightly positive role in waterlogging risk. Nevertheless, no pronounced contributions of PD, ED, or SHDI are found since their SHAP distributions are nearly null. This may be because a dispersed and fragmented patch distribution at the landscape level can facilitate the dissipation of local floodwaters in a timely manner since it provides more drainage paths for floodwater [34,86]. For landscape patterns with complex shapes and strongly uneven patch area distributions, more spaces and paths are available to retain and dissipate local floodwaters from a microtopography perspective. This conclusion is consistent with that of Tran et al. [87], who underscore that connectivity in urban landscapes can cause unintended flood impacts from stormwater systems.
Finally, the SHAP value distributions of the explanatory indicators for AdaBoost, DT, and NB are also presented in Figure S2 of the Supplementary Materials, which can be found in the Supplementary File of this study. For AdaBoost, LC, ROD, and MBV dominate waterlogging risk contributions, showing consistent feature importance patterns with XGBoost. Similarly, the DT model identifies LC as the most influential variable, which agrees with the outcomes of XGBoost and RF. Furthermore, the NB model prioritizes DEM and MBV, which are also critical predictors in XGBoost and RF. Such cross-model consistency demonstrates the reliable capability of the adopted ML approaches in identifying key driving factors of urban waterlogging in Beijing.
From Table 3, DRC and GDP play the most important positive roles in determining resilience levels; however, NDVI, curvature, and VP are less significant for Beijing. This indicates that vegetation cover and the inherent terrain relief of the city do not substantially improve urban resilience against waterlogging hazards. DTH, DTF, and DTP all show a moderate effect on the resilience score: the availability of medical, firefighting, and police services indeed enhances urban emergency response capacity following a waterlogging event. Additionally, education status (ES) and positive sentiment of the public (STS) also have a positive effect to some extent on the enhancement of urban waterlogging resilience in Beijing.

5. Discussion

5.1. Comparison with Previous Studies

This study constructs a framework to estimate the spatial inequality of urban waterlogging risk by incorporating the consideration of urban waterlogging resilience. Previous research has also mentioned issues related to equity in flood risk. For example, from a global standpoint, Rentschler et al. estimated the population living under high flood risk in conjunction with poverty [24]. According to their findings, the majority of those exposed to flooding worldwide live in poor countries, and over 780 million people living on less than $5.50 per day face a high risk of flooding. These findings indicate that the imbalance in flood risk exposure is driven not only by physical environmental factors but also by structural disparities in economic capacity and geographic distribution. Moreover, Lindersson et al. analyzed the relationship between income inequality and flood disasters across 67 middle- and high-income countries between 1990 and 2018, finding that the primary bearers of flood risk are not all residents of impoverished nations, but rather the poor in wealthy countries and vulnerable groups within unequal societies [25]. Even in relatively economically advanced countries, neglecting income inequality can lead to sustained flood-related fatalities due to the unequal flood risk distribution. These results qualitatively align with the conclusions of our study, both emphasizing that significant inequality in flood/waterlogging risk exists either among economically underdeveloped regions or across populations with different economic statuses within developed areas, underscoring the need for targeted interventions. Furthermore, Jia et al. conducted a case study in Shanghai, revealing significant spatiotemporal dynamics and trends in the urban inequality index between 2000–2010 and 2010–2020 [26]. Their work highlighted the growing importance of environmental indicators in assessing urban inequality, reflecting a broader global trend toward sustainability and resilience. Meanwhile, Zhou et al. focused on the Guangdong-Hong Kong-Macao Greater Bay Area, systematically examining imbalances in waterlogging risk exposure across multiple dimensions [19]. Their study pointed out that waterlogging safety resources, such as drainage facilities, flood barriers, emergency infrastructure, and rescue capabilities, are highly unevenly distributed spatially, with fragmented planning and isolated infrastructure exacerbating inefficiencies in disaster mitigation in newly developed districts. This pattern of environmental inequality aligns with our findings; however, the key difference lies in our consideration of urban resilience, which we find further exacerbates inequality in urban waterlogging risk. This is evident in our findings showing that Gini coefficients in some outer suburban towns, such as Bohai Town in Huairou District, Fozizhuang Township in Fangshan District, and Tanghekou Town in Huairou District, range between 0.68 and 0.72. This also suggests that while urban resilience, shaped by long-term urban development and construction, helps alleviate inequality within central urban areas, it paradoxically exacerbates inequities in suburban areas. Considering the interactive nature of disaster formation, this study adopted a multiplicative framework to integrate waterlogging susceptibility and resilience. Unlike additive or simple weighted superposition methods [88,89,90], the multiplicative formulation highlights the nonlinear constraint relationship between hazard conditions and social-ecological adaptive capacity. Specifically, low-resilience regions cannot form extreme waterlogging risk when the inherent inundation susceptibility is low, which agrees with real waterlogging disaster mechanisms. For outer suburban areas with both low susceptibility and resilience in Beijing, insufficient emergency service accessibility cannot lead to high risk due to the low probability and intensity of waterlogging hazards. This multiplicative calculation avoids the risk overestimation of additive algorithms.
The urban waterlogging risk framework constructed in this study encompasses three elements: susceptibility, resilience, and population exposure. A range of studies have been carried out on urban waterlogging susceptibility using ML methods. For example, Lin et al. took Shenzhen as a case study and employed a random forest model to quantify the potential impact of three-dimensional building morphology on pluvial flooding, finding that building density, building congestion degree, and building coverage ratio significantly influence the occurrence of pluvial flooding [45]. Wang et al. used Guangzhou and Beijing as case studies and found that when 2D and 3D indicators were incorporated into the ML-based waterlogging susceptibility model, the main drivers shifted to factors such as aggregation index, patch density, and building density, which significantly affect urban waterlogging [35]. These findings align with our study, where certain 3D building indicators, such as MBV and BCD, also demonstrate significant impacts on waterlogging in Beijing, highlighting the critical influence of urban horizontal and vertical structures and layouts, and providing new perspectives for mitigating urban waterlogging risk levels [35]. Lyu and Yin proposed tree-based ML models and selected the Guangdong-Hong Kong-Macao Greater Bay Area as a case study, finding that over 16% of the region was classified as having high flood susceptibility, and nearly 70% of historical flood events were located within high flood susceptibility areas. Model interpretation based on SHAP values indicated that elevation, population density, and typhoon intensity significantly influence waterlogging susceptibility [70]. The former finding is analogous to our study, which shows that impervious urban core areas exhibit high waterlogging susceptibility, while the latter reveals different driving factors, illustrating the regional heterogeneity in the underlying mechanisms driving urban waterlogging risk. Zhang et al. focused on Shenzhen, a city with severe waterlogging problems, and revealed that the morphological spatial pattern of green spaces, the proportion of green spaces, and the proportion of impervious surfaces are the dominant drivers of waterlogging risk [91]. This study differs somewhat from our findings in that the contributions of landscape indicators to urban waterlogging are far less significant than those of hydrogeographic indicators and urban building indicators, a discrepancy that may be attributable to differences in study scale. With respect to urban waterlogging resilience, numerous scholars have developed quantitative indicator systems from various perspectives to measure it. These include its application in the Yangtze River Economic Belt considering environmental, economic, social, and infrastructure dimensions [92], the Beibu Gulf urban agglomeration incorporating robustness, resistance, and recovery [93], the urban waterlogging resilience barrier model addressing institutional and policy barriers, socioeconomic barriers, technological and engineering barriers, natural environmental barriers, and management and emergency response barriers [53], and the Guangdong-Hong Kong-Macao Greater Bay Area based on resistance, emergency response, recovery, and adaptation [94]. Although direct comparison between our study and these related works is challenging, they collectively underscore the importance of urban waterlogging resilience in strengthening urban systems against waterlogging hazards. Such resilience plays a vital role in mitigating urban waterlogging risks and enhancing environmental justice regarding water-related hazards. Additionally, for the urban waterlogging resilience assessment framework, although the weights of curvature and NDVI are small, after removing these two indicators, we find that the overall variation range of UWR reaches 33.59%, followed by a 10.57% variation in the integrated urban waterlogging risk R, indicating that NDVI and curvature are not redundant for the Beijing case and exert impacts on the resilience evaluation results.

5.2. Development of Equitable Strategies for Waterlogging Risk

In response to the spatial differentiation characterized by low inequality in waterlogging risk within urban areas in Beijing and severe inequality in suburban areas, a region-specific and targeted intervention strategy is needed as follows.
The urban core region (Dongcheng, Xicheng, Chaoyang, Haidian, Fengtai, and Shijingshan) has a Gini coefficient below 0.4, indicating a relatively equitable distribution of waterlogging risk. Therefore, the strategic focus is on maintaining low inequality and preventing localized deterioration. Specific measures include advancing sponge city development and pipeline network upgrades, systematically improving stormwater drainage standards through the renovation of old residential areas and addressing localized waterlogging hotspots [95]. This involves increasing the use of permeable pavements, green roofs, and rain gardens to disperse storage and drainage pressures [96,97]. Key locations such as overpasses and underground spaces should be managed with tailored solutions [98]. Additionally, the equitable allocation of public services should be maintained to ensure that emergency resources such as firefighting, medical services, and rescue operations are evenly distributed across all urban subdistricts, preventing localized deficiencies [20].
The near suburban area, consisting of Changping, Shunyi, Tongzhou, and Daxing Districts, exhibits Gini coefficients in the interval of 0.4 to 0.48. These areas display overall inequality. Accordingly, the strategic focus is on controlling the expansion of inequality and narrowing internal disparities. In terms of infrastructure, the construction of drainage networks and pumping stations in urban-rural transition zones should be accelerated [91]. Newly developed areas should strictly implement separate stormwater and sewage systems [99,100]. Strict controls should be placed on residential development in high-risk low-lying areas, and emergency service resources such as medical, firefighting, and police services should be extended to suburban townships to enhance waterlogging disaster response capabilities [98].
Furthermore, in the outer suburbs (Miyun, Huairou, Yanqing, Fangshan, and Mentougou), many townships have Gini coefficients above 0.6. These include: Bulaotun Town (0.7) in Miyun District; Bohai Town and Baoshan Town in Huairou District; Xiangying Township in Yanqing District; Shidu Town in Fangshan District; Liuliumiao Town and Baoshan Town in Huairou District; and Liucun Town in Changping District. In these areas, inequality is extreme: the majority of waterlogging risk is concentrated on a small fraction of the population. For this region, more intervention measures are needed. (i) Efforts should focus on ecological resettlement and village consolidation, and on systematically relocating or centrally resettling high-risk villages. Priority should be given to addressing the residential safety issues in extremely high-risk townships such as Taishitun Town, Bohai Town, and Baoshan Town [26,101,102]. (ii) Regarding infrastructure development, facilities for mountain flood storage and drainage should be constructed. Natural features such as ponds, ditches, and terraced fields should be utilized to enhance stormwater retention capacity. The resilience of lifeline projects should be improved by reinforcing roads, bridges, power supplies, and communications in high-risk townships to ensure basic services can be maintained even in isolated conditions [101,103]. (iii) From a risk management standpoint, a fair risk-sharing system should be established. Government-subsidized waterlogging disaster insurance should be introduced, with full or partial premium subsidies for low-income households in high-risk areas to reduce disaster-related losses. Precise support for vulnerable groups should be strengthened for the elderly, disabled individuals, and low-income families in high-risk areas [104]. (iv) From the perspective of governance and institutional support, early warning information transmission mechanisms should be improved to ensure that meteorological and hydrological warnings reach villages and households directly so that high-risk populations can receive timely waterlogging information [105]. Fiscal transfer payments should be increased, and improvements in risk inequality should be incorporated into the assessment indicators for disaster prevention and mitigation for each district and township.

5.3. Limitations and Future Studies

There are some limitations and future directions going forward from this work. First, we calculated the Gini index at the district and township scales, without extending to finer units such as communities and administrative villages. Significant internal disparities exist within certain townships; for example, Tanghekou Town in Huairou District has a Gini coefficient of 0.72; however, limited data availability makes it challenging to accurately determine the spatial distribution and population attributes of high-risk micro-units. Future research should refine the unit of analysis to the community, integrating high-resolution remote sensing data, field surveys, and census data to accurately identify population composition and infrastructure conditions within high-risk micro-units, thereby providing a more reliable basis for targeted interventions [102]. Meanwhile, the spatial matching between population and risk data requires a compromise in resolution, leading to potential errors in smaller areas. For example, at the 1 km scale, Chaoyangmen Street contains only one to two effective pixels in this study, which smooths out internal micro-heterogeneity and artificially drives the Gini index toward zero. Future work should apply spatial downscaling techniques such as ML or geographically weighted regression. Combining high-resolution building footprints, road networks, and remote sensing data can downscale population data from 1 km to 100 m or finer, increasing effective pixel counts within micro-areas while maintaining matching accuracy [106]. It should be noted that all building and landscape indicators are aggregated at the sub-catchment scale, which is susceptible to the Modifiable Areal Unit Problem (MAUP), and population datasets are restricted by the census statistical scales. The sub-catchment zoning is delineated according to natural hydrological characteristics, alleviating arbitrary partitioning bias to some extent. Future work could adopt multi-zonal-unit comparison to further quantify MAUP-derived uncertainty. Second, this work focuses on inequality in waterlogging risk exposure but lacks a systematic analysis of the coping capacity of different groups, such as income levels, housing quality, access to emergency resources, and post-disaster recovery capacity. Thus, the interplay of exposure and vulnerability on risk inequality is not completely captured. Future work should integrate disaster exposure data with socioeconomic vulnerability data to develop a coupled exposure-vulnerability framework, enabling the identification of the most vulnerable groups and their spatial distribution in need of priority intervention [25]. Third, some inherent uncertainties associated with the indicator system adopted for the susceptibility and resilience system exist. For example, although ten indicators have been selected, some key factors, such as community organizational capacity, have not been incorporated because of data availability. Future research should expand the indicator system and employ some methods, such as structural equation modeling and ML, to reveal the mechanisms of resilience formation and evaluate the effectiveness of intervention measures through cost–benefit analysis and outcome assessments [8,18]. Finally, because our study relies on a single-period cross-sectional dataset, it cannot capture how waterlogging risk inequality evolves over time. As urban expansion, climate change, and infrastructure development continue, the degree of risk inequality may undergo dynamic shifts, an aspect not examined in our study. Future work should be carried out to establish a dynamic monitoring system by utilizing multi-temporal data to analyze the evolution of risk inequality over time and predict future evolution characteristics of risk inequality via scenario simulations under various climate change and urban development conditions [29]. Additionally, since our study is confined to Beijing, its generalization into other cities to reveal how factors such as city size, spatial structure, and governance models influence risk inequality is worthy of further investigation in future studies. Beijing has dense built-up zones, intricate spatial layouts, and a temperate monsoon climate, with rainfall concentrated between July and September. Some basic datasets, including remote sensing data, geographic information data, and statistical data adopted in this study, are also accessible for other megacities. Rooted in basic theories of urban susceptibility and resilience, the proposed framework can be applied to comparable megacities.

6. Conclusions

A comprehensive framework for the evaluation of urban waterlogging risk and its inequality in Beijing is proposed in this study. The framework integrates waterlogging susceptibility evaluated by five ML models (DT, RF, NB, AdaBoost, and XGBoost), urban waterlogging resilience quantified using the entropy weight method, and population exposure. The Gini index and Lorenz curve are employed to quantify waterlogging risk inequality at both the district and township scales. The study draws the following three main conclusions.
Of the five ML models tested, XGBoost achieves the highest predictive accuracy for waterlogging susceptibility mapping. Areas with high and very high susceptibility are largely clustered in the central urban area, whereas the outer suburbs are dominated by low-susceptibility zones. Land use (LC) and road density (ROD) emerge as the most important drivers of waterlogging. Furthermore, three-dimensional building indicators, particularly mean building volume (MBV) and building crowding degree (BCD), have a substantial impact on exacerbating susceptibility, whereas landscape factors play a relatively minor role.
The assessment of waterlogging resilience, covering inherent urban resilience, emergency response resilience, and socioeconomic resilience, reveals a distinct “core-periphery” spatial structure across Beijing. High-resilience areas form a solid core in the central urban area, benefiting from dense public service infrastructure and a robust economic base. In contrast, resilience levels decline rapidly, radially toward the outer suburbs, leaving vast peripheral areas highly vulnerable due to insufficient resilience coverage. Drainage capacity (DRC) and gross domestic product (GDP) emerge as the most important positive determinants of resilience levels, while normalized difference vegetation index (NDVI) and curvature play relatively minor roles.
The integration results of susceptibility, resilience, and population exposure indicate a profound spatial disparity in the waterlogging risk distribution. While the core urban area faces the highest waterlogging risk, the risk burden is relatively evenly distributed among its dense population, with the Gini coefficient remaining below the 0.4 warning line. Conversely, the outer suburbs and mountainous areas exhibit severe risk inequality, with local Gini coefficients exceeding 0.6 (e.g., in Miyun District), showing that a very small proportion of the population bears a disproportionately large share of the local waterlogging risk.
These findings suggest that policymakers should adopt spatially differentiated resource allocation strategies, prioritizing targeted and context-specific interventions in suburban hotspots where waterlogging risk inequality is most severe. Future studies could be performed from the perspectives of refining the analysis scale, the interplay between population exposure and waterlogging vulnerability, the comprehensiveness of the selected indicators, consideration of dynamic risk change, and generalization of the study results into other cities in China and abroad.

Supplementary Materials

The following supporting information can be downloaded at: https://www.mdpi.com/article/10.3390/rs18142428/s1, Figure S1: Illustration of the Gini index to assess waterlogging risk inequality; Figure S2: AdaBoost susceptibility model (a), decision tree susceptibility model (b), and naïve Bayes susceptibility model (c) explanation with SHAP method; Figure S3: Out-of-bag (OOB) AUC scores under various subsampling ratios; Figure S4: Pixel-wise standard deviation of waterlogging susceptibility (based on 90% subsampling); Section S1: Gini index for measuring waterlogging risk inequality; Section S2: Sensitivity test of XGBoost model for waterlogging susceptibility mapping.

Author Contributions

Conceptualization, X.Z. and Z.Z.; methodology, X.Z., Z.Z., Y.M. and W.W.; investigation, X.Z. and Y.M.; writing—original draft preparation, X.Z. and Z.Z.; supervision, Z.Z., D.P. and Y.Z.; data curation, Y.M.; validation, W.W., D.P. and Y.Z. All authors have read and agreed to the published version of the manuscript.

Funding

This work was supported by the National Science and Technology Major Project (2025ZD1204403).

Data Availability Statement

The original contributions presented in this study are included in the article/Supplementary Materials. Further inquiries can be directed to the corresponding author.

Acknowledgments

The authors would also like to express their gratitude to the academic editors (Qiang Dai, Jun Zhang and Shaonan Zhu) and two anonymous reviewers for their valuable time and insightful comments.

Conflicts of Interest

The authors declare no conflicts of interest.

References

  1. Hu, P.; Zhang, Q.; Shi, P.; Chen, B.; Fang, J. Flood-Induced Mortality across the Globe: Spatiotemporal Pattern and Influencing Factors. Sci. Total Environ. 2018, 643, 171–182. [Google Scholar] [CrossRef] [Scilit]
  2. Zhang, J.; Xu, W.; Liao, X.; Zong, S.; Liu, B. Global Mortality Risk Assessment from River Flooding under Climate Change. Environ. Res. Lett. 2021, 16, 064036. [Google Scholar] [CrossRef] [Scilit]
  3. Balaian, S.K.; Sanders, B.F.; Abdolhosseini Qomi, M.J. How Urban Form Impacts Flooding. Nat. Commun. 2024, 15, 6911. [Google Scholar] [CrossRef] [Scilit] [PubMed]
  4. Tellman, B.; Sullivan, J.A.; Kuhn, C.; Kettner, A.J.; Doyle, C.S.; Brakenridge, G.R.; Erickson, T.A.; Slayback, D.A. Satellite Imaging Reveals Increased Proportion of Population Exposed to Floods. Nature 2021, 596, 80–86. [Google Scholar] [CrossRef] [Scilit] [PubMed]
  5. Wang, P.; Li, Y.; Fan, J.; Kong, F.; Zhang, D.; Hu, T. Future Changes in Urban Drainage Pressure Caused by Precipitation Extremes in 285 Cities across China Based on CMIP6 Models. Sustain. Cities Soc. 2023, 91, 104404. [Google Scholar] [CrossRef] [Scilit]
  6. Chen, J.; Wu, L.; Zhou, Y.Q.; Hua, F.C.; Zhong, M.H. Lessons and Improvements: Subway Waterlogging Catastrophe in Zhengzhou, China. Tunn. Undergr. Space Technol. 2024, 144, 105541. [Google Scholar] [CrossRef] [Scilit]
  7. Chen, S.; Zhang, F.H.; Liu, B.Y.; Chen, T.; Hu, N. Basic Characteristics and Preliminary Causes of the Extreme Rainstorm over North. Torrential Rain Disasters 2026, 45, 1–14. [Google Scholar] [CrossRef]
  8. Zhang, H.; Li, C.; Cheng, J.; Wu, Z.; Wu, Y. A Review of Urban Flood Risk Assessment Based on the Framework of Hazard-Exposure-Vulnerability. Prog. Geogr. 2019, 38, 175–190. [Google Scholar] [CrossRef] [Scilit]
  9. Mudashiru, R.B.; Sabtu, N.; Abustan, I.; Balogun, W. Flood Hazard Mapping Methods: A Review. J. Hydrol. 2021, 603, 126846. [Google Scholar] [CrossRef] [Scilit]
  10. Ha-Mim, N.M.; Rahman, M.A.; Hossain, M.Z.; Fariha, J.N.; Rahaman, K.R. Employing Multi-Criteria Decision Analysis and Geospatial Techniques to Assess Flood Risks: A Study of Barguna District in Bangladesh. Int. J. Disaster Risk Reduct. 2022, 77, 103081. [Google Scholar] [CrossRef] [Scilit]
  11. Lyu, H.M.; Zhou, W.H.; Shen, S.L.; Zhou, A.N. Inundation Risk Assessment of Metro System Using AHP and TFN-AHP in Shenzhen. Sustain. Cities Soc. 2020, 56, 102103. [Google Scholar] [CrossRef] [Scilit]
  12. Ayalew, L. Analyzing the Effects of Historical and Recent Floods on Channel Pattern and the Environment in the Lower Omo Basin of Ethiopia Using Satellite Images and GIS. Environ. Geol. 2009, 58, 1713–1726. [Google Scholar] [CrossRef] [Scilit]
  13. Nkwunonwo, U.C.; Whitworth, M.; Baily, B. A Review of the Current Status of Flood Modelling for Urban Flood Risk Management in the Developing Countries. Sci. Afr. 2020, 7, e00269. [Google Scholar] [CrossRef] [Scilit]
  14. Kumar, V.; Sharma, K.V.; Caloiero, T.; Mehta, D.J.; Singh, K. Comprehensive Overview of Flood Modeling Approaches: A Review of Recent Advances. Hydrology 2023, 10, 141. [Google Scholar] [CrossRef] [Scilit]
  15. Huang, P.; Zheng, Y.; Xu, X.L.; Li, D.L.; Liu, P.X.; Zhang, X.P. Assessment and Classification of Flood Disaster Risk in Jiangxi Province at the County Scale. China Flood Drought Manag. 2024, 34, 61–67. [Google Scholar] [CrossRef]
  16. Li, G.; Liu, J.H.; Shao, W.W. Urban Flood Risk Assessment under Rapid Urbanization in Zhengzhou City, China. Reg. Sustain. 2023, 4, 332–348. [Google Scholar] [CrossRef] [Scilit]
  17. Liu, T.; Wang, Y.; Yu, H.; Chen, Y. Using Statistical Functions and Hydro-Hydraulic Models to Develop Human Vulnerability Curves for Flash Floods: The Flash Flood of the Taitou Catchment (China) in 2016. Int. J. Disaster Risk Reduct. 2022, 73, 102876. [Google Scholar] [CrossRef] [Scilit]
  18. Lyu, H.M.; Yin, Z.Y.; Zhou, A.; Shen, S.L. MCDM-Based Flood Risk Assessment of Metro Systems in Smart City Development: A Review. Environ. Impact Assess. Rev. 2023, 101, 107154. [Google Scholar] [CrossRef] [Scilit]
  19. Zhou, S.; Geng, X.; Jia, W.; Xu, H.; Xu, X.; Chen, H.; Wang, M.; Wu, Z. Towards Climate-Adaptive Equality in Coastal Megacities: Assessing Urban Flooding Risk Disparities and Nonlinear Effect of Multidimensional Indicators through an Interpretable LightGBM-SHAP Framework. Sustain. Cities Soc. 2025, 132, 106809. [Google Scholar] [CrossRef] [Scilit]
  20. Yao, Q.; Wang, J.; Li, M.; Kwan, M.P.; Yin, J. Cross-Regional and Multi-Entity Resource Coordination Can Enhance the Supply of Disaster Relief Materials during Flood Events in China. Commun. Earth Environ. 2025, 6, 472. [Google Scholar] [CrossRef] [Scilit]
  21. Yu, D.; Yin, J.; Wilby, R.L.; Lane, S.N.; Aerts, J.C.J.H.; Lin, N.; Liu, M.; Yuan, H.; Chen, J.; Prudhomme, C.; et al. Disruption of Emergency Response to Vulnerable Populations during Floods. Nat. Sustain. 2020, 3, 728–736. [Google Scholar] [CrossRef] [Scilit]
  22. Wang, C.; Zhang, X.; Wu, J. Disaster Information Mining from a Social Perception Perspective: A Case Study of the “23·7” Extreme Rainfall Event in the Beijing–Tianjin–Hebei Region. Int. J. Disaster Risk Reduct. 2024, 115, 105056. [Google Scholar] [CrossRef] [Scilit]
  23. Rakib, M.A.; Islam, S.; Nikolaos, I.; Bodrud-Doza, M.; Bhuiyan, M.A.H. Flood Vulnerability, Local Perception and Gender Role Judgment Using Multivariate Analysis: A Problem-Based “Participatory Action to Future Skill Management” to Cope with Flood Impacts. Weather Clim. Extrem. 2017, 18, 29–43. [Google Scholar] [CrossRef] [Scilit]
  24. Rentschler, J.; Salhab, M.; Jafino, B.A. Flood Exposure and Poverty in 188 Countries. Nat. Commun. 2022, 13, 3527. [Google Scholar] [CrossRef] [Scilit] [PubMed]
  25. Lindersson, S.; Raffetti, E.; Rusca, M.; Brandimarte, L.; Mård, J.; Di Baldassarre, G. The Wider the Gap between Rich and Poor the Higher the Flood Mortality. Nat. Sustain. 2023, 6, 995–1005. [Google Scholar] [CrossRef] [Scilit]
  26. Jia, N.; Li, Y.; Jiang, Z.; Su, R.; Lan, X.; Zhang, K.; Song, W.; Zhao, R.; Xia, Z.; Song, Y.; et al. Climate Change, Social Environment, Health, and Urban Inequality: Developing a Novel Adaptive Evaluation Framework. Sustain. Cities Soc. 2025, 127, 106443. [Google Scholar] [CrossRef] [Scilit]
  27. Yao, L.; Chen, L.; Wei, W.; Sun, R. Potential Reduction in Urban Runoff by Green Spaces in Beijing: A Scenario Analysis. Urban For. Urban Green. 2015, 14, 300–308. [Google Scholar] [CrossRef] [Scilit]
  28. Gong, Y.; Xu, X.; Tian, K.; Li, Z.; Wang, M.; Li, J. Subway Station Flood Risk Management Level Analysis. J. Hydrol. 2024, 638, 131473. [Google Scholar] [CrossRef] [Scilit]
  29. Jia, M.; Lin, J.; Dai, J.; Zhang, J. Assessing Future Flood Risks in Megacity Suburbs under Shared Socioeconomic Pathways (SSPs) Scenarios: A Case Study of Beijing. Urban Clim. 2024, 58, 102208. [Google Scholar] [CrossRef] [Scilit]
  30. Liu, L.; Sun, J.; Lin, B. A Large-Scale Waterlogging Investigation in a Megacity. Nat. Hazards 2022, 114, 1505–1524. [Google Scholar] [CrossRef] [Scilit]
  31. Wang, G.; Li, X.; Chen, J.; Wu, X. The Rainstorm Indirect Economic Loss Assessment of Multi Departments Based on IO Model—A Case Study on the Rainstorm on July, 21st in Beijing. J. Catastrophology 2015, 30, 94–99. [Google Scholar]
  32. Zhang, M.; Xu, M.; Wang, Z.; Lai, C. Assessment of the Vulnerability of Road Networks to Urban Waterlogging Based on a Coupled Hydrodynamic Model. J. Hydrol. 2021, 603, 127105. [Google Scholar] [CrossRef] [Scilit]
  33. Du, W.; Gong, Y.; Chen, N.C. PSO-WELLSVM: An Integrated Method and Its Application in Urban Waterlogging Susceptibility Assessment in the Central Wuhan, China. Comput. Geosci. 2022, 161, 105079. [Google Scholar] [CrossRef] [Scilit]
  34. Su, M.; Zheng, Y.; Hao, Y.; Chen, Q.; Chen, S.; Chen, Z.; Xie, H. The Influence of Landscape Pattern on the Risk of Urban Water-Logging and Flood Disaster. Ecol. Indic. 2018, 92, 133–140. [Google Scholar] [CrossRef] [Scilit]
  35. Wang, Y.; Zhang, Q.; Zhang, J.; Lin, K. Impact of 2D and 3D Factors on Urban Flooding: Spatial Characteristics and Interpretable Analysis of Drivers. Water Res. 2025, 280, 123537. [Google Scholar] [CrossRef] [Scilit] [PubMed]
  36. Yan, M.; Yang, J.; Ni, X.; Liu, K.; Wang, Y.; Xu, F. Urban Waterlogging Susceptibility Assessment Based on Hybrid Ensemble Machine Learning Models: A Case Study in the Metropolitan Area in Beijing, China. J. Hydrol. 2024, 630, 130695. [Google Scholar] [CrossRef] [Scilit]
  37. Zhou, S.; Liu, Z.; Wang, M.; Gan, W.; Zhao, Z.; Wu, Z. Impacts of Building Configurations on Urban Stormwater Management at a Block Scale Using XGBoost. Sustain. Cities Soc. 2022, 87, 104235. [Google Scholar] [CrossRef] [Scilit]
  38. Ashfaq, S.; Tufail, M.; Niaz, A.; Muhammad, S.; Alzahrani, H.; Tariq, A. Flood Susceptibility Assessment and Mapping Using GIS-Based Analytical Hierarchy Process and Frequency Ratio Models. Glob. Planet. Change 2025, 251, 104831. [Google Scholar] [CrossRef] [Scilit]
  39. Sohn, W.; Kim, J.H.; Li, M.H.; Brown, R.D.; Jaber, F.H. How Does Increasing Impervious Surfaces Affect Urban Flooding in Response to Climate Variability? Ecol. Indic. 2020, 118, 106774. [Google Scholar] [CrossRef] [Scilit]
  40. Fuller, I.C. Geomorphic Impacts of a 100-Year Flood: Kiwitea Stream, Manawatu Catchment, New Zealand. Geomorphology 2008, 98, 84–95. [Google Scholar] [CrossRef] [Scilit]
  41. Arabameri, A.; Rezaei, K.; Cerdà, A.; Conoscenti, C.; Kalantari, Z. A Comparison of Statistical Methods and Multi-Criteria Decision Making to Map Flood Hazard Susceptibility in Northern Iran. Sci. Total Environ. 2019, 660, 443–458. [Google Scholar] [CrossRef] [Scilit] [PubMed]
  42. Swain, K.C.; Singha, C.; Nayak, L. Flood Susceptibility Mapping through the GIS-AHP Technique Using the Cloud. ISPRS Int. J. Geo-Inf. 2020, 9, 720. [Google Scholar] [CrossRef] [Scilit]
  43. Leandro, J.; Schumann, A.; Pfister, A. A Step towards Considering the Spatial Heterogeneity of Urban Key Features in Urban Hydrology Flood Modelling. J. Hydrol. 2016, 535, 356–365. [Google Scholar] [CrossRef] [Scilit]
  44. Li, X.; Erpicum, S.; Mignot, E.; Archambeau, P.; Pirotton, M.; Dewals, B. Influence of Urban Forms on Long-Duration Urban Flooding: Laboratory Experiments and Computational Analysis. J. Hydrol. 2021, 603, 127034. [Google Scholar] [CrossRef] [Scilit]
  45. Lin, J.; He, X.; Lu, S.; Liu, D.; He, P. Investigating the Influence of Three-Dimensional Building Configuration on Urban Pluvial Flooding Using Random Forest Algorithm. Environ. Res. 2021, 196, 110438. [Google Scholar] [CrossRef] [Scilit] [PubMed]
  46. Peng, Y.; Wang, Q.; Wang, H.; Lin, Y.; Song, J.; Cui, T.; Fan, M. Does Landscape Pattern Influence the Intensity of Drought and Flood? Ecol. Indic. 2019, 103, 173–181. [Google Scholar] [CrossRef] [Scilit]
  47. Laidlaw, S.; Percival, S. Flood Resilience: A Review of Evolving Definitions. Nat. Hazards 2024, 120, 10773–10784. [Google Scholar] [CrossRef] [Scilit]
  48. Zhu, S.; Feng, H.; Arashpour, M.; Zhang, F. Enhancing Urban Flood Resilience: A Coupling Coordinated Evaluation and Geographical Factor Analysis under SES-PSR Framework. Int. J. Disaster Risk Reduct. 2024, 101, 104243. [Google Scholar] [CrossRef] [Scilit]
  49. Xiao, S.; Zou, L.; Xia, J.; Dong, Y.; Yang, Z.; Yao, T. Assessment of the Urban Waterlogging Resilience and Identification of Its Driving Factors: A Case Study of Wuhan City, China. Sci. Total Environ. 2023, 866, 161321. [Google Scholar] [CrossRef] [Scilit] [PubMed]
  50. Gu, T.; Zhao, H.; Yue, L.; Liu, Y.; Guo, J.; Tang, J.; Zhao, P. Spatial Heterogeneity of Urban Resilience: Quantifying Key Determinants by Spatial Machine Learning Model Embedded in Density-Structure-Function Framework. Cities 2025, 167, 106305. [Google Scholar] [CrossRef] [Scilit]
  51. Zhang, Y.; Li, X.; Kong, N.; Zhou, M.; Zhou, X. Spatial Accessibility Assessment of Emergency Response of Urban Public Services in the Context of Pluvial Flooding Scenarios: The Case of Jiaozuo Urban Area, China. Sustainability 2022, 14, 16332. [Google Scholar] [CrossRef] [Scilit]
  52. Zhang, Y.; Liu, K.; Ni, X.; Wang, M.; Zheng, J.; Liu, M.; Yu, D. Spatial Accessibility of Emergency Medical Services under Inclement Weather: A Case Study in Beijing, China. Nat. Hazards Earth Syst. Sci. 2024, 24, 63–77. [Google Scholar] [CrossRef] [Scilit]
  53. Sun, H.; Mao, W.; Luo, D. Paving the Path to Urban Flood Resilience by Overcoming Barriers: A Novel Grey Structure Analysis Approach. Sustain. Cities Soc. 2025, 121, 106187. [Google Scholar] [CrossRef] [Scilit]
  54. Khosravi, K.; Pham, B.T.; Chapi, K.; Shirzadi, A.; Shahabi, H.; Revhaug, I.; Prakash, I.; Tien Bui, D. A Comparative Assessment of Decision Trees Algorithms for Flash Flood Susceptibility Modeling at Haraz Watershed, Northern Iran. Sci. Total Environ. 2018, 627, 744–755. [Google Scholar] [CrossRef] [Scilit] [PubMed]
  55. Liu, J.; Zhao, X.; Chen, Y.; Sun, H.; Gu, Y.; Xu, S. Uncertainty Pattern and an Integration Strategy in Flood Susceptibility Modeling: Limited Sample Size. J. Hydrol. 2025, 658, 133184. [Google Scholar] [CrossRef] [Scilit]
  56. Fu, Z.; Wang, F.; Dou, J.; Nam, K.; Ma, H. Enhanced Absence Sampling Technique for Data-Driven Landslide Susceptibility Mapping: A Case Study in Songyang County, China. Remote Sens. 2023, 15, 3345. [Google Scholar] [CrossRef] [Scilit]
  57. Liu, K.; Harrison, M.T.; Yan, H.; Liu, D.L.; Meinke, H.; Hoogenboom, G.; Wang, B.; Peng, B.; Guan, K.; Jaegermeyr, J.; et al. Silver Lining to a Climate Crisis in Multiple Prospects for Alleviating Crop Waterlogging under Future Climates. Nat. Commun. 2023, 14, 765. [Google Scholar] [CrossRef] [Scilit] [PubMed]
  58. Beven, K.J.; Kirkby, M.J. A Physically Based, Variable Contributing Area Model of Basin Hydrology. Hydrol. Sci. Bull. 1979, 24, 43–69. [Google Scholar] [CrossRef] [Scilit]
  59. Fang, Z.; Wang, Y.; Peng, L.; Hong, H. Predicting Flood Susceptibility Using LSTM Neural Networks. J. Hydrol. 2021, 594, 125734. [Google Scholar] [CrossRef] [Scilit]
  60. Che, Y.; Li, X.; Liu, X.; Wang, Y.; Liao, W.; Zheng, X.; Zhang, X.; Xu, X.; Shi, Q.; Zhu, J.; et al. 3D-GloBFP: The First Global Three-Dimensional Building Footprint Dataset. Earth Syst. Sci. Data 2024, 16, 5357–5374. [Google Scholar] [CrossRef] [Scilit]
  61. Das, P.K.; Sahu, R.L.; Swain, P.C. Comparative Machine Learning for Flood Susceptibility in Subarnarekha Basin, Odisha. J. Atmos. Sol.-Terr. Phys. 2025, 274, 106578. [Google Scholar] [CrossRef] [Scilit]
  62. Refadah, S.S. Development in Flood Forecasting: A Comprehensive Review of Complex and Machine Learning Models. Phys. Chem. Earth 2025, 139, 103975. [Google Scholar] [CrossRef] [Scilit]
  63. Dou, J.; Yunus, A.P.; Tien Bui, D.; Merghadi, A.; Sahana, M.; Zhu, Z.; Chen, C.-W.; Khosravi, K.; Yang, Y.; Pham, B.T. Assessment of Advanced Random Forest and Decision Tree Algorithms for Modeling Rainfall-Induced Landslide Susceptibility in the Izu-Oshima Volcanic Island, Japan. Sci. Total Environ. 2019, 662, 332–346. [Google Scholar] [CrossRef] [Scilit] [PubMed]
  64. Tang, X.; Li, J.; Liu, M.; Liu, W.; Hong, H. Flood Susceptibility Assessment Based on a Novel Random Naïve Bayes Method: A Comparison between Different Factor Discretization Methods. Catena 2020, 190, 104536. [Google Scholar] [CrossRef] [Scilit]
  65. Freund, Y.; Schapire, R.E. A Decision-Theoretic Generalization of On-Line Learning and an Application to Boosting. J. Comput. Syst. Sci. 1997, 55, 119–139. [Google Scholar] [CrossRef] [Scilit]
  66. Chen, T.; Guestrin, C. XGBoost: A Scalable Tree Boosting System. In Proceedings of the ACM SIGKDD International Conference on Knowledge Discovery and Data Mining, San Francisco, CA, USA, 13–17 August 2016; pp. 785–794. [Google Scholar] [CrossRef] [Scilit]
  67. Dey, H.; Shao, W.; Moradkhani, H.; Keim, B.D.; Peter, B.G. Urban Flood Susceptibility Mapping Using Frequency Ratio and Multiple Decision Tree-Based Machine Learning Models. Nat. Hazards 2024, 120, 10365–10393. [Google Scholar] [CrossRef] [Scilit]
  68. Breiman, L. Random Forests. Mach. Learn. 2001, 45, 5–32. [Google Scholar] [CrossRef] [Scilit]
  69. Li, Y.; Osei, F.B.; Hu, T.; Stein, A. Urban Flood Susceptibility Mapping Based on Social Media Data in Chengdu City, China. Sustain. Cities Soc. 2023, 88, 104307. [Google Scholar] [CrossRef] [Scilit]
  70. Lyu, H.M.; Yin, Z.Y. Flood Susceptibility Prediction Using Tree-Based Machine Learning Models in the GBA. Sustain. Cities Soc. 2023, 97, 104744. [Google Scholar] [CrossRef] [Scilit]
  71. Akiba, T.; Sano, S.; Yanase, T.; Ohta, T.; Koyama, M. Optuna: A Next-Generation Hyperparameter Optimization Framework. In Proceedings of the ACM SIGKDD International Conference on Knowledge Discovery and Data Mining, Anchorage, AK, USA, 4–8 August 2019; pp. 2623–2631. [Google Scholar] [CrossRef] [Scilit]
  72. Russo, C.; Castro, A.; Gioia, A.; Iacobellis, V.; Gorgoglione, A. Improving the Sediment and Nutrient First-Flush Prediction and Ranking Its Influencing Factors: An Integrated Machine-Learning Framework. J. Hydrol. 2023, 616, 128842. [Google Scholar] [CrossRef] [Scilit]
  73. Aldin Shojaeezadeh, S.; Al-Wardy, M.; Reza Nikoo, M. Suspended Sediment Load Modeling Using Hydro-Climate Variables and Machine Learning. J. Hydrol. 2024, 633, 130948. [Google Scholar] [CrossRef] [Scilit]
  74. Aydin, H.E.; Iban, M.C. Predicting and Analyzing Flood Susceptibility Using Boosting-Based Ensemble Machine Learning Algorithms with SHapley Additive exPlanations. Nat. Hazards 2023, 116, 2957–2991. [Google Scholar]
  75. Gao, J.; Shi, Y.; Zhang, H.; Chen, X.; Zhang, W.; Shen, W.; Xiao, T.; Zhang, Y. China Regional 250 m Fractional Vegetation Cover Data Set (2000–2024); National Tibetan Plateau/Third Pole Environment Data Center: Beijing, China, 2022. [Google Scholar]
  76. Wang, Y.; Li, C.; Hu, Y.; Lv, J.; Liu, M.; Xiong, Z.; Wang, Y. Evaluation of Urban Flooding and Potential Exposure Risk in Central and Southern Liaoning Urban Agglomeration, China. Ecol. Indic. 2023, 154, 110845. [Google Scholar] [CrossRef] [Scilit]
  77. Mair, M.; Zischg, J.; Rauch, W.; Sitzenfrei, R. Where to Find Water Pipes and Sewers?—On the Correlation of Infrastructure Networks in the Urban Environment. Water 2017, 9, 146. [Google Scholar] [CrossRef] [Scilit]
  78. Chen, J.; Gao, M.; Cheng, S.; Hou, W.; Song, M.; Liu, X.; Liu, Y. Global 1 Km × 1 Km Gridded Revised Real Gross Domestic Product and Electricity Consumption during 1992–2019 Based on Calibrated Nighttime Light Data. Sci. Data 2022, 9, 202. [Google Scholar] [CrossRef] [Scilit] [PubMed]
  79. Xiang, H.-T.; Lyu, H.-M. Assessment of Vulnerability to Waterlogging in Subway Stations Using Integrated EWM-TOPSIS. Smart Constr. Sustain. Cities 2023, 1, 17. [Google Scholar] [CrossRef] [Scilit]
  80. Chen, W.; Yang, Y.; Xiao, Z.; Li, S. Spatial-Temporal Patterns and Influencing Factors of Urban Low-Carbon Resilience from a Comprehensive Green Transformation Perspective in Different Regions of China. Environ. Sustain. Indic. 2026, 30, 101147. [Google Scholar] [CrossRef] [Scilit]
  81. Wu, W.; Zhu, Z.; Zheng, X.; Liu, S.; Zhang, D.; Peng, D.; Pang, B. A Flood Risk Assessment Framework for Urban Subway Systems: A Case Study in Beijing, China. Sustain. Cities Soc. 2025, 131, 106681. [Google Scholar] [CrossRef] [Scilit]
  82. Dong, J.; Peng, J.; He, X.; Corcoran, J.; Qiu, S.; Wang, X. Heatwave-Induced Human Health Risk Assessment in Megacities Based on Heat Stress-Social Vulnerability-Human Exposure Framework. Landsc. Urban Plan. 2020, 203, 103907. [Google Scholar] [CrossRef] [Scilit]
  83. Lebakula, V.; Epting, J.; Moehl, J.; Stipek, C.; Reith, A.; Reynolds, B.; Adams, D.; Kaufman, J.; Gonzales, J.; Basford, S.; et al. LandScan Global 2023: Silver Edition; Oak Ridge National Laboratory (ORNL): Oak Ridge, TN, USA, 2024. [Google Scholar]
  84. Zhang, T.; Sun, Y.; Yin, L.; Tian, Y.; Sun, Y.; Zhang, B. Examining Heat Risk Inequality from the Perspective of Urban Resilience. Sustain. Cities Soc. 2025, 131, 106743. [Google Scholar] [CrossRef] [Scilit]
  85. Martin, A.J.F.; Conway, T.M. Using the Gini Index to Quantify Urban Green Inequality: A Systematic Review and Recommended Reporting Standards. Landsc. Urban Plan. 2025, 254, 105231. [Google Scholar] [CrossRef] [Scilit]
  86. Li, Y.; Osei, F.B.; Dai, S.; Hu, T.; Stein, A. Identifying Landscape Patterns at Different Scales as Driving Factors for Urban Flooding. Ecol. Indic. 2025, 176, 113614. [Google Scholar] [CrossRef] [Scilit]
  87. Tran, V.N.; Ivanov, V.Y.; Huang, W.; Murphy, K.; Daneshvar, F.; Bednar, J.H.; Alexander, G.A.; Kim, J.; Wright, D.B. Connectivity in Urbanscapes Can Cause Unintended Flood Impacts from Stormwater Systems. Nat. Cities 2024, 1, 654–664. [Google Scholar] [CrossRef] [Scilit]
  88. Wang, K.F.; Zhang, H.B.; Li, G. Advances in urban flood resilience study and its key supporting technologies review. Water Resour. Hydropower Eng. 2023, 54, 77–88. [Google Scholar]
  89. Zhu, Z.Y.; Tang, L.H.; Zhu, Z. Effectiveness assessment of urban drainage and flood control systems based on DPSIRAHP-FCE model. Water Resour. Hydropower Eng. 2026, 57, 13–24. [Google Scholar]
  90. Kong, F.; Gong, J.Y. Comprehensive understanding of key characteristics and analytical framework of flood disaster resilience in urban old communities. Water Resour. Hydropower Eng. 2026, 57, 90–103. [Google Scholar]
  91. Zhang, W.; Qiu, S.; Lin, Z.; Chen, Z.; Yang, Y.; Lin, J.; Li, S. Assessing the Influence of Green Space Morphological Spatial Pattern on Urban Waterlogging: A Case Study of a Highly-Urbanized City. Environ. Res. 2025, 266, 120561. [Google Scholar] [CrossRef] [Scilit] [PubMed]
  92. Ji, J.; Fang, L.; Chen, J.; Ding, T. A Novel Framework for Urban Flood Resilience Assessment at the Urban Agglomeration Scale. Int. J. Disaster Risk Reduct. 2024, 108, 104519. [Google Scholar] [CrossRef] [Scilit]
  93. Deng, J.; Zhang, R.; Chen, S.; Li, Z.; Gao, L.; Li, Y.; Wei, C. Spatiotemporal Evolution and Influencing Factors of Flood Resilience in Beibu Gulf Urban Agglomeration. Int. J. Disaster Risk Reduct. 2024, 114, 104905. [Google Scholar] [CrossRef] [Scilit]
  94. Sun, H.F.; Chen, R.J.; Mao, W.X.; Luo, D. Spatiotemporal Evolution and Influencing Factors of Urban Flood Resilience in the Pearl River Delta Urban Agglomeration. Sustain. Cities Soc. 2026, 139, 107218. [Google Scholar] [CrossRef] [Scilit]
  95. Kasprzyk, M.; Szpakowski, W.; Poznańska, E.; Boogaard, F.C.; Bobkowska, K.; Gajewska, M. Technical Solutions and Benefits of Introducing Rain Gardens—Gdańsk Case Study. Sci. Total Environ. 2022, 835, 155487. [Google Scholar] [CrossRef] [Scilit] [PubMed]
  96. Cheng, T.; Huang, B.; Yang, Z.; Qiu, J.; Zhao, B.; Xu, Z. On the Effects of Flood Reduction for Green and Grey Sponge City Measures and Their Synergistic Relationship—Case Study in Jinan Sponge City Pilot Area. Urban Clim. 2022, 42, 101058. [Google Scholar] [CrossRef] [Scilit]
  97. Bose, T.; Kalbar, P.P.; Mondal, A. Performance and Uncertainty Assessment of Green Roofs for Urban Flood Reduction in a High-Density Catchment in Ahmedabad, India. J. Environ. Manag. 2024, 365, 121500. [Google Scholar] [CrossRef] [Scilit] [PubMed]
  98. Soomro, S.; Waseem, M.; Zwain, H.M.; Soomro, G.; Shi, X.; Guo, J.; Li, Y.; Tayyab, M.; Hyder, M.; Aamir, A.; et al. How Effective Is Twitter (X) Social Media Data for Urban Flood Management? J. Hydrol. 2024, 634, 131129. [Google Scholar] [CrossRef] [Scilit]
  99. Lu, Q.O.; Bahramloo, R.; Rodrigo-Comino, J.; Wang, J.; Talebi, A.; Tran, Q.T.P.; Ghahramani, A.; Sepehri, M. Evaluating the Impact of Roof Rainwater Harvesting on Hydrological Connectivity and Urban Flood Mitigation. Results Eng. 2025, 25, 104022. [Google Scholar] [CrossRef] [Scilit]
  100. Dong, X.; Ye, Y.; Yang, R.; Li, X. Planning for Green Infrastructure Based on Integration of Multi-Driving Factors: A Case Study in Pilot Site of Sponge City. Sustain. Cities Soc. 2023, 93, 104549. [Google Scholar] [CrossRef] [Scilit]
  101. Liu, Q.; Dong, J.; Cui, N.; Liang, Z.; Luo, J. Strategic Allocation of Medical Resources in Disaster Response: A Multi-Objective Nonlinear Dynamic Model with Risk and Cost Considerations. Comput. Ind. Eng. 2025, 210, 111541. [Google Scholar] [CrossRef] [Scilit]
  102. Wei, Y.; Kidokoro, T.; Seta, F.; Yang, Y. Community Resilience to Urban Flooding across Comparative Neighborhoods in China. Sci. Rep. 2026, 16, 6473. [Google Scholar] [CrossRef] [Scilit] [PubMed]
  103. Higo, E.; Okada, N.; Hipel, K.W.; Fang, L. Cooperative Survival Principles for Underground Flooding: Vitae System Based Multi-Agent Simulation. Expert Syst. Appl. 2017, 83, 379–395. [Google Scholar] [CrossRef] [Scilit]
  104. Fox, S.; Agyemang, F.; Hawker, L.; Neal, J. Integrating Social Vulnerability into High-Resolution Global Flood Risk Mapping. Nat. Commun. 2024, 15, 3155. [Google Scholar] [CrossRef] [Scilit] [PubMed]
  105. Perera, D.; Agnihotri, J.; Seidou, O.; Djalante, R. Identifying Societal Challenges in Flood Early Warning Systems. Int. J. Disaster Risk Reduct. 2020, 51, 101794. [Google Scholar] [CrossRef] [Scilit]
  106. Zhu, J.; Zhou, W.; Yu, W.; Wang, W. Block-Level Spatial Integration of Population Density, Social Vulnerability, and Heavy Precipitation Reveals Intensified Urban Flooding Risk. Sustain. Cities Soc. 2024, 117, 105984. [Google Scholar] [CrossRef] [Scilit]
Figure 1. Location of Beijing (a) and waterlogging inventory (b), including a total of 482 recorded waterlogging points during 2011–2021.
Remotesensing 18 02428 g001
Figure 2. Framework and workflow of urban waterlogging risk inequality assessment.
Remotesensing 18 02428 g002
Figure 3. Eight hydrogeographic indicators, including P (a), DEM (b), LC (c), Slope (d), SPI (e), TWI (f), ROD (g), and RID (h).
Remotesensing 18 02428 g003
Figure 4. Eight urban building indicators: DB (a), MBH (b), MBV (c), SDBH (d), SDBV (e), BCR (f), BSC (g) and BCD (h).
Remotesensing 18 02428 g004
Figure 5. Eight landscape indicators: PD (a), ED (b), LSI (c), CONTAG (d), DIVISION (e), SHDI (f), SHEI (g) and AI (h).
Remotesensing 18 02428 g005
Figure 6. Ten resilience indicators, namely, curvature (a), NDVI (b), DRC (c), DTH (d), DTP (e), DTF (f), GDP (g), ES (h), STS (i) and VP (j).
Remotesensing 18 02428 g006
Figure 7. ROC curve of the ML model with the largest AUC score.
Remotesensing 18 02428 g007
Figure 8. Waterlogging susceptibility level in Beijing based on XGBoost.
Remotesensing 18 02428 g008
Figure 9. Areal proportions of waterlogging susceptibility levels in each administrative district across Beijing.
Remotesensing 18 02428 g009
Figure 10. Spatial distributions of UIR (a), ER (b), SER (c), and UWR (d) across Beijing.
Remotesensing 18 02428 g010
Figure 11. Spatial pattern of waterlogging exposure across Beijing.
Remotesensing 18 02428 g011
Figure 12. District-level distribution and areal percentages of waterlogging risk in Beijing.
Remotesensing 18 02428 g012
Figure 13. Gini index-based waterlogging risk inequality: spatial patterns at district (a) and township (b) levels.
Remotesensing 18 02428 g013
Figure 14. XGBoost susceptibility model explanation with SHAP method.
Remotesensing 18 02428 g014
Figure 15. RF susceptibility model explanation with SHAP method.
Remotesensing 18 02428 g015
Table 1. Detailed information on urban building indicators.
Urban Building IndicatorsAbbreviationCalculationDescriptionUnit
Density of buildingsDB DB = N B A DB quantified the level of building density present in a given region.m−2
Mean building heightMBH MBH = i = 1 N H i N MBH measures the mean building height, computed by taking the sum of all building heights and dividing it by the number of buildings.m
Mean building volumeMBV MBV = i = 1 N V i N MBV measures the mean building volume, computed by taking the sum of all building volumes and dividing it by the number of buildings.m3
Standard deviation of building heightSDBH SDBH = i = 1 N ( H i MBH ) 2 N SDBH quantifies the spread or standard deviation of building heights within the area.m
Standard deviation of building volumeSDBV SDBV = i = 1 N ( V i MBV ) 2 N SDBV quantifies the spread or standard deviation of building volumes within the area.m3
Building coverage ratioBCR BCR = i = 1 N A i A BCR is defined as the ratio of building-covered land to the total land area within a given region.m−1
Building shape coefficientBSC BSC = i = 1 N ( P i × H i + A i ) V i BSC represents the surface-area-to-volume ratio of a building.m−1
Building congestion degreeBCD BCD = i = 1 N V i max ( H i ) × A BCD measures how densely buildings occupy the three-dimensional space of the area.m−1
Note: within each sub-catchment, the following variables are defined: N B as the total number of buildings, A as the sub-catchment area, H i as the height of building i, A i as the floor area of building i, P i as the perimeter of building i, and V i as the volume of building i. All the metrics were computed at the sub-catchment scale [45].
Table 2. Detailed information on landscape indicators.
Landscape IndicatorsAbbreviationCalculationDescription
Patch densityPD PD = N L A How many patches occur within each 100-hectare unit.
Edge densityED ED = E A The cumulative length of all patch boundaries within a unit area.
Landscape shape indexLSI LSI = 0.25 E A Assesses the degree of shape complexity exhibited by the landscape as a whole.
ContagionCONTAG CONTAG = 1 + k = 1 m j = 1 m g kj 2 E ln g kj 2 E 2 lnm × 100 % Quantifies the degree of spatial aggregation or non-random association among distinct patch types.
DivisionDIVISION DIVISION = 1 k = 1 n a k A 2 Measures the degree of spatial separation or division among patches at the landscape scale.
Shannon’s diversity indexSHDI SHDI = k = 1 m q k lnq k Quantifies the degree of uniformity in the spatial distribution of landscape diversity.
Shannon’s evenness indexSHEI SHEI = SHDI lnm Quantifies the degree of heterogeneity in the spatial distribution of patch areas across the landscape.
Aggregation indexAI AI = k = 1 m g kk maxg kk q k × 100 % Measures the tendency of similar patches to be spatially grouped.
Note: For each sub-region, N L = patch count, E = total edge length, m = number of patch types k, j = type indices, g k j = edges between types k and j, a k = area of type k, q k = area proportion of type k, g k k = internal edges of type k, and max g k k = max internal edges for patch type k under full aggregation. Units: PD (num/100 ha), ED (m/ha), CONTAG/AI (%), and others that are unitless.
Table 3. The indicator system for urban waterlogging resilience assessment.
CategoryIndicatorStatusWeightDescription (Units)
Urban Intrinsic Resilience (UIR)Curvature+0.0032 Grid-cell terrain curvature from DEM.
NDVI+0.1303 The normalized difference vegetation index, used to represent how much vegetation covers each grid cell.
DRC+0.8665 The drainage capacity of urban areas on a per-grid-cell basis, which is proxied through road density
Emergency Resilience (ER)DTH0.3333 Euclidean distance to the nearest hospital per grid cell (m).
DTF0.3333 Euclidean distance to the nearest fire station per grid cell (m).
DTP0.3333 Euclidean distance to the nearest police station per grid cell (m).
Socioeconomic Resilience (SER)ES+0.2273District-level resident education levels based on statistical records.
GDP+0.4911The adjusted real GDP per grid cell, expressed in millions of 2017 US dollars.
STS+0.2175The spatial arrangement of positive sentiment values (on a scale of 0 to 1) obtained from social media check-in records.
VP0.0641The proportion of the vulnerable population aged 65 years and over.
Table 4. Information for urban waterlogging assessment indicators.
Data CategoryData DescriptionSpecific Layers/IndicatorsSource/DerivationSpatial ResolutionTemporal Coverage
Primary dataWaterlogging inventory482 points Beijing Municipal Water Resources BureauPoint2011–2021
Digital elevation modelDEMhttps://www.gebco.net/Raster (30 m)2024
Annual average precipitationPBeijing Open Data Platform (https://data.beijing.gov.cn/index.htm) (accessed on 10 December 2025)Raster (30 m)1990–2020
Land coverLChttps://zenodo.org/records/8176941 (accessed on 10 December 2025)Raster (30 m)2020
Road & river networksOpenStreetMap (https://www.openstreetmap.org/)Vector2024
Building footprint and heighthttps://zenodo.org/records/8174931 (accessed on 10 December 2025)Vector2023
NDVINDVIhttps://data.tpdc.ac.cn/zh-hans/data/10535b0b-8502-4465-bc53-78bcf24387b3 (accessed on 10 December 2025)Raster (250 m)2024
Points of interestHospitals, fire stations, police stationsGaode Maps (https://amap.com/)Point2024
Gross domestic productGDPhttps://doi.org/10.6084/m9.figshare.17004523Raster (1 km)2019
Education statusESBeijing Statistical YearbookDistrict2023
Vulnerable populationVPSeventh National Population Census of ChinaDistrict2020
Social media check-insWeibo (https://weibo.com/)Point2023
Population densityPophttps://doi.org/10.48690/1531770Raster (1 km)2023
Derived dataTopographic indices Slope, TWI, SPI, CurvatureDerived from DEMRaster (30 m)
Density indices ROD, RID, DRCDerived from road and river networksRaster (30 m)
Building morphology indicators (8)DB, MBH, MBV, SDBH, SDBV, BCR, BSC, BCDCalculated from Building shapefile at sub-catchment scaleRaster (30 m)
Landscape pattern metrics (8)PD, ED, LSI, CONTAG, DIVISION, SHDI, SHEI, AICalculated from LC using FRAGSTATS 4.2 at sub-catchment scaleRaster (30 m)
Distance to emergency facilitiesDTH, DTF, DTPEuclidean distance from Gaode POIs to each grid cellRaster (30 m)
Socioeconomic resilience layersSTSKriging interpolation of sentiment scores (0–1) from WeiboRaster (30 m)
Table 5. The search space and optimal values of hyperparameters of ML models.
ModelHyperparameterSearch SpaceOptimal ValueAccuracy
XGBoostn_estimators[50,1000]1080.8621
max_depth[10,50]25
learning_rate[0.01,0.1]0.01455
subsample[0.5,1.0]0.83337
colsample_bytree[0.5,1.0]0.73297
RFn_estimators[50,1000]6480.8598
max_depth[10,50]50
min_samples_split[2,20]7
min_samples_leaf’[1,20]6
max_features{sqrt, log2}‘log2’
AdaBoostn_estimators[50,1000]8840.8322
learning_rate[0.01,0.1]0.06806
DTmax_depth[10,50]130.8161
min_samples_split[2,20]12
min_samples_leaf[1,20]19
max_features{sqrt, log2, None}‘log2’
criterion{gini, entropy}‘gini’
splitter{best, random}‘best’
ccp_alpha[0.0,0.1]0.00244
NBvar_smoothing[1 × 10−9,1 × 10−1]4.58 × 10−50.7655
Table 6. Gini index values for waterlogging risk inequality across districts in Beijing.
DistrictGini Index
Miyun District0.6223
Yanqing District0.6034
Huairou District0.6007
Pinggu District0.5289
Changping District0.4536
Daxing District0.4883
Tongzhou District0.4934
Shunyi District0.4519
Fangshan District0.508
Mentougou District0.5775
Shijingshan District0.2357
Haidian District0.2943
Chaoyang District0.3517
Fengtai District0.2808
Dongcheng District0.1815
Xicheng District0.1659
Disclaimer/Publisher’s Note: The statements, opinions and data contained in all publications are solely those of the individual author(s) and contributor(s) and not of MDPI and/or the editor(s). MDPI and/or the editor(s) disclaim responsibility for any injury to people or property resulting from any ideas, methods, instructions or products referred to in the content.