Article

The Nexus Between Urbanization and Precipitation Chemistry in the Pearl River Delta, China: Decoupling Analysis


1
Guangdong Provincial Observation and Research Station for Urban Agglomeration Ecosystem in Guangdong-Hong Kong-Macao Greater Bay Area, Guangzhou Institute of Geography, Guangdong Academy of Sciences, Guangzhou 510070, China
2
Research Institute of Tropical Forestry, Chinese Academy of Forestry, Guangzhou 510520, China
3
Zhuhai Ecological Environment Monitoring Station of Guangdong Province, Zhuhai 519070, China
4
Guangdong Pearl River Estuary Integrated Monitoring Station for Ecological Quality of Marine Ecosystem, Zhuhai 519070, China
5
Guangdong Provincial Key Laboratory of Applied Botany, Key Laboratory of National Forestry and Grassland Administration on Plant Conservation and Utilization in Southern China, South China Botanical Garden, Chinese Academy of Sciences, Guangzhou 510650, China
*
Author to whom correspondence should be addressed.
Remote Sens. 2026, 18(14), 2391; https://doi.org/10.3390/rs18142391
Submission received: 28 May 2026 / Revised: 5 July 2026 / Accepted: 14 July 2026 / Published: 17 July 2026

Highlights

What are the main findings?
  • Integrating nighttime light (NTL) remote sensing with an optimal parameter–based geographical detector (OPGD) identifies economic urbanization as the dominant factor explaining the spatiotemporal heterogeneity of precipitation ion concentrations.
  • Decoupling analysis reveals a significant transition in the Pearl River Delta from expansive negative decoupling (62.93%) to strong decoupling (75.86%) after 2005, signaling a shift toward an equilibrium between urban expansion and atmospheric environmental quality.
What are the implications of the main findings?
  • The study demonstrates that NTL intensity serves as a high-performance proxy for characterizing the complex nonlinear interactions and spatial non-stationarity between urbanization and secondary pollutant prevalence in precipitation.
  • The proposed multi-source data framework provides a robust tool for large-scale monitoring of atmospheric chemistry dynamics, offering a scientific basis for formulating differentiated environmental zoning and targeted pollution control in rapid urbanizing clusters.

Abstract

Rapid urbanization exacerbates atmospheric pollutant emissions, markedly altering precipitation chemistry. However, a comprehensive understanding of the equilibrium between multicomponent precipitation chemistry and urbanization remains unclear. This study characterizes the spatiotemporal urbanization dynamics of the Pearl River Delta (PRD) urban agglomeration from 2000 to 2020 by integrating multi-source datasets, including nighttime light (NTL) observations, Landsat-derived land cover, and gridded population products. The interplay between precipitation chemistry and urbanization was evaluated through a multidimensional equilibrium assessment framework integrating spatial heterogeneity, trade-off and synergy analysis, and decoupling diagnosis. The results indicated that interannual variation in precipitation ion concentrations initially increased and then decreased from 2000 to 2020. Spatially, major ion concentrations (SO42−, NO3, Ca2+, and NH4+) generally declined across the region after 2009, with the most pronounced declines in peripheral PRD areas. Conversely, urbanization intensified, spreading from the central core to the periphery. NTL intensity exhibited the strongest explanatory power for major ion concentrations, suggesting that economic urbanization is more closely associated with spatial variability in precipitation chemistry. Over time, the relationship between precipitation ion concentrations and urbanization shifted from synergy to trade-off. After 2005, the dominant decoupling status of major ion concentrations relative to urbanization shifted from expansive negative decoupling (up to 62.93%) to strong decoupling (up to 75.86%). This shift indicates that the antagonism between urbanization and precipitation pollution has gradually transitioned toward equilibrium. However, this equilibrium exhibits spatiotemporal non-stationarity. These findings highlight the complex nonlinear interactions between urbanization and precipitation chemistry. Identifying spatial heterogeneity in decoupling between urbanization and environmental pollution facilitates the formulation of differentiated zoning management strategies.

1. Introduction

The chemical composition of precipitation serves as a reliable indicator of natural and anthropogenic influences on the atmospheric environment [1], particularly in urban areas with intensive pollution emissions [2]. Rapid urbanization is a global phenomenon with profound effects on ecosystems, introducing various ecological risks [3]. Rapid economic development, often driven by energy-intensive models, releases large amounts of atmospheric pollutants [4] that undergo complex atmospheric reactions before being deposited onto surfaces through processes such as rainfall. This deposition alters the geochemical cycles of surface elements, affecting terrestrial and aquatic ecosystems. The impacts include soil and water acidification, vegetation degradation, reduced crop yields, and corrosion of buildings [5,6,7]. The above situation forces human beings to effectively coordinate urban development and environmental protection. Accordingly, investigating the complex coupling and decoupling between urbanization and precipitation chemistry is essential for formulating effective environmental management strategies and evaluating their ecological impacts.
Numerous studies worldwide have examined the sources and chemical properties of regional precipitation, as well as the acidification or alkalinization of rainwater resulting from changes in its chemical composition since the 1980s [8,9,10]. The severity of acid rain in China has been a significant research focus in recent decades [11]. Over the past four decades, rapid socio-economic development and associated high energy consumption have led to frequent acid rain events in China [12]. Consequently, the country has become one of the regions worldwide most affected by acid rain, particularly in developed cities in the southern part of the country. In recent years, significant progress has been made through energy conservation, emission reduction, and pollution control measures. As a result, pollutant emissions and severe acid rain events have been mitigated, leading to substantial changes in precipitation chemistry [13]. Notably, sulfide levels have significantly decreased and are expected to continue declining [14]. Similarly, long-term observations in Europe have confirmed that reductions in anthropogenic emissions have led to decreased nitrogen and sulfur deposition over the past two decades [15]. Nitrogen oxide emissions have declined by 48% in the United States and 37% in the European Union over the past few decades [16]. However, nitrogen oxide emissions have substantially increased in rapidly developing and highly urbanized regions [17,18]. Furthermore, recent studies have indicated that ammonia emission control strategies in China, while reducing PM2.5 pollution and nitrogen deposition, might exacerbate acid rain [11]. These findings suggested that precipitation-driven pollution continues to pose a significant threat to the atmosphere and human health, with increasingly complex impacts [14]. Therefore, continued efforts to reduce acidifying agents and other chemical constituents in precipitation are essential to mitigate associated environmental impacts and enhance the resilience and stability of urban environments.
Amid rapid urbanization, atmospheric precipitation is increasingly susceptible to contamination by pollutants derived from gaseous precursors such as NOx, SO2, and NH3, as well as particulate matter, including fugitive dust containing divalent cations (e.g., Ca2+). These pollutants are inherently linked to human activities, with key sources including construction, transportation, industrial production, and biomass combustion [18]. This result highlights the significant impact of urbanization—encompassing the expansion of built environments, population growth, and economic development—on precipitation chemistry. The growing complexity of contemporary energy systems and industrial processes has led to a diversification of pollutant emission sources and atmospheric reaction pathways. As a result, the chemical deposition due to precipitation has become an intricate, multi-component phenomenon shaped by various emission sources and atmospheric interactions [7]. However, previous studies have often focused on isolated chemical components [19,20], short time periods [21,22], or individual locations [23,24].
Comprehensive studies examining multiple chemical components over extended periods and across diverse locations are urgently warranted. Such research is essential for evaluating regional precipitation pollution, understanding ecological impacts, and informing management strategies. Source apportionment methods, such as Positive Matrix Factorization, are commonly used to assess the effects of urbanization on precipitation chemistry [17,25]. These methods help identify contributions from specific sources (e.g., biomass combustion, vehicle emissions, construction dust, etc.), which are closely linked to broader urbanization dynamics, including land-use changes, economic development, and population growth. However, these methods typically focus on emission sources, potentially overlooking spatial correlations and heterogeneity in deposition patterns and impacts. Urbanization involves simultaneous economic growth, the expansion of built-up areas, and population concentration, driving increased demand for resources and energy. The interaction between natural and anthropogenic factors creates a complex relationship between urbanization and precipitation chemistry. Nevertheless, data and methodological constraints have limited the studies exploring spatial variations in the long-term relationship between multi-component precipitation chemistry and urbanization. This limitation presents significant challenges in fully understanding precipitation chemical evolution and assessing its response to urbanization. Future research should employ indicators of land-use changes, economic development, and population growth to comprehensively investigate their combined effects on precipitation chemistry across regions with varying degrees of urbanization. Advances in remote sensing technology have facilitated a multidimensional understanding of urbanization dynamics. Over the past several decades, the integration of multi-source Earth observation data—specifically high-resolution multispectral imagery and nighttime light (NTL) observations—has become a cornerstone for systematic urban monitoring and the assessment of coupled human–environmental systems [26,27].
The coupling and coordination between urbanization and the ecological environment have been extensively studied. However, existing literature has primarily focused on macro-scale coupling between urbanization and ecosystem service values [28], the balance between ecosystem service supply and demand [29], and the driving mechanisms of carbon emissions [30]. By contrast, the decoupling between urban pressure and ecological response has received limited attention [31]. The Tapio decoupling model, derived from decoupling theory, transforms the concept from a general policy discourse into an analytical tool characterized by rigorous mathematical definitions and a systematic typology. This method expands the economy–environment relationship from a simple binary opposition between coupling and decoupling to a detailed framework encompassing eight logical possibilities [32], thereby effectively revealing the complex dynamics between economic growth and environmental pressure and enabling cross-national, cross-temporal, and cross-sectoral decoupling comparisons. Therefore, to comprehensively elucidate the complex nonlinear relationship between urbanization and precipitation chemistry, this study constructs a decoupling analysis framework for “urbanization–precipitation pollution” and reveals the spatial non-stationarity of their decoupling state. The objective is to provide novel insights for assessing long-term trends and formulating differentiated zoning management strategies.
Precipitation chemical composition varies regionally due to differences in meteorological conditions, topography, and geographical characteristics [10], posing significant challenges for ecosystem protection. The Pearl River Delta (PRD) urban agglomeration, one of the most economically developed regions in China, is characterized by high population density, substantial land-use changes, and the rapid expansion of built-up areas. Urbanization intensifies human activities, including energy consumption, industrial production, and transportation, which alter the urban surface, thermal characteristics, and local microclimate [33]. Consequently, these changes promote pollutant emissions, such as aerosols, and exacerbate chemical pollution in precipitation. Meanwhile, efforts to control environmental pollution, combined with rapid urbanization, have further complicated urban air pollution [13]. The impact of urbanization on precipitation chemistry varies across different stages of development, influenced by evolving human activities and policy changes. Thus, achieving sustainable urban development requires further research to elucidate the complex relationship between urbanization and precipitation chemistry. Focusing on PRD urban agglomeration, this study quantified the spatiotemporal evolution (2000–2020) of nine chemical components in atmospheric precipitation (SO42−, Mg2+, NH4+, Na+, Cl, Ca2+, NO3, K+, and F) and examined the spatially variable relationship between precipitation chemistry and urbanization through coupling and decoupling analyses. Our findings provide a theoretical basis for policies targeting the sustainable management of chemical pollution in highly urbanized regions. Specifically, the study aimed to (i) elucidate the spatiotemporal trends in key ionic components of precipitation alongside urbanization patterns, and (ii) reveal the coupling–decoupling dynamics between urbanization and precipitation chemistry.

2. Materials and Methods

2.1. Study Area

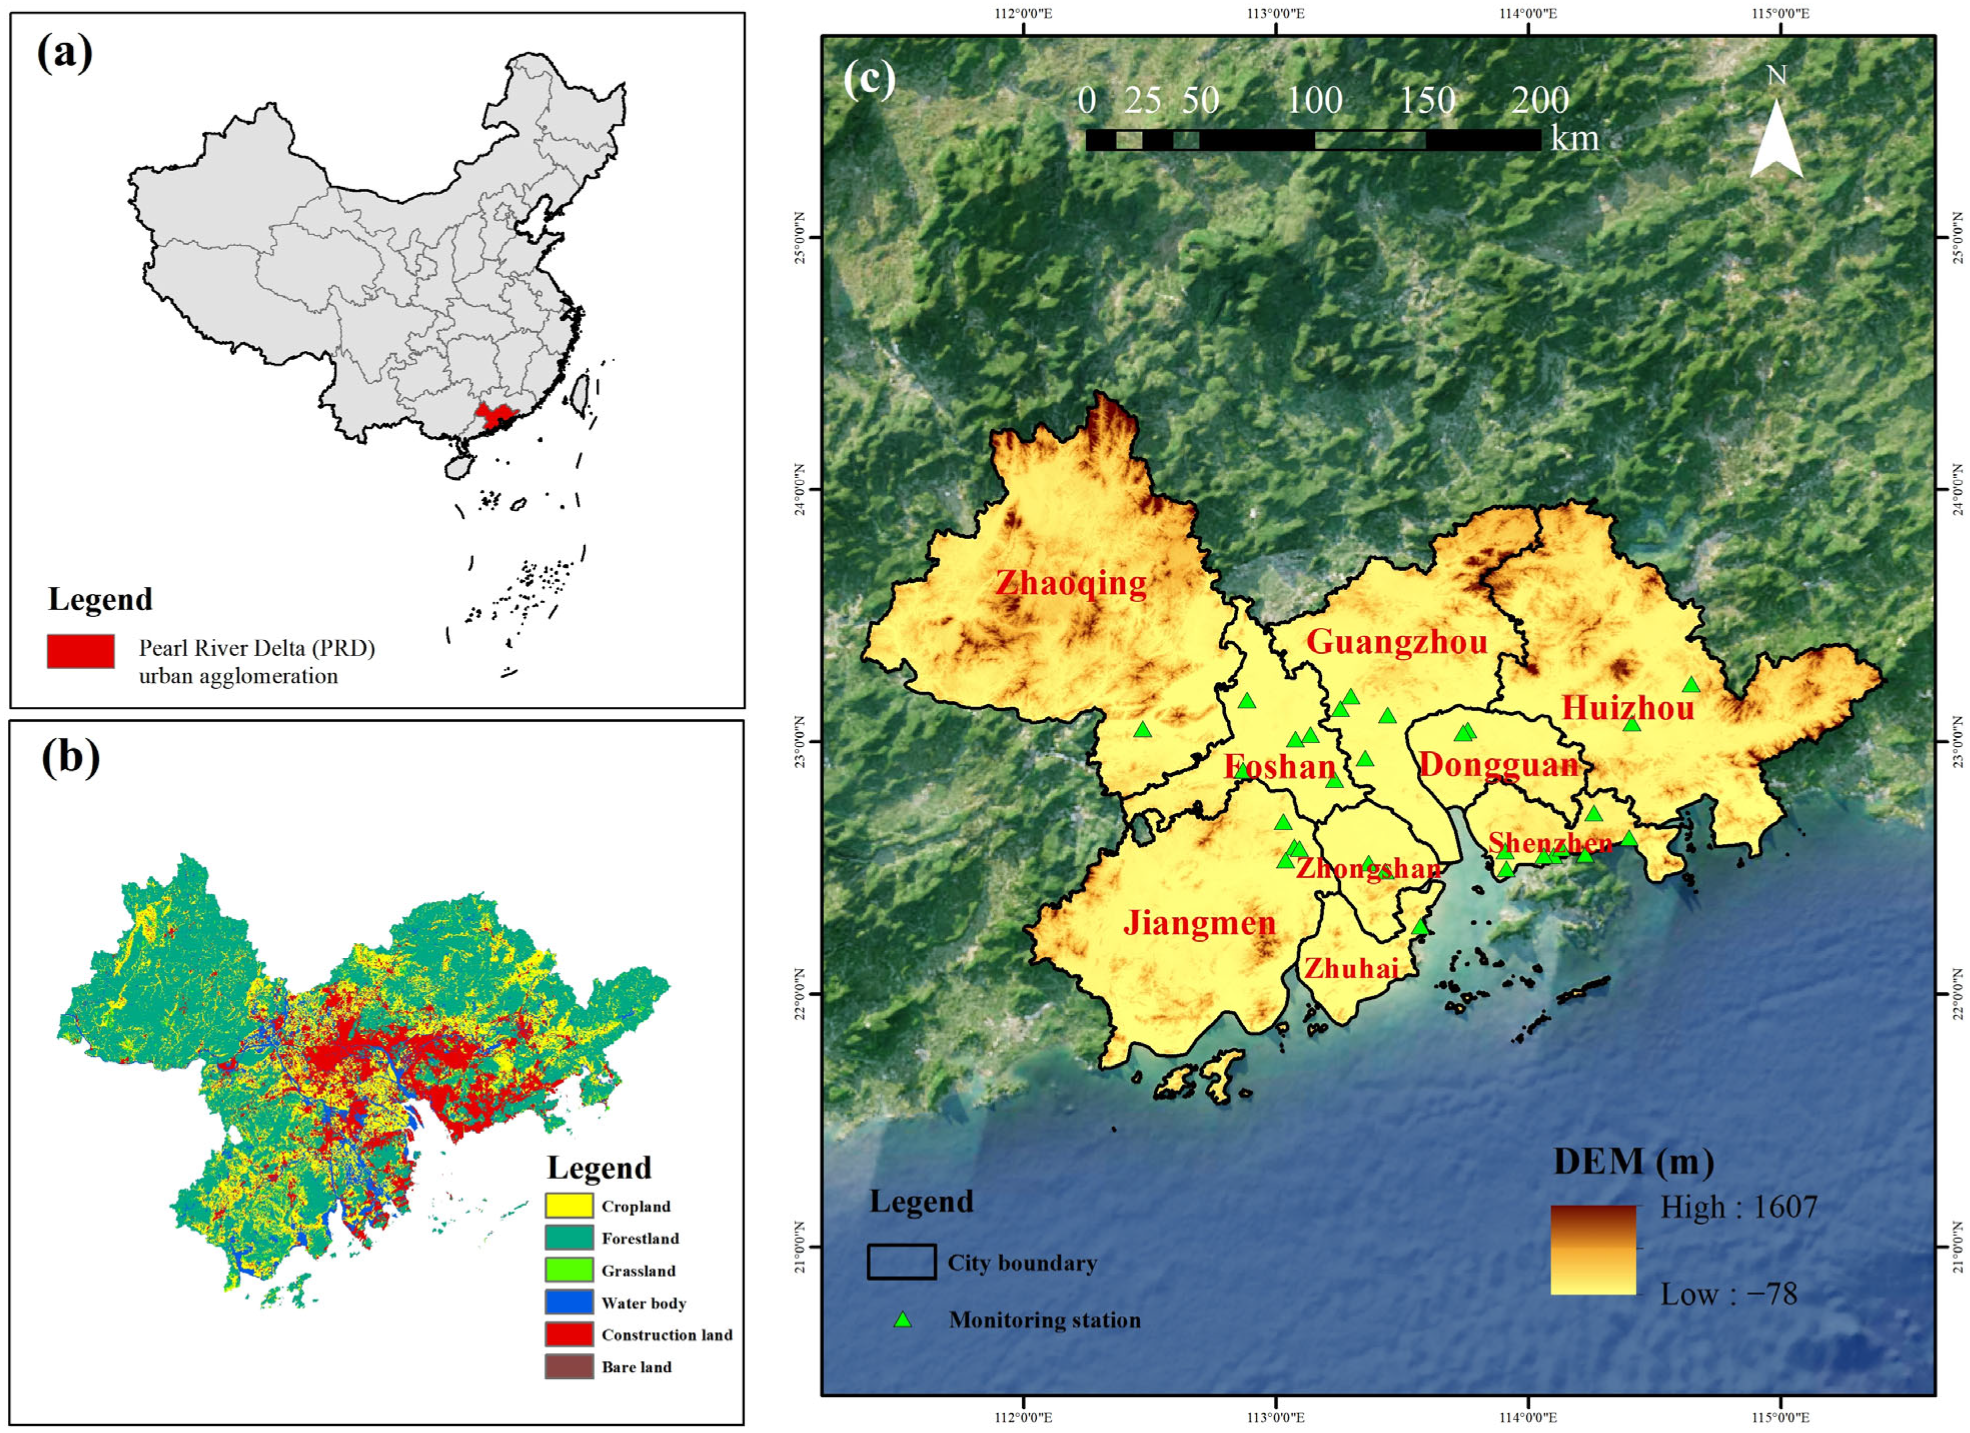
The PRD urban agglomeration is located in the lower reaches of the Pearl River Basin and south of the Nanling Mountains (21°28′–25°31′E, 111°03′–116°13′N; Figure 1a). The region has complex terrain that slopes gradually from north to south. High-altitude mountains characterize the northern area, while the central and southern coastal regions primarily comprise low hills, terraces, and plains, with an average elevation of <200 m (Figure 1c). The total area of the region is 5.60 × 10⁴ km2. The main land-use types are construction land and forestland, distributed primarily in the central and peripheral parts of the region (Figure 1b). The area experiences a subtropical humid monsoon climate characterized by high year-round temperatures and abundant rainfall. The annual mean temperature ranges from 21 °C to 23 °C, and the average annual precipitation exceeds 1500 mm. Various types of rainstorms with diverse precipitation characteristics occur frequently. The study area includes 29 precipitation monitoring stations (Figure 1c), and their detailed information is provided in Table S1.

2.2. General Research Framework

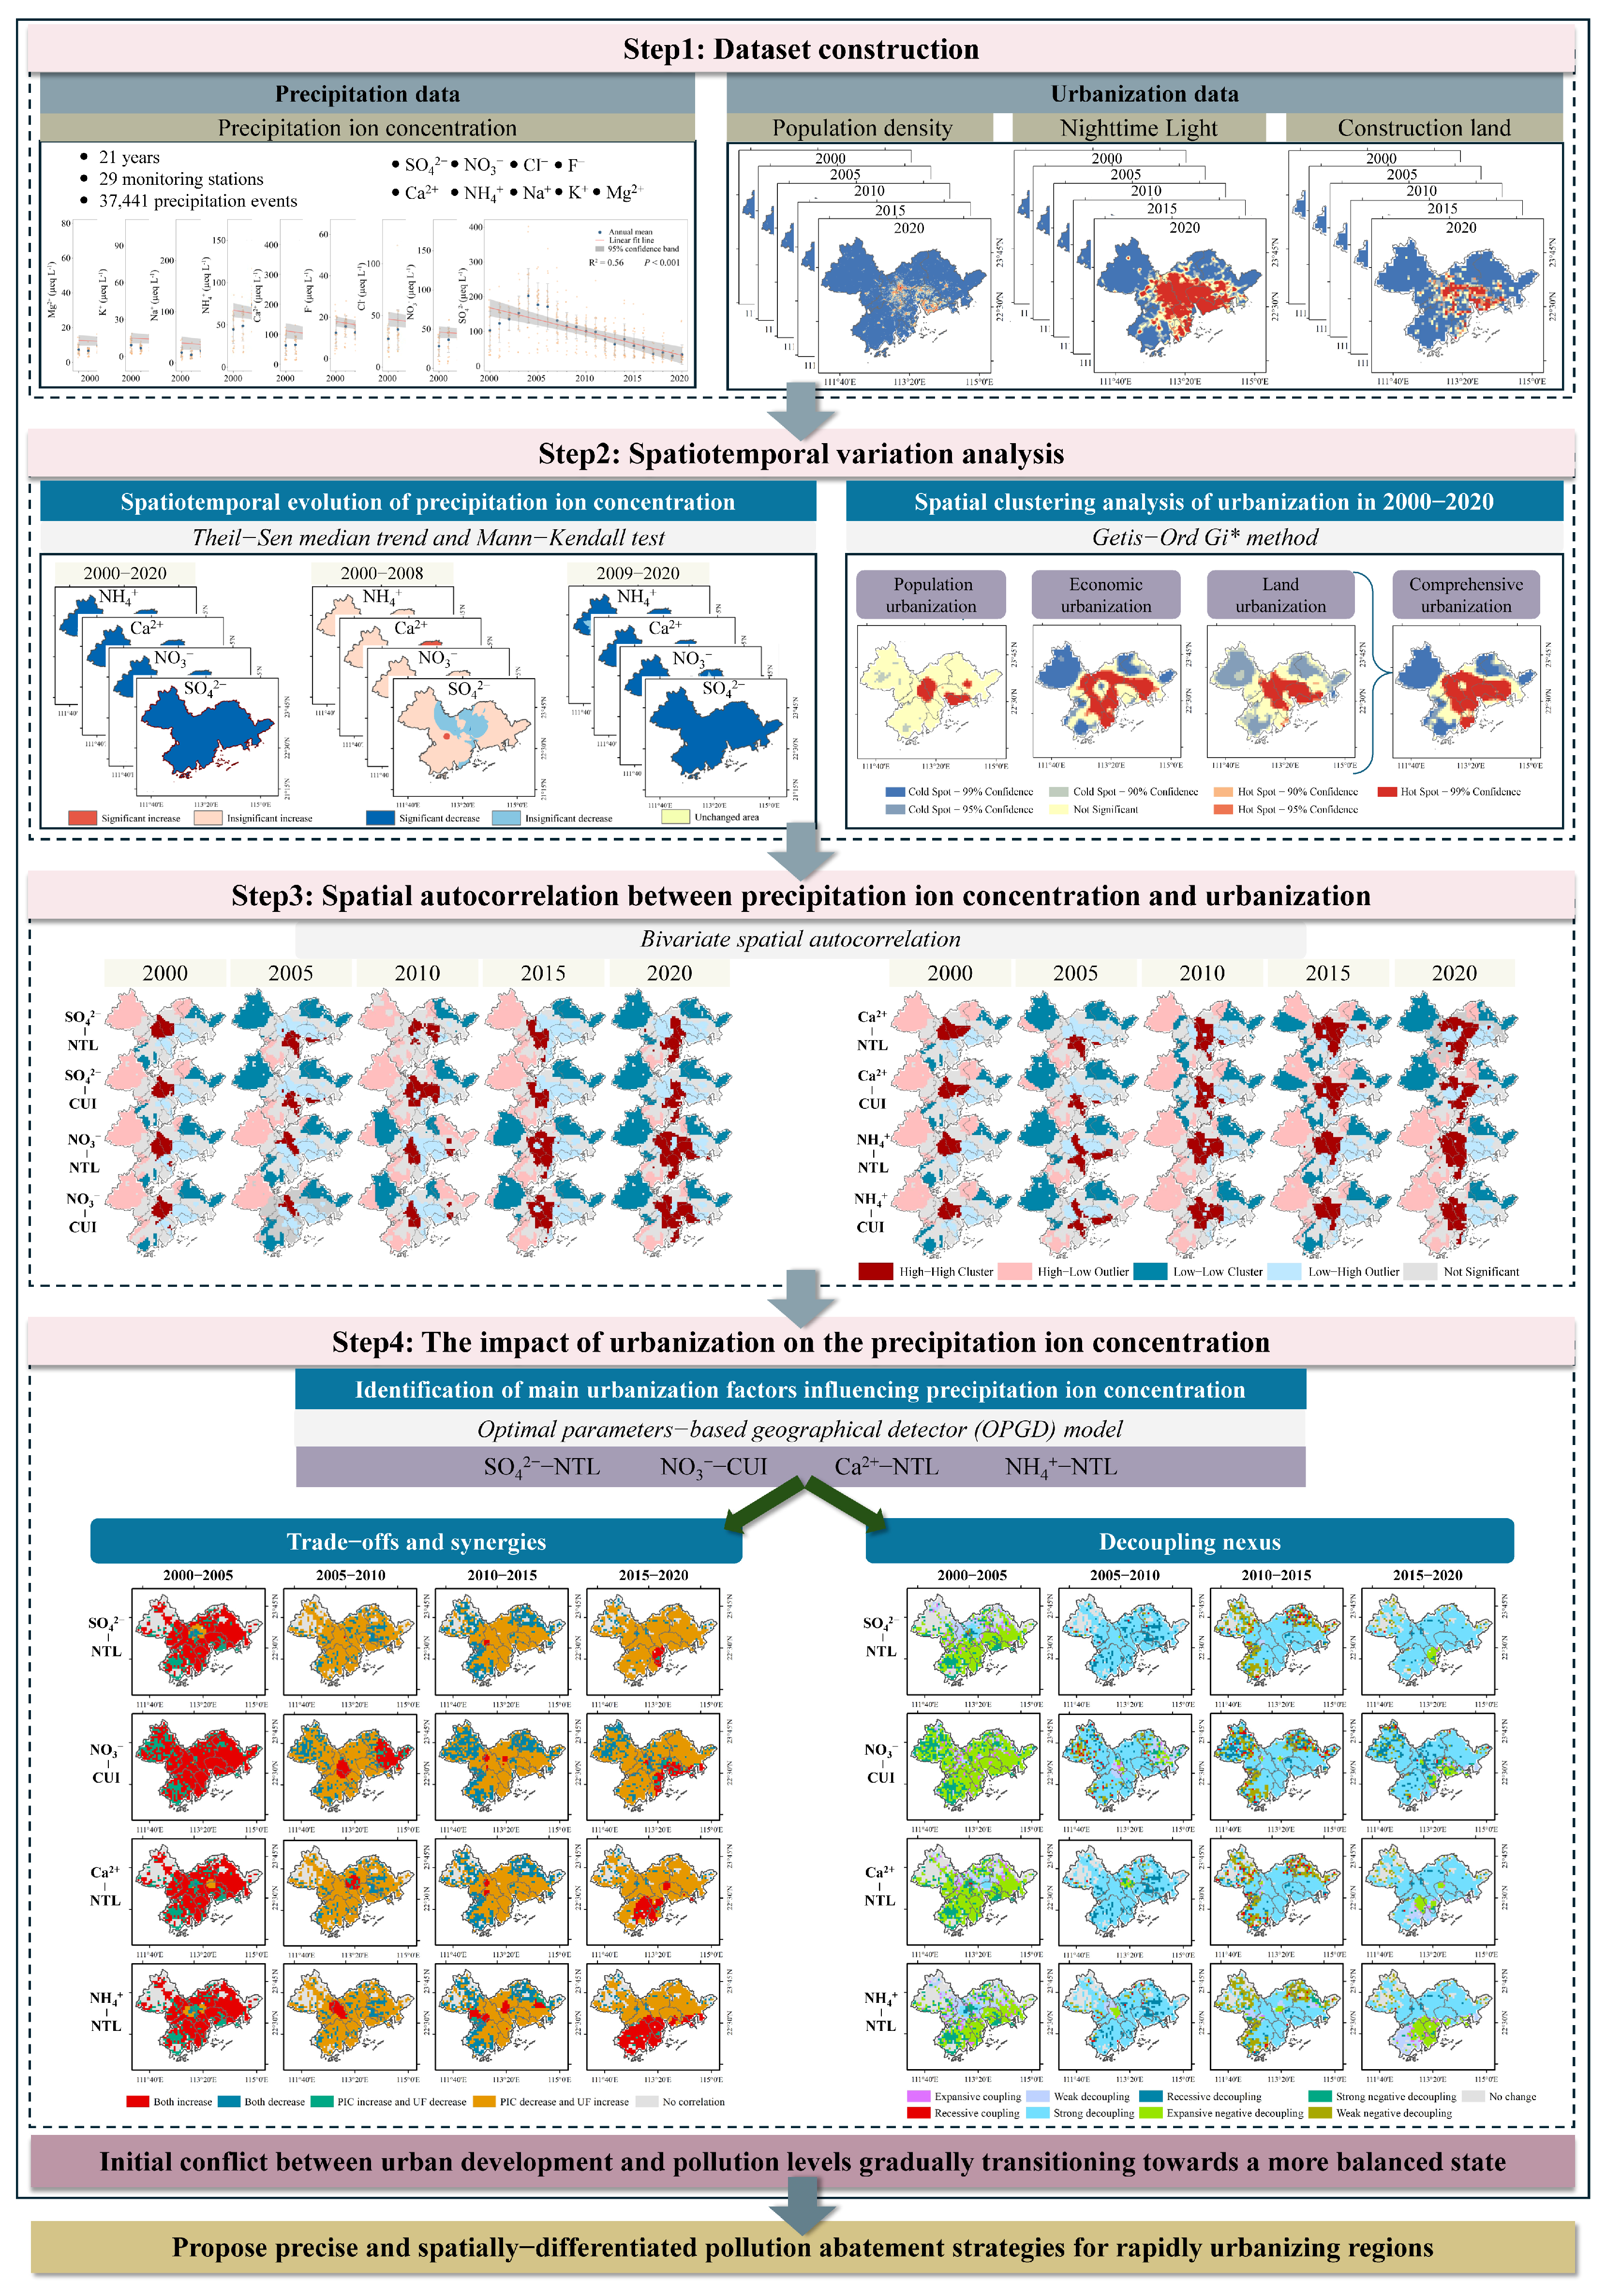
We conducted long-term monitoring of atmospheric precipitation chemical constituents from 2000 to 2020 to investigate the interaction between urbanization and precipitation chemical pollution in the PRD urban agglomeration. Additionally, the urbanization dynamics were quantified using NTL, population density (POD; people.km−2), and construction land proportion (CLP, %). To determine the optimal spatial extent for this study, semivariogram analysis was employed. NTL, POD, and CLP were selected, and semivariogram models were fitted using GS+ software (version 9.0; Gamma Design Software LLC, Plainwell, Michigan, USA) across spatial ranges from 1 to 10 km to estimate the following parameters: Nugget (C0), Sill (C0 + C), Nugget-to-Sill ratio [C0/(C0 + C)], Range (A0), coefficient of determination (R2), and residual sum of squares (RSS) [34]. The results indicate that the Nugget and Sill values, as well as their ratio, decrease gradually with increasing spatial range (Tables S2–S4). This suggests that, at larger scales, the proportion of spatial heterogeneity attributable to random components decreases progressively, and the overall pattern is masked by local changes. The fitting results indicate that all three indices attain the highest R2 and lowest RSS at a spatial range of 6 km. Thus, a 6 km × 6 km grid was adopted as the optimal analytical unit for examining the relationship between urbanization and precipitation chemistry. The research flowchart is illustrated in Figure 2.
This flowchart included (i) the spatio-temporal variation trend of precipitation ion concentration (PIC) based on the Theil–Sen median trend and Mann–Kendall (MK) test, (ii) the spatial distribution characteristics of single (e.g., population, economy, and land) and composite urbanization factor (UF) identified by spatial autocorrelation (global and local Moran’s I and Getis–Ord Gi* index), (iii) the paired spatial clustering analyzed using bivariate spatial autocorrelation, and (iv) the coupling coordination between PICs and UFs revealed through decoupling analysis.

2.3. Data Sources and Chemical Analyses

Samples were collected from January 2000 to December 2020 using a standard manual rain gauge with a 20 cm diameter installed 1.5 m above ground level at all monitoring sites. The gauges remained open throughout the monitoring period to collect bulk precipitation. In total, 37,441 precipitation events were recorded, and samples were collected immediately after each event to minimize post-depositional alterations. The sample sizes for each monitoring site are provided in Table S1. Rainfall amounts for individual events were measured using automated meteorological stations collocated with each gauge. Collectors were thoroughly rinsed with deionized water after each event to prevent cross-contamination. The samples were filtered through a 0.22 μm nylon membrane to remove insoluble substances, stored in clean polyethylene bottles at 4 °C, and analyzed chemically within 48 h. Concentrations (μeq L−1) of SO42−, Mg2+, NH4+, Na+, Cl, Ca2+, NO3, K+, and F were determined using ion chromatography (IC; 883 Basic IC plus; Metrohm, Herisau, Switzerland). Blank samples were analyzed to detect potential contamination during transportation, filtration, and storage, and the IC results confirmed negligible contamination.
The quality of the rainfall data was further assessed using the charge balance between cations and anions. Linear regression analysis yielded a slope of 0.80, an R2 value of 0.67, and an anion-to-cation concentration ratio of 1.19 (Figure S1). These results satisfied the ion balance criteria established by the United States Environmental Protection Agency, which specifies that when the total ion equivalent concentration exceeds 100 μeq L−1, the difference between anions and cations should fall within 15–30% [35]. Overall, these findings showed that the precipitation ion data in this study are of high quality and reliability.
Additionally, we used a set of geospatial data, including POD, NTL, and Landsat imagery, to assess the urbanization of the PRD from three perspectives: population urbanization, economic urbanization, and land urbanization. The population density raster data at 1 km resolution for 2000, 2005, 2010, 2015, and 2020 were sourced from the Resource and Environment Data Cloud Platform (RESDC, http://www.resdc.cn/). The NTL data, with a 1 km resolution and spanning from 2000 to 2020, were obtained from the National Qinghai–Tibet Plateau Scientific Data Center [26]. The Landsat imagery (including Landsat TM/ETM+/OLI) was jointly launched by the United States Geological Survey (USGS) and the National Aeronautics and Space Administration (NASA) (https://earthexplorer.usgs.gov). These data were utilized to extract the spatial extent of construction land across the study period.

2.4. Data Analyses and Processing

2.4.1. Calculation of PIC

PIC was calculated using Equation (1) [20]:
PIC i   =   i = 1 n ( C i j   ×   P j )   /   j = 1 n P j
where PIC i represents the annual mean equivalent concentration of the i-th ion, which is obtained by precipitation-weighted means; C i j represents the concentration (μeq L−1) of the i-th ion in the j-th sample, P j represents the corresponding precipitation amount (mm) during the j-th sampling period, and n represents the number of precipitation samples. PICs in the PRD were listed in Table S5. The total anion concentration (TAC) and total cation concentration (TCC) were calculated by adding the concentrations of four anions (SO42−, NO3, CI, and F) and five cations (Ca2+, NH4+, Na+, K+, and Mg2+). The total ion concentration (TIC) was the sum of TAC and TCC. The spatial distribution of ion concentrations was mapped using ordinary kriging based on annual mean concentrations of target ions.

2.4.2. Construction Land Extraction

Land use/cover (LULC) classification was executed utilizing a Random Forest (RF) algorithm—an ensemble decision-tree framework selected for its structural resilience to overfitting and its proficiency in handling high-dimensional datasets. Firstly, based on the Landsat images that have undergone radiation calibration and atmospheric correction, four spectral indices, namely Normalized Difference Vegetation Index (NDVI), Normalized Difference Water Index (NDWI), Normalized Difference Built-up Index (NDBI) and Enhanced Water Index (EWI), were calculated. These metrics effectively amplified the spectral divergence among target surface features—namely vegetation, aquatic bodies, and impervious surfaces—thereby enhancing the model’s capacity to resolve complex surface signatures [36]. Secondly, the truth-data matrix was established using a rigorous sampling design that paired regional elevation data with pixel-level, stratified random sampling. A total of 2830 sample points were systematically curated across a five-year temporal window, encompassing six discrete LULC taxonomies: construction land, forest, grassland, farmland, water bodies, and bare land. To insulate the classifier against classification artifacts born of data imbalance, sample sizes were uniformly distributed across all target categories within each studied year. This corpus was subsequently partitioned into a training cohort (80%) and an independent validation subset (20%). For the final model execution, the RF classifier ingested a multi-layered dataset consisting of the primary Landsat multispectral bands, the four derived spectral indices, and a supplemental nighttime light index to predict categorical LULC labels. The classifications from 2000 to 2020 achieved kappa coefficients ranging from 0.82 to 0.87, which met the accuracy requirements for subsequent analysis [37].

2.4.3. Measurement of UFs

Urbanization is a multidimensional process typically evaluated across three dimensions: population agglomeration, economic development, and urban expansion [38,39]. Among these, population agglomeration represents the core characteristic, economic growth serves as the driving force, and construction land expansion provides the physical basis for urbanization [40]. These three dimensions collectively reflect improvements in social living standards, which constitute the ultimate objective of urbanization. Urbanization levels are commonly assessed using single-indicator or composite-indicator methods [41].
In this study, economy, population, and land urbanization were represented by NTL, POD, and CLP, respectively. The UFs, including POD, NTL, CLP, and their composite index, were selected to measure urbanization levels. The composite urbanization index (CUI) was calculated as the standardized mean of the three individual indicators using the following formula [39]:
CUI i   =   ( POD i   +   NTL i   +   CLP i )   /   3
where CUIi was the CUI in the i-th unit and POD i , NTL i , and CLP i were POD, NTL, and CLP of the i-th unit, respectively.

2.4.4. Theil–Sen Median Trend and MK Test

The Theil–Sen median trend analysis and the MK test were applied to examine the interannual variation in PIC in the PRD from 2000 to 2020. These methods have been widely used in fields such as meteorology, hydrology, and environmental studies [42]. The Theil–Sen median trend analysis is a robust non-parametric statistical method that is highly efficient and resistant to measurement errors and outliers [43]. The process involves dividing the time series data into pairwise combinations and calculating the median slope (Sen’s slope) for each pair. A positive Sen’s slope indicates an upward trend, while a negative value indicates a downward trend [44]. This method can be combined with the MK test to analyze long-term trend data [45,46,47]. The MK test is a non-parametric test that offers statistical advantages over other parametric methods. It tests only the central tendency or distribution of the data without assuming a specific distribution, thus making it less sensitive to a few outliers [48]. The MK statistic, denoted as Z, ranges from −∞ to +∞. The time series exhibits an increasing trend if Z > 0. Otherwise, the time series show a decreasing trend. A confidence level of 0.05 was used in this study, meaning that |Z| > 1.96 indicated a significant trend change.

2.4.5. Spatial Heterogeneity Pattern of UFs

Spatial heterogeneity leads to differences in spatial patterns, manifested as varying degrees of spatial autocorrelation (i.e., the tendency for entities close together to exhibit strong correlations). Spatial autocorrelation and spatial heterogeneity are expressed through spatial patterns, laying the foundation for all ecological phenomena in which spatial heterogeneity and dependence coexist and are universal [49]. Exploratory spatial data analysis (ESDA) is an effective means of capturing spatial autocorrelation. ESDA was applied in this study to analyze the spatial heterogeneity of UF, including global and local spatial clustering patterns. First, we used global spatial autocorrelation (Moran’s I) and local spatial autocorrelation (local Moran’s I) to analyze the spatial heterogeneity pattern of UF [50]. Second, the Getis–Ord Gi* method was used to analyze the spatiotemporal changes in UF. This method identifies spatial clusters of statistically significant low (cold) and high (hot) UF values within a specified distance, using z-scores and p-values [51].
Following the previous research [52], statistically significant changes in UFs were classified using a 95% confidence threshold derived from the Getis–Ord Gi* analysis. Specifically, cold and hot spots with confidence levels above 95% were considered to represent significant decreases and increases, respectively. Furthermore, bivariate spatial autocorrelation was introduced to identify the spatial distribution patterns, correlations, and local spatial instability between UF and PIC [53]. Bivariate spatial autocorrelation can effectively describe the spatial dependence between different entities [52].

2.4.6. Optimal Parameters–Based Geographical Detector (OPGD) Model

The OPGD model comprises five modules: the factor detector, parameter optimization, interaction detector, risk detector, and ecological detector. The factor detector, the core module, uses Q-statistics to assess the relative importance of the explanatory variables. This approach compares the variance of observations across the entire study area with the variance within the variable layer. The Q value of a potential variable is calculated by:
Q   =   1     j = 1 M N j σ j 2 N σ 2
σ 2 = 1 N 1 i = 1 N ( Y i Y - ) 2
σ j 2 = 1 N 1 i = 1 N j ( Y j , i Y - j ) 2
where Q value represents the explanatory power of the factors, ranging from 0 to 1. The larger the Q value, the higher the importance of the explanatory variable. N and N j represent the number of observations within the entire study area and the jth (1, …, M) subregion. M represents the number of sub-regions. σ 2 and σ j 2 represent the population variance of observations within the entire study area and the jth (1, …, M) subregion. Y i and Y j , i represent the values of observations within the entire study area and the jth subregion of ith sample. Y - and Y - j represent the mean value of observations within the entire study area and the jth subregion.
The significance of the variance between observations and stratified observations was determined by the F-test, which was calculated as follows:
F   =   N M M 1 Q 1 Q ~ F ( M 1 ,   N M ;   δ )
δ =   [ j = 1 M Y - j 2 1 N ( j = 1 M Y - j N j ) 2 ]   /   σ 2
where M , N , and δ represent the number of subregions, number of observations, and non-central parameter, respectively. The detailed description of each module can be found in Song et al. [54].
Meanwhile, OPGD calculates Q-statistics values for each explanatory variable across various breakpoint numbers using multiple discretization methods (equidistant, natural breakpoint, quantile, geometric interval, and standard deviation). The optimal combination of discretization method and breakpoint number is then determined based on Q-statistic stability. The optimal parameter combination for the OPGD model is presented in Table S6.

2.4.7. Decoupling Analysis

The decoupling theoretical framework characterizes the dynamic relationship between economic growth and environmental pressure across development stages by incorporating the direction of absolute change (i.e., positive and negative growth) and the relative elasticity magnitude of both variables, with 0.8 and 1.2 as critical thresholds [55]. This classification system has been widely applied across diverse domains, including urbanization–ecosystem services, energy–economy, and carbon emissions–development, and has become the standard paradigm for decoupling analysis. Based on the classification criteria and decoupling typologies established in previous studies (Table S7), this study evaluated the decoupling state between PIC and UF [55]. The decoupling theoretical framework was divided into eight logical categories, including recessive and expansive coupling, strong, weak, and recessive decoupling, weak, strong, and expansive negative decoupling [32]. The decoupling index (DCI) was then calculated by dividing the change rate of PIC (%∆PIC) by the change rate of UF (%∆UF):
DCI a 2 a 1   =   % PIC % U F   =   ( PIC a 2 PIC a 1 )   /   PIC a 1 ( U F a 2 U F a 1 )   /   U F a 1
where DCI a 2 a 1 is the decoupling index from year a 1 to year a 2 ; PIC a 2 and PIC a 1 represent the values of PIC in years a 2 and a 1 , respectively; UF a 2 and UF a 1 represent the values of UF in years a 2 and a 1 , respectively.

3. Results

3.1. Spatiotemporal Variation in PIC

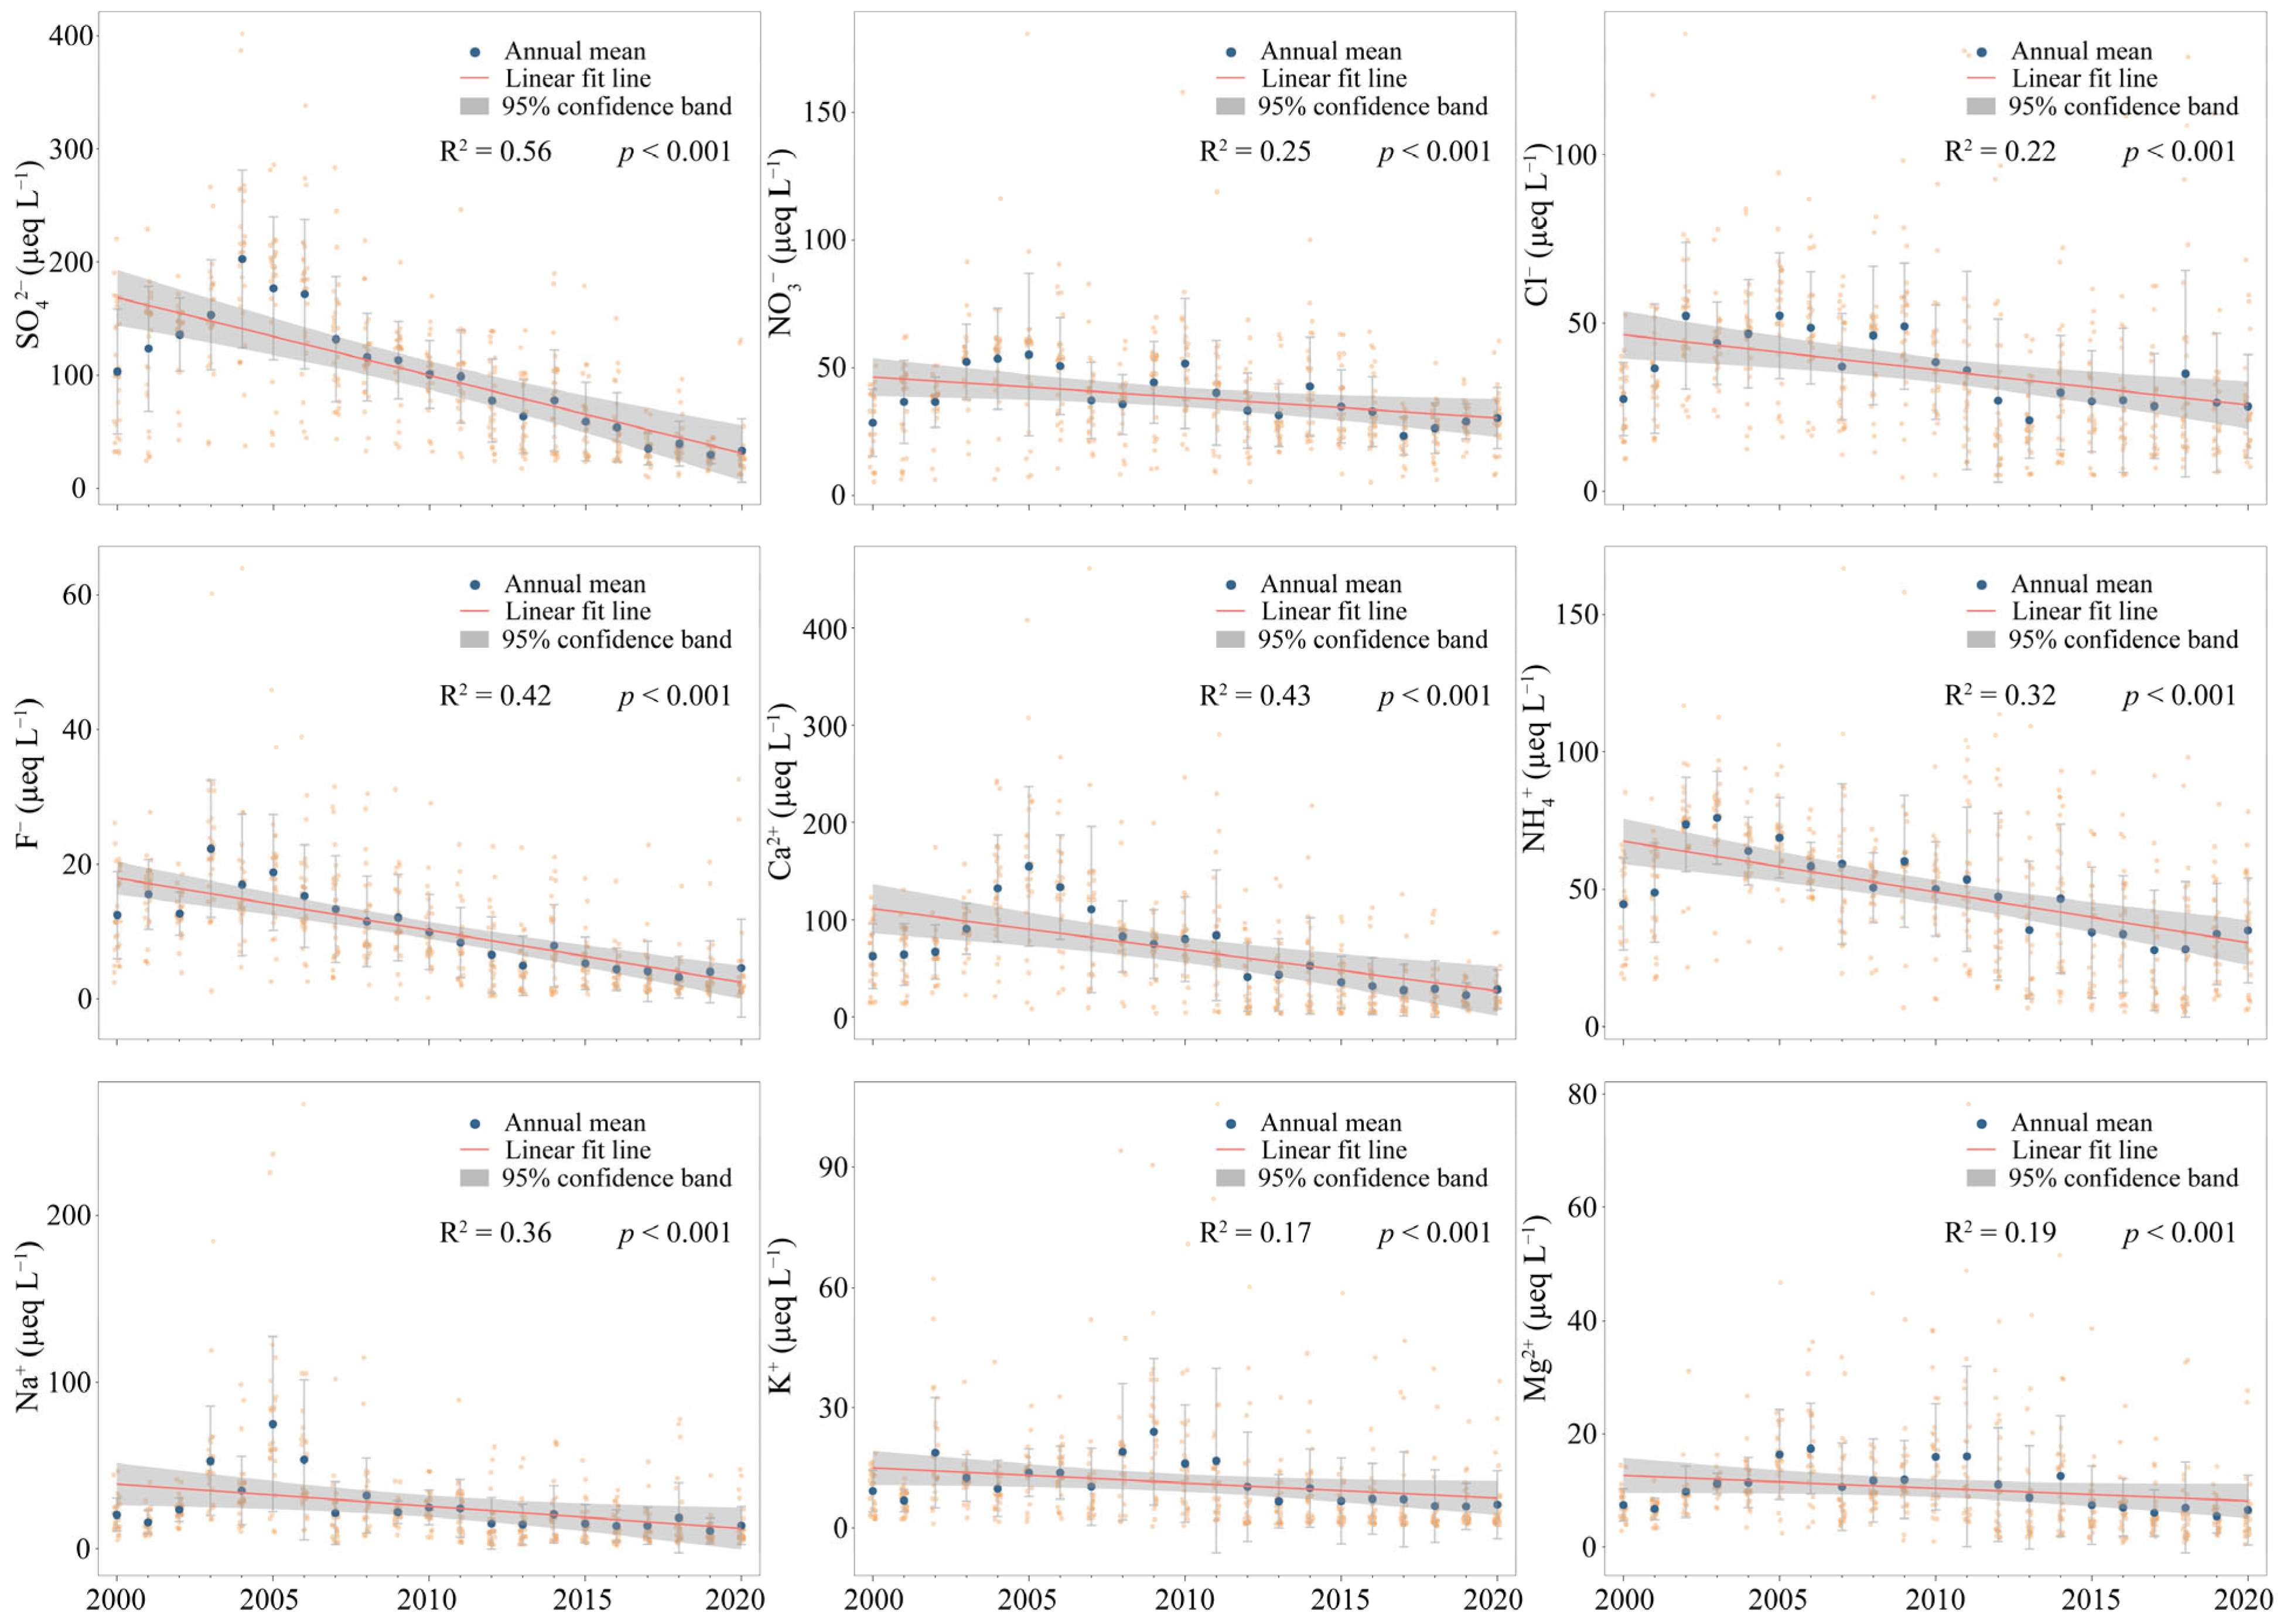
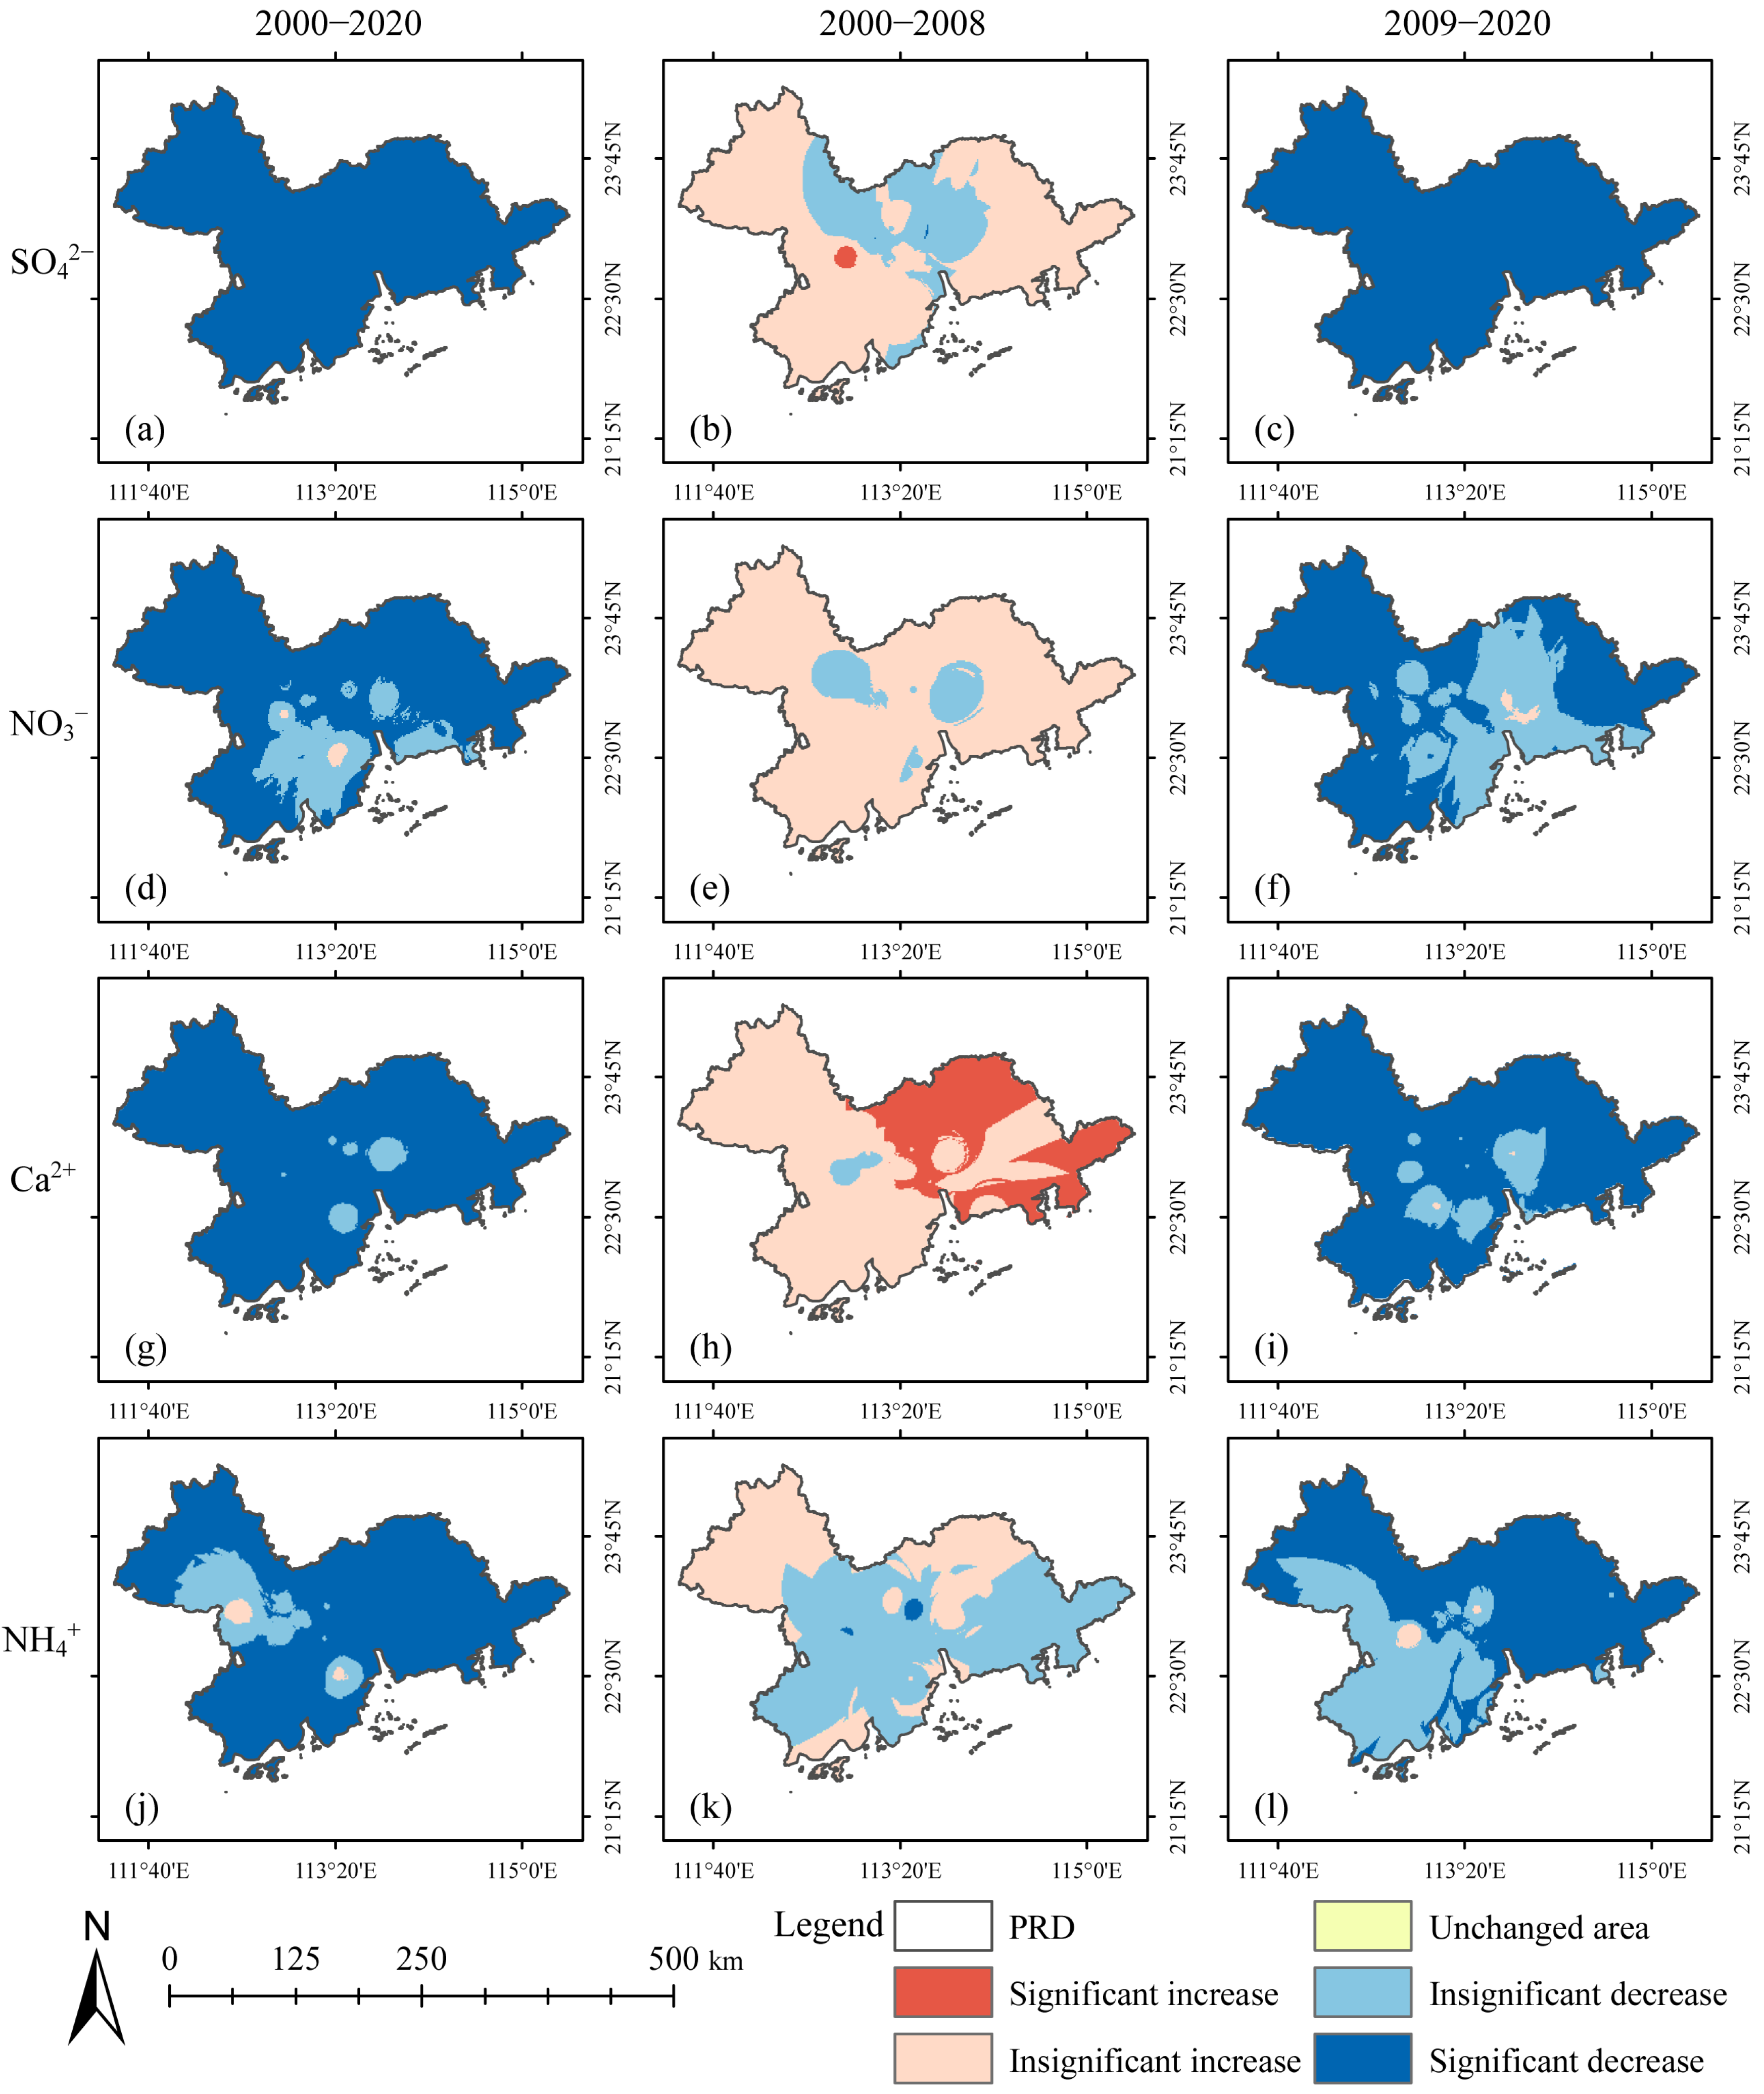
The concentration ratio of SO42− to NO3 (S/N) was used to characterize the balance of acidic substances in precipitation. From 2000 to 2020, the S/N values in the PRD ranged from 1.02 to 3.78, showing a gradual downward trend. After 2008, the S/N values remained below 3.0, indicating a shift from sulfate-dominant acid rain to a mixed-type composition (Figure S2). The PICs from 2000 to 2020 followed the descending order: SO42− > Ca2+ > NH4+ > NO3 > Cl > Na+ > K+ > Mg2+ > F. SO42− and NO3 were the dominant anions, while Ca2+ and NH4+ were the primary cations (Table S5). Interannual ion concentrations exhibited a non-monotonic trajectory, initially increasing before a pronounced decline, culminating in a significant overall decrease (p < 0.001, Figure 3 and Figure S3). According to the MK trend test, the concentrations of all ions except Mg2+ showed a significant downward trend from 2009 to 2020 and 2000 to 2020 (Z-statistic < −1.96, p < 0.001). In contrast, the concentrations of ions other than F increased from 2000 to 2008, with only Mg2+ showing a significant increase (Z-statistic > 1.96, p < 0.05; Tables S8 and S9).
Overall, the TIC, TAC, and TCC in the PRD exhibited statistically significant declining trends during 2000–2020 and 2009–2020. There was a significant decrease in PICs in 97.40–99.57% and 86.82–92.68% of the regions during these two periods (p < 0.05), with exceptions limited to the central and southeastern coastal areas. In contrast, these parameters showed marked increases during 2000–2008, particularly in urban clusters such as Guangzhou, Foshan, and Zhongshan (p < 0.05; Figure S4). Consequently, the spatial-temporal evolution of PIC in the PRD shifted from localized increases (2000–2008) to region-wide declines (2009–2020), with peripheral regions experiencing stronger declines than the central urban core.
Specifically, SO42−, among the four major ions, decreased significantly across the study area during 2000–2020 and 2009–2020 (p < 0.05, Figure 4a,c). The proportions of regions exhibiting significant decreases in NO3, Ca2+, and NH4+ were in the ranges of 68.08–82.68%, 90.42–96.87%, and 65.23–86.33%, respectively. These decreases were primarily observed in the northeastern, southwestern, and northwestern areas. However, local increases were observed in Guangzhou, Foshan, Zhongshan, and Dongguan (Figure 4d,f,g,i,j,l).
From 2000 to 2008, SO42− significantly increased in Foshan (p < 0.05, Figure 4b), whereas Ca2+ increased significantly in 29.06% of the region, primarily in the eastern areas of Shenzhen, Guangzhou, Dongguan, and Huizhou (p < 0.05, Figure 4h). NO3 and NH4+ did not exhibit significant increases (Figure 4e,k). Instead, NH4+ decreased significantly in Guangzhou and Foshan (p < 0.05). Additionally, the other five ions also showed an increasing trend from 2000 to 2008, with a significant increase in Mg2+ accounting for 51.85% of the area, mainly distributed in the western region, while Cl was mainly distributed in the eastern region (p < 0.05; Figure S5). F significantly increased only in Foshan, coinciding with areas of SO42− increase. After 2008, all five ions showed a significant downward trend, especially in the surrounding areas.

3.2. Spatiotemporal Heterogeneity of UFs

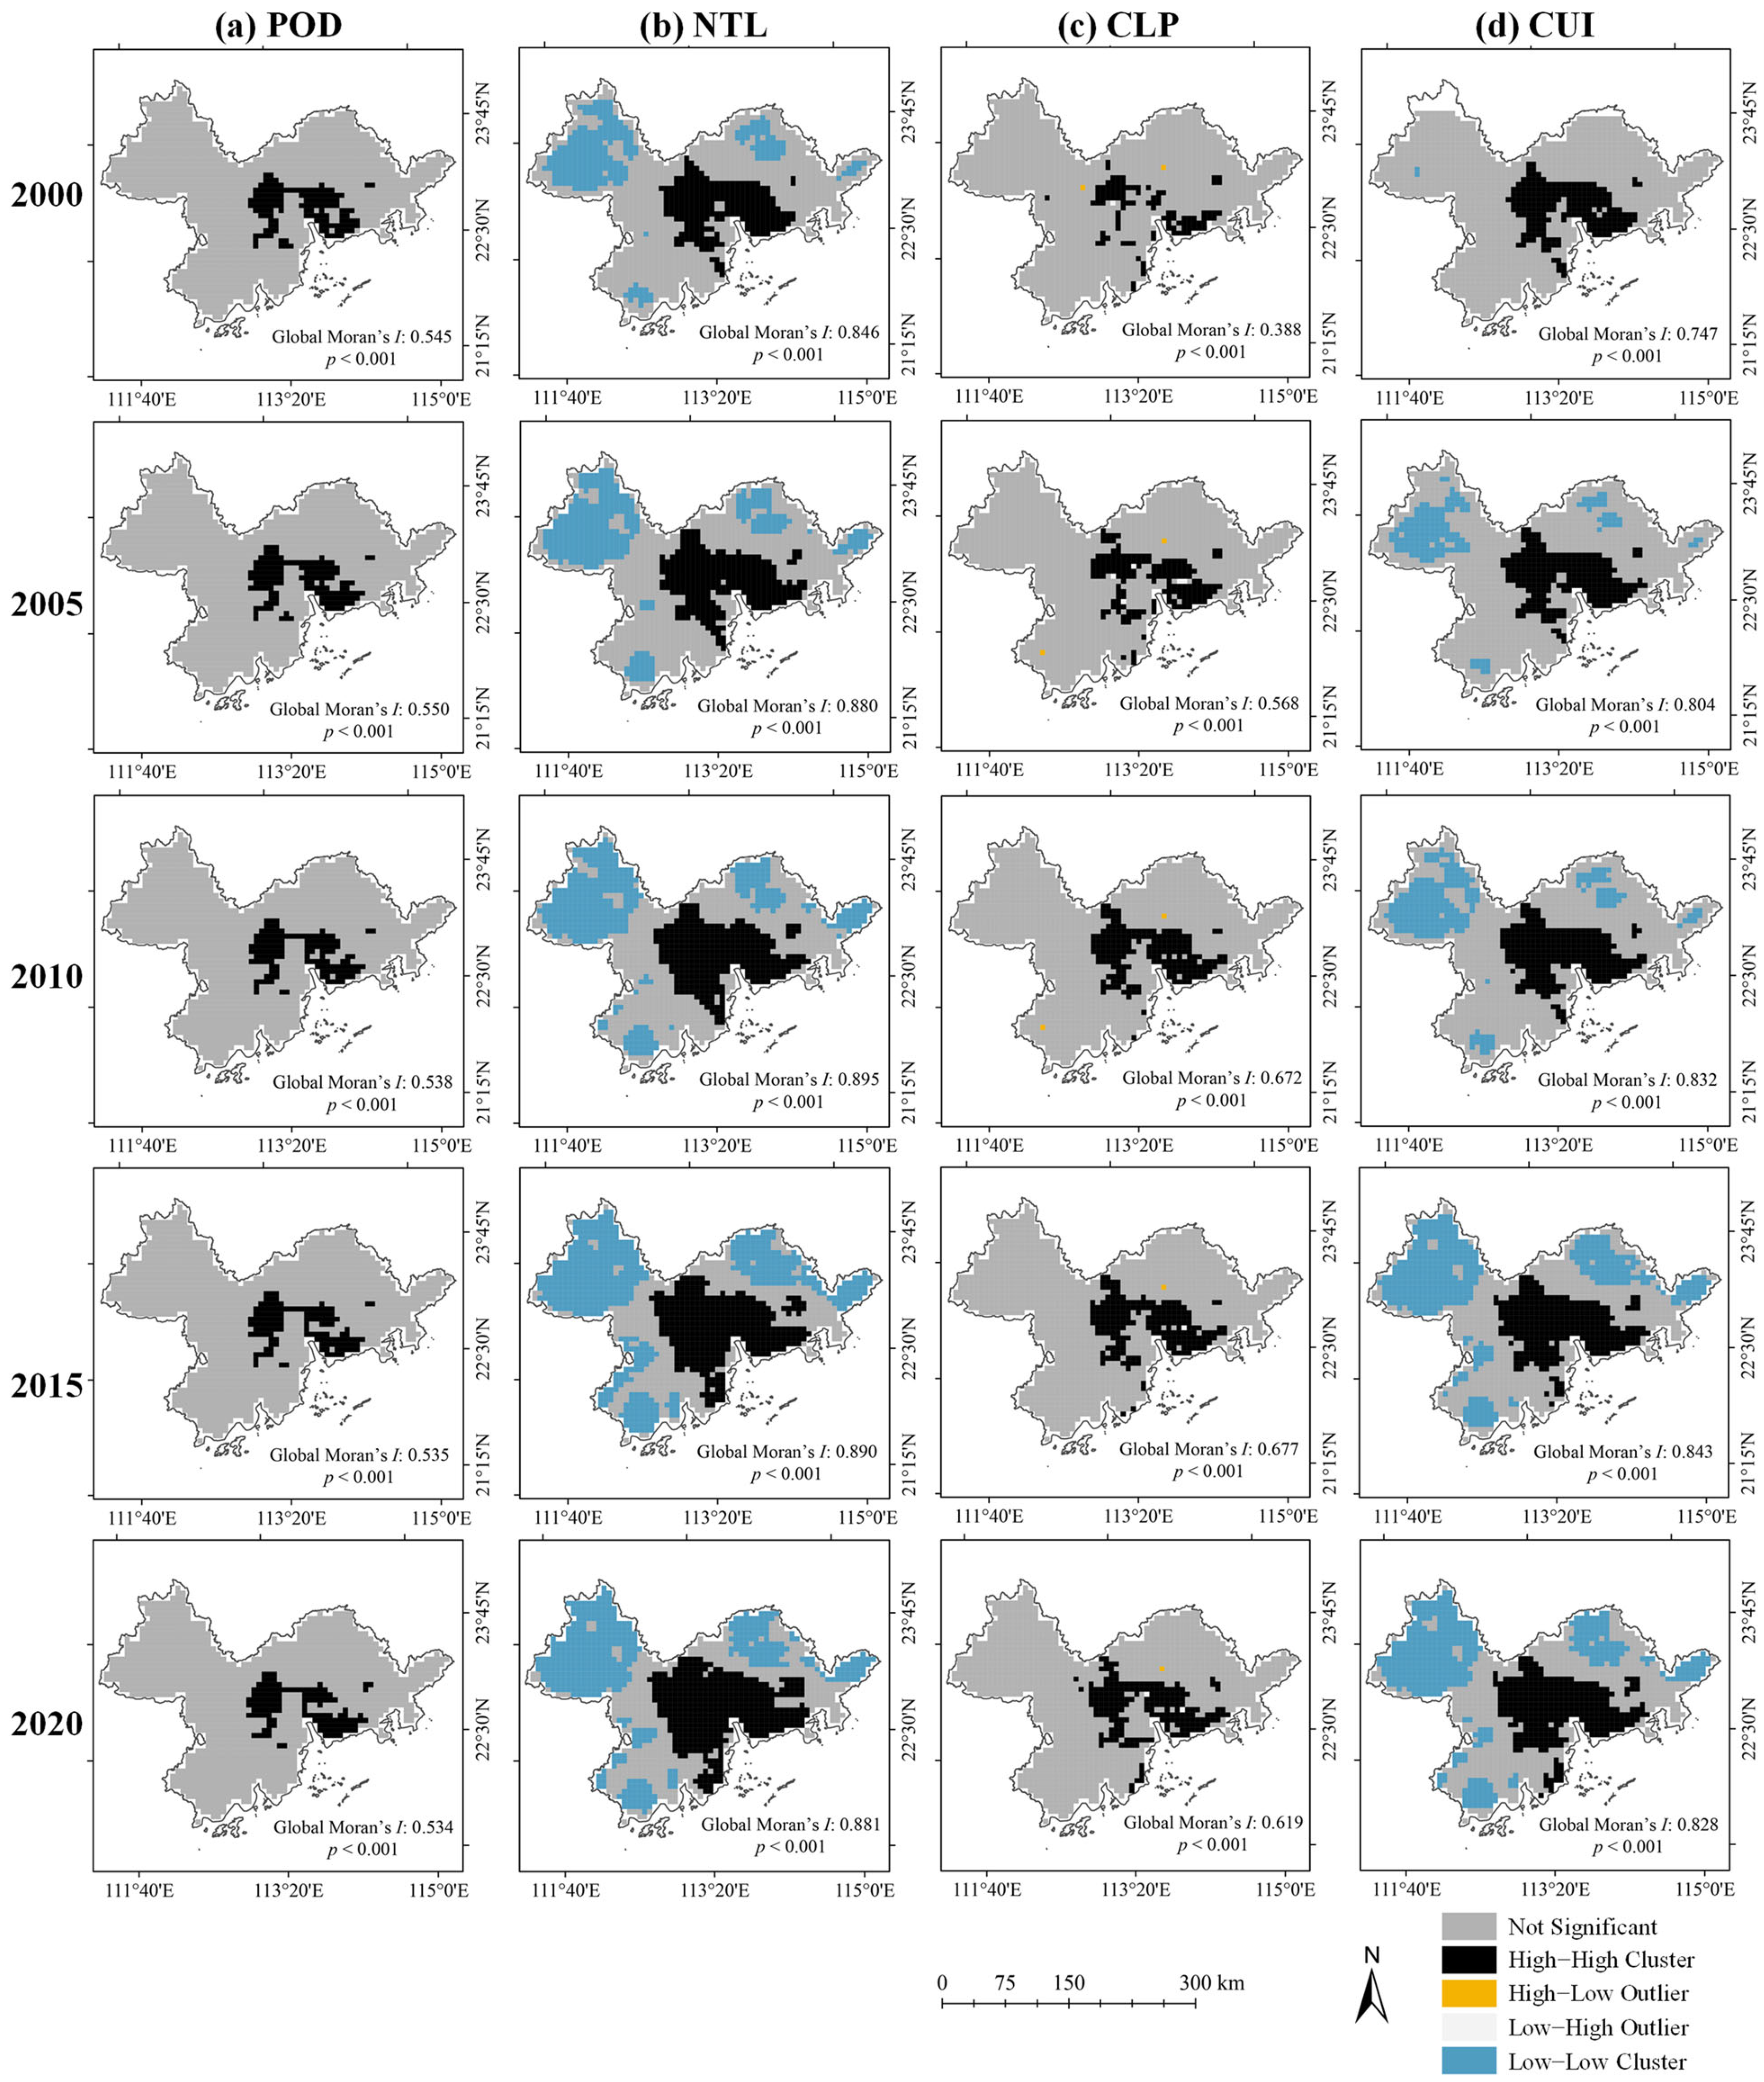
Spatial autocorrelation and hotspot analysis were employed to systematically characterize spatial heterogeneity in urbanization patterns. From 2000 to 2020, the global Moran’s I values for POD, NTL, CLP, and CUI were in the ranges of 0.534–0.550, 0.846–0.895, 0.388–0.677, and 0.747–0.843 (p < 0.001), respectively, indicating strong spatial clustering for all urbanization indicators (Figure 5). These values confirmed significant spatial autocorrelation and heterogeneous urbanization dynamics across the PRD. Over time, the global Moran’s I initially increased and then decreased between 2000 and 2020, exhibiting an overall upward trend, suggesting that the spatial autocorrelation of urbanization indicators strengthened over time. Spatially, high–high clusters were predominantly concentrated in the central and southeastern coastal zones. Among the three urbanization indicators, NTL demonstrated the strongest spatial coherence with CUI (Figure 5b,d). NTL also exhibited the largest high–high cluster area, with the proportion increasing from 18.83% in 2000 to 30.04% in 2020, marking a 59.52% increase, significantly higher than POD and CLP (Figure 5a,c). Notably, although the high–high cluster area of CLP was lower than half that of NTL, its expansion from 2000 to 2020 represented 90.48% of original area (Figure 5b,c).
Over the past two decades, the areas with the highest values for the four UFs have gradually expanded, reflecting an increase in regional urbanization intensity and an increased concentration in the central and southeastern coastal regions (Figures S6(a–e)–S9(a–e)). The Getis–Ord Gi* index was employed to further examine the spatial heterogeneity of UF variations. The changes in UFs showed significant spatial clustering, with hot spots predominantly in the central and southeastern coastal zones. Meanwhile, cold spots were concentrated in the peripheral northeastern, northwestern, and southwestern areas. Significant increases in NTL and CUI from 2000 to 2020 were primarily observed in Guangzhou, Foshan, Dongguan, Shenzhen, Zhongshan, and Zhuhai (Figures S6f and S7f), which also exhibited increased POD and CLP values (Figures S8f and S9f). Overall, the variation patterns of the different UFs in the PRD followed a consistent trend: regions with significant increases in UFs were mostly located in coastal and central areas with high human activity, whereas regions with significant decreases were mainly found in high–altitude woodland areas.

3.3. Spatial Autocorrelation Between PIC and UF

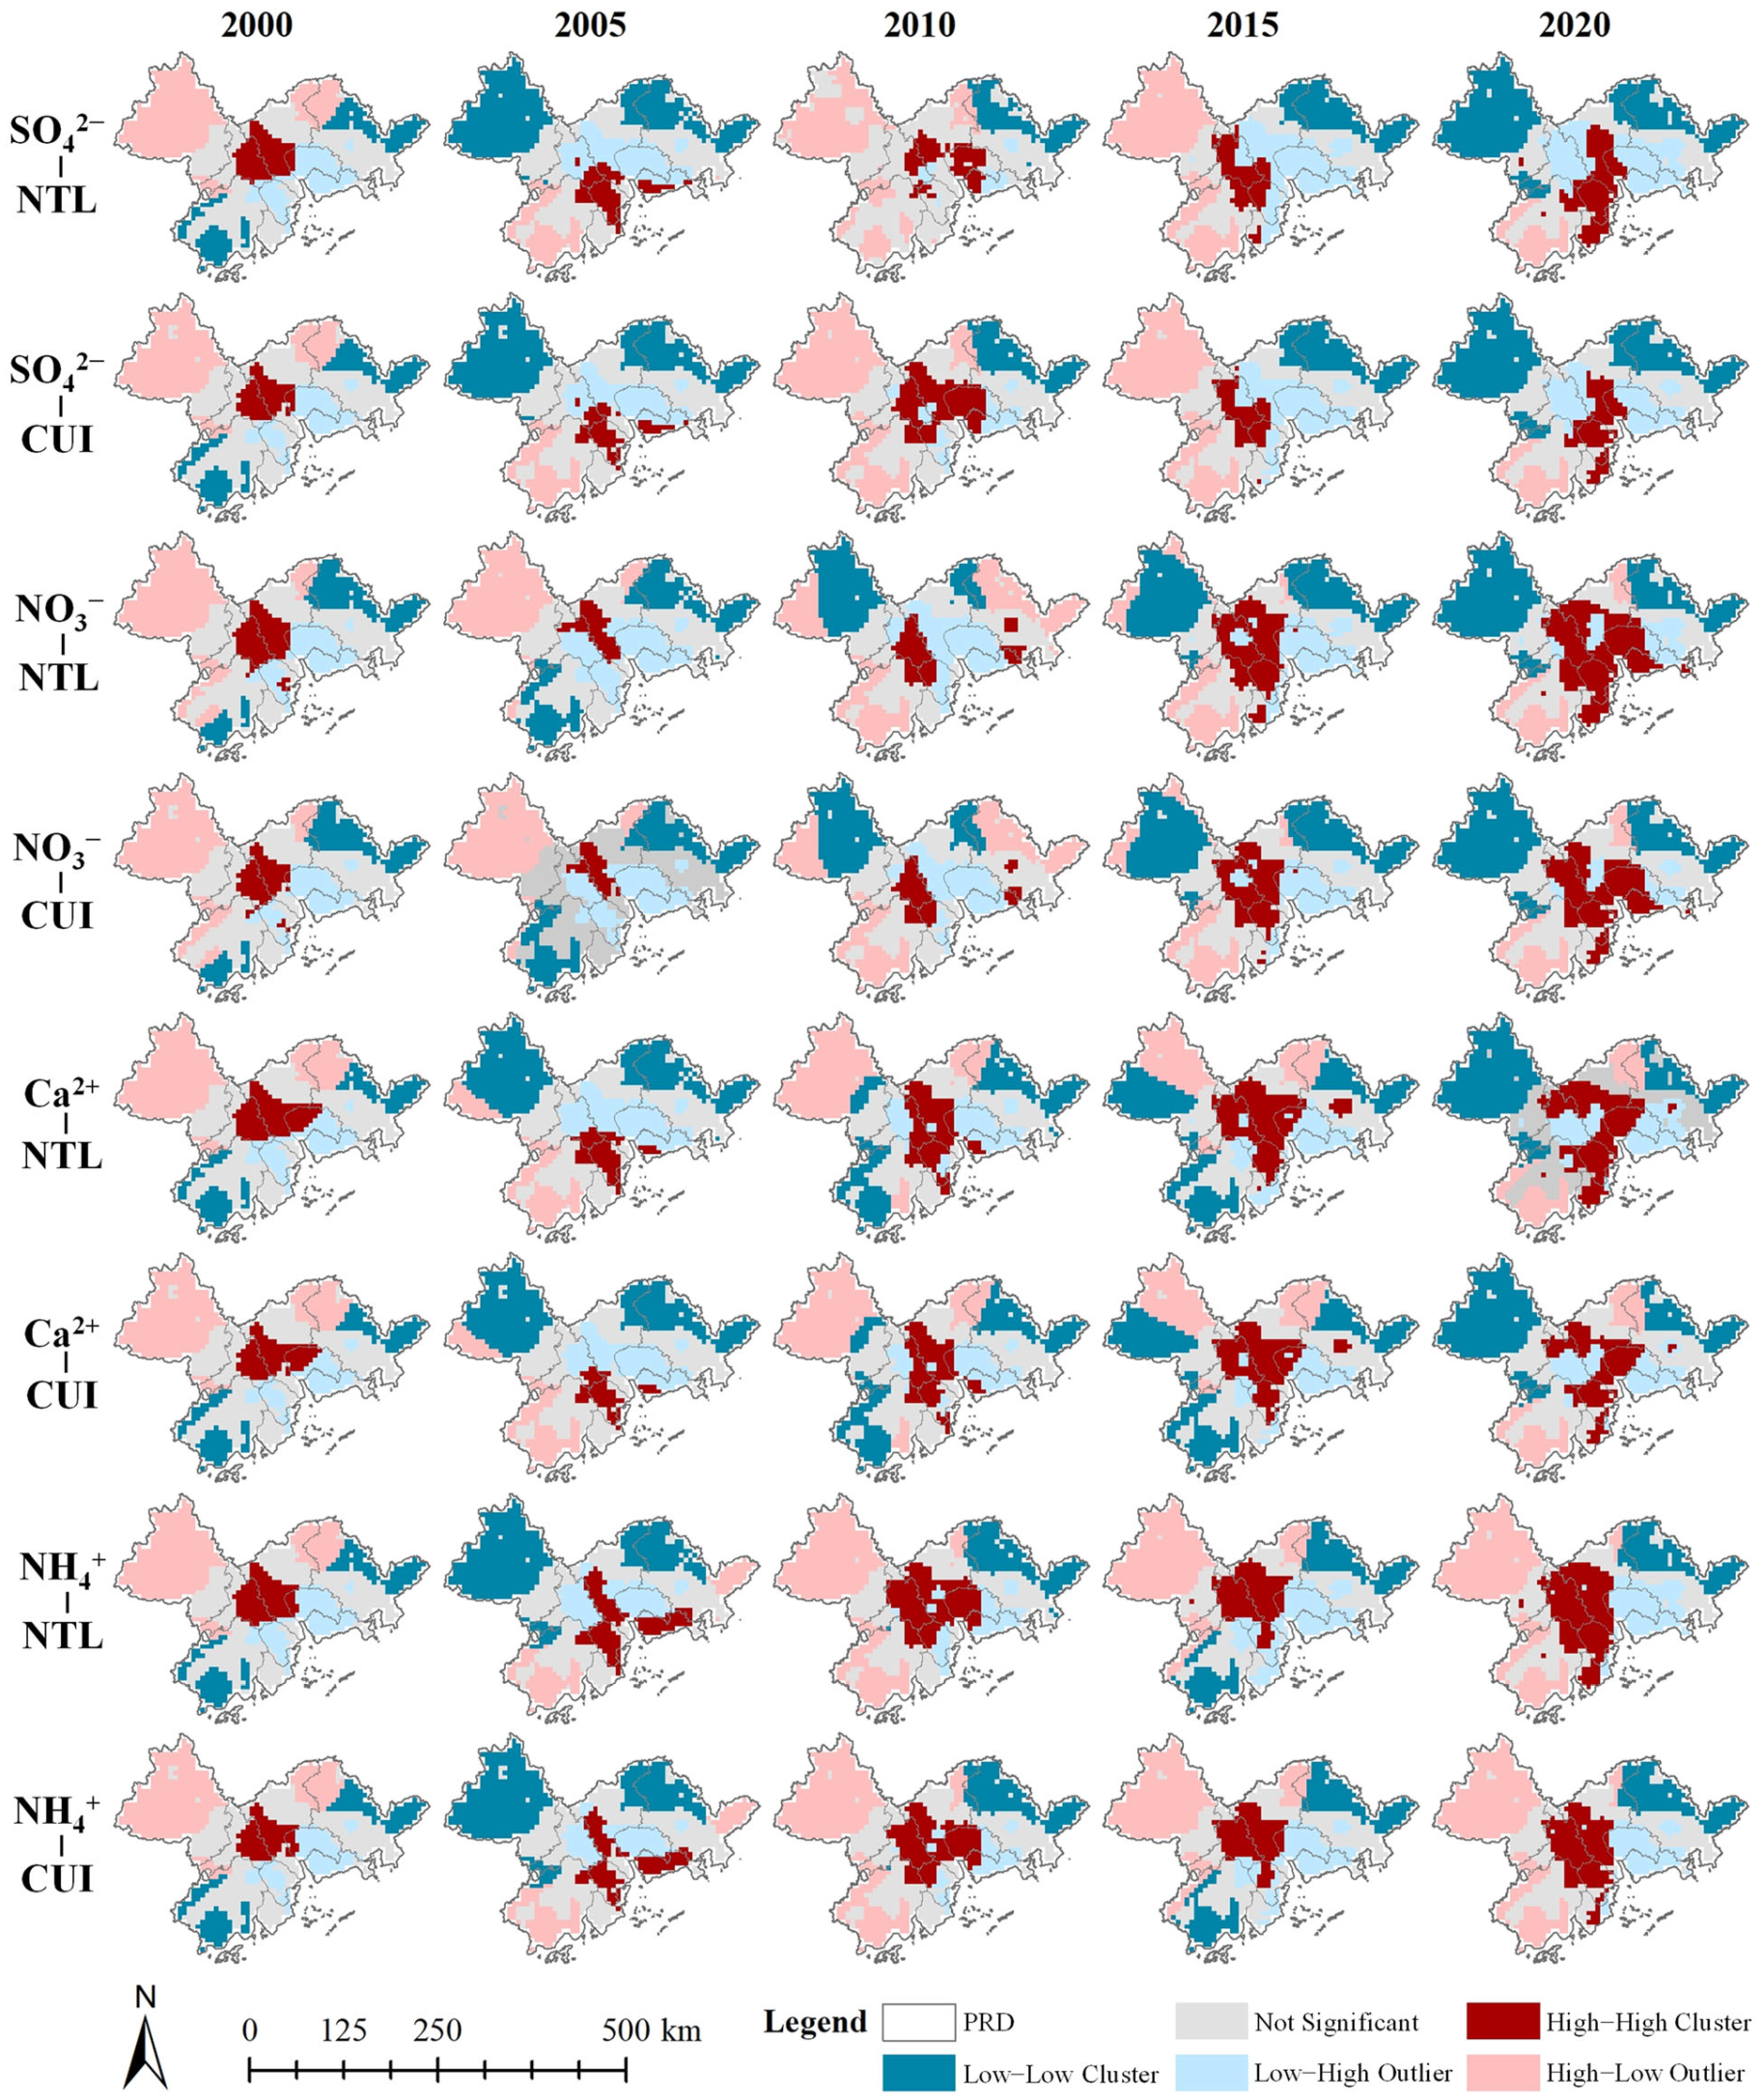
Building on the homology and concentration contributions of precipitation ions identified in our previous research, we selected four dominant ions (SO42−, NO3, Ca2+, and NH4+) to explore the spatial relationship between PICs and UFs. Moran’s I statistic revealed statistically significant spatial correlations (p < 0.05) between 2000 and 2020, with absolute values increasing over time. This result suggested a strengthening spatial relationship between PIC and UFs, particularly for NO3 (Table S10). The global bivariate Moran’s I for SO42−, NO3, and Ca2+ with UFs shifted from negative to positive between 2000 and 2020, indicating a transition from a significant negative spatial correlation to a positive one (p < 0.05). In contrast, NH4+ exhibited a more complex temporal pattern, characterized by negative-positive-negative transitions, with significant positive correlations in 2005 and 2010 and negative correlations in other years (p < 0.05). The spatial correlation strength between the major ions and the four UFs, in descending order, was NTL > CUI > CLP > POD.
The bivariate local spatial autocorrelation (Local Indicators of Spatial Association, LISA) maps indicated that each PIC had significant spatial clustering similarities with UFs (p < 0.05; Figure 6 and Figure S10), being divided into five categories: high–high clusters (high PIC and high UF), low–low clusters (low PIC and low UF), high–low outliers (high PIC and low UF), low–high outliers (low PIC and high UF), and random distributions. From 2000 to 2020, the spatial clustering patterns between PIC and UFs exhibited significant interannual variation. The high–low and low–low clusters became the predominant spatial patterns, covering 20.48–34.45% and 22.80–36.62% of the study area, respectively. The clustering patterns for SO42−, NO3, and Ca2+ with UFs transitioned from high–low to low–low, particularly in the northwestern Zhaoqing and Guangzhou–Huizhou border regions. The clustering patterns of NH4+ and UF were predominantly high–low, primarily located in Jiangmen and Zhaoqing in the western PRD, with temporary increases in the low–low pattern observed in 2005. The high–high clustering areas from 2000 to 2020 were relatively concentrated, extending from the central junction of Foshan, Guangzhou, Dongguan, and Zhongshan to the southeastern coastal regions, including Zhuhai and Shenzhen, with an average area increase of 77.11%. The proportion of high–high PIC and UF areas, in descending order, was NTL > CUI > CLP > POD. The high–high areas associated with NTL were larger than those of CLP and POD by factors of 1.774–1.923 and 2.413–2.638, respectively. Notably, in 2020, the high–high types of NO3 and NTL covered 25.11% of the study area, marking a 160.47% increase from 2000.

3.4. The Impact of UF on PIC

3.4.1. Identification of the Dominant UF Influencing PIC

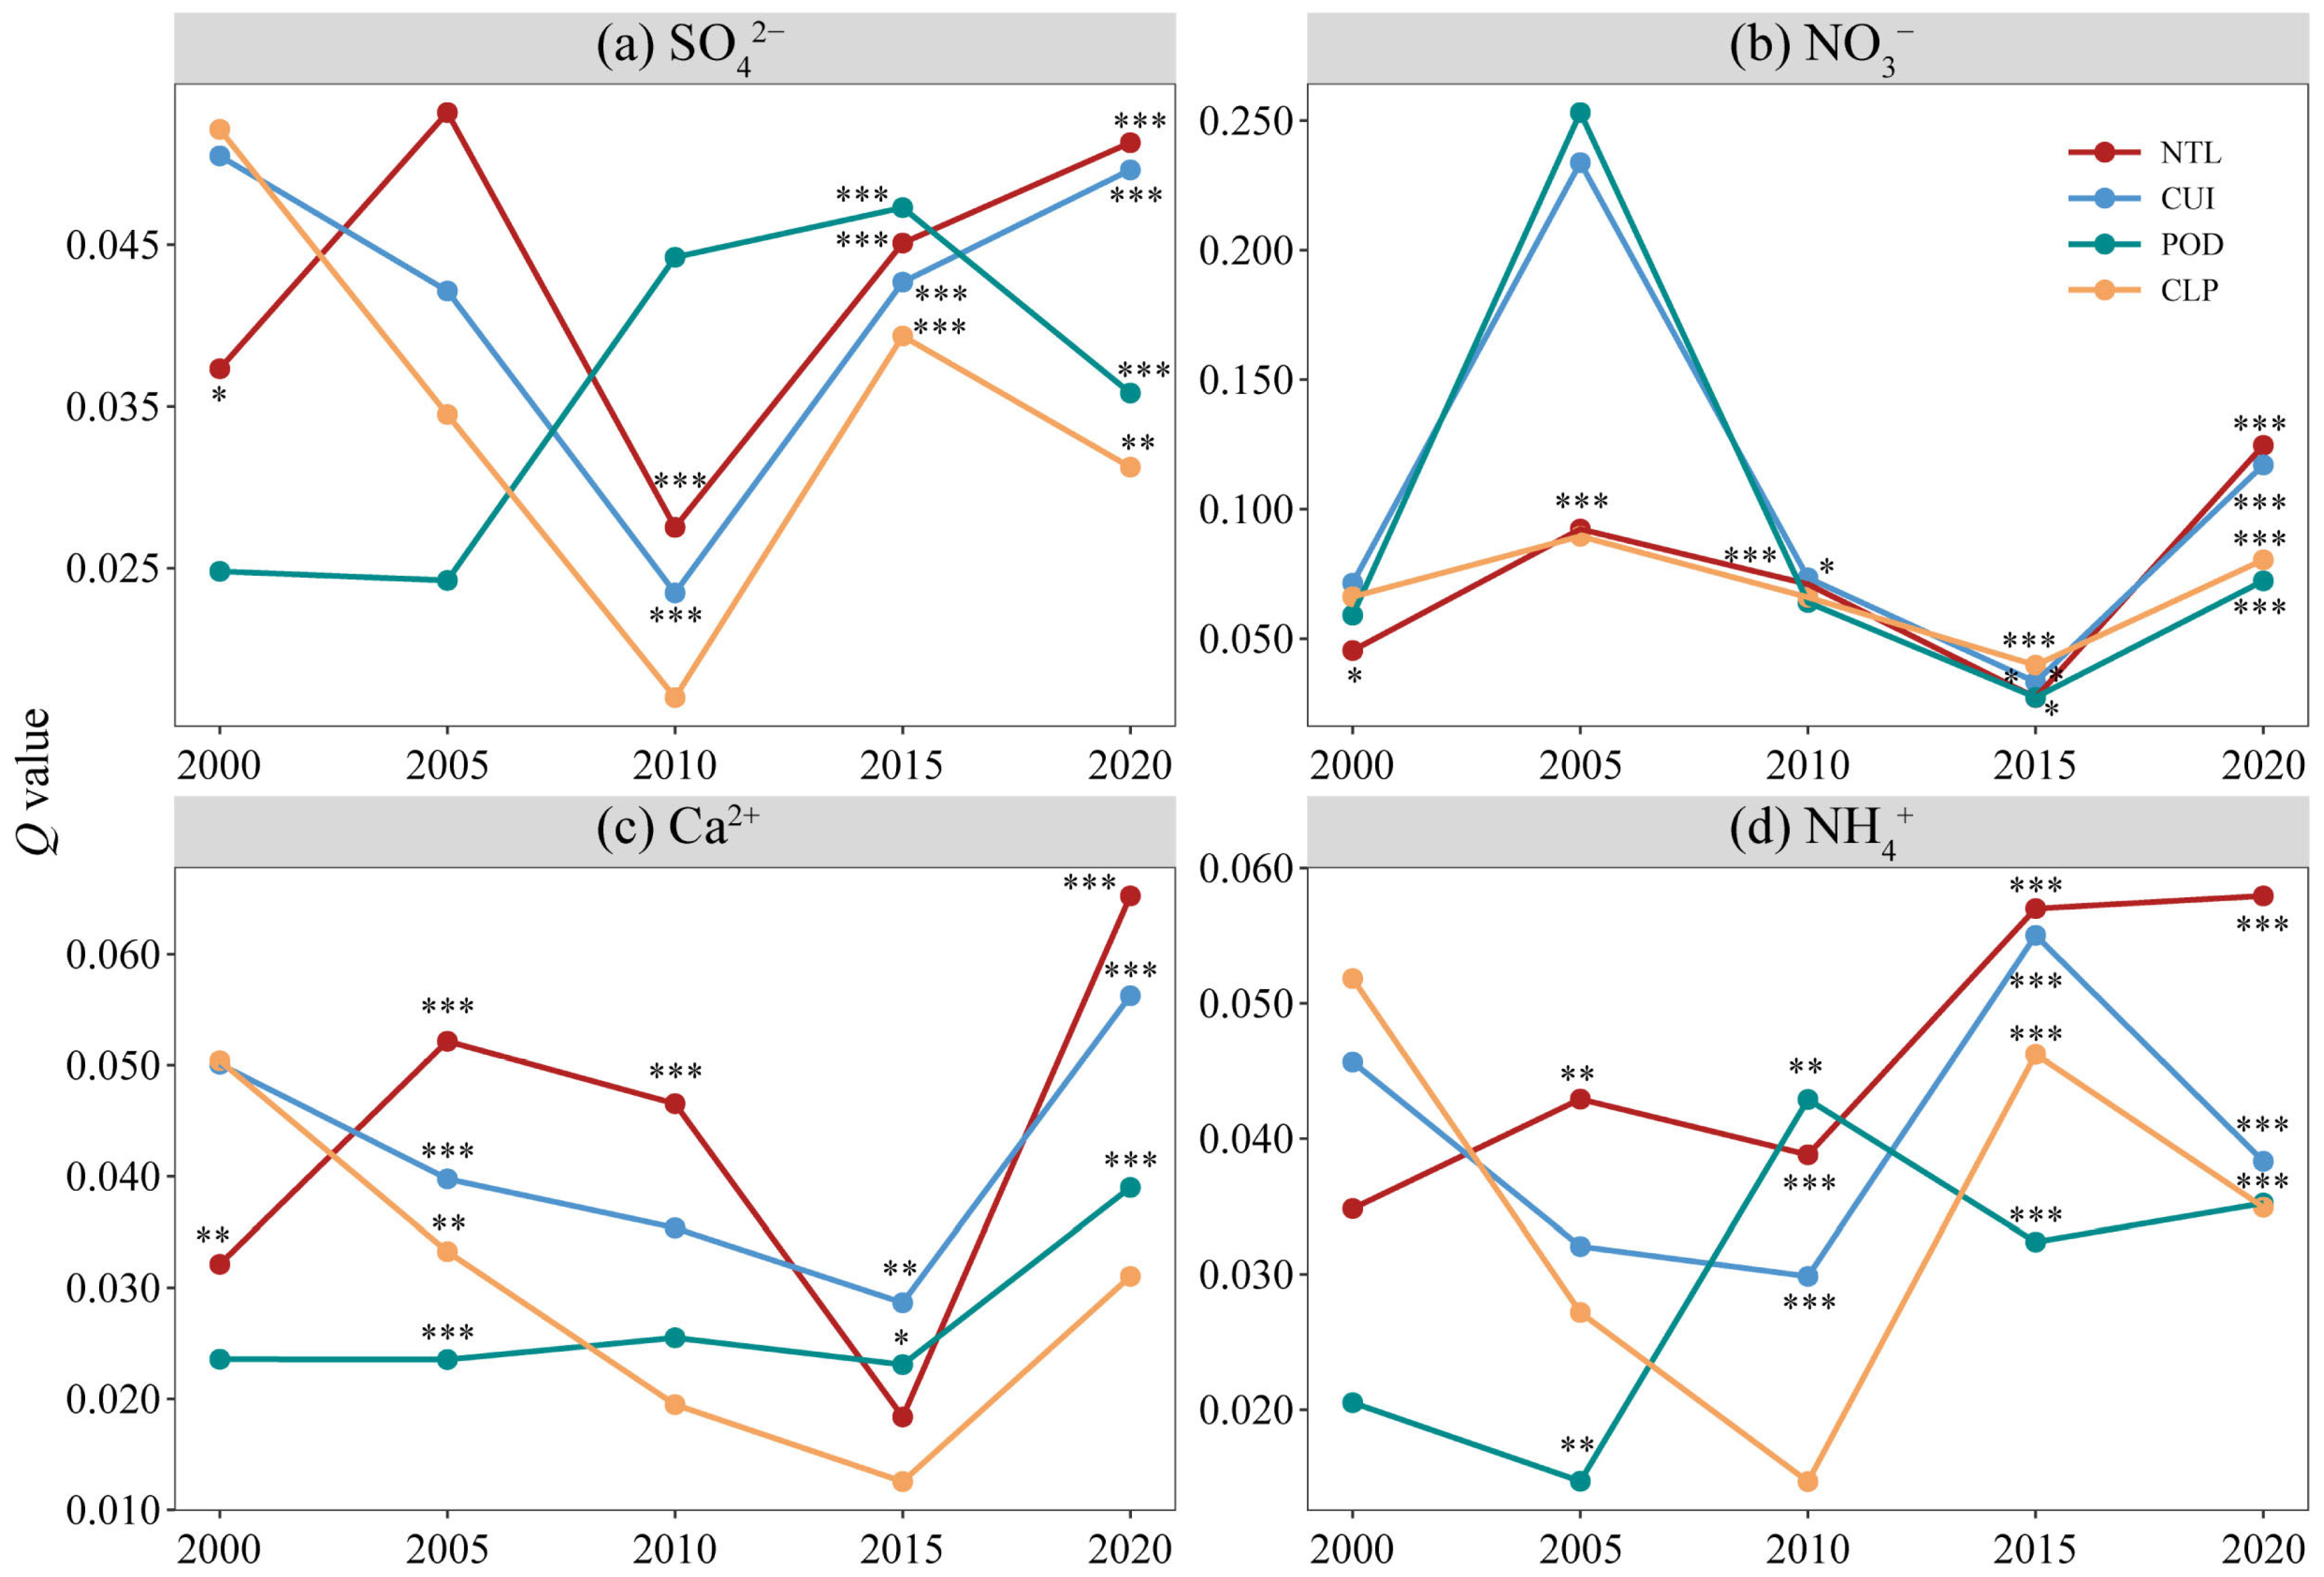
The explanatory power (i.e., Q value) of the four dimensions of urbanization for SO42−, NO3, Ca2+, and NH4+ was evaluated using the OPGD model to identify the most influential UF affecting changes in PIC (Figure 7). The Q values for each PIC and the four UFs varied from 2000 to 2020, with their significance gradually increasing.
For SO42−, NTL exhibited the highest explanatory power in 2005. Although CLP had the highest Q values in 2000 and POD in 2010 and 2015, their average Q values were lower than those of NTL, indicating that NTL had stronger explanatory power for SO42− (Figure 7a). For NO3, the Q peaks of the four UFs occurred twice, in 2005 and 2020. The highest Q values in these years were observed for POD and NTL, although each occurred in only one year. Considering the 5-year mean Q value, CUI, POD, NTL, and CLP were ranked in descending order, suggesting that CUI had stronger explanatory power for NO3 (Figure 7b). For Ca2+ and NH4+, NTL had the highest Q values over three years, reaching peaks in 2020 (0.065 and 0.058, p < 0.001). The 5-year mean Q value of NTL was significantly higher than that of the other three UFs, being 1.588–1.592 and 1.324–1.461 times higher than POD and CLP, respectively. Therefore, NTL exhibited stronger explanatory power for Ca2+ and NH4+ (Figure 7c,d). Furthermore, the correlation coefficients showed that from 2000 to 2020, NTL and CUI shifted from negative to mostly positive correlations with the four main PICs, indicating an increase in PIC, particularly NO3, with advancing urbanization (Table S11).

3.4.2. Trade-Offs and Synergies Between PIC and UF

Based on the findings in Section 3.4.1, NTL was identified as the primary contributor to spatial differences in SO42−, Ca2+, and NH4+ concentrations in the PRD, while CUI was the main factor explaining the spatial variation pattern of NO3. Consequently, this section explored the trade-offs and decoupling relationships between SO42−–NTL, NO3–CUI, Ca2+–NTL, and NH4+–NTL pairs. We selected four time periods to analyze the temporal dynamics and spatial differences among these variable pairs: 2000–2005, 2005–2010, 2010–2015, and 2015–2020.
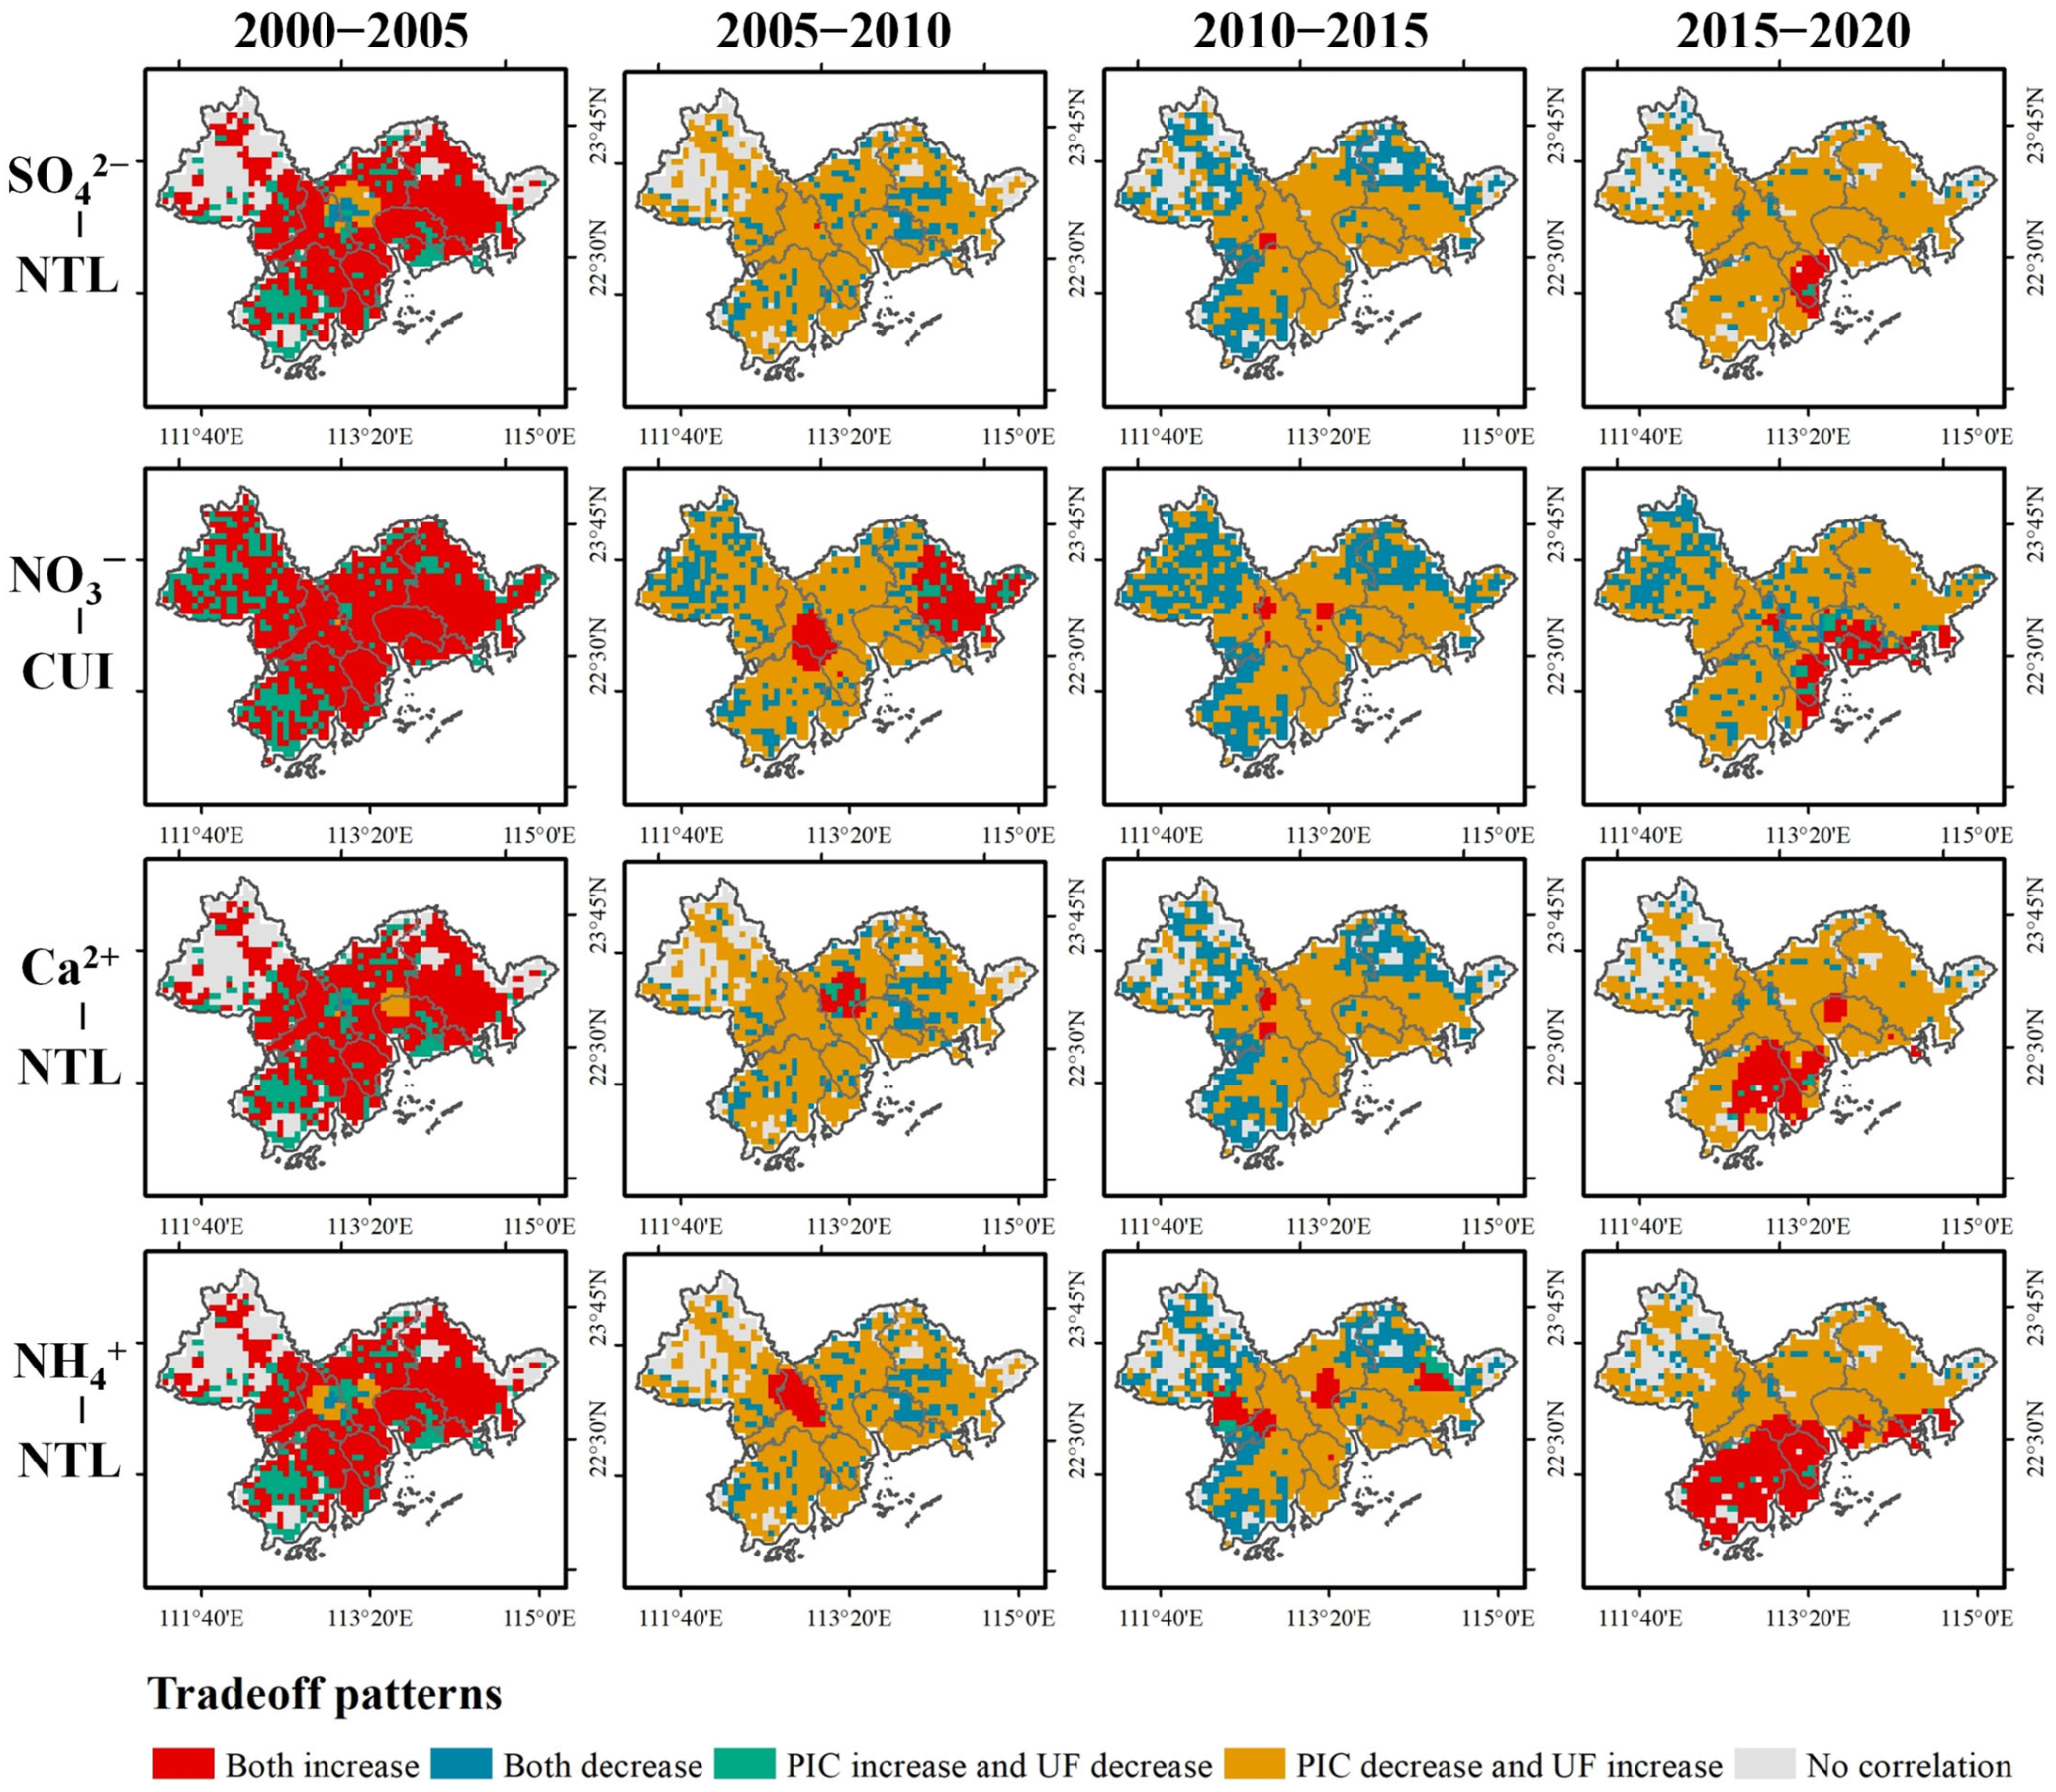
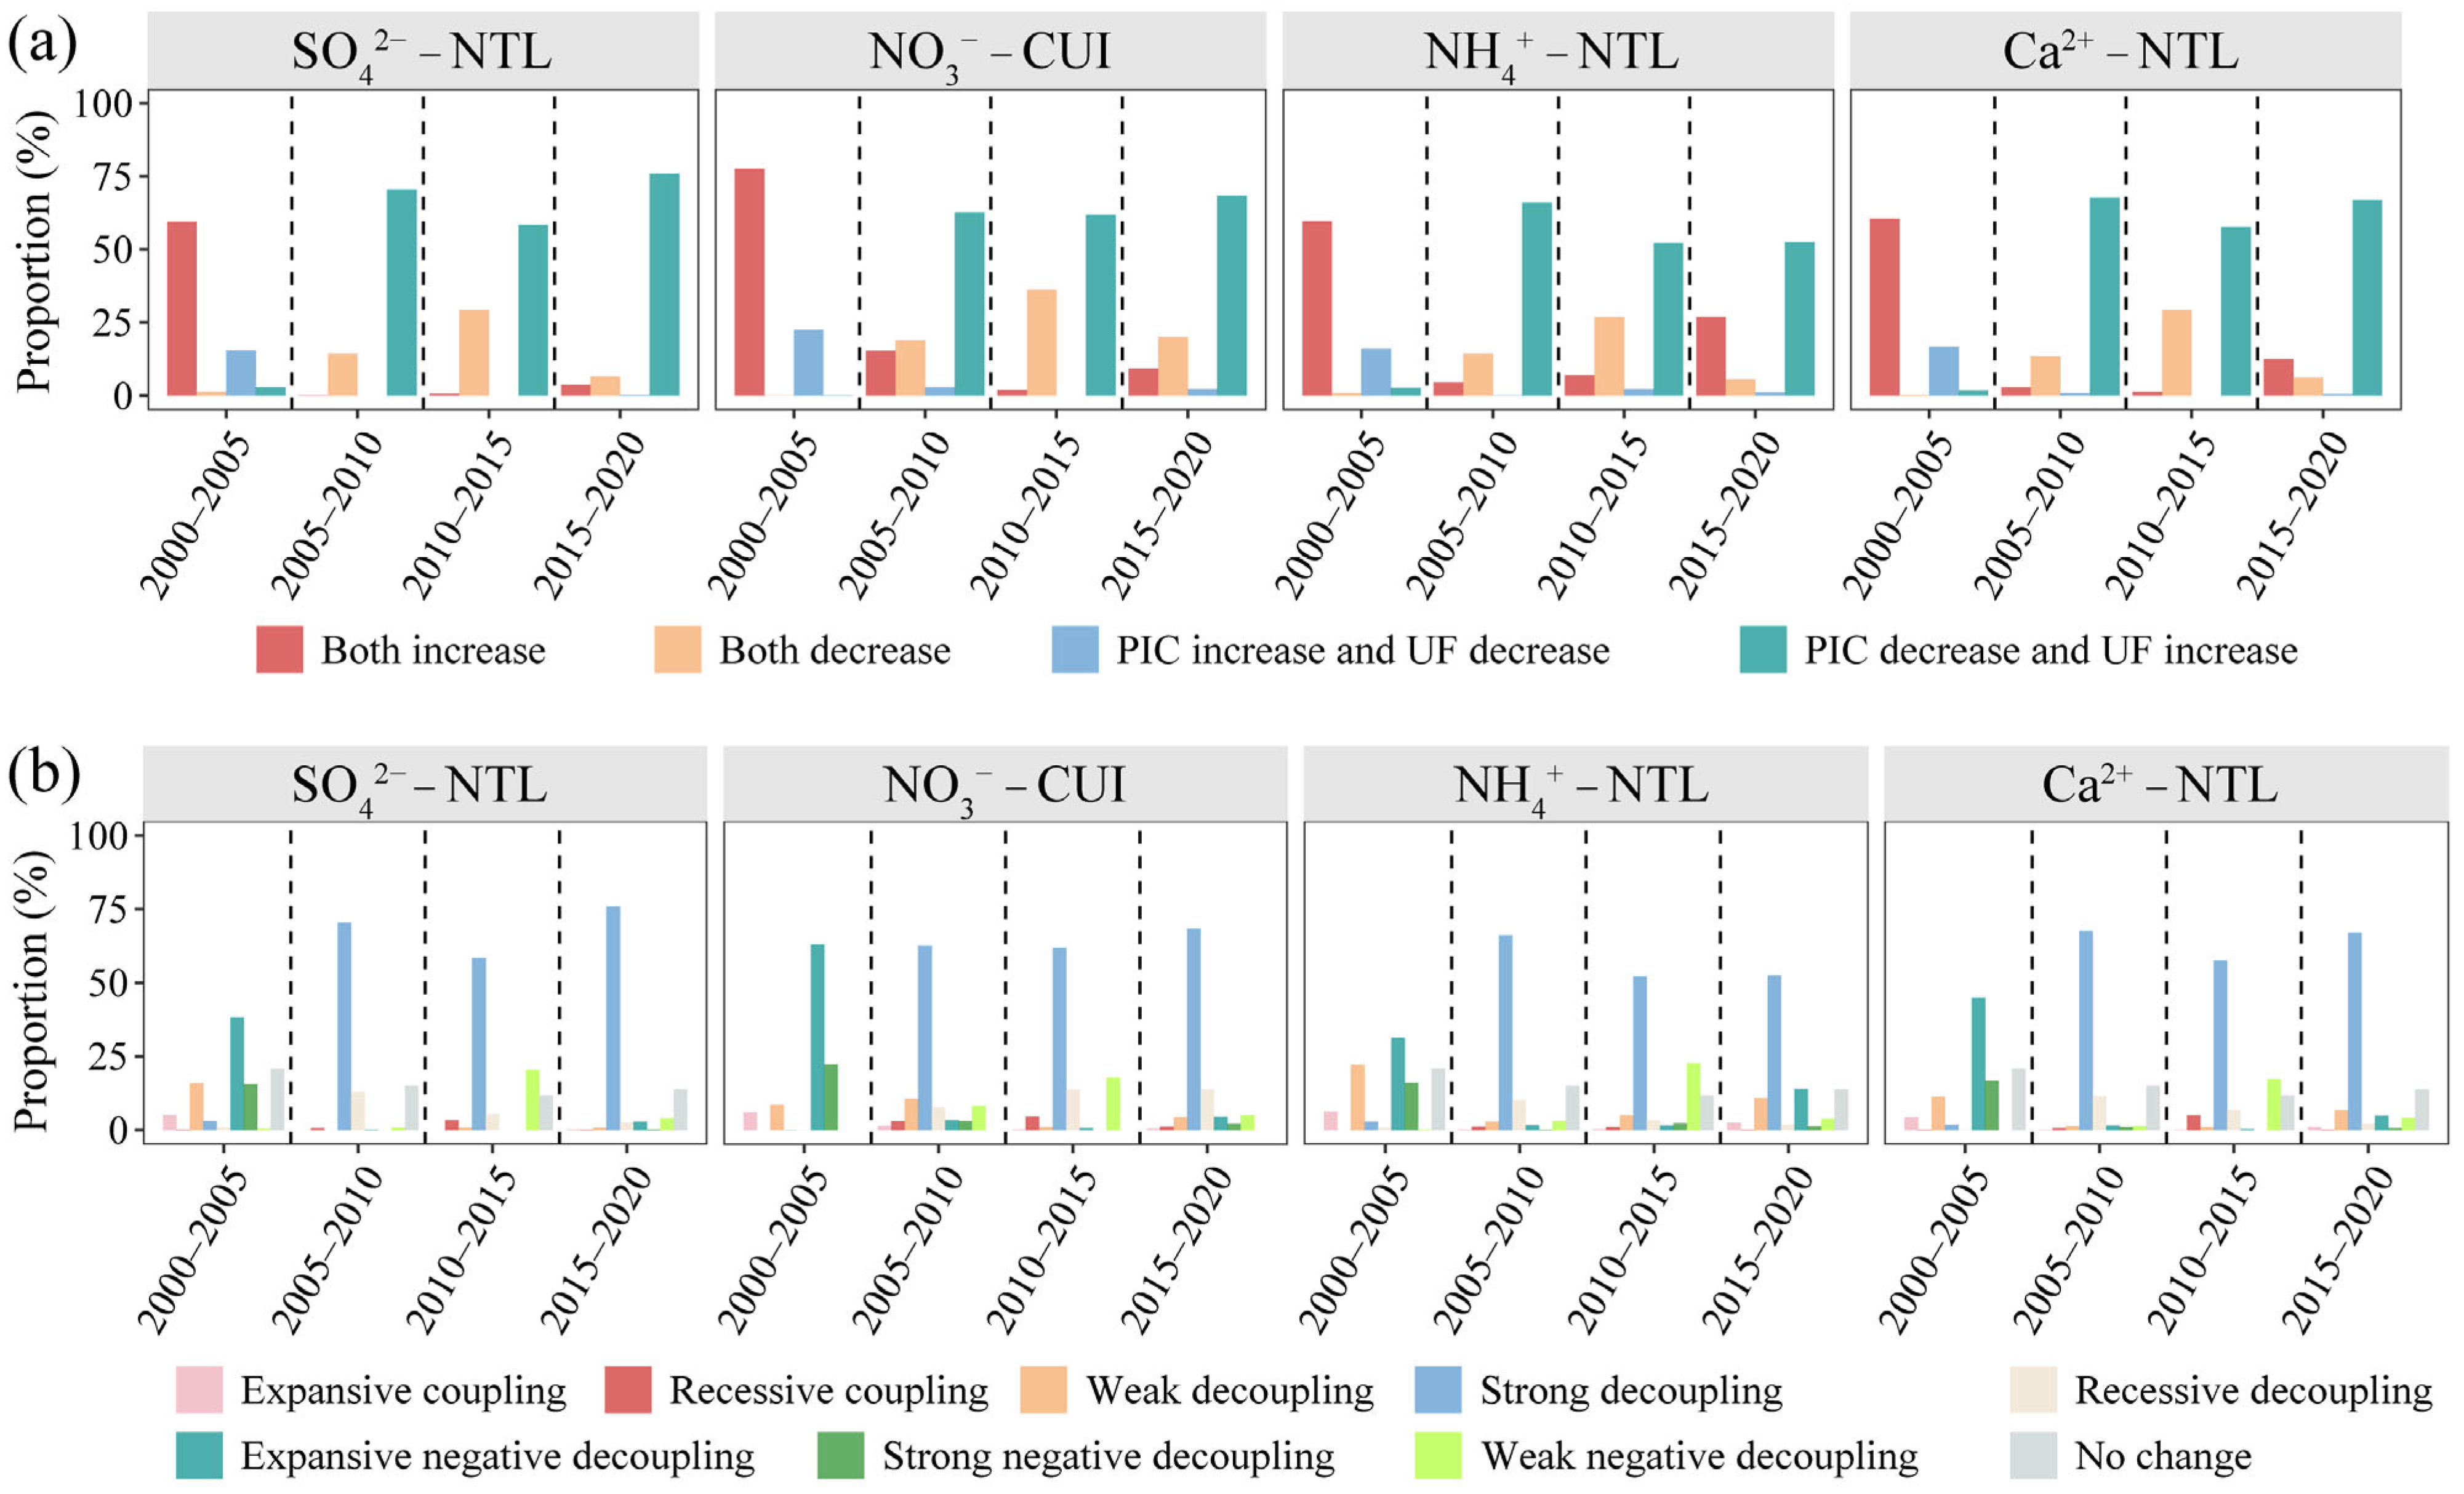
Synergies between PIC and UF were observed through increases and decreases in the relationships between the four pairs of variables (Figure 8 and Figure 9a). Over the four periods, the proportions of grid cells in which NTL with SO42−, Ca2+, and NH4+ increased simultaneously were 59.34–60.54%, 0.07–2.91%, 0.67–6.88%, and 3.66–26.98%, respectively. The proportions of simultaneous decreases in NTL with SO42−, Ca2+, and NH4+ were 0.22–1.35%, 13.45–14.35%, 26.98–29.22%, and 5.61–6.50%, respectively. After 2005, the proportion of simultaneous increases between NTL and the three PICs decreased sharply, with the lowest proportion observed between NTL and SO42−, whereas the interannual variation for simultaneous decreases showed the opposite trend. The proportions of grid cells in which CUI and NO3 increased simultaneously were 77.50%, 15.40%, 1.87%, and 9.34%, while the proportions in which they decreased simultaneously were 0.07%, 19.06%, 36.25%, and 20.10%. Overall, the grid proportions of simultaneous increases in the four variable pairs showed an interannual variation pattern of first decreasing and then increasing, while the changes in simultaneous decrease were the opposite. Spatially, areas with simultaneous increases were most widespread from 2000 to 2005, with high spatial clustering in the central PRD. From 2005 to 2020, these clusters primarily existed in the central, southern, and eastern regions. Notably, a spatial distribution of simultaneous increases reappeared in the southeastern coastal and southwestern regions from 2015 to 2020. Areas with simultaneous decreases expanded from 2005 to 2020, with a significant increase from 2010 to 2015, and the clusters were distributed in the northwest, southwest, and northeast regions.
The trade-offs between PIC and UF were observed in scenarios in which PIC increase and UF decrease (PIUD), or PIC decrease and UF increase (PDUI) (Figure 8 and Figure 9a). The trade-off shifted from PIUD in 2000–2005 to PDUI in 2005–2020. The trade-off relationship increased sharply after 2005, rising by 176.00–312.15% and significantly surpassing the synergistic relationship (Figure 8 and Figure 9a). After 2005, the grid proportion of PDUI ranged from 52.17% to 75.86%, accounting for more than half of the total. Spatially, trade-offs before 2005 were scattered around the periphery of the region. After 2005, these trade-offs were distributed throughout the region, with higher spatial aggregation in the center and considerable fragmentation around the periphery. The proportions of PIUD decreased from 15.55 to 22.35% during 2000–2005 to 0.00–2.99% during 2005–2020, lacking significant spatial aggregation. Overall, the relationship between PIC and UF transitioned from synergy (2000–2005) to trade-off (2005–2020), shifting from both PIC and UF increase to PDUI. This result indicates a phase-dependent covariation between urbanization and precipitation chemistry, whereby the atmospheric environment initially deteriorated and subsequently improved with economic development.

3.4.3. Decoupling Analysis of UF and PIC

The decoupling relationships between SO42−–NTL, NO3–CUI, Ca2+–NTL, and NH4+–NTL during the four periods were classified into three categories: coupling, decoupling, and negative decoupling. From 2000 to 2020, both coupling and negative decoupling exhibited an overall weakening trend. Negative decoupling of the four variable pairs decreased by 6.89, 6.22, 1.52, and 5.54, while decoupling increased markedly. Overall, the relationship between PIC and UF transitioned from negative decoupling to decoupling (Figure 9b). During 2000–2005, the relationship between the four variables was mainly characterized by expansive negative decoupling, with NO3–CUI having the highest grid ratio of 62.93%. From 2005 to 2020, strong decoupling became predominant, representing 58.37–75.86%, 61.88–68.39%, 52.17–65.99%, and 57.70–67.64% of the relationships for the respective pairs. This shift from expansive negative decoupling to strong decoupling in 2005 indicated that the concentrations of SO42−, NO3, Ca2+, and NH4+ began decreasing as NTL and CUI increased, reversing the previous trend. The rapid increase in strong decoupling from 0.07 to 2.91% to 52.17–75.86% after 2005 signaled a significant improvement in decoupling levels (Figure 9b). This trend suggested a reduction in conflicts between various PICs and UFs, indicating a favorable balance between urbanization and precipitation chemistry–related environmental pollution.
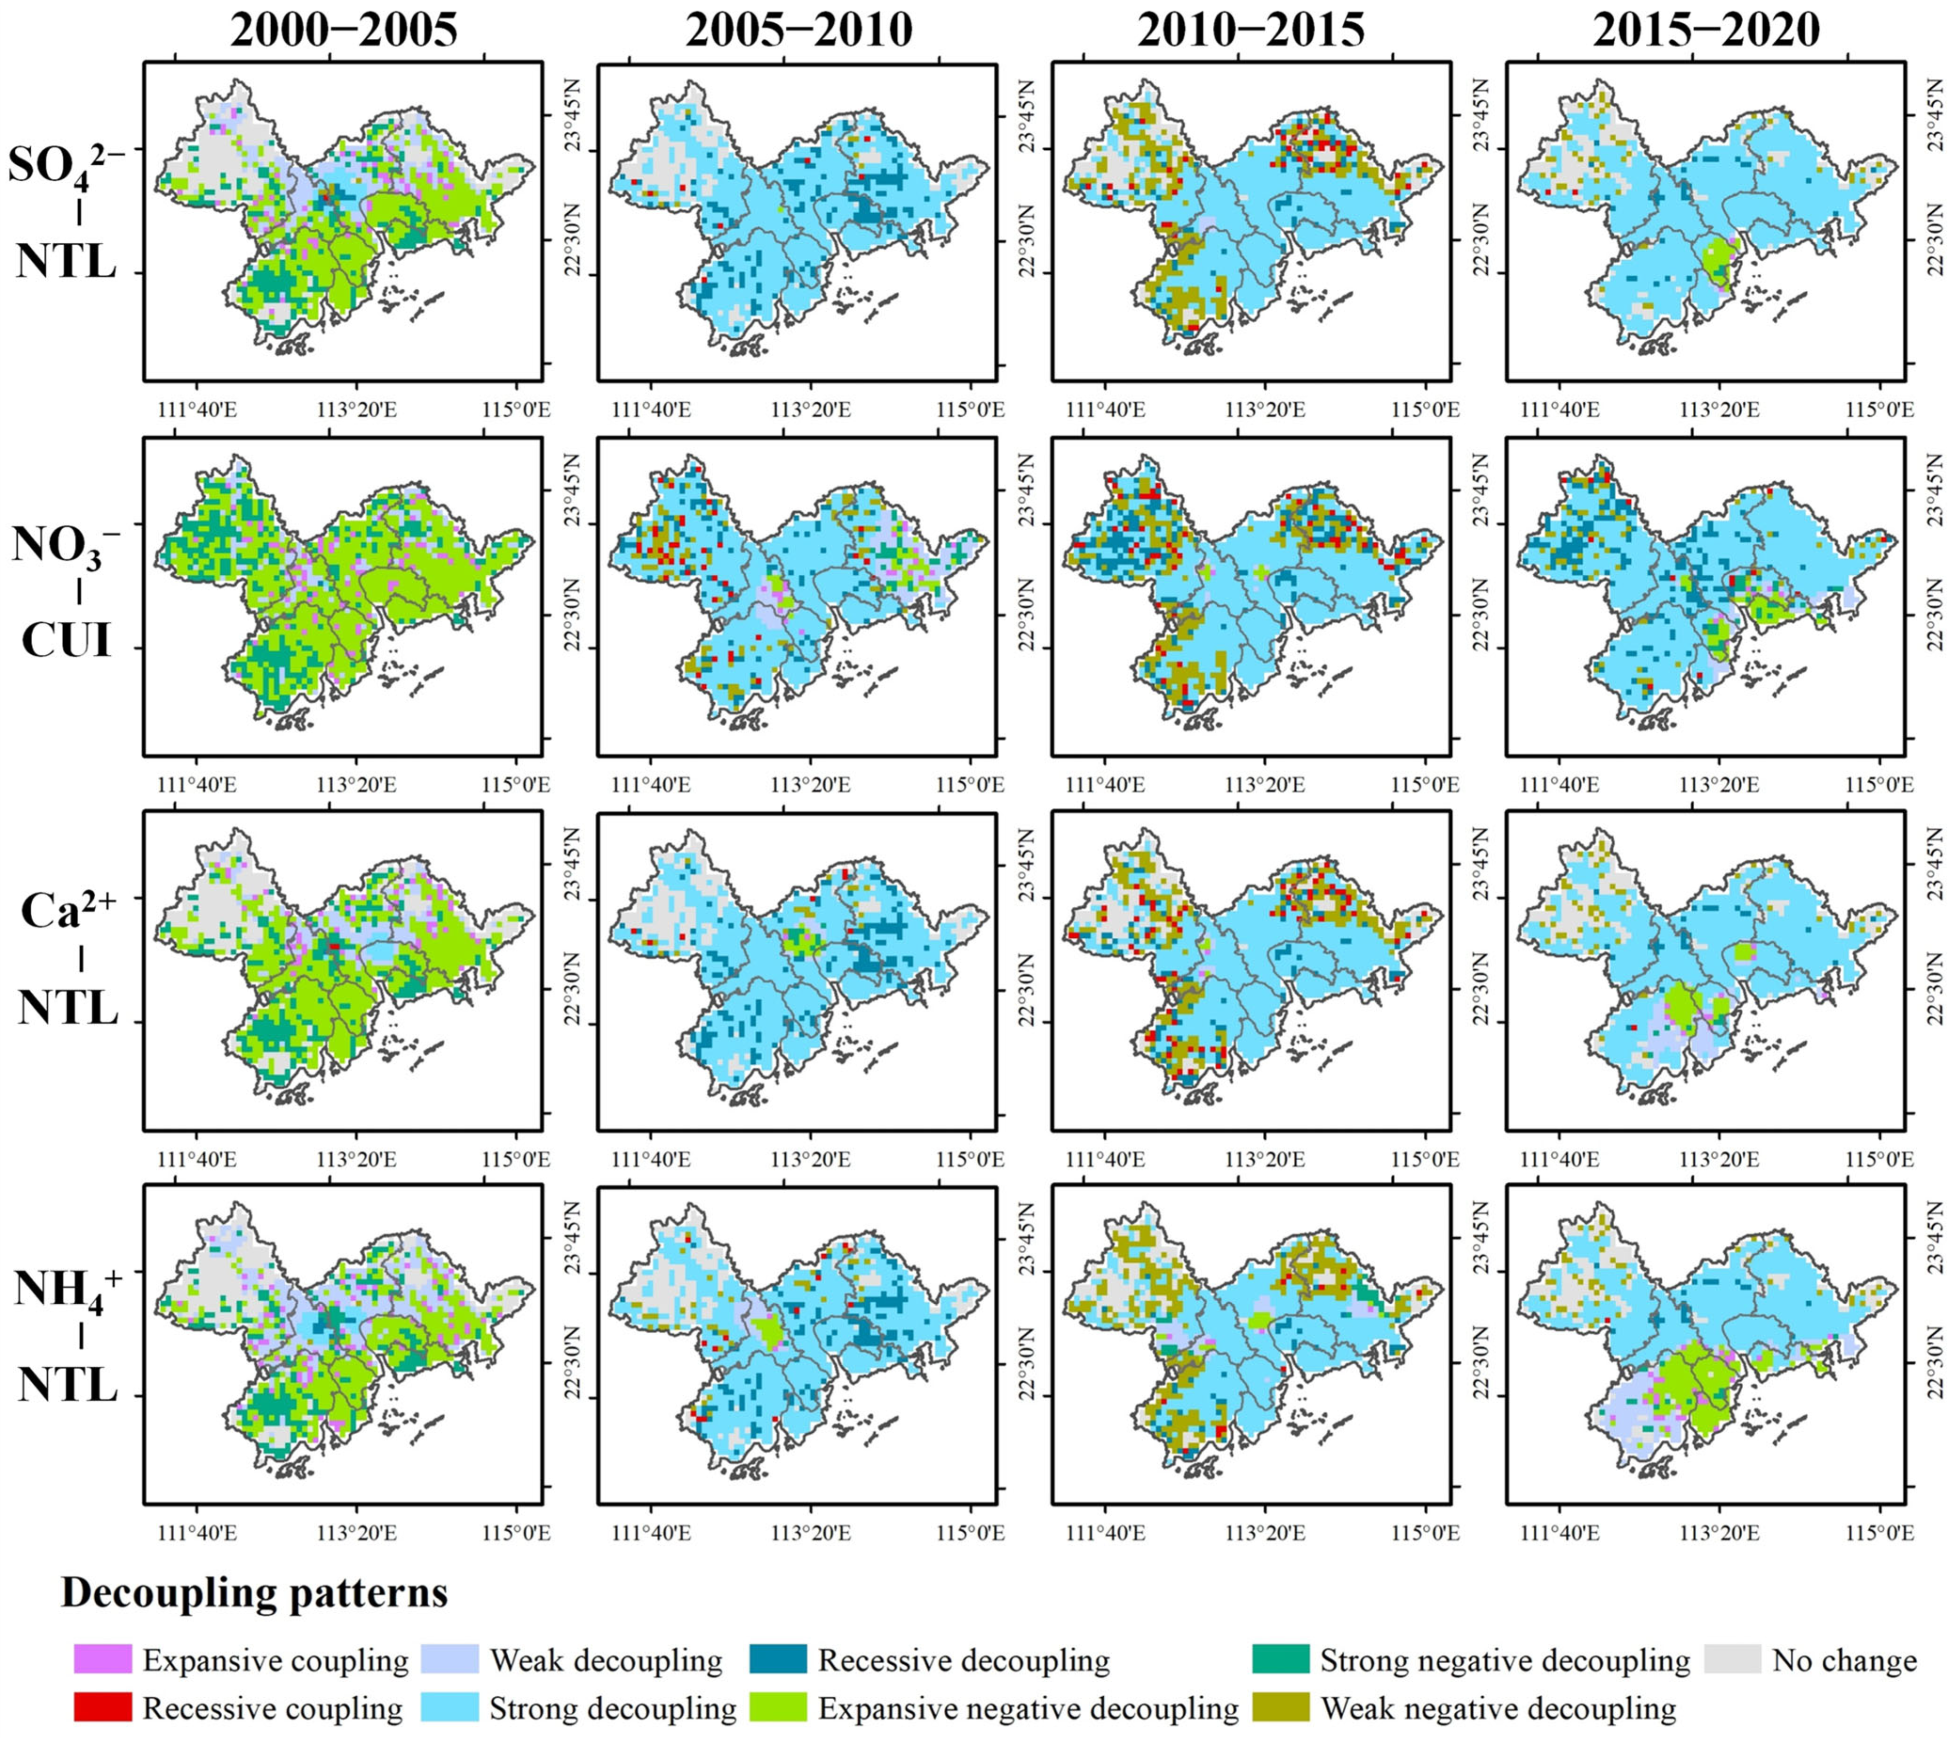
From 2000 to 2005, expansive negative decoupling of NTL with SO42−, Ca2+, and NH4+ was primarily observed in the southern coastal regions, including Dongguan, Zhongshan, Zhuhai, and Shenzhen. The expansive negative decoupling between NO3 and CUI was more extensively distributed, particularly in the central and southeastern coastal regions (Figure 10). Between 2005 and 2010, nearly all regions with expansive negative decoupling transitioned to strong decoupling, with clustering patterns becoming more apparent in the northern regions. From 2010 to 2015, decoupling distribution patterns for the four variable pairs became more consistent, with significantly strong decoupling relationships in central cities and coastal areas such as Guangzhou, Foshan, Dongguan, Shenzhen, Zhongshan, and Zhuhai. From 2015 to 2020, strong decoupling relationships expanded from the center to the periphery. The relationships of NTL with SO42− and Ca2+ were widespread throughout the region, whereas NH4+–NTL relationships were mainly concentrated in the north, particularly in Guangzhou, Foshan, Dongguan, and their junction with Huizhou and Zhaoqing (Figure 10). Notably, local patches of expansive negative decoupling for the four variable pairs appeared in the coastal areas of Zhongshan, Shenzhen, and Zhuhai during this period.

4. Discussion

4.1. The Overall Trend of PIC Is Downward, with Its Spatiotemporal Pattern Being Influenced by Human Activities

Our analysis revealed a significant nonlinear decline in TICs and individual ion species in precipitation across the PRD from 2000 to 2020 (Figure 3 and Figure S3). This trend was strongly correlated with Chinese environmental policies, including the “11th Five-Year Plan for Acid Rain and SO2 Pollution Control” and the “Air Pollution Prevention and Control Action Plan.” The primary ionic components in precipitation were SO42−, Ca2+, NH4+, and NO3, which aligned with the findings of previous studies [13,56]. Among the anions, SO42− exhibited the highest concentration, followed by NO3. Wang et al. [57] demonstrated that the proportion of SO42− among total ions fluctuated, with an overall 17.84% decrease over the two decades in the PRD, while the proportion of NO3 increased by 4.71%, indicating the growing dominance of NO3 in precipitation. This shift aligned with global trends in the deposition of nitrogen and sulfur [14]. Primarily, this shift was attributed to fossil fuel combustion (e.g., industrial, transportation, and heating) and urban waste emissions [19]. This pattern was also observed in coastal economic hubs in China (e.g., Fujian; [58]. High concentrations of Ca2+ and NH4+ in precipitation were linked to soil and road dust [25] and agricultural pollution emissions [21]. Agricultural practices, particularly the use of fertilizers and animal manure, contribute to NH3 emissions, which in turn affect atmospheric NH4+ levels. The NH4+/NO3 ratio served as a robust indicator of nitrogen source partitioning: NH4+/NO3 > 1 characterized intensive agricultural systems [59], whereas NH4+/NO3 < 1 typified industrial-dominated regions [60]. A comparison between Shenzhen and Zhaoqing showed that post-2008, NH4+/NO3 values in Shenzhen remained below 1 (ranging from 0.503 to 0.873), representing a 129.15% decrease from pre-2008 levels. In contrast, NH4+/NO3 values in Zhaoqing were significantly higher than 1 (6.263), indicating a 358.83% increase (Table S12). These contrasts quantitatively validate the distinct impacts of urban fossil fuel use versus rural agricultural practices on nitrogen deposition dynamics, consistent with previous studies [61].
Among the four principal ions monitored in PRD precipitation, SO42− exhibited the most pronounced interannual decrease in concentration, demonstrating a statistically significant reduction across the entire study area (Figure 3 and Figure 4a,c). This trend was strongly associated with the implementation of various desulfurization initiatives by the Guangdong Provincial government, including retrofitting thermal power plants for flue gas desulfurization (FGD), optimizing the energy portfolio, restricting the use of high-sulfur fuels, and mandating the installation of FGD systems. Official statistics indicate that SO2 emissions in Guangdong Province have decreased by approximately 90% over the past two decades [62]. Variations in the SO42−/NO3 ratio suggested that the composition of precipitation pollutants and the contributing source structure within the PRD underwent a marked transformation beginning around 2008 (Figure S2). Specifically, there was a shift from predominantly sulfate-type acidity toward a mixed sulfate–nitrate profile, a transition closely linked to trends in NOx emissions [57]. NO3 in precipitation primarily originates from NOx released during fossil fuel combustion, particularly from vehicular traffic and power generation. In parallel with economic growth, the civilian vehicle fleet in Guangdong Province has grown approximately 14-fold over the last two decades [62], leading to a corresponding and rapid increase in NOx emissions from vehicular exhaust. Furthermore, mandatory denitrification measures for power plants have not yet been implemented province-wide in Guangdong [63]. As a result, NO2 emissions in Guangdong significantly exceed SO2 emissions, and NOx emerged as the most abundant gaseous pollutant, not only in Guangdong, but also across China. Therefore, mitigating NOx emissions is critical for reducing acid rain pollution nationwide.
Moreover, we found that the PICs exhibited distinct spatial heterogeneity across the PRD (Figure 4 and Figures S4 and S5), with industrial hubs, such as Guangzhou and Foshan, exhibiting the highest ionic loads. This spatial pattern aligned with elevated SO2 and NOx emissions in these regions, consistent with established correlations between precipitation chemistry and nitrogen/sulfur oxide emission density [64]. The spatial heterogeneity of human activities determines the spatial differentiation of regional atmospheric pollution. Urbanization led to the formation of densely populated and intensively farmed areas [52]. Rapid economic growth and urban expansion (a 62% increase in built-up areas from 2000 to 2020; Figures S6 and S9) intensified fossil fuel combustion and construction-related particulate resuspension, elevating emissions of sulfur/nitrogen oxides and crustal cations (K+, Na+, Ca2+, and Mg2+) in industrial corridors. Notably, industrial regions also show high NH4+ concentrations (mean 198 μeq L−1), challenging traditional agricultural attributions [65]. Recent evidence indicates that industrial NH3 emissions have tripled since 2000, driven by waste treatment, coal-fired power plants, and fertilizer production, with non-agricultural sources now contributing nearly five times as much NH3 as agricultural activities [66,67]. This evidence supports the observed high NH4+ concentrations in the highly industrialized areas of this study. Temporal analysis further revealed distinct pollution trajectories: the Guangzhou–Foshan–Jiangmen cluster showed significant increases in ion concentrations from 2000 to 2008, followed by modest declines post-2009 (Figure S4). This biphasic trend reflected delayed policy impacts: initial sulfur control measures in heavy industrial areas were outpaced by emission growth, with substantial reductions emerging only after 2008, following the comprehensive implementation of the Guangdong Desulfurization Initiative. From a spatial perspective, peripheral areas of the PRD exhibited steeper declines in ion concentrations than urban cores, due to lower baseline emissions and stronger natural mitigation. High-elevation peripheral areas with dense vegetation cover demonstrate superior air pollutant interception through two key mechanisms: (i) great soil adsorption of air pollutants (e.g., reactive nitrogen) [68] and (ii) vegetation-mediated suppression of crustal cation fluxes. These findings redefine urban–rural pollution gradients through the lens of land-use and ecosystem services.

4.2. Spatiotemporal Relationship Between UF and PIC Demonstrates a Complex Nonlinear Dynamic, Gradually Approaching Equilibrium

This study identified a continuous increase in urbanization across various dimensions—economy, population, land, and composite urbanization—in the PRD between 2000 and 2020, with the highest intensity observed in economic urbanization. Urbanization levels were the highest in the central and southeastern coastal areas, while peripheral regions, such as the northeastern, northwestern, and southwestern areas, exhibited low intensities (Figure 5 and Figures S6–S9). The central and coastal PRD regions were considered developed urban areas, characterized by high economic development and intensive land use [69]. Consequently, pollutant emissions from industries, transportation, and construction have increased, resulting in a high–high clustering spatial distribution pattern between urbanization and PICs in these areas. Over time, the spatial correlation between urbanization and PICs has strengthened, particularly for NO3, where it has become more pronounced due to changes in the energy structure and increased emissions from mobile sources (Figure 6 and Figure S10). The impact of urbanization on PICs varies across different dimensions. Compared with population and land urbanization, economic and composite urbanization had a substantial effect on SO42−, NO3, Ca2+, and NH4+ (Figure 7). This finding might be attributed to the significant correlation between ions, especially secondary ions, and GDP [17]. Economic urbanization promotes the development of transportation and energy utilization, whereas increasing industrialization exacerbates coal and fossil fuel burning, vehicle exhaust emissions, and agricultural fertilizer production. Secondary ions such as SO42−, NO3, and NH4+ are closely linked to industrial output, total energy consumption, vehicle numbers, and nitrogen fertilizer usage [21]. Thus, emissions of SO2, NH3, and NOx driven by economic growth significantly affect the concentrations of related secondary ions in precipitation [21,67]. Ca2+, a common alkaline ion, is associated with dust, sandstorms, and other atmospheric particulate matter [25]. Construction, transportation, and industrial production may increase fine particulate matter in the air, rendering the influence of economic urbanization on Ca2+ concentration in precipitation particularly significant. Notably, although NTL exhibits a higher Q value than other urbanization indicators—indicating stronger explanatory power for PIC—its absolute value remains relatively low (Figure 7). This underscores the complexity of drivers and sources of precipitation chemistry. For instance, meteorological factors substantially influence PIC. Boundary layer height controls vertical pollutant dispersion [70], whereas precipitation amount and frequency modulate ion removal efficiency [13]. During low-rainfall periods, particulate matter accumulates in the atmosphere. Additionally, climate warming intensifies compound extreme weather events, thereby substantially altering PIC. Wind speed and direction also significantly affect PIC. Interactions between coastal emission sources and prevailing wind directions may exacerbate air pollution [71]. Specific atmospheric circulation patterns facilitate regional pollutant transport [72]. Other meteorological variables, including temperature, relative humidity, and atmospheric pressure, also exert complex effects on PIC [71]. Beyond anthropogenic emissions, oceanic inputs of Cl, Na+, and Mg2+ significantly contribute to precipitation ion composition in coastal cities [13]. In summary, precipitation chemistry is not governed by a single factor or a few dominant drivers.
Our findings showed that from 2000 to 2020, spatial patterns characterizing trade-off/synergy and coupling/decoupling relationships between PICs and UFs were consistent (Figure 8 and Figure 10). Over the past two decades, synergistic and coupled relationships between PICs and UFs have weakened, while trade-off and decoupled relationships have strengthened. Notably, around 2005, a shift occurred from a coupled state, with synchronous increases in both variables, to a decoupled state, characterized by decreasing ion concentrations amid ongoing urbanization. Between 2000 and 2005, relationships between major ions and their dominant urbanization indicators were primarily coupled, with expansive negative decoupling being the dominant observed type, albeit in limited areas (Figure 10). This finding suggested that rapid urbanization led to the swift expansion of construction land and intensified anthropogenic interventions in land systems [73]. Concurrently, rising population density and industrial growth stimulated pollutant emissions and increased PICs. The years 2000–2005 marked a period of accelerated population growth and expansion in the PRD, particularly in southeastern coastal cities such as Dongguan, Shenzhen, Zhongshan, and Zhuhai (Figures S8 and S9). During this period, inadequate preventive and remediation policies failed to counteract the adverse ecological impacts of rapid economic expansion. At the same time, urbanization intensified the urban heat island effect, with elevated temperatures likely exacerbating pollutant emissions, such as organic nitrogen [74], contributing to the rise in PICs alongside urban development. After 2005, strong decoupling relationships between major ions (SO42−, Ca2+, NH4+, and NO3) and key urbanization indicators (NTL and CUI) accounted for the majority (>50%) of observed cases, signaling a decreasing conflict between precipitation pollution levels and urban development. Despite sustained economic growth during this period, the population and built-up areas growth rates in the PRD decelerated. Additionally, implementing environmental control measures increased the environmental carrying capacity of the region, thereby mitigating air pollution. As a result, the relationship between PICs and UFs gradually shifted toward decoupling. However, despite effective mitigation of precipitation pollution in recent years, our analysis revealed that between 2015 and 2020, patches exhibiting expansive negative decoupling between PICs and UFs re-emerged in coastal cities along the western and eastern banks of the Pearl River Estuary, including Zhongshan, Shenzhen, and Zhuhai (Figure 10). This finding suggested a potential risk of localized air pollution intensification, necessitating targeted regional mitigation strategies to comprehensively improve air quality.
The decoupling trajectory observed in the PRD—transitioning from expansive negative decoupling to strong decoupling after 2005—parallels broader regional and global patterns of urbanization–environment interactions. To contextualize these findings, comparative evidence from diverse environmental media and geographical settings was synthesized (Table S13). This is consistent with the observation that urbanization–environment decoupling is not a static equilibrium but a dynamic, stage-dependent process. In Zhejiang Province, Wu et al. [75] documented a similar policy-induced transition from expansive negative decoupling dominance to strong decoupling prevalence, driven by the phased implementation of new-type urbanization strategies (e.g., “Five Waters Co-governance” and industrial greening). Whereas their influencing factors shifted sequentially across economic, social, and population dimensions, the PRD highlights economic urbanization—captured by NTL—as the primary driver of precipitation chemistry changes. This discrepancy likely reflects the PRD’s role as a manufacturing and export hub, where land-cover change and energy-intensive industrialization preceded social infrastructure development, contrasting with Zhejiang’s more balanced county-level development. From an ecological–environmental coupling perspective, the transition from sulfate-dominated to mixed sulfate–nitrate precipitation chemistry in the PRD parallels the atmospheric evolution observed in the Yellow River Basin [31], where stringent emission controls gradually shifted the pollution profile from SO2-dominated emissions to more complex, multi-pollutant conditions. However, the post-2009 decline in ion concentrations across peripheral PRD areas—concurrent with intensifying urbanization—contrasts with the ecosystem service patterns reported by Zhang et al. [28] for Chinese urban agglomerations. In that study, weak decoupling and expansive negative decoupling coexisted, with approximately 25% of cities exhibiting expansive negative decoupling, in which ecosystem degradation outpaced urban growth, particularly in southeastern coastal zones where habitat quality declined. The PRD’s trajectory toward strong decoupling indicates that peripheral ecological restoration and industrial relocation may have partially decoupled pollutant emissions from urban expansion, at least for atmospheric precipitation chemistry. Nevertheless, ecosystem services (e.g., habitat quality) in the same region may continue to lag, underscoring the medium-dependent nature of decoupling outcomes.
Globally, the PRD’s transition echoes decoupling experiences in OECD economies, where the Tapio framework was originally applied to demonstrate road-traffic-related decoupling in Finland [32]. More recently, EU member states exhibited decoupling of CO2 emissions from economic growth during 2013–2018 [76], driven by R&D investment and energy transition—paralleling the PRD’s post-2005 strong decoupling enabled by technological upgrading and emission standards enforcement. Conversely, developing regions such as Pakistan’s transportation sector have exhibited persistent expansive negative decoupling [77], indicating that the PRD’s rapid shift from expansive negative decoupling to strong decoupling is not universal but contingent on aggressive policy intervention and industrial restructuring. The observed non-stationary balance—in which the urbanization–precipitation chemistry relationship varies temporally and spatially—further corroborates the findings of Sun et al. [78] in the Taihu Lake Basin, namely that decoupling states can reverse under high levels of urbanization (e.g., Shanghai’s recessive decoupling and pollution rebound risk). Crucially, the ecological implications of decoupling extend beyond atmospheric chemistry. Logarithmic Mean Divisia Index decomposition reveals that intensity effects (technology-driven pollution reduction per unit output) and structure effects (industrial composition shifts) promote strong decoupling, whereas output effects and population effects often drive the system toward expansive coupling or expansive negative decoupling. In the PRD, the pronounced decline in SO42− and Ca2+ after 2009 suggests that intensity and structure effects—namely, the retirement of small coal-fired units and relocation of heavy industry—dominated during this period. However, the simultaneous increase in NO3 and NH4+ proportions indicates that agricultural and mobile source emissions (population-driven food and transport demands) may generate new forms of expansive negative decoupling or weak decoupling for nitrogen species, a nuance obscured by aggregate ion analyses. This nitrogen-centric legacy aligns with the Taihu Basin’s total phosphorus lag, where certain pollutant species resist decoupling due to diffuse source characteristics and delayed policy responses. In summary, although the PRD has achieved a remarkable shift toward strong decoupling between urbanization and precipitation pollution, this balance should be interpreted within a multi-scalar, multi-media framework. The coexistence of decoupling types across Chinese urban agglomerations—ranging from the ecosystem-service trade-offs identified by Zhang et al. [28] through the carbon-oriented strong decoupling in Zhejiang [75] to the water-quality rebounds in Taihu [78]—underscores that balanced development cannot be inferred from a single environmental indicator. For the PRD, sustaining strong decoupling will require differentiated zoning strategies that address the spatial heterogeneity of ion-specific pollution sources, particularly as urbanization diffuses from the core to the periphery where ecological sensitivity is elevated. Future research should integrate precipitation chemistry with ecosystem service accounting and carbon emission inventories to assess whether atmospheric decoupling occurs at the expense of other environmental domains, thereby ensuring that the observed balance is truly synergistic rather than merely displaced.

4.3. Policy Implications

The Chinese government has implemented measures that have effectively addressed the ecological challenges of rapid urbanization [79]. The post-2005 shift toward strong decoupling coincides with the implementation of the 11th Five-Year Plan and subsequent stringent air pollution control policies, suggesting a potential policy-driven effect. Regions with strong decoupling can sustain development trajectories while harmonizing economic progress with ecosystem protection. Investigating the coupling and decoupling between urbanization and precipitation chemistry provides critical insights for regional environmental protection and policy formulation. Accordingly, future air pollution control efforts in the PRD should prioritize the following four aspects.
First, in recent years, expansive negative decoupling regions have emerged on both the eastern and western sides of the Pearl River Estuary, indicating the potential risk of increasing atmospheric pollution alongside urbanization. These areas should be prioritized as key ecological protection zones in future urban development. Second, this study identified NOx species as the primary pollutant in precipitation within the PRD, with the expansion of mobile sources, particularly vehicular traffic in highly urbanized areas, being a major driver of NOx emissions. Therefore, future pollution control strategies should focus on reducing emissions from mobile sources; prioritizing source control; regulating the formation and emission of secondary pollutants; promoting the adoption of new energy vehicles, such as hydrogen fuel cell vehicles [80]; and enforcing stricter regulations on anthropogenic NH3 and NOx emissions. Additionally, improvements should be made to exhaust gas treatment technologies for stationary sources, the urban energy mix should be optimized, and the implementation and enforcement of emission standards should be strengthened. Third, as urbanization progresses, the expansion of construction land can convert ecological and arable lands into impervious surfaces, disrupting the balance between socio-ecological and natural systems [81]. However, our findings suggested that increases in population, construction land, and economic development do not necessarily result in long-term negative effects on the atmosphere. This inference underscores the need for rational resource use and green development models, emphasizing that conservation and governance strategies must be stable, timely, and sustainable. Future development in the PRD should prioritize balancing ecological, social, and economic goals, particularly in the highly urbanized zones along the eastern and western sides of the Pearl River Estuary. Fourth, key measures for controlling pollutant emissions include optimizing urban land-use patterns, rationalizing industrial distribution, transitioning to alternative economic development models, and carefully managing the expansion of construction land. The ultimate goal is to advance regional urbanization and socioeconomic development while safeguarding natural ecosystems, thereby promoting a virtuous cycle of sustainable development.

4.4. Limitations and Future Research Directions

This study introduces decoupling analysis to examine the urbanization–atmospheric precipitation nexus. Through dual perspectives of coupling and decoupling, it systematically elucidates the complex nonlinear relationship and spatial heterogeneity between these processes, thereby offering a novel scientific basis for understanding the ecological effects of urbanization and informing differentiated ecological management policies at the regional level. However, several uncertainties and limitations should be acknowledged. First, the limited spatial coverage of the monitoring stations introduces non-negligible spatial uncertainty. Future studies should deploy passive samplers or temporary stations in undersampled areas to further constrain interpolation uncertainty and validate the current findings. Second, given the high rainfall volume and frequency in the study area, the sampling devices were operated continuously throughout the year to ensure the capture of all precipitation events. This approach inevitably resulted in dry deposition contamination. During dry intervals, atmospheric particulate matter—including dust and soil particles—accumulated in the collectors and dissolved upon subsequent precipitation events. This cross-contamination may have affected the concentrations of specific ions, notably Ca2+ and NH4+. Future research should employ automated wet-only samplers to precisely isolate the chemical characteristics of precipitation from dry deposition inputs. Third, the decoupling model serves as a macro-scale statistical elasticity indicator for long-term sequential analysis, making it suitable for examining relative changes between regional-scale urbanization and precipitation chemistry trends and for characterizing spatiotemporal patterns in decoupling states across ions, periods, and regions. While this study addresses whether decoupling occurs and to what extent, it cannot elucidate the causal mechanisms driving decoupling, owing to limitations in microscopic-scale simulation of aerosol chemical processes. Future research should therefore employ atmospheric chemical transport models or box models to investigate these mechanisms. Additionally, multiple factors—including meteorological conditions (e.g., rainfall, wind direction), marine source inputs (Na+, Cl, Mg2+), long-distance transport, dry deposition interference, and pollution reduction policies—may collectively influence ion concentration variations. Subsequent studies should verify these effects by integrating emission inventories with atmospheric chemical transport models.

5. Conclusions

This study focused on the PRD urban agglomeration and employs various statistical methods (e.g., MK trend test, spatial autocorrelation analysis, OPGD model, and decoupling analysis) to investigate the complex nonlinear relationship between urbanization dynamics and precipitation chemistry. The results indicate that regional PICs declined significantly from 2000 to 2020, despite progressive intensification of urbanization in the PRD, characterized by expansion from the central core to peripheral areas. The composition of atmospheric pollutants shifted from a sulfate–dominant profile to a mixed sulfate–nitrate profile. Spatially, the trends for major ions transitioned from localized significant increases before 2009 to widespread significant decreases thereafter, with more pronounced declines in peripheral regions. The spatial correlation between PICs and UFs strengthened over the study period. Economic urbanization exhibited the strongest explanatory power for variations in PICs. The relationship between PICs and UFs shifted from synergy (concurrent increases) to trade-offs (declining ion concentrations amid intensifying urbanization) over time. Consequently, the decoupling status of major ions relative to urbanization transitioned from expansive negative decoupling to strong decoupling, particularly in the core region. These decoupling dynamics reflect a fundamental shift in the urbanization–precipitation chemistry relationship, from antagonism toward equilibrium. Collectively, these findings demonstrate that the urbanization–precipitation chemistry nexus exhibits both temporal stage dependence and spatial heterogeneity. Identifying spatial variability in this decoupling provides actionable insights for developing tailored strategies to mitigate regional precipitation pollution.

Supplementary Materials

The following supporting information can be downloaded at: https://www.mdpi.com/article/10.3390/rs18142391/s1.

Author Contributions

Conceptualization, N.W. and L.L.; methodology, N.W. and L.L.; validation, N.W. and X.Z.; formal analysis, N.W., L.L. and X.Z.; investigation, N.W., Y.X., H.Y. and Z.Z.; data curation, L.Z.; writing—original draft, N.W.; writing—review and editing, N.W. and L.L.; visualization, N.W.; supervision, L.Z.; project administration, L.Z.; funding acquisition, L.Z. All authors have read and agreed to the published version of the manuscript.

Funding

This research was funded by the GDAS Project of Science and Technology Development (2023GDASZH-2023010101) and National Natural Science Foundation of China (42571046).

Data Availability Statement

The original contributions presented in this study are included in the article/Supplementary Materials. Further inquiries can be directed to the corresponding author.

Conflicts of Interest

The authors declare no conflicts of interest.

References

  1. Han, G.L.; Song, Z.L.; Tang, Y.; Wu, Q.X.; Wang, Z.R. Ca and Sr isotope compositions of rainwater from Guiyang city, Southwest China: Implication for the sources of atmospheric aerosols and their seasonal variations. Atmos. Environ. 2019, 214, 116854. [Google Scholar] [CrossRef]
  2. Guo, Y.Y.; Du, E.Z.; Li, B.H.; Xia, N.; Wu, X.H.; de Vries, W. Significant urban hotspots of atmospheric trace element deposition and potential effects on urban soil pollution in China. J. Clean. Prod. 2023, 415, 137872. [Google Scholar] [CrossRef]
  3. Doan, Q.V.; Chen, F.; Kusaka, H.; Dipankar, A.; Khan, A.; Hamdi, R.; Roth, M.; Niyogi, D. Increased risk of extreme precipitation over an urban agglomeration with future global warming. Earth’s Future 2022, 10, e2021EF002563. [Google Scholar] [CrossRef]
  4. Huang, A.S.; Chu, M.; Cheng, W.X.; Wang, G.; Guan, P.B.; Zhang, L.; Jia, J. Dynamic evaluation of China’s atmospheric environmental pressure from 2008 to 2017: Trends and drivers. J. Environ. Sci. 2025, 150, 177–187. [Google Scholar] [CrossRef] [PubMed]
  5. Singh, A.K.; Mondal, G.C. Chemical characterization of wet precipitation events and deposition of pollutants in coal mining region, India. J. Atmos. Chem. 2008, 59, 1–23. [Google Scholar] [CrossRef]
  6. Zhang, T.A.; Chen, H.Y.H.; Ruan, H.H. Global negative effects of nitrogen deposition on soil microbes. ISME J. 2018, 12, 1817–1825. [Google Scholar] [CrossRef] [PubMed]
  7. Zhang, Q.Y.; Zhu, J.X.; Wang, Q.F.; Xu, L.; Li, M.X.; Li, Y.; Liu, C.C.; He, N.P. New insights into multi-component atmospheric wet deposition across China: A multidimensional analysis. Earth’s Future 2022, 10, e2021EF002588. [Google Scholar] [CrossRef]
  8. Galloway, J.N.; Zhao, D.W.; Xiong, J.L.; Likens, G.E. Acid rain: China, United States, and a Remote Area. Science 1987, 236, 1559–1562. [Google Scholar] [CrossRef] [PubMed]
  9. Larssen, T.; Lydersen, E.; Tang, D.G.; He, Y.; Gao, J.X.; Liu, H.Y.; Duan, L.; Seip, H.M.; Vogt, R.D.; Mulder, J.; et al. Acid rain in China. Environ. Sci. Technol. 2006, 40, 418–425. [Google Scholar] [CrossRef]
  10. Si, L.P.; Li, Z.X. Atmospheric precipitation chemistry and environmental significance in major anthropogenic regions globally. Sci. Total Environ. 2024, 926, 171830. [Google Scholar] [CrossRef] [PubMed]
  11. Liu, M.X.; Huang, X.; Song, Y.; Tang, J.; Cao, J.J.; Zhang, X.Y.; Zhang, Q.; Wang, S.X.; Xu, T.T.; Kang, L.; et al. Ammonia emission control in China would mitigate haze pollution and nitrogen deposition, but worsen acid rain. Proc. Natl. Acad. Sci. USA 2019, 116, 7760–7765. [Google Scholar] [CrossRef] [PubMed]
  12. Zhang, Q.Y.; Zhu, J.X.; Mulder, J.; Wang, Q.F.; Liu, C.Q.; He, N.P. High environmental costs behind rapid economic development: Evidence from economic loss caused by atmospheric acid deposition. J. Environ. Manag. 2023, 334, 117511. [Google Scholar] [CrossRef] [PubMed]
  13. Zeng, J.; Han, G.L.; Wu, Q.X.; Peng, M.X.; Ge, X.; Mao, S.J.; Wang, Z.J.; Ma, Q. Chemical evolution of rainfall in China’s first eco-civilization demonstration city: Implication for the provenance identification of pollutants and rainwater acid neutralization. Sci. Total Environ. 2024, 910, 168567. [Google Scholar] [CrossRef] [PubMed]
  14. Rubin, H.J.; Fu, J.S.; Dentener, F.; Li, R.; Huang, K.; Fu, H.B. Global nitrogen and sulfur deposition mapping using a measurement–model fusion approach. Atmos. Chem. Phys. 2023, 23, 7091–7102. [Google Scholar] [CrossRef]
  15. Theobald, M.R.; Vivanco, M.G.; Aas, W.; Andersson, C.; Ciarelli, G.; Couvidat, F.; Cuvelier, K.; Manders, A.; Mircea, M.; Pay, M.T.; et al. An evaluation of European nitrogen and sulfur wet deposition and their trends estimated by six chemistry transport models for the period 1990–2010. Atmos. Chem. Phys. 2019, 19, 379–405. [Google Scholar] [CrossRef]
  16. Hu, Y.; Schmidhalter, U. Urease inhibitors: Opportunities for meeting EU national obligations to reduce ammonia emission ceilings by 2030 in EU countries. Environ. Res. Lett. 2021, 16, 084047. [Google Scholar] [CrossRef]
  17. Huang, X.; Li, S.Y. Economic and industrial development significantly contribute to acidity and ionic compositions of rainwater in China. Water 2024, 16, 193. [Google Scholar] [CrossRef]
  18. Kurokawa, J.; Ohara, T. Long-term historical trends in air pollutant emissions in Asia: Regional Emission inventory in ASia (REAS) version 3. Atmos. Chem. Phys. 2020, 20, 12761–12793. [Google Scholar] [CrossRef]
  19. Mgelwa, A.S.; Zhu, F.F.; Huang, D.; Song, L.L.; Wang, Y.Y.; Gurmesa, G.A.; Wang, A.; Liu, M.; Huang, S.N.; Qiu, Q.Y.; et al. Patterns and drivers of atmospheric inorganic nitrogen deposition in Northeast Asia. J. Environ. Manag. 2024, 349, 119343. [Google Scholar] [CrossRef] [PubMed]
  20. Tan, J.N.; Su, H.; Itahashi, S.; Tao, W.; Wang, S.W.; Li, R.; Fu, H.B.; Huang, K.; Fu, J.S.; Cheng, Y.F. Quantifying the wet deposition of reactive nitrogen over China: Synthesis of observations and models. Sci. Total Environ. 2022, 851, 158007. [Google Scholar] [CrossRef] [PubMed]
  21. Li, R.; Cui, L.L.; Zhao, Y.L.; Zhang, Z.Y.; Sun, T.M.; Li, J.L.; Zhou, W.H.; Meng, Y.; Huang, K.; Fu, H.B. Wet deposition of inorganic ions in 320 cities across China: Spatio-temporal variation, source apportionment, and dominant factors. Atmos. Chem. Phys. 2019, 19, 11043–11070. [Google Scholar] [CrossRef]
  22. Zeng, J.; Han, G.L.; Wu, Q.X.; Qu, R.; Ma, Q.; Chen, J.W.; Mao, S.J.; Ge, X.; Wang, Z.J.; Ma, Z.H. Significant influence of urban human activities and marine input on rainwater chemistry in a coastal large city, China. Water Res. 2024, 257, 121657. [Google Scholar] [CrossRef] [PubMed]
  23. Qiao, X.; Du, J.; Kota, S.H.; Ying, Q.; Xiao, W.Y.; Tang, Y. Wet deposition of sulfur and nitrogen in Jiuzhaigou National Nature Reserve, Sichuan, China during 2015–2016: Possible effects from regional emission reduction and local tourist activities. Environ. Pollut. 2018, 233, 267–277. [Google Scholar] [CrossRef] [PubMed]
  24. Reyes-Trujeque, J.; Espinosa, A.A.; Sosa-Echeverría, R.; Alarcón-Jiménez, A.L.; Sánchez-Álvarez, P.; Kahl, J.D.W. Temporal variation and chemical composition of wet atmospheric deposition from two coastal sites in the Gulf of Mexico. Water Air Soil Pollut. 2024, 235, 443. [Google Scholar] [CrossRef]
  25. Zhang, Y.Y.; Cao, Y.F.; Tang, Y.; Ying, Q.; Hopke, P.K.; Zeng, Y.Y.; Xu, X.B.; Xia, Z.L.; Qiao, X. Wet deposition of sulfur and nitrogen at Mt. Emei in the West China Rain Zone, southwestern China: Status, inter-annual changes, and sources. Sci. Total Environ. 2020, 713, 136676. [Google Scholar] [CrossRef] [PubMed]
  26. Zhang, L.X.; Ren, Z.H.; Chen, B.; Gong, P.; Xu, B.; Fu, H.H. A prolonged artificial nighttime-light dataset of China (1984–2020). Sci. Data 2024, 11, 414. [Google Scholar] [CrossRef] [PubMed]
  27. Xiong, S.P.; Zhang, X.Y.; Wang, H.Y.; Meng, Q.Y.; Du, S.H. 40-year (1984–2024) mapping of urban land use dynamics in China. Sci. Bull. 2026, 71, 1474–1485. [Google Scholar] [CrossRef] [PubMed]
  28. Zhang, L.F.; Fang, C.L.; Zhu, C. Coupling coordination and decoupling effects: Measuring the interaction between urban agglomeration ecosystems and urbanization. Cities 2026, 171, 106788. [Google Scholar] [CrossRef]
  29. Peng, J.; Wang, X.Y.; Liu, Y.X.; Zhao, Y.; Xu, Z.H.; Zhao, M.Y.; Qiu, S.J.; Wu, J.S. Urbanization impact on the supply-demand budget of ecosystem services: Decoupling analysis. Ecosyst. Serv. 2020, 44, 101139. [Google Scholar] [CrossRef]
  30. Wu, Y.; Zong, T.; Shuai, C.Y.; Jiao, L.D. How does new-type urbanization affect total carbon emissions, per capita carbon emissions, and carbon emission intensity? An empirical analysis of the Yangtze River economic belt. China. J. Environ. Manag. 2024, 349, 119441. [Google Scholar] [CrossRef] [PubMed]
  31. Liu, F.F.; Zhu, M.Y.; Hua, C.Y.; Wang, L.; Tian, Y.R.; Fang, S.M.; Yang, J.Y.; Ren, L.J. Spatiotemporal analysis of the coupling and decoupling relationship between urbanization and atmospheric environment in the Yellow River Basin of China. Theor. Appl. Climatol. 2025, 156, 274. [Google Scholar] [CrossRef]
  32. Tapio, P. Towards a theory of decoupling: Degrees of decoupling in the EU and the case of road traffic in Finland between 1970 and 2001. Transp. Policy 2005, 12, 137–151. [Google Scholar] [CrossRef]
  33. Pielke, R.A. Land use and climate change. Science 2005, 310, 1625–1626. [Google Scholar] [CrossRef] [PubMed]
  34. Guo, H.J.; Cai, Y.P.; Li, B.W.; Wan, H.; Yang, Z.F. An improved approach for evaluating landscape ecological risks and exploring its coupling coordination with ecosystem services. J. Environ. Manag. 2023, 348, 119277. [Google Scholar] [CrossRef] [PubMed]
  35. Rastogi, N.; Sarin, M.M. Chemical characteristics of individual rain events from a semi-arid region in India: Three-year study. Atmos. Environ. 2005, 39, 3313–3323. [Google Scholar] [CrossRef]
  36. Awasthi, M.P. Mapping and analyzing temporal variability of spectral indices in the lowland region of Far Western Nepal. Water Pract. Technol. 2023, 18, 2971–2988. [Google Scholar] [CrossRef]
  37. Olofsson, P.; Foody, G.M.; Herold, M.; Stehman, S.V.; Woodcock, C.E.; Wulder, M.A. Good practices for estimating area and assessing accuracy of land change. Remote Sens. Environ. 2014, 148, 42–57. [Google Scholar] [CrossRef]
  38. Pan, Z.Z.; Wang, J.W. Spatially heterogeneity response of ecosystem services supply and demand to urbanization in China. Ecol. Eng. 2021, 169, 106303. [Google Scholar] [CrossRef]
  39. Peng, J.; Tian, L.; Liu, Y.X.; Zhao, M.Y.; Hu, Y.N.; Wu, J.S. Ecosystem services response to urbanization in metropolitan areas: Thresholds identification. Sci. Total Environ. 2017, 607–608, 706–714. [Google Scholar] [CrossRef] [PubMed]
  40. Friedmann, J. Four theses in the study of China’s urbanization. Int. J. Urban Reg. Res. 2006, 30, 440–451. [Google Scholar] [CrossRef]
  41. Wang, Q.; Lan, Z.L. Park green spaces, public health and social inequalities: Understanding the interrelationships for policy implications. Land Use Policy 2019, 83, 66–74. [Google Scholar] [CrossRef]
  42. Ding, Y.D.; Zhang, L.F.; He, Y.; Cao, S.P.; Wei, X.; Guo, Y.; Ran, L.; Filonchyk, M. Spatiotemporal evolution of agricultural drought and its attribution under different climate zones and vegetation types in the Yellow River Basin of China. Sci. Total Environ. 2024, 914, 169687. [Google Scholar] [CrossRef] [PubMed]
  43. Cao, S.P.; He, Y.; Zhang, L.F.; Sun, Q.; Zhang, Y.L.; Li, H.Z.; Wei, X.; Liu, Y.X. Spatiotemporal dynamics of vegetation net ecosystem productivity and its response to drought in Northwest China. GISci. Remote Sens. 2023, 60, 2194597. [Google Scholar] [CrossRef]
  44. Zhang, L.F.; Pu, H.Y.; Yan, H.W.; He, Y.; Yao, S.; Zhang, Y.L.; Ran, L.; Chen, Y. A landslide susceptibility assessment method based on auto-encoder improved deep belief network. Open Geosci. 2023, 15, 20220516. [Google Scholar] [CrossRef]
  45. Mann, H.B. Non-parametric tests against trend. Econometrica 1945, 13, 245–259. [Google Scholar] [CrossRef]
  46. Moran, P.A.P.; Kendall, M.G. Rank correlation methods. Int. Stat. Rev. 1973, 41, 399. [Google Scholar] [CrossRef] [PubMed]
  47. Sen, P.K. Estimates of the regression coefficient based on Kendall’s tau. J. Am. Stat. Assoc. 1968, 63, 1379–1389. [Google Scholar] [CrossRef]
  48. Ghosh, K.G. Analysis of rainfall trends and its spatial patterns during the last century over the Gangetic West Bengal, Eastern India. J. Geovisualization Spat. Anal. 2018, 2, 15. [Google Scholar] [CrossRef]
  49. Han, R.; Feng, C.C.; Xu, N.Y.; Guo, L. Spatial heterogeneous relationship between ecosystem services and human disturbances: A case study in Chuandong, China. Sci. Total Environ. 2020, 721, 137818. [Google Scholar] [CrossRef] [PubMed]
  50. Anselin, L. Local indicators of spatial association—LISA. Geogr. Anal. 1995, 27, 93–115. [Google Scholar] [CrossRef]
  51. Getis, A.; Ord, J.K. The analysis of spatial association by use of distance statistics. Geogr. Anal. 1992, 24, 189–206. [Google Scholar] [CrossRef]
  52. Li, L.; Wang, N.; Hao, Z.Z.; Sun, B.; Gao, B.T.; Gou, M.M.; Wang, P.; Pei, N.C. Urbanization intensifies the imbalance between human development and biodiversity conservation: Insights from the coupling analysis of human activities and habitat quality. Land Degrad. Dev. 2024, 35, 3606–3626. [Google Scholar] [CrossRef]
  53. Chi, G.Q.; Zhu, J. Spatial regression models for demographic analysis. Popul. Res. Policy Rev. 2008, 27, 17–42. [Google Scholar] [CrossRef]
  54. Song, Y.Z.; Wang, J.F.; Ge, Y.; Xu, C.D. An optimal parameters-based geographical detector model enhances geographic characteristics of explanatory variables for spatial heterogeneity analysis: Cases with different types of spatial data. GISci. Remote Sens. 2020, 57, 593–610. [Google Scholar] [CrossRef]
  55. Cui, X.Y.; Zeng, J.; Wu, J.H.; Chen, W.X. The nexus between urbanization and ecosystem services balance in China: A coupling perspective. Environ. Monit. Assess. 2024, 196, 638. [Google Scholar] [CrossRef] [PubMed]
  56. Zhang, L.Y.; Wang, J.; Wang, S.X.; Wang, C.B.; Yang, F.M.; Li, T.Z. Chemical characteristics of long-term acid rain and its impact on lake water chemistry: A case study in Southwest China. J. Environ. Sci. 2024, 138, 121–131. [Google Scholar] [CrossRef] [PubMed]
  57. Wang, N.; Li, L.; Zhang, Z.B.; Yang, H.; Zhao, X.F.; Zhao, L.L. Variations and source apportionment of chemical ions in atmospheric precipitation in the Pearl River Delta. Trop. Geogr. 2024, 44, 1562–1574. [Google Scholar] [CrossRef]
  58. Zheng, Q.P.; Wang, H.; Chen, B.B.; Sui, P.; Lin, W. Characteristics and the impact factors of acid rain in Fuzhou and Xiamen 1992–2012. J. Environ. Sci. 2014, 35, 3644–3650. [Google Scholar]
  59. Zhao, X.; Yan, X.; Xiong, Z.; Xie, Y.; Xing, G.; Shi, S.; Zhu, Z. Spatial and temporal variation of inorganic nitrogen wet deposition to the Yangtze River Delta Region, China. Water Air Soil Pollut. 2009, 203, 277–289. [Google Scholar] [CrossRef]
  60. Xing, J.W.; Song, J.M.; Yuan, H.M.; Li, X.G.; Li, N.; Duan, L.Q.; Kang, X.M.; Wang, Q.D. Fluxes, seasonal patterns and sources of various nutrient species (nitrogen, phosphorus and silicon) in atmospheric wet deposition and their ecological effects on Jiaozhou Bay, North China. Sci. Total Environ. 2017, 576, 617–627. [Google Scholar] [CrossRef] [PubMed]
  61. Mgelwa, A.S.; Kabalika, Z.; Hu, Y.L. Increasing importance of nitrate-nitrogen and organic nitrogen concentrations in bulk and throughfall precipitation across urban forests in southern China. Glob. Ecol. Conserv. 2020, 22, e00983. [Google Scholar] [CrossRef]
  62. National Bureau of Statistics of China. China Statistical Yearbook; China Statistics Press: Beijing, China. Available online: https://www.stats.gov.cn/sj/ndsj/ (accessed on 29 October 2025).
  63. Chen, X.; Zhang, J.E.; Xiang, H.M.; Wei, H. Study on the changing trend of acid rain in Guangdong Province from 2008 to 2018. Ecol. Environ. Sci. 2020, 29, 1198–1204. [Google Scholar] [CrossRef]
  64. Chen, Y.R.; Wang, Q.F.; Zhu, J.X.; Yang, M.; Hao, T.X.; Zhang, Q.Y.; Xi, Y.; Yu, G.R. Multi-elemental stoichiometric ratios of atmospheric wet deposition in Chinese terrestrial ecosystems. Environ. Res. 2024, 245, 117987. [Google Scholar] [CrossRef] [PubMed]
  65. Fu, H.; Luo, Z.B.; Hu, S.Y. A temporal-spatial analysis and future trends of ammonia emissions in China. Sci. Total Environ. 2020, 731, 138897. [Google Scholar] [CrossRef] [PubMed]
  66. Chen, Y.A.; Zhang, Q.R.; Cai, X.R.; Zhang, H.R.; Lin, H.M.; Zheng, C.Y.; Guo, Z.Q.; Hu, S.Y.; Chen, L.; Tao, S.; et al. Rapid increase in China’s industrial ammonia emissions: Evidence from unit-based mapping. Environ. Sci. Technol. 2022, 56, 3375–3385. [Google Scholar] [CrossRef] [PubMed]
  67. Mgelwa, A.S.; Song, L.; Fan, M.; Li, Z.J.; Zhang, Y.L.; Chang, Y.H.; Pan, Y.P.; Gurmesa, G.A.; Liu, D.W.; Huang, S.N.; et al. Isotopic imprints of aerosol ammonium over the north China plain. Environ. Pollut. 2022, 315, 120376. [Google Scholar] [CrossRef] [PubMed]
  68. Avila, A.; Aguillaume, L.; Izquieta-Rojano, S.; García-Gómez, H.; Elustondo, D.; Santamaría, J.M.; Alonso, R. Quantitative study on nitrogen deposition and canopy retention in Mediterranean evergreen forests. Environ. Sci. Pollut. Res. 2017, 24, 26213–26226. [Google Scholar] [CrossRef] [PubMed]
  69. Zhang, Z.M.; Peng, J.; Xu, Z.H.; Wang, X.Y.; Meersmans, J. Ecosystem services supply and demand response to urbanization: A case study of the Pearl River Delta, China. Ecosyst. Serv. 2021, 49, 101274. [Google Scholar] [CrossRef]
  70. Fan, S.J.; Fan, Q.; Yu, W.; Luo, X.Y.; Wang, B.M.; Song, L.L.; Leong, K.L. Atmospheric boundary layer characteristics over the Pearl River Delta, China, during the summer of 2006: Measurement and model results. Atmos. Chem. Phys. 2011, 11, 6297–6310. [Google Scholar] [CrossRef]
  71. Huang, Z.Q.; Fu, J.Y.; Liu, B.J.; Zhao, X.F.; Zhang, Y.; Wang, X.F. Acid rain prediction in the Guangdong-Hong Kong-Macao Greater Bay Area using an explainable machine learning framework. Atmos. Pollut. Res. 2024, 15, 102201. [Google Scholar] [CrossRef]
  72. Szép, R.; Bodor, Z.; Miklóssy, I.; Nită, I.-A.; Oprea, O.A.; Keresztesi, Á. Influence of peat fires on the rainwater chemistry in intra-mountain basins with specific atmospheric circulations (Eastern Carpathians, Romania). Sci. Total Environ. 2019, 647, 275–289. [Google Scholar] [CrossRef] [PubMed]
  73. Sun, R.; Jin, X.B.; Han, B.; Liang, X.Y.; Zhang, X.L.; Zhou, Y.K. Does scale matter? Analysis and measurement of ecosystem service supply and demand status based on ecological unit. Environ. Impact Asses. Rev. 2022, 95, 106785. [Google Scholar] [CrossRef]
  74. Huang, S.Z.; Gan, Y.; Zhang, X.; Chen, N.C.; Wang, C.; Gu, X.H.; Ma, J.J. Urbanization amplified asymmetrical changes of rainfall and exacerbated drought: Analysis over five urban agglomerations in the Yangtze River Basin, China. Earth’s Future 2023, 11, e2022EF003117. [Google Scholar] [CrossRef]
  75. Wu, Y.Q.; Zhou, C.Y.; Lai, X.Y.; Li, Y.H.; Miao, L.T.; Yu, H.F. Spatio-temporal characteristics and decoupling relationship of new-type urbanization and carbon emissions at the county Level: A case study of Zhejiang Province, China. Ecol. Indic. 2024, 160, 111793. [Google Scholar] [CrossRef]
  76. Karmellos, M.; Kosmadakis, V.; Dimas, P.; Tsakanikas, A.; Fylaktos, N.; Taliotis, C.; Zachariadis, T. A decomposition and decoupling analysis of carbon dioxide emissions from electricity generation: Evidence from the EU-27 and the UK. Energy 2021, 231, 120861. [Google Scholar] [CrossRef]
  77. Raza, M.Y.; Wu, R.X.; Lin, B.Q. A decoupling process of Pakistan’s agriculture sector: Insights from energy and economic perspectives. Energy 2023, 263, 125658. [Google Scholar] [CrossRef]
  78. Sun, D.Y.; Wang, X.X.; Yu, M.L.; Ouyang, Z.L.; Liu, G. Dynamic evolution and decoupling analysis of agricultural nonpoint source pollution in Taihu Lake Basin during the urbanization process. Environ. Impact Asses. Rev. 2023, 100, 107048. [Google Scholar] [CrossRef]
  79. Ouyang, Z.Y.; Zheng, H.; Xiao, Y.; Polasky, S.; Liu, J.G.; Xu, W.H.; Wang, Q.; Zhang, L.; Xiao, Y.; Rao, E.M.; et al. Improvements in ecosystem services from investments in natural capital. Science 2016, 352, 1455–1459. [Google Scholar] [CrossRef] [PubMed]
  80. Da, C.; Gu, X.Y.; Lu, C.C.; Hua, R.Q.; Chang, X.Y.; Cheng, Y.Y.; Qian, F.Y.; Wang, Y.H. Greenhouse gas emission benefits of adopting new energy vehicles in Suzhou City, China: A case study. Environ. Sci. Pollut. Res. 2022, 29, 76286–76297. [Google Scholar] [CrossRef] [PubMed]
  81. Kong, J.W.; Gao, M.X.; Deusen, D. Evaluating landscape ecological risk through Supply-Demand balance in ecosystem services: Evidence from China. Ecol. Indic. 2025, 173, 113355. [Google Scholar] [CrossRef]
Figure 1. Geographic location (a), land use (b), elevation, and monitoring station distribution (c) of the PRD.
Remotesensing 18 02391 g001
Figure 2. The flowchart of this study.
Remotesensing 18 02391 g002
Figure 3. Temporal variation trends of the precipitation ion concentration in the PRD from 2000 to 2020.
Remotesensing 18 02391 g003
Figure 4. Spatial pattern and significance test (p < 0.05) of major ion concentration in precipitation in the PRD at different stages ((a,d,g,j): 2000–2020; (b,e,h,k): 2000–2008; (c,f,i,l): 2009–2020).
Remotesensing 18 02391 g004
Figure 5. Spatial autocorrelation of population density (POD, persons km−2), nighttime light (NTL), construction land proportion (CLP, %), composite urbanization indicator (CUI) in the PRD area from 2000 to 2020.
Remotesensing 18 02391 g005
Figure 6. Bivariate LISA cluster map of urbanization and precipitation ion concentration in the PRD area from 2000 to 2020.
Remotesensing 18 02391 g006
Figure 7. The explanatory power of four-dimensional urbanization for the variability in major ion concentrations—(a) SO42−, (b) NO3, (c) Ca2+, and (d) NH4+—in precipitation over the PRD. ***, **, and * represent p < 0.001, 0.01, and 0.05, respectively.
Remotesensing 18 02391 g007
Figure 8. The spatial distribution of synergies and trade-offs between precipitation ion concentration and nighttime light (NTL) and composite urbanization indicator (CUI) in the PRD from 2000 to 2020.
Remotesensing 18 02391 g008
Figure 9. The proportion of trade-offs and synergies (a) and decoupling (b) between PIC and UF in the PRD area from 2000 to 2020.
Remotesensing 18 02391 g009
Figure 10. The spatial distribution of 8 decoupling types between SO42−–NTL, NO3–CUI, Ca2+–NTL, and NH4+–NTL from 2000 to 2020.
Remotesensing 18 02391 g010
Disclaimer/Publisher’s Note: The statements, opinions and data contained in all publications are solely those of the individual author(s) and contributor(s) and not of MDPI and/or the editor(s). MDPI and/or the editor(s) disclaim responsibility for any injury to people or property resulting from any ideas, methods, instructions or products referred to in the content.