Article

Surface Heat Source Variations and Driving Factors in Typical Permafrost Areas of the Tibetan Plateau


1
State Key Laboratory of Cryospheric Science and Frozen Soil Engineering, Cryosphere Research Station on the Qinghai-Tibet Plateau, Northwest Institute of Eco-Environment and Resources, Chinese Academy of Sciences, Lanzhou 730000, China
2
University of Chinese Academy of Sciences, Beijing 100049, China
3
Naqu Plateau Climate and Environment Observation and Research Station of Tibet Autonomous Region, State Key Laboratory of Cryospheric Science and Frozen Soil Engineering, Northwest Institute of Eco-Environment and Resources, Chinese Academy of Sciences, Lanzhou 730000, China
4
School of Geographical Sciences, Nanjing University of Information Science & Technology (NUIST), Nanjing 210044, China
*
Author to whom correspondence should be addressed.
These authors contributed equally to this work.
Remote Sens. 2026, 18(14), 2312; https://doi.org/10.3390/rs18142312
Submission received: 31 March 2026 / Revised: 16 June 2026 / Accepted: 6 July 2026 / Published: 10 July 2026

Highlights

What are the main findings?
  • The surface heat source in the isolated permafrost area remained relatively stable, whereas that in the continuous permafrost area increased significantly.
  • The proportions of sensible heat and latent heat fluxes in surface heat source varied with the season.
  • Soil temperature, downward shortwave radiation and albedo were the dominant contributors to surface heat source in the machine learning simulation.
What are the implications of the main findings?
  • Increasing surface heat source in the continuous permafrost area will impact the atmosphere and merit attention in climate warming studies.
  • Intense winter snow cover events exert impacts on land–atmosphere interactions of the next year and should be fully considered in climate forecasting.

Abstract

Surface heat sources play a critical role in shaping meteorological conditions and permafrost dynamics on the Tibetan Plateau. To better understand surface heat source variability in the permafrost region, multiyear observational data from an isolated permafrost site and a continuous permafrost site were used to analyse the variability. The results indicated that the surface heat source at the isolated permafrost site remained relatively stable, whereas that at the continuous permafrost site increased significantly, at a rate of approximately 2.2 Wm−2yr−1. The proportions of sensible and latent heat fluxes in the surface heat source budget varied with the season. Overall, the proportion of latent heat flux was greater than that of sensible heat flux in summer and autumn, whereas the proportion of sensible heat flux was greater than that of latent heat flux in winter and spring. The peak proportion for both fluxes exceeded 80%. A random forest model effectively captured the variations in the surface heat source. And the machine learning simulation indicated that soil temperature, downward shortwave radiation and albedo were identified as major contributors to the surface heat source, collectively accounting for more than 88% of the overall variability at both sites. The impacts of snow cover on the surface heat source varied with intensity. The increasing trend of the surface heat source was closely related to climate warming in autumn and winter. A significant but weak positive correlation was observed between vegetation and the surface heat source.

1. Introduction

The Tibetan Plateau, renowned as the Water Tower of Asia, is the world’s highest plateau [1,2]. Its high altitude and unique topography result in exceptional land-surface heating conditions, which profoundly influence the regional climate [3]. The surface heat source of the Tibetan Plateau is therefore a central topic in meteorological research [4]. It plays a crucial role in driving the development and maintenance of the Asian summer monsoon system [5], and its intensity modulates the strength of the monsoon and consequently affects the transport of water vapour from the Indian Ocean to inland China [6]. Furthermore, the surface heat source is intrinsically linked to the land-surface energy balance, thereby governing the thermal regime and stability of permafrost [7,8] and indirectly influencing regional hydrological cycles and ecosystem functions [9]. Given these wide-ranging impacts, observational and mechanistic studies of the surface heat source in this region are of substantial scientific importance.
A surface heat source, historically referred to as a surface heating field [3], is defined as the residual of net radiation minus surface soil heat flux, which is equal to the sum of sensible and latent heat fluxes [3,10,11,12,13,14]. Research has indicated that an anomalous winter surface heat source can trigger not only abnormalities in atmospheric circulation but also changes in precipitation in spring and summer in China [3,15]. The surface heat source in summer is positively correlated with the generation frequency of the Tibetan Plateau Vortex and is associated with catastrophic weather [13]. It also affects vegetation growth on the plateau and is thus significantly positively correlated with aboveground biomass [14]. Studies have focused on analysing changes in sensible and latent heat fluxes that constitute the surface heat source to evaluate its overall balance [10,11,12,16]. In studies of the surface energy closure ratio (ECR), the surface heat source was considered surface available energy and constituted an essential element in the calculation [16,17,18,19,20].
Currently, regional analyses of surface heat sources on the Tibetan Plateau rely primarily on reanalysis data, remote sensing data, and numerical models for calculation, evaluation, and trend analysis. However, significant biases and uncertainties persist in the results when validated against in situ observations [1,10,11]. Site observation data are widely considered the most accurate source and serve as the foundation for validating remote sensing and numerical models; however, in situ observation research on the Tibetan Plateau has focused largely on the surface energy balance and exchange processes [1,21,22,23,24]. Analyses of long-term time series of surface heat source data from site observations remain insufficient. This issue requires further attention, especially within the context of global warming.
To better understand surface heat source variations on the Tibetan Plateau, multiyear monitoring data from observation sites located in sporadic and continuous permafrost regions were analysed, and the corresponding influential factors were investigated.

2. Materials and Methods

2.1. Study Site

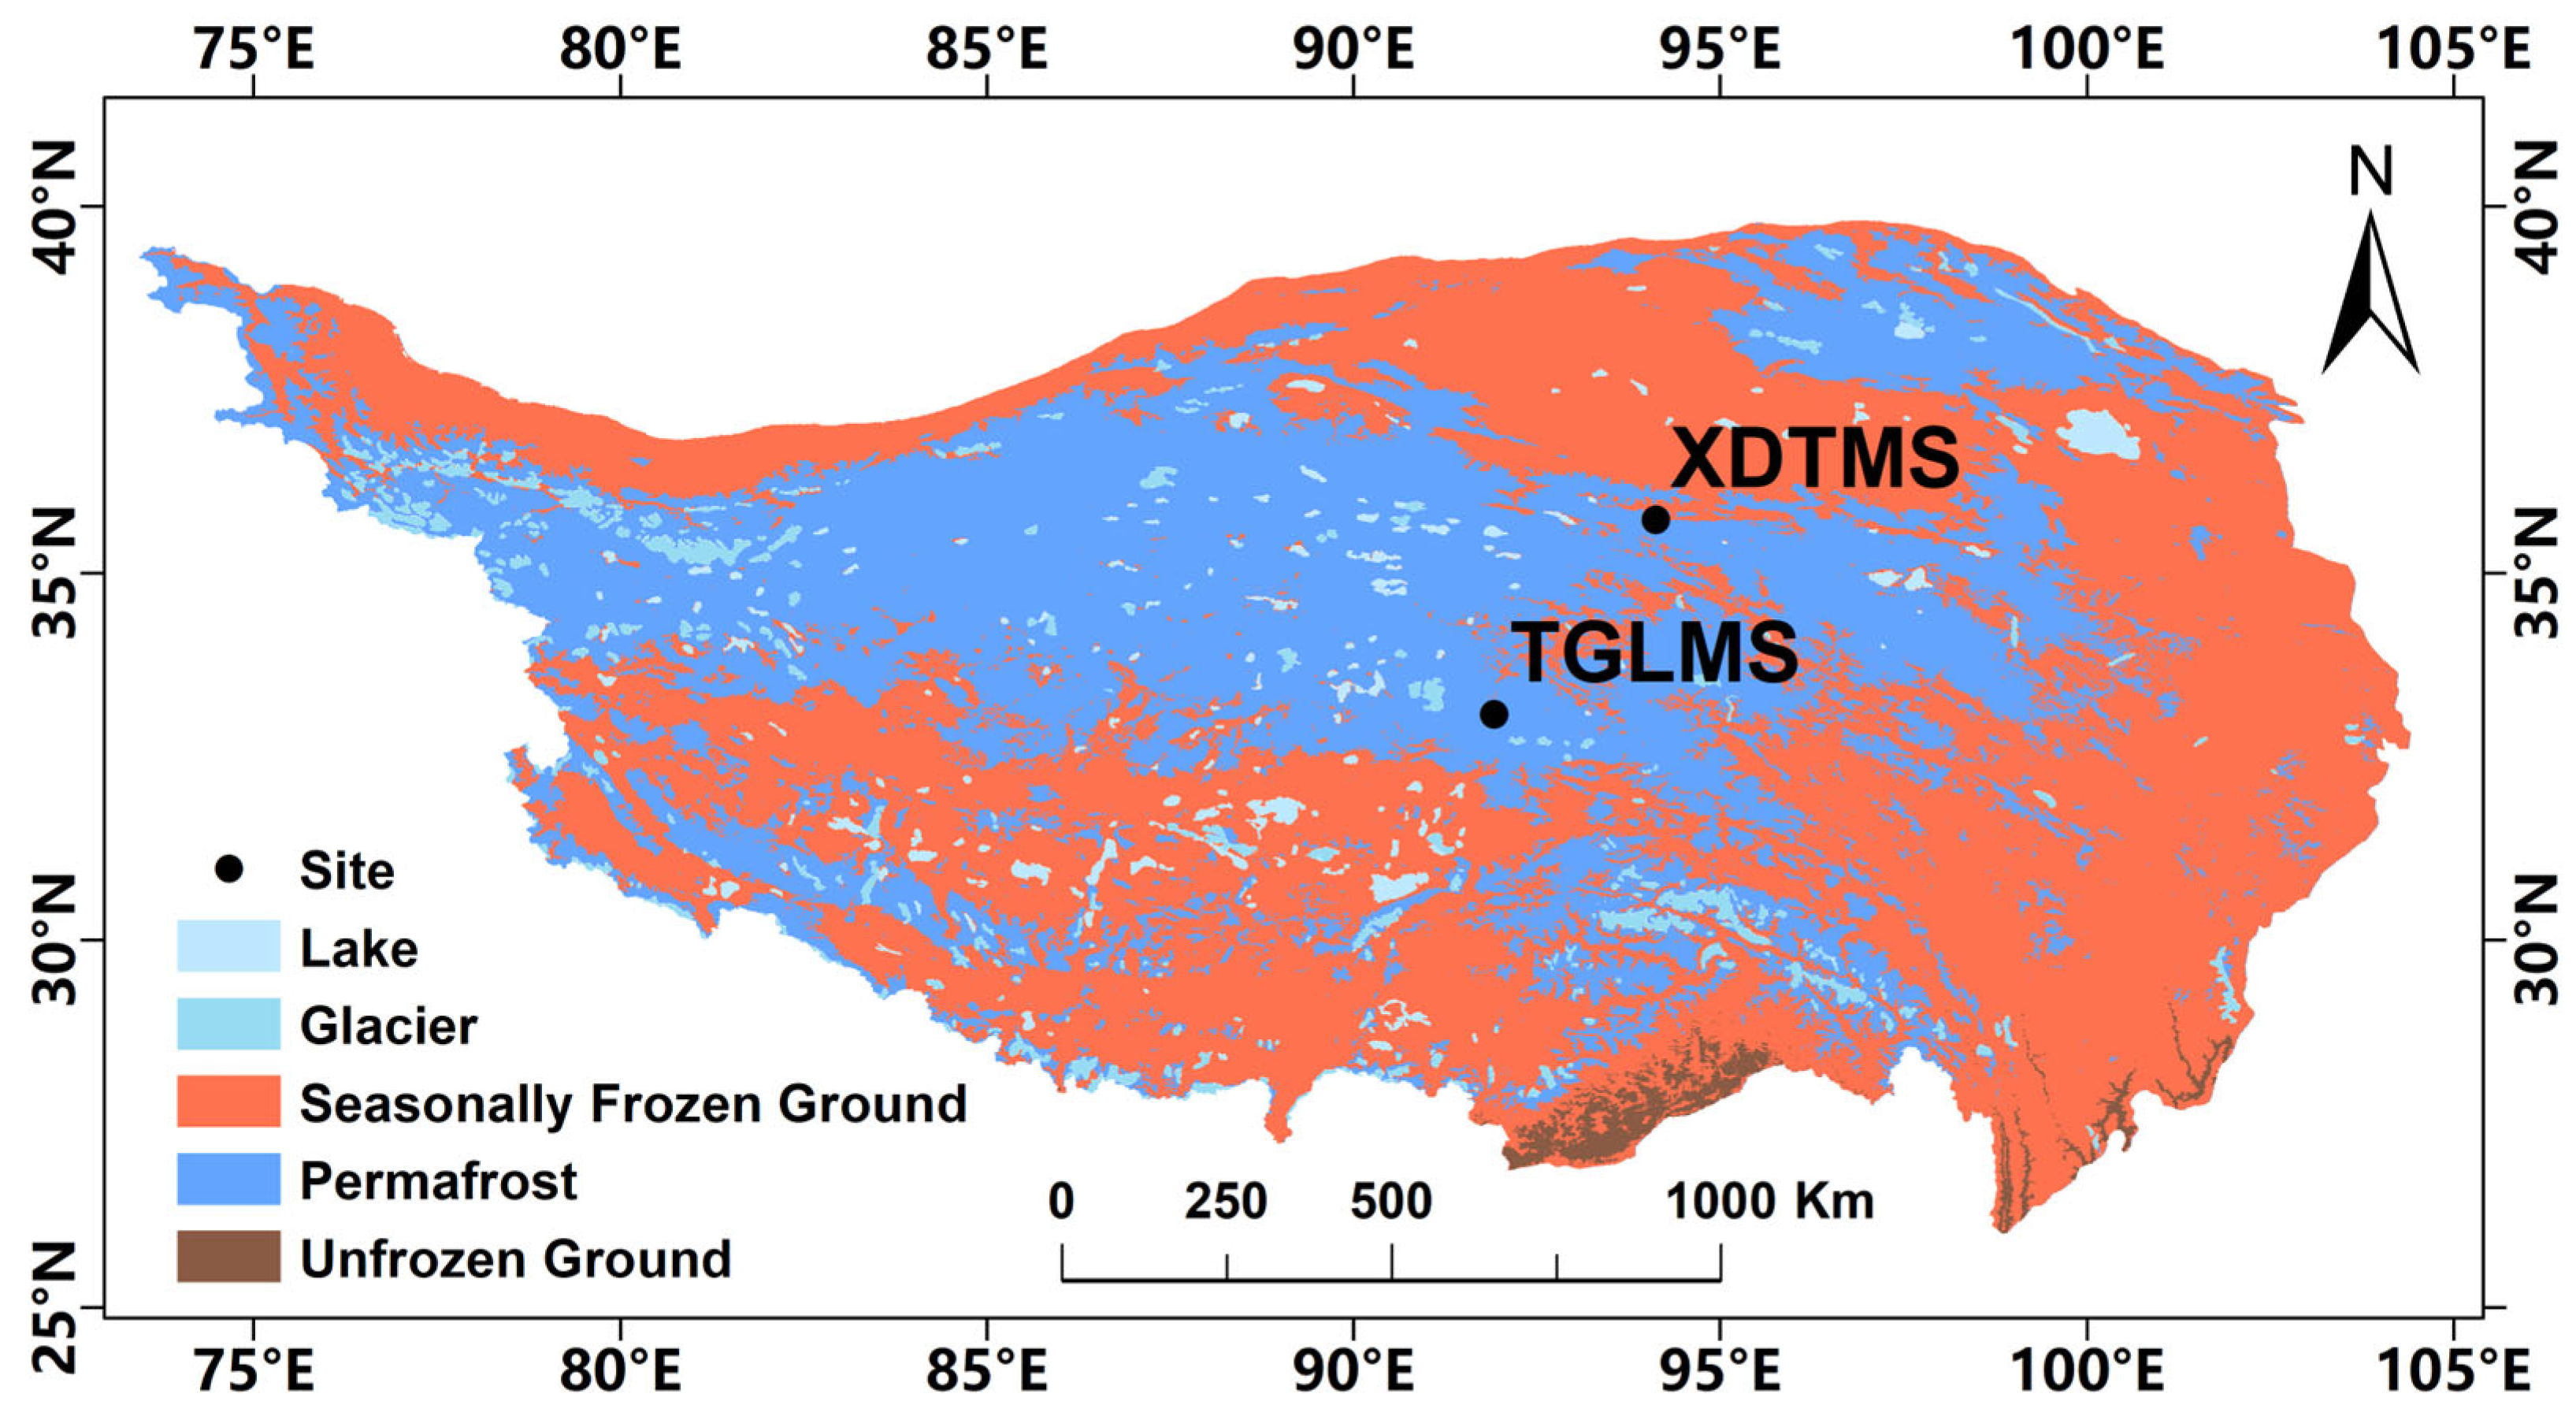
In this work, data from two observation sites in the permafrost region of the Tibetan Plateau, namely, XDTMS and TGLMS, were analysed (Figure 1). The XDTMS site (94°08′E, 35°43′N, and 4538 m above sea level (a.s.l.)) is situated at the northern boundary of the permafrost region. The underlying surface, characterized by isolated permafrost [25], is sensitive to climate warming. The area features alpine meadow vegetation, with an average annual air temperature of approximately −3.6 °C and an annual precipitation of approximately 410 mm, more than 80% of which occurs from May to October because of monsoon influences. The active layer thickness is approximately 1.5 m.
The TGLMS site (91°56′E, 33°04′N, and 5100 m a.s.l.) is located in the continuous permafrost region of the Tibetan Plateau [25], indicating a relatively stable permafrost state. The vegetation is alpine grassland, which has developed from the degradation of alpine meadows. The mean annual air temperature is approximately −4.7 °C lower than that at the XDTMS site because of its higher elevation. Influenced by the monsoon, precipitation is concentrated between May and October, with an annual total of approximately 400 mm, similar to that at XDTMS. The active layer thickness exceeds 3 m.

2.2. Measurements

Both sites functioned as comprehensive meteorological observation fields and were equipped with sensors for measuring the wind, air temperature, air humidity, soil moisture, soil temperature, soil heat flux, and precipitation. In addition, the observations included the four components of radiation and data from an eddy covariance system. Furthermore, the instrument models and configurations were essentially identical at both locations. Detailed information on the instrumentation is presented in Table 1. Observation at both sites began in 2004. On the basis of the quality and continuity of the observational data, we selected radiation data for the XDTMS site from 2004 to 2019, radiation data for the TGLMS site from 2004 to 2018, and soil hydrothermal data from 2004 to 2021.

2.3. Calculations

2.3.1. Surface Heat Source

The heating effect of the ground surface is related to the balance between the radiation and turbulence processes [12]. The equation is as follows:
R n = G 0 + H + L E
Then, the following relation can be obtained:
R n G 0 = H + L E
where Rn is the net radiation, G0 is the surface soil heat flux, H is the sensible heat flux and LE is the latent heat flux. The left side of the equation ( R n G 0 ) represents the surface heat source (Wm−2). In actual observations, when the energy system is closed, the right side of the equation ( H + L E ) also expresses the surface heat source. However, research has shown that the average surface ECR of eddy covariance observations on the Tibetan Plateau is 74.2 ± 5.4% [18] and that the data continuity of the meteorological tower is better than that of the eddy covariance system. Therefore, in this paper, the left side of the equation ( R n G 0 ) is used to calculate the surface heat source.

2.3.2. Net Radiation

The net radiation is derived using Equation (3) and is obtained from the four components of radiation as follows:
R n = R s d R s u + R l d R l u
where R s d is the downward shortwave radiation (Wm−2), R s u is the upward shortwave radiation (Wm−2), R l d is the downward longwave radiation (Wm−2) and R l u is the upward longwave radiation (Wm−2).

2.3.3. Surface Soil Heat Flux

The surface soil heat flux is estimated using the PlateCal approach. Using observations from soil heat flux plates, this method accounts for heat storage within shallow soil layers to derive G0 (Wm−2) [17]. The surface soil heat flux is calculated as follows:
G 0 = G s e n + z s e n z ρ s c s T ( z ) t d z
where G s e n is the soil heat flux at the sensor depth (Wm−2) and z s e n is the sensor depth (5 cm). T ( z ) is the soil temperature at 2 cm (K), t is the time, z is the depth (m), and ρ s c s is the soil heat capacity (Jm−3 K−1):
ρ s c s = ρ d r c d r ( 1 θ s a t ) + ρ w c w θ w + ρ i c i θ i
where ρ d r c d r is the dry soil heat capacity, for which we used the value from Yang and Wang [26], which is 2.1 × 10 6 (Jm−3K−1). θ s a t is the soil porosity; ρ w c w is the heat capacity of water ( 4.18 × 10 6 (Jm−3K−1)); θ w is the unfrozen water content of soil at 5 cm (m3m−3); and ρ i c i is the heat capacity of ice. The density of ice is approximately 920 kgm−3, and the specific heat capacity of ice is 2090 JKg−1K−1. Furthermore, ρ i c i = 920 × 2090 1.92 × 10 6 (Jm−3K−1). θ i is the soil ice content (m3m−3), and the variation in the ice content is approximated as follows [27]:
ρ i θ i T = ρ w θ w T
From Equation (6), the following equation can be obtained:
θ i = ρ w θ w ρ i
The ice content is estimated as follows:
θ i = θ i 1 + θ i
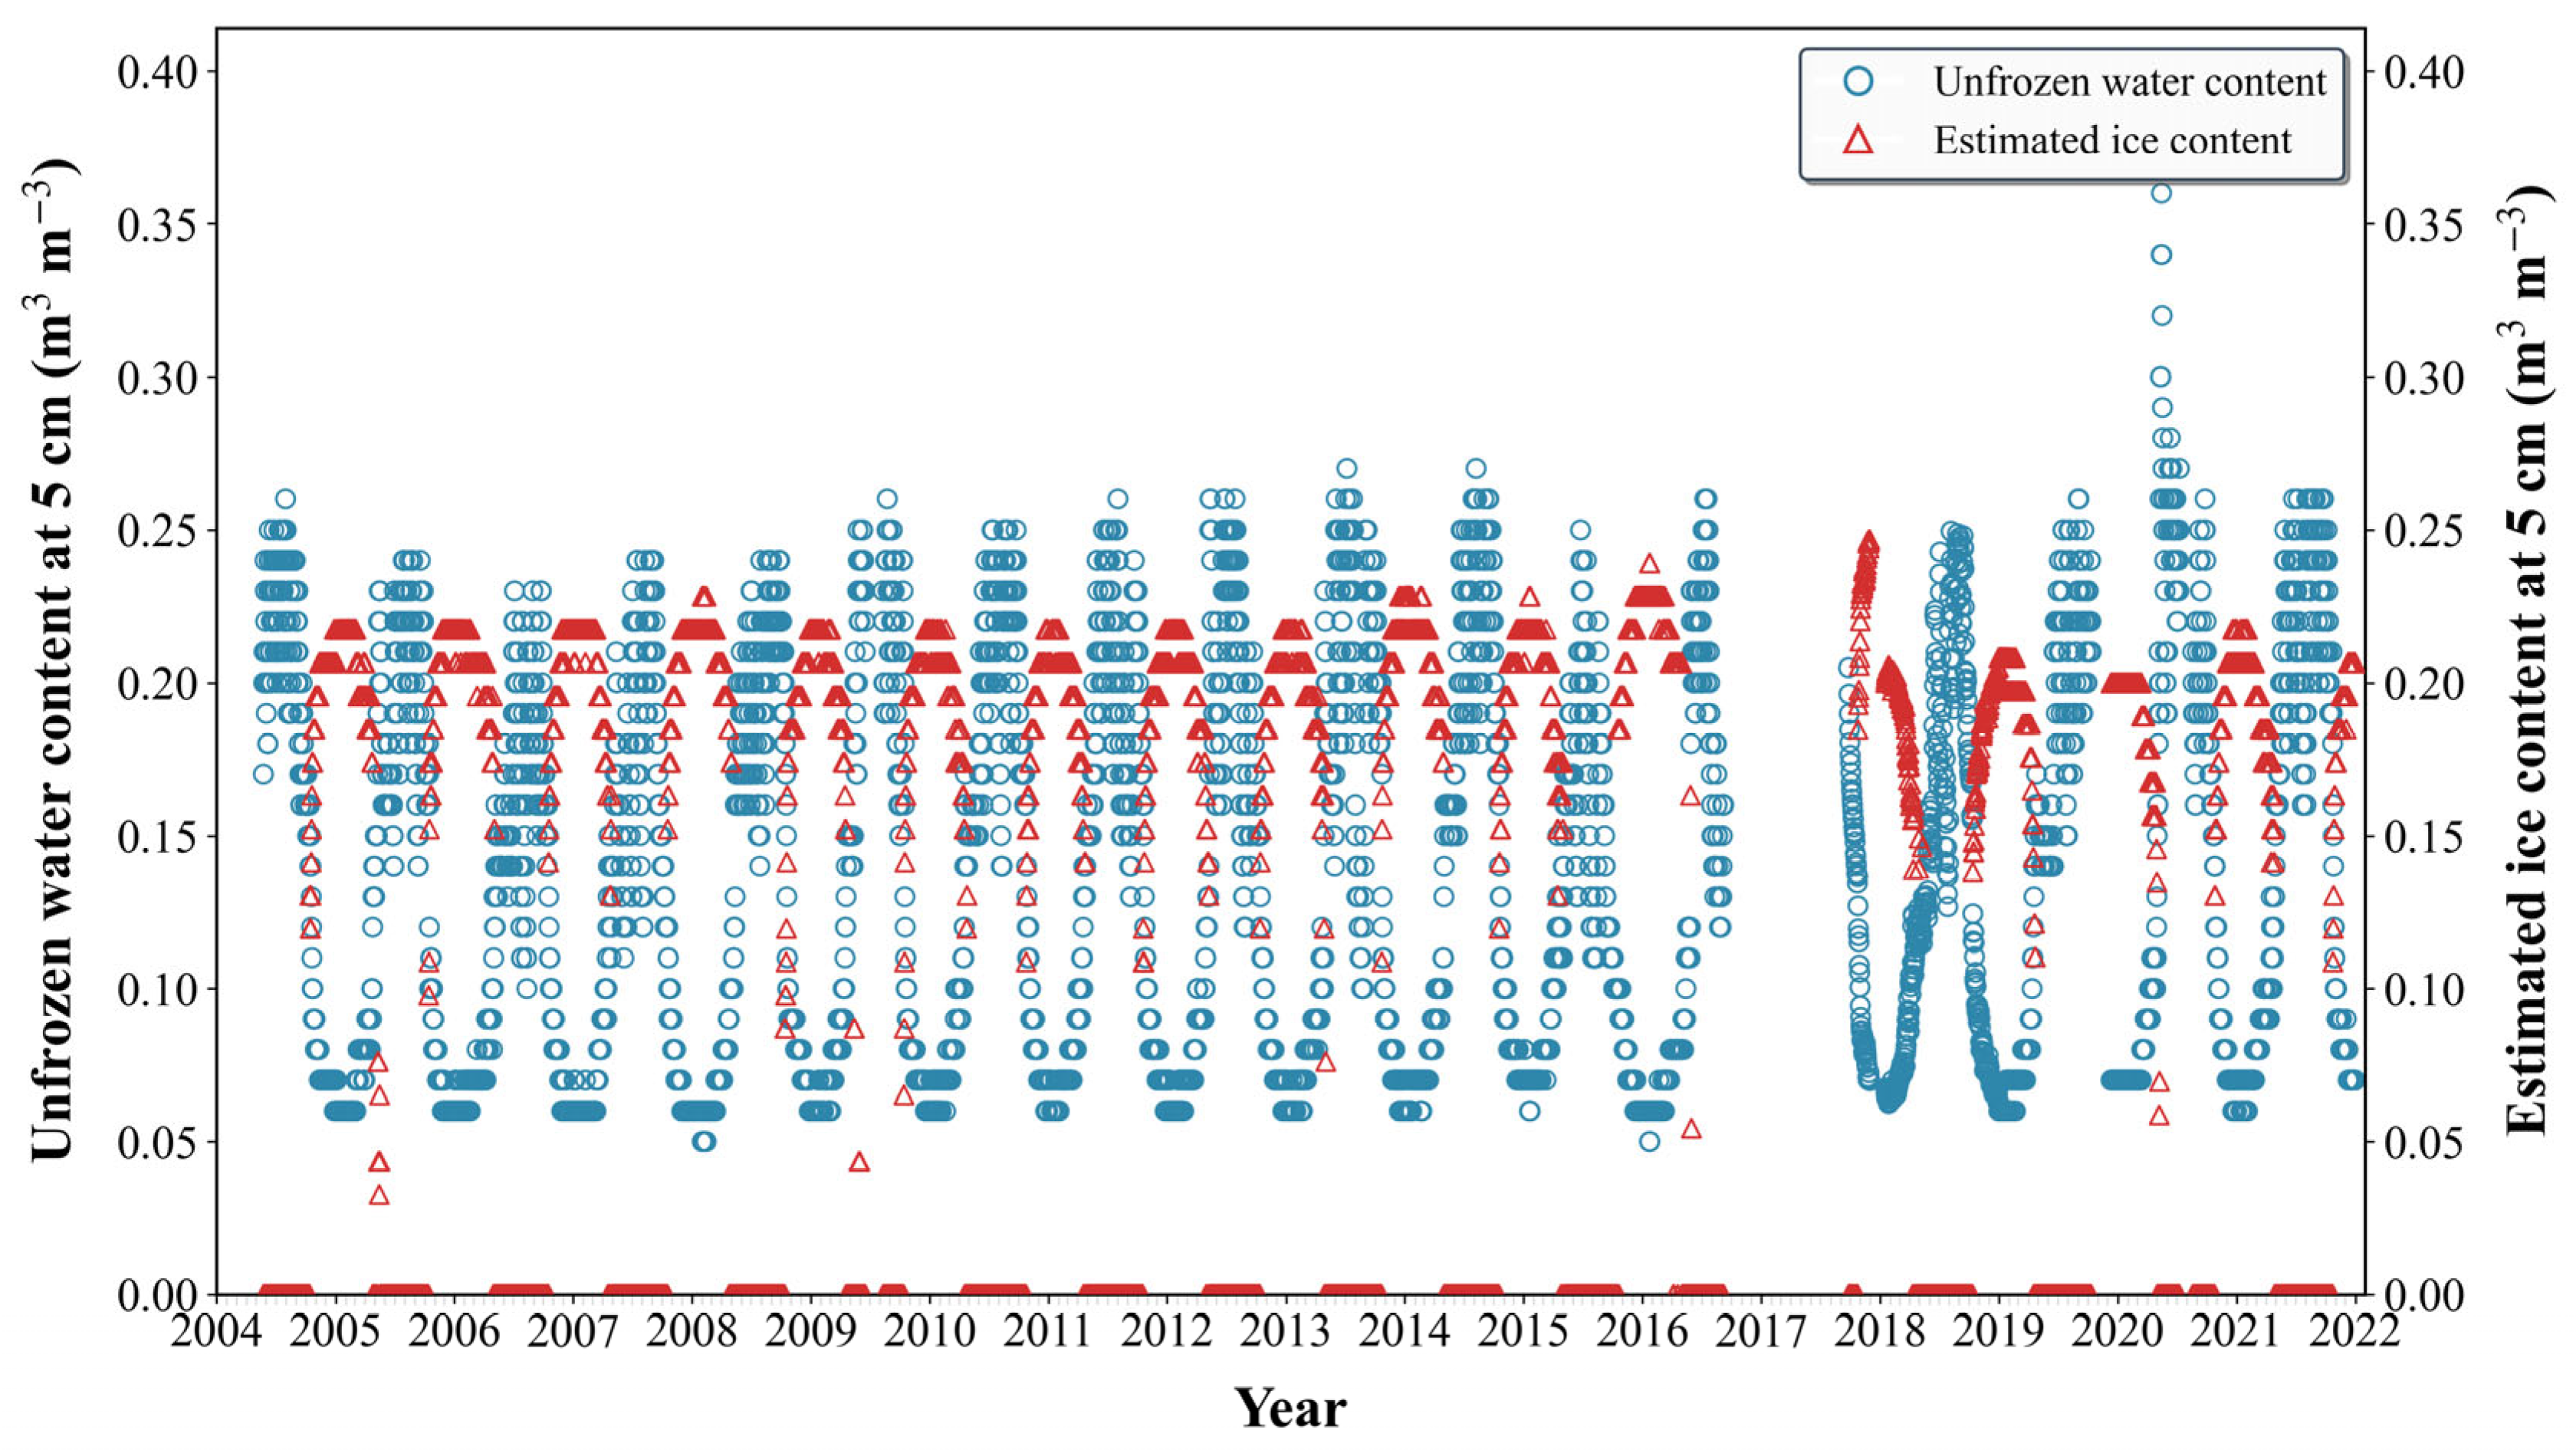
Notably, the starting date was 24 May 2004, and the shallow soil was thawed; thus, the initial value of the ice content was set to 0. After the calculation, the results were screened according to whether the soil temperature at 5 cm was less than 0 °C. The estimated ice content results are shown in Figure 2. The ice content and unfrozen water content alternate throughout the year; the ice content was 0 in summer, but it changed relatively consistently and was high in winter.

2.3.4. Turbulent Heat Fluxes

The sensible heat flux (H) and latent heat flux (LE) must be considered when analysing seasonal changes within a year. The corresponding data were obtained from eddy covariance systems, and these fluxes can be calculated as follows:
H = ρ C p w T ¯
L E = ρ L v w q ¯
The calculation involves several air-related variables: density   ρ (kg m−3), specific heat capacity Cp (J −1g−1 K−1), latent heat of water Lv−1(J kg−1), vertical wind velocit−1 w (m s−1), temperature T (K), and specific humidit−1 q (kg kg−1). The calculation window was 30 min. Data were processed using Edire (Version 6, University of Edinburgh, UK) and EddyPro (Version 6.2.1, LI-COR Biosciences, Lincoln, NE, USA).

3. Results

3.1. Interannual Variation Pattern

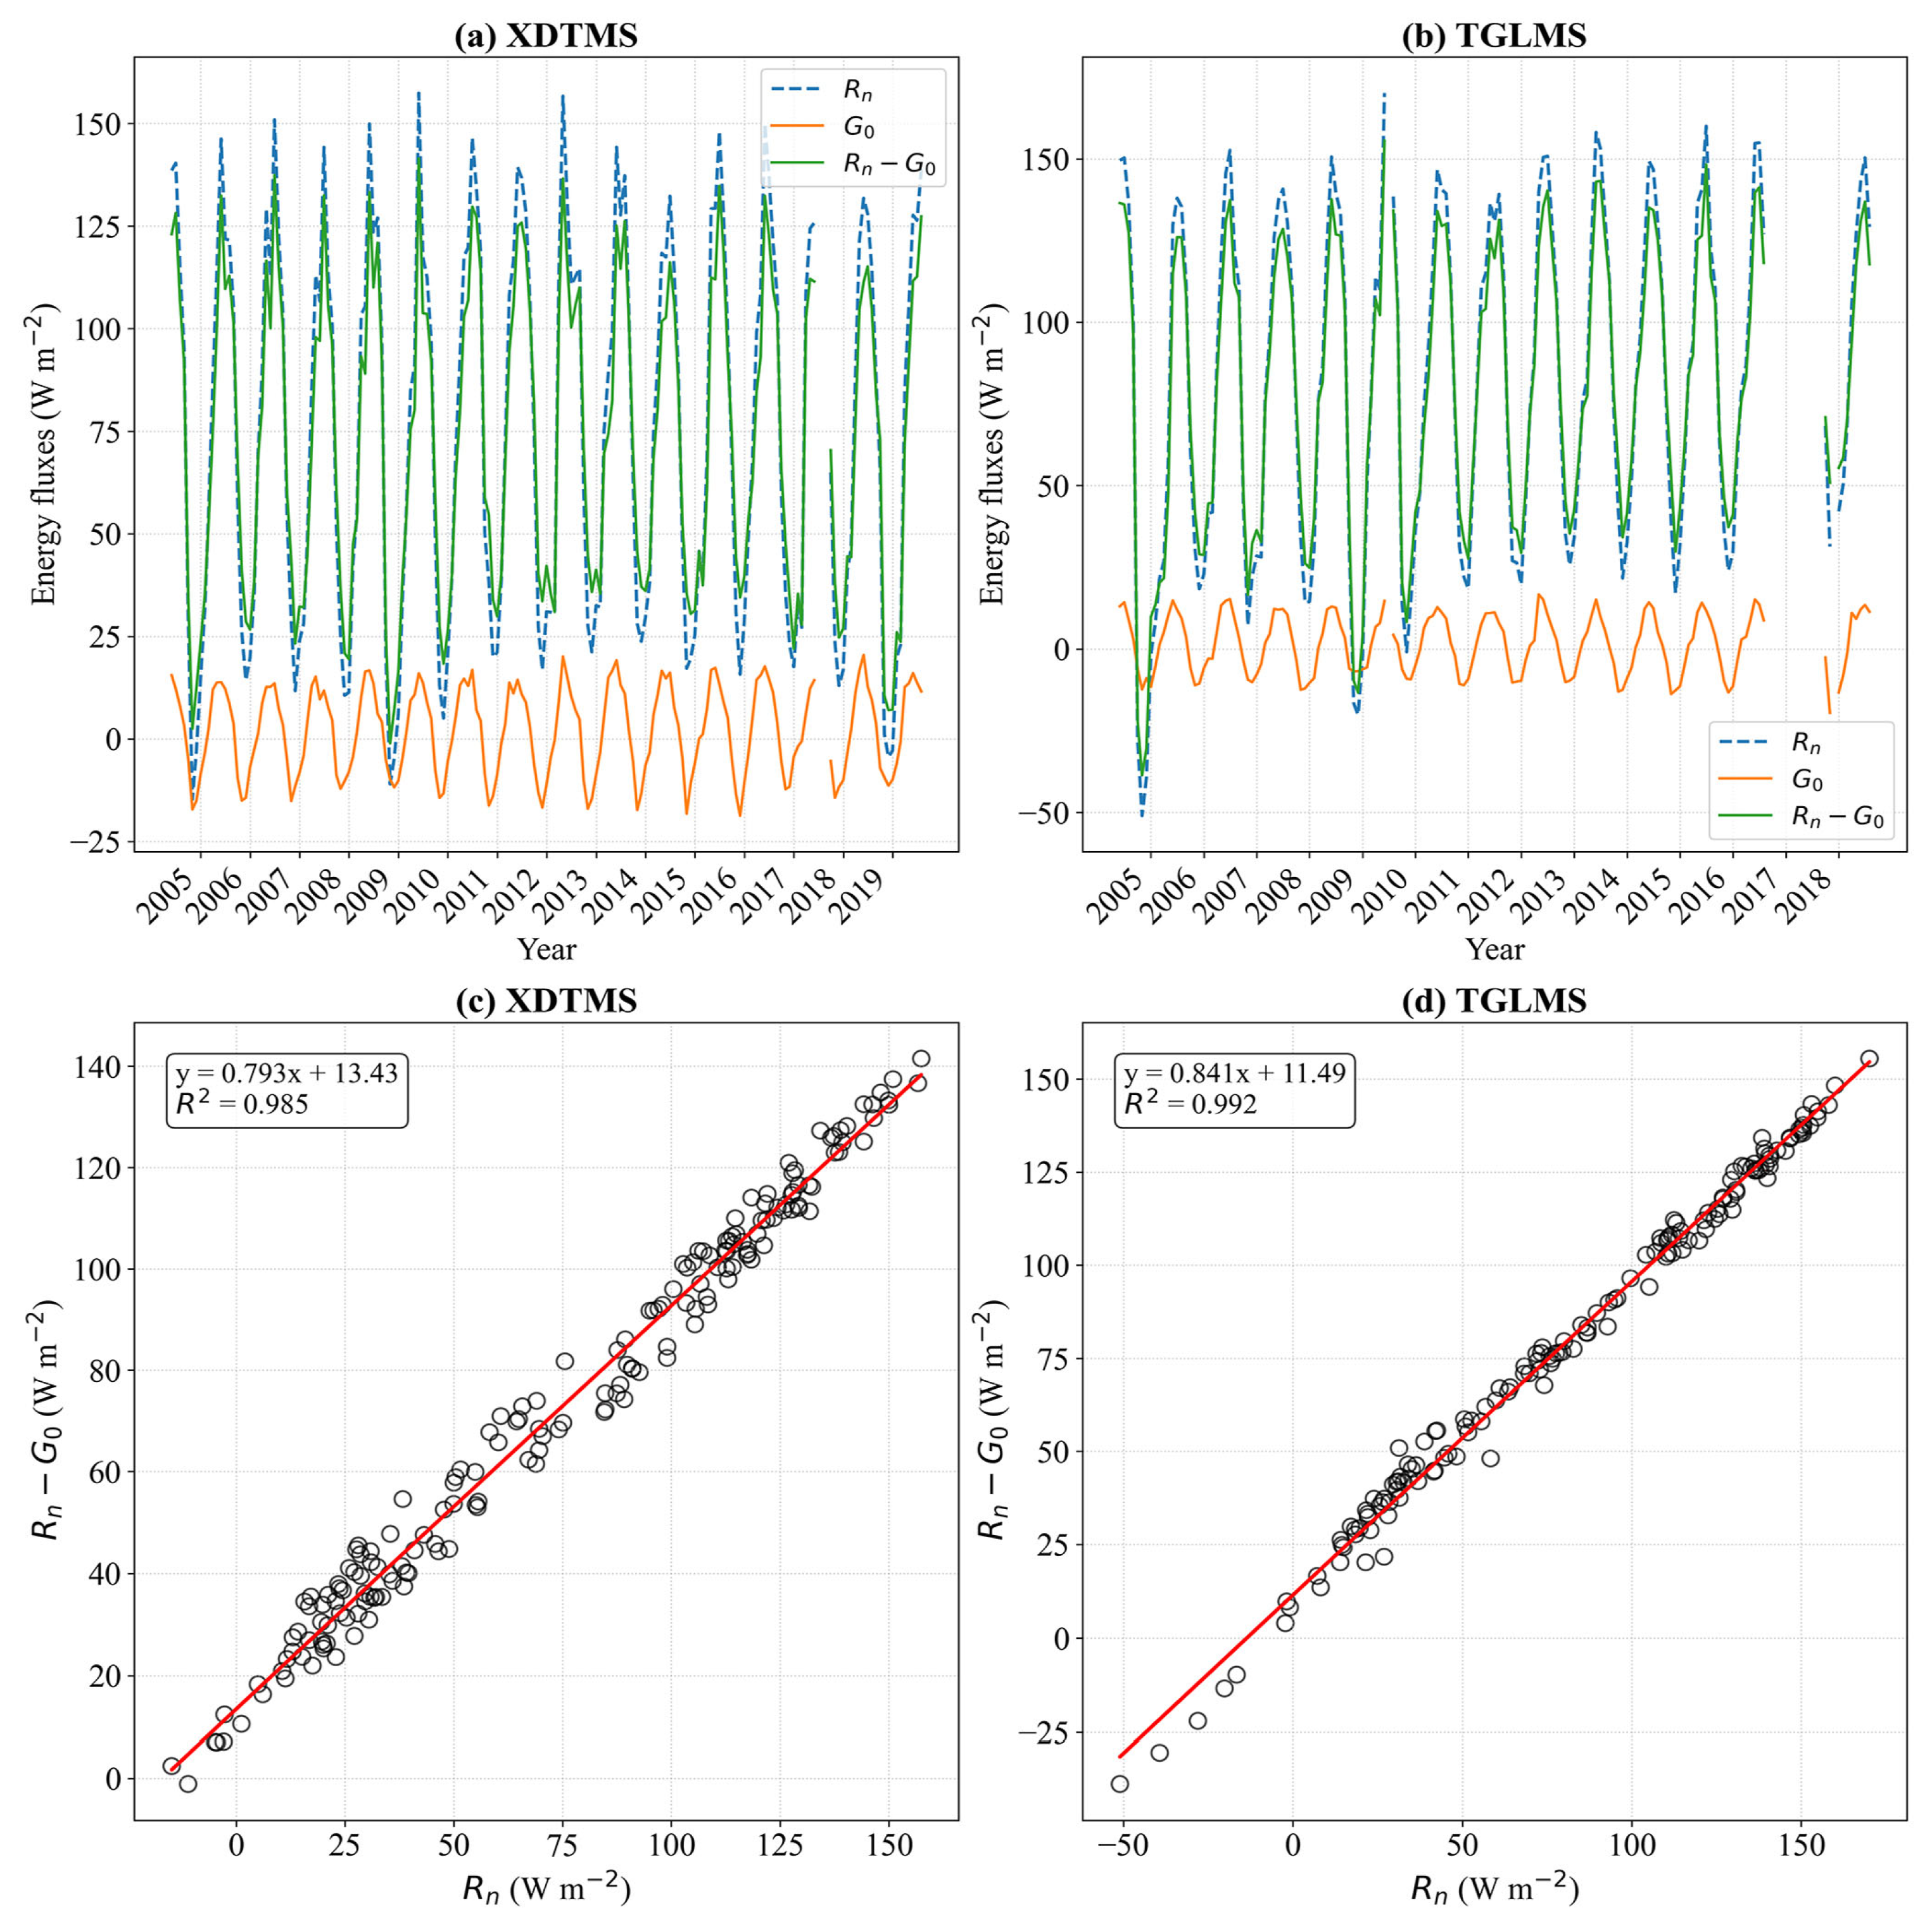
The results derived from the monthly averages are shown in Figure 3. Notably, the surface heat source was positive in most months and was governed primarily by net radiation. A strong linear correlation was observed between the net radiation (Rn) and surface heat source (RnG0), with R2 values exceeding 0.98.
At the XDTMS site, the net radiation did not significantly change. The surface soil heat flux fluctuated around zero, with high positive values in summer and low negative values in winter. These variations contributed to a relatively stable surface heat source at this site. By contrast, at the TGLMS site, the net radiation showed an increasing trend from 2004 to 2018. Although the variation in the surface soil heat flux was similar to that at the XDTMS site, the increase in net radiation increased the surface heat source. Notably, the increase in net radiation was not significant in summer but was pronounced in autumn and winter and primarily drove the annual upward trend. Consistent with the net radiation trend, the surface heat source also increased significantly in autumn and winter, resulting in an overall increase from 2004 to 2018 at the TGLMS site.
An analysis of the relationship between the surface heat source and net radiation (Figure 3) revealed that the rate of change at the XDTMS site was 0.79, which was lower than the value of 0.84 at the TGLMS site. This finding indicates that a greater proportion of net radiation entered the soil at the XDTMS site. The difference was associated with the contrasting underlying surface conditions at the two locations. The XDTMS site occurs in an isolated permafrost zone underlain by warm permafrost, whereas the TGLMS site is situated in a continuous permafrost region characterized by colder and more stable permafrost [25]. The below-ground water–heat processes at the XDTMS site were more intense. Furthermore, higher clay and silt contents were observed at the XDTMS site, corresponding to higher soil water retention and thermal conductivity [21]. These factors contributed to a greater proportion of net radiation being converted into soil heat flux and, correspondingly, a smaller proportion being converted into the surface heat source.
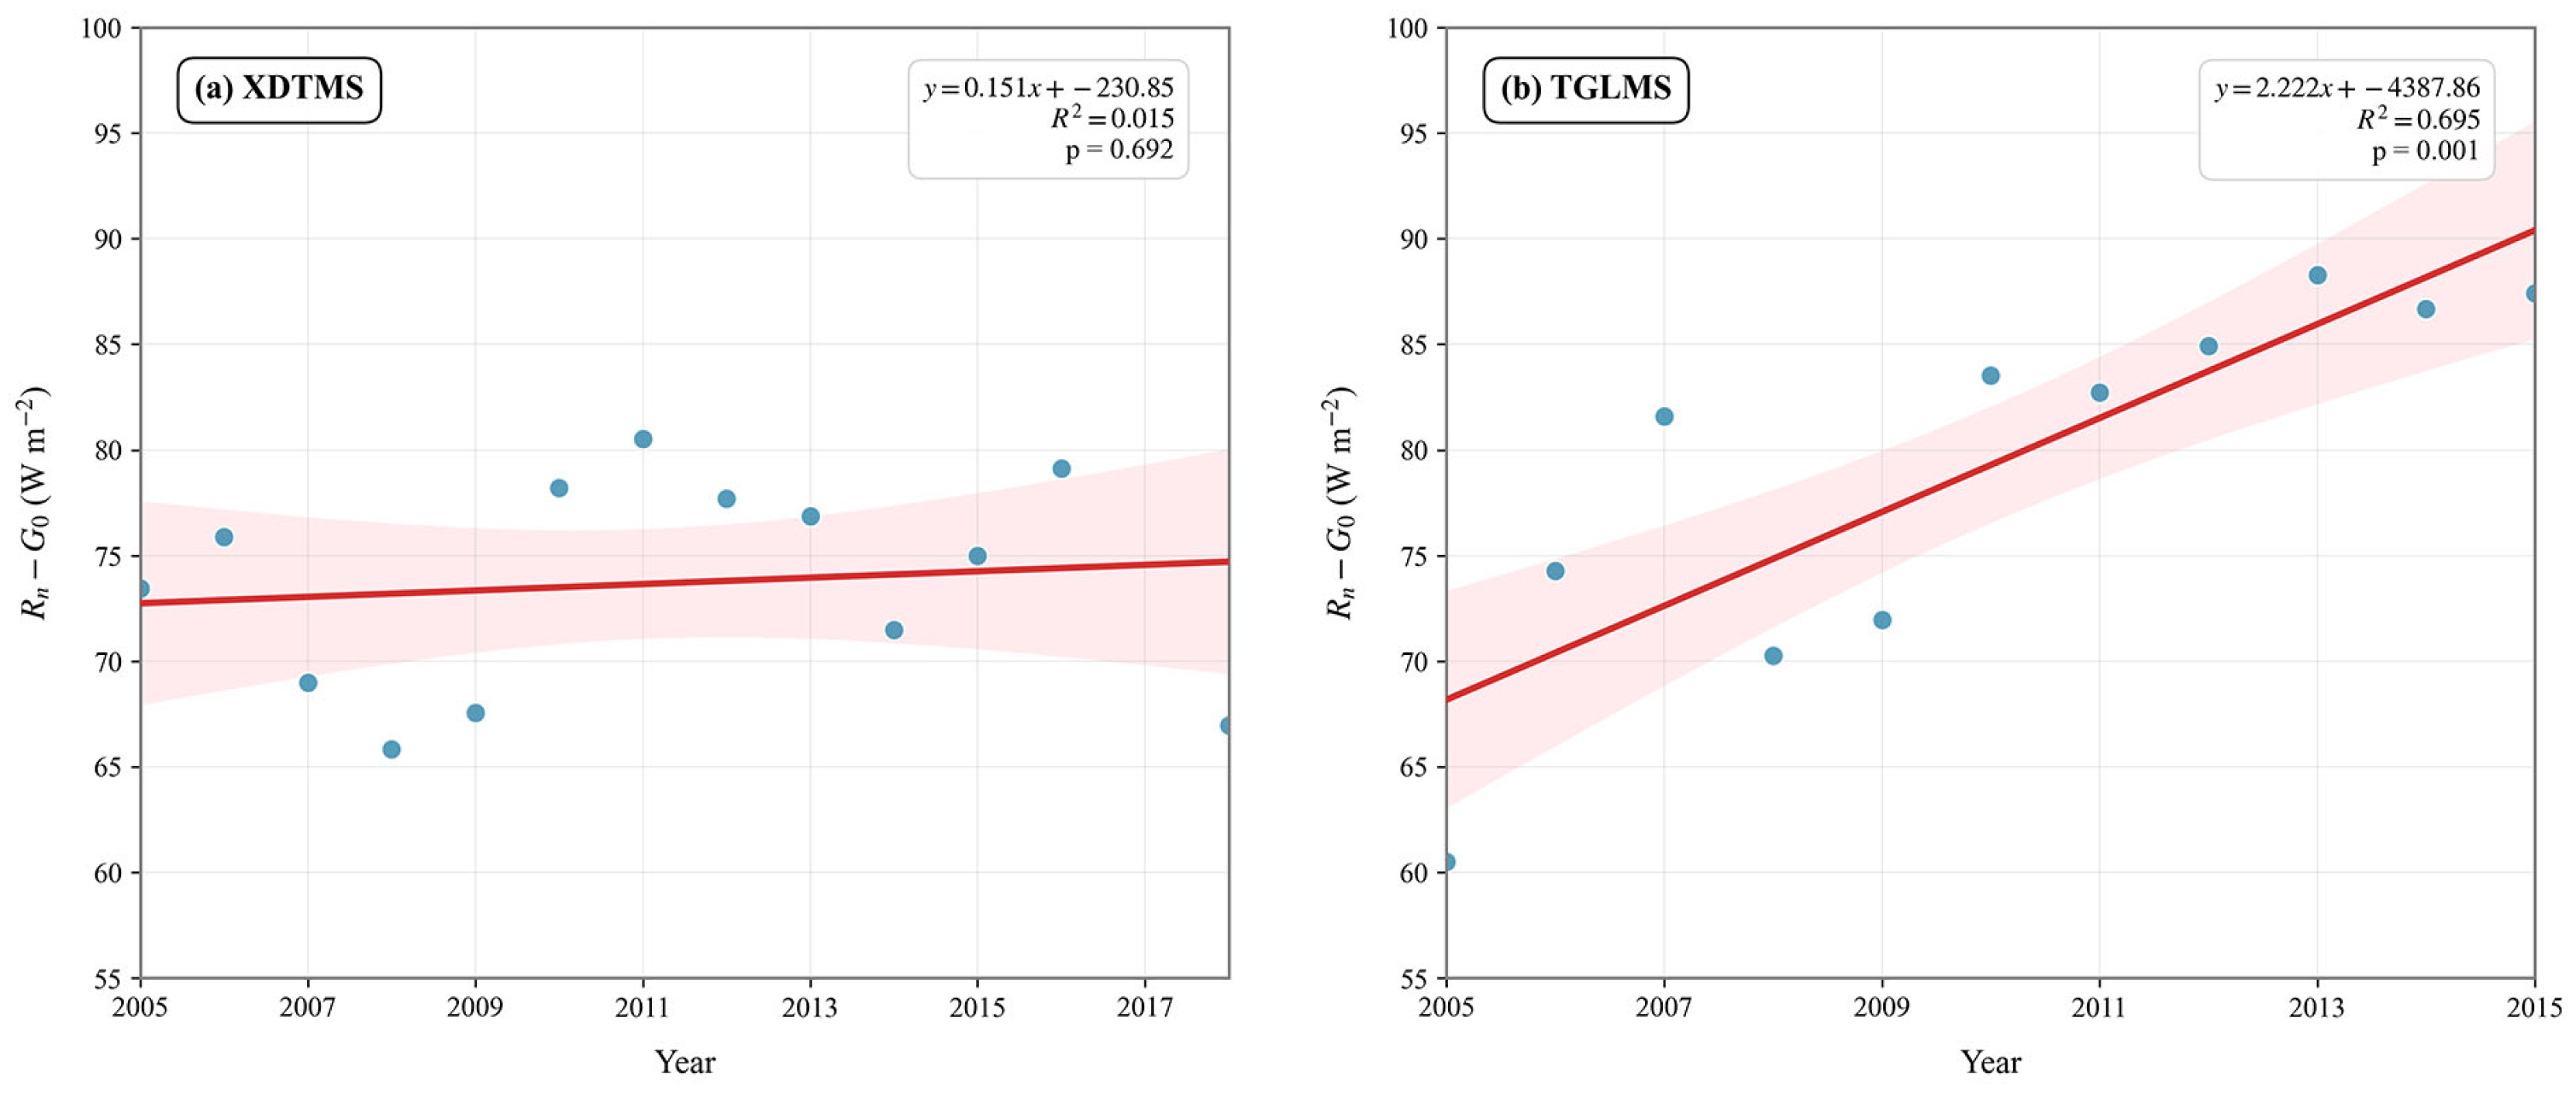
The interannual variability in the surface heat source is depicted in Figure 4. After seasonal cycles were removed, the surface heat source at the XDTMS site did not significantly change, whereas that at the TGLMS site significantly increased, with an average 2.2 W m−2 yr−1.

3.2. Evaluation of Intraseasonal Energy Allocation

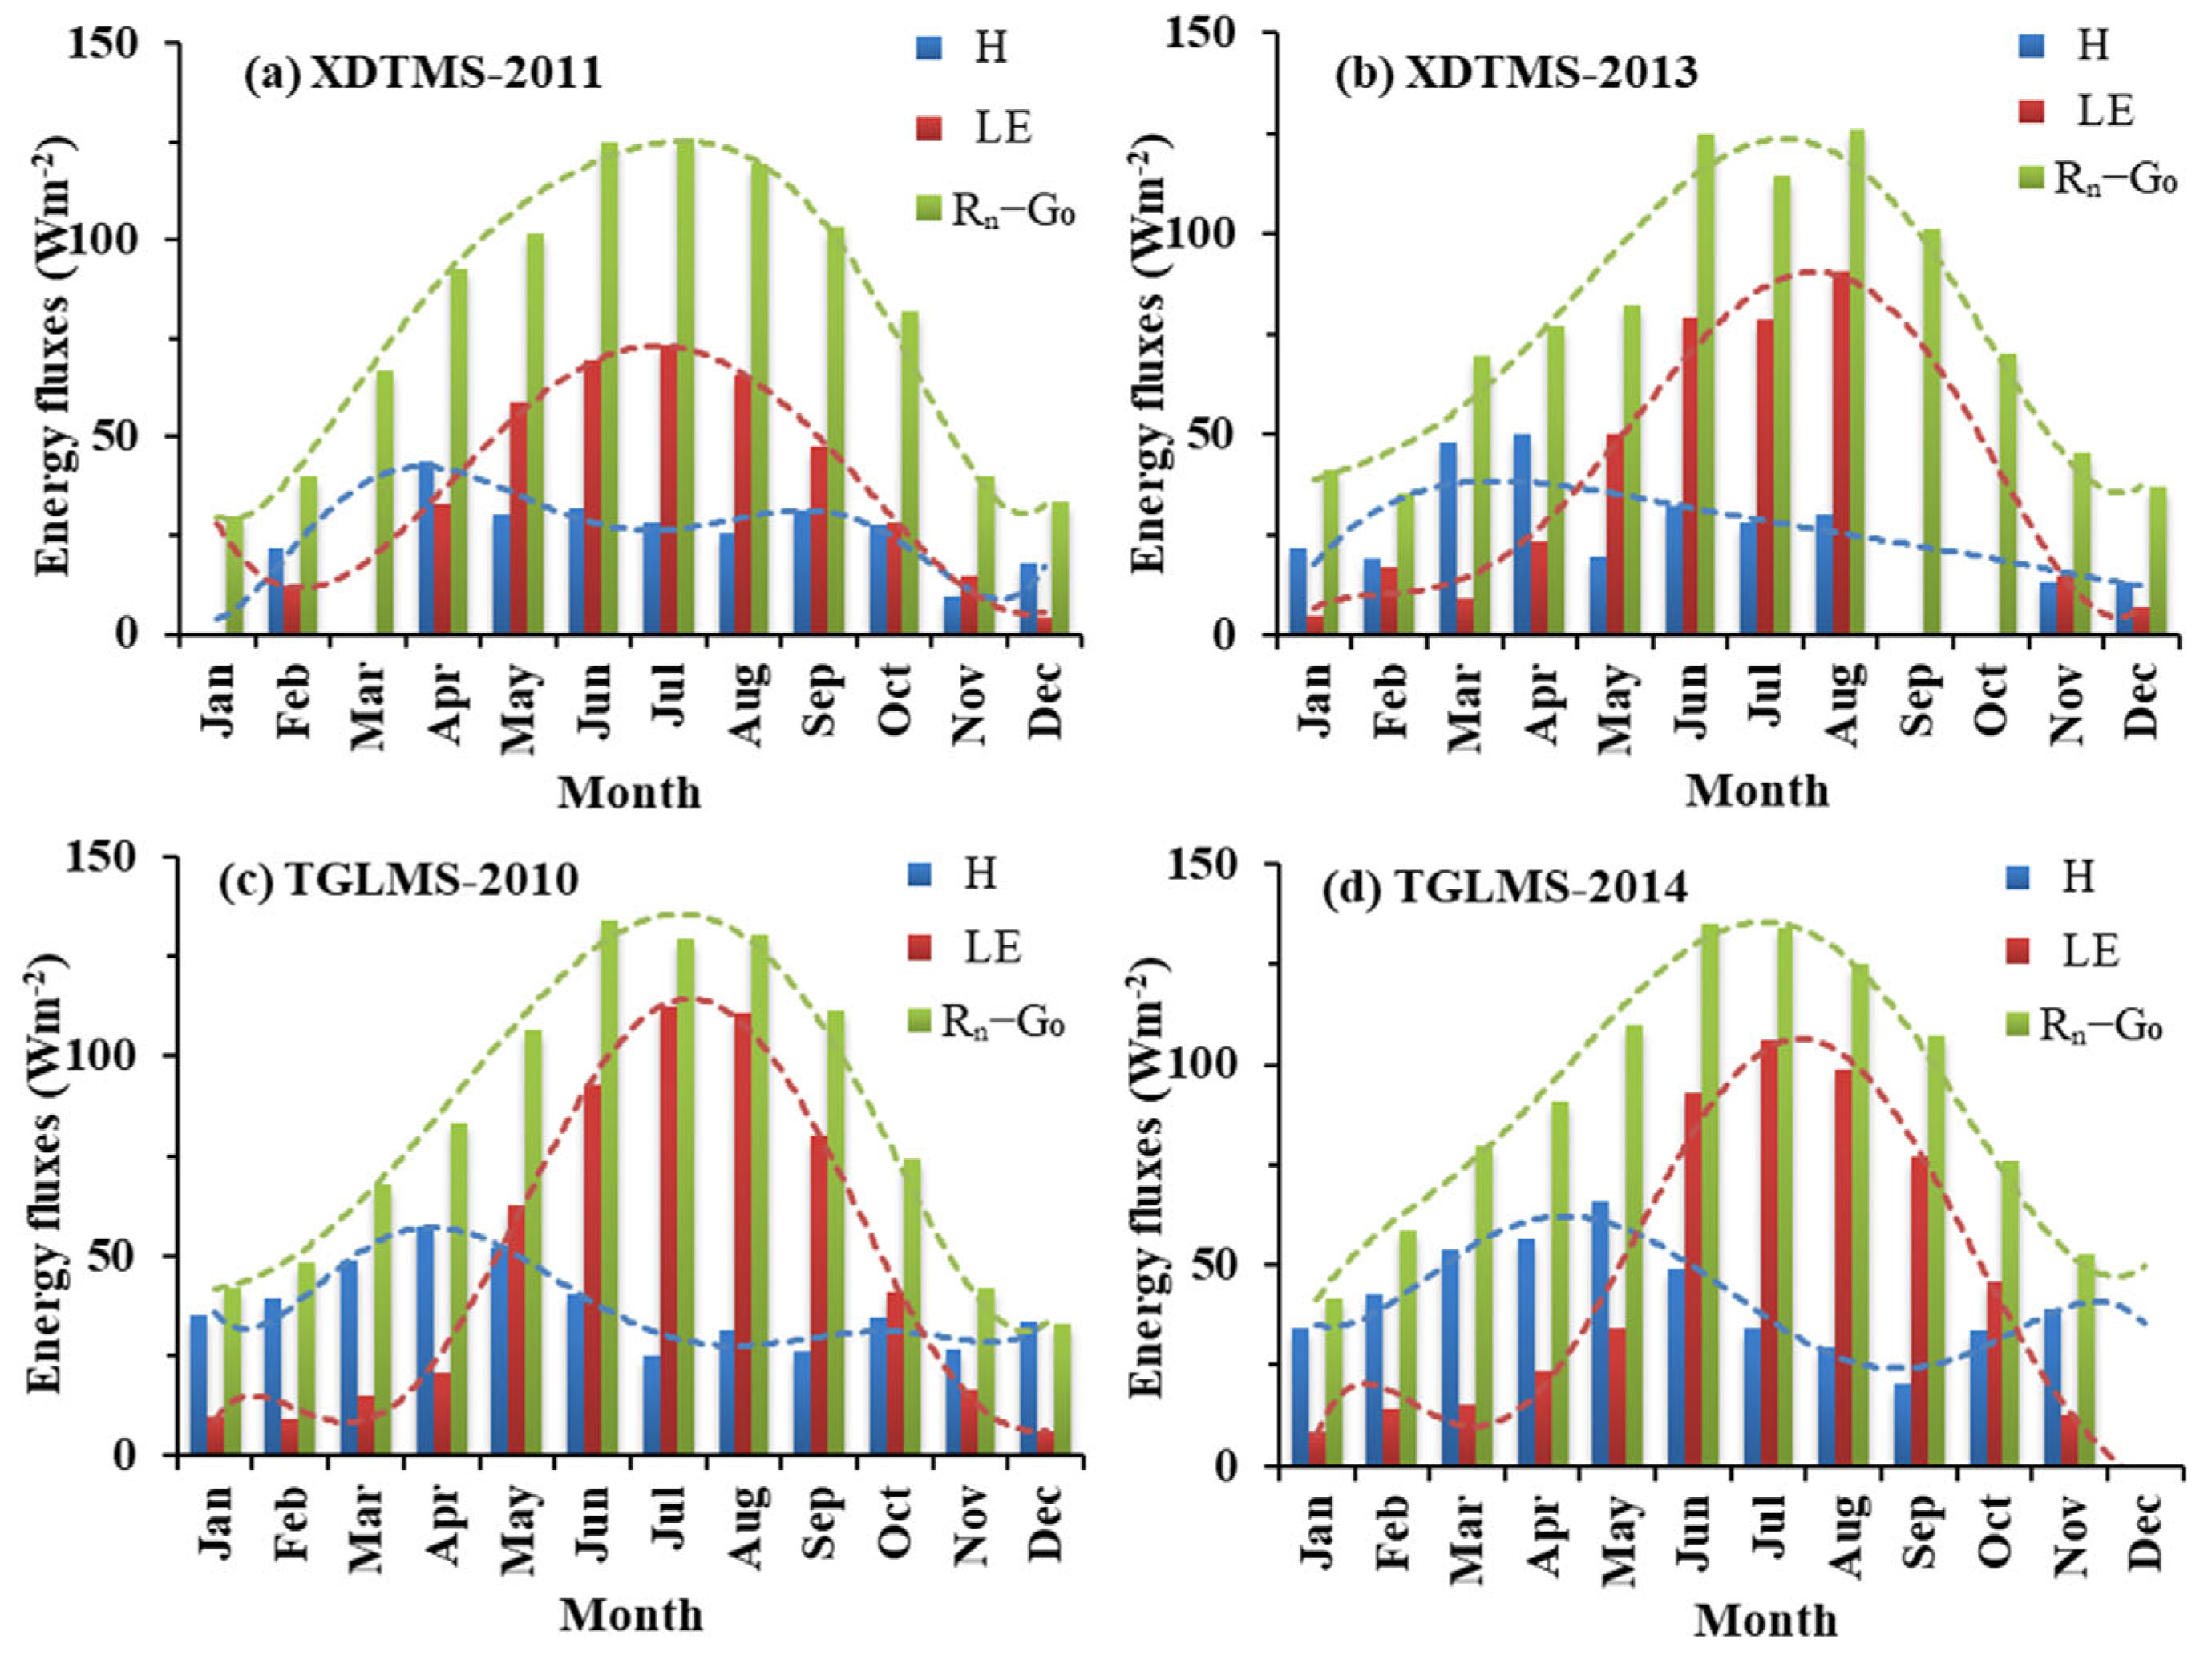
To investigate seasonal changes, we selected years with relatively continuous and complete data: 2011 and 2013 for the XDTMS site and 2010 and 2014 for the TGLMS site (Figure 5). The surface heat source was converted, according to Equation (2), into the following two types of energy: sensible heat flux and latent heat flux. The dynamics of these two energy fluxes represent a core process in the coupling between permafrost and the atmosphere [1].
As shown in Figure 5, monthly variations in the surface heat source at both sites exhibited a parabolic pattern, peaking in summer and reaching its lowest point in winter. Sensible and latent heat fluxes alternated as the dominant component with the season. The maximum sensible heat flux occurred in spring, whereas latent heat flux peaked in summer. The characteristics of these energy flux variations were consistent between the two sites.
The ECR was lower at the XDTMS site than at the TGLMS site; at XDTMS, the ECR was 0.78 in 2011 and 0.88 in 2013, whereas at TGLMS, it was 1.02 in 2010 and 0.98 in 2014.
E C R = H + L E R n G 0
According to the surface layer energy balance (Equation (2)), if the residual energy preventing closure is redistributed to the atmospheric turbulent fluxes in proportion to the observed Bowen ratio, the corrected turbulent fluxes can be acquired without altering the Bowen ratio itself [28], thereby ensuring that the surface heat source consists entirely of sensible and latent heat. That is, when influences such as precipitation are neglected, the corrected fluxes are calculated as follows [28,29]:
H c = H + β 1 + β R E S
L E c = L E + 1 1 + β R E S
R E S = R n G 0 H L E
where Hc is the corrected sensible heat flux (Wm−2), LEc is the corrected latent heat flux (Wm−2), β is the Bowen ratio and RES is the residual energy (Wm−2).
The corrected sensible and latent heat fluxes, which adhere to the surface energy balance theory [29], were used to evaluate their respective proportions in the surface heat source regime (Table 2). The monthly percentages were calculated, which revealed that the proportion of sensible heat flux was highest between December and March of the following year, exceeding 80% at its peak, whereas the proportion of latent heat flux peaked between July and September, reaching 70–82%. Among the four study years, 2010 was the only year for which a complete dataset was available for the TGLMS site. The calculated annual average energy flux for TGLMS in 2010 was approximately 36.9 W m−2, accounting for 44.1% of the surface heat source, and latent heat flux was approximately 46.7 W m−2, constituting 55.9%. Thus, over the entire year of 2010, latent heat flux contributed more to the surface heat source than sensible heat flux did at the TGLMS site.

3.3. Correlation Analysis of Environmental Impact Factors

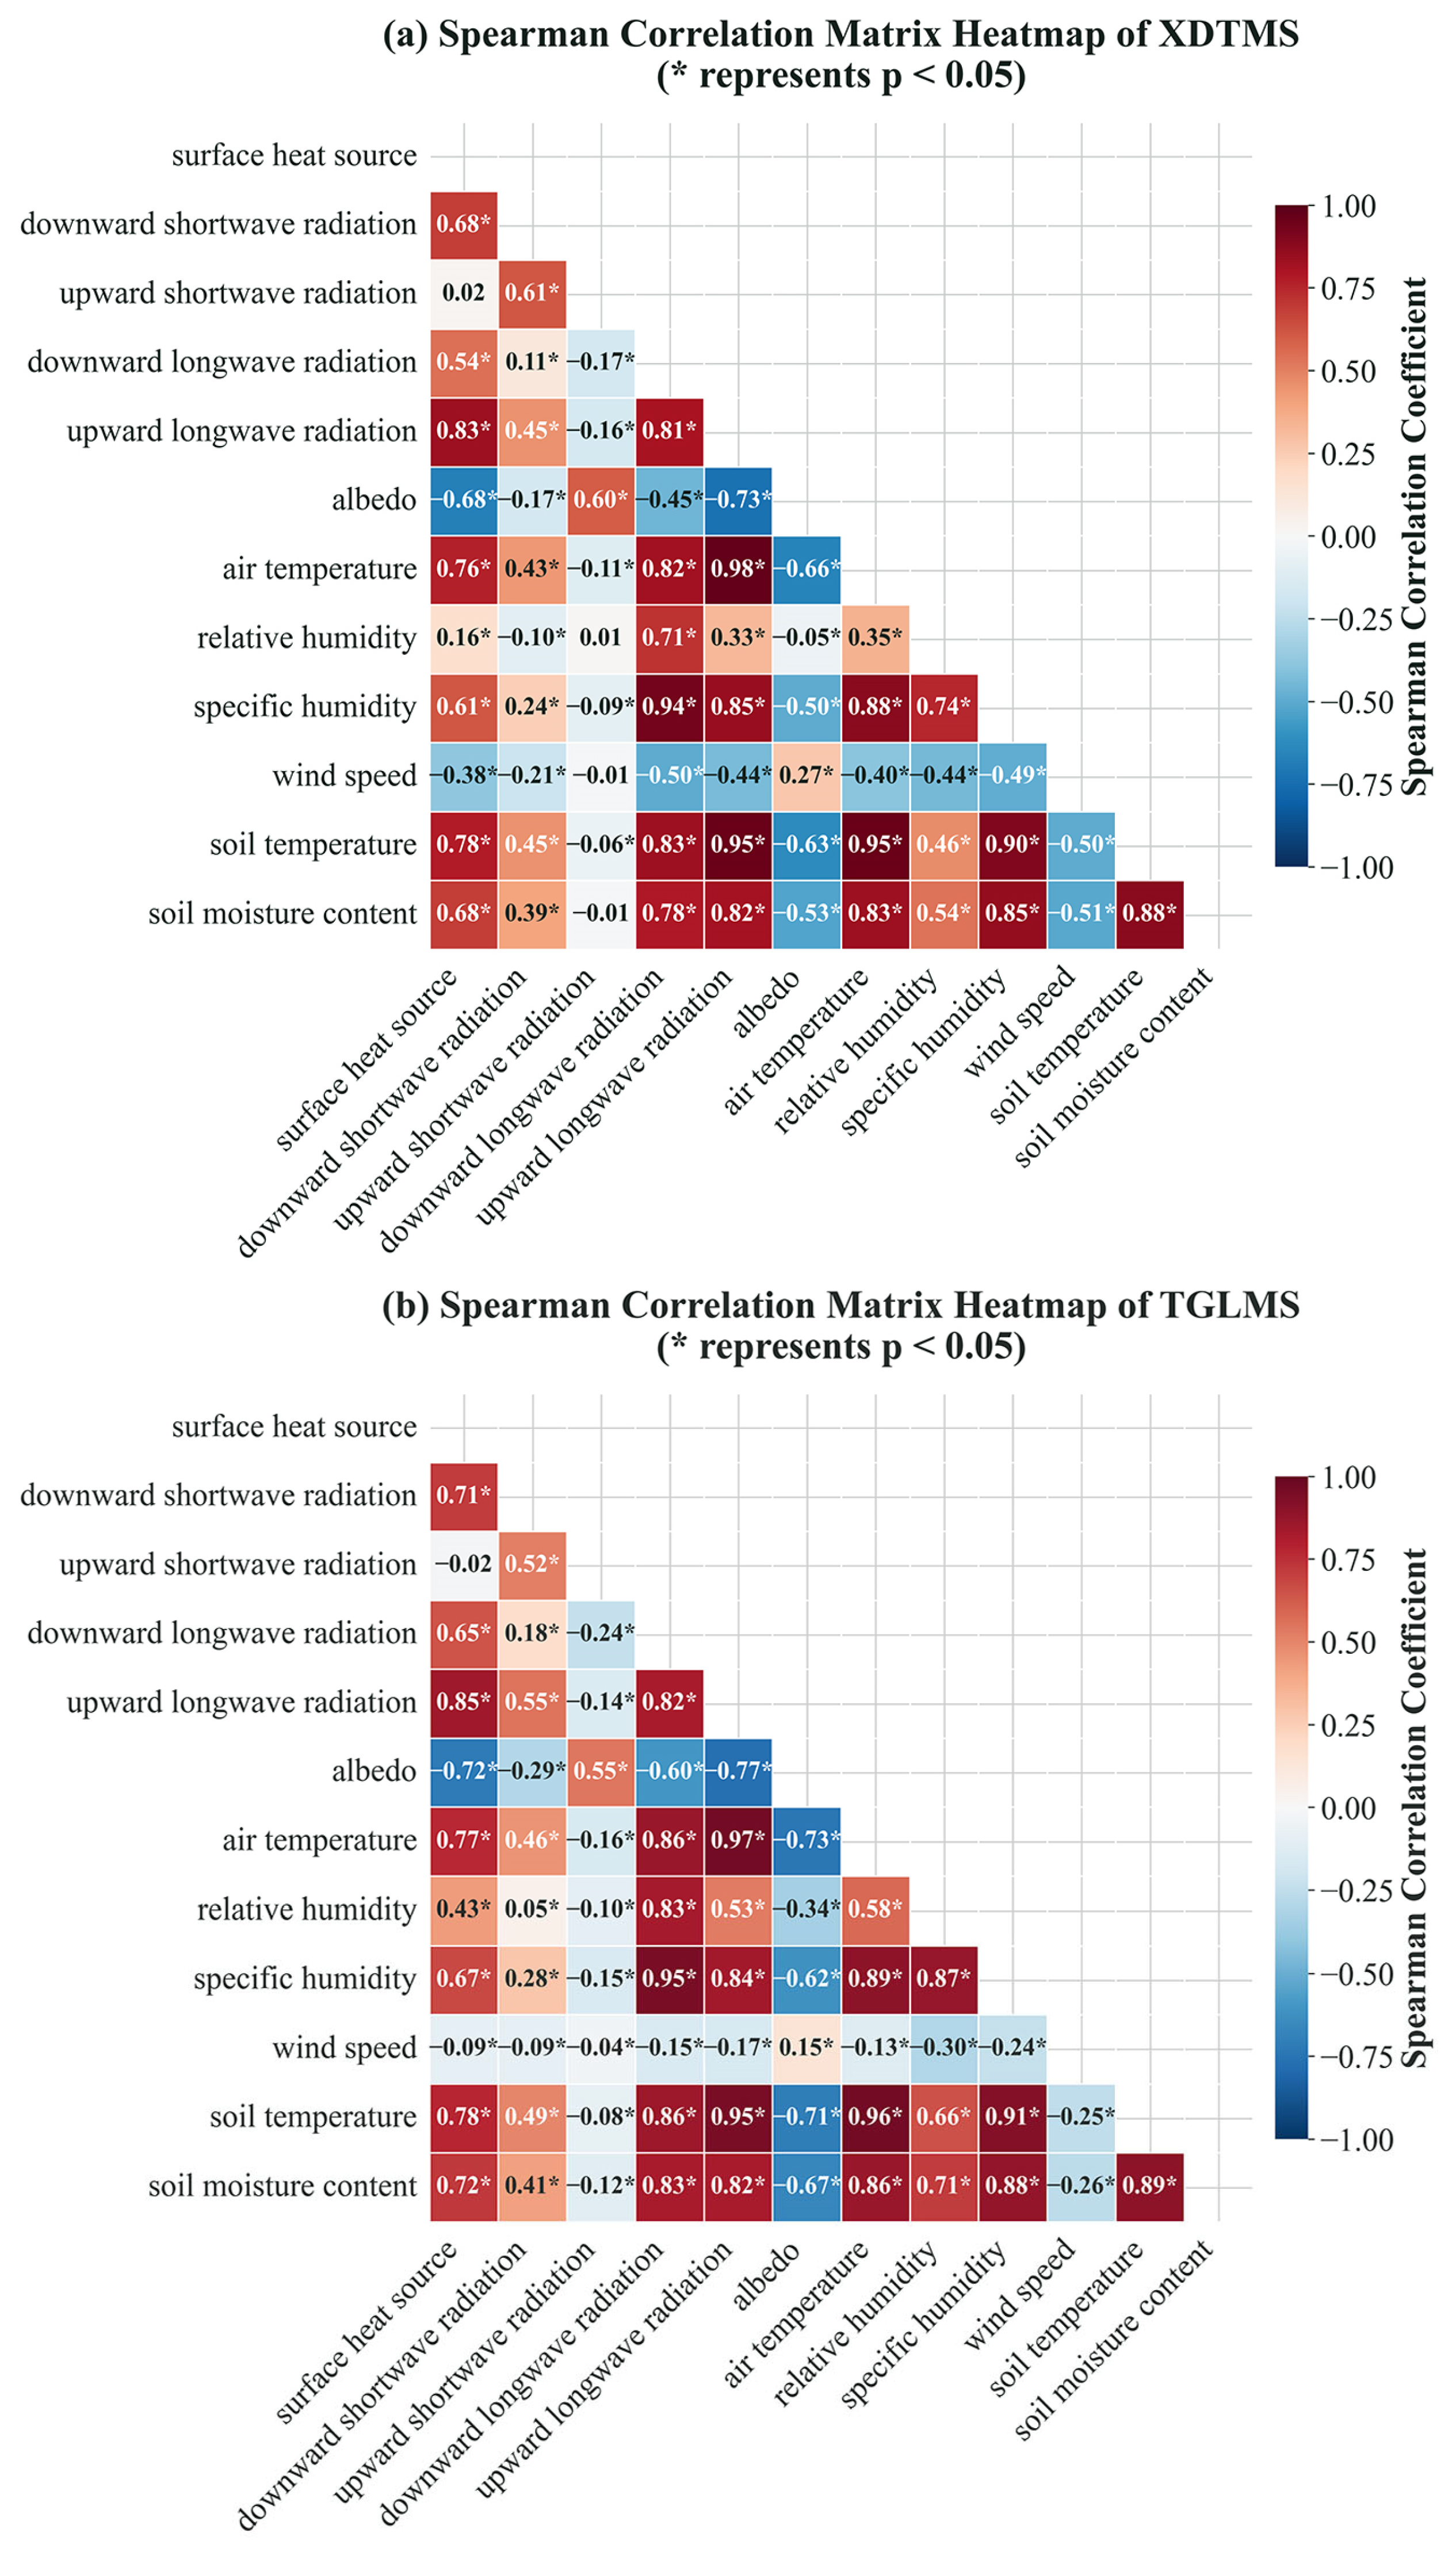
A comprehensive correlation analysis was conducted between the surface heat source and multiple environmental factors. The selected factors included downward and upward shortwave and longwave radiation, albedo, air temperature, relative humidity, specific humidity, wind speed, soil temperature, and soil moisture content. The data period for XDTMS ranged from 2004 to 2019, whereas that for TGLMS ranged from 2014 to 2018.
The results of the correlation analysis of the daily data from the two sites are shown in Figure 6. The correlation matrices of the two sites were similar. The surface heat source showed the strongest positive correlation with upward longwave radiation, with coefficients of 0.83 at the XDTMS site and 0.85 at the TGLMS site. The surface heat source was also strongly positively correlated with downward radiation, temperature and humidity. By contrast, the surface albedo and wind speed were negatively correlated. Notably, the correlation coefficients between the surface albedo and the surface heat source were less than −0.6, suggesting that surface conditions such as soil moisture, vegetation, and snow cover significantly affect the surface heat source.
Figure 6 also shows a strong correlation between the specific humidity and downward longwave radiation, which is a consequence of the efficient absorption and emission of longwave radiation by water vapour. The correlation coefficients exceeded 0.9 at both sites. Furthermore, the soil temperature, air temperature, and upward longwave radiation were strongly correlated. These close linkages are governed by well-established physical mechanisms, such as the Stefan–Boltzmann law and the interactive driving mechanism between soil and air temperatures [30].

3.4. Machine Learning Simulation and Feature Contribution Analysis

On the basis of the preceding correlation analysis and considering the relevant surface physical processes, five variables were selected for the machine learning simulation of surface heat sources: downward shortwave radiation, surface albedo, relative humidity, soil temperature and wind speed. The absolute values of the pairwise correlation coefficients among these five predictors are all less than 0.8 (Figure 6).
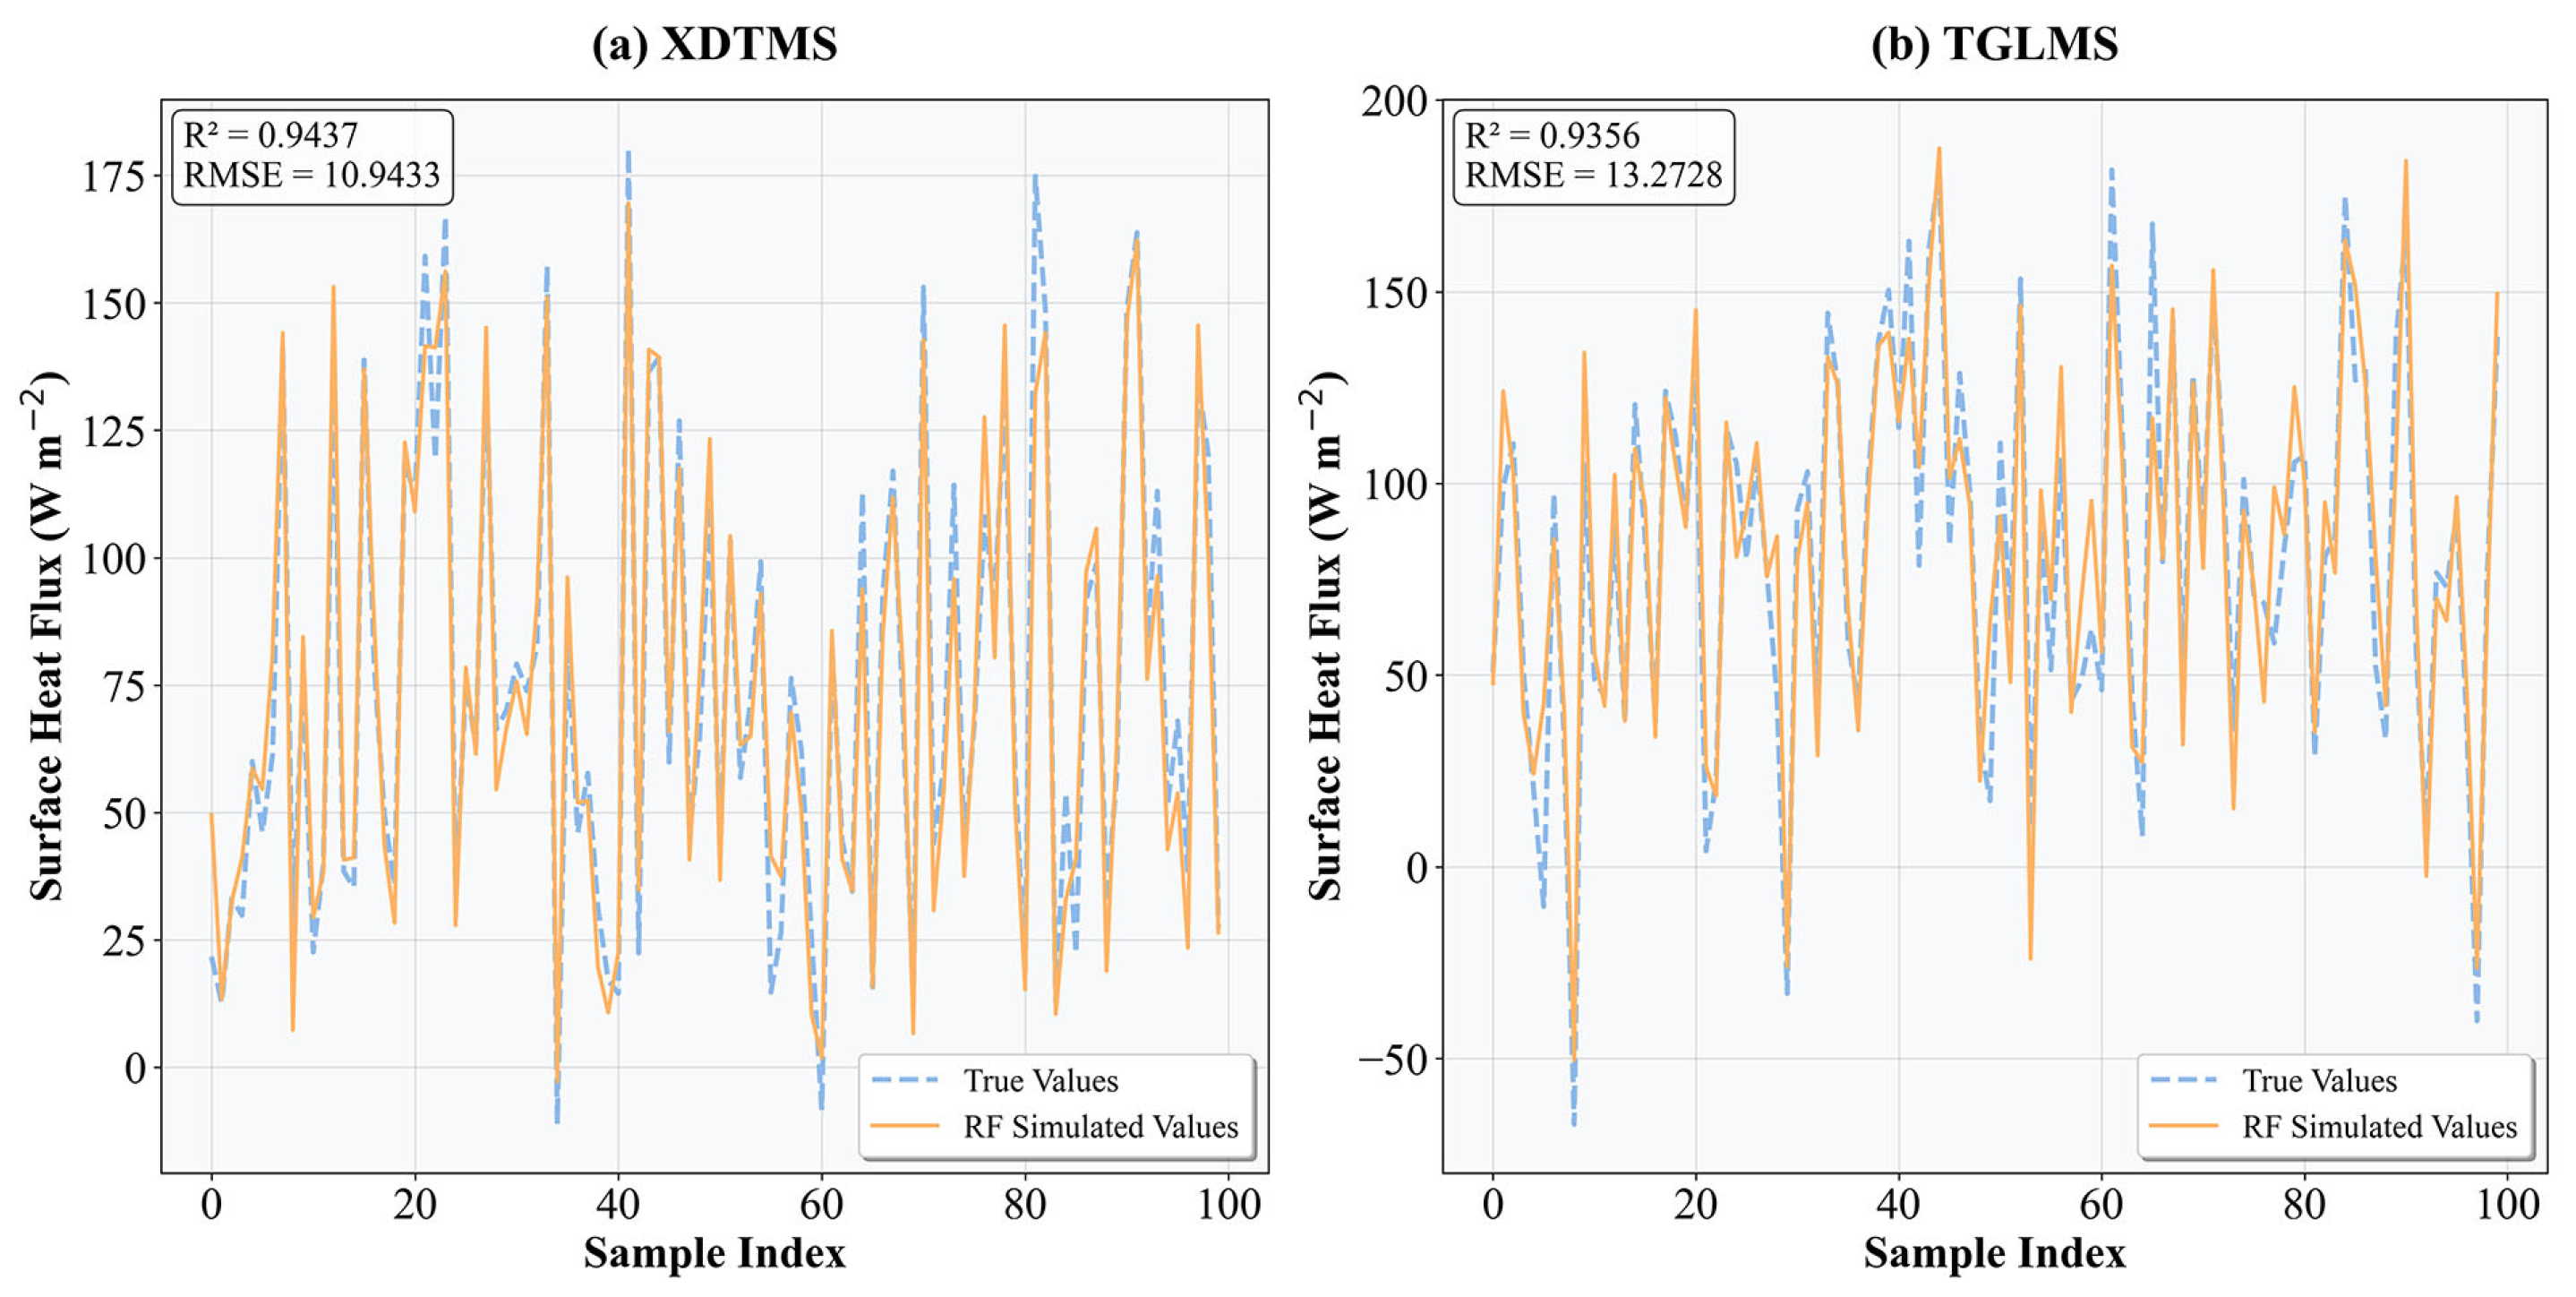
The random forest (RF) algorithm was employed. The model configuration included 200 trees, a maximum depth of 9, a minimum number of samples per leaf of 4, and bootstrap sampling with a maximum sample ratio of 0.5. A random state of 42 was fixed for reproducibility. The dataset was partitioned into 80% for training and 20% for testing, with model validation being conducted through 5-fold cross-validation. As shown in Figure 7, the simulation results agree closely with the actual measurements.
The goodness-of-fit statistics for the final model are summarized in Table 3. Performance evaluation confirmed the high accuracy and robustness of the RF model at both sites. The model exhibited excellent explanatory power, capturing approximately 96% of the variance in the training data. Notably, it maintained strong predictive accuracy for the independent test set, accounting for 94% of the variance at both sites, which demonstrates strong generalizability. These results were further supported by 5-fold cross-validation.
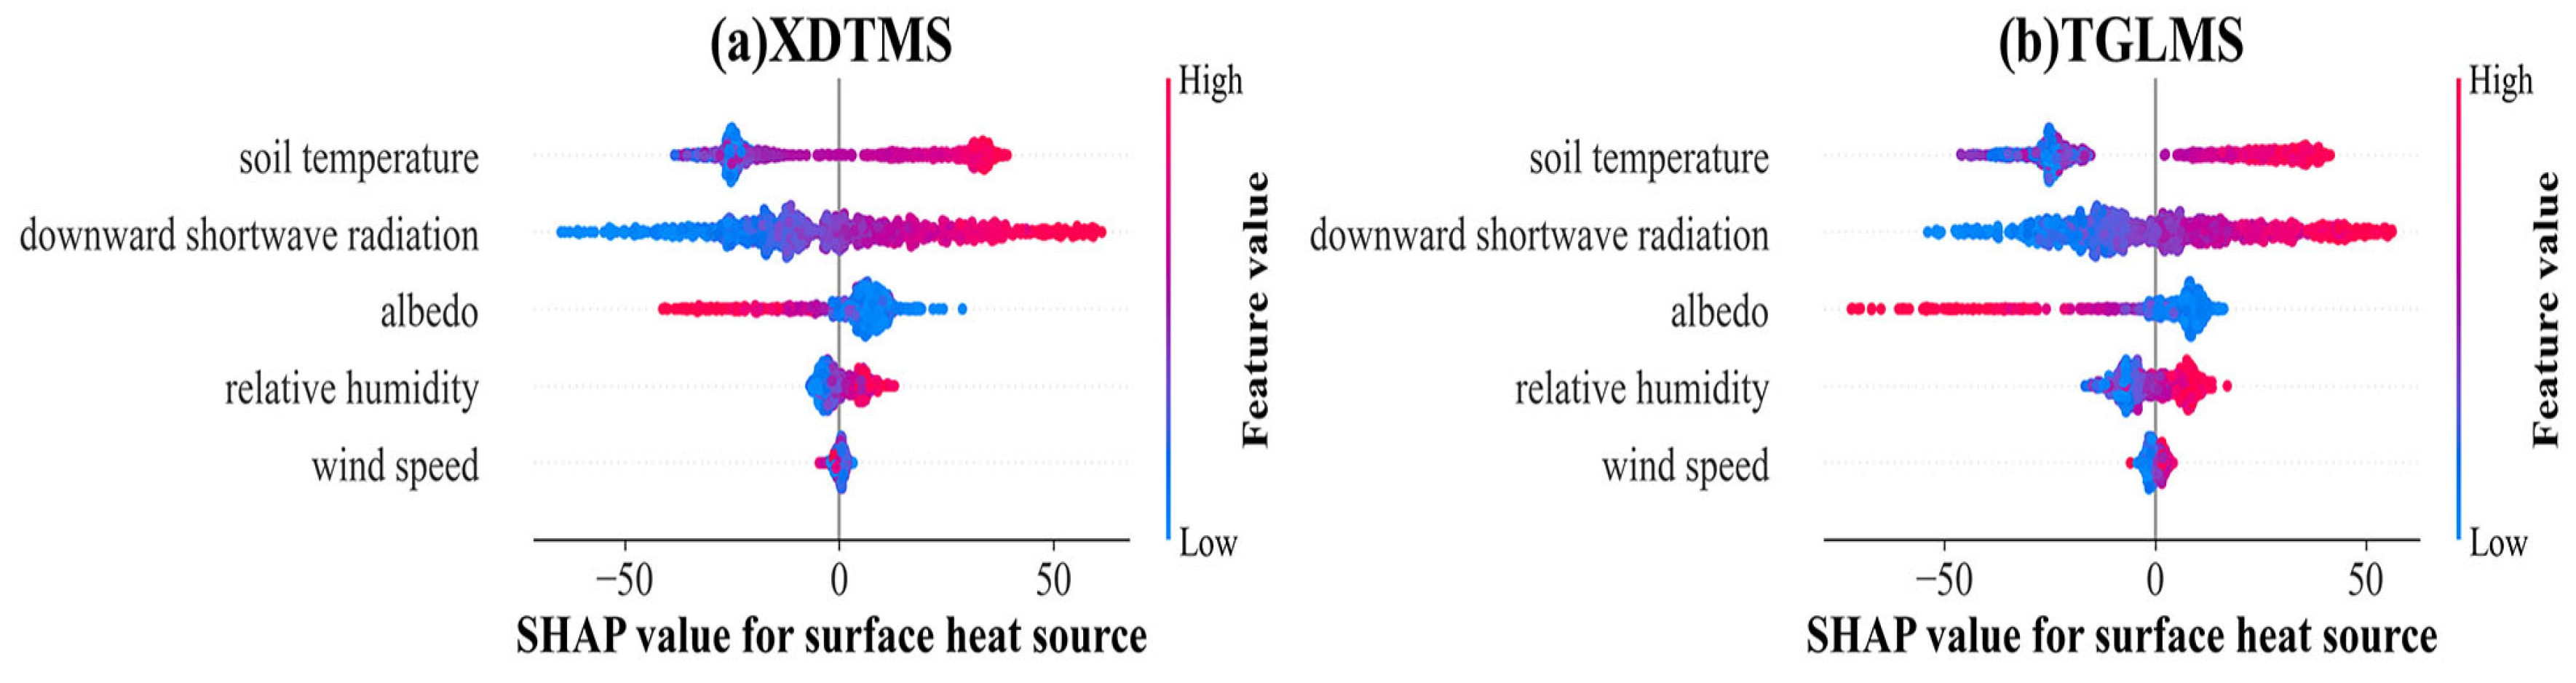
To dissect the influence of environmental factors, the SHapley Additive exPlanations (SHAP) method was applied. The SHAP analysis results for the effects of environmental factors on surface heat sources are shown in Figure 8. As shown, the SHAP results were similar at both sites. Notably, soil temperature, downward shortwave radiation, and albedo were the three most crucial factors, with their combined contribution exceeding 88% at the two sites.
As summarized in Table 4, at the XDTMS site, both soil temperature and downward shortwave radiation had positive effects on the surface heat source, with feature importance values of 42.38% and 34.92%, respectively. Similarly, at the TGLMS site, these two factors also had positive effects, with importance values of 40.67% and 30.61%, respectively. By contrast, the impact of albedo was negative at both sites, with importance values of 15.14% at XDTMS and 16.72% at TGLMS. The contributions of relative humidity and wind speed were relatively minor at both sites.
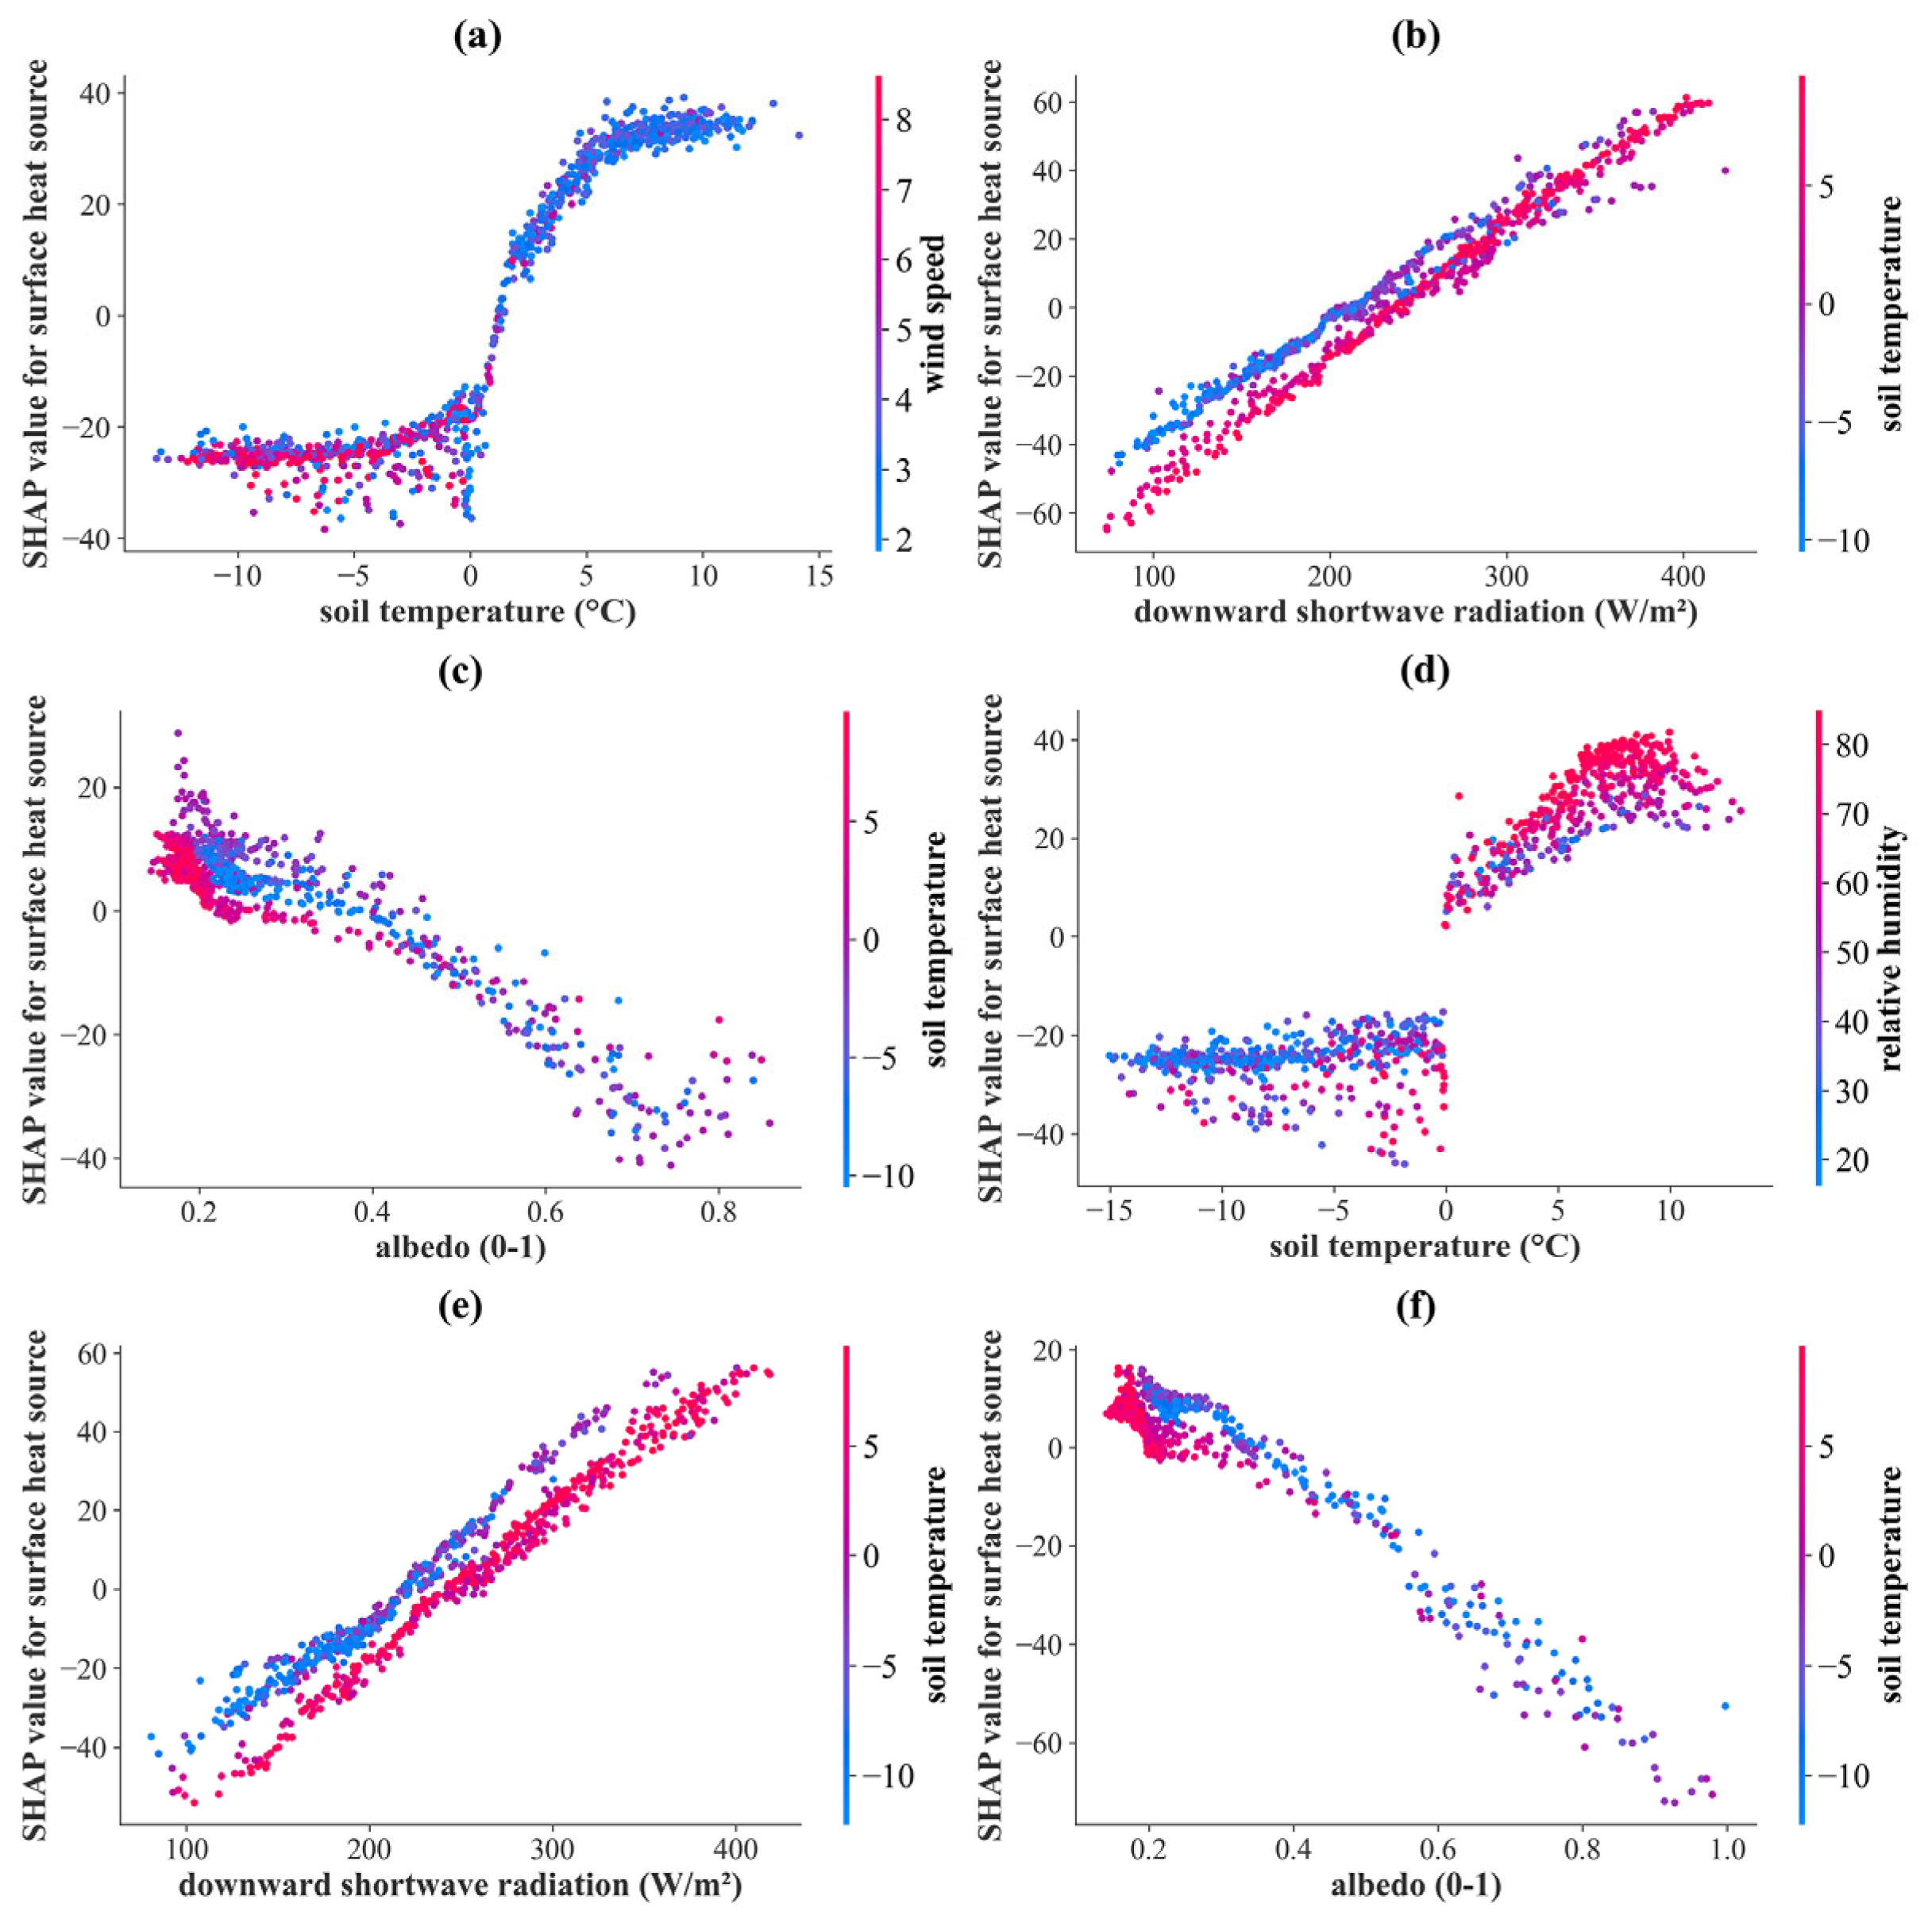
The SHAP dependence of the three most influential features on the surface heat source is shown in Figure 9, and the results for the two sites were consistent. A nonlinear influence of soil temperature on the SHAP value was observed. When the soil temperature ranged from 0 to 5 °C, the SHAP values varied substantially. By contrast, for soil temperatures below 0 °C or above 5 °C, the SHAP values, despite some scatter, generally tended to stabilize. The positive impact of downward shortwave radiation on the model output increased with intensity. As the downward shortwave radiation increased, the SHAP value increased significantly from approximately −60 to 60. When the albedo increased, the SHAP values clearly decreased overall. Particularly at the TGLMS site, high albedo can lead to SHAP values below −60.

4. Discussion

4.1. Response of the Surface Heat Source to Winter Snow Cover Events

Snow cover strongly affects surface albedo and soil temperature, which are among the principal factors controlling the surface heat source [31,32,33,34,35]. To analyse the response of the surface heat source, three typical and distinct continuous snow cover events that occurred in the winter at the TGLMS site were selected. These events began on 14 October 2004, 13 October 2008, and 19 December 2012. Among them, the 2012 event had the shortest duration (14 days) and the lowest average maximum daily snow depth (1.2 cm). The 2004 event lasted 91 days, with an average maximum daily snow depth of 9.2 cm. By contrast, the 2008 event had the longest duration (115 days) and the highest average maximum daily snow depth (17.0 cm).
This study revealed that the 2012 snow event reduced the surface heat source on a daily scale but did not cause a significant decline at the monthly scale (Figure 3). Conversely, the 2004 snow event led to a sharp decrease in the surface heat source, turning it negative and effectively converting it into a cold source, reaching the lowest value recorded during the study period. This pronounced cooling was attributed to enhanced surface cooling driven by the high albedo of snow and latent heat flux dissipation during snowmelt [33].
Although the 2008 snow cover also shifted the surface heat source to negative values, its cooling effect was less pronounced than that in 2004. This moderation is explained by the onset of an insulating effect once snow cover exceeds thresholds in both duration and thickness [33,36,37]. Notably, following the 2008 event, a high surface heat level of 155.47 W m−2 was observed in June 2009 (Figure 3). A possible mechanism for such delayed warming is that intense snow events suppressed the winter surface heat source, whereas thick, persistent autumn–winter snowpack significantly increased soil moisture in the following spring and summer—a phenomenon known as the freeze–thaw memory effect [38]. This process reduced the post-snowmelt surface albedo to 0.24, which was lower than the albedo observed during the same period in previous years, thereby favouring an increase in net radiation [39]. Research in West Greenland has similarly shown that meltwater from seasonal snow can increase solar radiation absorption by more than 28% [40]. Together, these effects can lead to unusually high surface heat source values in summer [3]. The results indicate that different snow cover have varying effects on the surface heat source.

4.2. Comparison of Climate Warming Effects on Surface Heat Sources Between the Two Sites

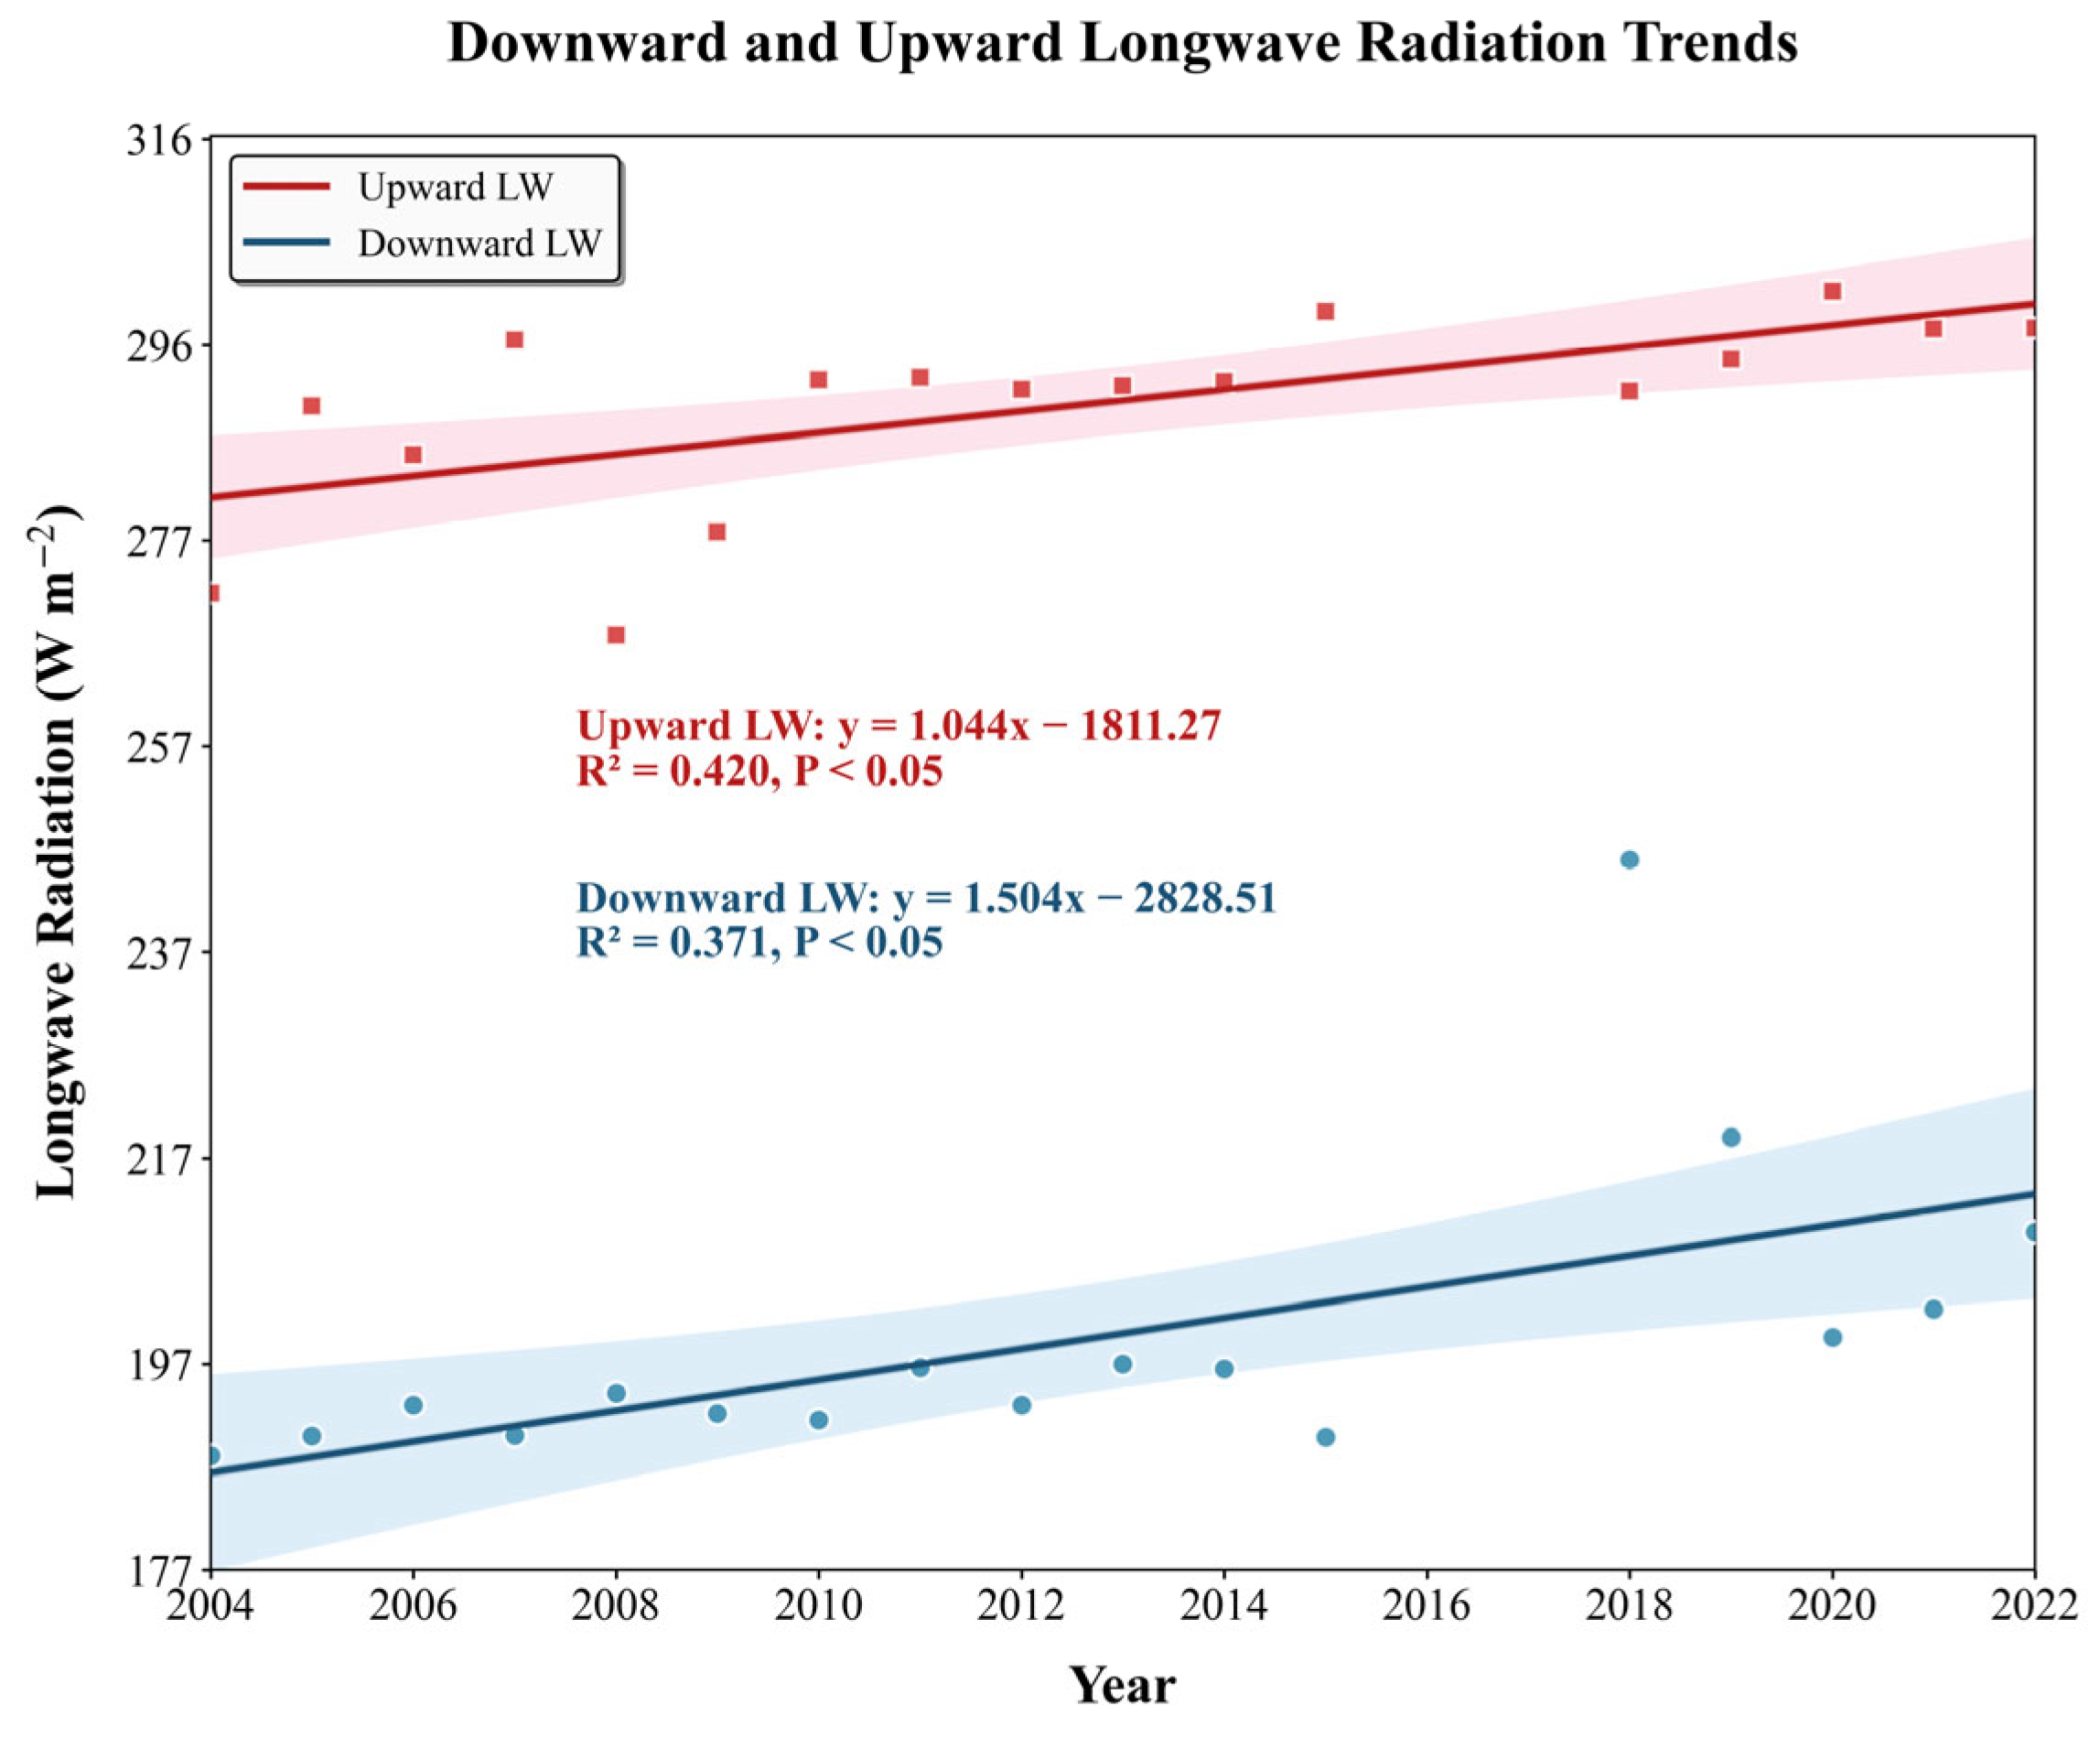
Both Figure 3 and Figure 4 illustrate an increasing trend in the surface heat source at the TGLMS site from 2004 to 2018. This trend is driven primarily by a significant increase in surface heat sources during autumn and winter, particularly in October and November, which thus elevated the annual mean [2,41]. The increase was closely linked to net radiation during the same season. A statistical analysis of the four radiation components in autumn and winter at TGLMS revealed two key changes: first, a significant decline in upward shortwave radiation resulting from fewer heavy snow events after 2008, and second, increases in both upward and downward longwave radiation, with the latter increasing more rapidly (Figure 10). The more rapid increase in downward longwave radiation contributed to the higher net radiation observed in autumn and winter.
The increase in downward longwave radiation reflects enhanced heat transfer from the air to the land—a phenomenon closely associated with climate warming [42,43,44]. Moreover, the increase in upward longwave radiation largely indicated an increased ground surface temperature, which was closely linked to soil temperature. These changes collectively result in a cyclical process: climate warming drives a rapid increase in downward longwave radiation, which augments energy absorption at the soil surface and increases the soil temperature. Wu et al. [45] confirmed that increased downward longwave radiation is the dominant contributor to surface soil warming. Warmer soil, in turn, heats the near-surface atmosphere and amplifies downward longwave radiation. This process increases the soil temperature, and because of its strong contribution to the surface heat source (Table 4), it consequently enhances the intensity of the surface heat source.
Compared with the TGLMS site, the XDTMS site showed no statistically significant trend in terms of the interannual variation in the surface heat source; i.e., it did not pass the significance test. This corresponded to the absence of a significant trend in the annual means of the four radiation components. However, during autumn and winter at the XDTMS site, changes similar to those observed at TGLMS, including decreased upward shortwave radiation and increased upward and downward longwave radiation, which were particularly significant in October and November, were detected. This autumn warming pattern on the Tibetan Plateau is similar to phenomena documented in the Arctic region [46].

4.3. Vegetation–Surface Heat Source Relationship

The enhanced vegetation index (EVI) was used to assess the role of vegetation cover in shaping the surface heat source. Data were obtained from the NASA Land Processes Distributed Active Archive Center (NASA LPDAAC, https://doi.org/10.5067/MODIS/MOD13Q1.061, accessed on 9 October 2025), with spatial and temporal resolutions of 250 m and 16 days, respectively. Following the definition of the vegetation growing season on the Tibetan Plateau (April to October) by Zhang et al. [47], EVI data from this period were selected for analysis.
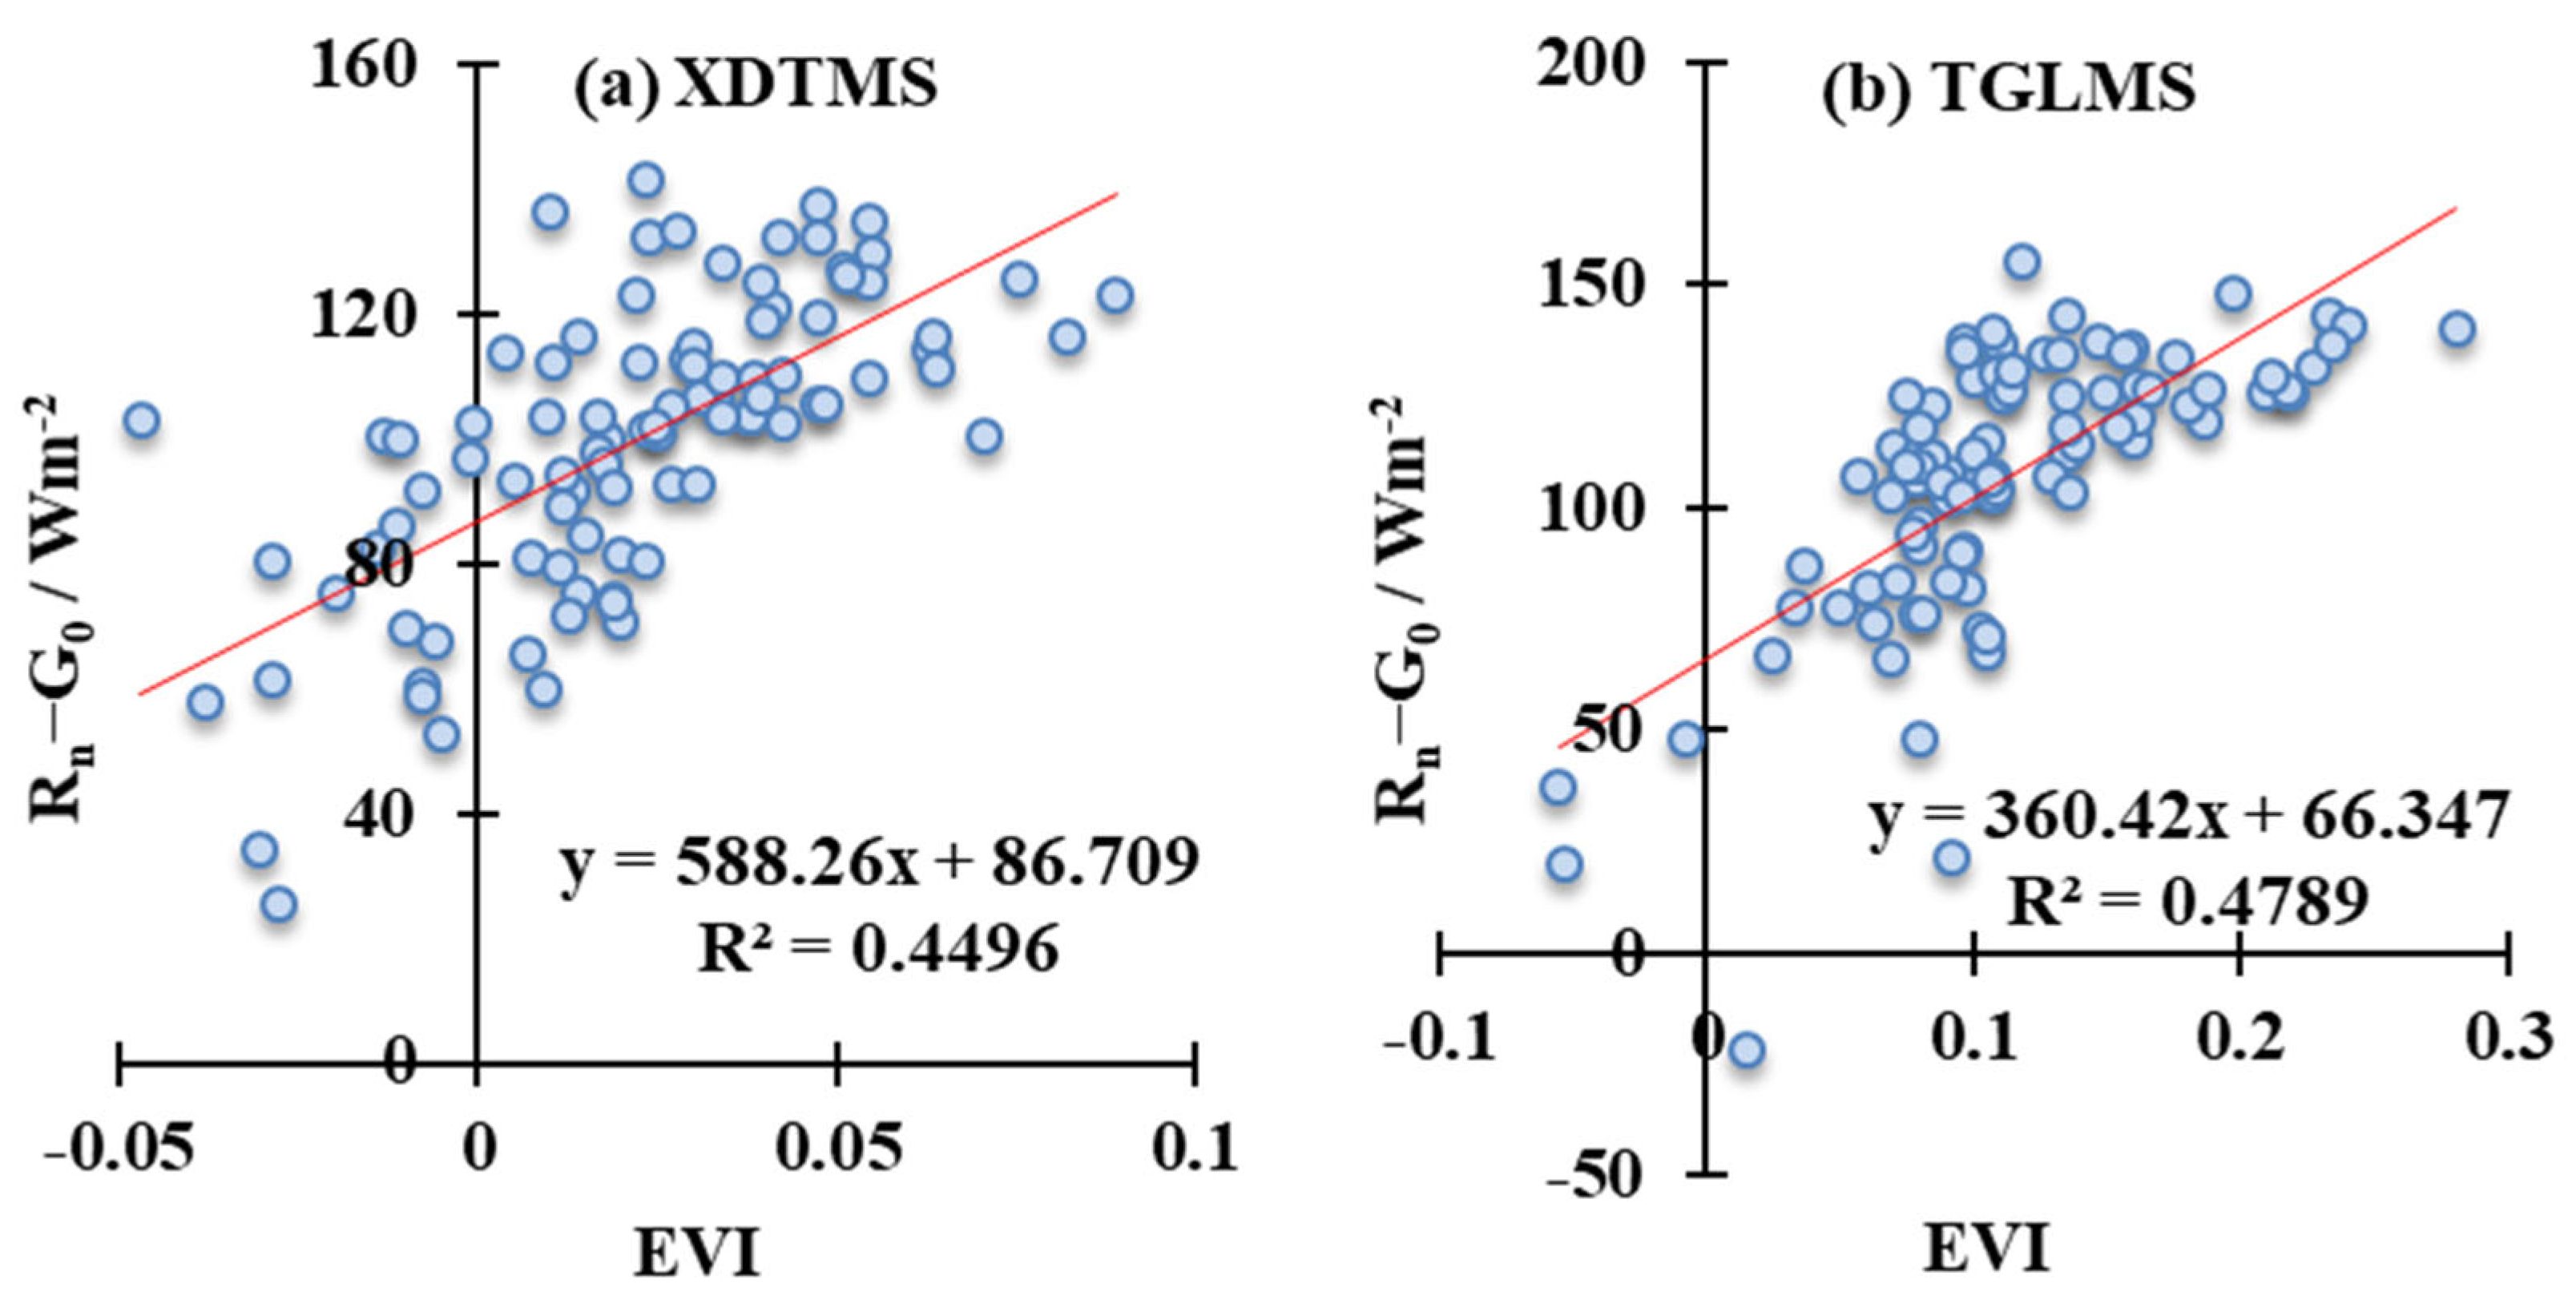
A regression analysis revealed positive linear correlations between the EVI and surface heat source at both XDTMS and TGLMS sites (Figure 11), which was consistent with the results of existing research [10,14,48]. This phenomenon occurs because vegetation, with its relatively low albedo, promotes net radiation. More importantly, vegetation absorbs soil moisture through its root system and transpires it into the atmosphere via leaf stomata—a process that consumes substantial energy and consequently increases latent heat flux.
Given that both vegetation growth and the surface heat source are significantly related to soil temperature [49,50], we controlled for soil temperature and conducted partial correlation analyses between the EVI and surface heat source. The results revealed partial correlation coefficients of approximately 0.257 (p < 0.05) at the XDTMS site and 0.296 (p < 0.05) at the TGLMS site. These values indicate significant, albeit weak, positive correlations between vegetation growth and the surface heat source at both sites.

4.4. Study Limitations and Prospects

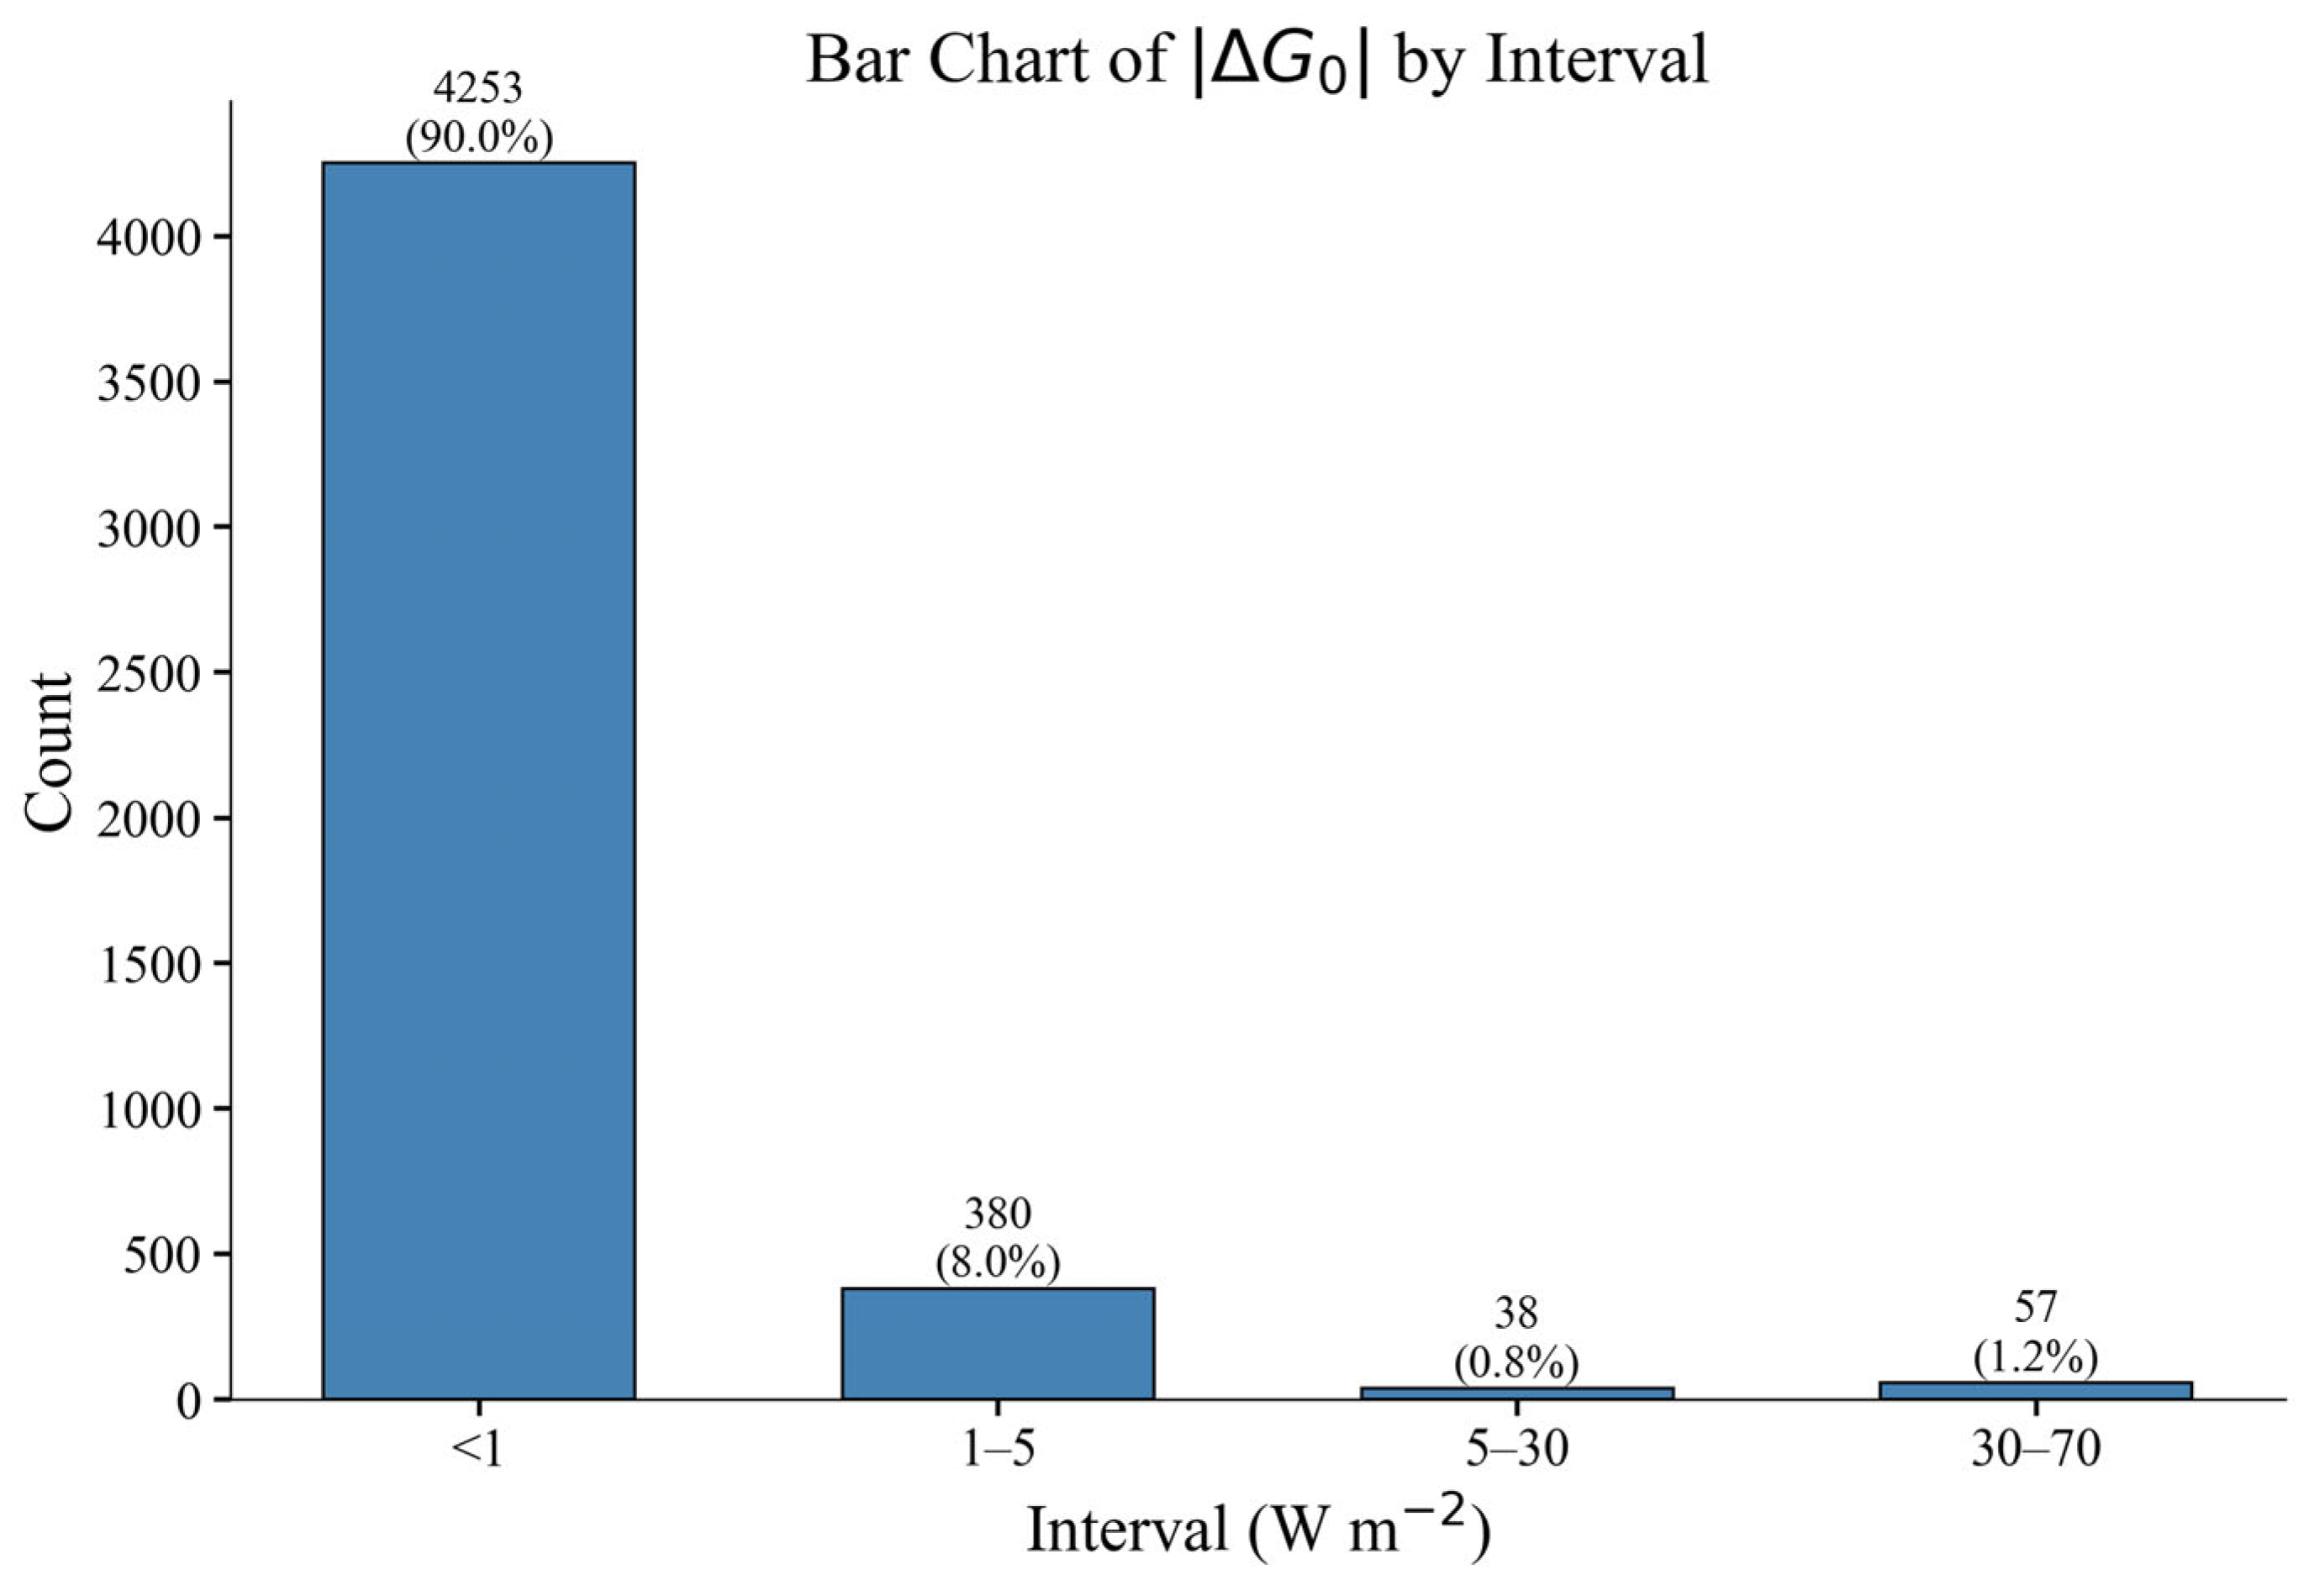
The ice content was derived from a transformed mass conservation equation and represents an estimate. This methodological approach introduced certain biases into the surface heat source calculations, particularly on timescales characterized by significant variations in the unfrozen water content. For example, during the daily freeze-thaw cycle period in April and May each year, significant fluctuations in G0 regularly occurred. However, these fluctuations were smoothed after monthly averaging. To evaluate the impact of the ice content on G0, daily G0 values calculated with and without considering the ice content at the TGLMS site from 2004 to 2018 were compared. Although the absolute differences ( G 0 ) for 90% of the data were less than 1 W m−2, absolute differences exceeding 5 W m−2 occurred for 2% of the data, with a maximum difference of approximately 62.8 W m−2 (Figure 12). Consequently, the ice content must be considered in the calculation of G0 in permafrost regions, although it cannot be measured directly.
Furthermore, in this study, observational data from only two typical sites, one in the sporadic permafrost region and the other in the continuous permafrost region of the Tibetan Plateau, were used; this approach may not reflect the overall characteristics of the surface heat source in this region. Nonetheless, this analysis clarified the commonalities and differences in the multiyear variation characteristics and factors influencing the surface heat source between the sporadic and continuous permafrost regions, providing valuable reference data for regional studies. In the future, satellite remote sensing and reanalysis data should be integrated into analyses to extend the monitoring of surface heat sources from typical sites to the entire Tibetan Plateau, thereby offering critical dataset support for improving climate predictions.

5. Conclusions

The surface heat source, which is a key component of the Earth’s energy balance, significantly influences permafrost dynamics. This study revealed that from 2004 to 2019, the surface heat source remained stable at the XDTMS site, whereas from 2004 to 2018, the surface heat source at the TGLMS site tended to increase, with a rate of change of 2.2 W m−2 yr−1. Strong correlations (R2 > 0.98) were observed between the surface heat source and net radiation. The energy composition of the surface heat source varied with the season: the proportion of latent heat flux was greater than that of sensible heat flux in summer and autumn, reaching a peak of 70–82%, whereas the proportion of sensible heat flux was greater than that of latent heat flux in winter and spring, with a peak exceeding 80%. The random forest model can effectively capture variations in the surface heat source. Soil temperature, downward shortwave radiation, and albedo were the primary contributors, collectively accounting for more than 88% of the total influence. The impact of snow cover of different intensities on the surface heat source also varied. Climate warming during autumn and winter led to an increase in the surface heat source. A significant but weak positive correlation was found between vegetation and the surface heat source. This study provides in situ comparisons for remote sensing research on surface heat sources.

Author Contributions

Conceptualization: J.Y., J.C. and L.G.; Data curation: J.S.; Formal analysis: J.Y.; Funding acquisition: L.G., T.W. and X.W.; Investigation: Y.X., E.D., D.Z., G.L., G.Y., Y.Z., W.W., X.Z. and Y.Q.; Methodology: J.Y.; Resources: J.C. and L.G.; Software: Z.L.; Supervision: T.W., X.W., Y.D. and L.Z.; Validation: R.L. and G.H.; Writing—Original draft: J.Y., Z.L., L.G. and R.L.; Writing—Review and editing: J.C., T.W., X.W., G.H., Y.X., E.D., D.Z., G.L., G.Y., Y.Z., W.W., X.Z., Y.D. and L.Z. All authors have read and agreed to the published version of the manuscript.

Funding

This work was supported by the Chinese Academy of Sciences “Light of West China” program (Grant No. xbzg-zdsys-202304), the National Natural Science Foundation of China (Grant Nos. 42475102, 42330609, 42471168), and the Program of the State Key Laboratory of Cryospheric Science and Frozen Soil Engineering, CAS (Grant Nos. CSFSE-TZ-2502 and CSFSE-FX-2505).

Data Availability Statement

The original contributions presented in the study are included in the article, and further inquiries can be directed to the corresponding author.

Conflicts of Interest

The authors declare no conflicts of interest.

References

  1. Ma, Y.; Yao, T.; Zhong, L.; Wang, B.; Xu, X.; Hu, Z.; Ma, W.; Sun, F.; Han, C.; Li, M.; et al. Comprehensive study of energy and water exchange over the Tibetan Plateau: A review and perspective: From GAME/Tibet and CAMP/Tibet to TORP, TPEORP, and TPEITORP. Earth-Sci. Rev. 2023, 237, 104312. [Google Scholar] [CrossRef]
  2. Zhang, C.; Qin, D.; Zhai, P. Amplification of warming on the Tibetan Plateau. Adv. Clim. Change Res. 2023, 14, 493–501. [Google Scholar] [CrossRef]
  3. Ji, G.; Shi, X.; Gao, W. The variation of surface heating field over northern Qinghai-Tibet Plateau and its effect on climate. Plateau Meteorol. 2001, 20, 239–244, (In Chinese with English abstract). [Google Scholar]
  4. Li, G. Dynamic Meteorology of the Tibetan Plateau, 4th ed.; China Meteorological Press: Beijing, China, 2022. (In Chinese) [Google Scholar]
  5. Wu, G.; Zhang, Y. Thermal and mechanical forcing of the Tibetan Plateau and Asian monsoon onset. Part 1: Situating of the onset. Chin. J. Atmos. Sci. 1998, 22, 825–838, (In Chinese with English abstract). [Google Scholar]
  6. Bao, Q.; Liu, Y.; Shi, J.; Wu, G. Comparisons of soil moisture datasets over the Tibetan Plateau and application to the simulation of Asia summer monsoon onset. Adv. Atmos. Sci. 2010, 27, 303–314. [Google Scholar] [CrossRef]
  7. Qin, D.; Yao, T.; Ding, Y.; Ren, J. Introduction to Cryospheric Science (Revised Edition); Science Press: Beijing, China, 2021. [Google Scholar]
  8. Taylor, P.; Hegyi, B.; Boeke, R.; Boisvert, L. On the increasing importance of air-sea exchanges in a thawing Arctic: A review. Atmosphere 2018, 9, 41. [Google Scholar] [CrossRef]
  9. Li, R.; Wang, S.; Ma, J.; Liu, W.; Wu, T.; Xie, C.; Wu, X.; Ding, Y.; Zhao, L.; Hu, G.; et al. The impacts of soil enthalpy change on land-atmosphere interactions of permafrost on the Qinghai-Tibet Plateau. Geoderma 2025, 454, 117183. [Google Scholar] [CrossRef]
  10. Aihaiti, A.; Wang, Y.; Mamtimin, A.; Liu, J.; Gao, J.; Song, M.; Wen, C.; Ju, C.; Yang, F.; Huo, W. Temporal and spatial surface heat source variation in the Gurbantunggut Desert from 1950 to 2021. Remote Sens. 2023, 15, 5731. [Google Scholar] [CrossRef]
  11. Chen, X.; Song, M.; Wang, Y.; Wu, T. Evaluation of the predictive capability of CMA climate prediction system model for summer surface heat source on the Tibetan Plateau. Remote Sens. 2024, 16, 4118. [Google Scholar] [CrossRef]
  12. Li, G.; Duan, T.; Wu, G. The intensity of surface heat source and surface heat balance on the western Qinghai-Xizang Plateau. Sci. Geogr. Sin. 2003, 23, 13–18, (In Chinese with English abstract). [Google Scholar] [CrossRef]
  13. Li, G.; Lu, H.; Huang, C.; Fan, Y.; Zhang, B. A climatology of the surface heat source on the Tibetan Plateau in summer and its impacts on the formation of the Tibetan Plateau Vortex. Chin. J. Atmos. Sci. 2016, 40, 131–141, (In Chinese with English abstract). [Google Scholar]
  14. Zhang, F.; Liu, A.; Li, Y.; Zhao, L. Primary study on surface heating field and biomass in Alpine Kobresia measow in the Qinghai-Tibetan Plateau. Chin. J. Agrometeorol. 2007, 28, 144–148, (In Chinese with English abstract). [Google Scholar]
  15. Zhou, X.; Zhao, P.; Ma, Y.; Yang, K.; Fan, G.; Bian, J. Complex Coupling Processes of the Land-Atmosphere System on the Tibetan Plateau; China Meteorological Press: Beijing, China, 2023. (In Chinese) [Google Scholar]
  16. Mallick, K.; Jarvis, A.; Wohlfahrt, G.; Kiely, G.; Hirano, T.; Miyata, A.; Yamamoto, S.; Hoffmann, L. Components of near-surface energy balance derived from satellite soundings-Part 1: Noontime net available energy. Biogeosciences 2015, 12, 433–451. [Google Scholar] [CrossRef]
  17. Foken, T. The energy balance closure problem: An overview. Ecol. Appl. 2008, 18, 1351–1367. [Google Scholar] [CrossRef] [PubMed]
  18. Xin, Y.; Chen, F.; Zhao, P.; Barlage, M.; Blanken, P.; Chen, Y.; Chen, B.; Wang, Y. Surface energy balance closure at ten sites over the Tibetan Plateau. Agric. For. Meteorol. 2018, 259, 317–328. [Google Scholar] [CrossRef]
  19. Yao, J.; Zhao, L.; Gu, L.; Qiao, Y.; Jiao, K. The surface energy budget in the permafrost region of the Tibetan Plateau. Atmos. Res. 2011, 102, 394–407. [Google Scholar] [CrossRef]
  20. van Tiggelen, M.; Smeets, P.; Reijmer, C.; van As, D.; Box, J.; Fausto, R.; Khan, S.; Rignot, E.; van den Broeke, M. Surface energy balance closure over melting snow and ice from in situ measurements on the Greenland ice sheet. J. Glaciol. 2024, 70, e82. [Google Scholar] [CrossRef]
  21. Yao, J.; Gu, L.; Yang, C.; Chen, H.; Wang, J.; Ding, Y.; Li, R.; Zhao, L.; Xiao, Y.; Qiao, Y.; et al. Estimation of surface energy fluxes in the permafrost region of the Tibetan Plateau based on in situ measurements and the surface energy balance system model. Int. J. Climatol. 2020, 40, 5783–5800. [Google Scholar] [CrossRef]
  22. Gu, L.; Yao, J.; Hu, Z.; Zhao, L. Comparison of the surface energy budget between regions of seasonally frozen ground and permafrost on the Tibetan Plateau. Atmos. Res. 2015, 153, 553–564. [Google Scholar] [CrossRef]
  23. Ma, Y.; Ma, W.; Zhong, L.; Hu, Z.; Li, M.; Zhu, Z.; Han, C.; Wang, B.; Liu, X. Monitoring and Modeling the Tibetan Plateau’s climate system and its impact on East Asia. Sci. Rep. 2017, 7, 44574. [Google Scholar] [CrossRef] [PubMed]
  24. You, Q.; Xue, X.; Peng, F.; Song, S.; Gao, Y. Surface water and heat exchange comparison between alpine meadow and bare land in a permafrost region of the Tibetan Plateau. Agric. For. 2017, 232, 48–65. [Google Scholar] [CrossRef]
  25. Wu, Q.; Zhang, T.; Liu, Y. Thermal state of the active layer and permafrost along the Qinghai-Xizang (Tibet) railway from 2006 to 2010. Cryosphere 2012, 6, 607–612. [Google Scholar] [CrossRef]
  26. Yang, K.; Wang, J. A temperature prediction-correction method for estimating surface soil heat flux from soil temperature and moisture data. Sci. China Ser. D Earth Sci. 2008, 51, 721–729. [Google Scholar] [CrossRef]
  27. Osterkamp, T. Freezing and thawing of soils and permafrost containing unfrozen water or brine. Water Resour. Res. 1987, 23, 2279–2285. [Google Scholar] [CrossRef]
  28. El Maayar, M.; Chen, J.; Price, D. On the use of field measurements of energy fluxes to evaluate land surface models. Ecol. Model. 2008, 214, 293–304. [Google Scholar] [CrossRef]
  29. Yang, Q.; Zuo, H.; Yang, Y.; Chen, J.; Li, Q.; Zhao, J. On the effect of the near-surface layer energy closure degree on land surface process simulations. Chin. J. Geophys. 2012, 55, 2876–2888, (In Chinese with English abstract). [Google Scholar] [CrossRef]
  30. Garcia-Garcia, A.; Cuesta-Valero, F.; Miralles, D.; Mahecha, M.; Quaas, J.; Reichstein, M.; Zscheischler, J.; Peng, J. Soil heat extremes can outpace air temperature extremes. Nat. Clim. Change 2023, 13, 1237–1241. [Google Scholar] [CrossRef]
  31. Tan, X.; Yu, H.; Yang, K.; Wu, X.; Yang, Y. Inconsistent responses of above- and below-ground to 8 years increased snow depth at the alpine meadow in the permafrost region of the Tibetan Plateau. Plant Soil 2025. [Google Scholar] [CrossRef]
  32. Xiao, Z.; Duan, A. Impacts of Tibetan Plateau snow cover on the interannual variability of the East Asian Summer Monsoon. J. Clim. 2016, 29, 8495–8514. [Google Scholar] [CrossRef]
  33. Xiao, Y.; Hu, G.; Li, R.; Wu, T.; Wu, X.; Liu, G.; Zou, D.; Xing, Z.; Yao, J.; Wang, C.; et al. Threshold-governed insulating and cooling effects of snow cover on alpine permafrost: Evidence from the Qinghai–Tibet Plateau. Agric. For. Meteorol. 2025, 373, 110802. [Google Scholar] [CrossRef]
  34. Wang, J.; Tang, L.; Lu, H. The new indices to describe temporal discontinuity of snow cover on the Qinghai-Tibet Plateau. npj Clim. Atmos. Sci. 2024, 7, 189. [Google Scholar] [CrossRef]
  35. Fernandez-Castillo, P.; Roman-Cascon, C.; Yague, C. Impact of snow cover on the surface energy balance and its contribution to the extreme cold wave in Spain after snowstorm Filomena. Atmos. Res. 2025, 320, 108015. [Google Scholar] [CrossRef]
  36. Ji, G.; Zou, J.; Lv, L. The seasonal variation of surface heating field over the northern Qinghai-Xizang Plateau. Plateau Meteorol. 1997, 16, 1–9, (In Chinese with English abstract). [Google Scholar]
  37. Peng, X.; Frauenfeld, O.; Huang, Y.; Chen, G.; Wei, G.; Li, X.; Tian, W.; Yang, G.; Zhao, Y.; Mu, C. The thermal effect of snow cover on ground surface temperature in the Northern Hemisphere. Environ. Res. Lett. 2024, 19, 044015. [Google Scholar] [CrossRef]
  38. Xiao, Y.; Hu, G.; Li, R.; Xiao, M.; Li, Z.; Zhao, J.; Xing, Z.; Wu, T.; Wu, X.; Liu, G.; et al. Beyond carbon: Multi-scale thermal and hydrological feedback of permafrost on the Tibetan Plateau. Earth Sci. Rev. 2025, 270, 105248. [Google Scholar] [CrossRef]
  39. Datt, P.; Srivastava, P.; Negi, P.; Satyawali, P. Surface energy balance of seasonal snow cover for snow-melt estimation in N-W Himalaya. J. Earth Syst. Sci. 2008, 117, 567–573. [Google Scholar] [CrossRef]
  40. Charalampidis, C.; van As, D.; Box, J.; van den Broeke, M.R.; Colgan, W.; Doyle, S.; Hubbard, A.; MacFerrin, M.; Machguth, H.; Smeets, C. Changing surface-atmosphere energy exchange and refreezing capacity of the lower accumulation area, West Greenland. Cryosphere 2015, 9, 2163–2181. [Google Scholar] [CrossRef]
  41. Hua, S.; Liu, Y.; Jia, R.; Chang, S.; Wu, C.; Zhu, Q.; Shao, T.; Wang, B. Role of clouds in accelerating cold-season warming during 2000–2015 over the Tibetan Plateau. Int. J. Climatol. 2018, 38, 4950–4966. [Google Scholar] [CrossRef]
  42. Ma, Y.; Yao, N.; Wang, B.; Ma, W. The radiation energy distribution over the Tibetan Plateau: A review and perspective. Adv. Atmos. Sci. 2026, 43, 265–280. [Google Scholar] [CrossRef]
  43. Su, J.; Duan, A.; Xu, H. Quantitative analysis of surface warming amplification over the Tibetan Plateau after the late 1990s using surface energy balance equation. Atmos. Sci. Lett. 2017, 18, 112–117. [Google Scholar] [CrossRef]
  44. You, Q.; Cai, Z.; Pepin, N.; Chen, D.; Ahrens, B.; Jiang, Z.; Wu, F.; Kang, S.; Zhang, R.; Wu, T. Warming amplification over the Arctic Pole and Third Pole: Trends, mechanisms and consequences. Earth Sci. Rev. 2021, 217, 103625. [Google Scholar] [CrossRef]
  45. Wu, F.; You, Q.; Pepin, N.; Kang, S.; Zhai, P. Surface warming in summer over the Tibetan Plateau: Local and atmospheric circulation processes. Glob. Planet. Change 2025, 252, 104904. [Google Scholar] [CrossRef]
  46. Grünberg, I.; Groenke, B.; Westermann, S.; Boike, J. Permafrost and active layer temperature and freeze/thaw timing reflect climatic trends at Bayelva, Svalbard. J. Geophys. Res. Earth Surf. 2024, 129, e2024JF007648. [Google Scholar] [CrossRef]
  47. Zhang, G.; Zhang, Y.; Dong, J.; Xiao, X. Green-up dates in the Tibetan Plateau have continuously advanced from 1982 to 2011. Proc. Natl. Acad. Sci. USA 2013, 110, 4309–4314. [Google Scholar] [CrossRef] [PubMed]
  48. Hua, W.; Fan, G.; Zhou, D.; Ni, C.; Li, X.; Wang, Y.; Liu, Y.; Huang, X. Preliminary analysis on the relationships between Tibetan Plateau NDVI change and its surface heat source and precipitation of China. Sci. China Ser. D Earth Sci. 2008, 51, 677–685. [Google Scholar] [CrossRef]
  49. Bhattarai, B.; Sigurdsson, B.D.; Sigurdsson, P.; Leblans, N.; Janssens, I.; Meynzer, W.; Devarajan, A.K.; Truu, J.; Truu, M.; Ostonen, I. Soil warming duration and magnitude affect the dynamics of fine roots and rhizomes and associated C and N pools in subarctic grasslands. Ann. Bot. 2023, 132, 269–279. [Google Scholar] [CrossRef] [PubMed]
  50. Mortier, S.; Hamedpour, A.; Bussmann, B.; Wandji, R.P.T.; Latre, S.; Sigurdsson, B.; Schepper, T.D.; Verdonck, T. Inferring the relationship between soil temperature and the normalized difference vegetation index with machine learning. Ecol. Inform. 2024, 82, 102730. [Google Scholar] [CrossRef]
Figure 1. Locations of the two observation sites: XDTMS (isolated permafrost) and TGLMS (continuous permafrost).
Remotesensing 18 02312 g001
Figure 2. Variations in the unfrozen water content and estimated ice content at 5 cm depth at the TGLMS site over the period of 2004–2021.
Remotesensing 18 02312 g002
Figure 3. Interannual variations in net radiation (Rn), surface soil heat flux (G0) and surface heat source (RnG0) at XDTMS and TGLMS sites, presenting scatter plots of the relationship between net radiation and the surface heat source at both sites.
Remotesensing 18 02312 g003
Figure 4. Variations in the yearly surface heat source (RnG0) at XDTMS and TGLMS sites (the red line is the trend line and the shaded area represents the 95% confidence interval; least squares trend analysis method).
Remotesensing 18 02312 g004
Figure 5. Seasonal variations in the surface heat source (RnG0), sensible heat flux (H) and latent heat flux (LE) at XDTMS and TGLMS sites (the dashed lines denote nonlinear fitted trend curves).
Remotesensing 18 02312 g005
Figure 6. Spearman correlation matrix heatmaps between the surface heat source and environmental factors at XDTMS and TGLMS sites.
Remotesensing 18 02312 g006
Figure 7. Comparisons between the RF simulation results and measured values at XDTMS and TGLMS sites.
Remotesensing 18 02312 g007
Figure 8. SHAP beeswarm plot of environmental factors for surface heat sources.
Remotesensing 18 02312 g008
Figure 9. SHAP dependence plots of the top three important features. (a) Soil temperature dependence at the XDTMS site; (b) downward shortwave radiation dependence at the XDTMS site; (c) albedo dependence at the XDTMS site; (d) soil temperature dependence at the TGLMS site; (e) downward shortwave radiation dependence at the TGLMS site; (f) albedo dependence at the TGLMS site.
Remotesensing 18 02312 g009
Figure 10. Yearly variations in the September–December averages of upward and downward longwave radiation at the TGLMS site (shaded area represents the 95% confidence interval; least squares trend analysis method).
Remotesensing 18 02312 g010
Figure 11. Relationship between the EVI and surface heat source (RnG0) at XDTMS and TGLMS sites.
Remotesensing 18 02312 g011
Figure 12. Frequency histogram of the absolute differences between daily G0 values calculated with and without considering the ice content.
Remotesensing 18 02312 g012
Table 1. List of instruments used at XDTMS and TGLMS sites (observation at both sites began in 2004).
MeasurementsInstrumentsAccuracyHeight/DepthFrequency
SystemItems
Meteorological towerAir temperatureHMP45C (Vaisala, Vantaa, Finland)±0.5 °C2 m30 min
Air humidityHmp45C (Vaisala, Vantaa, Finland)±3%2 m30 min
Shortwave radiationCM3 (Kipp & Zonen, Delft, The Netherlands)±5%2 m30 min
Longwave radiationCG3 (Kipp & Zonen, Delft, The Netherlands)±10%2 m30 min
Wind velocity05103_L (Campbell Scientific, Logan, UT, USA)±0.3 m/s10 m30 min
PrecipitationT-200B (Geonor, Østerås, Oslo area, Norway)±0.1 mm 30 min
Snow depthSR50 (Campbell Scientific, Logan, UT, USA)±1 cm 30 min
Soil temperature105T (Campbell Scientific, Logan, UT, USA)±0.1 °C2, 5, 10, 20, 40 cm30 min
Soil moisture CS616 (Campbell Scientific, Logan, UT, USA)±2.5%5, 10, 20 cm30 min
Soil heat fluxHFP01SC (Hukseflux, Delft, The Netherlands)±3%5, 10, 20 cm30 min
Eddy covariance system3D ultrasonic anemometerCSAT3 (Campbell Scientific, Logan, UT, USA)±0.4 cm/s3 m10 Hz
CO2/H2OLi-7500 (LI-COR, Lincoln, NE, USA)±0.01 μmol/mol3 m10 Hz
Table 2. The monthly percentage contributions of the corrected sensible (Hc) and latent (LEc) heat fluxes to the surface heat source (RnG0).
XDTMSTGLMS
2011201320102014
H c R n G 0 L E c R n G 0 H c R n G 0 L E c R n G 0 H c R n G 0 L E c R n G 0 H c R n G 0 L E c R n G 0
Jan. 81.7%18.3%78.4%21.6%80.1%19.9%
Feb.63.7%36.3%52.9%47.1%80.9%19.1%74.9%25.1%
Mar.--84.5%15.5%76.7%23.3%78.1%21.9%
Apr.56.9%43.1%68.4%31.6%73.3%26.7%70.4%29.6%
May34.1%65.9%27.8%72.2%45.4%54.6%65.6%34.4%
Jun.31.4%68.6%29.0%71.0%30.3%69.7%34.4%65.6%
Jul.27.8%72.2%26.4%73.6%18.2%81.8%24.5%75.5%
Aug.28.0%72.0%24.7%75.3%22.2%77.8%22.9%77.1%
Sep.39.5%60.5%--24.8%75.2%21.2%78.8%
Oct.49.3%50.7%--45.9%54.1%42.5%57.5%
Nov.38.3%61.7%47.4%52.6%61.6%38.4%75.3%24.7%
Dec.81.7%18.3%66.4%33.6%85.2%14.8%--
Table 3. The coefficients of determination for the training set (Tr-R2), test set (Te-R2) and 5-fold CV (CV-R2) and the test set root mean square error (teRMSE) of the RF at XDTMS and TGLMS sites.
Tr-R2Te-R2CV-R2teRMSE (Wm−2)
XDTMS0.960.940.94 ± 0.007810.94
TGLMS0.960.940.93 ± 0.007013.27
Table 4. SHAP feature importance percentage of environmental factors at XDTMS and TGLMS sites.
Meteorological FactorsXDTMSTGLMS
Soil temperature42.38%40.67%
Downward shortwave radiation34.92%30.61%
Albedo 15.14%16.72%
Relative humidity 6.21%9.88%
Wind speed1.34%2.11%
Disclaimer/Publisher’s Note: The statements, opinions and data contained in all publications are solely those of the individual author(s) and contributor(s) and not of MDPI and/or the editor(s). MDPI and/or the editor(s) disclaim responsibility for any injury to people or property resulting from any ideas, methods, instructions or products referred to in the content.