Article

Assessing the Reliability of Sentinel-2 for Turbidity Estimation in a Shallow Coastal Lagoon

1
Physics Department, University of Aveiro, 3810-193 Aveiro, Portugal
2
CESAM (Centre for Environmental and Marine Studies), Physics Department, University of Aveiro, 3810-193 Aveiro, Portugal
*
Author to whom correspondence should be addressed.
Remote Sens. 2026, 18(13), 2176; https://doi.org/10.3390/rs18132176
Submission received: 12 May 2026 / Revised: 26 June 2026 / Accepted: 29 June 2026 / Published: 3 July 2026

Highlights

What are the main findings?
  • Standard ACOLITE turbidity algorithms underestimated high turbidity levels, showing poor correlation with in situ data.
  • A locally calibrated exponential model, RGratio, based on the Rrs665/Rrs560 band ratio outperformed ACOLITE, achieving an R2 of 0.822 and an RMSE of 1.77 NTU.
What is the implication of the main finding?
  • Turbidity can be accurately monitored by Sentinel-2 satellite in optically complex waters if site-specific calibration is performed.

Abstract

Understanding turbidity in coastal systems is essential to ensure the sustainable management of these ecosystems, which are increasingly under pressure from natural factors and human activities. Thus, this study aims to develop a local Sentinel-2-based turbidity model for the Aveiro lagoon (Portugal) by combining Sentinel-2 records with in situ measurements. A field campaign synchronized with a Sentinel-2 overpass was conducted across the lagoon channels on 28 May 2025, to capture spatial variability by measuring near-surface turbidity and Secchi depth, for correspondence with the spectral records of satellite. Remote Sensing Reflectance (Rrs) and turbidity were derived using various algorithms integrated within the ACOLITE software (v20250114.0). Additionally, new turbidity models were developed and empirically adjusted based on the Rrs data, with their performance quantified through the coefficient of determination (R2) and Root Mean Square Error (RMSE). The results showed that the existing algorithms are not directly suitable for the Aveiro lagoon, as they underestimate the highest turbidity values. The ratio between 665 and 560 nm bands (RGratio) proved to be the most suitable spectral index, performing best in estimating turbidity (R2 = 0.822 and RMSE = 1.77 NTU). This study highlights the importance of locally calibrated models over standard ACOLITE algorithms for turbidity retrieval in shallow coastal lagoons, while emphasizing that the proposed model was calibrated for the tidal, wind, and river discharge conditions sampled during the campaign and has not yet been independently validated.

1. Introduction

Turbidity is a measure of the clarity or cloudiness of water, indicating the level of light diffusion and absorption caused by fine suspended particles [1]. As a key indicator of water quality in lagoon environments, this parameter is influenced by a range of natural and anthropogenic factors that alter suspended sediment concentrations and water column transparency [2]. Turbidity directly affects primary productivity and the distribution of aquatic organisms by limiting light penetration in the water column and, consequently, the depth of the euphotic zone [3,4]. Moreover, high turbidity levels are particularly harmful to seagrass meadows, where excessive light attenuation can restrict photosynthesis and lead to habitat fragmentation or loss [5,6]. The regulatory relevance of turbidity is also underscored by the European Union under the Water Framework Directive, which classifies it as a fundamental physicochemical quality element for characterizing the ecological status of transitional systems [7]. Within this legal framework, consistent monitoring of turbidity and related variables (e.g., water transparency and suspended solids) is mandatory to assess the ecological status of estuarine waters.
In shallow coastal environments, turbidity exhibits high spatial and temporal variability, driven by a complex interplay of hydrodynamic forcings, including tidal-induced resuspension of bottom sediments and fluvial discharges, and anthropogenic perturbations (e.g., maintenance dredging and the influx of urban and industrial effluents) [8]. This dynamic is currently shaped by diverging mechanisms. On the one hand, the intensification of tidal currents—driven by mean sea-level rise and the deepening of estuarine channels—has enhanced the resuspension of bottom sediments, leading to elevated turbidity levels [9]. On the other hand, the general decline in fluvial sediment supply, often exacerbated by prolonged droughts, has led to reduced suspended-matter inputs and a consequent localized decrease in turbidity [10]. Turbidity dynamics underscore the critical need for rigorous, site-specific, and synoptic assessments in coastal waters. Traditional in situ monitoring, although accurate, is limited in space and time, capturing only local conditions at the time of collection [11]. To better characterize the complex dynamics of turbidity, more consistent and continuous monitoring is required. The inherent logistical challenges and high operational costs of in situ monitoring methods have promoted the development of innovative satellite-based remote sensing methodologies. Such methods have been widely adopted for estuarine turbidity monitoring, given their capacity to provide regular and synoptic data through the use of free-to-access satellite archives [11,12]. Satellite-derived turbidity relies on the principle that the greater the concentration of suspended particulate matter, the more solar radiation in the visible and near-infrared spectral regions is backscattered towards the satellite sensor [13]. Previous studies demonstrated the efficiency of the red spectral band for turbidity detection in low-to-moderate regimes [14,15,16,17].
For instance, Bustamante et al. [14] successfully applied Landsat 5 and 7 red band data to map turbidity (1.5–8 NTU) in the Doñana marshes. Similarly, Chen et al. [15] and Petus et al. [16] leveraged MODIS red band to capture turbidity gradients in Tampa Bay (0.9–8 NTU) and the Adour River plume (0.5–70 NTU), respectively. Ouillon et al. [17] identified the MERIS red band as the most robust predictor for waters across New Caledonia, Cuba and Fiji, spanning a range of 1–25 NTU. Other studies have found that, in highly turbid coastal and estuarine waters, near-infrared bands (around 859 nm) are particularly effective for turbidity retrieval, as red bands tend to saturate at high turbidity levels [18,19]. In the Guadalquivir estuary, Chowdhury et al. [18] showed a spectral shift in sensitivity with increasing turbidity: remotely sensed reflectance initially increased in the red band (665 nm) at lower turbidity (below 85 NTU), but once this band saturated at very high turbidity (above 250 NTU), the red-edge band (704 nm) became more responsive. Dogliotti et al. [19] also observed saturation in the red band and developed a semi-empirical single-band algorithm based on the NIR (near-infrared) band at 859 nm, capable of retrieving turbidity across diverse coastal and estuarine regions. While Dogliotti et al. [19] demonstrated the NIR-based algorithm’s applicability across Southern North Sea and French Guiana coastal waters, as well as in the Scheldt, Gironde and Río de la Plata estuaries, its robustness must be tested in other estuarine environments to verify its local suitability. For instance, Chowdhury et al. [18] observed that a multi-band approach yielded better results in the Guadalquivir estuary compared to the Dogliotti et al. [19] model. Furthermore, several algorithms utilize spectral indices based on the relationship between red and green bands to effectively retrieve turbidity, taking advantage of the lower saturation in the green region by suspended sediments, providing a normalized background against which the enhanced red-reflectance sensitivity can be measured [20,21].
In parallel with the development of turbidity algorithms, progress has been made in optimizing atmospheric correction models tailored explicitly for coastal and inland waters. Atmospheric models designed for Case 1 waters, which assume negligible water-leaving radiance in the NIR, often fail in complex Case 2 waters due to the high reflectance of suspended particles [22]. Furthermore, the use of remote sensors designed explicitly for terrestrial applications, such as the MultiSpectral Instrument (MSI) and Landsat Operational Land Imager (OLI) onboard Sentinel-2 and Landsat missions, respectively, has increasingly gained popularity for assessing turbidity in estuarine systems due to their moderate spatial resolution (10−30 m) [18,23,24].
This study arises in this context and aims to investigate the potential of high-resolution MSI onboard Sentinel-2 satellites for accurately estimating turbidity in the Aveiro lagoon by developing turbidity algorithms that relate Remote Sensing Reflectance (Rrs) with in situ turbidity. Initially, the performance of the turbidity algorithms available within the ACOLITE processor [22,25] was evaluated. Subsequently, site-specific empirical models are developed and calibrated using satellite-derived Rrs of single bands and band ratios [19,26,27]. Finally, an in-depth analysis of the underlying reasons for the differing performance of the different approaches in estimating turbidity in optically complex coastal lagoons is conducted.
The sediments in suspension in the Aveiro lagoon have been studied through field observations and the application of previously validated and calibrated numerical models. Portela et al. [28] analyzed hydrodynamic and sediment transport conditions in an area of abandoned salt pans using in situ data, concluding that these areas have high fine sediment deposition and low water renewal rates. Lopes and Dias [29] applied numerical modeling to analyze residual circulation and its relationship with sediment redistribution. It was found that suspended sediment concentrations along the main channels are influenced by the tidal regime and by river runoff. In turn, Plecha et al. [30] applied the MOHID numerical model to simulate suspended sediment concentration, identifying deposition patterns influenced by tides and river discharge.
Despite these advances, the systematic application of remote sensing techniques to monitor water turbidity in this region remains limited. In particular, the use of Sentinel-2 data to estimate turbidity in the Aveiro lagoon still requires consistent validation adapted to local conditions. The morphological complexity of this coastal system creates significant optical challenges that global algorithms often fail to capture. This knowledge gap requires the development of locally calibrated approaches that account for the specific properties of this lagoon’s waters to ensure reliable estimates. This study aims to fill this gap by integrating in situ data and multispectral images from the MSI (Sentinel-2) sensor, contributing to a more sustainable and informed management of the Aveiro lagoon ecosystem and to broader scientific advancement in satellite-based turbidity assessment in shallow coastal lagoons.

2. Study Area

The Aveiro lagoon (Figure 1) is a shallow mesotidal coastal lagoon located on the north-western coast of Portugal, connected to the Atlantic Ocean through an artificial inlet approximately 1.3 km long, 350 m wide, and over 30 m deep [30]. The lagoon extends for about 45 km in length and 10 km in width, covering an area of 89.2 km2 at spring tide and 64.9 km2 at neap tide [31]. It consists of four main channels (Mira, S. Jacinto, Ílhavo, and Espinheiro) as well as several secondary channels and extensive intertidal flats [32].
The hydrodynamics of the lagoon is dominated by a semi-diurnal tide, with amplitudes ranging from 1.3 to 2.9 m during neap tides and spring tides, respectively. The average depth of the lagoon channels is about 1 m, although areas near the inlet can reach depths of over 20 m [33]. The lagoon receives freshwater inputs from several rivers, mainly the Vouga River, which accounts for roughly two-thirds of the total freshwater inflow, with an average annual flow of approximately 50 m3/s [34]. Smaller tributaries include the Antuã (20 m3/s), Ribeira dos Moinhos (10 m3/s), Boco (5 m3/s), and Cáster (5 m3/s) [32].
Residual circulation is controlled by the asymmetry between ebb and flood regimes, promoting the export of fine sediments towards the ocean in the lower lagoon and towards the main channel heads in the upper lagoon [35]. Sediment concentration patterns show higher suspended sediment concentrations in the upper lagoon during ebb tide conditions, decreasing seaward as marine waters, typically poor in suspended matter, enter through the inlet [28]. Biological productivity in the Aveiro lagoon is closely linked to hydrodynamic conditions. Changes in tidal currents and water depth have been associated with declines in seagrass meadows and increased turbidity and sediment resuspension [29,32]. Seasonal variations also play a significant role: higher SSC are commonly observed during winter, linked to higher river discharge and wind-induced mixing [33].
Given this dynamic environment, turbidity in the Aveiro lagoon fluctuates over very short temporal and spatial scales. Remote sensing techniques, particularly Sentinel-2 (MSI), can offer an efficient approach to monitoring these variations, providing synoptic, temporally consistent information that complements traditional in situ observations.

3. Data and Methods

The dataset used in this study comprises both field and satellite-derived data. The in situ data were retrieved from an oceanographic campaign conducted in the Aveiro lagoon, during which turbidity and Secchi depth were measured at multiple sampling stations. Satellite data were downloaded and processed using the ACOLITE software [36] to retrieve Rrs at various wavelengths, as well as several established turbidity models. These datasets were subsequently compared and integrated through statistical analysis to develop and calibrate turbidity models specifically tailored to the lagoon’s optical conditions.

3.1. In Situ Data

A field campaign was conducted in the Aveiro lagoon on 28 May 2025, coinciding with Sentinel-2 satellite overpasses, in order to obtain in situ measurements of turbidity and Secchi depth. The date was selected based on two main criteria: (i) cloud-free conditions to ensure optimal visibility for the MSI aboard Sentinel-2, and (ii) the satellite’s overpass schedule above the study area. The identification of a suitable date was supported by MATLAB R2023b routines, the Copernicus Data Space Ecosystem, and the HidroRia@UA v2.0 app, which provides tide forecasts for the lagoon.
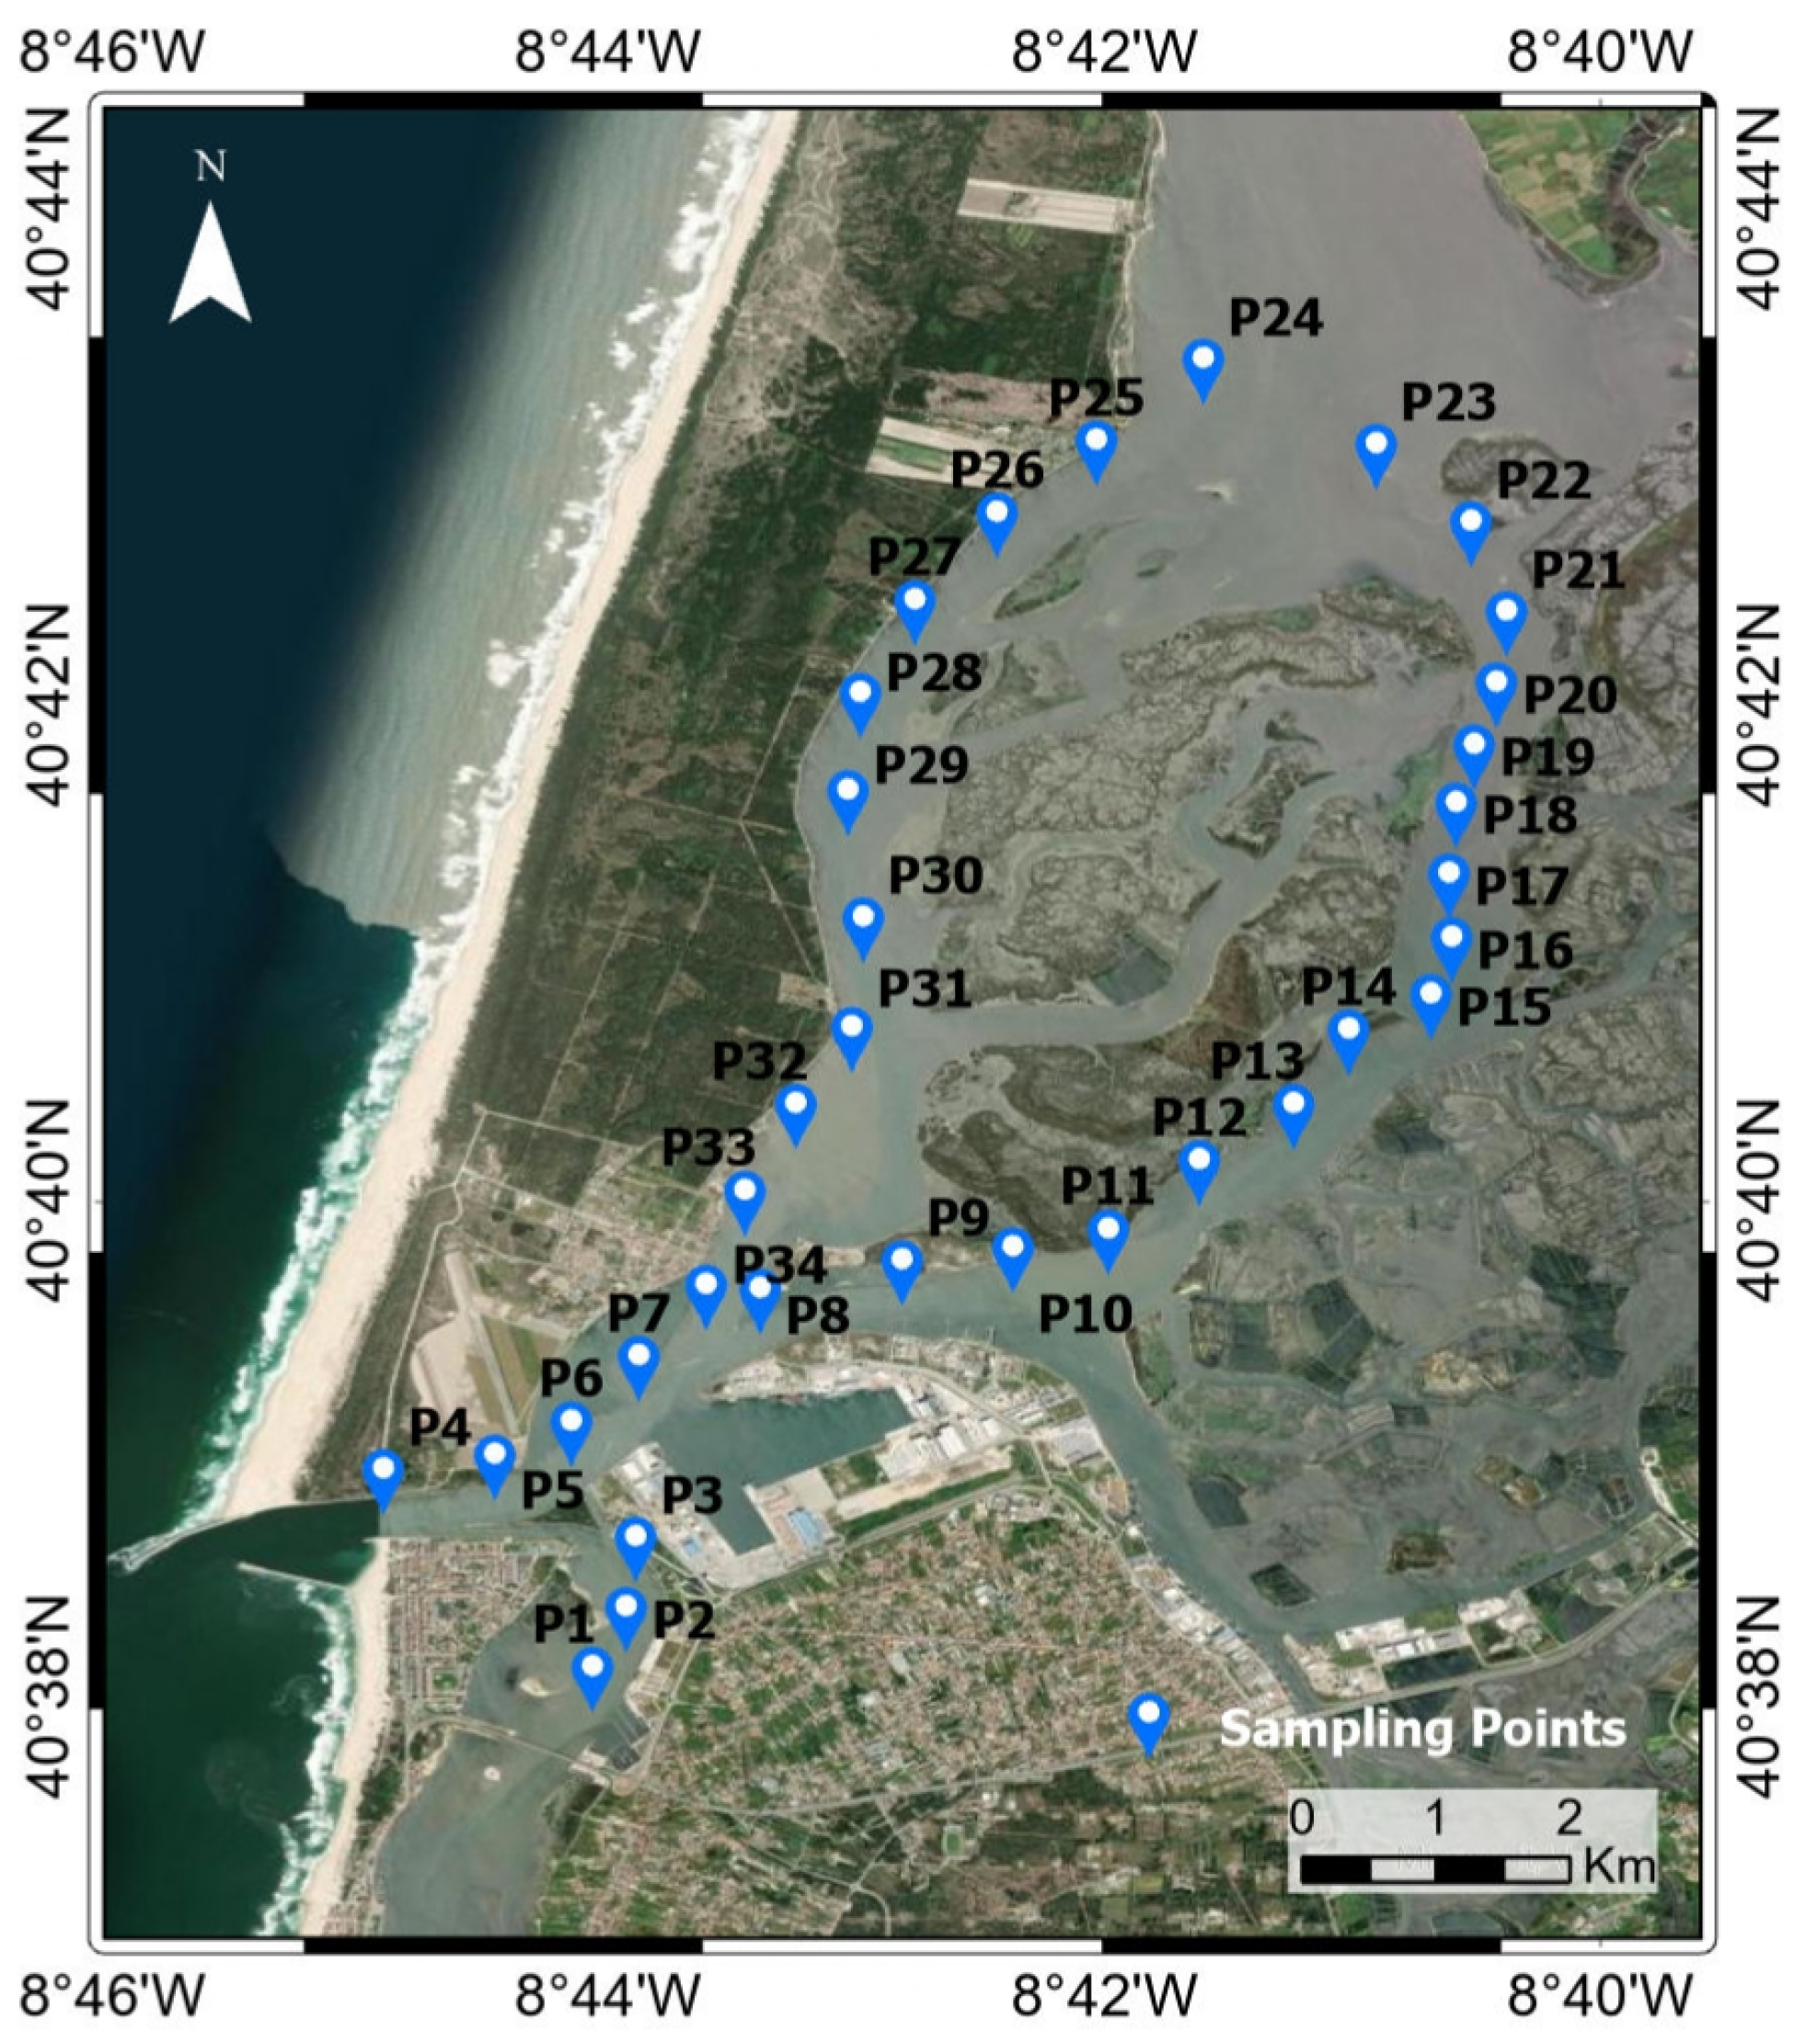
The campaign began near the Coastal Fishing Port (Point 1 in Figure 2), proceeded toward the lagoon inlet (Point 4), and continued northwards along the Espinheiro Channel until reaching the São Jacinto Channel (Point 23). Sampling was concluded upon return to the lagoon inlet (Point 34). The survey was conducted between 11:20 and 14:45 (local time), coinciding with the Sentinel-2 overpass, which occurred at approximately 12:20 local time.
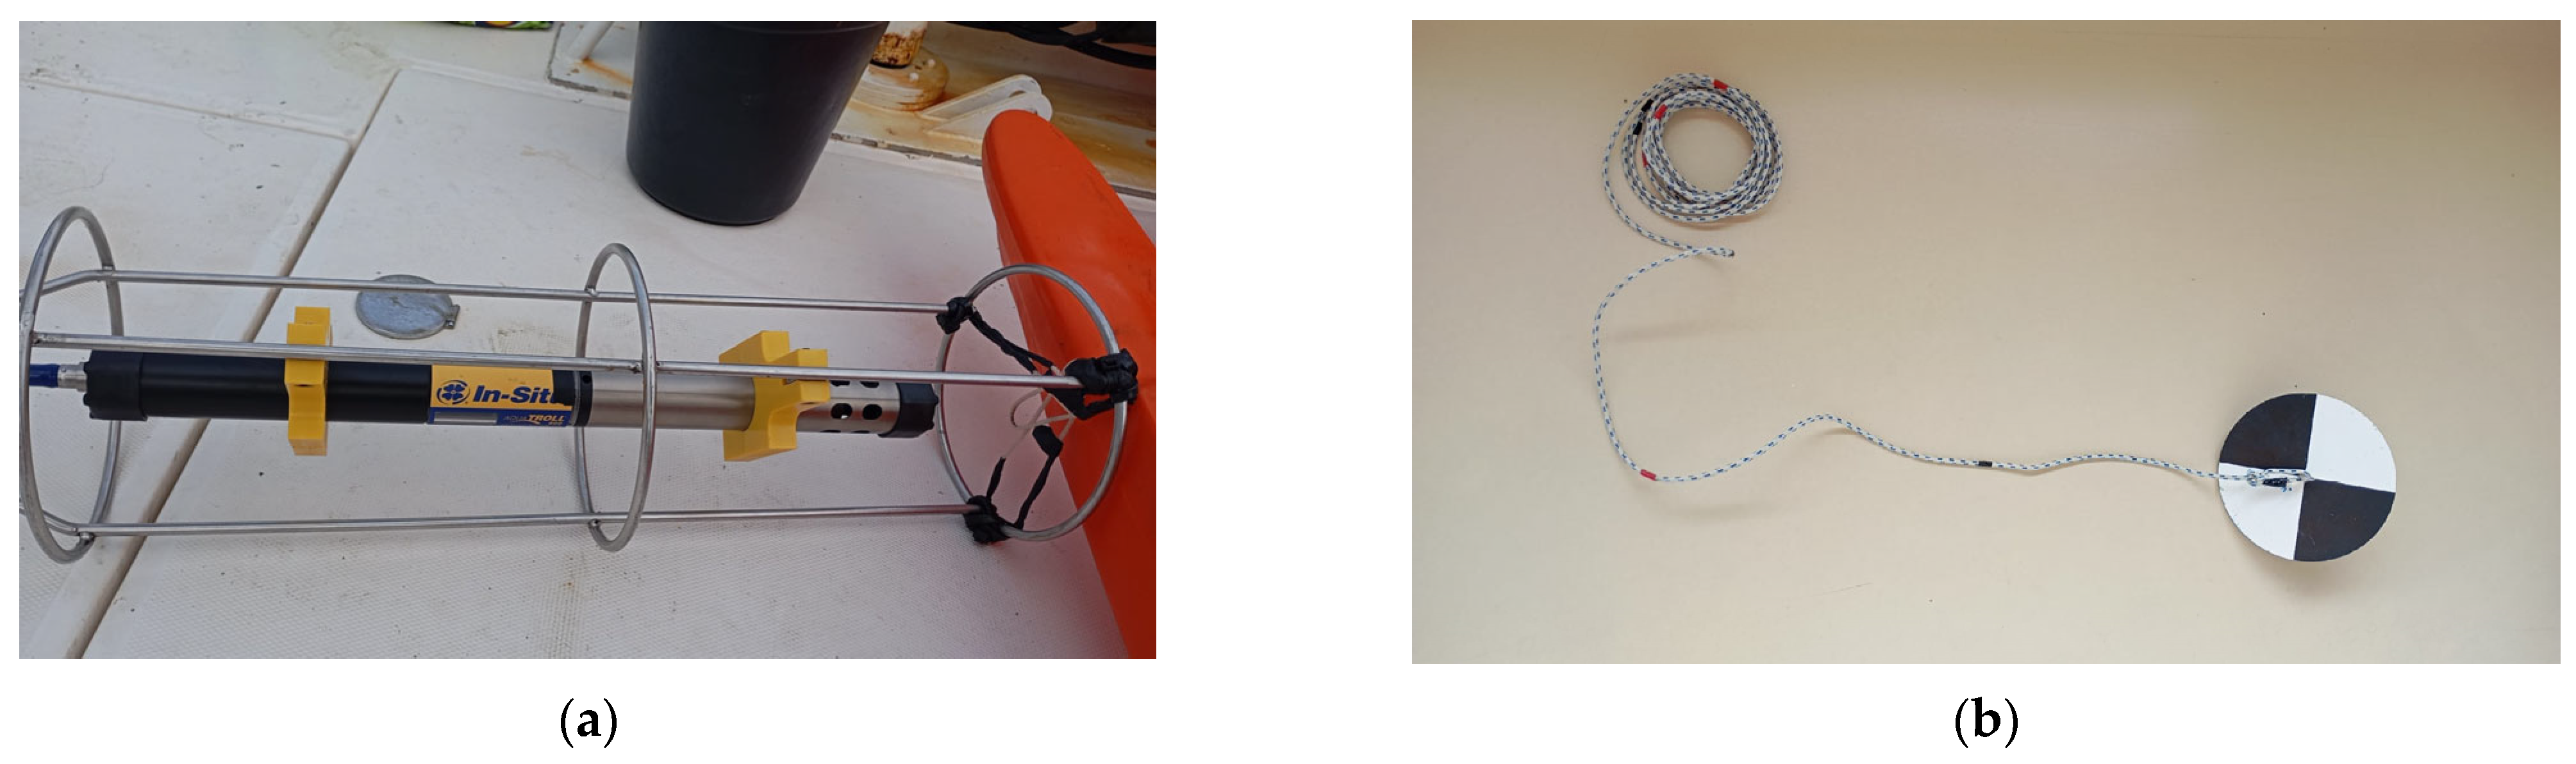
The multiparameter probe (Aqua TROLL 600) (Figure 3a) equipped with a turbidity sensor was used to measure turbidity in Nephelometric Turbidity Units (NTU). At each sampling station, the multiparameter probe was vertically submerged to a reference depth approximately equivalent to the Secchi depth and maintained at that position for approximately 40 s to allow sensor stabilization. Continuous turbidity data were recorded during this interval. Mean turbidity values were subsequently computed to represent water column conditions at the reference depth.
Secchi disk (Figure 3b) readings were obtained at all stations to quantify water transparency.

3.2. Sentinel-2 Data Processing with ACOLITE

In this study, a Sentinel-2 Level-1C image corresponding to the campaign date was obtained from the Copernicus Data Space Ecosystem (https://browser.dataspace.copernicus.eu/ (accessed on 30 May 2025). This image was processed to Level-2A by using the ACOLITE [36] (v20250114.0), a software package developed by the Royal Belgian Institute of Natural Sciences (RBINS) that provides atmospheric correction algorithms specifically designed for coastal remote-sensing applications. Atmospheric correction was performed using the Dark Spectrum Fitting (DSF) algorithm implemented in ACOLITE, which estimates aerosol path reflectance assuming the presence of optically black water pixels in the NIR and SWIR bands and spatially homogeneous aerosol conditions [22,25]. Accordingly, a spatially uniform aerosol optical thickness was estimated over the region, with the aerosol model (continental or maritime) automatically selected by minimizing the root-mean-square difference between observed and modeled path reflectance. The residual glint correction based on SWIR bands was also included within ACOLITE, assuming negligible water-leaving reflectance in the SWIR region [22,25]. Processing was performed for the region of interest defined by the bounding box 40.50°N–40.86°N, 8.80°W–8.60°W, at the native 10 m spatial resolution of Sentinel-2. Non-water pixels were masked using a top-of-atmosphere reflectance threshold of 0.06 in the SWIR band (l2w_mask_threshold = 0.06). In ACOLITE, additional parameters were also configured to control the outputs, enabling the retrieval of Rrs for the spectral bands at 443, 492, 560, 665, 704, 740, 783, 833, and 865 nm, as well as turbidity products (Tur_Nechad2009, Tur_Nechad2016, Tur_Nechad2009Ave, Tur_Novoa2017, and Tur_Dogliotti2015) [19,27,28]. In ACOLITE, turbidity is expressed in Formazin Nephelometric Units (FNU). Thus, the in situ and satellite turbidity data do not use exactly the same units: NTU measurements follow the US EPA standard method, which uses a white light source (~390–700 nm), whereas FNU values comply with the European ISO 7027-1 standard, which requires an infrared light source (780 nm–1 mm). Although these sensor designs differ spectrally, instrument suppliers and processing algorithms frequently use these terms interchangeably, and they can be considered comparable [37].

3.3. Comparison of In Situ and Sentinel-2 Data

In situ turbidity measurements were compared with Sentinel-2 Rrs data processed in ACOLITE to analyze the spectral signature of surface waters. All available sampling points were used, as the measurements represented near-surface conditions corresponding to the satellite’s optical signal. To match in situ measurements with satellite data, Rrs was extracted using each station’s geographic coordinates. For each point, spectral information was retrieved by averaging a 3 × 3-pixel spatial window (corresponding to a 30 m buffer) centered on the exact GPS location recorded during the field campaign. This approach reduces noise and location uncertainty; however, before averaging, a quality-control check was performed to identify anomalous or invalid pixels, and no relevant issues were detected.
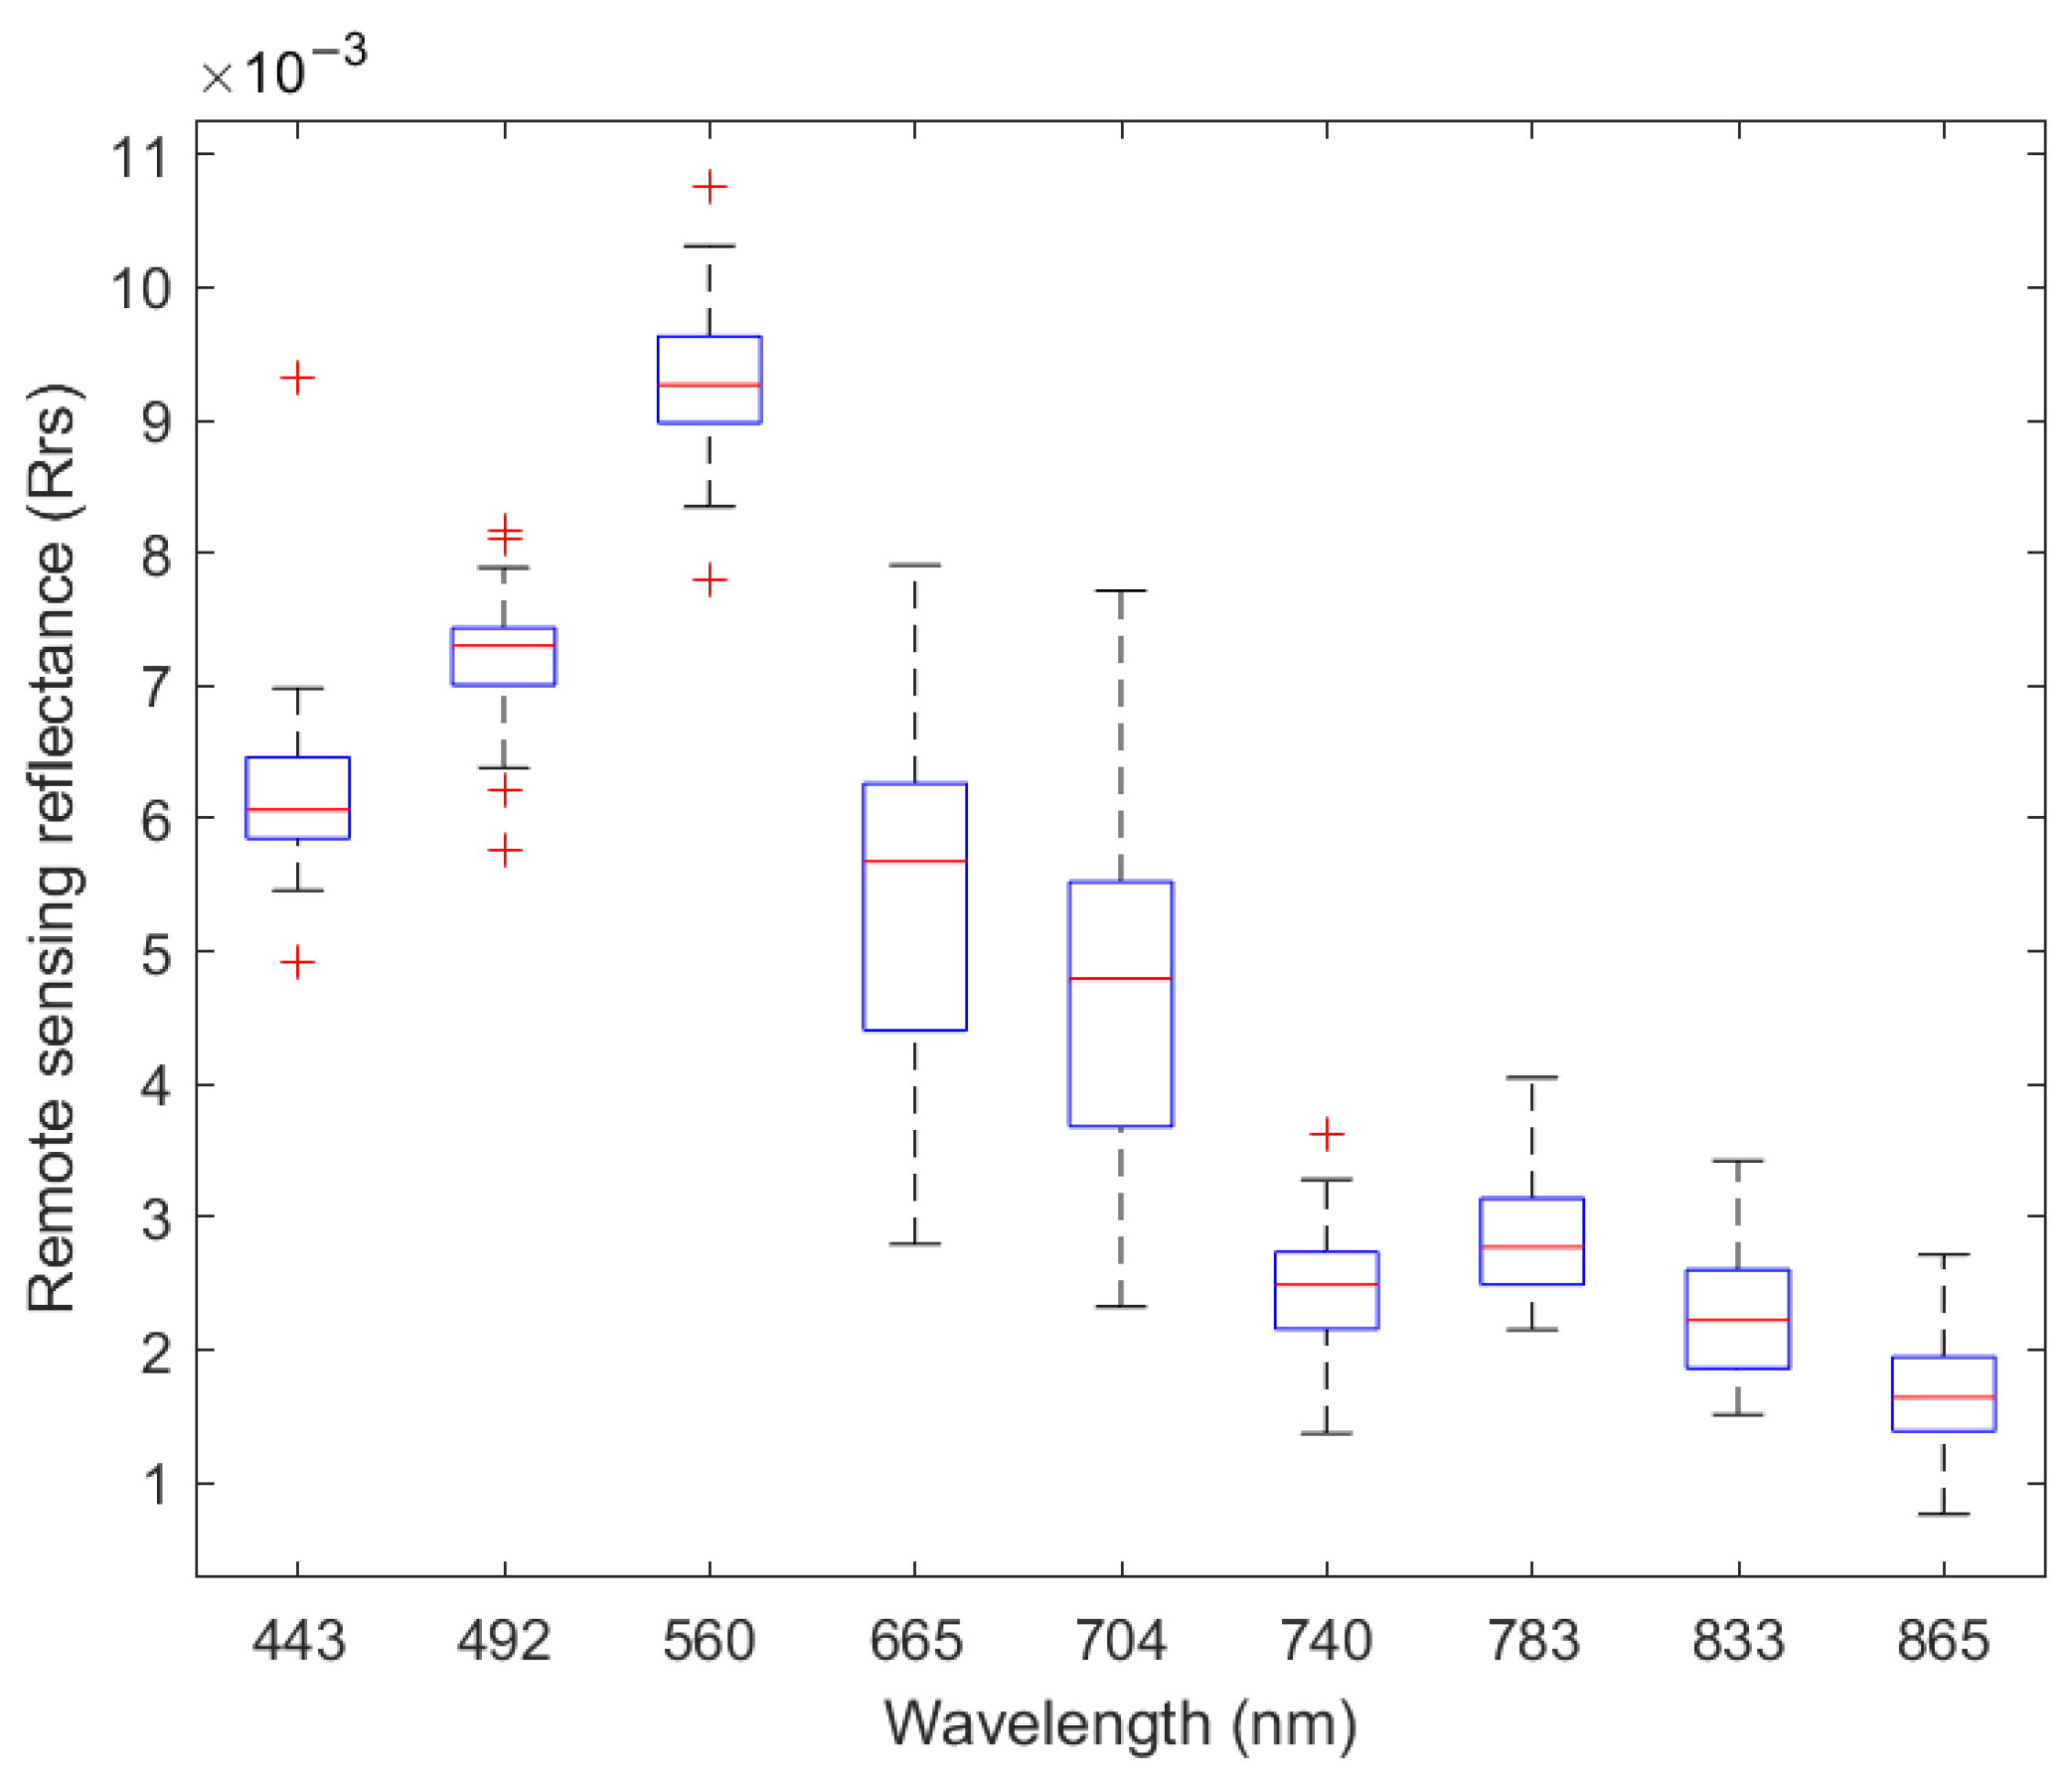
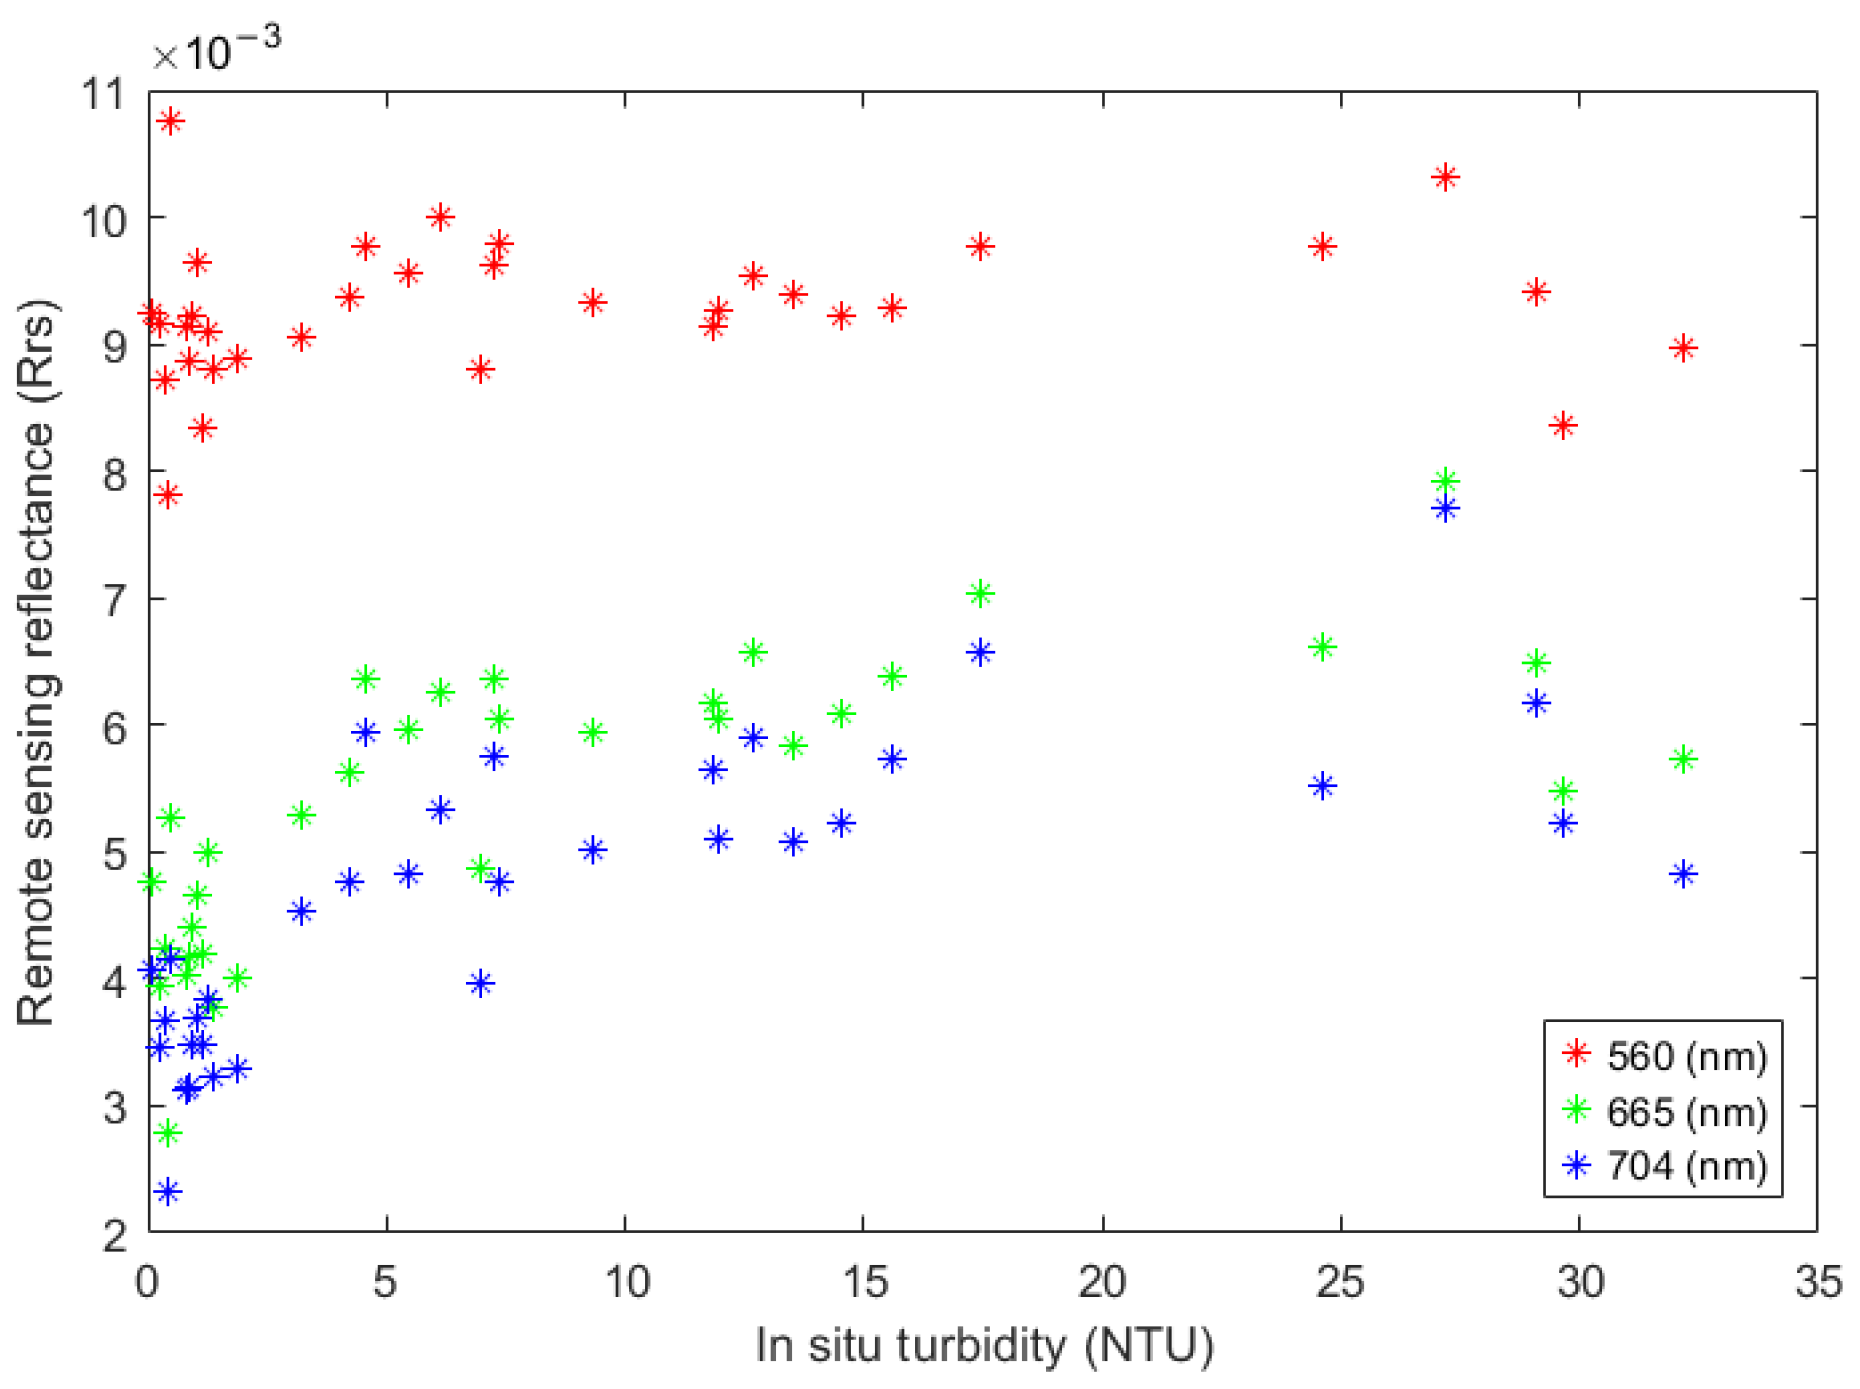
Boxplots were generated to illustrate the variability of Rrs across the different spectral bands, and scatter plots were created to assess the relationship between Rrs and turbidity at 560, 665, and 704 nm—wavelengths typically associated with chlorophyll and suspended particulate matter [38].

3.4. Turbidity Modeling

Initially, the performance of the turbidity algorithms available in ACOLITE for assessing turbidity in the Aveiro lagoon was evaluated by comparing in situ with satellite-derived turbidity, and computing the Root Mean Square Error (RMSE) and the coefficient of determination (R2):
R M S E = 1 n i = 1 n P i O i 2
where n represents the number of sampling points, and Pi and Oi are the satellite-derived and observed turbidity, respectively, in each sampling location (i).
R 2 = 1 ( y i y ^ i ) 2 ( y i y ¯ ) 2  
where yi is the in situ turbidity, y ^ i is the model-predicted turbidity, and y ¯ is the average of the in situ observations.
Additionally, further models were developed. Indeed, to better quantify the relationship between Rrs and in situ turbidity, regression analyses were performed, considering linear (3), exponential (4) and power (5) functions:
y = a x + b
y = a e b x
y = a x b
where x and y are the independent and dependent variables, respectively, and a and b are constants. Equations (4) and (5) were linearized, yielding Equations (6) and (7):
ln y = ln a + b x
log y = log a + b × l o g ( x )
Constants a and b were determined by regression analysis across several models, using satellite-derived variables as independent variables and in situ turbidity as the dependent variable. Satellite-derived variables included Rrs for 560 nm ( R r s 560 ), 665 nm ( R r s 665 ), and 704 nm ( R r s 704 ), Normalized Difference Turbidity Index (NDTI, Equation (8)) [39], and R G r a t i o as the ratio between R r s 665 and R r s 560 ).
N D T I = R r s 665 R r s 560 R r s 665 + R r s 560
R G r a t i o = R r s 665 R r s 560
The use of reflectance ratios for turbidity estimation has been previously explored. Delegido et al. [39] tested multiple ratio-based formulations using Sentinel-2 reflectance data, supporting the applicability of band ratio approaches for turbidity-related analyses.
The performance of each model in assessing turbidity from remote sensing variables was evaluated using the coefficient of determination (R2) and the RMSE. The best-fit regression equation, corresponding to the model with the highest R2, was subsequently applied to the Sentinel-2 image from 28 May 2025 to produce a spatially continuous turbidity map of the study area. The regression models were calibrated and evaluated using the same synchronous match-up dataset; therefore, the reported R2 and RMSE represent in-sample calibration performance rather than independent validation metrics.

4. Results

4.1. Observational Data

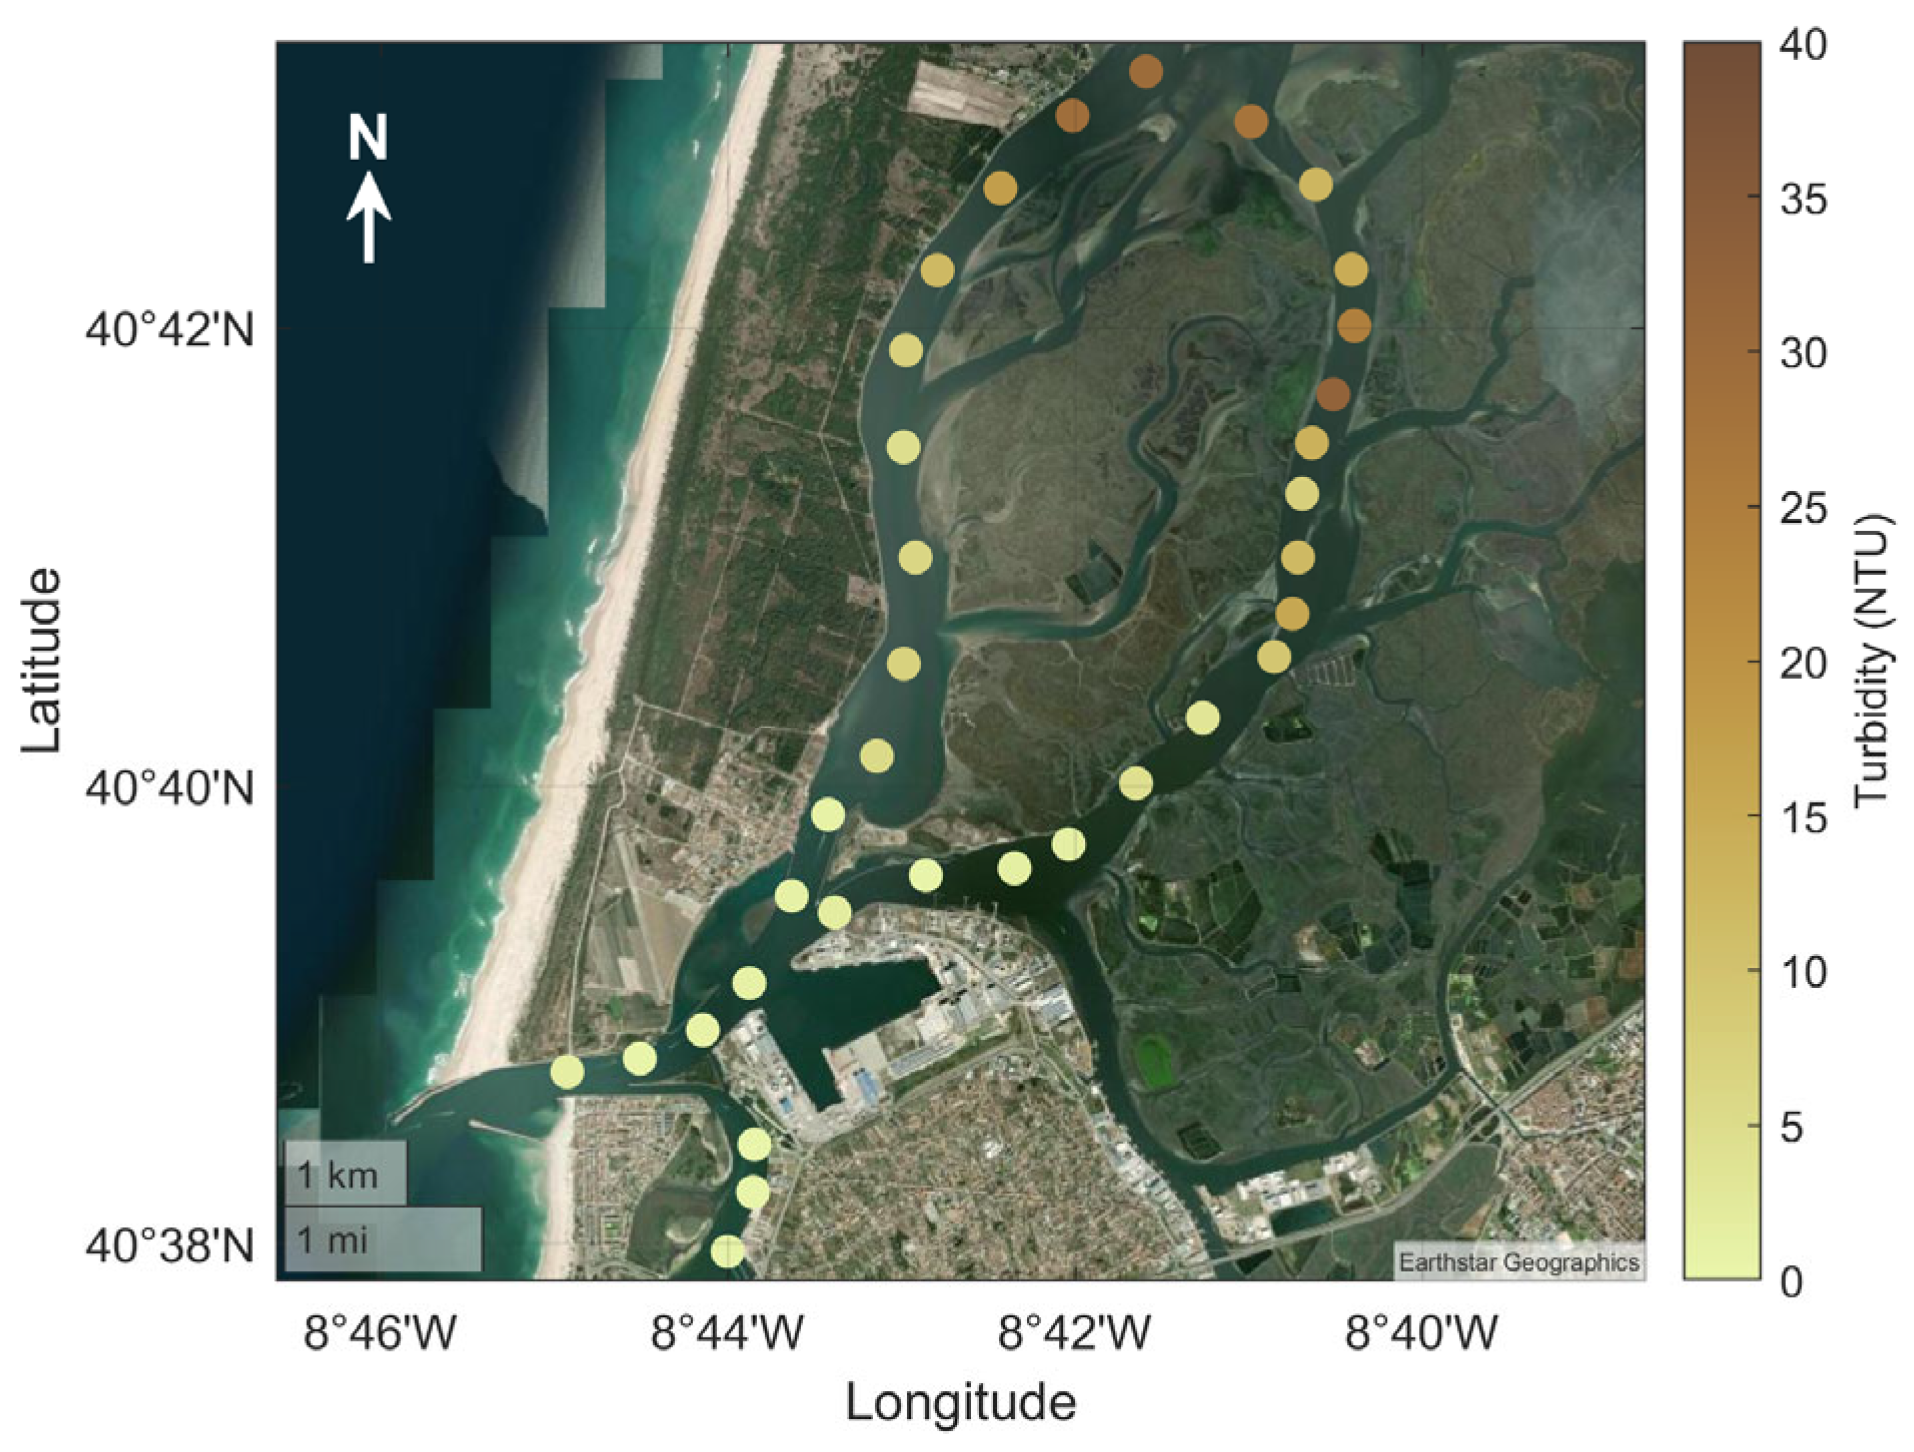
Turbidity values exhibited a clear spatial gradient along the Espinheiro Channel (Figure 4), with the lowest concentrations (<10 NTU) observed near the lagoon inlet and progressively increasing toward the inner lagoon, where the highest values (>30 NTU) were recorded.
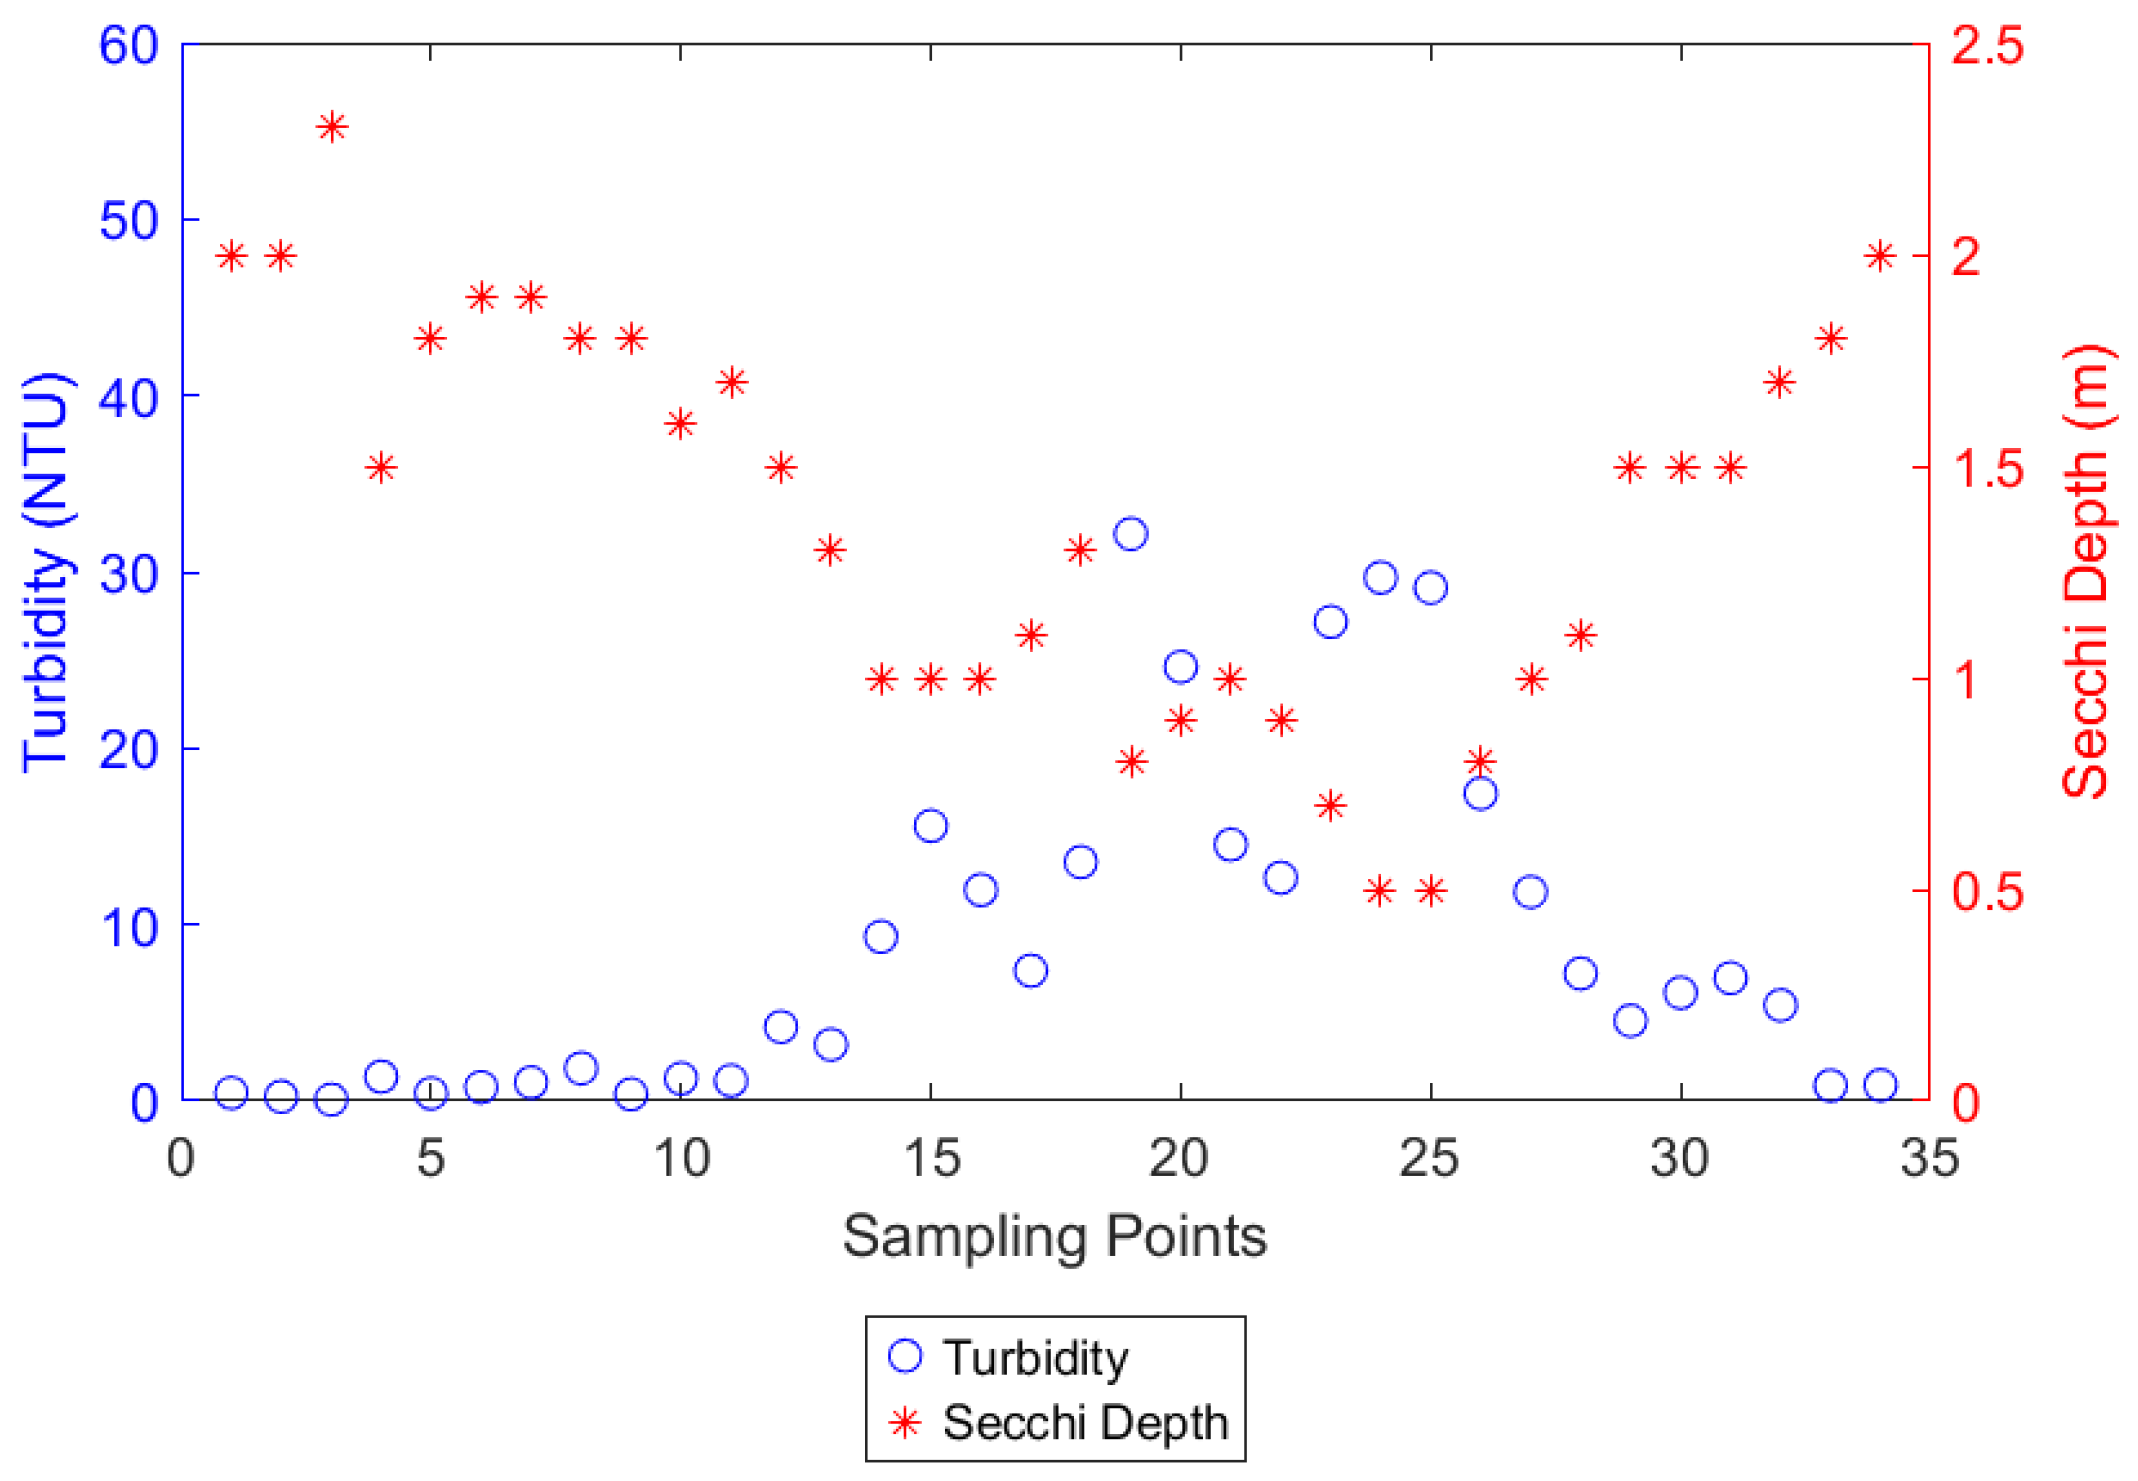
Figure 5 presents the scatter plots illustrating the relationship between turbidity and Secchi depth at the sampling locations. A general decrease in turbidity values was observed, with values close to zero recorded in the lower part of the Aveiro lagoon. In contrast, Secchi depth values were relatively high, reaching approximately 2 m, indicating improved water transparency. This comparison corroborates the inverse relationship between turbidity and Secchi depth.

4.2. Comparison Between In Situ and Satellite Data

Figure 6 presents the distribution of Sentinel-2 Rrs across the spectral bands acquired on 28 May 2025. The 560 nm band exhibited the highest reflectance values, though with relatively low dispersion. In contrast, the 665 nm band showed a wider spread of reflectance values, reflecting greater variability among the sampling locations. The 704 nm band showed a distribution pattern similar to that at 665 nm, but with lower overall reflectance levels.
The relationship between in situ turbidity and Sentinel-2 reflectance is shown in Figure 7. Among the examined bands, the 560 nm wavelength showed the highest reflectance values, ranging approximately from 8 × 10⁻³ to 1 × 10⁻², although these values were confined to a relatively narrow interval. Conversely, the 665 nm and 704 nm bands exhibited lower reflectance magnitudes but a broader distribution (approximately 2.5 × 10⁻³ to 7.5 × 10⁻³), indicating substantial variability across sampling points.

4.3. Turbidity Modeling Based on Sentinel-2 Reflectance

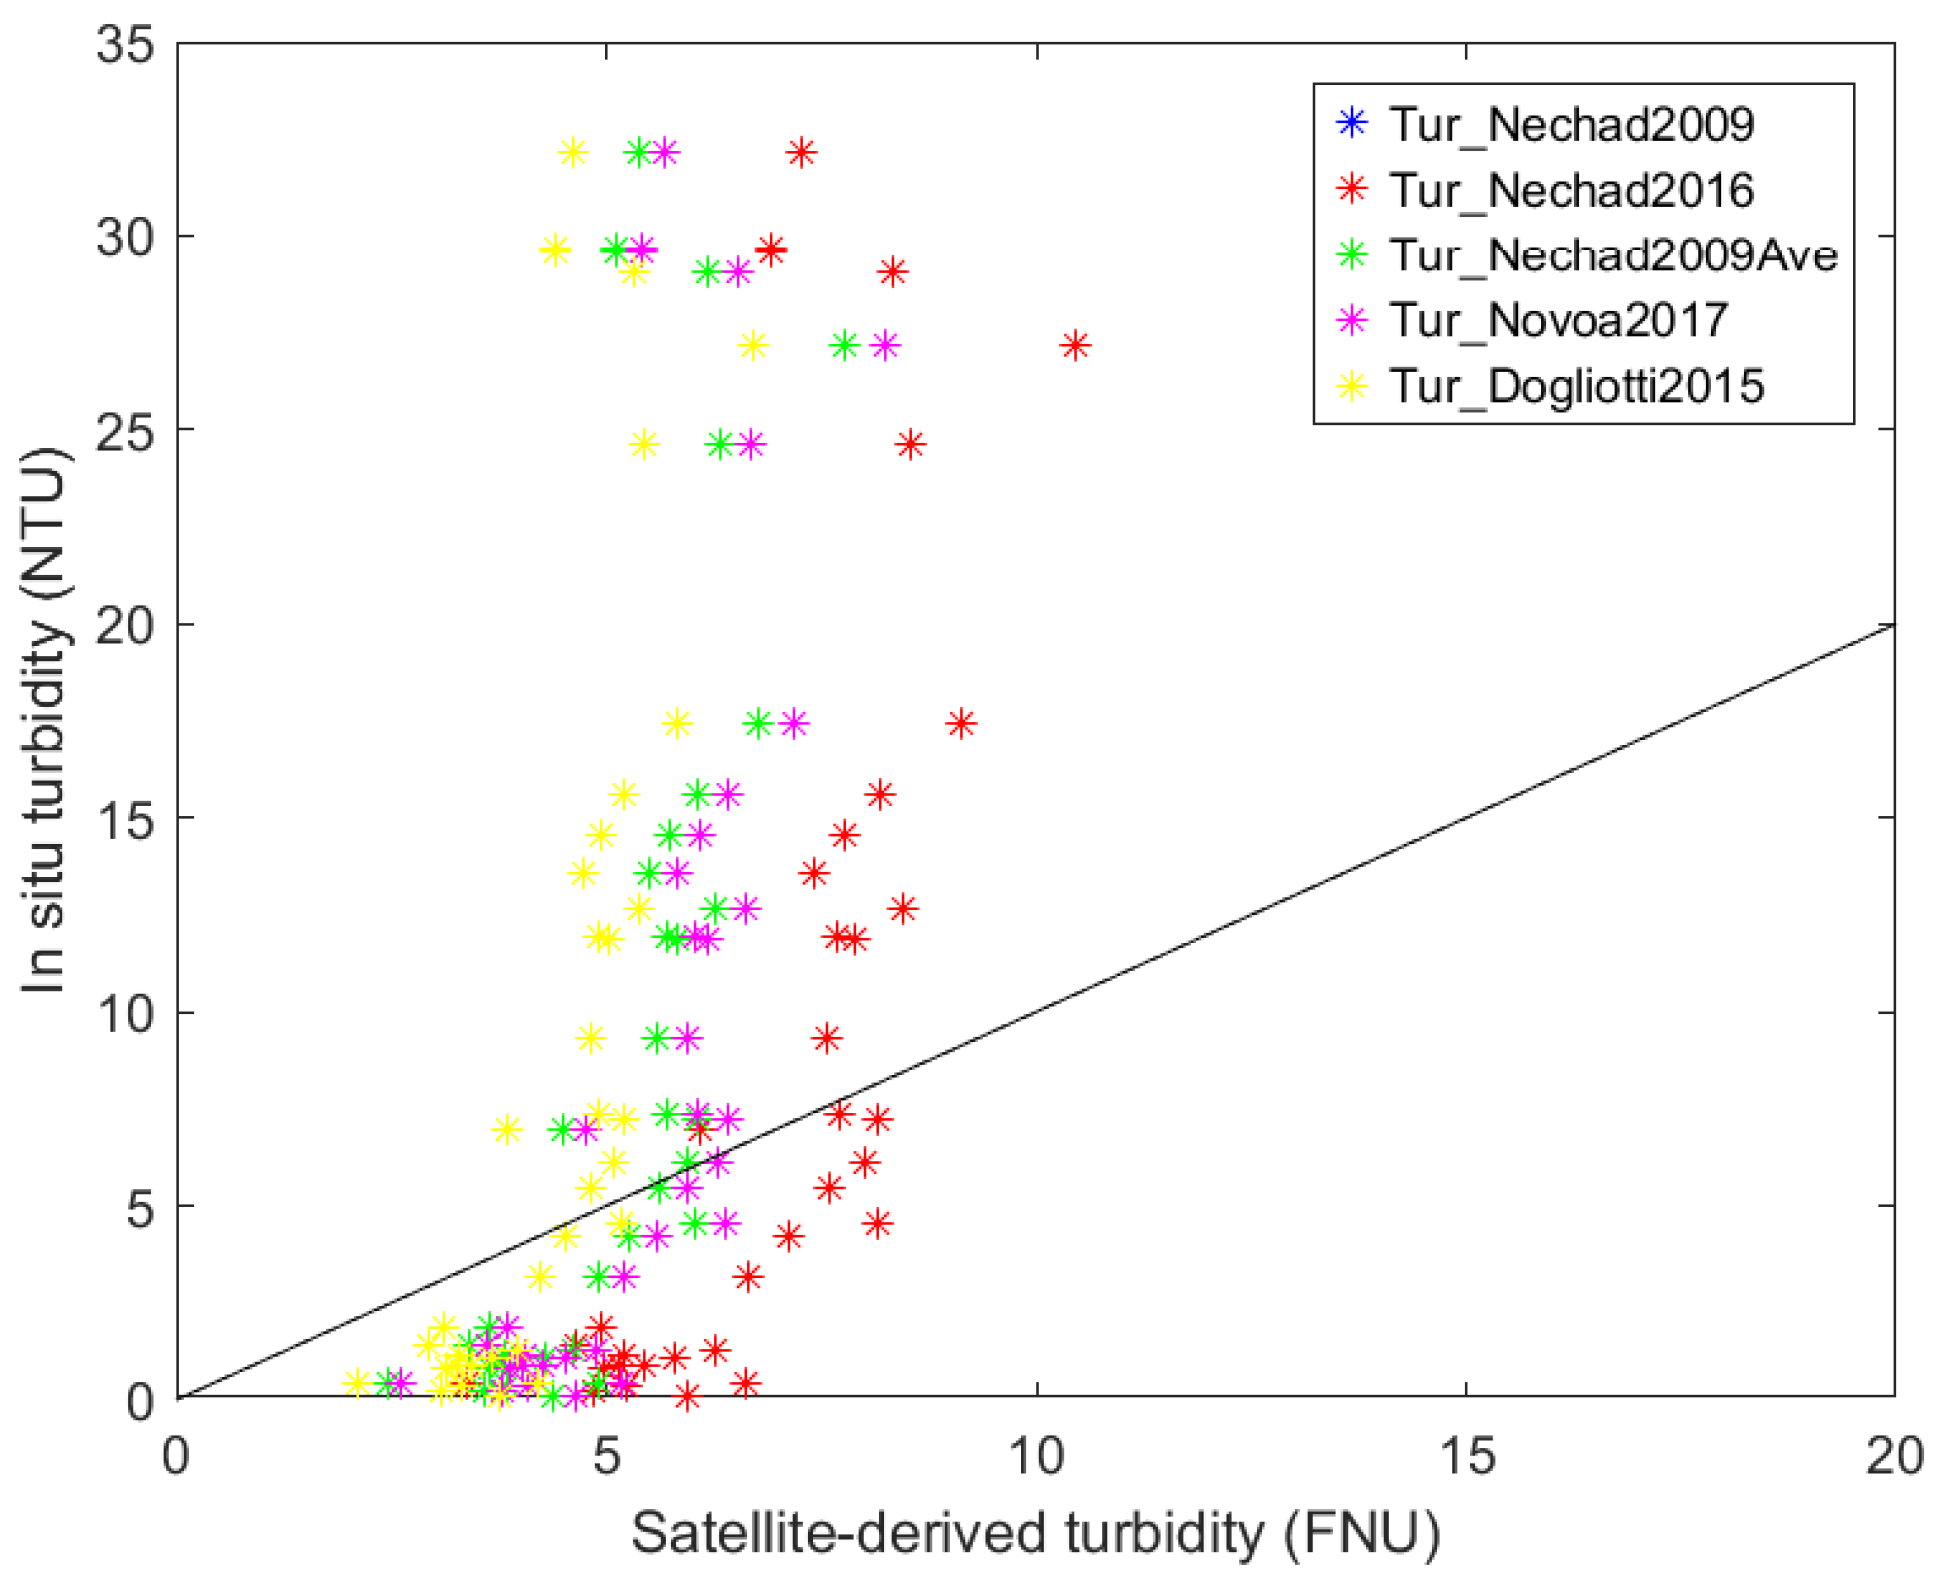
Figure 8 compares in situ turbidity measurements with satellite-derived turbidity estimates from the ACOLITE turbidity algorithms for 28 May 2025. The Tur_Nechad2009 algorithm (blue symbols) was indistinguishable from that of Tur_Novoa2017 (magenta symbols), as they overlapped. Although in situ measurements exhibited a wide dynamic range, satellite-derived values ranged only from 4 to 7 FNU, indicating a general underestimation of higher turbidity levels.
The performance of the various turbidity algorithms (Table 1) revealed relatively high errors across all tested processors, ranging from a minimum of 8.30 NTU for Tur_Nechad2016 to a maximum of 9.60 NTU for Tur_Dogliotti2015, confirming that none of the standard algorithms adequately describe the variability of in situ turbidity measurements in the Aveiro lagoon. These results highlight the need to calibrate local models that more precisely describe the lagoon’s optical conditions and turbidity range.
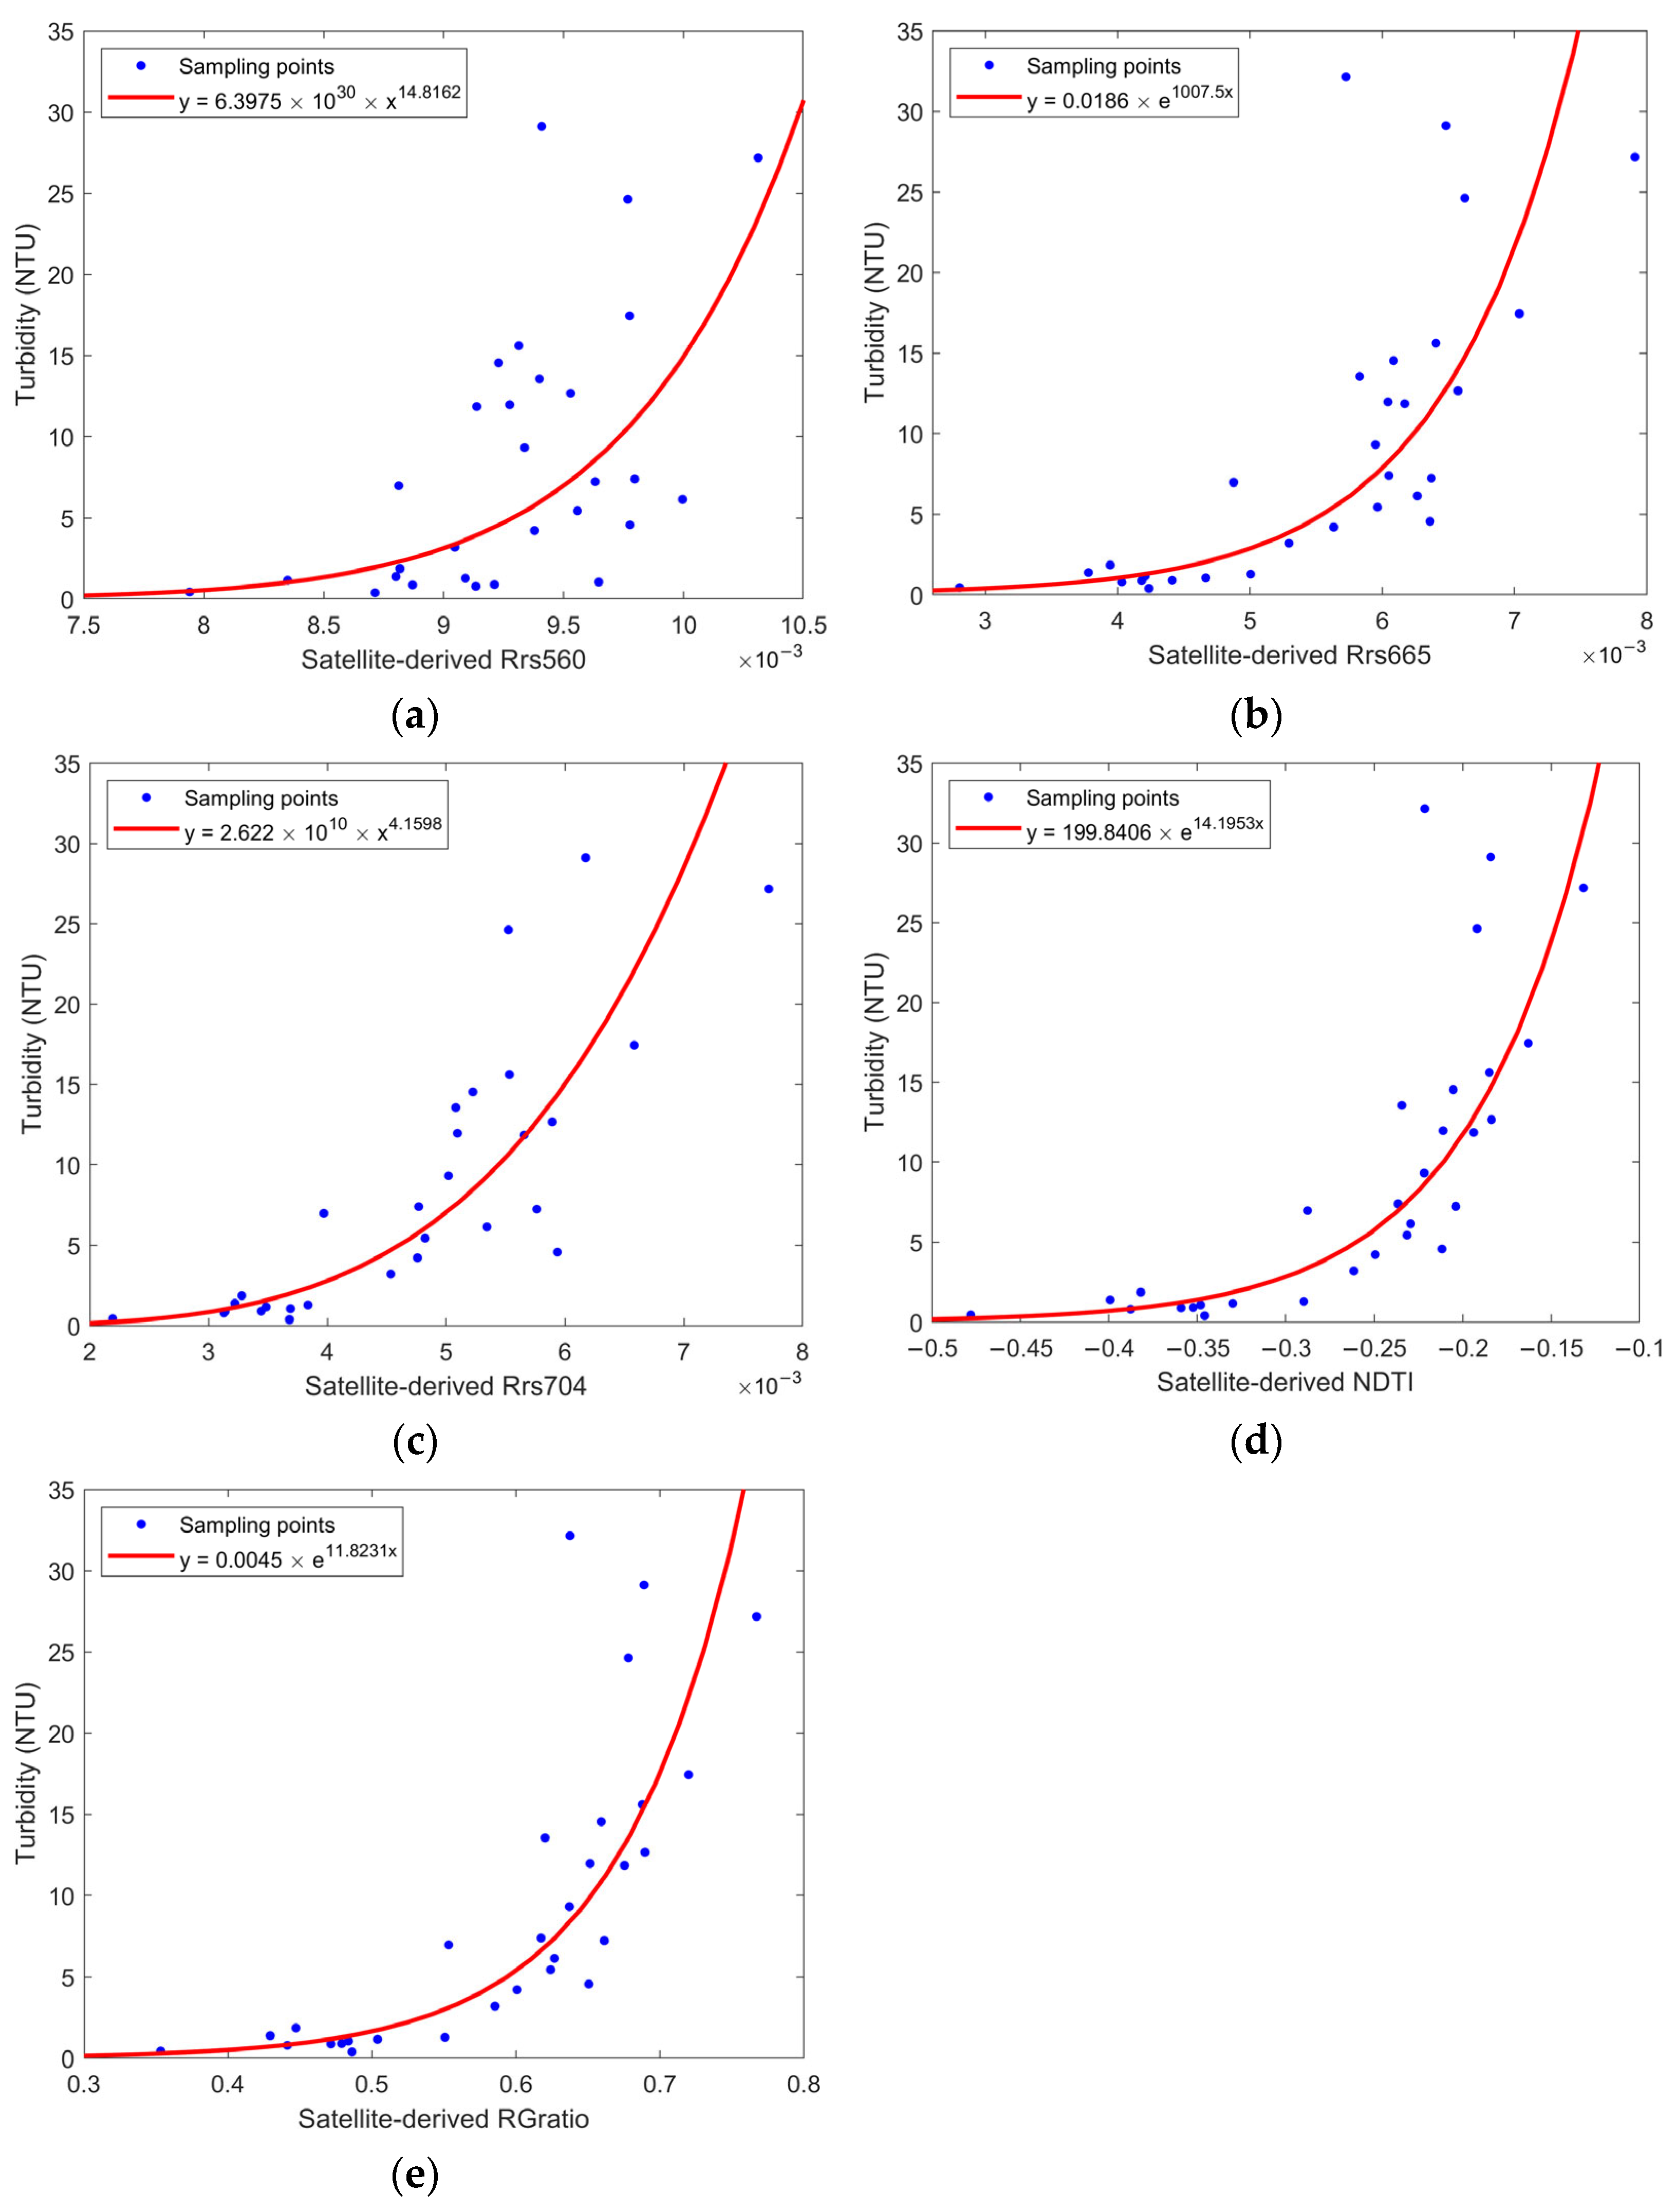
The regression results presented in Table 2 showed that the R G r a t i o was the best predictor of turbidity, yielding the highest performance among all tested bands and spectral indices, with an R2 of 0.822 and an RMSE of 1.77 NTU. Figure 9 supports this result, showing that the exponential models reproduce in situ turbidity variability more consistently, with individual bands (Figure 9a–c) performing worse than NDTI and R G r a t i o (Figure 9d,e).
Among the tested indices, R G r a t i o showed the most consistent agreement with in situ measurements and was therefore selected to derive the final turbidity model for the Aveiro lagoon on 28 May. Applying the natural logarithm transformation to the exponential regression yielded the linear form in Equation (6), with ln a = 5.4123 and b = 11.8231 . Back-transforming gives a = e 5.4123 = 0.00445 , resulting in the final empirical equation:
y = 0.00445 × e 11.8231 x
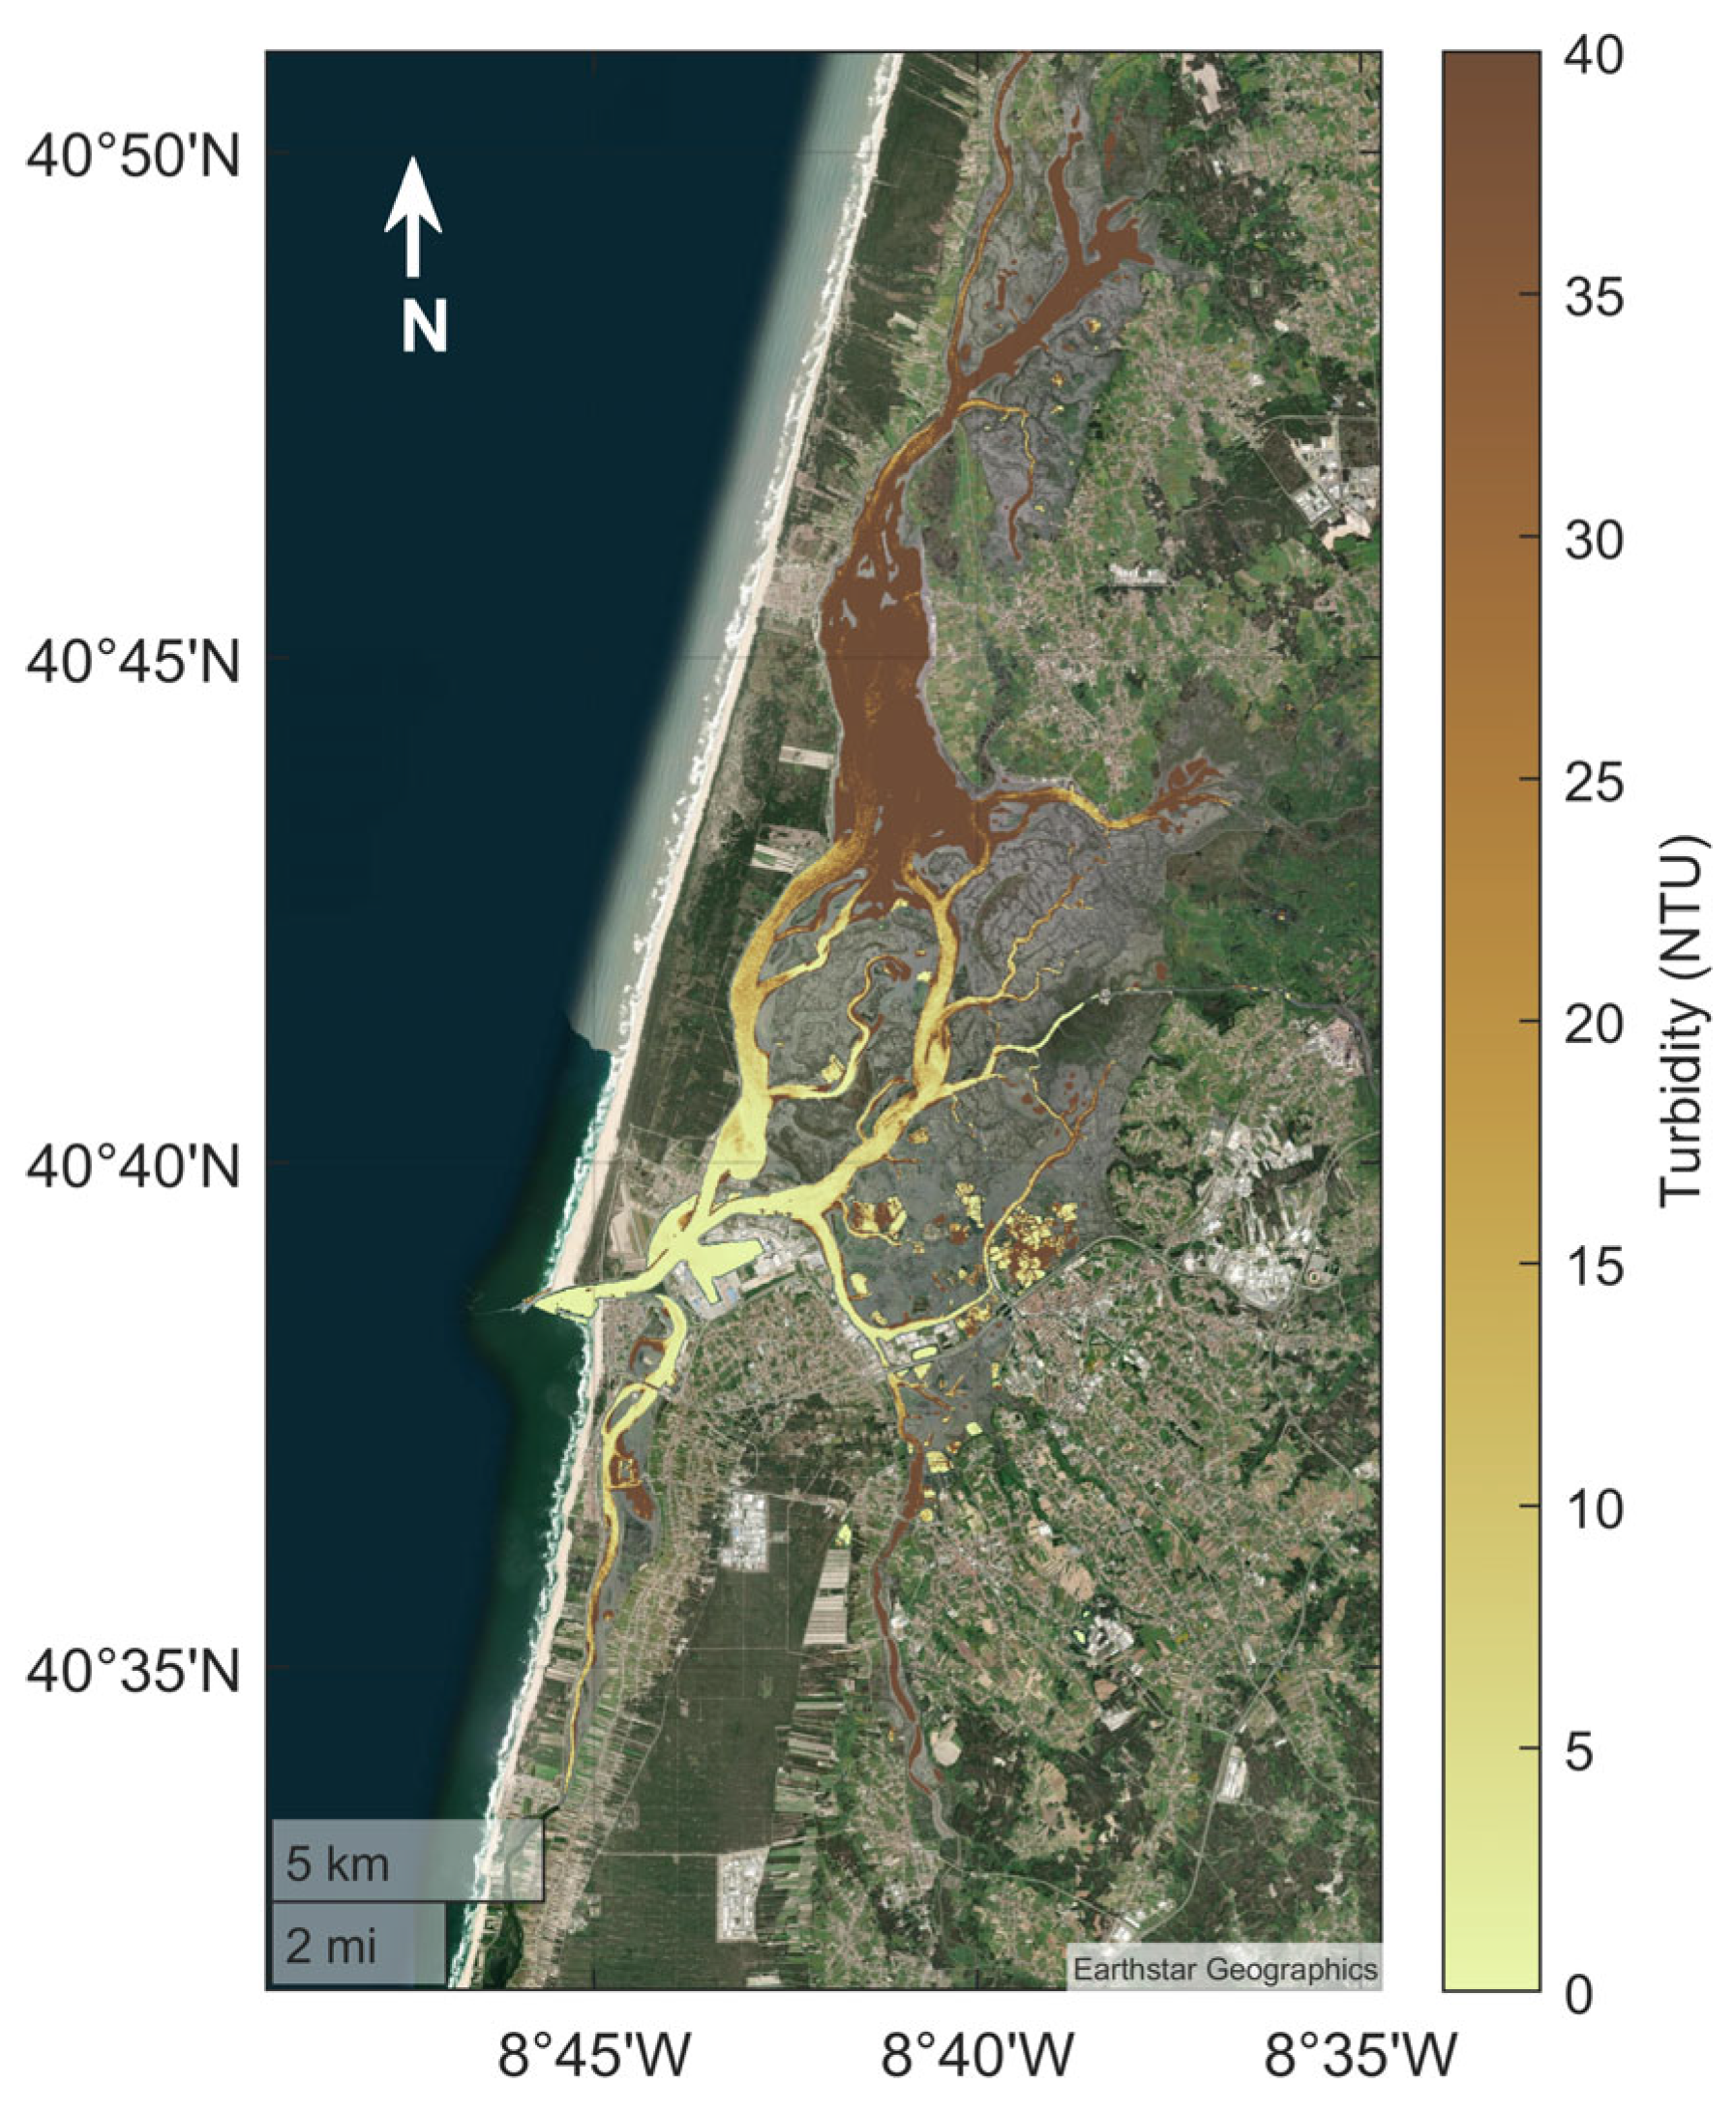
Applying Equation (10) to the Sentinel-2 imagery produced the turbidity map shown in Figure 10, which reproduces the spatial pattern observed in the in situ measurements (Figure 4): a clear horizontal gradient, with lower values near the lagoon inlet and a progressive increase towards the inner areas.

5. Discussion

5.1. Relationship Between Turbidity and Water Transparency

Effler [40] demonstrated that the relationship between Secchi disk transparency and turbidity in different freshwater systems can be described by an inverse relationship, which is more predictable and stronger at higher turbidity levels (T > 5 NTU), where scattering processes dominate over absorption.
The inverse relationship observed between turbidity and Secchi depth during the 28 May 2025 campaign reflects the direct influence of suspended particulate matter on water transparency in the Aveiro lagoon. Lower turbidity values, particularly in the southern sector and near the inlet, were associated with greater water clarity, as evidenced by Secchi depths of 2 m or more. Such spatial gradients align with frequent observations in other dynamic estuarine systems [29,41], including recent assessments in the Neva Estuary [42], which highlight how environmental variables and hydrodynamic patterns govern the localized optical variability of water transparency.
The reduced turbidity observed during this campaign may be attributed to calmer hydrodynamic conditions and lower fluvial discharge [43]. Furthermore, the satellite overpass occurred during a flooding tide, which promotes the inflow of clear marine water into the lagoon. This tidal stage facilitates the dilution of suspended particulate matter, especially near the inlet and main channels, explaining the low turbidity values recorded during the field survey [28,35,41]. In coastal marine environments, Kratzer et al. [44] associated Secchi depth with turbidity caused by suspended sediments, and attributed data variability to wind forcing that resuspends sediments in shallow waters.
Furthermore, the relationship between these variables is not static, following an annual cycle in which sediment concentrations are generally higher in winter and lower in summer [41]. According to Wilson & Heath [45], this seasonal variability is driven by multiple factors, ranging from intensified hydrodynamic forcing and runoff in winter to calmer conditions and biological processes during summer.

5.2. Spectral Assessment

The spectral analysis highlights distinct optical responses across the visible and near-infrared wavelengths. The 560 nm band exhibited the highest reflectance values but within a narrow range, indicating that the Rrs signal at this wavelength is less sensitive to moderate variations in suspended sediment concentration. In contrast, the 665 nm and 704 nm bands showed broader reflectance distributions, suggesting greater responsiveness to changes in turbidity levels.
This pattern is consistent with the known absorption and scattering behavior of optically active constituents in coastal waters [20,21]. The 560 nm band corresponds to the green region of the spectrum, where water reflectance tends to saturate at moderate turbidity levels. Conversely, reflectance in the red (665 nm) and red-edge (704 nm) regions increases more proportionally with suspended sediment concentration [38]. For example, Jiang et al. [20], utilized this band relationship to overcome signal saturation and ensure accurate spatiotemporal variations in the Yellow River.

5.3. Turbidity Estimate from Sentinel-2 Reflectances

The evaluation of the standard turbidity algorithms available in ACOLITE (Table 1) demonstrated that these models are not fully suitable for the Aveiro lagoon. All tested models exhibited a tendency to overestimate low turbidity values while significantly underestimating higher in situ turbidity. Furthermore, the computed RMSE were consistently high across all processors, reinforcing their lack of precision for this specific system. To better understand why the ACOLITE turbidity algorithms may be inadequate for the Aveiro lagoon, it is important to consider both the specific sampling conditions in the lagoon and the assumptions underlying the turbidity ACOLITE products. In the Aveiro lagoon, several of the sampled channels are very shallow, with depths below 5 m at stations P11–P33 (see Figure 2). In addition, these channels are narrow, often less than 50 m wide, so the remotely sensed signal may include substantial contributions from bottom reflectance in shallow areas and from adjacent intertidal zones, leading to mixed pixels. This issue is particularly relevant because single-band algorithms, such as those implemented in ACOLITE, are generally more sensitive to these effects and to uncertainties in atmospheric correction than band-ratio approaches, which minimize them [46,47]. Moreover, the ACOLITE algorithms assume little or no spatial variability in the backscatter coefficient and that non-particulate absorption remains constant and is dominated by pure water [46]. These assumptions are appropriate for optically homogeneous waters, but may be inadequate for lagoonal systems, such as the Aveiro lagoon, where suspended sediments are resuspended from the bed by tidal currents [48]. Because bed sediment composition is spatially variable, with mixtures of sand (2–90%), silt (10–80%), and clay (0–30%) [49,50], the backscatter coefficient is also expected to vary spatially. In addition, given the documented degradation of salt marshes and the associated organic matter inputs [51], absorption by dissolved organic matter may be locally important and spatially heterogeneous, as dissolved organic matter in the Aveiro lagoon shows a gradient between marine-influenced and more oceanic zones [52].
The limitations observed when applying global models to the Aveiro lagoon are consistent with previous findings in estuarine systems with high turbidity levels. Chowdhury et al. [18] demonstrated that standard models relying on a single spectral band often fail to capture the full environmental variability due to signal saturation, and developed a multi-conditional algorithm that dynamically switches between the red band (665 nm) for low turbidity and the red-edge band (704 nm) for high-turbidity zones, implementing a weighted transition to ensure data continuity.
Sensor specificity also plays a critical role in model performance. Maciel et al. [53] noted that the Tur_Dogliotti2015 algorithm, originally calibrated for the MODIS sensor, tends to overestimate turbidity when applied to Landsat imagery without proper recalibration. Similarly, García-Tuñon et al. [54] evaluated the Tur_Nechad2009 and Tur_Nechad2016 models and found a moderate correlation (R2 = 0.40), highlighting that the direct application of standard algorithms without considering local optical properties compromises retrieval accuracy.
Given these limitations, regression models were developed to best fit the characteristics of the Aveiro lagoon. Comparing the different modeling approaches, linear regressions yielded lower correlation values than the exponential and power functions. This suggests that the optical response in the lagoon follows a nonlinear relationship with increasing suspended sediment concentration. This behavior is consistent with Doxaran et al. [55], who suggested that nonlinear relationships may provide better fits between suspended particulate matter and Rrs, depending on the optical conditions and the concentration range analyzed.
Additionally, the combination of two spectral bands proved to be more effective at capturing the complexity of the lagoon than using a single band. The best overall performance was achieved by the exponential regression using the R G r a t i o . These results represent an improvement over the standard algorithms for this study area, suggesting that the proposed approach has potential for monitoring the water quality of this system. The superior performance of the R G r a t i o over single-band models can be explained by the optical characteristics of the Aveiro lagoon waters. The 560 nm band lies near a local minimum of chlorophyll-a absorption [56] and in a spectral region where dissolved organic matter absorption has already strongly decayed [57], being dominated by suspended particulate backscattering [58]. The 665 nm band, in contrast, lies close to the secondary chlorophyll-a absorption peak [56] and in a region of moderate pure-water absorption [59], where Rrs is low in clear waters but increases sharply with suspended particulate matter due to the strong contrast between particle scattering and water absorption. The ratio of the two bands, therefore, amplifies the suspended particle backscattering signal at 665 nm while normalizing it against the more stable background at 560 nm, with the advantage of canceling out effects that are common to both bands—such as illumination geometry, residual atmospheric correction errors, and part of the dissolved organic matter contribution—which a single-band model cannot remove [47]. The slightly lower performance of the NDTI compared to the R G r a t i o may be related to limitations in its formulation. The normalized-difference structure compresses the signal to [−1, 1], amplifies radiometric noise by subtracting reflectances of comparable magnitude, and only partially cancels common multiplicative effects such as residual atmospheric correction errors and absorption by colored dissolved organic matter.

5.4. Uncertainties and Limitations of the Local Regression Model

Although the locally calibrated turbidity model produced satisfactory results, it is important to note that both the satellite-derived Rrs data and the in situ turbidity measurements are subject to uncertainties that may influence the regression results.
Regarding the satellite data, in addition to the land adjacency and bottom reflectance effects discussed above, Rrs is also affected by atmospheric effects. Indeed, atmospheric correction remains one of the major challenges in the production of satellite ocean color products, since the atmospheric contribution typically accounts for more than 80–90% of the top-of-atmosphere signal recorded by the sensor in the visible bands [60,61]. In this study, we used the Dark Spectrum Fitting algorithm implemented in ACOLITE, specifically adapted for Sentinel-2 data over coastal and inland waters [22,25], and widely and successfully applied in coastal and estuarine studies [18,62]. The in situ turbidity measurements were collected using a multiparameter probe with an accuracy of 2% of reading as specified by the manufacturer [63]. However, during measurements at each sampling point, some difficulty was observed in reaching stable readings. For this reason, the mean value of the records at each point was used. The standard deviations ranged between 0.3 and 5.1 NTU, recorded at points P9 and P25, respectively, corresponding to approximately 82% and 18% of the observed turbidity values. This within-point variability suggests that part of the model uncertainty may be related not only to the satellite signal, but also to natural variability in the water column and to the instrumental uncertainty of the field measurements.
Moreover, it is also important to consider the temporal mismatch between the in situ measurements, collected between 11:30 and 14:45, and the Sentinel-2 acquisition, which occurred at 12:30. Despite this mismatch, turbidity data from all sampling points were used, as this approach produced the best model performance. Indeed, when only the data collected within one-hour or two-hour windows centered on the satellite overpass were used, model performance decreased. This was probably due to the substantial reduction in sample size to 13 and 24 points, respectively, which may have limited the model’s ability to represent the spatial variability of turbidity across the study area. The interpretation of this temporal mismatch should also consider the hydrodynamic context of the field campaign. Sampling began near slack water, at a sea level of approximately 0.65 m, when current velocities are generally reduced. In addition, the sampling route partly followed the inland propagation of the tidal wave, which typically experiences a phase lag as it moves through shallow and narrow lagoon channels [64]. Therefore, for a large proportion of the sampling points, namely P1 to P23, current velocities were likely relatively low. At the remaining points, current velocity may have been higher because the route was carried out in the opposite direction to tidal propagation, and by the end of the sampling period, sea level had already increased to approximately 2.95 m. In summary, although there was a temporal offset between the Sentinel-2 acquisition and the in situ turbidity measurements, a substantial part of the field campaign was conducted under conditions close to slack water. Therefore, the influence of tidal forcing variability on sediment resuspension was likely limited during much of the sampling period.
It is also worth noting that the model is based on data collected during a single field campaign and therefore represents only one hydrodynamic and optical state of the lagoon. As a result, its robustness and transferability to other seasons, tidal stages, and hydro-meteorological conditions remain untested. The present model should therefore be interpreted as a local calibration for the specific conditions observed during the campaign, rather than as a fully generalized turbidity retrieval model. Additional field campaigns covering a broader range of environmental conditions would be required to evaluate and improve its general applicability. Seasonal changes in river discharge, wind forcing, and sediment resuspension are expected to influence turbidity patterns, with higher values typically occurring in winter and lower values in summer. Consequently, surveys conducted in different seasons would be essential to obtain a more robust representation of the lagoon’s dynamics throughout the year, while also providing independent datasets for external model validation.

6. Conclusions

This study investigated the potential of high-resolution Sentinel-2 MSI imagery for estimating turbidity in the Aveiro lagoon, a morphologically complex and optically heterogeneous coastal lagoon.
The results demonstrated that the turbidity algorithms in ACOLITE did not adequately capture turbidity variability in the Aveiro lagoon, particularly at higher levels, which were consistently underestimated. This limited performance indicates that these algorithms are not fully transferable to coastal lagoon environments without local calibration. Their reduced accuracy is likely associated with assumptions that are not valid in the Aveiro lagoon, including the assumption of relatively constant particle backscattering and non-particle absorption mainly controlled by pure water. In the Aveiro lagoon, these assumptions are challenged by suspended sediments with heterogeneous particle sizes and high concentrations of decomposing organic matter, which induce significant spatial variability in the water’s optical properties.
The locally calibrated empirical models showed that band-ratio approaches outperformed single-band models. The best performance was obtained with the R G r a t i o index using an exponential relationship, suggesting that band-ratio algorithms are better suited to the optical complexity of the Aveiro lagoon, as they can partially reduce the influence of atmospheric, bottom reflectance, and land adjacency effects. In the Aveiro lagoon, the signal detected by the satellite sensor may be strongly affected by bottom reflectance and adjacency effects from surrounding land, intertidal flats, mainly due to the shallow depth and narrow width of many lagoon channels. Single-band algorithms are particularly sensitive to these effects, whereas band-ratio approaches can partially minimize them by normalizing the reflectance signal.
Overall, this study confirms the potential of Sentinel-2 MSI for monitoring turbidity in the Aveiro lagoon. The use of satellite imagery can help overcome some of the limitations of in situ measurements by providing a broader and synoptic view of turbidity patterns across the lagoon. However, because the proposed model was calibrated from a single field campaign and has not yet been independently validated, its applicability is currently limited to the tidal, wind, and river discharge conditions sampled during this study. Further validation is therefore still required using independent in situ datasets, ideally collected under different environmental, seasonal, and tidal conditions, to assess the model’s robustness and transferability.
Finally, this study reinforces the potential of integrating in situ monitoring and remote sensing for water quality management. It also highlights the importance of collecting high-quality data and employing models tailored to the specific study system, paving the way for more precise and applicable future investigations in the Aveiro lagoon.

Author Contributions

Conceptualization, C.L.L. and J.M.D.; methodology, C.L.L. and J.M.D.; software, C.L.L. and A.C.; validation, C.L.L. and A.C.; formal analysis, C.L.L., A.C. and J.M.D.; investigation, C.L.L. and A.C.; resources, C.L.L. and J.M.D.; data curation, H.P., C.L.L. and A.C.; writing—original draft preparation, A.C. and C.L.L.; writing—review and editing, C.L.L., A.C., H.P. and J.M.D.; visualization, A.C.; supervision, C.L.L. and J.M.D.; project administration, C.L.L. and J.M.D.; funding acquisition, J.M.D. All authors have read and agreed to the published version of the manuscript.

Funding

This work was funded by national funds through FCT—Fundação para a Ciência e a Tecnologia I.P., under the project CESAM-Centro de Estudos do Ambiente e do Mar, references UID/50017/2025 (doi.org/10.54499/UID/50017/2025) and LA/P/0094/2020 (doi.org/10.54499/LA/P/0094/2020).

Data Availability Statement

The data presented in this study are available on request from the corresponding author because the data are part of other ongoing studies.

Conflicts of Interest

The authors declare no conflicts of interest.

Abbreviations

The following abbreviations are used in this manuscript:
RrsRemote Sensing Reflectance
RMSERoot Mean Square Error
TTurbidity
NTUNephelometric Turbidity Units
FNUFormazin Nephelometric Units
NDTINormalized Difference Turbidity Index
R G r a t i o Ratio Between R r s 665 and R r s 560

References

  1. Kirk, J.T.O. Effects of Suspensoids (Turbidity) on Penetration of Solar Radiation in Aquatic Ecosystems. Hydrobiologia 1985, 125, 195–208. [Google Scholar] [CrossRef]
  2. Davies-Colley, R.J.; Smith, D.G. Turbidity Suspended Sediment, and Water Clarity: A Review. JAWRA J. Am. Water Resour. Assoc. 2001, 37, 1085–1101. [Google Scholar] [CrossRef]
  3. Uncles, R.J.; Joint, I.; Stephens, J.A. Transport and Retention of Suspended Particulate Matter and Bacteria in the Humber-Ouse Estuary, United Kingdom, and Their Relationship to Hypoxia and Anoxia. Estuaries 1998, 21, 597–612. [Google Scholar] [CrossRef]
  4. Morris, A.W.; Loring, D.H.; Bale, A.J.; Howland, R.J.M.; Mantoura, R.F.C.; Woodward, E.M.S. Particle Dynamics, Particulate Carbon and the Oxygen Minimum in an Estuary. Oceanol. Acta 1982, 5, 349–353. [Google Scholar]
  5. Thrush, S.; Hewitt, J.; Cummings, V.; Ellis, J.; Hatton, C.; Lohrer, A.; Norkko, A. Muddy Waters: Elevating Sediment Input to Coastal and Estuarine Habitats. Front. Ecol. Environ. 2004, 2, 299–306. [Google Scholar] [CrossRef]
  6. Ralph, P.J.; Tomasko, D.; Moore, K.; Seddon, S.; Macinnis-Ng, C.M.O. Human Impacts on Seagrasses: Eutrophication, Sedimentation, and Contamination. In Seagrasses: Biology, Ecology and Conservation; Springer: Berlin/Heidelberg, Germany, 2007; pp. 567–593. [Google Scholar]
  7. Ferreira, J.G.; Vale, C.; Soares, C.V.; Salas, F.; Stacey, P.E.; Bricker, S.B.; Silva, M.C.; Marques, J.C. Monitoring of Coastal and Transitional Waters under the E.U. Water Framework Directive. Environ. Monit. Assess. 2007, 135, 195–216. [Google Scholar] [CrossRef] [PubMed]
  8. Kempe, S. Estuaries- Their Natural and Anthropogenic Changes. In Biogeochemistry of Major World Rivers; John Wiley & Sons: Hoboken, NJ, USA, 1988; pp. 251–285. [Google Scholar]
  9. de Jonge, V.N.; Schuttelaars, H.M.; van Beusekom, J.E.E.; Talke, S.A.; de Swart, H.E. The Influence of Channel Deepening on Estuarine Turbidity Levels and Dynamics, as Exemplified by the Ems Estuary. Estuar. Coast. Shelf Sci. 2014, 139, 46–59. [Google Scholar] [CrossRef]
  10. Huang, Y.-G.; Yang, H.-F.; Jia, J.-J.; Li, P.; Zhang, W.-X.; Wang, Y.P.; Ding, Y.-F.; Dai, Z.-J.; Shi, B.-W.; Yang, S.-L. Declines in Suspended Sediment Concentration and Their Geomorphological and Biological Impacts in the Yangtze River Estuary and Adjacent Sea. Estuar. Coast. Shelf Sci. 2022, 265, 107708. [Google Scholar] [CrossRef]
  11. Chawla, I.; Karthikeyan, L.; Mishra, A.K. A Review of Remote Sensing Applications for Water Security: Quantity, Quality, and Extremes. J. Hydrol. 2020, 585, 124826. [Google Scholar] [CrossRef]
  12. Sun, Y.; Wang, D.; Li, L.; Ning, R.; Yu, S.; Gao, N. Application of Remote Sensing Technology in Water Quality Monitoring: From Traditional Approaches to Artificial Intelligence. Water Res. 2024, 267, 122546. [Google Scholar] [CrossRef] [PubMed]
  13. Moore, G.K. Satellite Remote Sensing of Water Turbidity/Sonde de Télémesure Par Satellite de La Turbidité de l’eau. Hydrol. Sci. Bull. 1980, 25, 407–421. [Google Scholar] [CrossRef]
  14. Bustamante, J.; Pacios, F.; Díaz-Delgado, R.; Aragonés, D. Predictive Models of Turbidity and Water Depth in the Doñana Marshes Using Landsat TM and ETM+ Images. J. Environ. Manag. 2009, 90, 2219–2225. [Google Scholar] [CrossRef] [PubMed]
  15. Chen, Z.; Muller-Karger, F.E.; Hu, C. Remote Sensing of Water Clarity in Tampa Bay. Remote Sens. Environ. 2007, 109, 249–259. [Google Scholar] [CrossRef]
  16. Petus, C.; Chust, G.; Gohin, F.; Doxaran, D.; Froidefond, J.-M.; Sagarminaga, Y. Estimating Turbidity and Total Suspended Matter in the Adour River Plume (South Bay of Biscay) Using MODIS 250-m Imagery. Cont. Shelf Res. 2010, 30, 379–392. [Google Scholar] [CrossRef]
  17. Ouillon, S.; Douillet, P.; Andréfouët, S. Coupling Satellite Data with in Situ Measurements and Numerical Modeling to Study Fine Suspended-Sediment Transport: A Study for the Lagoon of New Caledonia. Coral Reefs 2004, 23, 109–122. [Google Scholar] [CrossRef]
  18. Chowdhury, M.; Vilas, C.; van Bergeijk, S.; Navarro, G.; Laiz, I.; Caballero, I. Monitoring Turbidity in a Highly Variable Estuary Using Sentinel 2-A/B for Ecosystem Management Applications. Front. Mar. Sci. 2023, 10, 1186441. [Google Scholar] [CrossRef]
  19. Dogliotti, A.I.; Ruddick, K.G.; Nechad, B.; Doxaran, D.; Knaeps, E. A Single Algorithm to Retrieve Turbidity from Remotely-Sensed Data in All Coastal and Estuarine Waters. Remote Sens. Environ. 2015, 156, 157–168. [Google Scholar] [CrossRef]
  20. Jiang, X.; Li, J.; Wang, C.; Yao, H.; Du, Y.; Gao, M.; Zhang, F.; Wang, S. Satellite Observed Spatiotemporal Variations of Suspended Sediment Concentration in the Yellow River over the Past 40 Years: A Recent Shift in the Long-Term Decreasing Trend. J. Remote Sens. 2025, 6, 0940. [Google Scholar] [CrossRef]
  21. Yin, Z.; Li, J.; Liu, Y.; Xie, Y.; Zhang, F.; Wang, S.; Sun, X.; Zhang, B. Water Clarity Changes in Lake Taihu over 36 Years Based on Landsat TM and OLI Observations. Int. J. Appl. Earth Obs. Geoinf. 2021, 102, 102457. [Google Scholar] [CrossRef]
  22. Vanhellemont, Q.; Ruddick, K. Atmospheric Correction of Metre-Scale Optical Satellite Data for Inland and Coastal Water Applications. Remote Sens. Environ. 2018, 216, 586–597. [Google Scholar] [CrossRef]
  23. Lee, C.M.; Hestir, E.L.; Tufillaro, N.; Palmieri, B.; Acuña, S.; Osti, A.; Bergamaschi, B.A.; Sommer, T. Monitoring Turbidity in San Francisco Estuary and Sacramento–San Joaquin Delta Using Satellite Remote Sensing. JAWRA J. Am. Water Resour. Assoc. 2021, 57, 737–751. [Google Scholar] [CrossRef] [PubMed]
  24. Lang, S.E.; Luis, K.M.A.; Doney, S.C.; Cronin-Golomb, O.; Castorani, M.C.N. Modeling Coastal Water Clarity Using Landsat-8 and Sentinel-2. Earth Space Sci. 2023, 10, e2022EA002579. [Google Scholar] [CrossRef]
  25. Vanhellemont, Q. Adaptation of the Dark Spectrum Fitting Atmospheric Correction for Aquatic Applications of the Landsat and Sentinel-2 Archives. Remote Sens. Environ. 2019, 225, 175–192. [Google Scholar] [CrossRef]
  26. Novoa, S.; Doxaran, D.; Ody, A.; Vanhellemont, Q.; Lafon, V.; Lubac, B.; Gernez, P. Atmospheric Corrections and Multi-Conditional Algorithm for Multi-Sensor Remote Sensing of Suspended Particulate Matter in Low-to-High Turbidity Levels Coastal Waters. Remote Sens. 2017, 9, 61. [Google Scholar] [CrossRef]
  27. Nechad, B.; Ruddick, K.G.; Neukermans, G. Calibration and Validation of a Generic Multisensor Algorithm for Mapping of Turbidity in Coastal Waters; Bostater, C.R., Jr., Mertikas, S.P., Neyt, X., Velez-Reyes, M., Eds.; SPIE: Bellingham, WA, USA, 2009; p. 74730H. [Google Scholar]
  28. Portela, L.I.; Coelho, C.; Costa, S.M.; Freire, P. Hydrodynamic and Sedimentary Characteristics of a Small Tidal Channel in the Ria de Aveiro. J. Coast. Res. 2011, SI 64, 1629–1632. [Google Scholar]
  29. Lopes, J.F.; Dias, J.M. Residual Circulation and Sediment Distribution in the Ria de Aveiro Lagoon, Portugal. J. Mar. Syst. 2007, 68, 507–528. [Google Scholar] [CrossRef]
  30. Plecha, S.; Picado, A.; Chambel-Leitão, P.; Dias, J.M.; Vaz, N. Study of Suspended Sediment Dynamics in a Temperate Coastal Lagoon: Ria de Aveiro (Portugal). J. Coast. Res. 2014, SI 70, 604–609. [Google Scholar] [CrossRef]
  31. Lopes, C.L.; Azevedo, A.; Dias, J.M. Flooding Assessment Under Sea Level Rise Scenarios: Ria de Aveiro Case Study. J. Coast. Res. 2013, 65, 766–771. [Google Scholar] [CrossRef]
  32. Lopes, C.L.; Dias, J.M. Tidal Dynamics in a Changing Lagoon: Flooding or Not Flooding the Marginal Regions. Estuar. Coast. Shelf Sci. 2015, 167, 14–24. [Google Scholar] [CrossRef]
  33. Costa, S.; Picado, A.; Vaz, N.; Coelho, C.; Portela, L.; Dias, J.M. Climate Change Effects on Suspended Sediment Dynamics in a Coastal Lagoon: Ria de Aveiro (Portugal). J. Coast. Res. 2018, 85, 521–525. [Google Scholar] [CrossRef]
  34. Génio, L.; Sousa, A.; Vaz, N.; Dias, J.M.; Barroso, C. Effect of Low Salinity on the Survival of Recently Hatched Veliger of Nassarius reticulatus (L.) in Estuarine Habitats: A Case Study of Ria de Aveiro. J. Sea Res. 2008, 59, 133–143. [Google Scholar] [CrossRef]
  35. Oliveira, A.; Fortunato, A.B.; Dias, J.M. Numerical Modeling of the Aveiro Inlet Dynamics. In Coastal Engineering 2006; World Scientific: Singapore, 2007; pp. 3283–3294. [Google Scholar]
  36. RBINS ACOLITE. Available online: https://odnature.naturalsciences.be/remsem/software-data/fad48ee1-5ffb-4600-9deb-a73c4d3e1b54 (accessed on 31 March 2026).
  37. Skarbøvik, E.; Gyritia Madsen van’t Veen, S.; Lannergård, E.E.; Wenng, H.; Stutter, M.; Bieroza, M.; Atcheson, K.; Jordan, P.; Fölster, J.; Mellander, P.-E.; et al. Comparing in Situ Turbidity Sensor Measurements as a Proxy for Suspended Sediments in North-Western European Streams. Catena 2023, 225, 107006. [Google Scholar] [CrossRef]
  38. Pisanti, A.; Magrì, S.; Ferrando, I.; Federici, B. Sea Water Turbidity Analysis from Sentinel-2 Images: Atmospheric Correction and Bands Correlation. In Proceedings of the International Archives of the Photogrammetry, Remote Sensing and Spatial Information Sciences-ISPRS Archives; International Society for Photogrammetry and Remote Sensing: Göttingen, Germany, 2022; Volume 48, pp. 371–378. [Google Scholar]
  39. Delegido, J.; Urrego, P.; Vicente, E.; Sòria-Perpinyà, X.; Soria, J.M.; Pereira-Sandoval, M.; Ruiz-Verdú, A.; Peña, R.; Moreno, J. Turbidez y Profundidad de Disco de Secchi Con Sentinel-2 En Embalses Con Diferente Estado Trófico En La Comunidad Valenciana. Rev. Teledetec. 2019, 54, 15–24. [Google Scholar] [CrossRef]
  40. Effler, S.W. Secchi Disc Transparency and Turbidity. J. Environ. Eng. 1988, 114, 1436–1447. [Google Scholar] [CrossRef]
  41. Downing-Kunz, M.A.; Schoellhamer, D.H. Seasonal Variations in Suspended-Sediment Dynamics in the Tidal Reach of an Estuarine Tributary. Mar. Geol. 2013, 345, 314–326. [Google Scholar] [CrossRef]
  42. Golubkov, M.; Golubkov, S. Patterns of the Relationship between the Secchi Disk Depth and the Optical Characteristics of Water in the Neva Estuary (Baltic Sea): The Influence of Environmental Variables. Front. Mar. Sci. 2024, 11, 1265382. [Google Scholar] [CrossRef]
  43. Grasso, F.; Bismuth, E.; Burchard, H.; Defontaine, S.; Kösters, F.; Lafite, R.; Reese, L.; Sottolichio, A.; van Kessel, T.; Vanlede, J.; et al. Relating Estuarine Turbidity Maxima to Tide and River Conditions. Sci. Rep. 2025, 16, 3096. [Google Scholar] [CrossRef] [PubMed]
  44. Kratzer, S.; Buchan, S.; Bowers, D.G. Testing Long-Term Trends in Turbidity in the Menai Strait, North Wales. Estuar. Coast. Shelf Sci. 2003, 56, 221–226. [Google Scholar] [CrossRef]
  45. Wilson, R.J.; Heath, M.R. Increasing Turbidity in the North Sea during the 20th Century Due to Changing Wave Climate. Ocean Sci. 2019, 15, 1615–1625. [Google Scholar] [CrossRef]
  46. Nechad, B.; Ruddick, K.G.; Park, Y. Calibration and Validation of a Generic Multisensor Algorithm for Mapping of Total Suspended Matter in Turbid Waters. Remote Sens. Environ. 2010, 114, 854–866. [Google Scholar] [CrossRef]
  47. Doxaran, D.; Froidefond, J.-M.; Castaing, P. Remote-Sensing Reflectance of Turbid Sediment-Dominated Waters Reduction of Sediment Type Variations and Changing Illumination Conditions Effects by Use of Reflectance Ratios. Appl. Opt. 2003, 42, 2623. [Google Scholar] [CrossRef] [PubMed]
  48. Lopes, J.F.; Dias, J.M.; Dekeyser, I. Influence of Tides and River Inputs on Suspended Sediment Transport in the Ria de Aveiro Lagoon, Portugal. Phys. Chem. Earth Part B Hydrol. Ocean. Atmos. 2001, 26, 729–734. [Google Scholar] [CrossRef]
  49. Abrantes, I.; Dias, J.M.; Rocha, F. Spatial and Temporal Variability of Suspended Sediments Concentration in Ria de Aveiro Lagoon and Fluxes between the Lagoon and the Ocean. J. Coast. Res. 2006, SI 39, 718–723. [Google Scholar]
  50. Lopes, J.F.; Dias, J.M.; Dekeyser, I. Numerical Modelling of Cohesive Sediments Transport in the Ria de Aveiro Lagoon, Portugal. J. Hydrol. 2006, 319, 176–198. [Google Scholar] [CrossRef]
  51. Lopes, C.L.; Mendes, R.; Caçador, I.; Dias, J.M. Assessing Salt Marsh Loss and Degradation by Combining Long-term LANDSAT Imagery and Numerical Modelling. Land Degrad. Dev. 2021, 32, 4534–4545. [Google Scholar] [CrossRef]
  52. Santos, L.; Pinto, A.; Filipe, O.; Cunha, Â.; Santos, E.B.H.; Almeida, A. Insights on the Optical Properties of Estuarine DOM–Hydrological and Biological Influences. PLoS ONE 2016, 11, e0154519. [Google Scholar] [CrossRef] [PubMed]
  53. Maciel, F.P.; Pedocchi, F. Evaluation of ACOLITE Atmospheric Correction Methods for Landsat-8 and Sentinel-2 in the Río de La Plata Turbid Coastal Waters. Int. J. Remote Sens. 2022, 43, 215–240. [Google Scholar] [CrossRef]
  54. García-Tuñon, W.; Curra-Sánchez, E.D.; Lara, C.; González-Rodríguez, L.; Urrego, E.P.; Delegido, J.; Broitman, B.R. Spatio-Temporal Variability of Turbidity Derived from Sentinel-2 in Reloncaví Sound, Northern Patagonia, Chile. Ecol. Inform. 2024, 83, 102814. [Google Scholar] [CrossRef]
  55. Doxaran, D.; Froidefond, J.-M.; Lavender, S.; Castaing, P. Spectral Signature of Highly Turbid Waters. Remote Sens. Environ. 2002, 81, 149–161. [Google Scholar] [CrossRef]
  56. Bricaud, A.; Babin, M.; Morel, A.; Claustre, H. Variability in the Chlorophyll-specific Absorption Coefficients of Natural Phytoplankton: Analysis and Parameterization. J. Geophys. Res. Ocean. 1995, 100, 13321–13332. [Google Scholar] [CrossRef]
  57. Bricaud, A.; Morel, A.; Prieur, L. Absorption by Dissolved Organic Matter of the Sea (Yellow Substance) in the UV and Visible Domains1. Limnol. Oceanogr. 1981, 26, 43–53. [Google Scholar] [CrossRef]
  58. Babin, M.; Morel, A.; Fournier-Sicre, V.; Fell, F.; Stramski, D. Light Scattering Properties of Marine Particles in Coastal and Open Ocean Waters Asrelated to the Particle Mass Concentration. Limnol. Oceanogr. 2003, 48, 843–859. [Google Scholar] [CrossRef]
  59. Morel, A.; Prieur, L. Analysis of Variations in Ocean Color1. Limnol. Oceanogr. 1977, 22, 709–722. [Google Scholar] [CrossRef]
  60. Gordon, H.R.; Wang, M. Retrieval of Water-Leaving Radiance and Aerosol Optical Thickness over the Oceans with SeaWiFS: A Preliminary Algorithm. Appl. Opt. 1994, 33, 443. [Google Scholar] [CrossRef] [PubMed]
  61. Mobley, C.D.; Werdell, J.; Franz, B.; Ahmad, Z.; Bailey, S. Atmospheric Correction for Satellite Ocean Color Radiometry; NASA: Greenbelt, MD, USA, 2016.
  62. Caballero, I.; Fernández, R.; Escalante, O.M.; Mamán, L.; Navarro, G. New Capabilities of Sentinel-2A/B Satellites Combined with in Situ Data for Monitoring Small Harmful Algal Blooms in Complex Coastal Waters. Sci. Rep. 2020, 10, 8743. [Google Scholar] [CrossRef] [PubMed]
  63. In-Situ Inc. Aqua TROLL 600 Operator’s Manual; In-Situ Inc.: Fort Collins, CO, USA, 2021. [Google Scholar]
  64. Dias, J.M.; Lopes, J.F.; Dekeyser, I. Tidal Propagation in Ria de Aveiro Lagoon, Portugal. Phys. Chem. Earth Part B Hydrol. Ocean. Atmos. 2000, 25, 369–374. [Google Scholar] [CrossRef]
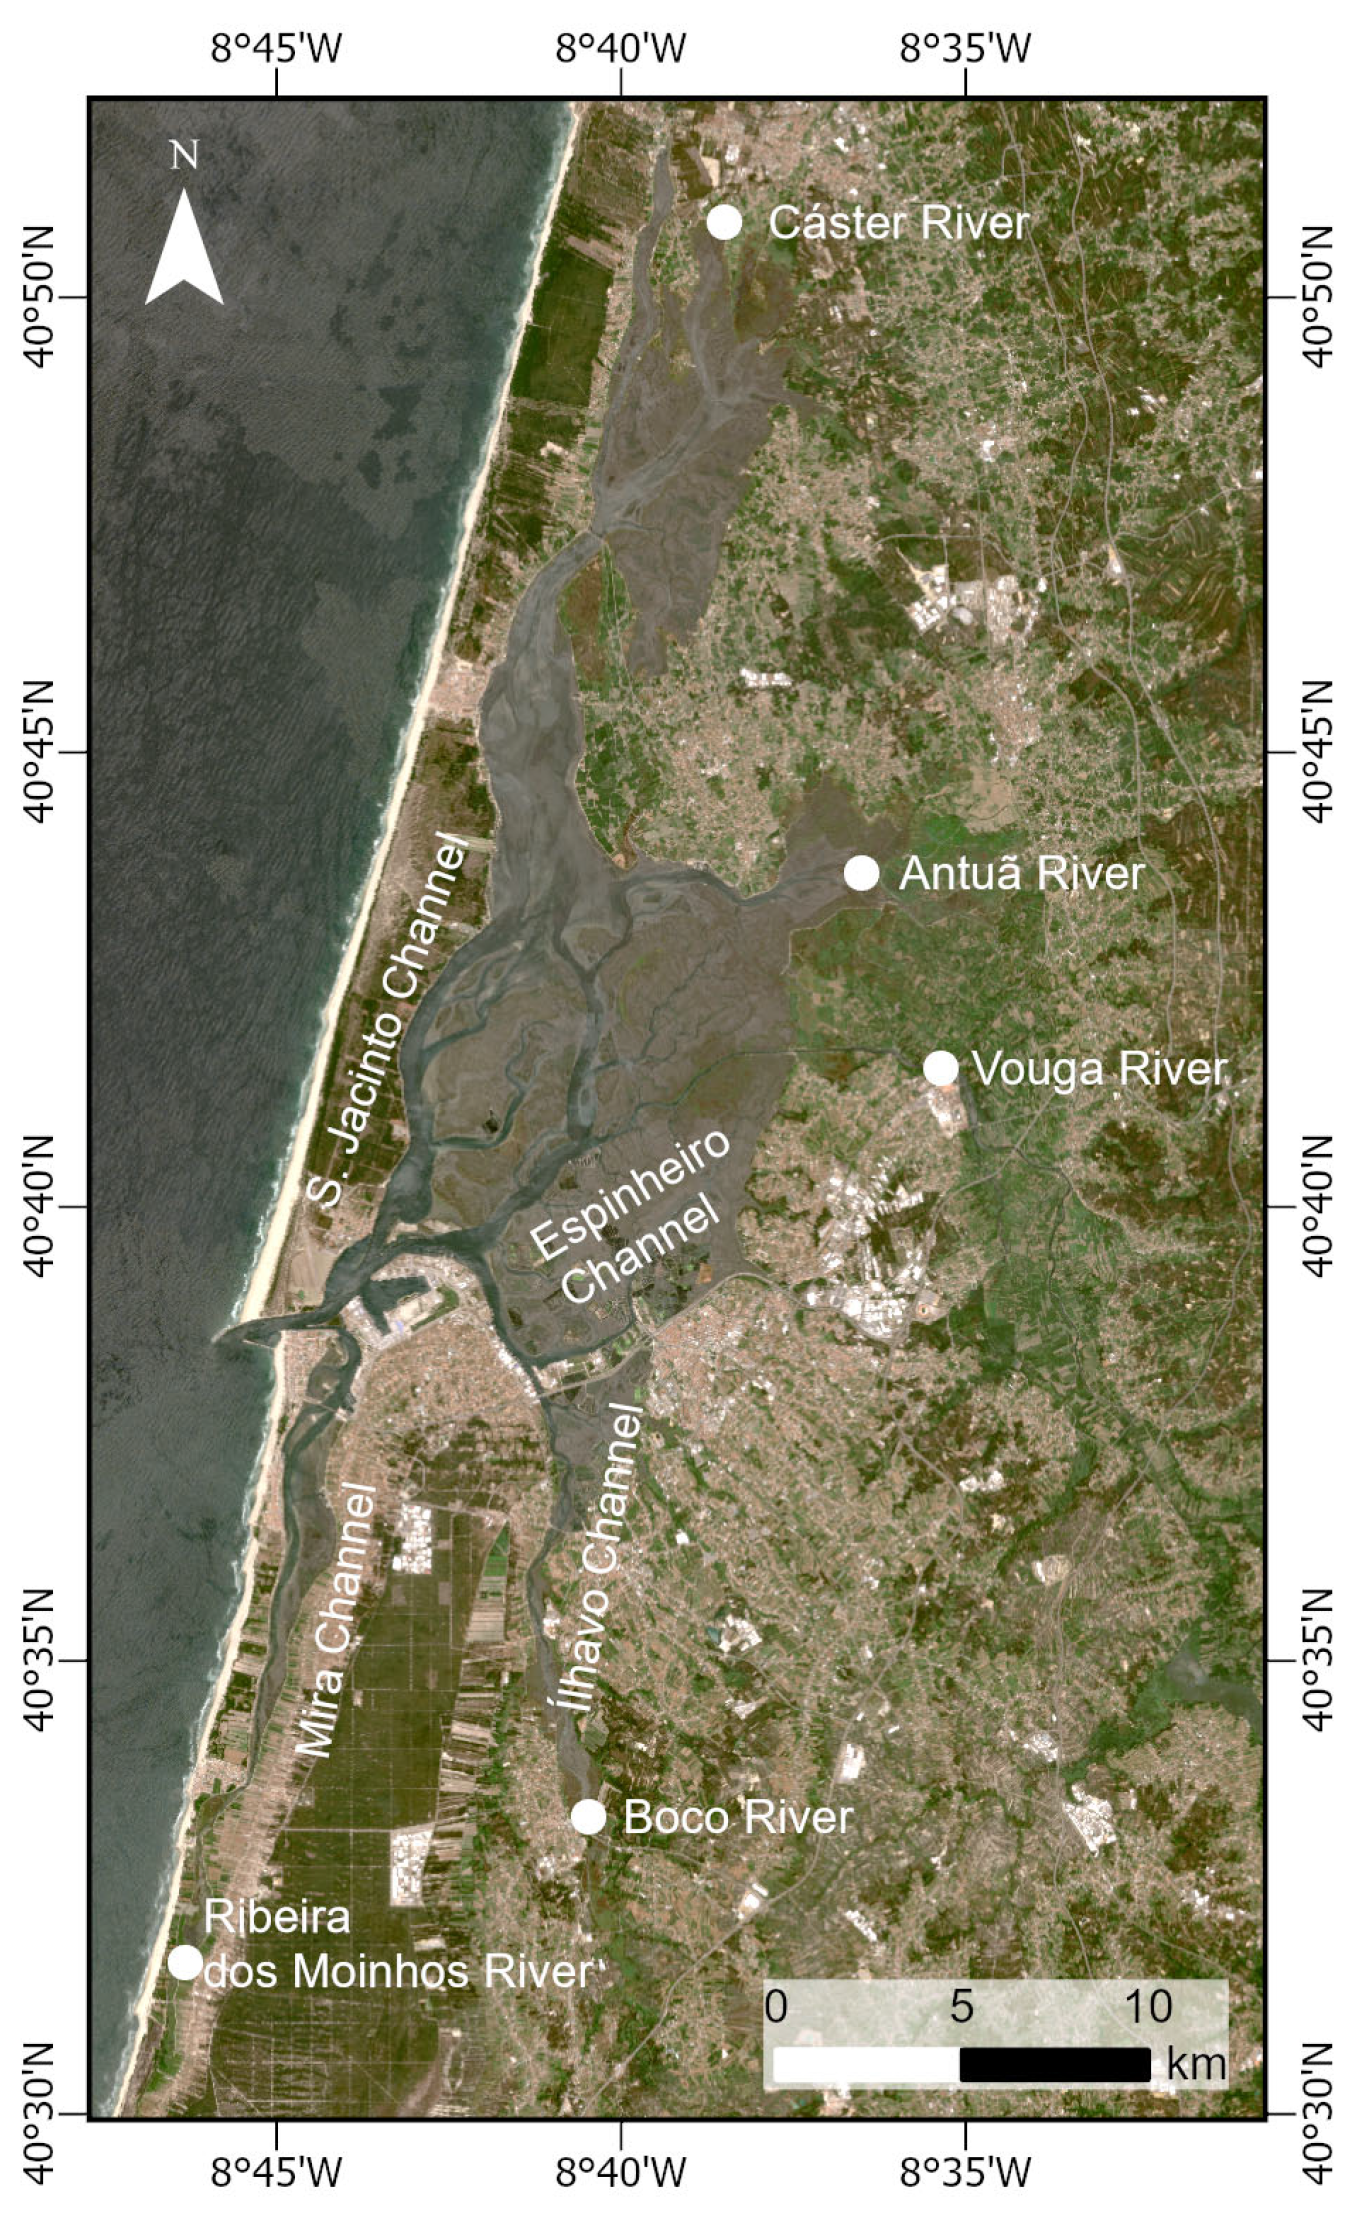
Figure 1. Map of the Aveiro lagoon showing the location of main channels and main tributaries.
Remotesensing 18 02176 g001
Figure 2. Spatial distribution of the sampling stations and the navigation route optimized for synchronization with the Sentinel-2 satellite overpass across the Aveiro lagoon channels during the field campaign on 28 May 2025.
Remotesensing 18 02176 g002
Figure 3. Instruments used in field campaigns: (a) multiparametric probe Aqua Troll 600 and (b) Secchi disk.
Remotesensing 18 02176 g003
Figure 4. Spatial distribution of near-surface turbidity measurements (NTU) recorded in situ on 28 May 2025.
Remotesensing 18 02176 g004
Figure 5. In situ turbidity and Secchi depth across the sampling points. Blue circles represent turbidity (NTU), referenced to the left y-axis, and red asterisks represent Secchi depth (m), referenced to the right y-axis.
Remotesensing 18 02176 g005
Figure 6. Distribution of Sentinel-2 Rrs across the different spectral bands.
Remotesensing 18 02176 g006
Figure 7. Scatter plot of Sentinel-2 Rrs as a function of in situ turbidity for 560, 665, and 704 nm spectral bands.
Remotesensing 18 02176 g007
Figure 8. Scatter plot comparing in situ turbidity measurements (NTU) with turbidity values (FNU) derived from the standard algorithms available in ACOLITE. The black line indicates perfect agreement; points above/below this line suggest underestimation/overestimation by the ACOLITE algorithms. The blue marks are not visible because they are overlapped by the red ones.
Remotesensing 18 02176 g008
Figure 9. Exponential regression models between Sentinel-2 and in situ turbidity: (a) R r s 560 ; (b) R r s 665 ; (c) R r s 704 ; (d) NDTI, and (e) R G r a t i o . Red lines represent the best-fit curves.
Remotesensing 18 02176 g009
Figure 10. Spatial distribution of turbidity on 28 May estimated using the exponential regression model for R G r a t i o .
Remotesensing 18 02176 g010
Table 1. Computed RMSE (NTU) for the standard ACOLITE turbidity algorithms.
Turbidity AlgorithmsRMSE (NTU)
Tur_Nechad20099.00
Tur_Nechad20168.30
Tur_Nechad2009Ave9.17
Tur_Novoa20179.00
Tur_Dogliotti20159.60
Table 2. Regression results for turbidity estimation using different Sentinel-2 spectral bands and optical indices, expressed as R2 and RMSE for linear, exponential (ln), and power (log) models. Bold values indicate the best-performing model.
Satellite-Derived VariableEquationR2RMSE (NTU)
Rrs560 T = 8030.1   ×   R r s 560 65.244 0.1858.46
l n ( T ) = 1613.6 × R r s 560 13.399 0.3572.97
l o g T = 14.816 × l o g R r s 560 + 30.806 0.3622.95
Rrs665 T = 5662.5 × R r s 665 21.950 0.5066.58
l n ( T ) = 1007.5 × R r s 665   3.9836 0.7671.92
l o g T = 5.0377 × l o g R r s 665 + 12.112 0.7561.95
Rrs704 T = 5409.8 × R r s 704 16.311 0.5256.45
l n T = 920.64 × R r s 704 2.7829 0.7292.02
l o g T = 4.1598 × l o g R r s 704 + 10.419 0.7451.95
NDTI T = 78.785 × N D T I + 29.949 0.5226.47
l n T = 14.195 × N D T I + 5.2975 0.8121.80
T = 66.968 × R G r a t i o 30.286 0.5516.28
R G r a t i o l n T = 11.823 × R G r a t i o 5.4123 0.8221.77
l o g T = 6.3948 × l o g R G r a t i o + 2.1883 0.8031.82
Disclaimer/Publisher’s Note: The statements, opinions and data contained in all publications are solely those of the individual author(s) and contributor(s) and not of MDPI and/or the editor(s). MDPI and/or the editor(s) disclaim responsibility for any injury to people or property resulting from any ideas, methods, instructions or products referred to in the content.