Article

SPPSFormer: High-Quality Superpoint-Based Transformer for Roof Plane Instance Segmentation from Point Clouds

1
School of Artificial Intelligence, Hubei University, Wuhan 430062, China
2
Key Laboratory of Intelligent Sensing System and Security (Hubei University), Ministry of Education, Wuhan 430062, China
3
Department of Land Surveying and Geo-Informatics, The Hong Kong Polytechnic University, Hong Kong 999077, China
4
Otto Poon Charitable Foundation Smart Cities Research Institute, The Hong Kong Polytechnic University, Hong Kong 999077, China
5
Department of Engineering, University of Cambridge, Cambridge CB2 1PZ, UK
6
Institute of Photogrammetry and Remote Sensing, Chinese Academy of Surveying and Mapping (CASM), Beijing 100830, China
*
Author to whom correspondence should be addressed.
These authors contributed equally to this work.
Remote Sens. 2026, 18(13), 2144; https://doi.org/10.3390/rs18132144
Submission received: 15 March 2026 / Revised: 18 June 2026 / Accepted: 18 June 2026 / Published: 2 July 2026
(This article belongs to the Section Urban Remote Sensing)

Highlights

What are the main findings?
  • We establish a set of criteria for generating superpoints that are well-suited for Transformer feature learning, and propose a corresponding superpoint generation procedure.
  • A superpoint Transformer-based method is proposed for roof plane instance segmentation from point clouds.
What are the implications of the main findings?
  • The proposed superpoint generation criteria in this paper have strong potential to be extended to superpoint Transformers for other 3D tasks and to superpixel Transformers in the 2D domain.
  • The proposed method achieves state-of-the-art performance on multiple roof point cloud datasets, demonstrates strong robustness to low-quality point clouds while reducing the dependence on accurate boundary annotations.

Abstract

Superpoint Transformers use superpoints as the basic processing units, thereby significantly reducing the number of tokens processed by Transformers. However, they have been seldom employed in point cloud roof plane instance segmentation, and existing superpoint Transformers suffer from limited performance due to the use of low-quality superpoints. To address this challenge, we establish a set of criteria that high-quality superpoints for Transformers should satisfy and introduce a corresponding two-stage superpoint generation process. The superpoints generated by our method not only have accurate boundaries, but also exhibit consistent geometric sizes and shapes, which greatly benefit the feature learning of superpoint Transformers. To compensate for the limitations of deep learning features when the training set size is limited, we incorporate multidimensional handcrafted features into the model. Additionally, we design a decoder that combines a Kolmogorov–Arnold Network with a Transformer module to improve instance prediction and mask extraction. Finally, our network’s predictions are refined using traditional algorithm-based post-processing. For evaluation, we annotated a real-world dataset and corrected annotation errors in the existing RoofN3D dataset. Experimental results show that our method achieves state-of-the-art performance on our dataset, as well as both the original and corrected RoofN3D datasets. Our model also shows significant advantages over existing methods when handling data with low point density, large density variations, or low 3D point precision. Moreover, it is not sensitive to plane boundary annotations during training, significantly reducing the annotation burden. We will release our code, trained models, and datasets.

1. Introduction

Segmenting roof plane instances from 3D point clouds is critical for 3D building reconstruction and rooftop photovoltaic installation planning. In fact, 3D point cloud roof plane instance segmentation serves as a key step in many 3D building reconstruction algorithms [1,2,3,4]. Consequently, accurate roof plane instance segmentation directly contributes to the quality of the resulting models. In addition, this segmentation technology plays a vital role in planning rooftop photovoltaic installations [5], as accurate instance segmentation of roof planes helps to reduce the need for costly and time-consuming on-site surveys.
Traditional plane instance segmentation methods—such as region growing algorithms [2,6], feature clustering-based algorithms [7,8], and model fitting-based algorithms [9,10,11,12]—typically rely on prior knowledge of point cloud characteristics and require manual parameter tuning. These dependencies limit their generalization ability and automation, particularly in complex and diverse real-world building scenarios. In practice, the shortcomings of traditional algorithms become especially evident when facing intricate roof structures.
In contrast, deep learning methods, especially Transformer-based methods, have demonstrated strong capabilities in point cloud segmentation, owing to their powerful feature extraction and representation learning abilities [13,14,15,16,17,18,19,20]. Nevertheless, current deep learning models specifically designed for roof plane instance segmentation in 3D point clouds primarily adopt PointNet++ [21] as the backbone network [5,22], which struggles to fully exploit global contextual information. The superpoint Transformer-based 3D point cloud instance segmentation network, SPFormer [14], was retrained on the RoofNTNU dataset in [23] and achieved promising results. However, the RoofNTNU dataset contains only 930 roof samples, and its limited scale makes it insufficient to fully validate the effectiveness of SPFormer in the domain of point cloud roof plane segmentation.
In fact, using superpoints as the basic processing units can significantly reduce the number of tokens processed by Transformers, thereby helping alleviate the high computational resource requirements when applying Transformers to large-scale point clouds. However, existing superpoint Transformers, including SPFormer [14], generally rely on simplistic geometric rules or clustering strategies to construct superpoints. These methods often yield superpoints that include points from multiple instances when handling boundary regions between adjacent instances, resulting in blurred segmentation boundaries and inaccurate segmentation. In addition, superpoints generated by these simplistic methods often vary significantly in size and shape. Such irregularities introduce complex data distributions, which hinder the Transformer from learning stable and discriminative features. This challenge makes model training more difficult and demands larger datasets for adequate performance. Unfortunately, annotating large-scale 3D point cloud datasets is both time-consuming and expensive. Therefore, generating high-quality superpoints has become a critical challenge that must be addressed to fully leverage the capabilities of superpoint Transformers for segmentation tasks.
In this paper, we develop a superpoint Transformer-based method for segmenting plane instances in point clouds. To address the issue of suboptimal superpoints in existing superpoint Transformer models, we propose a set of criteria that high-quality superpoints should meet:
They should have accurate boundaries, and different superpoints should be similar in both size and shape.
Based on the proposed criteria, we introduce a two-stage superpoint generation process that significantly enhances the performance of the superpoint Transformer in segmenting plane instances from 3D point clouds. To address the limited feature extraction capability of our deep learning model—especially in scenarios with small training sets—we incorporate multidimensional handcrafted features and spatial position features at the input stage of our network. To further strengthen the decoder, we adopt the Kolmogorov–Arnold Network (KAN) [24] for mask feature extraction and combine it with a Transformer module. This hybrid decoder architecture enables direct prediction of instance classes, confidence scores, and mask outputs.
Finally, traditional algorithm-based plane completion and boundary refinement modules are introduced to refine the predictions of our network. Although this conflicts with the end-to-end paradigm pursued by many researchers, we will demonstrate later in this paper that our architecture—consisting of deep learning-based prediction followed by traditional post-processing—offers several important advantages.
Plane completion. Existing datasets for 3D roof plane instance segmentation, such as the RoofN3D dataset [25], may contain incomplete plane annotations, which can cause trained models to miss valid roof planes during inference. To mitigate this, we propose a self-supervised plane completion strategy that first infers the parameters of missing planes based on already segmented planes and uses this information to guide a region growing algorithm to recover missing plane instances from points that are initially labeled as “nonplane”.
Boundary refinement. While deep learning models often produce inaccurate segmentation boundaries, traditional region growing methods are also prone to boundary inaccuracies due to their sequential nature—early-growing planes may absorb points from neighboring planes. To address this, we apply a plane boundary refinement algorithm to further enhance segmentation accuracy.
For evaluation, we constructed a 3D point cloud roof plane instance segmentation dataset by annotating 10,539 buildings based on wireframe annotations from the Building3D dataset [26] and corrected annotation errors in the RoofN3D dataset [25] for samples containing at least 700 points. By integrating our network design with traditional algorithm-based post-processing, our method achieves state-of-the-art (SOTA) performance on the Building3D dataset, as well as on both the original and corrected versions of RoofN3D.
We also disrupted the boundary annotations in the Building3D and RoofN3D training sets—while preserving accurate annotation of plane main bodies—and retrained our model, Point Transformer v3 (PTv3) [27], and the current SOTA deep learning-based method DeepRoofPlane [22] using these boundary-degraded training datasets. Remarkably, our method showed almost no performance drop on the test sets, whereas the performance of DeepRoofPlane declined significantly, and PTv3 consistently showed relatively poor performance. In general, neural network-based segmentation models rely heavily on fine annotations of the training set. However, accurately annotating the boundaries between different categories or instances is particularly challenging. Our model, nonetheless, demonstrates strong robustness to inaccurate boundary annotations, thanks to its hybrid structure: a deep neural network predicts plane instances, followed by traditional post-processing algorithms. This design allows for accurate segmentation even when only the main bodies of planes are accurately annotated in the training set, significantly reducing the complexity and cost of creating point cloud datasets for plane instance segmentation.
Additionally, we applied controlled degradations to our annotated Building3D dataset by separately reducing point cloud density, introducing greater density variations, and decreasing point precision—resulting in three distinct degraded datasets. We trained and evaluated models on these variants, and our algorithm significantly outperformed PTv3 [27] and DeepRoofPlane [22] across all conditions. More critically, we observed that the segmentation performance of both DeepRoofPlane [22] and our model dropped noticeably under these degradations. This highlights that data quality factors—especially point cloud density, density variation, and point precision—have a profound impact on the effectiveness of point cloud roof plane instance segmentation. These findings underscore the necessity of incorporating data augmentation strategies that simulate these degradations during training to improve model robustness in real-world and unpredictable scenarios.
In summary, the key contributions of this paper are as follows:
  • We establish two criteria for generating superpoints that are well-suited for Transformer feature learning, and propose a corresponding superpoint generation procedure. Our experiments demonstrate that simultaneously applying both criteria significantly enhances the performance of the superpoint Transformer, whereas using only one of them leads to a noticeable degradation in model performance. Existing superpoints/superpixels in current superpoint/superpixel Transformers satisfy at most one of the two criteria we propose. Therefore, the proposed superpoint generation criteria in this paper have strong potential to be extended to superpoint Transformers for other 3D tasks and to superpixel Transformers in the 2D domain.
  • By employing high-quality superpoints, incorporating handcrafted features into our superpoint Transformer, designing a decoder that integrates KAN and Transformer, and applying traditional algorithm-based post-processing, we realize accurate point cloud roof plane instance segmentation. Our model achieves new SOTA results on both the RoofN3D and Building3D datasets. Notably, our model relies primarily on the accurate annotation of the plane main bodies, while being less sensitive to the accuracy of boundary annotations. Therefore, our hybrid architecture—combining neural network-based prediction with traditional algorithm-based post-processing—substantially reduces the annotation burden for point cloud plane instance segmentation training sets.
  • Additionally, our model shows significant advantages over existing methods when handling data with low point density, large density variations, or low 3D point precision. In these experiments, we also identify the critical factors influencing point cloud plane segmentation performance: in addition to roof structure complexity, point cloud density, density variation, and point precision all significantly affect segmentation results. As such, future research should not only focus on the complexity of roof structures but also consider the impact of data quality on segmentation performance. For instance, incorporating data augmentation techniques targeting point cloud quality—including point cloud density, density variation, and point precision—during training can improve the model’s robustness when handling complex and unseen data.
  • We have annotated a real-world 3D point cloud roof plane instance segmentation dataset containing 10,539 buildings and corrected labeling errors in the existing RoofN3D dataset for samples containing at least 700 points. We will publicly release both our newly annotated dataset and the corrected RoofN3D samples.
In order to promote research in the field of roof plane instance segmentation from 3D point clouds, we have open-sourced the code and trained models used in this study at https://github.com/YanMENG-CVRS/SPPSFormer (last accessed: 17 June 2026).

2. Related Work

In this section, we review the advancements in research areas closely related to our method, including techniques for segmenting plane instances from 3D point clouds, superpoints in superpoint Transformers, and the KAN along with its recent applications.

2.1. Plane Instance Segmentation from 3D Point Clouds

Over recent decades, substantial progress has been made in 3D point cloud plane instance segmentation. Existing methods can be broadly grouped into three categories: traditional sequential algorithms, traditional global algorithms, and deep learning-based algorithms.

2.1.1. Traditional Sequential Algorithms

Sequential algorithms segment plane instances in 3D point clouds in a step-by-step manner, where the results depend on the order in which points are processed. Traditional sequential methods primarily include region growing, RANdom SAmple Consensus (RANSAC), and Hough Transform algorithms.
Region growing, initially proposed for image segmentation [28], was later adapted for 3D point cloud segmentation. The core idea is to begin with one or more seed points and, by comparing its (or their) similarity with neighboring pixels or other 3D units, merge similar elements into the same region [6,29,30,31,32]. In the context of plane instance segmentation from 3D point clouds, region growing typically operates on either individual 3D points or voxels. For example, Poux et al. [6] and Yan et al. [33] used individual 3D points as basic units, while Wang and Wang [32] and Li et al. [2] adopted voxels. Dong et al. [34] proposed a hybrid representation: voxels are used in areas likely to contain planes, while individual points are used elsewhere. Using individual points provides higher precision but at a cost to computational efficiency. In contrast, using voxels improves efficiency—especially at lower resolution—but often compromises segmentation accuracy. The performance of region growing algorithms is highly sensitive to the selection of seed points and growth criteria. Despite this, they are relatively efficient and are often used as a pre-processing step in multistage algorithms [2,33,34,35].
RANSAC and Hough Transform algorithms can segment plane instances from 3D point clouds through model fitting. In RANSAC-based methods [36,37,38,39,40], a small number of 3D points (more than two points are required) are sampled to fit a plane, and the number of inliers—points near the fitted plane—is counted. The plane with the most inliers is selected, and the inliers are removed from the point cloud. The process repeats on the remaining points to extract additional planes. The final segmentation consists of the planes with the largest inlier sets. In contrast, Hough Transform methods [10,41,42,43,44] operate by mapping points from 3D space into a discretized parameter space, where planes are detected through a voting mechanism to identify parameter combinations that best represent planar surfaces.
Both RANSAC and Hough Transform have been used in plane segmentation since the early days of 3D point cloud processing [45,46] and remain widely adopted in modern applications [10,39,40,44]. Typically, RANSAC offers higher efficiency than Hough Transform, particularly when processing large-scale point clouds. However, RANSAC also faces efficiency challenges. The introduction of local sampling by Schnabel et al. [36] significantly improves RANSAC’s runtime. Still, both RANSAC and Hough Transform are susceptible to producing false positives.

2.1.2. Traditional Global Algorithms

Traditional global algorithms refer to methods that segment all plane instances in a 3D point cloud simultaneously using conventional, non-learning-based techniques. These approaches can be categorized into three main types: energy optimization-based algorithms, feature clustering-based algorithms, and regularity-based algorithms.
Energy optimization-based algorithms generally begin by generating an initial plane segmentation and then refine plane boundaries through the minimization of an energy function. Due to their multistage nature, efficient techniques such as region growing algorithms are often employed for the initial segmentation. For example, Yan et al. [33] and Dong et al. [34] first applied region growing and subsequently refined the segmentation using graph cut optimization. However, graph cut methods are computationally expensive when applied to large-scale point clouds. To improve efficiency, Li et al. [2] introduced a local optimization strategy to refine boundary points after the initial region growing step. This method achieves effective boundary refinement with significantly reduced computational cost and has been validated in subsequent work [47]. We also adopt the local optimization method from [2] in our superpoint generation process.
Feature clustering-based algorithms group 3D points into plane instances by clustering those with similar features. Common clustering methods include K-means, mean shift, and Density-Based Spatial Clustering of Applications with NOISE (DBSCAN). Research in this area has primarily focused on designing or selecting effective features, as the quality of input features directly impacts segmentation accuracy. For instance, Sampath and Shan [7] computed normal vectors via eigenvalue analysis and applied fuzzy K-means for segmentation. Huang et al. [48] constructed a five-dimensional feature combining spatial coordinates and normal vectors, and applied the mean shift algorithm, while Wang et al. [49] used mean shift clustering on Gaussian maps. Czerniawski et al. [50] performed DBSCAN clustering using a six-dimensional feature space, while Chen et al. [8] designed a local tangent plane distance metric that combines spatial and normal vector features for DBSCAN clustering. Importantly, DBSCAN determines core, border, and noise points on a global scale, and operates independently of point processing order, qualifying it as a global algorithm.
Modern buildings often exhibit geometric regularities—such as parallelism, coplanarity, orthogonality, and symmetry—due to artificial and construction factors. Leveraging these regularities during plane instance segmentation can significantly improve a model’s robustness to noise, leading to the development of regularity-based segmentation algorithms. Given that such regularities typically manifest at a global or semiglobal scale in building point clouds, existing regularity-based plane segmentation algorithms are typically global approaches, such as those in references [51,52]. By definition, regularity-based algorithms cannot be purely local, as the regularities they exploit extend beyond localized regions. For instance, the orthogonality of mutually perpendicular planes extracted in references [53,54] represents a semiglobal regularity.

2.1.3. Deep Learning-Based Algorithms

Traditional algorithms often rely on manual tuning of input parameters for different data, resulting in inefficiencies and limited effectiveness. With the growing success of deep learning across various domains, many point cloud processing tasks have increasingly adopted deep learning-based approaches. These methods, known for their automation and efficiency, have emerged as a promising direction for plane instance segmentation. Zhang and Fan [5], for example, employed PointNet++ [21] as the backbone of a multitask point cloud processing network capable of segmenting roof plane instances while also recognizing groups of roof planes with similar geometric properties. Similarly, Li et al. [22] used the PointNet++ backbone within a multitask framework to separately extract features in both Euclidean and embedding spaces, which are then combined to cluster plane instances. Kong and Fan [23] retrained the superpoint Transformer-based 3D point cloud instance segmentation network, SPFormer [14], on the RoofNTNU dataset [5] and achieved promising results. However, the RoofNTNU dataset is too small, containing only 930 roof samples, which makes it insufficient to fully validate the effectiveness of SPFormer in the field of point cloud roof plane segmentation.
Deep learning-based algorithms, particularly Transformer-based approaches, represent the most promising future research direction for plane instance segmentation in 3D point clouds. However, the current SOTA models still utilize PointNet++ as the backbone network [5,22], underutilizing global contextual information, which may limit segmentation performance. Moreover, unlike the experiments in [23], we tested SPFormer [14] on two larger-scale plane segmentation datasets and found that its performance was far from satisfactory. Therefore, in this paper, we propose a superpoint Transformer tailored for point cloud plane instance segmentation by generating high-quality superpoints, incorporating handcrafted features, and integrating the Kolmogorov–Arnold Network. Additionally, we further enhance segmentation results through post-processing involving plane completion and boundary refinement.

2.2. Superpoints in Superpoint Transformers

In recent years, superpoint Transformers have demonstrated significant advantages over point Transformers in 3D point cloud processing [14,15,55,56,57]. Superpoints, analogous to superpixels in two-dimensional imagery, are generated by over-segmenting a 3D point cloud into spatially coherent regions. Replacing raw 3D points with superpoints as the fundamental processing units greatly reduces computational costs in dense prediction tasks, offering a new paradigm for a wide range of 3D point cloud applications. As a result, effectively generating superpoints and incorporating them into Transformer architectures has become a key challenge in the field.
However, most existing superpoint Transformers primarily focus on how superpoints are utilized, often overlooking the critical issues of how they are generated. Landrieu and Simonovsky [58] developed a global energy optimization-based method for unsupervised over-segmentation, aiming to produce superpoints that are both geometrically simple and semantically homogeneous. Building on this method, Landrieu and Boussaha [55] introduced a supervised learning framework called Supervised SuperPoint (SSP), which computes local geometric and radiometric embeddings for each point and constructs an adjacency graph. Superpoints are then defined as piecewise constant approximations of these embeddings on the adjacency graph. This approach was also applied in subsequent superpoint Transformers [56,59]. Sun et al. [14] proposed an end-to-end 3D instance segmentation method, SPFormer, which uses the superpoint generation method in reference [58]. In contrast, Robert et al. [15] used K-nearest neighbor clustering to split point clouds into a hierarchical superpoint structure.
Although the aforementioned methods have demonstrated the utility of superpoints in various applications, their superpoint generation approaches often produce low-quality superpoints when dealing with complex point clouds. Graph-based segmentation can result in discontinuities or irregularities within superpoints and is often computationally inefficient. Conversely, clustering-based approaches may produce superpoints with imprecise boundaries, compromising segmentation accuracy.
Given that real-world 3D scans may contain hundreds of millions of points, improving the efficiency of 3D analysis remains a critical research goal. Using superpoints as the processing units can greatly enhance the efficiency of Transformer models. However, the effectiveness is highly dependent on the quality of the superpoints. Therefore, identifying the characteristics of high-quality superpoints for Transformer-based architectures and thus developing effective superpoint generation methods is the primary objective of this study.

2.3. KAN and Its Application

KAN [24] introduces a novel neural network architecture grounded in the Kolmogorov–Arnold representation theorem [60]. It fundamentally differs from traditional multilayer perceptrons (MLPs) [61,62] in both design philosophy and implementation. Instead of utilizing fixed nonlinear activation functions, KAN learns nonlinear relationships directly. Each KAN layer consists of multiple continuous univariate function mappings applied element-wise to the input vector. These function mappings act as learnable activation functions, combined through summation, allowing the network to perform nonlinear transformations via parameterization—ultimately enhancing its expressive power. Functionally, KAN resembles a two-layer MLP: the first layer performs an internal summation, while the second layer applies the learnable activation functions and aggregates the activation results. This architecture not only amplifies the network’s capacity for modeling complex nonlinearities but also introduces greater adaptability through its flexible activation functions.
KAN’s design leverages B-splines for local control and adjustable grid resolution, enabling a form of dynamic network structure and supporting continual learning. Variants of KAN have explored alternative basis functions such as Chebyshev polynomials [63], wavelet functions [64], and other orthogonal polynomials, each offering distinct modeling properties. A notable variant, FourierKAN [65,66], replaces B-splines with Fourier series, which excel at modeling continuous and especially smooth and periodic functions. This makes FourierKAN particularly effective across various domains and a strong candidate for replacing MLPs in certain applications. In the FourierKAN-GCF model [66], FourierKAN is employed in place of the traditional MLP in the feature transformation stage of graph convolutional networks. This substitution enhances the representational power of graph collaborative filtering (GCF) [67], simplifies training, and yields notable performance improvements on graph-structured data. Furthermore, FourierKAN’s ease of training and strong representational capabilities enable its integration with architectures such as Transformer, further improving model performance.
Despite these strengths, KAN also has limitations. Yu et al. [68] conducted a comprehensive comparison between KAN and MLP across multiple tasks, revealing that KAN is more prone to catastrophic forgetting and that MLP still outperforms it on most datasets. Similarly, Cang et al. [69] demonstrated KAN’s heightened sensitivity to noise. Nevertheless, KAN remains a promising innovation in neural network research, offering a fresh perspective and the potential to inspire new algorithmic developments. With continued investigation, improved variants of KAN may emerge, refining its architecture and training strategies to fully realize its potential in deep learning.
In our proposed superpoint Transformer-based point cloud plane instance segmentation method, KAN plays a central role, leveraging its strengths in nonlinear modeling. By utilizing parameterized and learnable activation functions in place of traditional linear weight matrices, KAN matches or exceeds the performance of standard MLPs while maintaining a compact model size. This contributes to improved feature extraction and instance prediction, thereby enhancing the accuracy of segmentation. Our experimental results further validate KAN’s effectiveness in the 3D point cloud plane instance segmentation task.

3. Materials and Methods

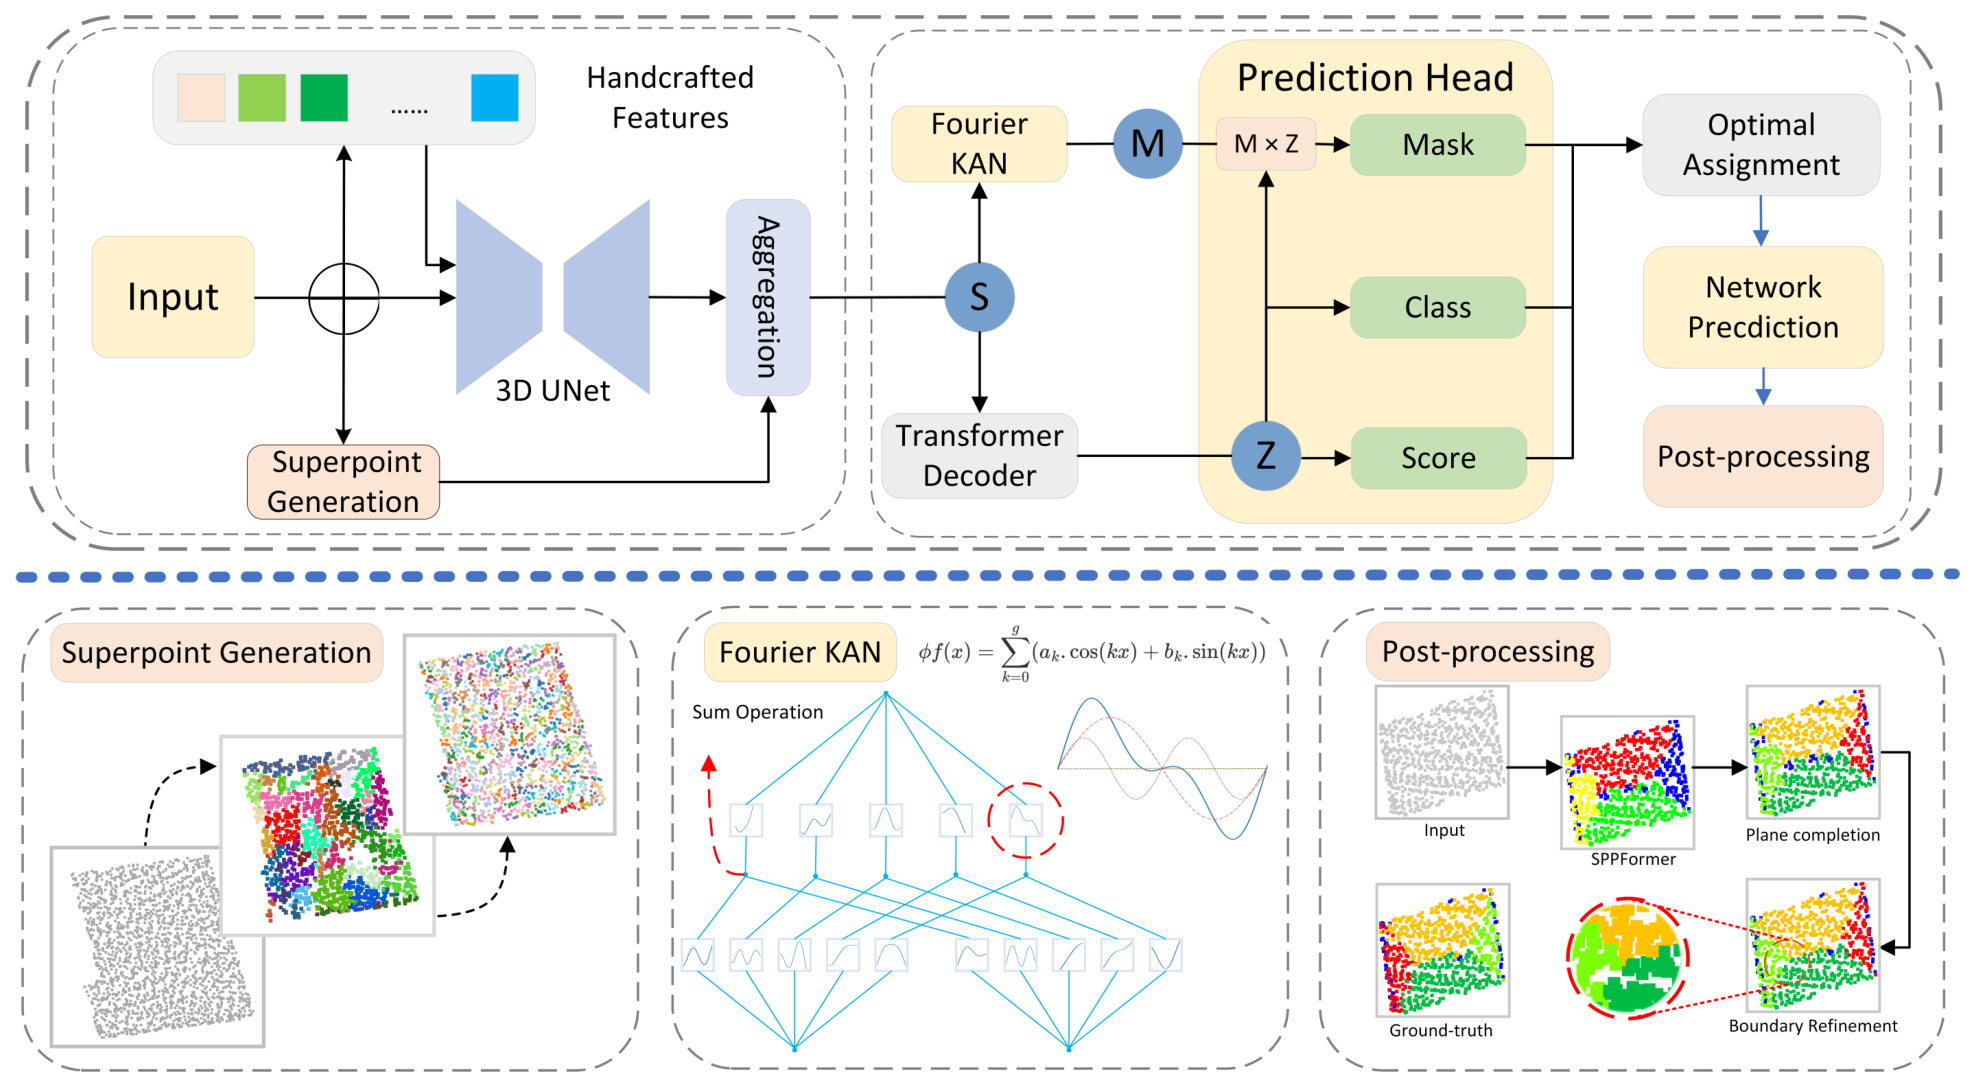
Figure 1 illustrates the architecture of the proposed superpoint Transformer. The framework begins with a two-stage superpoint generation strategy to produce high-quality superpoints from the input point cloud. Subsequently, the point cloud is voxelized, and multidimensional handcrafted features along with spatial position information are integrated into the initial representation. A 3D U-Net is then employed to extract per-point features from this voxelized input. Using the precomputed superpoints, the per-point features are passed through a superpoint pooling layer, which performs average pooling within each superpoint to produce aggregated superpoint features. These features are then fed into a Transformer decoder, which captures plane instance information from the superpoints. To enhance our model’s discriminative capability, mask-aware features are extracted using FourierKAN [65,66]. Finally, the label assignment is formulated as an optimal matching problem. By applying bipartite matching to the predicted superpoint masks, our model supports end-to-end training.
At the prediction stage, our model directly outputs superpoint masks for K plane instances from an input point cloud. Each instance is associated with an IoU-aware score S i and a corresponding mask confidence score m S i 0 , 1 K . To derive the final prediction, we compute a combined score S i ˜ = S i × m S i 2 , which is then used for ranking and filtering, eliminating the need for non-maximum suppression or other post-processing steps, and thus ensuring fast inference. Given that our network performs plane instance segmentation based on a superpoint Transformer, we name it SPPSFormer (SuperPoint Plane Segmentation transFormer).
While our SPPSFormer adopts a similar architecture to SPFormer [14], it incorporates several key improvements:
(1)
We establish a set of criteria for generating superpoints tailored to the superpoint Transformer, and propose a corresponding generation method.
(2)
We introduce essential handcrafted features, effectively enhancing deep learning features and thus providing the decoder with stronger input features.
(3)
In the decoder, we combine a Kolmogorov–Arnold Network with a Transformer module to improve instance prediction and mask extraction.
Among these, (1) has the most pronounced impact on performance. In addition to architecture enhancements, we introduce two post-processing techniques to further refine predictions of our network:
(4)
To mitigate incomplete plane segmentation due to partially annotated training data, we propose a self-supervised plane completion strategy.
(5)
To refine segmentation at plane boundaries, we design an efficient boundary refinement algorithm.
The details of these contributions are structured as follows. Section 3.1 defines the criteria of high-quality superpoints for the superpoint Transformer under limited training data and presents a workflow for generating such high-quality superpoints. Section 3.2 describes the handcrafted features integrated into our neural network. Section 3.3 details the Transformer–FourierKAN decoder architecture. Section 3.4 presents the plane completion and boundary refinement methods. The datasets used in this paper are described in Section 3.5.

3.1. Generation of High-Quality Superpoints for the Superpoint Transformer

In this section, we establish the criteria that superpoints well-suited for Transformer-based feature learning should meet, and introduce a corresponding generation workflow. Superpoints constructed according to these criteria enhance the ability of the superpoint Transformer to learn generalizable features—even under limited training data conditions. As a result, the network’s performance in plane instance segmentation is significantly improved.

3.1.1. Superpoint Generation Criteria for Transformer Feature Learning

Before generating superpoints suitable for Transformer-based processing, we first examine the key characteristics that make superpoints effective as fundamental units in a superpoint Transformer. Based on our analysis, ideal superpoints should satisfy the following two conditions:
  • Accurate boundaries: Each superpoint should be spatially coherent and contain points from only a single semantic category or instance. This requirement is essential because, once superpoints are formed, the Transformer assumes them as fixed processing units. If a superpoint contains mixed-category or multi-instance points, this error cannot be corrected by the network and will propagate throughout the segmentation process.
  • Uniform size and shape: Superpoints should exhibit consistent size and geometric shape. Neural networks typically rely on the assumption that similar inputs lead to similar outputs. When superpoints corresponding to the same category or instance vary greatly in size and shape, this assumption breaks down. Consequently, the network requires a significantly larger training set to generalize well—an issue that cannot be easily addressed through standard data augmentation, thereby complicating the training process.
Our experimental results confirm that superpoints adhering to both of these criteria lead to marked improvements in segmentation performance of the superpoint Transformer. In contrast, using only the first or the second criterion results in a significant performance drop. Specifically, if the superpoints in superpoint Transformers satisfy only the requirement of boundary precision but exhibit large variations in size and shape, the model performance remains poor. Likewise, if the superpoints are similar in size and shape but lack accurate boundaries, the performance is also substantially degraded.

3.1.2. Our Superpoint Generation Process

While generating superpoints that meet either of the two criteria outlined in Section 3.1.1 is relatively straightforward, producing superpoints that simultaneously satisfy both requirements is considerably more challenging. For example, current energy optimization-based methods [2,10,33,34] are effective at producing superpoints with accurate boundaries. However, the resulting superpoints often exhibit significant variability in size, which, as noted in Section 3.1.1, undermines the consistency required for effective feature learning in a superpoint Transformer. Conversely, enforcing uniform superpoint size tends to compromise boundary accuracy, as it typically necessitates the generation of small superpoints. This poses a problem because accurate boundary delineation often depends on reliable plane parameter fitting, which, however, becomes unreliable when performed on overly small superpoints.
To address this trade-off, we propose a two-stage superpoint generation process. In the first stage, we generate superpoints with accurate boundaries. In the second stage, we perform size adjustments to enforce greater uniformity in the superpoint scale. This approach allows us to generate superpoints that simultaneously satisfy both criteria, thereby enhancing the performance and generalization ability of the superpoint Transformer, as discussed in Section 3.1.1.
  • Stage 1: Generating coarse-grained superpoints with accurate boundaries
Accurate boundaries are essential for reliably distinguishing between different categories or instances, thereby preventing the creation of superpoints that span multiple categories or instances. This accuracy lays a solid foundation for downstream processing. However, in real-world point cloud data, complex and ambiguous boundary regions often challenge traditional superpoint generation methods, which tend to blur or misclassify instance boundaries. Therefore, the first stage of our pipeline focuses specifically on generating superpoints with high boundary accuracy.
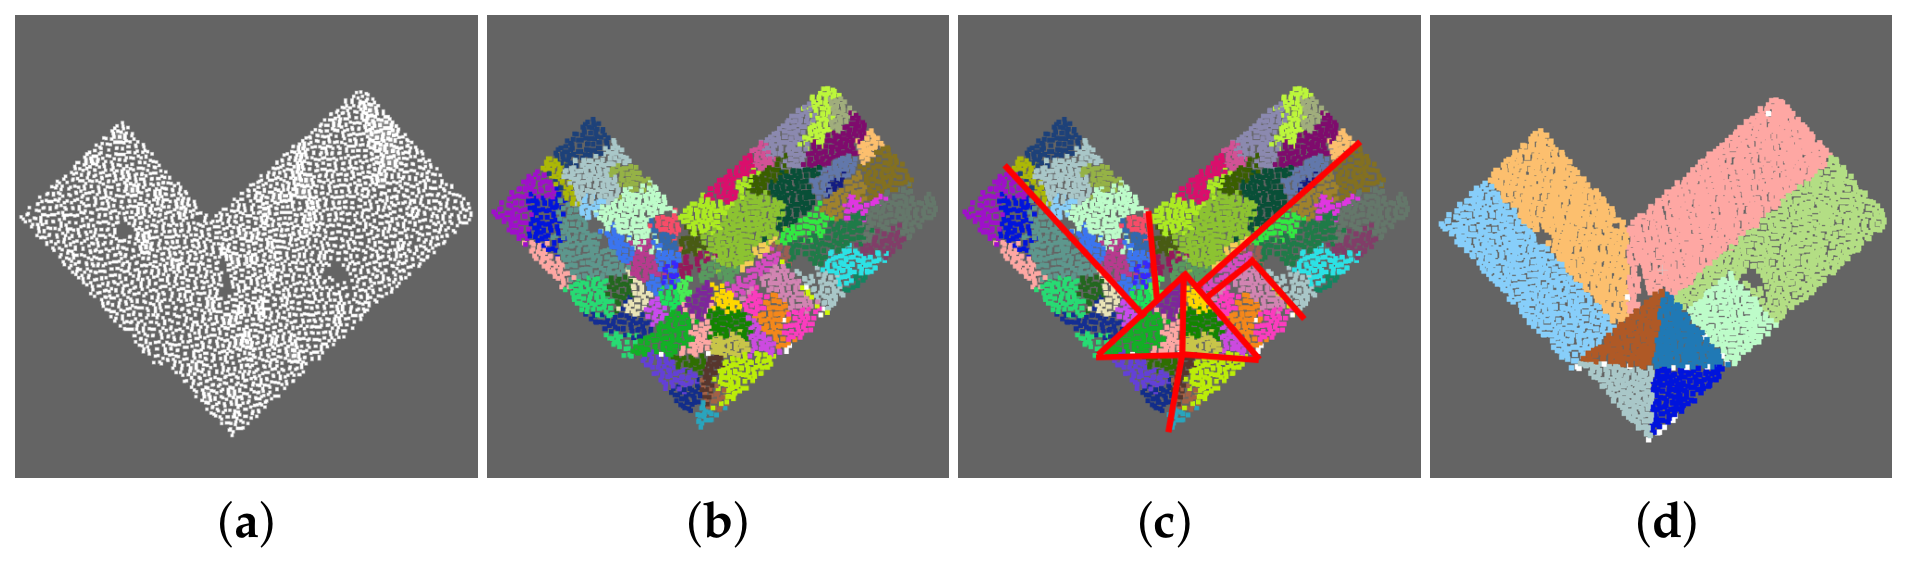
We begin by applying a region growing algorithm to produce an initial coarse plane segmentation. To preserve boundary integrity, we use strict growth parameters, which help prevent points of different planes from being grouped into a single superpoint. However, due to the sequential nature of region growing, early-segmented planes may inadvertently claim points from adjacent, yet distinct, planes—resulting in inaccurate boundary delineation. To correct such errors, we incorporate the local boundary optimization method proposed by Li et al. [2], which selectively adjusts point assignments near plane boundaries. Unlike global optimization techniques, this localized refinement is computationally efficient and sufficient for our purpose. Given that our goal is to prevent misassignments at boundaries rather than perform full-scene optimization, a global algorithm is unnecessary.
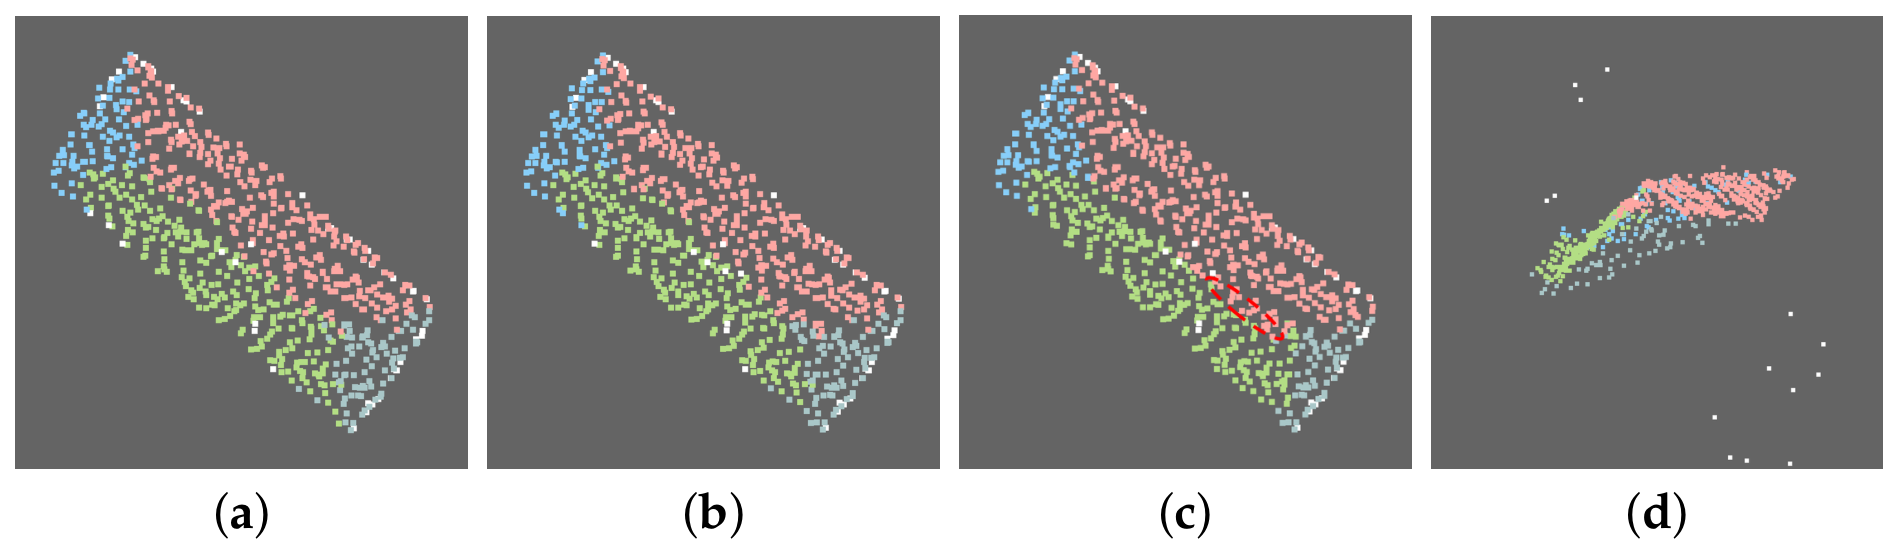
As illustrated in Figure 2, this two-step process—initial region growing followed by boundary refinement—produces superpoints with well-defined boundaries (Figure 2b,c). However, these superpoints still exhibit considerable variation in size and shape, making them unsuitable at this stage as the basic units for the superpoint Transformer.
It is important to highlight that while our implementation uses region growing for the initial segmentation and the local boundary refinement method from [2] for the second step, this design is not exclusive. In principle, other algorithms—such as RANSAC, the Hough Transform, or watershed-based algorithms—could also be applied during the over-segmentation phase. Similarly, graph cut optimization or other optimization techniques could be used in place of the boundary refinement method adopted in our approach. Nevertheless, we select region growing and local boundary refinement [2] primarily due to their computational efficiency.
  • Stage 2: Generating fine-grained superpoints with consistent sizes and shapes
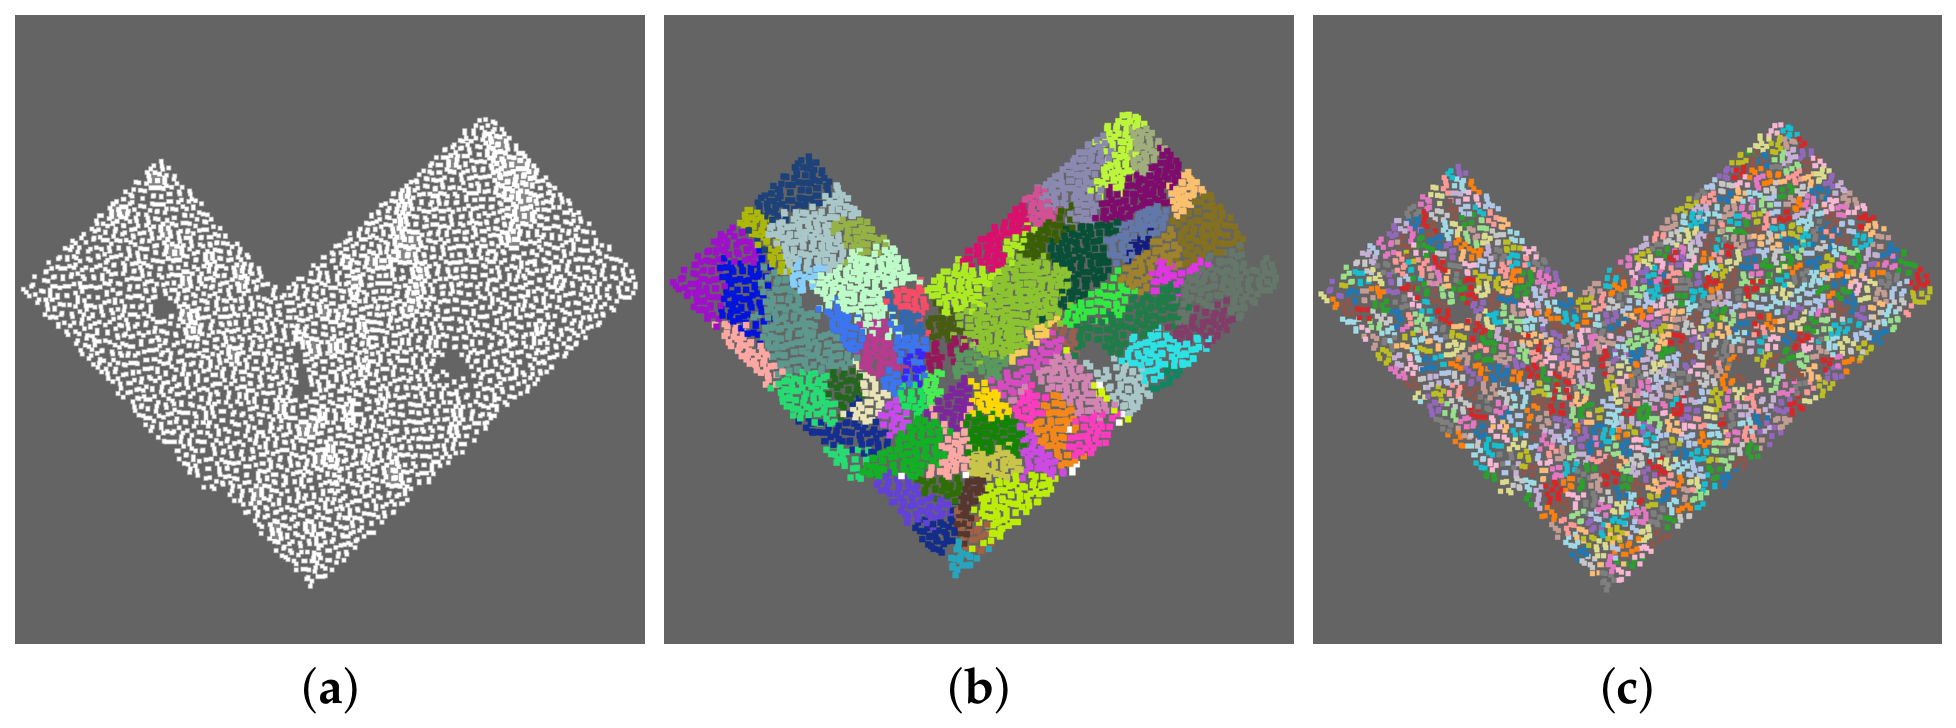
To ensure that the superpoints fed into the Transformer also possess uniform sizes and shapes, we apply the K-means clustering algorithm to partition the coarse-grained superpoints S P coarse and the unfitted points. The desired number of clusters is estimated based on Equation (1).
k = P i n
where n denotes the desired average number of points per superpoint, P i represents the total number of 3D points within a given coarse superpoint or the noise set being processed, and · denotes the ceiling operation, which rounds a real value up to the nearest integer.
K-means clustering is applied to each coarse-grained superpoint based on the 3D spatial coordinates of its constituent points:
F i = { K m e a n s ( P i , k ) , P i > n K m e a n s ( P i , | P i | / 2 ) , P i n .
where K m e a n s ( ) denotes the clustering algorithm, with the first argument being the input point cloud and the second indicating the number of desired clusters. In practice, situations may arise where P i < = n , especially in sparse regions where some coarse-grained superpoints contain few points while covering large spatial space. To address this, we increase the number of clusters in such cases to produce superpoints with a more uniform spatial distribution.
Unfitted points, referred to as NOISE, are treated as a single large superpoint and subjected to K-means clustering. Because the NOISE may contain significant real noise, we use a smaller average superpoint size during the partition process of the NOISE to ensure that each superpoint predominantly contains points from either the same plane or noise. This setting helps reduce the likelihood of mixing plane points with noise points within the same superpoint, thereby improving the network’s performance during feature extraction.
The final set of fine-grained superpoints is formed by dividing the original large-sized superpoints and the unfitted NOISE points, as shown in Equation (3):
S P fine = i F i K m e a n s NOISE , 2 k
Because K-means uses only the spatial coordinates of 3D points and the cluster size is kept relatively small, the resulting superpoints exhibit similar sizes and shapes.
Ultimately, we generate superpoints that satisfy both criteria introduced in Section 3.1.1. Figure 3 presents an illustration of our two-stage superpoint generation strategy. In the first stage, we achieve boundary-accurate superpoint segmentation through a region growing process followed by local boundary refinement (see Figure 3b). In the second stage, the size and shape of the superpoints are adjusted using K-means clustering, further improving the uniformity of superpoint shapes and sizes (see Figure 3c). In the experimental section, we will evaluate how superpoint quality affects segmentation performance.
Compared to existing approaches, our method yields superpoints with accurate boundaries, uniform sizes, and geometrically consistent shapes. These characteristics make the superpoints particularly effective for feature extraction of the superpoint Transformer, enabling generalizable feature learning even under limited training data.

3.2. Handcrafted Features

Deep learning algorithms typically require large training datasets to extract robust and generalizable features [19,70,71,72,73,74]. When the training dataset size is limited, the features extracted by deep learning models often have inherent limitations. To address this issue, we provide the network with a set of manually designed features as input, in addition to the raw 3D point coordinates, to enhance the expressiveness of the deep learning features. These handcrafted features include geometric attributes derived from principal component analysis [75], such as linearity, planarity, scattering, verticality, curvature, and log-transformed local geometric scale descriptors. Additionally, we introduce a roof contour feature based on normal vectors (contour). These handcrafted features may serve as complementary inputs to the raw deep learning features, enhancing the model’s ability to capture more nuanced characteristics of the 3D point cloud, particularly in the context of 3D plane instance segmentation. Our experiments thoroughly validate the effectiveness of these handcrafted features, demonstrating their critical role in improving model performance.
Below is a brief description of the handcrafted features we employ.
Linearity: Regions exhibiting high linearity [76] typically correspond to edges or straight-line features, which are crucial for identifying and delineating boundaries and linear structures, such as building edges, during the segmentation process. By recognizing these high linearity regions, we can refine boundary detection between planes, improving the accuracy of the segmentation of linear structures.
Planarity: High planarity regions [76] are indicative of planar structures, which are often associated with building surfaces. Using the planarity feature allows us to enhance the accuracy of identifying and segmenting planar surfaces. In the context of roof plane segmentation, this feature is critical for accurately recognizing roof planes.
Scattering: The scattering [76] feature helps distinguish between dense areas (e.g., roofs) and dispersed areas (e.g., noise or railing structures). By evaluating the scattering of points, we can better differentiate between valid planar features and noise, thus improving the robustness of segmentation and preventing erroneous classification of sparse noise points as part of the planes.
Verticality: Many important building structures, such as walls, are typically vertical. The verticality [77] feature enables the model to accurately identify vertical planes and distinguish them from horizontal and oblique surfaces. By leveraging this feature, we can improve segmentation performance for roof planes.
For a detailed explanation of linearity, planarity, and scattering, please refer to reference [76]. For verticality, please see reference [77].
Curvature: The curvature feature is used to measure the degree of local surface bending around each point, helping distinguish flat regions (e.g., planar roof surfaces) from curved or edge regions (e.g., roof ridges or roof-plane intersections). It is computed as follows. For each point P i in the point cloud, a covariance matrix C i is constructed using its K nearest neighbors. Eigenvalue decomposition is then performed on the covariance matrix, and the resulting eigenvalues are sorted in descending order such that λ 1 λ 2 λ 3 > 0 . The curvature is defined as:
curvature i = λ 3 λ 1 + λ 2 + λ 3
A curvature value closer to 0 indicates a flatter local surface, whereas a larger value indicates a more curved surface.
Log-transformed local geometric scale descriptors: These scale-related features include log-length, log-surface, and log-volume. The length descriptor represents the extent of the local neighborhood along the first principal direction, the surface descriptor represents the area spanned by the first two principal directions, and the volume descriptor represents the volume spanned by the three principal directions. Through these three features, the network can perceive the spatial scale of the neighborhood surrounding each point.
The three scale-related features are computed as follows. For each point P i in the point cloud, based on the eigenvalues λ 1 λ 2 λ 3 > 0 obtained from the aforementioned eigenvalue decomposition, the original geometric scale descriptors are first defined as follows:
length i = λ 1
surface i = λ 1 × λ 2 = ( λ 1 × λ 2 ) 1 / 4
volume i = ( λ 1 × λ 2 × λ 3 ) 1 / 6
Since these scale descriptors vary considerably in magnitude, directly using them is not conducive to network training. Therefore, logarithmic transformation is applied to these features.
log-length i = log length i + 1
log-surface i = log surface i + 1
log-volume i = log volume i + 1
Contour: The contour feature aids in distinguishing roof planes that are not actually connected in 3D space, such as multilayered roofs. Incorporating this feature into the network is equivalent to performing a connectivity analysis after the network predicts plane instances, but our approach is more efficient.
The contour feature is computed as follows. For each point P i in the point cloud, the tangent plane is calculated based on its neighboring points. For each neighboring point P j of P i , it is projected onto the tangent plane, and this projection is denoted as P j . Next, for each neighboring point P j of P i , we compute the vector
v i j = P j P i .
These vectors are then sorted in a counterclockwise order by calculating the angle between each vector and a reference vector within the tangent plane of P i (e.g., the X-axis of P i ’s tangent plane), and the vectors are sorted based on these angles. The maximum angle α i between adjacent vectors in the sorted list is computed as follows:
α i = max θ ( v i 1 , v i 2 ) , θ ( v i 2 , v i 3 ) , , θ ( v i k , v i 1 ) ,
where θ ( v a , v b ) represents the angle between vectors v a and v b .
Finally, we classify P i as a contour point if α i exceeds a user-defined angle threshold.

3.3. Decoder Integrating Transformer and KAN

In the original SPFormer [14] architecture, the query decoder consists of two branches: an instance branch and a mask branch. The instance branch uses Transformer blocks, while the mask branch extracts mask-aware features via an MLP. However, MLPs rely on stacking nonlinear activation functions to approximate complicated mappings. For highly intricate target functions, this requires many network layers. In the original SPFormer, the mask branch employs a two-layer MLP, which is overly simplistic and lacks sufficient representational power. Although a deeper MLP could increase capacity, it would also introduce a substantial increase in parameters, many of which may contribute little to model performance, further increasing both the model complexity and training difficulty.
To address this issue, we replace the MLP with FourierKAN [65,66] while keeping the parameter count roughly unchanged, because KANs offer a more parameter-efficient solution for approximating nonlinear functions. Under comparable representational capacity, they have fewer parameters, and offer stronger representational capacity at comparable complexity. Additionally, FourierKAN substitutes the B-spline basis functions used in the vanilla KAN with a one-dimensional Fourier series, providing a smooth and naturally periodic function representation. In contrast, B-splines, while effective locally, lack the same level of global smoothness. As a result, Fourier series make it easier to optimize than B-spline designs, and consequently, FourierKAN exhibits better stability than the vanilla KAN.
Another reason for adopting KAN is to assess its effectiveness in processing 3D point clouds, providing insights for future research. In some computer vision tasks, KANs have demonstrated advantages over MLPs [65,66,78,79], whereas in other tasks, the opposite has been observed [68,69]. As the effectiveness of KANs in computer vision remains an active area of exploration, our investigation into its application for 3D point cloud plane instance segmentation aims to contribute valuable insights, potentially guiding future research in this domain.

3.4. Post-Processing

After obtaining the network’s predictions, we further refine the segmentation results by applying two traditional post-processing modules: plane completion and boundary refinement.

3.4.1. Self-Supervised Plane Completion

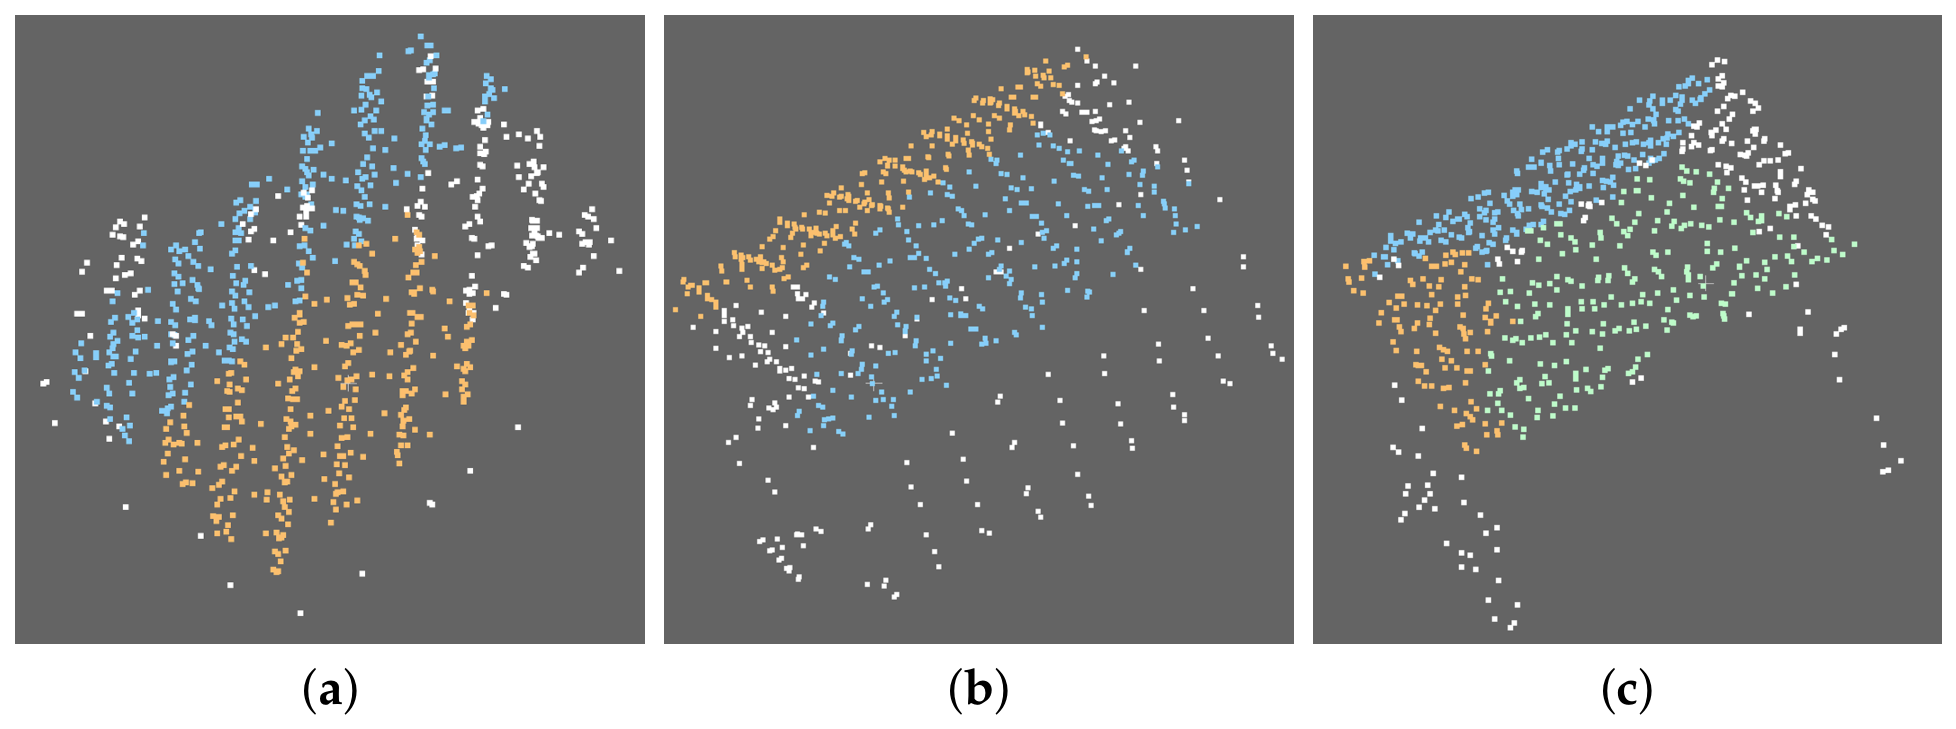
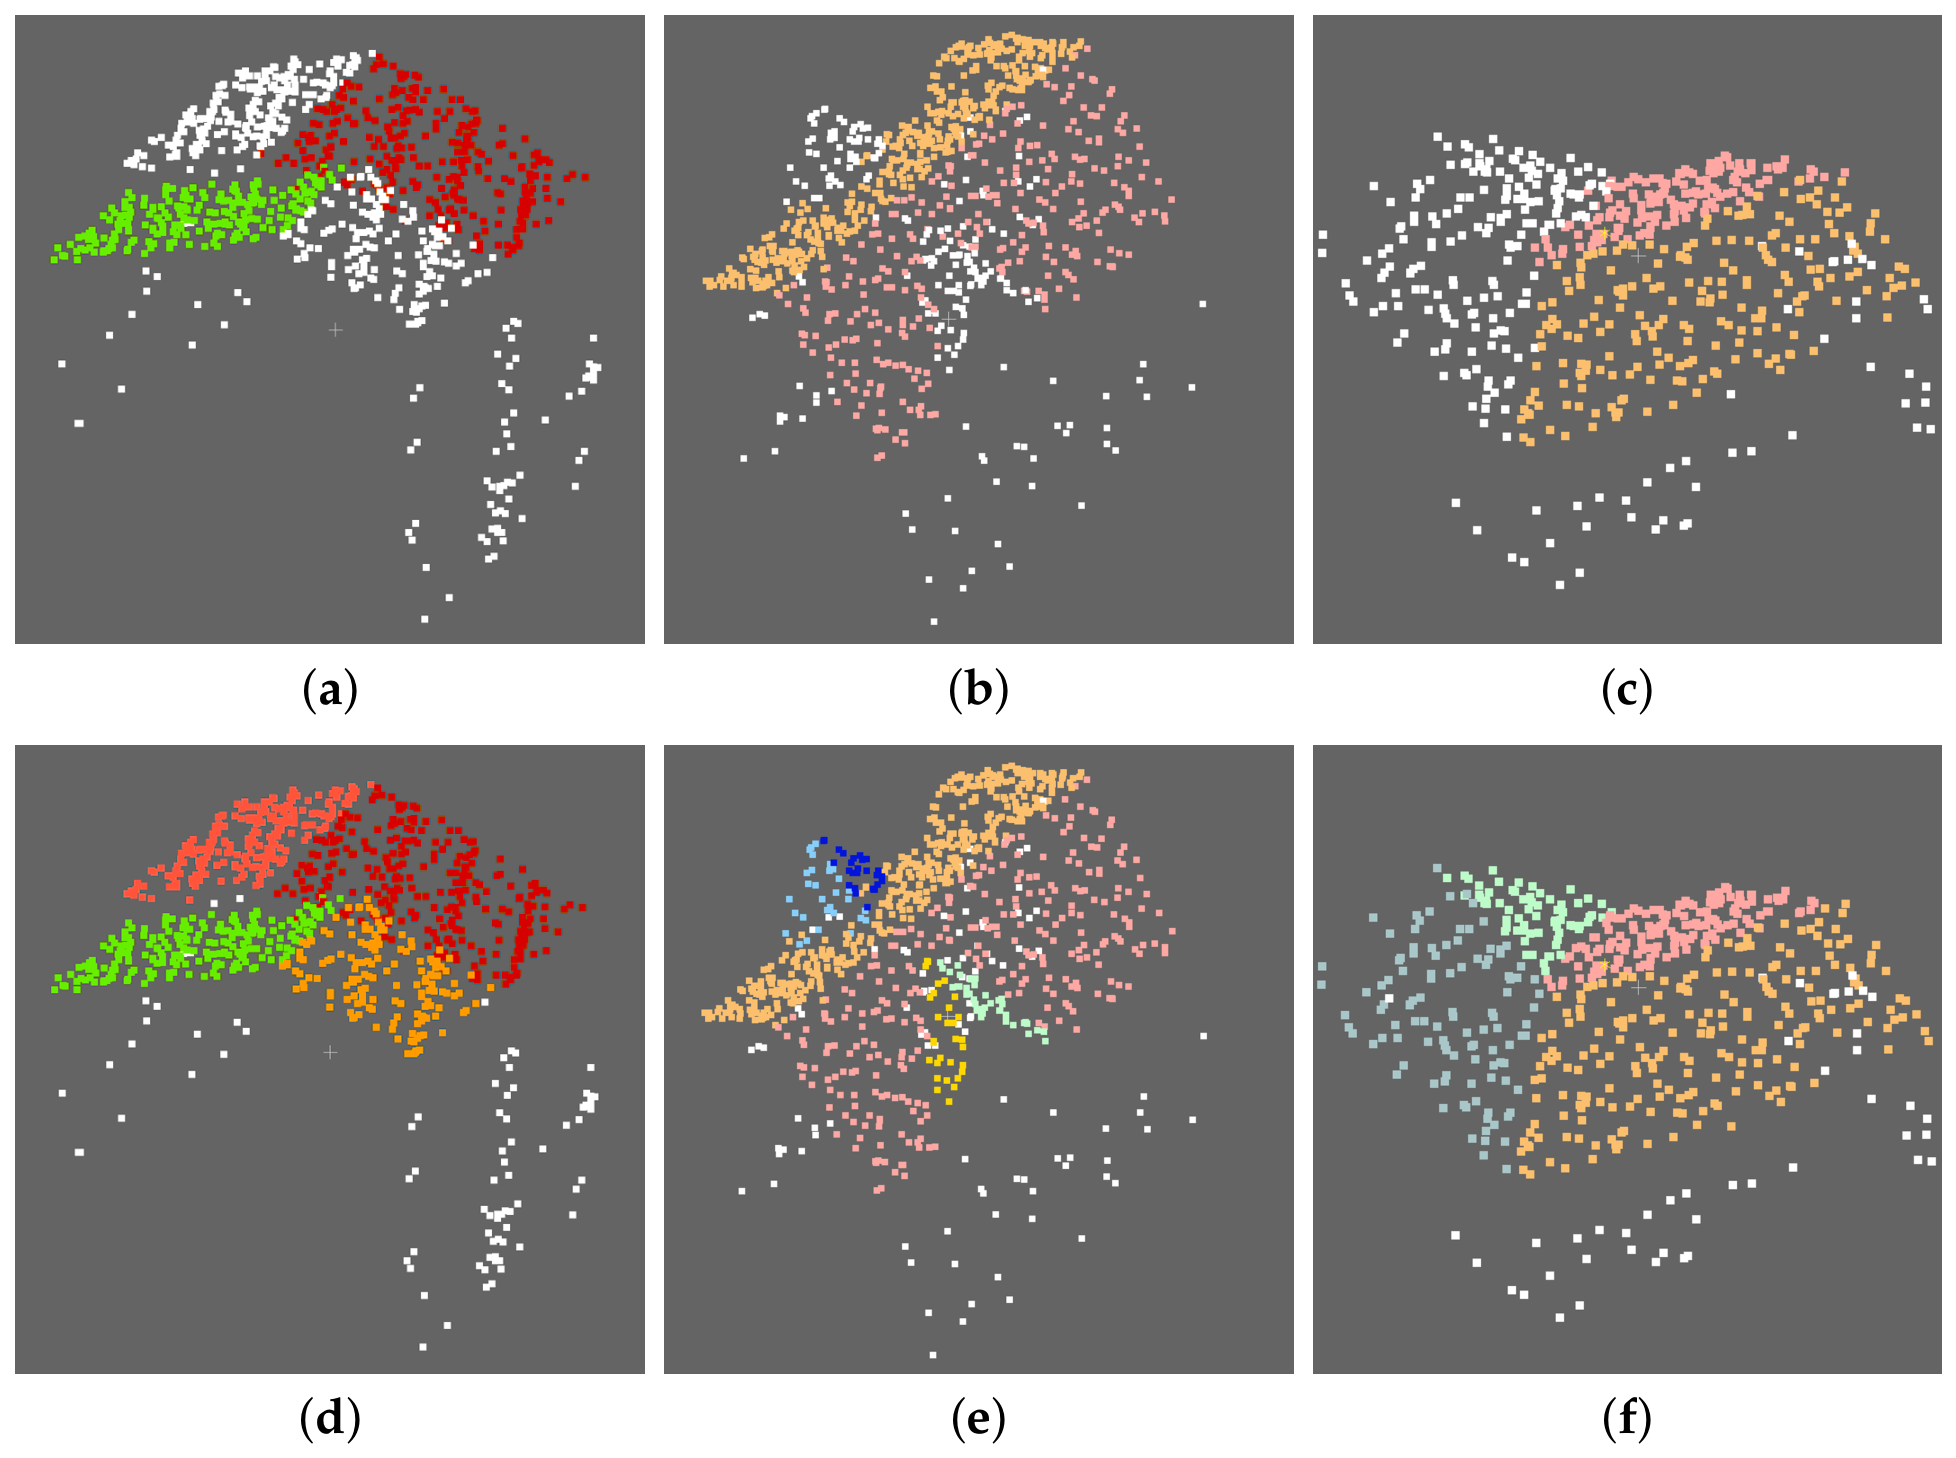
Real-world plane instance segmentation datasets may suffer from incomplete annotations. For example, in the RoofN3D dataset [25], some planes are mistakenly labeled as noise points (see Figure 4). These erroneous annotations in the training set may result in incomplete plane segmentation by neural networks (see Figure 4). Therefore, we introduce a plane completion module. However, if the annotation quality of the dataset is sufficiently high, this post-processing step may become unnecessary. For instance, when processing the Building3D dataset created by us, this module is redundant.
Research across various fields has shown that traditional algorithms often struggle in complex scenarios because these algorithms usually need different parameters for different data [32,80,81,82], or even different parts of the same data sample [83,84,85,86]. However, in real-world applications, it is challenging to fine-tune parameters for each individual data sample or even for different parts of the same data sample. Fortunately, the plane completion task we address here involves relatively simple scenarios. This is because our neural network has already segmented the majority of the planes from the point cloud, and the remaining nonplane data are minimal. Thus, a single set of global parameters is sufficient to achieve satisfactory results for an individual point cloud. Therefore, with reasonable global parameters, region growing is capable of producing satisfactory segmentation for these simple point cloud data; considering also that region growing is highly efficient, we employ it to segment any real planes missed by our network. However, as mentioned earlier, the challenge remains that different point clouds may require distinct global parameters.
To address the issue of global parameters for region growing in nonplane points across different point cloud data, we propose inferring the necessary parameters from the segmented plane instances. In our region growing approach, we rely on the perpendicular distance from a point to the plane and the cosine distance between the point’s normal and the plane’s normal. Thus, the global parameters that need to be estimated are related to these two features. Given that the precision of plane instances may vary across different data, we infer the required parameters from the existing plane instances in the respective point cloud. First, we assume that the existing plane instances were obtained using our region growing algorithm. Based on this assumption, we can retrospectively infer the optimal segmentation parameters for each individual plane instance with respect to the two features used. Then, we set both needed thresholds for initially missed planes to the most relaxed values of the corresponding thresholds across the existing plane instances within the point cloud, because the planes missed by the network typically have lower precision. It is also important to note that we discard planes containing very few points before performing plane completion, as they are likely false detections.

3.4.2. Efficient Boundary Refinement

When using only neural networks, the resulting segmentation often suffers from inaccurate boundaries, including in our network. Additionally, our region growing algorithm for plane completion, being sequential, struggles to effectively segment 3D points at plane boundaries. As a result, after plane completion, we apply a boundary refinement step. To improve efficiency, we focus solely on the 3D points at plane boundaries and avoid using energy-based optimization. Instead, we utilize a composite distance—defined by both the perpendicular distance from a point to the plane and the cosine distance between the point’s normal and the plane’s normal—to assign boundary points to the closest plane. The composite distance is formulated as follows:
d i s composite = λ · d i s P 2 P + d i s N 2 N
where d i s P 2 P represents the perpendicular distance from the point to the plane, d i s N 2 N is the cosine distance between the point’s normal and the plane’s normal, and λ is the weight of d i s P 2 P . We recommend setting λ > 1 because d i s P 2 P is generally more robust than d i s N 2 N .
In our model, we utilize two types of boundary refinement algorithms: the local boundary refinement algorithm from reference [2] used in Section 3.1.2 and our proposed algorithm used in this section. The key difference between the two lies in the trade-off between efficiency and applicability: the algorithm from reference [2] is less efficient but applicable to a wide range of scenarios, while our own algorithm is more efficient but is specifically suited for cases where the main bodies of the roof planes have been well segmented. During the superpoint generation phase, the segmentation quality of the roof planes’ main bodies is relatively poor, so we apply the local boundary refinement algorithm from reference [2]. In contrast, when refining the predictions of our network—where the main bodies of the roof planes are already well segmented—we opt for our own more efficient boundary refinement algorithm.

3.5. Datasets

We evaluated our model on two real-world datasets to assess its generalization capability in practical applications.
The first dataset we used is the RoofN3D dataset [25], which contains 118,074 buildings from New York City. However, a majority of the data are sparse, and some of the annotations are of low quality [26]. For our experiments, we selected data samples with at least 700 points, resulting in a total of 11,189 buildings. Among these, 8189 buildings were used for training, 2000 for validation, and 1000 for testing. It is worth noting that 457 samples in the original RoofN3D dataset contain annotation errors. Therefore, we corrected these errors and conducted experiments on both the original and corrected versions of the dataset. We only consider samples in this dataset containing more than 700 points because, for buildings with too few points, it is difficult to visually inspect and verify the accuracy of their plane instance segmentation annotations.
The second dataset we used is the Building3D dataset [26], which spans over 160,000 buildings across 16 cities in Estonia, covering an area of approximately 998 km2. To date, approximately 40,000 annotated buildings from this dataset have been released. However, the annotations provided only include meshes and wireframes, lacking plane instance segmentation labels. We annotated the roof plane instances for 10,539 buildings based on the available wireframe annotations. Of these, 7539 buildings were used for training, 2000 for validation, and 1000 for testing.
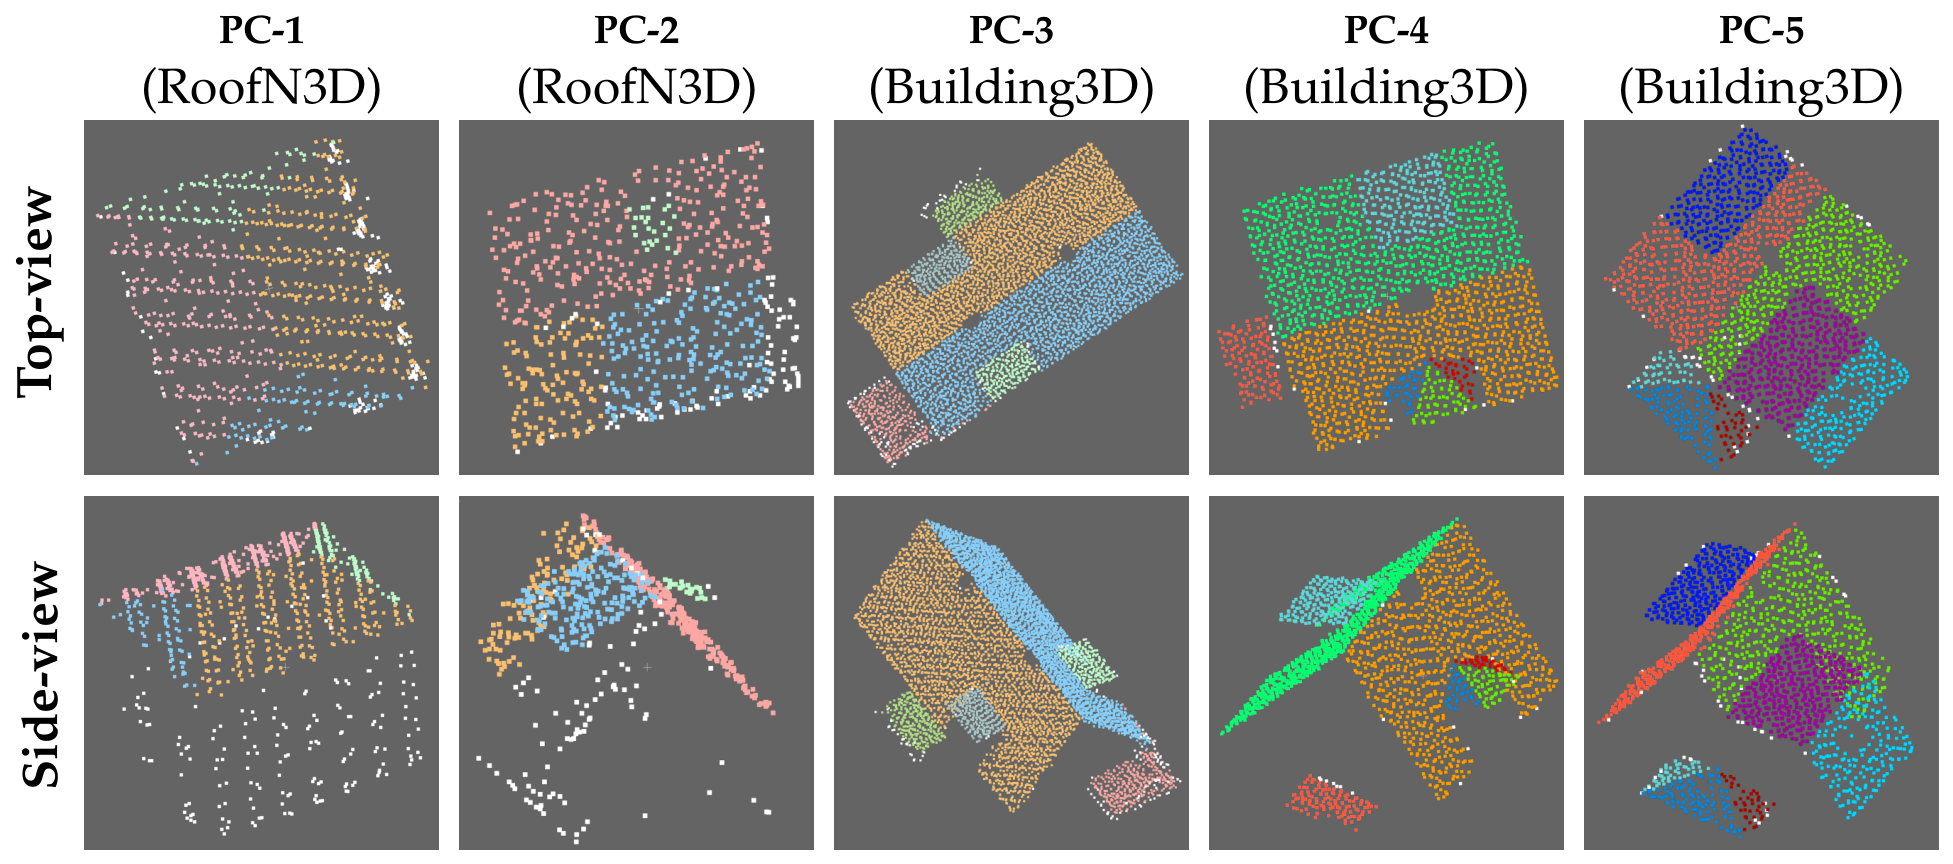
Each of the two datasets presents unique challenges. The Building3D dataset features relatively high and uniform point cloud density, precise 3D points, and high-quality annotations, but it covers a wide variety of complex roof types. In contrast, the RoofN3D dataset primarily contains three roof types: gable, pyramid, and hip. However, the point cloud density is low and highly variable, with low 3D point precision, making it highly challenging to process. Additionally, as discussed in Section 3.4.1, this dataset suffers from incomplete plane instance annotations. In the experiments, we will observe that the original RoofN3D dataset is actually more difficult to handle. Figure 5 provides some samples from both datasets.

4. Experiments and Results

This section primarily presents comparative experiments between our method and competing approaches on the RoofN3D [25] and Building3D [26] datasets (Section 4.3), followed by ablation studies of our model (Section 4.4). The evaluation metrics are introduced in Section 4.1, while Section 4.2 describes the implementation details of our method.

4.1. Evaluation Metrics

We use a range of evaluation metrics to comprehensively assess our model’s performance. These metrics include coverage (Cov), weighted coverage (WCov) [87], precision, recall, and F1 score. Together, these metrics provide a holistic evaluation framework for our model. While Cov and WCov are primarily used for quantitative assessment, the other metrics offer a more detailed analysis of segmentation performance across different methods. Note that all quantitative improvements reported in this paper refer to the absolute increases in evaluation metrics, rather than relative gains.
The above evaluation metrics are defined as follows:
Precision = T P T P + F P
Recall = T P T P + F N
F 1 = 2 × Precision × Recall Precision + Recall
Cov = 1 N g t i max j IoU P i , G j
WCov = 1 k P k i P i × max j IoU P i , G j
where T P , F P , and F N denote the numbers of true positives, false positives, and false negatives, respectively; N g t is the total number of ground-truth instances; P i is the number of points in the i-th predicted instance; IoU P i , G j denotes the intersection over union (IoU) between the predicted instance P i and the ground-truth instance G j ; and max j IoU P i , G j represents the maximum IoU between the predicted instance P i and all ground-truth instances.

4.2. Implementation Details

Our SPPSFormer was trained using the AdamW optimizer with an initial learning rate of 0.0001, a batch size of 4, and a weight decay factor of 0.05. The PolyLR learning rate scheduling strategy was applied, with a decay power of 0.9. To ensure reproducibility, the random seed was fixed at 200 for all experiments conducted using a single seed. Training was performed on an NVIDIA Tesla V100 GPU (NVIDIA Corporation, Santa Clara, CA, USA), with 100 epochs on the RoofN3D dataset and 200 epochs on the Building3D dataset. In all experiments, we set λ to 20 in our boundary refinement module.

4.3. Comparative Experiments

We compared the proposed SPPSFormer with two traditional roof plane segmentation algorithms—the hierarchical clustering and boundary relabeling (HCBR) algorithm [2] and the quasi-a-contrario theory-based plane segmentation (QTPS) algorithm [88]—as well as the superpoint Transformer-based 3D point cloud instance segmentation network SPFormer [14], the strong baseline model for point cloud segmentation, Point Transformer v3 (PTv3) [27], and the latest deep learning network for segmenting plane instances from 3D point clouds, DeepRoofPlane [22]. Note that PTv3 here refers to PointGroup [89] with its backbone replaced by PTv3. This implementation was developed by the same research team that proposed both PTv3 and PointGroup.
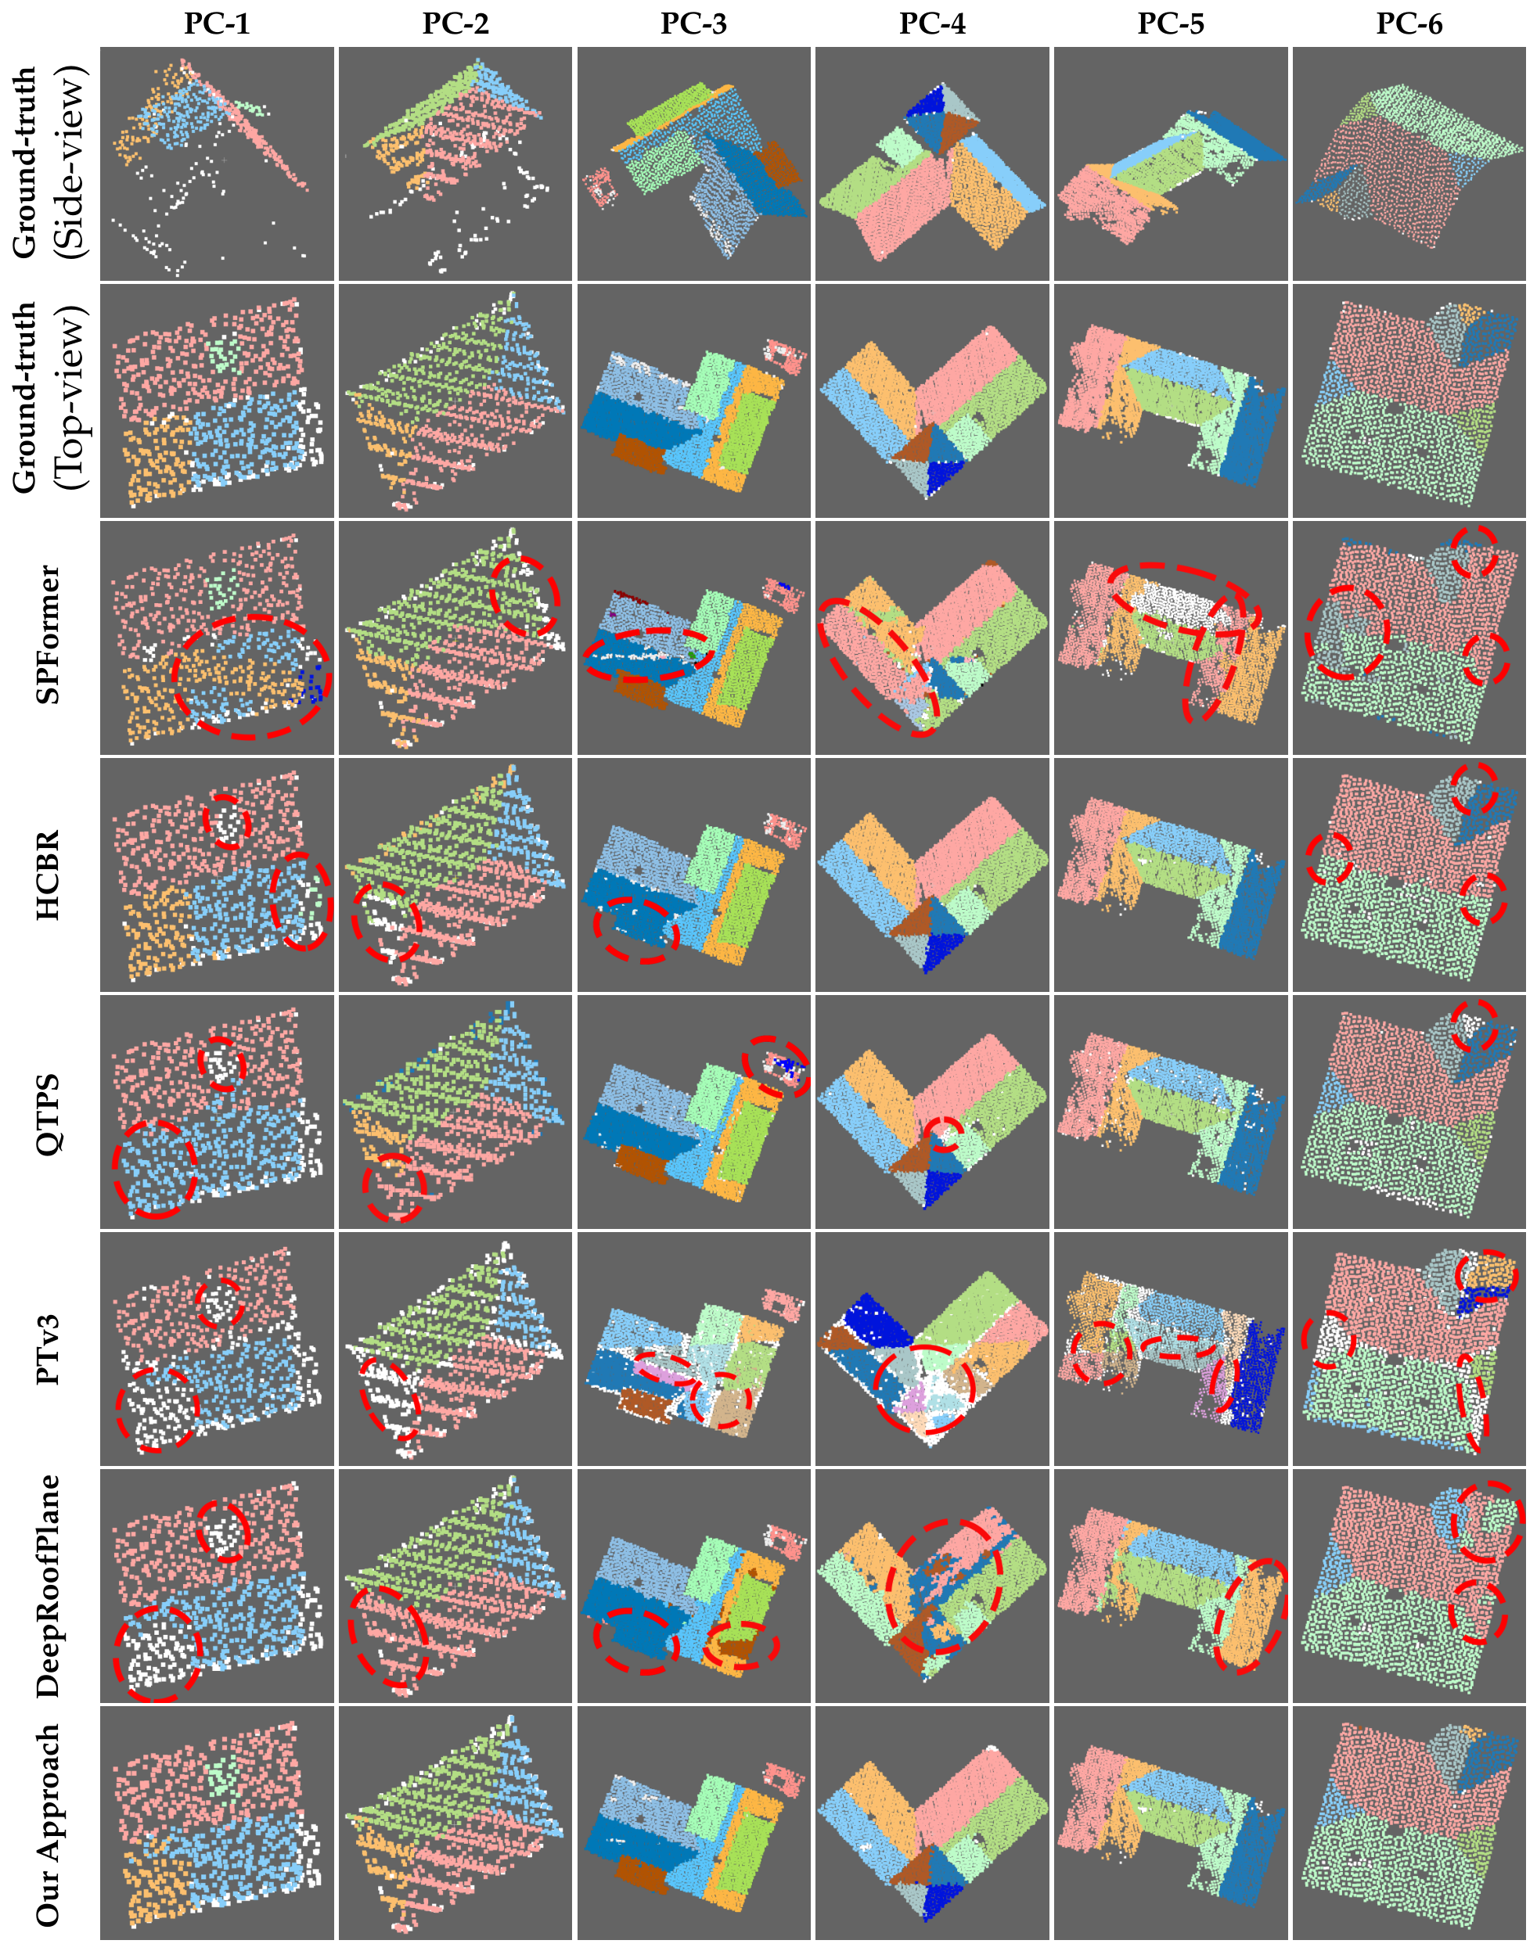
Table 1 presents detailed quantitative evaluation results using the original RoofN3D dataset. Due to low point cloud density, significant density variations, and low point precision in this dataset, plane instance segmentation is theoretically highly challenging. As shown in Table 1, our proposed SPPSFormer achieves excellent performance across all evaluation metrics, particularly excelling in the Cov metric. Compared to the second-best method, DeepRoofPlane [22], our SPPSFormer improves Cov and WCov by 3.03% and 1.85%, respectively. These results indicate that our method offers high accuracy and robustness in plane instance extraction tasks. It is worth noting that the QTPS algorithm was only able to process 392 out of the 1000 test samples, and the evaluation results for QTPS are based solely on these 392 samples. The qualitative comparison results, shown in Figure 6, further validate the above conclusions. It should also be noted that in Table 1, the best-performing algorithms are highlighted in bold, a formatting choice that is consistently applied to the subsequent tables throughout the paper.
A key highlight of our work is the development of a lightweight model architecture, SPPSFormer nano, achieved by reducing the number of decoder layers and their dimensions and the size of hidden layers. This optimization reduces the model complexity by 90%, bringing the number of parameters down to just 1.8 M. Despite this significant reduction in complexity, SPPSFormer nano still performs exceptionally well, as shown in Table 1. This demonstrates the model’s ability to maintain strong performance while drastically reducing the computational requirements. Such advancements open the door for deploying effective deep learning models in resource-constrained environments.
Table 2 presents the quantitative evaluation results on the Building3D dataset. As illustrated, our approach outperforms other methods, showing an improvement of 1.75% in Cov and 1.17% in WCov compared to the second-best deep learning-based method, DeepRoofPlane [22]. Notably, the QTPS algorithm only worked on 901 out of 1000 test samples, and the values in Table 2 are averaged over these 901 samples. The qualitative comparison results shown in Figure 6 further validate the effectiveness of our approach. Additionally, SPPSFormer nano also demonstrates strong performance on the Building3D dataset.
Because the RoofN3D dataset was automatically annotated using a traditional algorithm, some of the ground-truth annotations contain errors. To address this, we manually reannotated 49 samples in the test set that exhibited severe annotation errors. Examples of the corrected samples are shown in Figure 7. With this reannotated test set, we conducted a more rigorous evaluation. Table 3 presents the quantitative evaluation results, which once again demonstrate the significant advantages of our SPPSFormer. Notably, our SPPSFormer nano also performs well on the revised RoofN3D test set.
To investigate the potential of deep learning algorithms on the error-free RoofN3D dataset, we further corrected the annotation errors for 408 samples in the RoofN3D training and validation sets (having already corrected the test set annotations, as previously described). We then retrained our SPPSFormer, PTv3 [27], and DeepRoofPlane [22] using the corrected RoofN3D training set. As shown in the quantitative results in Table 3 and Table 4, the segmentation performance of both our SPPSFormer and DeepRoofPlane significantly improves after the training set annotations are corrected. This indicates that the suboptimal performance of these models in Table 3 can, at least in part, be attributed to the poor annotation quality of the RoofN3D training set. Therefore, for deep learning-based methods to perform optimally, it is crucial that the dataset annotations are sufficiently accurate. The quantitative comparison results in Table 4 demonstrate that our SPPSFormer still achieves significantly superior performance compared to PTv3 and DeepRoofPlane.
To further validate the superiority of our method over the baseline methods, we conducted repeated experiments using five different random seeds for the best-performing baseline method, DeepRoofPlane, and our proposed SPPSFormer. The results are reported in the form of “mean ± standard deviation”, as shown in Table 5, Table 6, Table 7 and Table 8. The experimental results indicate that all metrics of SPPSFormer exhibit relatively small standard deviations across different random seeds, demonstrating good stability and robustness. In addition, we performed paired t-tests based on the coverage (Cov) values. The statistical results further confirm that SPPSFormer significantly outperforms the baseline method DeepRoofPlane (p < 0.05). Note that in Table 5, Table 6, Table 7 and Table 8, “N/A” is the abbreviation for “not applicable”. This also applies to the remaining tables in this paper.
Since both SPPSFormer and DeepRoofPlane adopt a hybrid framework—neural network prediction followed by traditional boundary refinement as post-processing—we further compared their performance without boundary refinement on three datasets: (1) the RoofN3D dataset with only the test set corrected, (2) the fully corrected RoofN3D dataset, and (3) the Building3D dataset. The quantitative results are presented in Table 9, Table 10 and Table 11, which also include the quantitative performance of PTv3. From Table 9 and Table 11, it can be observed that on the RoofN3D dataset with only the test set corrected and on the Building3D dataset, our network-only predictions significantly outperform those of DeepRoofPlane. From Table 10 and Table 11, it can be observed that on the fully corrected RoofN3D dataset and the Building3D dataset, our network-only results are significantly superior to those of PTv3. It is important to clarify that, in these comparisons, all post-processing steps were removed from our SPPSFormer. In contrast, PTv3 and DeepRoofPlane still retain the clustering step as post-processing, since their networks only generate features and rely on traditional clustering algorithms to produce the segmentation results.
For the experiments corresponding to Table 9, Table 10 and Table 11, we also assessed the statistical reliability of the results by repeating the experiments with five different random seeds for both the strongest baseline, DeepRoofPlane, and the proposed SPPSFormer. The averaged results and standard deviations are summarized in Table 12, Table 13 and Table 14. As can be observed, SPPSFormer consistently achieves low standard deviations across all evaluation metrics, suggesting that its performance is not sensitive to random initialization. Moreover, paired t-tests were conducted using the coverage (Cov) values, and the obtained results show that the improvements achieved by SPPSFormer over DeepRoofPlane are statistically significant (p < 0.05).

4.4. Ablation Experiments

In this section, we conduct ablation studies to evaluate the impact of the five improvements proposed in this paper.
Ablation experiments on our three modifications to the network. We first performed a detailed quantitative assessment of the performance improvements resulting from three key modifications to the network architecture, using the RoofN3D and Building3D datasets. The ablation results are shown in Table 15 and Table 16, where not selecting SP indicates the use of the superpoints employed by SPFormer [14] and not selecting KAN indicates that the MLP in the decoder is not replaced by KAN. The comparative results highlight that introducing our superpoint generation method alone leads to substantial improvements. Specifically, on the fully corrected RoofN3D dataset, Cov increases by 13.05% and WCov by 12.41%; on the RoofN3D dataset with only the test set corrected, Cov increases by 12.71% and WCov by 10.97%. On the Building3D dataset, Cov improves by 8.75% and WCov by 8.42%. These results validate the significance of our superpoint generation criteria in deep learning tasks and confirm the effectiveness of our proposed superpoint generation approach. Additionally, ablation experiments on the three datasets show that incorporating our handcrafted features enhances the model’s performance, indicating that our handcrafted features play a crucial role, especially when the training set is limited in size. Additionally, replacing the traditional MLP layer with the FourierKAN layer in the decoder yields further performance improvements under most testing conditions, confirming the positive role of KAN in model optimization. By comparing the results on the RoofN3D datasets in Table 15 and Table 16, we can further observe that when the training set annotations are of lower quality, the introduction of handcrafted features and KAN leads to more pronounced improvements. This is because, under such conditions, the baseline models without these two components perform relatively poorly, leaving greater room for performance gains.
When all three improvements are simultaneously introduced to the network model, as shown in Table 15 and Table 16, we observe significant performance gains. On the fully corrected RoofN3D dataset, Cov increases by 14.07% and WCov by 13.12%; on the RoofN3D dataset with only the test set corrected, Cov increases by 19.91% and WCov by 18.35%; on the Building3D dataset, Cov improves by 9.67% and WCov by 9.21%. These experimental results collectively demonstrate the effectiveness and importance of our proposed strategies in enhancing model performance.
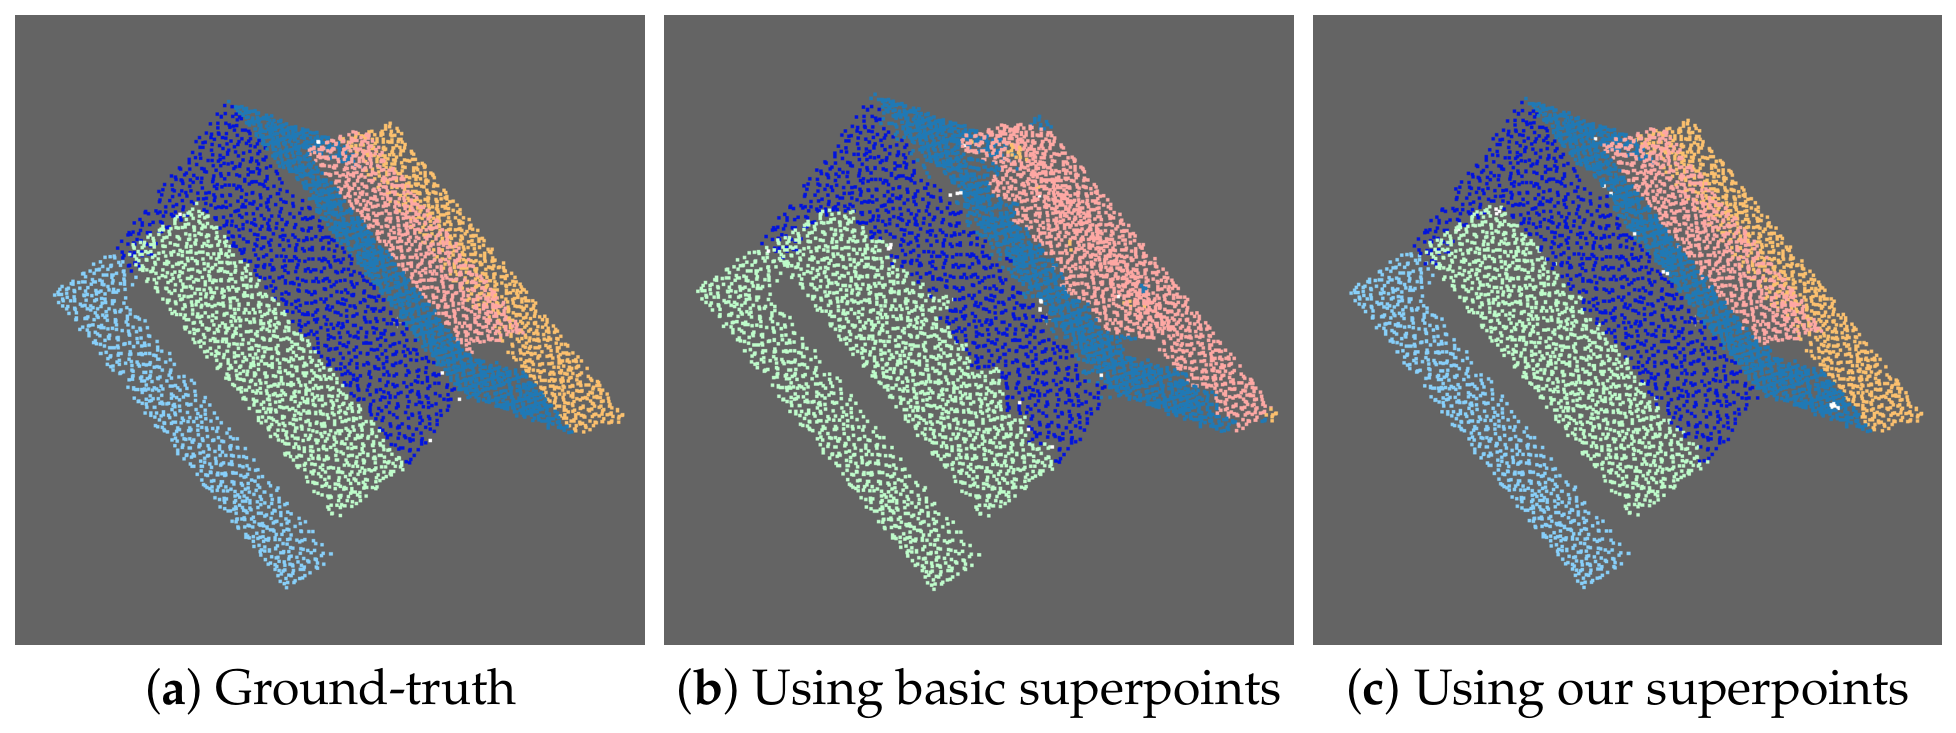
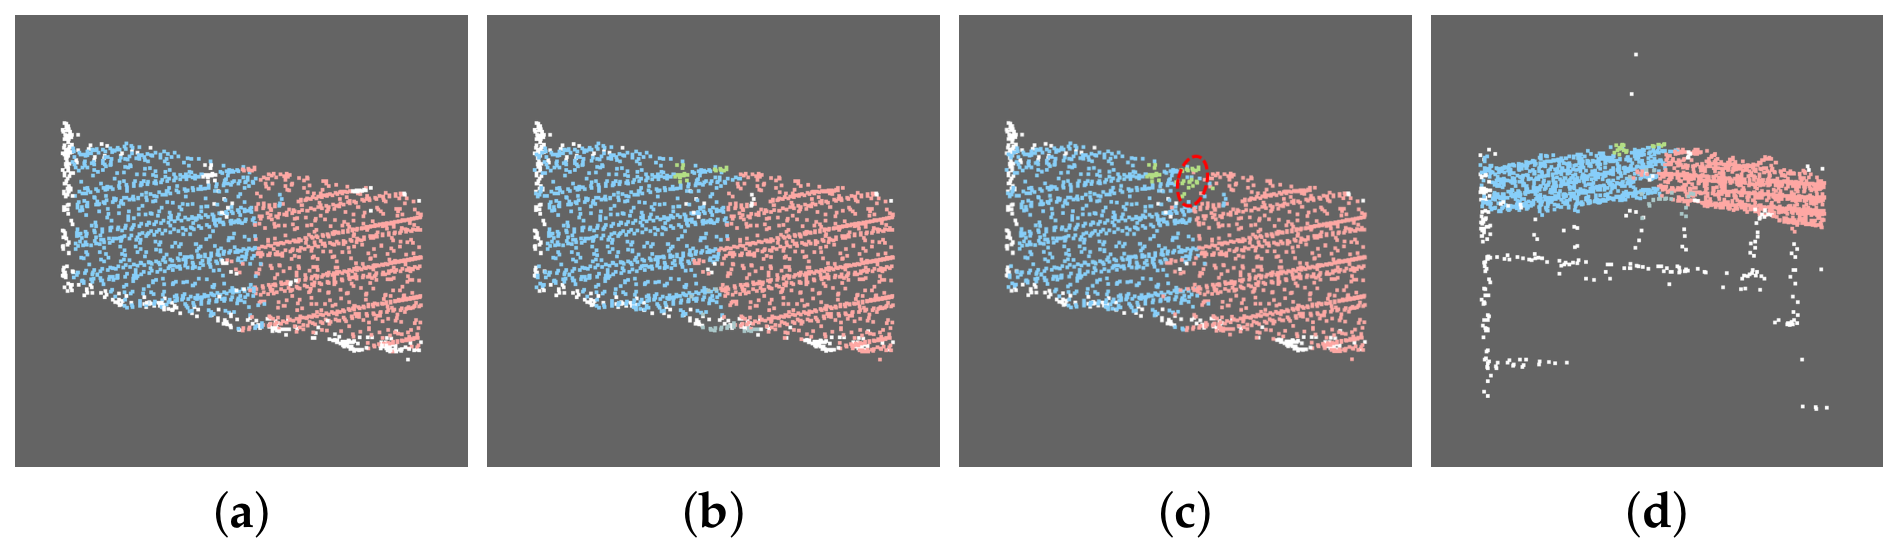
Figure 8 presents a qualitative comparison between the network predictions of our SPPSFormer and the SPPSFormer model using superpoints from SPFormer [14] (referred to as basic superpoints) on the Building3D dataset. As shown in Figure 8, plane instance segmentation using basic superpoints results in inaccurate boundaries and severe under-segmentation. In contrast, using our proposed superpoints leads to significant improvements in segmentation performance. This further validates the crucial role of our superpoint generation method in enhancing the network’s ability to perform accurate plane instance segmentation.
Since the primary contribution of this paper is the proposal of a set of high-quality superpoint generation criteria—consisting of two principles—along with a feasible generation pipeline, we further conduct ablation studies on our superpoint generation strategy to verify that both criteria must be satisfied simultaneously. Specifically, we perform experiments with and without post-processing on the fully corrected RoofN3D dataset and the Building3D dataset, yielding two sets of results shown in Table 17 and Table 18. The results clearly indicate that satisfactory performance can only be achieved when both proposed criteria for high-quality superpoints are adopted simultaneously; otherwise, the performance degrades significantly.
Ablation experiments on our two post-processing modules.Table 19 and Table 20 present the quantitative ablation results for the two proposed post-processing modules. From these tables, we can see that on the fully corrected RoofN3D dataset, applying only the plane completion module results in an increase in Cov by 3.28% and WCov by 1.47%; on the RoofN3D dataset with only the test set corrected, applying only the plane completion module results in an increase in Cov by 2.67% and WCov by 1.02%. On the Building3D dataset, the increases are more modest at 0.91% and 0.17%, respectively. The performance of the plane completion module on the fully corrected RoofN3D dataset indicates that, even when plane omission issues are not caused by incomplete plane annotations in the training set, our plane completion module can still effectively address the problem.
Building upon the plane completion module, the addition of the boundary refinement module further enhances segmentation performance on both the RoofN3D dataset with only the test set corrected and the Building3D dataset. The improvement is modest on the Building3D dataset but substantial on the RoofN3D dataset with only the test set corrected. No gains in accuracy are observed on the fully corrected RoofN3D dataset. This discrepancy arises because the Building3D dataset features relatively high point precision, density, uniformity, and high annotation accuracy, allowing our network to already perform well, with limited room for enhancement. Conversely, the RoofN3D dataset with only the test set corrected suffers from low point cloud precision and density, significant density variations, and low annotation accuracy, resulting in poorer initial performance and greater potential for improvement. As for the performance of the boundary refinement module on the fully corrected RoofN3D dataset, it can be explained as follows: although the module refines boundaries for some test samples, it may also introduce boundary degradation in other test samples due to noise. The initial boundaries on the fully corrected RoofN3D dataset are already relatively precise; therefore, the potential positive contribution of the boundary refinement module is limited. However, its negative effects still persist. As a result, the overall performance shows a slight, almost negligible decline.
When both plane completion and boundary refinement modules are applied, Cov and WCov increase by 6.38% and 5.26% on the RoofN3D dataset with only the test set corrected, respectively. On the fully corrected RoofN3D dataset, the increases are more modest at 2.94% and 1.08%, respectively. On the Building3D dataset, the increases are also modest at 1.48% and 0.67%, respectively. These results demonstrate that our post-processing algorithms adapt well to varying dataset characteristics. Furthermore, due to the presence of the boundary refinement module, our method is less sensitive to inaccurate plane boundary annotations in the training set, as evidenced by the experiments in Section 5.
In the second stage of the superpoint generation algorithm, we adjust the size and shape of superpoints using K-means clustering. The desired average number of points per superpoint is empirically set to 4 for the RoofN3D dataset and 5 for the Building3D dataset. To justify these settings, we added an ablation study on the desired average number of points per superpoint n (see Equation (1)). Specifically, we compared the network prediction performance without post-processing and the final model performance with post-processing for n values ranging from 3 to 8. The quantitative results are presented in Table 21 and Table 22, respectively. The results show that the best performance is achieved when n = 4 on the fully corrected RoofN3D dataset and n = 5 on the Building3D dataset. Table 21 and Table 22 also indicate that our model performs well across all tested values from 3 to 8 on the RoofN3D dataset, and across values from 3 to 7 on the Building3D dataset. Therefore, it can be concluded that, within a reasonable range, the performance of our model does not vary significantly with n.
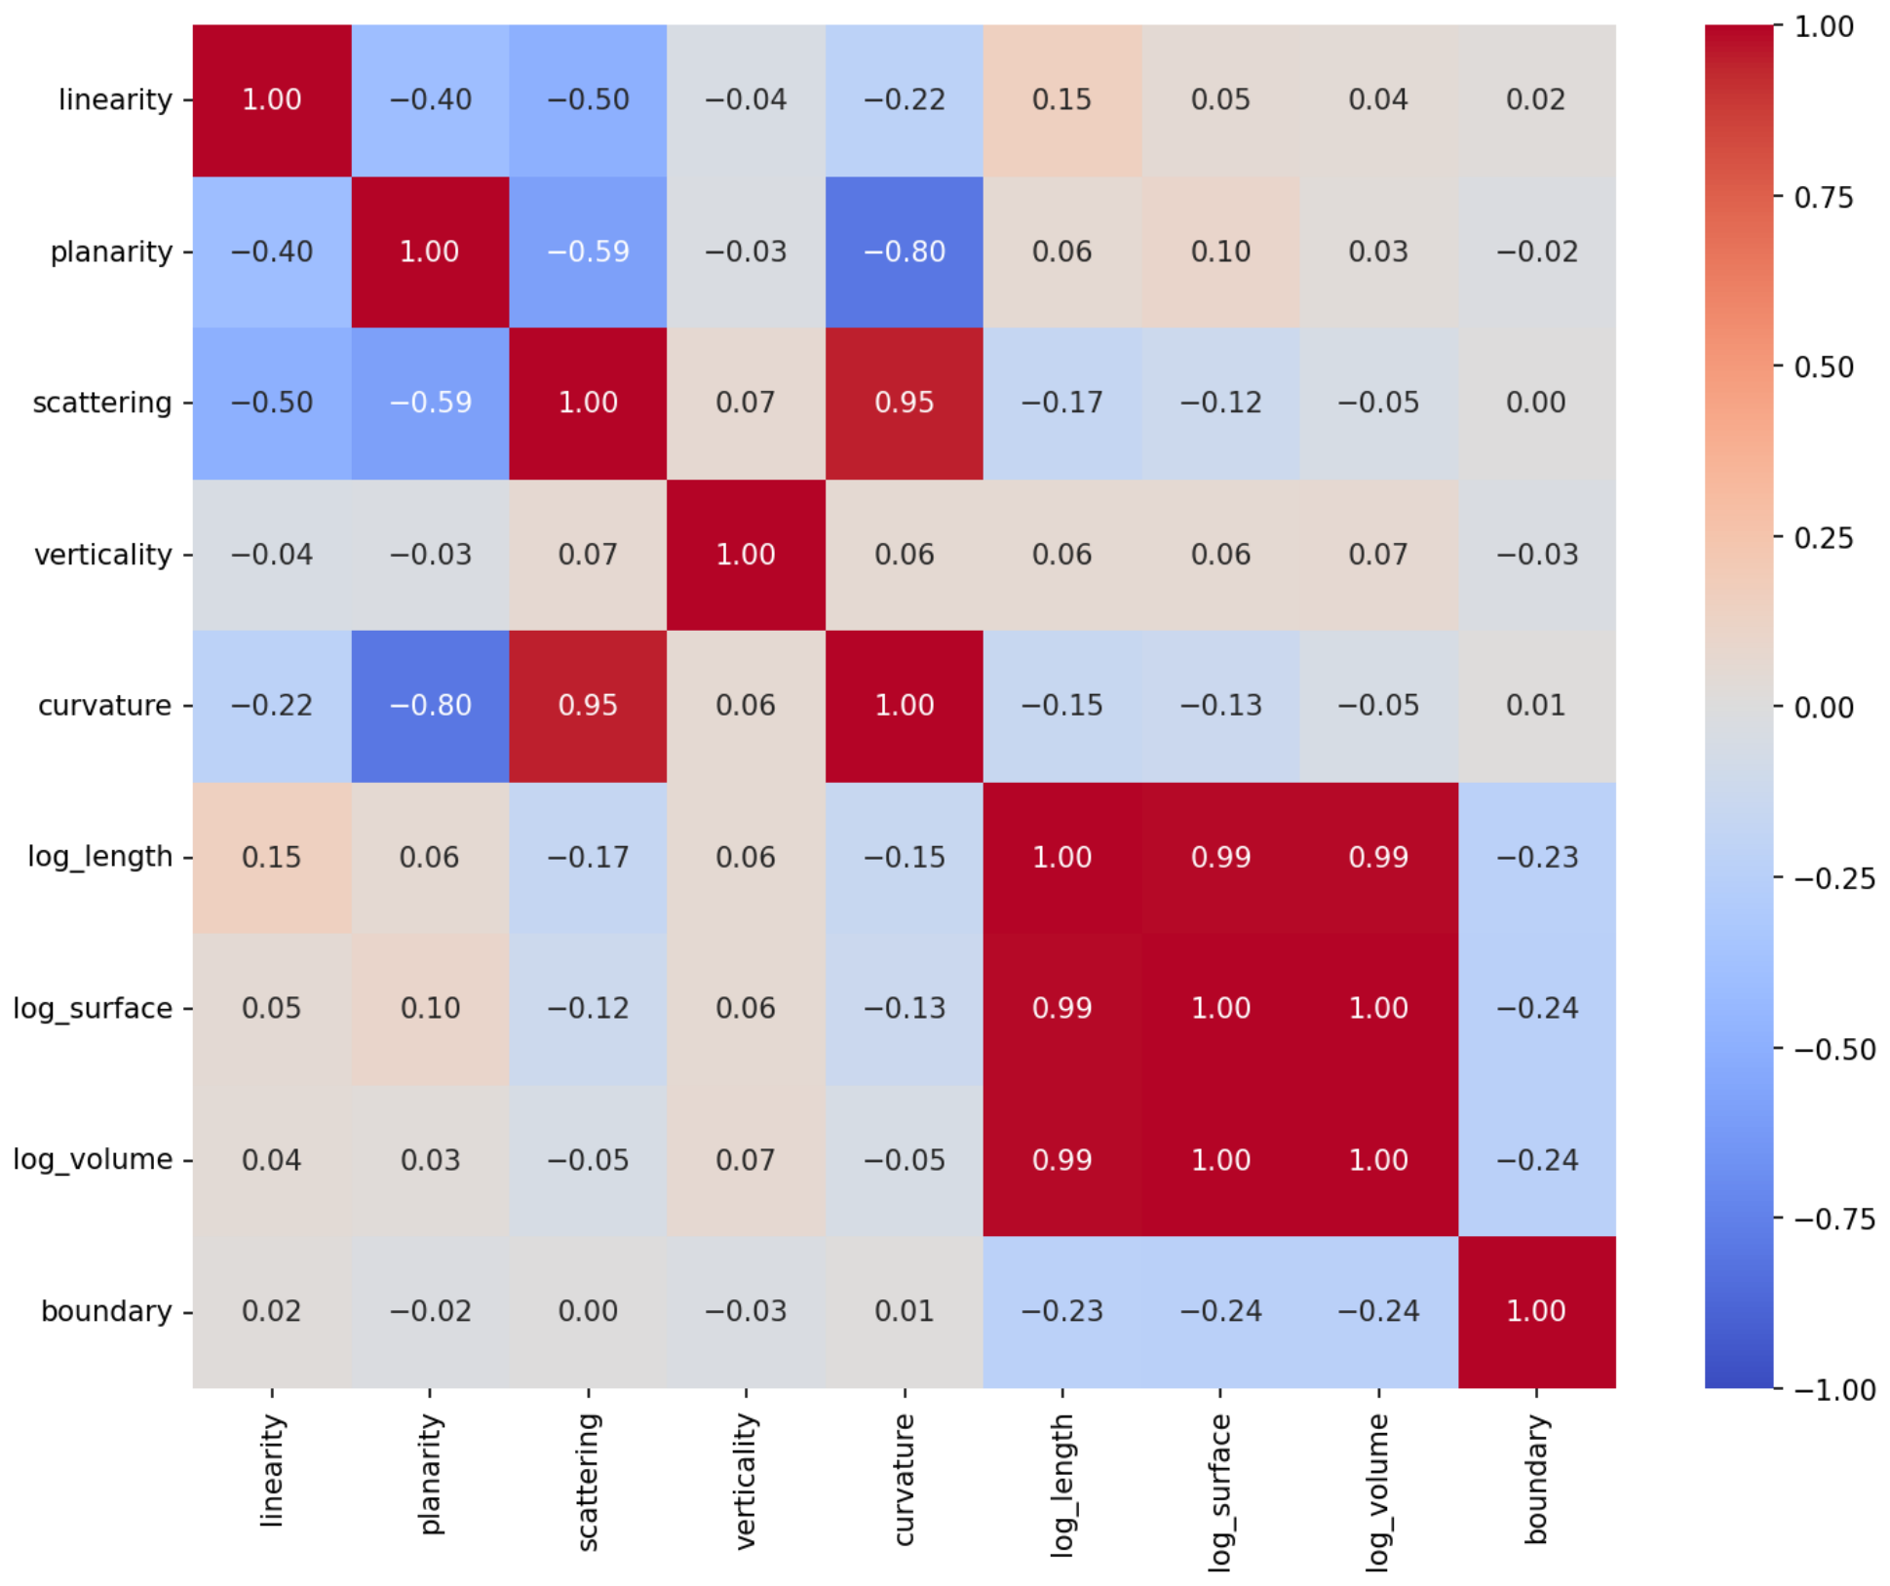
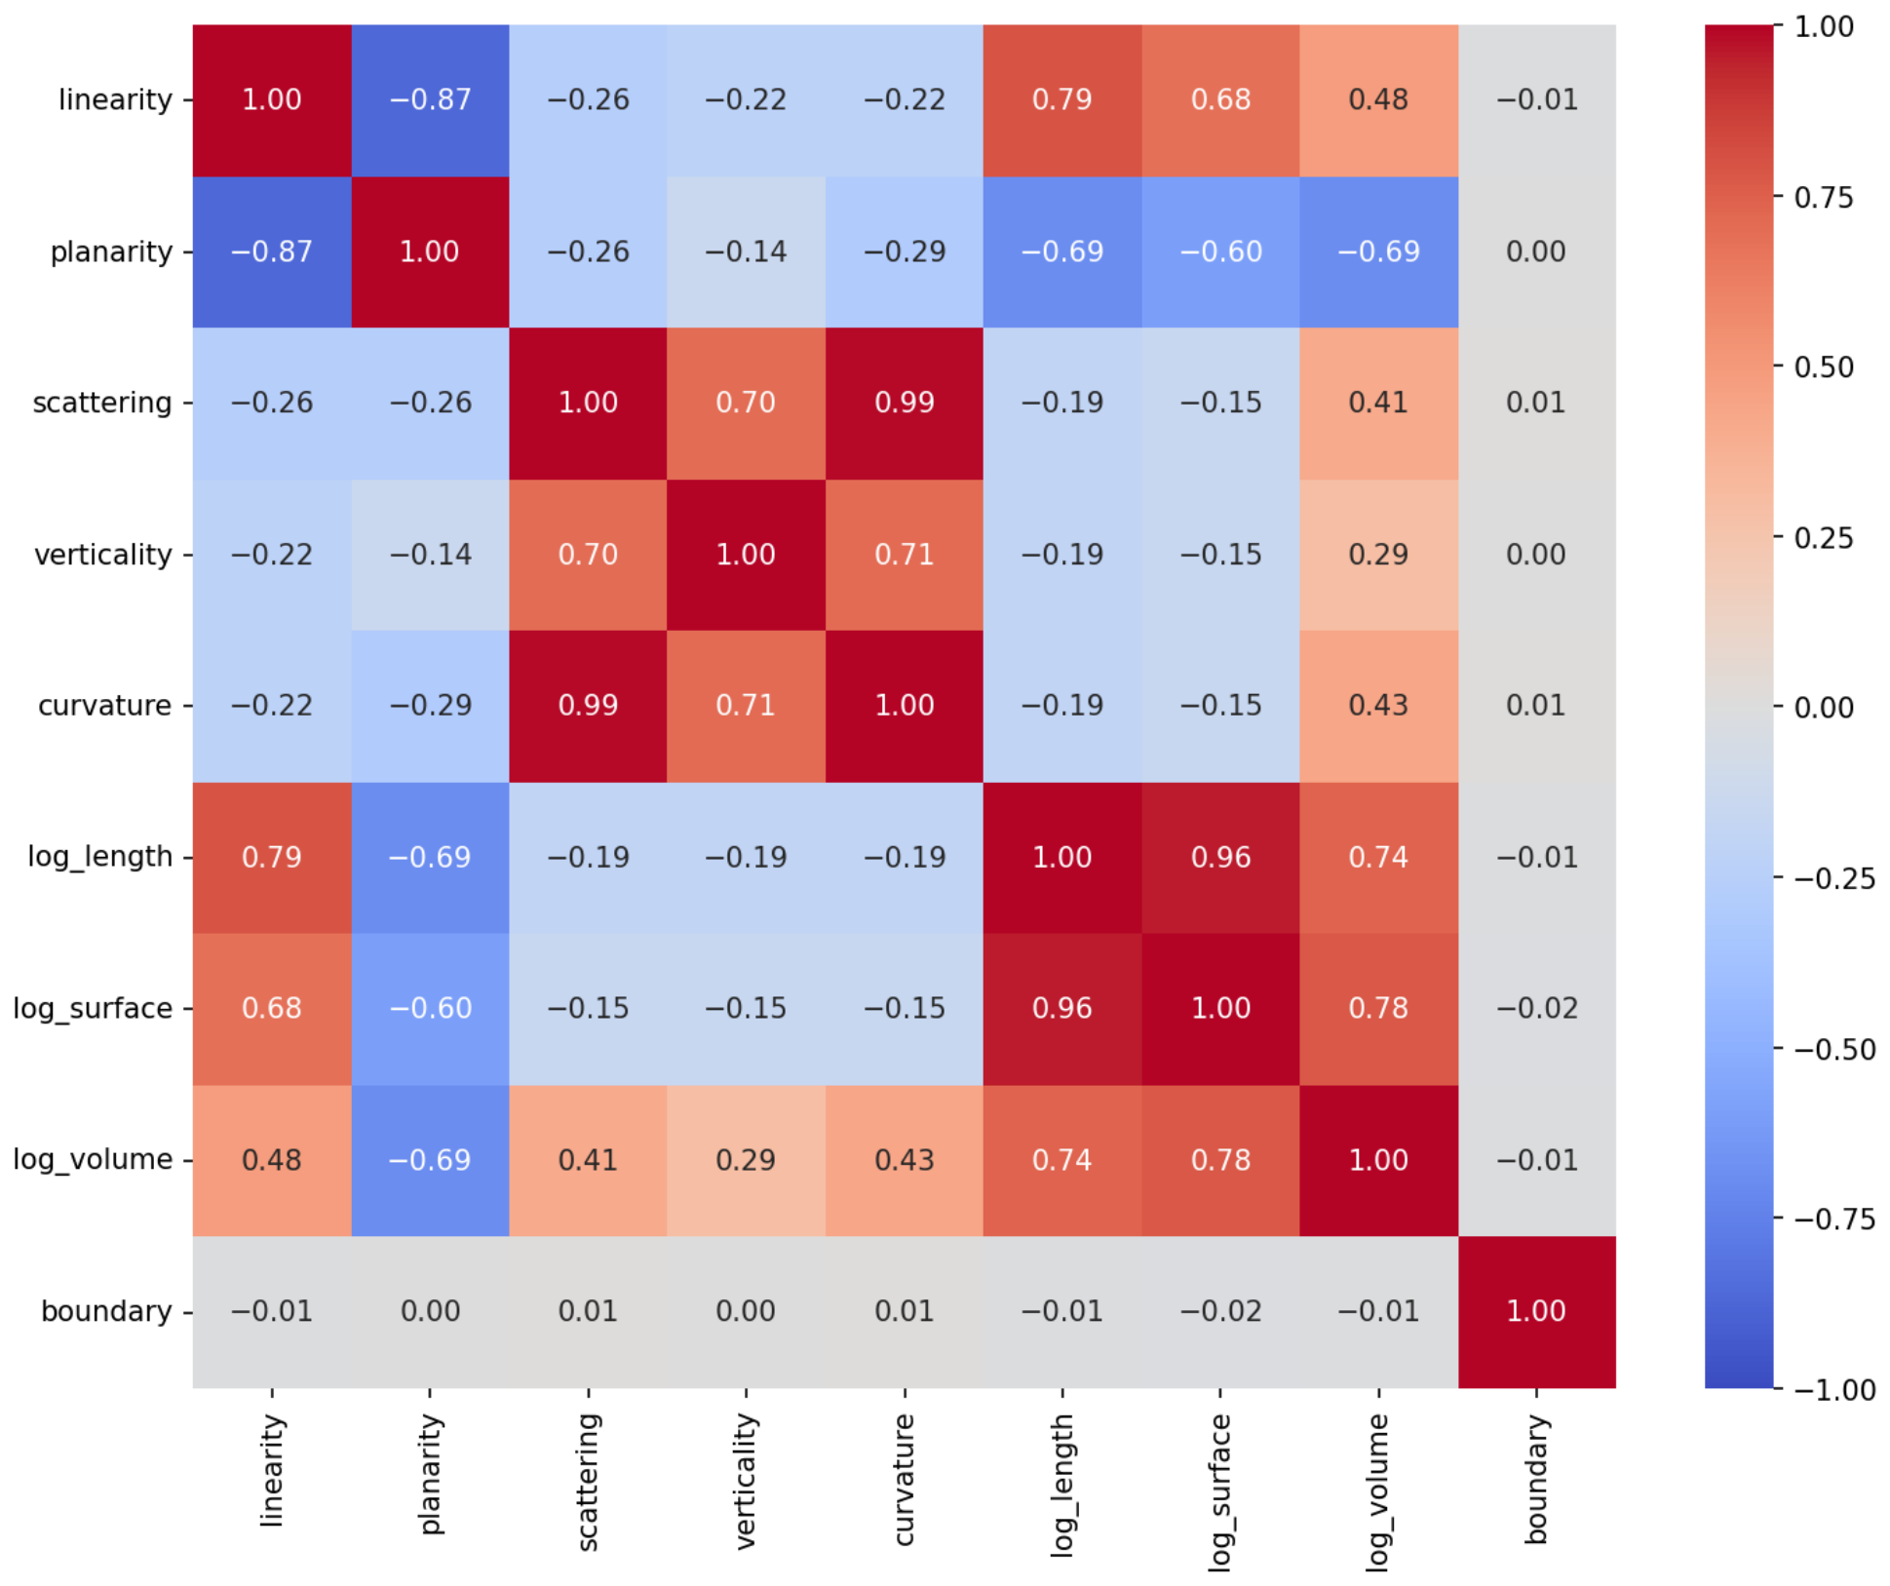
A total of nine handcrafted features are introduced in this work: linearity, planarity, scattering, verticality, curvature, log-transformed local geometric scale descriptors (including log-length, log-surface, and log-volume), and contour. When selecting these handcrafted features, our primary consideration was their complementarity. However, some of these nine features may exhibit high correlations or redundancy. Since the use of multiple highly correlated features may potentially increase the risk of overfitting, we measured the pairwise Pearson correlation coefficients among these features on the test sets of the RoofN3D and Building3D datasets. The results are shown in Figure 9 and Figure 10. It can be observed that scattering and curvature, as well as the three log-transformed local geometric scale descriptors, exhibit relatively high correlations on both datasets. Therefore, we conducted additional experiments on the fully corrected RoofN3D dataset in which only one feature from each group of highly correlated features was retained. The results are presented in Table 23. As can be seen, removing the highly correlated features leads to a slight decrease in Cov and WCov. A possible explanation for this phenomenon is that our model already possesses the ability to handle redundant features, whereas removing certain features reduces the amount of available information. Therefore, it is reasonable to simultaneously employ all nine handcrafted features, even though some of them exhibit relatively high correlations with one another.

5. Discussion

In this section, we first discuss the impact of low-quality data or low-quality annotations on our method and the deep learning-based baseline models, followed by other necessary discussions. From the analyses presented in the first part of this section, it can be observed that our SPPSFormer consistently demonstrates significantly superior performance under various conditions involving low-quality data or imperfect boundary annotations.
Although the roof structures in the RoofN3D dataset are much simpler than those in the Building3D dataset, none of the baseline methods evaluated in Section 4.3—except for PTv3 [27]—achieved significantly better quantitative evaluation metrics on RoofN3D with only the test set corrected than on Building3D. In particular, SPFormer [14], HCBR [2], and QTPS [88] show notably lower performance on RoofN3D with only the test set corrected. Regarding the performance of our method, as shown in Table 19 and Table 20, without the proposed plane completion and boundary refinement modules, our network also performs significantly worse on RoofN3D with only the test set corrected than on Building3D. Even the results from DeepRoofPlane [22] suggest that RoofN3D with only the test set corrected is difficult to handle—despite the simpler roof shapes, its performance on RoofN3D with only the test set corrected is only comparable to that on Building3D, even with a slight decline in terms of WCov.
There are two primary challenges in the RoofN3D dataset with only the test set corrected that hinder high-quality plane instance segmentation: (1) the data quality itself is poor (low density, significant density variation, and low point precision), and (2) the annotation quality in the training set is suboptimal. The poor performance of traditional algorithms on the RoofN3D dataset is clearly attributed to the first factor. The experiments in Section 4.3 have already demonstrated that the suboptimal performance of the deep learning-based models (SPPSFormer and DeepRoofPlane) in Table 3 can, at least in part, be attributed to the poor annotation quality of the RoofN3D training set.
Regarding the impact of data quality in the RoofN3D dataset on the plane segmentation performance of deep learning-based models, it is challenging to evaluate experimentally. This is because we currently lack effective methods to improve the data quality of the RoofN3D dataset for a controlled comparison. Therefore, we conducted degradation experiments on the higher-quality Building3D dataset to investigate how point density, density variation, and geometric precision of points affect plane instance segmentation performance. We began by reducing the density of the Building3D dataset (including the test set) and retrained and tested our SPPSFormer, PTv3, and DeepRoofPlane. The downsampling process involved randomly removing 50% of the 3D points. The new quantitative results are presented in Table 24. By comparing the results in Table 2 and Table 24, we observe that after reducing the density of the Building3D dataset, the plane instance segmentation performance of all tested methods decreases significantly.
Similarly, the corresponding quantitative evaluation results after introducing density variation and reducing the point precision of the Building3D dataset are presented in Table 25 and Table 26, respectively. To increase density variation, a series of evenly spaced center planes parallel to the YZ plane are generated based on the spatial extent of the point cloud along the X-axis. Then, all 3D points are randomly shifted toward their nearest center plane by a small distance to simulate the uneven density characteristics observed in the RoofN3D dataset. To preserve the original point precision, each plane point is moved only along the direction parallel to its associated real plane during the shifting process. For the reduction in point precision, we added a random offset ranging from 0 m to 0.5 m to the XYZ coordinates of each point. By comparing the quantitative results in Table 2 with those in Table 25 and Table 26, we observe that when point cloud density variation increases or point precision degrades, the plane instance segmentation performance of all tested methods drops significantly.
Therefore, we conclude that for roof plane instance segmentation algorithms, in addition to the complexity of the roof structure, the quality of the 3D point cloud has a significant impact on segmentation performance. This suggests that future research on point cloud roof plane segmentation should focus more on the negative effects of low-quality point cloud data. For instance, during network training, data augmentation strategies that target point cloud quality—such as variations in density, density uniformity, and point precision—are essential to ensure robustness in handling complex and unseen real-world data. Notably, in all the quantitative results presented in Table 24, Table 25 and Table 26, our SPPSFormer consistently outperforms PTv3 and DeepRoofPlane. This demonstrates that our method is more effective at handling lower-quality point cloud data than existing state-of-the-art methods.
Our subsequent experiments further reveal that our SPPSFormer primarily relies on accurate annotations of the plane main bodies, while DeepRoofPlane depends heavily on both plane main body and boundary annotations.
Many current deep learning researchers prioritize end-to-end models, whereas our method incorporates traditional algorithms for post-processing. At first glance, this might seem like a limitation of our approach. However, it is precisely this architecture—deep learning-based prediction followed by traditional post-processing—that reduces our model’s reliance on highly accurate plane boundary annotations in the training set. To validate this, we intentionally degraded the plane boundary annotations in the fully corrected RoofN3D and Building3D training sets while keeping the plane main body annotations intact. We then retrained our SPPSFormer, PTv3, and DeepRoofPlane models using these datasets with degraded boundary annotations. Specifically, we perturbed the boundary annotations by randomly swapping labels of points belonging to different planes if the distance between them is less than 0.5 m. Table 27 presents the quantitative results of the retrained model evaluated on the fully corrected RoofN3D test set (the same as in Table 4), while Table 28 shows the results evaluated on the original Building3D test set.
By comparing Table 2 with Table 28 and Table 4 with Table 27, we observe that when plane boundary annotations in the RoofN3D and Building3D training sets are degraded, the segmentation performance of DeepRoofPlane drops significantly. In contrast, the performance of our SPPSFormer (including the post-processing steps) declines only slightly. This is because our method requires only accurate segmentation of plane main bodies in the network prediction stage, which does not heavily rely on accurate boundary annotations in the training set. Furthermore, the traditional boundary refinement module in our method can effectively refine the segmentation of boundary points as long as the plane main bodies are correctly segmented. Although DeepRoofPlane also includes a boundary refinement module—a post-processing module that combines handcrafted features with deep learning features—it depends on deep learning at every stage of its processing pipeline. As a result, its performance is more sensitive to the quality of training annotations. When boundary annotations are inaccurate, DeepRoofPlane’s generalization ability degrades accordingly. When the annotation quality of plane boundaries in the training set decreases, the performance of PTv3 also does not decline significantly. However, its evaluation metrics remain relatively low both before and after the degradation in annotation quality.
Thus, while our use of traditional algorithms in post-processing may seem at odds with the common end-to-end approach favored by many researchers, it allows our method to function effectively without relying heavily on highly accurate plane boundary annotations. In fact, accurately labeling points near plane intersections is often the most challenging part of annotating point cloud plane segmentation datasets. In contrast, labeling plane main bodies is much easier. As a result, the reduced dependence on accurate boundary annotations in our method significantly reduces the difficulty of creating training datasets for roof plane instance segmentation in 3D point clouds.
In the ablation study of the post-processing modules, our boundary refinement module slightly degrades performance on the fully corrected RoofN3D dataset. To investigate this phenomenon, we compared the coverage values before and after boundary refinement for all samples in the RoofN3D test set. We found that all reductions in coverage were caused by slight boundary degradation introduced by the boundary refinement module. In other words, for some samples, the boundary refinement module does not improve boundary segmentation quality and may instead slightly deteriorate it. When the proportion of such samples becomes sufficiently large, a decrease in the overall evaluation metrics on the test set may occur.
We further analyzed the causes of these boundary degradations and found that they mainly stem from the following two factors:
(1)
Some samples contain severe noise, which affects the plane-fitting process and leads to inaccurate plane parameters;
(2)
Errors in network predictions or failures of the plane completion module may introduce spurious planes, which in turn prevent the boundary refinement module from effectively refining the boundaries.
Among these factors, the first is the primary cause of boundary degradation.
Figure 11 presents a representative example in which the first factor causes relatively severe boundary degradation after boundary refinement. It shows the visualization results before and after applying the boundary refinement module. As can be seen, the network prediction is already highly consistent with the ground-truth, leaving very limited room for further improvement. Under such circumstances, even a slight error in the boundary refinement process can easily lead to boundary degradation. However, the plane marked in green contains substantial noise, which can make the plane parameters estimated by the least-squares fitting method inaccurate and consequently adversely affect the subsequent boundary refinement process. Most of the boundary degradation cases observed in the RoofN3D test set are primarily caused by this factor, although the severity of degradation in most samples is less pronounced than that shown in Figure 11. One possible solution is to use RANSAC to fit the dominant planar region within a plane, thereby reducing the influence of noise. However, how to efficiently obtain optimal plane parameters using RANSAC while remaining robust to noise is still a challenging problem. This will be one of our future research directions.
Figure 12 presents a visualization example of boundary degradation caused by the second factor. As shown in Figure 12, an over-segmented plane is present in the segmentation result before boundary refinement due to the influence of noise. This over-segmented plane interferes with the normal competition among different planes for boundary points, thereby leading to unpredictable results. A small proportion of the boundary degradation cases observed in the RoofN3D test set can be attributed to this factor.
Although our boundary refinement module may exhibit the aforementioned negative effects, the ablation results indicate that it is capable of refining boundaries in the vast majority of cases. Even when boundary degradation occurs, the degradation is generally minor. Therefore, it can be concluded that our boundary refinement module is highly effective overall.
To quantitatively compare the boundary adherence of our superpoints with those generated by SPFormer, we adopted several evaluation metrics that are commonly used in the image superpixel segmentation literature, including boundary recall (BR), boundary precision (BP), boundary F-score (BF), under-segmentation error (UE), and achievable segmentation accuracy (ASA) [90,91,92,93,94,95,96]. Since the target of evaluation is superpoint segmentation rather than object segmentation, the primary metrics used in our analysis, consistent with mainstream approaches, are boundary recall, under-segmentation error, and achievable segmentation accuracy, while the remaining metrics are provided for reference. For the neighborhood relationships involved in these metrics, we employed spherical neighborhoods with radii equal to one and two times the average point spacing (APS), respectively. The quantitative results are presented in Table 29, Table 30 and Table 31. It can be observed that our superpoints outperform those generated by SPFormer across all evaluated metrics, demonstrating superior boundary adherence.
We also compared the size consistency of our superpoints with that of SPFormer’s superpoints on the test sets of the two datasets. The quantitative results are presented in Table 32, where the superpoint size is reported in the form of mean ± standard deviation. We also report the size range, i.e., the difference between the largest and smallest superpoints in the superpoint segmentation result of the same point cloud. It can be observed that our superpoints exhibit more consistent sizes.
Regarding the time overhead compared with SPFormer’s superpoint generation, Table 32 shows that our superpoint generation algorithm requires substantially more time. In summary, our method generates higher-quality superpoints with more accurate boundaries and more consistent sizes, but its computational efficiency is also significantly lower. However, roof plane instance segmentation generally does not require real-time processing, and a certain amount of latency is fully acceptable in most practical scenarios.
To effectively evaluate the efficiency of our model, we compared it with DeepRoofPlane. Table 33 and Table 34 present the comparisons in the training and testing stages, respectively. As can be seen, the training efficiency of our network is lower than that of DeepRoofPlane. This is because our network is based on Transformer, whereas DeepRoofPlane is based on PointNet++. However, the inference efficiency of our network is significantly higher than that of DeepRoofPlane. As for the efficiency of the post-processing modules and the complete processing pipeline, SPPSFormer outperforms DeepRoofPlane on the RoofN3D dataset, whereas the opposite trend is observed on the Building3D dataset. It should be noted that the complete processing pipeline of SPPSFormer includes superpoint generation, handcrafted feature computation, network prediction, and post-processing. However, handcrafted feature computation and superpoint generation can be performed in parallel, and the time required for handcrafted feature computation is much shorter than that required for superpoint generation. Therefore, when evaluating the efficiency of the complete SPPSFormer pipeline, we did not include the time required for handcrafted feature computation. In addition, our superpoint generation module and post-processing modules were designed primarily for academic research and have not undergone extensive efficiency optimization.
The high-quality superpoint generation criteria proposed in this work can, in theory, be directly extended to other point cloud processing tasks, such as point cloud instance segmentation, point cloud semantic segmentation, and point cloud object detection. However, the superpoint generation method designed in this paper, especially the boundary refinement component, is not well-suited to non-planar scenarios, because it is mainly designed for planar or approximately planar surfaces. In addition, the plane completion module and the plane-oriented boundary refinement post-processing strategy proposed in this work are not suitable for handling non-planar objects. Therefore, the applicability of the proposed method to more complex roof structures, such as curved roofs, free-form surfaces, or highly irregular non-planar geometries, may be limited. To extend the proposed algorithm to more general point cloud processing tasks, the main challenge lies in how to satisfy the first criterion of high-quality superpoints proposed in this paper, namely how to generate superpoints with accurate boundaries without assuming that the objects are composed of planar surfaces. This will be one of our important future research directions.

6. Conclusions

In this study, we mainly propose a set of superpoint generation criteria specifically designed for Transformers, and apply them to a superpoint Transformer for 3D point cloud roof plane instance segmentation. By leveraging superpoints as processing units, we significantly reduce the number of tokens the Transformer needs to process. Based on the superpoint generation criteria we propose, we introduce a corresponding generation approach, which substantially enhances the Transformer’s feature learning capability. To further improve segmentation performance, we integrate handcrafted features with spatial position features at the input stage of our network, and employ a decoder that combines KAN with a Transformer. Additionally, we design a self-supervised plane completion module that infers segmentation parameters from segmented plane instances, alongside an efficient boundary refinement module.
We annotated a real-world dataset based on wireframe models in the Building3D dataset and corrected annotation errors in the RoofN3D dataset to enable a quantitative evaluation of our method. Experimental results demonstrate that our approach achieves SOTA performance on both our annotated dataset and the original and corrected versions of the RoofN3D dataset, and that our model exhibits significant performance advantages over existing methods when handling data with low point density, large density variations, or low 3D point precision. Moreover, our model relies predominantly on the accuracy of plane main body annotations in the training set and is far less dependent on accurate plane boundary annotations. This reduces the annotation effort required for training datasets significantly. We also identify key factors influencing point cloud roof plane instance segmentation performance: beyond roof structure complexity, point cloud quality, including factors such as density, density variation, and point precision, greatly impacts segmentation quality. This insight highlights the importance of incorporating data augmentation strategies related to point cloud quality during training to enhance robustness, enabling the network to handle complex and unseen real-world data more effectively.
The superpoint generation criteria we propose have strong potential to be extended to superpoint Transformers designed for other 3D analysis tasks, as well as to superpixel Transformers for 2D analysis tasks. Although the underlying criteria are expected to remain theoretically consistent, the specific generation methods still require further investigation, which will be a key direction for our future work. The superpoint generation method presented in this paper is currently tailored specifically to 3D point cloud roof plane instance segmentation.


Author Contributions

Conceptualization, Q.X., Y.M., C.Z. and X.Q.; methodology, Q.X., Y.M., C.Z. and X.Q.; software, X.Q., H.W., Y.M. and C.Z.; validation, H.W., Y.M., C.Z.,and X.Q.; formal analysis, Q.X., Y.M., C.Z. and X.Q.; investigation, H.W., Y.M., C.Z. and X.Q.; resources, Q.X., Y.M. and C.Z.; data curation, K.S. and P.Z.; writing—original draft preparation, Y.M., H.W. and X.Q.; writing—review and editing, Y.M., H.W. and Y.S.; visualization, H.W. and X.Q.; supervision, Q.X., Y.M., C.Z. and Y.L.; project administration, Q.X., Y.M. and C.Z.; funding acquisition, Y.M., Q.X., C.Z. and Y.L. All authors have read and agreed to the published version of the manuscript.

Funding

This work was supported by the Hubei Provincial Key Research and Development Program (No. 2025BAB061), the Hubei Provincial Major Science and Technology Program (JD) (No. 2025BEA001), the Wuhan Natural Science Foundation Focused Program (No. 2026040101030022), Key Laboratory of China-ASEAN Satellite Remote Sensing Applications, Ministry of Natural Resources of the People’s Republic of China (No. KLCARS-2025-G07), the Knowledge Innovation Program of Wuhan-Shuguang Project (No. 2023020201020414), the basic scientific research project of the Chinese Academy of Surveying and Mapping (CASM) (No. 2423), the National Natural Science Foundation of China (No. 62102136), and State Key Laboratory of Spatial Datum (SKLSD2025-KF-19).

Data Availability Statement

This paper utilizes two datasets for experiments. The first dataset is RoofN3D, which can be downloaded from https://roofn3d.gis.tu-berlin.de (accessed on 17 June 2026). We only used samples in this dataset that contain no fewer than 700 points. Since this dataset contains some annotation errors, we corrected them. The corrected annotations will be released after the paper is accepted. The second dataset is a plane instance segmentation dataset that we constructed by combining annotations from an existing 3D reconstruction dataset with manual refinement. This dataset will also be made publicly available after the paper is accepted.

Acknowledgments

We would like to thank the Wuhan Supercomputing Center for providing part of the computational resources. The original RoofN3D training data [25] was provided by the chair Methods of Geoinformation Science of Technische Universität Berlin and is available at https://roofn3d.gis.tu-berlin.de (accessed on 17 June 2026).

Conflicts of Interest

The authors declare no conflicts of interest.

References

  1. Li, Z.; Shan, J. RANSAC-based multi primitive building reconstruction from 3D point clouds. ISPRS J. Photogramm. Remote Sens. 2022, 185, 247–260. [Google Scholar] [CrossRef]
  2. Li, L.; Yao, J.; Tu, J.; Liu, X.; Li, Y.; Guo, L. Roof Plane Segmentation from Airborne LiDAR Data Using Hierarchical Clustering and Boundary Relabeling. Remote Sens. 2020, 12, 1363. [Google Scholar] [CrossRef]
  3. Yan, J.; Jiang, W.; Shan, J. A Global Solution to Topological Reconstruction of Building Roof Models from Airborne Lidar Point Clouds. ISPRS Ann. Photogramm. Remote Sens. Spat. Inf. Sci. 2016, III-3, 379–386. [Google Scholar] [CrossRef][Green Version]
  4. Nan, L.; Wonka, P. PolyFit: Polygonal Surface Reconstruction from Point Clouds. In Proceedings of the IEEE International Conference on Computer Vision (ICCV), Venice, Italy, 22–29 October 2017. [Google Scholar]
  5. Zhang, C.; Fan, H. An Improved Multi-Task Pointwise Network for Segmentation of Building Roofs in Airborne Laser Scanning Point Clouds. Photogramm. Rec. 2022, 37, 260–284. [Google Scholar]
  6. Poux, F.; Mattes, C.; Selman, Z.; Kobbelt, L. Automatic region-growing system for the segmentation of large point clouds. Autom. Constr. 2022, 138, 104250. [Google Scholar] [CrossRef]
  7. Sampath, A.; Shan, J. Segmentation and Reconstruction of Polyhedral Building Roofs From Aerial Lidar Point Clouds. IEEE Trans. Geosci. Remote Sens. 2010, 48, 1554–1567. [Google Scholar] [CrossRef]
  8. Chen, H.; Xie, T.; Liang, M.; Liu, W.; Liu, P.X. A local tangent plane distance-based approach to 3D point cloud segmentation via clustering. Pattern Recognit. 2023, 137, 109307. [Google Scholar] [CrossRef]
  9. Zhang, L.; Zhang, Y.; Chen, Z.; Xiao, P.; Luo, B. Splitting and Merging Based Multi-model Fitting for Point Cloud Segmentation. J. Geod. Geoinf. Sci. 2019, 2, 78–89. [Google Scholar] [CrossRef]
  10. Xu, Y.; Ye, Z.; Huang, R.; Hoegner, L.; Stilla, U. Robust segmentation and localization of structural planes from photogrammetric point clouds in construction sites. Autom. Constr. 2020, 117, 103206. [Google Scholar] [CrossRef]
  11. Fischler, M.A.; Bolles, R.C. Random sample consensus: A paradigm for model fitting with applications to image analysis and automated cartography. Commun. ACM 1981, 24, 381–395. [Google Scholar] [CrossRef]
  12. Li, L.; Yang, F.; Zhu, H.; Li, D.; Li, Y.; Tang, L. An Improved RANSAC for 3D Point Cloud Plane Segmentation Based on Normal Distribution Transformation Cells. Remote Sens. 2017, 9, 433. [Google Scholar] [CrossRef]
  13. Guo, Y.; Wang, H.; Hu, Q.; Liu, H.; Liu, L.; Bennamoun, M. Deep Learning for 3D Point Clouds: A Survey. IEEE Trans. Pattern Anal. Mach. Intell. 2021, 43, 4338–4364. [Google Scholar] [CrossRef] [PubMed]
  14. Sun, J.; Qing, C.; Tan, J.; Xu, X. Superpoint Transformer for 3D Scene Instance Segmentation. Proc. AAAI Conf. Artif. Intell. 2023, 37, 2393–2401. [Google Scholar] [CrossRef]
  15. Robert, D.; Raguet, H.; Landrieu, L. Efficient 3D Semantic Segmentation with Superpoint Transformer. In Proceedings of the IEEE/CVF International Conference on Computer Vision (ICCV), Paris, France, 2–6 October 2023; pp. 17195–17204. [Google Scholar]
  16. Wu, X.; Hou, Y.; Huang, X.; Lin, B.; He, T.; Zhu, X.; Ma, Y.; Wu, B.; Liu, H.; Cai, D.; et al. TASeg: Temporal Aggregation Network for LiDAR Semantic Segmentation. In Proceedings of the IEEE/CVF Conference on Computer Vision and Pattern Recognition (CVPR), Seattle, WA, USA, 16–22 June 2024; pp. 15311–15320. [Google Scholar]
  17. Zhu, A.Z.; Mei, J.; Qiao, S.; Yan, H.; Zhu, Y.; Chen, L.C.; Kretzschmar, H. Superpixel Transformers for Efficient Semantic Segmentation. In Proceedings of the 2023 IEEE/RSJ International Conference on Intelligent Robots and Systems (IROS), Detroit, MI, USA, 1–5 October 2023; pp. 7651–7658. [Google Scholar] [CrossRef]
  18. Dai, H.; Hu, X.; Zhang, J.; Shu, Z.; Xu, J.; Du, J. Large-Scale ALS Point Cloud Segmentation via Projection-Based Context Embedding. IEEE Trans. Geosci. Remote Sens. 2024, 62, 5704216. [Google Scholar] [CrossRef]
  19. Zhang, S.; Wang, B.; Chen, Y.; Zhang, S.; Zhang, W. Point and voxel cross perception with lightweight cosformer for large-scale point cloud semantic segmentation. Int. J. Appl. Earth Obs. Geoinf. 2024, 131, 103951. [Google Scholar] [CrossRef]
  20. Huang, W.; Zou, P.; Xia, Y.; Wen, C.; Zang, Y.; Wang, C.; Zhou, G. OPOCA: One Point One Class Annotation for LiDAR Point Cloud Semantic Segmentation. IEEE Trans. Geosci. Remote Sens. 2024, 62, 5701610. [Google Scholar] [CrossRef]
  21. Qi, C.R.; Yi, L.; Su, H.; Guibas, L.J. PointNet++: Deep Hierarchical Feature Learning on Point Sets in a Metric Space. In Proceedings of the Advances in Neural Information Processing Systems; Guyon, I., Luxburg, U.V., Bengio, S., Wallach, H., Fergus, R., Vishwanathan, S., Garnett, R., Eds.; Curran Associates, Inc.: New York, NY, USA, 2017; Volume 30. [Google Scholar]
  22. Li, L.; Li, Q.; Xu, G.; Zhou, P.; Tu, J.; Li, J.; Li, M.; Yao, J. A boundary-aware point clustering approach in Euclidean and embedding spaces for roof plane segmentation. ISPRS J. Photogramm. Remote Sens. 2024, 218, 518–530. [Google Scholar] [CrossRef]
  23. Kong, G.; Fan, H. Automatic Generation of 3-D Roof Training Dataset for Building Roof Segmentation from ALS Point Clouds. IEEE Trans. Geosci. Remote Sens. 2024, 62, 5708812. [Google Scholar] [CrossRef]
  24. Liu, Z.; Wang, Y.; Vaidya, S.; Ruehle, F.; Halverson, J.; Soljačić, M.; Hou, T.Y.; Tegmark, M. KAN: Kolmogorov-Arnold Networks. arXiv 2024, arXiv:2404.19756. [Google Scholar] [CrossRef]
  25. Wichmann, A.; Agoub, A.; Schmidt, V.; Kada, M. RoofN3D: A database for 3D building reconstruction with deep learning. Photogramm. Eng. Remote Sens. 2019, 85, 435–443. [Google Scholar] [CrossRef]
  26. Wang, R.; Huang, S.; Yang, H. Building3D: A Urban-Scale Dataset and Benchmarks for Learning Roof Structures from Point Clouds. In Proceedings of the IEEE/CVF International Conference on Computer Vision (ICCV), Paris, France, 2–3 October 2023; pp. 20076–20086. [Google Scholar]
  27. Wu, X.; Jiang, L.; Wang, P.S.; Liu, Z.; Liu, X.; Qiao, Y.; Ouyang, W.; He, T.; Zhao, H. Point Transformer V3: Simpler, Faster, Stronger. In Proceedings of the 2024 IEEE/CVF Conference on Computer Vision and Pattern Recognition (CVPR), Seattle, WA, USA, 17–21 June 2024; pp. 4840–4851. [Google Scholar] [CrossRef]
  28. Adams, R.; Bischof, L. Seeded region growing. IEEE Trans. Pattern Anal. Mach. Intell. 1994, 16, 641–647. [Google Scholar] [CrossRef]
  29. Jagannathan, A.; Miller, E.L. Three-Dimensional Surface Mesh Segmentation Using Curvedness-Based Region Growing Approach. IEEE Trans. Pattern Anal. Mach. Intell. 2007, 29, 2195–2204. [Google Scholar] [PubMed]
  30. Yu, Q.; Clausi, D.A. IRGS: Image Segmentation Using Edge Penalties and Region Growing. IEEE Trans. Pattern Anal. Mach. Intell. 2008, 30, 2126–2139. [Google Scholar] [CrossRef] [PubMed]
  31. Vo, A.V.; Truong-Hong, L.; Laefer, D.F.; Bertolotto, M. Octree-based region growing for point cloud segmentation. ISPRS J. Photogramm. Remote Sens. 2015, 104, 88–100. [Google Scholar] [CrossRef]
  32. Wang, L.; Wang, X. Multi-value Voxel Connected Region Construction based on 3D Plane Extraction for Airborne LIDAR Data. J. Geo-Inf. Sci. 2021, 23, 1598–1607. [Google Scholar] [CrossRef]
  33. Yan, J.; Shan, J.; Jiang, W. A global optimization approach to roof segmentation from airborne lidar point clouds. ISPRS J. Photogramm. Remote Sens. 2014, 94, 183–193. [Google Scholar] [CrossRef]
  34. Dong, Z.; Yang, B.; Hu, P.; Scherer, S. An efficient global energy optimization approach for robust 3D plane segmentation of point clouds. ISPRS J. Photogramm. Remote Sens. 2018, 137, 112–133. [Google Scholar] [CrossRef]
  35. Wang, X.; Ji, S. Roof Plane Segmentation from LiDAR Point Cloud Data Using Region Expansion Based L0 Gradient Minimization and Graph Cut. IEEE J. Sel. Top. Appl. Earth Obs. Remote Sens. 2021, 14, 10101–10116. [Google Scholar] [CrossRef]
  36. Schnabel, R.; Wahl, R.; Klein, R. Efficient RANSAC for Point-Cloud Shape Detection. Comput. Graph. Forum 2007, 26, 214–226. [Google Scholar]
  37. Fujiwara, T.; Kamegawa, T.; Gofuku, A. Plane detection to improve 3D scanning speed using RANSAC algorithm. In Proceedings of the 2013 IEEE 8th Conference on Industrial Electronics and Applications (ICIEA), Melbourne, Australia, 19–21 June 2013; pp. 1863–1869. [Google Scholar] [CrossRef]
  38. Xu, B.; Jiang, W.; Shan, J.; Zhang, J.; Li, L. Investigation on the Weighted RANSAC Approaches for Building Roof Plane Segmentation from LiDAR Point Clouds. Remote Sens. 2016, 8, 5. [Google Scholar] [CrossRef]
  39. Liu, Y.; Li, Y.; Liu, H.; Sun, D.; Zhao, S. An Improved RANSAC Algorithm for Point Cloud Segmentation of Complex Building Roofs. J. Geo-Inf. Sci. 2021, 23, 1497–1507. [Google Scholar] [CrossRef]
  40. Xu, J.; Li, J. Optimal RANSAC Method for Segmentation of Complex Building Roof Planes. Geomat. Inf. Sci. Wuhan Univ. 2023, 48, 1531–1537. [Google Scholar] [CrossRef]
  41. Leng, X.; Xiao, J.; Wang, Y. A multi-scale plane-detection method based on the Hough transform and region growing. Photogramm. Rec. 2016, 31, 166–192. [Google Scholar] [CrossRef]
  42. Maltezos, E.; Ioannidis, C. Automatic Extraction of Building Roof Planes from Airborne Lidar Data Applying an Extended 3D Randomized Hough Transform. ISPRS Ann. Photogramm. Remote Sens. Spat. Inf. Sci. 2016, III-3, 209–216. [Google Scholar] [CrossRef]
  43. Vera, E.; Lucio, D.; Fernandes, L.A.; Velho, L. Hough Transform for real-time plane detection in depth images. Pattern Recognit. Lett. 2018, 103, 8–15. [Google Scholar] [CrossRef]
  44. Xu, Z.H.; Guo, G.; Sun, Q.C.; Wang, Q.; Zhang, G.D.; Ye, R.Q. Structural plane recognition from three-dimensional laser scanning points using an improved region-growing algorithm based on the robust randomized Hough transform. J. Mt. Sci. 2023, 20, 3376–3391. [Google Scholar] [CrossRef]
  45. Wahl, R.; Guthe, M.; Klein, R. Identifying planes in point-clouds for efficient hybrid rendering. In Proceedings of the 13th Pacific Conference on Computer Graphics and Applications; Bayreuth University Library: Bayreuth, Germany, 2005; Volume 3. [Google Scholar]
  46. Vosselman, G.; Gorte, B.G.; Sithole, G.; Rabbani, T. Recognising structure in laser scanner point clouds. Int. Arch. Photogramm. Remote Sens. Spat. Inf. Sci. 2004, 46, 33–38. [Google Scholar]
  47. Li, H.; Xiong, S.; Men, C.; Liu, Y. Roof Reconstruction of Aerial Point Cloud Based on BPPM Plane Segmentation and Energy Optimization. IEEE J. Sel. Top. Appl. Earth Obs. Remote Sens. 2023, 16, 5828–5848. [Google Scholar] [CrossRef]
  48. Huang, X.; Jiang, W.; Gong, J. A Mean Shift Based Competition Algorithm for Robust Extraction of Roof Plane from Airborne Laser Scanning Data. In Proceedings of the San Antonio Fall 2006 Speciality Conference, San Antonio, Texas, USA, 6–10 November, 2006. [Google Scholar]
  49. Wang, Y.; Hao, W.; Ning, X.; Zhao, M.; Zhang, J.; Shi, Z.; Zhang, X. Automatic Segmentation of Urban Point Clouds Based on the Gaussian Map. Photogramm. Rec. 2013, 28, 342–361. [Google Scholar] [CrossRef]
  50. Czerniawski, T.; Sankaran, B.; Nahangi, M.; Haas, C.; Leite, F. 6D DBSCAN-based segmentation of building point clouds for planar object classification. Autom. Constr. 2018, 88, 44–58. [Google Scholar] [CrossRef]
  51. Monszpart, A.; Mellado, N.; Brostow, G.J.; Mitra, N.J. RAPter: Rebuilding man-made scenes with regular arrangements of planes. ACM Trans. Graph. 2015, 34, 1–12. [Google Scholar] [CrossRef]
  52. Lin, Y.; Li, J.; Wang, C.; Chen, Z.; Wang, Z.; Li, J. Fast regularity-constrained plane fitting. ISPRS J. Photogramm. Remote Sens. 2020, 161, 208–217. [Google Scholar] [CrossRef]
  53. Sommer, C.; Sun, Y.; Guibas, L.; Cremers, D.; Birdal, T. From Planes to Corners: Multi-Purpose Primitive Detection in Unorganized 3D Point Clouds. IEEE Robot. Autom. Lett. 2020, 5, 1764–1771. [Google Scholar] [CrossRef]
  54. Wu, Y.; Li, G.; Xian, C.; Ding, X.; Xiong, Y. Extracting POP: Pairwise orthogonal planes from point cloud using RANSAC. Comput. Graph. 2021, 94, 43–51. [Google Scholar] [CrossRef]
  55. Landrieu, L.; Boussaha, M. Point Cloud Oversegmentation with Graph-Structured Deep Metric Learning. In Proceedings of the IEEE/CVF Conference on Computer Vision and Pattern Recognition (CVPR), Long Beach, CA, USA, 16–20 June 2019. [Google Scholar]
  56. Liang, Z.; Li, Z.; Xu, S.; Tan, M.; Jia, K. Instance Segmentation in 3D Scenes Using Semantic Superpoint Tree Networks. In Proceedings of the IEEE/CVF International Conference on Computer Vision (ICCV), Montreal, QC, Canada, 10–17 October 2021; pp. 2783–2792. [Google Scholar]
  57. Zhu, H.; Yang, H.; Wu, X.; Huang, D.; Zhang, S.; He, X.; Zhao, H.; Shen, C.; Qiao, Y.; He, T.; et al. PonderV2: Pave the Way for 3D Foundation Model with A Universal Pre-training Paradigm. arXiv 2024, arXiv:2310.08586. [Google Scholar] [CrossRef]
  58. Landrieu, L.; Simonovsky, M. Large-Scale Point Cloud Semantic Segmentation with Superpoint Graphs. In Proceedings of the IEEE Conference on Computer Vision and Pattern Recognition (CVPR), Salt Lake City, UT, USA, 18–22 June 2018. [Google Scholar]
  59. Hui, L.; Tang, L.; Shen, Y.; Xie, J.; Yang, J. Learning Superpoint Graph Cut for 3D Instance Segmentation. In Proceedings of the Advances in Neural Information Processing Systems; Koyejo, S., Mohamed, S., Agarwal, A., Belgrave, D., Cho, K., Oh, A., Eds.; Curran Associates, Inc.: Red Hook, NY, USA, 2022; Volume 35, pp. 36804–36817. [Google Scholar]
  60. Kolmogorov, A.N. On the Representation of Continuous Functions of Several Variables by Superpositions of Continuous Functions of a Smaller Number of Variables; American Mathematical Society: Providence, RI, USA, 1961. [Google Scholar]
  61. Rosenblatt, F. The perceptron: A probabilistic model for information storage and organization in the brain. Psychol. Rev. 1958, 65 6, 386–408. [Google Scholar] [CrossRef]
  62. Rumelhart, D.E.; Hinton, G.E.; Williams, R.J. Learning representations by back-propagating errors. Nature 1986, 323, 533–536. [Google Scholar] [CrossRef]
  63. Sidharth, S.S.; Keerthana, A.R.; Gokul, R.; Anas, K.P. Chebyshev Polynomial-Based Kolmogorov-Arnold Networks: An Efficient Architecture for Nonlinear Function Approximation. arXiv 2024, arXiv:2405.07200. [Google Scholar] [CrossRef]
  64. Bozorgasl, Z.; Chen, H. Wav-KAN: Wavelet Kolmogorov-Arnold Networks. arXiv 2024, arXiv:2405.12832. [Google Scholar] [CrossRef]
  65. Imran, A.A.; Ishmam, M.F. FourierKAN outperforms MLP on Text Classification Head Fine-tuning. arXiv 2024, arXiv:2408.08803. [Google Scholar] [CrossRef]
  66. Xu, J.; Chen, Z.; Li, J.; Yang, S.; Wang, W.; Hu, X.; Ngai, E.C.H. FourierKAN-GCF: Fourier Kolmogorov-Arnold Network—An Effective and Efficient Feature Transformation for Graph Collaborative Filtering. arXiv 2024, arXiv:2406.01034. [Google Scholar]
  67. Wang, X.; He, X.; Wang, M.; Feng, F.; Chua, T.S. Neural Graph Collaborative Filtering. In Proceedings of the 42nd International ACM SIGIR Conference on Research and Development in Information Retrieval, SIGIR’19, Paris, France, 21–25 July 2019; pp. 165–174. [Google Scholar] [CrossRef]
  68. Yu, R.; Yu, W.; Wang, X. KAN or MLP: A Fairer Comparison. arXiv 2024, arXiv:2407.16674. [Google Scholar]
  69. Cang, Y.; Liu, Y.H.; Shi, L. Can KAN Work? Exploring the Potential of Kolmogorov-Arnold Networks in Computer Vision. arXiv 2024, arXiv:2411.06727. [Google Scholar] [CrossRef]
  70. Radford, A.; Kim, J.W.; Hallacy, C.; Ramesh, A.; Goh, G.; Agarwal, S.; Sastry, G.; Askell, A.; Mishkin, P.; Clark, J.; et al. Learning Transferable Visual Models from Natural Language Supervision. In Proceedings of the 38th International Conference on Machine Learning, Virtual, 18–24 July 2021; Meila, M., Zhang, T., Eds.; PMLR: Cambridge, MA, USA, 2021; Volume 139, pp. 8748–8763. [Google Scholar]
  71. Meng, Y.; Chen, S.; Liu, Y.; Li, L.; Zhang, Z.; Ke, T.; Hu, X. Unsupervised Building Extraction from Multimodal Aerial Data Based on Accurate Vegetation Removal and Image Feature Consistency Constraint. Remote Sens. 2022, 14, 1912. [Google Scholar] [CrossRef]
  72. Kirillov, A.; Mintun, E.; Ravi, N.; Mao, H.; Rolland, C.; Gustafson, L.; Xiao, T.; Whitehead, S.; Berg, A.C.; Lo, W.Y.; et al. Segment Anything. In Proceedings of the IEEE/CVF International Conference on Computer Vision (ICCV), Paris, France, 1–6 October 2023; pp. 4015–4026. [Google Scholar]
  73. Ao, W.; Zheng, S.; Meng, Y.; Gao, Z. Few-Shot Aerial Image Semantic Segmentation Leveraging Pyramid Correlation Fusion. IEEE Trans. Geosci. Remote Sens. 2023, 61, 5624512. [Google Scholar] [CrossRef]
  74. Wang, T.; Zhang, X.; Chen, G.; Liu, C. Smilies: A Soft-Multi-Label-Guided Weakly Supervised Semantic Segmentation Framework for Remote Sensing Images. In Proceedings of the 2023 30th International Conference on Geoinformatics, London, UK, 19–21 July 2023; pp. 1–4. [Google Scholar]
  75. Hotelling, H. Analysis of a complex of statistical variables into principal components. J. Educ. Psychol. 1933, 24, 498–520. [Google Scholar] [CrossRef]
  76. Demantké, J.; Mallet, C.; David, N.; Vallet, B. Dimensionality Based Scale Selection in 3D Lidar Point Clouds. Int. Arch. Photogramm. Remote Sens. Spat. Inf. Sci. 2011, XXXVIII-5/W12, 97–102. [Google Scholar] [CrossRef]
  77. Guinard, S.; Landrieu, L. Weakly Supervised Segmentation-Aided Classification of Urban Scenes from 3D Lidar Point Clouds. Int. Arch. Photogramm. Remote Sens. Spat. Inf. Sci. 2017, 42, 151–157. [Google Scholar] [CrossRef]
  78. Li, C.; Liu, X.; Li, W.; Wang, C.; Liu, H.; Liu, Y.; Chen, Z.; Yuan, Y. U-KAN Makes Strong Backbone for Medical Image Segmentation and Generation. arXiv 2024, arXiv:2406.02918. [Google Scholar] [CrossRef]
  79. Cheon, M. Demonstrating the Efficacy of Kolmogorov-Arnold Networks in Vision Tasks. arXiv 2024, arXiv:2406.14916. [Google Scholar] [CrossRef]
  80. Meng, Y.; Lin, C.; Cui, W.; Yao, J. Scale selection based on Moran’s I for segmentation of high resolution remotely sensed images. In Proceedings of the 2014 IEEE Geoscience and Remote Sensing Symposium, Quebec City, QC, Canada, 13–18 July 2014; pp. 4895–4898. [Google Scholar] [CrossRef]
  81. Georganos, S.; Lennert, M.; Grippa, T.; Vanhuysse, S.; Johnson, B.; Wolff, E. Normalization in Unsupervised Segmentation Parameter Optimization: A Solution Based on Local Regression Trend Analysis. Remote Sens. 2018, 10, 222. [Google Scholar] [CrossRef]
  82. Meng, Y.; Hu, Z.; Chen, X.; Yao, J. Subtracted Histogram: Utilizing Mutual Relation Between Features for Thresholding. IEEE Trans. Geosci. Remote Sens. 2018, 56, 7415–7435. [Google Scholar] [CrossRef]
  83. Felzenszwalb, P.F.; Huttenlocher, D.P. Efficient graph-based image segmentation. Int. J. Comput. Vis. 2004, 59, 167–181. [Google Scholar] [CrossRef]
  84. Rao, J.; Abugharbieh, R.; Hamarneh, G. Adaptive regularization for image segmentation using local image curvature cues. In Proceedings of the 11th European Conference on Computer Vision: Part IV, ECCV’10, Crete, Greece, 5–11 September 2010; pp. 651–665. [Google Scholar]
  85. Yang, J.; He, Y.; Caspersen, J. Region merging using local spectral angle thresholds: A more accurate method for hybrid segmentation of remote sensing images. Remote Sens. Environ. 2017, 190, 137–148. [Google Scholar] [CrossRef]
  86. Su, T. Scale-variable region-merging for high resolution remote sensing image segmentation. ISPRS J. Photogramm. Remote Sens. 2019, 147, 319–334. [Google Scholar] [CrossRef]
  87. Wang, X.; Liu, S.; Shen, X.; Shen, C.; Jia, J. Associatively Segmenting Instances and Semantics in Point Clouds. In Proceedings of the IEEE/CVF Conference on Computer Vision and Pattern Recognition (CVPR), Long Beach, CA, USA, 15–20 June 2019. [Google Scholar]
  88. Zhu, X.; Liu, X.; Zhang, Y.; Wan, Y.; Duan, Y. Robust 3-D Plane Segmentation from Airborne Point Clouds Based on Quasi-A-Contrario Theory. IEEE J. Sel. Top. Appl. Earth Obs. Remote Sens. 2021, 14, 7133–7147. [Google Scholar] [CrossRef]
  89. Jiang, L.; Zhao, H.; Shi, S.; Liu, S.; Fu, C.W.; Jia, J. PointGroup: Dual-Set Point Grouping for 3D Instance Segmentation. In Proceedings of the 2020 IEEE/CVF Conference on Computer Vision and Pattern Recognition (CVPR), Virtually, 13–19 June 2020; pp. 4866–4875. [Google Scholar] [CrossRef]
  90. Yang, F.; Sun, Q.; Jin, H.; Zhou, Z. Superpixel Segmentation with Fully Convolutional Networks. In Proceedings of the 2020 IEEE/CVF Conference on Computer Vision and Pattern Recognition (CVPR), Virtually, 13–19 June 2020; pp. 13961–13970. [Google Scholar] [CrossRef]
  91. Zhu, L.; She, Q.; Zhang, B.; Lu, Y.; Lu, Z.; Li, D.; Hu, J. Learning the Superpixel in a Non-iterative and Lifelong Manner. In Proceedings of the 2021 IEEE/CVF Conference on Computer Vision and Pattern Recognition (CVPR), Virtually, 19–25 June 2021; pp. 1225–1234. [Google Scholar] [CrossRef]
  92. Wang, Y.; Wei, Y.; Qian, X.; Zhu, L.; Yang, Y. AINet: Association Implantation for Superpixel Segmentation. In Proceedings of the 2021 IEEE/CVF International Conference on Computer Vision (ICCV), Virtually, 11–17 October 2021; pp. 7058–7067. [Google Scholar] [CrossRef]
  93. Barcelos, I.B.; Belém, F.D.C.; João, L.D.M.; Patrocínio, Z.K.G.D.; Falcão, A.X.; Guimarães, S.J.F. A Comprehensive Review and New Taxonomy on Superpixel Segmentation. ACM Comput. Surv. 2024, 56, 1–39. [Google Scholar] [CrossRef]
  94. Gaur, U.; Manjunath, B.S. Superpixel Embedding Network. IEEE Trans. Image Process. 2020, 29, 3199–3212. [Google Scholar] [CrossRef] [PubMed]
  95. Xu, Y.; Gao, X.; Zhang, C.; Tan, J.; Li, X. High Quality Superpixel Generation Through Regional Decomposition. IEEE Trans. Circuits Syst. Video Technol. 2023, 33, 1802–1815. [Google Scholar] [CrossRef]
  96. Yu, H.; Hu, H.; Xu, B.; Shang, Q.; Wang, Z.; Zhu, Q. SuperpixelGraph: Semi-automatic generation of building footprint through semantic-sensitive superpixel and neural graph networks. Int. J. Appl. Earth Obs. Geoinf. 2023, 125, 103556. [Google Scholar] [CrossRef]
Figure 1. Overall architecture of our SPPSFormer. S denotes the superpoint features obtained by the superpoint pooling layer, Z represents the query vector features produced by the Transformer decoder, and M indicates the mask features extracted using FourierKAN.
Remotesensing 18 02144 g001
Figure 2. Illustration of the generation process of our coarse-grained superpoints: (a) shows the point cloud; (b,c) depict the generated superpoints (the same superpoint segmentation result), with (c) overlaid with the ground-truth boundaries between planes, which are marked by red line segments. A comparison with the ground-truth (d) demonstrates that our superpoints align well with true boundaries. Note that noise points in (bd) are marked in white. Each connected region with the same color in (b,c) corresponds to a superpoint. Different plane instances are indicated by distinct colors in (d).
Remotesensing 18 02144 g002
Figure 3. Illustration of our two-stage superpoint generation process. (a) shows the point cloud, corresponding to Figure 2a; (b) presents the superpoints with accurate boundaries produced in the first stage, corresponding to Figure 2b,c; and (c) displays the fine-grained superpoints with consistent sizes and shapes generated in the second stage. Note that each connected region with the same color in (b,c) corresponds to a superpoint.
Remotesensing 18 02144 g003
Figure 4. Examples of incomplete plane segmentation in the RoofN3D training set and predictions by our SPPSFormer. (a,b) show incomplete annotations in the RoofN3D training set, while (c) illustrates a prediction made by our network on the test set. White points indicate nonplane points. Each connected region with the same color corresponds to an annotated or extracted plane instance.
Remotesensing 18 02144 g004
Figure 5. Sample point clouds from the two datasets used in our experiments. PC-1 and PC-2 are from the original RoofN3D dataset, while PC-3 to PC-5 are from the Building3D dataset. Notable variations in point cloud density are observed in some samples, particularly in PC-1 and PC-2. Each connected region with the same color corresponds to an annotated plane instance.
Remotesensing 18 02144 g005
Figure 6. Visual comparison of segmentation results produced by different methods on the original RoofN3D and Building3D datasets. PC-1 and PC-2 are samples from the original RoofN3D, while PC-3 to PC-6 are from Building3D. Nonplane points are shown in white, and different plane instances are indicated by distinct colors. Red dotted lines highlight representative problem areas.
Remotesensing 18 02144 g006
Figure 7. Corrected examples from the RoofN3D test set. (ac) show the original labels containing annotation errors, while (df) display the corresponding corrected labels after reannotation for (a), (b), and (c), respectively. Each connected region with the same color corresponds to a labeled plane instance.
Remotesensing 18 02144 g007
Figure 8. Qualitative ablation results demonstrating the impact of our superpoint generation method on the Building3D dataset. Different plane instances are indicated by distinct colors.
Remotesensing 18 02144 g008
Figure 9. Correlation analysis of the handcrafted features used in this paper on the RoofN3D dataset.
Remotesensing 18 02144 g009
Figure 10. Correlation analysis of the handcrafted features used in this paper on the Building3D dataset.
Remotesensing 18 02144 g010
Figure 11. Illustration of the main reason why our boundary refinement module produces side effects on the fully corrected RoofN3D dataset. (a) Ground-truth. (b) Segmentation result before boundary refinement. (c) Segmentation result after boundary refinement. (d) Side view of (c). Each connected region with the same color corresponds to a plane instance. The main region where boundary degradation occurs in (c) is highlighted with a red ellipse. As can be observed from (d), there is severe noise on one side of the green plane in (c), which can lead to errors in the plane-fitting process.
Remotesensing 18 02144 g011
Figure 12. Illustration of the secondary reason why our boundary refinement module produces side effects on the fully corrected RoofN3D dataset. (a) Ground-truth. (b) Segmentation result before boundary refinement. (c) Segmentation result after boundary refinement. (d) Side view of (b). Each connected region with the same color corresponds to a plane instance. The main region where boundary degradation occurs in (c) is highlighted with a red ellipse. As can be observed from (d), an extra plane (marked in green) already exists before boundary refinement. This spurious plane severely interferes with the normal operation of our boundary refinement module.
Remotesensing 18 02144 g012
Table 1. Quantitative evaluation results on the original RoofN3D dataset.
Different ApproachesCovWCovPrecisionRecallF1 Score
SPFormer0.65250.70230.78640.49920.6044
QTPS0.63040.65790.69620.61140.6512
HCBR0.67550.71280.70170.96300.7905
PTv30.86100.86690.64750.96080.7734
DeepRoofPlane0.90200.92130.85510.99650.9171
Our SPPSFormer0.93230.93980.87240.98700.9238
SPPSFormer nano0.90440.91520.86260.98120.9152
Table 2. Quantitative evaluation results on the Building3D dataset.
Different ApproachesCovWCovPrecisionRecallF1 Score
SPFormer0.78950.83590.88770.98460.9270
QTPS0.85930.89810.91390.97030.9337
HCBR0.89270.92630.93520.98930.9561
PTv30.75940.77420.49030.95570.6481
DeepRoofPlane0.88350.92300.95620.94990.9480
Our SPPSFormer0.90100.93470.94650.98600.9623
SPPSFormer nano0.85590.89600.91900.97700.9405
Table 3. Quantitative evaluation results on the RoofN3D dataset with only the test set corrected.
Different ApproachesCovWCovPrecisionRecallF1 Score
SPFormer0.65760.70750.78090.50130.6108
QTPS0.63370.66130.69940.61920.6571
HCBR0.67670.71390.70270.96280.7912
PTv30.86330.86070.65560.96760.7815
DeepRoofPlane0.90140.92110.85540.99690.9175
Our SPPSFormer0.92710.93850.90780.95710.9304
SPPSFormer nano0.90550.91200.86900.98000.9212
Table 4. Quantitative evaluation results on the fully corrected RoofN3D dataset.
Different ApproachesCovWCovPrecisionRecallF1 Score
PTv30.85470.86160.64890.94770.7703
DeepRoofPlane0.92370.93550.87750.99140.9298
Our SPPSFormer0.96340.96680.91130.97400.9407
Table 5. Statistical significance analysis on the original RoofN3D dataset.
MethodCovWCovF1 Scorep-Value
DeepRoofPlane0.9058 ± 0.00340.9237 ± 0.00340.9179 ± 0.00120.00002
SPPSFormer0.9370 ± 0.00260.9438 ± 0.00240.9257 ± 0.0019N/A
Table 6. Statistical significance analysis on the Building3D dataset.
MethodCovWCovF1 Scorep-Value
DeepRoofPlane0.8620 ± 0.01230.8727 ± 0.02820.9059 ± 0.02380.00422
SPPSFormer0.8995 ± 0.00550.9285 ± 0.00620.9588 ± 0.0045N/A
Table 7. Statistical significance analysis on the RoofN3D dataset with only the test set corrected.
MethodCovWCovF1 Scorep-Value
DeepRoofPlane0.9039 ± 0.00170.9297 ± 0.00490.9224 ± 0.00280.00152
SPPSFormer0.9223 ± 0.00330.9434 ± 0.00340.9335 ± 0.0057N/A
Table 8. Statistical significance analysis on the fully corrected RoofN3D dataset.
MethodCovWCovF1 Scorep-Value
DeepRoofPlane0.9310 ± 0.00420.9398 ± 0.00260.9246 ± 0.00290.00004
SPPSFormer0.9622 ± 0.00210.9658 ± 0.00210.9390 ± 0.0024N/A
Table 9. Quantitative evaluation results of deep learning models on the RoofN3D dataset with only the test set corrected (without boundary refinement post-processing for all methods).
Different ApproachesCovWCovPrecisionRecallF1 Score
PTv30.86330.86070.65560.96760.7815
DeepRoofPlane0.83400.84690.86760.90100.8840
Our SPPSFormer0.86330.88590.98290.95570.9691
Table 10. Quantitative evaluation results of deep learning models on the fully corrected RoofN3D dataset (without boundary refinement post-processing for all methods).
Different ApproachesCovWCovPrecisionRecallF1 Score
PTv30.85470.86160.64890.94770.7703
DeepRoofPlane0.92080.92340.97790.94780.9620
Our SPPSFormer0.93400.95600.89280.98330.9347
Table 11. Quantitative evaluation results of deep learning models on the Building3D dataset (without boundary refinement post-processing for all methods).
Different ApproachesCovWCovPrecisionRecallF1 Score
PTv30.75940.77420.49030.95570.6481
DeepRoofPlane0.83710.83890.88330.87730.8803
Our SPPSFormer0.88620.92800.93480.97140.9593
Table 12. Statistical significance analysis on the RoofN3D dataset with only the test set corrected (without boundary refinement post-processing for both methods).
MethodCovWCovF1 Scorep-Value
DeepRoofPlane0.8310 ± 0.00470.8448 ± 0.00350.8962 ± 0.01740.00008
SPPSFormer0.8616 ± 0.00270.8857 ± 0.00280.9702 ± 0.0016N/A
Table 13. Statistical significance analysis on the fully corrected RoofN3D dataset (without boundary refinement post-processing for both methods).
MethodCovWCovF1 Scorep-Value
DeepRoofPlane0.9171 ± 0.00460.9205 ± 0.00390.9595 ± 0.00340.00229
SPPSFormer0.9283 ± 0.00460.9518 ± 0.00290.9321 ± 0.0017N/A
Table 14. Statistical significance analysis on the Building3D dataset (without boundary refinement post-processing for both methods).
MethodCovWCovF1 Scorep-Value
DeepRoofPlane0.8228 ± 0.01650.8381 ± 0.00510.8770 ± 0.00450.00024
SPPSFormer0.8820 ± 0.00260.9251 ± 0.00240.9615 ± 0.0014N/A
Table 15. Quantitative ablation results evaluating the impact of different components on network performance on the fully corrected RoofN3D dataset and the Building3D dataset.
Different ComponentsFully Corrected RoofN3DBuilding3D
HF KAN SP Cov WCov F1 Score Cov WCov F1 Score
0.79330.82480.89090.78950.83590.9270
0.92380.94890.93090.87700.92010.9573
0.92850.94980.93230.87710.92380.9562
0.92730.95190.93090.88190.92680.9576
0.93400.95600.93470.88620.92800.9593
Note: HF denotes handcrafted features, and SP denotes our superpoints.
Table 16. Quantitative ablation results evaluating the impact of different components on network performance on the RoofN3D dataset with only the test set corrected.
Different ComponentsRoofN3D Dataset with Test Set Corrected
HF KAN SP Cov WCov F1 Score
0.66420.70240.6089
0.79130.81210.8812
0.79550.82000.8791
0.81620.84010.8861
0.86330.88590.9691
Note: HF denotes handcrafted features, and SP denotes our superpoints.
Table 17. Quantitative ablation results evaluating the impact of the two superpoint generation criteria on network performance.
Different CriteriaFully Corrected RoofN3D DatasetBuilding3D Dataset
AB SSS Cov WCov F1 Score Cov WCov F1 Score
0.85210.87770.70520.73140.80980.7248
0.79330.82410.96000.73090.81800.6599
0.93400.95600.93470.88620.92800.9593
Note: AB denotes accurate boundaries, and SSS denotes similar shapes and sizes.
Table 18. Quantitative ablation results evaluating the impact of the two superpoint generation criteria on SPPSFormer (with post-processing).
Different CriteriaFully Corrected RoofN3D DatasetBuilding3D Dataset
AB SSS Cov WCov F1 Score Cov WCov F1 Score
0.90440.91210.73120.71600.80290.7432
0.87960.89500.96940.76470.84230.7992
0.96340.96680.94070.90100.93470.9623
Note: AB denotes accurate boundaries, and SSS denotes similar shapes and sizes.
Table 19. Quantitative ablation results evaluating the impact of our two post-processing modules on the fully corrected RoofN3D dataset and the Building3D dataset.
Different CriteriaFully Corrected RoofN3D DatasetBuilding3D Dataset
PC BR Cov WCov F1 Score Cov WCov F1 Score
0.93400.95600.93470.88620.92800.9593
0.96680.97070.94160.89530.92970.9592
0.92710.95060.93390.89370.93320.9615
0.96340.96680.94070.90100.93470.9623
Note: PC denotes plane completion, and BR denotes boundary refinement.
Table 20. Quantitative ablation results evaluating the impact of our two post-processing modules on the RoofN3D dataset with only the test set corrected.
SettingRoofN3D Dataset with Test Set Corrected
PC BR Cov WCov F1 Score
0.86330.88590.9691
0.87760.88960.9142
0.88460.89150.9192
0.92710.93850.9304
Note: PC denotes plane completion, and BR denotes boundary refinement.
Table 21. Quantitative ablation results of the effect of the desired superpoint size n on SPPSFormer (without post-processing).
nFully Corrected RoofN3D DatasetBuilding3D Dataset
Cov WCov F1 Score Cov WCov F1 Score
30.90350.92610.92330.88270.92550.9597
40.93400.95600.93470.88320.92600.9596
50.92870.95450.93260.88620.92800.9593
60.92740.95290.93190.86380.88890.9127
70.91830.93110.92830.85710.88320.9057
80.91250.92380.92590.84150.87540.9028
Table 22. Quantitative ablation results of the effect of the desired superpoint size n on SPPSFormer (with post-processing).
nFully Corrected RoofN3D DatasetBuilding3D Dataset
Cov WCov F1 Score Cov WCov F1 Score
30.94070.95510.93500.89180.93150.9602
40.96340.96680.94070.89980.93200.9607
50.94480.96040.93870.90100.93470.9623
60.94260.96010.92680.89820.92650.9128
70.94200.95830.92450.88790.92300.9101
80.94170.95680.92210.86370.91990.9048
Table 23. Ablation results of handcrafted features on the fully corrected RoofN3D dataset (with post-processing).
Feature CombinationCovWCovPrecRecF1 Score
w/ all handcrafted features0.96340.96680.91130.97400.9407
w/o curvature0.96110.96620.91080.97510.9410
w/o scattering0.95970.96470.91090.97220.9392
w/o lengtd and volume0.94890.95450.90640.95720.9255
w/o surface and volume0.95750.95930.90730.97310.9382
w/o lengtd and surface0.94950.95540.90220.95380.9227
Note: w/ and w/o are abbreviations for “with” and “without”, respectively.
Table 24. Quantitative evaluation results of deep learning models on the downsampled Building3D dataset.
Different ApproachesDownsampled Building3D Dataset
Cov WCov Precision Recall F1 Score
PTv30.69500.77460.74360.77670.7598
DeepRoofPlane0.81440.85720.90760.87970.8864
Our SPPSFormer0.84180.92220.98840.94310.9632
Table 25. Quantitative evaluation results of deep learning models on the Building3D dataset with increased point density variation.
Different ApproachesBuilding3D Dataset with Increased Point Density Variation
Cov WCov Precision Recall F1 Score
PTv30.62110.69020.58620.67040.6248
DeepRoofPlane0.77140.80420.88710.83570.8536
Our SPPSFormer0.84530.91680.99310.93390.9601
Table 26. Quantitative evaluation results of deep learning models on the Building3D dataset with reduced 3D point precision.
Different ApproachesBuilding3D Dataset with Reduced 3D Point Precision
Cov WCov Precision Recall F1 Score
PTv30.66520.66520.50001.00000.6667
DeepRoofPlane0.36380.38360.66500.45200.5193
Our SPPSFormer0.78430.86740.99620.90120.9425
Table 27. Quantitative evaluation results of models retrained on the boundary-corrupted RoofN3D training set.
Different ApproachesCorrected RoofN3D Test Set
Cov WCov Precision Recall F1 Score
PTv30.82190.82680.63870.96260.7677
DeepRoofPlane0.69620.71170.82120.75870.7784
Our SPPSFormer0.91590.94510.89280.99460.9381
Table 28. Quantitative evaluation results of models retrained on the boundary-corrupted Building3D training set.
Different ApproachesOriginal Building3D Test Set
Cov WCov Precision Recall F1 Score
PTv30.67970.68880.73430.81770.7737
DeepRoofPlane0.76550.80300.89050.85580.8659
Our SPPSFormer0.87920.93200.94560.99140.9654
Table 29. Comparison of superpoint boundary adherence on the fully corrected RoofN3D dataset using boundary recall, boundary precision, and boundary F-score.
Different Approachesr = APSr = 2 × APS
BR BP BF BR BP BF
SPFormer0.0877 ± 0.14470.0673 ± 0.10230.0629 ± 0.08350.5749 ± 0.23480.2107 ± 0.10760.2962 ± 0.1350
SPPSFormer0.9840 ± 0.12560.4340 ± 0.22140.5710 ± 0.22551.0000 ± 0.00000.2751 ± 0.10930.4200 ± 0.1354
Note: In the table, r denotes the radius of the spherical neighborhood used to define adjacency relationships.
Table 30. Comparison of superpoint boundary adherence on the Building3D dataset using boundary recall, boundary precision, and boundary F-score.
Different Approachesr = APSr = 2 × APS
BR BP BF BR BP BF
SPFormer0.0432 ± 0.11430.0096 ± 0.03470.0134 ± 0.04130.4651 ± 0.26650.0536 ± 0.05060.0917 ± 0.0797
SPPSFormer0.2390 ± 0.27830.0148 ± 0.02100.0269 ± 0.03650.7469 ± 0.27210.0647 ± 0.05600.1149 ± 0.0917
Note: In the table, r denotes the radius of the spherical neighborhood used to define adjacency relationships.
Table 31. Comparison of superpoint boundary adherence using under-segmentation error and achievable segmentation accuracy.
Different ApproachesFully Corrected RoofN3D DatasetBuilding3D Dataset
UE ASA UE ASA
SPFormer0.1611 ± 0.06310.9191 ± 0.03190.0682 ± 0.05440.9658 ± 0.0274
SPPSFormer0.0000 ± 0.00001.0000 ± 0.00000.0362 ± 0.02950.9819 ± 0.0148
Table 32. Quantitative comparison of superpoint size consistency and generation efficiency between SPPSFormer and SPFormer.
Different ApproachesSuperpoint SizeAverage Range of Superpoint SizesAverage Superpoint Generation Time
RoofN3D Building3D RoofN3D Building3D RoofN3D Building3D
SPFormer15.12 ± 6.3615.08 ± 2.8825.4015.234.72 ms5.20 ms
SPPSFormer4.00 ± 2.055.17 ± 1.629.799.6383.74 ms96.54 ms
Table 33. Comparison of training efficiency between DeepRoofPlane and SPPSFormer.
Different ApproachesPer-Epoch Training TimeGPU Memory Usage
RoofN3D Building3D RoofN3D Building3D
DeepRoofPlane5.02 min5.45 min5.33 GB5.65 GB
SPPSFormer10.56 min11.53 min20.62 GB24.50 GB
Table 34. Comparison of inference efficiency between DeepRoofPlane and SPPSFormer.
Different ApproachesEnd-to-End Inference LatencyAverage Post-Processing TimeAverage Total Time
RoofN3D Building3D RoofN3D Building3D RoofN3D Building3D
DeepRoofPlane128.10 ms128.21 ms508.13 ms873.60 ms636.23 ms1001.81 ms
SPPSFormer58.75 ms64.17 ms411.91 ms984.75 ms554.40 ms1145.46 ms
Disclaimer/Publisher’s Note: The statements, opinions and data contained in all publications are solely those of the individual author(s) and contributor(s) and not of MDPI and/or the editor(s). MDPI and/or the editor(s) disclaim responsibility for any injury to people or property resulting from any ideas, methods, instructions or products referred to in the content.