Article

Multi-Domain Interference-Suppressed DETR for SAR Object Detection

1
College of Information and Communication Engineering, Harbin Engineering University, Harbin 150001, China
2
Qingdao Innovation and Development Center, Harbin Engineering University, Qingdao 266404, China
3
Ceyear Technologies Co., Ltd., Qingdao 266000, China
4
Institute of Information Fusion, Naval Aviation University, Yantai 264001, China
*
Author to whom correspondence should be addressed.
Remote Sens. 2026, 18(13), 2076; https://doi.org/10.3390/rs18132076
Submission received: 12 May 2026 / Revised: 20 June 2026 / Accepted: 22 June 2026 / Published: 24 June 2026
(This article belongs to the Section Remote Sensing Image Processing)

Highlights

What are the main findings?
  • A unified multi-domain interference-suppressed Detection Transformer (DETR) framework (MDIS-DETR) is proposed to jointly address spatial, frequency, and structural interference in synthetic aperture radar (SAR) object detection.
  • The proposed method achieves superior performance on multiple SAR benchmarks, including a 4.58% mAP improvement over the Real-Time Detection Transformer (RT-DETR) on the SARDet-100K dataset.
What are the implications of the main findings?
  • The proposed framework enhances feature representation robustness under complex SAR imaging conditions affected by speckle noise and spectral imbalance.
  • It provides a practical solution for improving detection reliability in real-world SAR applications such as remote sensing surveillance and target monitoring.

Abstract

Synthetic aperture radar (SAR) object detection has long been affected by spatial speckle interference, spectral energy imbalance, and structural bias in cross-scale feature fusion. In this article, we propose the Multi-Domain Interference-Suppressed Detection Transformer (MDIS-DETR), a unified multi-domain interference-suppressed detection framework built on the Real-Time Detection Transformer (RT-DETR) architecture. Specifically, spatial-domain interference is suppressed by learnable fusion of complementary denoising responses at the input stage. Furthermore, frequency-domain interference is suppressed by polarization-guided attention together with adaptive frequency refinement within the encoder. In addition, structural-domain interference is suppressed by non-sequential cross-scale interaction to enhance multi-scale consistency. Extensive experiments on multiple SAR benchmarks demonstrate that MDIS-DETR establishes state-of-the-art (SOTA) performance across datasets. Notably, on SARDet-100K, currently the largest SAR detection dataset with a scale comparable to the Common Objects in Context (COCO) dataset, it achieves 58.82% mAP, surpassing the RT-DETR baseline by 4.58%.

1. Introduction

Synthetic aperture radar (SAR) is an active microwave imaging sensor capable of operating in diverse weather conditions at any time of the day [1,2,3], supporting its widespread use in both military and civilian domains [4,5,6]. Accordingly, accurate object detection in complex scenes remains of critical practical importance in SAR image interpretation [7,8].
Early research on SAR image object detection mainly relied on handcrafted features and prior knowledge, with constant false alarm rate (CFAR) detectors serving as representative approaches [9,10]. To improve robustness in complex SAR scenes, subsequent studies introduced more sophisticated statistical models, such as the G 0 distribution [11], and incorporated spatial contextual cues such as bilateral filtering [12] to suppress speckle-induced false alarms [13]. In addition, geometry- and texture-related descriptors, including contour, symmetry, edge, and wavelet features, were explored to enhance target discrimination [14,15,16,17]. However, these methods still rely heavily on handcrafted representations and predefined statistical assumptions, limiting their effectiveness in complex SAR environments.
In recent years, deep-learning-based detectors have gradually replaced handcrafted pipelines in object detection. Convolutional neural network (CNN)-based detectors, including two-stage frameworks such as Faster R-CNN [18] and one-stage frameworks such as You Only Look Once (YOLO) [19,20,21], have achieved strong performance in natural-image detection. However, most CNN-based methods rely on non-maximum suppression (NMS) [18], which introduces additional post-processing complexity. To address this limitation, DETR-style detectors [22,23] reformulate detection as an end-to-end set prediction problem using Transformer architectures. Among them, the real-time detection Transformer (RT-DETR) [24] further improves the balance between detection accuracy and inference efficiency, making it attractive for real-time SAR object detection.
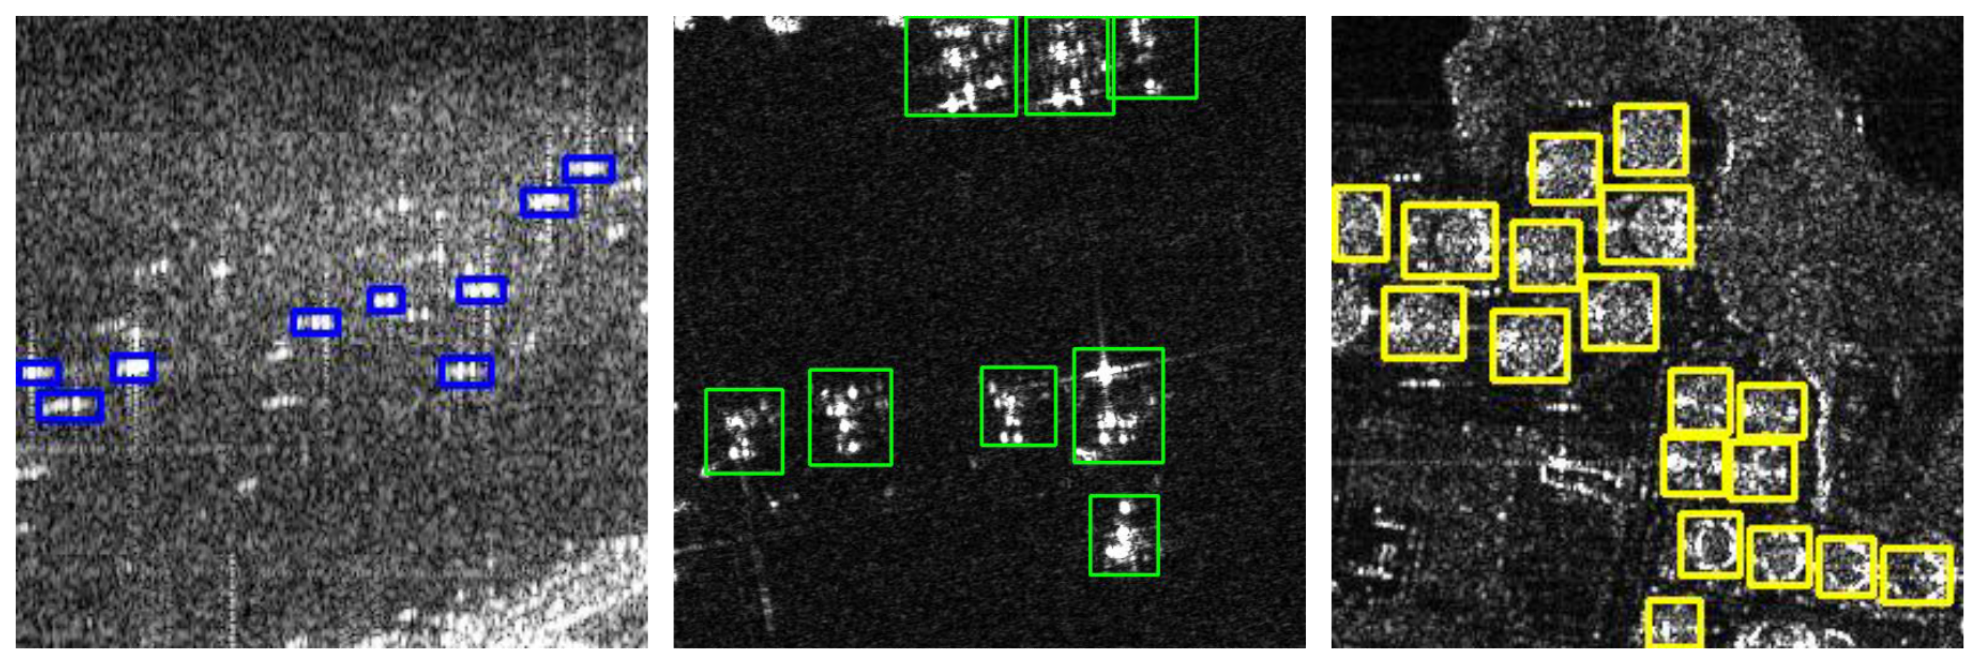
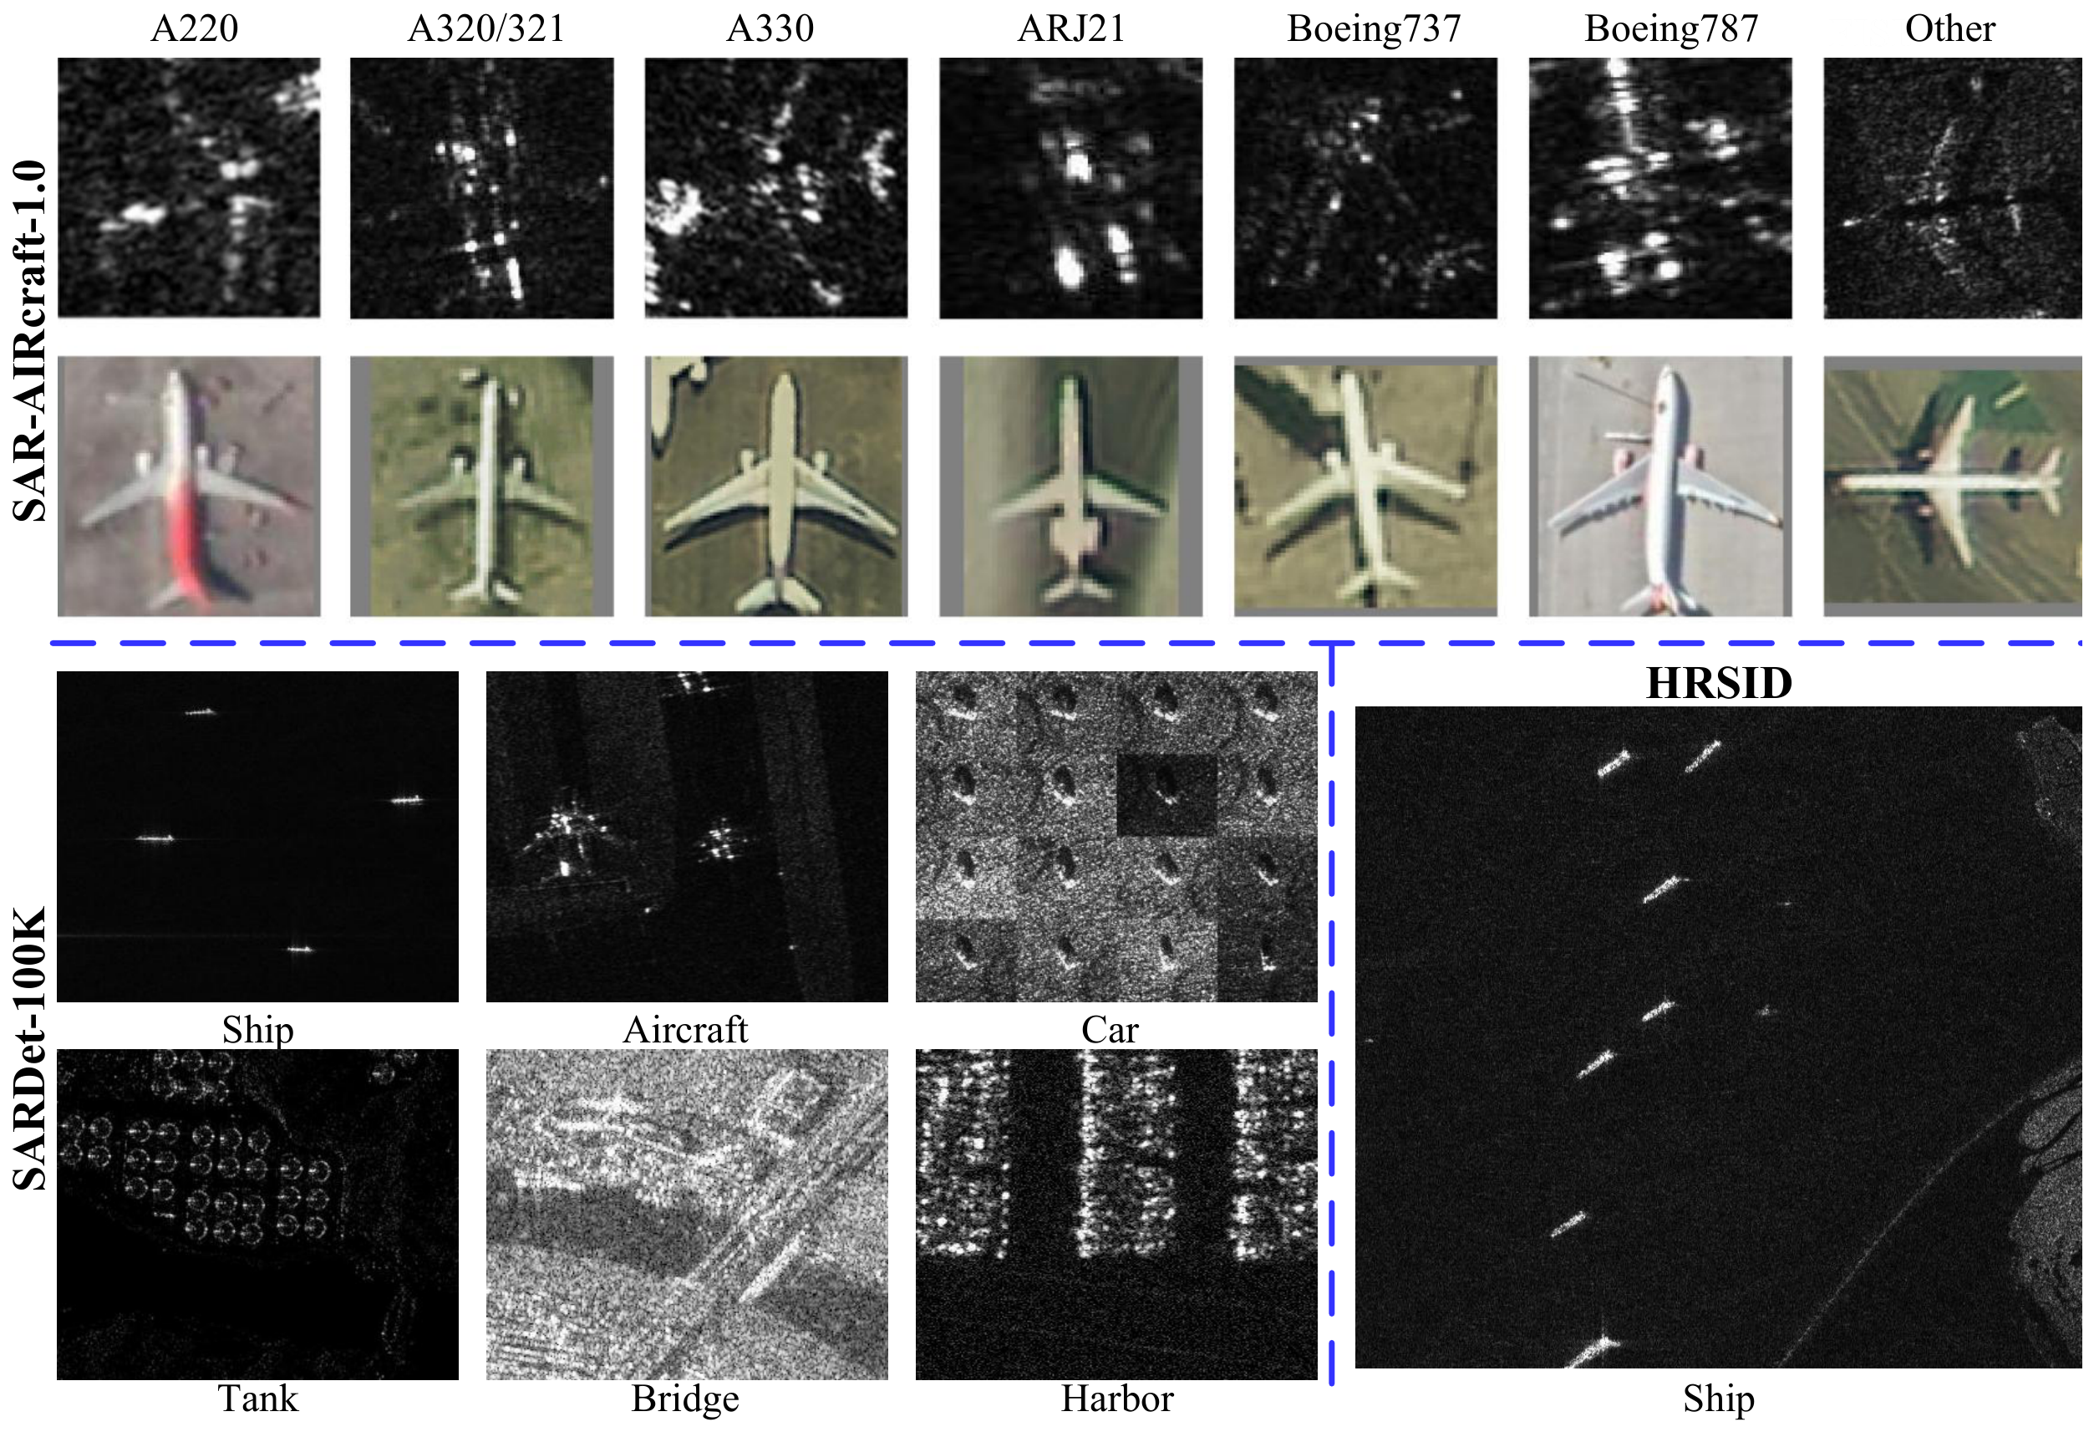
Although deep learning methods have achieved promising results, applying them to SAR images remains challenging due to the unique properties of coherent radar signals. Unlike optical images, SAR images contain multiplicative speckle noise, complex background clutter, and object responses that are often small, scattered, or densely distributed. As illustrated in Figure 1, representative scenarios exhibit dense background responses, weak target boundaries, and scale variations, which provide visual context for the challenges discussed in this work. These properties influence feature extraction across spatial, frequency, and structural domains, forming the key challenges in SAR object detection.
Spatial-Domain Interference: SAR images are affected by multiplicative speckle noise that overlaps with object responses. As a result, spatial filtering often reduces noise while blurring important object details, making it difficult to preserve reliable spatial features [25]. Since SAR images are single-channel, three-channel inputs are often constructed through simple replication [26,27] or fixed filtering [28] to fit multi-channel detection frameworks. However, such operations either introduce redundant information or are applied as fixed preprocessing rather than being learned within the detection framework. Consequently, spatial-domain interference originates from the image-input level, including both the coupling between noise and object features and the non-adaptive construction of input representations, which together limit effective spatial feature learning.
Frequency-Domain Interference: Due to scene-dependent scattering characteristics and the coherent imaging mechanism, SAR images exhibit non-uniform and spatially structured spectral distributions after a two-dimensional Fourier transform. In this work, the frequency domain refers to the spectrum obtained by applying Fast Fourier Transform (FFT) to SAR images, where different spatial regions contribute to different distributions across frequency components. Variations in scene composition, background structures, and scattering responses lead to heterogeneous spectral patterns in the transformed domain [29]. Most detection frameworks rely on self-attention [30] for global feature modeling, which aggregates information across all positions without explicitly preserving region-aware spectral consistency. In SAR scenes, this may lead to insufficient sensitivity to spatially localized spectral variations, resulting in inconsistent feature representations across regions. Consequently, frequency-domain interference is characterized as the mismatch between spatially varying scene statistics and their corresponding spectral representations after Fourier transformation, which limits stable feature learning. In this work, such interference is addressed by applying FFT-based transformations on localized feature windows, enabling region-adaptive spectral refinement during feature learning.
Structural-Domain Interference: In existing detection frameworks, multi-scale features are usually fused through predefined top-down or bottom-up sequential paths, e.g., Feature Pyramid Networks (FPN) [31] and Path Aggregation Networks (PAN) [32]. Such designs follow fixed information flows and lack direct interactions between different scales. In SAR scenes, where object appearance varies significantly across scales, sequential fusion introduces repeated responses or inconsistent feature propagation during stage-wise transmission, resulting in less consistent multi-scale representations. As a result, structural-domain interference originates from the feature-fusion level, where fixed fusion paths and biased cross-scale propagation lead to less reliable multi-scale representations and affect robust feature learning.
However, existing deep-learning-based object detection methods cannot effectively suppress the aforementioned interferences in SAR images, limiting the stability and reliability of feature modeling. Moreover, the above interferences are not completely isolated in SAR feature learning. Spatial-domain speckle noise affects local response distributions at the input stage, which further induces regional spectral instability during Transformer feature encoding. These unstable frequency responses are subsequently propagated across scales during feature fusion, resulting in structural inconsistency in multi-scale representations. Therefore, suppressing interference only in a single domain cannot fully stabilize SAR feature learning, motivating the proposed coordinated multi-domain interference suppression strategy. To overcome this limitation, we adopt a multi-domain interference suppression perspective, since the above interferences are not isolated but jointly affect feature representation across spatial, frequency, and structural domains. Accordingly, coordinated suppression mechanisms are introduced to enable unified refinement of data input, feature encoding, and cross-scale interaction within the detection framework. Specifically, we construct a unified detection framework termed Multi-Domain Interference-Suppressed DETR (MDIS-DETR) based on the RT-DETR architecture, which integrates the above suppression strategies in an end-to-end manner. Importantly, rather than operating as independently superimposed modules, the proposed three-domain suppression strategies are organized in a progressive manner across the detection pipeline. Specifically, spatial-domain suppression first stabilizes local spatial responses at the input stage, which provides more reliable representations for subsequent frequency-domain modeling in the encoder. Based on the refined frequency-aware features, the structural-domain suppression further enhances cross-scale consistency during feature fusion. Such progressive coordination enables interference suppression to be continuously propagated and refined throughout the feature learning process. Then, the proposed strategies are presented in detail below.
First, to alleviate the coupling between speckle noise and object responses in SAR images, we introduce a learnable spatial-domain fusion denoising strategy implemented via the Learnable Spatial-Domain Fusion Denoising Module (LSFDM) at the input stage. Instead of fixed channel replication or isolated preprocessing, complementary spatial filtering responses are adaptively fused with the original image through learnable weighting and residual enhancement. In this way, spatial-domain interference is jointly optimized with the detection objective, improving the robustness of spatial feature extraction.
Second, to regulate regionally imbalanced spectral variations and inconsistent frequency responses during feature learning, we integrate a frequency-domain suppression strategy into the encoder through the Polar-Guided Adaptive Frequency-Domain Denoising Module (PAFDM). Inspired by polarity-aware feature modeling [33], a polarity-guided attention mechanism improves the robustness of global modeling against such interference, while an adaptive frequency refinement operation performs localized spectral adjustment. This coordinated design enhances the consistency of frequency representations and mitigates noise amplification during self-attention-based feature learning.
Third, to mitigate cross-scale propagation bias caused by fixed sequential fusion pathways, we develop a structural-domain suppression strategy realized by the Node-Interactive Cross-Scale Focus Module (NICFM). By introducing scale-aligned focusing and non-sequential cross-scale interaction, the proposed mechanism reduces redundant feature propagation and enhances cross-scale consistency of feature representations. As a result, multi-scale representations become more reliable for SAR object detection.
In summary, this work makes the following four contributions:
(1)
Spatial-Domain Interference Suppression: We propose a learnable spatial-domain interference suppression strategy implemented via the LSFDM. By adaptively integrating complementary spatial responses with the original SAR input, the proposed approach mitigates spatial-domain interference while preserving discriminative feature representations for robust representation learning.
(2)
Frequency-Domain Interference Suppression: We integrate a frequency-domain suppression mechanism into the encoder through the PAFDM. By stabilizing global dependency modeling under regionally imbalanced spectral variations and performing localized spectral adjustment, the proposed design improves the consistency of frequency representations.
(3)
Structural-Domain Interference Suppression: We develop a structural-domain suppression strategy realized by the NICFM. Through scale-aligned focusing and non-sequential cross-scale interaction, the proposed mechanism mitigates the limitations of fixed sequential fusion and enhances multi-scale consistency of feature representations.
(4)
State-of-the-Art Performance: Our MDIS-DETR outperforms existing approaches across multiple SAR object detection benchmarks, particularly on SARDet-100K, currently the largest SAR detection dataset with a scale comparable to the Common Objects in Context (COCO) benchmark.
The remainder of this article is organized as follows. Section 2 reviews the related work. Section 3 introduces the proposed MDIS-DETR framework in detail. Experimental results and analysis are presented in Section 4. Section 5 provides further discussion of the results. Finally, Section 6 concludes this article.

2. Related Work

2.1. Deep-Learning-Based General Object Detection

Benefiting from advances in deep neural networks, object detection has achieved remarkable progress in recent years. Current deep-learning-based frameworks are mainly developed along two major directions: CNN-based detectors and Transformer-based detectors.
CNN-based detectors rely on convolutional feature extraction with anchor-based predictions for object classification and localization. In two-stage frameworks such as Faster R-CNN [18], Cascade R-CNN [34] and Dynamic R-CNN [35], region proposals are first generated by a region proposal network (RPN) and then refined through subsequent classification and regression branches. Although this design achieves high accuracy, its multi-stage processing limits real-time efficiency. One-stage detectors simplify the architecture by removing the explicit proposal stage and directly predicting categories and box offsets. Since YOLOv1 [19], the YOLO family [20,21,36,37,38,39,40] has continuously improved detection speed while maintaining competitive accuracy. Nevertheless, these models still rely on NMS to eliminate redundant predictions. Applied as a separate post-processing step, NMS with manually defined thresholds compromises the stability of detection results.
Such dependence on NMS is closely associated with one-to-many label assignment in CNN-based detectors, whereas Transformer-based detectors adopt one-to-one matching for set prediction. DETR [22] introduces the Transformer into object detection, where global self-attention enables end-to-end set prediction. However, the global attention mechanism results in high computational cost and slow convergence, making real-time deployment challenging. To improve efficiency, several variants have been proposed. Deformable DETR [23] introduces multi-scale features together with deformable attention to reduce computational overhead and accelerate training. Conditional DETR [41] refines the query design by guiding spatial queries with reference points, leading to better localization. DN-DETR [42] and DINO [43] improve training by introducing denoising strategies and more effective query initialization. Other extensions, such as Anchor DETR [44], DAB-DETR [45], and Rank-DETR [46], further explore different directions to improve performance. For real-time deployment, RT-DETR [24] adopts an efficient hybrid encoder and an uncertainty-minimal query selection strategy, improving speed while maintaining strong detection accuracy. Nevertheless, the performance of RT-DETR in complex SAR imagery has not been systematically studied.

2.2. Deep-Learning-Based SAR Object Detection

Despite the progress in natural-image detection, SAR object detection still involves unique challenges, as discussed above, which limits the direct application of generic detectors. Existing SAR detection studies therefore focus on improving detection performance from different perspectives. PADN [47] and EWFAN [48] apply attention mechanisms to refine spatial features under speckle noise, leading to more reliable target detection. MD-DETR [28] extends this idea within a Transformer framework by introducing multilevel denoising strategies at the image, feature, and query levels. In addition, FAM [49] introduces a frequency-aware attention module to process frequency information adaptively and suppress sea clutter. Building on this idea, DenoDet [50] further incorporates an explicit frequency transform and highlights high-frequency components to reduce noise while preserving target signals. Meanwhile, refinements in network structure to strengthen multi-scale representation remain an important research direction. MGCAN [26], MSSDet [51], and SEFEPNet [52] focus on integrating features from different layers to enhance multi-scale representation. CenterNet++ [53], based on CenterNet, further improves SAR detection through feature enhancement, multi-level fusion, and head refinement. Similarly, PVT-SAR [54] employs a Pyramid Vision Transformer backbone (PVT) to capture global features across different scales.
Although existing methods demonstrate effectiveness, most of them perform interference suppression in only one domain. A unified strategy that jointly suppresses interference in the spatial, frequency, and structural domains is still lacking, limiting the overall suppression capability. To address this limitation, we propose a unified interference suppression approach across all three domains to enhance detection reliability.

3. Materials and Methods

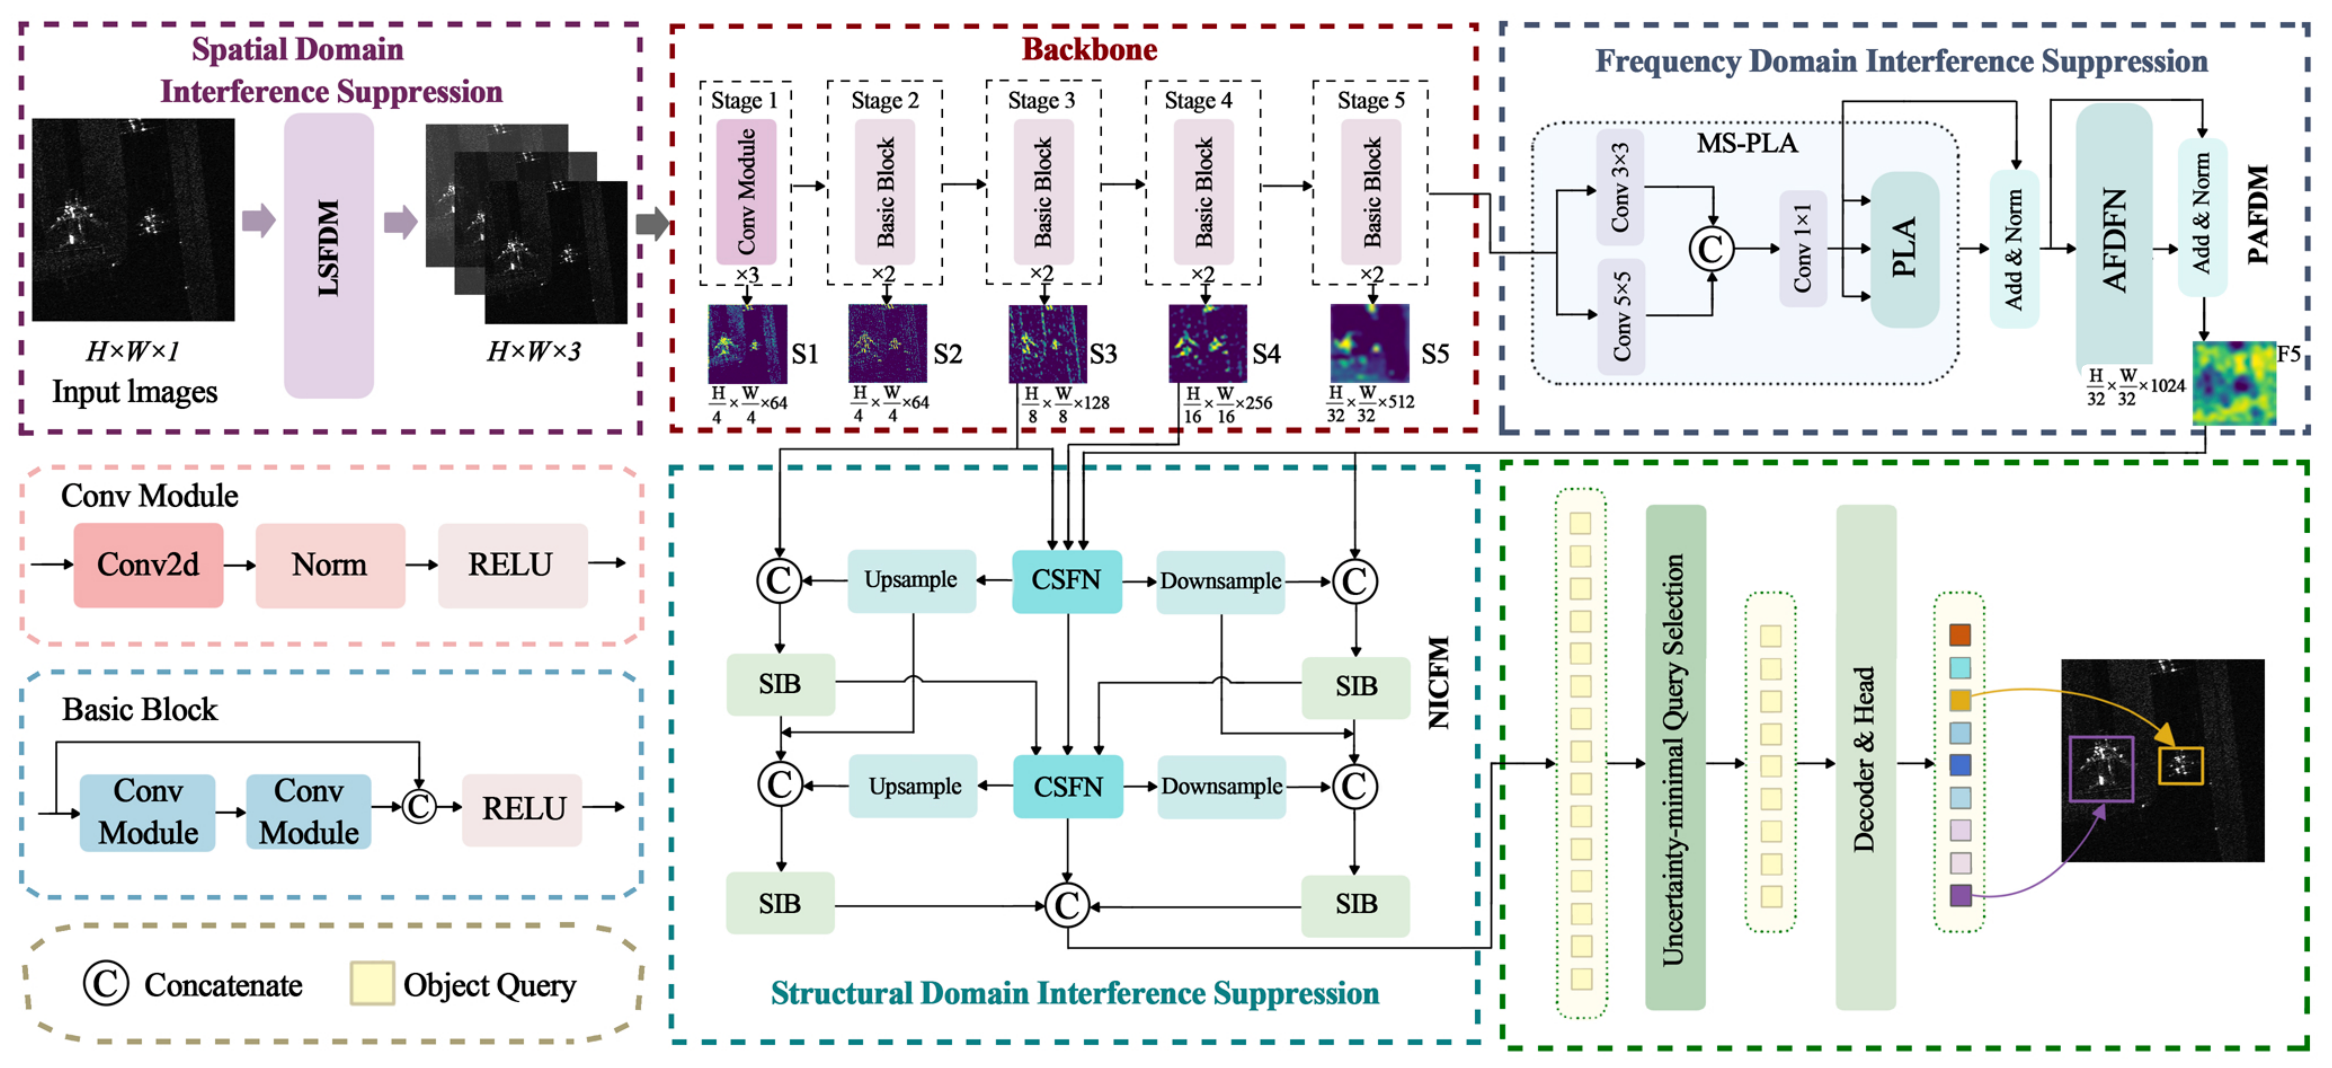
To balance detection efficiency and accuracy in SAR object detection, we propose a new detection framework referred to as MDIS-DETR, as shown in Figure 2. The proposed framework is established on the real-time, end-to-end RT-DETR detector and incorporates three complementary interference suppression mechanisms acting on spatial, frequency, and structural domains. It is worth noting that the underlying idea of representation interference suppression is generic, and the proposed modules are designed in a plug-and-play manner, allowing them to be readily integrated into other detection architectures.
Figure 2. Overall architecture of the proposed Multi-Domain Interference-Suppressed Detection Transformer (MDIS-DETR), built upon the Real-Time Detection Transformer (RT-DETR) framework and consisting of three domain-specific interference suppression designs, namely the spatial-domain interference suppression, the frequency-domain interference suppression, and the structural-domain interference suppression. The definitions of the acronyms used in this figure are summarized in Table 1.
Remotesensing 18 02076 g002
Table 1. Definitions of acronyms used in Figure 2.
AcronymDefinition
AFDFNAdaptive Frequency-Domain Denoising Feed-Forward Network
CSFNCross-Scale Fusion Node
LSFDMLearnable Spatial-Domain Fusion Denoising Module
MS-PLAMulti-Scale Polar Linear Attention
NICFMNode-Interactive Cross-Scale Focus Module
PAFDMPolar-Guided Adaptive Frequency-Domain Denoising Module
SIBScale-wise Integration Block
In Section 3.1, we first provide a brief overview of the baseline model RT-DETR and outline its overall architecture. Then, the design motivations and implementation details of the three core interference suppression strategies are presented in Section 3.2, Section 3.3, and Section 3.4, respectively.

3.1. Overall Architecture

RT-DETR is an end-to-end Transformer-based detector for real-time object detection and is adopted as the baseline architecture in this work. It mainly consists of a multi-stage backbone, a hybrid encoder, and a Transformer decoder driven by learnable queries.
Backbone: RT-DETR adopts a multi-stage backbone to extract multi-level features at different spatial scales. Specifically, multi-stage networks such as ResNet [55] or HGNet [56] can be used as the backbone, from which feature maps extracted from the last three stages are denoted as { S 3 , S 4 , S 5 } , corresponding to spatial downsampling factors of 8, 16, and 32 relative to the input image.
Hybrid Encoder: The encoder of RT-DETR consists of the Attention-based Intra-scale Feature Interaction (AIFI) and the Cross-scale Feature Fusion (CCFF), which are used to further process the multi-scale features extracted by the backbone.
The AIFI module is applied to the high-level feature map S 5 . Specifically, the feature map is first flattened to generate the query ( Q ), key ( K ), and value ( V ) representations used in the standard self-attention mechanism, and a dot-product self-attention is employed to model feature correlations within a single scale. After the attention operation, the output features are reshaped back to the original spatial layout, resulting in an updated high-level feature map F 5 .
Subsequently, the CCFF module performs cross-scale feature fusion. Following a PAN-style linear fusion pathway, the features { S 3 , S 4 , F 5 } are progressively combined to produce the final encoded output feature map O , which is then passed to the decoder.
The above process can be formulated as
Q = K = V = Flatten ( S 5 ) ,
F 5 = Reshape softmax Q K T d k V ,
O = CCFF ( S 3 , S 4 , F 5 ) .
where d k denotes the dimensionality of the vectors in the scaled dot-product attention mechanism.
Transformer Decoder: Based on the output feature map O , RT-DETR employs an uncertainty-minimal query selection mechanism to initialize object queries for the Transformer decoder, corresponding to the lower-right branch in Figure 2. A set of content queries and positional queries is first initialized through a query selection mechanism. Subsequently, the decoder iteratively updates the query representations by interacting with the encoded feature O via deformable attention across multiple cascaded layers. The final predictions are obtained from the refined queries, including both classification scores and bounding box regression results.

3.2. Spatial-Domain Interference Suppression

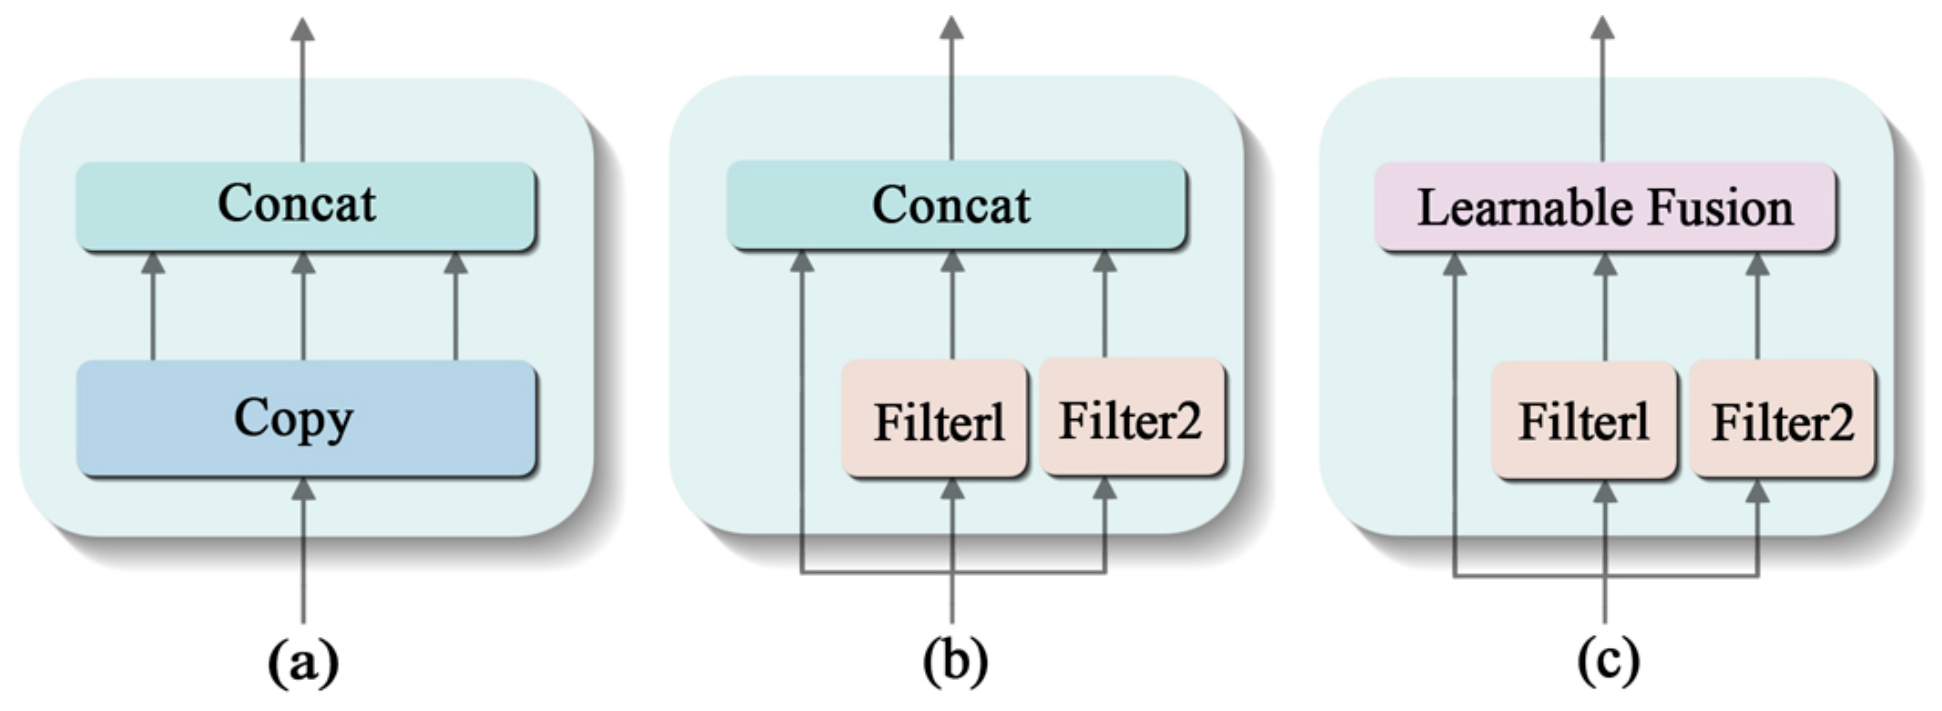
As introduced in Section 1, spatial-domain interference is rarely considered in existing SAR object detection methods. In practice, a single-channel SAR image is converted into an RGB-like three-channel input at the network input stage to satisfy the format requirements of multi-channel detection architectures (Figure 3a). However, this channel replication fails to introduce new discriminative information, while spatial-domain interference, especially speckle noise, is directly retained, thereby limiting the quality of subsequent feature extraction.
Another common approach applies traditional image denoising techniques at the network input stage to reduce noise effects. Specifically, several spatial-domain filters are applied to the SAR image, and the filtered results are concatenated with the original image as the network input, as illustrated in Figure 3b. However, their fusion is fixed and cannot adapt to varying scenes or object properties, resulting in limited suppression of spatial-domain interference.
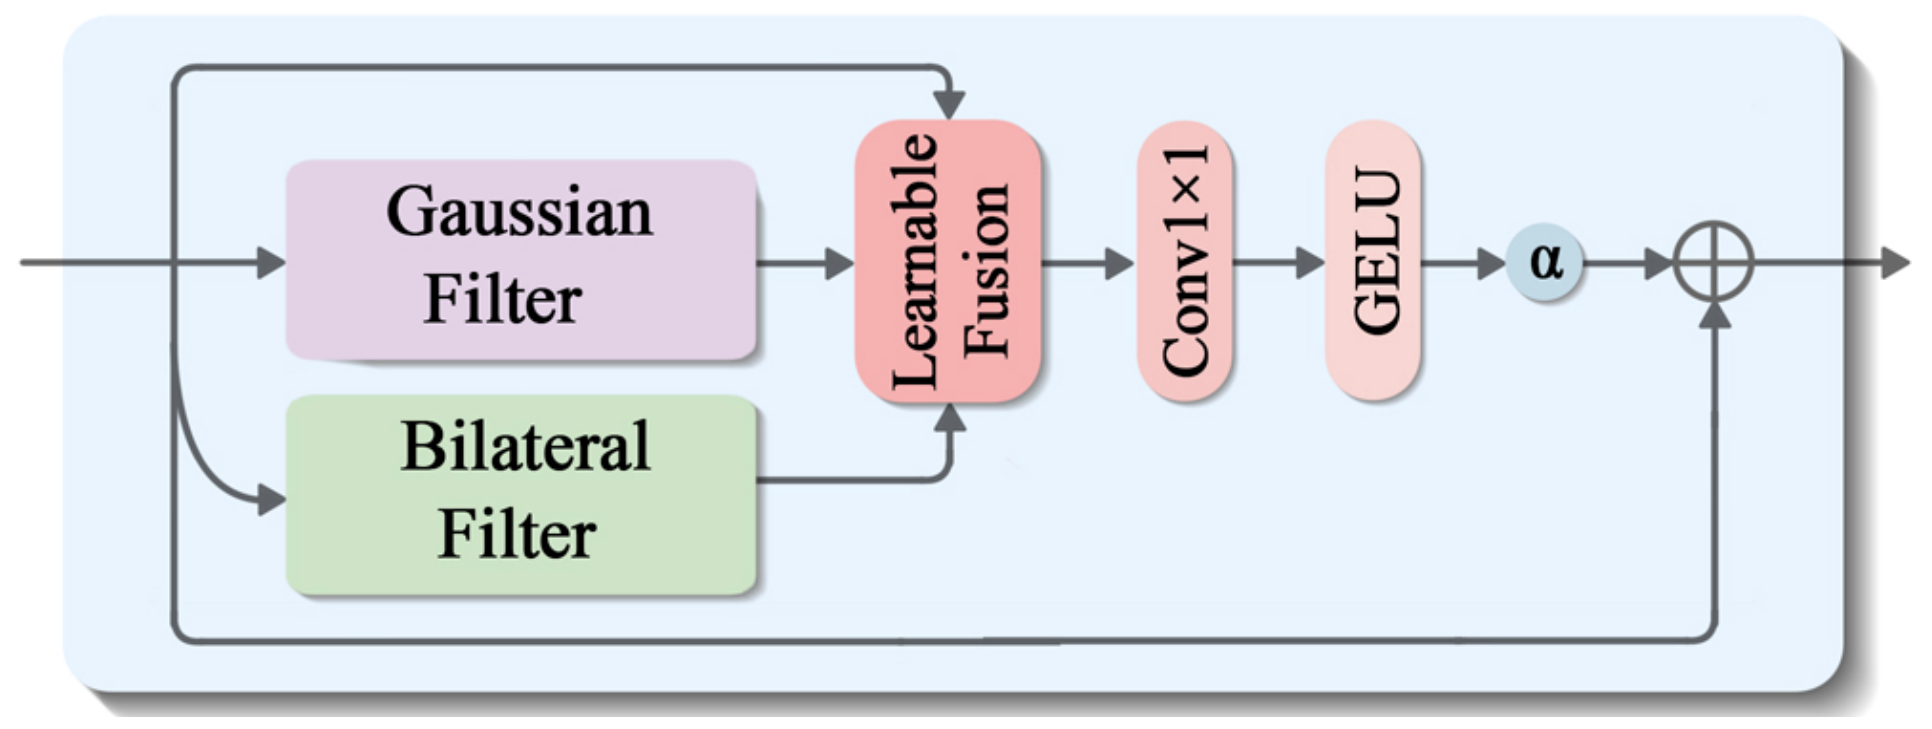
These approaches share a common limitation: spatial-domain interference is handled as an isolated preprocessing step instead of being jointly optimized with the detection task. As a result, interference suppression remains largely decoupled from object detection, which limits the effective use of spatial-domain information. To address this issue, we propose a Learnable Spatial-Domain Fusion Denoising Module (LSFDM) that adaptively fuses the original SAR image and multiple spatial-domain filtered outputs via a learnable mechanism, as shown in Figure 4.
In this way, spatial-domain interference can be effectively reduced while retaining spatial information that is critical for object detection.
Given a single-channel SAR image x R H × W × 1 , Gaussian and bilateral filtering are applied to form two complementary spatial-domain representations:
D G = G ( x ) ,
D B = B ( x ) ,
where G ( · ) and B ( · ) denote the Gaussian filter and the bilateral filter, respectively.
The Gaussian filter mainly suppresses speckle noise through spatial smoothing, while the bilateral filter emphasizes edge-aware denoising by preserving local structures, resulting in complementary spatial-domain representations.
Subsequently, the original input and the two filtered representations are combined along the channel dimension, where a learnable parameter vector is introduced to generate channel-wise weights and avoid simple concatenation:
X s = Concat ( w 1 x ,   w 2 D G ,   w 3 D B ) ,
[ w 1 , w 2 , w 3 ] = σ ( w ) ,
where σ ( · ) denotes the sigmoid function and w represents learnable parameters that are jointly optimized with the detector through back-propagation during training. The coefficients w 1 , w 2 , and w 3 correspond to the channel-wise scaling factors for the original image, the Gaussian-filtered response, and the bilateral-filtered response, respectively.
Based on the weighted concatenated features, a lightweight fusion mapping is performed using a 1 × 1 convolution followed by a GELU activation:
X ˜ s = GELU ( Conv 1 × 1 ( X s ) ) .
Finally, to preserve the original structural information, LSFDM integrates the fused features with the input through a residual connection. Since the original SAR image x is single-channel, it is first replicated along the channel dimension to match the dimension of X ˜ s :
X o u t = Rep ( x ) + α · X ˜ s ,
where Rep ( · ) denotes channel-wise replication from one channel to three channels, and α is a learnable scaling factor used to adjust the magnitude of the denoising enhancement.
This design allows denoising to be smoothly integrated into feature extraction, suppressing spatial-domain interference while preserving essential structural information.

3.3. Frequency-Domain Interference Suppression

In SAR object detection tasks, beyond spatial-domain interference, frequency-domain interference poses a significant challenge to feature representation and object discrimination. Here, frequency-domain interference refers to the regionally imbalanced spectral variations in the Fourier spectrum of SAR images. Owing to the coherent imaging mechanism and scene-dependent scattering characteristics, SAR images typically exhibit local spectral variations and irregular energy distributions caused by speckle noise.
Most existing SAR object detection methods adopt self-attention-based global modeling during feature extraction. In DETR-style architectures, such as RT-DETR, this strategy is implemented within the encoder through modules like AIFI. However, when applied to SAR images, these methods suffer from inherent limitations. Specifically, dot-product attention relies on amplitude similarity, which makes it sensitive to multiplicative noise. Moreover, global modeling fails to capture the regional and multi-scale characteristics of frequency-domain interference, which leads to the reinforcement of noise effects during feature extraction.
To address these issues, we propose the Polar-Guided Adaptive Frequency-Domain Denoising Module (PAFDM), which is composed of two complementary components: the Multi-Scale Polar Linear Attention (MS-PLA) and the Adaptive Frequency-Domain Denoising Feed-Forward Network (AFDFN), as shown in Figure 2. Different from existing frequency-aware enhancement methods, the proposed PAFDM explicitly models regional spectral instability during Transformer feature learning and performs coordinated frequency-domain suppression within the encoder. Inspired by recent progress in polarization attention, we design MS-PLA to guide selective feature modeling across scales by leveraging attention-guided contextual representations, thereby producing more stable and discriminative features for subsequent frequency-domain processing. Furthermore, AFDFN performs adaptive adjustment directly in the frequency domain according to the regional characteristics of frequency-domain interference, providing complementary refinement beyond spatial-domain feature learning alone.
Overall, PAFDM is designed to suppress frequency-domain interference in feature representations, and its formulation can be summarized as
M 1 = LN M i n + MS - PLA ( M i n ) ,
M o u t = LN M 1 + AFDFN ( M 1 ) ,
where M i n , M o u t R H × W × C denote the input and output feature maps of the module, respectively; MS - PLA ( · ) and AFDFN ( · ) denote the MS-PLA and AFDFN modules; and LN ( · ) denotes Layer Normalization.

3.3.1. MS-PLA: Multi-Scale Polar Linear Attention

As shown in Figure 2, MS-PLA integrates polarity-aware linear attention (PLA) with a lightweight multi-scale convolutional aggregation structure consisting of parallel 3 × 3 and 5 × 5 convolutions and channel fusion to enhance local structural modeling. This design improves the stability of feature representations under multiplicative noise without introducing additional complexity, by incorporating polarity-aware guidance into attention modeling through polarity decomposition and gated fusion. As a result, MS-PLA reduces the impact of localized abnormal responses during global modeling and provides more reliable feature guidance for the subsequent AFDFN.
The overall operation of MS-PLA can be formulated as
M m s = Conv 1 Concat { Conv k ( M i n ) } k { 3 , 5 } ,
MS - PLA ( M i n ) = PLA ( M m s ) ,
where M i n R H × W × C denotes the input feature map of MS-PLA, Conv k ( · ) denotes convolution operations with kernel size k × k , and PLA ( · ) denotes the PLA.
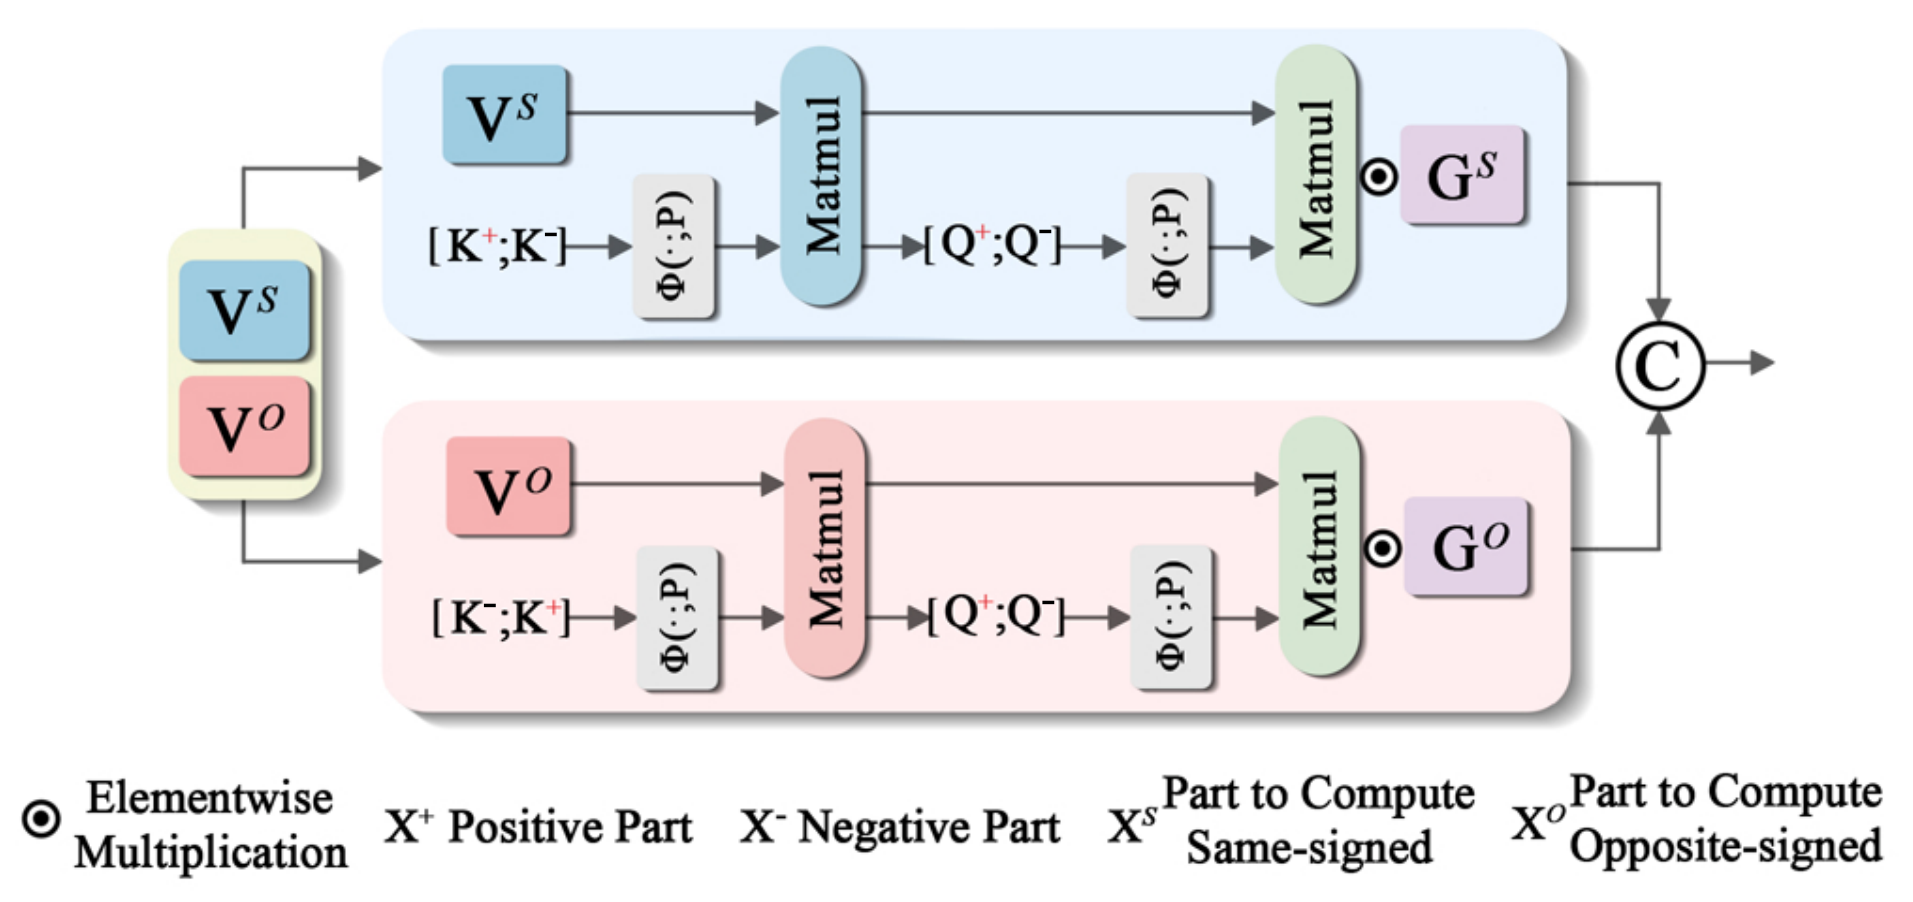
In this context, PLA aims to improve the stability of attention modeling under complex interference conditions with linear computational complexity. The internal structure of PLA is illustrated in Figure 5. The key idea of PLA is to explicitly distinguish and model positive and negative relationships in feature responses, which helps reduce the sensitivity of self-attention to magnitude similarity and contrast variations.
Given the input feature map, the corresponding query, key, and value representations are denoted as Q , K , and V .
PLA introduces a polarity decomposition strategy by applying a nonlinear mapping function ϕ ( · ) (i.e., ReLU) to the query and key representations, which separates the features into non-negative polarity components. Based on this decomposition, a learnable power parameter p is further introduced to adaptively reweight the magnitude of the decomposed responses, formulated as p = 1 + α · σ ( p ^ ) , where α is a preset amplification factor, σ ( · ) denotes the sigmoid function, and p ^ is the learnable parameter.
This design decouples polarity separation and adaptive response modulation, enabling more stable feature representation under magnitude variations.
Q + = ϕ ( Q ) , Q = ϕ ( Q ) , K + = ϕ ( K ) , K = ϕ ( K ) .
Based on the polarity-decomposed representations, PLA builds two attention paths to capture same-signed and opposite-signed feature responses, formulated as
A s = Concat ( Q + , Q ) Concat ( K + , K ) V s · z s , A o = Concat ( Q + , Q ) Concat ( K , K + ) V o · z o ,
where the superscripts s and o denote the same-signed and opposite-signed branches, respectively. V s and V o are obtained by splitting the value representation V along the channel dimension, and z s and z o are normalization factors used to ensure numerical stability during attention computation.
The outputs of the same-signed and opposite-signed branches are first enhanced by the corresponding local convolutional components, then modulated by branch-specific learnable gates, and finally concatenated along the channel dimension. The final output of PLA is given by
PLA ( M ) = Concat A s + DWConv ( V s ) G s , A o + DWConv ( V o ) G o ,
where ⊙ denotes element-wise multiplication and G s and G o denote the learnable gating representations for the same-signed and opposite-signed branches, respectively. DWConv ( V s ) and DWConv ( V o ) denote the corresponding local convolutional enhancement components for the two branches.

3.3.2. AFDFN: Adaptive Frequency-Domain Denoising Feed-Forward Network

Building upon the polarity-guided representations provided by MS-PLA, the resulting features still contain noise-related frequency variations, which exhibit clear regional and non-uniform characteristics. To further reduce noise effects in the frequency domain, we introduce AFDFN for frequency-domain denoising.
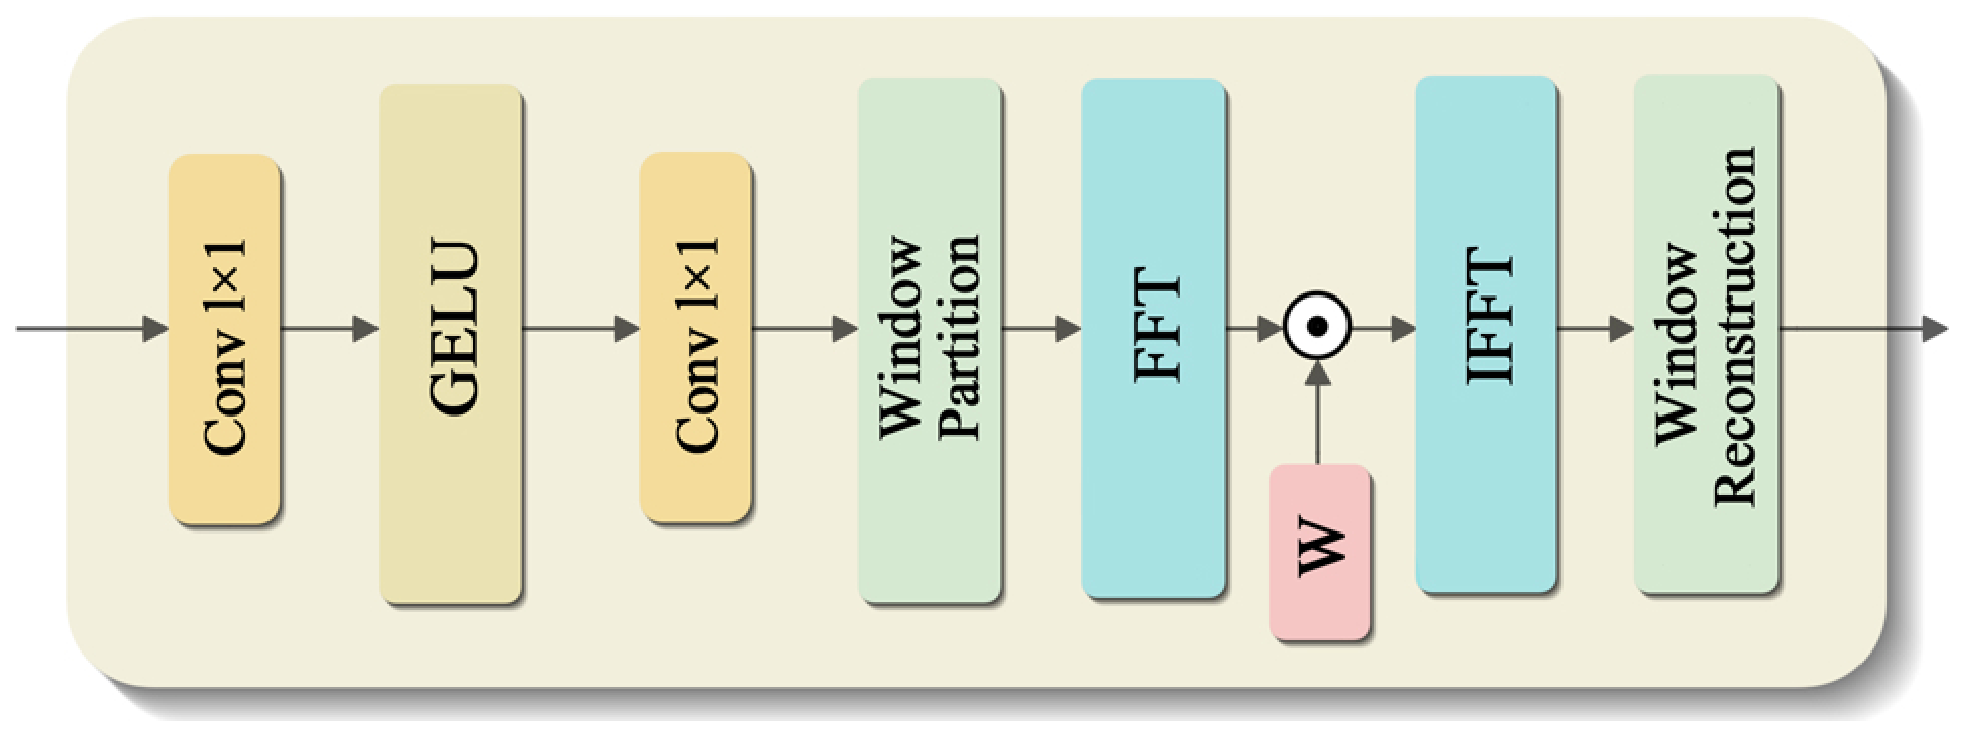
As illustrated in Figure 6, AFDFN evenly partitions the input feature map into fixed-size non-overlapping windows arranged in an X × X grid manner and independently transforms each local window into the frequency domain via a 2-D fast Fourier transform (FFT). A set of learnable frequency-domain weights is then applied to adaptively suppress noise-related frequency responses while retaining useful frequency information. The processed features are then transformed back to the original shape via the inverse FFT.
Formally, the AFDFN operation can be expressed as
AFDFN ( M i n ) = R 1 F 1 ( F ( M i n w i n ) W f r e q ) ,
where M i n R H × W × C denotes the input feature map, and M i n w i n represents the corresponding window-partitioned features. F ( · ) and F 1 ( · ) denote the 2-D FFT and its inverse, respectively. W f r e q is a learnable frequency-domain weighting matrix for adaptive denoising, and ⊙ denotes element-wise multiplication (Hadamard product). R 1 ( · ) represents the window reconstruction operation that recovers features to their original layout.
By performing frequency-domain denoising within local regions, AFDFN explicitly models the regional distribution of noise in the frequency space, avoiding unnecessary coupling caused by global frequency processing. Combined with the polarity-guided attention provided by MS-PLA, AFDFN further refines attention-aware features in the frequency domain, providing more stable frequency representations for subsequent processing.

3.4. Structural-Domain Interference Suppression

In SAR object detection, significant variations in object sizes often produce heterogeneous feature responses across different feature scales. Existing detection frameworks typically integrate such multi-scale features through sequential cross-scale fusion schemes (e.g., FPN and PAN). However, these approaches rely on fixed fusion paths without explicit interactions among scale nodes, which can lead to redundant responses and structural inconsistency during feature transmission.
To address the above structural-domain interference, we propose the Node-Interactive Cross-Scale Focus Module (NICFM). Unlike conventional sequential fusion strategies, the proposed NICFM establishes direct cross-scale interactions to alleviate structural inconsistency caused by fixed propagation paths. By introducing cross-scale interaction and focus mechanisms, NICFM promotes more consistent feature structures across different scales during the fusion process. As illustrated in Figure 2, NICFM maintains the original multi-scale hierarchy while enabling effective cross-scale collaboration through cross-scale focusing, scale-wise integration, and a non-sequential interaction mechanism, thereby supporting stable feature representations during fusion.

3.4.1. CSFN: Cross-Scale Focus Node

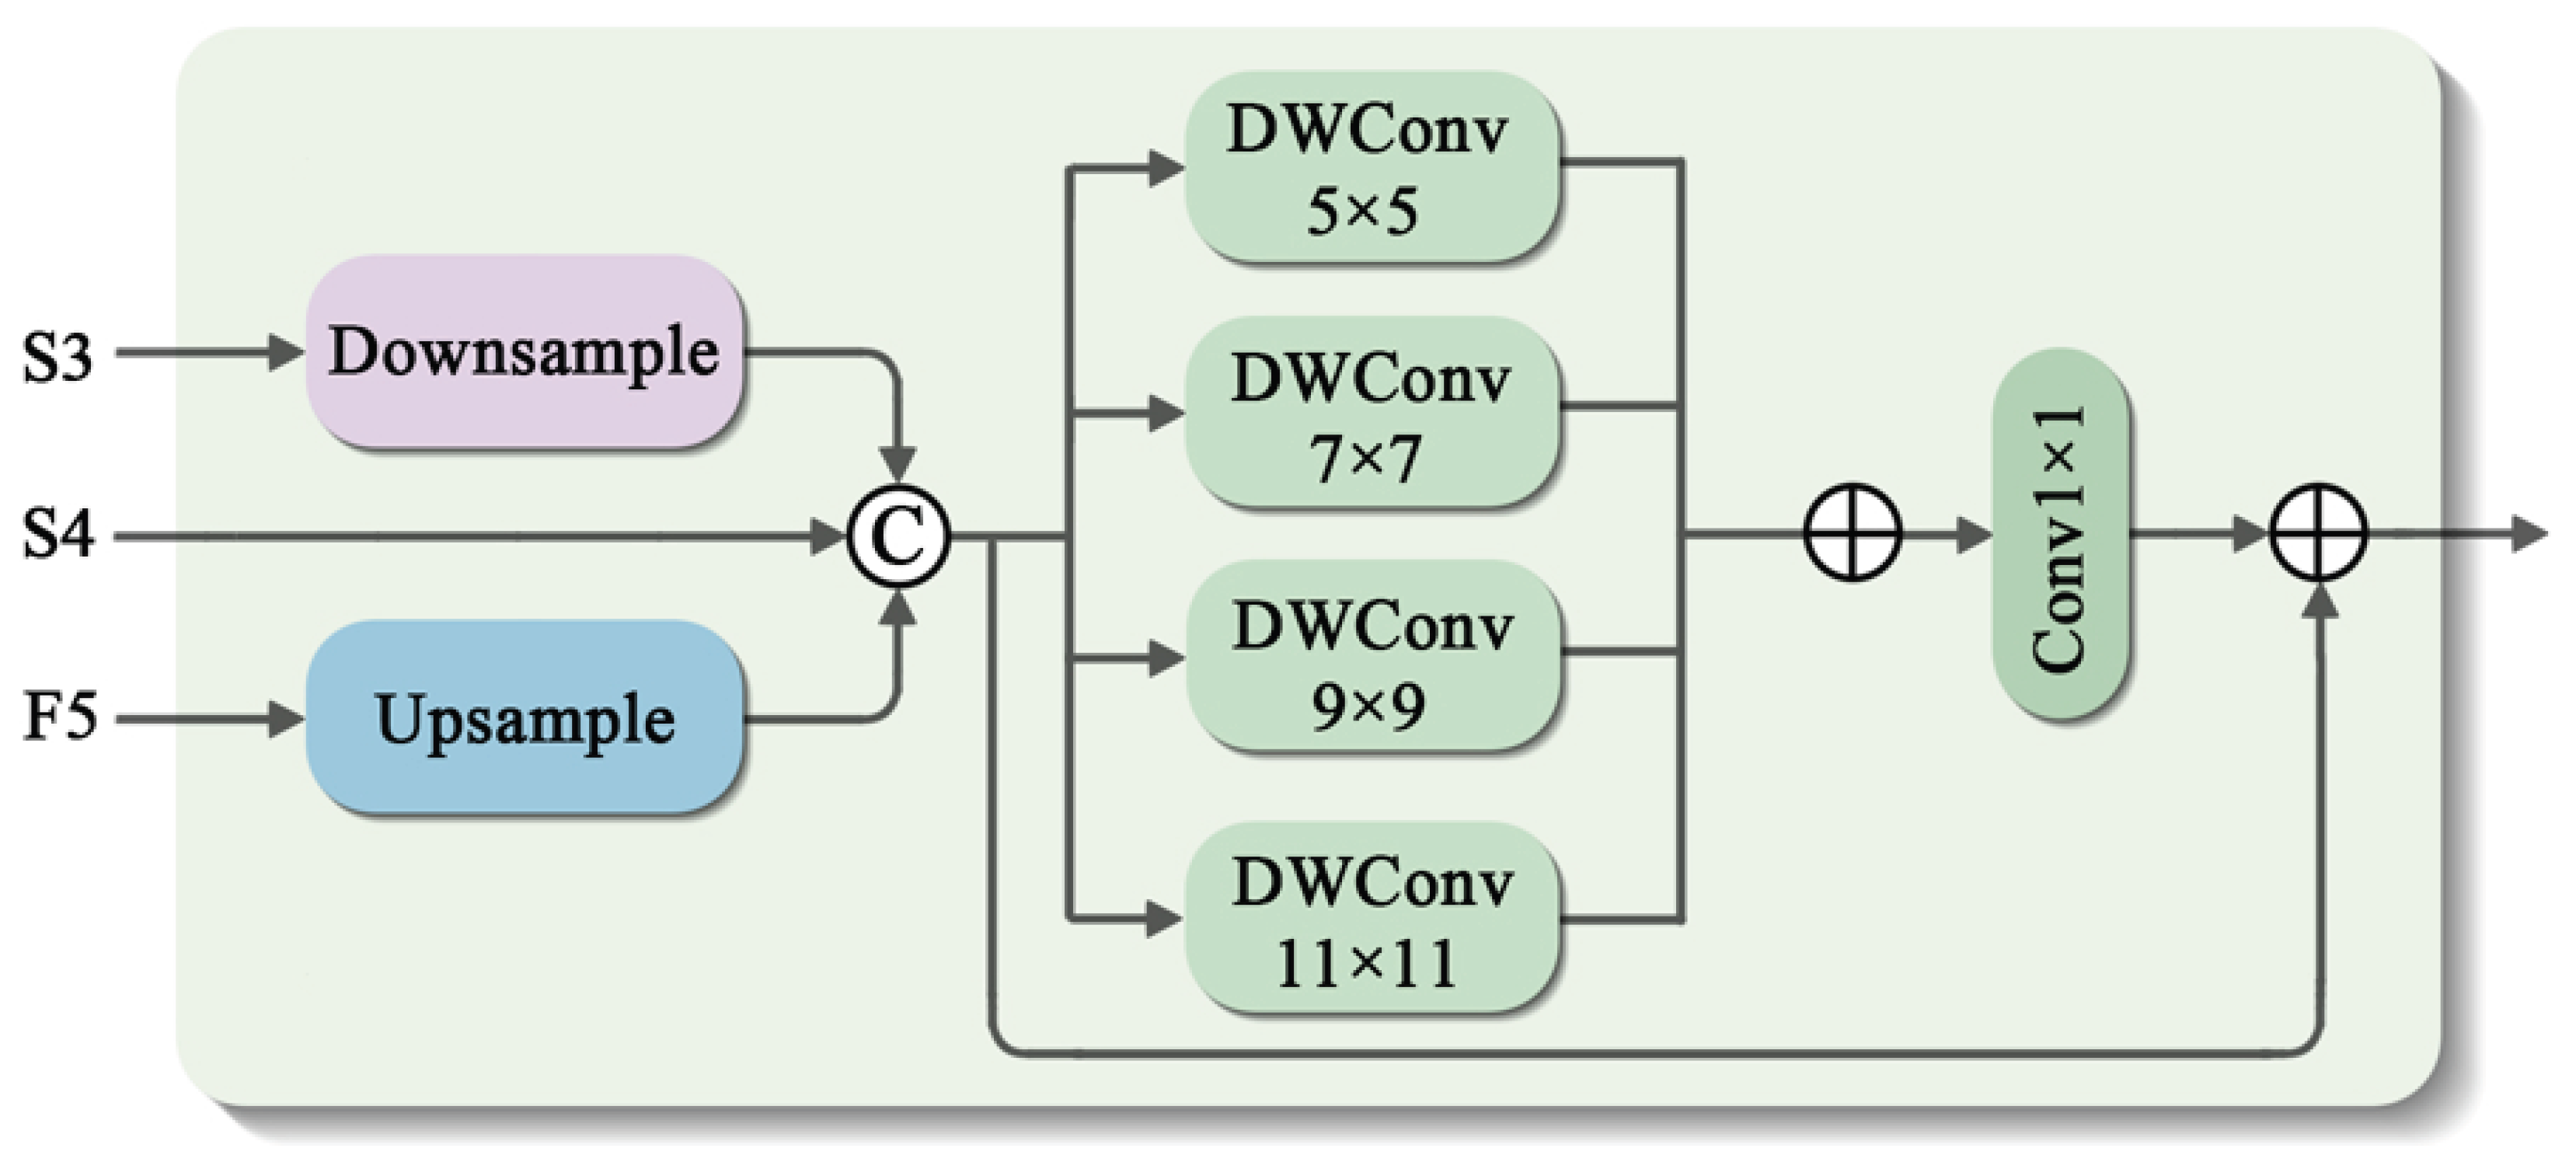
Two Cross-Scale Focus Nodes (CSFNs) are introduced in NICFM as basic feature focusing units to enhance multi-scale feature representations. The proposed CSFN operates on feature maps across scales, enhancing representations through scale alignment and multi-scale focusing while preserving the original structural information.
As illustrated in Figure 7, the upper CSFN receives multi-scale input features, denoted as S 3 , S 4 , and F 5 . These features are first aligned in spatial resolution and concatenated along the channel dimension to obtain a unified cross-scale feature representation:
X = Concat U ( S 3 ) ,   S 4 ,   D ( F 5 ) ,
where U ( · ) and D ( · ) denote the upsampling and downsampling operations, respectively.
Based on the unified cross-scale representation X , CSFN performs multi-scale focusing by employing a set of parallel depthwise separable convolutions with different kernel sizes to capture complementary spatial responses. The overall operation of CSFN can be formulated as
F = Conv 1 k K DWConv k ( X ) + X , K = { 5 , 7 , 9 , 11 } ,
where the multi-scale depthwise convolution branches aggregate responses under different receptive fields, followed by a pointwise convolution Conv 1 ( · ) for feature fusion and focusing. The residual term X preserves the original cross-scale information, allowing CSFN to emphasize feature enhancement rather than feature replacement.
Benefiting from depthwise separable convolutions and lightweight channel fusion, CSFN introduces multi-scale contextual modeling with low computational cost. Such a design enables CSFN to be stacked within NICFM, leading to progressively stronger and more stable feature representations that effectively support non-sequential interaction across scales.

3.4.2. SIB: Scale-Wise Integration Block

After cross-scale feature aggregation and focusing, NICFM introduces a Scale-wise Integration Block (SIB) to further organize and refine feature representations across individual scales.
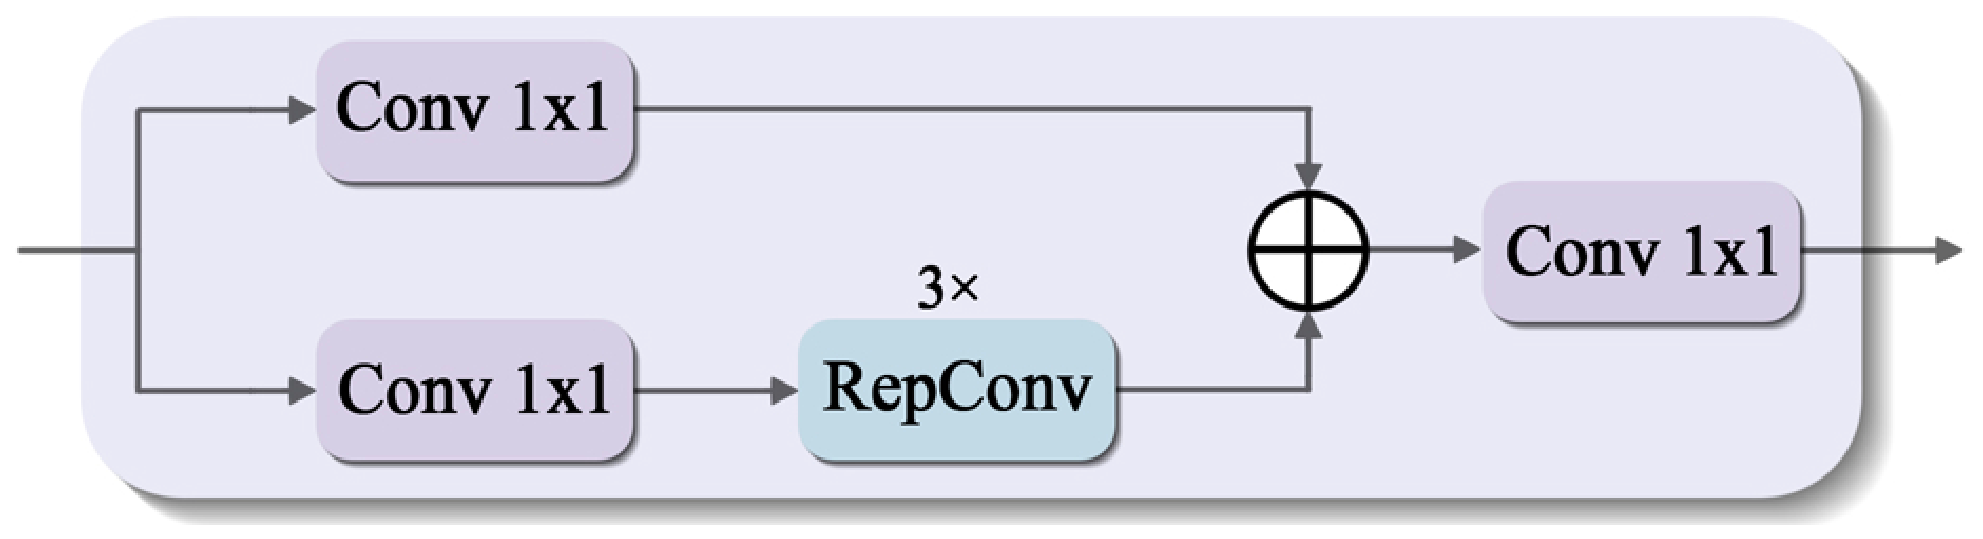
As illustrated in Figure 8, SIB adopts a dual-path architecture for scale-wise feature integration. Both paths employ 1 × 1 convolutions for channel mapping, while one path further incorporates a modeling unit composed of RepConv [57] blocks to enhance feature representation. The two paths are aggregated and subsequently projected via a 1 × 1 convolution, resulting in an integrated scale-wise feature representation.
Through this design, SIB refines cross-scale aggregated features from CSFN in a single-scale manner, resulting in stable and consistent representations for non-sequential cross-scale interaction within NICFM.

3.4.3. Non-Sequential Cross-Scale Interaction Mechanism

In multi-scale feature modeling, existing approaches commonly rely on top-down and bottom-up sequential feature propagation paths, where information exchange across scales is limited by predefined propagation orders. Such sequential designs limit flexible cross-scale interactions in practice, resulting in redundant responses and unstable multi-scale feature representations. To address these issues, a Non-Sequential Cross-Scale Interaction Mechanism is introduced in NICFM, aiming to strengthen cross-scale collaborative modeling.
Specifically, NICFM performs cross-scale interaction by organizing scale-aligned multi-scale features into a unified interaction stage. As illustrated in Figure 2, the non-sequential interaction mechanism is realized through the bidirectional cross-scale connections among CSFN and SIB nodes, where multi-scale features are directly exchanged across different semantic levels rather than propagated along a fixed top-down or bottom-up path. In this design, CSFN and SIB mainly serve as supporting components that provide scale-aligned and integrated feature representations, enabling non-sequential interaction across scales. Within a non-sequential interaction stage, feature representations from different scales are allowed to directly exchange information without following a fixed propagation sequence. Through this mechanism, cross-scale dependencies are established via flexible interactions, allowing multi-scale features to communicate at the same semantic level rather than through hierarchical message passing.
Through this design, information from different scales is coordinated in a more balanced way, reducing redundant information accumulation caused by unidirectional propagation. Consequently, NICFM produces multi-scale feature representations with improved cross-scale consistency and coherent structural distributions, serving as reliable feature representations for multi-scale modeling in the overall network.

4. Results

In this section, we present the experimental results of the proposed MDIS-DETR. Experiments are conducted on three benchmarks, including SARDet-100K [7], SAR-AIRcraft-1.0 [8], and HRSID [58].
We first introduce the datasets and implementation settings. Subsequently, ablation studies are conducted to evaluate the effectiveness of the proposed multi-domain interference-suppression strategies from spatial, frequency, and structural perspectives. Comparisons with state-of-the-art (SOTA) detectors on three SAR benchmarks are then presented, followed by visual analyses of false alarms and missed detections to further demonstrate the robustness of the proposed method.
Considering the characteristics of object detection tasks, standard COCO-style evaluation metrics are adopted in this study. The computation methods for these metrics are as follows:
P r e c i s i o n = T P T P + F P ,
R e c a l l = T P T P + F N ,
A P = 0 1 P ( R )   d R ,
m A P = 1 N i = 1 N A P i ,
F P S = S T ,
where T P , F P , and F N denote the numbers of true positives, false positives, and false negatives, respectively. A P represents the area under the precision–recall ( P R ) curve, while m A P is calculated by averaging the A P values across all object categories. In addition, F P S evaluates the inference efficiency of the detector, where S denotes the number of processed samples and T represents the total inference time.

4.1. Datasets

SARDet-100K: SARDet-100K is the first COCO-level large-scale benchmark for SAR object detection, consisting of 116,598 images and 245,653 instances from six object categories, including aircraft, ship, car, bridge, tank, and harbor. It contains 94,493 images for training, 10,492 for validation, and 11,613 for testing, with corresponding instance counts of 198,747, 22,703, and 24,023.
SAR-AIRcraft-1.0: SAR-AIRcraft-1.0 is a SAR dataset for fine-grained aircraft detection, containing 4368 images and 16,463 aircraft instances from seven aircraft categories, including A220, A320/321, A330, ARJ21, Boeing737, Boeing787, and others.
HRSID: HRSID is a high-resolution SAR dataset introduced for ship detection, comprising 5604 images and 16,951 ship instances, and following the official benchmark split with a 6.5:3.5 train–test ratio at the image level.
The satellite and sensor information is summarized in Table 2. Representative samples of the adopted datasets are shown in Figure 9.

4.2. Implementation Details

The proposed method is implemented using the PyTorch 2.2.2 framework and trained on a single NVIDIA GeForce RTX 4090 GPU (Nvidia Corporation, Santa Clara, CA, USA). For all experiments, we adopt ResNet-18 as the backbone network to balance efficiency and representation capacity. The backbone network is trained from scratch without using pretrained weights. Input images are resized to a fixed resolution of 640 × 640 , and no explicit data augmentation techniques are applied during training. During training, the batch size is set to 16 for all datasets, and the AdamW optimizer is employed with an initial learning rate of 0.001.
The training schedule varies across datasets to account for their different scales and complexities. Specifically, models are trained for 150 epochs on SARDet-100K, 200 epochs on SAR-AIRcraft-1.0, and 500 epochs on HRSID, respectively. Unless otherwise specified, all remaining hyperparameters follow the default settings of the RT-DETR framework.

4.3. Ablation Study

To systematically evaluate the effectiveness and generalisation capability of the proposed multi-domain interference-suppression strategy, a series of ablation experiments are conducted on three representative SAR detection datasets, including SARDet-100K, SAR-AIRcraft-1.0, and HRSID. The corresponding experimental results are summarized in Table 3, Table 4 and Table 5.
As shown in Table 3, Table 4 and Table 5, the original RT-DETR network is adopted as the baseline model in our ablation study. Based on this baseline, the proposed spatial-domain, frequency-domain, and structural-domain interference-suppression strategies are progressively introduced into the network with different combinations to evaluate their individual and joint contributions to detection performance. For all experiments, identical training settings are adopted to ensure a fair comparison.
From the experimental results on all three datasets, it can be observed that each single-domain suppression strategy consistently improves detection performance over the baseline model. Specifically, on the SARDet-100K dataset, the spatial-domain, frequency-domain, and structural-domain strategies improve the mAP by 1.97%, 2.01%, and 3.08%, respectively. Similarly, on the SAR-AIRcraft-1.0 dataset, the corresponding improvements reach 3.75%, 3.62%, and 4.90%, while on the HRSID dataset, the improvements are 1.37%, 1.30%, and 2.71%, respectively. Meanwhile, these improvements consistently extend to AP50, AP75, and multi-scale detection metrics, indicating that the proposed strategies effectively suppress complex interference in SAR images from different perspectives.
When all three domain suppression strategies are jointly employed, the model achieves the best overall performance across all evaluation metrics on all three datasets. Specifically, the proposed complete model achieves mAP values of 58.82%, 60.92%, and 70.14% on the SARDet-100K, SAR-AIRcraft-1.0, and HRSID datasets, corresponding to improvements of 4.58%, 6.36%, and 4.43% over the baseline model, respectively. These results further validate the effectiveness and generalization capability of the proposed multi-domain interference-suppression framework for SAR object detection.
In addition, although the complete model introduces moderate increases in FLOPs and parameter size compared with the baseline model, it maintains competitive inference efficiency while achieving substantially improved detection performance. The FPS results further demonstrate that the proposed method preserves favorable real-time detection capability under practical deployment conditions.
Next, the contribution of each strategy will be analyzed in detail.

4.3.1. Effect of Spatial-Domain Interference Suppression

As shown in Table 3, Table 4 and Table 5, introducing the proposed spatial-domain interference suppression strategy consistently improves the detection performance across all three SAR datasets. Specifically, compared with the baseline RT-DETR, the spatial-domain suppression strategy achieves mAP improvements of 1.97%, 3.75%, and 1.37% on SARDet-100K, SAR-AIRcraft-1.0, and HRSID, respectively. Similar improvements can also be observed in AP50, AP75, and multi-scale detection metrics, indicating that the proposed strategy provides stable benefits under different SAR imaging conditions and object distributions.
In SAR images, spatial-domain interference typically appears as local intensity fluctuations caused by speckle noise, which tend to obscure weak objects and degrade the representation of object boundaries. Such interference not only affects background homogeneity but also weakens local structural continuity, thereby reducing the separability between targets and clutter regions. In this context, we further analyze the effect of the proposed spatial-domain interference suppression strategy on noise suppression and object structure preservation.
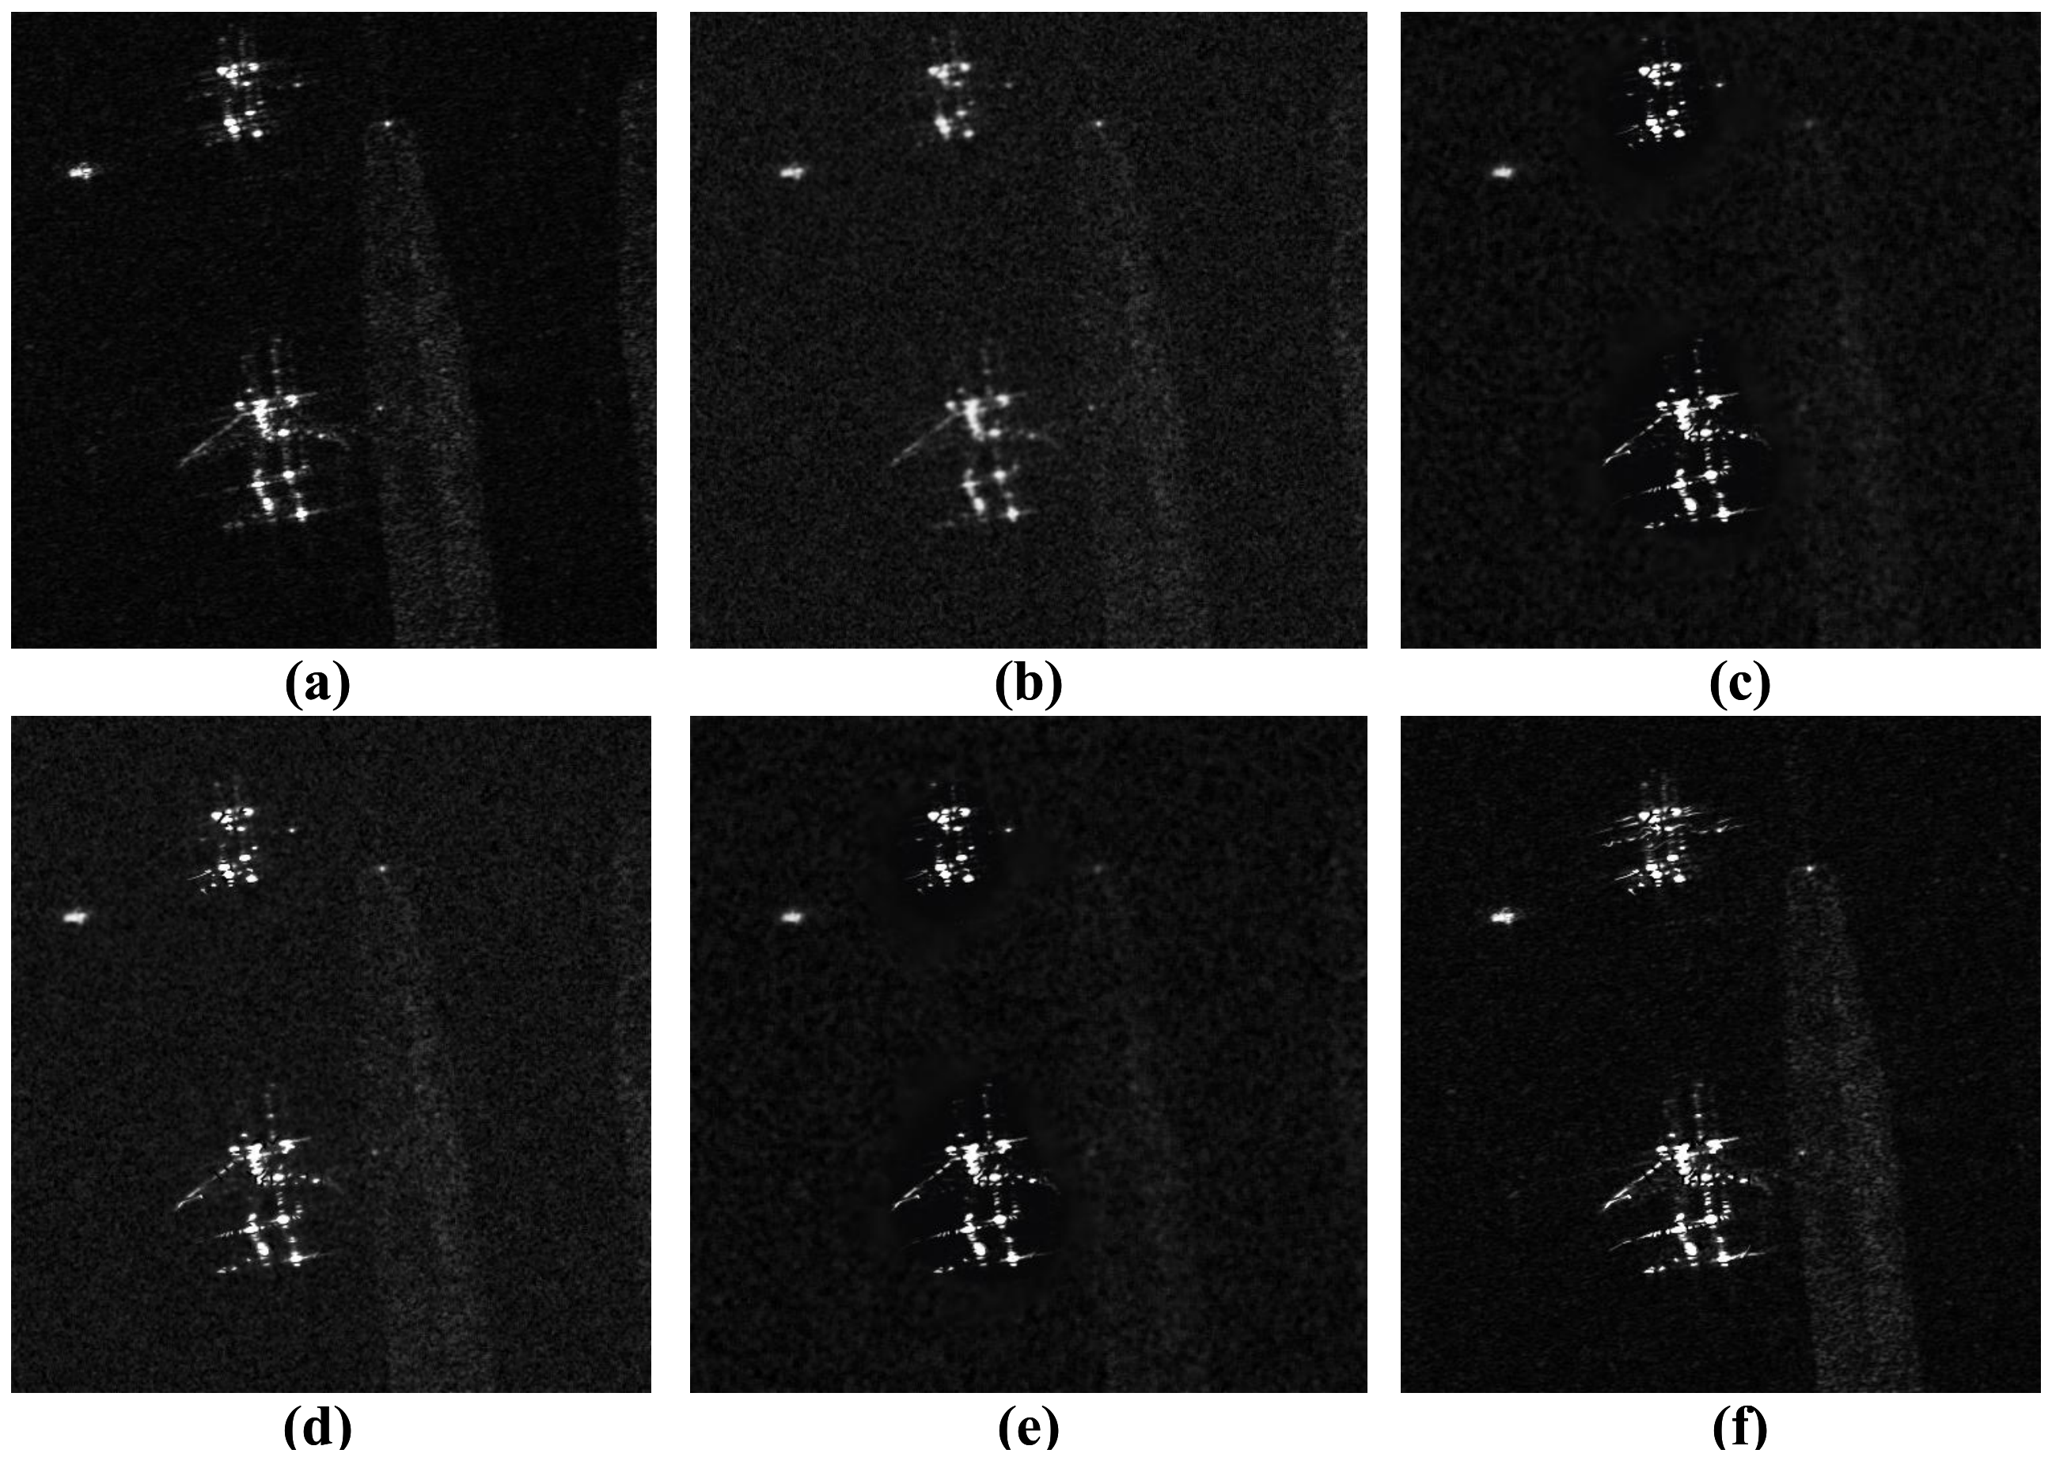
Figure 10 presents visual comparisons of different processing results to illustrate the effect of the proposed spatial-domain suppression strategy. As shown in Figure 10a, the original SAR image exhibits pronounced speckle noise in background regions, where the edges and structural details of weak objects are easily masked by interference.
Figure 10b,c show the results of Gaussian and bilateral filtering, respectively. Gaussian filtering effectively suppresses high-frequency speckle noise and produces smoother background distributions, but it also blurs object boundaries and weakens fine structural details. In contrast, bilateral filtering preserves object edges and local structures more effectively due to its edge-aware property, although residual speckle noise remains in several background regions. These observations indicate that the two filtering schemes exhibit complementary characteristics in balancing noise suppression and structural preservation.
To exploit this complementarity, the proposed LSFDM employs a learnable fusion mechanism to adaptively integrate the responses from the Gaussian and bilateral filtering branches. This design enables the network to dynamically adjust the contribution of different spatial-domain representations under various interference conditions. As shown in Figure 10d–f, the fused spatial-domain representations achieve a more balanced trade-off between background denoising and structural preservation, with substantially reduced speckle interference while maintaining and even enhancing object contours and shape structures. Consequently, the distinction between objects and background clutter becomes more pronounced, which facilitates more reliable downstream feature extraction and object localization.
To further investigate the contribution of internal components in the proposed LSFDM, intra-module ablation experiments are conducted on the SARDet-100K dataset, with the results summarized in Table 6. Specifically, the residual connection and learnable fusion mechanism are separately evaluated. When only the learnable fusion mechanism is employed, the model achieves an mAP of 54.25%. Introducing the residual connection further improves the mAP to 55.87%, indicating that residual information propagation helps preserve useful spatial details during feature refinement. When both components are jointly employed, the model achieves the best performance with an mAP of 56.21%, together with improvements in AP50, AP75, and multi-scale detection metrics. These results demonstrate that the residual connection and learnable fusion mechanism play complementary roles in enhancing spatial-domain representation learning for SAR object detection.

4.3.2. Effect of Frequency-Domain Interference Suppression

As shown in Table 3, Table 4 and Table 5, introducing the proposed frequency-domain interference suppression strategy consistently improves detection performance across all three SAR datasets. Specifically, compared with the baseline RT-DETR, the frequency-domain suppression strategy achieves mAP improvements of 2.01%, 3.62%, and 1.30% on SARDet-100K, SAR-AIRcraft-1.0, and HRSID, respectively. Meanwhile, consistent gains can also be observed in AP50, AP75, and multi-scale detection metrics, demonstrating that the proposed strategy effectively enhances feature robustness under different SAR imaging conditions and target distributions.
In SAR object detection, frequency-domain interference challenges the stability and discriminability of feature representations. Due to the coherent imaging mechanism of SAR systems, speckle noise in the frequency domain typically exhibits multiplicative behavior and regional aggregation characteristics. These unstable frequency responses are easily amplified during Transformer-based feature encoding, resulting in regional response imbalance and degraded object-background separability. Therefore, suppressing frequency-domain interference is important for improving the reliability of high-level semantic representation learning.
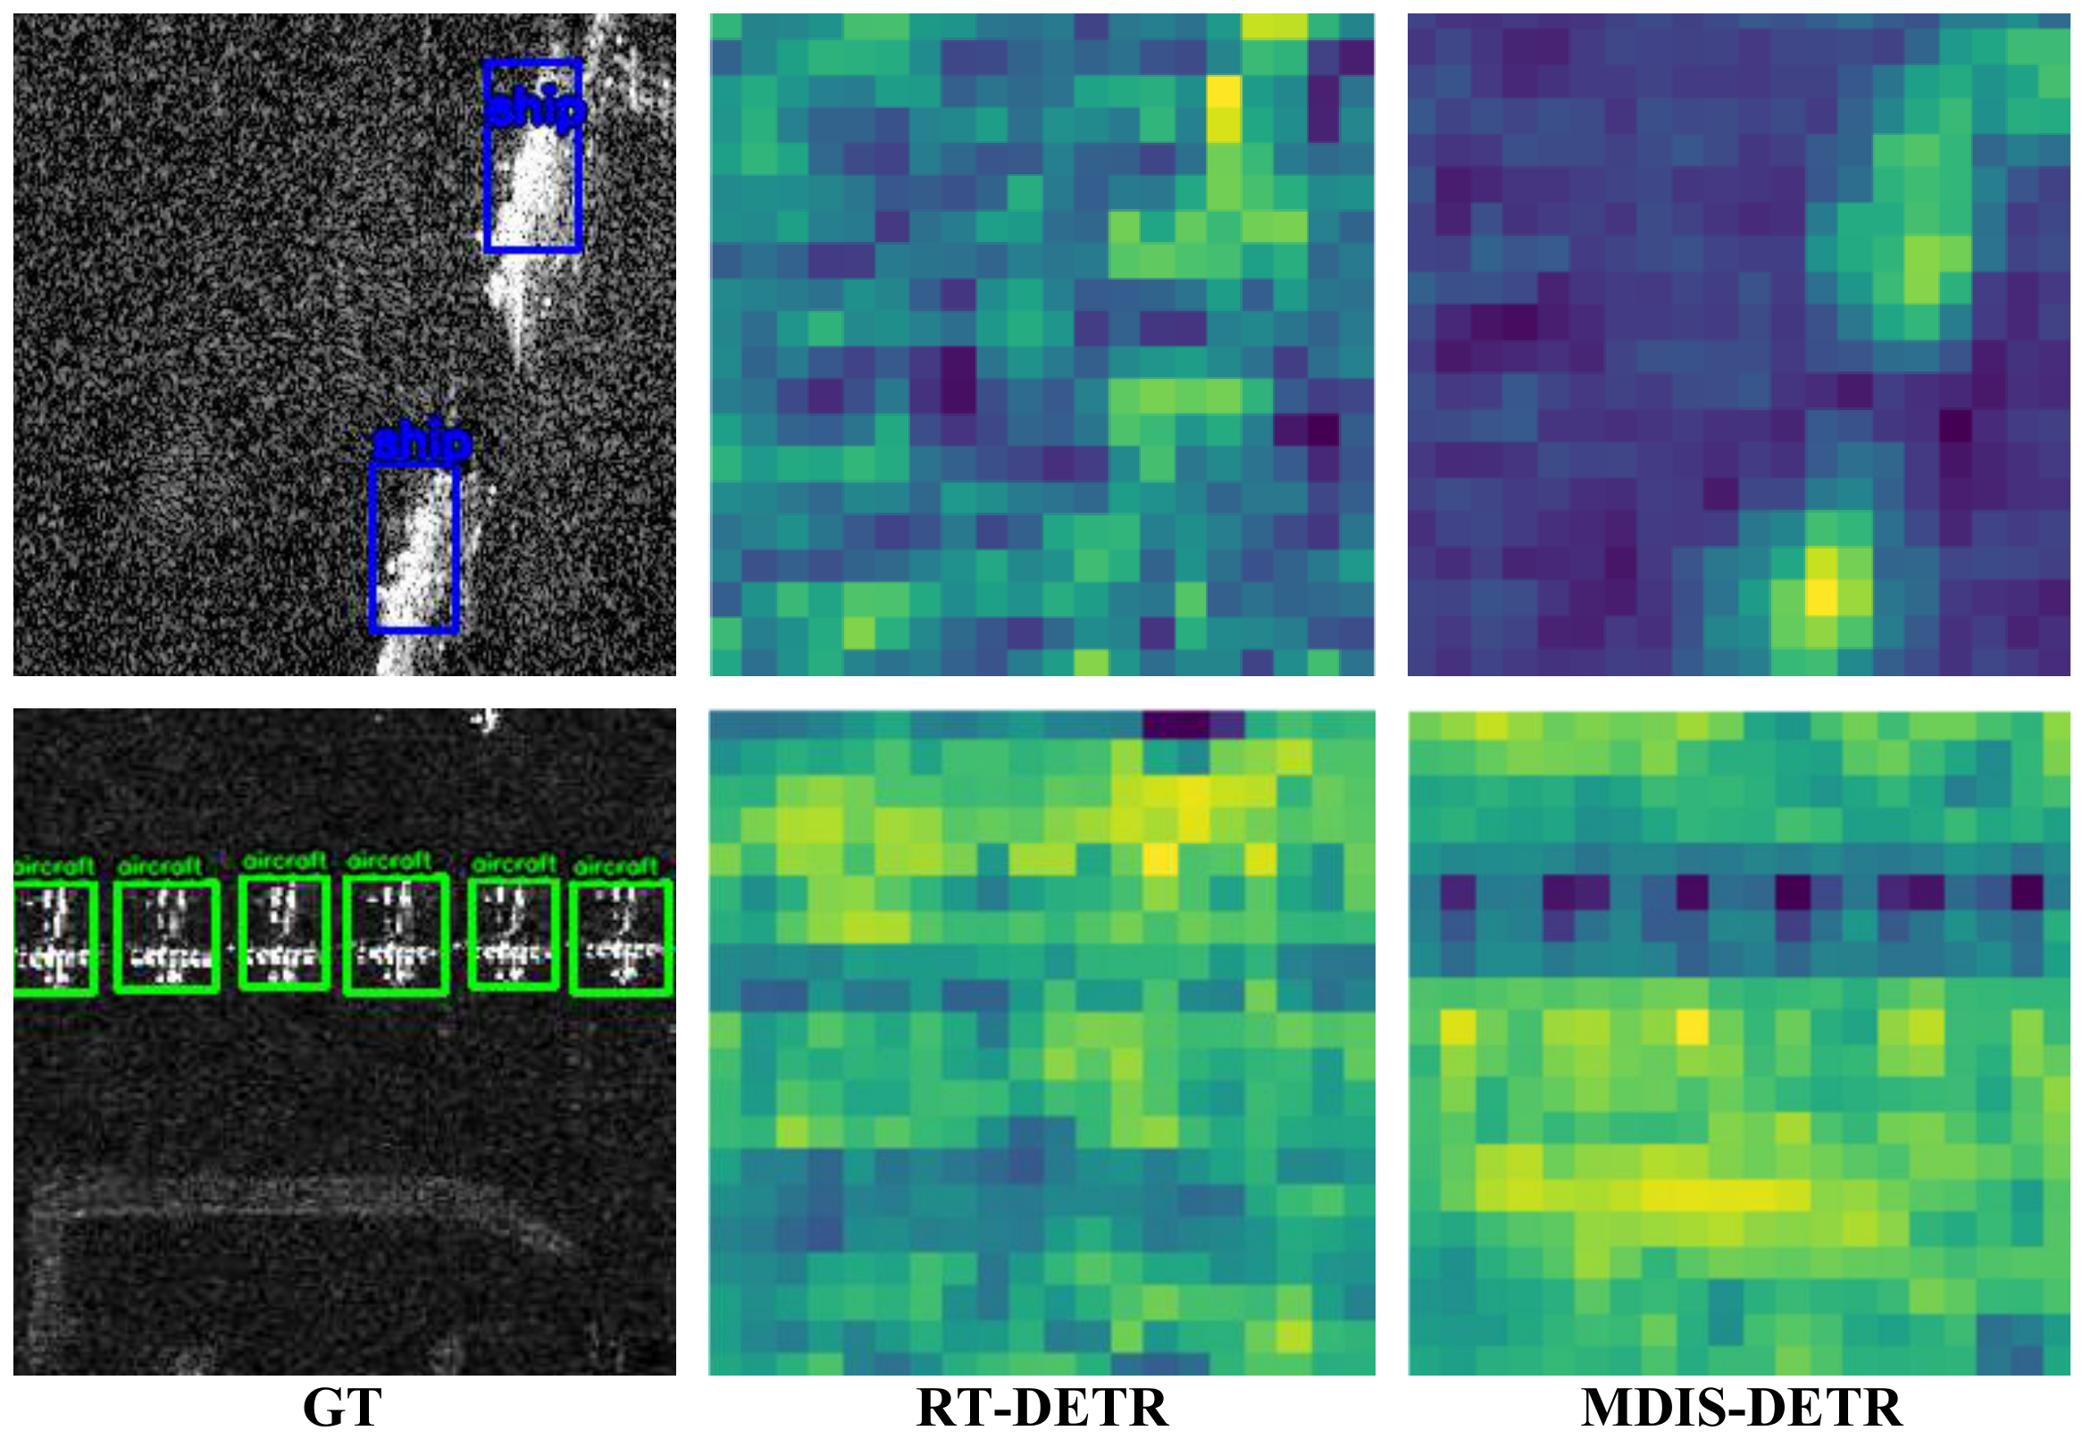
To visually analyze the effect of the proposed frequency-domain interference suppression strategy, Figure 11 presents comparisons between the feature-response maps generated by the baseline RT-DETR and those produced by the proposed MDIS-DETR after the AIFI module. The left column shows the corresponding ground-truth SAR targets, while the middle and right columns illustrate the feature-response maps generated by RT-DETR and MDIS-DETR, respectively.
As shown in the first row of Figure 11, the baseline RT-DETR exhibits relatively scattered and unbalanced feature activations in the surrounding background regions, while the responses corresponding to ship targets remain less distinguishable from clutter interference. After introducing the proposed frequency-domain suppression strategy, MDIS-DETR produces more concentrated and structurally consistent target responses, with substantially suppressed background interference and clearer separation between ship targets and surrounding clutter.
A similar phenomenon can also be observed in the second row of Figure 11. For densely distributed aircraft targets, the baseline RT-DETR generates relatively diffuse regional activations, where target responses are partially mixed with surrounding noisy regions. In contrast, the feature responses generated by MDIS-DETR become more compact and spatially discriminative, with the target-related regions being more clearly highlighted while irrelevant background activations are effectively suppressed. These observations indicate that the proposed strategy improves the stability and discriminability of frequency-domain feature representations under complex SAR interference conditions.
To further investigate the contribution of internal components in the proposed PAFDM, intra-module ablation experiments are conducted on the SARDet-100K dataset, with the results summarized in Table 7. Specifically, the MS-PLA and AFDFN components are separately evaluated. When only the MS-PLA module is introduced, the model achieves an mAP of 55.18%, indicating that multi-scale positional local attention helps alleviate regional response imbalance during frequency-domain modeling. When only the AFDFN module is employed, the mAP further increases to 55.73%, demonstrating that adaptive frequency-domain feature decomposition contributes to more stable feature representation learning. When both components are jointly employed, the model achieves the best performance with an mAP of 56.25%, together with improvements in AP50, AP75, and multi-scale detection metrics. These results demonstrate that MS-PLA and AFDFN play complementary roles in enhancing frequency-domain representation learning for SAR object detection.

4.3.3. Effect of Structural-Domain Interference Suppression

As shown in Table 3, Table 4 and Table 5, the proposed structural-domain interference suppression strategy consistently improves the detection performance across all three SAR datasets. Specifically, compared with the baseline RT-DETR, introducing the structural-domain suppression strategy individually achieves mAP improvements of 3.08%, 4.90%, and 2.71% on SARDet-100K, SAR-AIRcraft-1.0, and HRSID, respectively, which are the most significant gains among the three individual suppression strategies. Meanwhile, consistent improvements can also be observed in AP50, AP75, and multi-scale detection metrics, indicating that the proposed strategy effectively enhances the stability and consistency of multi-scale feature representation learning under complex SAR scenes.
In SAR object detection, structural-domain interference is mainly caused by the organization and interaction manner of multi-scale features within the network architecture. Due to the large variation in target scales, clutter distributions, and background complexity in SAR images, feature propagation across different scales often exhibits inconsistent structural responses. Without effective cross-scale coordination, sequential feature fusion may gradually amplify unstable responses during information propagation, thereby leading to false alarms in clutter regions and missed detections of weak or small-scale targets.
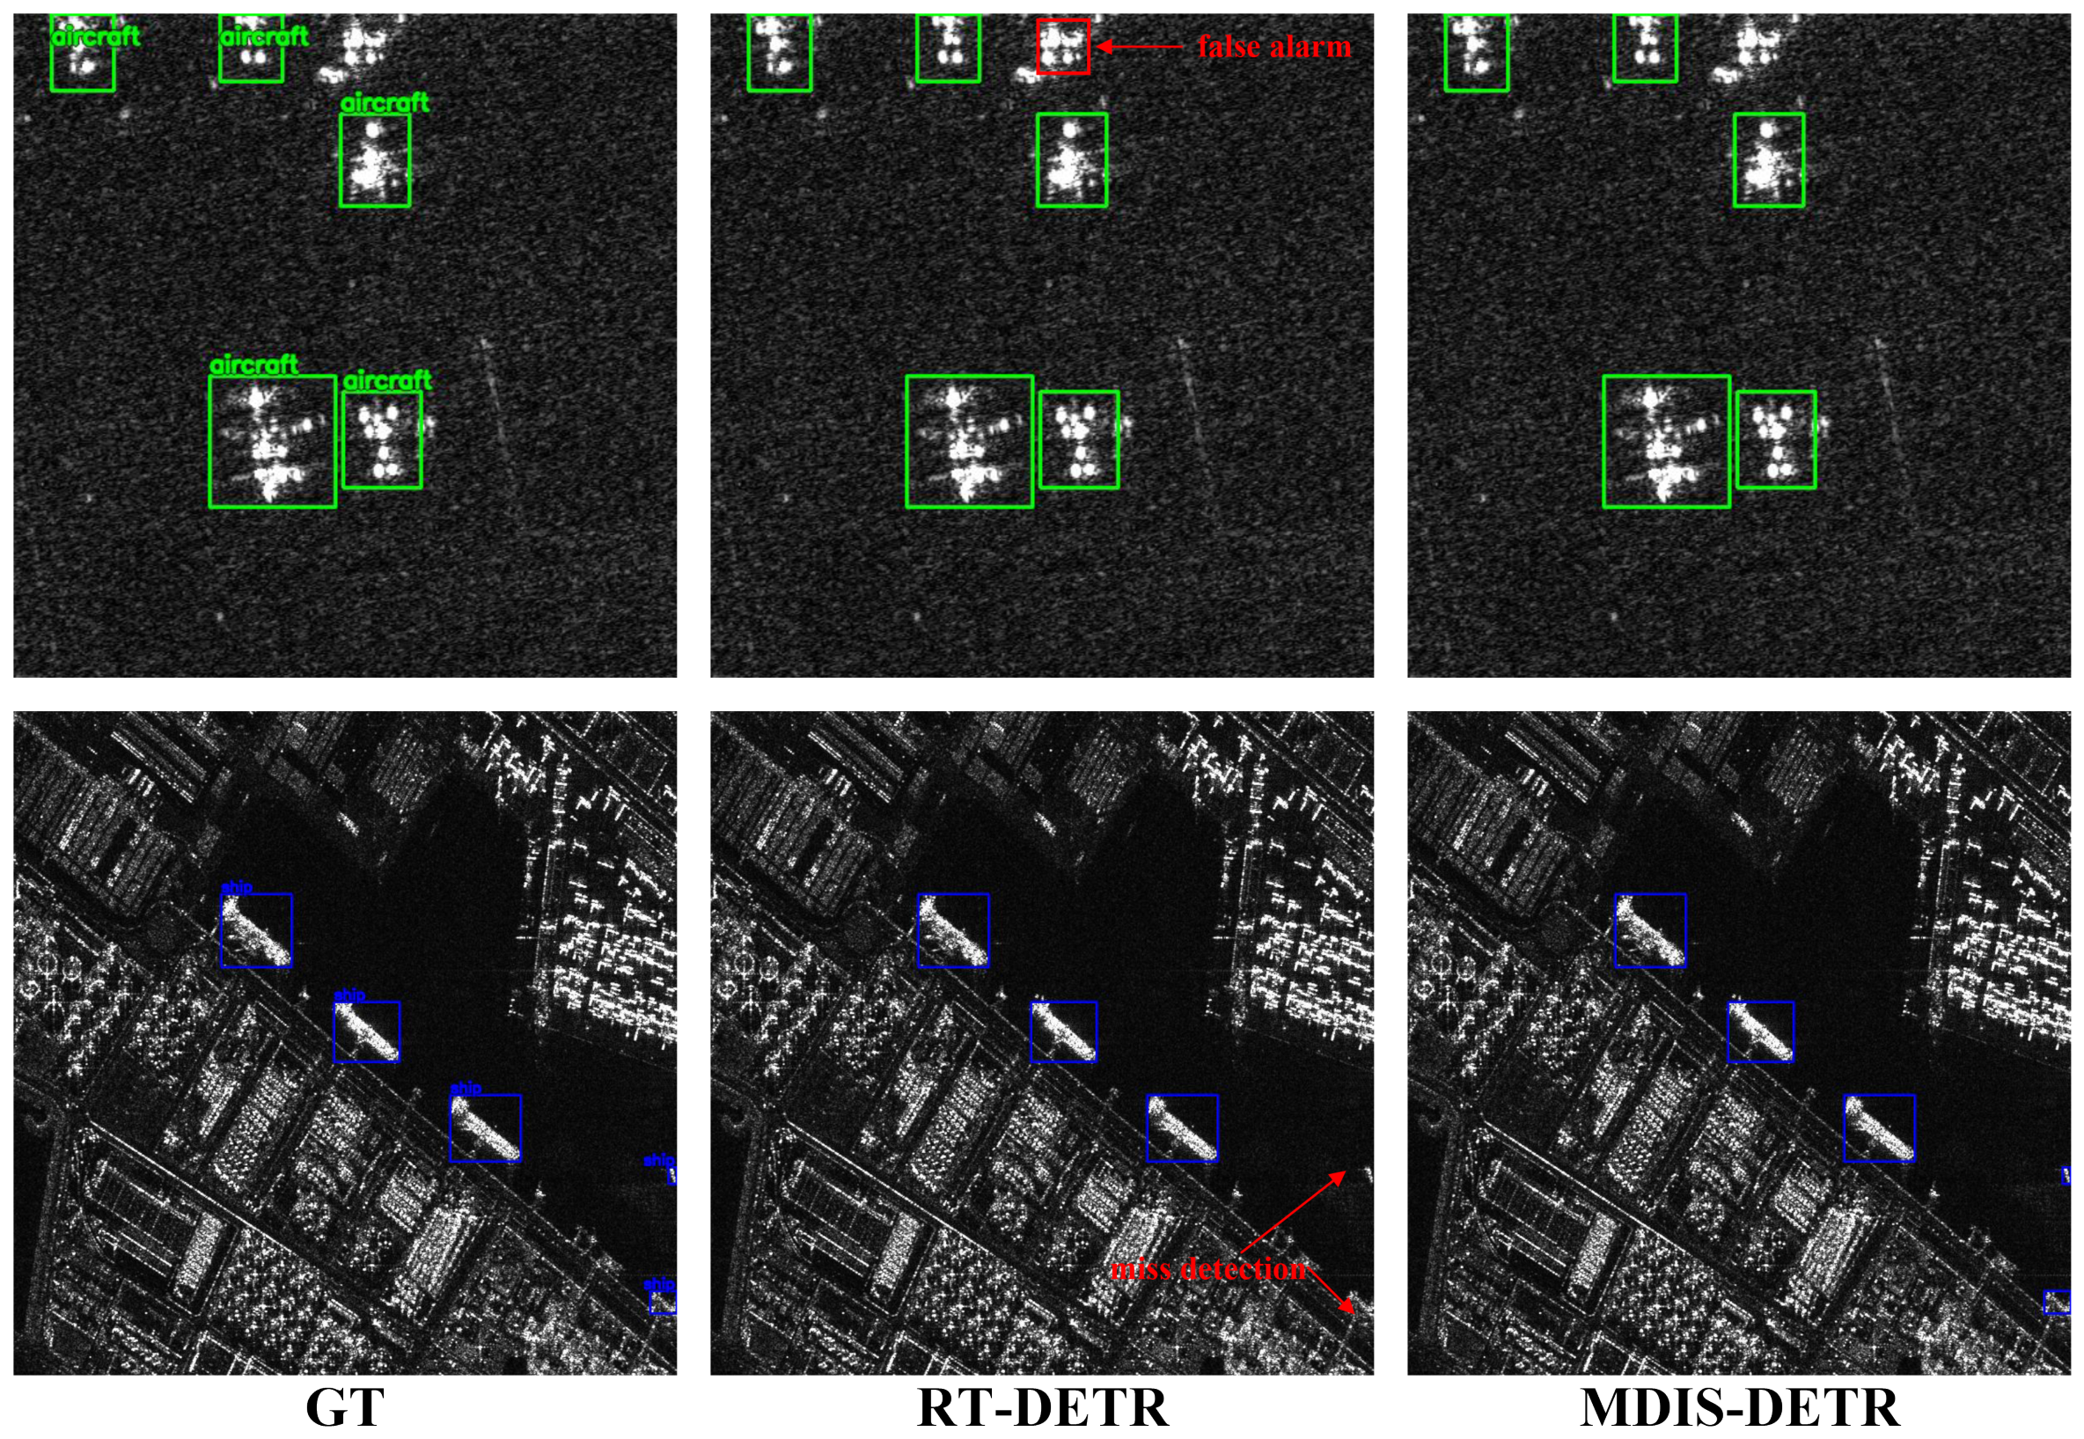
To visually analyze the effect of the proposed structural-domain interference suppression strategy, Figure 12 presents comparisons between the detection results produced by the baseline RT-DETR and those generated by the proposed MDIS-DETR. The left column shows the corresponding ground-truth annotations, while the middle and right columns present the detection results of RT-DETR and MDIS-DETR, respectively.
As shown in the first row of Figure 12, the baseline RT-DETR produces a false alarm in the background region when detecting multiple aircraft targets, indicating that unstable structural responses generated during multi-scale feature fusion may interfere with target discrimination. After introducing the proposed structural-domain suppression strategy, MDIS-DETR effectively suppresses the irrelevant structural responses in clutter regions while maintaining accurate target localization, thereby reducing false alarms and improving the structural consistency of detection results.
A similar phenomenon can also be observed in the second row of Figure 12. In a complex SAR scene, the baseline RT-DETR suffers from missed detections for several ship targets. By contrast, MDIS-DETR produces more stable cross-scale structural responses and successfully detects the previously missed targets while maintaining accurate localization for existing detections. These observations indicate that the proposed strategy improves the reliability of multi-scale feature interaction and enhances the robustness of SAR object detection in structurally complex scenes.
Overall, the above experimental and visualization results demonstrate that optimizing the organization and interaction of multi-scale features at the network-structure level effectively suppresses structural-domain interference and contributes to more stable and discriminative SAR object representations.

4.4. Comparison with SOTAs

We compare the proposed method with 30 representative SOTA detectors on three benchmarks: SARDet-100K, SAR-AIRcraft-1.0, and HRSID. This section reports detection results and visualizations for comparison.

4.4.1. Detection Results on Three SAR Datasets

Results on SARDet-100K: SARDet-100K is currently the largest and most challenging public SAR object detection benchmark, which places high demands on model robustness and stability. Table 8 reports the comparison results between the proposed MDIS-DETR and 30 representative SOTA detectors on this dataset.
As shown in Table 8, the proposed method achieves the best performance on the main evaluation metrics, obtaining an mAP of 58.82% and outperforming the second-best method (DenoDet V2) by 2.15%. The method also maintains strong performance at higher IoU thresholds, achieving AP@50 and AP@75 scores of 89.31% and 63.68%, respectively.
Moreover, the proposed method shows strong robustness to object scale variations, particularly on small targets, with an APS of 53.43%. Category-wise results further show stable performance across representative classes, indicating that the performance gain is not driven by isolated categories. Notably, these performance improvements are achieved while maintaining competitive FLOPs, parameter size, and a real-time inference speed of 150.17 FPS, demonstrating a favorable balance between detection accuracy, computational complexity, and inference efficiency without relying on excessive model complexity.
Results on SAR-AIRcraft-1.0: Table 9 reports the performance comparison on the SAR-AIRcraft-1.0 dataset. The proposed MDIS-DETR ranks first among the 30 evaluated detectors, achieving an mAP of 60.92%. Beyond the overall accuracy, stable performance across different IoU thresholds and aircraft categories indicates reliable discrimination among visually similar aircraft targets. This result highlights the effectiveness of the proposed method for fine-grained aircraft detection in practical SAR applications.
Results on HRSID: Table 10 summarizes the comparison results on the HRSID dataset. The proposed MDIS-DETR achieves the best overall performance among all compared methods, obtaining an mAP of 70.14%, together with AP@50 and AP@75 scores of 92.23% and 79.73%, respectively.
In particular, the proposed method performs notably well in small-object detection, achieving an APS of 69.05%, which demonstrates its effectiveness for challenging maritime SAR scenarios containing densely distributed small-scale ship targets.
Despite the improved detection accuracy, the proposed method still maintains a real-time inference speed of 149.42 FPS with reasonable computational complexity, indicating a favorable trade-off between detection performance and efficiency.

4.4.2. Detection Result Visualization

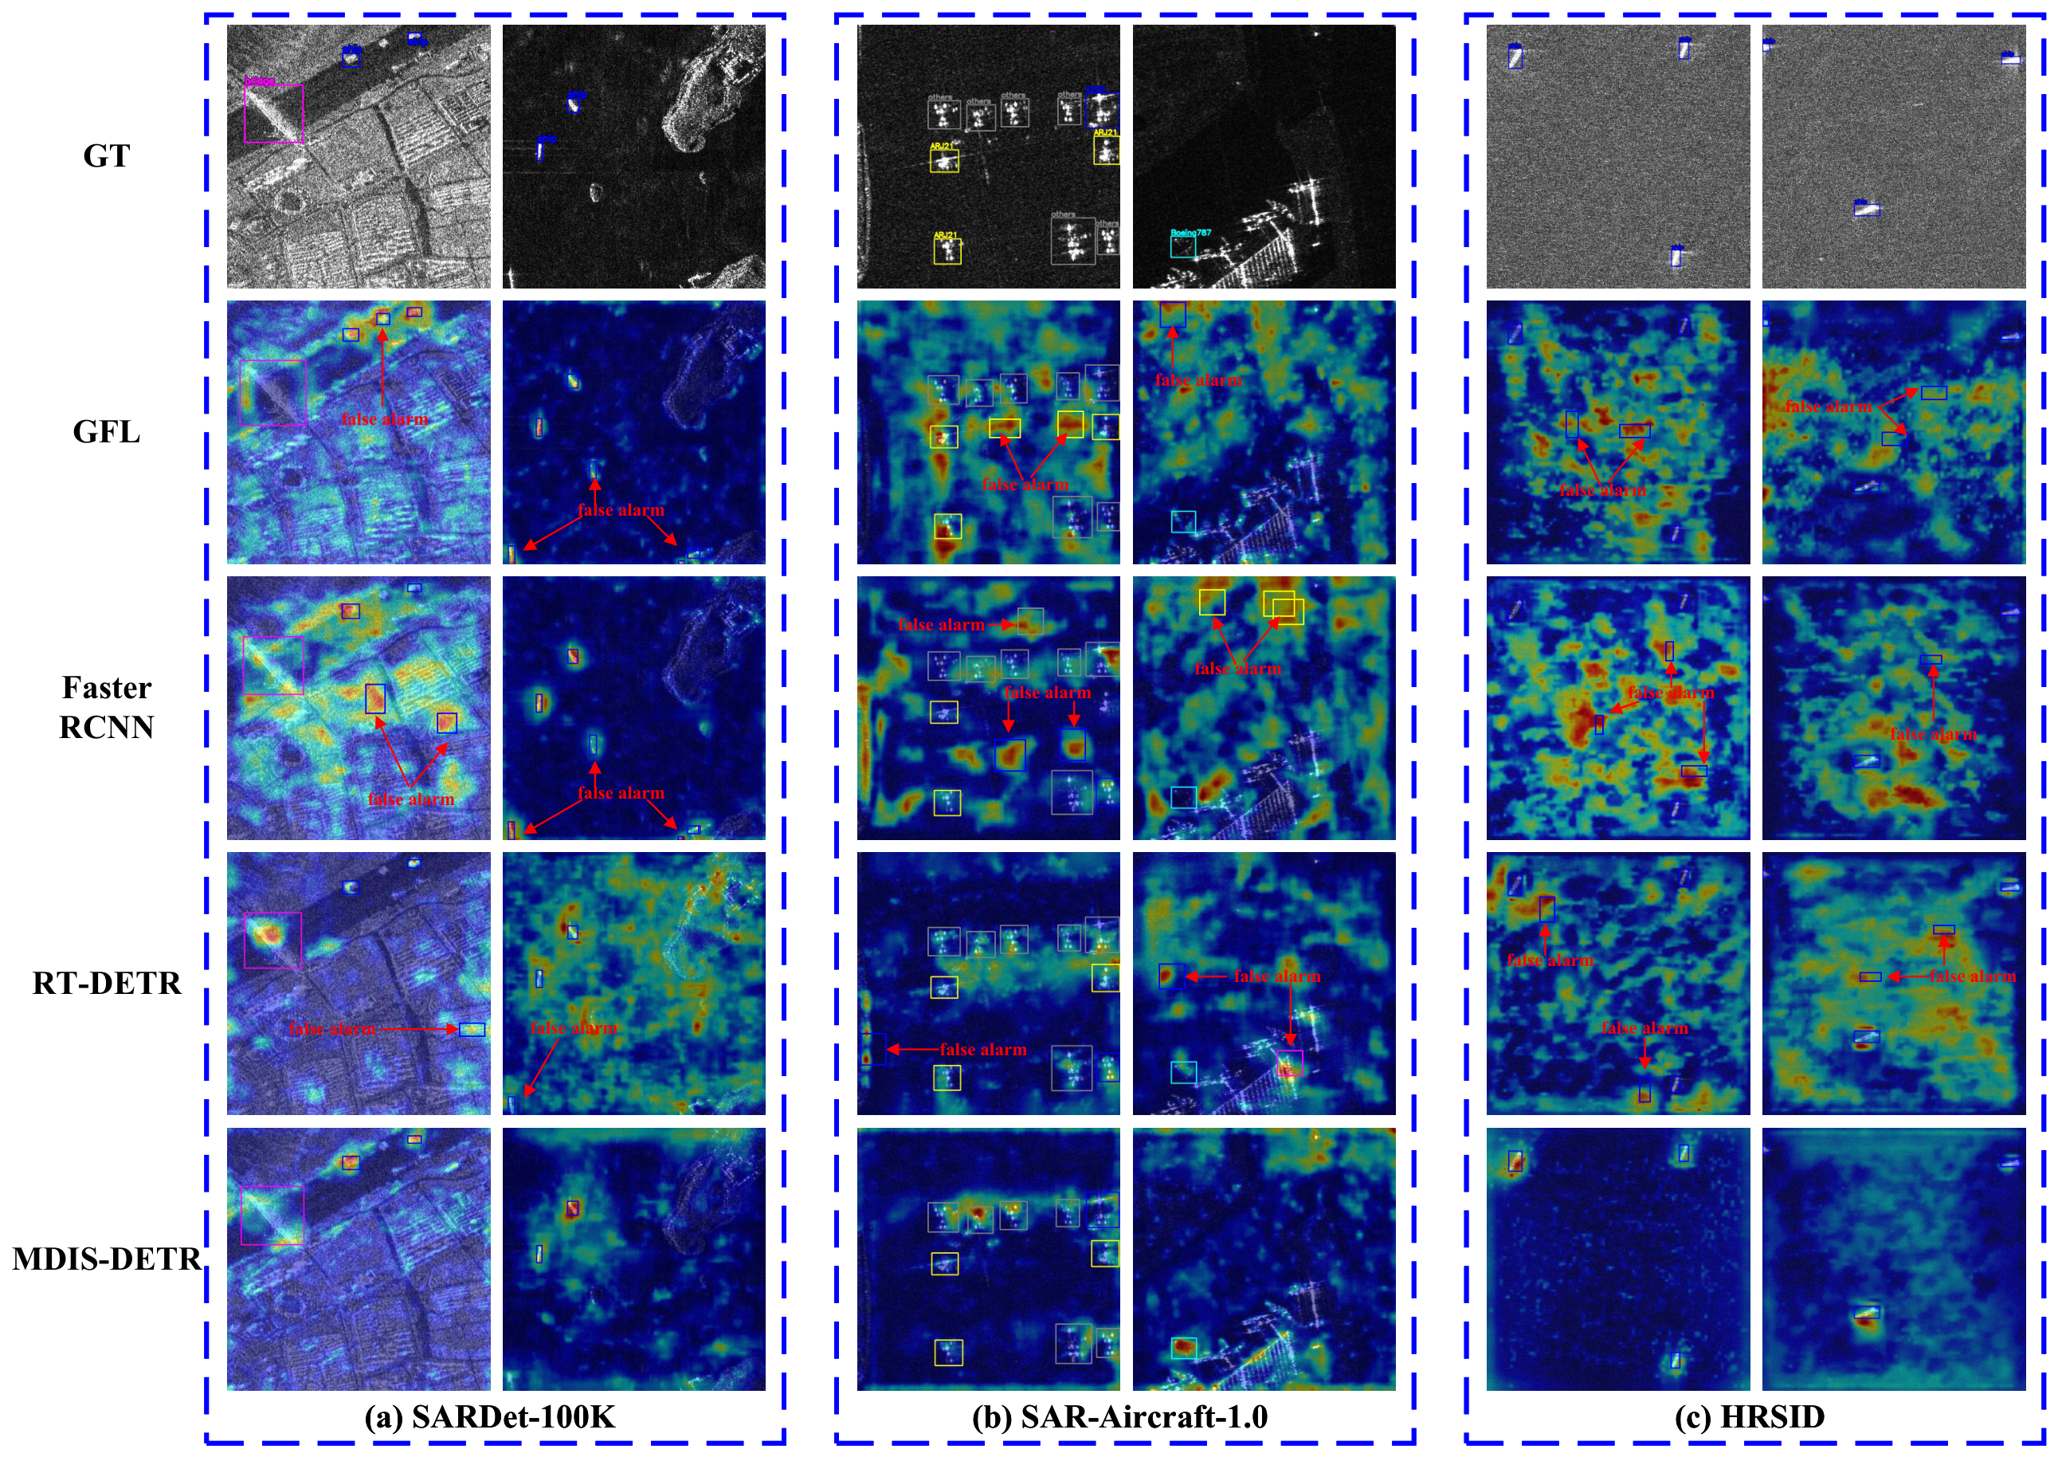
Visualization on False Alarm Cases: Figure 13 presents representative false alarm cases from different SAR datasets. As shown in the visualization results, comparative detectors tend to produce multiple redundant responses in non-target regions, which leads to false alarms in complex scenes.
In contrast, the proposed method generates response maps that are more concentrated around true target regions while suppressing unnecessary background responses. Compared with other detectors, MDIS-DETR produces fewer scattered activations and more consistent localization results across different scenes. These observations demonstrate the effectiveness of the proposed method in reducing false alarms under various SAR imaging conditions.
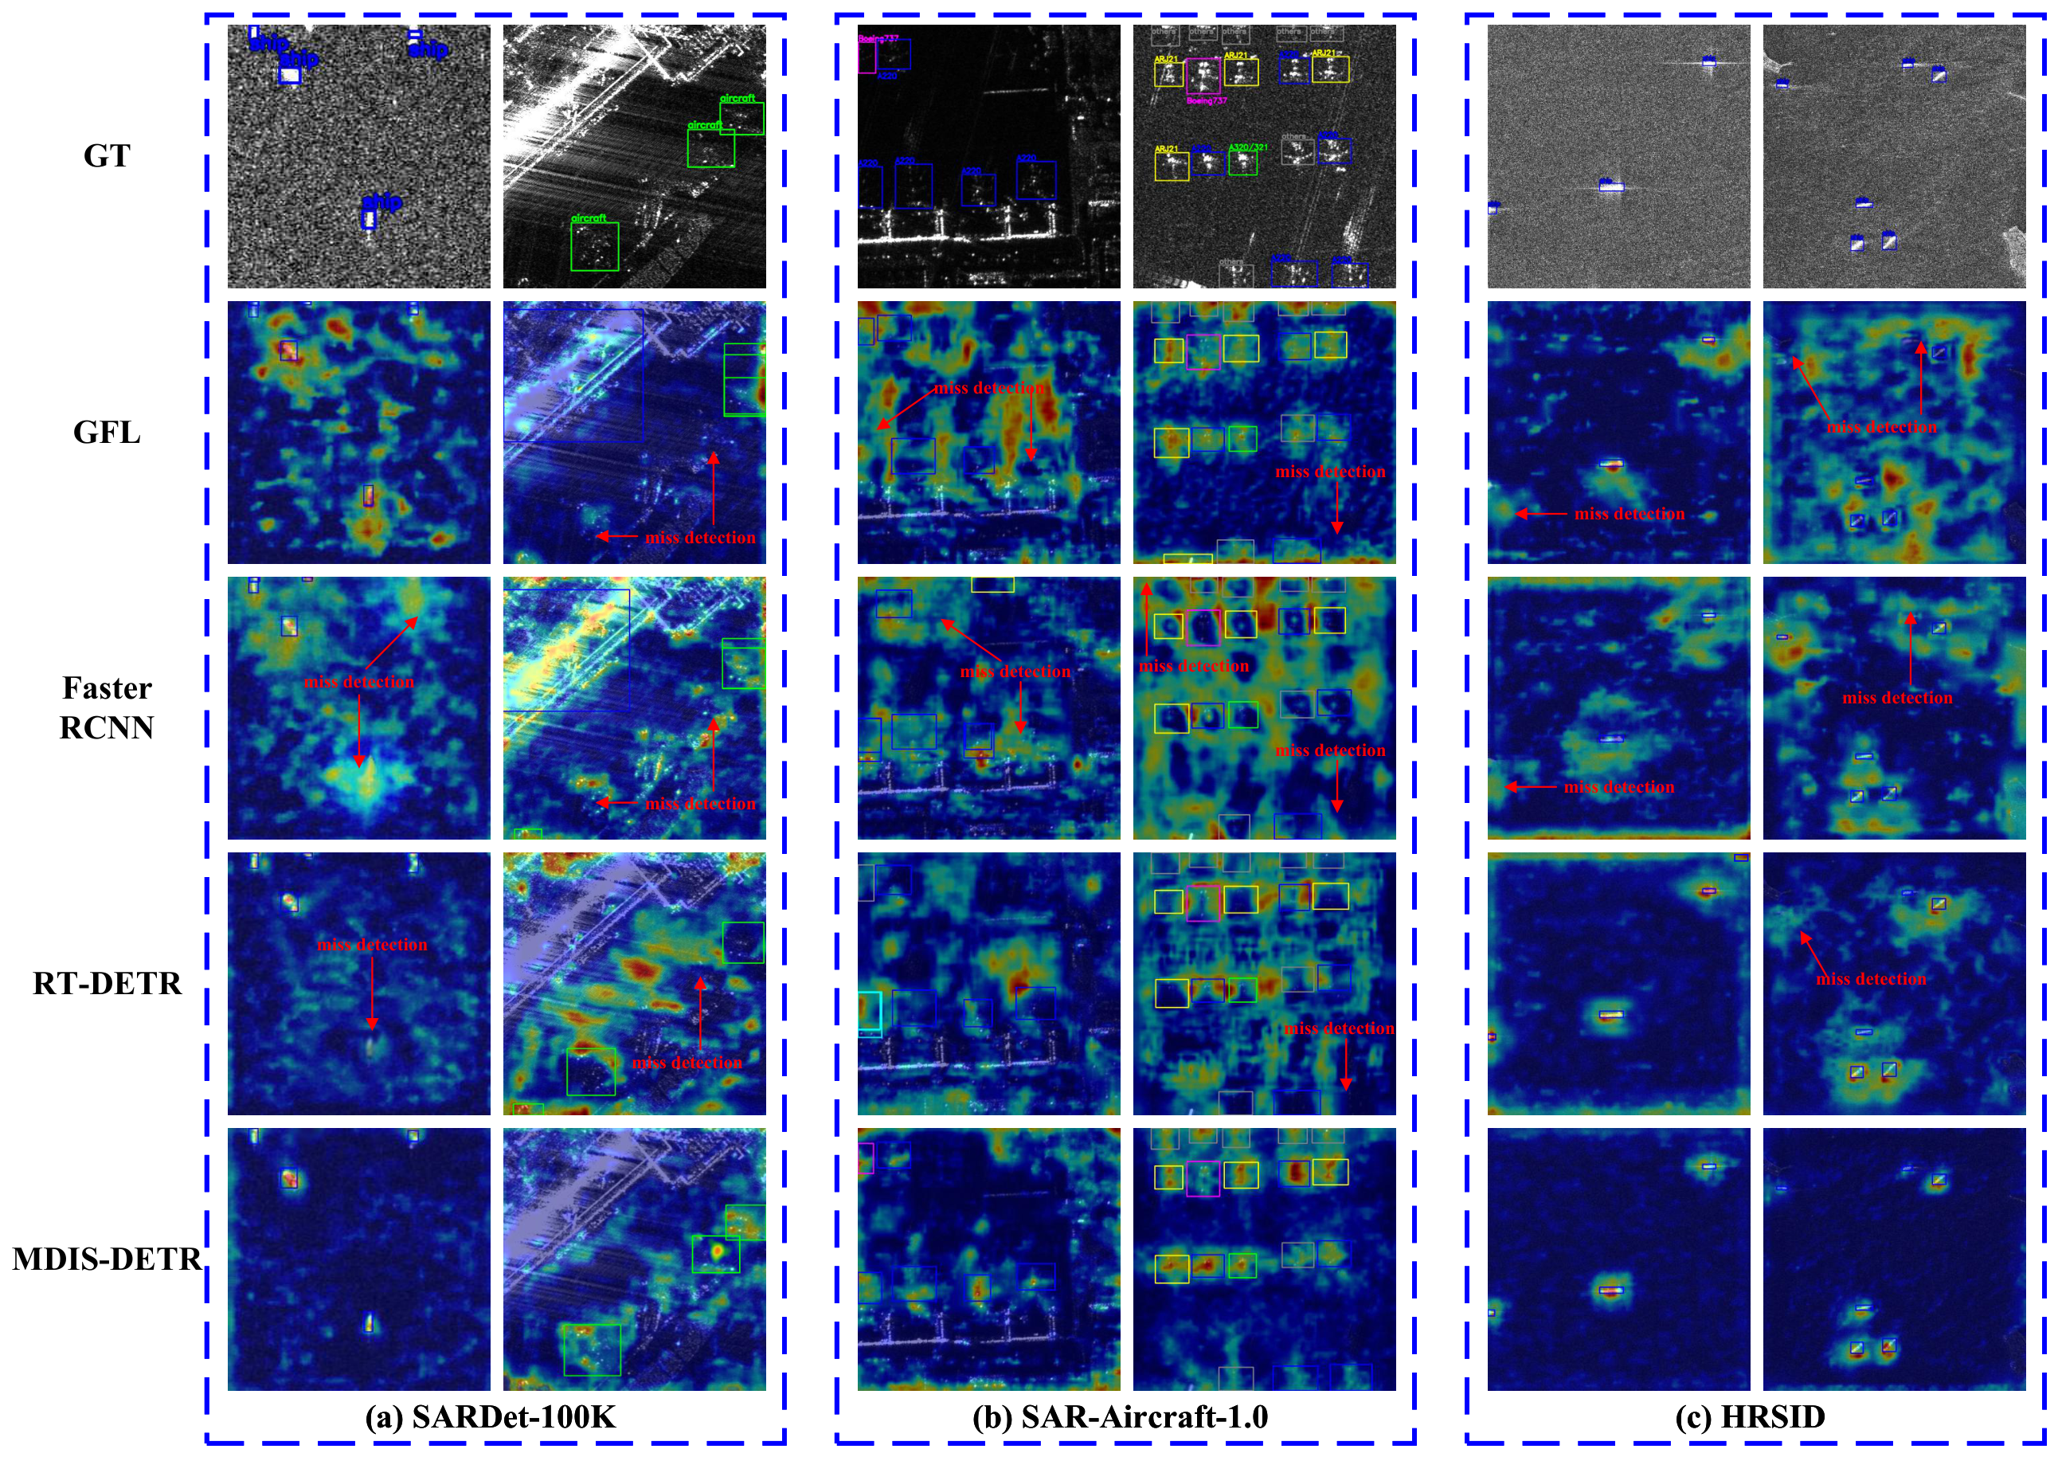
Visualization on Missed Detection Cases: Figure 14 shows representative missed detection cases from different SAR datasets. As illustrated in the figure, several comparative detectors fail to maintain clear responses at some target locations, resulting in incomplete detections or missed targets.
By comparison, the proposed method preserves stronger responses around target regions and detects more targets consistently across different scenes. In particular, MDIS-DETR exhibits more stable activations and clearer target localization results than other detectors in challenging cases. Overall, the visualization results verify the improved robustness of the proposed method against missed detections.

5. Discussion

The experimental results presented in Section 4 demonstrate that the proposed MDIS-DETR framework achieves consistent performance improvements across multiple SAR object detection benchmarks. These improvements can be attributed to the unified multi-domain interference suppression strategy, which jointly addresses spatial, frequency, and structural challenges inherent in SAR imagery.
From the perspective of spatial-domain modeling, the proposed LSFDM effectively alleviates the coupling between speckle noise and object responses. Unlike conventional preprocessing-based denoising methods, which operate independently of the detection task, the learnable fusion mechanism enables adaptive integration of complementary spatial representations. This design allows the network to preserve discriminative structural details while suppressing noise, thereby improving feature quality for downstream detection.
In the frequency domain, the proposed PAFDM enhances the robustness of feature representation under regionally imbalanced spectral distributions. By incorporating polarity-guided attention and adaptive frequency refinement, the framework stabilizes global feature modeling while mitigating the amplification of noise-related frequency components. This is particularly beneficial in SAR scenarios, where multiplicative noise and regional spectral variations often degrade detection reliability.
Furthermore, the structural-domain suppression strategy introduced via NICFM improves cross-scale feature consistency by breaking the limitations of fixed sequential fusion pathways. By enabling non-sequential interactions across scales, the proposed mechanism reduces redundant feature propagation and enhances the coherence of multi-scale representations. This contributes to improved detection performance, especially for small or densely distributed targets.
Compared with existing SAR object detection approaches, which typically focus on a single aspect of interference suppression, the proposed method provides a unified framework that simultaneously considers multiple domains. This design enables different suppression strategies to work together, leading to more stable and reliable feature representations. As demonstrated in the ablation studies, each component contributes to performance improvement, while their combination yields the most significant gain.
Despite the strong performance achieved by the proposed framework, several aspects deserve further discussion. First, although the introduced multi-domain suppression modules increase the GFLOPs compared with the baseline model, the overall parameter scale remains relatively lightweight, while competitive FPS performance is still maintained across different datasets. These results indicate that the proposed framework achieves a reasonable balance between detection accuracy and inference efficiency. Nevertheless, further optimization of the computational complexity associated with GFLOPs remains an important direction for future work.
Second, the current evaluation is mainly conducted on standard SAR object detection benchmarks. Although these datasets cover diverse scenarios, further validation on more heterogeneous SAR imaging conditions, as well as other remote sensing tasks or sensor modalities, would help to more comprehensively assess the generalization capability of the proposed framework.
Overall, the proposed MDIS-DETR provides a unified and effective solution for suppressing complex interference in SAR object detection while maintaining competitive performance and practical applicability.

6. Conclusions

This article proposes the MDIS-DETR, a unified detection framework to suppress multi-domain interference. By integrating spatial-domain, frequency-domain, and structural-domain suppression strategies within an end-to-end RT-DETR architecture, the method enables coordinated refinement of input representation, encoder feature modeling, and cross-scale interaction. Specifically, LSFDM enhances spatial robustness through learnable fusion denoising, PAFDM stabilizes frequency-domain feature representation via polar-guided adaptive refinement, and NICFM improves cross-scale consistency through non-sequential interaction. Experiments on three benchmarks (SARDet-100K, SAR-AIRcraft-1.0, HRSID) verify that the MDIS-DETR achieves superior performance over representative SOTA detectors with competitive efficiency, demonstrating the effectiveness of unified multi-domain interference suppression. Future work will focus on improving computational efficiency to better support real-time deployment, as well as extending the proposed framework to more diverse SAR imaging conditions and complex target scenarios.

Author Contributions

Conceptualization, Z.Z. and R.P.; methodology, Z.Z.; software, Z.Z. and Z.W.; validation, Z.Z., R.P. and D.S.; formal analysis, Z.Z.; investigation, Z.Z.; data curation, Z.Z. and Z.W.; writing—original draft preparation, Z.Z.; writing—review and editing, Z.Z., R.P., D.S. and S.T.; visualization, Z.Z. and Z.W.; supervision, R.P., D.S. and S.T.; project administration, R.P.; funding acquisition, R.P. All authors have read and agreed to the published version of the manuscript.

Funding

This research was funded by the Taishan Scholars Program, grant number tstp20250747.

Data Availability Statement

The datasets (SARDet-100K, SAR-AIRcraft-1.0, and HRSID) analyzed in this study are publicly available.

Conflicts of Interest

Author Zhibin Zhang is employed by Ceyear Technologies Co., Ltd. This work was conducted under the author’s university affiliation and does not involve any commercial interests. The authors declare no conflict of interest.

References

  1. Moreira, A.; Prats-Iraola, P.; Younis, M.; Krieger, G.; Hajnsek, I.; Papathanassiou, K.P. A tutorial on synthetic aperture radar. IEEE Geosci. Remote Sens. Mag. 2013, 1, 6–43. [Google Scholar] [CrossRef]
  2. Tirandaz, Z.; Akbarizadeh, G.; Kaabi, H. PolSAR image segmentation based on feature extraction and data compression using Weighted Neighborhood Filter Bank and Hidden Markov random field-expectation maximization. Measurement 2020, 153, 107432. [Google Scholar] [CrossRef]
  3. Li, H.L.; Liu, S.W.; Chen, S.W. PolSAR ship characterization and robust detection at different grazing angles with polarimetric roll-invariant features. IEEE Trans. Geosci. Remote Sens. 2024, 62, 5225818. [Google Scholar]
  4. Zalpour, M.; Akbarizadeh, G.; Alaei-Sheini, N. A new approach for oil tank detection using deep learning features with control false alarm rate in high-resolution satellite imagery. Int. J. Remote Sens. 2020, 41, 2239–2262. [Google Scholar]
  5. Qin, Y.; Xu, W.; Yao, Y.; Huang, X. SAR-3DTR: A novel feature hybrid transformer network for end-to-end 3-D target reconstruction from SAR images. IEEE Geosci. Remote Sens. Lett. 2024, 21, 4017905. [Google Scholar]
  6. Ghara, F.M.; Shokouhi, S.B.; Akbarizadeh, G. A new technique for segmentation of the oil spills from synthetic-aperture radar images using convolutional neural network. IEEE J. Sel. Top. Appl. Earth Obs. Remote Sens. 2022, 15, 8834–8844. [Google Scholar] [CrossRef]
  7. Li, Y.; Li, X.; Li, W.; Hou, Q.; Liu, L.; Cheng, M.M.; Yang, J. Sardet-100k: Towards open-source benchmark and toolkit for large-scale sar object detection. Adv. Neural Inf. Process. Syst. 2024, 37, 128430–128461. [Google Scholar]
  8. Zhirui, W.; Yuzhuo, K.; Xuan, Z.; Yuelei, W.; Ting, Z.; Xian, S. SAR-AIRcraft-1.0: High-resolution SAR aircraft detection and recognition dataset. J. Radars 2023, 12, 906–922. [Google Scholar]
  9. Goldstein, G. False-alarm regulation in log-normal and Weibull clutter. IEEE Trans. Aerosp. Electron. Syst. 1973, AES-9, 84–92. [Google Scholar]
  10. Gao, G.; Liu, L.; Zhao, L.; Shi, G.; Kuang, G. An adaptive and fast CFAR algorithm based on automatic censoring for target detection in high-resolution SAR images. IEEE Trans. Geosci. Remote Sens. 2008, 47, 1685–1697. [Google Scholar] [CrossRef]
  11. Balleri, A.; Nehorai, A.; Wang, J. Maximum likelihood estimation for compound-Gaussian clutter with inverse gamma texture. IEEE Trans. Aerosp. Electron. Syst. 2007, 43, 775–779. [Google Scholar] [CrossRef]
  12. Tomasi, C.; Manduchi, R. Bilateral filtering for gray and color images. In Proceedings of the Sixth International Conference on Computer Vision (IEEE Cat. No.98CH36271), Bombay, India, 7 January 1998; pp. 839–846. [Google Scholar] [CrossRef]
  13. Leng, X.; Ji, K.; Yang, K.; Zou, H. A bilateral CFAR algorithm for ship detection in SAR images. IEEE Geosci. Remote Sens. Lett. 2015, 12, 1536–1540. [Google Scholar] [CrossRef]
  14. Gao, J.; Gao, X.; Sun, X. Geometrical features-based method for aircraft target interpretation in high-resolution SAR images. Foreign Electron. Meas. Technol. 2015, 34, 21–28. [Google Scholar]
  15. Aghaei, N.; Akbarizadeh, G.; Kosarian, A. GreyWolfLSM: An accurate oil spill detection method based on level set method from synthetic aperture radar imagery. Eur. J. Remote Sens. 2022, 55, 181–198. [Google Scholar]
  16. Li, H.L.; Chen, S.W. Polyhedral corner reflectors multi-domain joint characterization with fully polarimetric radar. IEEE Trans. Antennas Propag. 2025, 73, 10679–10693. [Google Scholar]
  17. Li, H.L.; Chen, S.W. General polarimetric correlation pattern: A visualization and characterization tool for target joint-domain scattering mechanisms investigation. IEEE Trans. Geosci. Remote Sens. 2025, 64, 5200417. [Google Scholar] [CrossRef]
  18. Ren, S.; He, K.; Girshick, R.; Sun, J. Faster R-CNN: Towards real-time object detection with region proposal networks. IEEE Trans. Pattern Anal. Mach. Intell. 2016, 39, 1137–1149. [Google Scholar] [PubMed]
  19. Redmon, J.; Divvala, S.; Girshick, R.; Farhadi, A. You only look once: Unified, real-time object detection. In Proceedings of the IEEE Conference on Computer Vision and Pattern Recognition, Las Vegas, NV, USA, 27–30 June 2016; pp. 779–788. [Google Scholar]
  20. Zhang, Y.; Guo, Z.; Wu, J.; Tian, Y.; Tang, H.; Guo, X. Real-time vehicle detection based on improved yolo v5. Sustainability 2022, 14, 12274. [Google Scholar] [CrossRef] [PubMed]
  21. Glenn, J. YOLOv8. 2023. Available online: https://github.com/ultralytics/ultralytics (accessed on 21 June 2026).
  22. Carion, N.; Massa, F.; Synnaeve, G.; Usunier, N.; Kirillov, A.; Zagoruyko, S. End-to-end object detection with transformers. In Proceedings of the European Conference on Computer Vision; Springer: Cham, Switzerland, 2020; pp. 213–229. [Google Scholar]
  23. Zhu, X.; Su, W.; Lu, L.; Li, B.; Wang, X.; Dai, J. Deformable detr: Deformable transformers for end-to-end object detection. arXiv 2020, arXiv:2010.04159. [Google Scholar]
  24. Zhao, Y.; Lv, W.; Xu, S.; Wei, J.; Wang, G.; Dang, Q.; Liu, Y.; Chen, J. Detrs beat yolos on real-time object detection. In Proceedings of the IEEE/CVF Conference on Computer Vision and Pattern Recognition, Seattle, WA, USA, 16–22 June 2024; pp. 16965–16974. [Google Scholar]
  25. Buades, A.; Coll, B.; Morel, J.M. A non-local algorithm for image denoising. In Proceedings of the 2005 IEEE Computer Society Conference on Computer Vision and Pattern Recognition (CVPR’05); IEEE: Piscataway, NJ, USA, 2005; Volume 2, pp. 60–65. [Google Scholar]
  26. Chen, L.; Luo, R.; Xing, J.; Li, Z.; Yuan, Z.; Cai, X. Geospatial transformer is what you need for aircraft detection in SAR imagery. IEEE Trans. Geosci. Remote Sens. 2022, 60, 5225715. [Google Scholar] [CrossRef]
  27. Hu, Q.; Hu, S.; Liu, S.; Xu, S.; Zhang, Y.D. FINet: A feature interaction network for SAR ship object-level and pixel-level detection. IEEE Trans. Geosci. Remote Sens. 2022, 60, 5239215. [Google Scholar]
  28. Liu, W.; Zhou, L. Multilevel denoising for high-quality SAR object detection in complex scenes. IEEE Trans. Geosci. Remote Sens. 2024, 62, 5226813. [Google Scholar] [CrossRef]
  29. Cloude, S.R.; Pottier, E. A review of target decomposition theorems in radar polarimetry. IEEE Trans. Geosci. Remote Sens. 1996, 34, 498–518. [Google Scholar] [CrossRef]
  30. Vaswani, A.; Shazeer, N.; Parmar, N.; Uszkoreit, J.; Jones, L.; Gomez, A.N.; Kaiser, Ł.; Polosukhin, I. Attention is all you need. In Advances in Neural Information Processing Systems; Curran Associates Inc.: Red Hook, NY, USA, 2017; Volume 30. [Google Scholar]
  31. Lin, T.Y.; Dollár, P.; Girshick, R.; He, K.; Hariharan, B.; Belongie, S. Feature pyramid networks for object detection. In Proceedings of the IEEE/CVF Conference on Computer Vision and Pattern Recognition (CVPR), Honolulu, HI, USA, 21–26 July 2017; pp. 2117–2125. [Google Scholar]
  32. Liu, S.; Qi, L.; Qin, H.; Shi, J.; Jia, J. Path aggregation network for instance segmentation. In Proceedings of the IEEE/CVF Conference on Computer Vision and Pattern Recognition (CVPR), Salt Lake City, UT, USA, 18–23 June 2018; pp. 8759–8768. [Google Scholar]
  33. Meng, W.; Luo, Y.; Li, X.; Jiang, D.; Zhang, Z. Polaformer: Polarity-aware linear attention for vision transformers. arXiv 2025, arXiv:2501.15061. [Google Scholar]
  34. Cai, Z.; Vasconcelos, N. Cascade r-cnn: Delving into high quality object detection. In Proceedings of the IEEE Conference on Computer Vision and Pattern Recognition, Salt Lake City, UT, USA, 18–23 June 2018; pp. 6154–6162. [Google Scholar]
  35. Zhang, H.; Chang, H.; Ma, B.; Wang, N.; Chen, X. Dynamic R-CNN: Towards high quality object detection via dynamic training. In Proceedings of the European Conference on Computer Vision; Springer: Cham, Switzerland, 2020; pp. 260–275. [Google Scholar]
  36. Liu, W.; Anguelov, D.; Erhan, D.; Szegedy, C.; Reed, S.; Fu, C.Y.; Berg, A.C. Ssd: Single shot multibox detector. In Proceedings of the European Conference on Computer Vision; Springer: Cham, Switzerland, 2016; pp. 21–37. [Google Scholar]
  37. Redmon, J.; Farhadi, A. Yolov3: An incremental improvement. arXiv 2018, arXiv:1804.02767. [Google Scholar]
  38. Ge, Z.; Liu, S.; Wang, F.; Li, Z.; Sun, J. Yolox: Exceeding yolo series in 2021. arXiv 2021, arXiv:2107.08430. [Google Scholar]
  39. Wang, C.Y.; Bochkovskiy, A.; Liao, H.Y.M. YOLOv7: Trainable bag-of-freebies sets new state-of-the-art for real-time object detectors. In Proceedings of the IEEE/CVF Conference on Computer Vision and Pattern Recognition, Vancouver, BC, Canada, 17–24 June 2023; pp. 7464–7475. [Google Scholar]
  40. Tian, Y.; Ye, Q.; Doermann, D. Yolov12: Attention-centric real-time object detectors. arXiv 2025, arXiv:2502.12524. [Google Scholar]
  41. Meng, D.; Chen, X.; Fan, Z.; Zeng, G.; Li, H.; Yuan, Y.; Sun, L.; Wang, J. Conditional detr for fast training convergence. In Proceedings of the IEEE/CVF International Conference on Computer Vision, Montreal, BC, Canada, 11–17 October 2021; pp. 3651–3660. [Google Scholar]
  42. Li, F.; Zhang, H.; Liu, S.; Guo, J.; Ni, L.M.; Zhang, L. Dn-detr: Accelerate detr training by introducing query denoising. In Proceedings of the IEEE/CVF Conference on Computer Vision and Pattern Recognition, New Orleans, LA, USA, 18–24 June 2022; pp. 13619–13627. [Google Scholar]
  43. Zhang, H.; Li, F.; Liu, S.; Zhang, L.; Su, H.; Zhu, J.; Ni, L.M.; Shum, H.Y. Dino: Detr with improved denoising anchor boxes for end-to-end object detection. arXiv 2022, arXiv:2203.03605. [Google Scholar]
  44. Wang, Y.; Zhang, X.; Yang, T.; Sun, J. Anchor DETR: Query design for transformer-based object detection. arXiv 2021, arXiv:2109.07107. [Google Scholar]
  45. Liu, S.; Li, F.; Zhang, H.; Yang, X.; Qi, X.; Su, H.; Zhu, J.; Zhang, L. Dab-detr: Dynamic anchor boxes are better queries for detr. arXiv 2022, arXiv:2201.12329. [Google Scholar]
  46. Pu, Y.; Liang, W.; Hao, Y.; Yuan, Y.; Yang, Y.; Zhang, C.; Hu, H.; Huang, G. Rank-DETR for high quality object detection. Adv. Neural Inf. Process. Syst. 2023, 36, 16100–16113. [Google Scholar] [CrossRef]
  47. Zhao, Y.; Zhao, L.; Li, C.; Kuang, G. Pyramid attention dilated network for aircraft detection in SAR images. IEEE Geosci. Remote Sens. Lett. 2020, 18, 662–666. [Google Scholar] [CrossRef]
  48. Wang, J.; Xiao, H.; Chen, L.; Xing, J.; Pan, Z.; Luo, R.; Cai, X. Integrating weighted feature fusion and the spatial attention module with convolutional neural networks for automatic aircraft detection from SAR images. Remote Sens. 2021, 13, 910. [Google Scholar] [CrossRef]
  49. Zhang, L.; Liu, Y.; Zhao, W.; Wang, X.; Li, G.; He, Y. Frequency-adaptive learning for SAR ship detection in clutter scenes. IEEE Trans. Geosci. Remote Sens. 2023, 61, 5215514. [Google Scholar] [CrossRef]
  50. Dai, Y.; Zou, M.; Li, Y.; Li, X.; Ni, K.; Yang, J. Denodet: Attention as deformable multi-subspace feature denoising for target detection in sar images. IEEE Trans. Aerosp. Electron. Syst. 2024, 61, 4729–4743. [Google Scholar]
  51. Zhou, K.; Zhang, M.; Wang, H.; Tan, J. Ship detection in SAR images based on multi-scale feature extraction and adaptive feature fusion. Remote Sens. 2022, 14, 755. [Google Scholar] [CrossRef]
  52. Zhang, P.; Xu, H.; Tian, T.; Gao, P.; Li, L.; Zhao, T.; Zhang, N.; Tian, J. SEFEPNet: Scale expansion and feature enhancement pyramid network for SAR aircraft detection with small sample dataset. IEEE J. Sel. Top. Appl. Earth Obs. Remote Sens. 2022, 15, 3365–3375. [Google Scholar] [CrossRef]
  53. Guo, H.; Yang, X.; Wang, N.; Gao, X. A CenterNet++ model for ship detection in SAR images. Pattern Recognit. 2021, 112, 107787. [Google Scholar] [CrossRef]
  54. Zhou, Y.; Jiang, X.; Xu, G.; Yang, X.; Liu, X.; Li, Z. PVT-SAR: An arbitrarily oriented SAR ship detector with pyramid vision transformer. IEEE J. Sel. Top. Appl. Earth Obs. Remote Sens. 2022, 16, 291–305. [Google Scholar] [CrossRef]
  55. He, K.; Zhang, X.; Ren, S.; Sun, J. Deep residual learning for image recognition. In Proceedings of the IEEE Conference on Computer Vision and Pattern Recognition, Las Vegas, NV, USA, 27–30 June 2016; pp. 770–778. [Google Scholar]
  56. Yao, T.; Li, Y.; Pan, Y.; Mei, T. Hgnet: Learning hierarchical geometry from points, edges, and surfaces. In Proceedings of the IEEE/CVF Conference on Computer Vision and Pattern Recognition, Vancouver, BC, Canada, 17–24 June 2023; pp. 21846–21855. [Google Scholar]
  57. Ding, X.; Zhang, X.; Ma, N.; Han, J.; Ding, G.; Sun, J. Repvgg: Making vgg-style convnets great again. In Proceedings of the IEEE/CVF Conference on Computer Vision and Pattern Recognition, Nashville, TN, USA, 20–25 June 2021; pp. 13733–13742. [Google Scholar]
  58. Wei, S.; Zeng, X.; Qu, Q.; Wang, M.; Su, H.; Shi, J. HRSID: A high-resolution SAR images dataset for ship detection and instance segmentation. IEEE Access 2020, 8, 120234–120254. [Google Scholar] [CrossRef]
  59. Tian, Z.; Shen, C.; Chen, H.; He, T. Fcos: Fully convolutional one-stage object detection. In Proceedings of the IEEE/CVF International Conference on Computer Vision, Seoul, Republic of Korea, 27 October–2 November 2019; pp. 9627–9636. [Google Scholar]
  60. Li, X.; Wang, W.; Wu, L.; Chen, S.; Hu, X.; Li, J.; Tang, J.; Yang, J. Generalized focal loss: Learning qualified and distributed bounding boxes for dense object detection. Adv. Neural Inf. Process. Syst. 2020, 33, 21002–21012. [Google Scholar]
  61. Yang, Z.; Liu, S.; Hu, H.; Wang, L.; Lin, S. Reppoints: Point set representation for object detection. In Proceedings of the IEEE/CVF International Conference on Computer Vision, Seoul, Republic of Korea, 27 October–2 November 2019; pp. 9657–9666. [Google Scholar]
  62. Zhang, S.; Chi, C.; Yao, Y.; Lei, Z.; Li, S.Z. Bridging the gap between anchor-based and anchor-free detection via adaptive training sample selection. In Proceedings of the IEEE/CVF Conference on Computer Vision and Pattern Recognition, Seattle, WA, USA, 13–19 June 2020; pp. 9759–9768. [Google Scholar]
  63. Zhou, X.; Wang, D.; Krähenbühl, P. Objects as points. arXiv 2019, arXiv:1904.07850. [Google Scholar]
  64. Kim, K.; Lee, H.S. Probabilistic anchor assignment with iou prediction for object detection. In Proceedings of the European Conference on Computer Vision; Springer: Cham, Switzerland, 2020; pp. 355–371. [Google Scholar]
  65. Wang, W.; Xie, E.; Li, X.; Fan, D.P.; Song, K.; Liang, D.; Lu, T.; Luo, P.; Shao, L. Pyramid vision transformer: A versatile backbone for dense prediction without convolutions. In Proceedings of the IEEE/CVF International Conference on Computer Vision, Montreal, BC, Canada, 11–17 October 2021; pp. 568–578. [Google Scholar]
  66. Lin, T.Y.; Goyal, P.; Girshick, R.; He, K.; Dollár, P. Focal loss for dense object detection. In Proceedings of the IEEE International Conference on Computer Vision, Venice, Italy, 22–29 October 2017; pp. 2980–2988. [Google Scholar]
  67. Feng, C.; Zhong, Y.; Gao, Y.; Scott, M.R.; Huang, W. Tood: Task-aligned one-stage object detection. In Proceedings of the 2021 IEEE/CVF International Conference on Computer Vision (ICCV); IEEE Computer Society: Washington, DC, USA, 2021; pp. 3490–3499. [Google Scholar]
  68. Zhang, H.; Wang, Y.; Dayoub, F.; Sunderhauf, N. Varifocalnet: An iou-aware dense object detector. In Proceedings of the IEEE/CVF Conference on Computer Vision and Pattern Recognition, Nashville, TN, USA, 20–25 June 2021; pp. 8514–8523. [Google Scholar]
  69. Zhu, B.; Wang, J.; Jiang, Z.; Zong, F.; Liu, S.; Li, Z.; Sun, J. Autoassign: Differentiable label assignment for dense object detection. arXiv 2020, arXiv:2007.03496. [Google Scholar]
  70. Ni, K.; Zou, M.; Li, Y.; Li, X.; Guo, K.; Cheng, M.M.; Dai, Y. DenoDet V2: Phase-Amplitude Cross Denoising for SAR Object Detection. In Proceedings of the AAAI Conference on Artificial Intelligence, Singapore, 20–27 January 2026; Volume 40, pp. 8142–8150. [Google Scholar]
  71. Chen, Q.; Wang, Y.; Yang, T.; Zhang, X.; Cheng, J.; Sun, J. You only look one-level feature. In Proceedings of the IEEE/CVF Conference on Computer Vision and Pattern Recognition, Nashville, TN, USA, 20–25 June 2021; pp. 13039–13048. [Google Scholar]
  72. Lu, X.; Li, B.; Yue, Y.; Li, Q.; Yan, J. Grid r-cnn. In Proceedings of the the IEEE/CVF Conference on Computer Vision and Pattern Recognition (CVPR), Long Beach, CA, USA, 15–20 June 2019; pp. 7363–7372. [Google Scholar]
  73. Pang, J.; Chen, K.; Shi, J.; Feng, H.; Ouyang, W.; Lin, D. Libra r-cnn: Towards balanced learning for object detection. In Proceedings of the IEEE/CVF Conference on Computer Vision and Pattern Recognition, Long Beach, CA, USA, 15–20 June 2019; pp. 821–830. [Google Scholar]
  74. Liu, Z.; Mao, H.; Wu, C.Y.; Feichtenhofer, C.; Darrell, T.; Xie, S. A convnet for the 2020s. In Proceedings of the IEEE/CVF Conference on Computer Vision and Pattern Recognition, New Orleans, LA, USA, 18–24 June 2022; pp. 11976–11986. [Google Scholar]
  75. Woo, S.; Debnath, S.; Hu, R.; Chen, X.; Liu, Z.; Kweon, I.S.; Xie, S. Convnext v2: Co-designing and scaling convnets with masked autoencoders. In Proceedings of the IEEE/CVF Conference on Computer Vision and Pattern Recognition, Vancouver, BC, Canada, 17–24 June 2023; pp. 16133–16142. [Google Scholar]
  76. Li, Y.; Hou, Q.; Zheng, Z.; Cheng, M.M.; Yang, J.; Li, X. Large selective kernel network for remote sensing object detection. In Proceedings of the IEEE/CVF International Conference on Computer Vision, Paris, France, 2–3 October 2023; pp. 16794–16805. [Google Scholar]
  77. Zuo, Z.; Cheng, Z.; Huang, S.; Wei, J.; Wu, Z. CGAQ-DETR: DETR with Corner Guided and Adaptive Query for SAR Object Detection. Remote Sens. 2025, 17, 3254. [Google Scholar] [CrossRef]
Figure 1. Representative Synthetic Aperture Radar (SAR) images for object detection in typical scenarios. Blue, green, and yellow bounding boxes denote ship, aircraft, and tank targets, respectively. These examples illustrate common SAR detection challenges, including complex background responses, weak target boundaries, and scale variations.
Remotesensing 18 02076 g001
Figure 3. Comparison of different spatial-domain fusion strategies at the network input stage. (a) Naive channel replication followed by direct concatenation. (b) Independent spatial filtering with fixed concatenation of filtered outputs. (c) The proposed learnable fusion mechanism that adaptively integrates multiple spatial-domain responses.
Remotesensing 18 02076 g003
Figure 4. Structure of the proposed LSFDM. The module adaptively integrates Gaussian and bilateral filtering responses through a learnable fusion block. The operator ⊕ denotes element-wise addition.
Remotesensing 18 02076 g004
Figure 5. Principle of the proposed Polar Linear Attention (PLA). The module introduces polarity decomposition, builds dual attention branches for positive and negative components, and integrates the responses via learnable fusion.
Remotesensing 18 02076 g005
Figure 6. Structure of the proposed Adaptive Frequency-Domain Denoising Feed-Forward Network (AFDFN). The module performs window-based FFT transformation, applies learnable frequency-domain weighting for adaptive noise suppression, and reconstructs spatial features via inverse FFT.
Remotesensing 18 02076 g006
Figure 7. Structure of the proposed CSFN. The module aligns multi-scale features via upsampling and downsampling, aggregates them through channel-wise concatenation, and performs multi-scale depthwise convolution for feature focusing, followed by residual enhancement.
Remotesensing 18 02076 g007
Figure 8. Structure of the proposed SIB for scale-wise feature integration.
Remotesensing 18 02076 g008
Figure 9. Example samples collected from the SAR-AIRcraft-1.0, SARDet-100K, and HRSID datasets used in our experiments for performance evaluation.
Remotesensing 18 02076 g009
Figure 10. Visualization of the spatial-domain interference suppression. (a) Original SAR image. (b) Gaussian filtering result. (c) Bilateral filtering result. (df) Fused spatial-domain representations produced by the proposed LSFDM.
Remotesensing 18 02076 g010
Figure 11. Visualization of the frequency-domain interference suppression. Columns from (leftright) show the ground-truth (GT) reference and the corresponding feature-response maps produced by RT-DETR and MDIS-DETR.
Remotesensing 18 02076 g011
Figure 12. Visualization of the structural-domain interference suppression. Columns from (leftright) show the ground-truth (GT), detection results of RT-DETR, and detection results of the proposed MDIS-DETR.
Remotesensing 18 02076 g012
Figure 13. Comparative visualization of typical false alarm instances across the selected SARDet-100K, SAR-AIRcraft-1.0, and HRSID datasets.
Remotesensing 18 02076 g013
Figure 14. Comparative visualization of typical miss detection instances across the selected SARDet-100K, SAR-AIRcraft-1.0, and HRSID datasets.
Remotesensing 18 02076 g014
Table 2. Satellites and sensor details for datasets used in our experiments.
DatasetsRes. (m)BandPolarizationSatellites & Sensor
SARDet-100K0.1∼25C, Ka, Ku, XHH, HV, VH, VV, Uni-polarAirborne SAR synthetic slic, GF-3, HISEA-1, RadarSat-2, S-1, TerraSAR-X, TanDEMX
SAR-AIRcraft-1.01CUni-polarGF-3
HRSID0.5∼3C/XHH, HV, VH, VVS-1B, TerraSAR-X, TanDEMX
Table 3. Ablation studies on the SARDet-100K dataset.
IDMulti-Domain
Interference Suppression
FLOPs (G)↓Params (M)↓FPS↑ mAP AP50 AP75 APS APM APL
Spatial
Domain
Frequency
Domain
Structural
Domain
0×××56.9719.88187.9354.2485.8958.4148.7467.7262.54
1××56.9719.88141.8056.21 (+1.97)87.5260.9150.8369.0464.32
2××57.2120.05198.8756.25 (+2.01)87.5360.8251.0269.2964.23
3××66.0922.24145.2157.32 (+3.08)88.2862.0352.1170.4064.39
4×57.2220.05157.5056.91 (+2.67)87.4161.5151.5170.0163.81
566.3922.42150.1758.82 (+4.58)89.3163.6853.4371.3767.08
Note: ↑ and ↓ indicate that higher and lower values are better, respectively; ✓ and × denote the presence and absence of the corresponding module; bold values indicate the best performance in each column.
Table 4. Ablation studies on the SAR-AIRcraft-1.0 dataset.
IDMulti-Domain
Interference Suppression
FLOPs (G)↓Params (M)↓FPS↑ mAP AP50 AP75 APS APM APL
Spatial
Domain
Frequency
Domain
Structural
Domain
0×××56.9719.88192.5454.5677.6258.6181.3254.5251.42
1××56.9719.88146.8658.31 (+3.75)83.2759.6384.4158.7157.03
2××57.2120.05204.3358.18 (+3.62)83.5259.3884.4459.1956.71
3××66.0922.24149.8759.46 (+4.90)84.0460.7786.2160.1257.11
4×57.2220.05162.6258.87 (+4.31)83.1860.0285.5759.5456.39
566.3822.42154.5860.92 (+6.36)85.1162.2388.5860.8359.36
Note: ↑ and ↓ indicate that higher and lower values are better, respectively; ✓ and × denote the presence and absence of the corresponding module; bold values indicate the best performance in each column.
Table 5. Ablation studies on the HRSID dataset.
IDMulti-Domain
Interference Suppression
FLOPs (G)↓Params (M)↓FPS↑ mAP AP50 AP75 APS APM APL
Spatial
Domain
Frequency
Domain
Structural
Domain
0×××56.9719.88186.9965.7189.4774.4353.8870.3148.61
1××56.9719.88141.0967.08 (+1.37)90.3176.3365.7478.5948.47
2××57.2120.05197.8867.01 (+1.30)90.4576.0965.8879.0448.52
3××66.0922.24144.4868.42 (+2.71)91.0977.7467.2780.2948.63
4×57.2220.05156.7267.79 (+2.08)90.2176.9466.6379.7048.11
566.2822.41149.4270.14 (+4.43)92.2379.7369.0581.3250.61
Note: ↑ and ↓ indicate that higher and lower values are better, respectively; ✓ and × denote the presence and absence of the corresponding module; bold values indicate the best performance in each column.
Table 6. Intra-module ablation studies of LSFDM on the SARDet-100K dataset.
IDLSFDM ComponentsFLOPs (G)↓Params (M)↓FPS↑ mAP AP50 AP75 APS APM APL
Residual
Connection
Learnable
Fusion
0×56.9719.88187.9354.2585.8958.4148.7467.7262.54
1×56.9719.88163.4255.8786.9459.6349.9168.7363.41
256.9719.88141.8056.2187.5260.9150.8369.0464.32
Note: ↑ and ↓ indicate that higher and lower values are better, respectively; ✓ and × denote the presence and absence of the corresponding module; bold values indicate the best performance in each column.
Table 7. Intra-module ablation studies of PAFDM on the SARDet-100K dataset.
IDPAFDM ComponentsFLOPs (G)↓Params (M)↓FPS↑ mAP AP50 AP75 APS APM APL
MS-PLAAFDFN
0××56.9719.88187.9354.2485.8958.4148.7467.7262.54
1×57.0120.01183.4255.1886.7459.5249.8368.4163.37
2×57.1220.03181.6755.7387.0260.0350.2468.8863.91
357.2120.05198.8756.2587.5360.8251.0269.2964.23
Note: ↑ and ↓ indicate that higher and lower values are better, respectively; ✓ and × denote the presence and absence of the corresponding module; bold values indicate the best performance in each column.
Table 8. Comparison with SOTA methods on the SARDet-100K dataset.
MethodFLOPs (G) ↓Params (M) ↓FPS ↑mAPAP@50AP@75APSAPMAPLShipAircraftCarTankBridgeHarbor
One-stage
FCOS [59]51.5732.1338.1752.5285.8254.9347.0166.1357.8259.7955.4460.7541.7834.1763.44
GFL [60]32.2732.2736.4155.0185.1658.8749.4467.2960.4563.9257.6362.2944.8036.4165.04
RepPoints [61]48.4936.8235.4851.6686.4353.9946.6663.2653.7860.8555.5061.1340.6935.1256.71
ATSS [62]51.5732.1339.6154.9587.6058.2549.8967.9458.9761.5355.9461.7746.2037.2267.48
CenterNet [63]51.5532.1241.2553.9186.1757.3148.8866.2257.7461.2456.3561.7445.3135.9163.29
PAA [64]51.5732.137.5852.2085.7154.8046.0063.9057.6160.1656.1760.0941.0735.9660.12
PVT-T [65]42.1921.4338.6946.1077.5549.0038.0159.5353.3553.3052.9159.0330.2022.5159.11
RetinaNet [66]52.7736.4339.2746.4877.7448.9440.2559.3550.2655.3654.0060.8832.7224.8151.12
TOOD [67]50.5230.0325.6854.6586.8858.4150.2066.7258.6062.2855.6162.5345.9636.6465.24
VFNet [68]48.3832.7235.4453.0184.3256.3247.3765.3957.9962.1455.8461.9742.0834.1162.28
AutoAssignx [69]51.8336.2637.2153.9589.5855.9650.1463.4054.7362.0355.7061.6948.5538.2557.45
DenoDet [50]52.6965.7830.9355.8885.8160.1650.6368.4760.9664.9157.3663.6645.7936.3967.17
DenoDet V2 [70]52.4732.632.1856.6786.2461.0251.4568.7661.3865.5258.2164.3746.6337.2468.05
YOLOF [71]26.3242.46190.2342.8374.9543.1833.7356.1953.5752.6252.6452.7122.8623.7452.42
YOLOX [38]8.538.94218.4134.0866.7731.3128.4943.0628.9546.0846.8353.4326.2613.1418.95
Two-stage
Faster R-CNN [18]63.241.3722.3639.2270.0439.8732.5547.2342.0250.4550.3657.8224.9018.6933.11
Cascade R-CNN [34]90.9969.1714,5453.5587.3356.8149.0962.8948.6866.9956.4363.2544.3536.8953.81
Dynamic R-CNN [35]63.241.3721.1349.7580.9653.9143.1259.7254.7761.3253.8660.0033.6834.4055.25
Grid R-CNN [72]180.0264.4722.5750.0580.5853.4942.4362.0152.7060.4355.6161.9436.0331.1655.13
Libra R-CNN [73]64.0241.6424.1952.0983.5455.8145.8563.5255.4061.3254.0361.5638.1235.9761.50
ConvNeXt [74]63.8445.0717.6953.1585.5257.2845.6764.5558.6160.5557.3562.1338.1236.8163.95
ConvNeXtV2 [75]120.02110.108.2753.9186.0158.9047.6364.6759.5761.4855.8363.2339.6539.1664.09
LSKNet [76]53.7330.9920.7252.3985.0756.9645.1563.5959.1659.3356.7662.7436.0935.0164.38
End2end
DETR [22]24.9441.5635.1245.7378.5746.8737.0158.1655.5854.9451.1750.1126.0632.8059.31
Deformable DETR [23]51.7840.1022.4152.0088.7754.0346.9963.5858.5560.9454.1661.2239.1436.0960.46
DAB-DETR [45]28.9443.7028.1343.3178.1443.1034.8256.3452.6253.1650.3249.4724.0628.4755.07
Conditional DETR [41]28.0943.4528.7544.0477.8851.6735.2556.4752.8652.7749.5851.0022.7329.9840.95
CGAQ-DETR [77]70.3259.9576.5238.6269.8340.1132.2349.0840.6245.1139.8244.9730.1325.7745.90
MD-DETR [28]65.3243.91105.3355.3887.9659.0849.8267.6161.4764.3257.8863.5444.9335.4266.18
RT-DETR [24]56.9719.88187.9354.2485.8958.4148.7467.7262.5465.9448.1662.6143.3338.7966.63
MDIS-DETR (Ours)66.3922.42150.1758.8289.3163.6853.4371.3767.0868.6953.6367.0250.4842.6270.47
Note: The best and second-best results are highlighted in bold and underlined, respectively.
Table 9. Comparison with SOTA methods on the SAR-AIRcraft-1.0 dataset.
MethodFLOPs (G) ↓# Params (M) ↓FPS ↑mAPAP@50AP@75APSAPMAPLA220A320A330ARJ21B737B787Other
One-stage
FCOS [59]51.5832.1338.6054.9282.4161.8581.2351.7448.6156.1080.2256.8154.3336.6344.4255.94
GFL [60]32.2732.2738.9256.2479.5662.9158.4552.0951.1551.8571.9379.6051.0740.3050.4748.46
RepPoints [61]48.5036.8235.7154.2181.1260.3482.6750.0349.5250.4073.9868.1850.9935.0146.7454.19
ATSS [62]51.5832.1341.8953.5878.2357.4561.8949.7149.6849.0470.4179.8847.3132.1746.5349.71
CenterNet [63]51.5732.1243.1055.3782.7860.1288.4551.5651.7351.6278.8585.3051.9629.9537.5552.35
PAA [64]51.5832.138.6755.4380.5656.2359.1251.2851.5453.4975.8381.5150.1231.2943.4052.38
PVT-T [65]42.3021.4346.3248.3474.1251.5648.7845.5342.8642.8362.8268.9046.4027.0941.5948.74
RetinaNet [66]52.8836.4341.8351.1878.3456.7821.4547.1247.9149.1474.7261.8743.6833.2345.1550.44
TOOD [67]50.5330.0327.4754.8781.2360.4568.5651.1550.4948.7370.4881.9451.4832.4645.6253.37
VFNet [68]48.3932.7235.1254.7179.8958.1261.4550.4650.9251.8873.6680.2549.1734.0845.1848.72
AutoAssign [69]51.8436.2639.5754.7581.5656.8969.3451.4849.9551.2873.5074.8948.9131.4947.7955.36
DenoDet [50]48.5365.7830.4155.2780.3362.8988.5452.0851.2350.3273.8876.5049.1338.5343.3055.20
DenoDet V2 [70]48.6137.1531.2755.9281.9261.0889.2152.8451.7252.0675.7778.3350.6339.1143.8655.34
YOLOF [71]26.3342.46194.7353.5683.1257.6751.2350.6249.0852.2976.9080.5745.2621.8546.1551.89
YOLOX [38]8.538.94223.5451.1380.3456.1249.5650.2547.8350.2066.5377.4445.6428.2440.4949.34
Two-stage
Faster R-CNN [18]63.2141.3724.3653.5278.4558.2388.6750.0747.7645.6174.3678.7245.1531.0647.3652.37
Cascade R-CNN [34]91.0069.1713.8455.5780.1263.4569.7851.2350.1945.9381.0182.0355.1727.4348.5248.90
Dynamic R-CNN [35]63.2141.3722.6356.1281.3462.5689.1252.3451.7242.8481.6286.2750.3129.6347.3454.58
Grid R-CNN [72]180.0064.4721.9154.3677.5659.8960.4550.3549.5447.3181.8780.8452.7523.0241.9553.06
Libra R-CNN [73]64.0241.6425.6854.4979.2360.1271.3450.8148.7849.0179.3175.4947.4330.2146.8153.20
ConvNeXt [74]63.8545.0717.4356.5683.4562.6791.2353.5950.6551.7378.9083.3356.6933.8739.6651.72
ConvNeXtV2 [75]120.00110.109.3155.5182.5661.3469.4552.7648.8348.3878.0180.7747.2331.1049.4053.70
LSKNet [76]53.7330.9920.0756.5483.1262.7881.4553.5150.6850.9981.3779.5150.7332.7446.0554.36
End2end
DETR [22]24.9441.5635.0231.2554.2332.8911.2324.7938.3656.654.343.4110.4529.3360.8553.75
Deformable DETR [23]51.7840.1024.2153.4983.6758.4561.5650.7346.5955.7161.0774.8552.2036.6140.1653.86
DAB-DETR [45]28.9443.7027.8446.1775.3447.2362.1243.5245.2753.5174.1118.2251.6127.7248.7949.21
Conditional DETR [41]28.0943.4530.7247.9378.1251.6789.4544.4644.7142.8867.3262.1946.0430.3245.8140.95
CGAQ-DETR [77]70.2459.9878.4338.3556.2242.3457.5639.6235.2034.9351.7753.0933.7125.7230.5438.71
MD-DETR [28]65.3243.91108.4254.1580.8660.1382.3753.4150.2849.7273.6876.1148.0536.8843.5754.93
RT-DETR [24]56.9519.88192.0854.5677.6258.6181.3254.5251.4250.6475.0974.6244.2339.7849.0448.54
MDIS-DETR (Ours)66.3822.42154.5860.9285.1162.2388.5860.8359.3656.7682.5482.0353.0143.7355.0153.36
Note: The best and second-best results are highlighted in bold and underlined, respectively.
Table 10. Comparison with SOTA methods on the HRSID dataset.
MethodFLOPs (G) ↓# Params (M) ↓FPS ↑mAPAP@50AP@75APSAPMAPL
One-stage
FCOS [59]51.5732.1338.0258.9182.5364.6160.4266.6331.97
GFL [60]32.2732.2735.7762.3182.4778.9363.2166.5731.18
RepPoints [61]48.4936.8234.9561.6281.8366.5761.8265.9431.59
ATSS [62]51.5732.1340.1258.8380.5765.4360.1167.2728.59
CenterNet [63]51.5532.1241.8746.8178.5349.5746.8354.8318.17
PAA [64]51.5732.139.5459.2382.0766.4159.8263.8334.57
PVT-T [65]42.1921.4344.6350.7376.7755.5750.3164.9742.39
RetinaNet [66]52.7736.4339.0841.0165.2745.1341.2358.3713.79
TOOD [67]50.5230.0327.1152.4778.3757.8352.3160.7723.89
VFNet [68]48.3832.7234.2850.4175.1755.8350.2162.1727.59
AutoAssign [69]51.8336.2638.9160.8183.0768.0362.9167.7330.59
DenoDet [50]52.6965.7829.4761.3383.5368.1362.0364.2330.99
DenoDet V2 [70]48.6138.7532.1262.4884.7169.3663.1765.0231.84
YOLOF [71]26.3242.46191.3651.4167.8358.6351.6159.1322.59
YOLOX [38]8.538.94217.4250.5165.2744.7350.3363.8322.49
Two-stage
Faster R-CNN [18]63.2041.3724.8751.1166.6358.8350.7164.3731.29
Cascade R-CNN [34]90.9969.1714.2968.4390.5778.8370.1368.7329.79
Dynamic R-CNN [35]63.2041.3721.7651.2367.4758.0351.0363.0731.69
Grid R-CNN [72]180.0264.4720.8451.6368.7359.2352.3355.2311.49
Libra R-CNN [73]64.0241.6424.6348.9364.5356.0348.3363.5330.49
ConvNeXt [74]63.8445.0718.2154.4369.1361.5353.6371.3345.89
ConvNeXtV2 [75]120.03110.108.7355.5369.4762.5354.9370.3340.49
LSKNet [76]53.7330.9919.4855.0371.4363.6354.2371.5348.59
End2end
DETR [22]24.9441.5634.6720.6146.8513.4322.2416.792.47
Deformable DETR [23]51.7840.1023.5847.4374.9353.4347.7351.5322.79
DAB-DETR [45]28.9443.7027.1537.5364.3334.6346.4349.6324.19
Conditional DETR [41]28.0943.4529.8438.1368.1336.3345.2350.0323.69
CQAQ-DETR [77]70.3159.9875.8747.3263.2253.7539.0150.2235.47
MD-DETR [28]65.3143.91104.8166.0890.3174.9254.3771.0449.22
RT-DETR [24]56.9419.88186.9265.7189.4774.4353.8870.3148.61
MDIS-DETR (Ours)66.2822.41149.4270.1492.2379.7369.0581.3250.61
Note: The best and second-best results are highlighted in bold and underlined, respectively.
Disclaimer/Publisher’s Note: The statements, opinions and data contained in all publications are solely those of the individual author(s) and contributor(s) and not of MDPI and/or the editor(s). MDPI and/or the editor(s) disclaim responsibility for any injury to people or property resulting from any ideas, methods, instructions or products referred to in the content.