Article

Long-Term Remote Sensing of Three-Dimensional Structure and Vertical Transport of Dust Aerosols over the Qaidam Basin

1
College of Geographic Science and Tourism, Xinjiang Normal University, Urumqi 830017, China
2
Xinjiang Laboratory of Lake Environment and Resources in Arid Zone, Urumqi 830017, China
3
College of Geography and Remote Sensing Sciences, Xinjiang University, Urumqi 830017, China
4
Institute of Desert Meteorology, China Meteorological Administration, Urumqi 830002, China
5
National Observation and Research Station of Desert Meteorology, Taklimakan Desert of Xinjiang, Urumqi 830002, China
6
Taklimakan Desert Meteorology Field Experiment Station of China Meteorological Administration, Urumqi 830002, China
7
Xinjiang Key Laboratory of Desert Meteorology and Sandstorm, Urumqi 830002, China
8
Key Laboratory of Tree-Ring Physical and Chemical Research, China Meteorological Administration, Urumqi 830002, China
9
School of Atmospheric Physics, Nanjing University of Information Science and Technology, Nanjing 210044, China
*
Author to whom correspondence should be addressed.
Remote Sens. 2026, 18(12), 1977; https://doi.org/10.3390/rs18121977
Submission received: 28 April 2026 / Revised: 10 June 2026 / Accepted: 12 June 2026 / Published: 14 June 2026
(This article belongs to the Special Issue Aerosol Remote Sensing from Space, Ground or Computers)

Highlights

What are the main findings?
  • By utilizing long-term CALIPSO satellite observations, we further clarified the 3D spatial distribution of dust aerosols over the Qaidam Basin. Dust aerosols show obvious low-altitude accumulation, mainly distributed below 4 km AGL, and the base of dust layers remains steadily under 1 km.
  • During 2007–2022, the basin’s DAOD presented a decreasing trend. Seasonally, DAOD reaches its peak in spring with a mean value of 0.25, and it follows a spatial pattern of high in the west and low in the east.
What are the implications of the main findings?
  • By elaborating the vertical structural properties of regional dust aerosols, it is possible to supply reliable theoretical references for relevant atmospheric simulation research.
  • By revealing the long-term evolution and seasonal variation of dust activities, it is possible to support the assessment of environmental changes over arid inland regions.

Abstract

This study explores the three-dimensional structure of dust aerosols over the Qaidam Basin using CALIPSO satellite observations from 2007 to 2022. The results show that polluted dust is the dominant aerosol type in this region. Dust activity peaks in spring, with its vertical extent reaching nearly 10 km. Dust Aerosol Optical Depth (DAOD) is relatively high in the northwest and central parts of the basin, with a spring peak of 0.25 and an autumn minimum of 0.12. DAOD has shown a notable decreasing trend over the past 16 years. In terms of vertical structure, dust aerosols are mainly concentrated below 4 km AGL, especially within the near-surface layer of 0–2 km, and their occurrence frequency declines as altitude increases. The dust layer thickness exhibits obvious seasonal variations, which are primarily controlled by changes in layer top height. The average thickness decreases from 1.53 km in spring to 0.61 km in winter, while the layer’s bottom height remains fairly stable. Analysis based on the LASSO-SHAP model indicates that potential evapotranspiration and friction velocity are the major factors affecting DAOD, highlighting the vital roles of surface dryness and near-surface dynamic forcing. Furthermore, investigation of typical dust events reveals distinct vertical stratification of dust transport. Low-level dust movement is restricted by basin terrain, whereas upper levels are governed by the westerlies. This study improves our understanding of the three-dimensional structure, seasonal evolution, and transport processes of dust aerosols in high-altitude arid basins.

1. Introduction

Dust aerosols are one of the key components in the atmosphere, accounting for about 30% of the total mass of global aerosols, and have the characteristics of being present throughout all seasons [1,2]. As an important regulating factor of the climate system, dust aerosols directly change the energy balance at the top of the atmosphere through two-way radiation forcing, which in turn affects the vertical thermal structure and cloud microphysical processes of the atmosphere, producing significant regional and even global climate effects [1]. Dust particles cool the near-surface layer by scattering the short-wave radiation of the sun, while absorbing the long-wave radiation of the surface to heat the atmosphere. This radiation bidirectionality has a complex impact on the atmospheric thermal state [3]. The spatial distribution of dust aerosols is the core parameter for evaluating its climate effects, which can usually be analyzed from both horizontal and vertical dimensions [4]. The horizontal structure reflects the regional heterogeneity of radiation forcing [5], while the vertical structure determines the relative position of the aerosol layer with the cloud and the temperature inversion layer, thus modulating the local temperature gradient and convection intensity. For example, the radiation heating of the high-altitude dust layer may inhibit the formation of low-level clouds [6,7], while the increase in temperature caused by dust deposition in the near-surface may stimulate the convection turbulence of the boundary layer [8,9]. Therefore, gaining a comprehensive understanding of the three-dimensional (3D) structure of dust aerosols is crucial for reducing uncertainties in climate models and, consequently, enhancing the accuracy of simulations.
At present, passive sensors such as the Moderate Resolution Imaging Spectroradiometer (MODIS) and the Multi-angle Imaging SpectroRadiometer (MISR) have contributed critical datasets to the research on global aerosol horizontal distributions [10]. However, such passive observations are often constrained by high surface albedo in complex terrain, which is particularly prominent in arid areas and snow-covered areas [11,12,13]. At the same time, their ability to penetrate optically thick dust layers is also relatively limited. The above shortcomings hinder the refined analysis of the internal vertical structure and extinction profile of the aerosol. For comparison, the Cloud-Aerosol Lidar with Orthogonal Polarization (CALIOP) instrument mounted on the Cloud-Aerosol Lidar and Infrared Pathfinder Satellite Observations (CALIPSO) can provide high-precision and global-scale cloud and aerosol vertical profiling. As an active lidar system, the instrument does not depend on sunlight, and the surface reflectance has less impact on it [14,15,16]. Based on these advantages, it has built a long-term, continuous, and reliable observation foundation for the study of the vertical distribution of dust aerosols and their climate impact [17,18].
In recent years, growing advances have been made in research on the three-dimensional structure, source identification, and transport mechanism of dust aerosols in major global arid areas such as the Middle East, North Africa, Central Asia, and Northwest China [19,20,21,22,23,24]. Many studies have shown that the vertical distribution of dust particles is not only affected by local convection activity but also by regional-scale control by large-scale weather systems [25,26,27]. Among them, the Tibetan Plateau, due to its dynamic and thermal effects, has a unique “dust pumping effect” on the vertical lifting and long-range transport of dust in Asia, becoming a focus of global atmospheric scientific research. As a typical inland arid basin located on the northern edge of the Tibetan Plateau, the Qaidam Basin is a key channel for the Taklamakan Desert to transport dust to the plateau interior [28]. At present, studies on dust aerosols in the Qaidam Basin focus more on outward transport processes and material source characteristics, with methods mostly limited to horizontal flux estimation, chemical component analysis, and qualitative discussion of transport paths [29,30,31]. While some scholars have used passive remote sensing to reveal the spatial distribution of Aerosol Optical Depth (AOD) in the area [32], the limited vertical detection capability of passive sensors often makes it impossible to define dust aerosols and their vertical structure during transport. Currently, there is still a lack of systematic characterization of the 3D structure of dust in the Qaidam Basin based on multi-sensor and long-term active remote sensing data. Therefore, an in-depth analysis of the vertical evolution of dust over the basin not only complements existing regional observations but also provides key vertical constraints for assessing its radiative forcing effect.
Based on the aforementioned background, this study utilizes long-term CALIPSO lidar observations from 2007 to 2022 to systematically characterize the 3D distribution of dust aerosols in the Qaidam Basin and their driving mechanisms. The research integrates Climatic Research Unit Time-Series (CRU TS) meteorological data and European Centre for Medium-Range Weather Forecasts Reanalysis Version 5 (ERA5) datasets to screen dominant meteorological drivers via the LASSO regression model and employs SHAP (SHapley Additive exPlanations) analysis to quantify the contribution of each factor to dust activity. Furthermore, for a typical dust event, the spatial evolution and vertical structure during dust transport are analyzed by integrating HYSPLIT backward trajectory simulations with vertical backscatter coefficient profiles. Specific research objectives include: (1) identifying dominant aerosol types and quantifying the spatial patterns and temporal evolution of long-term Dust Aerosol Optical Depth (DAOD); (2) constructing a 3D dust structure model to analyze occurrence frequencies at different altitudes and extracting key vertical parameters such as layer top/bottom heights and effective thickness; (3) identifying key factors affecting basin DAOD and quantifying their contribution magnitude and action direction; (4) identifying the differences in dust transport pathways at various altitudes and characterizing their vertical subsidence and spatial aggregation. This research provides high-resolution vertical observation constraints for regional climate models and demonstrates the critical role of long-term active remote sensing in revealing the 3D evolution of aerosols in arid regions. It aims to provide scientific references and decision-making support for atmospheric environmental monitoring, radiative effect assessment, and ecological safety maintenance in global arid areas.

2. Materials and Methods

2.1. Overview of the Study Area

The Qaidam Basin is located in northwestern Qinghai Province on the northeastern Tibetan Plateau, China (Figure 1), spanning approximately 90°16′E–99°16′E and 35°00′N–39°20′N. It is surrounded by the Kunlun, Altun (Altyn Tagh), and Qilian Mountains. As the highest inland basin in China, the Qaidam Basin has a unique geographic setting. Due to its deep continental interior, it experiences a typical plateau continental climate characterized by extreme aridity, low annual precipitation, high evaporation rates, sparse vegetation cover, and widespread desert landscapes. Frequent strong winds in spring trigger severe dust events such as sandstorms and blowing dust, making it one of the most dust-prone regions in China. Furthermore, previous studies have identified the Qaidam Basin as an important pathway for dust transport from the Taklamakan Desert to the Tibetan Plateau, indicating its significant role in modulating regional climate change [28].

2.2. Data and Methods

2.2.1. CALIPSO

The satellite used in this study is CALIPSO, developed by the National Aeronautics and Space Administration and the Centre National d’Etudes Spatiales together and launched into a sun-synchronous orbit in 2006 to carry out earth observations [14]. It is equipped with the CALIOP that constitutes two wavelength lidar systems at 532 nm and 1064 nm, which facilitates the possibility of worldwide acquisition of the vertical distribution of aerosols in all-weather conditions [16,17]. CALIPSO offers Level 2 products such as the Aerosol Profile (APRO) and Vertical Feature Mask (VFM). The APRO product offers aerosol extinction coefficient (EXT) vertical profiles, and the VFM product offers distribution of aerosol clouds at various altitudes and types of aerosols, such as dust, polluted dust, smoke, clean continental aerosols, polluted continental aerosols, and marine aerosols [16]. Such capabilities considerably improve the fidelity of research in aerosol research. The quality of CALIPSO data, however, depends on the observation time: during the daytime, the solar radiation has a greater contribution to the measurement, whereas during the nighttime, the signal-to-noise ratio is greater and the uncertainty in the data is smaller [33]. Given its time coverage, detection capability, and available product types, this study adopts nighttime CALIPSO from 2007 to the end of 2022. The methodology includes these two components: (1) Using the VFM product to identify aerosol types, characterize the 3D structure of dust aerosols, analyze the spatiotemporal variation of the dust layer, calculate the vertical dust occurrence frequency, and map the vertical distribution of dust within the study area. (2) Calculation of the DAOD by vertically integrating EXT obtained from APRO products.

2.2.2. MERRA-2

MERRA-2 (Modern-Era Retrospective Analysis for Research and Applications, Version 2) is produced by the Global Modeling and Assimilation Office (GMAO) of NASA. It is the first long-term global reanalysis dataset that assimilates satellite aerosol observations, with a spatial resolution of 0.5° × 0.625° [34]. This study adopted the 550 nm dust extinction aerosol optical depth product DUEXTTAU (Dust Extinction AOT at 550 nm) from MERRA-2 aerosol diagnostics spanning 2007 to 2022. Spatial distribution comparisons were conducted to validate against the DAOD retrieved from CALIPSO.

2.2.3. CRU

Climatic Research Unit Time-Series (CRU TS) is data created and updated by the Climatic Research Unit at the University of East Anglia (UK), which is a compilation and reconstruction of data in various reliable data archives of climate records. Its application is broadly used because it has almost complete coverage of time, few or zero data gaps, and a relatively high spatial resolution. It covers the latitude and longitude, at a 0.5 × 0.5° resolution, almost 90 percent of the terrestrial surface, with the exclusion of Antarctica. It is also suitable for long-term climatic analyses because of its long time period [35]. In order to provide consistency across datasets at varying native resolutions, we resampled the CRU TS fields to a common 0.1° × 0.1° grid and picked 6 meteorological variables available in 2007–2022: cloud cover (cld), wet day frequency (wet), diurnal temperature range (dtr), precipitation (pre), daily mean temperature (tmp), and potential evapotranspiration (pet). These variables are important explanatory variables to be used in analyzing the drivers of dust activities.

2.2.4. ERA5

To assess the contributions of multiple factors to DAOD and study the dynamic mechanisms of a typical dust event, this study used ERA5 reanalysis data from the European Centre for Medium-Range Weather Forecasts (ECMWF). Previous studies have shown that meteorological and boundary-layer conditions, such as near-surface wind speed and boundary layer height, can strongly affect the accumulation, dispersion, and transport of particulate matter [36]. Therefore, ERA5-derived dynamic, humidity, soil moisture, and boundary-layer variables were introduced in this study. Specifically, we selected 10 m wind speed (ws10), 850 hPa wind speed (ws850), 700 hPa wind speed (ws700), 700 hPa vertical velocity (ω700), friction velocity (ustar), 2 m relative humidity (rh2m), surface soil moisture (sm), and boundary layer height (blh). These variables were used to reflect the effects of dynamic conditions, humidity, soil moisture, and boundary layer processes on DAOD variations. Wind speeds were calculated from wind components. rh2m was derived from 2 m temperature and 2 m dew point temperature. Since negative values represent upward motion and positive values represent subsidence, we reversed the sign of 700 hPa vertical velocity to construct the 700 hPa upward motion index (ω700-up). This index reflects atmospheric upward motion associated with dust vertical transport. All data were resampled to a spatial resolution of 0.1° × 0.1°.
For the typical dust event analysis, hourly ERA5 pressure-level data with a spatial resolution of 0.25° × 0.25° were used for 2–4 March 2021. We extracted zonal wind (u), meridional wind (v), and vertical velocity (ω) from several pressure levels (550, 700, and 900 hPa). The u and v components were used to rebuild the horizontal wind field. The ω component was used to assess the intensity of convective lifting and subsidence. This continuous 3D meteorological background field can help verify the HYSPLIT simulations. It also helps reveal the dynamic mechanisms of dust emission and vertical diffusion over the Qaidam Basin.

2.2.5. The 3D Distribution of Various Aerosol Types

Based on VFM data between 2007 and 2022, the research paper examines the primary types of aerosols and their vertical distribution patterns in the Qaidam Basin. The grid established to measure and study the vertical profiles of different aerosols in the basin was a 0.1° × 0.1° latitude–longitude grid used to extract and analyze. Due to the peculiarities of the geographical and climatic situation in this region, our study defines dust and polluted dust as mixed dust aerosols, while polluted continental and clean continental aerosols are grouped as mixed continental aerosols. Based on this, the aerosol type in this analysis was categorized into five groups, which included mixed dust aerosols, mixed continental aerosols, smoke aerosols, clean marine aerosols, and other types of aerosols.

2.2.6. Frequency of Dust Events

Based on the climatic characteristics of Northwest China, the year is divided into four distinct seasons: spring (March-May, MAM), summer (June-August, JJA), autumn (September-November, SON), and winter (December-February, DJF). In this study, the VFM dataset was used to extract profiles labeled as dust aerosols. Considering the high terrain elevation of the Qaidam Basin, the vertical distribution of dust aerosols was analyzed using height above ground level (AGL) rather than absolute altitude above sea level. Specifically, the surface elevation of each grid cell was first obtained from the digital elevation model (DEM), and then subtracted from the CALIPSO altitude levels to obtain the corresponding height relative to the local surface. The dust occurrence frequency was then calculated within four AGL layers, namely 0–2 km, 2–4 km, 4–6 km, and 6–8 km. The frequency of dust events (f) was subsequently calculated by dividing the number of dust aerosol profiles (Ndust) by the total number of aerosol profiles (Nall) within each vertical layer of every 0.1° × 0.1° grid cell:
f = N d u s t N a l l

2.2.7. Dust Layer

To identify dust layers, a 0.1° × 0.1° latitude–longitude grid was constructed. Within each grid cell, vertically continuous layers consisting solely of dust aerosols, as identified in the VFM dataset, were defined as dust layers [24]. Given the arid geographical and climatic conditions of the study area, a minimum effective thickness constraint was introduced to ensure the robustness and significance of the identified layers. A critical condition of 180 m was used, and only dust layers having a vertical thickness of 180 m and high spatial continuity were left to be analyzed further [21]. The layer-top height, layer-base height, and the thickness of the layer were picked out for every valid dust layer. To reduce the influence of complex terrain, the bottom height, top height, and thickness of the dust aerosol layer are expressed as heights above ground level (AGL).

2.2.8. LASSO Regression Model and SHAP-Based Interpretability Analysis

The Least Absolute Shrinkage and Selection Operator (Lasso) regression model, introduced by Tibshirani in 1996, is a method that builds upon the traditional least squares loss function [37]. It incorporates an L1 norm penalty term on the regression coefficients and performs shrinkage by adjusting the regularization parameter λ. This forces less significant coefficients to shrink to zero, thereby automatically selecting variables and reducing the model’s dimensionality [38]. Lasso is particularly suitable for handling problems involving large numbers of variables and multicollinearity [39]. To provide deeper insight into the model’s outputs, SHAP is employed. Based on cooperative game theory, SHAP decomposes the model prediction into the individual contributions of each feature [40]. This method is versatile across various model architectures and provides both local interpretability for individual samples and global importance assessments through aggregated statistics [41]. Furthermore, SHAP quantifies the relative contribution and directional effects of features, offering a comprehensive understanding of the driving mechanisms [42].
In this study, DAOD across the study area was defined as the dependent variable. We adopted six standardized meteorological factors from CRU (cld, pre, tmp, wet, dtr, and pet) and variables derived from ERA5 (ws10, ws850, ws700, ω700-up, ustar, rh2m, sm, blh) were used as independent variables to construct a LASSO regression model for parameter estimation and variable selection. To evaluate the model’s performance, this study employs the goodness of fit (R2) and root mean square error (RMSE) as evaluation metrics. To further quantify the contribution strength and directional impact of each meteorological variable on DAOD, SHAP is introduced to provide interpretability analysis based on the optimal Lasso regression model, thus evaluating the global importance of each variable and revealing their marginal contribution characteristics to dust activity.

2.2.9. HYSPLIT

The Hybrid Single-Particle Lagrangian Integrated Trajectory (HYSPLIT) model, created by the Air Resources Laboratory of the National Oceanic and Atmospheric Administration (NOAA), is a specialized model that can be used to simulate the complex chemical processes of transformations and deposition [43]. It is usually employed in determining and examining the transport and diffusion paths of pollutants in the atmosphere [44]. The model is primarily divided into two types: forward diffusion simulation and backward trajectory simulation. In this study, the backward trajectory scheme is applied, with the National Centers for Environmental Prediction/Global Forecast System (NCEP/GFS) meteorological fields as input. The core city of Delingha in the eastern part of the Qaidam Basin is set as the starting point, with three different arrival heights (1000 m, 3000 m, and 5000 m) established above the city. A 72 h backward trajectory tracking of air masses is conducted for the dust event that occurred from 2 to 4 March 2021. The results are then combined with the CALIPSO Total Backscatter Coefficient (TBC) vertical profile to identify the dust source regions and the vertical stratification characteristics of the transport pathways in the Qaidam Basin.

3. Results

3.1. Vertical Distribution of Different Aerosol Types

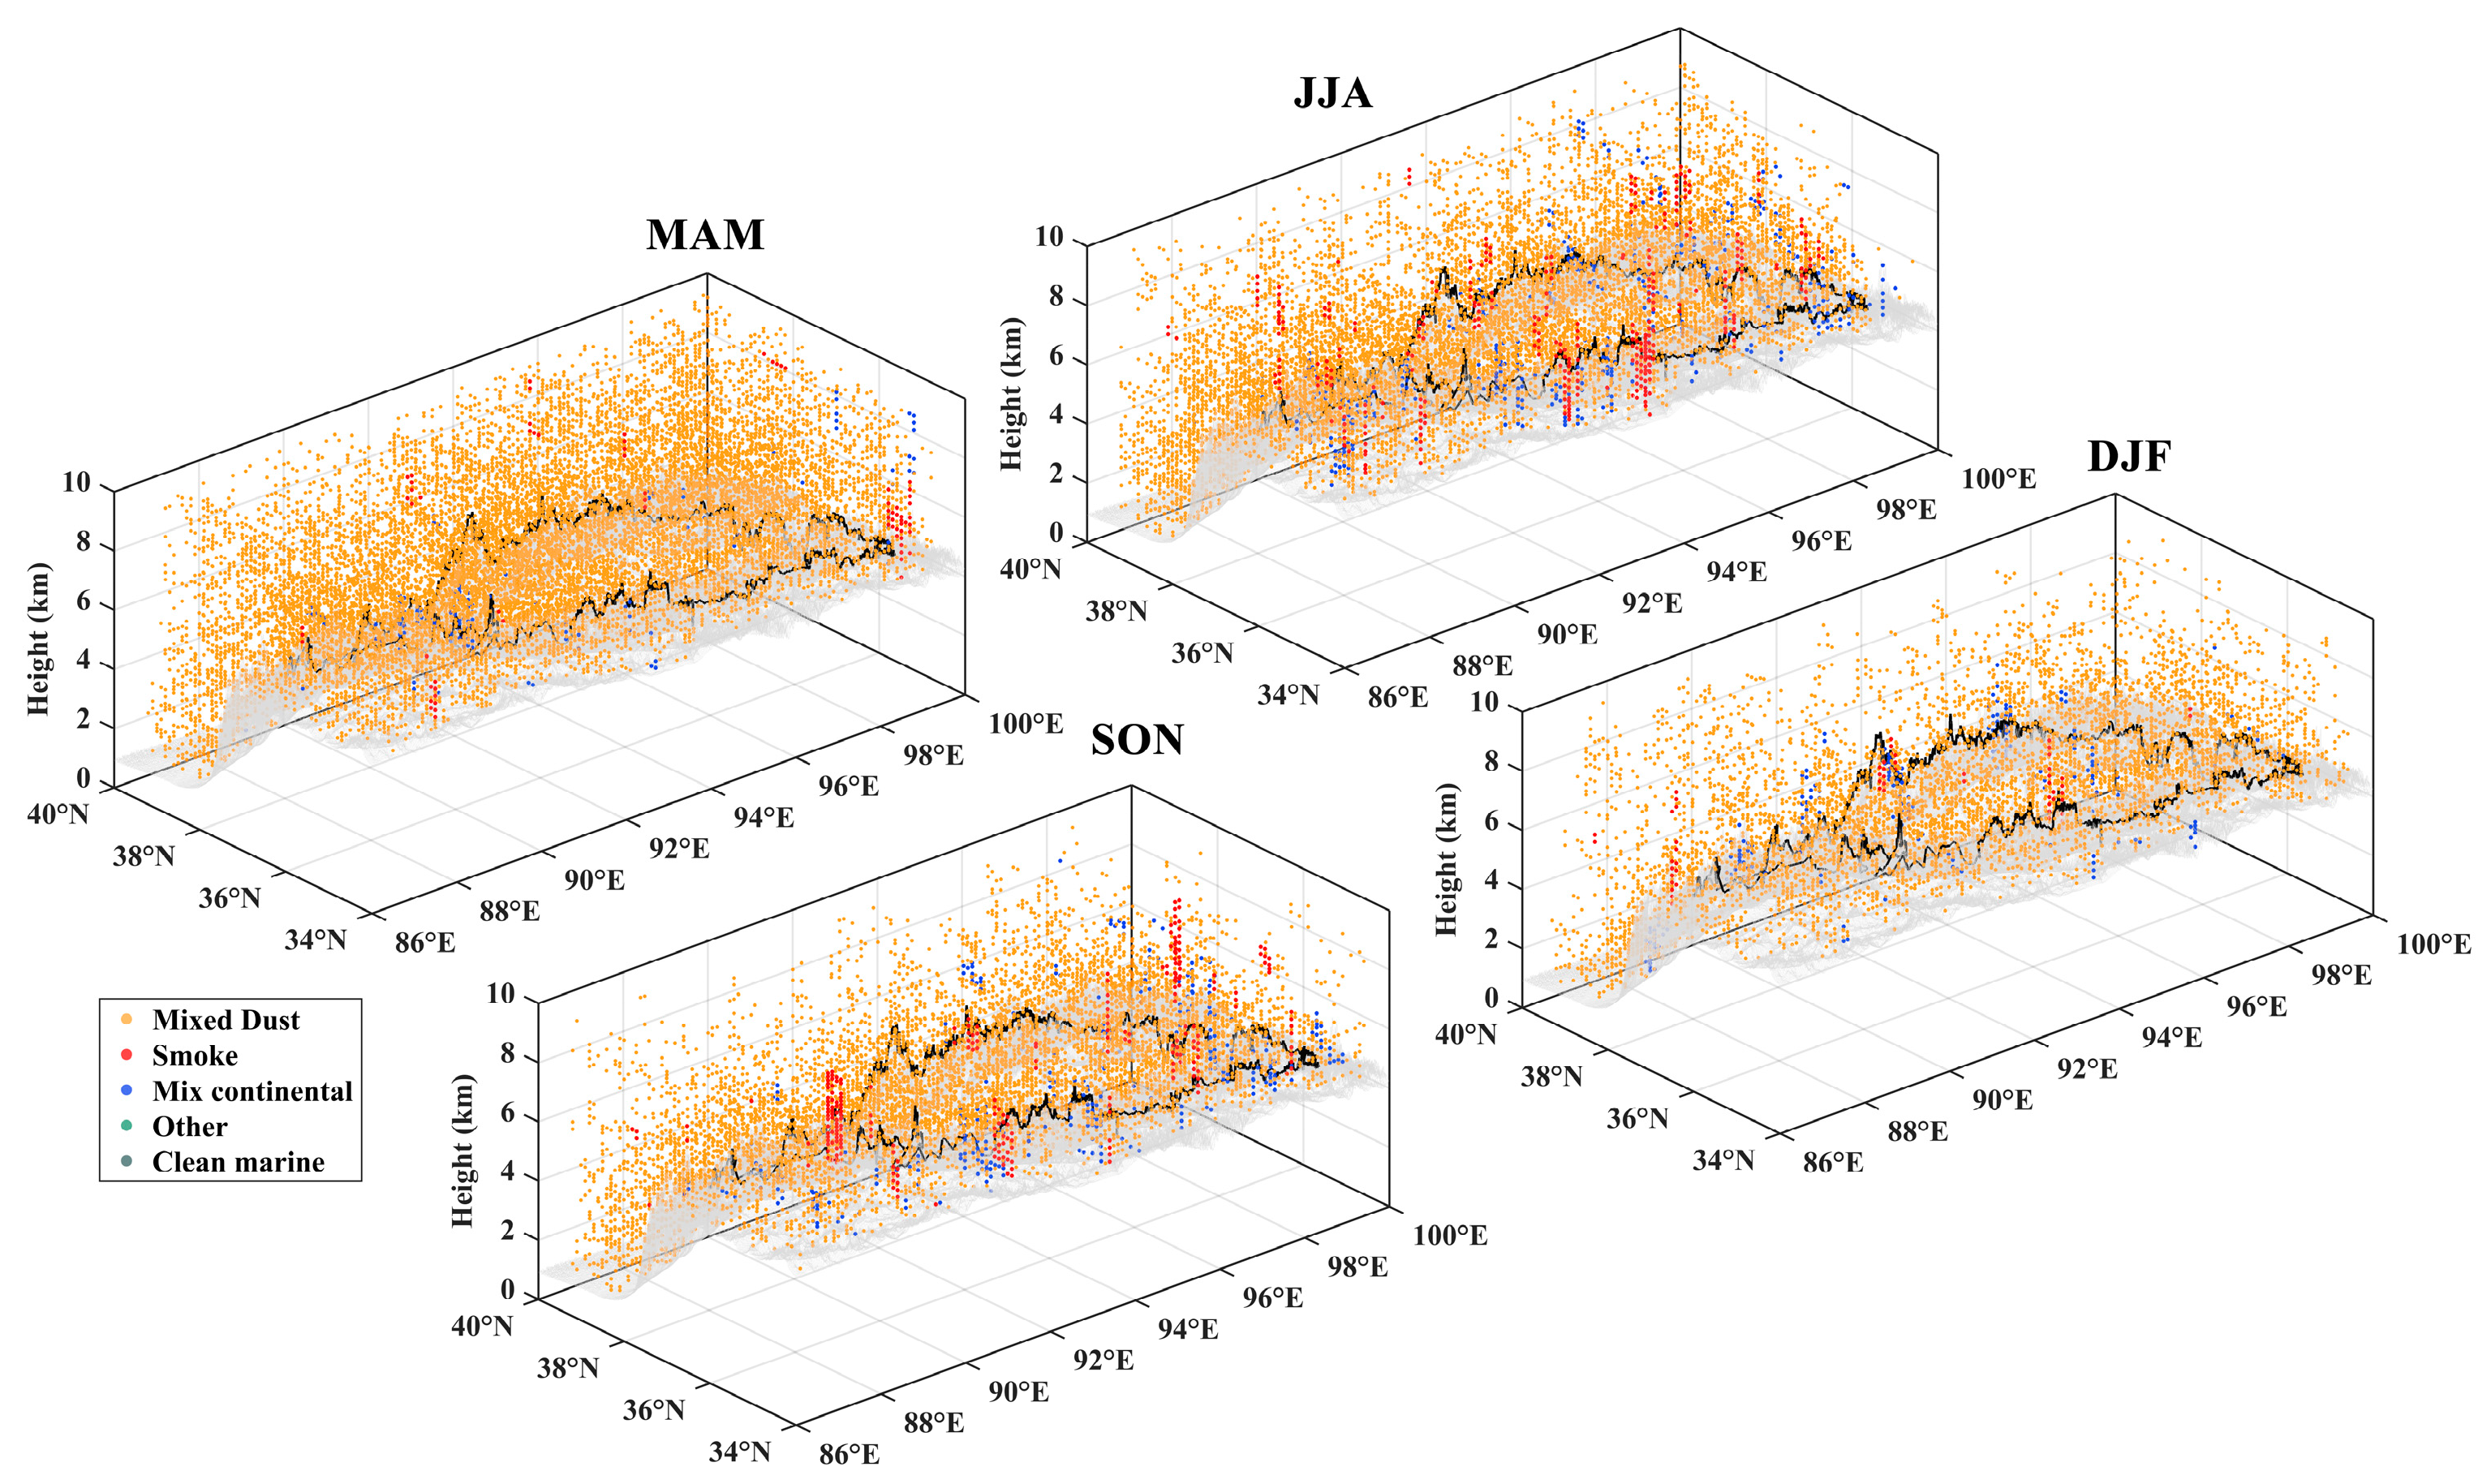
In order to identify the dominant aerosol types over the Qaidam Basin, this study analysed the aerosol classification data of CALIPSO VFM products from 2007 to 2022. Figure 2 shows the seasonal evolution characteristics of the vertical distribution of various aerosols. The results show that during MAM, the proportion of total aerosols accounted for by mixed dust aerosols reached its peak, showing a high degree of continuity in space, and its vertical height can be expanded to about 10 km. In contrast, the total amount of aerosols in JJA is lower than that in spring. At the same time, the proportion of other types of aerosols (especially smoke and mixed continental aerosols) has increased, but mixed dust aerosols still maintain a dominant position. In SON and DJF, the vertical extent of aerosols decreases noticeably, with aerosol particles mainly distributed in the lower to middle troposphere below approximately 6 km above sea level, indicating a clear low-altitude aggregation pattern.
In summary, the distribution of aerosols over the Qaidam Basin shows distinct seasonal characteristics. Mixed dust aerosols are the dominant type of aerosols over the Qaidam Basin. In view of the absolute advantage of dust aerosols in the composition of regional atmospheres and the heterogeneity of time and space of its vertical stratification, the following chapters will carry out a multi-dimensional in-depth discussion on dust aerosols.

3.2. Spatiotemporal Variation Characteristics of DAOD

3.2.1. Spatial Distribution of Annual and Seasonal Mean DAOD

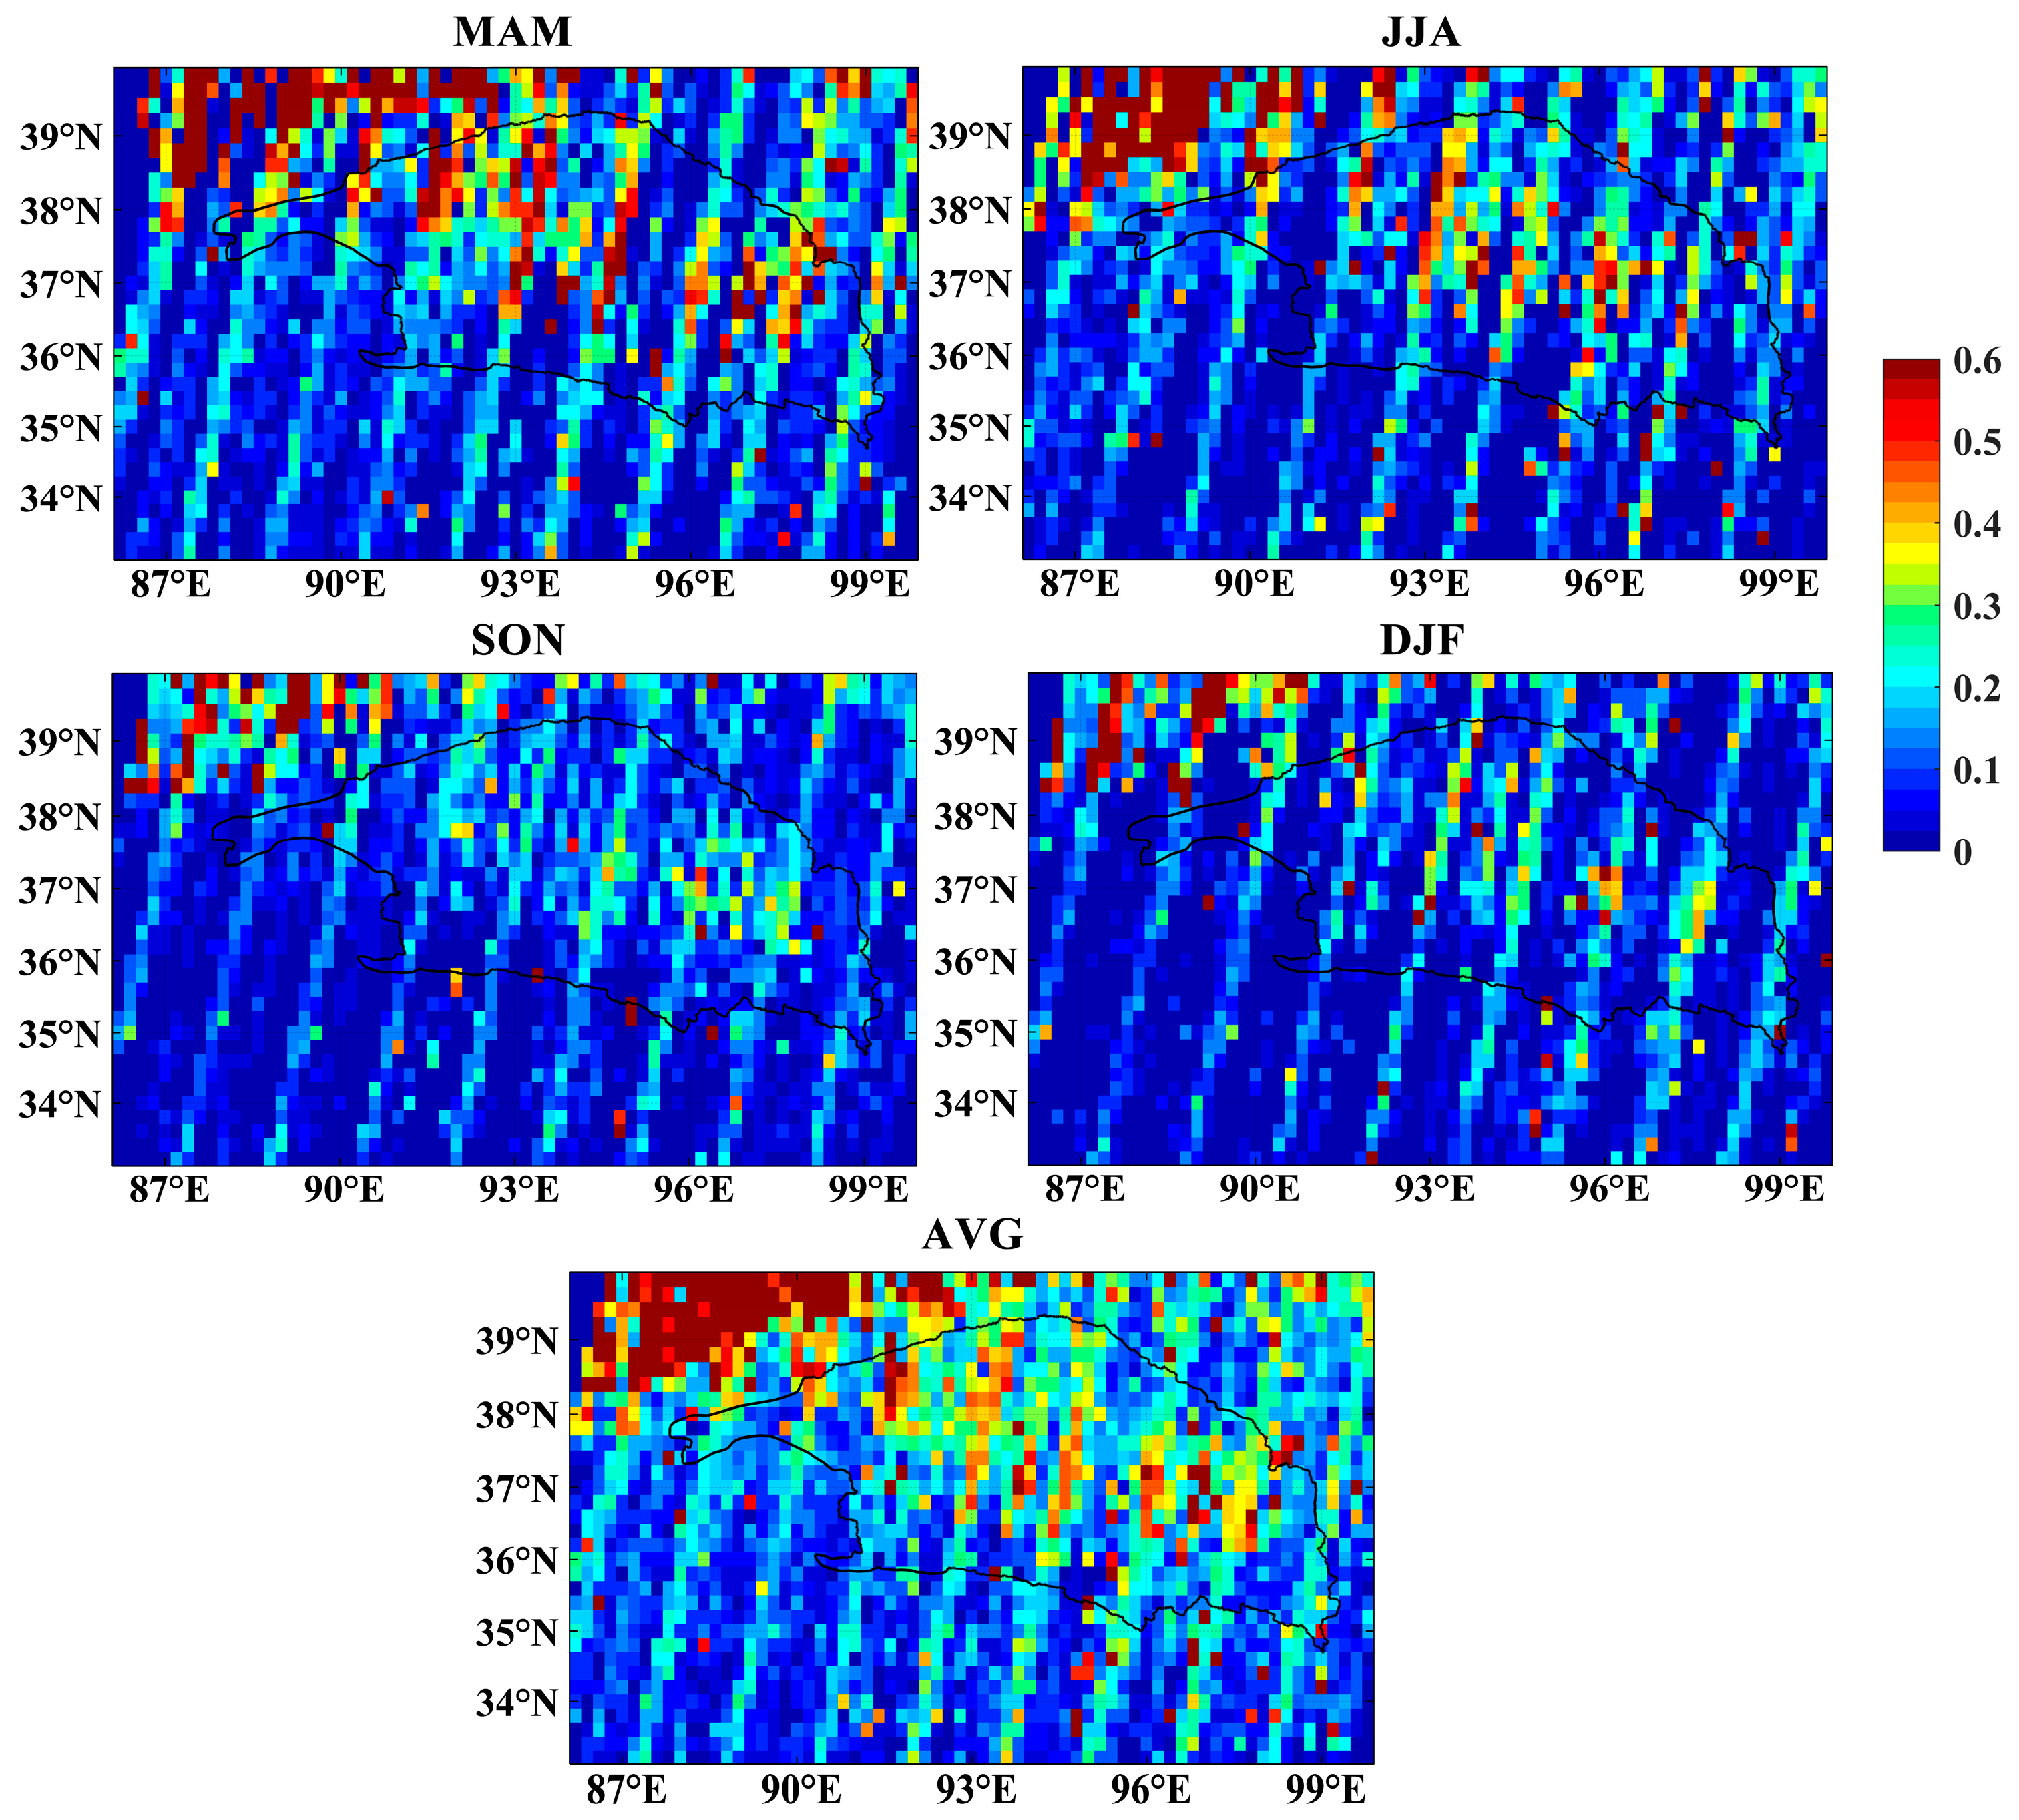
The CALIPSO APRO dataset was processed to derive both seasonal and annual spatial distributions of DAOD over the Qaidam Basin, as shown in Figure 3. During the spring, areas having high values of DAOD (more than 0.50) were very much centered in the northwestern and central areas of the basin, with some areas registering values as high as 0.60. Throughout the summer period, DAOD decreased across the entire basin, though the central region continued to exhibit high concentration levels. In autumn and winter, DAOD generally dropped below 0.30. According to the annual mean spatial distribution, there were comparatively high values of the DAOD at the central and northwestern regions of the basin, and the values are low towards the outer boundaries.
Considering the possible influence of CALIPSO orbital sampling on the spatial pattern, the orbital sampling distribution and valid sample count were further examined (Figure S1). To reduce the possible impacts of sparse observations on the spatial distribution, CALIPSO DAOD was further aggregated to 0.5° × 0.5° (Figure S2), and MERRA-2 DAOD was resampled to the same spatial resolution for comparison (Figure S3). The main high-value areas of the aggregated CALIPSO DAOD are generally consistent with those from the original 0.1° × 0.1° results. Meanwhile, MERRA-2 DAOD shows a similar spatial pattern, with relatively high dust loading mainly located in the central and northwestern parts of the basin. These results suggest that the main spatial characteristics derived from CALIPSO are relatively stable and can support the subsequent analysis of DAOD spatiotemporal variations.
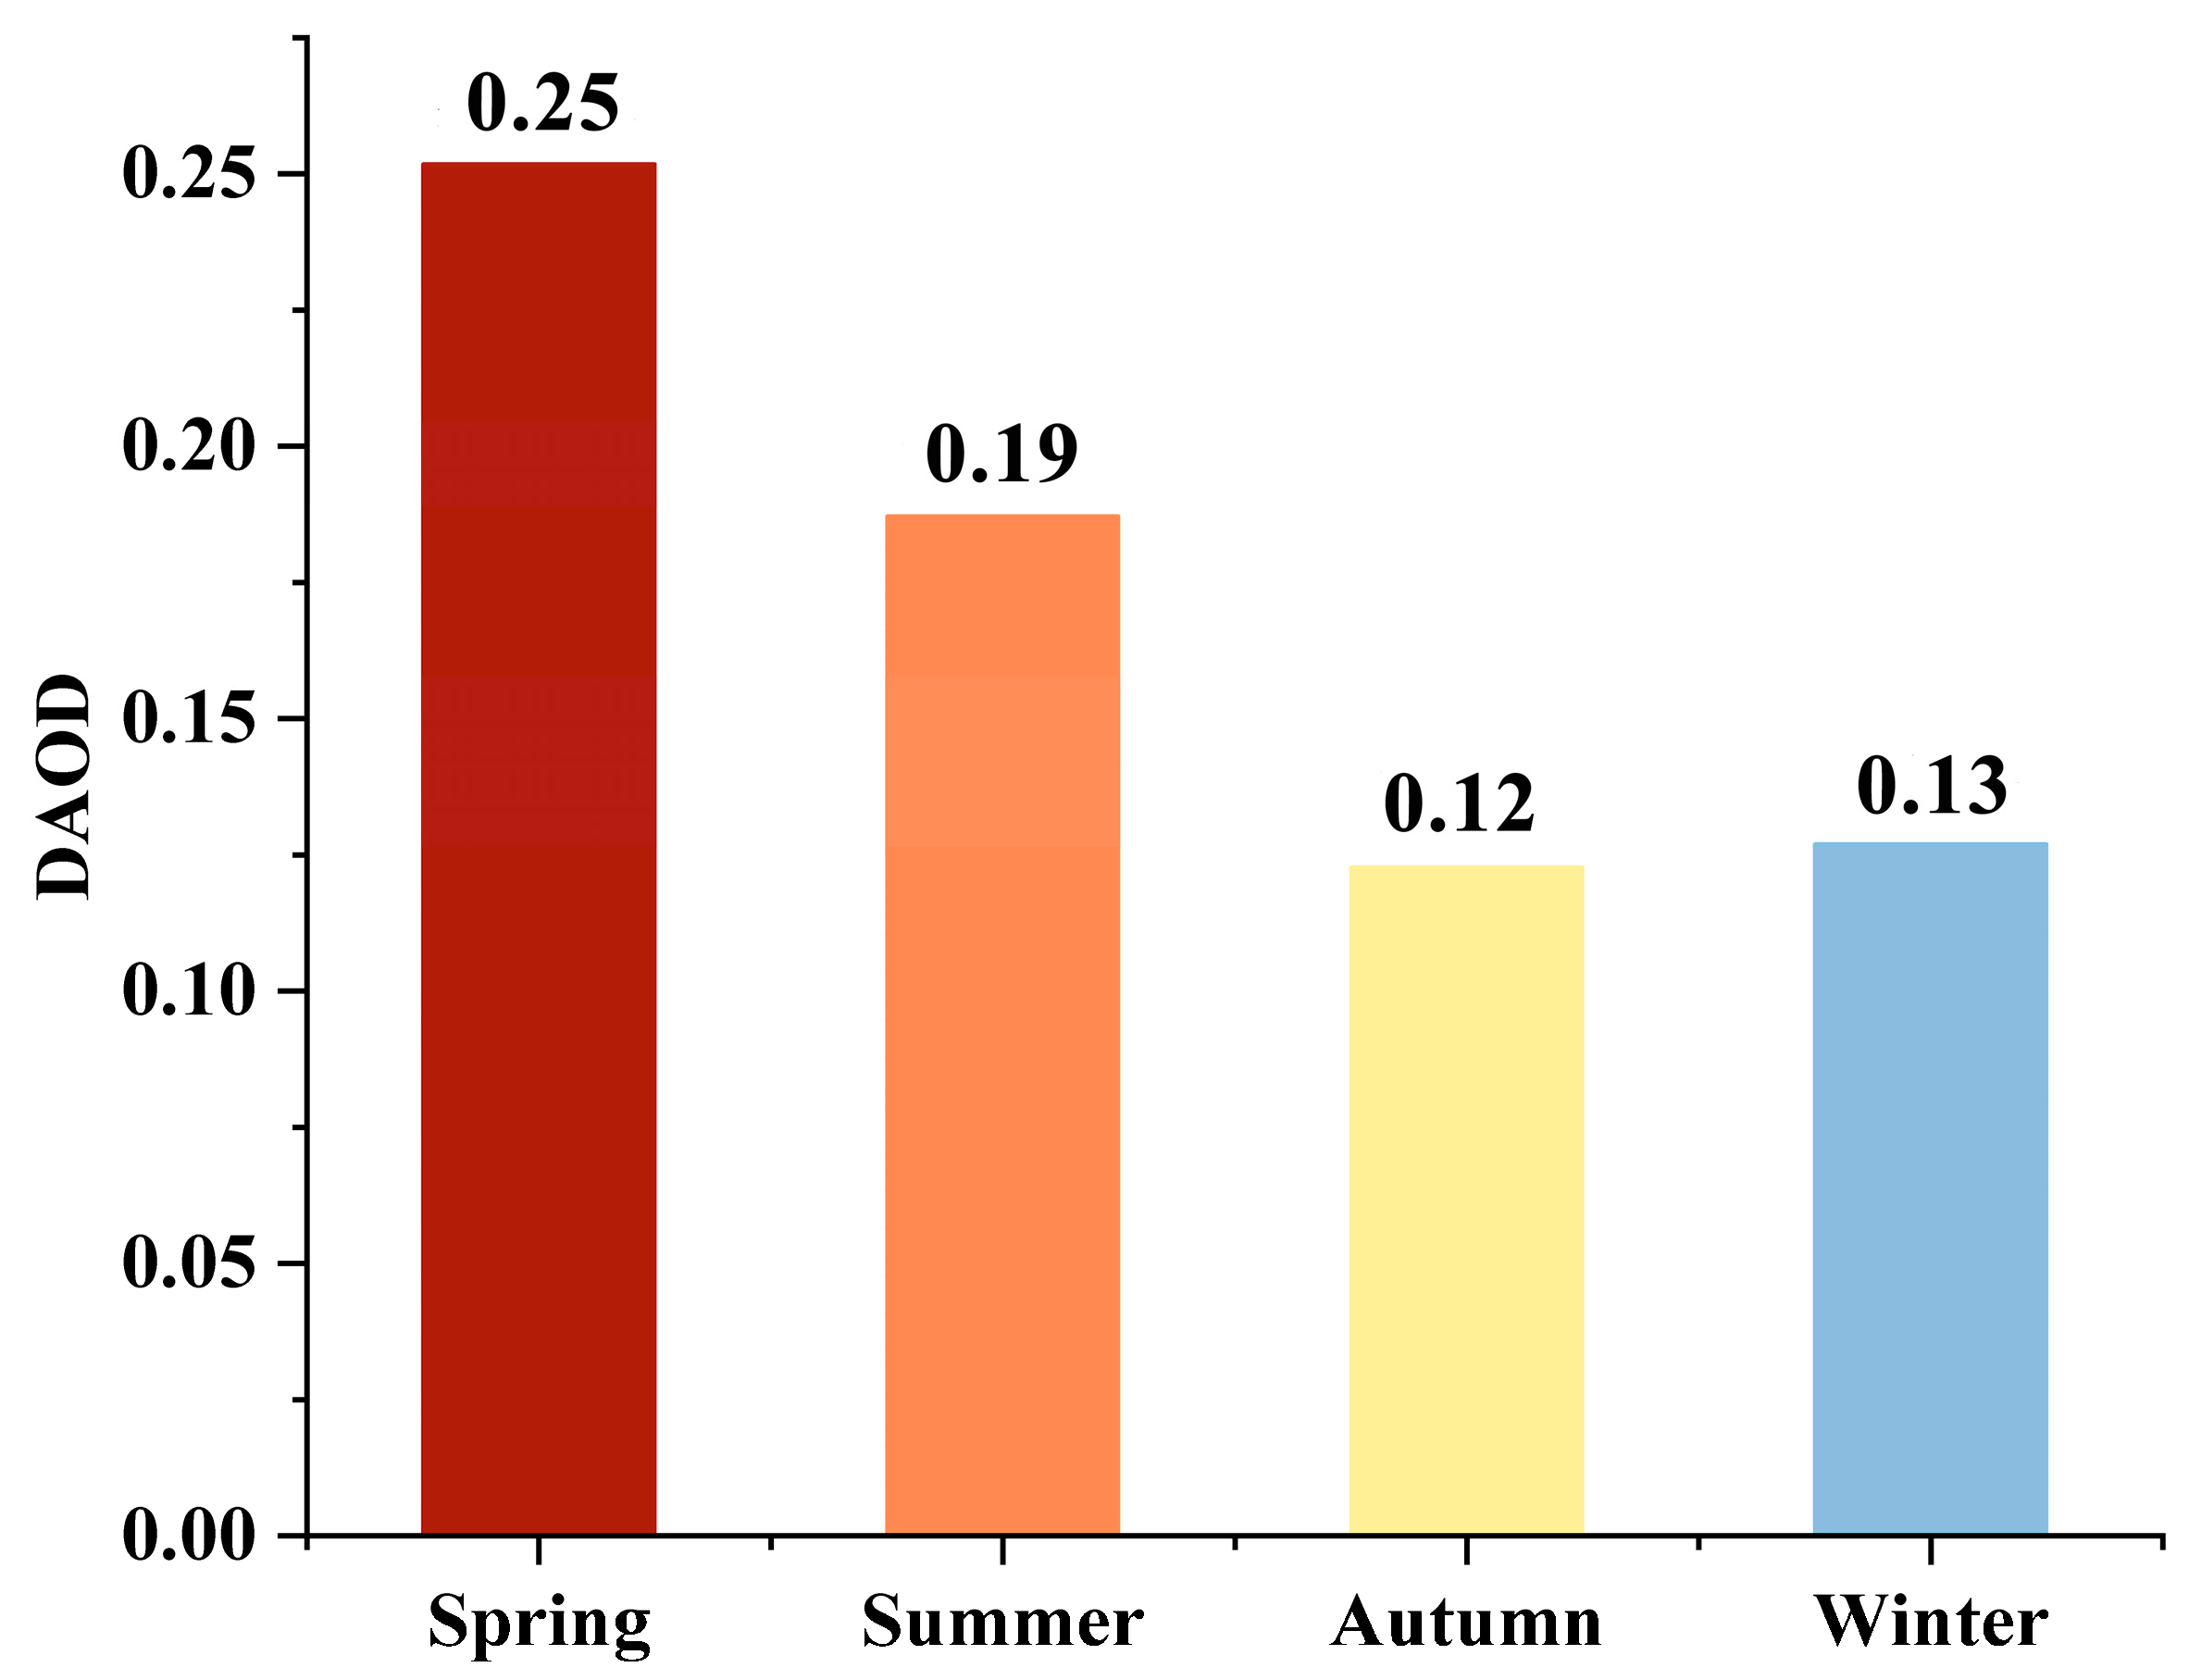
In addition to the spatial pattern, basin-averaged seasonal DAOD values were also calculated, seasonal averages of the DAOD in the Qaidam Basin were obtained, and the results were displayed in a bar chart (Figure 4). It is evident that the highest DAOD occurred in spring (0.25), while the lowest was observed in autumn (0.12). Overall, the seasonal trend indicates that spring displays significantly higher DAOD levels compared to other seasons.

3.2.2. Spatial Distribution of Monthly Mean DAOD

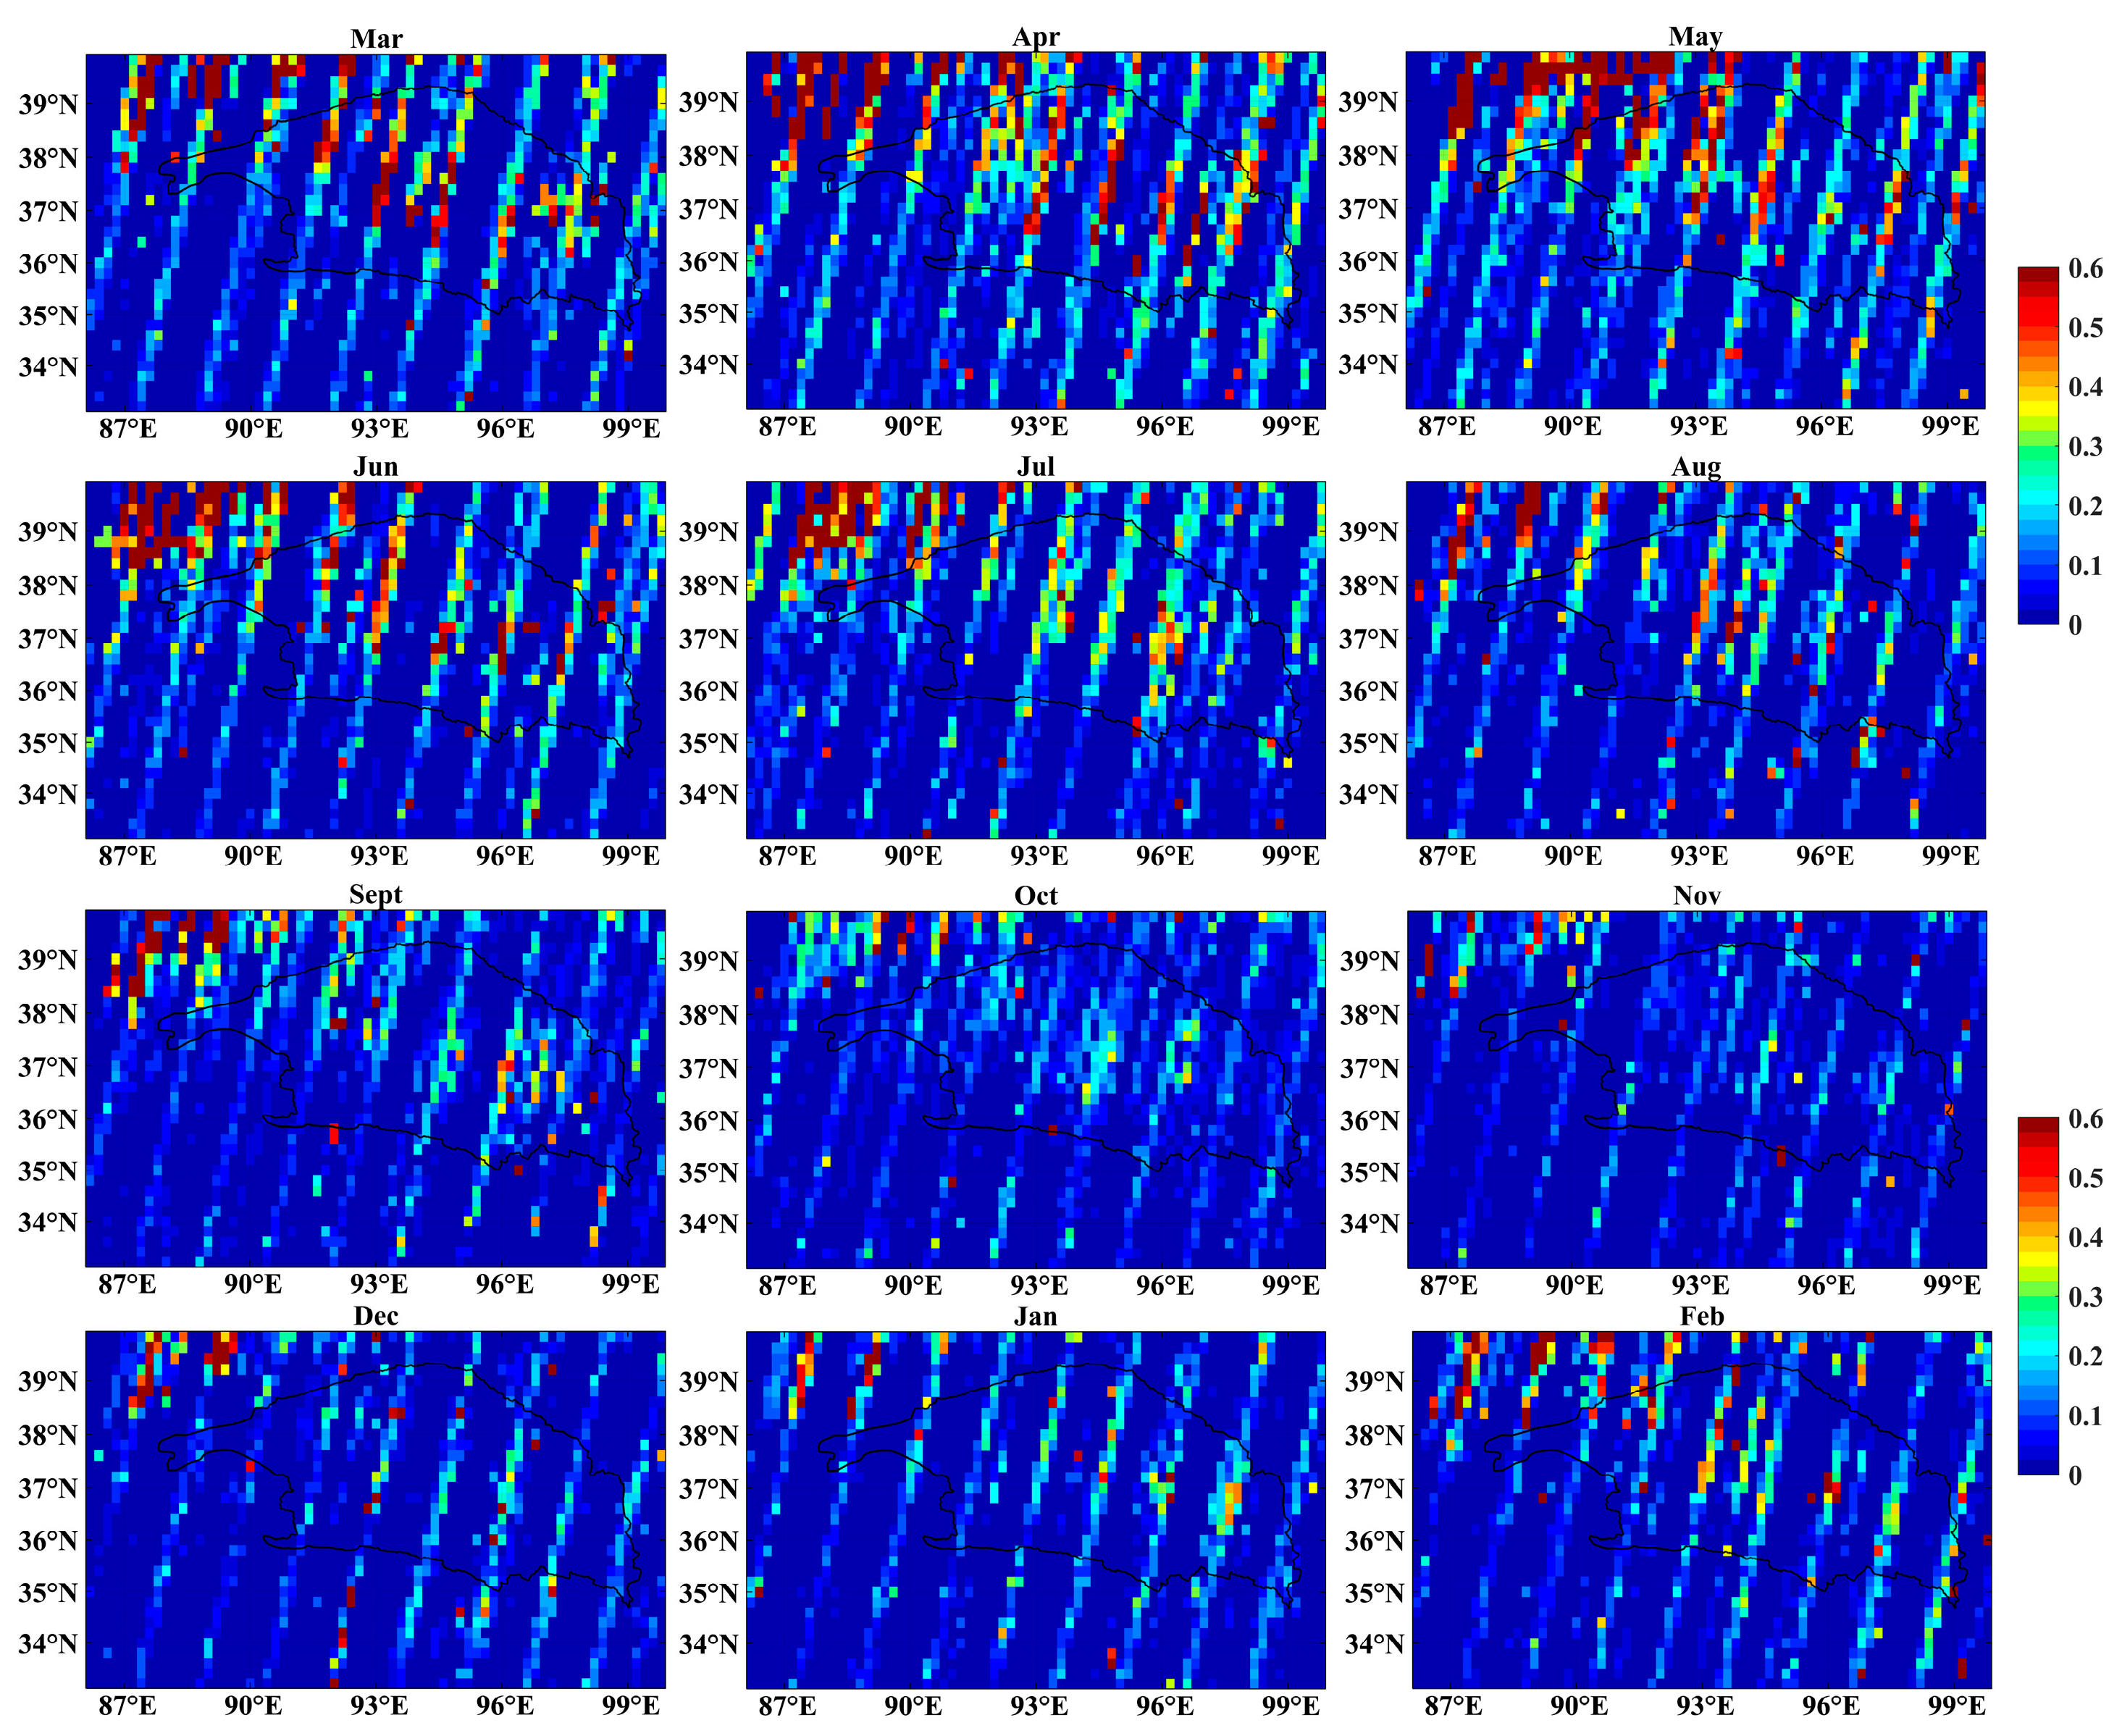
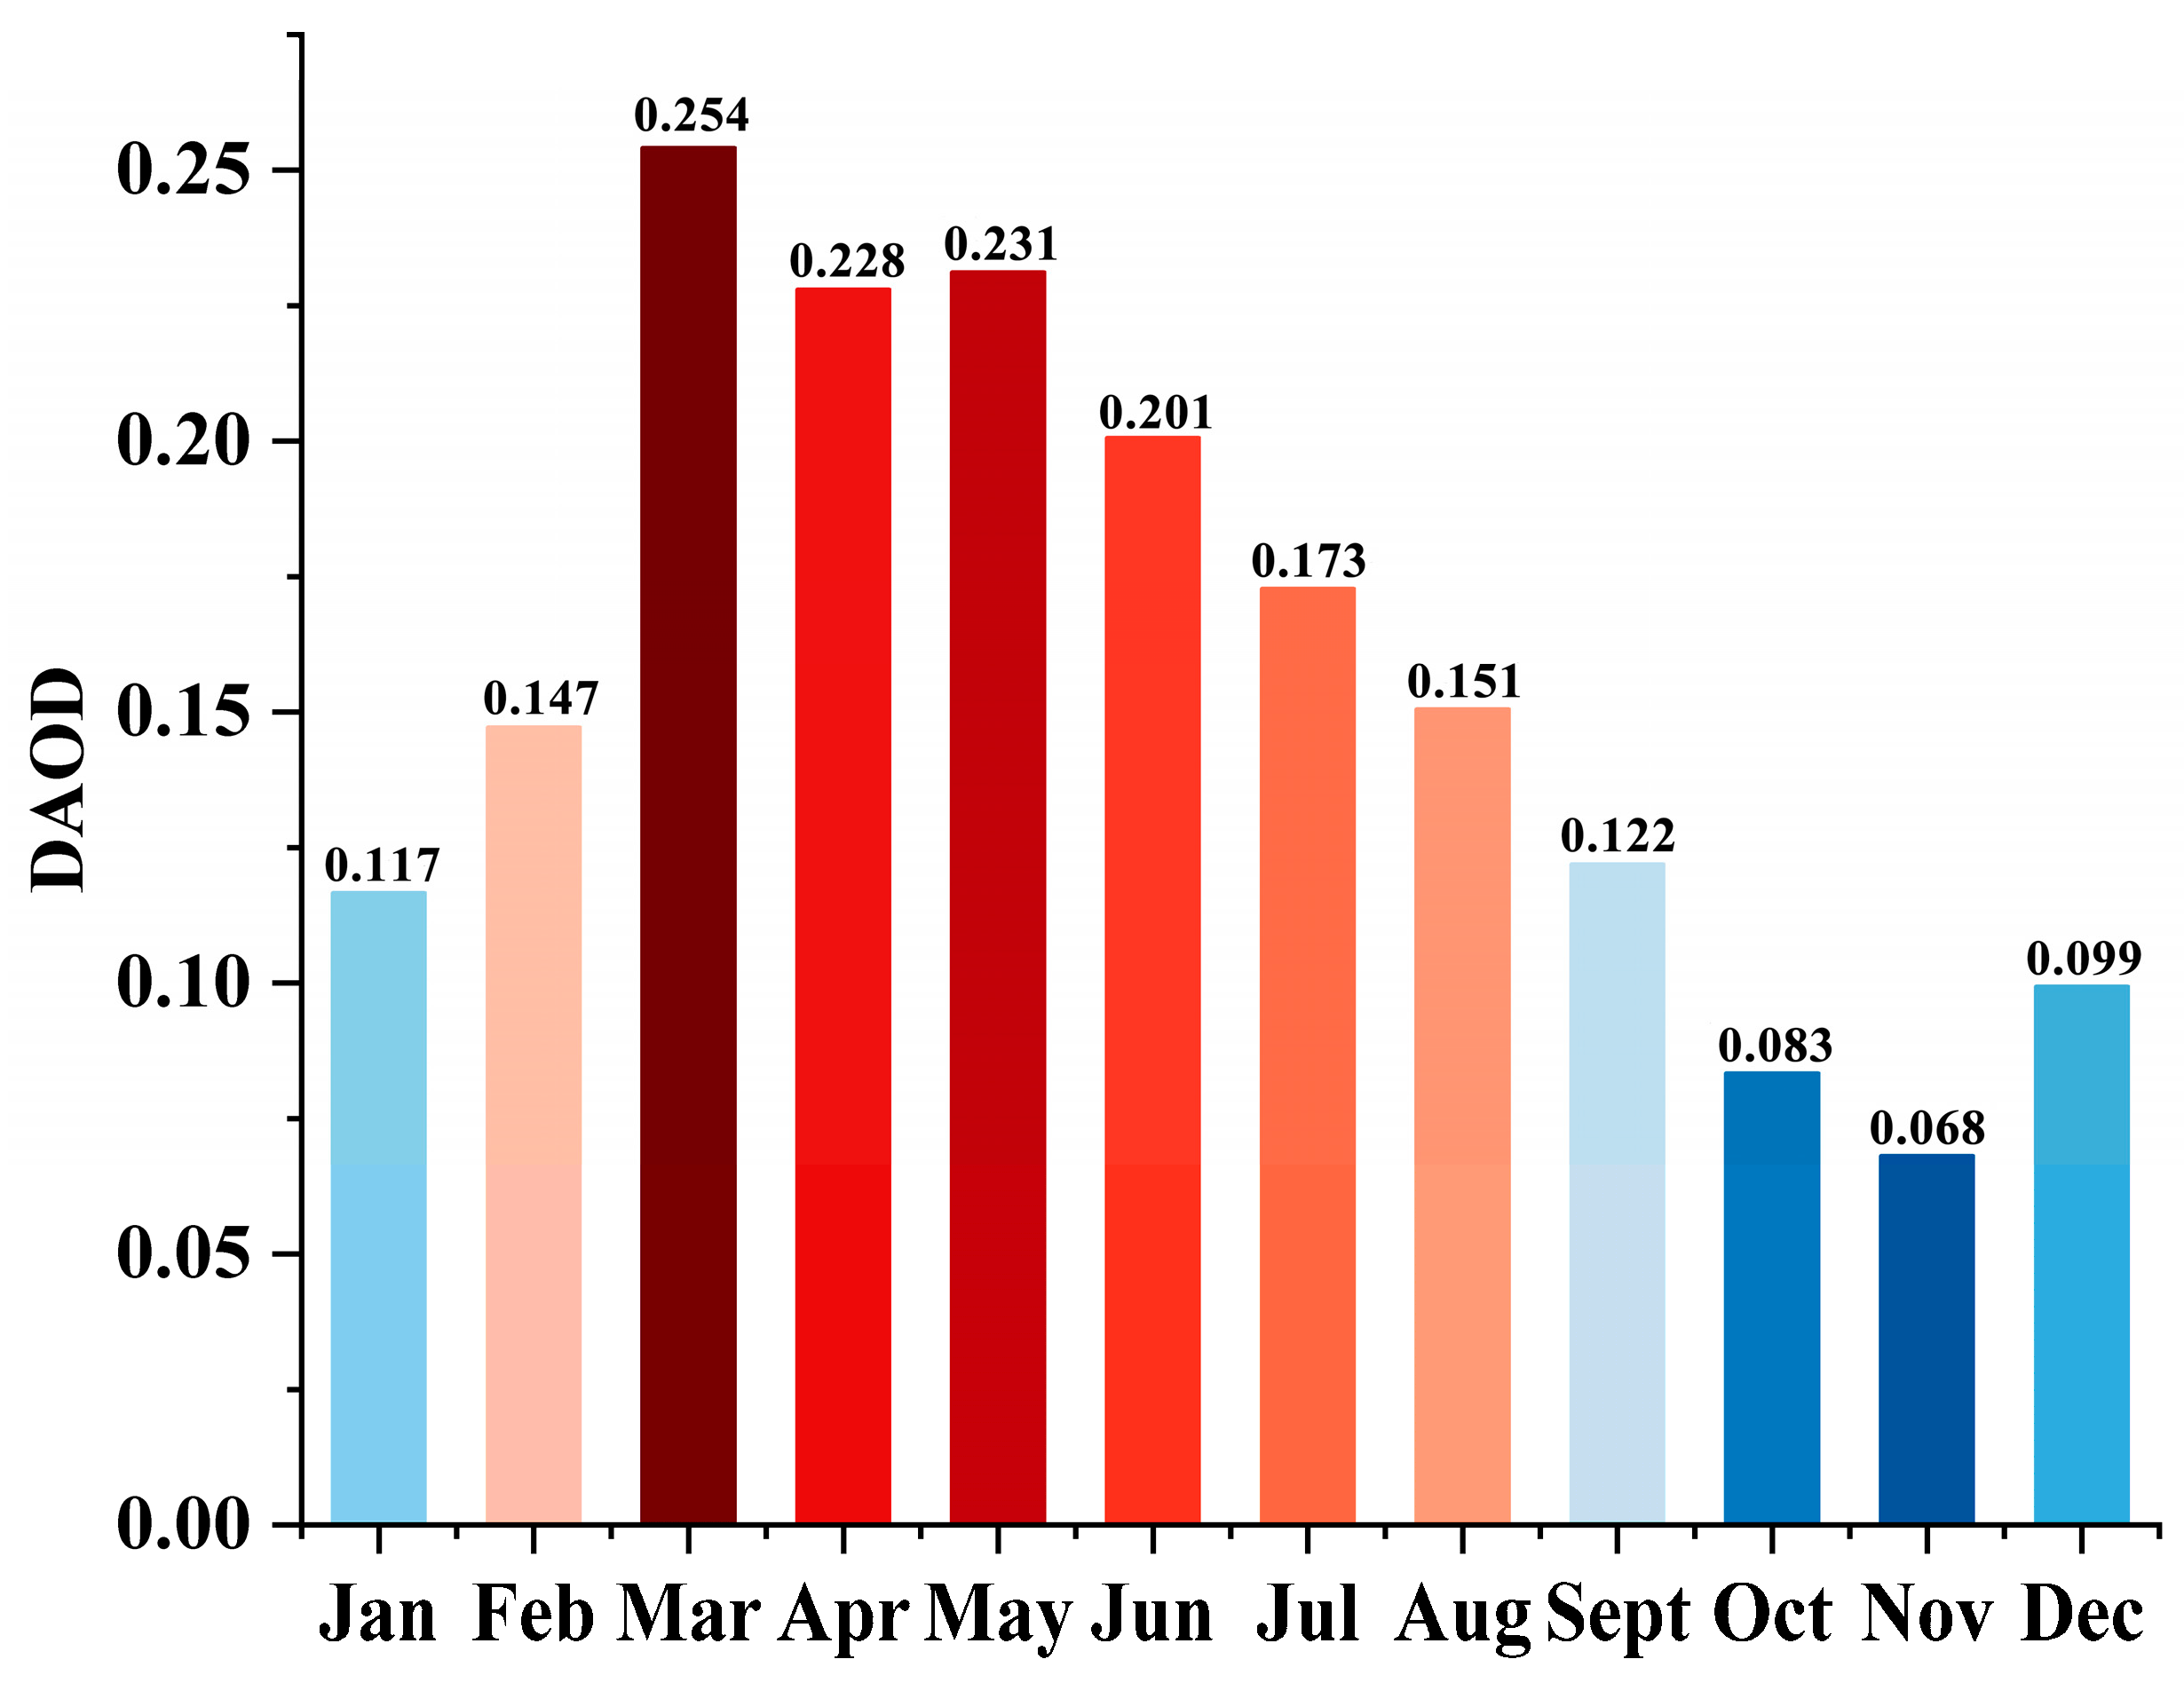
To further investigate the spatiotemporal characteristics of DAOD over the Qaidam Basin, a multi-year monthly mean spatial distribution map of DAOD was constructed based on the seasonal averages (Figure 5). During this period, the results revealed that high DAOD were concentrated between March and June. The center of these high values gradually shifted from the northwestern part of the region to the central part. Specifically, the maximum values were condensed at the western basin during the period between March and May, and the range of the presence of high DAOD values significantly increased. The DAOD high-value zone began to be focalized in the central basin starting in September, and the values of DAOD in the northwest reduced significantly. Quantitative values of the monthly mean DAOD, which were extracted and represented in Figure 6, show that DAOD peaked in March at 0.254. The three months with the highest DAOD values all happened in the spring, which supports the pattern we saw earlier. From September to December, DAOD stayed pretty low, with the lowest value being 0.068 in November.

3.2.3. Interannual Variation of DAOD

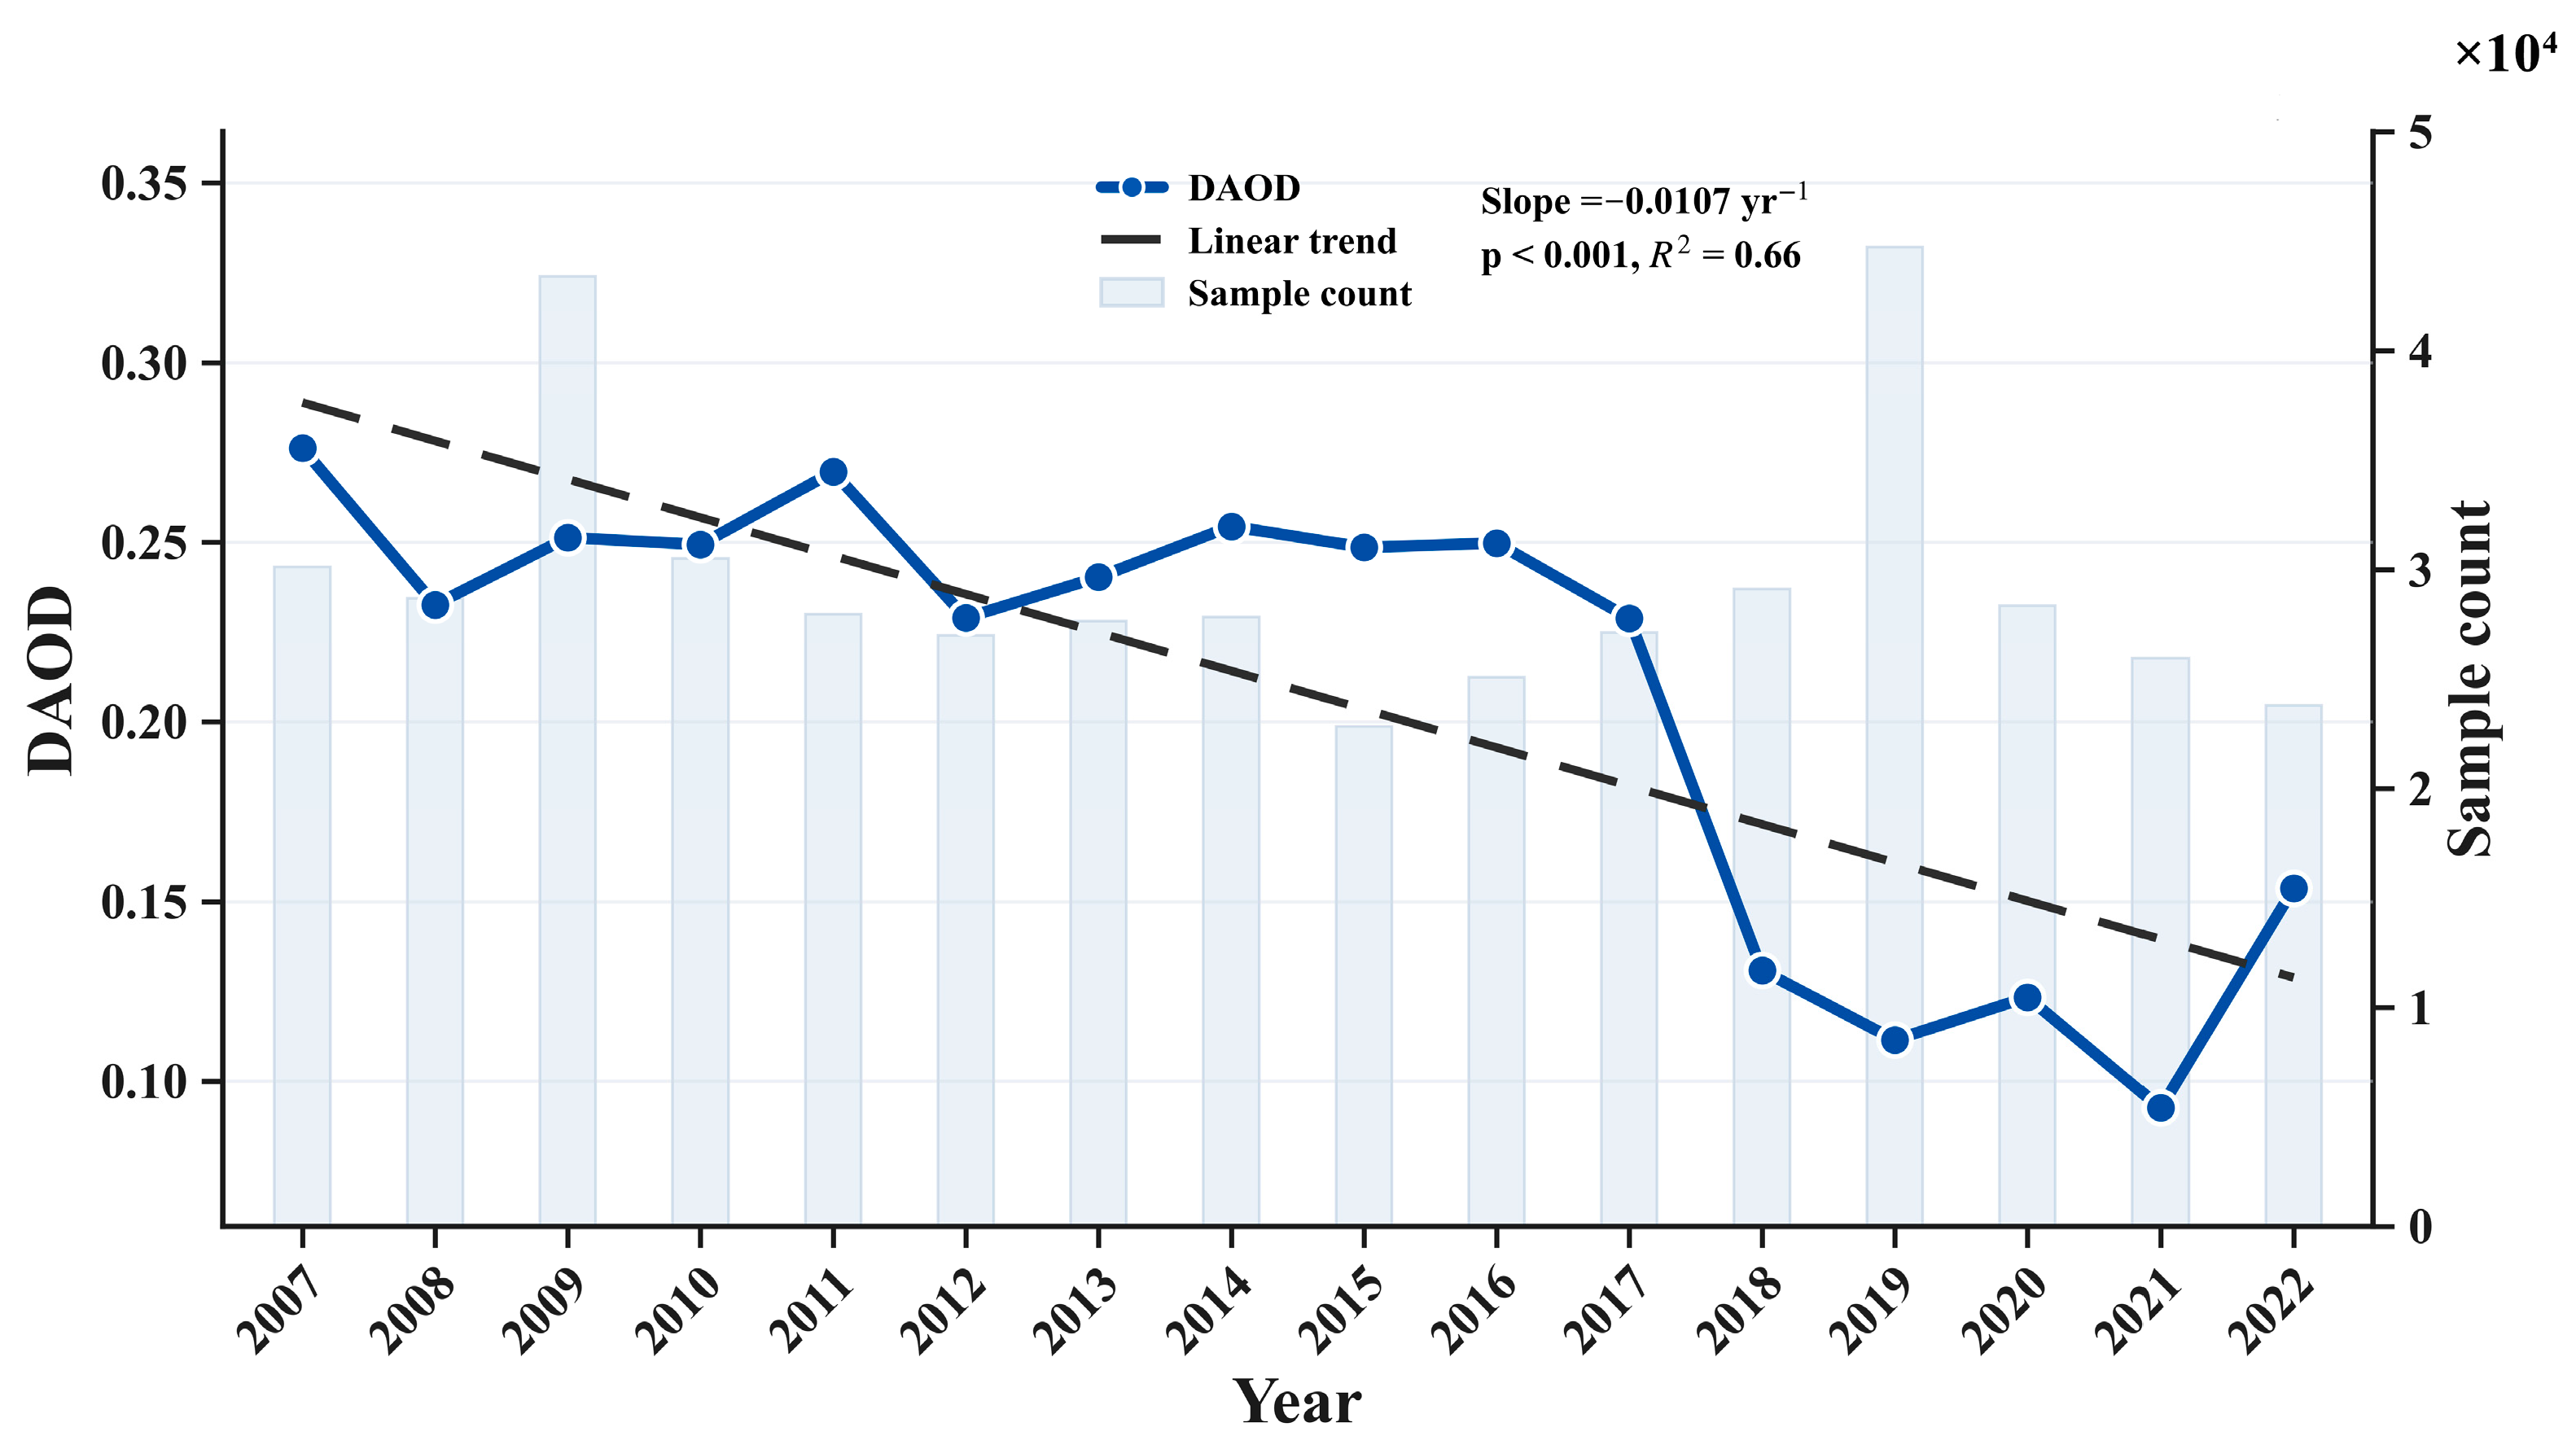
Figure 7 presents the interannual variation of DAOD over the Qaidam Basin from 2007 to 2022. DAOD shows an overall decreasing trend, with annual mean values fluctuating between 0.09 and 0.28. From 2007 to 2017, DAOD remained at a high level, and most annual means exceeded 0.22. Two peak values appeared in 2007 (about 0.28) and 2011 (about 0.27). DAOD dropped obviously after 2017 and stayed at a low level from 2018 to 2021. The minimum value of approximately 0.09 in the entire study period occurred in 2021. DAOD rebounded slightly in 2022, but it was still lower than the average level.
Linear fitting results indicate a significant decreasing trend of DAOD over the 16 years. The decreasing rate is −0.01 yr−1. The trend passes the significance test at the 0.001 level, with a coefficient of determination R2 of 0.66. This indicates that DAOD has an obvious downward trend in this region. In addition, the annual number of CALIPSO samples shown in the bar chart stays stable. It does not decline along with DAOD. This rules out the possibility that low DAOD results from reduced observation frequency, and verifies that the decline of DAOD reflects real changes in the atmospheric environment.
In general, DAOD over the Qaidam Basin decreases distinctly during the study period. Low values are particularly notable after 2017.

3.3. Occurrence Frequency of Dust Aerosols

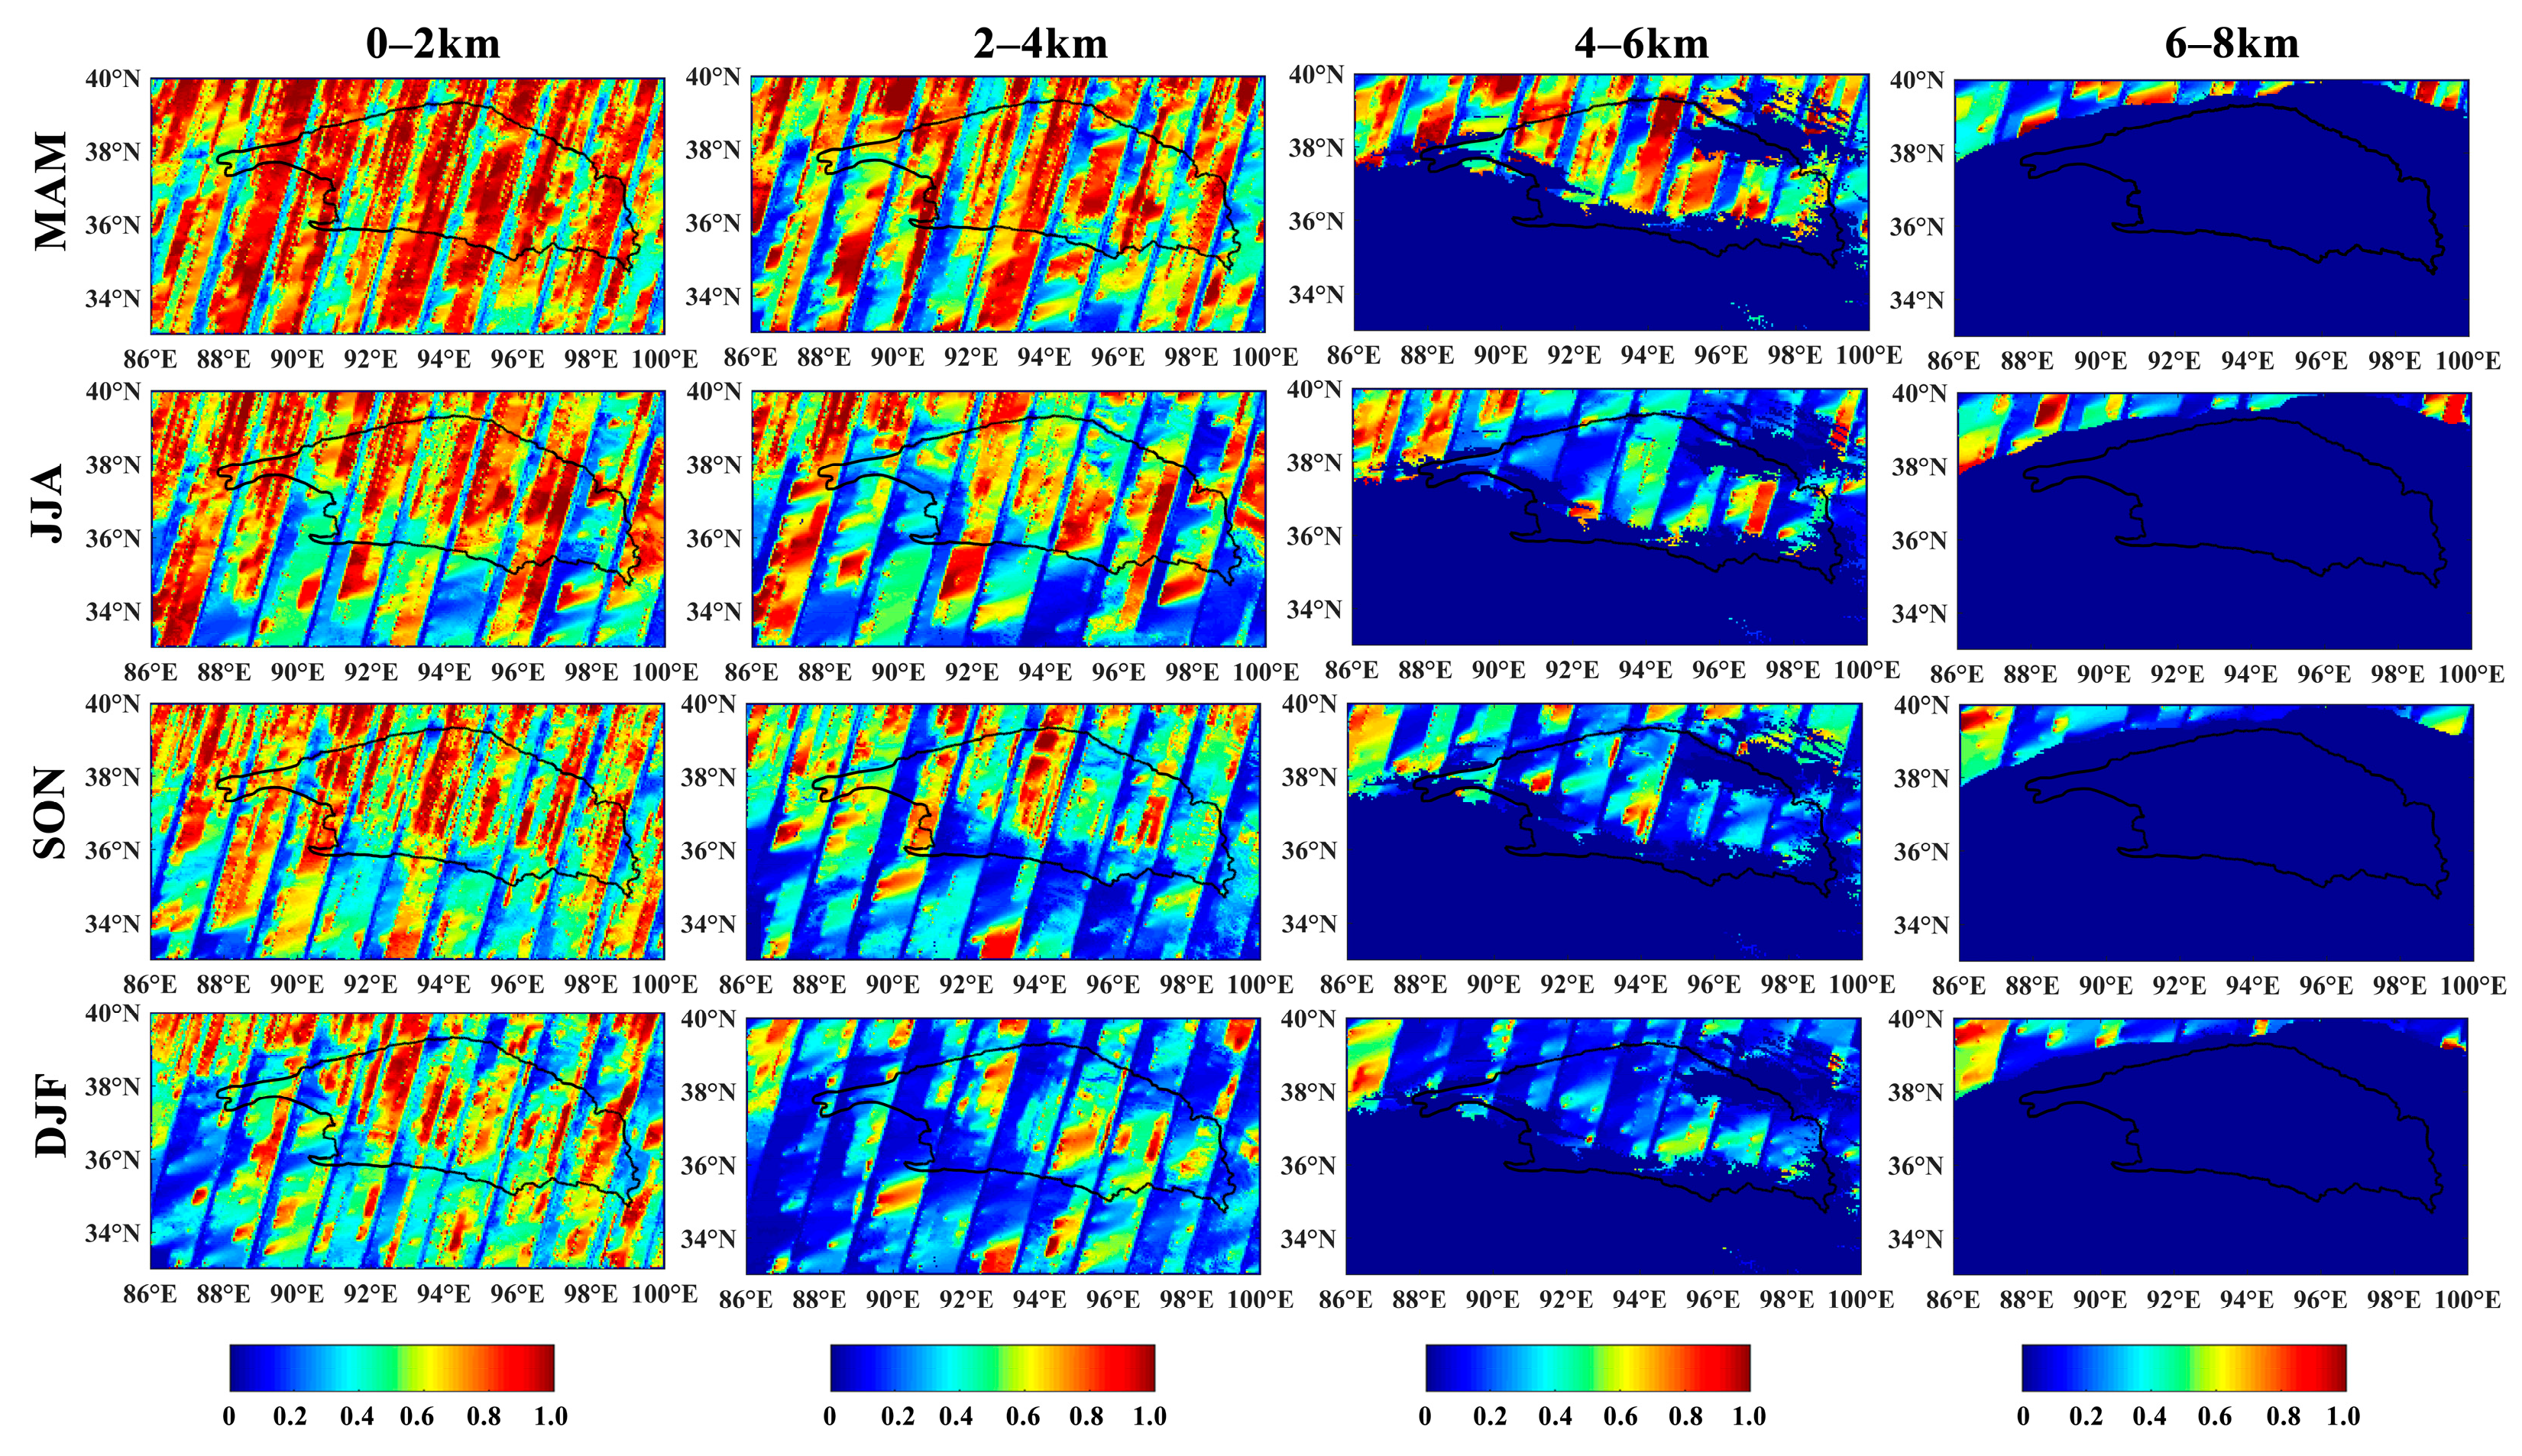
Based on processing results from the CALIPSO Level 2 VFM product, this study analyzed the seasonal occurrence frequency of dust aerosols at various height layers (0–2 km, 2–4 km, 4–6 km, and 6–8 km AGL) over the Qaidam Basin. The results are illustrated in Figure 8.
The findings reveal distinct vertical variations in dust aerosol occurrence frequency over the basin. Occurrence frequencies are relatively high across all seasons within the 0–2 km and 2–4 km height layers. The frequency in the 4–6 km layer is significantly lower than that in the 2–4 km layer, indicating that dust aerosols are primarily active in the lower atmosphere. Meanwhile, the spatial distribution in the 6–8 km layer is markedly influenced by high-elevation terrain. In terms of spatial distribution, the “basin effect” is pronounced, with frequencies in the central region generally higher than those in the surrounding areas. Seasonally, dust activity peaked during MAM, and JJA also exhibited widespread dust distribution in the 0–2 km and 2–4 km layers, while activity subsided overall during SON and DJF, although significant dust signals persisted in the lower layers.
In summary, dust aerosol occurrence frequency over the Qaidam Basin is characterized by high frequency at low altitudes, generally decreasing with increasing height above ground level. Dust activity is primarily concentrated within the 0–4 km range above the surface.

3.4. Dust Layer Distribution Characteristics

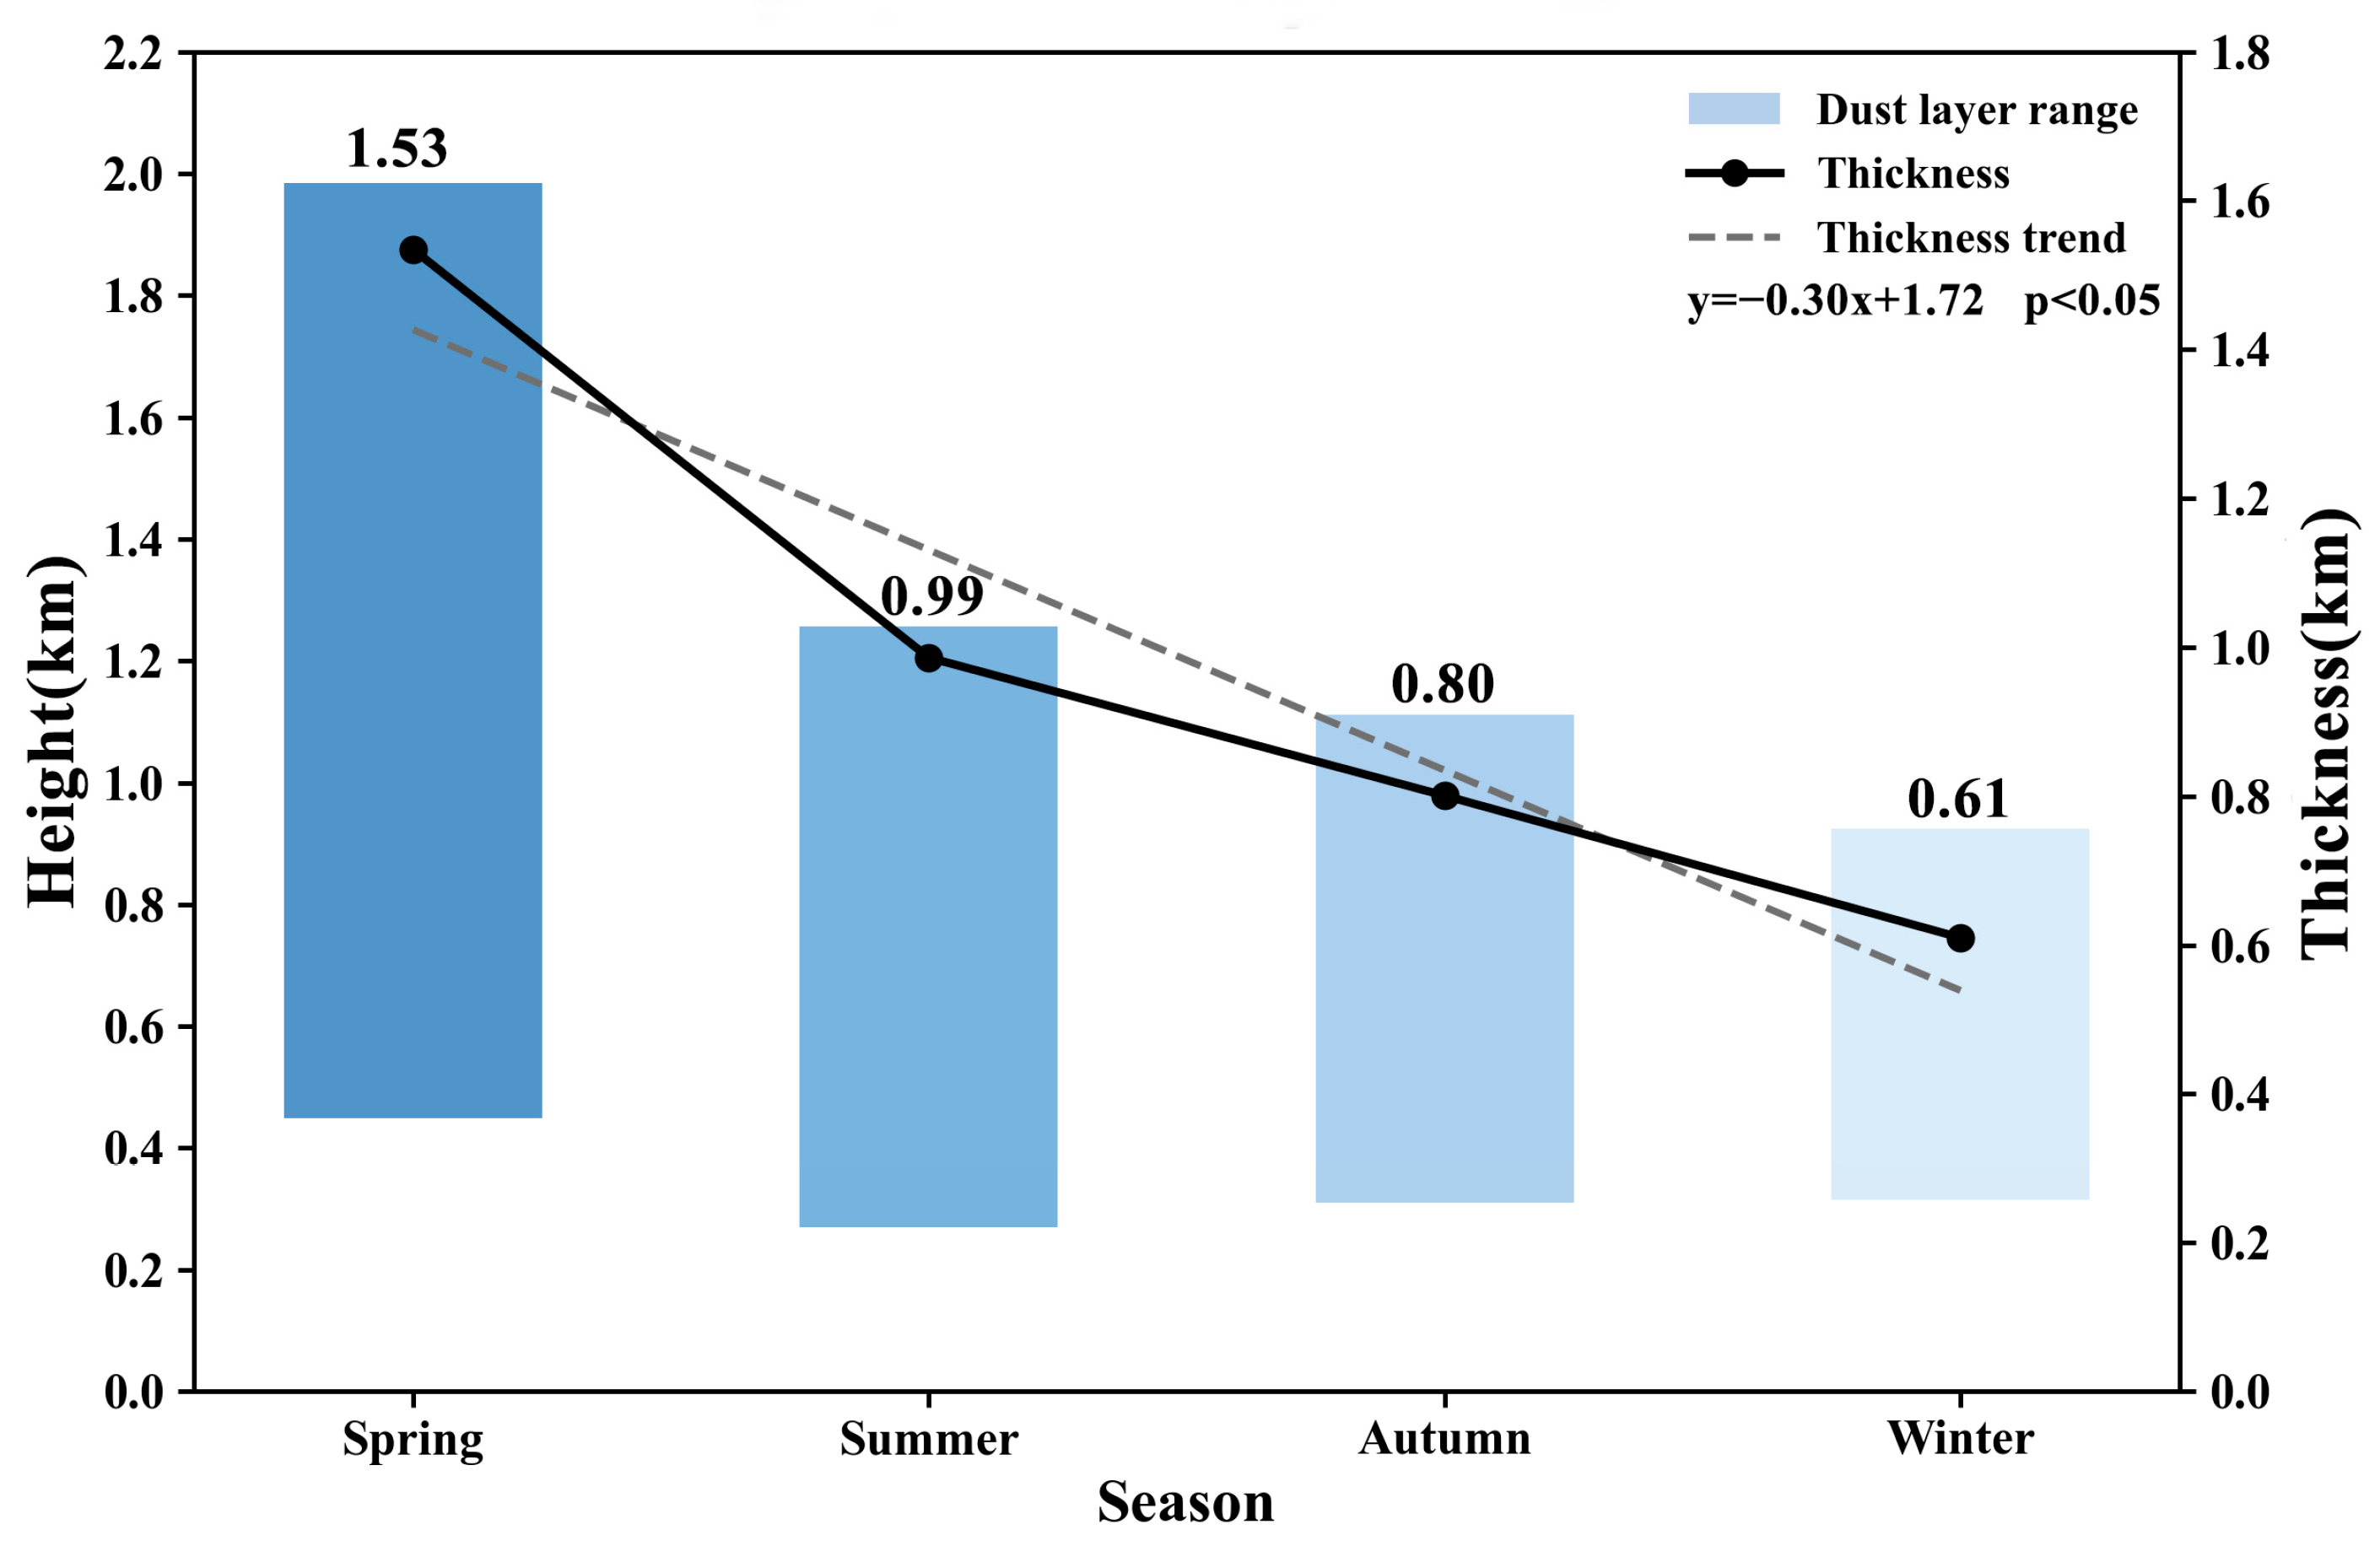
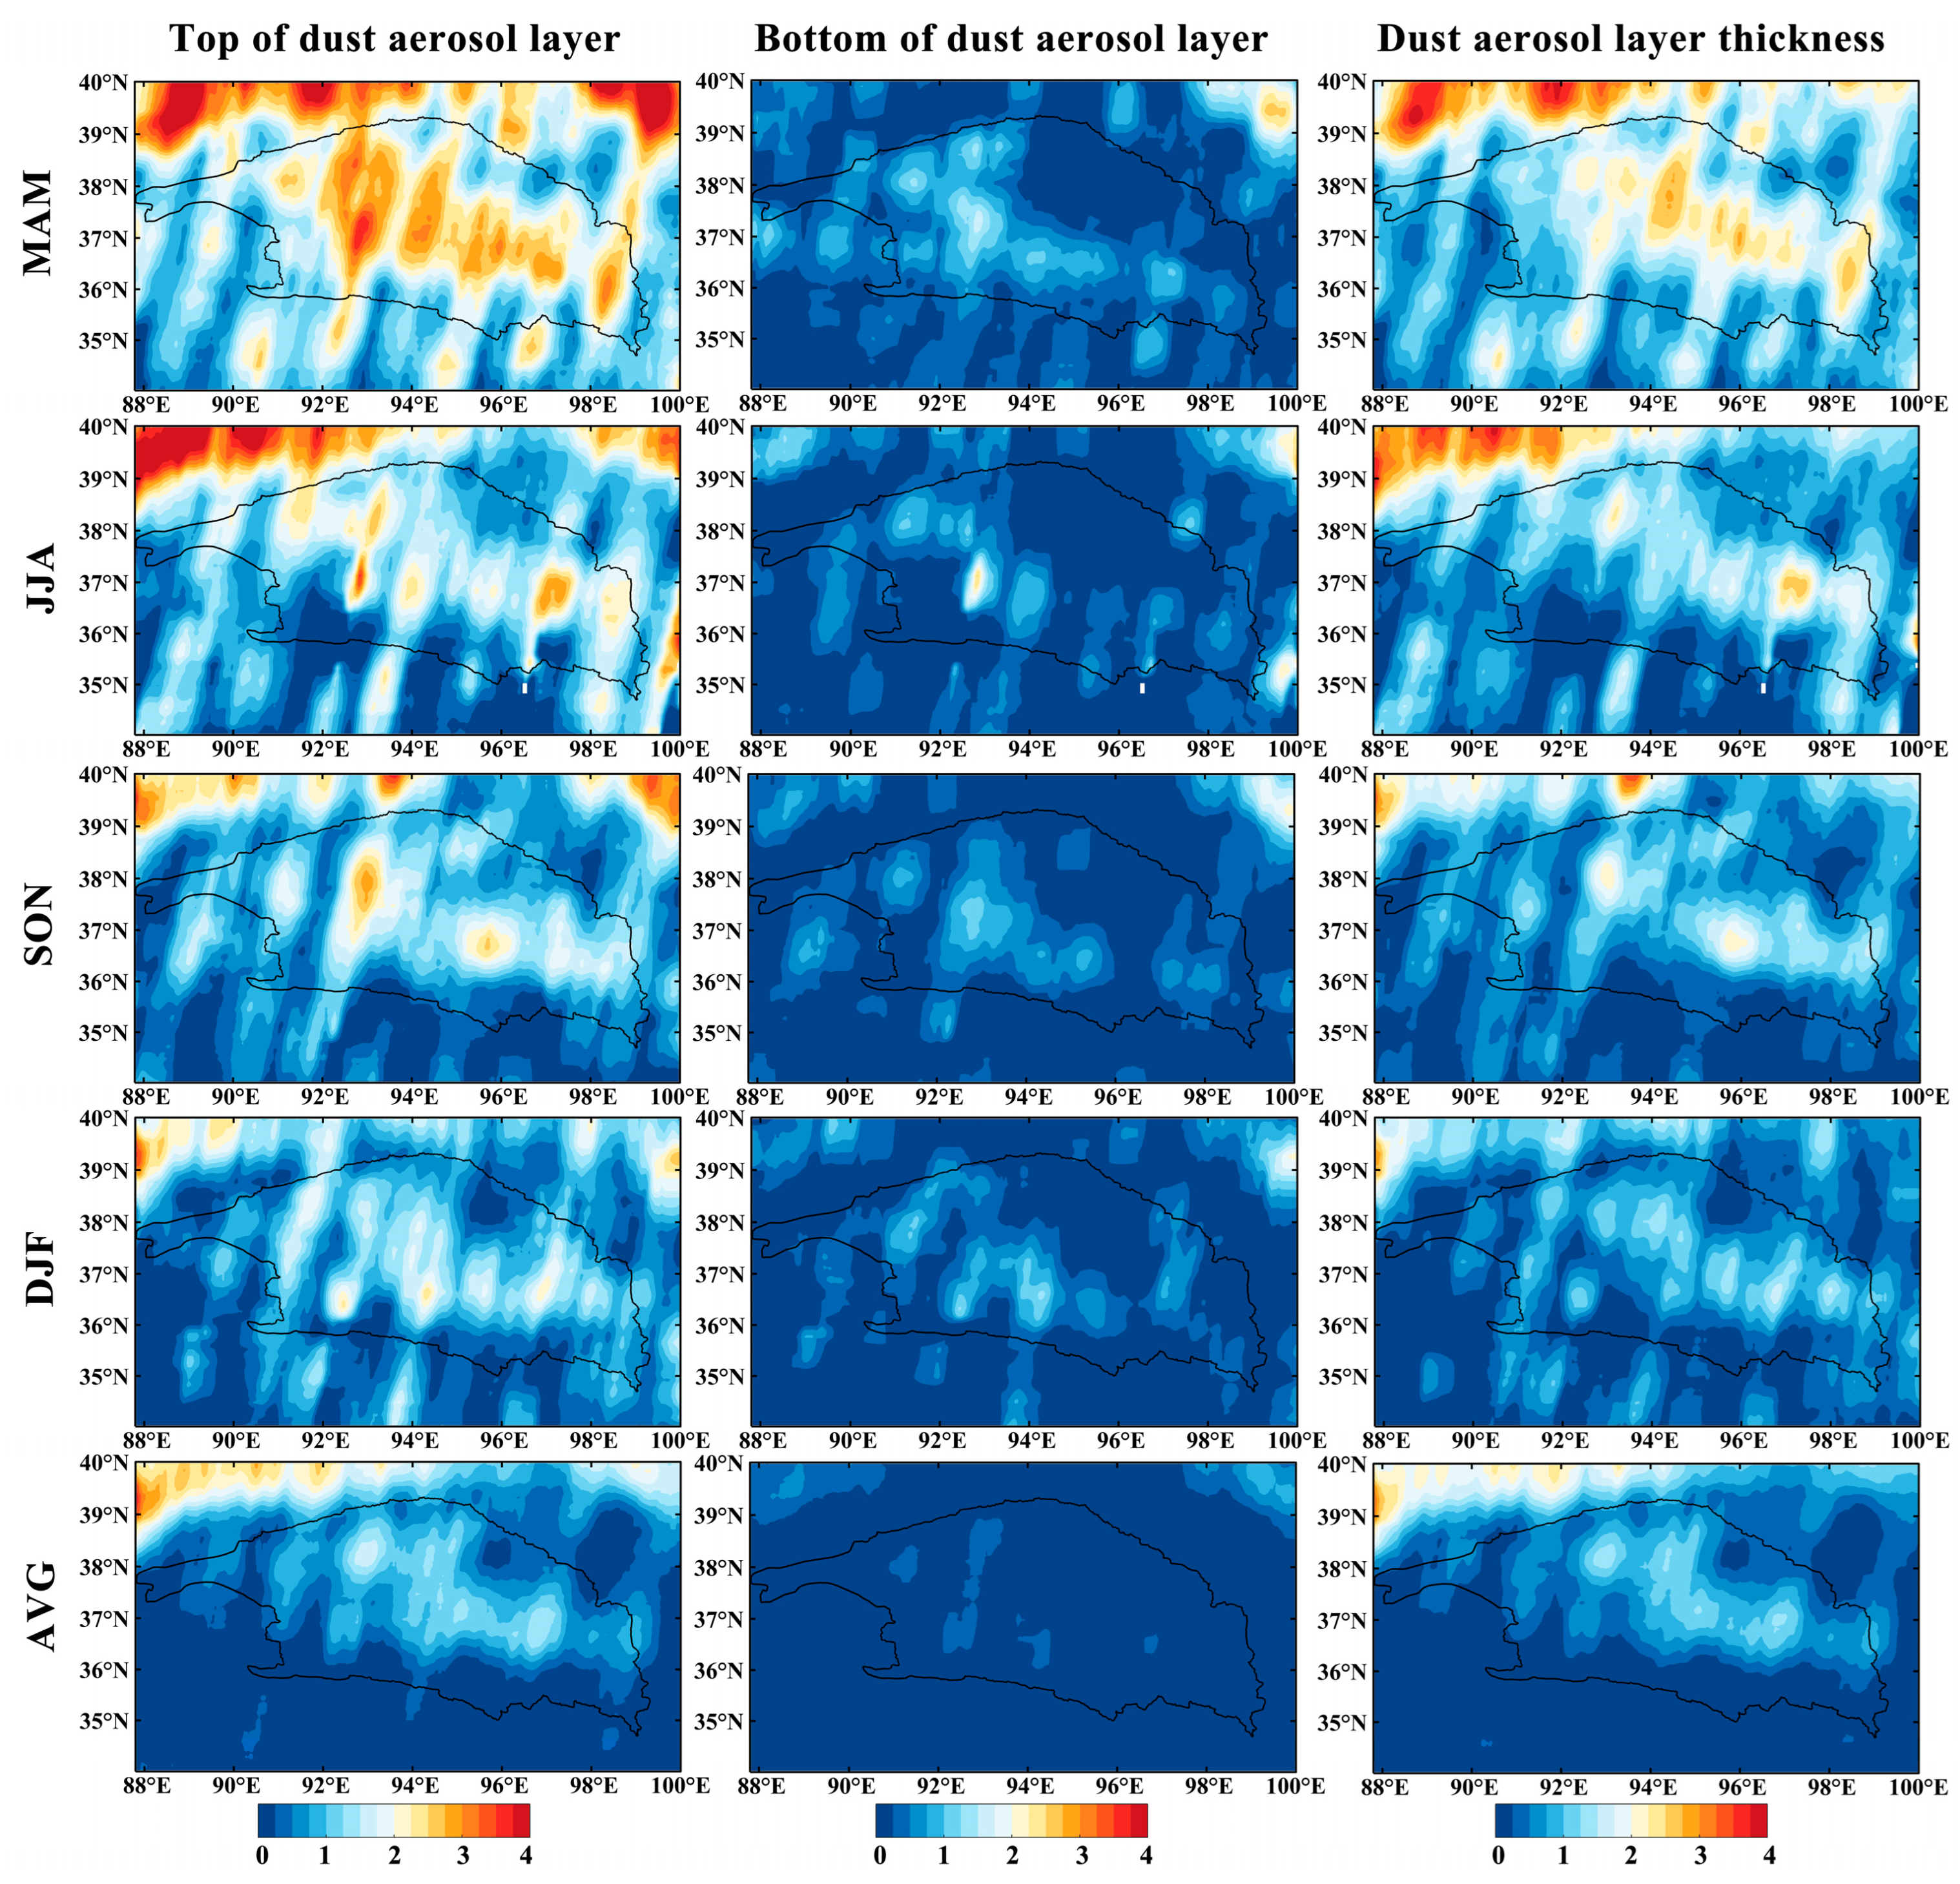
Figure 9 presents the spatial distributions of seasonal and annual mean values of the top height, bottom height, and thickness of dust layers over the Qaidam Basin from 2007 to 2022. Observations show that a continuous and structurally stable dust layer exists over the basin, which is mainly distributed in the lower atmosphere within 2 km AGL. Both the top height and thickness of dust layers exhibit distinct seasonal variations. The dust layer top rises most significantly in spring, reaching 3–4 km in some local areas, and the overall thickness of the dust layer is relatively large. The top height gradually drops in summer and autumn, accompanied by a reduction in layer thickness. In winter, the top height falls to the lowest level of the year, and the dust layer thickness also reaches its annual minimum. Compared with the top height and thickness, the bottom height of dust layers has small seasonal fluctuations and remains in the low altitude near the ground, with the value below 1 km in most areas. This indicates that the bottom of the dust layer in the basin is stable, and dust accumulation near the surface is prominent. In terms of spatial distribution, the bottom height of dust layers is higher in the western Qaidam Basin, while high values of top height are concentrated in the central basin. As a result, the thickness of dust layers generally presents a pattern of being thicker in the east and thinner in the west.
Figure 10 further reveals the seasonal evolution of the vertical range and average thickness of dust layers in the study area from 2007 to 2022. The average thickness of dust layers is the largest in spring at 1.53 km, and it decreases successively to 0.99 km, 0.80 km, and 0.61 km in summer, autumn, and winter, respectively. Overall, the thickness of dust layers shows a remarkable decreasing trend from spring to winter. The fitting equation is y = −0.30x + 1.72, and this trend passes the significance test at the 95% confidence level. Meanwhile, it can be seen from Figure 10 that the variation in dust layer thickness is mainly related to the rise and fall of the dust layer top.

3.5. LASSO+SHAP Feature Ranking

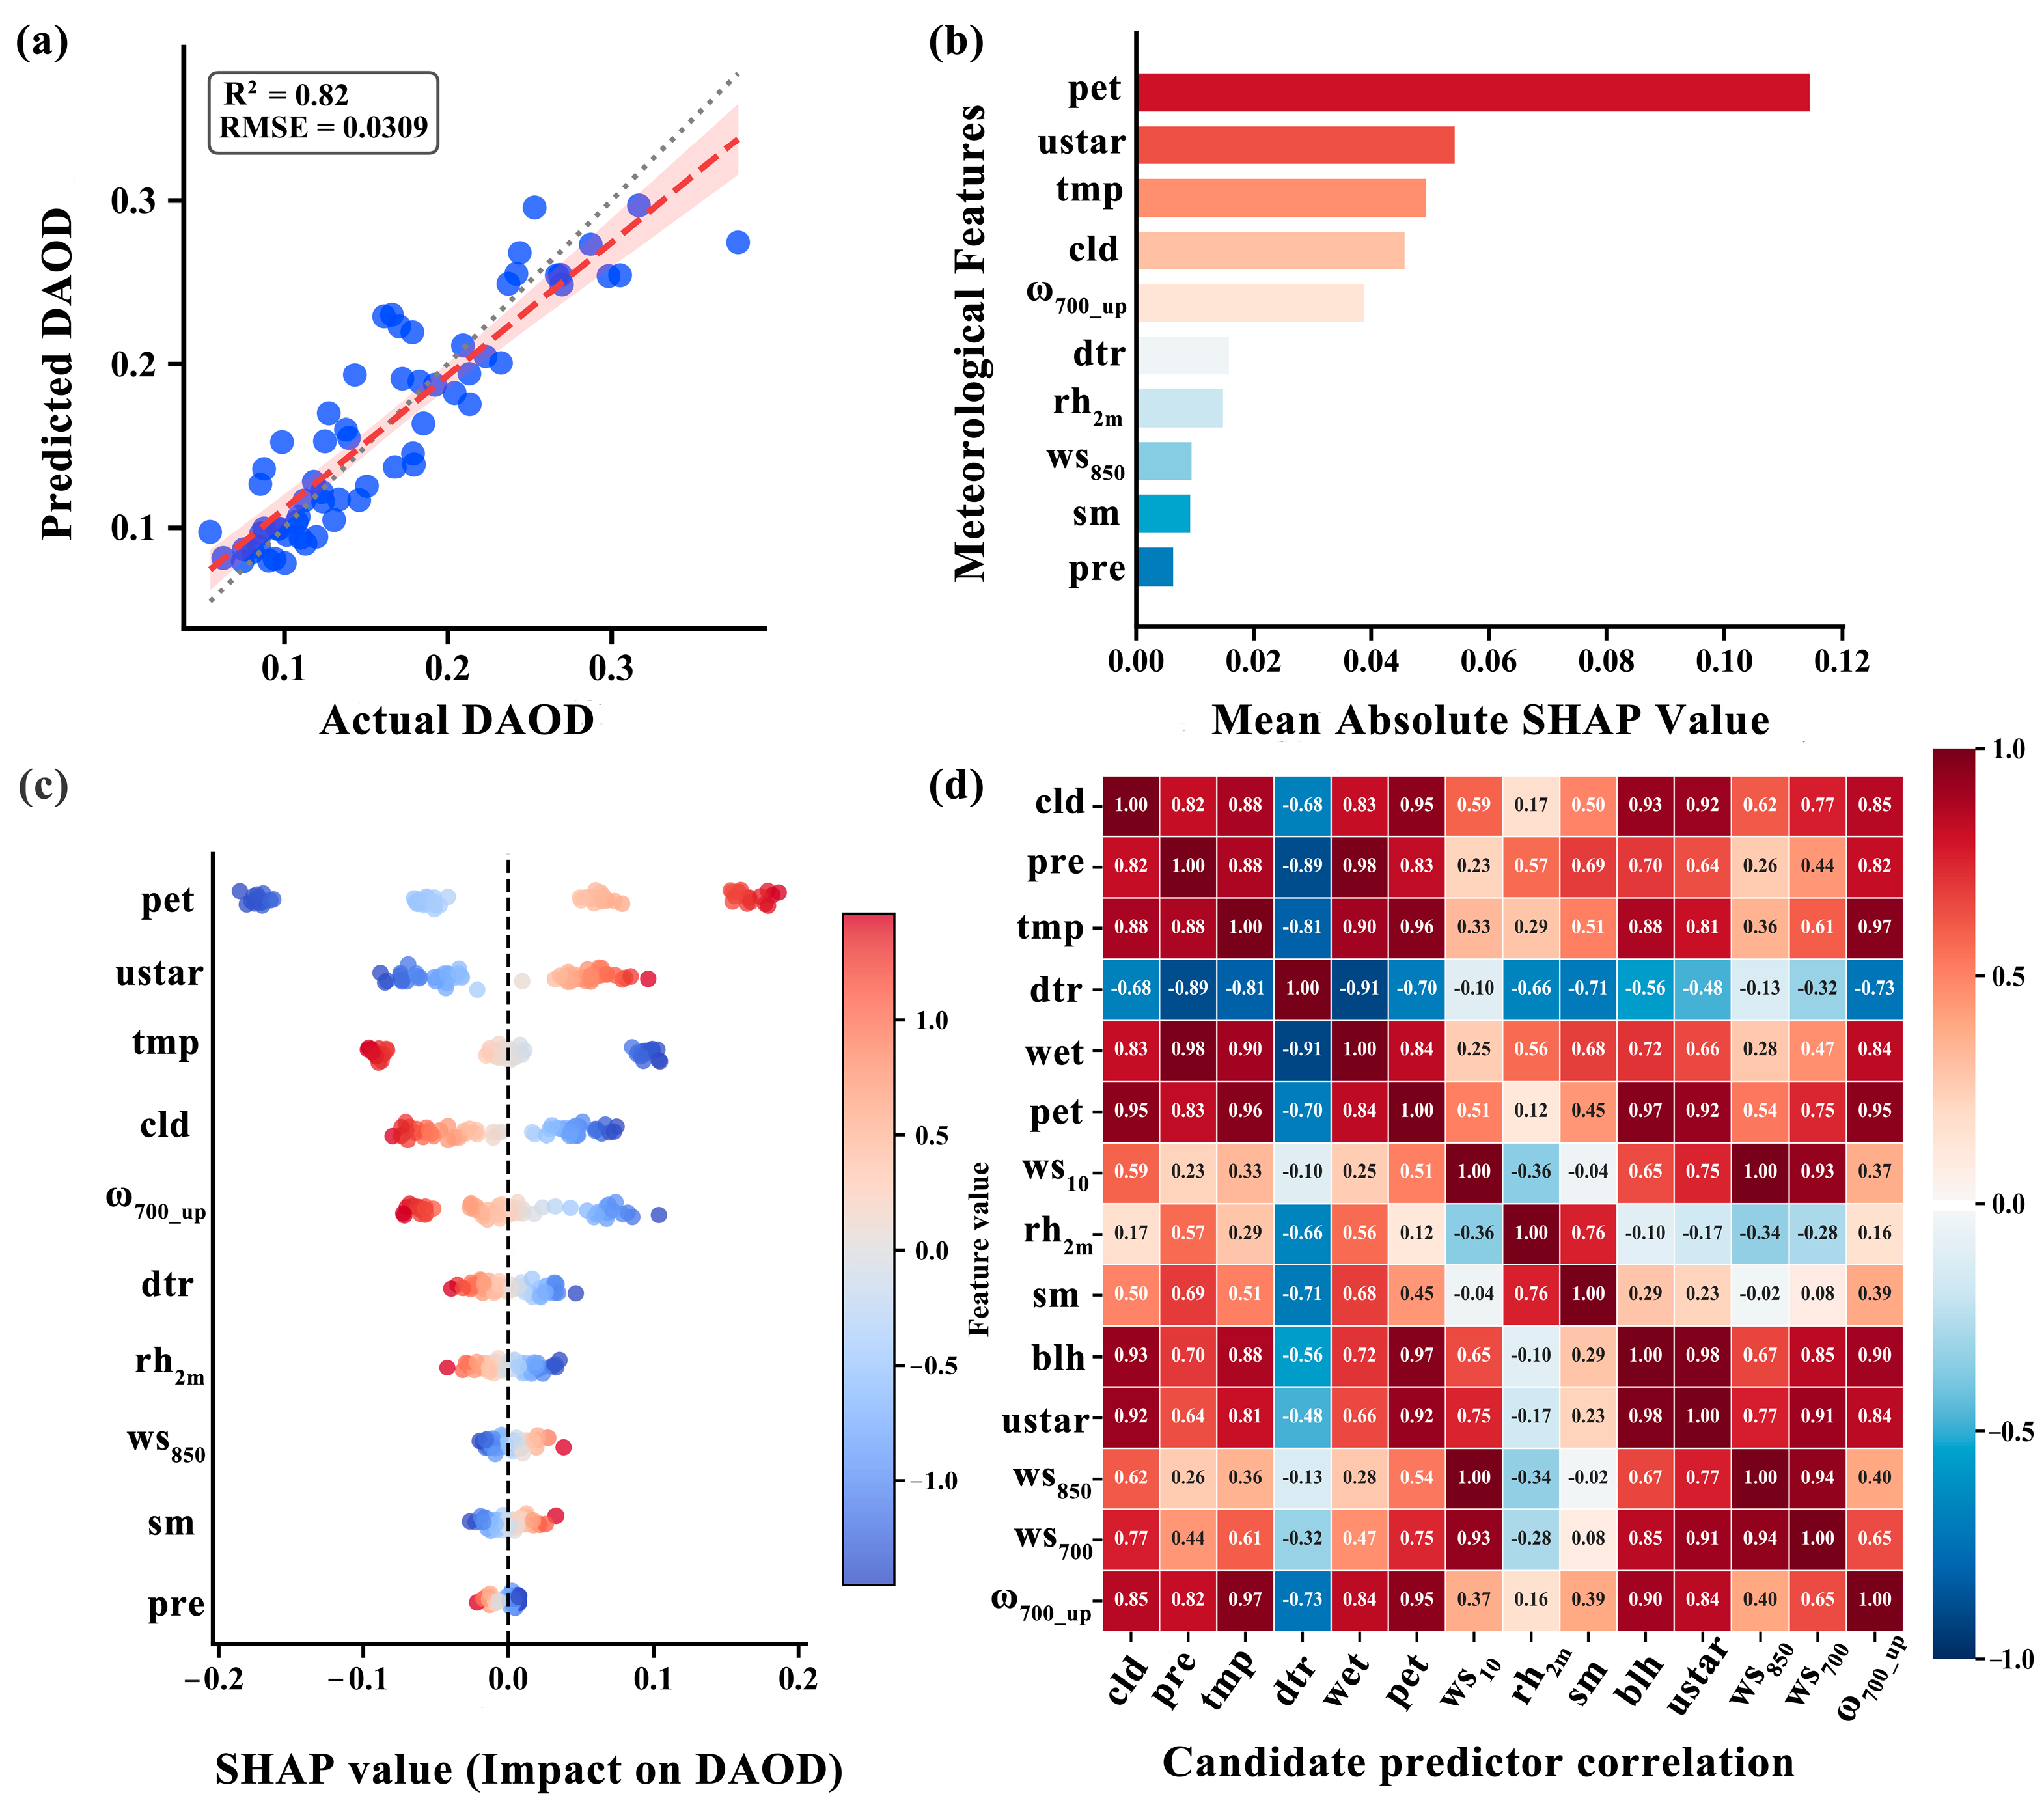
The results of the LASSO regression model and SHAP interpretability analysis are shown in Figure 11. The results demonstrate that there is good consistency between the observed values and the predicted values (Figure 11a), with an R2 = 0.82 and an RMSE of 0.03, indicating that the model has high accuracy and stability in predicting the variations in DAOD in the Qaidam Basin. According to the global feature importance ranking derived from the SHAP analysis (Figure 11b), pet contributes the most to DAOD variations, with a mean absolute SHAP value of approximately 0.12, followed by ustar, with a mean absolute SHAP value of approximately 0.05. Variables including tmp, cld, and ω700-up also show relatively high contributions, with mean absolute SHAP values all exceeding 0.04. In contrast, dtr, rh2m, ws850, sm, and pre show weak contributions, with mean absolute SHAP values lower than 0.02. As shown in Figure 11c, high values of pet and ustar generally correspond to positive SHAP values, indicating that these two variables have positive contributions to DAOD in the current model. High tmp values are mainly associated with negative SHAP values, indicating a negative contribution of temperature after considering the combined effects of other variables. Similarly, high values of ω700-up also correspond to negative SHAP values, suggesting that stronger upward motion at 700 hPa shows a negative contribution to DAOD in this model. It should be noted that these SHAP results represent conditional contributions in the multivariable model, rather than simple correlations between individual variables and DAOD.
The correlation matrix (Figure 11d) further explains the feature selection results. The correlation coefficient between wet and pre reaches approximately 0.98. The correlation coefficients of blh with ustar and pet are about 0.98 and 0.97, respectively. The correlation coefficient between ws700 and ws850 is 0.94, and that between ws10 and ws850 is 1.00. Therefore, although wet, blh, ws10, and ws700 were included in the initial candidate variables, their regression coefficients were shrunk to zero after LASSO regularization. These results indicate strong multicollinearity between the excluded variables and the retained predictors, leading to limited independent explanatory power. This further supports the reliability of feature selection using the LASSO algorithm.

3.6. Analysis of Dust Trajectories and Vertical Movement

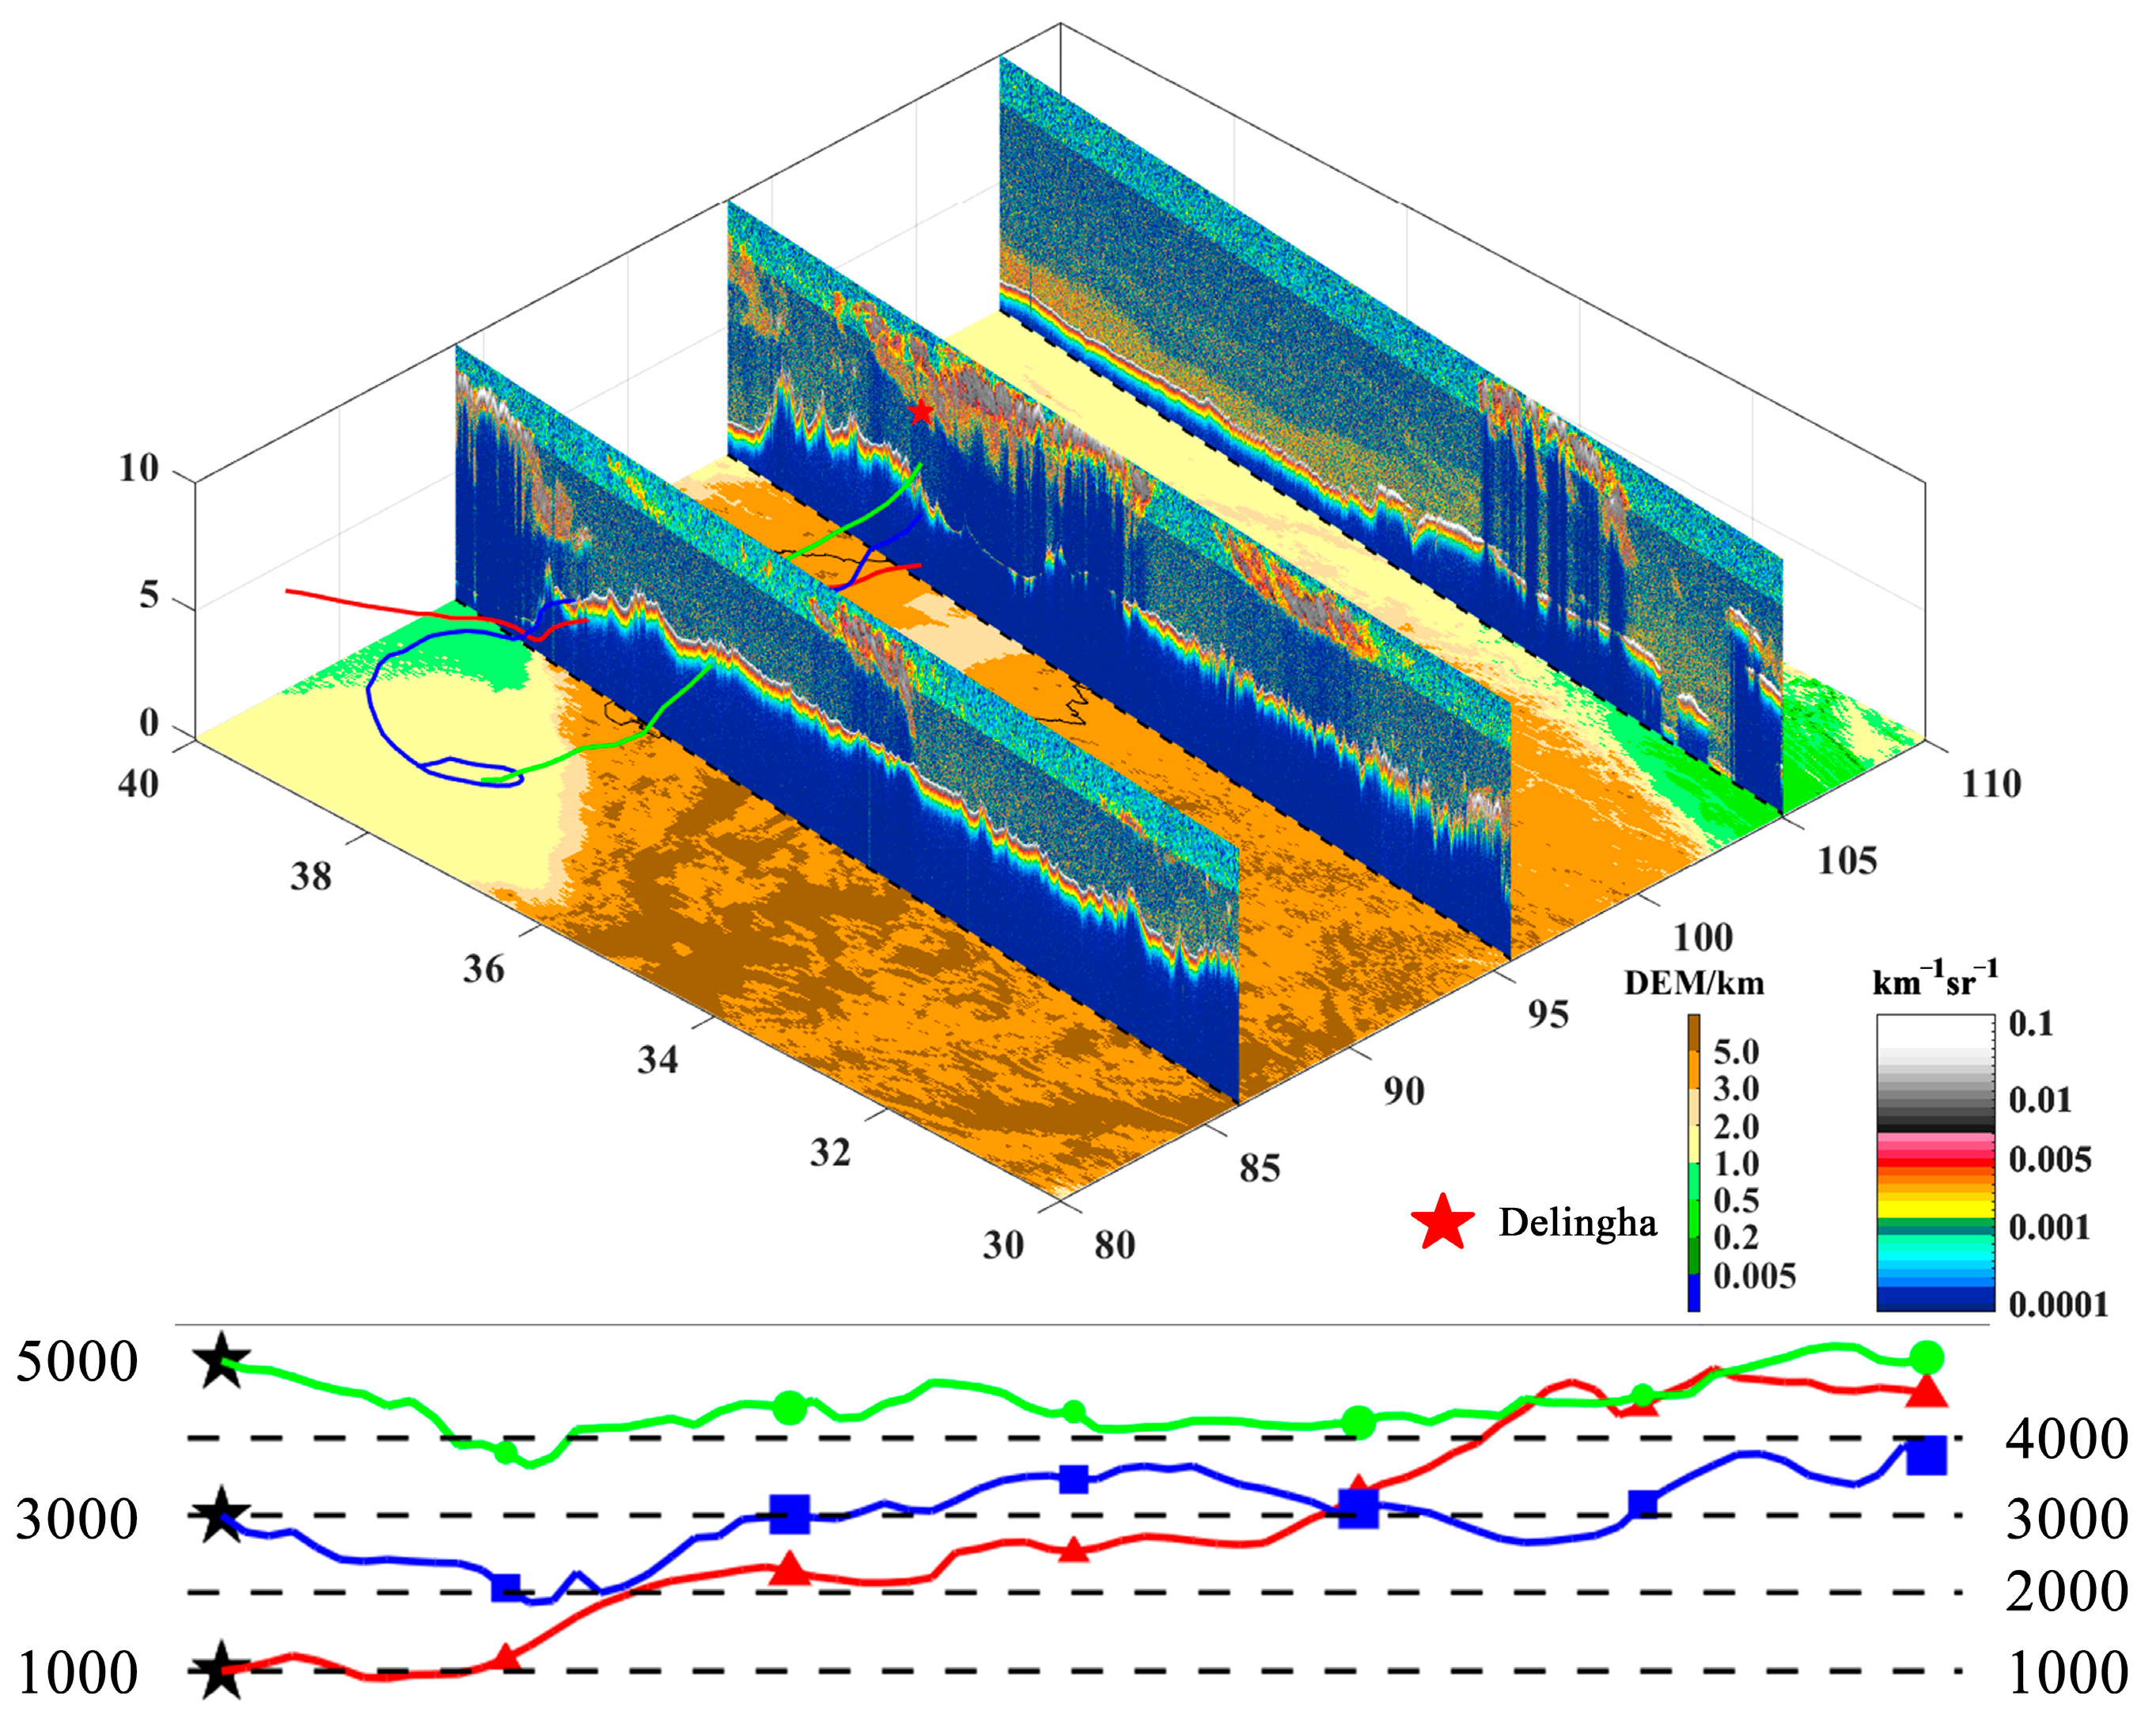
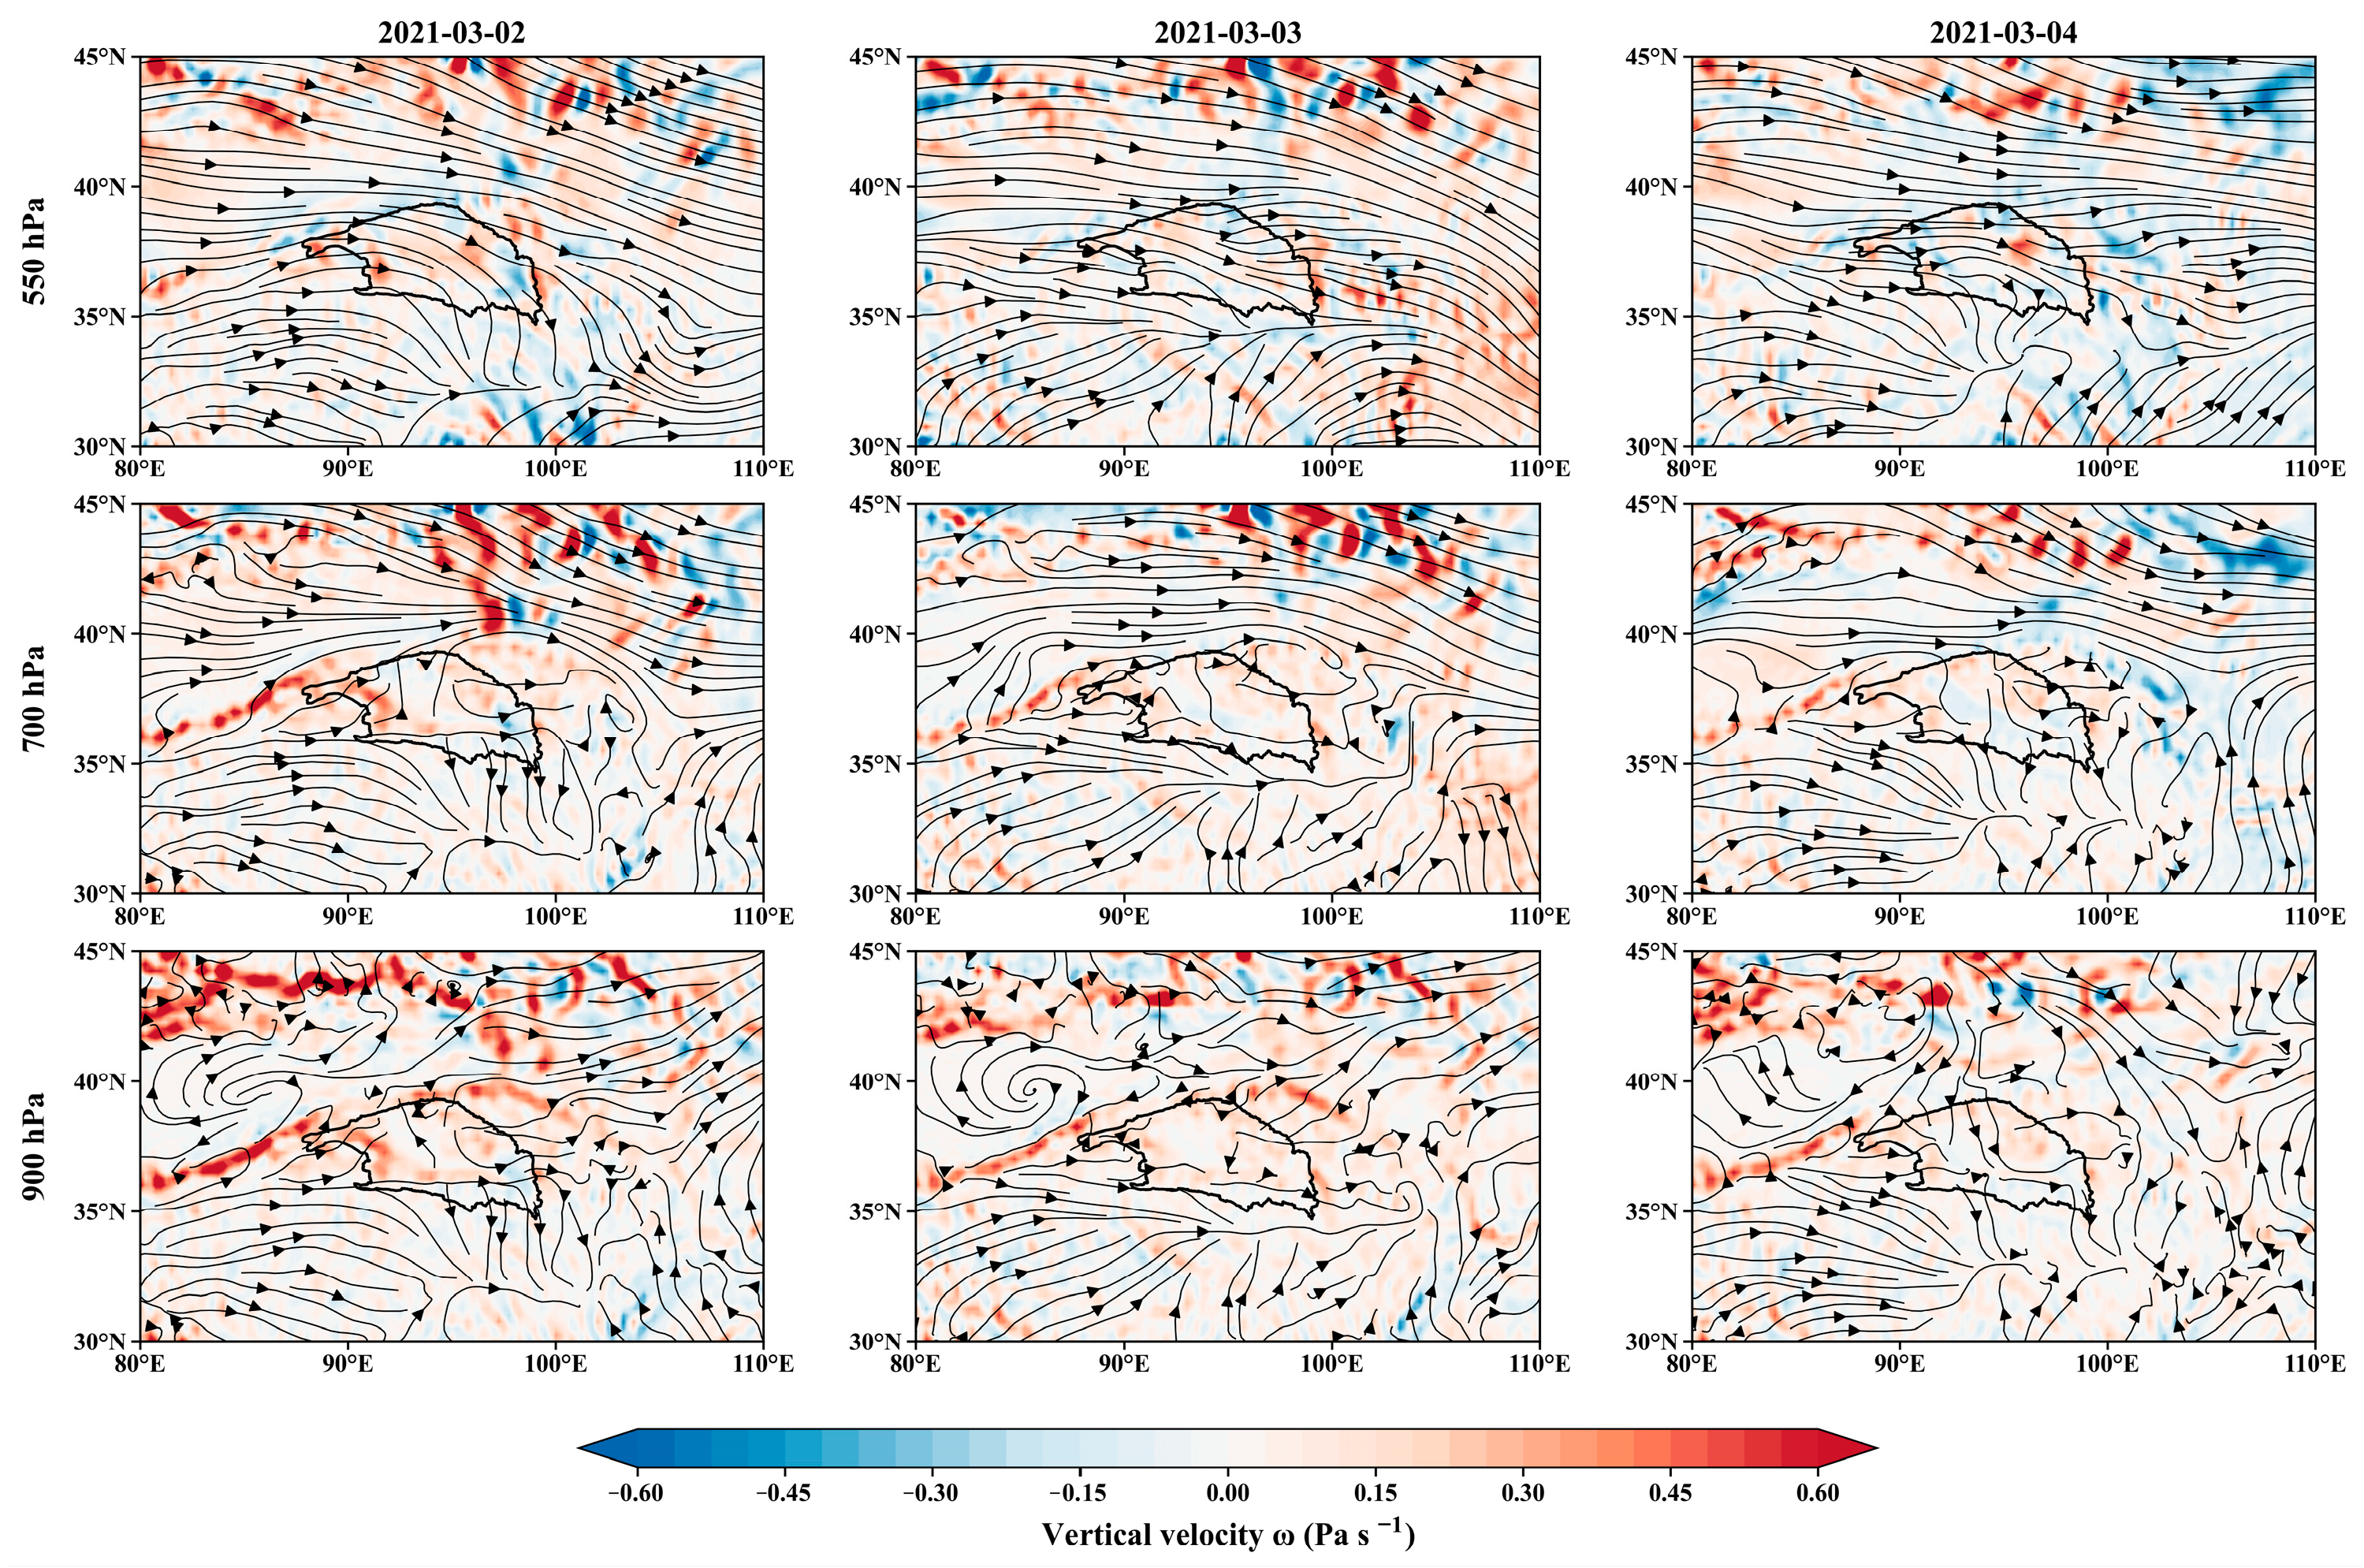
Backward trajectory results for a typical dust event from 2 to 4 March 2021 indicate that the Taklimakan Desert and its surrounding arid regions were the main potential source regions of dust transported to the Qaidam Basin (Figure 12). Specifically, in the lower layer (1000 m), airflow followed a tortuous path due to the orographic blocking and friction exerted by the high-altitude terrain at the basin’s margins. In the middle layer (3000 m), transport was dominated by regional advection, resulting in a continuous and stable process. In the upper layer (5000 m), airflow was governed by the mid-tropospheric westerly circulation, characterized by straight-line, high-speed movement and long-range, cross-regional transport. Combined with CALIPSO TBC profiles and ERA5 wind field analysis (Figure 13), the results suggest that westerly circulation was the main horizontal transport background during this event. The wind fields at 550 and 700 hPa show relatively continuous westward-to-eastward transport over and around the Qaidam Basin, while the 900 hPa wind field is more affected by local terrain. This is consistent with the more curved low-level trajectory. Since ERA5 vertical velocity is pressure vertical velocity, negative ω values indicate upward motion, whereas positive values indicate subsidence. Near the western entrance of the basin, subsiding motion was observed, and the enhanced TBC band was mainly concentrated in the lower-to-middle troposphere, approximately between 3 and 4 km. As the air mass moved eastward, the enhanced TBC signal extended upward to approximately 8–10 km, broadly corresponding to the upward-motion areas shown by ERA5.
These results indicate that the dust transport during this event was not limited to near-surface advection, but involved a vertically coupled transport process from the lower to upper troposphere, in which terrain-controlled low-level flow, mid-level regional advection, and upper-level westerly circulation jointly shaped the vertical redistribution of dust over the Qaidam Basin.

4. Discussion

Using long-term active remote sensing, this study analyzed the 3D dust aerosol distribution over the Qaidam Basin. The results are consistent with the regional characteristics of arid basins, where mixed dust dominates, and show pronounced seasonal variability [45]. Spatially, DAOD exhibits a west-high and east-low pattern, whereas dust layer thickness shows an east-high and west-low distribution. This difference reflects the different physical meanings of the two indicators: DAOD represents column-integrated dust optical loading, while dust layer thickness describes the vertical development of dust layers [46]. The typical dust event analyzed in Section 3.6 further supports this interpretation: dust entered the Qaidam Basin from the west, while subsidence in the western basin and uplift in the eastern basin promoted vertical redistribution and partly enhanced dust layer thickness in the eastern basin.
Seasonally, DAOD is jointly controlled by hydrothermal conditions, near-surface dynamic processes, and atmospheric vertical motion [47]. In spring, strong westerlies and dry surface conditions lower the dust emission threshold and promote dust activity and vertical diffusion [48]. In summer, increased precipitation, soil moisture, and vegetation coverage weaken dust emission and transport, contributing to thinner dust layers [49]. The LASSO-SHAP results further support this mechanism. The positive contributions of pet and ustar indicate that surface dryness and near-surface wind erosion are key drivers of regional dust emission. In contrast, the negative contributions of tmp and the upward-motion index should be interpreted as conditional marginal effects rather than direct physical suppression. The effect of tmp may overlap with pet, while the negative contribution of the ω700-up index may be related to vertical diffusion and transport dilution after dust particles are lifted.
This study has some limitations. The vertical transport analysis was based on a single typical dust event, making it difficult to quantify the relative contributions of local emissions and external transport. Furthermore, the discontinuous spatial coverage of CALIPSO may bring certain errors and uncertainties to the research results. Future studies should integrate multi-source remote sensing observations, such as spaceborne active and passive sensors and ground-based lidar, to improve the characterization of the structural characteristics of dust aerosols.

5. Conclusions

Based on CALIPSO satellite data from 2007 to 2022 and machine learning methods, this study investigates the three-dimensional structure and meteorological driving factors of dust aerosols over the Qaidam Basin. Mixed dust dominates local aerosol types, with the highest proportion in spring and a vertical distribution up to nearly 10 km. Dust Aerosol Optical Depth (DAOD) shows a clear west-high and east-low pattern, with high values concentrated in the northwest and central basin. DAOD varies greatly across seasons, reaching its peak of 0.25 in spring and its lowest value of 0.12 in autumn. The DAOD over the basin has exhibited a decreasing trend over the past 16 years. Vertical observation results show that dust over the basin is mainly distributed in the lower atmosphere below 4 km AGL, and its occurrence frequency decreases steadily with rising altitude. Changes in dust layer thickness are primarily controlled by variations in layer top height. The top height and thickness of dust layers reach their annual peaks in spring, with an average thickness of 1.53 km, and then gradually decrease in summer, autumn, and winter. The bottom height of dust layers has little seasonal change and remains stable near the surface, which further proves that dust tends to accumulate near the ground in the basin.
The LASSO-SHAP results indicate that DAOD variations are jointly affected by surface dryness, near-surface dynamic conditions, and atmospheric vertical structure. Among these factors, pet and ustar make the greatest contributions. Combining HYSPLIT trajectories and CALIPSO TBC vertical profiles, vertical observations of typical dust events indicate that terrain and local atmospheric conditions dominate dust movement at low altitudes, causing roundabout transport and regional dust retention. The westerly circulation prevails at high altitudes and promotes long-distance dust diffusion. Due to the topographic forcing of the enclosed basin, the west-sinking and east-rising feature reshapes the vertical distribution of dust and regulates regional dust transport potential.
To sum up, based on CALIPSO satellite observation data, this study systematically reveals the three-dimensional distribution characteristics of dust aerosols in the Qaidam Basin, clarifies the vertical stratification differences and regulatory factors of dust transport, and provides a scientific basis and practical reference for regional dust control, ecological environment management, and related research.

Supplementary Materials

The following supporting information can be downloaded at https://www.mdpi.com/article/10.3390/rs18121977/s1. Figure S1: CALIPSO orbital sampling and valid sample count distribution over the Qaidam Basin during 2007–2022; Figure S2: Multi-year annual and seasonal mean CALIPSO DAOD over the Qaidam Basin during 2007–2022 (0.5° × 0.5°); Figure S3: Multi-year annual and seasonal mean MERRA-2 DAOD over the Qaidam Basin during 2007–2022 (0.5° × 0.5°).

Author Contributions

Conceptualization, S.C. and J.L.; methodology, S.C. and J.L.; software, S.C. and L.Z.; validation, Q.H.; formal analysis, S.C. and L.Z.; investigation, S.C. and L.Z.; data curation, S.C.; writing—original draft preparation, S.C.; writing—review and editing, S.C. and J.L.; visualization, S.C.; supervision, J.L. and Q.H.; funding acquisition, J.L. All authors have read and agreed to the published version of the manuscript.

Funding

This research was funded by the Natural Science Foundation of Xinjiang Uygur Autonomous Region (No. 2024D01B52), and the Tianchi Talent Introduction Programme (Young Doctor). The APC was funded by the Natural Science Foundation of Xinjiang Uygur Autonomous Region (No. 2024D01B52).

Data Availability Statement

The CALIPSO satellite data used in this study were obtained from the NASA Langley Research Center Atmospheric Science Data Center (https://asdc.larc.nasa.gov/project/CALIPSO, accessed on 11 June 2026). The meteorological datasets, including temperature and potential evapotranspiration, were retrieved from the CRU TS v4.07 dataset provided by the University of East Anglia’s Climatic Research Unit (https://crudata.uea.ac.uk/cru/data/hrg/cru_ts_4.07/, accessed on 11 June 2026). The wind field and vertical velocity data were obtained from the ECMWF ERA5 reanalysis (https://www.ecmwf.int/en/forecasts/datasets/reanalysis-datasets/era5, accessed on 11 June 2026). The results generated during the current study are available from the corresponding author upon reasonable request.

Acknowledgments

The authors would like to acknowledge NASA, the European Centre for Medium-Range Weather Forecasts (ECMWF), and the University of East Anglia.

Conflicts of Interest

The authors declare no conflicts of interest.

Abbreviations

The following abbreviations are used in this manuscript:
CALIPSOCloud-Aerosol Lidar and Infrared Pathfinder Satellite Observation
CALIOPCloud-Aerosol Lidar with Orthogonal Polarization
HYSPLITHybrid Single-Particle Lagrangian Integrated Trajectory
CRUClimatic Research Unit
TBCTotal Backscatter Coefficient
DAODDust Aerosol Optical Depth
AODAerosol Optical Depth

References

  1. Huang, L.; Jiang, J.H.; Tackett, J.L.; Su, H.; Fu, R. Seasonal and Diurnal Variations of Aerosol Extinction Profile and Type Distribution from CALIPSO 5-Year Observations. J. Geophys. Res. Atmos. 2013, 118, 4572–4596. [Google Scholar] [CrossRef] [Scilit]
  2. Perlwitz, J.; Tegen, I.; Miller, R.L. Interactive Soil Dust Aerosol Model in the GISS GCM: 1. Sensitivity of the Soil Dust Cycle to Radiative Properties of Soil Dust Aerosols. J. Geophys. Res. Atmos. 2001, 106, 18167–18192. [Google Scholar] [CrossRef] [Scilit]
  3. Charlson, R.J.; Schwartz, S.E.; Hales, J.M.; Cess, R.D.; Coakley, J.A.; Hansen, J.E.; Hofmann, D.J. Climate Forcing by Anthropogenic Aerosols. Science 1992, 255, 423–430. [Google Scholar] [CrossRef] [Scilit]
  4. Claquin, T.; Schulz, M.; Balkanski, Y.; Boucher, O. Uncertainties in Assessing Radiative Forcing by Mineral Dust. Tellus B Chem. Phys. Meteorol. 1998, 50, 491–505. [Google Scholar] [CrossRef] [Scilit]
  5. Williams, A.I.L.; Stier, P.; Dagan, G.; Watson-Parris, D. Strong Control of Effective Radiative Forcing by the Spatial Pattern of Absorbing Aerosol. Nat. Clim. Change 2022, 12, 735–742. [Google Scholar] [CrossRef] [Scilit]
  6. Koren, I.; Kaufman, Y.J.; Remer, L.A.; Martins, J.V. Measurement of the Effect of Amazon Smoke on Inhibition of Cloud Formation. Science 2004, 303, 1342–1345. [Google Scholar] [CrossRef] [Scilit]
  7. Ackerman, A.S.; Toon, O.B.; Stevens, D.E.; Heymsfield, A.J.; Ramanathan, V.; Welton, E.J. Reduction of Tropical Cloudiness by Soot. Science 2000, 288, 1042–1047. [Google Scholar] [CrossRef] [Scilit] [PubMed]
  8. Phillips, C.; Nair, U.; Christopher, S. The Influence of Dust-Smoke Mixtures on Boundary Layer Processes and Nocturnal Warming in the Sahel. J. Geophys. Res. Atmos. 2022, 127, e2021JD036349. [Google Scholar] [CrossRef] [Scilit]
  9. Su, T.; Li, Z.; Zheng, Y.; Wu, T.; Wu, H.; Guo, J. Aerosol-Boundary Layer Interaction Modulated Entrainment Process. npj Clim. Atmos. Sci. 2022, 5, 64. [Google Scholar] [CrossRef] [Scilit]
  10. Tang, Q.; Zhao, Y.; He, Y.; Yu, Q.; Liang, T. Analysis of Aerosol Types and Vertical Distribution in Seven Typical Cities in East Asia. Atmosphere 2024, 15, 195. [Google Scholar] [CrossRef] [Scilit]
  11. Levy, R.C.; Remer, L.A.; Mattoo, S.; Vermote, E.F.; Kaufman, Y.J. Second-Generation Operational Algorithm: Retrieval of Aerosol Properties over Land from Inversion of Moderate Resolution Imaging Spectroradiometer Spectral Reflectance. J. Geophys. Res. Atmos. 2007, 112, D13211. [Google Scholar] [CrossRef] [Scilit]
  12. Kahn, R.A.; Gaitley, B.J.; Martonchik, J.V.; Diner, D.J.; Crean, K.A.; Holben, B. Multiangle Imaging Spectroradiometer (MISR) Global Aerosol Optical Depth Validation Based on 2 Years of Coincident Aerosol Robotic Network (AERONET) Observations. J. Geophys. Res. Atmos. 2005, 110, D10S04. [Google Scholar] [CrossRef] [Scilit]
  13. Yang, Y.; Zhao, C.; Wang, Q.; Cong, Z.; Yang, X.; Fan, H. Aerosol Characteristics at the Three Poles of the Earth as Characterized by Cloud–Aerosol Lidar and Infrared Pathfinder Satellite Observations. Atmos. Chem. Phys. 2021, 21, 4849–4868. [Google Scholar] [CrossRef] [Scilit]
  14. Winker, D.M.; Hunt, W.H.; McGill, M.J. Initial Performance Assessment of CALIOP. Geophys. Res. Lett. 2007, 34, L19803. [Google Scholar] [CrossRef] [Scilit]
  15. Tackett, J.L.; Winker, D.M.; Getzewich, B.J.; Vaughan, M.A.; Young, S.A.; Kar, J. CALIPSO Lidar Level 3 Aerosol Profile Product: Version 3 Algorithm Design. Atmos. Meas. Tech. 2018, 11, 4129–4152. [Google Scholar] [CrossRef] [Scilit]
  16. Omar, A.H.; Winker, D.M.; Vaughan, M.A.; Hu, Y.; Trepte, C.R.; Ferrare, R.A.; Lee, K.-P.; Hostetler, C.A.; Kittaka, C.; Rogers, R.R.; et al. The CALIPSO Automated Aerosol Classification and Lidar Ratio Selection Algorithm. J. Atmos. Ocean. Technol. 2009, 26, 1994–2014. [Google Scholar] [CrossRef] [Scilit]
  17. Hunt, W.H.; Winker, D.M.; Vaughan, M.A.; Powell, K.A.; Lucker, P.L.; Weimer, C. CALIPSO Lidar Description and Performance Assessment. J. Atmos. Ocean. Technol. 2009, 26, 1214–1228. [Google Scholar] [CrossRef] [Scilit]
  18. Brakhasi, F.; Hajeb, M.; Mielonen, T.; Matkan, A.; Verbesselt, J. Investigating Aerosol Vertical Distribution Using CALIPSO Time Series over the Middle East and North Africa (MENA), Europe, and India: A BFAST-Based Gradual and Abrupt Change Detection. Remote Sens. Environ. 2021, 264, 112619. [Google Scholar] [CrossRef] [Scilit]
  19. Kok, J.F.; Storelvmo, T.; Karydis, V.A.; Adebiyi, A.A.; Mahowald, N.M.; Evan, A.T.; He, C.; Leung, D.M. Mineral Dust Aerosol Impacts on Global Climate and Climate Change. Nat. Rev. Earth Environ. 2023, 4, 71–86. [Google Scholar] [CrossRef] [Scilit]
  20. Berhane, S.A.; Kumar, K.R.; Bu, L. A 13-Year Space-Based Climatological Evolution of Desert Dust Aerosols in the Middle East and North Africa Regions Observed by the CALIPSO. Sci. Total Environ. 2024, 948, 174793. [Google Scholar] [CrossRef] [Scilit]
  21. Li, J.; He, Q.; Wang, Y.; Ma, X.; Zhang, X.; Li, Y. Three-Dimensional Structure and Transport Properties of Dust Aerosols in Central Asia—New Insights from CALIOP Observations, 2007–2022. Remote Sens. 2024, 16, 2049. [Google Scholar] [CrossRef] [Scilit]
  22. Huang, J.; Minnis, P.; Yi, Y.; Tang, Q.; Wang, X.; Hu, Y.; Liu, Z.; Ayers, K.; Trepte, C.; Winker, D. Summer Dust Aerosols Detected from CALIPSO over the Tibetan Plateau. Geophys. Res. Lett. 2007, 34, L18805. [Google Scholar] [CrossRef] [Scilit]
  23. Xu, X.; Yang, Y.; Xiong, Z.; Gong, J.; Luo, T. Three-Dimensional Distribution and Transport Features of Dust and Polluted Dust over China and Surrounding Areas from CALIPSO. Remote Sens. 2023, 15, 5734. [Google Scholar] [CrossRef] [Scilit]
  24. Xu, X.; Wu, H.; Yang, X.; Xie, L. Distribution and Transport Characteristics of Dust Aerosol over Tibetan Plateau and Taklimakan Desert in China Using MERRA-2 and CALIPSO Data. Atmos. Environ. 2020, 237, 117670. [Google Scholar] [CrossRef] [Scilit]
  25. Sun, X.; Zhou, Y.; Zhao, T.; Fu, W.; Wang, Z.; Shi, C.; Zhang, H.; Zhang, Y.; Yang, Q.; Shu, Z. Vertical Distribution of Aerosols and Association with Atmospheric Boundary Layer Structures during Regional Aerosol Transport over Central China. Environ. Pollut. 2024, 362, 124967. [Google Scholar] [CrossRef] [Scilit]
  26. Shi, C.; Mao, R.; Kim, S.-J.; Gong, D.-Y.; Fan, J.; Dong, X. Combined Influence of IPO and AAO on Dust Events in South America. J. Clim. 2025, 38, 6661–6676. [Google Scholar] [CrossRef] [Scilit]
  27. Jenkins, G.S.; Tindan, J.; Gebremariam, S. WRF Simulations of Future Saharan Dust Concentrations Across West Africa: Historical and Late 21st Century. J. Geophys. Res. Atmos. 2025, 130, e2025JD043892. [Google Scholar] [CrossRef]
  28. Xu, X.; Pan, S.; Luo, T.; Yang, Y.; Xiong, Z. Characteristics of Optical Properties and Heating Rates of Dust Aerosol over Taklimakan Desert and Tibetan Plateau in China Based on CALIPSO and SBDART. Remote Sens. 2023, 15, 607. [Google Scholar] [CrossRef] [Scilit]
  29. Han, L.; Zhang, Z.; Liang, A.; Lu, J.; Dong, Z.; Zhang, Z. Deciphering Dust Provenance and Transport Pathways across Northern China’s Source-Sink Systems. Atmos. Chem. Phys. 2025, 25, 15343–15357. [Google Scholar] [CrossRef] [Scilit]
  30. Du, S.; Wu, Y.; Tan, L. Geochemical Evidence for the Provenance of Aeolian Deposits in the Qaidam Basin, Tibetan Plateau. Aeolian Res. 2018, 32, 60–70. [Google Scholar] [CrossRef] [Scilit]
  31. Wang, X.; Cheng, H.; Che, H.; Sun, J.; Lu, H.; Qiang, M.; Hua, T.; Zhu, B.; Li, H.; Ma, W.; et al. Modern Dust Aerosol Availability in Northwestern China. Sci. Rep. 2017, 7, 8741. [Google Scholar] [CrossRef] [Scilit] [PubMed]
  32. Xiao, H.; He, Q.; Yuan, S.; Li, J.; Yin, L. Spatiotemporal distribution characteristics of aerosol optical depth and analysis of meteorological factor influences in the Qaidam Basin. Plateau Meteorol. 2024, 43, 762–774. (In Chinese) [Google Scholar]
  33. Thorsen, T.J.; Fu, Q.; Comstock, J.M. Comparison of the CALIPSO Satellite and Ground-Based Observations of Cirrus Clouds at the ARM TWP Sites. J. Geophys. Res. Atmos. 2011, 116, D21203. [Google Scholar] [CrossRef] [Scilit]
  34. Inness, A.; Ades, M.; Agustí-Panareda, A.; Barré, J.; Benedictow, A.; Blechschmidt, A.-M.; Dominguez, J.J.; Engelen, R.; Eskes, H.; Flemming, J.; et al. The CAMS Reanalysis of Atmospheric Composition. Atmos. Chem. Phys. 2019, 19, 3515–3556. [Google Scholar] [CrossRef] [Scilit]
  35. Harris, I.; Osborn, T.J.; Jones, P.; Lister, D. Version 4 of the CRU TS Monthly High-Resolution Gridded Multivariate Climate Dataset. Sci. Data 2020, 7, 109. [Google Scholar] [CrossRef] [Scilit]
  36. Wang, X.; Dickinson, R.E.; Su, L.; Zhou, C.; Wang, K. PM2.5 Pollution in China and How It Has Been Exacerbated by Terrain and Meteorological Conditions. Bull. Am. Meteorol. Soc. 2018, 99, 105–119. [Google Scholar] [CrossRef] [Scilit]
  37. Tibshirani, R. Regression Shrinkage and Selection Via the Lasso. J. R. Stat. Soc. Ser. B Stat. Methodol. 1996, 58, 267–288. [Google Scholar] [CrossRef] [Scilit]
  38. Liu, F.; Liu, Y.; Li, X.; Wang, Y.; Jing, Z.; Chen, Y. The Analysis of Ozone Pollution in Urban Agglomerations of the Sichuan Basin Based on the Scale Decomposition-Synthesis Method. Environ. Res. 2025, 271, 121121. [Google Scholar] [CrossRef] [Scilit] [PubMed]
  39. Ju, J.; Liu, K.; Liu, F. Prediction of SO2 Concentration Based on AR-LSTM Neural Network. Neural Process. Lett. 2023, 55, 5923–5941. [Google Scholar] [CrossRef] [Scilit]
  40. Shapley, L.S. A Value for N-Person Games. In Contributions to the Theory of Games, Volume II; Princeton University Press: Princeton, NJ, USA, 1952. [Google Scholar]
  41. Başakın, E.E.; Stoy, P.C.; Demirel, M.C.; Ozdogan, M.; Otkin, J.A. Combined Drought Index Using High-Resolution Hydrological Models and Explainable Artificial Intelligence Techniques in Türkiye. Remote Sens. 2024, 16, 3799. [Google Scholar] [CrossRef] [Scilit]
  42. Birinci, E.; Ekmekcioğlu, Ö.; Ozdemir, H.; Deniz, A. Interpretable Machine Learning Framework for Air Quality Prediction in Istanbul Using Shapley Additive Explanations (SHAP). Stoch. Environ. Res. Risk Assess. 2026, 40, 37. [Google Scholar] [CrossRef] [Scilit]
  43. Stein, A.F.; Draxler, R.R.; Rolph, G.D.; Stunder, B.J.B.; Cohen, M.D.; Ngan, F. NOAA’s HYSPLIT Atmospheric Transport and Dispersion Modeling System. Bull. Am. Meteorol. Soc. 2015, 96, 2059–2077. [Google Scholar] [CrossRef] [Scilit]
  44. Draxler, R.; Stunder, B.; Rolph, G.; Stein, A.; Taylor, A.; Zinn, S.; Loughner, C.; Crawford, A. HYSPLIT User’s Guide; NOAA Air Resources Laboratory: Silver Spring, MD, USA, 2010. [Google Scholar]
  45. Jia, R.; Liu, Y.; Li, Y.; Li, J.; Hu, X.; Gao, R.; Tian, Y.; Sun, Y.; Mu, N.; Zhao, M. Direct Radiative Effects of Dust Aerosols over Northwest China Revealed by Satellite-Derived Aerosol Three-Dimensional Distribution. J. Meteorol. Res. 2022, 36, 767–778. [Google Scholar] [CrossRef] [Scilit]
  46. Song, Q.; Zhang, Z.; Yu, H.; Ginoux, P.; Shen, J. Global Dust Optical Depth Climatology Derived from CALIOP and MODIS Aerosol Retrievals on Decadal Timescales: Regional and Interannual Variability. Atmos. Chem. Phys. 2021, 21, 13369–13395. [Google Scholar] [CrossRef] [Scilit]
  47. Sun, H.; Liu, X.; Wang, A. Seasonal and Interannual Variations of Atmospheric Dust Aerosols in Mid and Low Latitudes of Asia—A Comparative Study. Atmos. Res. 2020, 244, 105036. [Google Scholar] [CrossRef] [Scilit]
  48. Liu, L.; Wang, Z.; Che, H.; Wang, D.; Gui, K.; Liu, B.; Ma, K.; Zhang, X. Climate Factors Influencing Springtime Dust Activities over Northern East Asia in 2021 and 2023. Atmos. Res. 2024, 303, 107342. [Google Scholar] [CrossRef] [Scilit]
  49. Yang, S.; Du, H.; Fan, Y. Spatiotemporal Variations of Dust Emission in Qaidam Basin during the Past 40 Years. Res. Cold Arid. Reg. 2024, 18, 187–196. [Google Scholar] [CrossRef] [Scilit]
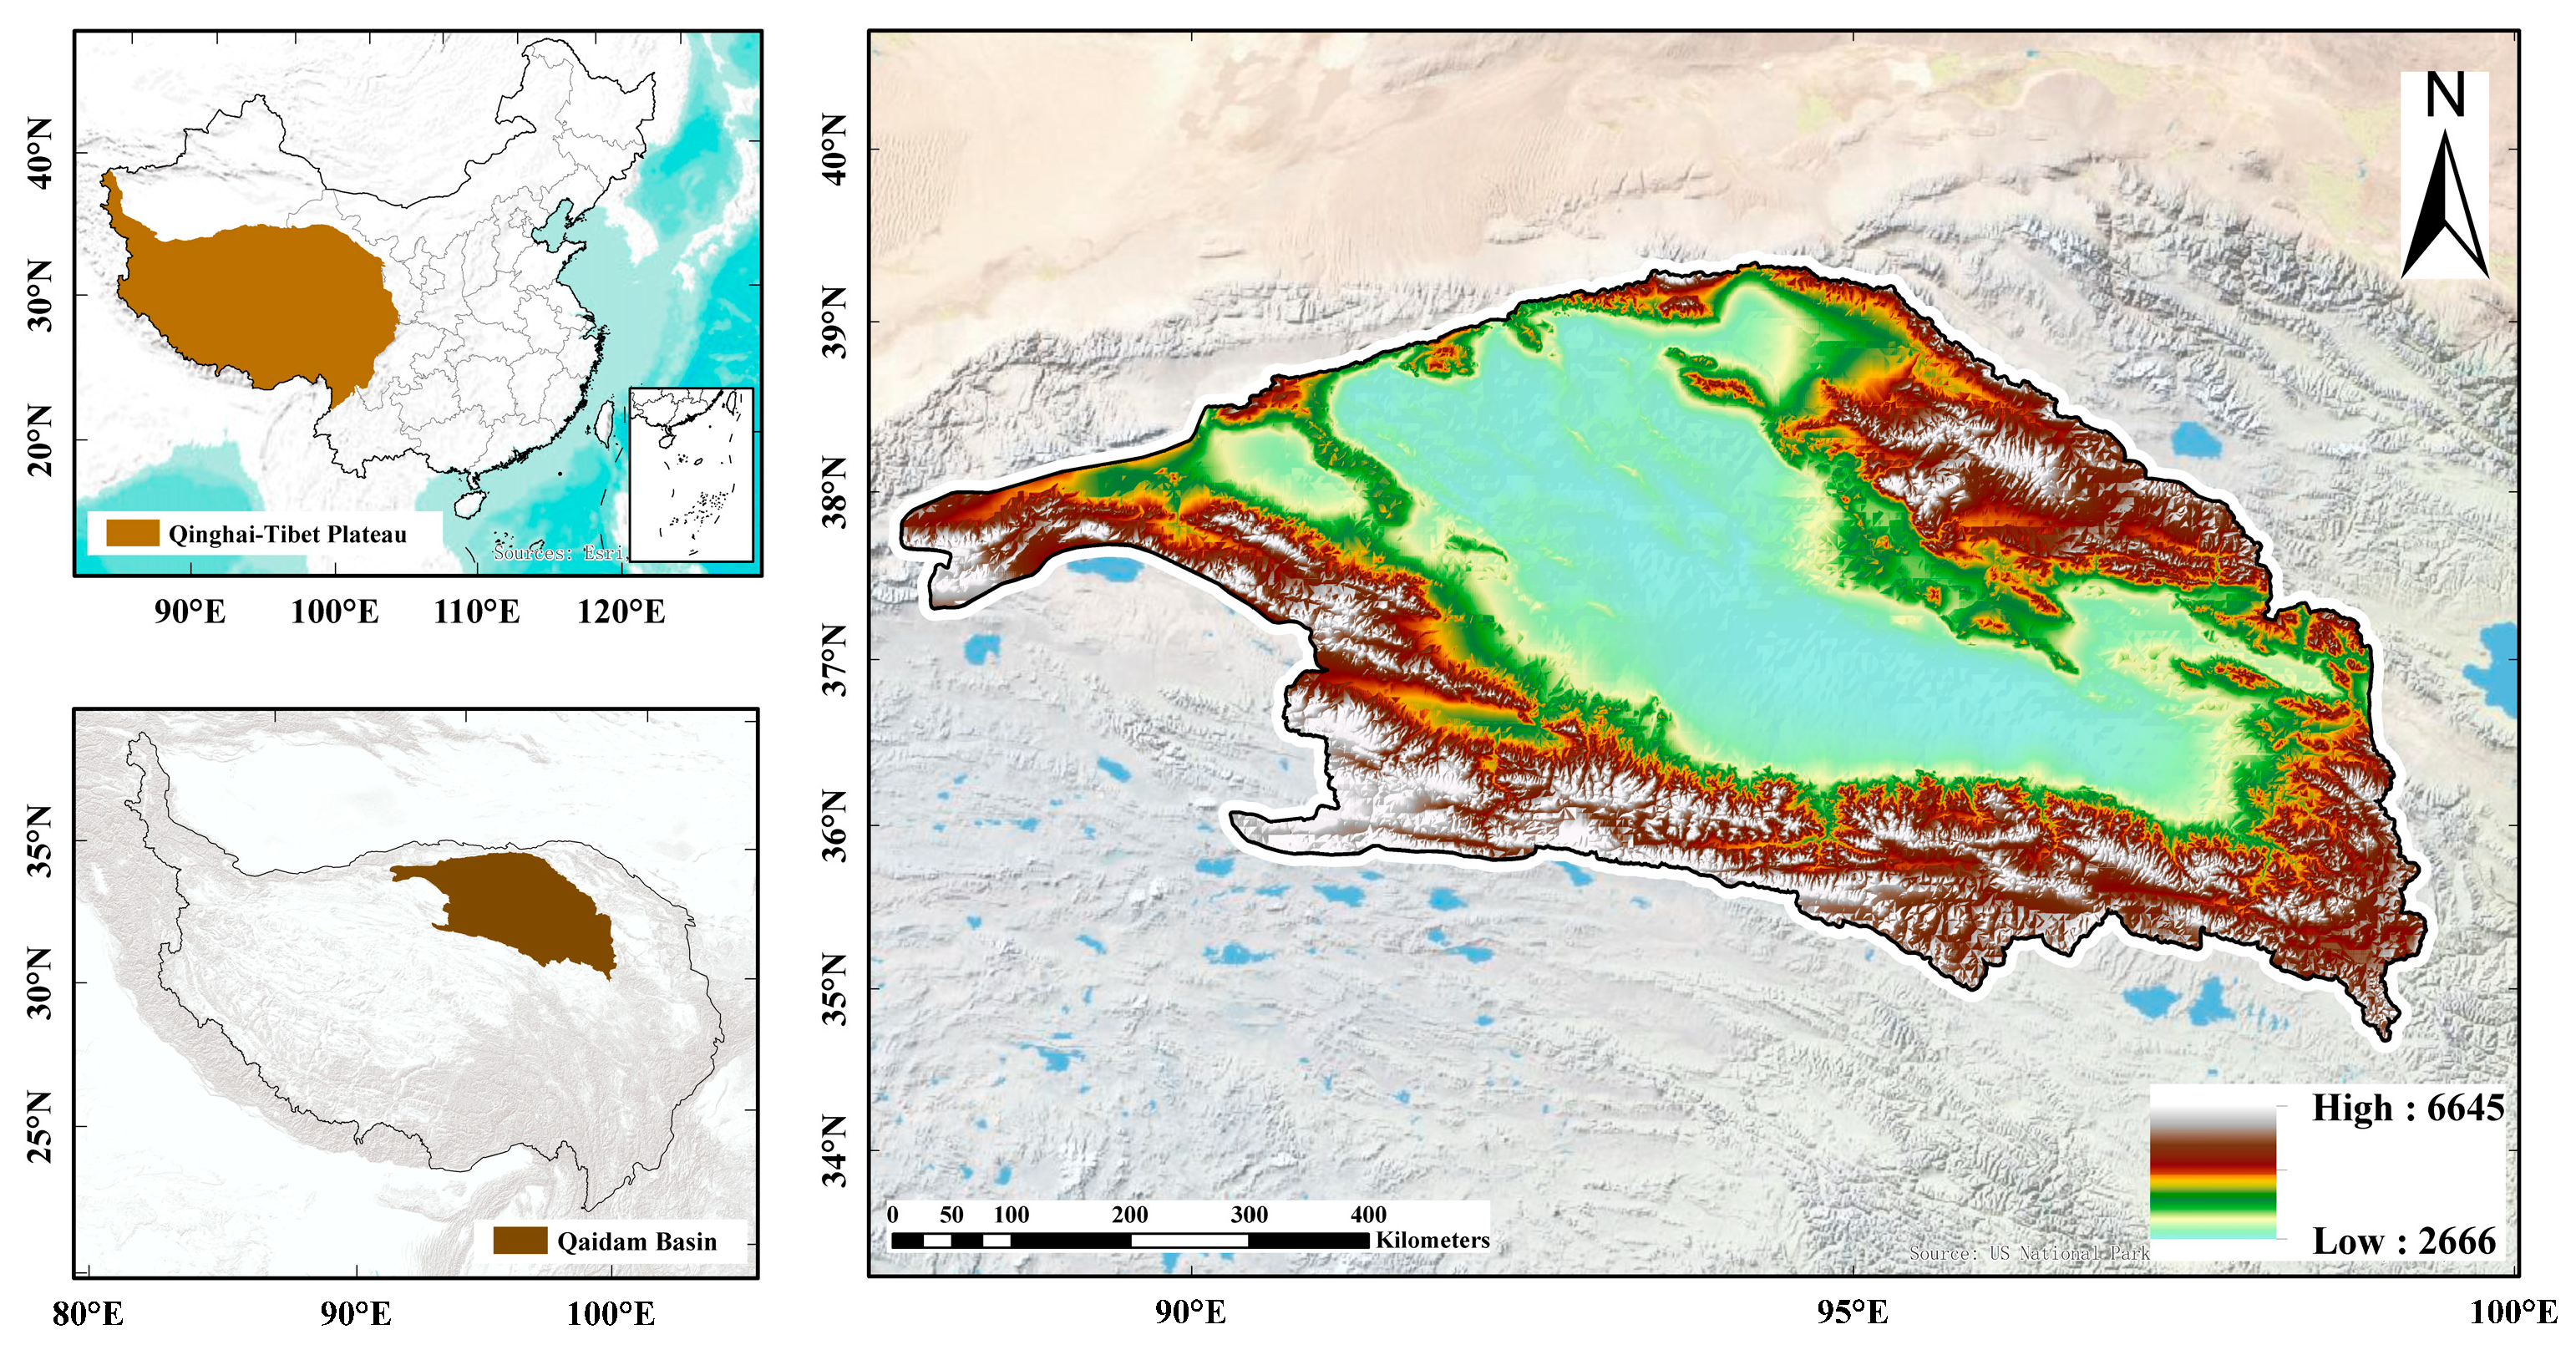
Figure 1. Overview of the Qaidam Basin region.
Remotesensing 18 01977 g001
Figure 2. Seasonal variations in 3D distribution of different types of aerosols over the Qaidam Basin.
Remotesensing 18 01977 g002
Figure 3. Seasonal and annual spatial distribution patterns of DAOD in the Qaidam Basin.
Remotesensing 18 01977 g003
Figure 4. Variation in seasonal mean DAOD in the Qaidam Basin.
Remotesensing 18 01977 g004
Figure 5. Monthly average spatial distribution of DAOD variation in the Qaidam Basin.
Remotesensing 18 01977 g005
Figure 6. Variation in monthly mean DAOD in the Qaidam Basin.
Remotesensing 18 01977 g006
Figure 7. Interannual variation of DAOD over the Qaidam Basin from 2007 to 2022. (The light blue bars represent the annual total number of valid CALIPSO within the 0.1° × 0.1° grids.)
Remotesensing 18 01977 g007
Figure 8. Seasonal distribution of dust aerosol occurrence frequency over the Qaidam Basin at different height layers above ground level (AGL).
Remotesensing 18 01977 g008
Figure 9. Seasonal and annual mean spatial distributions of dust layer top height, bottom height, and thickness above ground level (AGL) over the Qaidam Basin.
Remotesensing 18 01977 g009
Figure 10. Seasonal variations of dust layer vertical extent and mean thickness above ground level (AGL) in the Qaidam Basin from 2007 to 2022. (The top and bottom of each bar indicate the top and base heights of the dust layer, respectively, while the line represents the seasonal mean thickness).
Remotesensing 18 01977 g010
Figure 11. Attribution of DAOD variations based on the LASSO-SHAP model. (a) Model performance evaluation; (b) global importance ranking of retained factors based on mean absolute SHAP values; (c) SHAP summary plot showing the direction and magnitude of retained factor contributions; (d) correlation matrix of all initial candidate factors for diagnosing variable collinearity. (In panel (a), the blue dots represent individual samples, the red dashed line represents the fitted regression line, the pink shaded area indicates the 95% confidence interval, and the gray dotted line represents the 1:1 reference line, where predicted DAOD equals actual DAOD.)
Remotesensing 18 01977 g011
Figure 12. Backward trajectory analysis and vertical TBC profiles of the dust event during 2 to 4 March 2021. (The red, blue, and green lines represent the trajectories arriving at 1000 m, 3000 m, and 5000 m, respectively.)
Remotesensing 18 01977 g012
Figure 13. Wind field and vertical velocity distribution during the dust event from 2 to 4 March 2021. Streamlines with arrows represent the horizontal wind field at different pressure levels, and shaded colors indicate ERA5 pressure vertical velocity (ω). Blue shading represents upward motion (ω < 0), while red shading represents downward motion (ω > 0).
Remotesensing 18 01977 g013
Disclaimer/Publisher’s Note: The statements, opinions and data contained in all publications are solely those of the individual author(s) and contributor(s) and not of MDPI and/or the editor(s). MDPI and/or the editor(s) disclaim responsibility for any injury to people or property resulting from any ideas, methods, instructions or products referred to in the content.