Article

LMFusion: Breaking the Computational Barrier for Multimodal Classification in Remote Sensing
State Key Laboratory of Integrated Services Networks, Xidian University, Xi’an 710071, China
*
Author to whom correspondence should be addressed.
Remote Sens. 2026, 18(12), 1972; https://doi.org/10.3390/rs18121972
Submission received: 30 April 2026 / Revised: 6 June 2026 / Accepted: 9 June 2026 / Published: 13 June 2026

Highlights

What are the main findings?
  • We propose LMFusion, an efficient multimodal remote sensing classification framework that integrates linear-complexity cross-attention for bidirectional HSI-LiDAR feature interaction and Mamba-based state space modeling for spatial-spectral representation learning.
  • Experimental results on multiple multimodal remote sensing datasets demonstrate that LMFusion achieves competitive classification performance while providing an effective feature fusion strategy for hyperspectral and LiDAR data.
What is the implication of the main finding?
  • The proposed framework shows that effective multimodal feature interaction can be achieved with reduced computational burden, making multimodal remote sensing classification more suitable for resource-constrained scenarios.
  • The introduced selective quantization-aware optimization further improves the compactness of the model, providing potential support for future deployment on low-bit or edge-computing hardware platforms.

Abstract

Multi-modal land cover classification plays an important role in remote sensing applications such as urban monitoring and environmental analysis. By integrating complementary information from hyperspectral imagery (HSI) and LiDAR data, multimodal learning can significantly improve classification performance. However, existing Transformer-based fusion methods often suffer from high computational complexity and inefficient cross-modal interaction modeling, which limits their applicability in resource-constrained scenarios. To address these challenges, we propose LMFusion, an efficient framework for multimodal feature learning. Specifically, LMFusion enables efficient bidirectional feature interaction through a linear-complexity cross-attention mechanism and enhances long-range spatial-spectral representation learning with Mamba-based state space modeling, thereby achieving effective multimodal dependency modeling with linear computational complexity. In addition, a selective quantization-aware optimization strategy is introduced to support multiple bit-width settings (down to 1-bit), yielding a more compact and efficient model while improving representation robustness under low-bit constraints. Extensive experiments on the Houston2013, MUUFL, and Augsburg datasets demonstrate the effectiveness of LMFusion. It achieves overall accuracies of 95.84%, 94.95%, and 99.05%, respectively, consistently outperforming representative multimodal classification methods and showing strong potential for accurate and efficient multimodal remote sensing classification.

1. Introduction

Multi-modal land cover classification is a fundamental problem in remote sensing and plays a crucial role in real-world applications, including urban planning, environmental monitoring, and military target recognition [1,2,3,4]. With the rapid development of Earth observation technologies, heterogeneous sensing modalities such as hyperspectral imagery, LiDAR, and SAR have become increasingly accessible. These modalities provide complementary information about the same scene, where spectral-rich data characterize material properties, while active sensing modalities capture geometric and structural cues that are robust to illumination variations and adverse atmospheric conditions [5,6,7,8]. Effectively integrating such heterogeneous information has therefore become a central challenge in remote sensing analysis [9,10,11,12].
Despite notable progress achieved by deep learning–based multi-modal approaches, several inherent challenges remain unresolved [2,13]. Remote sensing data are typically high-dimensional, which often leads to severe feature redundancy and increased computational burden [1,5,11]. Moreover, accurate land cover classification requires modeling long-range contextual dependencies as well as complex interactions across modalities over large spatial extents [5,11,14]. Existing convolutional, transformer-based, and hybrid frameworks have demonstrated strong representational capability, but they frequently suffer from high computational complexity, limited efficiency in cross-modal interaction modeling, and restricted deployability under constrained computational resources [13].
More specifically, while convolutional architectures excel at capturing local spatial–spectral patterns, their inherently limited receptive fields restrict the modeling of long-range dependencies across heterogeneous modalities. Transformer-based approaches alleviate this issue through global attention mechanisms; however, their quadratic computational complexity with respect to the number of tokens often results in substantial memory consumption and computational overhead when processing high-dimensional remote sensing data. Consequently, an efficient multimodal classification framework should not only enable effective cross-modal interaction, but also support long-range spatial–spectral dependency modeling under affordable computational complexity.
To address these limitations, recent studies have explored more efficient modeling paradigms that emphasize linear-complexity computation and structured sequence representations [7,10]. These approaches provide a promising direction for capturing long-range dependencies while mitigating the quadratic computational cost inherent in conventional global interaction mechanisms [8,12,15]. Nevertheless, in the context of multimodal remote sensing, it remains challenging to simultaneously achieve effective cross-modal interaction, computational efficiency, and deployment-friendly model design [6,7,10]. Existing works often investigate efficiency-oriented architectures and practical deployment considerations separately, leaving a gap between high-performance multimodal learning and real-world applicability [16,17].
Accordingly, LMFusion is designed to address this gap through three coordinated components. First, Linear Cross Attention is introduced to perform bidirectional information exchange between HSI and LiDAR features with linear-complexity computation, thereby improving cross-modal interaction efficiency. Second, SS2D-based state-space modeling is adopted to enhance long-range spatial–spectral dependency modeling without relying on computationally expensive global self-attention. Third, quantization-aware training is incorporated to improve the deployment potential of the framework under low-bit settings. These components jointly support the goal of achieving accurate, efficient, and deployment-friendly multimodal remote sensing classification.
In this work, we focus on efficient multi-modal land cover classification under realistic resource constraints, aiming to bridge the gap between expressive cross-modal representation learning and lightweight deployment. Our study is centered on the following aspects:
  • We propose LMFusion, an efficient multimodal classification framework that integrates linear-complexity cross-modal interaction with Mamba-based long-range spatial–spectral modeling, enabling effective HSI–LiDAR feature fusion under limited computational budgets.
  • We develop a quantization-aware optimization scheme for LMFusion, supporting ultra-low-bit deployment while preserving feature learning and improving model compactness and inference efficiency.
  • Extensive experiments on multiple multimodal benchmark datasets demonstrate that the proposed method consistently outperforms representative state-of-the-art approaches, while ablation studies further verify the effectiveness of Linear Cross Attention, SS2D-based state-space modeling, and quantization-aware training.

2. Related Works

2.1. Multi-Modal Learning in Remote Sensing

With the rapid development of high-resolution remote sensing (RS) sensors, the integration of heterogeneous data sources, such as hyperspectral imagery (HSI), LiDAR, and SAR, has become an essential strategy for accurate land-cover classification [3,4,18]. Traditional multimodal fusion methods mainly rely on hand-crafted feature extraction, morphological profiles, or shallow feature-level fusion strategies, which can exploit complementary information but have limited representation capacity for complex spatial–spectral patterns and heterogeneous modality relationships [9,19]. CNN-based methods are widely used to extract local spatial and spectral features and have achieved promising performance in HSI–LiDAR classification [1,16]. However, convolutional operations are inherently local, which limits their ability to model long-range dependencies and complex cross-modal interactions.
Transformer-based fusion architectures have been introduced to capture global contextual information and modality correlations through attention mechanisms [11,12,20]. Nevertheless, standard attention-based fusion usually suffers from quadratic computational complexity with respect to the number of tokens, which restricts its efficiency and scalability for high-dimensional remote sensing data. Linearized attention mechanisms provide a promising solution by replacing standard softmax attention with kernel-based or feature-mapping-based formulations, reducing the complexity from O ( N 2 ) to O ( N ) while preserving global interaction capability [21]. Liao et al. introduced MambaHL, a hybrid model combining state-space dynamics with convolutional backbones to better capture long-range dependencies while maintaining linear-time complexity. Building on the principles of recurrent-like modeling, state-space networks such as Mamba and its two-dimensional extensions (SS2D) reformulate sequence processing as continuous-time state evolution, parameterized by transition matrices (A,B,C). This formulation enables efficient modeling of spatial and temporal correlations without relying on dense attention operations. However, most of these works are restricted to unimodal vision or natural language data, leaving their potential for multimodal RS fusion largely unexplored [7].
To overcome the above limitations, recent research has sought to combine the efficiency of state-space modeling with cross-modal feature alignment for lightweight multimodal fusion [13]. These advances provide a promising foundation for lightweight cross-modal architectures that maintain both representational richness and computational efficiency. Motivated by these findings, our framework integrates Linear Cross Attention with SS2D-based state-space modeling to achieve bidirectional cross-modal interaction and long-range dependency modeling between HSI and LiDAR modalities under linear complexity. Different from existing multimodal fusion methods that mainly rely on CNN-based local feature extraction, Transformer-based global attention, or state-space modeling alone, the proposed LMFusion combines these two mechanisms into a unified lightweight framework, aiming to improve cross-modal interaction and long-range spatial–spectral representation learning with reduced computational cost.

2.2. Efficient and Lightweight Optimization

The ever-increasing resolution of RS data also raises practical challenges in model deployment and inference efficiency [10]. Deep multimodal models typically involve large parameter counts and memory footprints, hindering their use in real-time or embedded RS applications. Quantization techniques have thus emerged as a critical solution to compress models while maintaining accuracy [22,23]. Early post-training quantization (PTQ) methods directly discretized weights and activations but often resulted in severe performance degradation [22]. To mitigate this, Jacob et al. proposed Quantization-Aware Training (QAT), which incorporates fake quantization operations into the training pipeline to preserve gradient flow through discrete values [22]. Subsequent studies extended QAT to convolutional and Transformer-based architectures, enabling stable low-bit inference without noticeable loss in accuracy [24,25]. In the RS community, a few works have begun to investigate lightweight quantized models for spectral and spatial feature extraction [16,26]. Li et al. applied QAT to hyperspectral CNNs, demonstrating that low-bit models can significantly reduce computational costs while maintaining high classification precision. However, the integration of quantization with multimodal feature fusion remains underexplored-particularly when balancing long-range modeling, cross-modal consistency, and low-bit deployment [13,19,27]. In this context, our work adopts a Quantization-Aware Optimization strategy that jointly quantizes convolutional and linear layers during training, while selectively preserving full precision in cross-attention and state-space modules to ensure reliable cross-modal feature modeling [28].
In summary, existing multimodal RS methods have achieved notable progress in feature alignment and dependency modeling but still suffer from high computational overhead and limited deployability. Meanwhile, recent advances in state-space modeling and quantization provide opportunities for scalable and efficient architectures. Building upon these insights, our proposed framework integrates Linear Cross Attention, Mamba-based State Space Modeling, and Quantization-Aware Optimization, jointly enhancing cross-modal interaction, long-range reasoning, and lightweight inference for next-generation remote sensing classification.

3. Methodology

3.1. Problem Definition

In multimodal remote sensing classification, hyperspectral imagery (HSI) and LiDAR data provide complementary spectral and structural information for land-cover recognition. Given a pair of spatially aligned input patches, the hyperspectral and LiDAR inputs are represented as X h R C h × H × W and X l R C l × H × W , respectively, where C h and C l denote the numbers of channels of HSI and LiDAR data, and H and W represent the spatial dimensions of the input patch.
In our experiments, the spatial size is fixed to H = W = 32 . The channel numbers vary across datasets such as Houston2013, MUUFL, and Augsburg.
The objective is to learn a multimodal classification function y ^ = f ( X h , X l ) , where f ( · ) denotes the proposed network and y ^ represents the predicted land-cover label.

3.2. Framework Overview

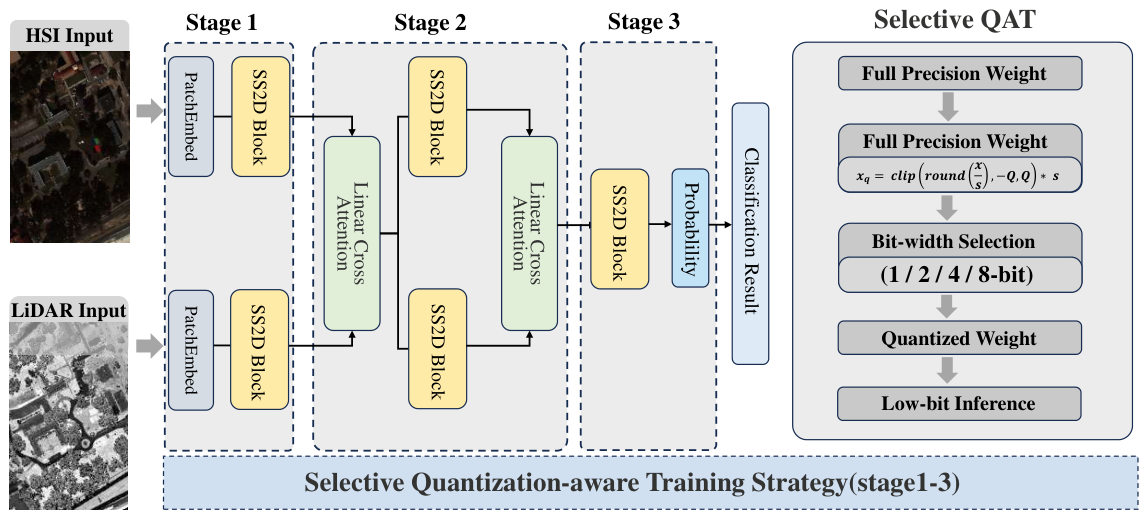
The overall architecture of the proposed framework is illustrated in Figure 1. The network is designed to jointly exploit the complementary information from hyperspectral imagery (HSI) and LiDAR data. The entire framework consists of three stages: initial feature encoding, cross-modal interaction modeling, and final classification. Specifically, the data flow starts from modality-specific Patch Embedding, proceeds through SS2D-based feature modeling and Linear Cross Attention-based cross-modal interaction, and finally reaches the classifier for land-cover prediction. The detailed step-by-step process is described below.
In Stage 1, the HSI and LiDAR inputs are first projected into a unified feature space through Patch Embedding layers. The embedded features of each modality are then processed by an SS2D block to perform preliminary feature modeling. Each SS2D block contains an SS2D-based state space modeling unit that captures spatial structural information and enhances local feature representations. The resulting modality-specific features are then used as the inputs to the following cross-modal interaction stage.
In Stage 2, the modality-specific features obtained from Stage 1 are first passed to a Linear Cross Attention module to model cross-modal interactions. In this module, a cross-attention operation allows features from HSI and LiDAR to exchange information. After this interaction, the features of each modality are further refined by another SS2D block. A second Linear Cross Attention module is then applied to further strengthen cross-modal fusion and establish deeper correlations between the two modalities.
In Stage 3, the fused features are further processed by an SS2D block for high-level semantic modeling. The resulting final representation is then fed into the classifier to generate the land-cover prediction.
To improve deployment efficiency on resource-constrained devices, a quantization-aware training strategy is adopted. Specifically, convolution and linear layers are quantized with multiple bit-width settings, enabling efficient inference while maintaining classification performance.

3.3. Linear Cross Attention

To capture cross-modal interactions between hyperspectral imagery and LiDAR features, we introduce a Linear Cross Attention module. Let F h R N × d and F l R N × d denote the HSI and LiDAR feature representations, respectively, where N = H × W is the number of spatial tokens and d is the feature dimension.
The query, key, and value matrices are obtained through linear projections as follows:
Q = F h W q , K = F l W k , V = F l W v ,
where W q , W k , and W v are learnable projection matrices.
In conventional attention mechanisms [29], the attention output is computed as:
Z = Softmax Q K T d V ,
which requires computing pairwise token similarities and results in a quadratic complexity of O ( N 2 ) .
To alleviate the quadratic computational complexity of conventional attention mechanisms, linear attention approximates the exponential similarity function using a kernel feature mapping ϕ ( · ) [21,30]:
exp ( Q i T K j ) ϕ ( Q i ) T ϕ ( K j ) .
Thus, the attention output can be reformulated as:
Z i = j = 1 N ϕ ( Q i ) T ϕ ( K j ) j = 1 N ϕ ( Q i ) T ϕ ( K j ) V j .
By exploiting the associative property of matrix multiplication, the computation order can be reorganized as:
Z = ϕ ( Q ) ϕ ( K ) T V ,
which reduces the computational complexity to O ( N d 2 ) while preserving effective cross-modal interaction between HSI and LiDAR features.
In practice, the proposed Linear Cross Attention module adopts a multi-head structure with 4 attention heads and incorporates residual connections for stable optimization. The feature dimensions of the three stages are set to 64, 128, and 256, respectively, and the hidden dimension is set to 128. These architectural settings are kept consistent across all datasets used in our experiments, while only the input channel numbers and the number of output classes are adjusted according to the dataset-specific HSI/LiDAR modalities and class definitions.

3.4. SS2D-Based Spatial State Space Modeling

To capture long-range spatial dependencies in multimodal remote sensing data, we introduce a spatial state space modeling module derived from the Mamba architecture [31]. Compared with convolutional neural networks, which primarily focus on local spatial correlations, state space models are capable of modeling global contextual relationships while maintaining linear computational complexity with respect to the sequence length [32]. Recent studies have further extended state space models to visual tasks by applying structured scanning strategies over spatial tokens, enabling efficient modeling of two-dimensional spatial dependencies and improving representation capability for high-dimensional visual data [33].
Given an input feature map F R H × W × C , the spatial dimensions are first reshaped into a sequence of spatial tokens, resulting in X R N × d with N = H × W , where N denotes the number of spatial tokens and d represents the feature dimension. The token sequence is then processed using a selective state space model (SSM) [31].
The continuous-time state space formulation of the system can be defined as [32]:
d h ( t ) d t = A h ( t ) + B x ( t ) ,
where h ( t ) denotes the hidden state, x ( t ) represents the input signal, and A, B, and C are learnable parameters.
Following the discretization adopted in Mamba [31], the hidden state update at step t is computed as:
h t = A ¯ t h t 1 + B ¯ t x t ,
where the discretized transition matrices are defined as:
A ¯ t = exp ( Δ t A ) , B ¯ t = 0 Δ t exp ( A τ )   d τ B ,
where Δ t denotes an input-dependent step size computed as Δ t = Softplus ( W Δ x t ) , enabling adaptive state transitions conditioned on the input features.
To adapt the state space modeling to spatial feature maps, the SS2D module performs selective scanning over the flattened spatial tokens [33]. Let X = { x 1 , x 2 , , x N } denote the spatial token sequence. During the scan process, hidden states are propagated along the predefined spatial scanning order according to the state update rule above, allowing long-range spatial dependencies to be captured efficiently while maintaining linear complexity with respect to the token length.
Finally, the SS2D module is integrated into the feature modeling block using a residual formulation:
F o u t = F i n + SS 2 D ( LN ( F i n ) ) ,
which stabilizes the optimization process and improves the capability of modeling long-range spatial dependencies.

3.5. Quantization-Aware Training

To further improve deployment efficiency on resource-constrained devices, we adopt a quantization-aware training (QAT) strategy [34]. During training, low-bit quantization is simulated in the forward pass, allowing the network parameters to gradually adapt to quantization-induced noise while maintaining stable optimization dynamics [25].
In the forward pass, quantized weights and activations are used for computation, while the backward pass employs the straight-through estimator (STE) to approximate gradients of the quantization function:
L w = L w q ,
where L denotes the overall training loss, w represents the original floating-point weight, and w q denotes the corresponding quantized weight.
To balance computational efficiency and classification performance, selective quantization is adopted [35]. Convolutional and fully connected layers are replaced by quantized counterparts during training, while other operations remain in floating-point precision to preserve numerical stability. For a selected weight bit-width b w , the full-precision weight w of each quantized layer is first scaled, rounded to the nearest discrete level, clipped to the valid integer range determined by b w , and then rescaled to obtain the quantized weight w q . During forward propagation, w q and the corresponding quantized activations are used to compute the layer outputs, so that the network is trained under the same low-bit constraint as inference. During backward propagation, the underlying full-precision weights are retained and updated using STE, which allows gradients to pass through the non-differentiable rounding operation. Therefore, the selected bit-width determines the discrete quantization range used to obtain w q , while the QAT process gradually adapts the full-precision parameters to the low-bit forward computation.
The detailed quantization-aware training procedure is summarized in Algorithm 1.
Algorithm 1 Quantization-Aware Training Procedure
  • Require: Pre-trained model M, weight bit-width b w , activation bit-width b a
  • Ensure: Quantized model M q
1:
Initialize M q M
2:
for each layer l in M q  do
3:
    if l is Conv2d or Linear then
4:
        Compute the quantization scale
s = max ( | w | ) 2 b w 1 1
5:
        Normalize weights
w n = w s
6:
        Map normalized weights to discrete levels
w ^ = w n
7:
        Clip the quantized values to the valid integer range
w ^ = clip w ^ , 2 b w 1 , 2 b w 1 1
8:
        Rescale to obtain the quantized weight
w q = s · w ^
9:
        Replace the floating-point layer with its corresponding quantized counterpart
10:
   end if
11:
end for
12:
Perform forward propagation using quantized weights and activations
13:
Update parameters using backpropagation with STE
14:
return  M q

4. Experiments and Analysis

4.1. Data Description

To comprehensively evaluate the effectiveness of the proposed framework, experiments are conducted on three widely used multimodal remote sensing benchmark datasets: Houston2013, MUUFL Gulfport, and Augsburg. These datasets provide co-registered multimodal observations with pixel-level annotations for land-cover classification. They exhibit diverse characteristics in terms of spatial resolution, spectral dimensionality, auxiliary modalities, and class distributions, which enables a comprehensive evaluation of the proposed method. Therefore, these datasets are selected to evaluate whether LMFusion can generalize across different scene types, sensor configurations, and category distributions rather than being tailored to a single benchmark.

4.1.1. Houston2013 Dataset

The Houston2013 dataset was released as part of the 2013 IEEE GRSS Data Fusion Contest. It consists of co-registered hyperspectral imaging (HSI) and LiDAR data acquired over the University of Houston campus in Houston, Texas, USA. The hyperspectral data were collected using the ITRES CASI-1500 sensor (ITRES Research Limited, Calgary, AB, Canada), providing 144 spectral bands covering wavelengths from 0.38 µm to 1.05 µm. The LiDAR data are provided as a single-band elevation map representing surface height.
All images in the dataset have a spatial resolution of 349 × 1905 pixels. The dataset contains 15 land-cover categories. The official training and testing partitions provided by the contest organizers are adopted in this work. The detailed numbers of training and testing samples for each category are summarized in Table 1.

4.1.2. Augsburg Dataset

The Augsburg dataset is a multimodal remote sensing dataset collected over the city of Augsburg, Germany, for land-cover classification tasks. It includes hyperspectral imaging (HSI), synthetic aperture radar (SAR), and LiDAR data, ensuring multimodal consistency across the observed scene.
The hyperspectral data were captured by the HySpex spectrometer (Norsk Elektro Optikk (NEO), Oslo, Norway) and consist of 180 spectral bands ranging from 400 nm to 2500 nm with a spectral resolution of 10 nm. The SAR data are obtained from Sentinel-1 using the Interferometric Wide Swath mode, providing dual-polarization (VV–VH). In addition, the LiDAR data provide elevation describing the surface structure of the scene.
All data were preprocessed to a spatial resolution of 332 × 485 pixels with a ground sampling distance (GSD) of 30 m to ensure alignment across modalities. The dataset contains seven land-cover categories, including forest, residential areas, industrial areas, low vegetation, allotments, commercial zones, and water bodies. In total, the dataset contains 761 training samples and 77,533 testing samples. The detailed distribution of training and testing samples is provided in Table 2.

4.1.3. MUUFL Gulfport Scene Dataset

The MUUFL Gulfport Scene dataset was collected in November 2010 over the University of Southern Mississippi-Gulf Park Campus in Long Beach, MI, USA. The hyperspectral data were acquired using the ITRES Research Ltd. Compact Airborne Spectral Imager (CASI-1500) sensor. The hyperspectral image has a spatial resolution of 325 × 220 pixels and originally contains 72 spectral bands, among which 64 bands are available for analysis. These bands span wavelengths from 375 nm to 1050 nm with a spectral interval of 10 nm. In addition, the LiDAR data provide elevation information with two channels describing surface height characteristics. The dataset includes 11 land-cover categories and a total of 53,687 labeled pixels. The official training and testing partitions are adopted. The detailed numbers of training and testing samples for each class are summarized in Table 3.
For the input configuration, all datasets are organized into two branches in the proposed framework. The HSI data are used as the spectral branch, while the auxiliary modality data are used as the structural branch. Each sample is cropped into a spatial patch with a size of 32 × 32 . Specifically, Houston2013 uses 144 HSI channels and 1 LiDAR channel with 15 land-cover classes; MUUFL uses 64 HSI channels and 2 LiDAR-related channels with 11 land-cover classes; Augsburg uses 180 HSI channels and co-registered SAR/LiDAR auxiliary data, including dual-polarization SAR channels and a LiDAR elevation channel, with 7 land-cover classes.

4.2. Evaluation Metrics and Parameter Setting

4.2.1. Evaluation Metrics

To quantitatively evaluate the classification performance of the proposed framework, four widely used metrics in remote sensing classification are adopted: Overall Accuracy (OA), Class Accuracy (CA), Average Accuracy (AA), and the Kappa coefficient.
Overall Accuracy (OA) measures the ratio of correctly classified samples to the total number of samples. Class Accuracy (CA) evaluates the classification accuracy of each individual category. Average Accuracy (AA) is defined as the mean of all class accuracies, which provides a more balanced evaluation under class-imbalanced conditions. The Kappa coefficient further measures the agreement between predicted labels and ground-truth labels while taking random agreement into account.
The corresponding definitions are given as follows:
O A = N c N a ,
C A i = N c i N a i ,
A A = 1 C i = 1 C C A i ,
κ = O A P e 1 P e ,
where N c denotes the number of correctly classified samples, N a represents the total number of samples, and N c i and N a i denote the number of correctly classified samples and the total number of samples in the i-th category, respectively. C is the total number of land-cover categories. P e denotes the probability of random agreement and is computed as
P e = i = 1 C N r i N p i N a 2 ,
where N r i and N p i denote the ground-truth samples and predicted samples belonging to the i-th category, respectively.

4.2.2. Parameter Setting

The proposed framework is implemented in PyTorch 2.3.1 with CUDA 11.8 support. All experiments are conducted on an NVIDIA A100-SXM4-80GB GPU computing platform (NVIDIA Corporation, Santa Clara, CA, USA).
For all datasets, the input spatial patch size is fixed to 32 × 32 . The HSI and auxiliary modality channels are set according to the corresponding dataset configuration. Specifically, the Houston2013 dataset contains 144 HSI channels and 1 LiDAR channel with 15 land-cover categories, the MUUFL dataset contains 64 HSI channels and 2 LiDAR channels with 11 categories, and the Augsburg dataset contains 180 HSI channels and 4 auxiliary-modality channels with 7 categories.
During training, the AdamW optimizer is adopted with an initial learning rate of 1 × 10 4 and a weight decay of 1 × 10 2 . The training batch size and test batch size are both set to 32. The model is trained for 200 epochs, and the dropout rate is set to 0.1. In addition, the cosine annealing learning-rate scheduler is employed to adjust the learning rate during training. The random seed is fixed to 3407, and the number of data-loading workers is set to 4.
Unless otherwise specified, the same training configuration is adopted for all datasets to ensure fair comparisons.

4.3. Ablation Study

To evaluate the contribution of each component in the proposed framework, we conduct a series of ablation experiments covering three aspects: modeling paradigm, cross-attention design, and quantization strategy. The results averaged over the Houston2013, MUUFL, and Augsburg datasets are summarized in Table 4.
A.
Modeling Paradigm Analysis:
We first analyze the impact of different modeling paradigms. Specifically, we replace the Mamba module with CNN and Transformer counterparts while keeping the rest of the architecture unchanged. As shown in Table 4, the CNN-based model achieves an overall accuracy (OA) of 95.82%, while the Transformer-based model reaches 96.45%. In contrast, the Mamba-based model obtains a higher OA of 97.14% and significantly improves AA and Kappa. These results suggest that the Mamba-based sequence modeling mechanism is more effective in capturing long-range spatial–spectral dependencies compared with convolutional and Transformer-based counterparts. By leveraging selective state space modeling, the Mamba module can efficiently model global contextual relationships while maintaining linear computational complexity, which leads to improved discriminative feature representation for multimodal data.
B.
Cross-Attention Design Analysis:
We further investigate the effectiveness of the proposed Linear Cross-Attention mechanism. Compared with the conventional cross-attention module, the linear variant slightly reduces the OA from 97.14% to 96.61%, while maintaining comparable AA and Kappa. Although the linear cross-attention slightly reduces the OA from 97.14% to 96.61%, it significantly lowers the computational cost by reducing the FLOPs from 19.86 G to 18.30 G. More importantly, the linear attention formulation is more compatible with low-bit quantization, enabling efficient lightweight deployment while maintaining competitive classification performance.
C.
Quantization Analysis:
To evaluate the lightweight deployment capability of the proposed framework, we conduct quantization experiments with bit-widths ranging from 1-bit to 16-bit based on the Mamba + Linear CA configuration. As shown in Table 4, quantization significantly reduces the model size while maintaining competitive classification performance. For instance, under 1-bit quantization, the model size decreases from 28.96 MB to 0.91 MB, while the OA improves to 97.19%.
These results indicate that the proposed framework is robust to low-bit quantization and achieves substantial storage reduction with minimal impact on classification accuracy. In particular, the significant reduction in model size suggests strong potential for deployment on resource-constrained devices that support low-bit inference.
Although this study focuses on theoretical analysis and simulation-based evaluation, the quantization results indicate that the proposed framework maintains stable performance under aggressive bit-width reduction, which benefits practical lightweight deployment.
These results verify the effectiveness of each component in the proposed framework. The Mamba module strengthens feature representation capability, the linear cross-attention mechanism reduces computational overhead, and the quantization strategy substantially compresses the model size, enabling efficient multimodal classification with improved deployability.

5. Results

5.1. Comparisons with Previous Methods

In this section, the proposed method is compared with representative multimodal remote sensing classification approaches, including coupled_CNN [5], CCR-Net [36], LSAF [37], HCT [38], MHST [38], SSEFT [39], ExViT [40], and DSHF [41]. These methods represent different multimodal fusion paradigms, such as convolution-based architectures, attention-based fusion models, and transformer-based frameworks.
To clarify the comparison protocol, the baseline results reported in this section are obtained from two sources. When the experimental settings are consistent or directly comparable, results from the corresponding original publications or existing benchmark studies are adopted. For methods with publicly available implementations, we reproduce the results under the corresponding dataset settings whenever possible. Since some baseline methods do not provide complete implementation details or use different data splits, not all compared methods are re-run from scratch. This protocol improves the transparency of the experimental comparison while maintaining fair and reasonable comparability among representative multimodal classification methods.
All experiments are conducted on three widely used multimodal remote sensing benchmark datasets, including Houston2013, MUUFL, and Augsburg. Three evaluation metrics are adopted to assess the classification performance, namely overall accuracy (OA), average accuracy (AA), and the kappa coefficient ( κ ). The detailed class-wise classification results are reported in Table 5, Table 6 and Table 7.
On the Houston2013 dataset, the proposed method achieves an OA of 95.84%, an AA of 95.90%, and a κ value of 95.54%, which are the best results among the compared methods. Compared with coupled_CNN and CCR-Net, the proposed method improves the OA by 1.47% and 2.69%, respectively. In terms of class-wise performance, the proposed method achieves strong results across categories. For example, the Residential class achieves 98.69% accuracy, while the Synthetic Grass and Running Track classes both reach 100.00%.
On the Augsburg dataset, the proposed method achieves an OA of 99.05%, an AA of 95.74%, and a κ value of 98.64%, which are the highest values among all compared methods. From Table 6, the proposed method achieves the best accuracy in several categories. For instance, Forest achieves 99.85%, while Commercial Area and Industrial Area achieve 99.71% and 99.65%, respectively.
On the MUUFL dataset, the proposed method achieves an OA of 94.95%, an AA of 93.28%, and a κ value of 93.28%. Compared with CCR-Net and DSHF, the OA is improved by 3.45% and 6.30%, respectively. In addition, the proposed method achieves the best performance in several categories, including Grass-Pure, Dirt-and-Sand, Sidewalk, Yellow-Curb, and ClothPanels.
Computational Complexity Analysis:
In addition to classification accuracy, we further analyze the computational complexity of different methods in terms of parameter scale and model size.
For fair comparison, the complexity evaluation follows the Houston2013 dataset configuration, where the hyperspectral image (HSI) input is set to 1 × 144 × 32 × 32 and the LiDAR input is set to 1 × 1 × 32 × 32 with a batch size of 1.
The comparison results are summarized in Table 8. As shown in the table, the proposed framework contains 7.58 M parameters with a model size of 28.92 MB under the full-precision (FP32) setting.
For several existing multimodal classification models, including MAHiDFNet, FusAtNet, SepG-ResNet50, the parameter statistics are directly reported from the benchmark comparison presented in the recent study CTPMSN [42]. Compared with these representative approaches, the proposed method achieves a significantly smaller parameter scale and storage cost while maintaining strong classification capability.
For instance, MAHiDFNet requires 77.0 M parameters, and FusAtNet contains 36.9 M parameters, both of which are considerably larger than the proposed model. Even compared with SepG-ResNet50 (14.7 M parameters), the proposed method still achieves a notable reduction in model complexity.
Quantization Analysis:
To further improve deployment efficiency, the proposed framework supports low-bit quantization during inference. As reported in Table 8, when applying 1-bit quantization, the model size can be reduced from 28.92 MB to 0.91 MB, achieving approximately 31× storage compression compared with the full-precision model.
It should be noted that the reported storage cost under low-bit quantization corresponds to the theoretical model size assuming ideal bit-level representation. In practical deployment scenarios, achieving such compression requires hardware platforms that support low-bit arithmetic operations.
Overall, the proposed framework maintains a moderate parameter scale while enabling substantial storage reduction through quantization, demonstrating its potential for lightweight deployment in remote sensing applications. It is worth noting that lightweight remote sensing classification requires not only a compact parameter scale, but also a balanced consideration of accuracy, memory footprint, and inference efficiency. In this regard, the proposed LMFusion provides a practical trade-off by combining linear-complexity cross-modal interaction with low-bit quantization. The Linear Cross Attention module reduces the computational burden of multimodal interaction, while quantization-aware training further decreases the storage requirement of the model. This design is particularly meaningful for remote sensing scenarios where onboard or edge devices have limited memory and computational resources.

5.2. Result Visualization

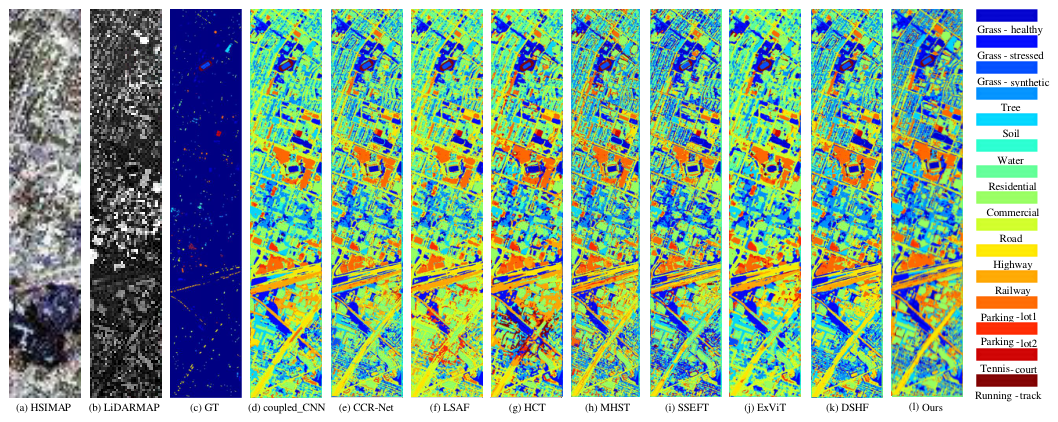
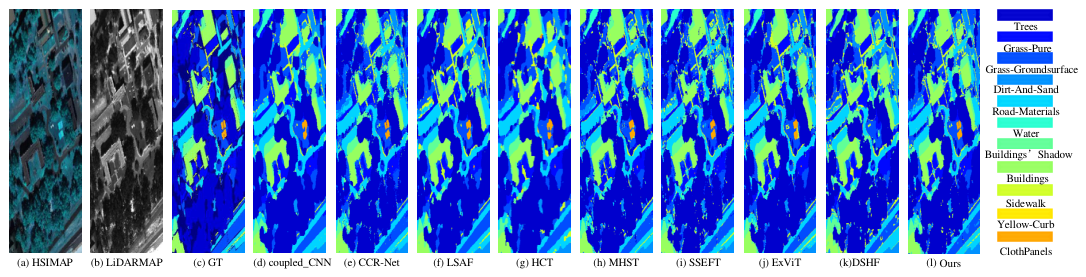
To provide a more intuitive comparison of classification performance among different methods, visualization results on the Houston2013, Augsburg, and MUUFL datasets are presented. Each land-cover category is represented by a distinct color to facilitate visual comparison.
On the Houston2013 dataset, several CNN-based approaches such as coupled_CNN and CCR-Net tend to produce fragmented predictions in complex urban regions. This phenomenon is particularly visible in areas containing residential blocks and dense road networks, where misclassified pixels frequently appear. Transformer-based methods improve spatial consistency to some extent; however, confusion between spectrally similar categories, such as Synthetic grass and Running track, can still be observed. In comparison, the proposed method produces more spatially continuous classification regions and clearer object boundaries, especially around urban structures such as highways and railways.
For the Augsburg dataset, which contains complex urban scenes with multiple land-cover categories, noticeable differences can be observed among the compared methods. Several existing models generate noisy predictions in built-up areas, especially in Commercial Area and Industrial Area. In contrast, the classification map produced by the proposed method shows more coherent regions and fewer scattered pixels. Large homogeneous areas such as Forest and Low Plants are also preserved more clearly.
On the MUUFL dataset, some categories share similar spectral characteristics, making them difficult to distinguish. For example, Sidewalk, Yellow-Curb, and ClothPanels often appear mixed in predictions of several baseline methods. As shown in the visualization results, the proposed approach produces more consistent classification patterns in these regions and maintains clearer structural details around roads and buildings.
The visualization results are shown in Figure 2, Figure 3 and Figure 4. The visual comparison further supports the quantitative results reported in the comparison tables. Compared with several baseline methods, LMFusion produces more spatially coherent classification maps and reduces scattered misclassified pixels in complex regions. This indicates that the proposed combination of Linear Cross Attention and SS2D-based state-space modeling is beneficial for preserving structural continuity while enhancing cross-modal feature representation. These results further demonstrate the effectiveness of the proposed framework for multimodal remote sensing classification.

6. Discussion

The experimental results demonstrate that LMFusion achieves a favorable balance between classification accuracy and computational efficiency in multimodal remote sensing classification. Compared with CNN-based methods, the proposed framework is better suited for capturing long-range spatial–spectral dependencies through SS2D-based state-space modeling. Compared with Transformer-based methods, Linear Cross Attention reduces the computational burden caused by pairwise token interaction while still enabling effective bidirectional information exchange between HSI and LiDAR features. This design allows the model to exploit complementary spectral and structural information without introducing excessive computational overhead.
The ablation results further show that each component contributes to the overall effectiveness of the framework. The Mamba-based modeling paradigm improves feature representation by capturing broader contextual dependencies. The Linear Cross Attention module provides a more efficient cross-modal fusion strategy than conventional attention, reducing FLOPs while maintaining competitive classification performance. In addition, quantization-aware training significantly decreases the model storage cost under low-bit settings, indicating that LMFusion has potential for lightweight deployment in resource-constrained remote sensing scenarios.
The visualization results also support the quantitative comparisons. LMFusion produces more spatially coherent classification maps and reduces scattered misclassified pixels in complex regions. This suggests that the combination of efficient cross-modal interaction and long-range dependency modeling is beneficial for preserving structural continuity and improving category discrimination, especially in scenes where different land-cover classes have similar spectral responses or fragmented spatial distributions.
Nevertheless, several aspects remain worthy of further investigation. Although the current experiments are conducted on three representative multimodal benchmark datasets, more large-scale scenes with different sensor configurations can be considered in future work to further evaluate the generalization ability of the framework. Moreover, the reported low-bit quantization results mainly demonstrate the theoretical storage reduction, while practical acceleration still depends on hardware support for low-bit arithmetic. Therefore, future work will further investigate real-device inference latency, memory consumption, and energy efficiency on edge-computing platforms.

7. Conclusions

In this paper, we propose LMFusion, an efficient multimodal classification framework for hyperspectral and LiDAR data. By enabling effective cross-modal interaction and long-range spatial–spectral dependency modeling under linear-complexity computation, the proposed method achieves a favorable balance between classification performance and computational efficiency. Experimental results on three benchmark datasets demonstrate that LMFusion consistently outperforms several representative methods. In addition, visualization and quantization analyses verify its ability to generate spatially coherent predictions and maintain robust representation capability under low-bit settings, indicating its potential for efficient deployment in resource-constrained remote sensing scenarios. Future work will further investigate hardware-aware optimization, including low-bit operator support, memory-access optimization, and inference acceleration on edge devices. In addition, we will extend the proposed framework to more heterogeneous remote sensing modalities, such as SAR, multispectral imagery, and multi-temporal observations, to further evaluate its scalability and robustness under more diverse application scenarios.

Author Contributions

Conceptualization, S.Z. and Y.L.; methodology, S.Z., S.H. and D.L.; software, S.Z. and D.L.; validation, S.Z., S.H. and D.L.; formal analysis, S.Z.; investigation, S.Z.; resources, W.X. and Y.L.; data curation, S.Z. and D.L.; writing—original draft preparation, S.Z.; writing—review and editing, S.H., D.L., W.X. and Y.L.; visualization, S.Z.; supervision, W.X. and Y.L.; project administration, W.X. and Y.L.; funding acquisition, W.X. and Y.L. All authors have read and agreed to the published version of the manuscript.

Funding

This work was supported in part by the National Natural Science Foundation of China under Grants 62322117, 62371365, U24B20136, and U22B2014, and in part by the Fundamental Research Funds for the Central Universities under Grant ZYTS24101.

Institutional Review Board Statement

Not applicable.

Informed Consent Statement

Not applicable.

Data Availability Statement

The datasets used in this study are publicly available from the corresponding dataset providers. Additional experimental results are available from the corresponding author upon reasonable request.

Conflicts of Interest

The authors declare no conflicts of interest.

References

  1. Chen, Y.; Lin, Z.; Zhao, X.; Wang, G.; Gu, Y. Deep Learning-Based Classification of Hyperspectral Data. IEEE J. Sel. Top. Appl. Earth Obs. Remote Sens. 2014, 7, 2094–2107. [Google Scholar] [CrossRef]
  2. Ghamisi, P.; Yokoya, N.; Li, J.; Liao, W.; Liu, S.; Plaza, J.; Rasti, B.; Plaza, A. Advances in Hyperspectral Image and Signal Processing: A Comprehensive Overview of the State of the Art. IEEE Geosci. Remote Sens. Mag. 2017, 5, 37–78. [Google Scholar] [CrossRef]
  3. Matsuki, T.; Yokoya, N.; Iwasaki, A. Hyperspectral Tree Species Classification of Japanese Complex Mixed Forest with the Aid of Lidar Data. IEEE J. Sel. Top. Appl. Earth Obs. Remote Sens. 2015, 8, 2177–2187. [Google Scholar] [CrossRef]
  4. Ghamisi, P.; Höfle, B.; Zhu, X.X. Hyperspectral and LiDAR Data Fusion Using Extinction Profiles and Deep Convolutional Neural Network. IEEE J. Sel. Top. Appl. Earth Obs. Remote Sens. 2017, 10, 3011–3024. [Google Scholar] [CrossRef]
  5. Hang, R.; Li, Z.; Ghamisi, P.; Hong, D.; Xia, G.; Liu, Q. Classification of Hyperspectral and LiDAR Data Using Coupled CNNs. IEEE Trans. Geosci. Remote Sens. 2020, 58, 4939–4950. [Google Scholar] [CrossRef]
  6. Zhao, X.; Tao, R.; Li, W.; Li, H.C.; Du, Q.; Liao, W.; Philips, W. Joint Classification of Hyperspectral and LiDAR Data Using Hierarchical Random Walk and Deep CNN Architecture. IEEE Trans. Geosci. Remote Sens. 2020, 58, 7355–7370. [Google Scholar] [CrossRef]
  7. Du, X.; Zheng, X.; Lu, X.; Doudkin, A.A. Multisource Remote Sensing Data Classification with Graph Fusion Network. IEEE Trans. Geosci. Remote Sens. 2021, 59, 10062–10072. [Google Scholar] [CrossRef]
  8. Xue, Z.; Yu, X.; Tan, X.; Liu, B.; Yu, A.; Wei, X. Multiscale Deep Learning Network with Self-Calibrated Convolution for Hyperspectral and LiDAR Data Collaborative Classification. IEEE Trans. Geosci. Remote Sens. 2022, 60, 5514116. [Google Scholar] [CrossRef]
  9. Luo, R.; Liao, W.; Zhang, H.; Zhang, L.; Scheunders, P.; Pi, Y.; Philips, W. Fusion of Hyperspectral and LiDAR Data for Classification of Cloud-Shadow Mixed Remote Sensed Scene. IEEE J. Sel. Top. Appl. Earth Obs. Remote Sens. 2017, 10, 3768–3781. [Google Scholar] [CrossRef]
  10. Gbodjo, Y.J.E.; Montet, O.; Ienco, D.; Gaetano, R.; Dupuy, S. Multisensor Land Cover Classification with Sparsely Annotated Data Based on Convolutional Neural Networks and Self-Distillation. IEEE J. Sel. Top. Appl. Earth Obs. Remote Sens. 2021, 14, 11485–11499. [Google Scholar] [CrossRef]
  11. Zhang, M.; Li, W.; Tao, R.; Li, H.; Du, Q. Information Fusion for Classification of Hyperspectral and LiDAR Data Using IP-CNN. IEEE Trans. Geosci. Remote Sens. 2022, 60, 5506812. [Google Scholar] [CrossRef]
  12. Li, J.; Ma, Y.; Song, R.; Xi, B.; Hong, D.; Du, Q. A Triplet Semisupervised Deep Network for Fusion Classification of Hyperspectral and LiDAR Data. IEEE Trans. Geosci. Remote Sens. 2022, 60, 5540513. [Google Scholar] [CrossRef]
  13. Hong, D.; Gao, L.; Yokoya, N.; Yao, J.; Chanussot, J.; Du, Q.; Zhang, B. More Diverse Means Better: Multimodal Deep Learning Meets Remote-Sensing Imagery Classification. IEEE Trans. Geosci. Remote Sens. 2021, 59, 4340–4354. [Google Scholar] [CrossRef]
  14. Xiu, D.; Pan, Z.; Wu, Y.; Hu, Y. MAGE: Multisource Attention Network with Discriminative Graph and Informative Entities for Classification of Hyperspectral and LiDAR Data. IEEE Trans. Geosci. Remote Sens. 2022, 60, 5539714. [Google Scholar] [CrossRef]
  15. Šimundić, V.; Mihelčić, D.; Svirac, D.; Đurović, P.; Cupec, R. Safety System for Industrial Robots Based on Human Detection Using an RGB-D Camera. In Proceedings of the 2021 44th International Convention on Information, Communication and Electronic Technology (MIPRO), Opatija, Croatia, 27 September–1 October 2021; pp. 1178–1184. [Google Scholar] [CrossRef]
  16. Roy, S.K.; Krishna, G.; Dubey, S.R.; Chaudhuri, B.B. HybridSN: Exploring 3-D–2-D CNN Feature Hierarchy for Hyperspectral Image Classification. IEEE Geosci. Remote Sens. Lett. 2020, 17, 277–281. [Google Scholar] [CrossRef]
  17. Nugraheni, D.M.K.; de Vries, D. The effectiveness of SMS as verification of flood early warning messages from users’ perception. In Proceedings of the 2017 1st International Conference on Informatics and Computational Sciences (ICICoS), Semarang, Indonesia, 15–16 November 2017; pp. 77–82. [Google Scholar] [CrossRef]
  18. Zhu, X.X.; Tuia, D.; Mou, L.; Xia, G.S.; Zhang, L.; Xu, F.; Fraundorfer, F. Deep Learning in Remote Sensing: A Comprehensive Review and List of Resources. IEEE Geosci. Remote Sens. Mag. 2017, 5, 8–36. [Google Scholar] [CrossRef]
  19. Baltrušaitis, T.; Ahuja, C.; Morency, L.P. Multimodal Machine Learning: A Survey and Taxonomy. IEEE Trans. Pattern Anal. Mach. Intell. 2019, 41, 423–443. [Google Scholar] [CrossRef]
  20. Dosovitskiy, A.; Beyer, L.; Kolesnikov, A.; Weissenborn, D.; Zhai, X.; Unterthiner, T.; Dehghani, M.; Minderer, M.; Heigold, G.; Gelly, S.; et al. An Image is Worth 16x16 Words: Transformers for Image Recognition at Scale. In Proceedings of the International Conference on Learning Representations (ICLR), Virtual Event, 3–7 May 2021. [Google Scholar]
  21. Katharopoulos, A.; Vyas, A.; Pappas, N.; Fleuret, F. Transformers are RNNs: Fast Autoregressive Transformers with Linear Attention. In Proceedings of the 37th International Conference on Machine Learning (ICML), Virtual Event, 13–18 July 2020; Daumé, H., III, Singh, A., Eds.; PMLR: Cambridge, MA, USA, 2020; Volume 119, pp. 5156–5165. [Google Scholar]
  22. Yang, W.; Ouyang, W.; Wang, X.; Ren, J.; Li, H.; Wang, X. 3D Human Pose Estimation in the Wild by Adversarial Learning. In Proceedings of the 2018 IEEE/CVF Conference on Computer Vision and Pattern Recognition (CVPR), Salt Lake City, UT, USA, 18–22 June 2018; pp. 5255–5264. [Google Scholar] [CrossRef]
  23. Banner, R.; Nahshan, Y.; Hoffer, E.; Soudry, D. Post Training 4-bit Quantization of Convolutional Networks. In Proceedings of the Advances in Neural Information Processing Systems (NeurIPS), Vancouver, BC, Canada, 8–14 December 2019. [Google Scholar]
  24. Krishnamoorthi, R. Quantizing Deep Convolutional Networks for Efficient Inference: A Whitepaper. arXiv 2018, arXiv:1806.08342. [Google Scholar] [CrossRef]
  25. Esser, S.K.; McKinstry, J.L.; Bablani, D.; Appuswamy, R.; Modha, D.S. Learned Step Size Quantization. In Proceedings of the International Conference on Learning Representations (ICLR), Virtual Event, 26 April–1 May 2020. [Google Scholar]
  26. Ruan, Y.; Wu, S.; Yang, C.; Xie, K.; Zhi, H. Simulation and Experiments of the Eruption of Deep-sea Hydrothermal Plume. In Proceedings of the Global Oceans 2020: Singapore–U.S. Gulf Coast, Virtual Event, 5–30 October 2020; pp. 1–6. [Google Scholar] [CrossRef]
  27. Rehmat, M.; Ansari, A.; ur Rehman, M. Modeling and Analysis of 300 MW Photovoltaic System Using ETAP and Harmonic Filter Design. In Proceedings of the 2023 Third International Symposium on Instrumentation, Control, Artificial Intelligence, and Robotics (ICA-SYMP), Bangkok, Thailand, 18–20 January 2023; pp. 140–144. [Google Scholar] [CrossRef]
  28. Nagel, M.; Amjad, R.A.; van Baalen, M.; Louizos, C.; Blankevoort, T. A Data-Free Quantization Method for Deep Neural Networks. In Proceedings of the International Conference on Learning Representations (ICLR), Virtual Event, 3–7 May 2021. [Google Scholar]
  29. Vaswani, A.; Shazeer, N.; Parmar, N.; Uszkoreit, J.; Jones, L.; Gomez, A.N.; Kaiser, L.; Polosukhin, I. Attention Is All You Need. In Proceedings of the Advances in Neural Information Processing Systems (NeurIPS), Long Beach, CA, USA, 4–9 December 2017. [Google Scholar]
  30. Qin, Z.; Sun, W.; Deng, H.; Jiang, X.; Sun, Y.; Zhao, X. Bridging the Divide: Reconsidering Softmax and Linear Attention. In Proceedings of the 2022 Conference on Empirical Methods in Natural Language Processing (EMNLP), Abu Dhabi, United Arab Emirates, 7–11 December 2022; pp. 515–527. [Google Scholar]
  31. Gu, A.; Dao, T. Mamba: Linear-Time Sequence Modeling with Selective State Spaces. arXiv 2023, arXiv:2312.00752. [Google Scholar]
  32. Gu, A.; Goel, K.; Re, C. Efficiently Modeling Long Sequences with Structured State Spaces. In Proceedings of the International Conference on Learning Representations (ICLR), Virtual Event, 25–29 April 2022. [Google Scholar]
  33. Liu, Y.; Tian, Y.; Zhao, Y.; Yu, H.; Xie, L.; Wang, Y.; Ye, Q.; Jiao, J.; Liu, Y. VMamba: Visual State Space Model. In Proceedings of the Advances in Neural Information Processing Systems (NeurIPS), Vancouver, BC, Canada, 9–15 December 2024. [Google Scholar]
  34. Jacob, B.; Kligys, S.; Chen, B.; Zhu, M.; Tang, M.; Howard, A.; Adam, H.; Kalenichenko, D. Quantization and Training of Neural Networks for Efficient Integer-Arithmetic-Only Inference. In Proceedings of the IEEE/CVF Conference on Computer Vision and Pattern Recognition (CVPR), Salt Lake City, UT, USA, 18–22 June 2018. [Google Scholar]
  35. Zhou, S.; Wu, Y.; Ni, Z.; Zhou, X.; Wen, H.; Zou, Y. DoReFa-Net: Training Low Bitwidth Convolutional Neural Networks with Low Bitwidth Gradients. arXiv 2016, arXiv:1606.06160. [Google Scholar]
  36. Wu, X.; Hong, D.; Chanussot, J. Convolutional Neural Networks for Multimodal Remote Sensing Data Classification. IEEE Trans. Geosci. Remote Sens. 2022, 60, 5517010. [Google Scholar] [CrossRef]
  37. Feng, M.; Gao, F.; Fang, J.; Dong, J. Hyperspectral and Lidar Data Classification Based on Linear Self-Attention. In Proceedings of the 2021 IEEE International Geoscience and Remote Sensing Symposium IGARSS, Virtual Event, 11–16 July 2021; pp. 2401–2404. [Google Scholar] [CrossRef]
  38. Zhao, G.; Ye, Q.; Sun, L.; Wu, Z.; Pan, C.; Jeon, B. Joint Classification of Hyperspectral and LiDAR Data Using a Hierarchical CNN and Transformer. IEEE Trans. Geosci. Remote Sens. 2023, 61, 5500716. [Google Scholar] [CrossRef]
  39. Feng, Y.; Zhu, J.; Song, R.; Wang, X. S2EFT: Spectral-spatial-elevation fusion transformer for hyperspectral image and LiDAR classification. Knowl.-Based Syst. 2024, 283, 111190. [Google Scholar] [CrossRef]
  40. Yao, J.; Zhang, B.; Li, C.; Hong, D.; Chanussot, J. Extended Vision Transformer (ExViT) for Land Use and Land Cover Classification: A Multimodal Deep Learning Framework. IEEE Trans. Geosci. Remote Sens. 2023, 61, 5514415. [Google Scholar] [CrossRef]
  41. Feng, Y.; Song, L.; Wang, L.; Wang, X. DSHFNet: Dynamic Scale Hierarchical Fusion Network Based on Multiattention for Hyperspectral Image and LiDAR Data Classification. IEEE Trans. Geosci. Remote Sens. 2023, 61, 5522514. [Google Scholar] [CrossRef]
  42. Wang, A.; Dai, S.; Wu, H.; Lv, H.; Yan, S.; Wang, M. CTPMSN: Enhancing Multimodal Remote Sensing Classification with Composite Text Prompts. IEEE J. Sel. Top. Appl. Earth Obs. Remote Sens. 2025, 18, 27960–27978. [Google Scholar] [CrossRef]
Figure 1. LMFusion adopts a three-stage multimodal architecture for HSI–LiDAR classification. Dual-modal features are first extracted by SS2D blocks and progressively fused through linear cross-attention to model cross-modal dependencies. The fused representations are then refined in the final stage for prediction. In addition, a selective quantization-aware training strategy is applied across Stages 1–3 to enable efficient low-bit deployment.
Remotesensing 18 01972 g001
Figure 2. Visualization of false-color HSI and LiDAR images using different comparison methods on the Houston2013 dataset.
Remotesensing 18 01972 g002
Figure 3. Visualization of false-color HSI and LiDAR images using different comparison methods on the Augsburg dataset.
Remotesensing 18 01972 g003
Figure 4. Visualization of false-color HSI and LiDAR images using different comparison methods on the MUUFL dataset.
Remotesensing 18 01972 g004
Table 1. A List of the Number of Training and Testing Samples for Each Class in the Houston2013 Dataset.
Land CoverTrainTestLand CoverTrainTest
Background662,013652,648Grass-healthy1981053
Grass-stressed1901064Grass-synthetic192505
Tree1881056Soil1861056
Water182143Residential1961072
Commercial1911053Road1931059
Highway1911036Railway1811054
Parking-lot11921041Parking-lot2184285
Tennis-court181247Running-track187473
Table 2. A List of the Number of Training and Testing Samples for Each Class in the Augsburg Dataset.
Land CoverTrainTestLand CoverTrainTest
Background160,25983,487Forest14613,361
Commercial Area26430,065Residential Area213830
Industrial Area24826,609Low Plants52523
Allotment71638Water231507
Table 3. A List of the Number of Training and Testing Samples for Each Class in the MUUFL Dataset.
Land CoverTrainTestLand CoverTrainTest
Background68,81720,496Trees116222,084
Grass-Pure2144056Grass-Groundsurface3446538
Dirt-And-Sand911735Road-Materials3346353
Water23443Buildings’-Shadow1122121
Buildings3125928Sidewalk691316
Yellow-Curb9174ClothPanels13256
Table 4. Unified ablation study averaged over three datasets (Houston2013, MUUFL, and Augsburg).
CNNTransMambaLinear CAQuantBitOAAA κ ParamsFLOPsSize
A. Modeling Paradigm
95.8289.5594.564.08 M14.16 G15.55 MB
96.4591.9195.374.05 M85.75 G15.46 MB
97.1495.5396.407.58 M19.86 G28.92 MB
B. Cross-Attention Design
97.1495.5396.407.58 M19.86 G28.92 MB
FP3296.6194.9795.827.59 M18.30 G28.96 MB
C. Quantization (based on Mamba + Linear CA)
197.1995.6596.447.59 M18.30 G0.91 MB
296.6195.0295.817.59 M18.30 G1.81 MB
496.6995.0995.917.59 M18.30 G3.62 MB
896.2594.6395.437.59 M18.30 G7.24 MB
1696.7395.1895.957.59 M18.30 G14.48 MB
Table 5. OA, AA and Kappa Coefficient on the Houston2013 Dataset (in %) by Considering HSI and LiDAR Data.
No.ClassCoupled CNNCCR-NetLSAFHCTMHSTSSEFTExViTDSHFOurs
1Healthy grass82.8188.4183.1097.3492.1883.3882.9187.5698.34
2Stressed grass99.8199.91 83.0896.6296.8097.0998.6899.3499.51
3Synthetic grass97.23100.00100.0084.7597.8297.2399.6098.81100.00
4Tree100.0099.1589.4996.7899.8198.8699.1599.8198.11
5Soil100.0099.34100.00100.00100.0099.7299.9199.91100.00
6Water100.0095.80100.0096.5096.5091.6199.3093.71100.00
7Residential92.3594.9692.7282.0995.5291.3296.0883.9698.69
8Commercial94.3091.2692.6995.5496.3990.0390.0380.6385.39
9Road92.7392.6397.0790.8487.7280.3686.1264.6891.06
10Highway85.1479.6368.4458.8882.2455.3172.9796.7276.7
11Railway98.8694.2189.9497.5398.0184.8288.9978.75100.00
12Park lot 193.2888.3896.2590.1185.4977.7190.3986.3691.5
13Park lot 289.4777.1989.1297.1992.9861.7590.1888.7799.18
14Tennis court100.0096.76100.00100.0094.3399.7699.6098.79100.00
15Running track98.9499.79100.00100.0097.0492.1895.14100.00100.00
 OA(%)94.3793.1590.5191.1593.8186.3391.4089.0195.84
 AA(%)94.9993.1692.1392.2894.1986.4192.6090.5295.9
 Kappa(%)93.8892.5689.6990.4093.2885.1890.6688.0695.54
Bold indicates the best or tied-best result in each row.
Table 6. OA, AA and Kappa Coefficient on the Augsburg dataset (in %) by Considering HSI and LiDAR Data.
No.ClassCoupled_CNNCCR-NetLSAFHCTMHSTSSEFTExViTDSHFOurs
1Forest92.9692.0697.2194.2398.9291.8393.5197.0699.85
2Commercial Area1.776.780.314.821.409.3415.208.9199.71
3Residential Area97.0497.1398.9798.5494.5590.1997.3196.8893.88
4Industrial Area76.6662.0930.3143.7964.3352.2264.2614.8399.65
5Low Plants96.1084.2095.9795.3386.0488.2987.5798.0192.25
6Allotment50.1046.2749.1467.8852.0155.6452.775.5490.03
7Water30.6626.9411.9452.0934.378.6327.0147.5194.78
 OA(%)91.3986.4790.1390.9087.4784.4288.2889.8199.05
 AA(%)63.6159.3554.8465.2461.6656.5962.5252.6895.74
 Kappa(%)87.5680.6385.4586.8382.1777.7483.2884.9398.64
Bold indicates the best or tied-best result in each row.
Table 7. OA, AA and Kappa Coefficient on the MUUFL Dataset (in %) by Considering HSI and LiDAR Data.
No.ClassCoupled_CNNCCR-NetLSAFHCTMHSTSSEFTExViTDSHFOurs
1Trees97.6797.4497.0097.0398.8697.3798.5895.0698.51
2Grass-Pure88.0977.9383.3690.2979.8377.7687.7081.0191.55
3Grass-Groundsurface88.9982.9090.7990.0779.6383.1390.9672.9090.14
4Dirt-And-Sand95.2288.1394.1894.1893.9582.5490.6194.8795.8
5Road-Materials97.3296.4995.8893.8694.8495.1794.7390.4196.47
6Water99.1094.3694.5895.7192.7892.1093.681.8198.36
7Buildings’Shadow85.3883.3687.3687.0987.1378.9790.0597.9789.51
8Buildings98.0897.9398.1496.6197.1296.7897.7692.7098.04
9Sidewalk51.6052.8975.9146.3568.7763.2268.5456.0887.77
10Yellow-Curb10.342.3013.2218.9728.1626.4423.56092.73
11ClothPanels81.6485.1684.7775.3993.7591.0280.86097.75
 OA(%)93.6591.5093.7092.9592.4391.1794.3788.6594.95
 AA(%)81.2278.0883.2080.5083.1780.4183.3763.1193.28
 Kappa(%)91.5988.7491.6890.6989.9288.3292.5485.1593.28
Bold indicates the best or tied-best result in each row.
Table 8. Parameter and model size comparison of different multimodal classification methods.
ModelParams (M)Model Size (MB)
MAHiDFNet77.0308.0
FusAtNet36.9147.6
SepG-ResNet5014.758.8
Ours (FP32)7.6029.00
Ours (1-bit)7.600.91
Disclaimer/Publisher’s Note: The statements, opinions and data contained in all publications are solely those of the individual author(s) and contributor(s) and not of MDPI and/or the editor(s). MDPI and/or the editor(s) disclaim responsibility for any injury to people or property resulting from any ideas, methods, instructions or products referred to in the content.