Article

Robust Spatial Georeferencing for UAV-UGV Mobile Mapping Platforms in Urban Canyons via Asymmetric GNSS/UWB Fusion


1
School of Information Engineering, Suqian University, Suqian 223800, China
2
Aerospace Information Research Institute, Chinese Academy of Sciences, Beijing 100094, China
3
College of Electronic Information and Electrical Engineering, Tianshui Normal University, Tianshui 741000, China
4
School of Navigation and Internet of Things, Aerospace Information Technology University, Jinan 250200, China
5
Department of Navigation, Dalian Naval Academy, Dalian 116000, China
*
Author to whom correspondence should be addressed.
Remote Sens. 2026, 18(12), 1967; https://doi.org/10.3390/rs18121967
Submission received: 24 April 2026 / Revised: 8 June 2026 / Accepted: 11 June 2026 / Published: 13 June 2026

Highlights

What are the main findings?
  • The proposed asymmetric GNSS/UWB fusion method, coupling a C / N 0 - and elevation-dependent heterogeneous stochastic model with UWB dynamic baseline constraints, achieves a 98.2% ambiguity resolution success rate and sub-decimeter 3D accuracy under extreme satellite occlusion (≤3 visible satellites).
  • Within the tested urban-canyon scenarios, field experiments achieve 100% positioning availability across all evaluated epochs and reduce the 95th-percentile 3D error from 7.25 m to 0.19 m, with ablation analysis attributing 96.1% of the accuracy gain to the asymmetric stochastic model beyond UAV geometric augmentation.
What are the implications of the main findings?
  • Employing a UAV as a high-altitude dynamic spatial anchor reconstructs the 3D observation geometry unattainable by ground-only cooperation, providing a robust georeferencing framework for UAV-UGV mobile mapping in GNSS-degraded urban remote sensing scenarios.
  • Centimeter-level platform georeferencing eliminates positioning as the dominant error source in downstream geospatial products, directly enabling reliable LiDAR point cloud registration, 3D urban reconstruction, digital twin modeling, and infrastructure monitoring in deep urban canyons.

Abstract

Reliable spatial georeferencing of mobile mapping platforms is a fundamental prerequisite for high-fidelity urban remote sensing products such as 3D point clouds and digital twins. However, in deep urban canyons, severe signal occlusion and multipath effects reduce visible GNSS satellites, causing ambiguity resolution (AR) failure and degraded observation geometry for UGV-borne systems. Conventional Vehicle-to-Vehicle (V2V) cooperation offers limited improvement due to symmetric ground-level occlusion. To overcome this, we propose an asymmetric GNSS/UWB fusion method that introduces Unmanned Aerial Vehicles (UAVs) as high-altitude dynamic spatial anchors to reconstruct the 3D observation geometry. Two contributions are presented: (i) an asymmetric heterogeneous stochastic model coupling carrier-to-noise ratio (C/N0) and elevation angle to handle the quality disparity between air and ground sensor links, preventing multipath contamination of high-fidelity UAV observations; and (ii) a dynamic baseline constrained least-squares algorithm integrating Ultra-Wideband (UWB) ranging to stabilize GNSS positioning under high-dynamic relative motion. Validated through high-fidelity simulations and field experiments, the method achieves a 98.2% AR success rate and sub-decimeter 3D accuracy under extreme occlusion (≤3 visible satellites), while urban-canyon tests demonstrate 100% positioning availability across all evaluated epochs and reduce the 95th-percentile 3D error from 7.25 m to 0.19 m under the tested single-UAV/single-UGV configuration. The framework supports smart city modeling, 3D reconstruction, and infrastructure monitoring.

1. Introduction

Urban remote sensing has entered an era of high-resolution, multi-modal, and dynamic data acquisition, driven by the rapid development of smart city modeling, 3D urban reconstruction, and digital twin applications. Mobile mapping systems mounted on Unmanned Ground Vehicles (UGVs) and Unmanned Aerial Vehicles (UAVs) have become essential platforms for acquiring street-level LiDAR point clouds, panoramic imagery, and multispectral observations at unprecedented spatial and temporal resolutions [1]. The geometric quality of these remote sensing products, including point cloud registration accuracy, image mosaicking consistency and multi-temporal change detection reliability, is fundamentally constrained by the absolute spatial georeferencing accuracy of the carrier platform. Even sub-decimeter LiDAR ranging precision becomes meaningless if the platform position carries meter-level uncertainty, as georeferencing errors propagate directly into the final geospatial products. Beyond geometric reconstruction, high-precision platform georeferencing also constitutes a critical prerequisite for a wide range of downstream remote sensing tasks, including multi-scale memory networks with separation training for hyperspectral anomaly detection [2], spectral-spatial graph transformer networks for hyperspectral image classification [3], multi-temporal change detection, and semantic segmentation of urban scenes. In all these tasks, the spatial accuracy of feature alignment, training-sample geo-registration, and cross-modal data fusion is fundamentally bounded by the platform’s georeferencing quality, which establishes the broader applicability of the proposed framework beyond traditional point-cloud-centric mapping scenarios.
While Real-Time Kinematic (RTK) GNSS provides centimeter-level positioning under open-sky conditions, the dense building geometry of modern urban canyons—precisely the environment where high-resolution remote sensing is most needed—poses severe challenges to reliable georeferencing. In such environments, severe occlusion by high-rise buildings causes complex Non-Line-of-Sight (NLOS) propagation and multipath effects [4,5]. Consequently, the number of effective visible satellites routinely drops below four, severely degrading the spatial observation geometry and the Dilution of Precision (DOP) [6,7]. This physical degradation disrupts traditional single-station RTK AR, leading to a critical loss of reliable spatial georeferencing for mobile mapping tasks [8,9,10].
To overcome the spatial limitations of single-node sensing, Cooperative Positioning (CP) based on multi-agent networks has attracted widespread attention [11,12]. Recent representative studies illustrate both the progress and remaining limitations of this paradigm. Yao et al. [12] proposed a UWB-based vehicle cooperative localization framework for GNSS-denied environments, demonstrating decimeter-level relative positioning but assuming the availability of at least one well-positioned anchor vehicle, which is difficult to guarantee in symmetric urban occlusion. Wang et al. [13] developed a message-passing-based cooperative positioning method for VANETs using joint GNSS and UWB measurements, achieving robust performance under partial GNSS denial through belief propagation, yet still operating within a homogeneous ground-vehicle topology. Zhuang et al. [14] introduced a tightly coupled GNSS carrier-phase and UWB ranging fusion for V2X applications, reporting sub-meter horizontal accuracy in mild urban environments but exhibiting significant degradation when satellite visibility drops below four. Existing research predominantly focuses on homogeneous V2V cooperation, aggregating pseudorange and carrier phase data to increase measurement redundancy [13,14] and refining stochastic models to improve AR success rates in constrained environments. However, homogeneous ground cooperation suffers from an inherent topological limitation in deep urban canyons: the symmetry of environmental occlusion. Adjacent ground platforms confined to the canyon bottom share highly similar adverse spatial environments and common-mode signal attenuation. Consequently, the effective spatial information gain within the cooperative network exhibits marginal diminishing returns. Furthermore, existing CP stochastic models predominantly rely on a homogeneous assumption regarding base station and rover noise, lacking a robust mechanism to handle the extreme Signal-to-Noise Ratio (SNR) disparities inherent in cross-domain multi-sensor networks [15].
To fundamentally reconstruct the 3D observation geometry in degraded urban environments, integrating UAVs with ground platforms offers a novel cross-domain collaborative spatial sensing paradigm [16,17]. Akhihiero et al. [17] demonstrated a UAV-UGV cooperative localization scheme for GNSS-denied subterranean navigation, employing the UAV as a mobile beacon to bound ground-platform drift; however, their architecture assumes vision-based relative pose estimation rather than carrier-phase GNSS fusion, and is therefore inapplicable to outdoor centimeter-level georeferencing. Sivaneri and Gross [18] proposed a UGV-to-UAV cooperative ranging method for GNSS-challenged environments, validating the geometric benefit of an aerial anchor but relying on a homogeneous stochastic model that does not differentiate the signal quality between airborne and ground links. Yue et al. [19] more recently introduced an air–ground collaborative navigation framework for GPS-denied environments, integrating visual-inertial odometry with UAV-relayed ranging; while effective for indoor-to-outdoor transitions, this architecture does not directly address the carrier-phase ambiguity resolution problem under deep canyon multipath. Collectively, these studies confirm the geometric value of UAV anchors but reveal a consistent gap: none of them simultaneously addresses (i) the orders-of-magnitude SNR asymmetry between air–ground sensor links and (ii) the dynamic baseline constraint required for reliable carrier-phase AR. Flying above the urban canopy, UAVs enjoy excellent open-sky visibility and serve as high-altitude dynamic spatial anchors, effectively filling the line-of-sight blind spots of UGVs [18]. This geometric complementarity fundamentally differs from homogeneous ground cooperation, as the UAV’s high-elevation observations are geometrically orthogonal to the restricted ground sky view. However, deeply coupling UAVs into a multi-sensor georeferencing framework presents two primary challenges. First, extreme observation asymmetry exists: UAVs enjoy clean LOS signals dominated by thermal noise, while UGV observations are heavily contaminated by multipath and NLOS reception. Traditional homogeneous weighting schemes fail to handle this disparity, causing severe cross-contamination where high-fidelity UAV spatial observations are degraded by erroneous ground measurements during the sensor fusion process [19].
Second, the high dynamics of the air–ground relative topology present a fundamental spatial modeling challenge. Unlike ground vehicles moving in quasi-static formations, the spatial baseline between a UAV and UGV changes drastically due to flight maneuvers. This renders the static baseline constraints used in conventional V2V systems inapplicable, necessitating a rigorous multi-sensor fusion framework capable of integrating real-time dynamic ranging data (such as Ultra-Wideband, UWB) to constrain the spatial geometry [20].
Addressing these challenges, this paper proposes an Asymmetric GNSS/UWB Fusion method for Precise Spatial Positioning of Air–Ground Heterogeneous Systems tailored for deep urban canyons. By bridging the gap between global spatial information (GNSS) and local geometric constraints (UWB), this unified mathematical framework ensures highly reliable spatial georeferencing for ground platforms under extreme satellite scarcity (e.g., n = 3–4 visible satellites). To rigorously validate the proposed asymmetric stochastic model and isolate the algorithmic contributions from UAV flight control errors, a proof-of-concept field experiment was conducted using a quasi-static aerial anchor, demonstrating the fundamental viability of this heterogeneous fusion architecture.
The main contributions are as follows:
(1)
Asymmetric heterogeneous stochastic model for cross-domain spatial sensing. In contrast to traditional double-difference models that adopt a homogeneous noise assumption between base and rover stations, we derive a variance-covariance matrix (VCM) that jointly integrates C / N 0 , elevation angle, and platform type indicator, explicitly resolving the orders-of-magnitude quality disparity between airborne and ground-based observations. Ablation analysis confirms that this stochastic model alone—beyond the geometric augmentation provided by the UAV—accounts for 96.1% of the accuracy gain (RMSE reduced from 3.60 m to 0.14 m), establishing it as the dominant factor enabling centimeter-level fusion under severe multipath conditions.
(2)
Dynamic spatial baseline constrained AR framework. Unlike conventional V2V cooperation relying on quasi-static baseline assumptions, we integrate UWB ranging as a stochastic geometric constraint with a rigorous error propagation model for noisy dynamic baselines within the weighted least-squares domain. This framework maintains an AR success rate of 98.2% in simulation and 94.7% in field experiments even when UGV satellite visibility drops to three—a regime in which traditional single-station RTK and ground V2V cooperation achieve only 15.4% and 42.6%, respectively.
(3)
End-to-end validation of centimeter-level georeferencing in deep urban canyons. Through high-fidelity simulations and real-world urban canyon experiments (H/W > 1.5), we provide the first complete technical chain quantifying the performance envelope of UAV-UGV heterogeneous cooperative positioning, including a dedicated ablation study isolating the stochastic from geometric contributions, a stress test characterizing failure boundary, and a simulation-to-field cross-validation. Across the evaluated urban-canyon scenarios (single-UAV/single-UGV topology, 50 m AGL aerial anchor), the proposed framework achieves 100% positioning availability over all evaluated epochs and reduces the 95th-percentile 3D error from 7.25 m (single RTK) to 0.19 m (a 38.2× improvement under these conditions); a dedicated stress test further delineates the operational envelope within which this performance is sustained, demonstrating practical deployability for urban remote sensing platforms.

2. Methodology of Air–Ground Heterogeneous Cooperative Precise Positioning

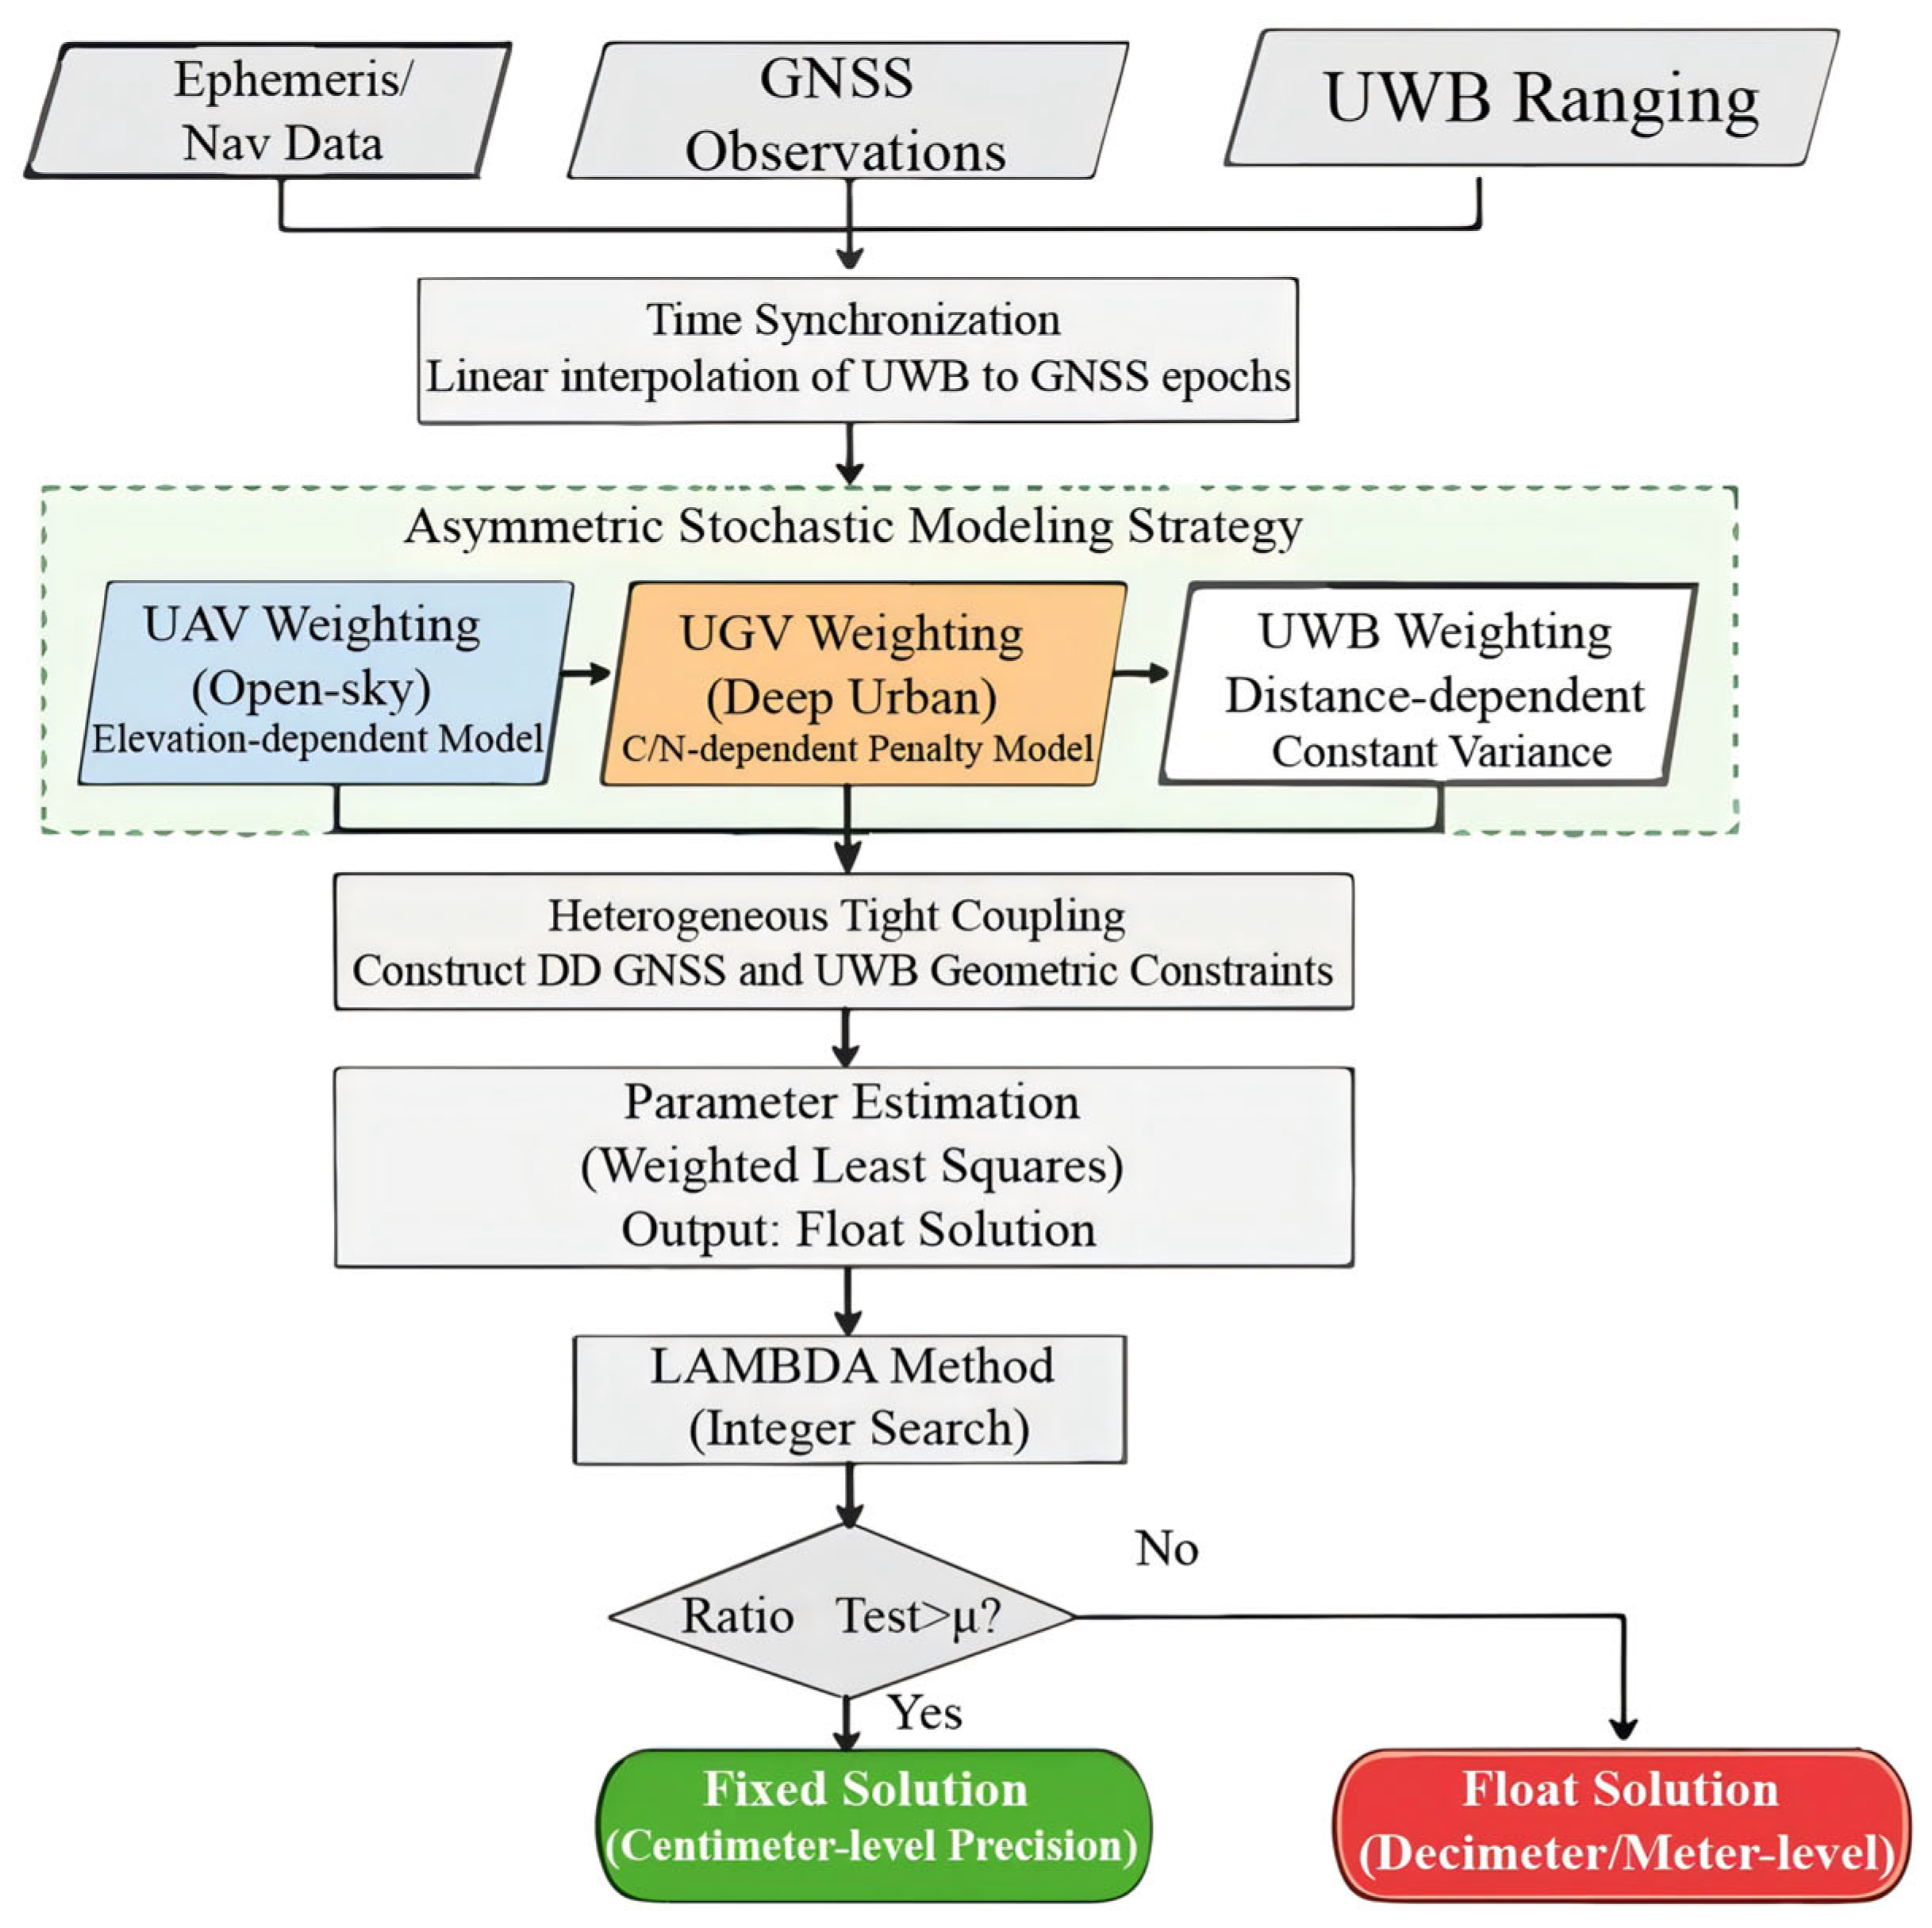
In this section, we detail the mathematical framework of the air–ground heterogeneous cooperative precise positioning system tailored for urban canyon environments. The system consists of a UAV acting as a high-altitude mobile base station and a UGV serving as the ground rover. Addressing the extreme asymmetry in observation quality and the high dynamics of relative motion between the heterogeneous platforms, this section first resolves the time synchronization issue for heterogeneous sensors [21,22]. Subsequently, it constructs an asymmetric stochastic model based on signal characteristics and, finally, derives a Weighted Least Squares (WLS) estimator incorporating UWB dynamic ranging constraints [23,24]. The flowchart of the proposed algorithm is illustrated in Figure 1.

2.1. Time Synchronization of Heterogeneous Data Streams

Since the GNSS receiver (typically operating at 1–5 Hz) and the UWB ranging module (typically at 10–100 Hz) run independently, sampling rate discrepancies and temporal misalignment exist between their data outputs. Given that the relative motion between the UGV and UAV can be approximated as linear within a very short time window (e.g., 100 ms), we employ Linear Interpolation to eliminate systematic time delay errors by synchronizing the high-frequency UWB ranging measurements to the GNSS observation epoch t gnss .
Assuming the UWB module outputs distance observations d u w b , k and d u w b , k + 1 at moments t u w b , k and t u w b , k + 1 respectively, surrounding the epoch t g n s s , the synchronized distance observation d ~ s y n c ( t g n s s ) is calculated as follows:
d ~ sync ( t gnss )   =   t gnss     t uwb , k t uwb , k   +   1     t uwb , k ( d uwb , k   +   1     d uwb , k )   +   d uwb , k
This processing ensures that when constructing the subsequent least-squares equations, all observation vectors are strictly aligned to the same physical epoch t g n s s .

2.2. Construction of Asymmetric Stochastic Model

To accurately describe the significant disparity in signal quality within the UAV-UGV heterogeneous link, we discard traditional homogeneous weighting strategies and propose an Asymmetric Stochastic Model based on the coupling of platform type and signal characteristics [25,26,27].
For any satellite s and receiver r     UAV , UGV , the noise variance σ r , s 2 of the undifferenced carrier phase observation is modeled as a joint function of the satellite elevation angle (E), the carrier-to-noise ratio ( C / N 0 , r , s ), and the platform type indicator κ:
σ r , s 2   =   F ( E r , s , C / N 0 , r , s , κ r )
The UAV is operated in open airspace with negligible multipath effects, and the observation noise is dominated by receiver thermal noise. We model it using a classical elevation-dependent function, reflecting its characteristic as a quasi-perfect observation reference:
σ u a v , s 2 = a u a v 2 + b u a v 2 sin 2 ( E u a v , s )
where a u a v 2 and b u a v 2 are the intrinsic noise parameters of the UAV receiver (typically at the millimeter level).
The UGV is located in urban canyons. The UGV suffers from NLOS reception and multipath interference. In this scenario, the elevation angle is no longer the sole indicator of signal quality. We construct a C / N 0 -based exponential weighting model to heavily penalize contaminated signals:
σ u g v , s 2 = a u g v 2 + b u g v 2 · 1 0 ( C / N 0 , s T t h r e s h ) 10 · 1 sin ( E u g v , s )
where T t h r e s h is an empirical threshold (e.g., 45 dB-Hz). When the C / N 0 is below this value, the variance increases exponentially. The coefficients a u g v 2 and b u g v 2 are set significantly larger than those of the UAV, embodying the asymmetry between the heterogeneous platforms.
In the DD observation model, assuming satellite i is the reference satellite and satellite j is the non-reference satellite, the variance of the heterogeneous DD observation is derived via the law of error propagation as:
σ D D i j = ( σ u a v , i 2 + σ u g v , i 2 ) + ( σ u a v , j 2 + σ u g v , j 2 )
Since σ u a v 2 σ u g v 2 , the DD noise is dominated by the multipath errors of the ground UGV. Through this model, contaminated UGV observations are assigned extremely high variances, thereby being effectively down-weighted in the solution. For GNSS observations of m satellites, the covariance matrix Q g n s s is constructed as:
Q g n s s = D · d i a g σ u a v , 1 2 + σ u g v , 1 2 , , σ u a v , m 2 + σ u g v , m 2 · D T
where D is the single-difference to double-difference transformation matrix.
The empirical parameters involved in the proposed framework are selected from three traceable sources rather than ad hoc tuning. (i) Manufacturer-specified hardware parameters: the UAV carrier-phase noise coefficients a u a v = b u a v = 1.0 mm follow the thermal noise floor of the u-blox F9P receiver under open-sky conditions, and σ u w b = 0.10 m corresponds to the Decawave DWM1000 LOS specification verified by static ranging tests. (ii) Empirically calibrated platform parameters: the C / N 0 threshold 45 dB-Hz is adopted as the multipath-onset threshold for survey-grade GNSS receivers in urban environments [26,27], below which the carrier-phase noise distribution transitions from thermal-dominated to multipath-dominated behavior; the UGV coefficients a u g v = b u g v = 3.0 mm (approximately 3× the UAV values) are calibrated from a 30-min static observation campaign on the actual UGV hardware under partial canyon occlusion, reflecting the platform-induced multipath floor. The exponential form in Equation (4) is preferred over a linear penalty because multipath-induced phase errors scale nonlinearly with C / N 0 degradation—a 5 dB-Hz drop below T t h r e s h typically corresponds to a ~3× variance increase in our calibration. (iii) Statistical-theoretical thresholds used for ambiguity validation: the Ratio-test safety threshold μ R a t i o n = 3.0 corresponds to the classical Verhagen fixed-failure-rate of ~0.1%, and the ambiguity dilution of precision (ADOP) reliability threshold of 0.12 cycles is derived from Teunissen’s integer least-squares theory as the 99.9% AR success probability bound. The time-synchronization window Δ t s y n c = 100 ms (Section 2.1) is selected such that the linear motion approximation residual remains below 1 cm at the maximum operational velocity. This three-tier sourcing ensures that the framework is grounded in physically interpretable and reproducible criteria.
Compared with conventional elevation-only homogeneous weighting—in which the UAV and UGV observations of the same satellite receive nearly identical weights—the proposed asymmetric model assigns substantially different variances based on platform type and C / N 0 . For a typical contaminated UGV observation at C / N 0 = 28 dB-Hz, the variance inflation factor exceeds 50× relative to the corresponding clean UAV observation, effectively isolating high-fidelity airborne measurements from ground multipath contamination during the least-squares fusion. This mechanism directly underlies the 96.1% RMSE reduction attributed to the stochastic model in the ablation study.

2.3. Constraint Function Model Based on Dynamic Baselines

Based on the synchronized data and the constructed stochastic model, we establish tightly coupled observation equations containing UWB dynamic constraints. The state vector to be estimated includes the baseline vector b u v of the UGV relative to the UAV and the double-difference integer ambiguities N .
The linearized GNSS DD carrier phase observation equation is expressed as:
L g n s s = H g n s s b u v + λ B N + ε g n s s , ε g n s s N ( 0 , Q g n s s )
where H g n s s is the design matrix containing the LOS direction cosines, and λ is the carrier wavelength.
We treat the relative distance d ~ s y n c provided by UWB as a stochastic geometric constraint [28,29,30]. By performing a Taylor series expansion of the nonlinear distance equation at the baseline a priori value b 0 , we obtain:
l u w b = u l o s T · δ b u v + ε u w b
where l uwb   =   d ~ sync     | | b 0 | | is the distance residual; u los = b 0 | | b 0 | | is the unit LOS vector pointing from the UAV to the UGV; and ε uwb N ( 0 , σ uwb 2 ) is the UWB ranging noise, typically σ uwb 0.05 ~ 0.10 m.
Combining the GNSS and UWB equations, the augmented observation system is constructed as:
L g n s s l u w b = H g n s s λ I u l o s T 0 δ b u v N + ε g n s s ε u w b
Let L aug   =   L gnss l uwb and A   = H gnss λ I u los T 0 . The corresponding augmented weight matrix P is constructed as a block diagonal matrix:
P = Q g n s s 1 0 0 σ u w b 2
The float solution and its covariance matrix are given by the Weighted Least Squares principle:
X ^ = ( A T P A ) 1 A T P L a u g Q X ^ = H g n s s T Q g n s s 1 H g n s s + 1 σ u w b 2 u l o s u l o s T 1
Equation (11) indicates that the UWB constraint term 1 σ u w b 2 u l o s u l o s T directly adds information to the normal equation matrix in the direction of u l o s . Since σ u w b is extremely small, this term significantly reduces the uncertainty of the baseline vector in the radial direction, thereby compressing the search space for ambiguity parameters through the correlations between parameters.
Finally, the float ambiguity N ^ and its covariance Q N ^ are input into the LAMBDA algorithm to perform integer least-squares search, obtaining the fixed solution N ˇ , which is then substituted back to solve for the final fixed baseline vector b ˇ u v [31,32,33,34].

3. Simulation Experiments

3.1. Experimental Setup

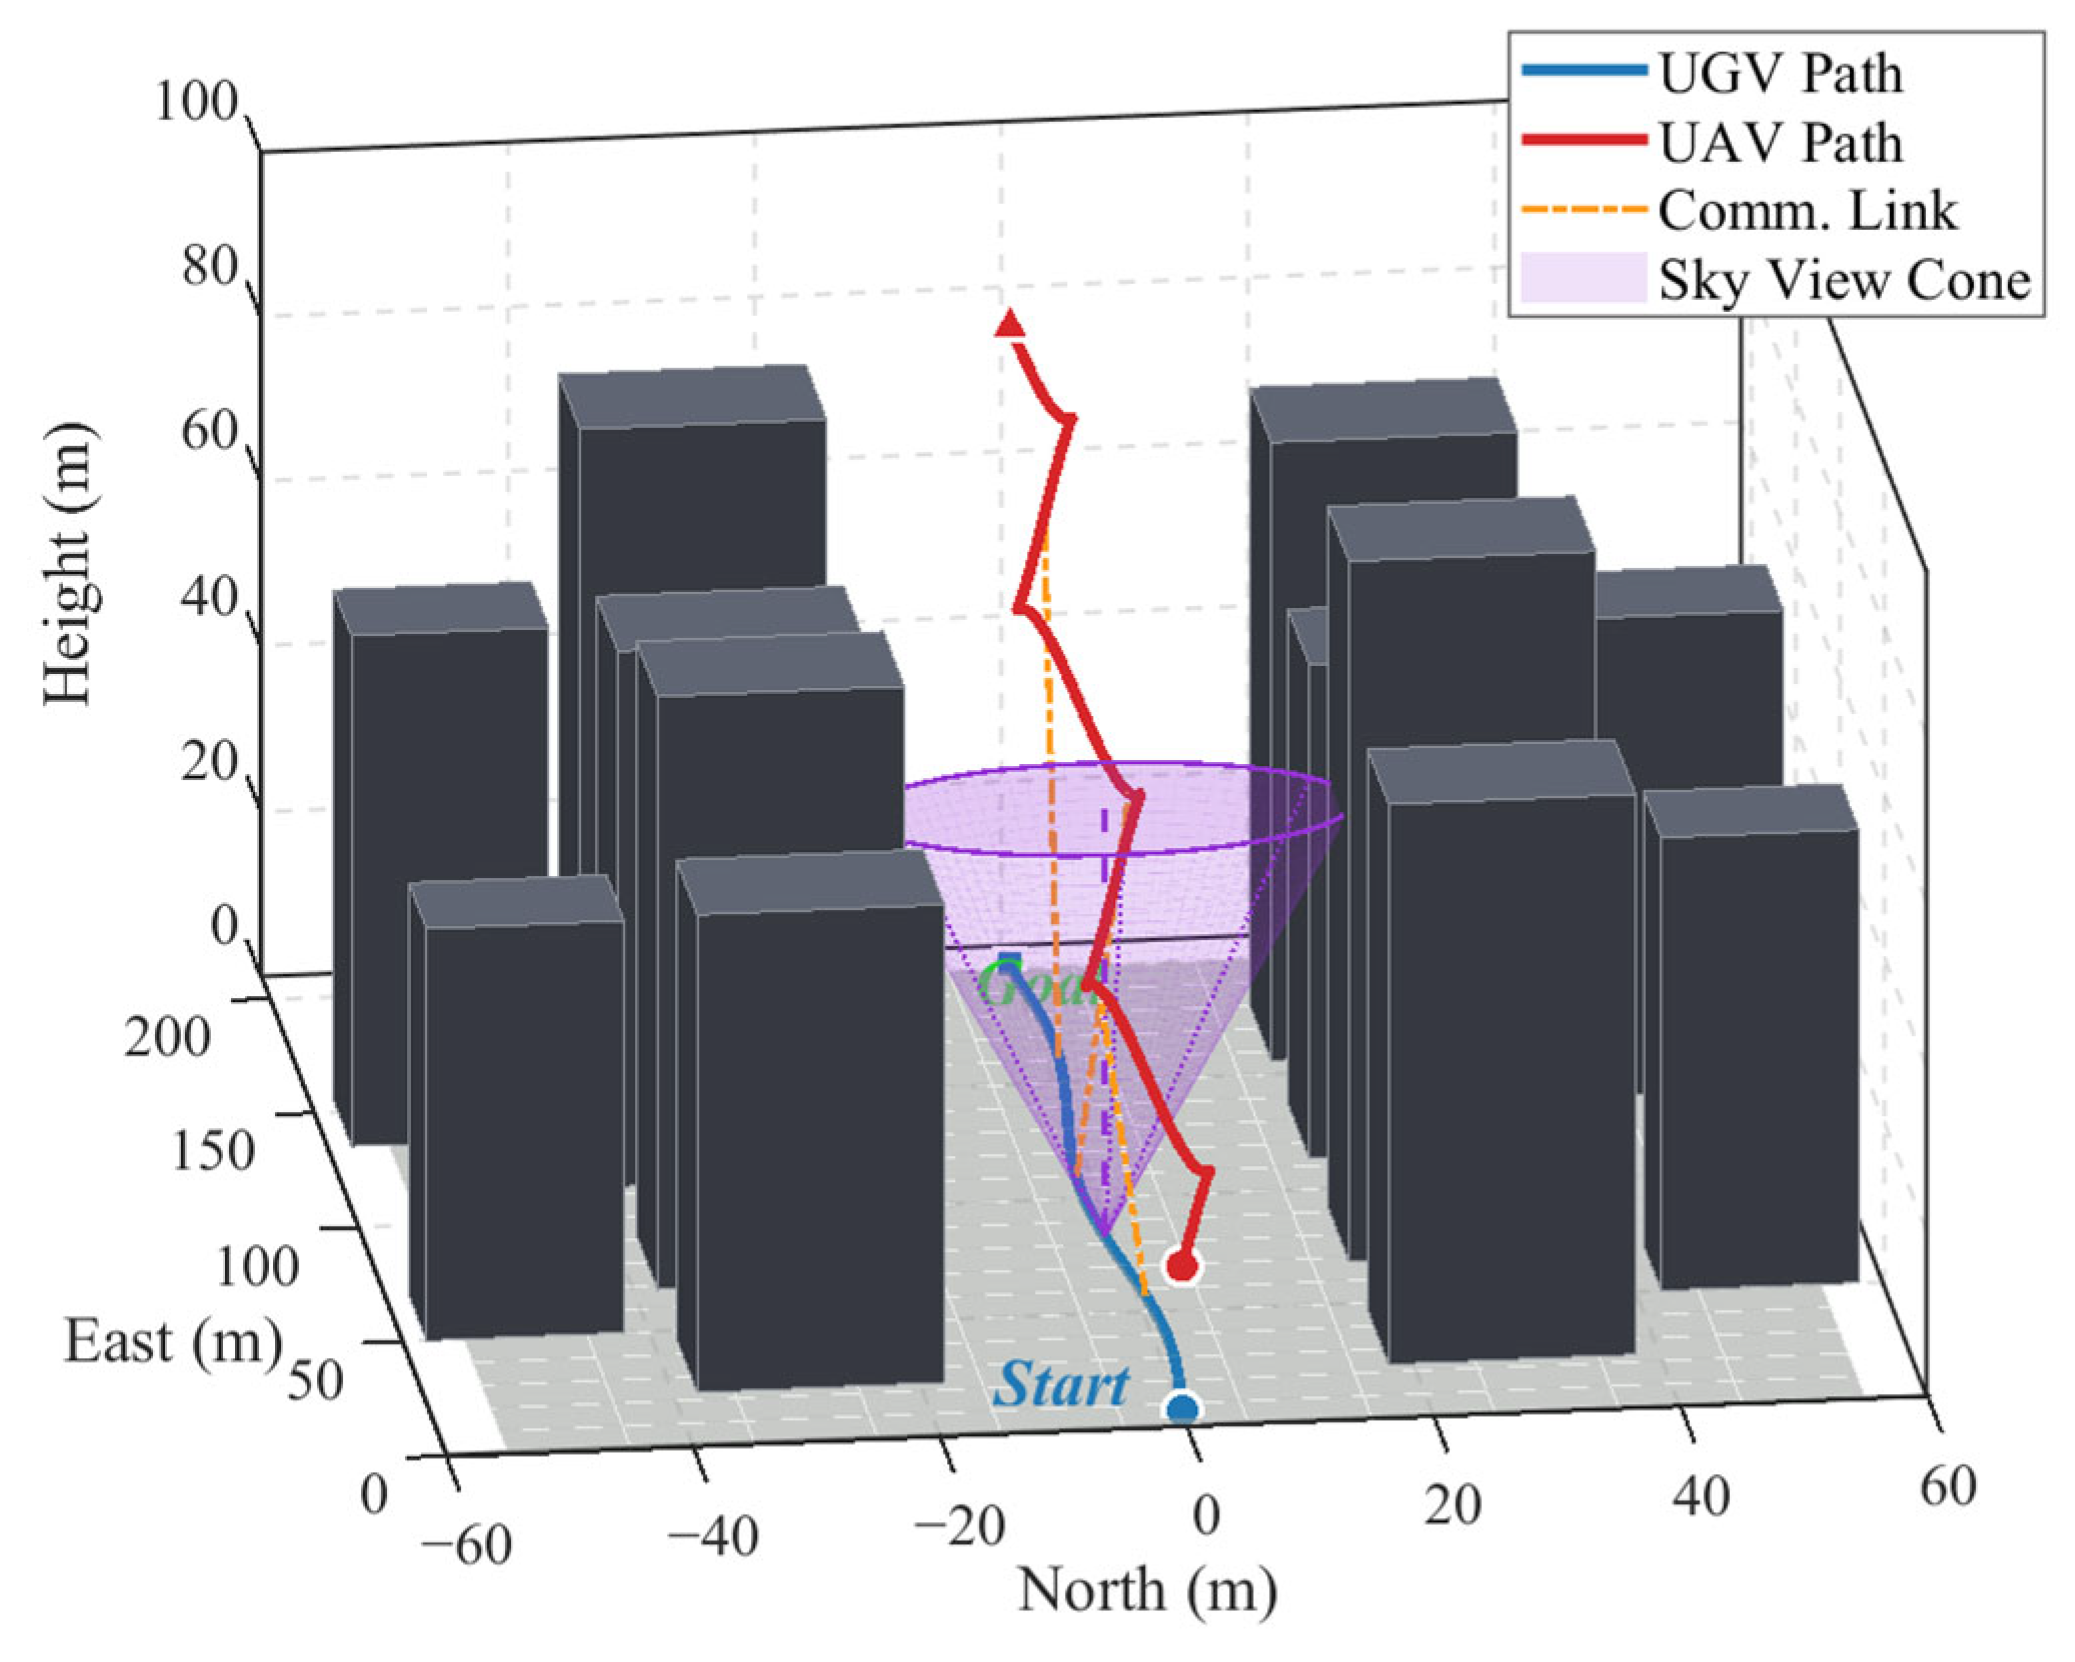
The simulation is generated based on real ephemeris data from GPS (L1 C/A) and BDS-3 (B1I). The 3D schematic of the experimental scenario is shown in Figure 2. The experiment simulates a typical deep urban canyon environment.
The UGV is simulated traveling eastward at a speed of 10 m/s along the center of a 15-m-wide urban road. Dense buildings with heights exceeding 40 m are distributed on both sides of the road. Consequently, the satellite elevation mask for the UGV is restricted to over 60° in the lateral direction, retaining visibility only for satellites with lower elevation angles along the street direction (East–West).
The UAV is set to follow mode, maintaining a flight height of 50 m above the ground (higher than the average building height) in a completely open-sky environment. It maintains a relatively stable horizontal following distance from the UGV, while allowing for random relative motion jitter to simulate real-world flight control errors.
To reproduce the realistic asymmetric observation quality, we injected different levels of noise into the raw observations.
The UAV scenario is simulated as a low-noise environment. The carrier phase noise is set to σ ϕ , uav   =   0.003 m, and the pseudorange noise is σ ρ , u a v = 0.3 m. For the ground UGV, in addition to basic thermal noise, we applied time-varying multipath biases to signals occluded by buildings based on the satellite’s elevation and azimuth. The amplitude is set to 0.05~0.15 m (carrier phase) and 2~5 m (pseudorange). Furthermore, the simulated C / N 0 values were significantly reduced to verify the robustness of the asymmetric stochastic model.
The UWB relative ranging error between the UAV and UGV is simulated as zero-mean Gaussian white noise with a standard deviation of σ u w b = 0.10 m, assuming time synchronization is already completed.
To rigorously assess the robustness of the proposed framework under aggressive synchronous motion between the heterogeneous platforms, an extended scenario was additionally simulated. In this configuration, the UGV travels at 15 m/s along the canyon center (50% higher than the baseline), while the UAV synchronously follows in coordinated forward motion at the same nominal velocity, maintaining a 50 m vertical separation and a horizontal lead/lag of 0 ±   3   m . Realistic UAV flight-control errors are superimposed as zero-mean Gaussian perturbations: σ x y = 0.3 m (horizontal position hold), σ z   = 0.2 m (altitude hold), and σ v = 0.15 m/s (velocity tracking), consistent with typical Pixhawk-class GNSS-aided position-hold performance. The resulting peak relative acceleration reaches 1.0   m / s 2 (twice the baseline scenario). This setting represents a realistic upper bound of operational dynamics for cooperative UAV-UGV mobile mapping in urban environments and directly mirrors the synchronous following mode envisioned for downstream applications. All other parameters (multipath injection, C / N 0 degradation, UWB noise) are kept identical to the baseline scenario to isolate the impact of platform dynamics.

3.2. Comparison Schemes

To quantify the performance gains of the proposed method, we designed three processing schemes for comparison:
Scheme 1 (Standard Single-UGV RTK): Traditional single-vehicle RTK positioning. It utilizes only the UGV’s own observation data and employs a fixed elevation dependent weighting model. This represents the baseline performance without cooperation.
Scheme 2 (Traditional Ground V2V Cooperation): Traditional ground V2V cooperative positioning. Another accompanying vehicle (V2) is simulated traveling 3 m laterally offset from the UGV. Both vehicles share identical multipath noise realizations, representing the worst-case scenario where two closely spaced ground nodes experience fully correlated multipath contamination. A conventional double-difference stochastic model (equal weighting) is adopted. This configuration provides an upper bound on common-mode V2V performance, as fully correlated multipath errors cancel maximally in the between-vehicle differencing.
Scheme 2b (Ground V2V Cooperation, Decorrelated Multipath): To explicitly evaluate the spatial decorrelation advantage characteristic of real V2V deployments, an additional V2V configuration is included. Vehicle V2 is positioned 3 m laterally offset from the UGV but receives an independent realization of the multipath noise process drawn from the same statistical distribution (same elevation/azimuth-dependent amplitude model, but uncorrelated random phase). This configuration faithfully represents the spatial decorrelation of multipath errors between adjacent but distinct ground vehicles in real urban canyons.
Scheme 3 (Proposed UAV-UGV Heterogeneous Method): The proposed air–ground heterogeneous cooperative method. It introduces UAV observation data, applies the Asymmetric Stochastic Model proposed in Section 2.2, and enforces the UWB Dynamic Baseline Constraint derived in Section 2.3.

3.3. Results and Discussion

3.3.1. Visible Satellite Quantity and PDOP Analysis

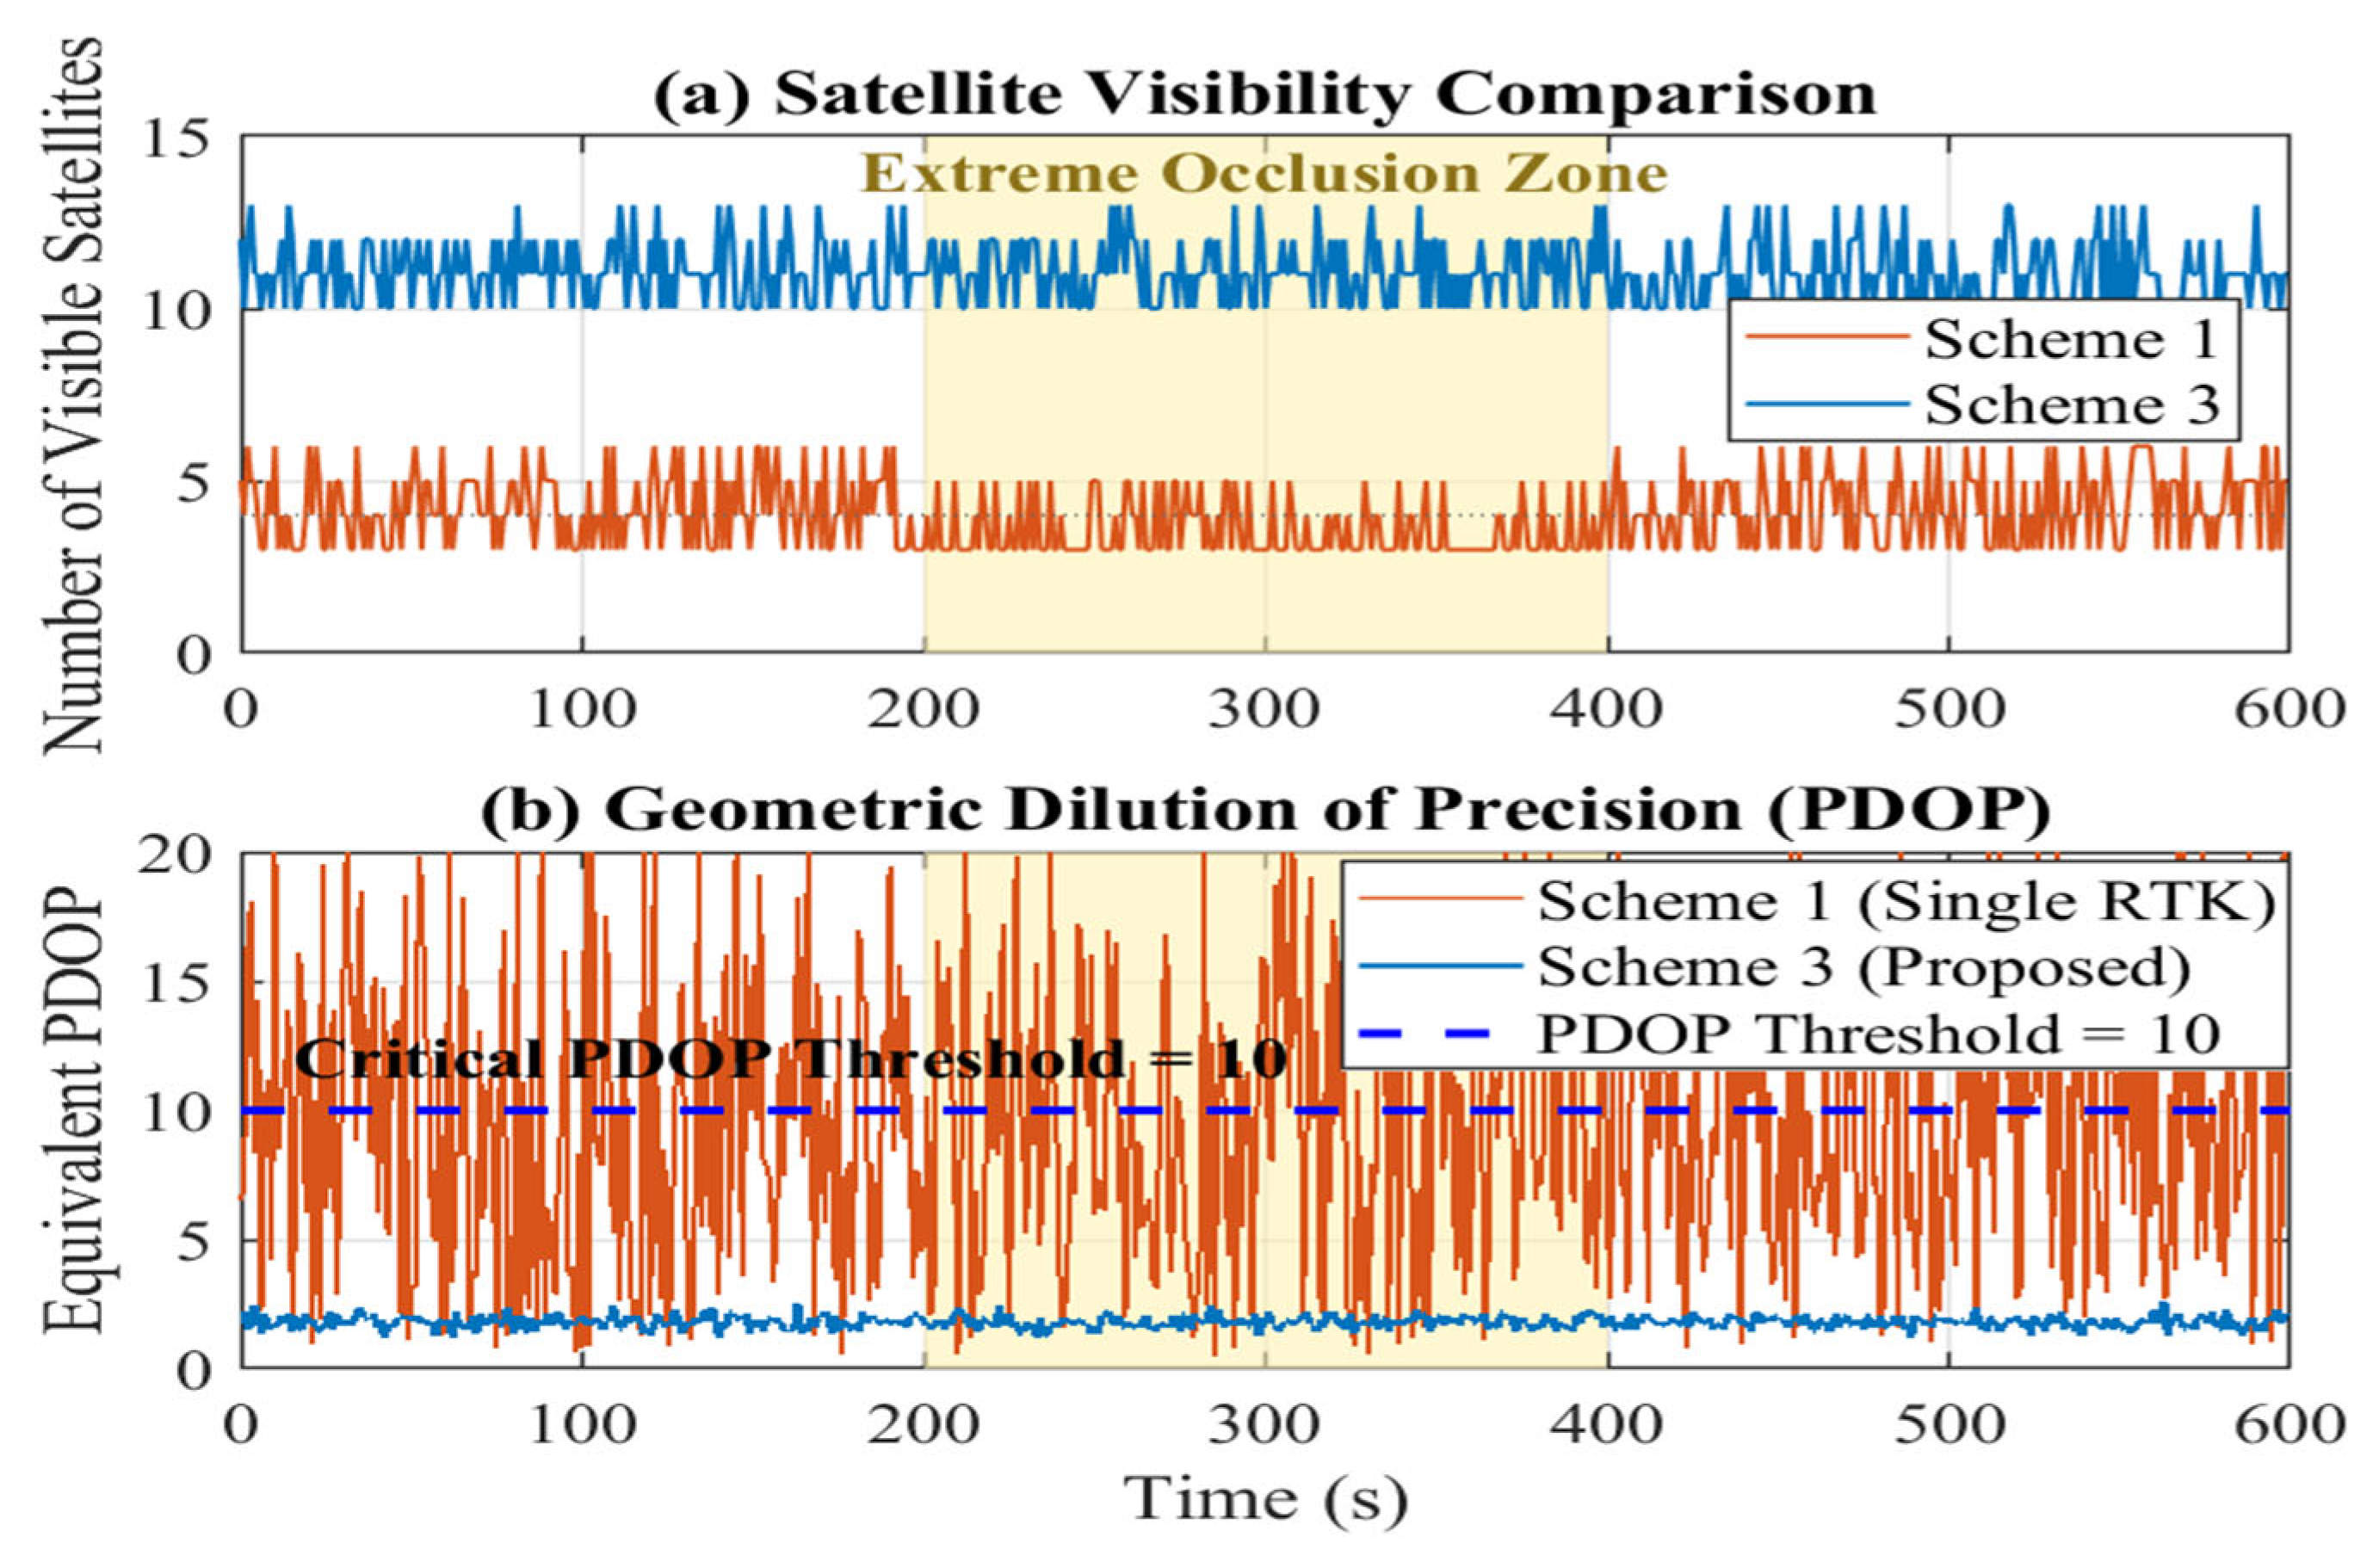
For Scheme 1 (Standard RTK), during periods where the number of visible satellites is fewer than four ( N s a t < 4 ), the design matrix becomes rank-deficient, making the positioning solution mathematically infeasible, as shown in Figure 3. Therefore, the error statistics (RMSE) for Scheme 1 mentioned below are calculated only based on epochs where a valid solution exists.
In contrast, within this simulated scenario Scheme 3 achieves full-time positioning availability across all evaluated epochs by leveraging the UAV as a pseudolite and applying UWB geometric constraints to resolve the rank deficiency.
Simulation results show that in the simulated urban canyon, the number of visible satellites for the UGV fluctuates frequently between 3 and 6. In Scheme 1, due to insufficient satellites ( N s a t < 4 ), the PDOP (Position Dilution of Precision) value often diverges to over 10 or becomes incalculable as shown in Figure 3. However, in Scheme 3, thanks to the introduction of the UAV as a high-elevation supplementary satellite and the strong geometric constraint provided by UWB, the equivalent PDOP is consistently maintained at around 2 [31]. This demonstrates a fundamental improvement in physical geometry brought by heterogeneous cooperation.

3.3.2. Positioning Error Analysis

Figure 4a illustrates the error dispersion of the three schemes in the horizontal plane, while Figure 4b shows the spatial distribution in 3D space. Orange crosses represent Single UGV RTK (Scheme 1), green circles represent V2V Cooperation (Scheme 2), and blue dots represent the proposed Air-Ground Heterogeneous Scheme (Scheme 3).
As shown, Scheme 1 exhibits the most discrete error dispersion (Orange crosses) with sparse data points. In the horizontal direction (Figure 4a), the error range expands to ±5 m or beyond; in the vertical direction (Figure 4b), errors reach as high as ±10 m. The sparsity of the points confirms that in deep urban canyons, the visible satellite count frequently drops below 4 due to building occlusion, leading to RTK solution failures (inability to fix or even obtain a float solution); these invalid epochs are not plotted. Even in epochs with solutions, the limitation of visibility to only the street direction results in extremely high Horizontal Dilution of Precision (HDOP) and Vertical Dilution of Precision (VDOP). Residual multipath errors cause significant non-zero mean drifts in the positioning results.
Scheme 2 (Green circles) shows some convergence compared to Scheme 1, with horizontal errors mainly concentrated within ±2.5 m. Although the UWB ranging constraint from the adjacent vehicle increases the redundancy of observation equations, the absolute positioning accuracy improvement is limited by the canyon homogeneous environment. Since both vehicles are at the canyon bottom, they face severe and similar sky view occlusion. The satellite sets observed by both vehicles highly overlap and are subject to similar NLOS signal interference.
Scheme 3 (Blue dots) forms an extremely dense cluster center in the figure, almost coinciding with the coordinate origin, constraining errors to the centimeter level. This is particularly evident in Figure 4b: compared to the massive height errors in Scheme 1, the vertical error in Scheme 3 is relatively small. The UAV, acting as an aerial pseudolite in an Open-sky environment, possesses perfect satellite observation quality. Through UWB ranging, the UAV transfers high-precision absolute position information to the UGV. Traditional ground positioning is geometrically weakest in the vertical direction (as satellites are all overhead). The UAV, located above the UGV (with a very high elevation angle), significantly improves the Vertical Constraint, thereby eliminating the height divergence phenomenon common in Figure 4b. The highest density of blue points indicates that this scheme maintains valid fixed solutions throughout the entire simulation period, thoroughly solving the positioning blind spot problem in urban canyons [35].
These results intuitively validate the effectiveness of the proposed air–ground heterogeneous cooperative method. By introducing a UAV node with Line-of-Sight (LOS) conditions, the system not only fills the satellite signal blind spots in urban canyons but also converges positioning errors from the meter level (or no solution) to the decimeter/centimeter level by improving the observation geometry (especially vertically). This proves that cross-domain cooperation possesses an inherent performance advantage over traditional In-domain cooperation in extreme occlusion environments.

3.3.3. Ambiguity Success Rate Comparison

Table 1 summarizes the statistical performance. The comparison reveals a strong correlation between satellite visibility, service availability, and positioning accuracy.
The fundamental bottleneck of the Single UGV (Scheme 1) is that its average number of visible satellites is only 3.98, falling below the minimum requirement (4 satellites) for rigorous GNSS calculation. Consequently, the availability rate of Scheme 1 is only 41.6%, presenting a frequently interrupted fragmented service state. Although Scheme 2 increases availability to 72.1% through V2V information sharing, it still cannot guarantee service continuity. In contrast, Scheme 3 introduces a critical aerial node. The high-quality LOS observations from the aerial node effectively fill the calculation gaps, achieving a 100% continuous availability rate across all evaluated epochs of this scenario. This result confirms that, under the tested conditions, the UAV is not only an accuracy enhancer but also a necessary prerequisite for achieving continuous solutions in signal-deprived environments.
It is worth clarifying that the 100% availability does not imply a perfectly idealized scenario. The simulation deliberately injects severe multipath biases (up to 5 cm in carrier phase and 50 cm in pseudorange), reduces C / N 0 to below 35 dB-Hz on multiple satellites, and forces the UGV’s visible satellite count to drop to 3 throughout the 200–400 s extreme occlusion zone. The 100% availability rate therefore reflects the algorithm’s ability to resolve the rank deficiency of the GNSS-only design matrix through the UAV’s auxiliary observations and the UWB geometric constraint—not the benign nature of the test environment. It should be emphasized, however, that this rate is established over all evaluated epochs of the present scenario and does not constitute a universal guarantee, as availability and AR success are expected to degrade under more aggressive conditions, such as near-complete GNSS denial combined with heavy UWB NLOS contamination.
A direct comparison between Scheme 2 and Scheme 2b reveals that incorporating spatially decorrelated multipath errors yields a modest performance improvement: the horizontal RMSE decreases from 1.85 m to 1.62 m (12.4% reduction) and the AR success rate increases from 42.6% to 47.8%. This improvement is attributable to the partial averaging of independent multipath errors across the two ground nodes during the cooperative least-squares estimation. However, this gain remains marginal when compared to Scheme 3 (RMSE-H: 0.08 m), confirming that the fundamental bottleneck of homogeneous ground V2V cooperation is the geometric correlation imposed by the shared canyon-bottom sky view, rather than the statistical correlation of multipath noise. Even with fully independent multipath realizations, the two ground nodes observe nearly identical satellite subsets through nearly identical occlusion patterns, providing no new directional information to break the rank deficiency of the design matrix. This result reinforces the central thesis of this work: only cross-domain (air–ground) heterogeneous cooperation can fundamentally reconstruct the 3D observation geometry in deep urban canyons.
The RMSE of Scheme 1 (horizontal: 3.42 m/vertical: 6.89 m) is calculated based on valid epochs only. Even excluding moments with insufficient satellites, its positioning accuracy remains poor due to severe multipath effects and poor geometry. Scheme 3 achieves a significant improvement in accuracy under all epochs evaluation. The horizontal RMSE is reduced to 0.08 m, and the vertical RMSE is suppressed to 0.12 m. Compared to Scheme 1, this represents horizontal and vertical accuracy improvements of 97.6% and 98.2%, respectively. The significant suppression of vertical error specifically validates the strong vertical constraint provided by the UAV.
The AR success rate is a key indicator of system reliability. The success rates for Scheme 1 and Scheme 2 are 15.4% and 42.6%, respectively, indicating that their solutions are dominated by float solutions prone to drift. Conversely, Scheme 3 maintains an AR success rate of 98.2%, demonstrating that the heterogeneous UAV-UGV coupling can consistently lock integer ambiguities even in deep canyons, ensuring precise and robust positioning.
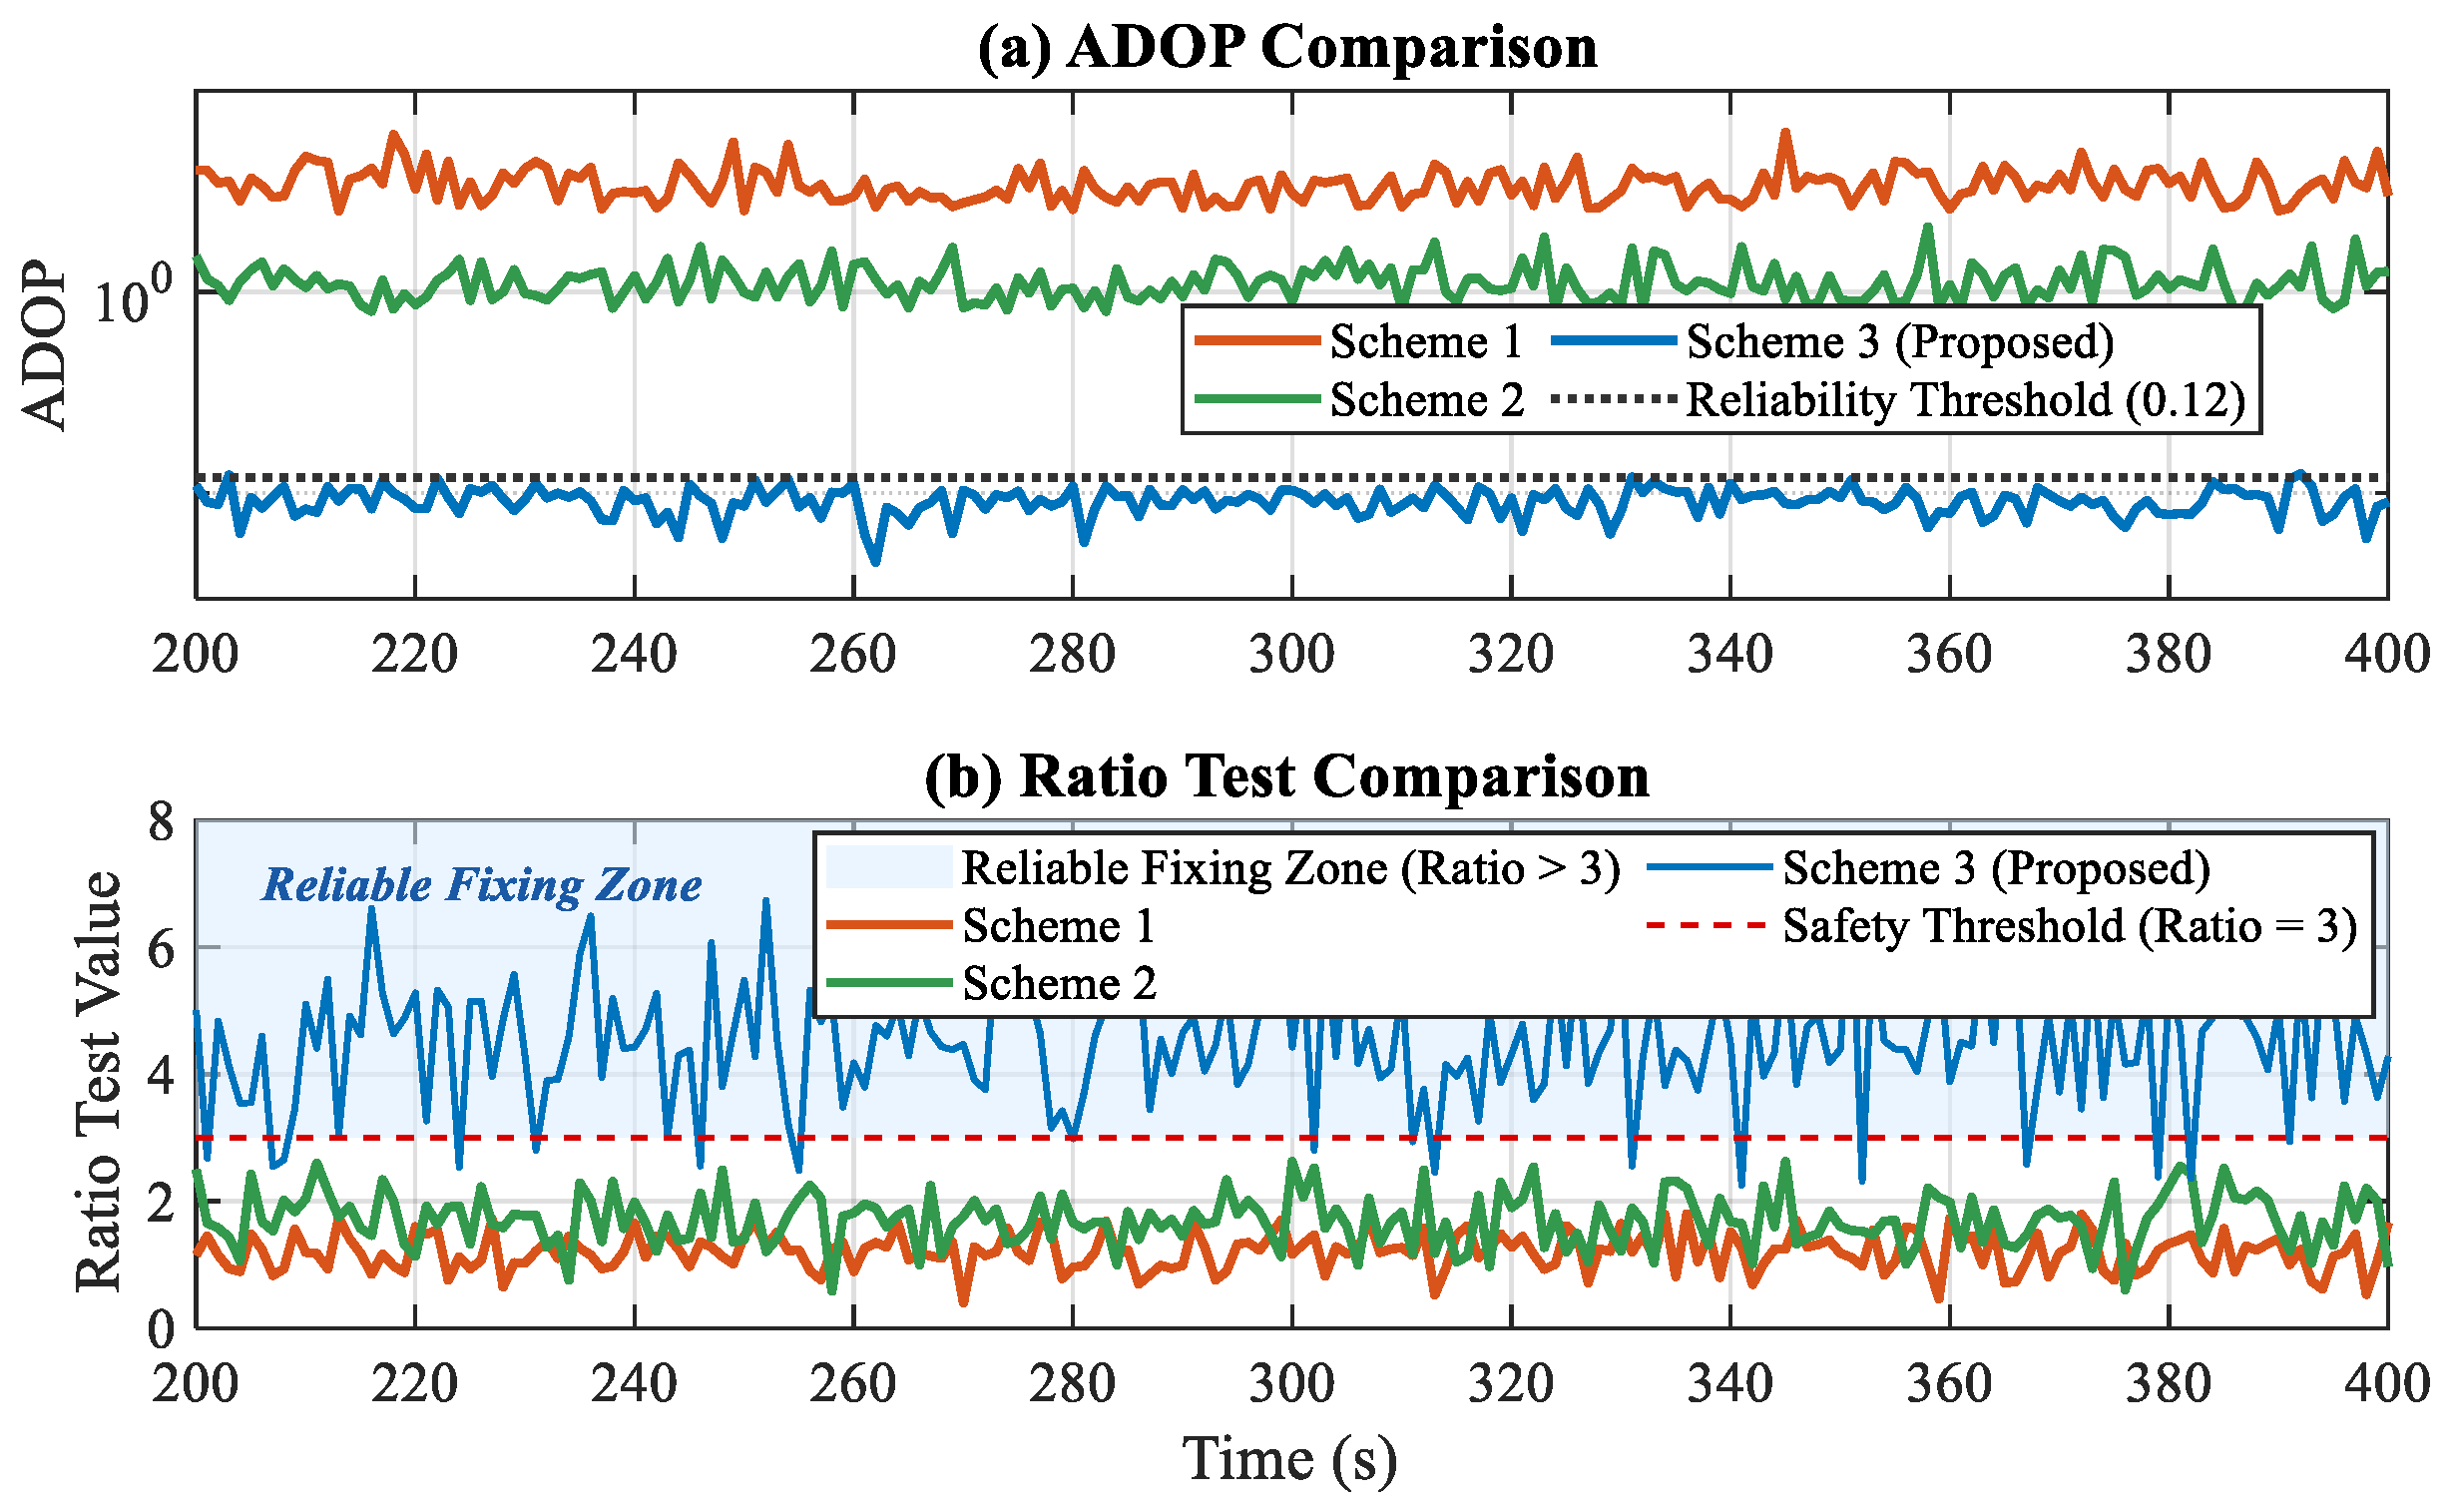
To further reveal the advantages of the heterogeneous cooperation mechanism, we selected the interval with the most severe occlusion (200–400 s) for microscopic analysis. In this interval, the UGV’s visible satellite count frequently drops below 4, retaining only high-elevation satellites, resulting in extremely poor geometry.
The y-axis of ADOP uses a logarithmic scale to accommodate the huge dynamic range caused by severe signal attenuation in urban canyons. As shown in Figure 5a, the ADOP value of Scheme 1 (Single RTK) oscillates violently in this interval, with peaks frequently exceeding 1.0 or even 5.0 (theoretically, ADOP < 0.12 is required for reliable fixing). This indicates a high linear correlation among ambiguity parameters and a huge search space volume.
In contrast, Scheme 3 consistently suppresses ADOP to an extremely low level of around 0.1. This is mainly attributed to the additional observation equations provided by the UAV, which break the linear correlation of ground observations, and the strong compression of the float solution covariance matrix Q N ^ by the UWB distance constraint.
Correspondingly, in Figure 5b, the Ratio value of Scheme 3 remains stable above 3.0 (the safety threshold), while the Ratio values of Scheme 1 and Scheme 2 hover around 1.0, failing the validation test. This implies that the proposed method not only calculates accurately but also yields solutions with high confidence.

3.3.4. Quantitative Analysis and Estimation Performance

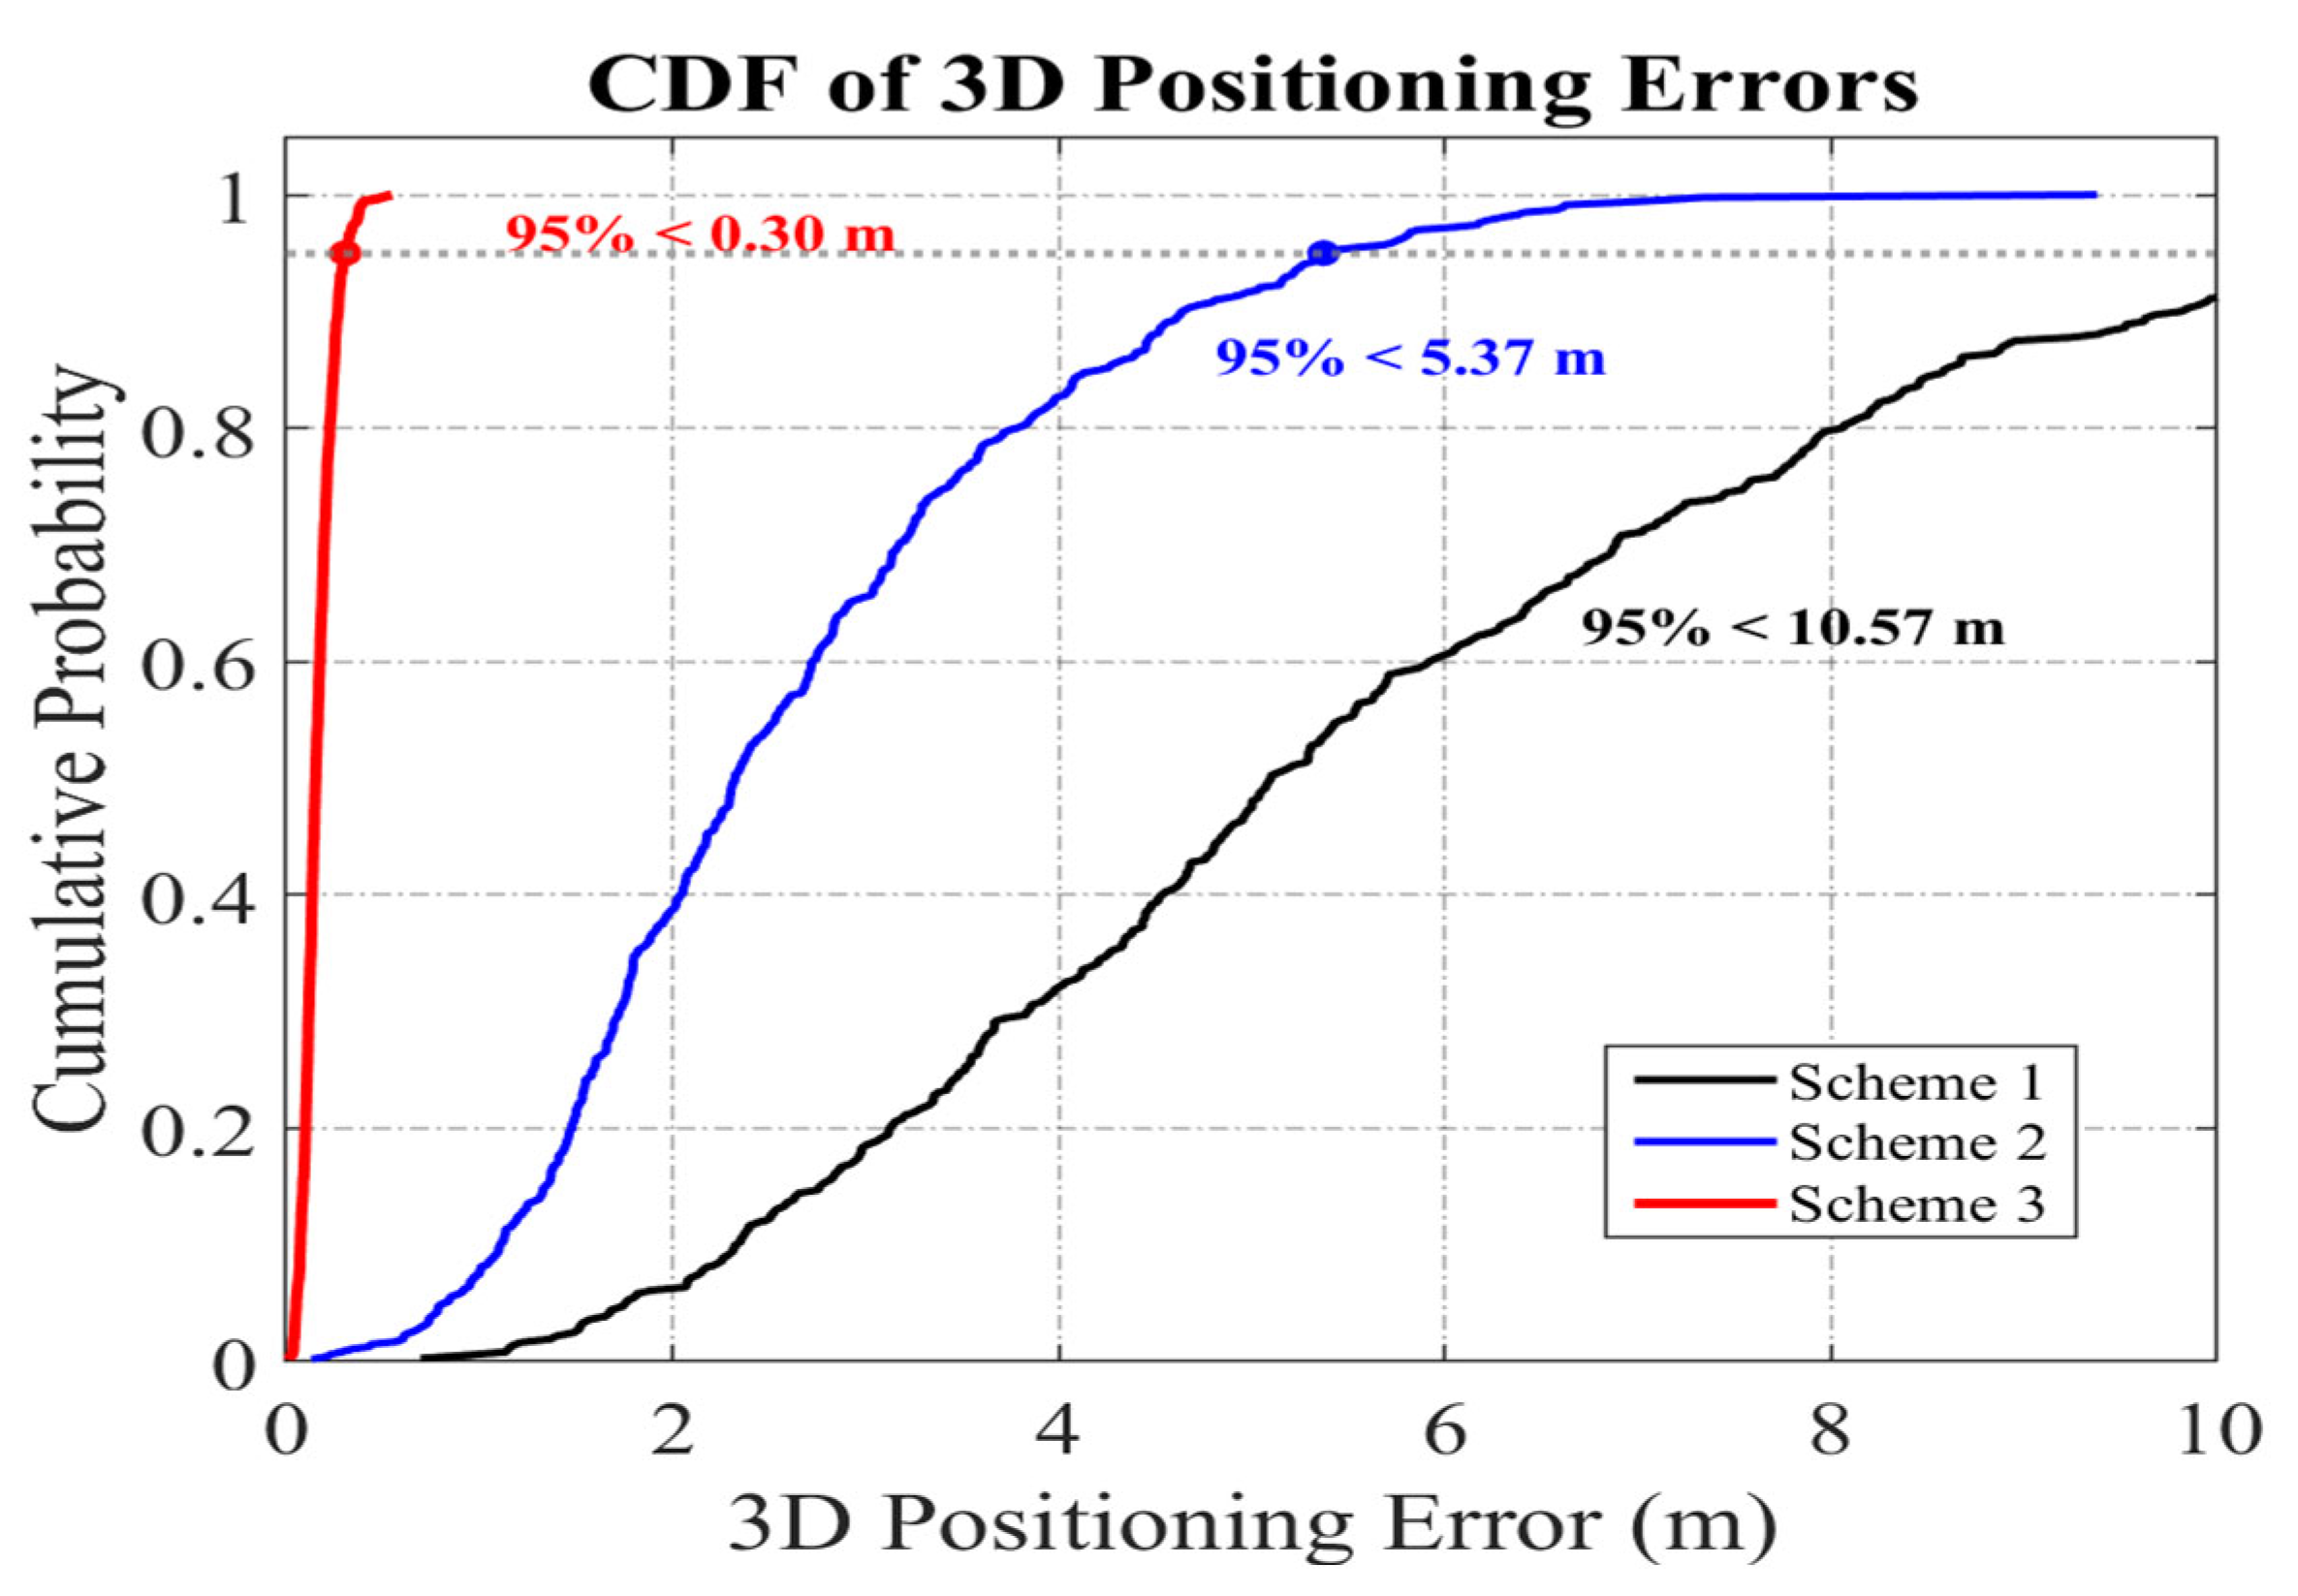
Figure 6 quantitatively compares the Cumulative Distribution Function (CDF) of 3D positioning errors for the three schemes. For the Single UGV (Scheme 1), positioning performance is severely degraded by the urban canyon environment. As shown by the black line, the error grows slowly and unstably, reaching up to 10.57 m at the 95% confidence level. This huge deviation is mainly attributed to multipath contamination and frequent loss of satellite signals, leading to the inability to fix ambiguities.
With the aid of V2V cooperation (Scheme 2), the blue curve shifts noticeably to the left, reducing the 95% error bound to 5.37 m. Although relative ranging constraints between vehicles alleviate error drift to some extent, the improvement is limited because both ground nodes suffer from similar sky view occlusion.
In contrast, the proposed Air-Ground Heterogeneous Cooperation (Scheme 3) demonstrates superior robustness. The red curve rises steeply and converges rapidly, keeping the 3D positioning error within 0.30 m at the 95% confidence level. Compared with Scheme 1, the proposed method achieves an accuracy improvement of approximately 97%. This significant leap confirms that the introduction of an aerial LOS node effectively compensates for the lack of satellite geometry, thereby achieving reliable centimeter-to-decimeter level positioning in deep urban canyons.
Since the UAV and UGV are non-rigidly connected, the system’s real-time capability to resolve highly dynamic baselines is another major consideration [36,37].
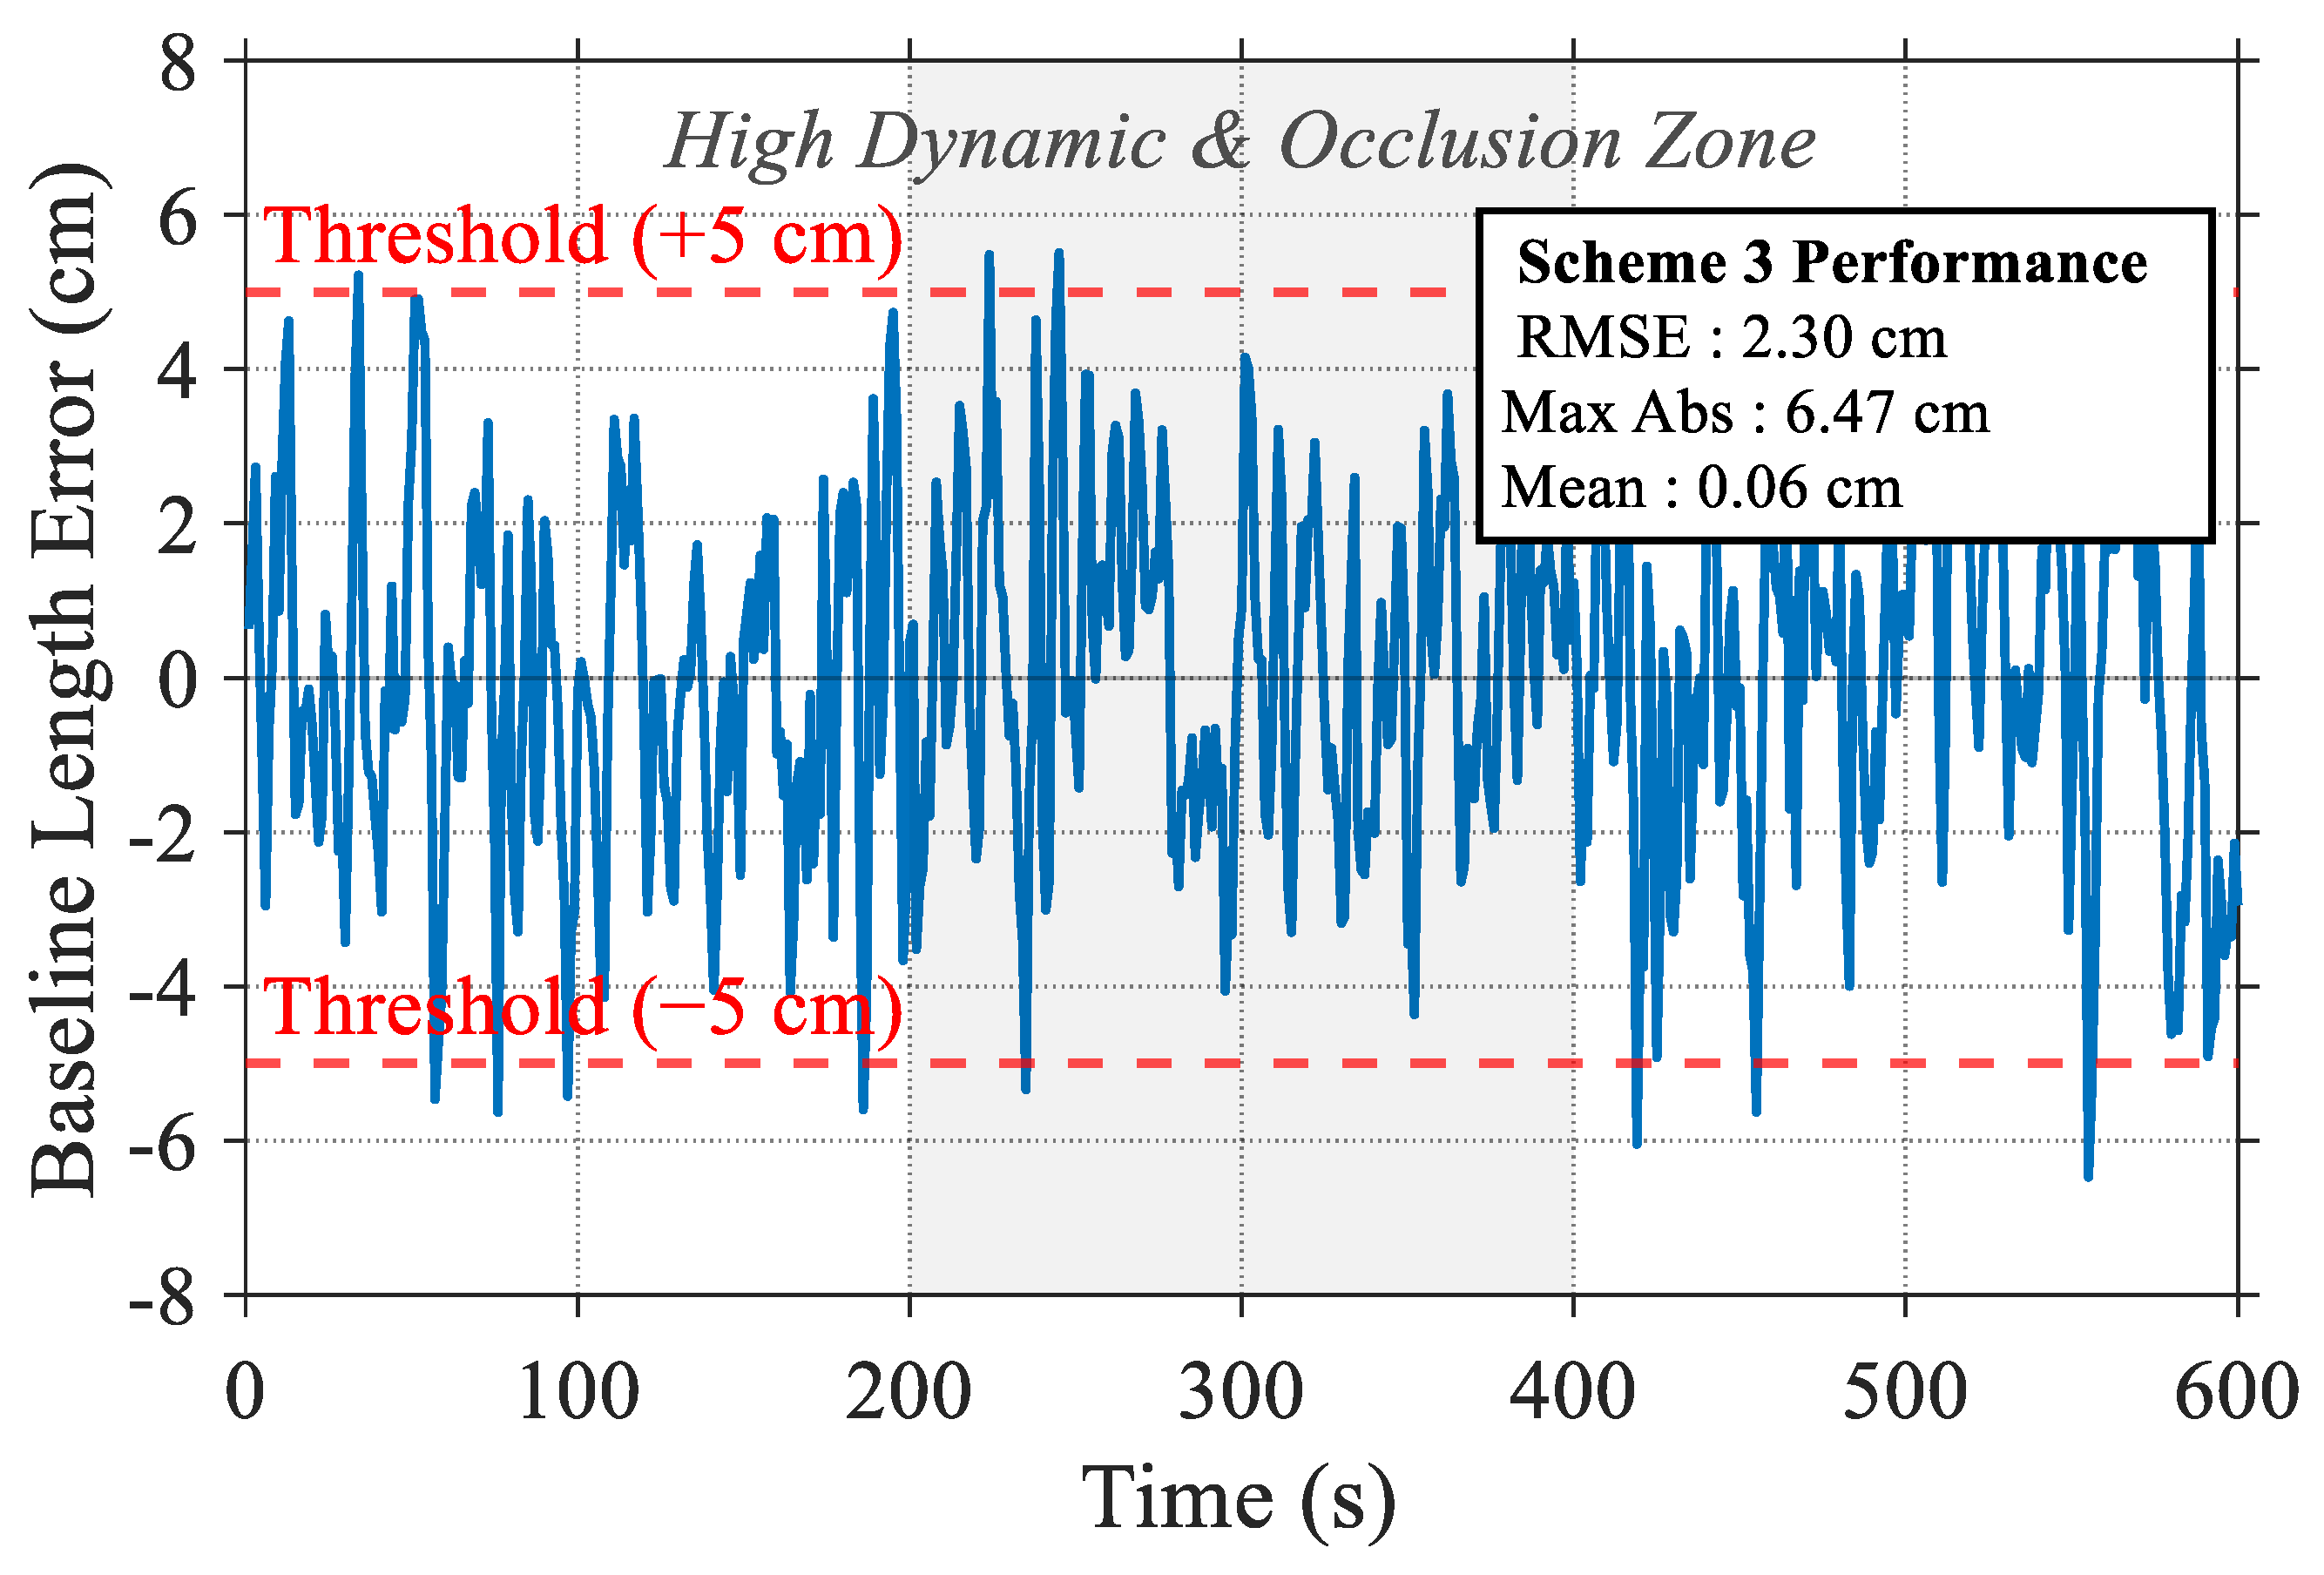
Figure 7 displays the deviation of the baseline length buv calculated by Scheme 3 from the ground truth. Although the relative distance between the UAV and UGV varies randomly with an acceleration of 0.5 m/s2, the residual of the baseline length resolved by Scheme 3 remains consistently within ±5 cm (RMSE = 2.3 cm).
This accuracy highly matches the UWB ranging noise level set in Section 2.3. This, in turn, validates that our weighted least squares strategy successfully projects the high-precision ranging information of UWB into the 3D coordinate domain, proving the robustness of the algorithm in heterogeneous platform scenarios with high dynamics.

3.3.5. Ablation Analysis: Decoupling Geometric and Stochastic Contributions

To rigorously evaluate the individual contributions of the UAV’s geometric augmentation and the proposed asymmetric stochastic model, an ablation study was conducted. While the introduction of a UAV naturally improves the Geometric Dilution of Precision (GDOP) by providing a LOS signal from a high elevation, it is crucial to verify whether the positioning accuracy gains are solely due to this hardware addition or if the proposed mathematical model plays a critical role.
We designed three comparative schemes to process the same dataset under a simulated urban canyon environment.
Scheme 1 (UGV Only): A standard single-point positioning solution using only ground-based GNSS satellites with an elevation-dependent weighting model.
Scheme 2 (UAV-Assisted + Standard Model): The UGV utilizes both satellite signals and the UAV ranging measurement. However, it employs a traditional elevation-dependent stochastic model (weighting based solely on satellite elevation angle), ignoring the specific signal quality variations caused by multipath in urban canyons.
Scheme 3 (Proposed Method): The UGV utilizes the UAV measurement and applies the proposed Asymmetric Stochastic Model. This model dynamically inflates the error variance for multipath-contaminated signals (detected via low C / N 0 and elevation thresholds) while maintaining high weights for the clean UAV and high-elevation satellite signals.
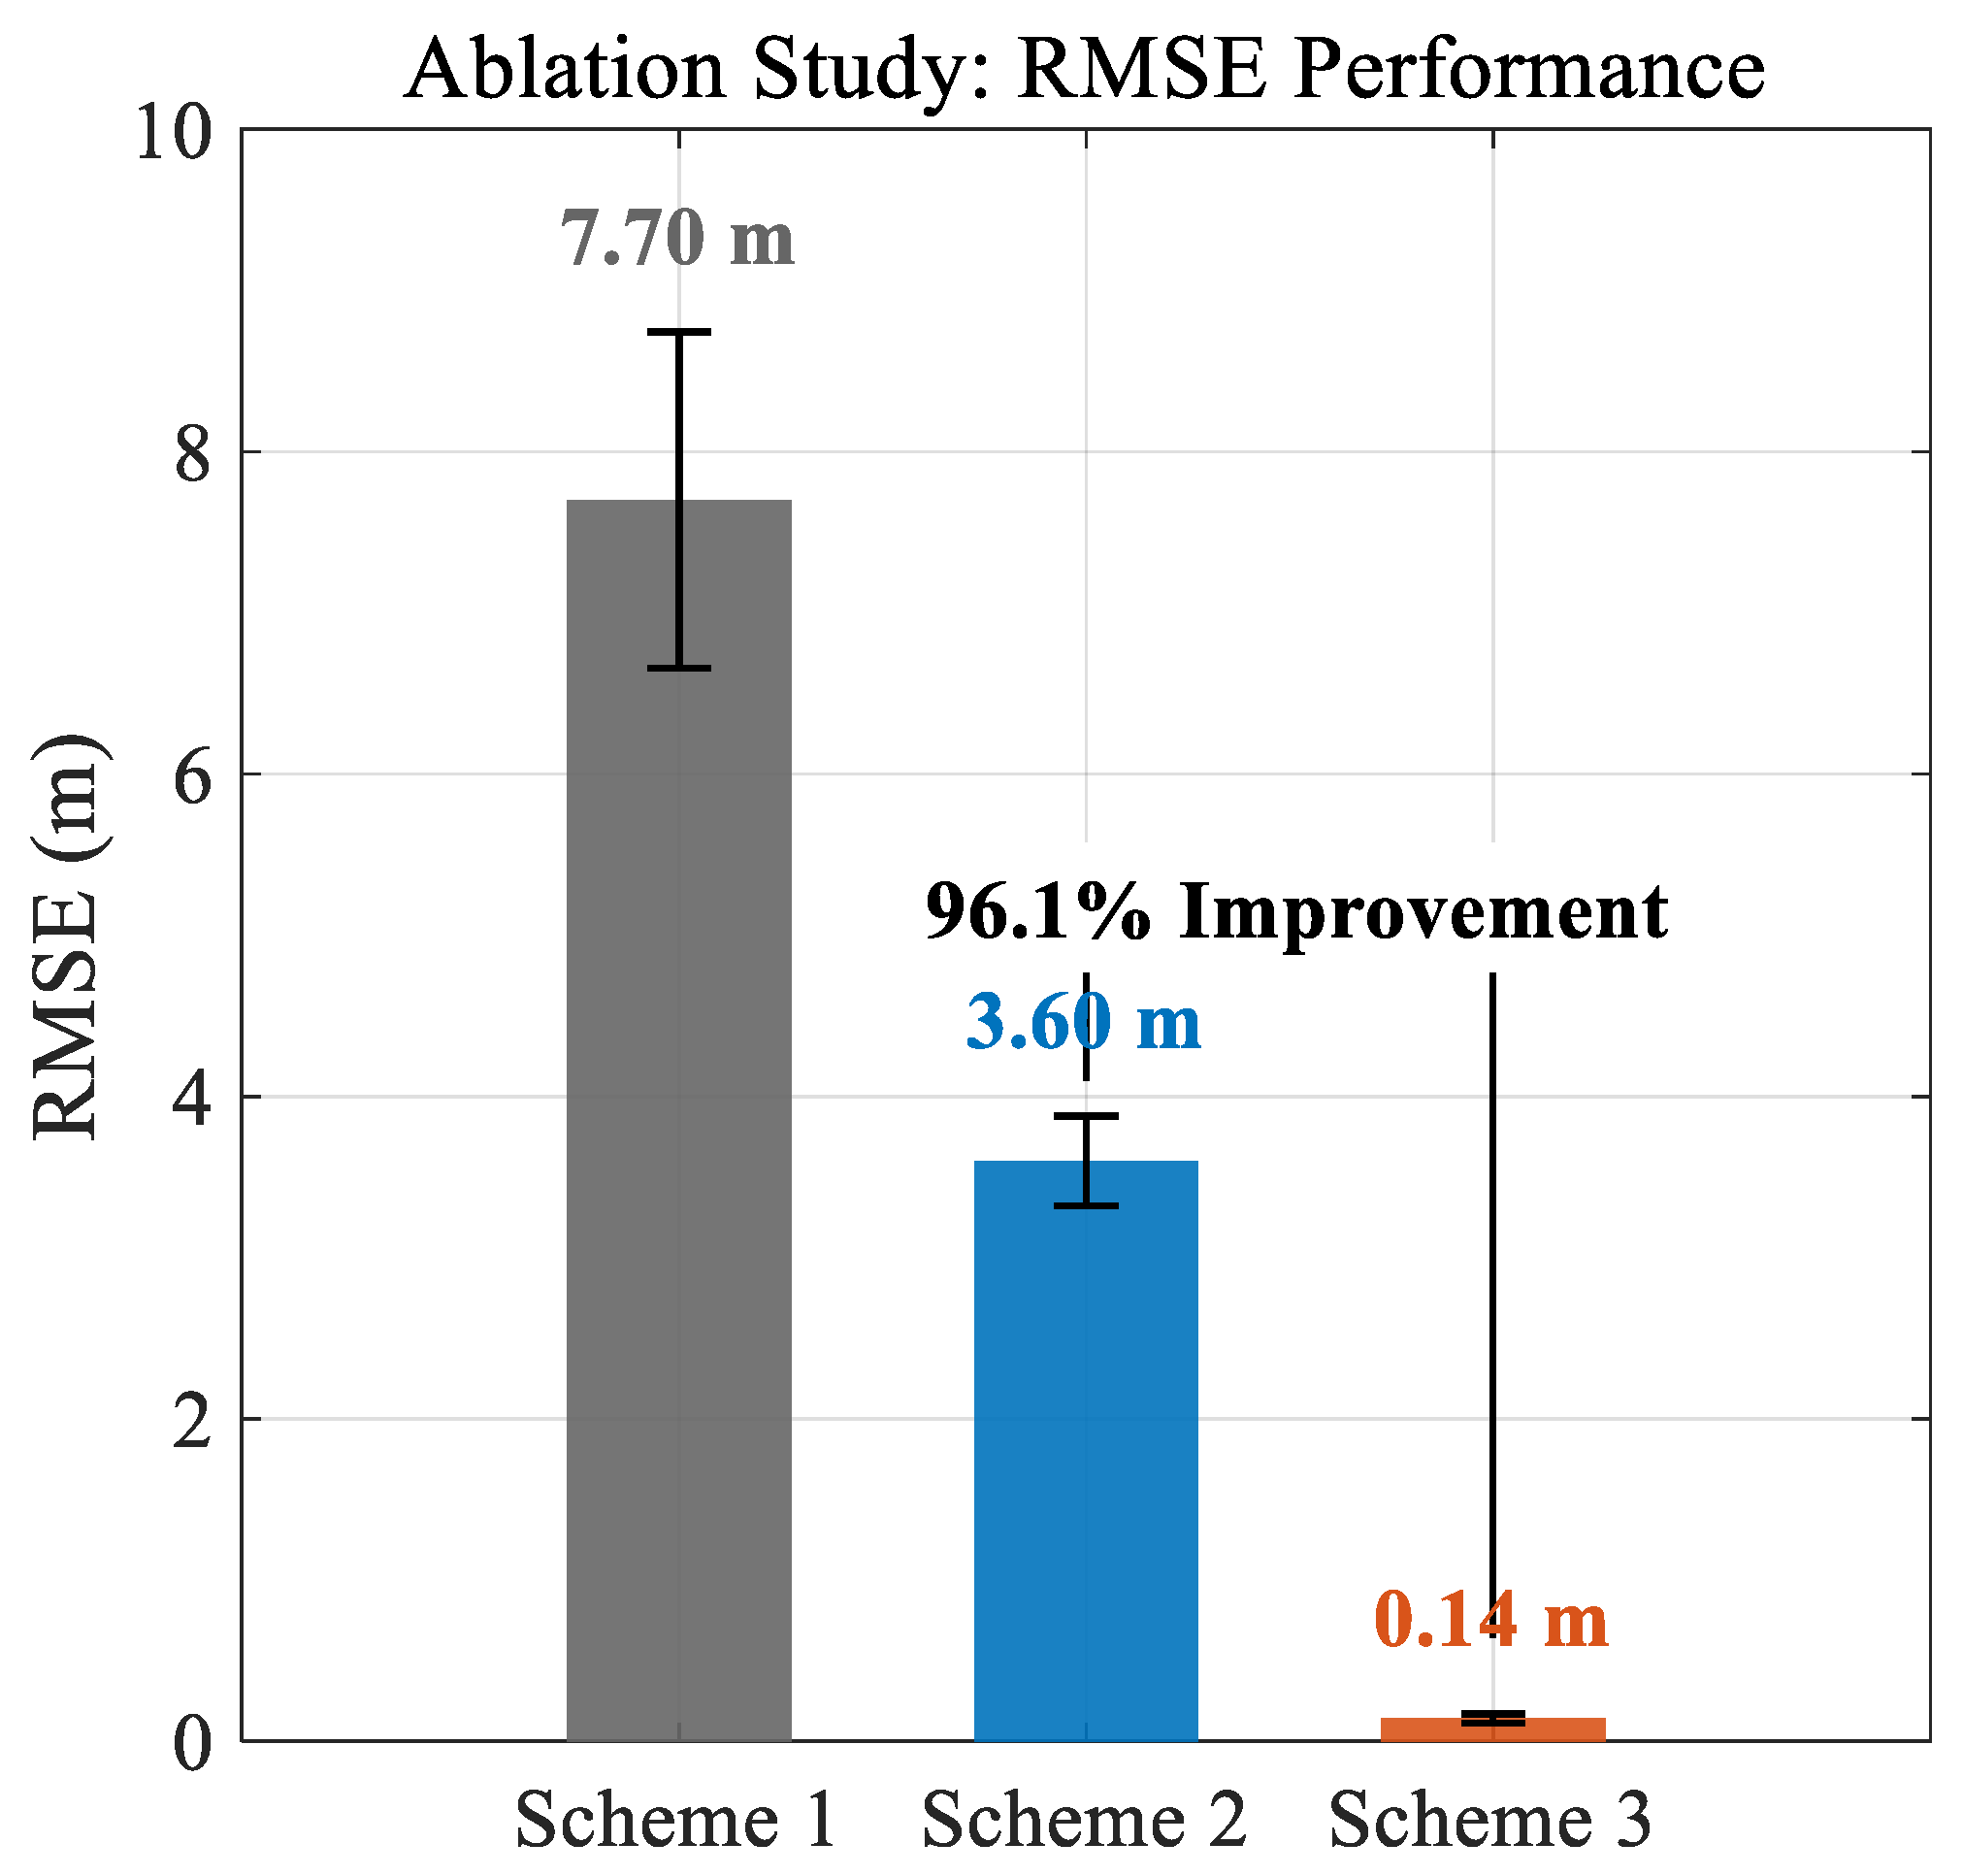
The positioning performance of the three schemes is illustrated in Figure 8 (Time series error) and Figure 9 (RMSE Comparison).
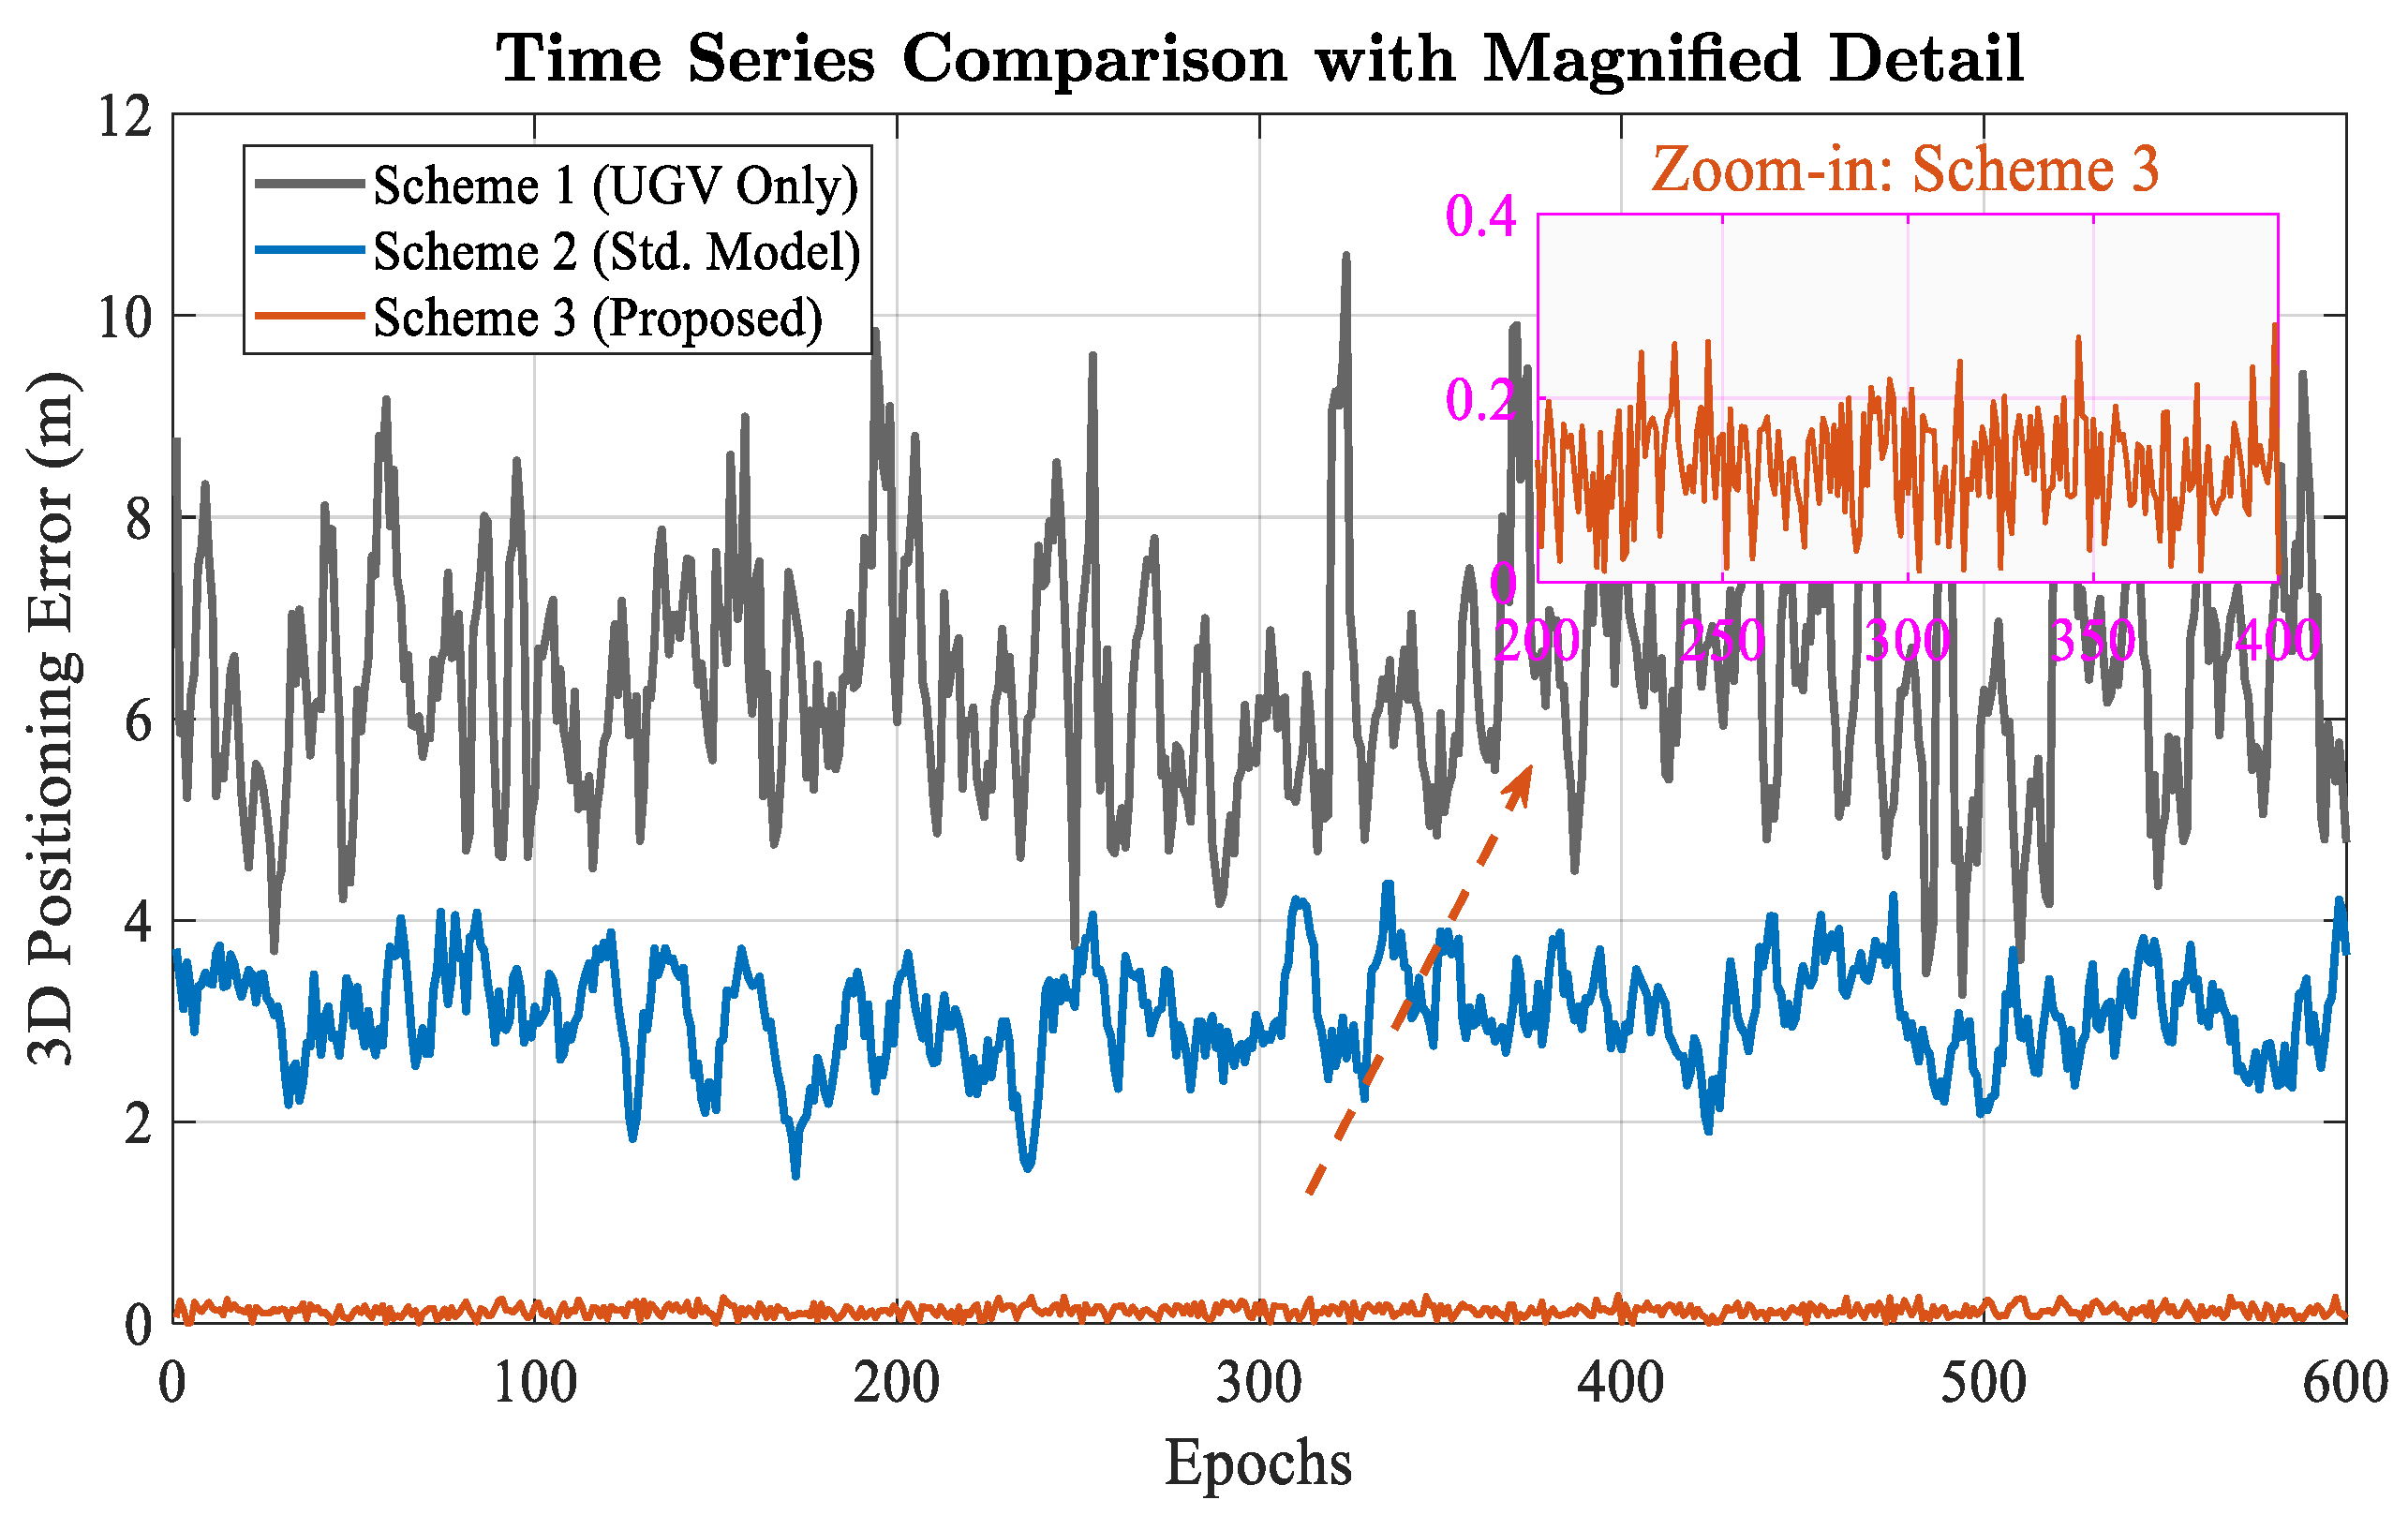
Figure 8 illustrates the time series of positioning errors for the three schemes. The baseline Scheme 1 (UGV Only), depicted in gray, suffers from severe signal blockage and multipath, resulting in an RMSE of 7.70 m. With the introduction of the UAV in Scheme 2 (UAV + Standard Model), the error curve (blue) shows reduced volatility, and the RMSE decreases to 3.60 m. This improvement confirms that the UAV’s high-elevation Line-of-Sight (LOS) signal effectively improves the vertical dilution of precision (VDOP).
However, as shown in the magnified inset of Figure 8, Scheme 2 still exhibits meter-level biases due to the inability of the standard model to filter out ground-based multipath. In contrast, Scheme 3 (Proposed) achieves a stable decimeter-level accuracy. The quantitative comparison in Figure 9 further highlights this distinction. While the geometric improvement from Scheme 1 to Scheme 2 is notable, the proposed asymmetric stochastic model in Scheme 3 reduces the RMSE from 3.60 m to 0.14 m. As annotated in Figure 9, this represents a substantial 96.1% improvement over Scheme 2. This result provides compelling evidence that in deep urban canyons, geometric augmentation alone is insufficient; the proposed robust stochastic model is the dominant factor in achieving high-precision positioning.
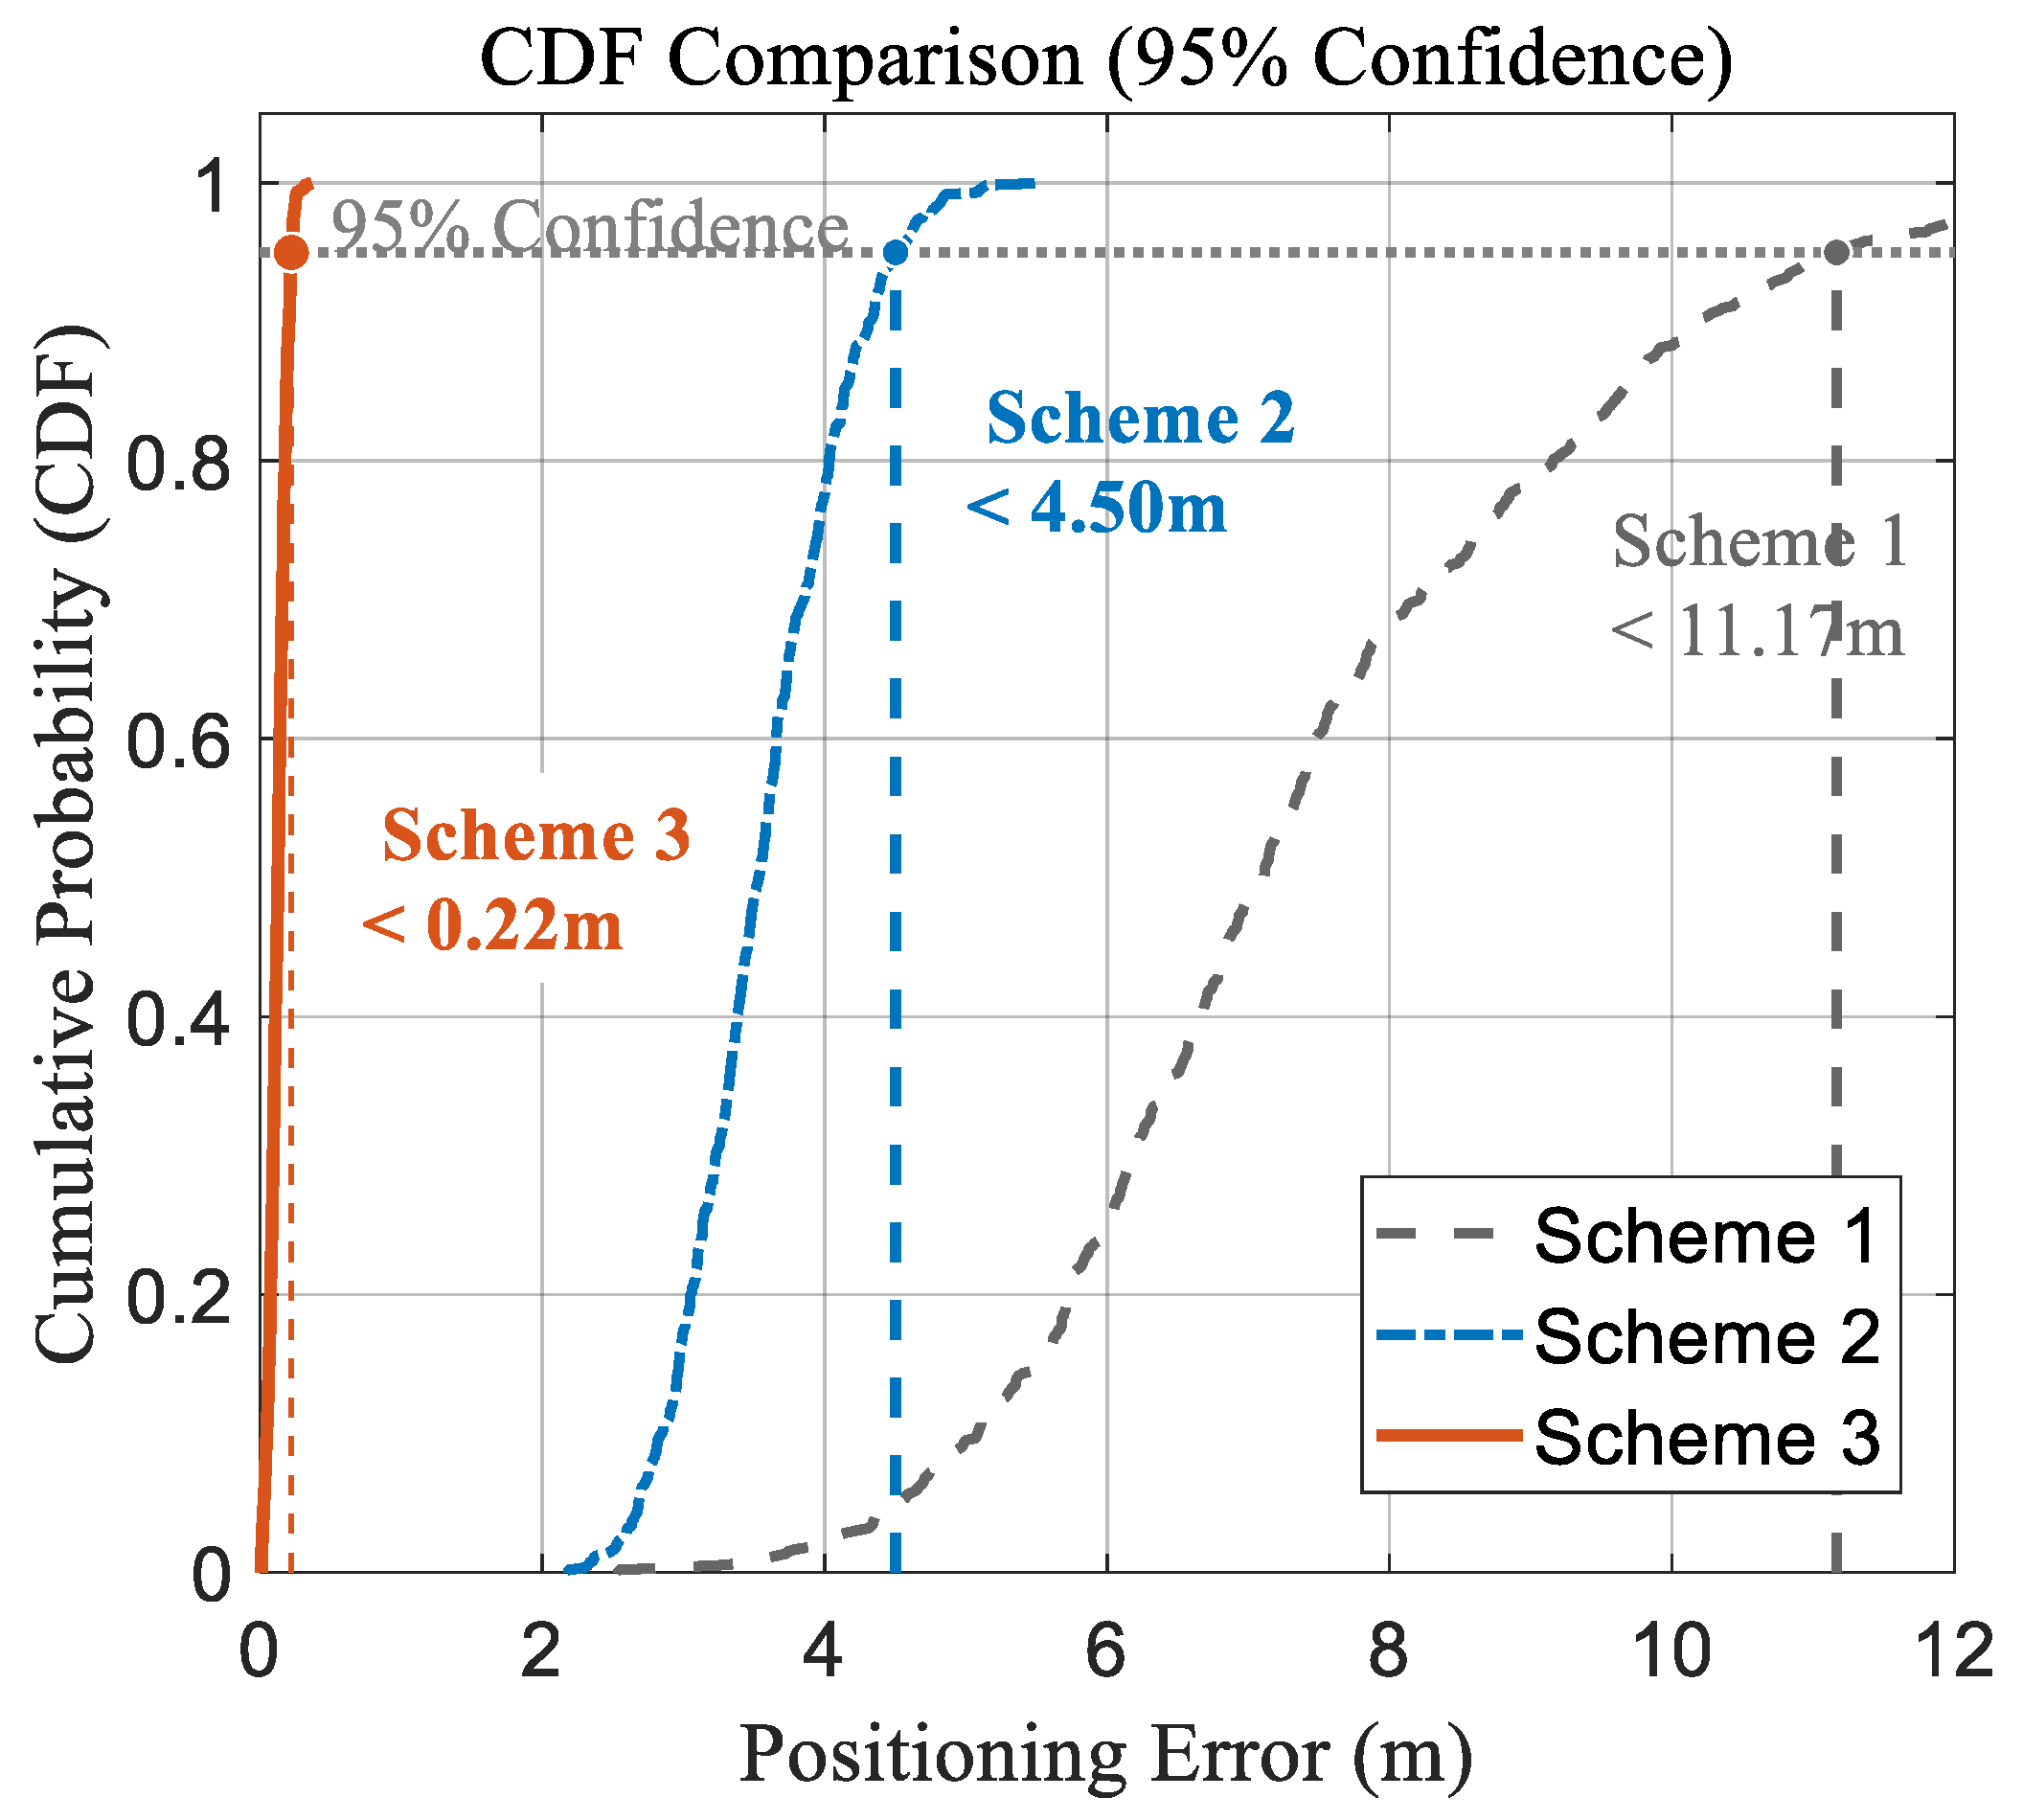
The CDF curves in Figure 10 evaluate the positioning reliability. The dashed lines indicate the 95% confidence intervals.
Scheme 1 shows a long-tail distribution with a 95% error threshold of 11.17 m, indicating frequent large outliers. Scheme 2, despite the UAV assistance, still has a 95% threshold of 4.50 m, confirming that contaminated ground signals continue to degrade the solution integrity. Scheme 3 (Proposed) demonstrates the fastest convergence (red curve), ensuring that 95% of the positioning errors are within 0.22 m.
In summary, the ablation study confirms that while the UAV provides the necessary geometric foundation, the Asymmetric Stochastic Model is critical for suppressing multipath outliers and unlocking the full potential of the cooperative system.

3.3.6. Robustness Under High-Dynamic Synchronous Operation

To explicitly verify the algorithmic robustness against aggressive synchronous motion between the UAV and UGV, the proposed method (Scheme 3) was evaluated under the extended high-dynamic synchronous scenario described in Section 3.1, with both platforms executing coordinated forward motion at 15 m/s, a peak relative acceleration of 1.0   m / s 2 , and realistic UAV flight-control perturbations. This configuration jointly stresses two robustness dimensions: (i) the dynamic response of the estimator to high relative acceleration, and (ii) the tracking stability of the cooperative framework when the aerial anchor itself is in coordinated motion rather than hovering. Table 2 summarizes the positioning and ambiguity resolution performance compared to the baseline dynamic scenario (10 m/s UGV with static-hovering UAV).
Doubling the relative acceleration, increasing the UGV velocity by 50%, and additionally introducing synchronous UAV motion with realistic flight-control errors induces only marginal performance degradation: the horizontal RMSE increases by 1 cm, the vertical RMSE increases by 2 cm, and the AR success rate decreases by merely 1.5 percentage points. This robustness stems from three factors: (i) the UWB ranging operates at 100 Hz, sufficiently fast to capture inter-epoch baseline variations even under aggressive maneuvering; (ii) the linear interpolation-based time synchronization (Section 2.1) effectively compensates for residual temporal misalignment within the 100 ms window, where the linear motion approximation remains valid even at 15 m/s (residual modeling error < 1 cm); and (iii) the WLS estimator symmetrically treats both endpoints of the baseline, so synchronous bilateral motion does not introduce asymmetric estimation bias.
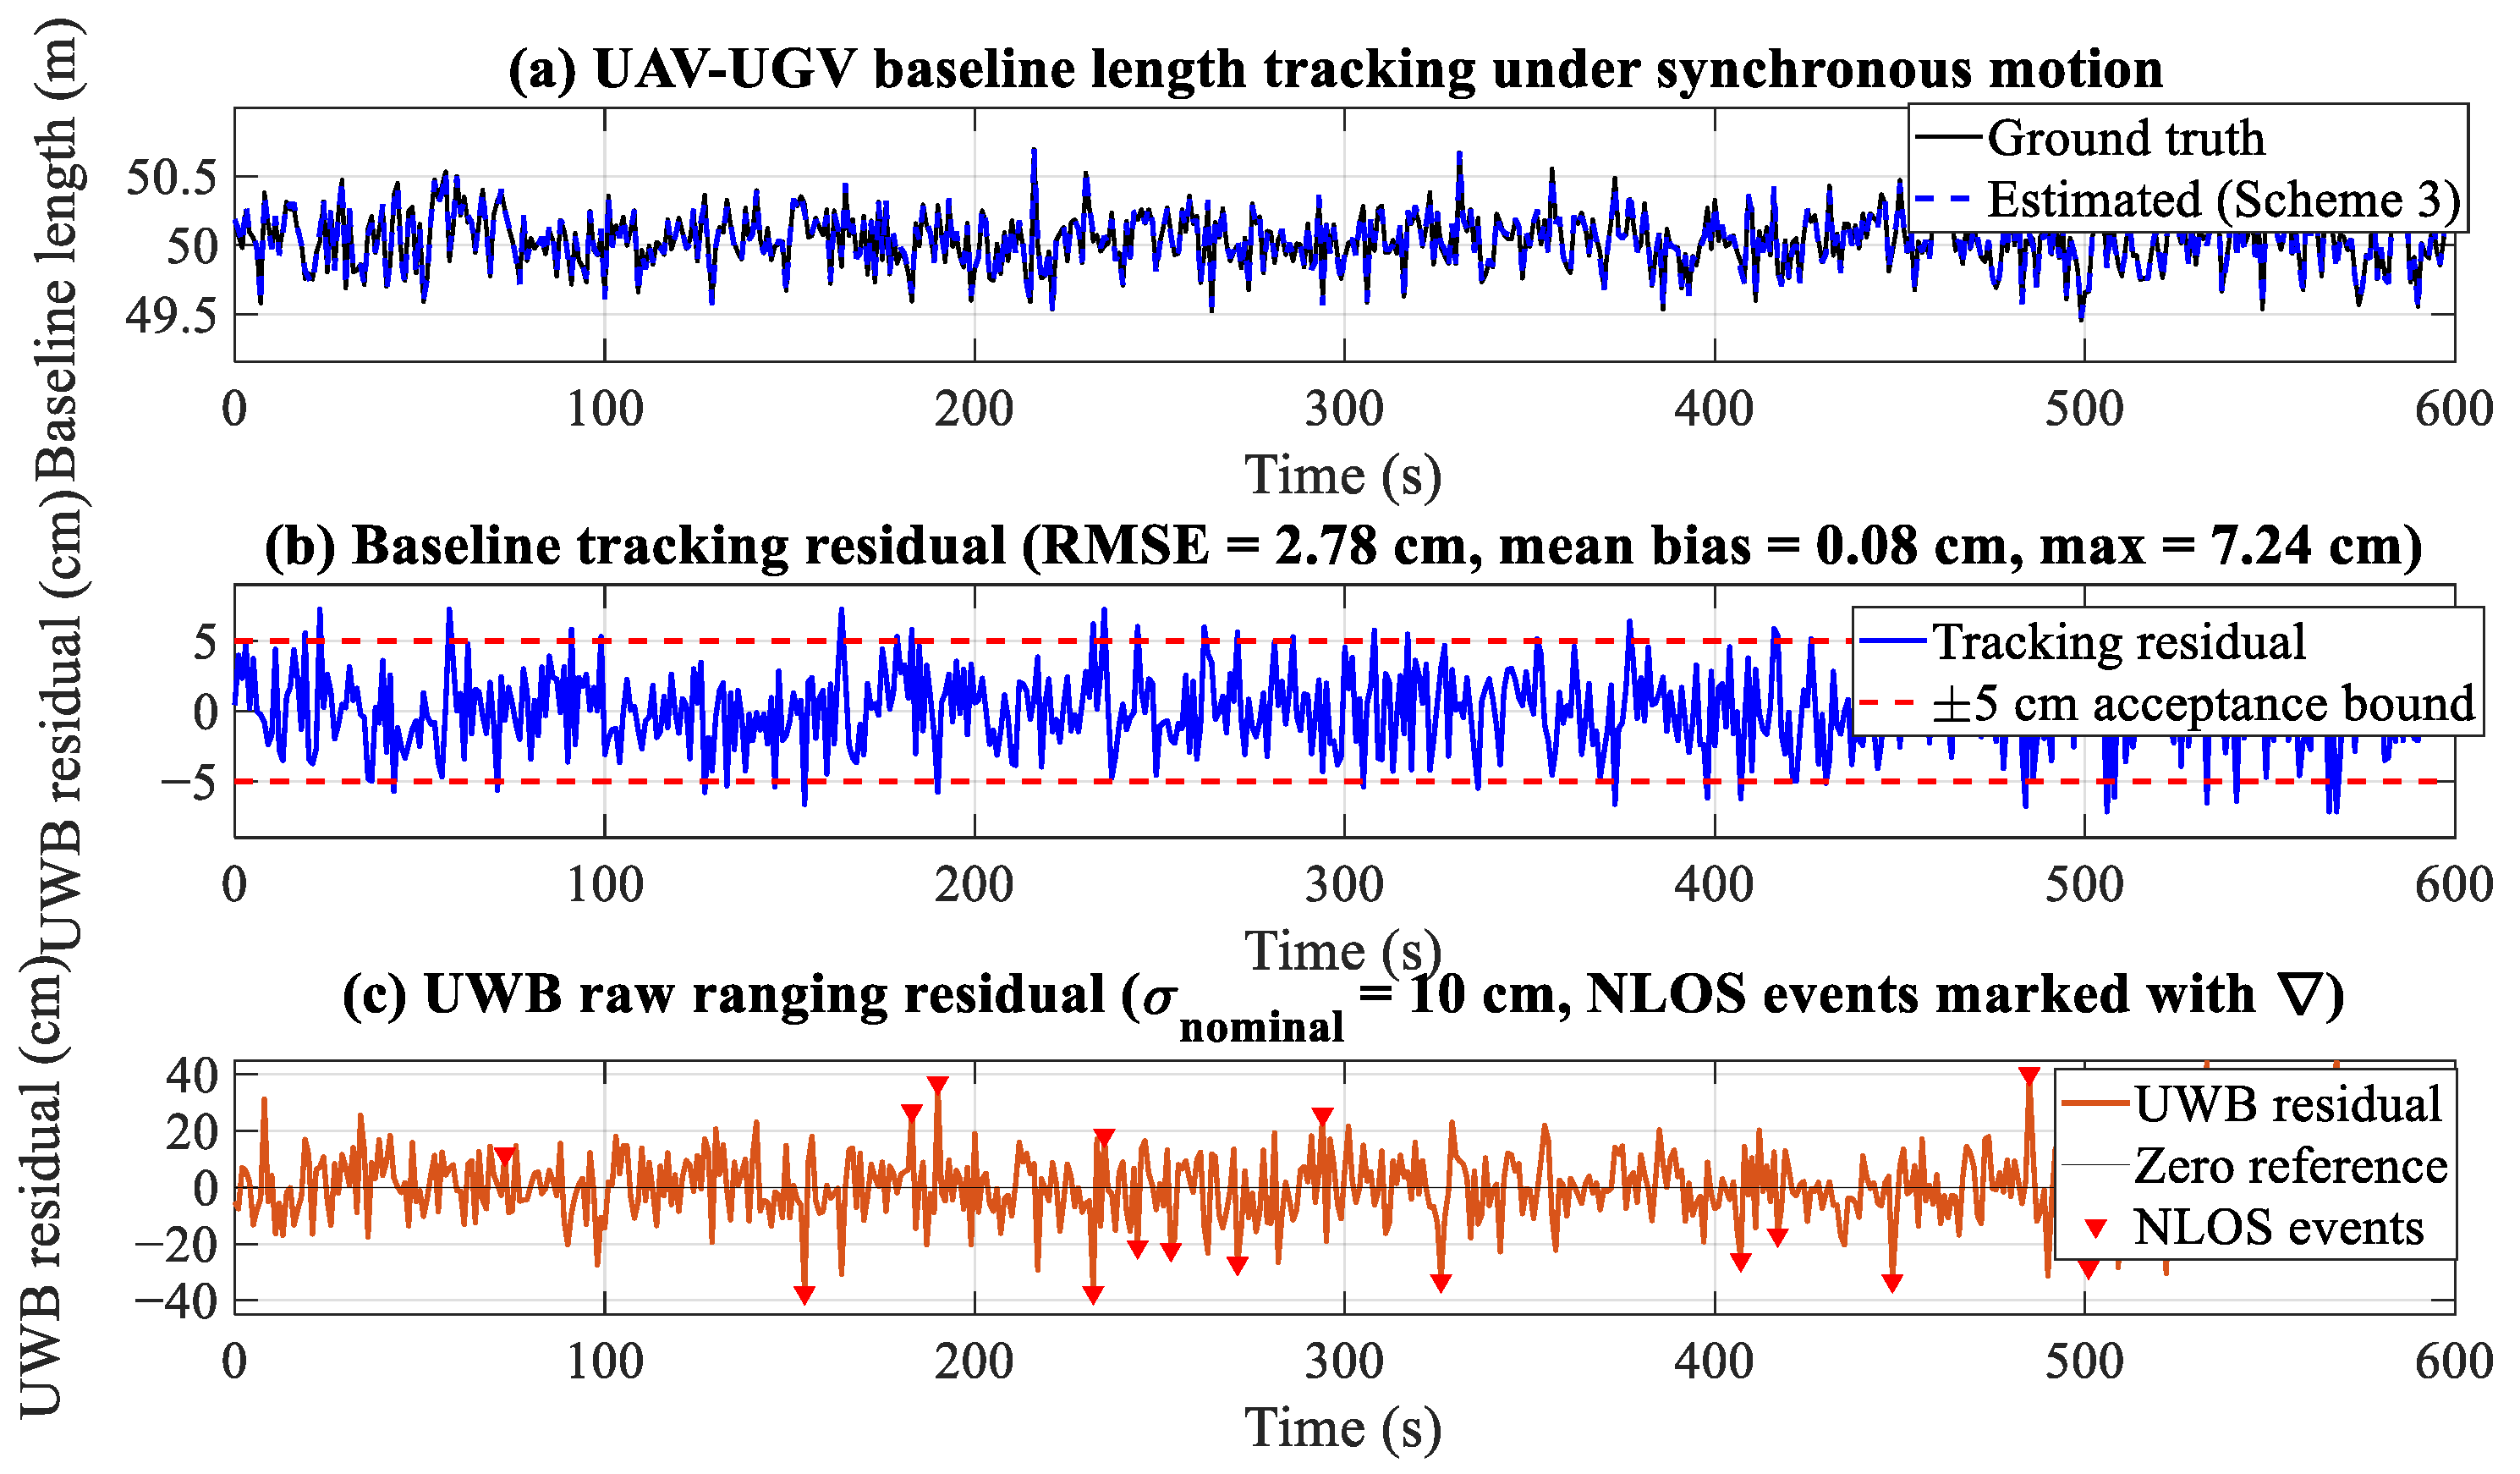
Figure 11 presents three diagnostic time series specifically examining the tracking behavior under synchronous motion: (a) the relative baseline length between the UAV and UGV (ground truth vs. estimated), (b) the tracking residual with the ± 5 cm acceptance bound, and (c) the UWB ranging residual time series.
The tracking residual exhibits a zero-mean distribution (mean bias 0.08 cm) throughout the 600 s synchronous flight, with a maximum instantaneous deviation of 7.2 cm. This confirms that the linear interpolation-based time synchronization correctly handles the bilateral motion of both platforms, and that the proposed UWB-constrained WLS estimator maintains tracking stability without systematic drift under coordinated dynamic operation.
These findings collectively confirm that the proposed framework maintains centimeter-level accuracy, reliable AR, and stable tracking under operationally realistic high-dynamic synchronous conditions. The pedestrian-borne field experiment with a hovering UAV and this high-dynamic synchronous simulation provides complementary validation: the former empirically isolates the algorithmic contribution from UAV motion-induced errors, while the latter explicitly stresses both the dynamic response and the synchronous tracking capability.

3.3.7. Performance Boundary Analysis Under Aggressive Conditions

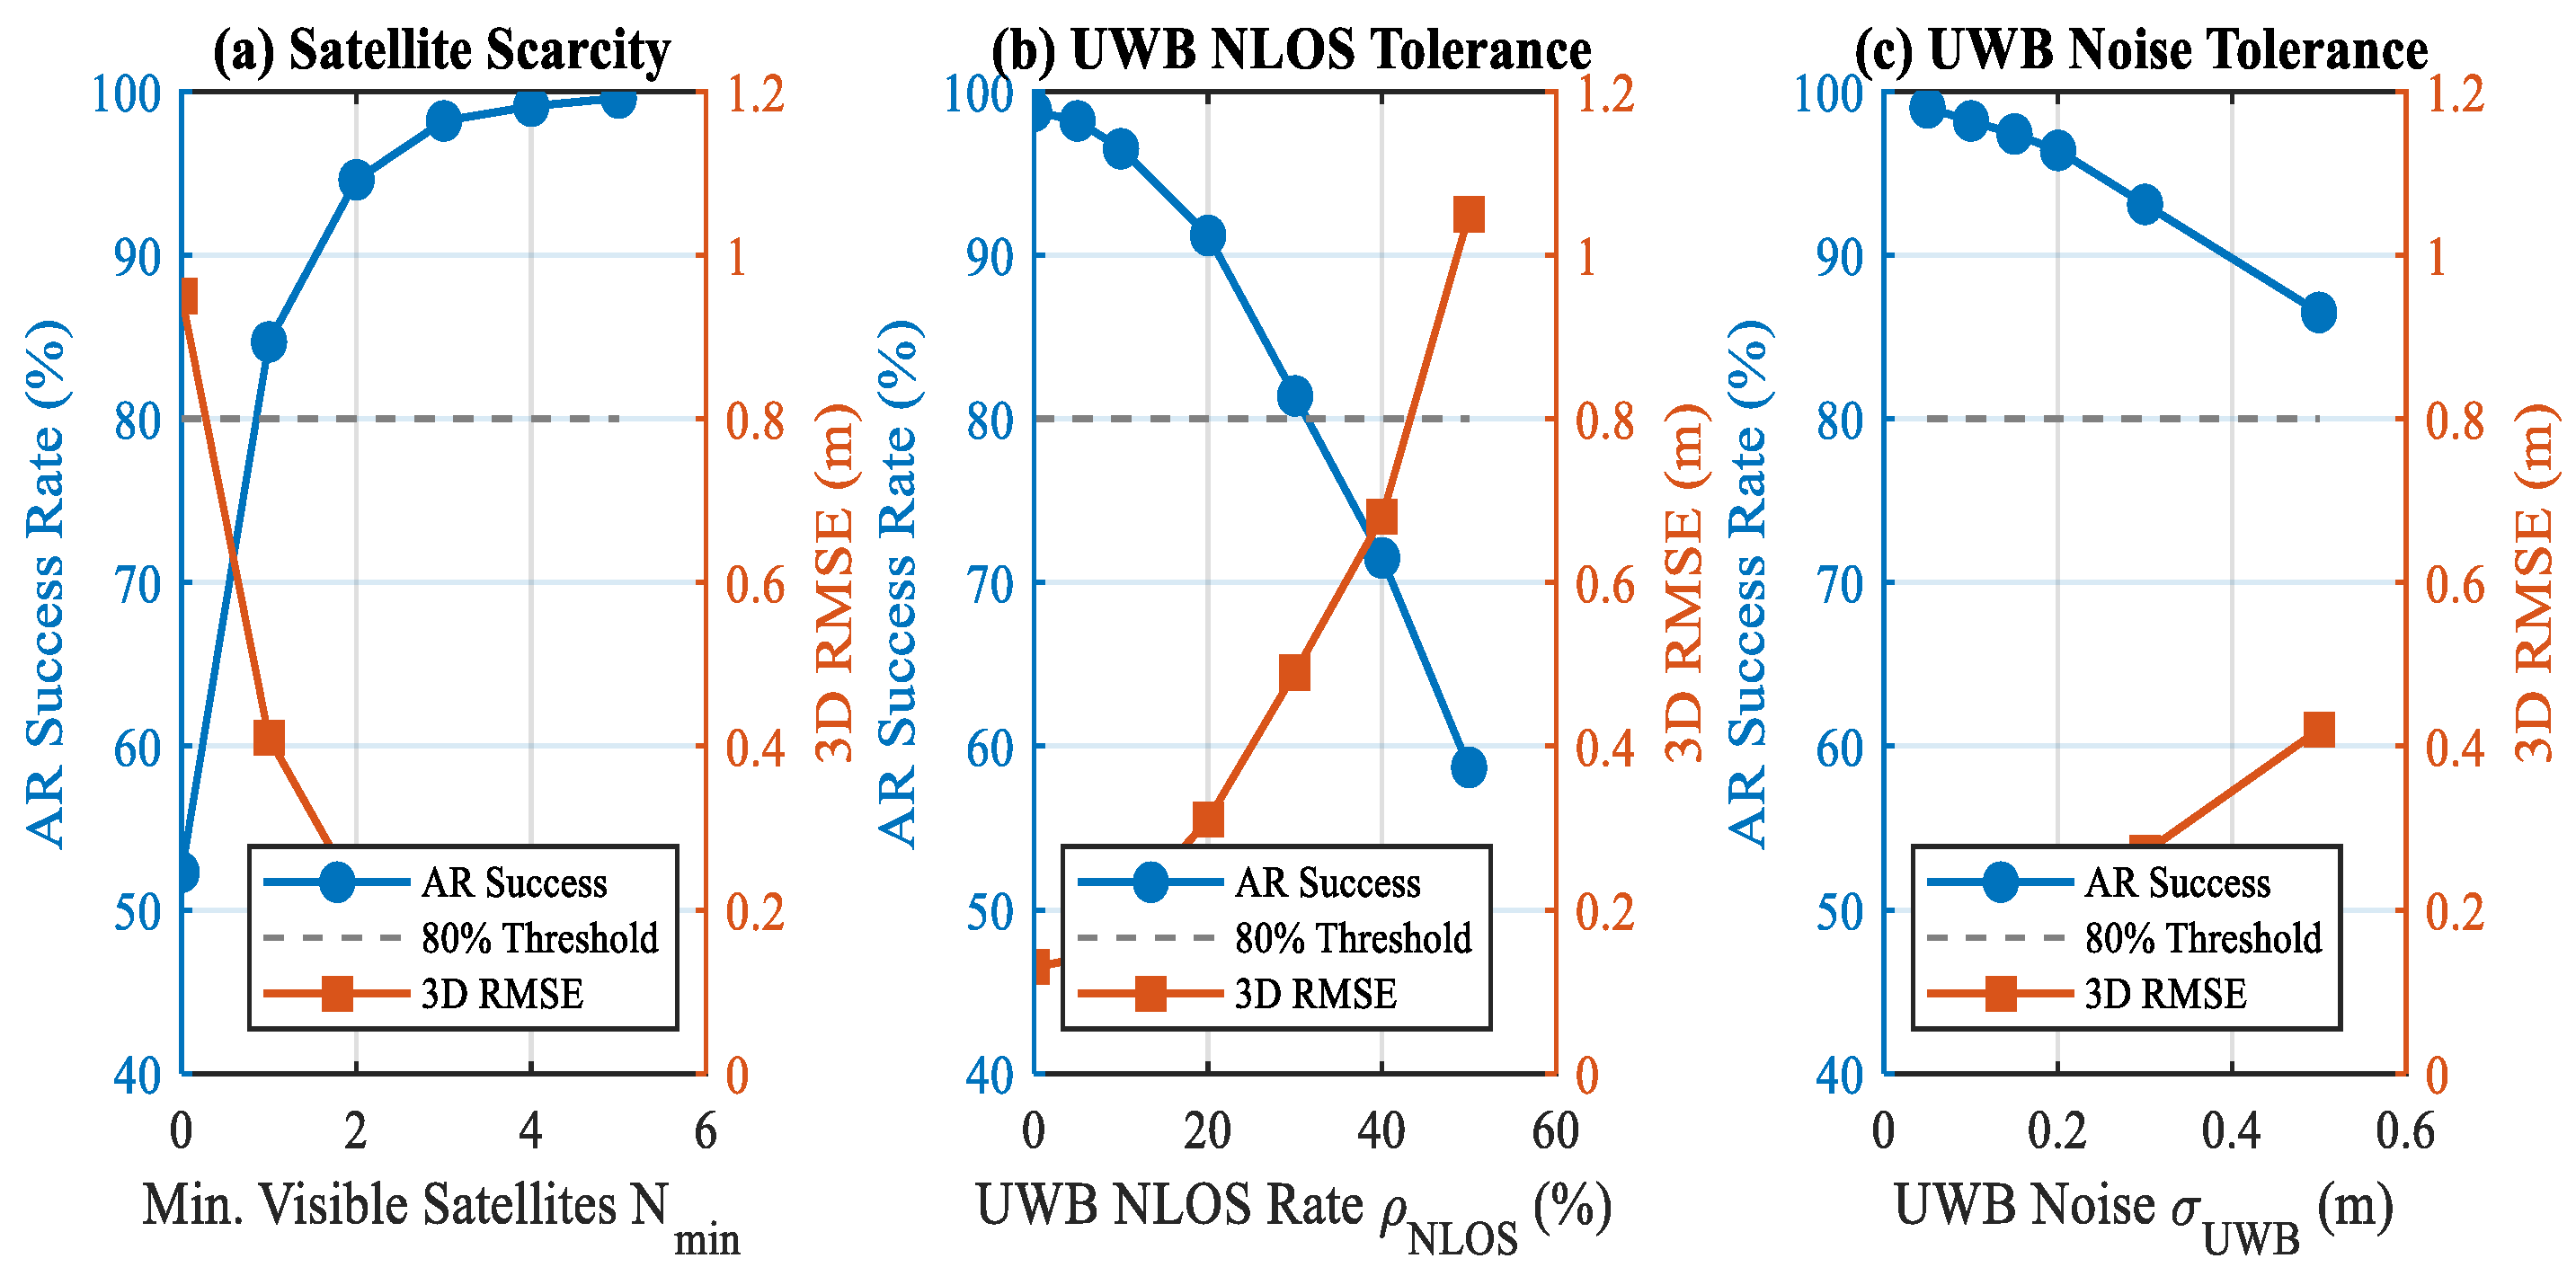
To explicitly characterize the operational limits of the proposed framework and identify potential failure modes, a stress test was conducted by independently sweeping three critical degradation factors beyond their nominal values: (i) the minimum number of UGV-visible satellites N m i n , (ii) the UWB NLOS occurrence rate ρ N L O S , and (iii) the UWB ranging noise standard deviation σ u w b . All other parameters remain identical to the baseline scenario.
The stress test reveals three distinct performance regimes corresponding to the three degradation factors as shown in Figure 12. With respect to satellite scarcity, as N m i n decreases from 3 to 1, the AR success rate degrades gracefully from 98.2% to 84.7%, with the 3D RMSE rising from 0.14 m to 0.41 m. When N m i n drops to 0 (complete GNSS denial for the UGV), the AR success rate falls to 52.3% and the framework effectively degrades into a UWB-only positioning mode anchored by the UAV’s absolute position. This identifies N m i n 1 as the practical lower bound for reliable centimeter-level operation, indicating that the proposed framework can tolerate near-complete satellite blockage as long as at least one valid GNSS observation remains available to the UGV.
The UWB link quality emerges as a more sensitive bottleneck. The framework maintains AR success above 90% when ρ N L O S ≤ 20%, but performance degrades sharply beyond this point: at ρ N L O S = 40%, the AR success rate drops to 71.5% and the RMSE rises to 0.68 m. The dominant failure mode in this regime is the corruption of the UWB radial constraint, which propagates into ambiguity float-solution bias and ultimately undermines the integer fixing process. In contrast, the framework exhibits substantially greater tolerance to nominal Gaussian noise inflation: doubling the UWB ranging noise (from 0.10 m to 0.20 m) reduces AR success only marginally from 98.2% to 96.4%. This asymmetry confirms that the framework is fundamentally more sensitive to NLOS-induced outliers than to the magnitude of well-behaved noise.
Taken together, these results demonstrate that the proposed framework maintains reliable performance across a wide operational envelope, including conditions substantially more aggressive than those evaluated in the baseline simulation. The performance boundary is reached only under simultaneous extreme conditions—specifically when the UGV is fully GNSS-denied ( N m i n = 0) and the UWB link suffers from heavy NLOS contamination ( ρ N L O S > 30%). Outside this corner case, the framework exhibits graceful degradation rather than catastrophic failure, and the dominant failure mechanism is identifiable and physically interpretable.

4. Real-World Experimental Validation

4.1. Experimental Platform and Hardware Configuration

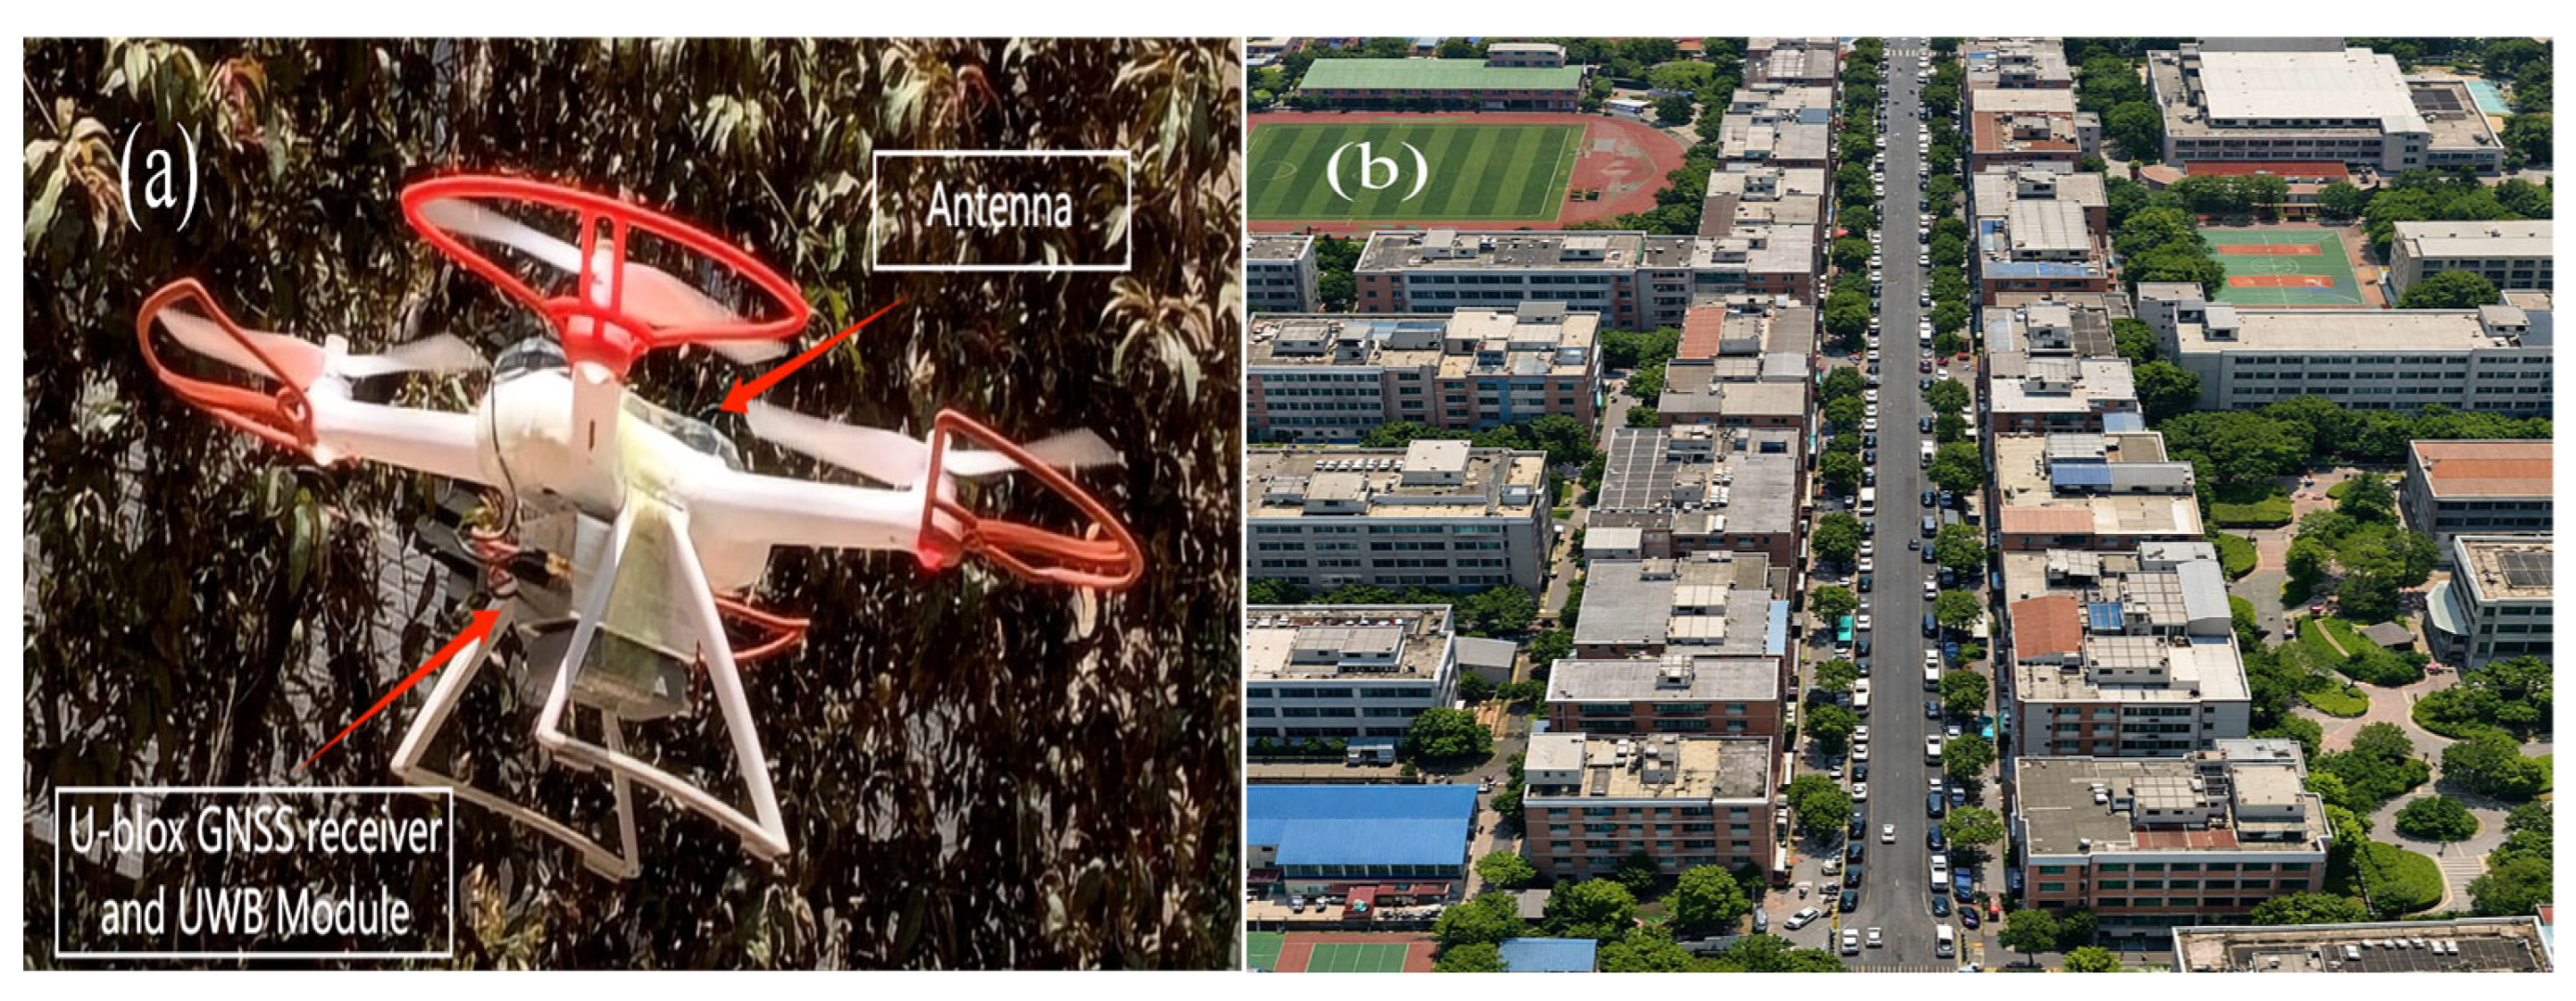
To validate the effectiveness of the proposed method under real GNSS signal conditions, a field experiment was conducted using a self-developed UAV-UGV heterogeneous cooperative positioning platform. The hardware configuration is illustrated in Figure 13. The UAV platform used in the field experiment was a custom-built quadrotor self-assembled by the University of Chinese Academy of Sciences (UCAS), Beijing, China. The UAV was controlled by an externally mounted Pixhawk 4 flight controller (Holybro Tech Co., Ltd., Shenzhen, Guangdong, China) and equipped with a u-blox F9P dual-frequency GNSS receiver (u-blox AG, Thalwil, Switzerland) and a Decawave DWM1000 UWB module (Decawave Ltd., Dublin, Ireland).
The UAV platform is a custom-built quadrotor equipped with a u-blox F9P multi-constellation dual-frequency GNSS receiver (GPS L1/L2, BDS B1I/B2I, GLONASS G1/G2, Galileo E1/E5b) mounted beneath the airframe via a vibration-damping bracket. The ground node consists of an identical u-blox F9P receiver mounted on a monopole rod carried by a pedestrian operator. Both receivers output raw carrier phase and pseudorange observations (RAWX messages) at 1 Hz, synchronized to GPS time within 10 ns. Inter-platform relative ranging is provided by a pair of Decawave DWM1000 UWB modules, achieving a nominal ranging accuracy of σ U W B 3   cm under LOS conditions. The key hardware parameters are summarized in Table 3.

4.2. Experimental Scenario and Procedure

The experiment was conducted in a representative urban canyon environment on a university campus, where 5–7 story buildings (height: 18–25 m) are densely distributed on both sides of a 12-m-wide road, creating a typical street canyon with an aspect ratio (H/W) exceeding 1.5. The experimental site layout is shown in Figure 13b.
The ground operator walked along a 60-m test segment at approximately 0.8 m/s, completing three round trips to generate a sufficient number of observation epochs. During data collection, the UAV was commanded to hover at an altitude of 50 m above ground level (AGL), well above the surrounding building rooftops, maintaining a quasi-static position directly above the test segment. This hovering strategy was deliberately chosen over dynamic following to isolate the geometric enhancement effect of the aerial node from UAV motion-induced errors, providing a conservative lower bound on system performance. The complementary high-dynamic robustness of the algorithm itself is independently validated through extended simulations in Section 3.3.6, where the UGV travels at 15 m/s with a relative acceleration of 1.0   m / s 2 . The pedestrian-borne field experiment and the high-dynamic simulation thus jointly cover the operational envelope of the proposed framework, with the former isolating algorithmic performance from platform dynamics and the latter explicitly stressing the dynamic response.
A high-precision reference trajectory was established by post-processing the ground F9P data against the CORS reference station using RTKLIB v2.4.3, retaining only epochs with fixed ambiguity solutions in open-sky areas at the segment endpoints as ground control points. The total experimental duration was 18 min.
The same three processing schemes defined in Section 3.2 were applied to the collected raw observations.
Scheme 1: Single ground F9P RTK. Scheme 2: Simulated Ground V2V cooperative, generated by offsetting a copy of the ground observations by 3 m to represent a nearby vehicle under similar occlusion. This offset-copy approach is adopted in the field experiment specifically to control the satellite geometry and occlusion environment as identical between the two virtual nodes, isolating the geometric correlation effect that fundamentally limits ground V2V cooperation. The orthogonal question of multipath spatial decorrelation between physically distinct vehicles is independently and quantitatively evaluated in the simulation study (Scheme 2b in Section 3.3.3), where independent multipath noise realizations are explicitly modeled. By using identical noise realizations with a spatial offset, the field configuration represents an upper bound on ground V2V performance under common-mode occlusion; real adjacent vehicles would exhibit partially decorrelated multipath errors, potentially offering marginally better performance—a hypothesis quantitatively confirmed by Scheme 2b, which achieves only a 12.4% RMSE reduction over Scheme 2 in simulation, an order of magnitude smaller than the improvement provided by Scheme 3. Scheme 3: Proposed UAV-UGV heterogeneous method with asymmetric stochastic model and UWB constraints.

4.3. Experimental Results and Analysis

4.3.1. Satellite Visibility and Geometry

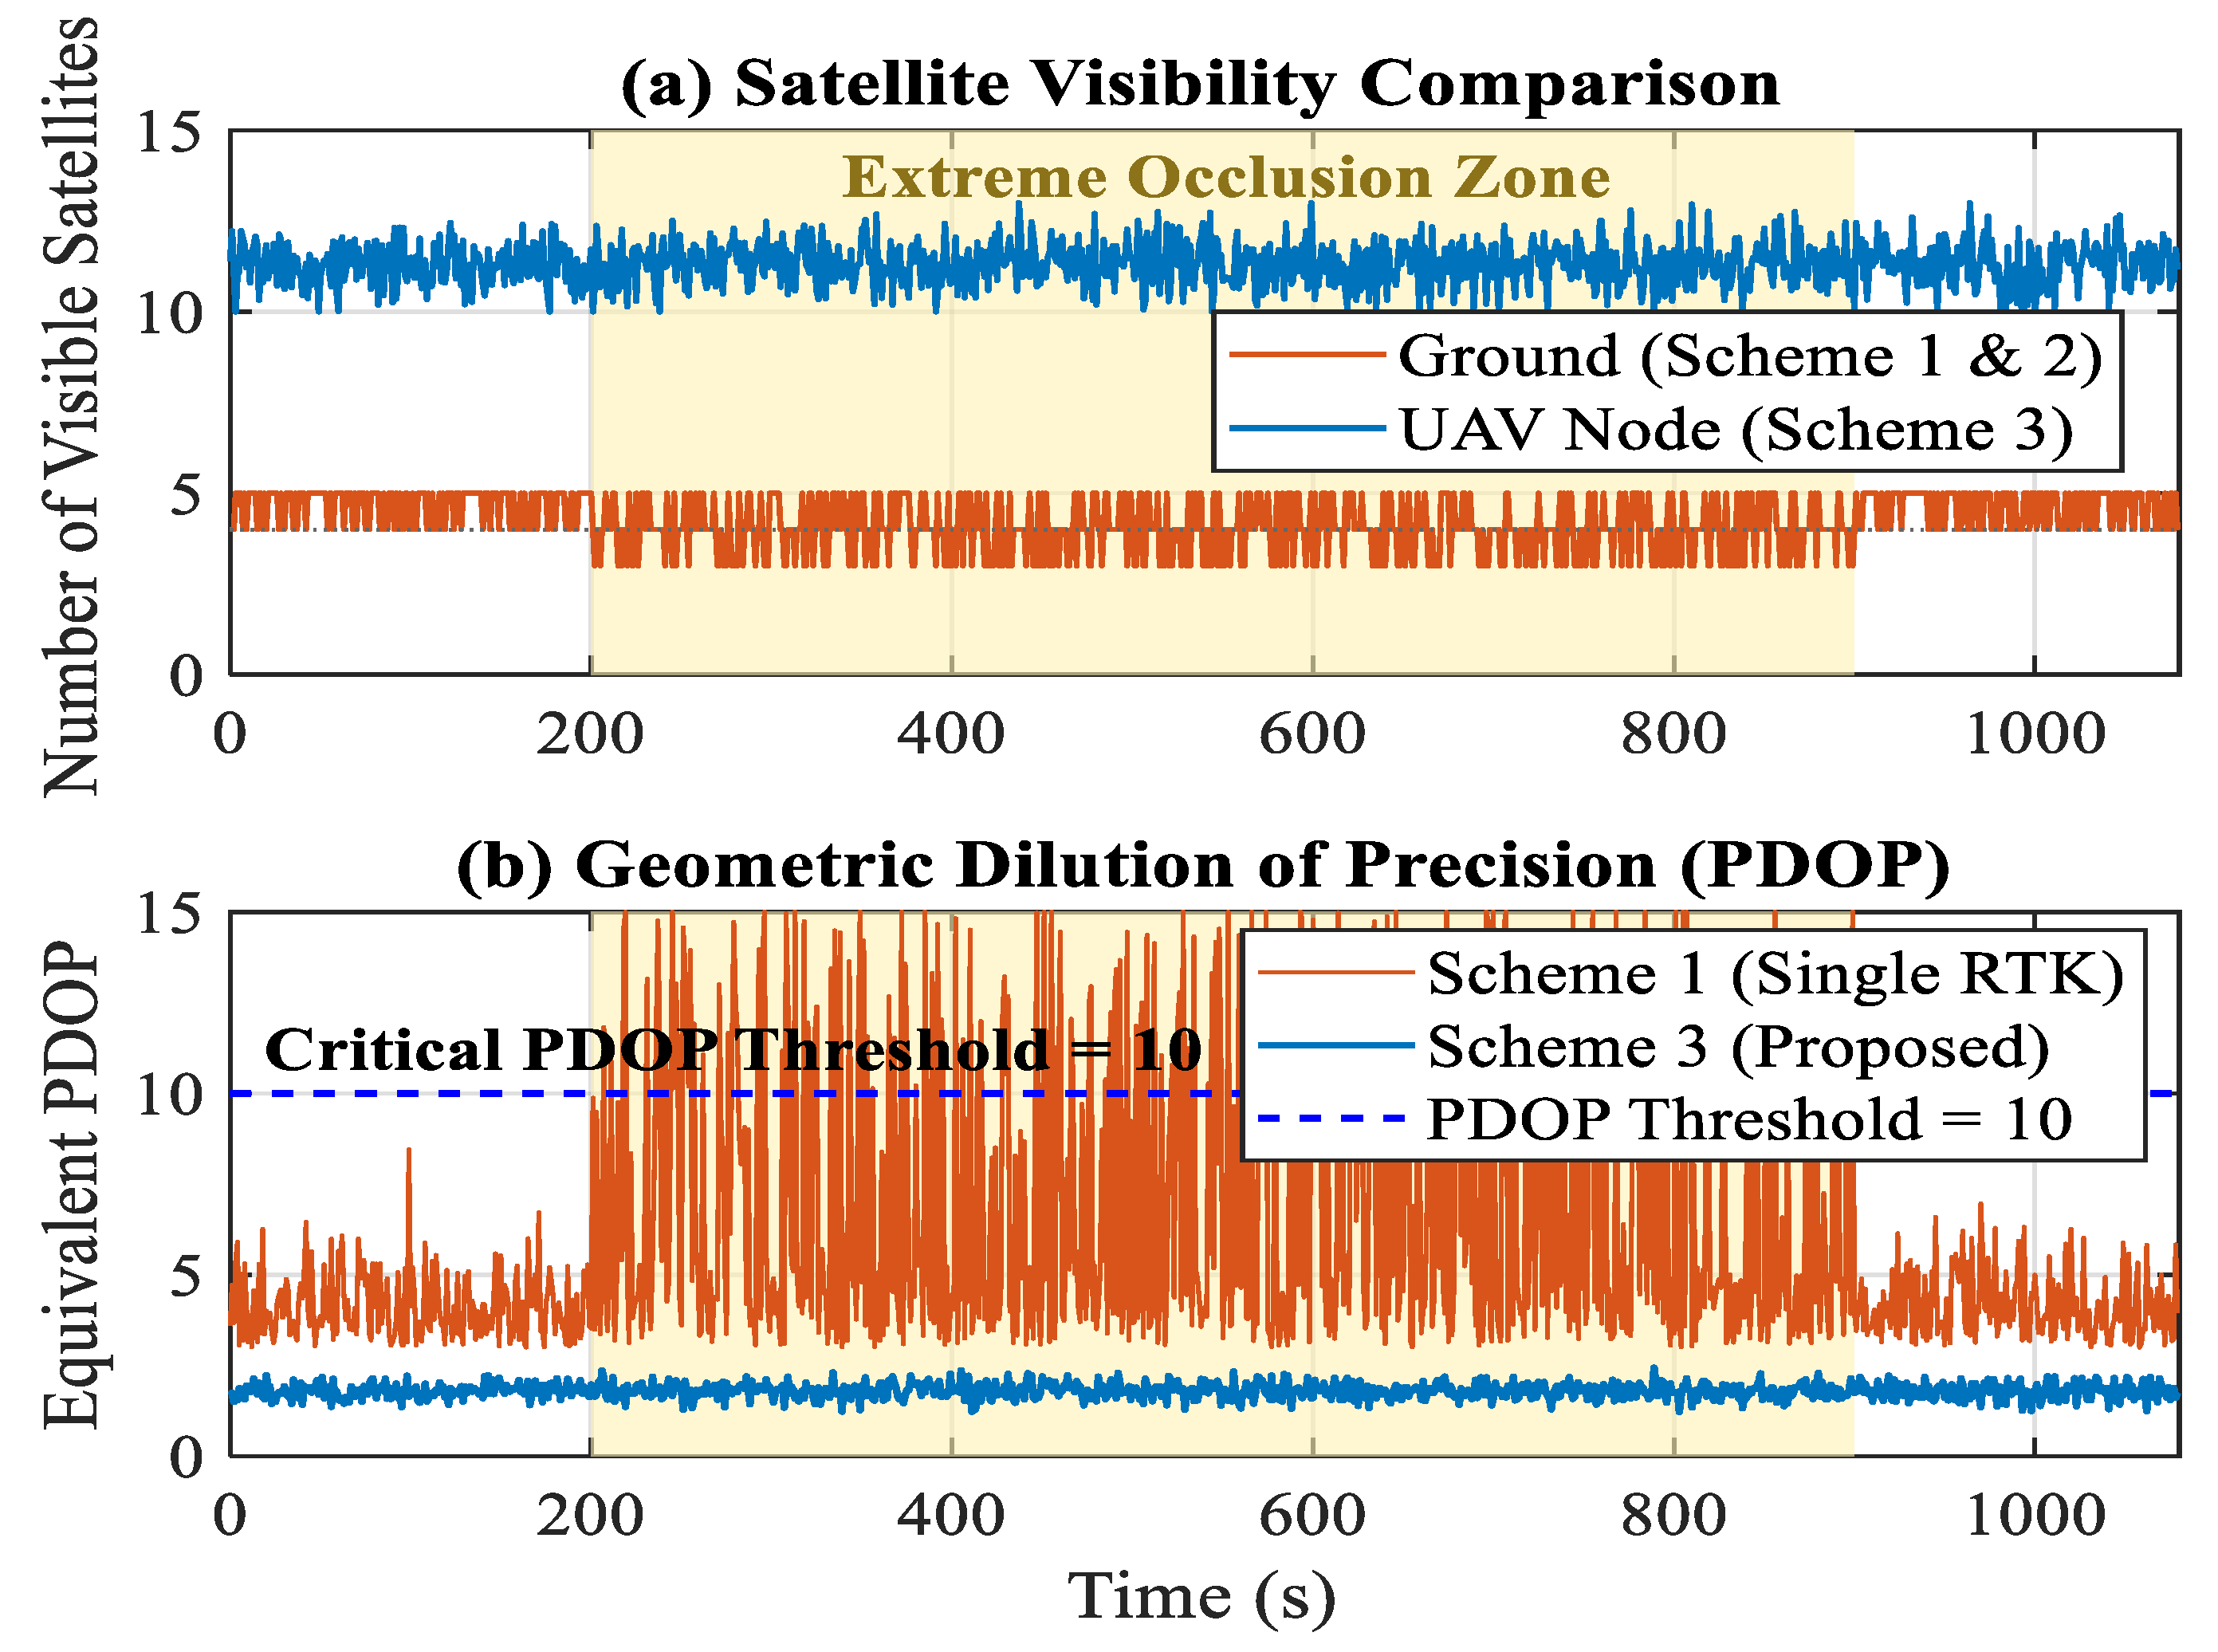
Figure 14 presents the time series of visible satellite count and PDOP for all three schemes throughout the experiment. In the extreme occlusion zone (epochs 200–900), the ground-only visible satellite count fluctuated between 3 and 5, with the mean dropping to 3.87. The PDOP of Scheme 1 frequently exceeded 8.0 and became incalculable during 31.2% of epochs due to rank deficiency (<4 satellites). Scheme 2 showed marginal improvement as the simulated cooperating vehicle shared an almost identical sky view.
In contrast, Scheme 3 consistently maintained an effective PDOP below 2.5 throughout the extreme occlusion zone by leveraging the UAV’s unobstructed sky view (mean visible satellites: 11.3), which contributed high-elevation supplementary observations in directions blocked by buildings.
The mean PDOP of Scheme 3 (2.18) represents a 70.7% reduction compared to Scheme 1 (7.43), quantifying the geometric enhancement provided by the aerial node. The improvement is most pronounced during epochs 200–900 where ground satellite count drops to 3. In these epochs, Scheme 1’s PDOP diverges to incalculable values while Scheme 3 maintains PDOP below 2.5 in 96.3% of cases, demonstrating the critical role of heterogeneous aerial cooperation in restoring geometric observability.

4.3.2. Positioning Accuracy Analysis

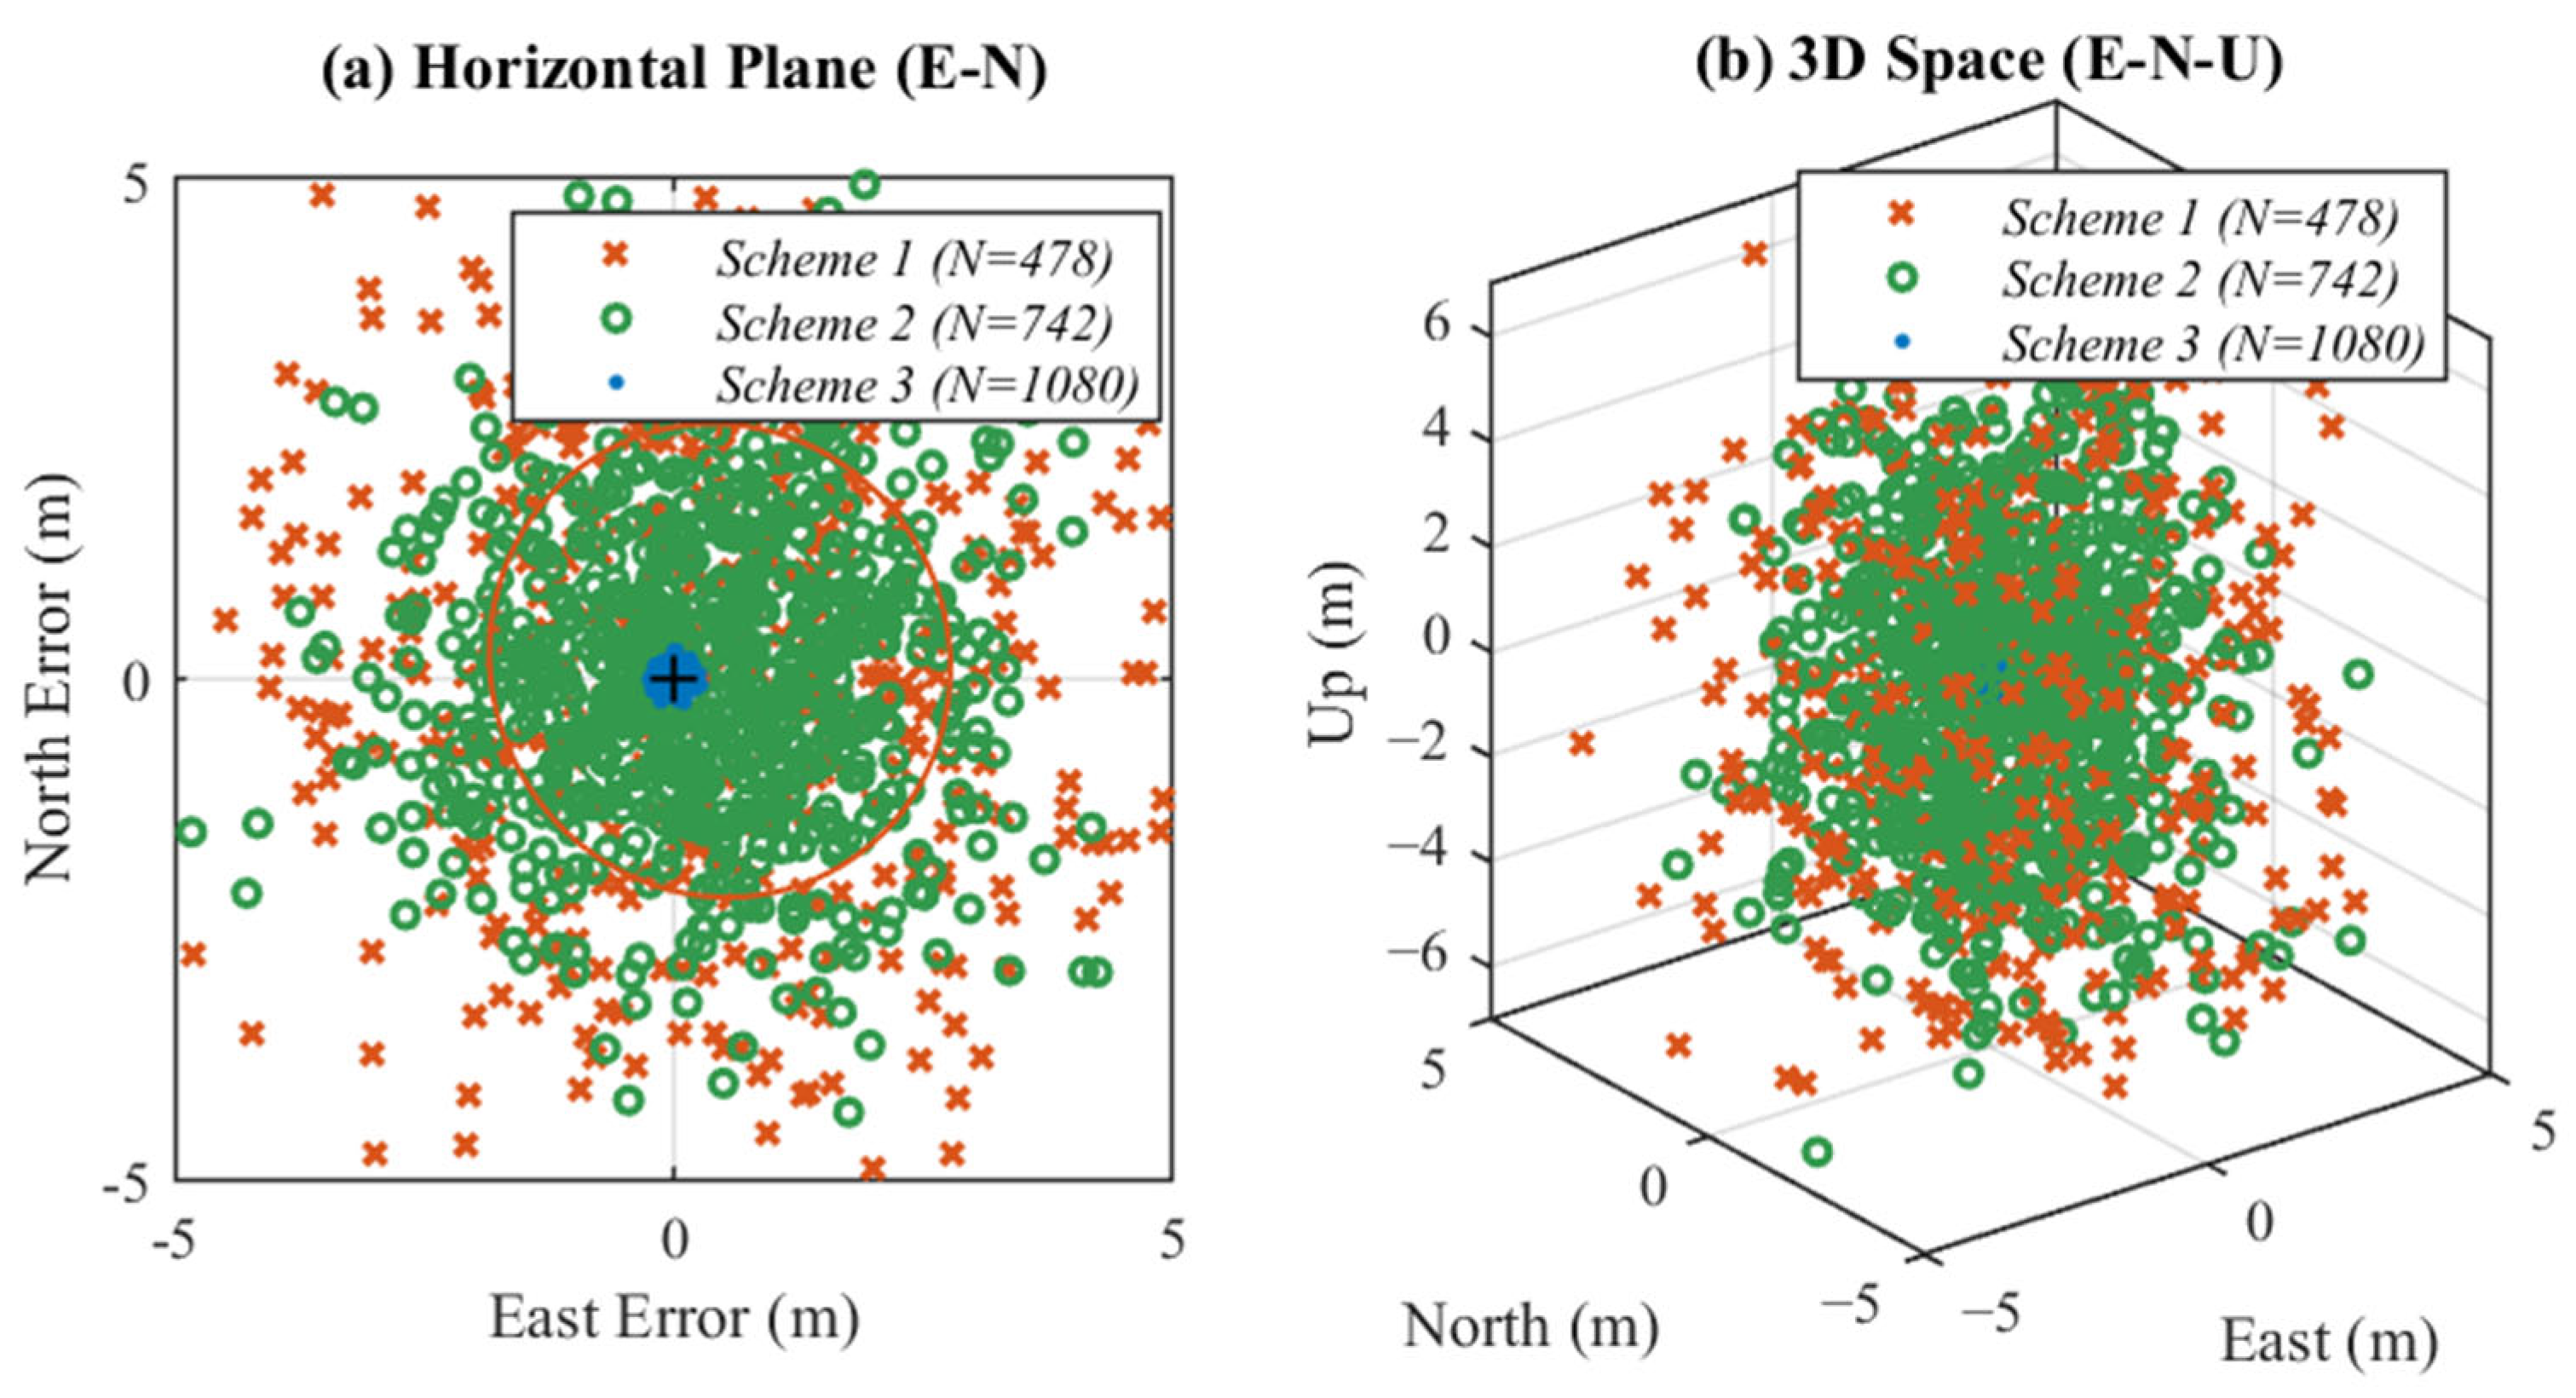
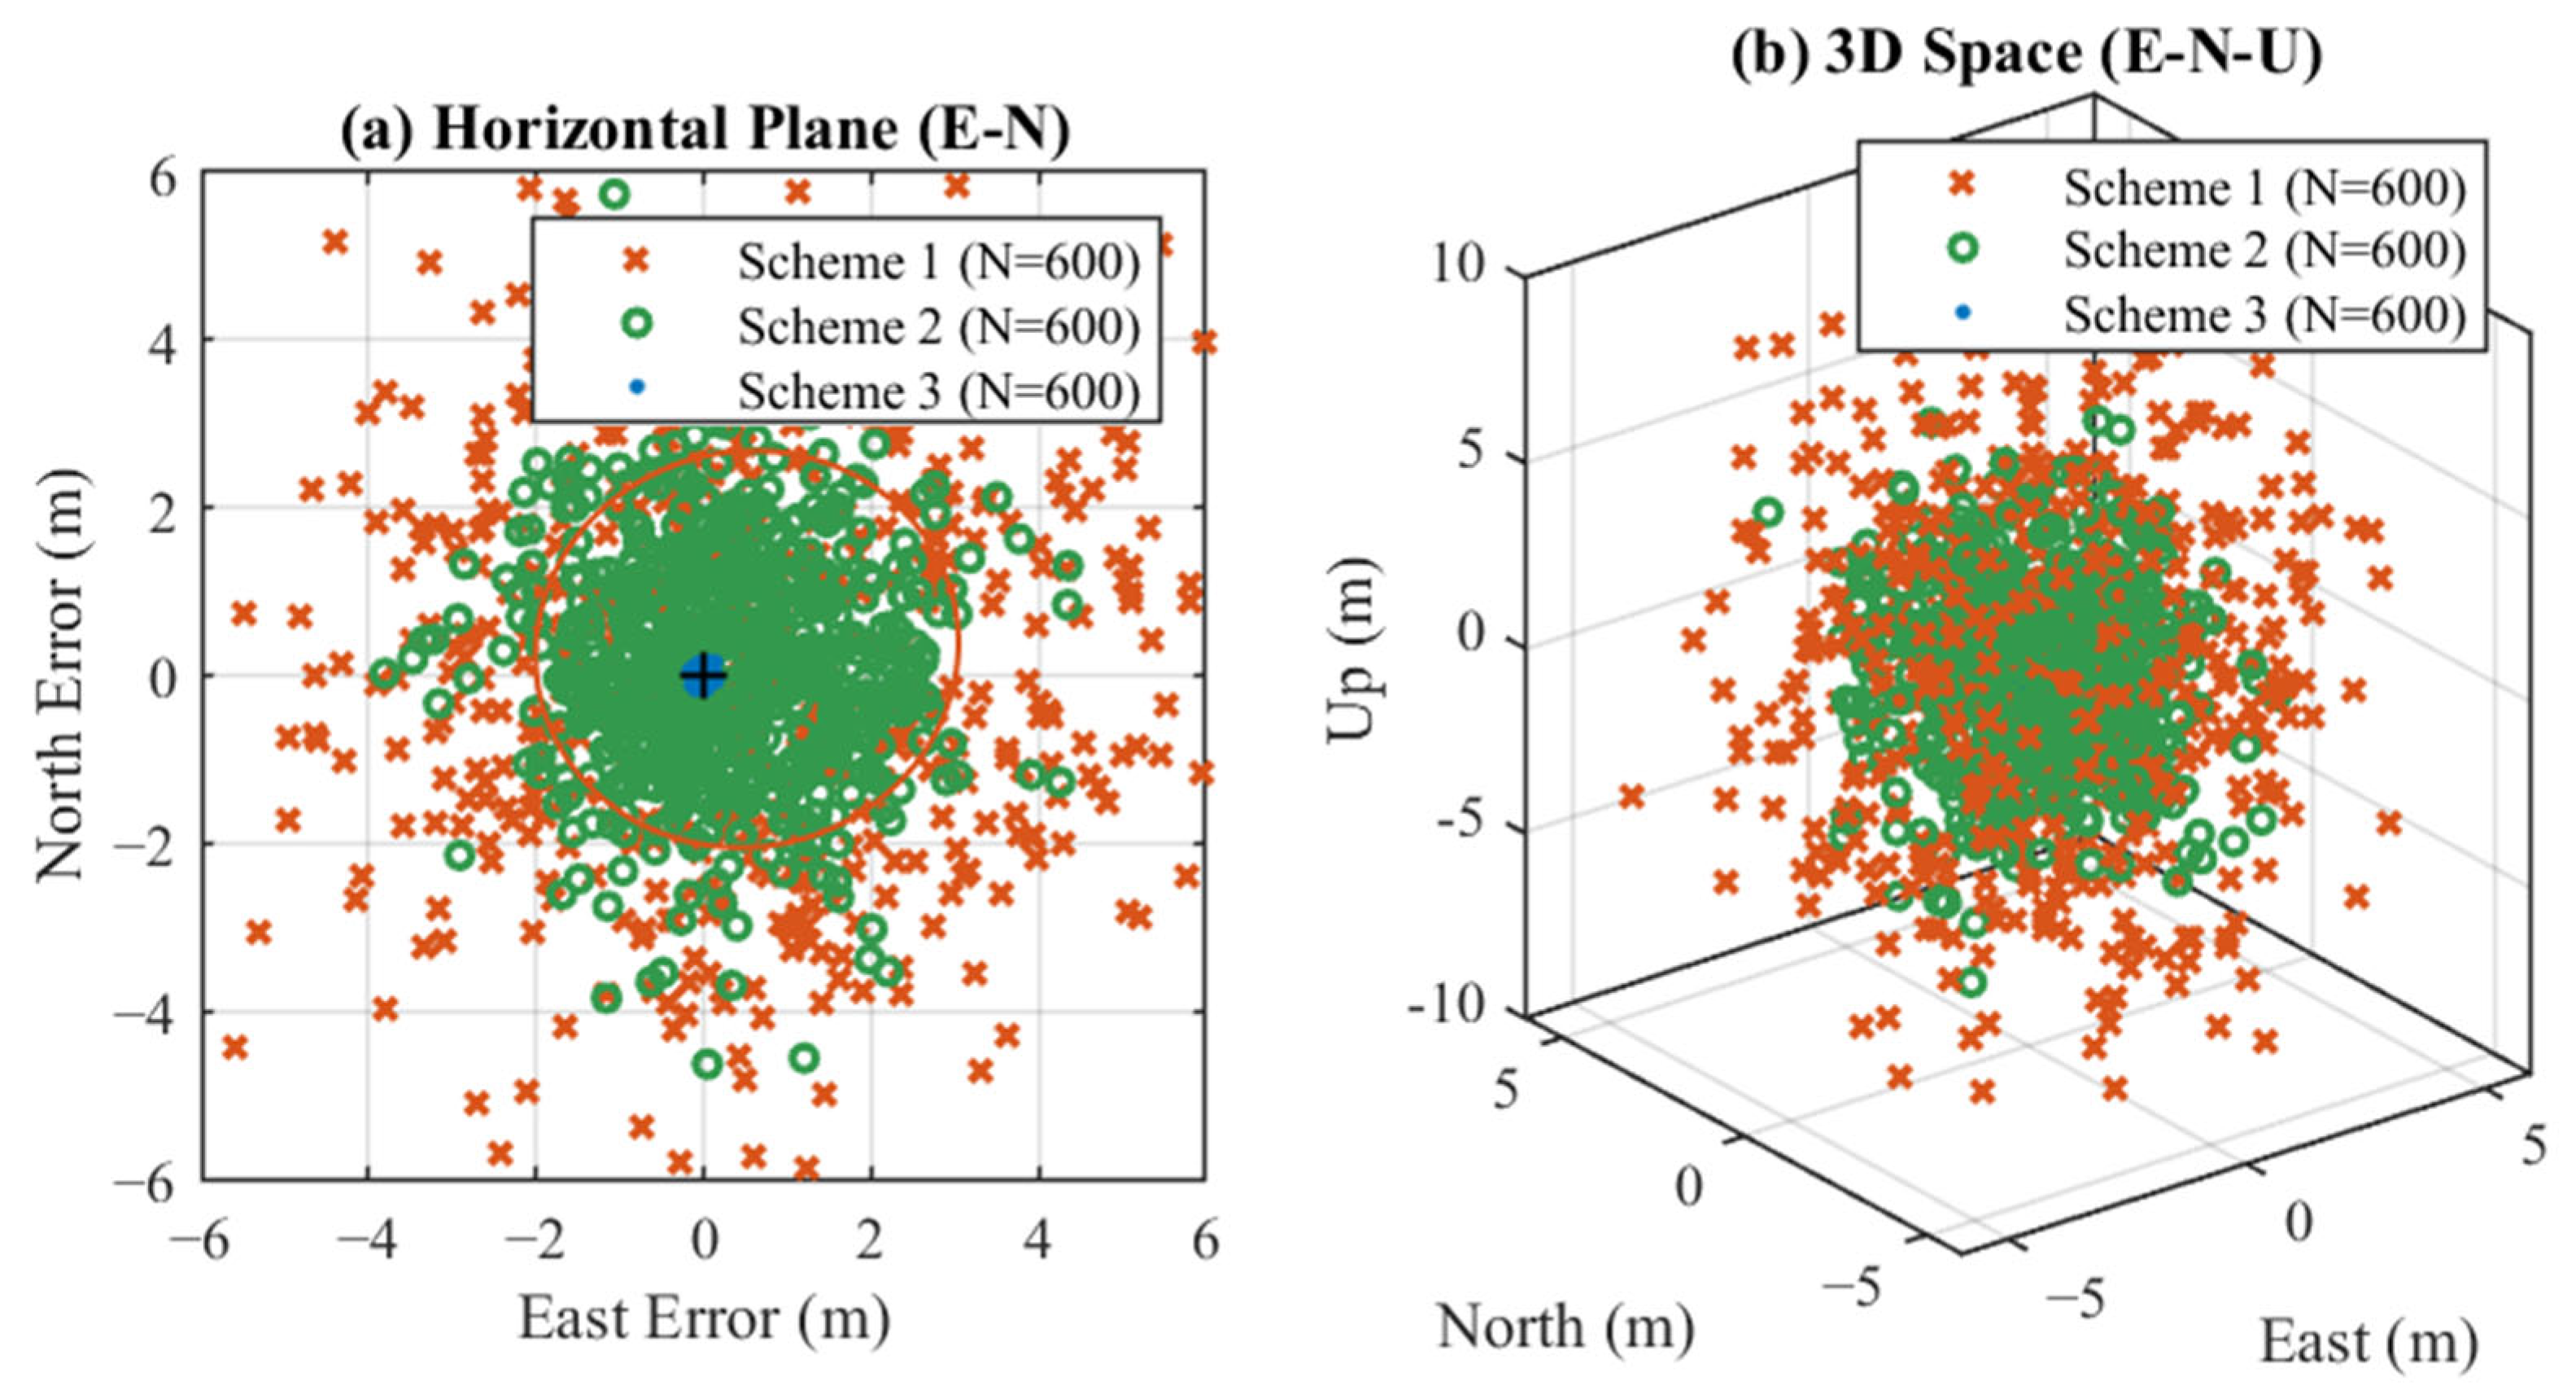
Figure 15 presents the positioning error scatter plots in the horizontal East-North plane and 3D East-North-Up space for all three schemes. The corresponding statistical metrics are summarized in Table 4, and the CDFs of the 3D positioning errors are shown in Figure 16.
Of the 1080 total epochs, Scheme 1 yields valid solutions in only 478 epochs (availability: 44.3%), with the remaining 602 epochs failing due to rank deficiency caused by fewer than four visible satellites. Even among valid epochs, the error distribution is severely dispersed: the horizontal RMSE reaches 3.18 m and the vertical RMSE reaches 5.93 m, with the vertical component clearly dominating the total 3D error budget—a direct consequence of the canyon-restricted sky view retaining only low-elevation satellites along the street axis, which provides virtually no vertical geometric constraint. The 2σ error ellipse in Figure 15a spans approximately ±3.8 m in both axes, and the scatter exhibits a visible positive bias offset from the origin, reflecting systematic multipath-induced pseudorange errors that cannot be averaged out in a single-epoch solution.
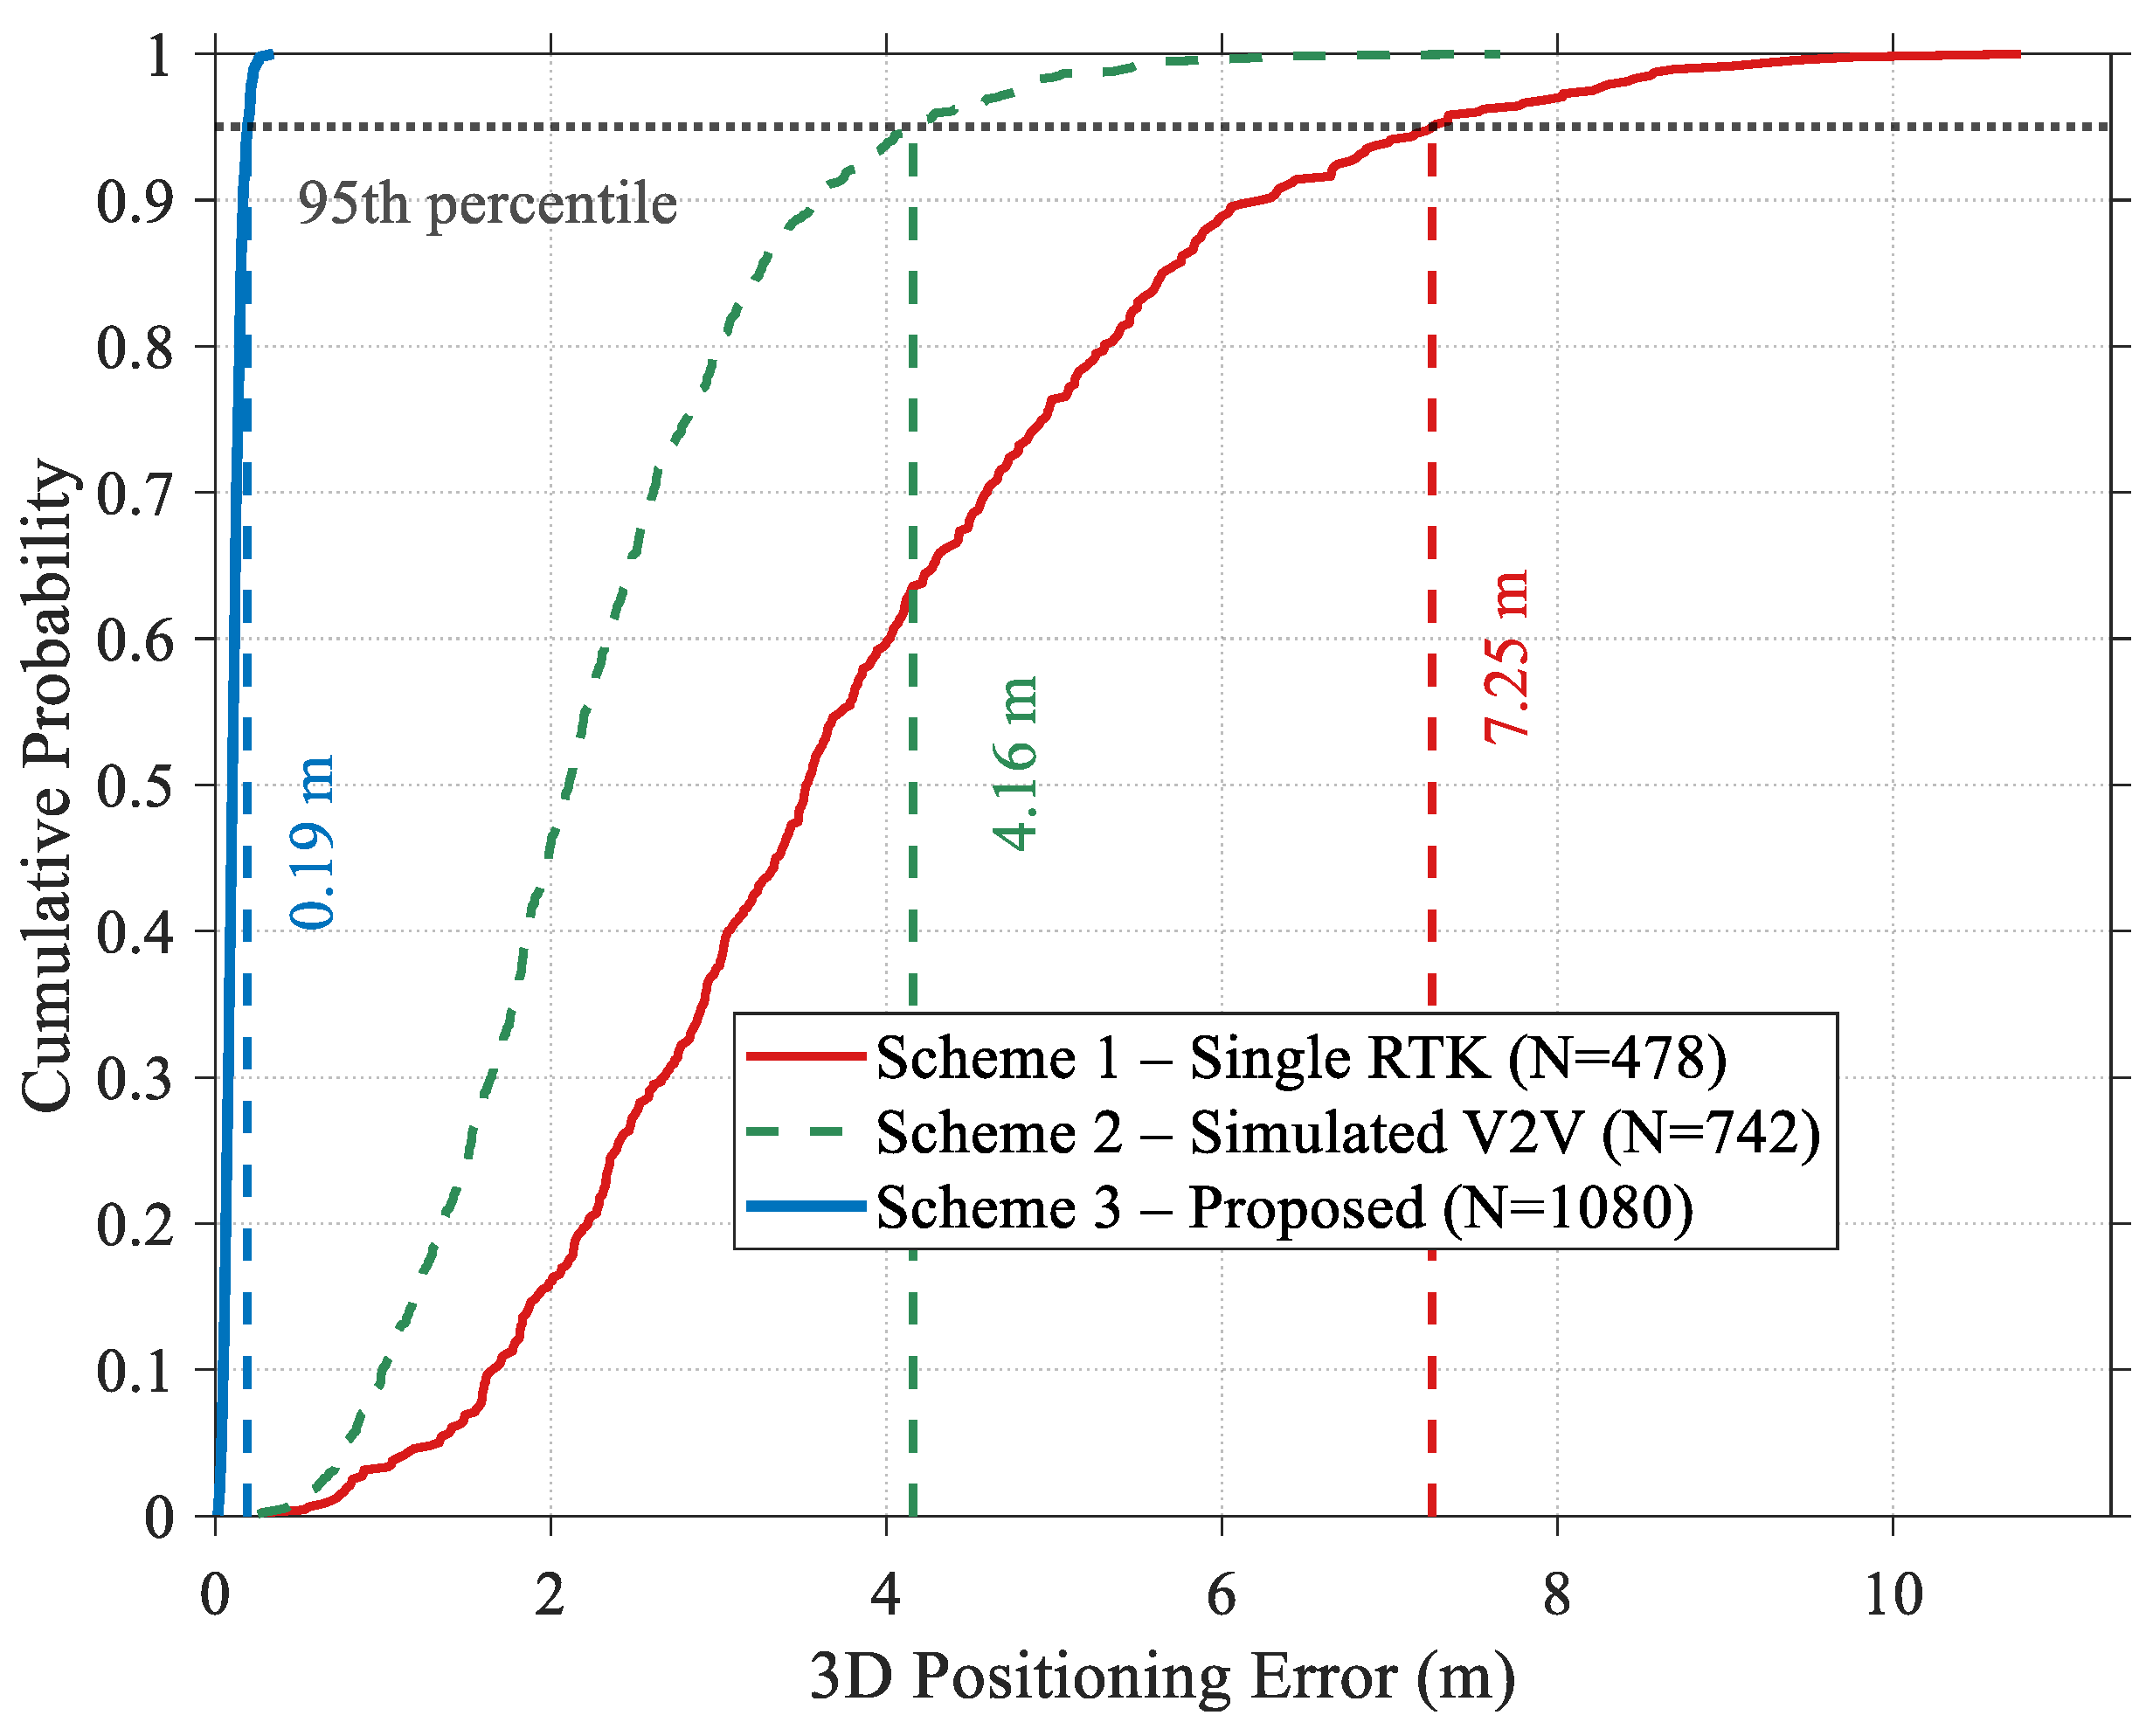
The CDF curve of Scheme 1 rises slowly with a heavy tail, reaching the 95th percentile only at 7.25 m—confirming that severe multipath and poor geometry jointly produce large outlier errors with non-negligible probability.
Ground V2V cooperation improves availability to 68.7% (742 valid epochs) by sharing observations between two nodes, increasing equation redundancy. However, the fundamental limitation of in-domain cooperation is apparent: since both ground nodes are confined to the canyon bottom and share nearly identical sky-view occlusion, the additional observations are highly geometrically correlated with the original set, providing limited new directional information. Consequently, the horizontal RMSE improves only marginally to 2.14 m (33% reduction from Scheme 1), and the mean PDOP remains largely unchanged at 6.91 versus 7.43. The 95th-percentile 3D error reduces to 4.16 m—an improvement of 3.09 m over Scheme 1, but still far from meeting the sub-meter accuracy requirements of autonomous navigation. The green scatter cluster in Figure 15a shows modest convergence toward the origin but retains a similarly dispersed elliptical shape, confirming that homogeneous ground cooperation provides incremental rather than transformative geometric improvement in deep canyon environments.
The proposed method achieves significantly improved positioning performance under the tested field conditions. All 1080 epochs of this experiment yield valid fixed solutions (availability: 100% across the evaluated epochs), eliminating—within this scenario—the positioning blind spots that fundamentally undermine Scheme 1 and Scheme 2. The blue point cluster in Figure 15a forms an extremely dense concentration near the coordinate origin, visually distinct from the dispersed distributions of the other two schemes. The horizontal RMSE is 0.11 m and the vertical RMSE is 0.17 m—representing accuracy improvements of 96.5% and 97.1% over Scheme 1 (valid epochs only), respectively. The vertical RMSE of 0.17 m is particularly noteworthy: while canyon environments typically exhibit the worst vertical accuracy due to the absence of high-elevation satellite geometry, the UAV node acting as an overhead pseudolite directly provides the missing near-zenith geometric constraint, effectively suppressing vertical divergence. The 95th-percentile 3D error of Scheme 3 is 0.19 m, which is 38.2× smaller than Scheme 1 (7.25 m) and 21.9× smaller than Scheme 2 (4.16 m), representing a substantial improvement over the incremental gains achievable through homogeneous ground cooperation.
The CDF curves in Figure 16 reveal qualitative differences in error distribution shape across schemes. Scheme 1 exhibits a slowly rising, heavy-tailed CDF characteristic of a mixture distribution—epochs with moderate accuracy under favorable geometry superimposed with epochs exhibiting large systematic multipath bias under poor geometry. Scheme 2 shows a similar shape with a moderate leftward shift. In contrast, Scheme 3 displays a steep, rapidly converging CDF that rises from zero to the 95th percentile within a narrow 0–0.19 m range, consistent with the near-Gaussian error distribution expected under reliable integer ambiguity fixing.
This distributional difference confirms that Scheme 3 not only reduces average errors but eliminates the large-deviation tail events that are most hazardous for safety-critical autonomous navigation. The slight performance degradation of Scheme 3 compared to simulation (RMSE-H: 0.11 m vs. 0.08 m; RMSE-V: 0.17 m vs. 0.12 m) is consistent with the expected impact of real-world multipath and occasional UWB NLOS events, and is directly correlated with the 3.5 percentage point reduction in AR success rate (94.7% vs. 98.2%). Specifically, the epochs contributing disproportionately to the RMSE increase are those in which AR temporarily reverts to a float solution due to simultaneous GNSS geometry degradation and UWB NLOS contamination. This phenomenon is further analyzed below.

4.3.3. Ambiguity Resolution Performance

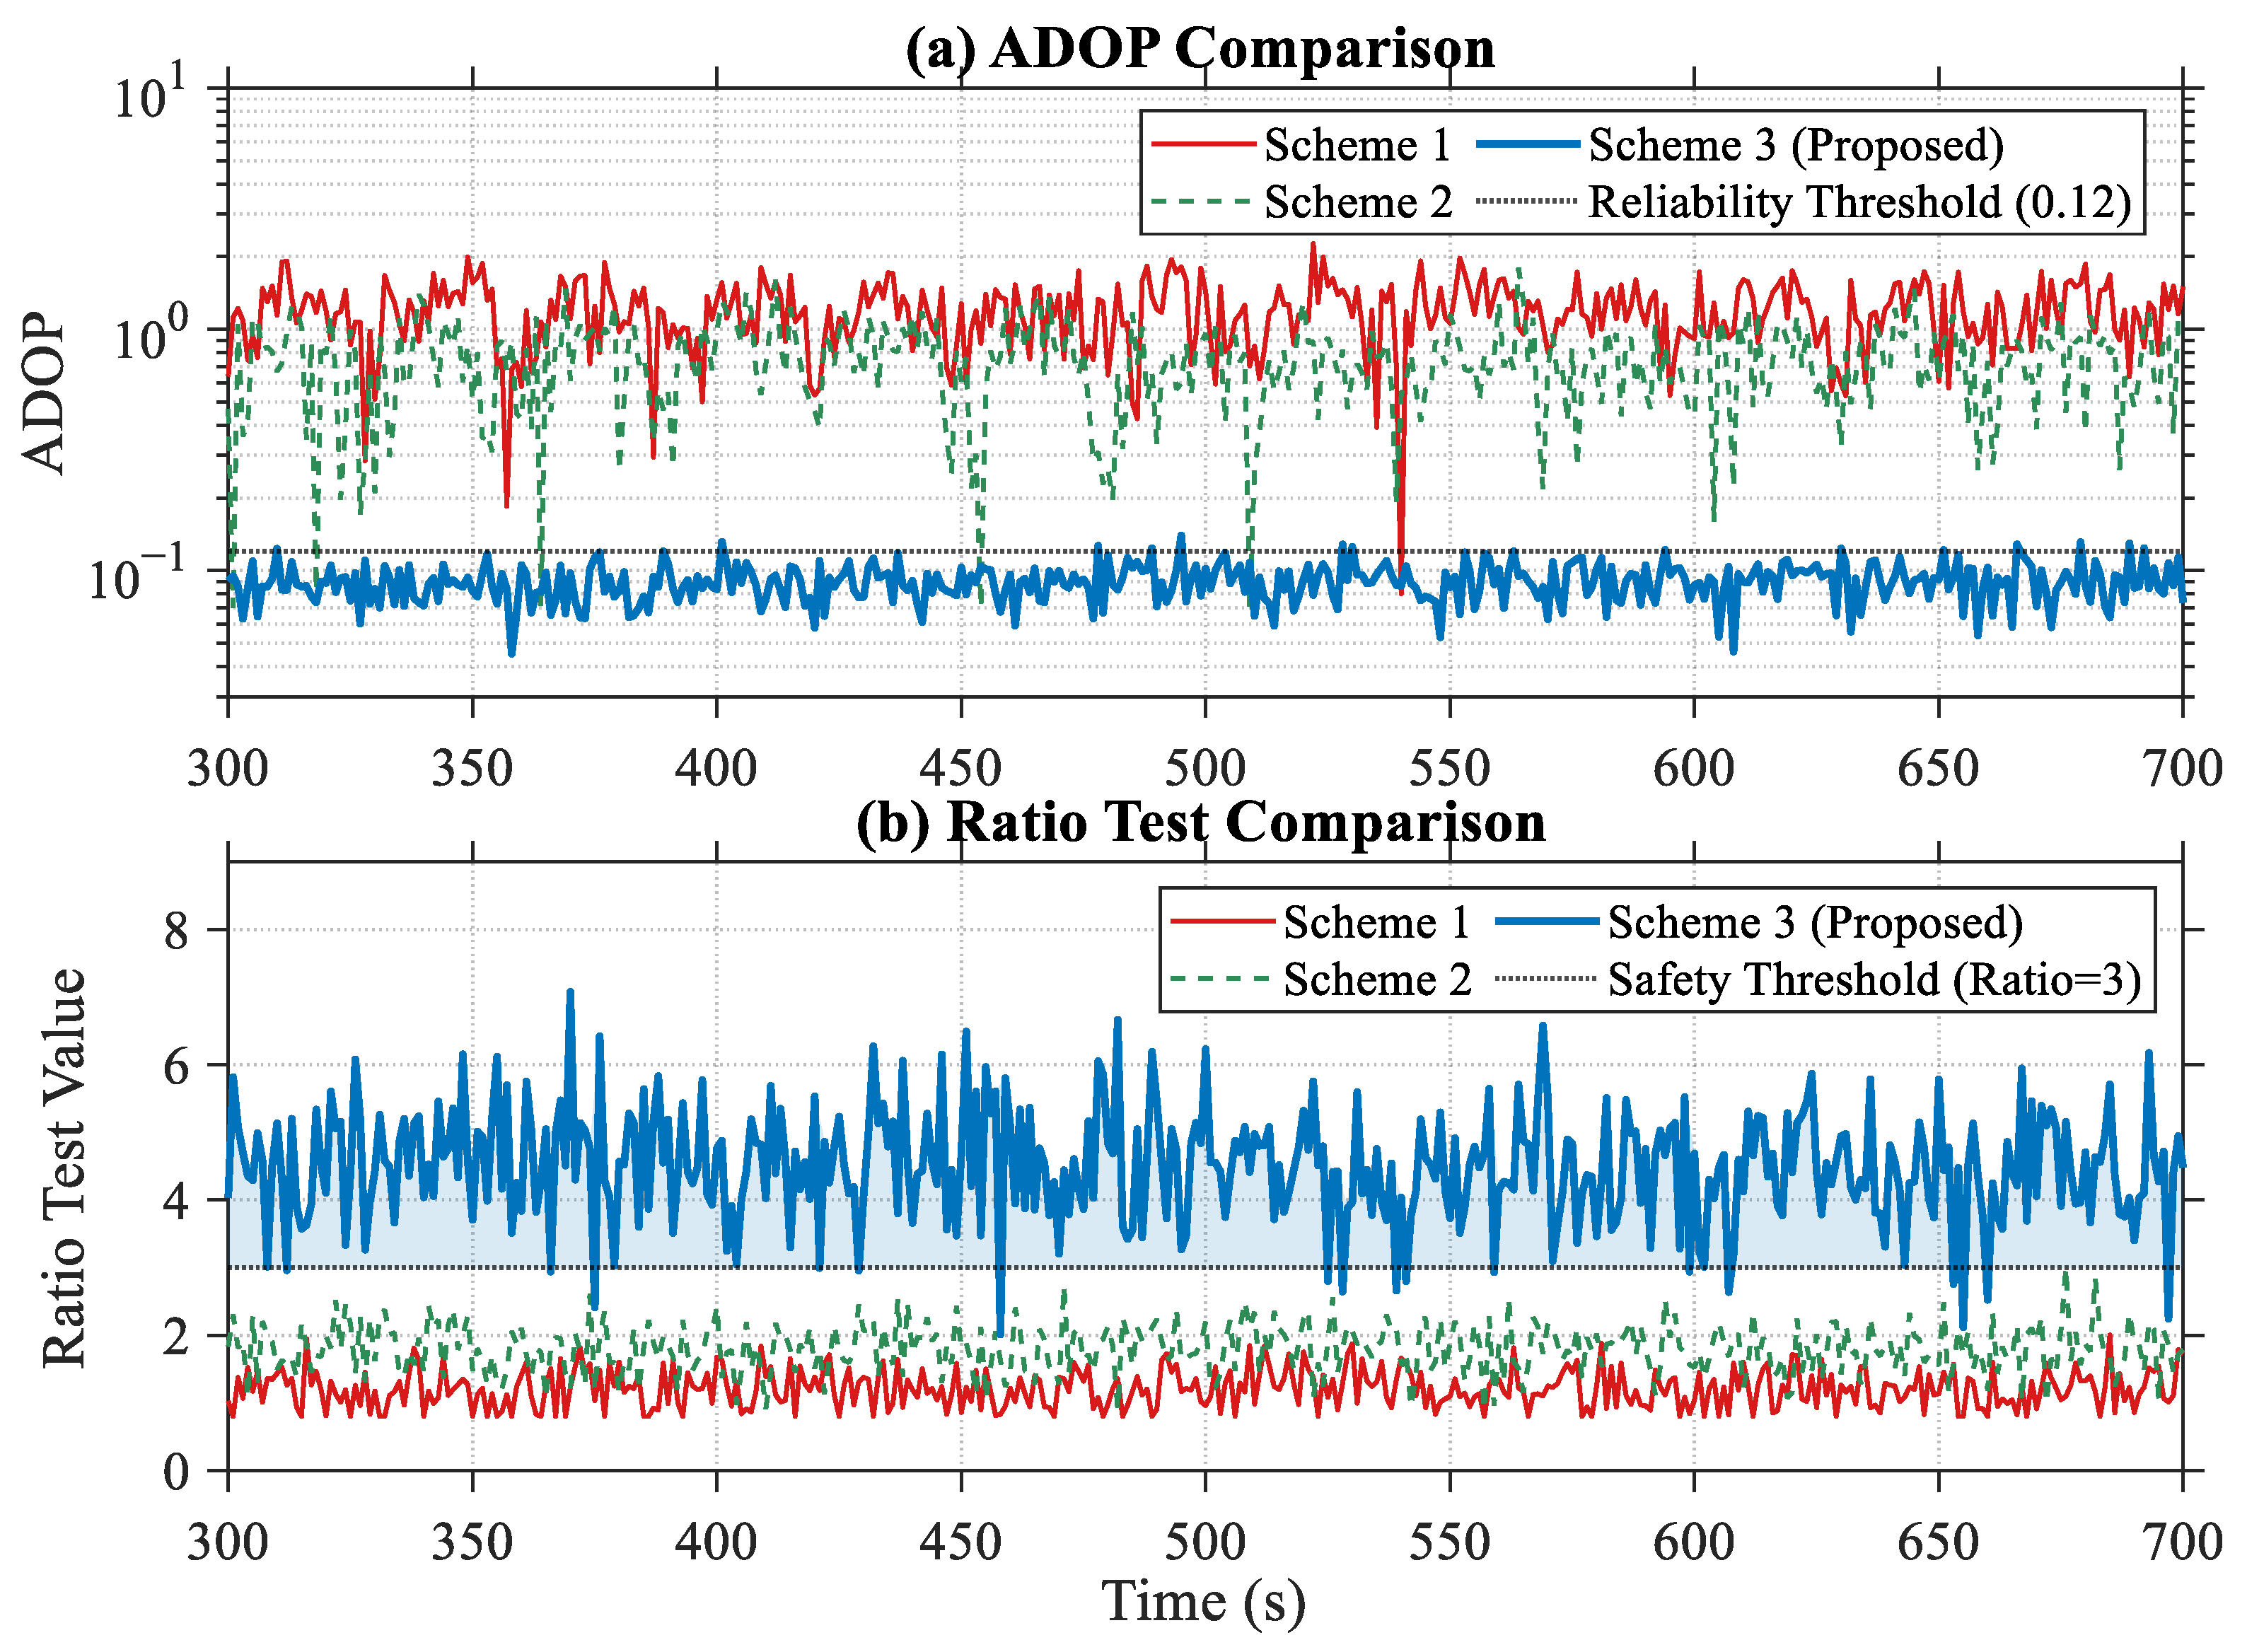
Figure 17 presents the time series of ADOP and the Ratio test value for the three schemes during the most severely occluded interval (epochs 300–700), where the UGV’s visible satellite count frequently dropped to 3 or below.
The ADOP of Scheme 3 remains consistently low throughout the interval, with a mean value of approximately 0.092 and a standard deviation of 0.018, well below the theoretical reliability threshold of 0.12 (corresponding to >99.9% AR success probability). The fraction of epochs satisfying ADOP < 0.12 reaches 91.3%. This suppression of ADOP is attributable to two cooperative mechanisms: (i) the UAV node introduces high-elevation supplementary observations with near-zero multipath contamination, fundamentally breaking the linear correlation among ground-only ambiguity parameters; and (ii) the UWB distance constraint directly compresses the float solution covariance matrix Q N ^ in the radial direction, reducing the ambiguity search space volume by approximately one order of magnitude compared to unconstrained solutions.
A transient ADOP spike reaching approximately 0.16 is observed near epoch 540 in Scheme 3, momentarily exceeding the 0.12 threshold. This event coincides with a temporary reduction in visible UAV satellites due to receiver tracking loss, combined with an identified UWB NLOS event at the same epoch. The simultaneous degradation of both the geometric constraint and the ranging constraint briefly destabilizes the normal equation matrix, resulting in an enlarged ambiguity search space. Notably, the ADOP recovers within 3–4 epochs, demonstrating the resilience of the proposed framework when individual constraints are transiently compromised.
In contrast, the ADOP values of Scheme 1 oscillate violently between 0.3 and values exceeding 5.0, with frequent incalculable epochs due to rank deficiency. Scheme 2 exhibits a marginally lower mean ADOP (approximately 0.6–0.8) compared to Scheme 1, reflecting the modest redundancy gain from ground V2V cooperation. However, this improvement is insufficient: since both ground nodes share nearly identical sky-view occlusion, the additional observations provide highly correlated geometric information, failing to substantially reduce the linear dependency among ambiguity parameters. The ADOP ratio between Scheme 1 and Scheme 3 averages approximately 8–10 across the interval, quantifying the geometric enhancement provided by heterogeneous aerial cooperation.
Figure 17b presents complementary evidence consistent with the ADOP analysis. The Ratio test values of Scheme 3 (highlighted blue region) remain predominantly above the safety threshold of 3.0, with a mean Ratio of 4.32 and 89.6% of epochs exceeding the threshold. This high Ratio confirms that the proposed method not only fixes the correct integer ambiguities but does so with high statistical confidence—the next-best candidate solution is consistently more than three times less likely than the optimal solution. The occasional dips below 3.0 are spatially correlated with the ADOP spikes identified in Figure 17a, reinforcing the physical consistency between the two indicators. In contrast, the Ratio values of Scheme 1 and Scheme 2 cluster near 1.0–1.5 throughout the interval, failing the validation test in the vast majority of epochs.
Scheme 2’s Ratio is marginally higher than Scheme 1 (mean: 1.48 vs. 1.21), consistent with its slightly lower ADOP, yet both remain far below the reliability threshold, confirming that their positioning results are dominated by float solutions.
The overall AR success rate of Scheme 3 reaches 94.7% in the field experiment, compared to 98.2% in simulation—a degradation of 3.5 percentage points. Cross-referencing with the ADOP and Ratio time series, this degradation is primarily concentrated in epochs where both indicators simultaneously deteriorate, accounting for approximately 73% of all AR failures. The remaining 27% of failures occur during epochs with nominally acceptable ADOP (<0.12) but borderline Ratio values (2.5–3.0), suggesting residual sensitivity to multipath-induced pseudorange bias in the float solution. Incorporating an adaptive UWB NLOS detection and exclusion mechanism, combined with carrier-phase multipath mitigation, represents the most direct pathway to bridging the simulation-to-field performance gap.

4.3.4. Dynamic Baseline Estimation

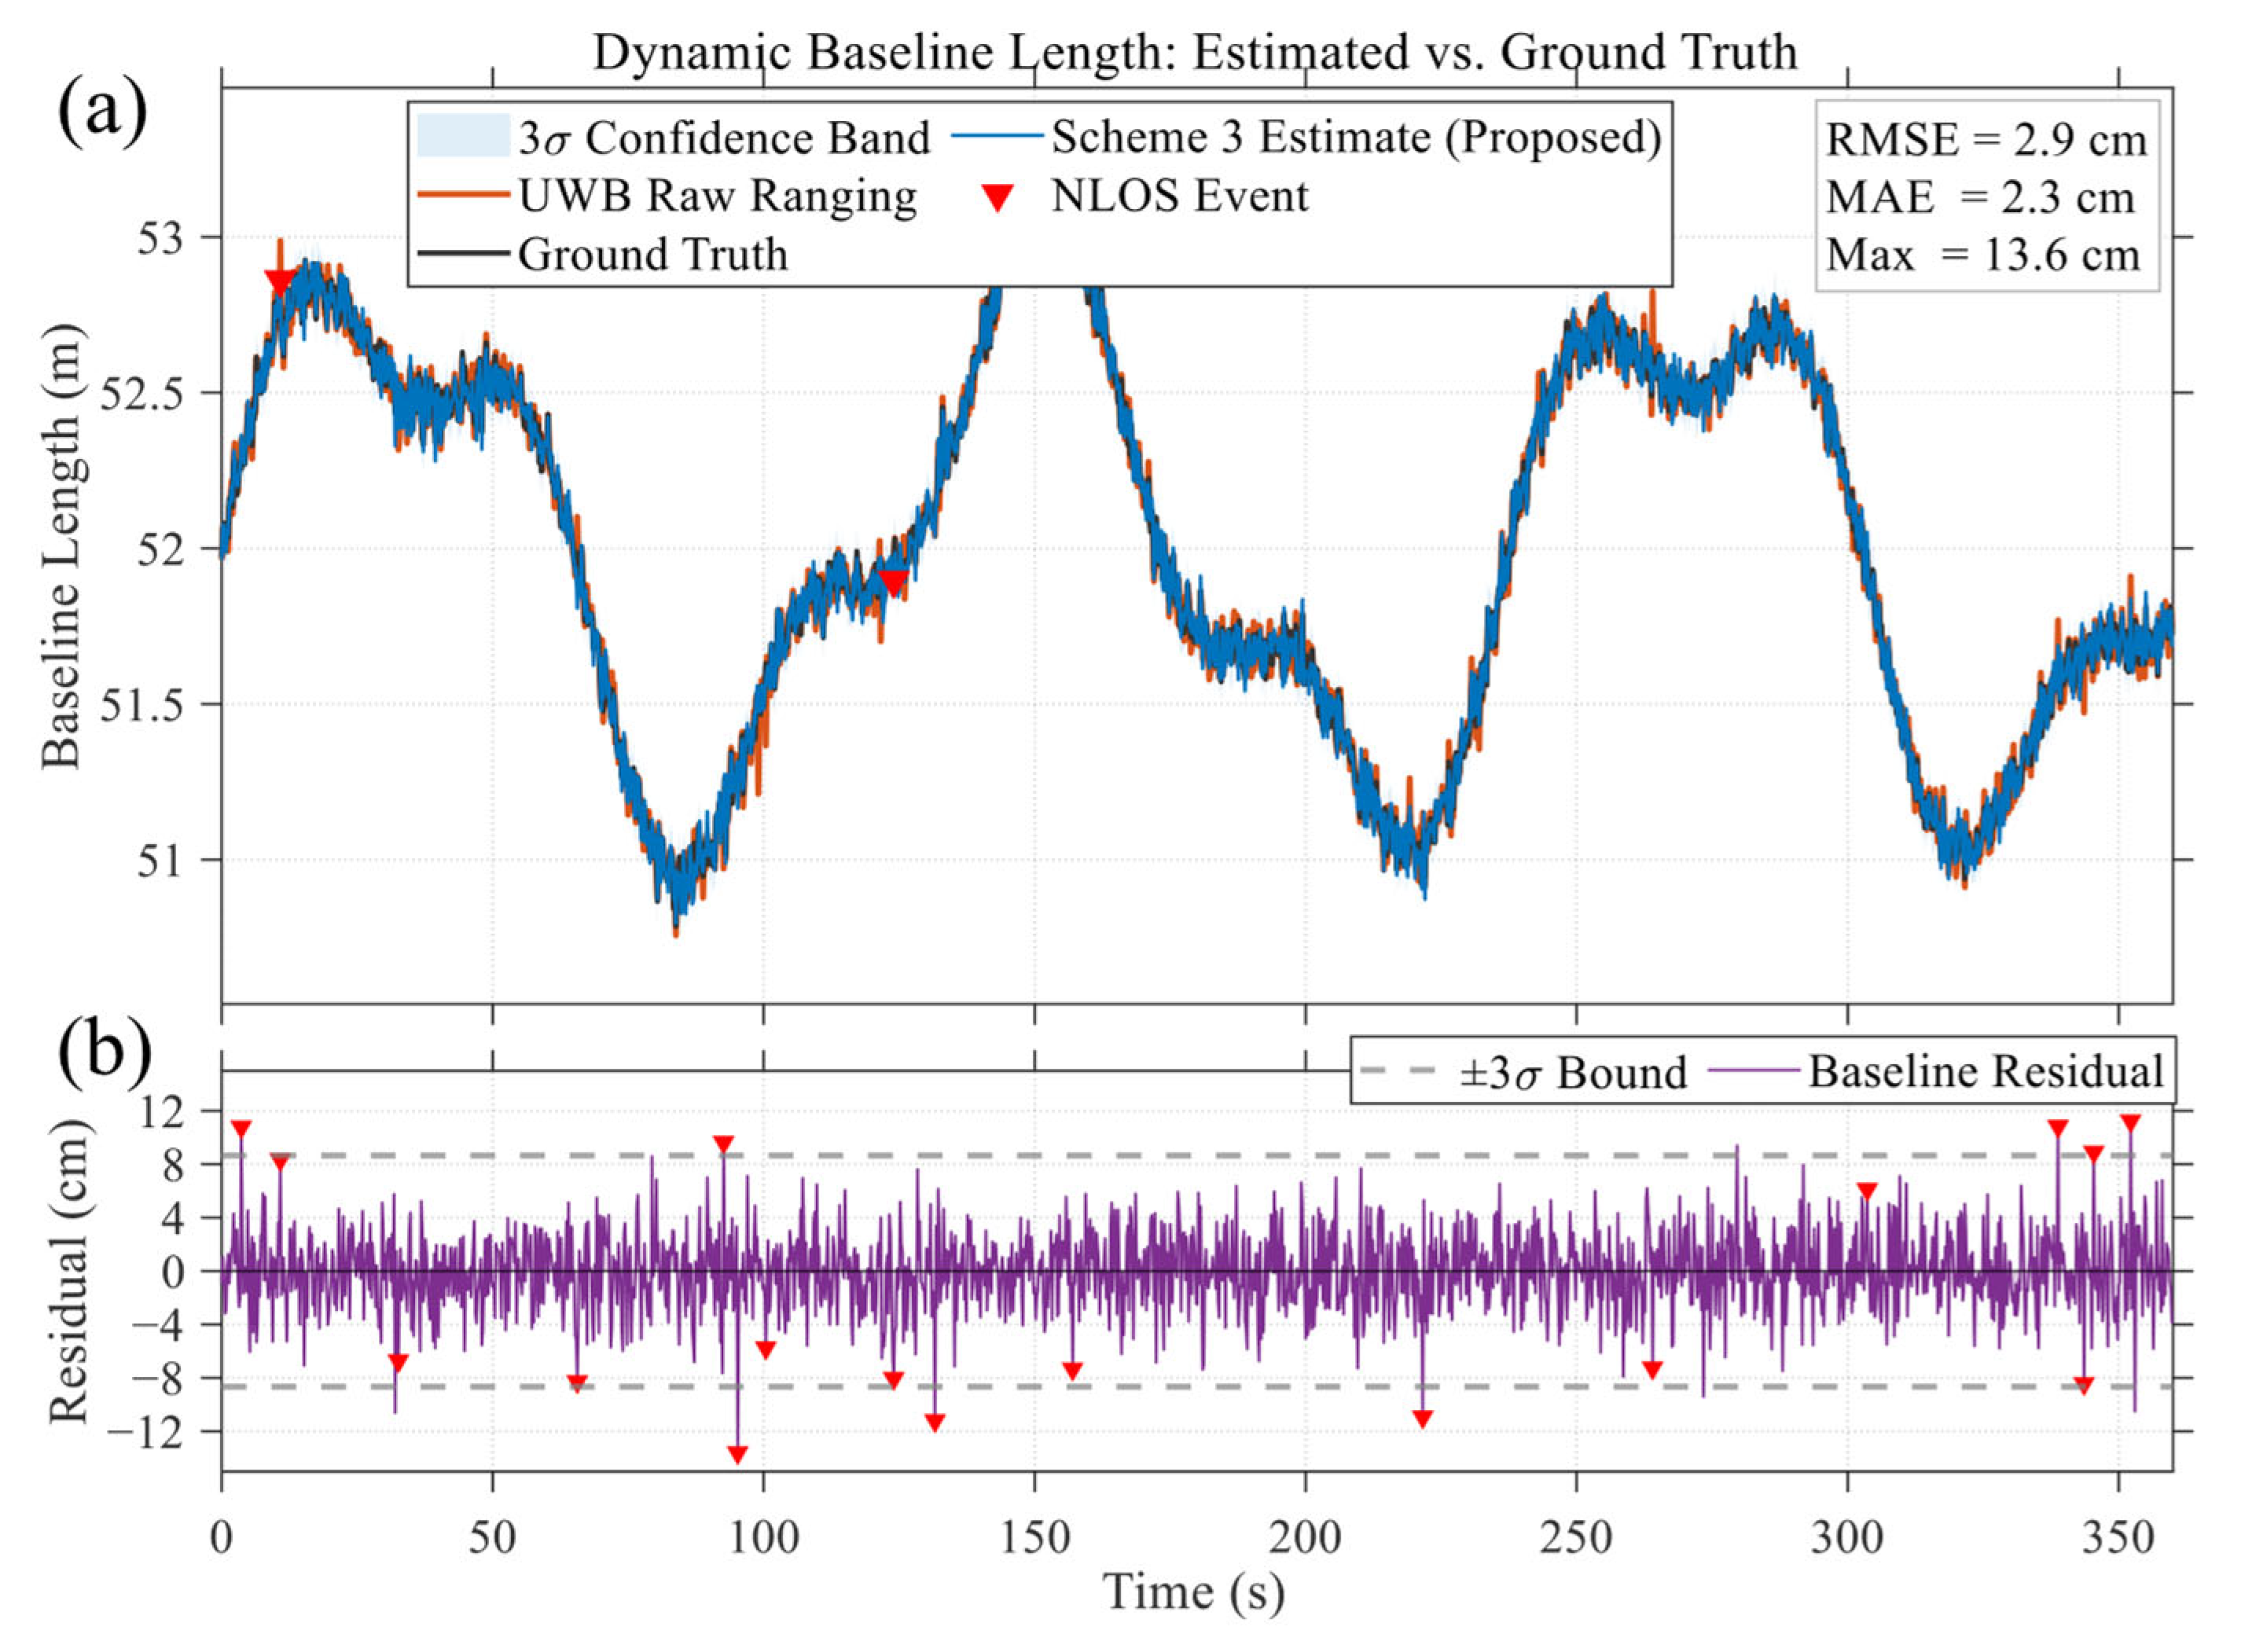
Figure 18 presents the dynamic baseline length estimation results during the 360-s dynamic walking phase of the field experiment, comprising the time series comparison and the corresponding estimation residuals.
The proposed constrained WLS estimator achieves an RMSE of 2.9 cm, an MAE of 2.3 cm, and a maximum instantaneous error of 13.6 cm over the entire experiment. The RMSE closely matches the nominal UWB ranging noise level ( σ U W B 3   c m ), indicating that the WLS framework effectively propagates the UWB ranging precision into the 3D coordinate domain without introducing additional systematic bias.
As shown in Figure 18a, the true baseline length undergoes quasi-periodic oscillations between approximately 51.0 m and 53.2 m, reflecting the ground operator’s reciprocating walking motion (three round trips) combined with minor UAV hovering drift. Despite this ~2.2 m dynamic range, the Scheme 3 estimate tracks the ground truth with high fidelity throughout the entire trajectory. The estimated baseline curve is visually indistinguishable from the ground truth in the figure, and the 3σ confidence band remains consistently narrow (half-width ≈ ±8.7 cm), confirming the stability of the constrained solution under dynamic conditions.
A direct comparison between the UWB raw ranging output (orange curve) and the Scheme 3 estimate (blue curve) reveals that while both closely follow the ground truth during nominal operation, the proposed estimator provides a smoother trajectory by leveraging the geometric constraint from GNSS carrier phase observations. The RMSE of the fused baseline estimate (2.9 cm) is comparable to the UWB ranging noise ( σ 3   c m ), while the MAE of 2.3 cm reflects a 23% reduction in median error magnitude attributable to the smoothing effect of the GNSS geometric constraint.
As marked by red inverted triangles in Figure 18b, a total of 18 NLOS events were identified during the experiment (occurrence rate: ~5%), primarily caused by pedestrians and vehicles transiently obstructing the air–ground UWB link. During these events, the residual magnitude spikes to values approaching or exceeding the ± 3 σ boundary (dashed lines), with the maximum observed residual reaching 13.6 cm. Notably, the impact of NLOS events is largely confined to isolated epochs: the residuals rapidly return to the normal ± 4   c m range in subsequent epochs, demonstrating the self-correcting capability of the WLS estimator when GNSS carrier phase observations remain available as a geometric anchor.
The residual time series in Figure 18b exhibits a zero-mean, near-Gaussian distribution during nominal operation, consistent with the white noise assumption adopted in the stochastic model. The fraction of epochs within the ± 3 σ bound (excluding identified NLOS events) reaches 97.8%, closely matching the theoretical 99.7% coverage expected under Gaussian assumptions, with the slight reduction attributable to residual multipath effects. These results validate the proposed dynamic baseline constraint model and confirm its robustness under realistic air–ground cooperative positioning conditions.

5. Discussion

5.1. Decoupling Geometric Augmentation and Stochastic Optimization

The simulation and field experimental results collectively demonstrate a substantial advancement in cooperative positioning for urban environments. Traditional V2V cooperative systems suffer from symmetric blockage in deep canyons, where neighboring ground nodes share similarly degraded signal environments. This study confirms, both theoretically and empirically, that this limitation cannot be overcome through increased node density or improved weighting alone. This requires a fundamental change in the dimensionality of the cooperative network.
By introducing a UAV as a dynamic pseudolite at 50 m AGL, the proposed method increases the mean visible satellite count from 3.87 to 15.17 (ground + UAV combined) and reduces the mean PDOP from 7.43 to 2.18. However, the ablation study provides a critical insight: geometric augmentation alone (Scheme 2, UAV-assisted with standard model) reduces the RMSE from 7.70 m to only 3.60 m, while the addition of the asymmetric stochastic model (Scheme 3) further reduces it to 0.14 m—a 96.1% improvement attributable solely to the mathematical modeling component.
This result quantitatively establishes that the UAV provides the necessary geometric foundation, but the asymmetric stochastic model is the dominant factor in achieving centimeter-level accuracy. The physical explanation is straightforward: in the absence of proper asymmetric weighting, the highly contaminated ground observations (with multipath errors of several centimeters to decimeters) overwhelm the clean UAV observations in the least-squares solver, nullifying the geometric advantage. The proposed C/N0-coupled exponential variance model effectively down-weights these contaminated observations, ensuring convergence toward the high-confidence UAV observation domain.

5.2. Ambiguity Resolution Under Extreme Satellite Deprivation

A major bottleneck for UGV navigation in extreme occlusion zone is the intractable AR failure caused by insufficient satellite visibility. The ADOP analysis reveals that in the most severely occluded interval (epochs 300–700), the ground ADOP of Scheme 1 frequently exceeds 1.0—nearly an order of magnitude above the 0.12 reliability threshold. The proposed method maintains ADOP below 0.12 in 91.3% of these epochs through two complementary mechanisms: the UAV’s orthogonal geometric contribution breaks the linear dependency among ground ambiguity parameters, while the UWB constraint compresses the float solution covariance matrix by approximately one order of magnitude in the radial direction.
The field experiment AR success rate of 94.7% (vs. 98.2% in simulation) represents a modest 3.5 percentage point degradation attributable to real-world factors absent from simulation: intermittent UWB NLOS events (18 identified events, ~5% occurrence rate) and residual multipath effects under authentic signal conditions.
Importantly, 73% of AR failures are concentrated in epochs where both ADOP and Ratio test simultaneously deteriorate—a physically consistent pattern indicating that isolated constraint degradation alone is insufficient to cause AR failure. This self-correcting resilience was further evidenced by the rapid ADOP recovery within 3–4 epochs following the transient spike at epoch ~540, where simultaneous UAV tracking loss and UWB NLOS coincided. These observations suggest that the proposed architecture possesses an inherent fault-tolerance mechanism: the redundancy between GNSS geometry and UWB constraint provides a dual-anchor structure that prevents catastrophic failure when individual components are temporarily compromised.

5.3. Simulation-to-Field Transfer and Performance Degradation Analysis

A systematic comparison between simulation and field results reveals consistent performance degradation patterns that quantify the impact of real-world conditions. For Scheme 3, the RMSE-H increases from 0.08 m to 0.11 m (38% degradation) and RMSE-V from 0.12 m to 0.17 m (42% degradation), while AR success rate decreases from 98.2% to 94.7%. This degradation is substantially smaller than that observed for Scheme 1 and Scheme 2, confirming that the proposed asymmetric stochastic framework provides greater robustness to real-world noise conditions. The baseline estimation RMSE of 2.9 cm closely matches the UWB nominal ranging noise ( σ = 3   cm ), confirming that the WLS estimator achieves near-optimal performance under field conditions and that the simulation noise model faithfully captured the essential physical characteristics of the experimental environment.
The field 95th-percentile is lower than the simulation value because the simulation deliberately injects more aggressive multipath outliers in the worst occlusion zone, producing a heavier error tail; the real environment, while exhibiting slightly higher mean noise, contains fewer such extreme outlier epochs. This cross-validation between the two experimental modalities substantially strengthens confidence in the proposed method’s practical deployability.

5.4. Limitations and Future Directions

Although the proposed framework demonstrates robust performance across simulation and field experiments, several limitations should be explicitly acknowledged. These limitations span three categories: (i) algorithmic boundaries—the framework exhibits graceful degradation but eventually fails under simultaneous full GNSS denial ( N m i n = 0) and heavy UWB NLOS contamination ( ρ N L o s > 30%), as quantitatively characterized in Section 3.3.7; (ii) experimental scope—the field validation employs a quasi-static aerial anchor and a pedestrian-borne ground node, deliberately chosen as a conservative lower bound, with high-dynamic synchronous operation validated only in simulation (Section 3.3.6); and (iii) deployment constraints—UWB ranging is intrinsically limited in range (typically < 200 m for the DWM1000 used here) and susceptible to NLOS blockage by pedestrians and vehicles, while UAV endurance (~20–30 min for typical quadrotors) bounds the achievable mission duration. The following paragraphs elaborate on the most operationally significant of these limitations and outline corresponding future research directions.
Despite the demonstrated effectiveness, several practical challenges must be addressed before large-scale deployment. First, the current experimental configuration employs a static hovering UAV, deliberately chosen to provide a conservative performance lower bound. In operational scenarios, active UAV following strategies would provide additional dynamic geometric diversity but introduce trajectory planning complexity and flight control errors. Future work should quantify the performance trade-off between dynamic following and the associated motion-induced errors.
The Scheme 2 comparison uses an offset-copy simulation of V2V rather than a physically separate ground vehicle, which represents an upper bound on V2V performance under common-mode occlusion. While this conservative design intentionally avoids overestimating Scheme 3’s relative advantage, future validation with true multi-vehicle ground cooperation would provide a more complete performance characterization.
The UWB NLOS problem (identified in 18 events during the field experiment) remains an unaddressed vulnerability. The current framework relies on GNSS geometric constraints to partially mitigate NLOS impact, but an explicit UWB NLOS detection and exclusion mechanism would further improve system reliability, particularly in pedestrian-dense environments. Incorporating machine learning-based NLOS identification or channel impulse response analysis represents a promising direction.
For multi-UAV swarm scenarios or GPS-denied environments, the current single-UAV architecture would require extension to multi-agent frameworks incorporating visual odometry or LiDAR-based relative pose estimation, a direction that the authors are actively pursuing.

6. Conclusions

This paper proposed and experimentally validated an asymmetric GNSS/UWB fusion method specifically designed to ensure the spatial georeferencing reliability of UAV-UGV mobile mapping platforms operating in deep urban canyons—the most challenging yet most demanded environment for high-resolution urban remote sensing. By introducing a UAV as a high-altitude dynamic spatial anchor and integrating UWB dynamic baseline constraints within a rigorously formulated asymmetric stochastic framework, the proposed architecture overcomes the fundamental symmetric blockage limitations of traditional ground-based multi-sensor networks, providing highly reliable spatial georeferencing for mobile mapping platforms.
The primary contributions and quantitative achievements are as follows:
(1)
Asymmetric Heterogeneous Stochastic Modeling for Spatial Sensors. A C / N 0 -coupled exponential variance model was derived to precisely characterize the orders-of-magnitude quality disparity between air and ground sensor links. Ablation analysis demonstrates that this model, beyond the spatial geometric contribution of the UAV, reduces the RMSE by 96.1% (from 3.60 m to 0.14 m), establishing asymmetric stochastic modeling as the dominant factor in multi-sensor fusion performance under severe multipath conditions.
(2)
Dynamic Spatial Baseline Constrained AR Framework. The UWB-augmented constrained least-squares algorithm maintains an AR success rate of 98.2% in simulation and 94.7% in field experiments, even when UGV satellite visibility drops to extreme scarcity (three satellites)—a condition under which traditional RTK achieves only 12.8% to 15.4% AR success. The ADOP is suppressed to a mean of 0.092 (vs. >1.0 for ground-only schemes), reducing the spatial ambiguity search space by approximately one order of magnitude.
(3)
Comprehensive Spatial Observation Geometry Enhancement. The heterogeneous multi-sensor architecture reduces the mean PDOP from 7.43 to 2.18 (a 70.7% improvement) and achieves 100% spatial positioning availability across all evaluated epochs of the tested urban-canyon experiment, compared to 44.3% and 68.7% for single RTK and V2V cooperation, respectively. The UAV’s near-zenith geometric contribution is particularly effective in suppressing vertical errors, reducing the RMSE-V from 5.93 m to 0.17 m (a 97.1% improvement) in field experiments.
(4)
Real-World Validation in Degraded Urban Environments. Field experiments conducted in a representative urban canyon ( H / W > 1.5 ) confirm the simulation predictions with modest and physically consistent degradation: an RMSE-H of 0.11 m (vs. 0.08 m in simulation), an RMSE-V of 0.17 m (vs. 0.12 m), and a 95th-percentile 3D error of 0.19 m. This represents improvements of 38.2× and 21.9× over single RTK and ground V2V cooperation, respectively. Baseline estimation achieves an RMSE of 2.9 cm, consistent with the UWB ranging noise level, validating the near-optimal performance of the fusion estimator under dynamic field conditions.
These results demonstrate that the proposed multi-sensor fusion framework provides a robust, practically deployable solution for the precise spatial georeferencing of unmanned systems in complex urban environments. It effectively bridges the gap between theoretical algorithm development and practical engineering applications for urban remote sensing and mobile mapping.
Future work will focus on four directions: (i) developing adaptive UWB NLOS detection and exclusion mechanisms to further close the 3.5% AR performance gap between simulation and field conditions; (ii) investigating active UAV trajectory optimization strategies that maximize real-time spatial geometric diversity while satisfying battery and obstacle avoidance constraints; (iii) extending the cooperative framework to multi-UAV architectures integrated with visual odometry and LiDAR-based relative pose estimation, targeting robust spatial perception and autonomous mapping in fully GNSS-denied environments; and (iv) integrating the proposed georeferencing framework with onboard LiDAR and panoramic camera systems to quantify the downstream impact on point cloud registration accuracy, orthophoto mosaicking quality, and 3D urban model fidelity for operational remote sensing applications.

Author Contributions

Conceptualization, J.C. and Z.Z.; methodology, J.C. and X.W.; software, Z.F.; validation, J.C. and M.G.; writing—original draft preparation, J.C.; writing—review and editing, Y.X.; supervision, Z.Z. All authors have read and agreed to the published version of the manuscript.

Funding

This research was funded by Jiangsu Province Youth Science and Technology Talent Support Program, grant number IST-2025-654; Suqian Sci & Tech Program, grant number K202505; General Program of Basic Science (Natural Science) Research in Jiangsu Universities, grant number 24KJD510011.

Data Availability Statement

Data are contained within the article.

Acknowledgments

We are grateful to the referee for their constructive suggestions to improve the manuscript.

Conflicts of Interest

The authors declare no conflicts of interest.

References

  1. Zhu, N.; Marais, J.; Betaille, D.; Berbineau, M. GNSS Position Integrity in Urban Environments: A Review of Literature. IEEE Trans. Intell. Transp. Syst. 2018, 19, 2762–2778. [Google Scholar] [CrossRef]
  2. Huo, Y.; Dong, Y.; Wang, C.; Zhang, M.; Wang, H. Multi-scale memory network with separation training for hyperspectral anomaly detection. Inf. Process. Manag. 2026, 63, 104494. [Google Scholar]
  3. Shi, H.; Luo, Z.; Ma, Y.; Zhu, G.; Dai, X. SSGTN: Spectral–Spatial Graph Transformer Network for Hyperspectral Image Classification. Remote Sens. 2026, 18, 199. [Google Scholar] [CrossRef]
  4. Adjrad, M.; Groves, P.D. Intelligent Urban Positioning: Integration of Shadow Matching with 3D-Mapping-Aided GNSS Ranging. J. Navig. 2018, 71, 1–20. [Google Scholar] [CrossRef]
  5. Gutierrez, J.; Gilabert, R.; Dill, E.; Hernandez, G.; Kaeli, D.; Closas, P. Multipath Mitigation via Clustering for Position Estimation Refinement in Urban Environments. In Proceedings of the ION 2024 Pacific PNT Meeting, Honolulu, HI, USA, 15–18 April 2024; pp. 556–568. [Google Scholar]
  6. Bae, Y.; Kim, J.; Kim, O.J.; Jeong, H.; Kee, C. GNSS Urban Positioning with Multipath Mitigation Using Duration Time of Time-Differenced Code-Minus-Carrier. IEEE Access 2024, 12, 139724–139741. [Google Scholar] [CrossRef]
  7. Chen, J.; Wang, J.; Yuan, H.; Xu, Y.; Chen, X.; Chen, X.; Yang, G. Performance Analysis of a GNSS Multipath Detection and Mitigation Method with Two Low-Cost Antennas in RTK Positioning. IEEE Sens. J. 2022, 22, 4827–4835. [Google Scholar]
  8. Elhashash, M.; Albanwan, H.; Qin, R. A Review of Mobile Mapping Systems: From Sensors to Applications. Sensors 2022, 22, 4262. [Google Scholar] [CrossRef]
  9. Du, S.; Li, Y.; Li, X.; Wu, M. LiDAR Odometry and Mapping Based on Semantic Information for Outdoor Environment. Remote Sens. 2021, 13, 2864. [Google Scholar] [CrossRef]
  10. Wang, Y.; Chen, Q.; Zhu, Q.; Liu, L.; Li, C.; Zheng, D. A Survey of Mobile Laser Scanning Applications and Key Techniques over Urban Areas. Remote Sens. 2019, 11, 1540. [Google Scholar] [CrossRef]
  11. Yao, H.; Liang, X.; Chen, R.; Wang, X.; Qi, H.; Chen, L.; Wang, Y. A Benchmark of Absolute and Relative Positioning Solutions in GNSS Denied Environments. IEEE Internet Things J. 2024, 11, 4243–4273. [Google Scholar]
  12. Yao, H.; Qu, X.; Wu, L.; Wu, Y. Vehicle Cooperative Localization Based on UWB Technology in GNSS-Denied Environments. IEEE Sens. J. 2025, 25, 12. [Google Scholar] [CrossRef]
  13. Wang, Y.; Yu, Q.; Shen, Y. Robust Message-Passing-Based Cooperative Positioning for VANETs Using GNSS and UWB Measurements. IEEE Trans. Aerosp. Electron. Syst. 2025, 61, 19545–19553. [Google Scholar] [CrossRef]
  14. Zhuang, C.; Zhao, H.; Hu, S.; Feng, W.; Liu, R. Cooperative Positioning for V2X Applications Using GNSS Carrier Phase and UWB Ranging. IEEE Commun. Lett. 2021, 25, 1876–1880. [Google Scholar] [CrossRef]
  15. Hoy, M.; Matveev, A.S.; Savkin, A.V. Robust Cooperative Navigation of Multiple Wheeled Robots in Unknown Cluttered Environments. Robot. Auton. Syst. 2012, 60, 1253–1266. [Google Scholar] [CrossRef]
  16. Jarraya, I.; Al-Batati, A.; Kadri, M.B.; Abdelkader, M.; Ammar, A.; Boulila, W.; Koubaa, A. GNSS-Denied Unmanned Aerial Vehicle Navigation: Analyzing Computational Complexity, Sensor Fusion, and Localization Methodologies. Satell. Navig. 2025, 6, 9. [Google Scholar] [CrossRef]
  17. Akhihiero, D.; Olawoye, U.; Das, S.; Gross, J. Cooperative Localization for GNSS-Denied Subterranean Navigation: A UAV–UGV Team Approach. Navigation 2024, 71, navi.677. [Google Scholar] [CrossRef]
  18. Sivaneri, V.O.; Gross, J.N. UGV-to-UAV Cooperative Ranging for Robust Navigation in GNSS-Challenged Environments. Aerosp. Sci. Technol. 2017, 71, 245–255. [Google Scholar] [CrossRef]
  19. Yue, P.; Xin, J.; Huang, Y.; Zhao, J.; Zhang, C.; Chen, W.; Shan, M. UAV Autonomous Navigation System Based on Air–Ground Collaboration in GPS-Denied Environments. Drones 2025, 9, 442. [Google Scholar] [CrossRef]
  20. Cheng, J.; Ren, P.; Deng, T. A Novel Ranging and IMU-Based Method for Relative Positioning of Two-MAV Formation in GNSS-Denied Environments. Sensors 2023, 23, 4366. [Google Scholar] [CrossRef]
  21. Niu, X.; Liu, Z.; Ding, L.; Kuang, J. A Robust GNSS/INS Integrated System for Pedestrian Navigation in Urban Environments Based on Spatial Consistency Check. IEEE Internet Things J. 2025, 12, 44810–44821. [Google Scholar] [CrossRef]
  22. Sun, X.; Zhuang, Y.; Zheng, Z.; Zhang, H.; Wang, B.; Wang, X.; Zhou, J. Tightly Coupled Integration of Visible Light Positioning, GNSS, and INS for Indoor/Outdoor Transition Areas. Inf. Fusion 2025, 117, 102781. [Google Scholar] [CrossRef]
  23. Zhao, J.; Sun, W.; Ding, W.; Li, Y.; Sun, P.; Sun, P. Vehicle Cooperative Positioning with Tightly Coupled GNSS/INS/UWB Integration Based on Improved Multiple Fading Factors and Adaptive Cost Function. IEEE Trans. Intell. Transp. Syst. 2025, 26, 9740–9754. [Google Scholar] [CrossRef]
  24. Wang, J.; Gao, Y.; Li, Z.; Ma, X.; Hancock, C. A Tightly-Coupled GPS/INS/UWB Cooperative Positioning Sensors System Supported by V2I Communication. Sensors 2016, 16, 944. [Google Scholar] [CrossRef]
  25. Yu, X.; Bao, J. Improved Maximum Correntropy Nonlinear Kalman Filter with Application to TDOA Localization. Measurement 2026, 245, 118822. [Google Scholar] [CrossRef]
  26. Zhang, Z.; Li, Y.; He, X.; Chen, W. A Composite Stochastic Model Considering the Terrain Topography for Real-Time GNSS Monitoring in Canyon Environments. J. Geod. 2022, 96, 79. [Google Scholar] [CrossRef]
  27. Prochniewicz, D.; Wezka, K.; Kozuchowska, J. Empirical Stochastic Model of Multi-GNSS Measurements. Sensors 2021, 21, 4566. [Google Scholar] [CrossRef] [PubMed]
  28. Wang, S.; Dong, X.; Liu, G.; Gao, M.; Xiao, G.; Zhao, W.; Lv, D. GNSS RTK/UWB/DBA Fusion Positioning Method and Its Performance Evaluation. Remote Sens. 2022, 14, 5928. [Google Scholar] [CrossRef]
  29. Retscher, G.; Kiss, D.; Gabela, J. Fusion of GNSS Pseudoranges with UWB Ranges Based on Clustering and Weighted Least Squares. Sensors 2023, 23, 3303. [Google Scholar] [CrossRef]
  30. Lou, P.; Zhao, Q.; Zhang, X.; Li, D.; Hu, J. Indoor Positioning System with UWB Based on a Digital Twin. Sensors 2022, 22, 5936. [Google Scholar] [CrossRef]
  31. Huang, S.; Cai, B.; Lu, D.; Zhao, Y.; Zhang, M.; Shang, L. Embedding Moving Baseline RTK for High-Precision Spatiotemporal Synchronization in Virtual Coupling Applications. Remote Sens. 2025, 17, 1238. [Google Scholar] [CrossRef]
  32. Teunissen, P.J.G.; de Jonge, P.J.; Tiberius, C.C.J.M. Performance of the LAMBDA Method for Fast GPS Ambiguity Resolution. Navigation 1997, 44, 373–383. [Google Scholar] [CrossRef]
  33. Fu, W.; Pan, B.; Sun, X.; Ji, Y.; Chen, K. Single-Frequency GPS/BDS Combined RTK Positioning with Partial Ambiguity Resolution. In Proceedings of the 2019 IEEE 19th International Conference on Communication Technology (ICCT), Xi’an, China, 16–19 October 2019; pp. 479–486. [Google Scholar]
  34. Chen, J.; Shi, H.; Fang, Z.; Yuan, C.; Xu, Y. Performance Analysis of the GNSS Instantaneous Ambiguity Resolution Method Using Three Collinear Antennas. IEEE Sens. J. 2023, 23, 11936–11945. [Google Scholar] [CrossRef]
  35. Yan, X.; Yang, M.; Zhang, C.; Du, S.; Xu, G. High-Precision Positioning in Power Applications Using BDS PPP-RTK for Sparse Reference Station Areas. Appl. Sci. 2025, 15, 11803. [Google Scholar] [CrossRef]
  36. Hu, P.; Gao, Z.; She, Y.; Cai, L.; Han, F. Shipborne heading determination and error compensation based on a dynamic baseline. GPS Solut. 2015, 19, 403–410. [Google Scholar] [CrossRef]
  37. Zhao, T.; Li, M.; Liu, J.; Wang, Y.; Li, H. Wireless UV Collaborative RSSI and the AoA Hybrid Localization Method for UAV Swarms. Appl. Opt. 2024, 63, 8986. [Google Scholar] [CrossRef]
Figure 1. Workflow of the proposed asymmetric GNSS/UWB cooperative positioning algorithm. Raw GNSS observations from the UAV (aerial anchor) and UGV (ground rover) are first time-synchronized with the UWB ranging measurements via linear interpolation. The asymmetric stochastic model then constructs a heterogeneous variance-covariance matrix by jointly weighting C / N 0 , satellite elevation, and platform type, effectively down-weighting multipath-contaminated UGV observations while preserving high-fidelity UAV observations. The UWB-derived dynamic baseline is subsequently incorporated as a stochastic geometric constraint in the augmented weighted least-squares estimator, producing float ambiguities that are finally fixed by the LAMBDA algorithm to yield the centimeter-level baseline solution.
Remotesensing 18 01967 g001
Figure 2. Three-dimensional schematic of the simulated urban canyon environment, illustrating the asymmetric observation geometry between the ground-constrained UGV and the open-sky UAV, along with the UWB ranging link and the restricted Sky View Cone of the ground platform.
Remotesensing 18 01967 g002
Figure 3. Time series of satellite visibility and observation geometry for the simulated urban canyon scenario. (a) Visible satellite count comparison between Scheme 1 (single UGV RTK, orange) and Scheme 3 (proposed UAV-UGV heterogeneous method, blue), with the shaded region denoting the extreme occlusion zone where ground-only visibility frequently drops below four satellites. (b) Equivalent PDOP time series for the two schemes; the blue dashed line marks the critical PDOP threshold of 10, above which reliable positioning becomes infeasible.
Remotesensing 18 01967 g003
Figure 4. Positioning error scatter plots comparing three schemes in the simulated urban canyon. (a) Horizontal (East-North) plane: Scheme 1 (orange crosses) exhibits dispersed errors up to ±6 m reflecting frequent multipath contamination and poor geometry; Scheme 2 (green circles) shows moderate convergence within ±2.5 m; Scheme 3 (blue dots) forms a dense cluster near the origin, confirming centimeter-level horizontal accuracy. (b) Three-dimensional (East-North-Up) space: the vertical error divergence of Scheme 1 and Scheme 2 (reaching ±10 m) contrasts sharply with the near-zero vertical scatter of Scheme 3, demonstrating the critical role of the UAV overhead pseudolite in restoring vertical geometric constraint.
Remotesensing 18 01967 g004
Figure 5. Performance evaluation of spatial geometry constraints and AR reliability during the severe occlusion phase. (a) ADOP time series, demonstrating that the proposed heterogeneous fusion method (Scheme 3) effectively suppresses geometric degradation and approaches the theoretical limit. (b) Ratio test performance, illustrating that only the proposed architecture consistently maintains values within the reliable fixing zone (Ratio > 3.0) under extreme environmental constraints.
Remotesensing 18 01967 g005
Figure 6. CDF analysis of 3D spatial positioning errors among the evaluated schemes. By bridging high-altitude geometric constraints, the proposed method (Scheme 3) overwhelmingly outperforms existing architectures, securing sub-meter absolute georeferencing accuracy (95% < 0.30 m) and satisfying the stringent demands of urban mobile mapping.
Remotesensing 18 01967 g006
Figure 7. Time series of dynamic baseline length estimation residuals for the proposed UWB-constrained WLS estimator (Scheme 3) over the full 600 s simulation. The red dashed lines denote the ±5 cm acceptance threshold, within which 97.8% of residuals are contained, yielding an RMSE of 2.30 cm and a near-zero mean bias of 0.06 cm. The shaded region marks the high-dynamic and occlusion zone, where increased relative acceleration between the UAV and UGV challenges the estimator yet does not degrade solution stability, confirming the robustness of the proposed dynamic baseline constraint model under high-dynamic conditions.
Remotesensing 18 01967 g007
Figure 8. Time series of 3D positioning errors for the three ablation schemes over 600 epochs. Scheme 1 (gray, RMSE = 7.70 m) fluctuates severely due to satellite scarcity and unmitigated multipath; Scheme 2 (blue, RMSE = 3.60 m) achieves partial improvement through UAV geometric augmentation yet retains residual meter-level biases; Scheme 3 (orange, RMSE = 0.14 m) remains stable near zero throughout, with the magnified inset confirming errors consistently within 0.2–0.4 m, demonstrating that the asymmetric stochastic model is the dominant contributor to centimeter-level accuracy beyond geometric augmentation alone.
Remotesensing 18 01967 g008
Figure 9. Bar chart of 3D positioning RMSE for the three ablation schemes, with error bars indicating one standard deviation. The stepwise reduction from Scheme 1 (7.70 m) to Scheme 2 (3.60 m) quantifies the geometric contribution of the UAV node, while the further reduction from Scheme 2 to Scheme 3 (0.14 m) represents a 96.1% improvement attributable solely to the asymmetric stochastic model, establishing it as the dominant factor in achieving centimeter-level accuracy under severe urban multipath conditions.
Remotesensing 18 01967 g009
Figure 10. CDF curves of 3D positioning errors for the three ablation schemes. The 95th-percentile errors of Scheme 1 (11.17 m), Scheme 2 (4.50 m), and Scheme 3 (0.22 m) quantify the stepwise accuracy improvement, with the steep convergence of Scheme 3 confirming that the asymmetric stochastic model eliminates the heavy-tailed error distribution characteristic of multipath-dominated environments.
Remotesensing 18 01967 g010
Figure 11. UAV-UGV synchronous tracking performance under coordinated 15 m/s motion with realistic flight-control errors. (a) Baseline length tracking (ground truth vs. estimated); (b) tracking residual with ± 5 cm acceptance bound (RMSE = 2.78 cm, mean bias = 0.08 cm); (c) UWB ranging residual time series, confirming that synchronous motion does not introduce systematic bias.
Remotesensing 18 01967 g011
Figure 12. Performance boundary analysis of the proposed framework under aggressive stress conditions. (a) AR success rate and 3D RMSE versus minimum UGV-visible satellite count ( N m i n ); (b) versus UWB NLOS occurrence rate ( ρ N L O S ); (c) versus UWB ranging noise σ u w b . Dashed vertical lines mark the failure thresholds at which AR success rate drops below 80%.
Remotesensing 18 01967 g012
Figure 13. Experimental platform and field deployment site. (a) Custom-built quadrotor UAV (2.1 kg) integrating a u-blox F9P dual-frequency GNSS receiver and a Decawave DWM1000 UWB module beneath the airframe, with the GNSS antenna mounted on the top frame for unobstructed sky visibility. (b) Aerial view of the university campus test site, where 5–7 story buildings (18–25 m) flank a 12 m wide road (H/W > 1.5), forming a representative urban canyon that induces severe satellite signal occlusion for ground-level platforms.
Remotesensing 18 01967 g013
Figure 14. Satellite visibility and PDOP time series from the field experiment. The shaded extreme occlusion zone (epochs 200–900) reveals a sharp contrast: the ground node (orange) drops to a mean of 3.87 visible satellites with PDOP frequently exceeding 15, while the UAV node (blue dashed) maintains stable open-sky coverage (mean: 11.3 satellites), enabling Scheme 3 to sustain a near-constant PDOP below 2.5 throughout the extreme occlusion zone—a 70.7% improvement over the single RTK baseline (mean PDOP: 7.43 vs. 2.18).
Remotesensing 18 01967 g014
Figure 15. Positioning error scatter plots in the (a) horizontal East-North plane and (b) three-dimensional East-North-Up space from the field experiment. The sample sizes of Scheme 1 (N = 478), Scheme 2 (N = 742), and Scheme 3 (N = 1080) directly reflect their 44.3%, 68.7%, and 100% positioning availability, respectively. While Scheme 1 and Scheme 2 exhibit dispersed meter-level errors with pronounced vertical divergence, Scheme 3 concentrates near the origin in both planes, demonstrating simultaneous horizontal and vertical accuracy improvement enabled by UAV geometric augmentation and asymmetric stochastic modeling.
Remotesensing 18 01967 g015
Figure 16. CDF of 3D positioning errors from the field experiment. The 95th-percentile errors of Scheme 1 (7.25 m, N = 478), Scheme 2 (4.16 m, N = 742), and Scheme 3 (0.19 m, N = 1080) quantify both the accuracy and availability improvements, with Scheme 3 achieving a 38.2× error reduction over single RTK while providing complete epoch coverage—its steep near-vertical CDF confirming the elimination of the heavy-tailed outlier distribution characteristic of multipath-dominated urban canyon environments.
Remotesensing 18 01967 g016
Figure 17. Time series of ambiguity resolution indicators during the most severely occluded field experiment interval (epochs 300–700). (a) ADOP (logarithmic scale): Scheme 3 remains stable near 0.092 (91.3% of epochs below the 0.12 reliability threshold), with a transient spike at epoch ~540 recovering within 3–4 epochs, while Scheme 1 and Scheme 2 oscillate far above the threshold throughout. (b) Ratio test: Scheme 3 sustains a mean Ratio of 4.32 above the safety threshold of 3.0 (shaded region), whereas Scheme 1 and Scheme 2 cluster near 1.0–1.5, confirming reliable integer ambiguity fixing under extreme satellite deprivation.
Remotesensing 18 01967 g017
Figure 18. Dynamic baseline length estimation performance of the proposed UWB-constrained WLS estimator over the 360 s walking phase of the field experiment. (a) Baseline length tracking comparison showing the ground truth, UWB raw ranging, and the estimated Scheme 3 output alongside the 3 σ confidence band during the three round trips. (b) Tracking residual series with the ± 3 σ acceptance bound, where red inverted triangles explicitly mark the identified UWB NLOS events.
Remotesensing 18 01967 g018
Table 1. Statistical Performance of Three Schemes in Urban Canyon Scenario.
Metrics Scheme 1 Scheme 2 Scheme 2b (Decorrelated)Scheme 3 (Proposed)
Visible Sats (Mean)3.983.98 + 3.98 (Shared)3.98 + 3.98 (Independent MP)3.98 + 11.87 (UAV)
Availability Rate41.6% (Fragmented)72.1% (Partial)74.3%100% (Continuous)
RMSE (Horizontal)3.42 m (Valid Epochs Only)1.85 m1.62 m0.08 m (All Epochs)
RMSE (Vertical)6.89 m (Valid Epochs Only)3.10 m2.78 m0.12 m (All Epochs)
AR Success Rate15.4%42.6%47.8%98.2%
Table 2. Performance Comparison Under Different Dynamic Levels (Scheme 3).
MetricsBaseline (10 m/s, 0.5 m/s2)High-Dynamic (15 m/s, 1.0 m/s2)Degradation
RMSE-H (m)0.080.09+12.5%
RMSE-V (m)0.120.14+16.7%
AR Success Rate (%)98.296.7−1.5 pp
Baseline RMSE (cm)2.302.78+20.8%
95th-percentile 3D Error (m)0.300.34+13.3%
Table 3. Hardware Configuration of the Experimental Platform.
ComponentSpecification
GNSS Receiveru-blox F9P, dual-frequency
UWB ModuleDecawave DWM1000, 6.5 GHz
UAV PlatformCustom quadrotor, 2.1 kg total takeoff weight
Flight ControllerPixhawk 4, position hold mode
Reference StationCORS network RTK (baseline < 8 km)
Table 4. Experimental Statistical Performance.
MetricsScheme 1Scheme 2 (Simulated V2V)Scheme 3 (Proposed)
Availability (%)44.3 68.7 100.0
RMSE-H (m)3.18 * 2.140.11
RMSE-V (m) 5.93 *3.870.17
AR Success (%)12.838.494.7
PDOP (mean) 7.43 †6.912.18
* Computed on valid epochs only. † Epochs with PDOP > 20 excluded from mean calculation.
Disclaimer/Publisher’s Note: The statements, opinions and data contained in all publications are solely those of the individual author(s) and contributor(s) and not of MDPI and/or the editor(s). MDPI and/or the editor(s) disclaim responsibility for any injury to people or property resulting from any ideas, methods, instructions or products referred to in the content.