1. Introduction
Forests are invaluable natural resources that serve as habitats for countless organisms while offering various ecological, economic, and societal benefits [
1]. These ecosystems are essential in carbon sequestration, air quality enhancement, water regulation, soil stabilization, and biodiversity conservation [
2,
3]. Additionally, forests contribute to economic development by providing timber and non-timber products, generating employment opportunities, and supporting essential ecosystem services, such as pollination and soil health maintenance [
4]. They are also vital in mitigating climate change, regulating local temperatures, and safeguarding watersheds [
2]. Beyond their ecological and economic importance, forests provide spaces for recreation, cultural significance for numerous communities, and mental and physical health benefits [
5]. Furthermore, they support diverse wildlife and are fundamental to maintaining ecological balance and sustainability [
1]. Despite their importance, forests are increasingly threatened by wildfires and deforestation, posing significant challenges to their preservation and highlighting the need for advanced monitoring, prediction, and management strategies [
6].
Wildfires, also known as forest fires, bushfires, or wildland fires, are a significant component of the Earth’s system, occurring year-round globally [
7]. While they are considered natural disturbances, wildfires are often classified as uncontrolled disasters due to their potential to inflict substantial economic damage, annually destroying millions of acres of land and causing immense losses in human lives, vegetation, and forest resources [
4,
8,
9]. Natural factors, such as lightning or human activities, including campfires, discarded cigarettes, and deliberate land clearing, can ignite wildfires [
10]. These fires are fueled by dry vegetation, high temperatures, and strong winds, enabling rapid spread over vast areas [
11]. Despite their destructive nature, leading to the loss of lives, property, and wildlife habitats, wildfires also serve essential ecological functions in specific ecosystems [
12]. They clear out dead vegetation, return nutrients to the soil, and stimulate new plant growth [
13]. However, the increasing frequency and severity of wildfires, driven by climate change, threaten ecosystems, air quality, and human health [
14]. These challenges highlight the urgent need for effective wildfire management and prevention strategies [
15]. Moreover, these challenges have accelerated the adoption of advanced geospatial technologies and artificial intelligence (AI) models to improve wildfire monitoring, prediction, and mitigation [
16].
Wildfires are complex phenomena influenced by five major factors: climate conditions, forest fuels, ignition points, topography, and human activities [
17]. According to [
18], the estimated global annual burned area is approximately 420 million hectares, exceeding India’s land area. Moreover, the economic losses caused by wildfires are substantial [
19]. For example, a single catastrophic wildfire in California claimed 88 lives and affected 18,500 structures, and the total financial cost of this event reached
$24 billion [
20]. This estimate excludes the hidden economic impacts on human health, which translates to a cost of
$9.50 per person per day during the wildfire event [
21]. Therefore, wildfires should not be underestimated, and the adoption of advanced technologies is essential to enhance their management and mitigation.
Although managing wildfires is naturally challenging, significant progress has been made in wildfire modeling, monitoring, and observation. These advancements have been fueled by the enhanced capabilities and accessibility of remote sensing (RS) and geospatial information systems (GIS) technologies [
10]. Since the mid-1980s, these innovative tools for preventing, assessing, and monitoring wildfires have evolved considerably [
22,
23,
24,
25]. These techniques have been adapted to address the distinct needs of each wildfire phase, using diverse algorithms and methodologies to improve management strategies. These advancements have created unprecedented opportunities to use geospatial data for wildfire analysis, but they have also introduced increasing complexity in data integration, processing, and interpretation.
Wildfire management using RS and GIS technologies can be categorized into three phases: “Before,” “During,” and “After” wildfire events. The “Before” phase focuses on wildfire prediction, which involves forecasting the likelihood of wildfire occurrence before ignition [
26]. This process includes modeling the relationship between wildfire risk and influential factors such as weather conditions, fuel content, and topography [
27]. For example, [
28] generated a wildfire risk map to identify areas at greater risk. Similarly, [
20] identified high-risk zones in Chile, demonstrating the importance of regional-scale risk assessments. Moreover, [
29] developed a fuel map as part of preparedness efforts to raise awareness about fuel availability within forested areas. The primary goal of these initiatives is to predict when and where wildfires might occur to prevent ignition and limit their spread.
The “During” phase focuses on predicting wildfire behavior, including the spatial and temporal evolution of wildfire spread, active fire detection, and smoke detection. Wildfire spread involves understanding how environmental factors such as weather conditions, moisture levels, fuel availability, and human activity influence wildfire behavior [
30]. Several studies have been conducted in this field, including predicting the rate of spread in response to wind speed [
31,
32,
33,
34,
35], predicting the spatial progression of the wildfire [
1,
14,
15,
36,
37,
38,
39,
40], and classifying wildfires based on the extent of land burned [
41,
42,
43,
44,
45], such as small or large wildfires. Similarly, active fire detection uses space-, aerial-, or ground-based sensors to locate active wildfire hotspots in real time. Several researchers have conducted research in this field [
46,
47,
48]. These systems can identify high-temperature areas, allowing responders to prioritize containment efforts. On the other hand, smoke detection uses optical sensors and atmospheric monitoring to track smoke plumes, estimate their spread, and predict their impact on air quality and visibility [
10]. Previous studies in this area have developed methodologies to improve early smoke detection and its integration with fire spread models [
49,
50,
51,
52,
53,
54].
Finally, the “After” phase centers on recovery efforts, including burned area mapping (BAM) and severity assessment. BAM identifies and locates wildfire-affected regions, while severity mapping evaluates areas based on damage intensity. Previous studies have used various techniques to map burned areas and assess wildfire severity [
55,
56,
57,
58,
59,
60,
61,
62,
63,
64,
65]. Typically, regions with higher fuel loads experience greater wildfire severity. In addition, this phase evaluates the effects of wildfires on vegetation and canopy structures and tracks recovery trends over time [
66]. Various studies have been conducted to measure the impact of wildfires on vegetation [
67,
68,
69,
70,
71].
Although advancements in RS and GIS technologies had revolutionized wildfire-related tasks, a pressing need remained for more accurate and reliable algorithms. This necessity drove significant interest in AI methods, particularly machine learning (ML) and deep learning (DL) algorithms [
72,
73]. RS data provides extensive observations of forested areas, offering a valuable understanding of every phase of wildfire management [
74,
75]. On the other hand, AI algorithms require high-quality, large-scale datasets for training, creating a synergy among AI, RS, and GIS. The motivations for employing AI algorithms in forest ecosystem research, including disturbances caused by wildfires, were explored in earlier studies [
76]. Reference [
77] further emphasized the potential of ML techniques to model complex ecological problems. With the advent of DL architectures, particularly convolutional neural networks (CNNs) [
11], these algorithms have become powerful tools for geospatial tasks, especially in wildfire-related domains. Recent advancements, such as transformers [
78] and attention mechanisms [
79], further enhanced the capabilities of AI in addressing wildfire challenges. Researchers have continued introducing innovative architectures and intelligent solutions to improve wildfire management by proposing various accurate AI models [
39,
80,
81,
82]. As a result, geospatial AI (GeoAI), which integrates RS, GIS, and AI, has emerged as a critical framework for addressing complex wildfire challenges across spatial and temporal scales.
Despite the remarkable advancements in integrating RS, GIS, and supervised learning algorithms such as ML and DL for wildfire applications, a critical gap remains in synthesizing and understanding the collective progress of these technologies. The rapid growth of GeoAI-based wildfire studies has led to a fragmented body of literature, with individual studies focusing on specific wildfire phases, geographic regions, data sources, or algorithmic approaches. Although several review papers, as some of these studies are illustrated in
Table 1, have examined particular wildfire tasks, such as wildfire prediction, detection, and spread modeling [
2,
10,
83,
84,
85,
86,
87], none provide a comprehensive and systematic synthesis of the integration of RS, GIS, and supervised AI across all wildfire management phases. Furthermore, existing reviews often investigate a limited number of studies, focus on specific algorithms, or overlook important aspects such as data sources, spatial scales, and methodological trends. In particular, the “After” phase of wildfire management has received limited attention, with [
10] being among the few studies to investigate it using conventional ML algorithms. This lack of a unified and systematic assessment makes it difficult for researchers, practitioners, and decision-makers to fully understand current capabilities, identify methodological limitations, and determine future research directions. Therefore, comprehensive systematic review and meta-analysis are critically needed to consolidate existing knowledge, identify research gaps, and support the development of more effective, scalable, and interpretable GeoAI-based wildfire management systems.
Therefore, this review paper aims to address these critical gaps by providing a comprehensive and systematic analysis of the integration of RS, GIS, and supervised AI algorithms, including traditional ML and DL, across diverse wildfire management applications. Using the Preferred Reporting Items for Systematic Reviews and Meta-Analyses (PRISMA) framework, this study systematically evaluates the current state of GeoAI in wildfire science and identifies areas where these technologies have demonstrated strong performance, as well as domains that remain underexplored. Specifically, this study makes the following contributions: (1) providing a comprehensive synthesis of RS, GIS, and supervised AI applications across all wildfire management phases; (2) conducting a rigorous meta-analysis of 449 peer-reviewed studies published between 1994 and 2024 to identify research trends, methodological developments, and existing gaps; (3) highlighting understudied wildfire applications, including post-fire recovery and vulnerability assessments, and underutilized AI approaches such as transfer learning and explainable AI (XAI); (4) analyzing the global distribution of wildfire studies to reveal geographic disparities and research priorities; (5) examining the most commonly used data sources, features, and algorithmic approaches across wildfire-related tasks; and (6) providing methodological insights and recommendations to support the development of more accurate, scalable, and interpretable GeoAI-based wildfire management systems.
Table 1.
Summary of existing literature review studies covering wildfire management using geospatial science and supervised AI algorithms.
Table 1.
Summary of existing literature review studies covering wildfire management using geospatial science and supervised AI algorithms.
| #Num | Title | Addressed Issue | Gap | Ref |
|---|
| 1 | A review of machine learning applications in wildfire science and management | This paper provides a comprehensive overview of ML applications in different wildfire tasks. | Primarily focused on conventional ML methods and not on RS and GIS specifically. | [10] |
| 2 | A Survey of Machine Learning Algorithms Based Forest Fires Prediction and Detection Systems | Review of different methods used in wildfire prediction and detection. | Mainly concentrates on the “Before” and “During” phases, without specifically highlighting RS and GIS domains. | [83] |
| 3 | Forest fire induced Natech risk assessment: A survey of geospatial technologies. | A review of GIS-based methods for modeling wildfire risk and assessing their potential to trigger Natural Hazards Triggering Technological Disasters (Natech). | Excludes ML and DL algorithms, focusing primarily on wildfire risk assessment rather than addressing other phases of wildfire management. | [88] |
| 4 | A Review on Early Forest Fire Detection Systems Using Optical Remote Sensing | Highlights the strengths and limitations of methods and sensors employed in wildfire detection, along with future trends in this domain. | Focuses solely on the wildfire detection task, with limited emphasis on ML and DL algorithms. | [89] |
| 5 | Role of Machine Learning Algorithms in Forest Fire Management: A Literature Review | Explores various applications of ML in wildfire-related tasks utilizing diverse sensors and datasets. | Examines a limited number of studies, with no specific focus on RS and GIS technologies. | [2] |
| 6 | Forest fire fuel through the lens of remote sensing: Review of approaches, challenges and future directions in the remote sensing of biotic determinants of fire behavior | Fuel mapping through RS has been considerably studied and addressed. | It covers only a specific aspect of wildfire and does not focus on using ML and DL. | [90] |
| 7 | A Systematic Review of Applications of Machine Learning Techniques for Wildfire Management Decision Support | A review of recent ML applications in wildfire management decision support, categorized by study type, primary model application, ML technique, case study location, and performance metrics. | The investigation is limited to a few features and focuses on ML and decision support rather than RS and GIS technologies. | [85] |
| 8 | A review on early wildfire detection from unmanned aerial vehicles using deep learning-based computer vision algorithms | A review of the challenge in detecting wildfires and wildlands at their early stages using unmanned aerial vehicle (UAV) and DL algorithms. | Reliance on UAV-based RS technologies and a limited focus on a narrow range of wildfire tasks | [4] |
| 9 | A Brief Review of Machine Learning Algorithms in Forest Fires Science | It briefly describes ML algorithm applications in three steps of wildfire phases. | A detailed exploration is not provided, and only a few studies are investigated. | [84] |
| 10 | Forest fire surveillance systems: A review of deep learning methods | Highlights the methods and architectures of DL models that have been applied, including the type of datasets used and their accompanying performance accuracy. | Very limited studies are investigated, focusing mainly on DL architectures. Moreover, not all wildfire phases are explored. | [86] |
| 11 | Wildfire Risk Prediction: A Review | A comprehensive review of wildfire risk prediction using DL algorithms, along with a discussion of the current limitations of existing algorithms. | While DL algorithms are significantly reviewed, the focus is limited to the “Before” and some “During” phases of wildfire, with less attention given to other taks. | [91] |
| 12 | Machine Learning and Deep Learning for Wildfire Spread Prediction: A Review | A comprehensive review of wildfire spread prediction, focusing on ML and DL architectures, with a thorough investigation of various developed architectures. | The field is limited to the wildfire spread prediction task only. | [92] |
| 13 | Application of Deep Learning in Forest Fire Prediction: A Systematic Review | A review of prevalent DL architectures, datasets, and human activity in wildfire prediction. | Although DL architectures are fully investigated, the “After” phase is not explored. Additionally, RS and GIS technologies are not considered. | [26] |
2. Literature Review Methodology
This systematic review was conducted in accordance with the PRISMA 2020 guidelines [
93] to improve methodological transparency, reproducibility, and reporting consistency. The review process involved systematic literature identification, screening, eligibility assessment, and inclusion of studies related to GeoAI applications in wildfire science and management. Since this study focused on a structured synthesis and descriptive meta-analysis of peer-reviewed literature rather than intervention-based evidence synthesis, no formal review protocol registration was conducted.
A structured, systematic literature search was conducted across two major academic databases, Web of Science and Scopus, to identify studies on the intersection of wildfires, geospatial science, and AI methods. The search strategy was formulated around three distinct keyword categories, as outlined in
Table 2. The first category focused on wildfire-related terminology, encompassing expressions such as “wildfire,” “forest fire,” “burned,” and “post-fire” to cover various types and stages of fire-related phenomena. The second category targeted Earth observation (EO) data and geospatial technologies, including terms such as “remote sensing,” “GIS,” “Satellite,” and “Earth observation,” reflecting the spatial and data-driven nature of the analysis. The third category comprised learning-methods keywords, incorporating classical ML and contemporary DL terms such as “Classification,” “Regression,” “CNN,” “Transformer,” “GAN,” and “explainable AI,” to ensure comprehensive coverage of data analysis approaches applied in this domain.
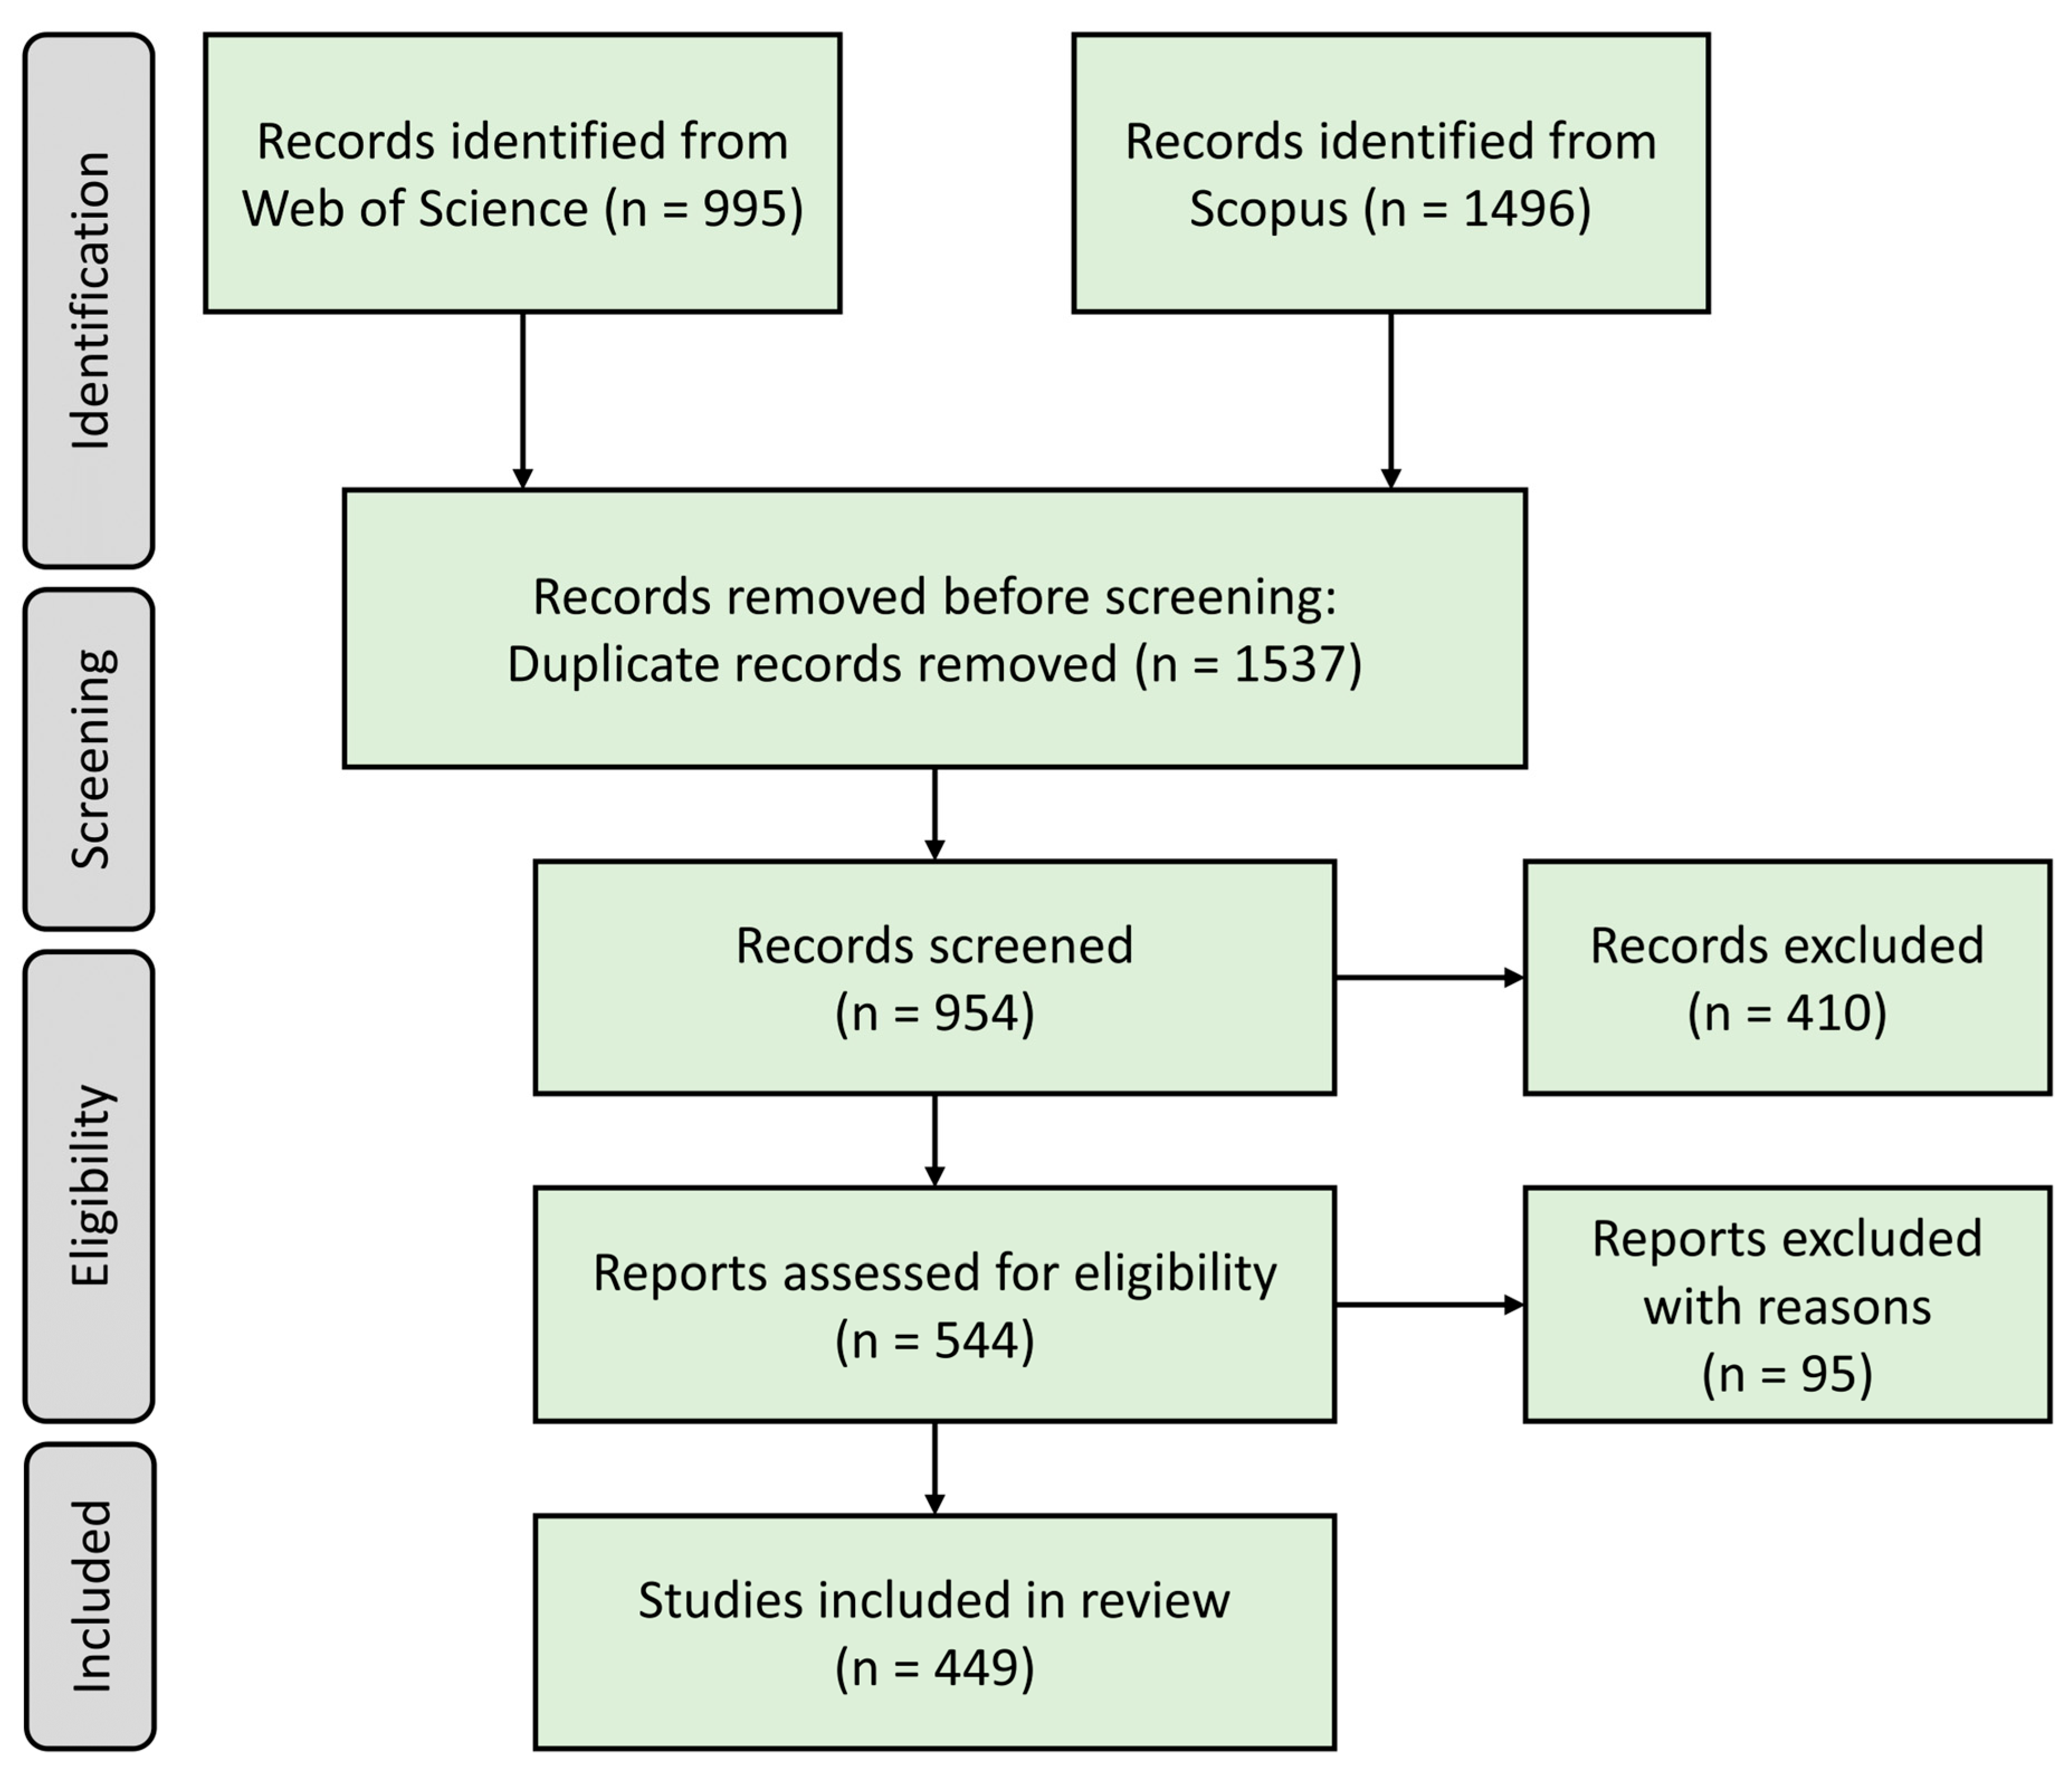
The search was limited to peer-reviewed journal articles published in English over a 30-year period from January 1994 to December 2024. The inclusion criteria comprised studies that explicitly addressed wildfire-related applications through the integration of geospatial science (e.g., remote sensing, GIS, or Earth observation data) and learning-based analytical approaches, including ML and DL methods. Conference proceedings, review abstracts, editorials, and non-English publications were excluded to maintain methodological consistency and academic rigor. Studies were also excluded if they focused on unrelated hazards (e.g., floods or landslides) or employed only non-learning-based analytical approaches, such as statistical, deterministic, or rule-based methods. The entire review process followed a transparent and structured protocol, as illustrated in
Figure 1. The screening process was conducted through multiple stages following PRISMA guidelines, including title, abstract, and full-text assessments. Any disagreements regarding study eligibility or thematic relevance were resolved through discussion among the authors to maintain consistency in the selection process.
In this study, the term “meta-analysis” refers to a structured quantitative synthesis of literature characteristics, consistent with prior PRISMA-based review studies in the RS domain [
94,
95,
96]. The initial query yielded 995 records from Web of Science and 1496 from Scopus. After removing duplicates, 954 unique articles were retained for screening. Titles and abstracts were then reviewed to eliminate studies that did not explicitly align with the three predefined keyword categories, thereby ensuring thematic coherence with the objectives of this review.
In the eligibility assessment phase, full-text articles and accompanying figures were examined in greater detail to evaluate their alignment with the inclusion criteria. Studies that had passed the initial screening but, upon closer inspection, did not meet methodological or thematic requirements were excluded at this stage. These included papers that did not engage with geospatial science, those addressing unrelated hazards such as floods or landslides, and studies that employed only non-learning-based analytical techniques. Specifically, this latter group comprised studies that applied purely statistical models, rule-based systems, or deterministic mathematical algorithms rather than data-driven or learning-based approaches.
Following this multi-tiered filtering process, 449 studies were retained for inclusion in the final meta-analysis review. This refined dataset provides a comprehensive and methodologically consistent foundation for further quantitative and thematic analysis within the scope of this review.
The keyword groups presented in
Table 2 were combined using Boolean operators (AND/OR) to construct the final search queries. Specifically, terms within each group were connected using OR, while the three groups (wildfire, EO data, and learning methods) were combined using AND. The search was applied to the title, abstract, and keyword fields in both Web of Science and Scopus databases. The database search was conducted in January 2025.
3. Results
A total of 449 peer-reviewed journal articles met the eligibility criteria described in
Section 2. These studies represent a comprehensive body of research that intersects geospatial science, supervised AI techniques, and various wildfire management applications. Based on a structured meta-analysis, the selected literature was categorized to extract several key types of information. This section presents a detailed review of the meta-analysis results. First, the general characteristics of the reviewed papers, including journal distribution and first-author country of affiliation, are discussed to highlight the global spread and publication trends in wildfire research. Next, the data types are analyzed to reveal their prevalence and significance across wildfire tasks. Then, the application of ML and DL methods is reviewed to assess their growing role in spatial and temporal wildfire analysis. Finally, performance metrics are presented.
3.1. General Characteristics of Studies
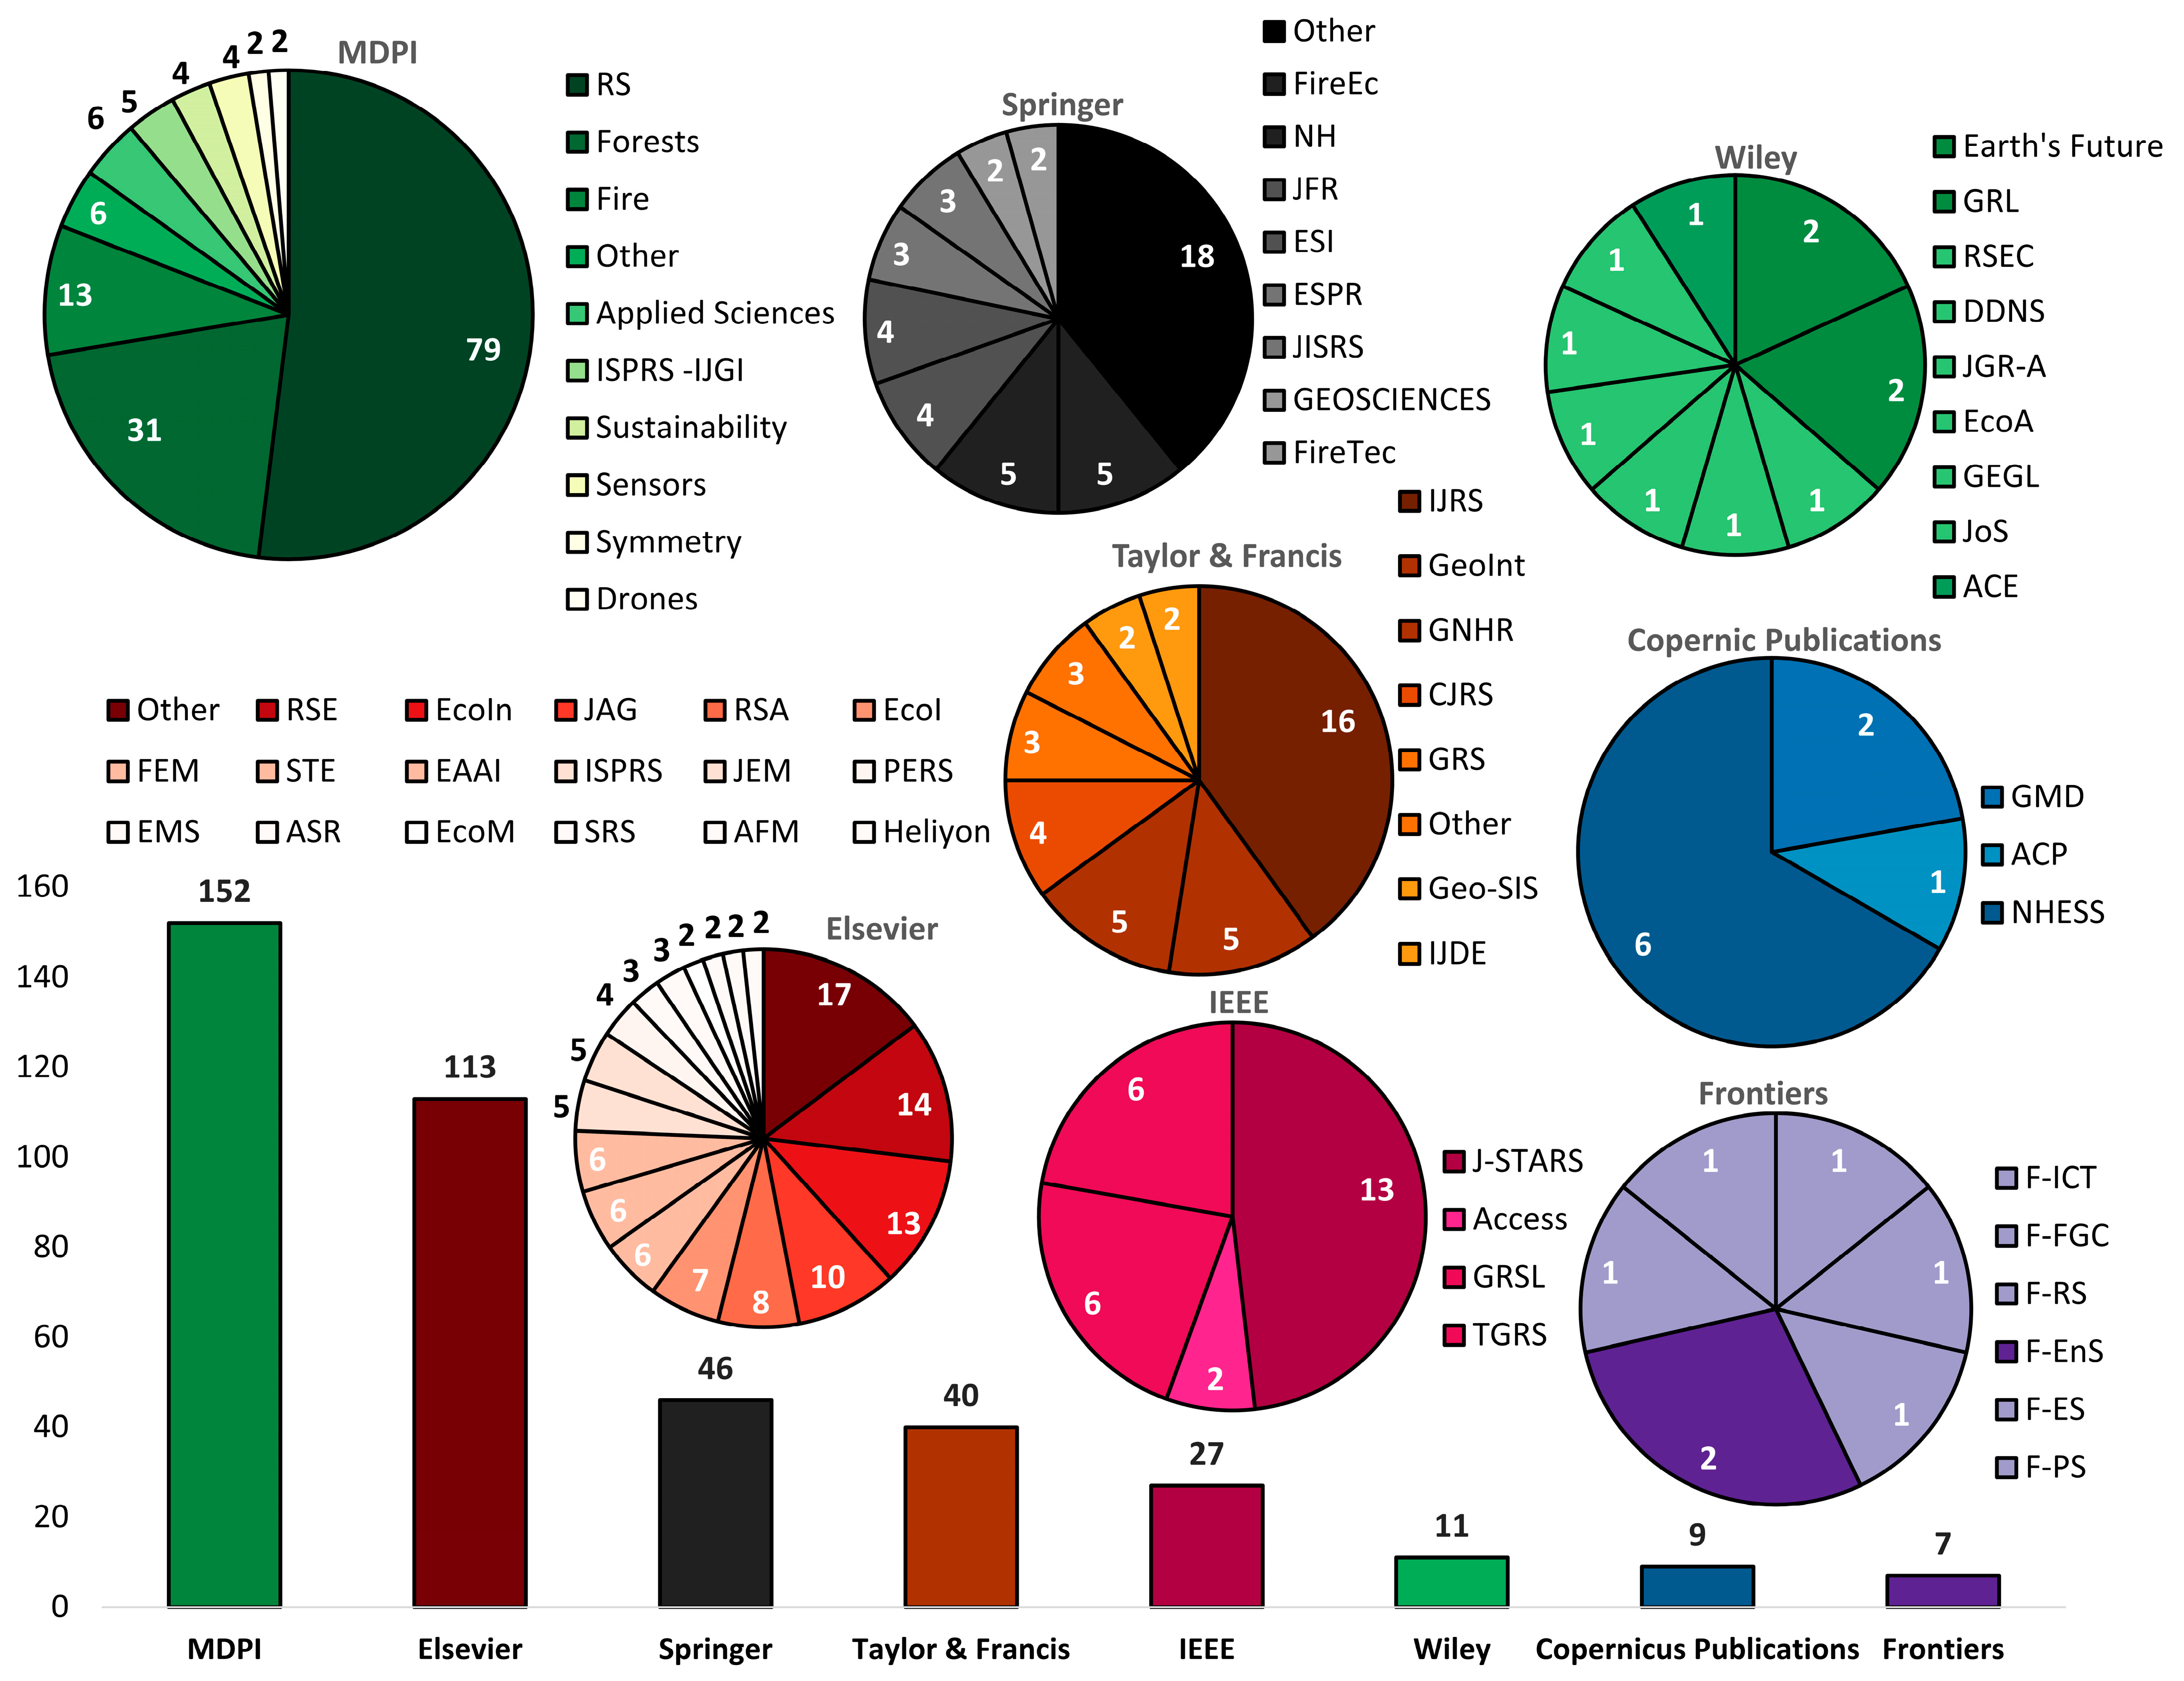
The reviewed studies were distributed across 136 different journals. As shown in
Figure 2, the highest number of publications appeared in journals published by the Multidisciplinary Digital Publishing Institute (MDPI), totaling 152 papers. Elsevier followed this with 113 publications and Springer with 46. Taylor & Francis and IEEE contributed 40 and 27 papers, respectively. Additional contributions included 11 papers from Wiley, 9 from Copernic Publications, and 7 from Frontiers. Notably, publishers with at least five publications are illustrated in
Figure 2.
A closer examination of
Figure 2 shows the specific distribution of wildfire-related publications across journals within the MDPI publisher. The Remote Sensing journal accounted for most studies, with 79 publications. The Forests followed this journal with 31 papers and the Fire Journal with 13, the latter dedicated to wildfire research. Applied Sciences and the “Other” MDPI journals contributed six papers each, while the International Society for Photogrammetry and Remote Sensing (ISPRS) International Journal of Geo-Information (ISPRS-IJGI) published five papers. Notably, the “Other” category includes journals with only a single wildfire-related publication: Sensors and Sustainability, which published four papers, and Symmetry and Drones, which published two papers.
Among the Elsevier-published journals, Remote Sensing of Environment (RSE) had the highest number of wildfire-related publications, with 14 papers. This was followed by Ecological Informatics (EcoIn) and the International Journal of Applied Earth Observation and Geoinformation (JAG), which published 13 and 10 papers, respectively. Remote Sensing Applications: Society and Environment (RSA) published eight papers, while Ecological Indicators (EcoI) had seven publications. Journals such as Forest Ecology and Management (FEM), Environmental Modelling & Software (EMS), Engineering Applications of Artificial Intelligence (EAAI), and Science of the Total Environment (STE) each contributed six papers. The ISPRS and the Journal of Environmental Management (JEM) published five papers. Moreover, Photogrammetric Engineering & Remote Sensing (PERS) had four publications. Advances in Space Research (ASR) and Agricultural and Forest Meteorology (AFM) each had three papers, and the same was true for Ecological Modelling (EcoM), Science of Remote Sensing (SRS), and Heliyon. The “Other” category, including journals with only one wildfire-related publication, collectively accounted for 17 papers.
Within the Springer group, the Fire Ecology (FireEc) and Natural Hazards (NH) journals each contributed the highest number of wildfire-related publications, with five papers each. This was followed by Earth Science Informatics (ESI) and the Journal of Forestry Research (JFR), which published four papers each. Environmental Science and Pollution Research (ESPR) and the Journal of the Indian Society of Remote Sensing (JISRS) each contributed three publications, while Geosciences and Fire Technology (FireTec) each contributed two papers. The “Other” category, comprising Springer journals with only one wildfire-related publication, accounted for 18 papers.
For Taylor & Francis publications, the International Journal of Remote Sensing (IJRS) had the highest number of wildfire-related studies, contributing 16 papers. This was followed by Geocarto International (GeoInt) and Geo-Natural Hazards and Risk (GNHR), with five publications each. The Canadian Journal of Remote Sensing (CJRS) published four papers, while Geo-Spatial Information Science (Geo-SIS) and Geographical Research Letters (GRS) published two and three papers, respectively. The “Other” category, including journals with only one wildfire-related publication, collectively accounted for three papers.
For IEEE publications, the Journal of Selected Topics in Applied Earth Observations and Remote Sensing (J-STARS) had the highest number of wildfire-related studies, with 13 papers. This was followed by IEEE Geoscience and Remote Sensing Letters (GRSL) and IEEE Transactions on Geoscience and Remote Sensing (TGRS), each of which contributed six papers. IEEE Access published two papers on wildfire management.
As shown in
Figure 2, 11 papers were published under Wiley. Among these, Earth’s Future and Geophysical Research Letters (GRL) each published two papers. The remaining journals, including Remote Sensing in Ecology and Conservation (RSEC), Discrete Dynamics in Nature and Society (DDNS), Journal of Geophysical Research: Atmospheres (JGR-A), Ecology and Agriculture (EcoA), Global Ecology and Biogeography Letters (GEBL), Journal of Sensors (JoS), and Advances in Civil Engineering (ACE), each published one paper.
As illustrated in
Figure 2, Copernic Publications and Frontiers together contributed a total of 16 wildfire-related journal papers. Copernic Publications accounted for nine papers, with Natural Hazards and Earth System Sciences (NHESS) leading at six publications, followed by Geoscientific Model Development (GMD) with two papers and Atmospheric Chemistry and Physics (ACP) with one paper. Similarly, the Frontiers journals published seven papers in total, with Frontiers in Environmental Science (F-EnS) contributing two papers and the remaining five journals, including Frontiers in Information and Communication Technologies (F-ICT), Forests and Global Change (F-FGC), Remote Sensing (F-RS), Earth Science (F-ES), and Plant Science (F-PS), each contributing one.
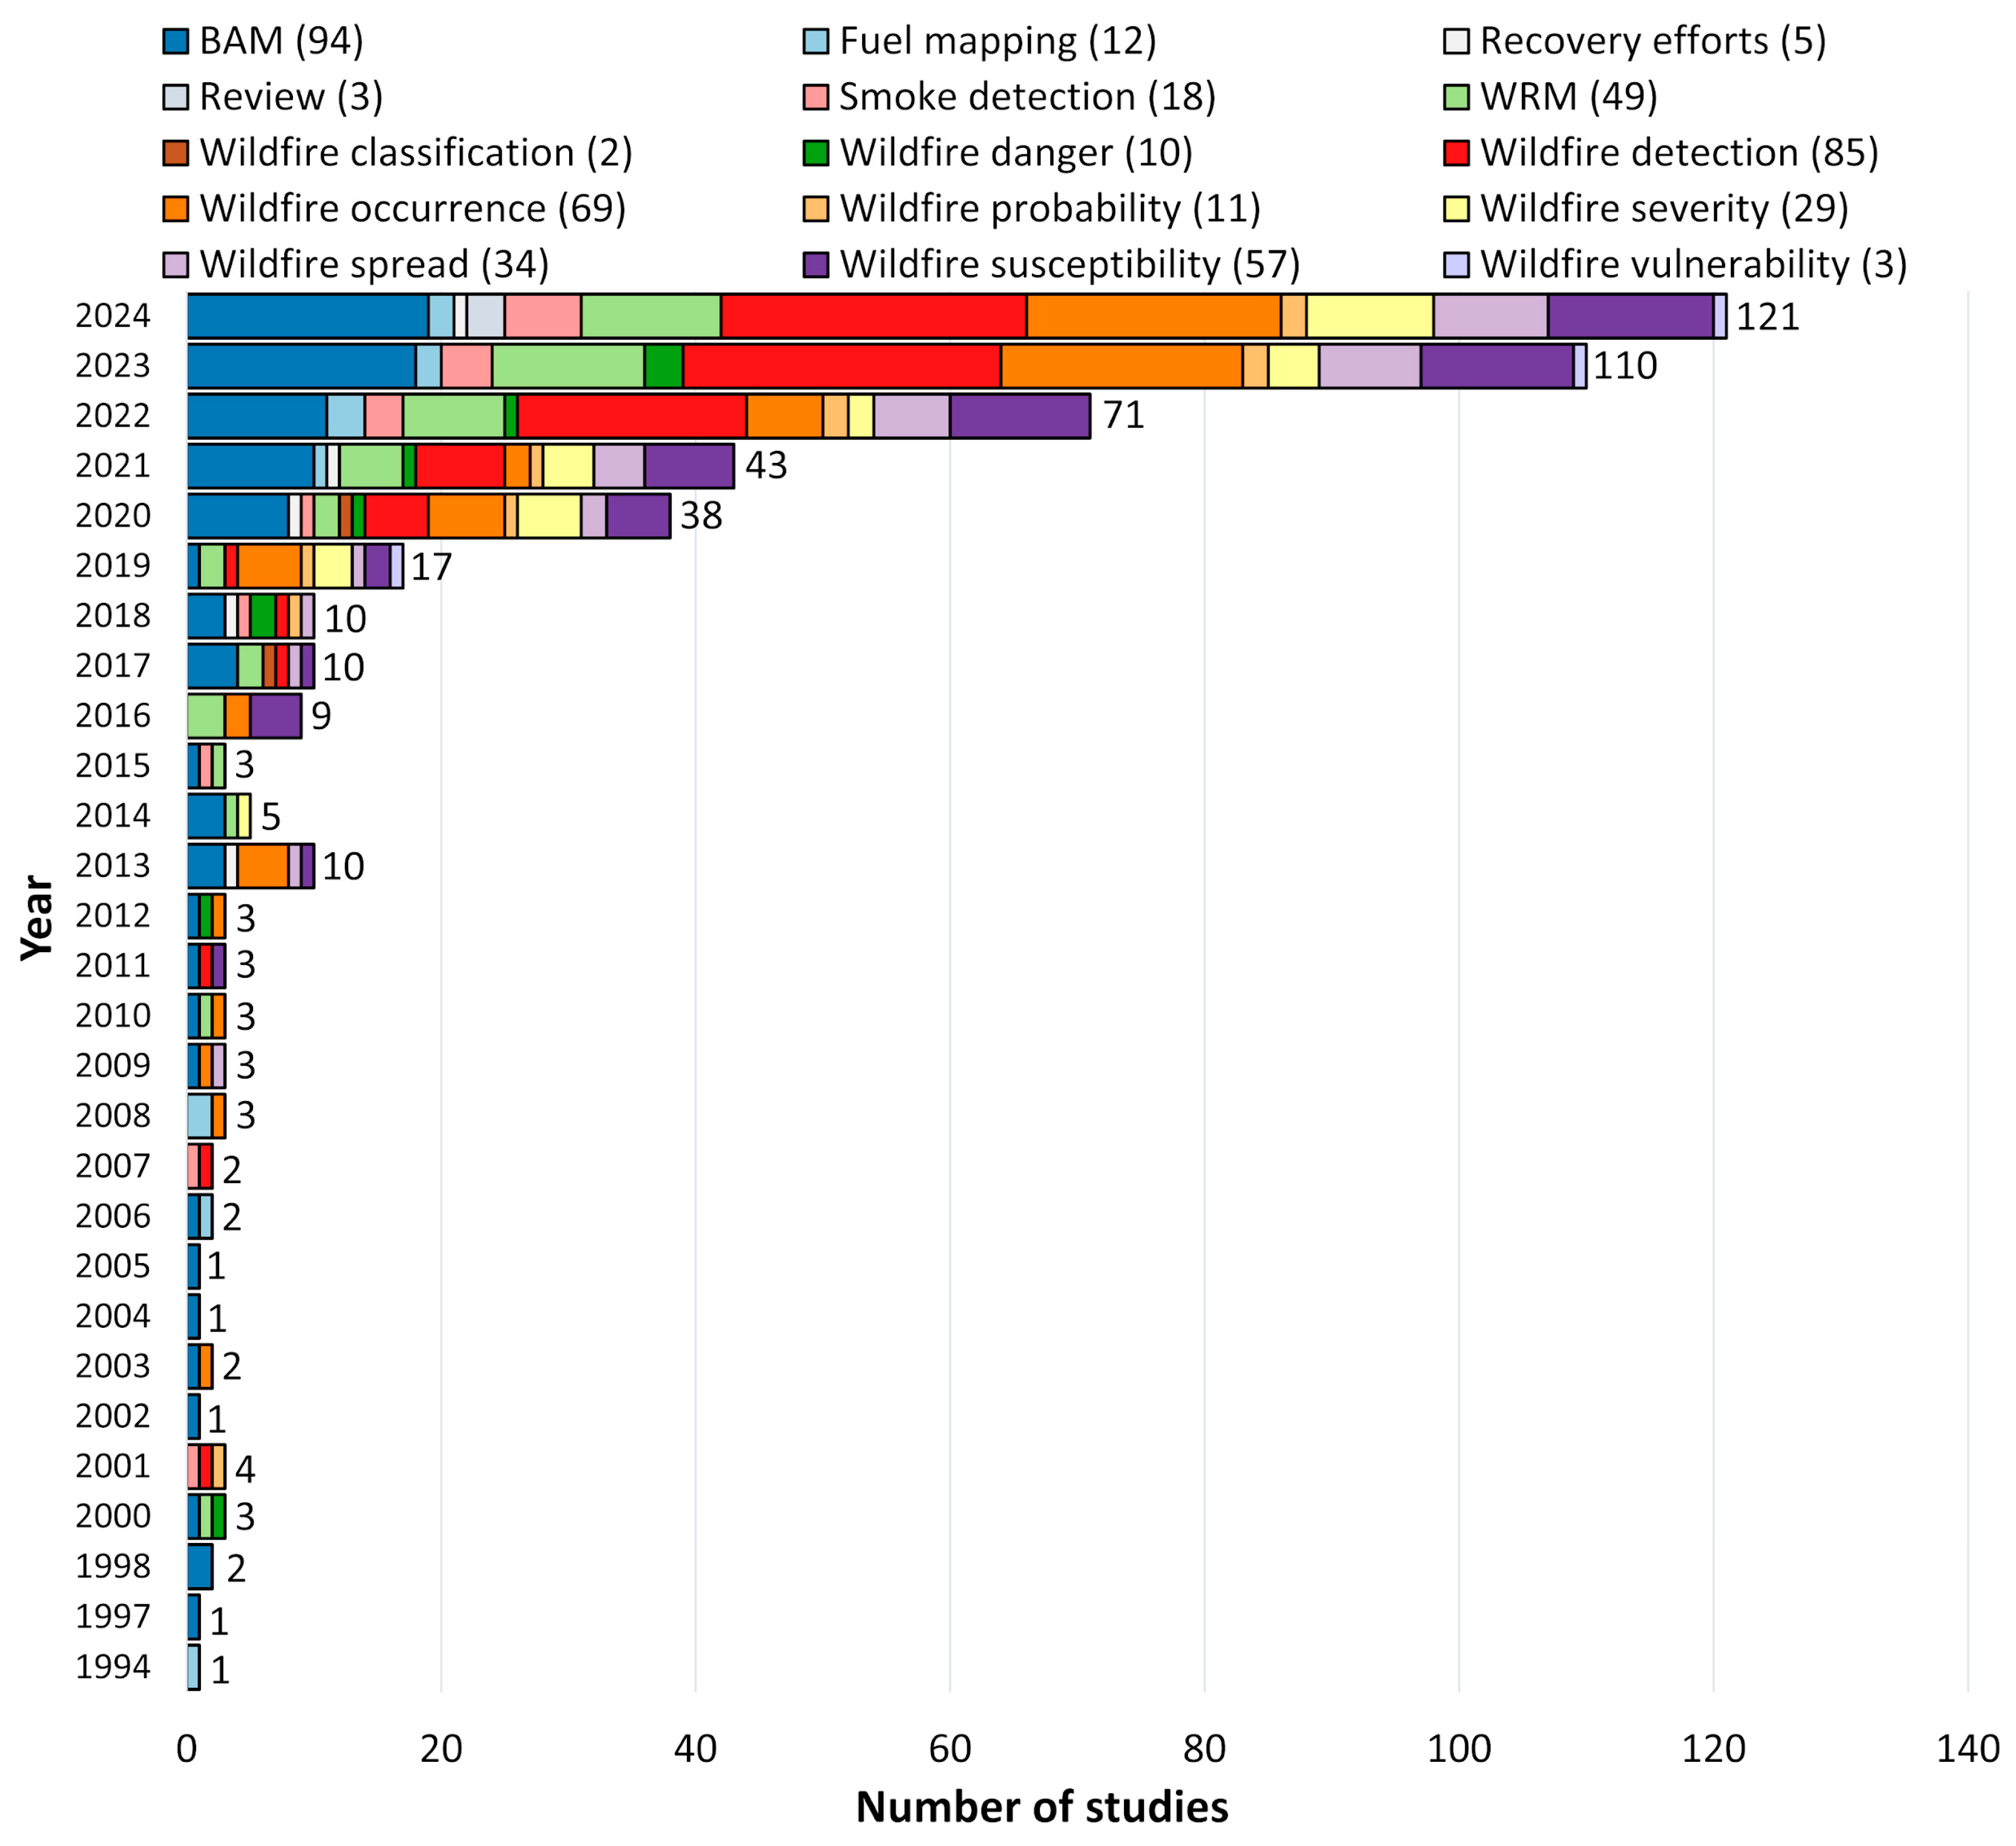
In addition to the journals and publishers that provide an overview of wildfire-related themes,
Figure 3 presents the evolution of wildfire-related research tasks from 1994 to 2024, showcasing how scientific interest and research priorities have shifted over time. The figure plots the number of studies published annually across 15 distinct wildfire application categories, ranging from BAM to wildfire vulnerability assessments. BAM appeared as the most studied application among the research tasks, with 94 publications. While only sporadic studies appeared before 2010, interest grew steadily in the following decade, culminating in a sharp increase after 2020. In 2023 and 2024, BAM accounted for 18 and 19 studies, respectively, underscoring the critical importance of accurately mapping fire-affected areas for response and recovery planning. Wildfire detection also gained substantial traction, with 85 studies in total. It followed a similar trend to BAM, with minimal activity before 2010, then steady growth, peaking in 2023 with 25 publications. Similarly, wildfire occurrence studies exploring spatial and temporal wildfire patterns also became increasingly prominent, growing from fewer than five papers before 2015 to 20 in 2024 and 19 in 2023. Moreover, Wildfire Susceptibility reached 13 studies in 2024, making it the fourth-most-studied task, with a total of 57 papers.
Other wildfire applications, such as wildfire spread (34 studies), wildfire severity (29), and wildfire risk mapping (WRM) (49 studies), showed consistent but moderate growth over the years. Wildfire probability, danger, and smoke detection, with 11, 10, and 18 publications, respectively, were less frequently studied but still important, and have seen gradual increases in the number of publications over the past decade. Notably, smoke detection experienced a recent spike, reaching six studies in 2024. In contrast, some tasks, such as recovery efforts, wildfire classification, vulnerability assessment, and review studies, remained relatively underrepresented, with fewer than six total studies each.
The identified wildfire tasks are grouped into three overarching stages of wildfire management: before fire, during fire, and after fire. While some categories (e.g., wildfire probability, danger, and susceptibility) are conceptually related, they represent distinct modeling objectives and are therefore analyzed separately. It is also important to note that the boundaries between these stages are not always strictly defined. For example, wildfire spread models can be used both before fire events to simulate potential scenarios and during active fires to support real-time decision-making.
Notably, the overall number of wildfire-related studies has surged in recent years. Between 2020 and 2024 alone, 383 studies were published across all tasks. The number of publications rose sharply from 38 in 2020 to 43 in 2021, 71 in 2022, 110 in 2023, and 121 in 2024, signaling a growing commitment to wildfire monitoring, prediction, and mitigation using geospatial and supervised learning approaches.
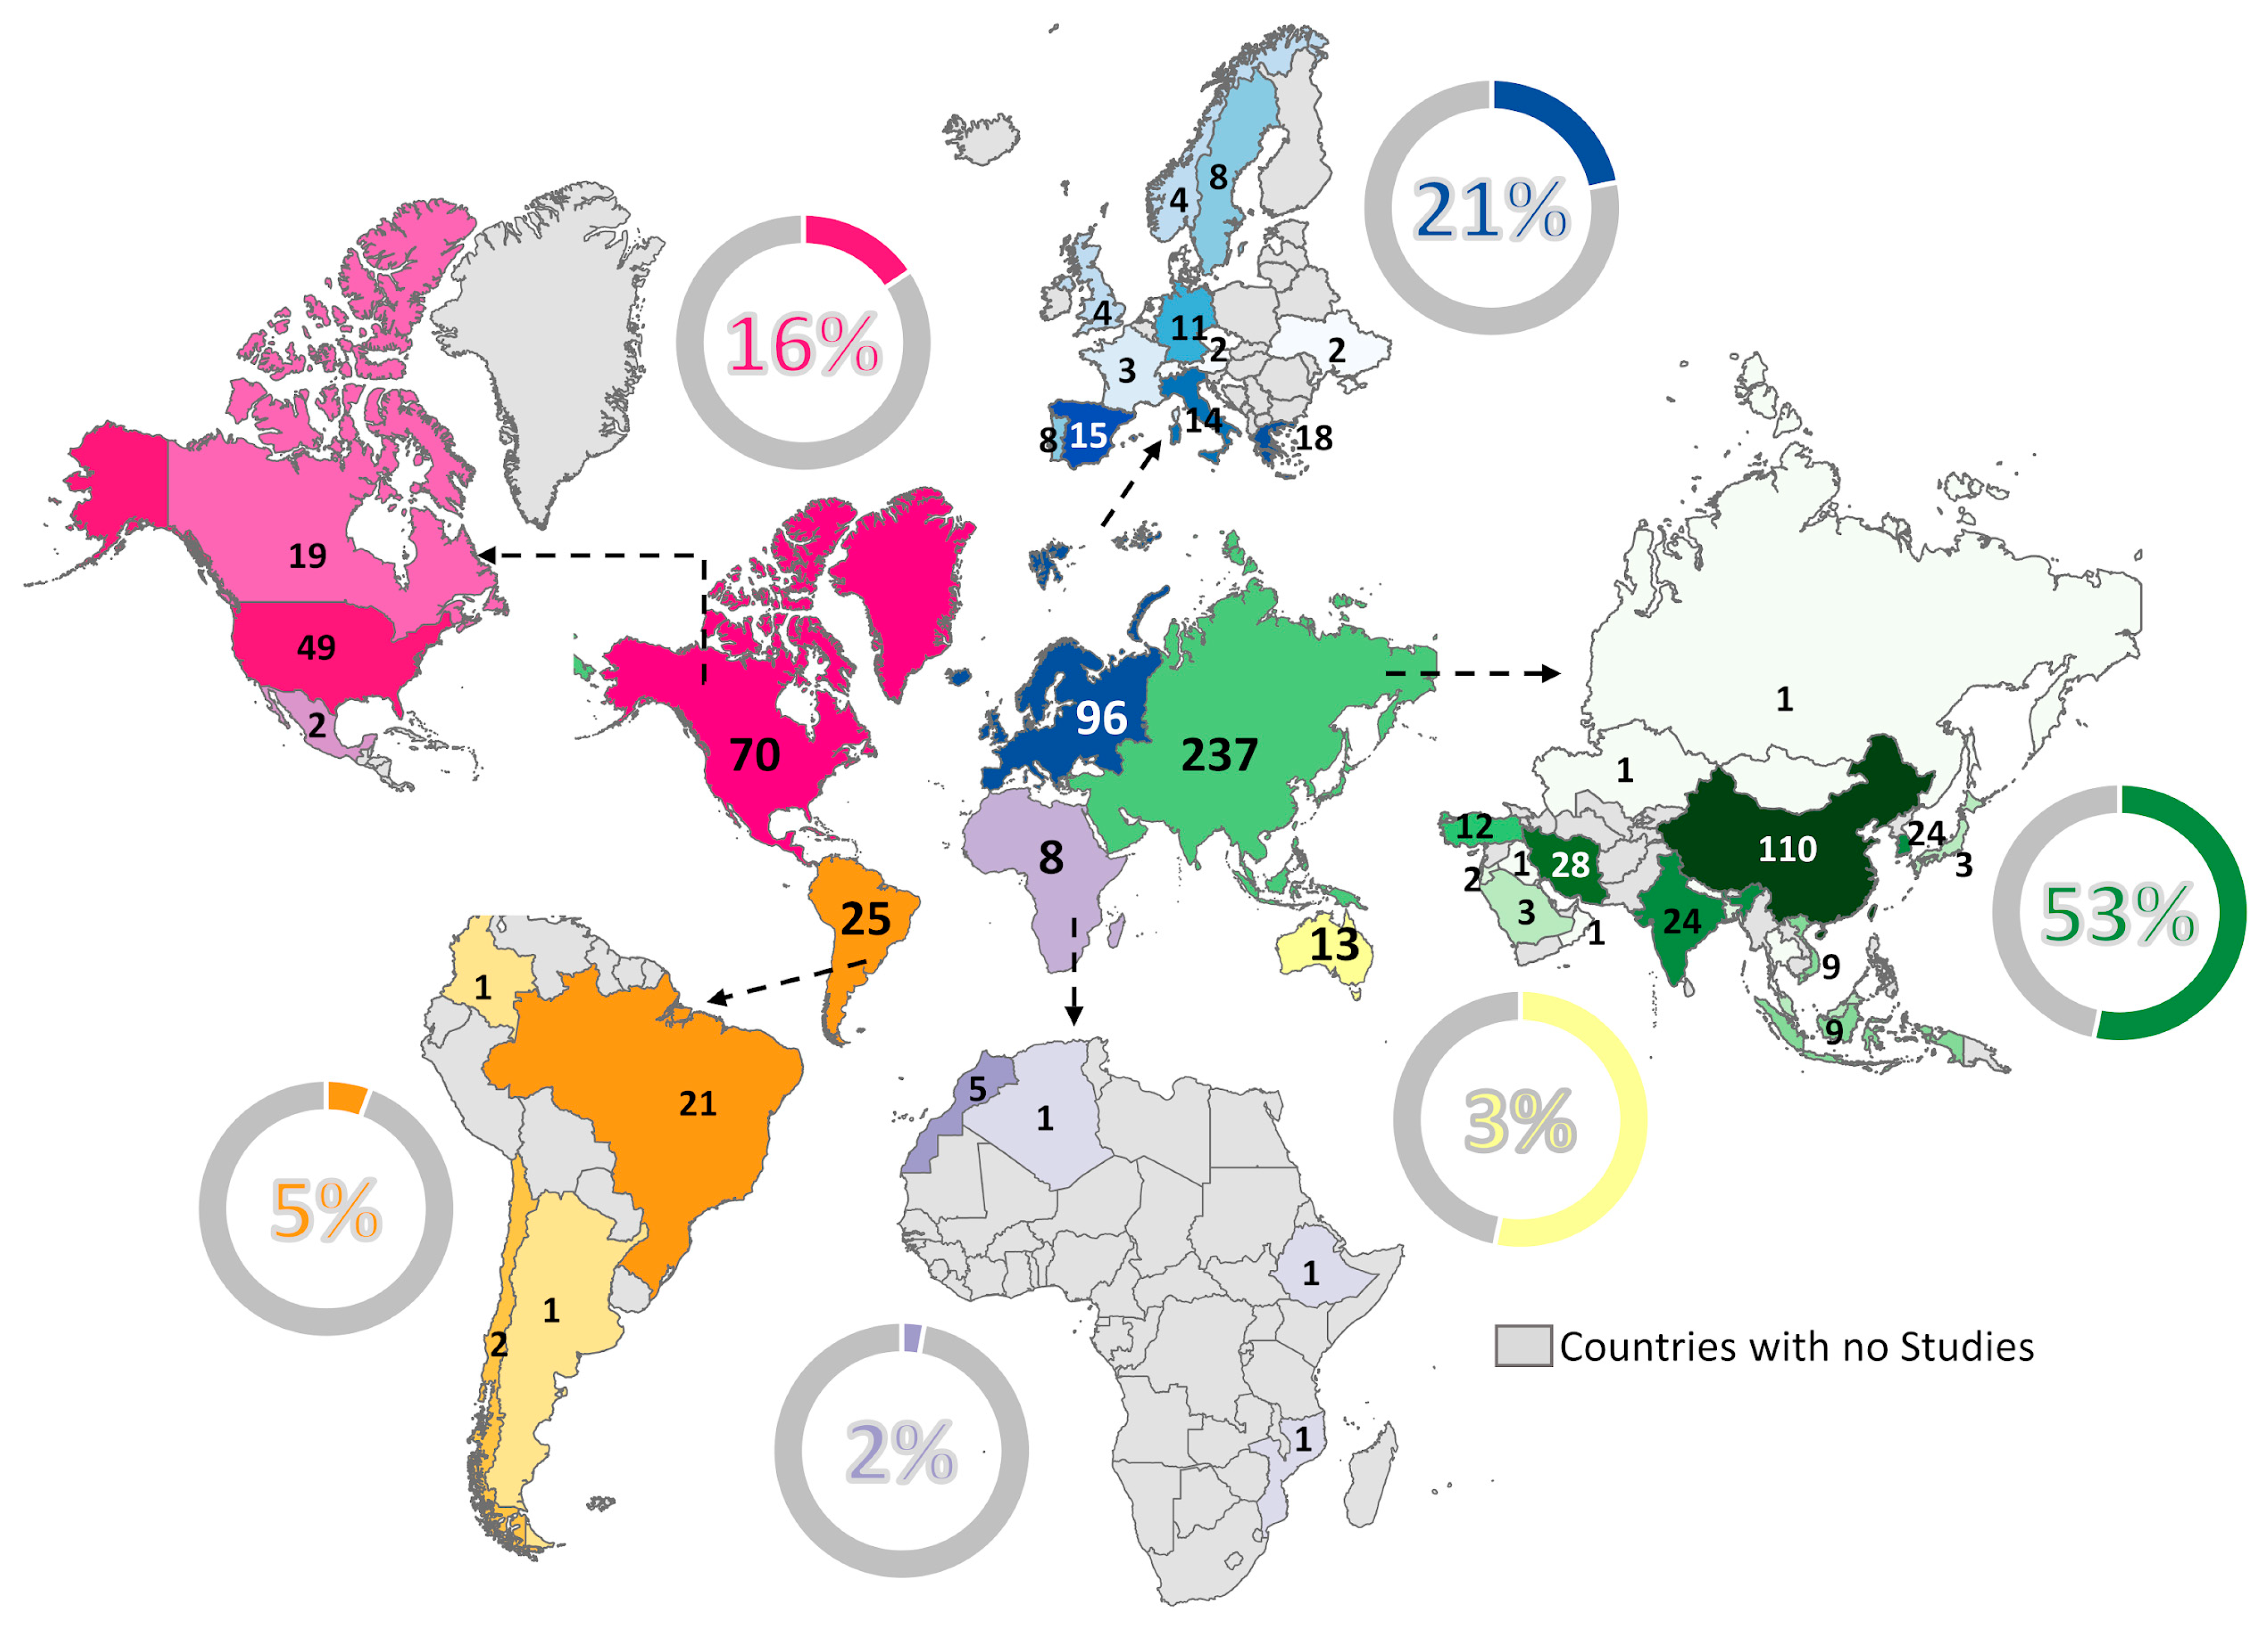
To understand the distribution of the reviewed papers worldwide,
Figure 4 presents the geographic affiliation of the first authors by continent and country. The results highlight clear global engagement in wildfire-related research, with varying contributions across regions. Among them, Asia stands out as the dominant contributor, accounting for 237 studies, or 53% of the total reviewed papers. Within Asia, China is by far the leading country with 110 studies, followed by Iran (28), India and South Korea (24 each), Turkey (12), Vietnam (9), and Indonesia (9).
Europe follows with 96 studies (21% of the reviewed papers) that show robust, distributed engagement. Greece leads with 18 publications, followed by Spain (15), Italy (14), and Germany (11). Portugal and Sweden each contributed eight studies, with Norway (4), France (3), Austria (2), and others making up the rest. Moreover, North America contributed 70 studies (16% of reviewed papers), led by the United States (US) with 49 papers and Canada with 19. Mexico accounted for two studies. Given the frequent occurrence of large wildfires in both the US and Canada, their strong research output aligns with national wildfire management and mitigation priorities.
South America produced 25 studies (5% of reviewed papers), predominantly from Brazil, contributing 21. Chile added two studies, while the remaining came from other countries. This regional contribution underscores Brazil’s increasing attention to wildfire threats, particularly in ecosystems such as the Amazon rainforest. Moreover, Africa contributed the fewest, with just 8 studies (2% of the reviewed papers). Morocco led with five publications, while Mozambique, Algeria, and Ethiopia each produced one. Australia also had a notable presence, contributing 13 studies, which account for approximately 3% of the total.
3.2. Study Area Distribution
To understand the geographic focus of the reviewed studies,
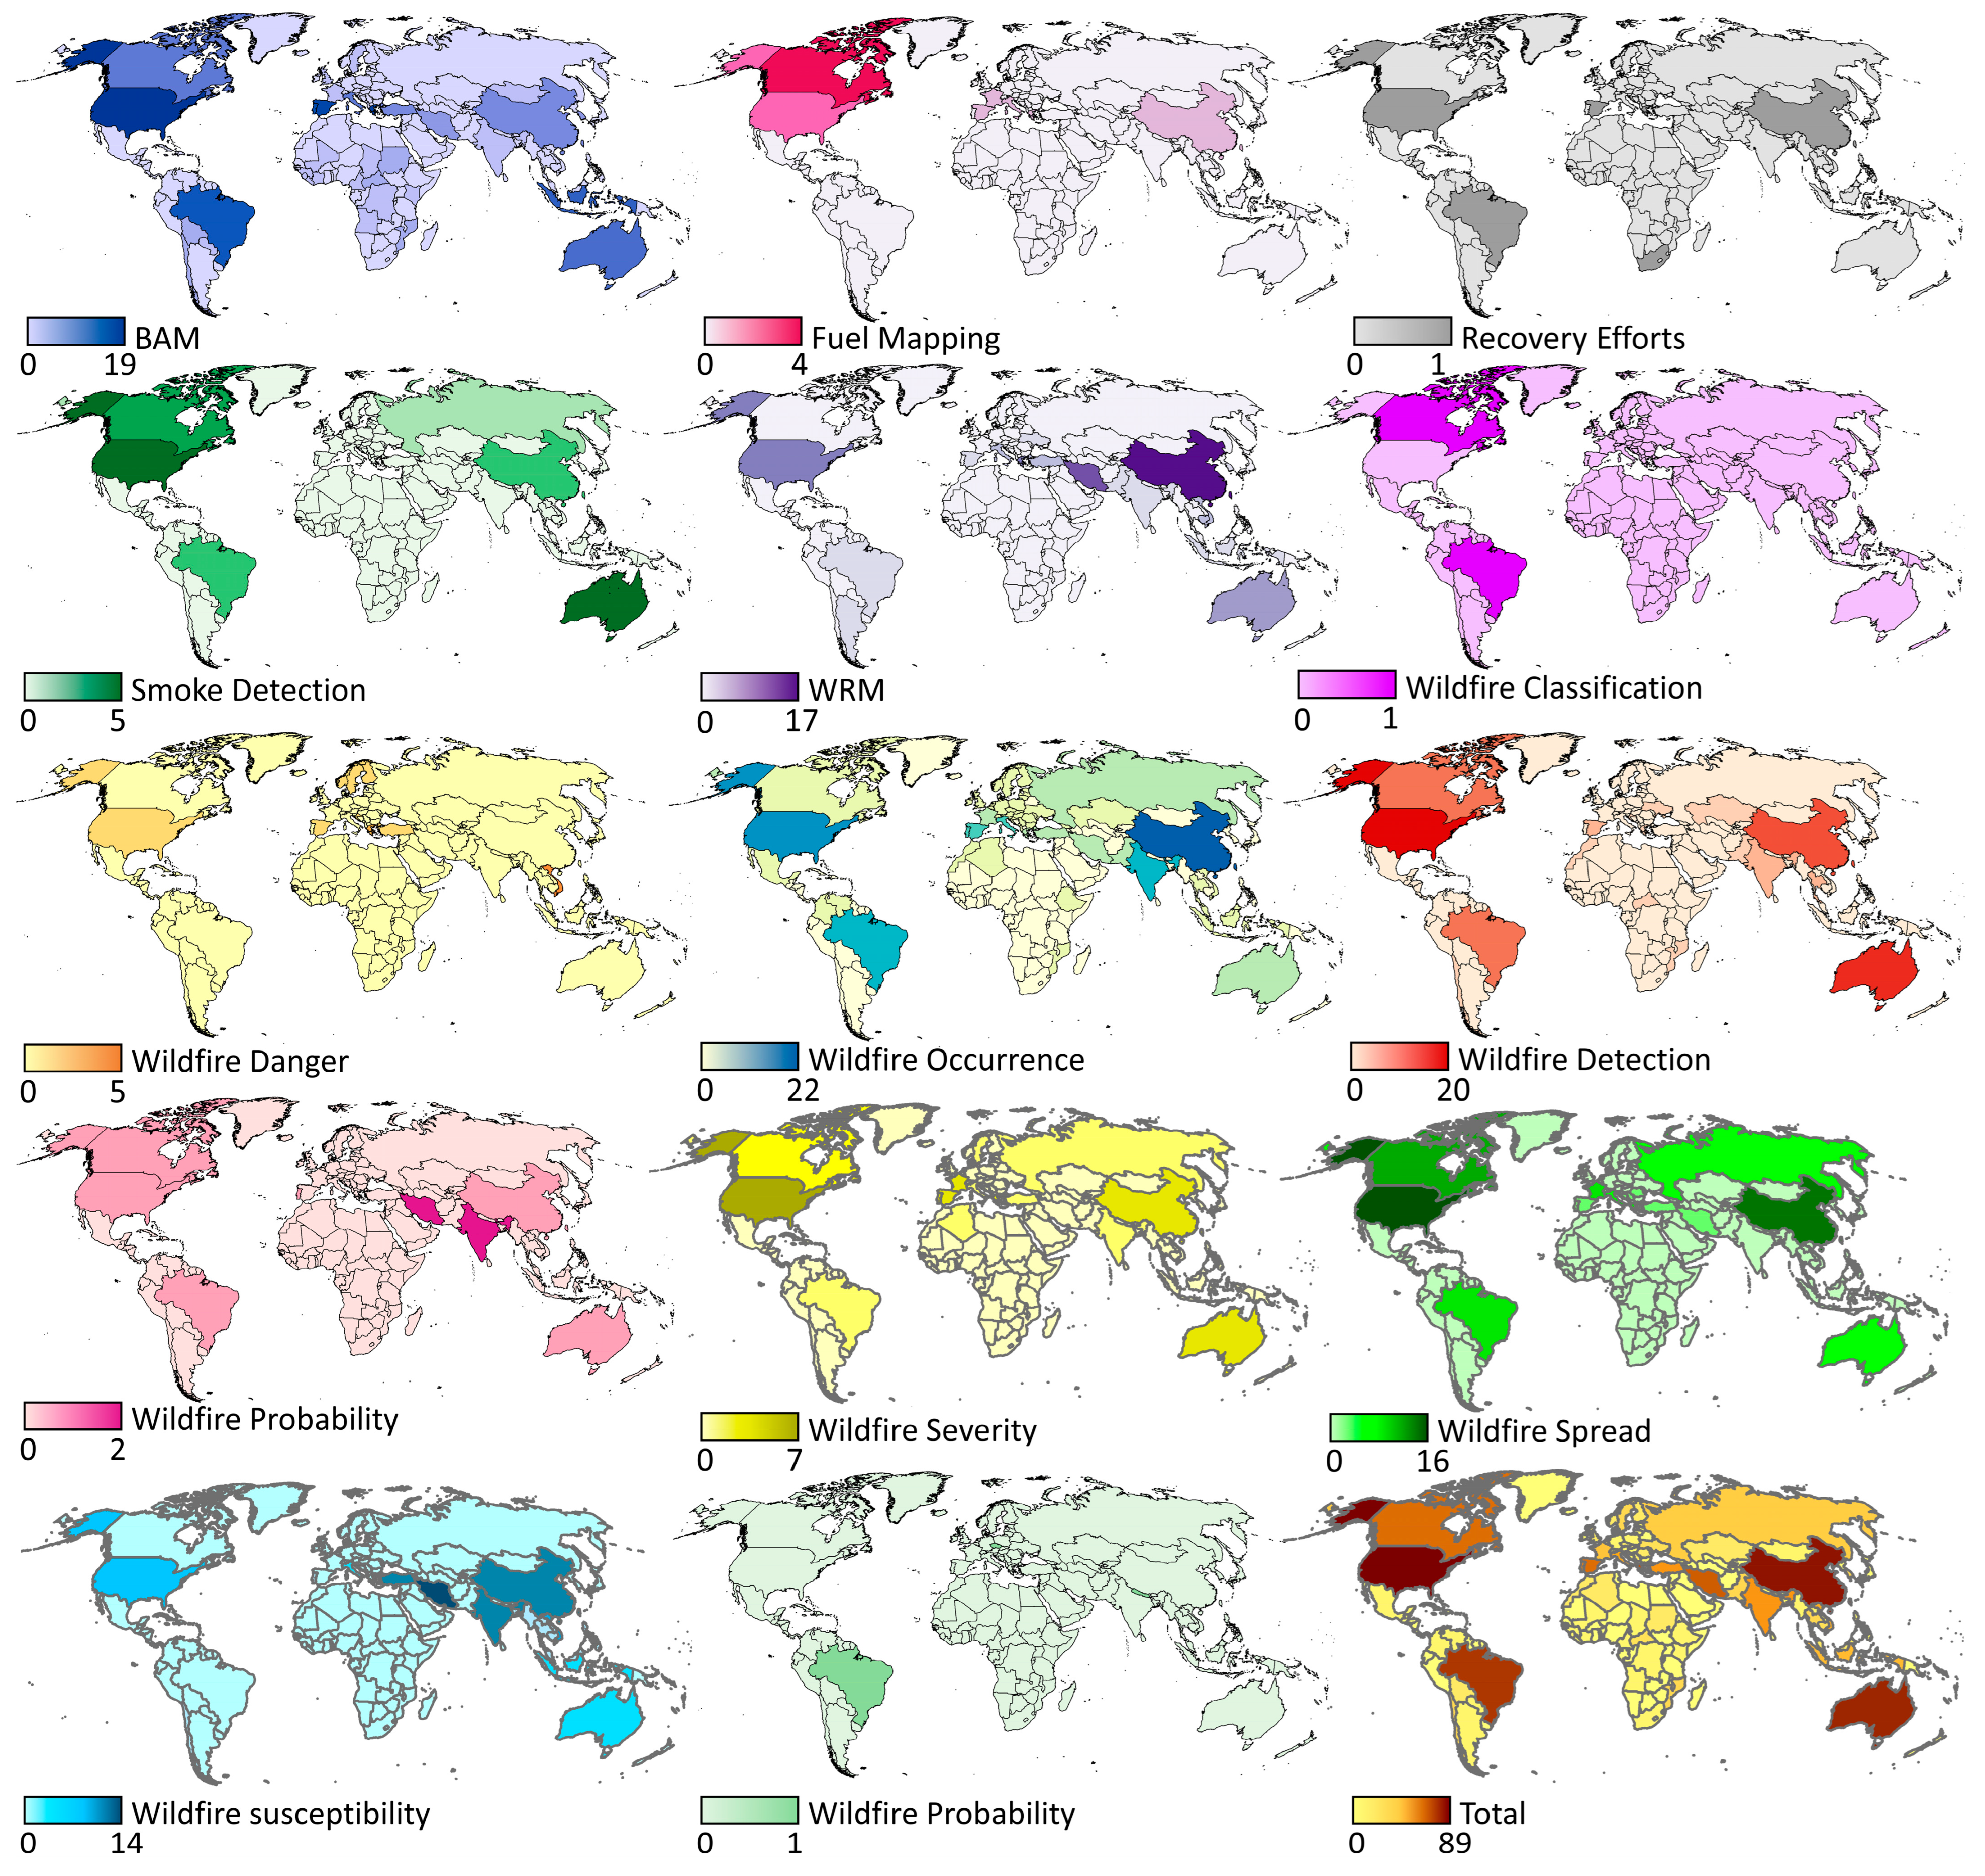
Figure 5 presents the distribution of countries used as study areas across different wildfire-related tasks. The figure highlights which countries have served as primary study areas for tasks such as wildfire detection, spread prediction, susceptibility assessment, severity mapping, recovery efforts, etc. This analysis shows geographic preferences and research trends and reflects regional wildfire challenges, data availability, and institutional research capacity.
The US is the most frequently studied region, contributing to 89 studies. It leads to tasks such as wildfire detection (20 studies), wildfire spread (16 studies), BAM (19 studies), and wildfire occurrence (9 studies), indicating a broad and balanced focus on both pre-fire and post-fire analysis.
China follows with 77 studies, primarily concentrated on wildfire occurrence (22 studies), WRM (17 studies), and wildfire detection (10 studies). Australia (35 studies), Brazil (33 studies), and Greece (30 studies) are also prominent study areas. Australia’s research is largely focused on wildfire detection and BAM, consistent with its frequent and devastating fire seasons. Brazil, known for its Amazon wildfires, has many studies focused on BAM (11) and wildfire detection (6). Greece notably emphasizes BAM (15 studies), indicating an interest in post-fire damage evaluation.
Countries like Iran and India show a more specialized research pattern. Iran is heavily represented in wildfire susceptibility (14 studies) and WRM (7 studies), while India’s research covers wildfire susceptibility (7 studies) and detection (2 studies). Canada and Spain each have 28 studies, with Canada more involved in fuel mapping and wildfire spread, and Spain in burned area and severity mapping.
Other countries such as Portugal, Turkey, Vietnam, South Korea, and France have moderate representation, each contributing 10–21 studies. These tend to focus on a narrower set of tasks, often dictated by national priorities or specific wildfire challenges. Several developing countries from Africa, Southeast Asia, and South America (e.g., Mozambique, Cambodia, Chile, and Indonesia) also appear, but with lower frequencies, often limited to one or two studies.
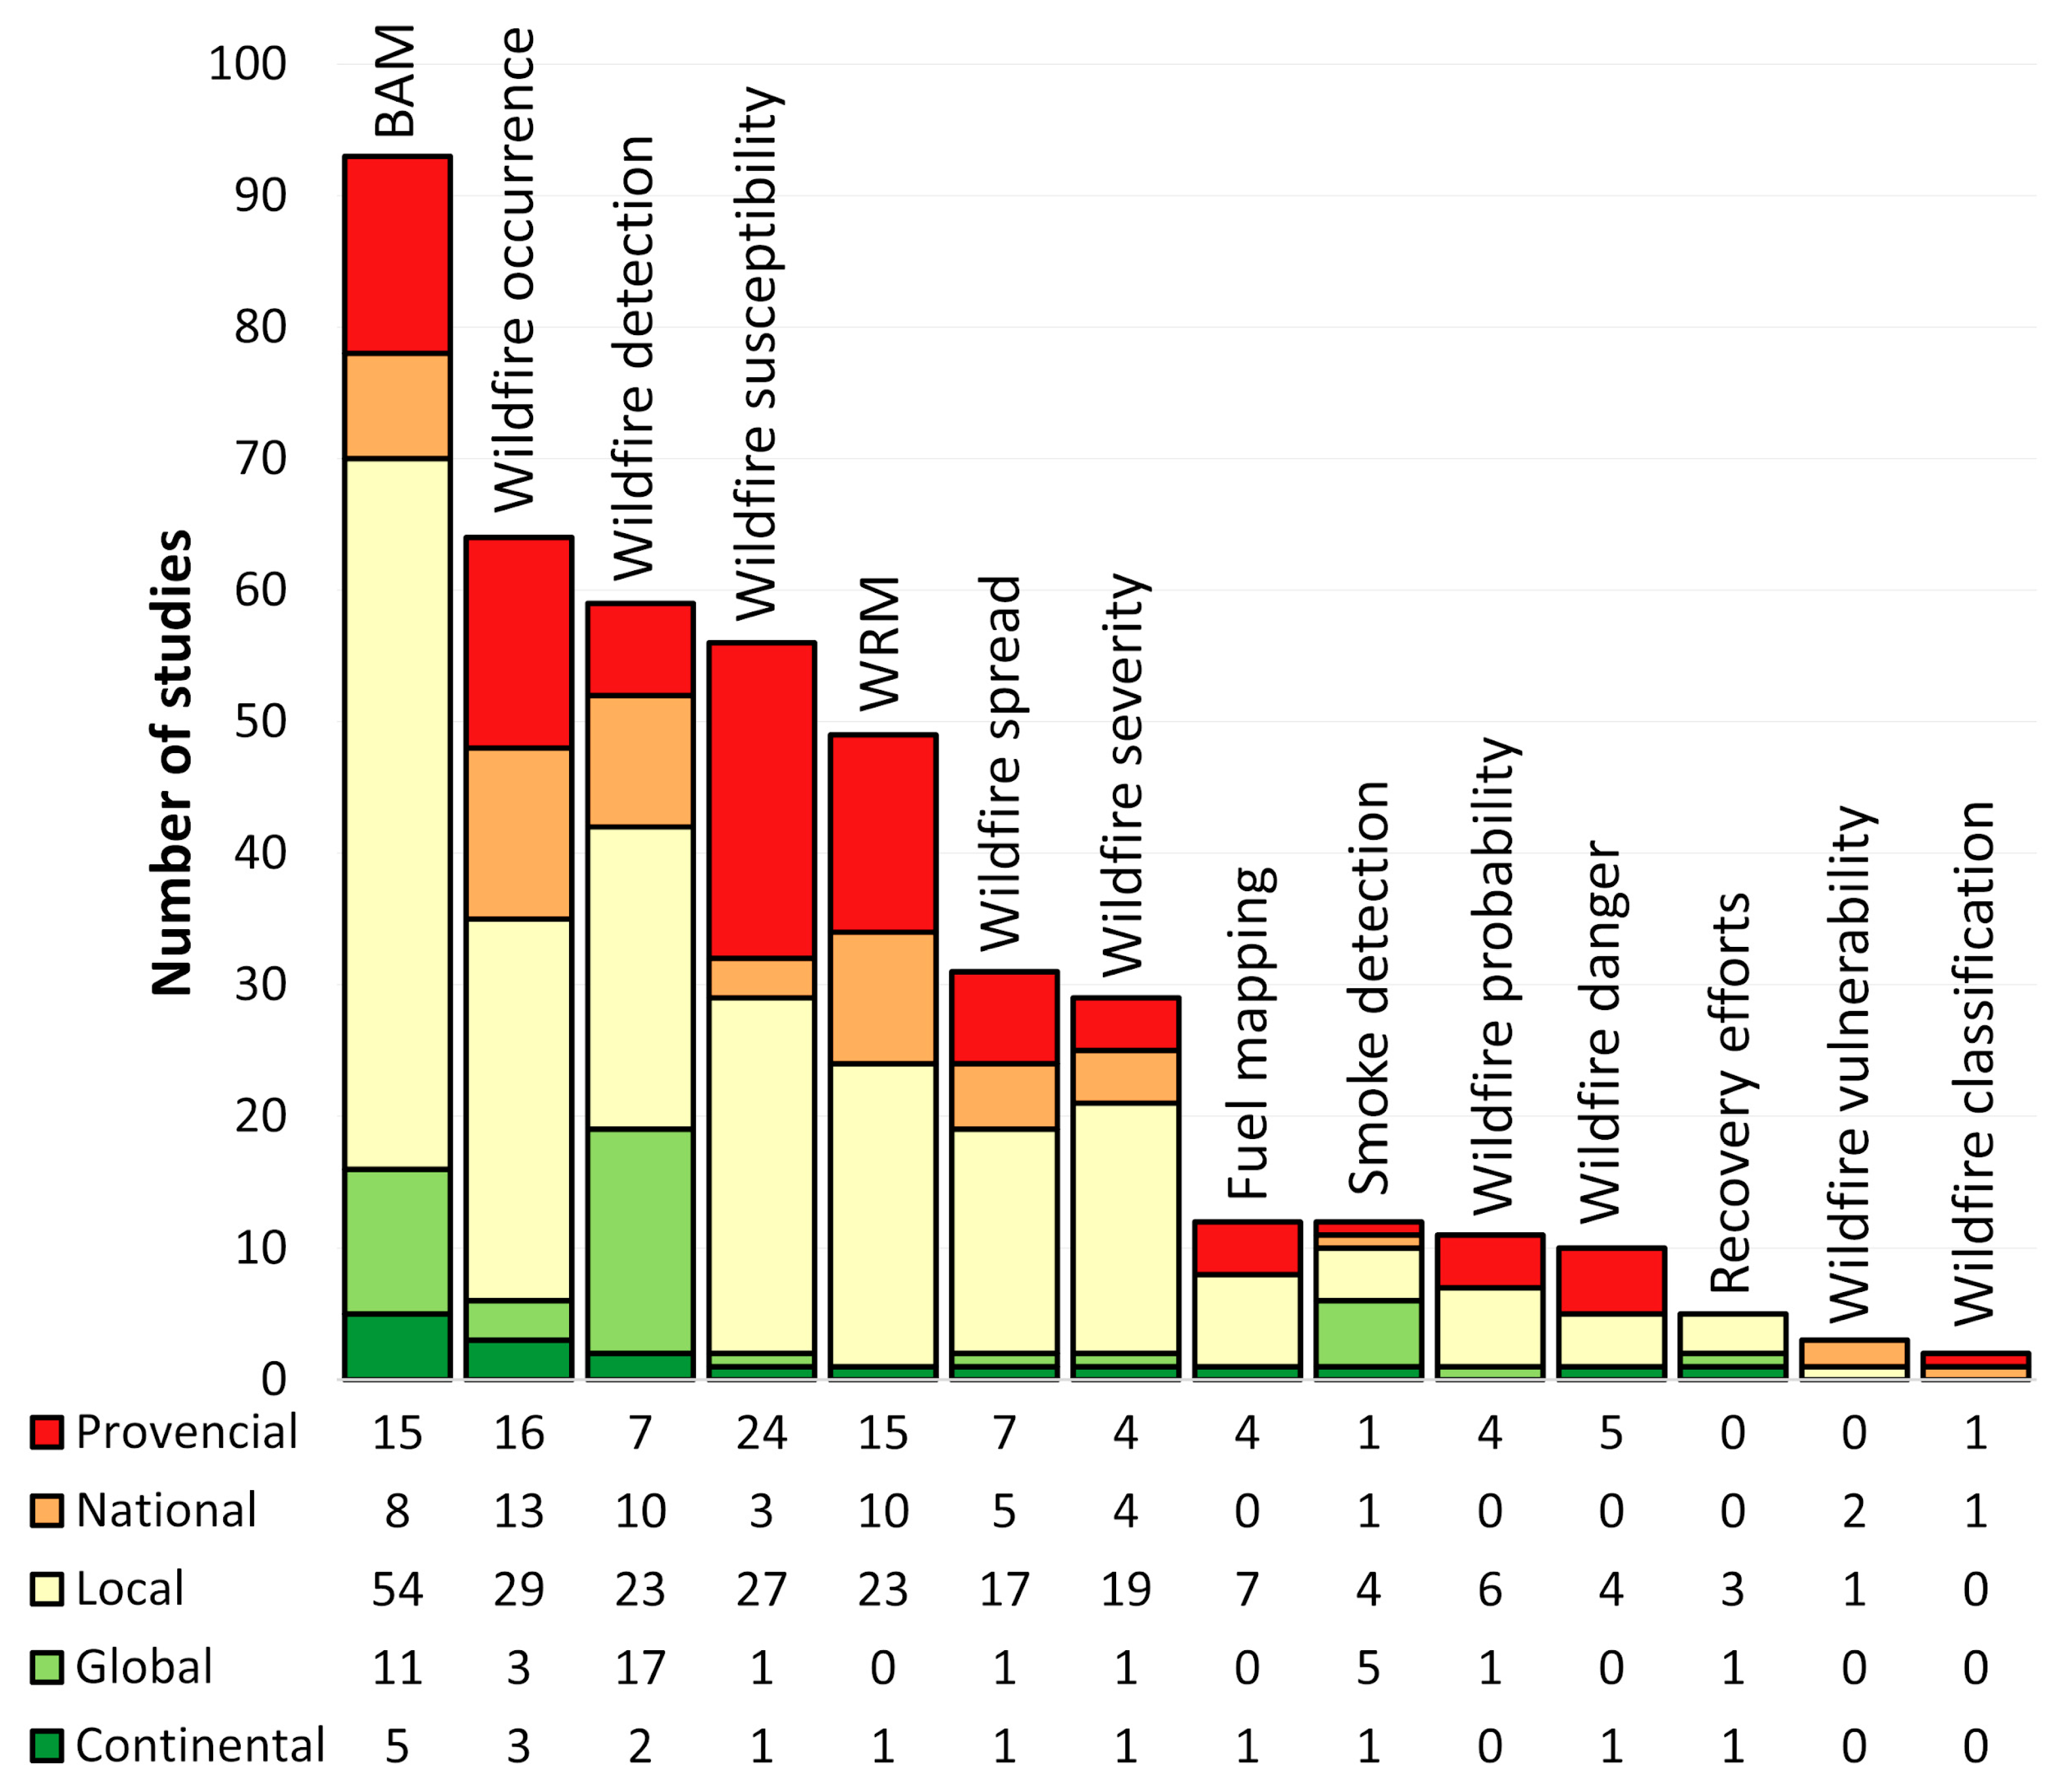
In addition to the spatial distribution of the study areas, the scale of analysis across wildfire-related tasks showed a dominant use of local-scale studies.
Figure 6 indicates the number of studies across different wildfire-related tasks at various spatial scales. BAM had the highest number of local-scale studies, with 54, followed by wildfire occurrence with 29, and wildfire detection with 23 studies. Wildfire susceptibility, WRM, and wildfire spread were also commonly investigated at the local level, with 27, 23, and 17 studies, respectively.
At the provincial and national scales, wildfire susceptibility was studied in 24 studies at the provincial level and three at the national level. Wildfire occurrence was examined in 16 provincial and 13 national studies. Similarly, wildfire detection showed 10 studies at the national level and seven at the provincial scale. WRM, wildfire spread, and wildfire severity were also addressed at both provincial and national scales, though in smaller numbers. On the other hand, fewer studies were conducted at continental and global scales. BAM included five studies at the continental level and 11 at the global scale. Wildfire detection had 17 continental and two global studies. Other tasks, such as smoke detection, wildfire probability, and wildfire severity, had limited representation at these broader scales. Tasks like wildfire classification, recovery efforts, and vulnerability were addressed in a few studies, with most limited to one or two instances across all scales.
3.3. Data Type
3.3.1. Environmental Variables
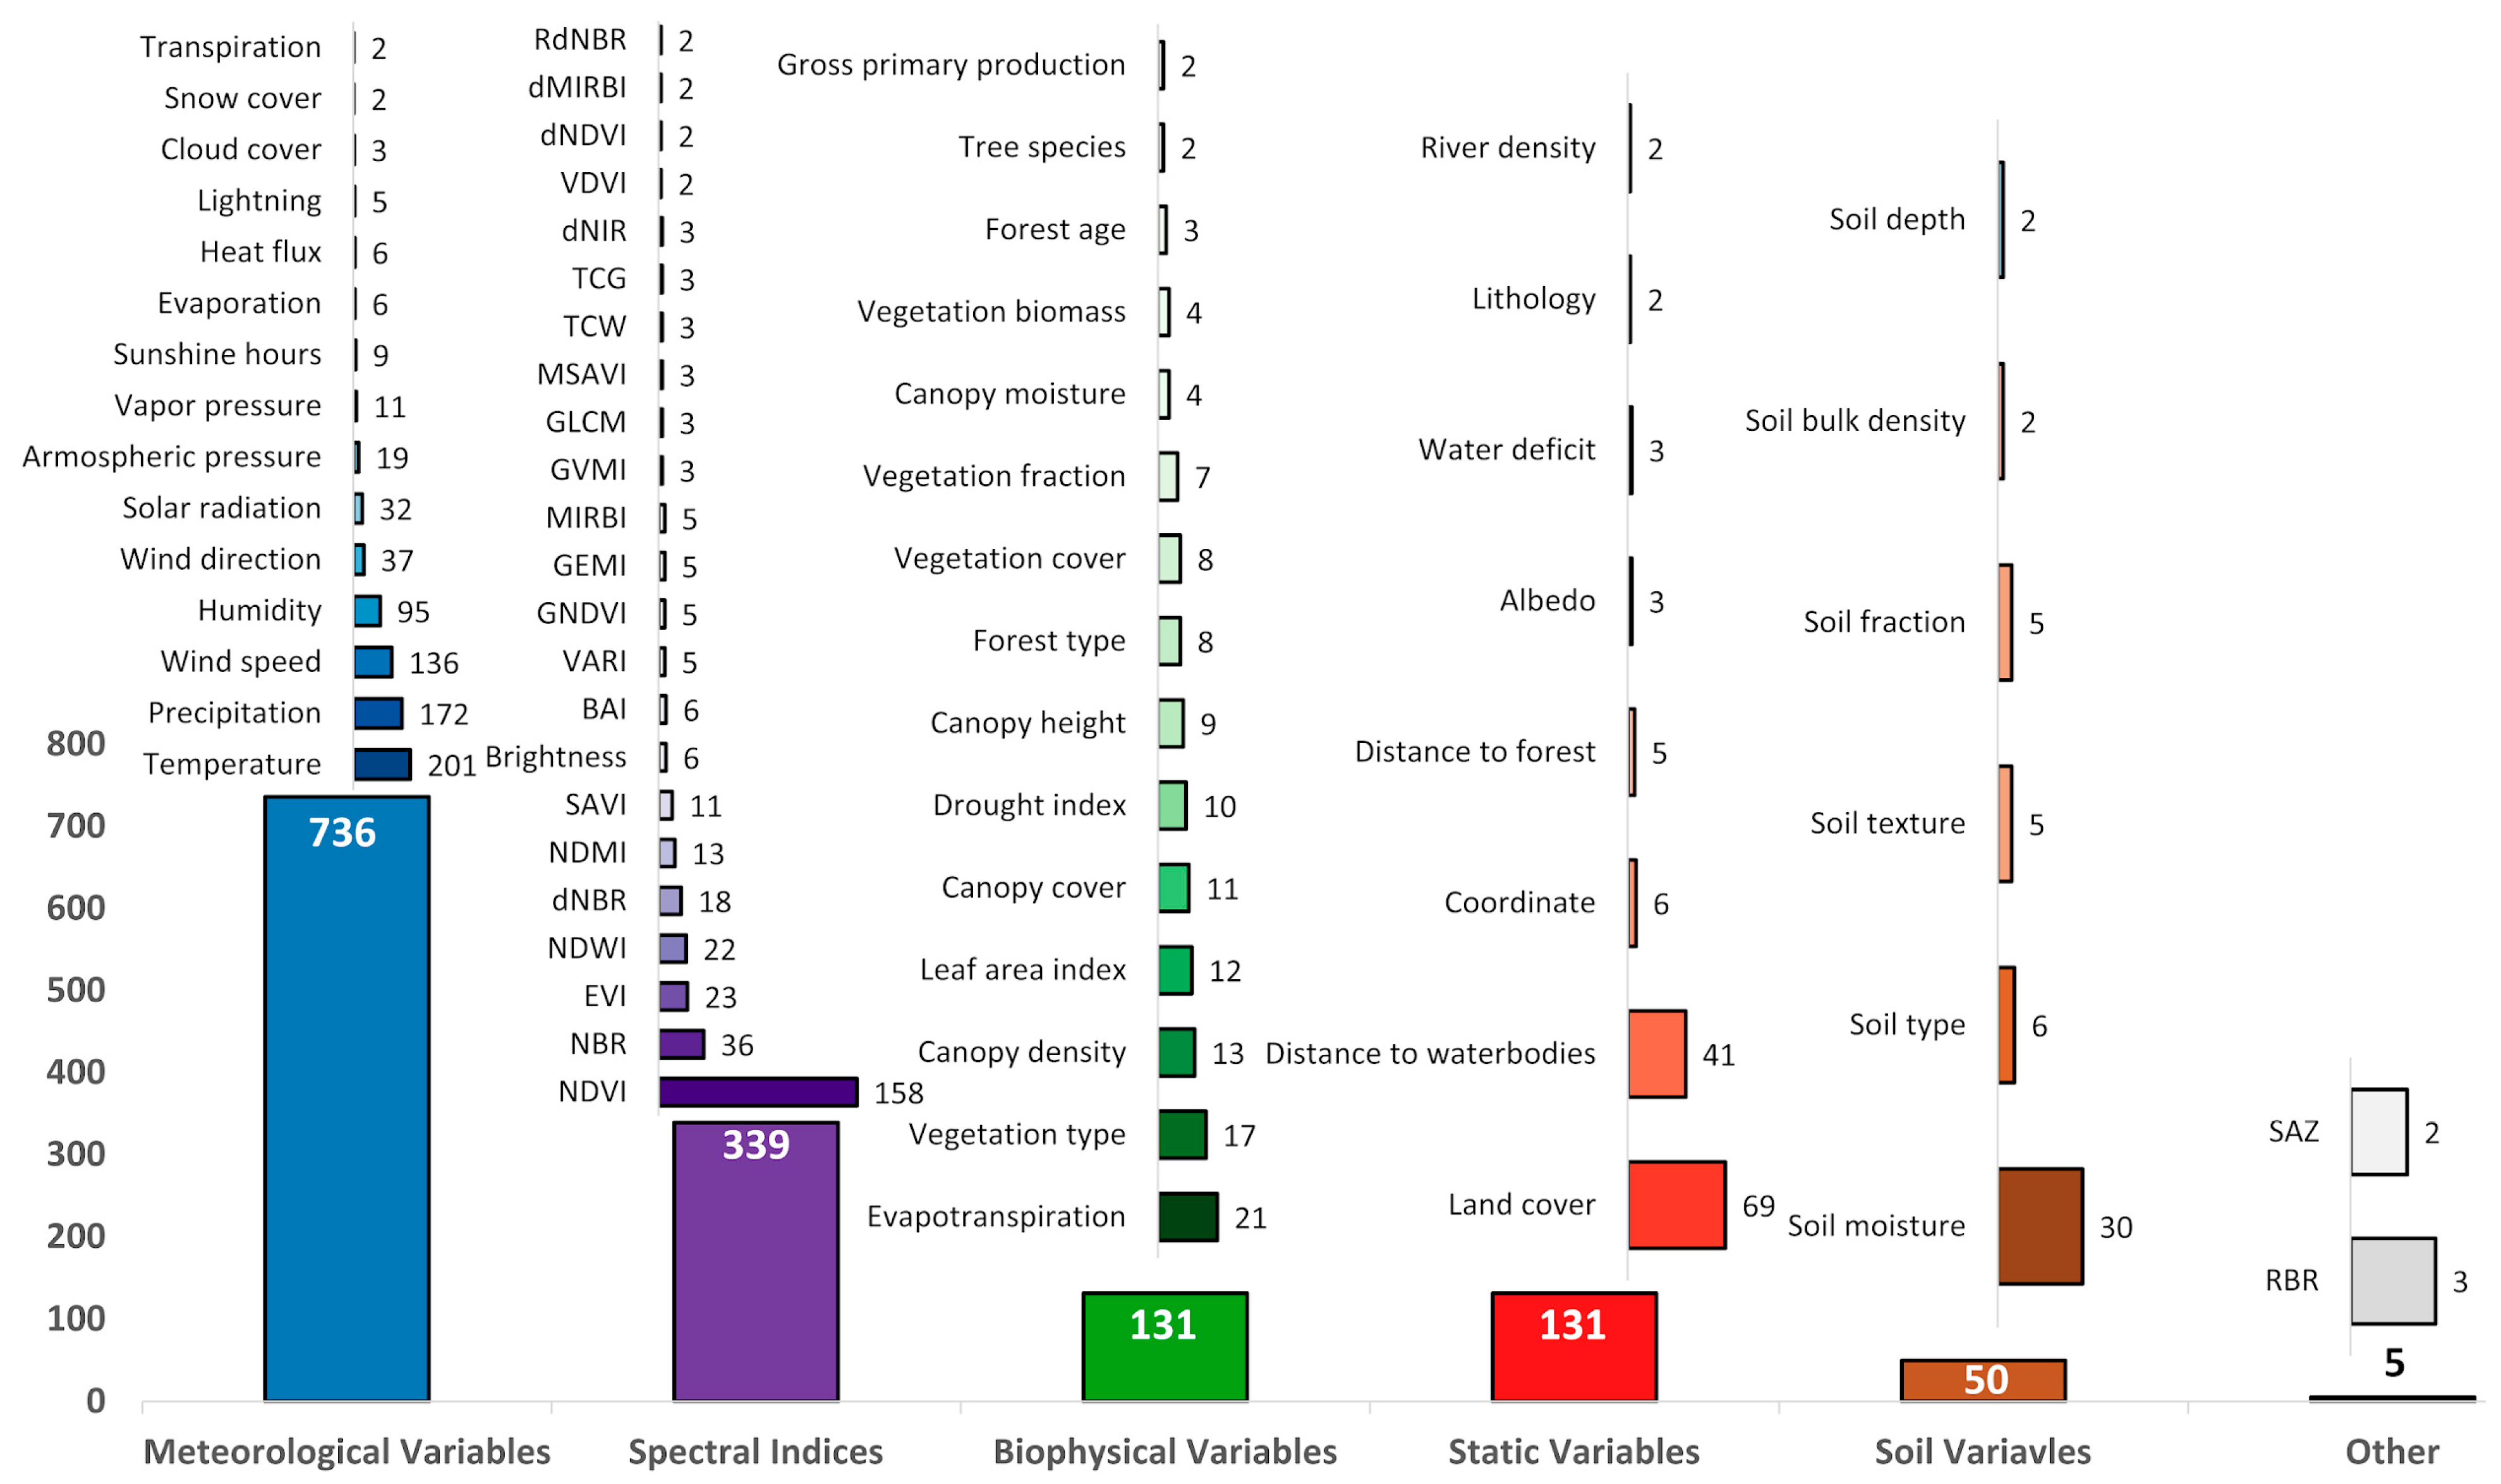
Wildfire is a process in which various parameters interact. This section investigates six main groups of variables: meteorological variables, spectral indices, biophysical variables, static variables, soil variables, and others, as shown in
Figure 7. It is important to note that this classification did not include raw data from passive and active sensors, such as optical bands and topographic variables. These data types will be discussed in the following section.
The analysis reveals that meteorological variables were the most used geospatial data type across wildfire-related studies, totaling 709 occurrences. Among these, temperature was the most frequently included variable in 201 studies. Precipitation closely followed, with 172 studies citing it. Moreover, wind speed was used in 136 studies, reflecting its impact on wildfire spread direction and velocity. Additionally, humidity appeared in 95 studies, while wind direction, solar radiation, and atmospheric pressure were reported in 37, 32, and 19 studies, respectively. Less commonly used variables such as vapor pressure, sunshine hours, evaporation, heat flux, lightning, cloud cover, snow cover, and transpiration were also included, though their frequencies were relatively low.
The second largest group comprised spectral indices, with 339 occurrences, reflecting the growing reliance on RS-derived vegetation and burn metrics in wildfire research. The Normalized Difference Vegetation Index (NDVI) was the most prominent index, featured in 158 studies. Other widely used indices included the Normalized Burn Ratio (NBR) in 36 studies, the Enhanced Vegetation Index (EVI) in 23, and the Normalized Difference Water Index (NDWI) in 22 studies. A variety of other indices were also reported, such as the Normalized Difference Moisture Index (NDMI), Soil Adjusted Vegetation Index (SAVI), Brightness, Burned Area Index (BAI), Visible Atmospherically Resistant Index (VARI), Green Normalized Difference Vegetation Index (GNDVI), Global Environmental Monitoring Index (GEMI), Mid-Infrared Burn Index (MIRBI), and Global Vegetation Moisture Index (GVMI), as well as more complex transformations like the Modified Soil Adjusted Vegetation Index (MSAVI), Tasseled Cap Wetness (TCW), Tasseled Cap Greenness (TCG), and change-based indices such as dNDVI (delta NDVI), dNBR (delta NBR), and dMIRBI (delta MIRBI). This wide range of indices reflects the diversity of spectral signals relevant to various wildfire phenomena, from pre-fire vegetation conditions to post-fire severity assessments.
Biophysical and static variables are the most used groups, with 131 occurring similarly. The most used biophysical indicators were evapotranspiration in 21 studies, vegetation type in 17, canopy density in 13, and leaf area index in 12. Other important features included canopy cover, canopy height, drought indices, and forest type, each contributing to fuel structure, biomass, and ecosystem conditions. Several studies also incorporated vegetation cover, fraction, canopy moisture, biomass, forest age, and tree species to understand vegetation’s role in wildfire susceptibility and behavior. Among the static group that provides contextual spatial information, the most common were land cover, present in 69 studies, followed by distance to waterbodies in 41, and geographic coordinates in 6. Other static parameters included distance to forest, albedo, water deficit, lithology, and river density, suggesting that landscape configuration and background geologic or hydrologic features also play a part in wildfire modeling efforts.
Although important for understanding moisture retention and vegetation support, soil variables were reported 50 times. Among these, soil moisture was the most frequent, with 30 studies, followed by soil type, texture, fraction, bulk density, and depth. Finally, a few studies (categorized as Other) incorporated specialized variables, such as the Relativized Burn Ratio (RBR) and the Satellite zenith angle (SAZ), which appeared in 3 and 2 studies, respectively.
3.3.2. Satellite Data
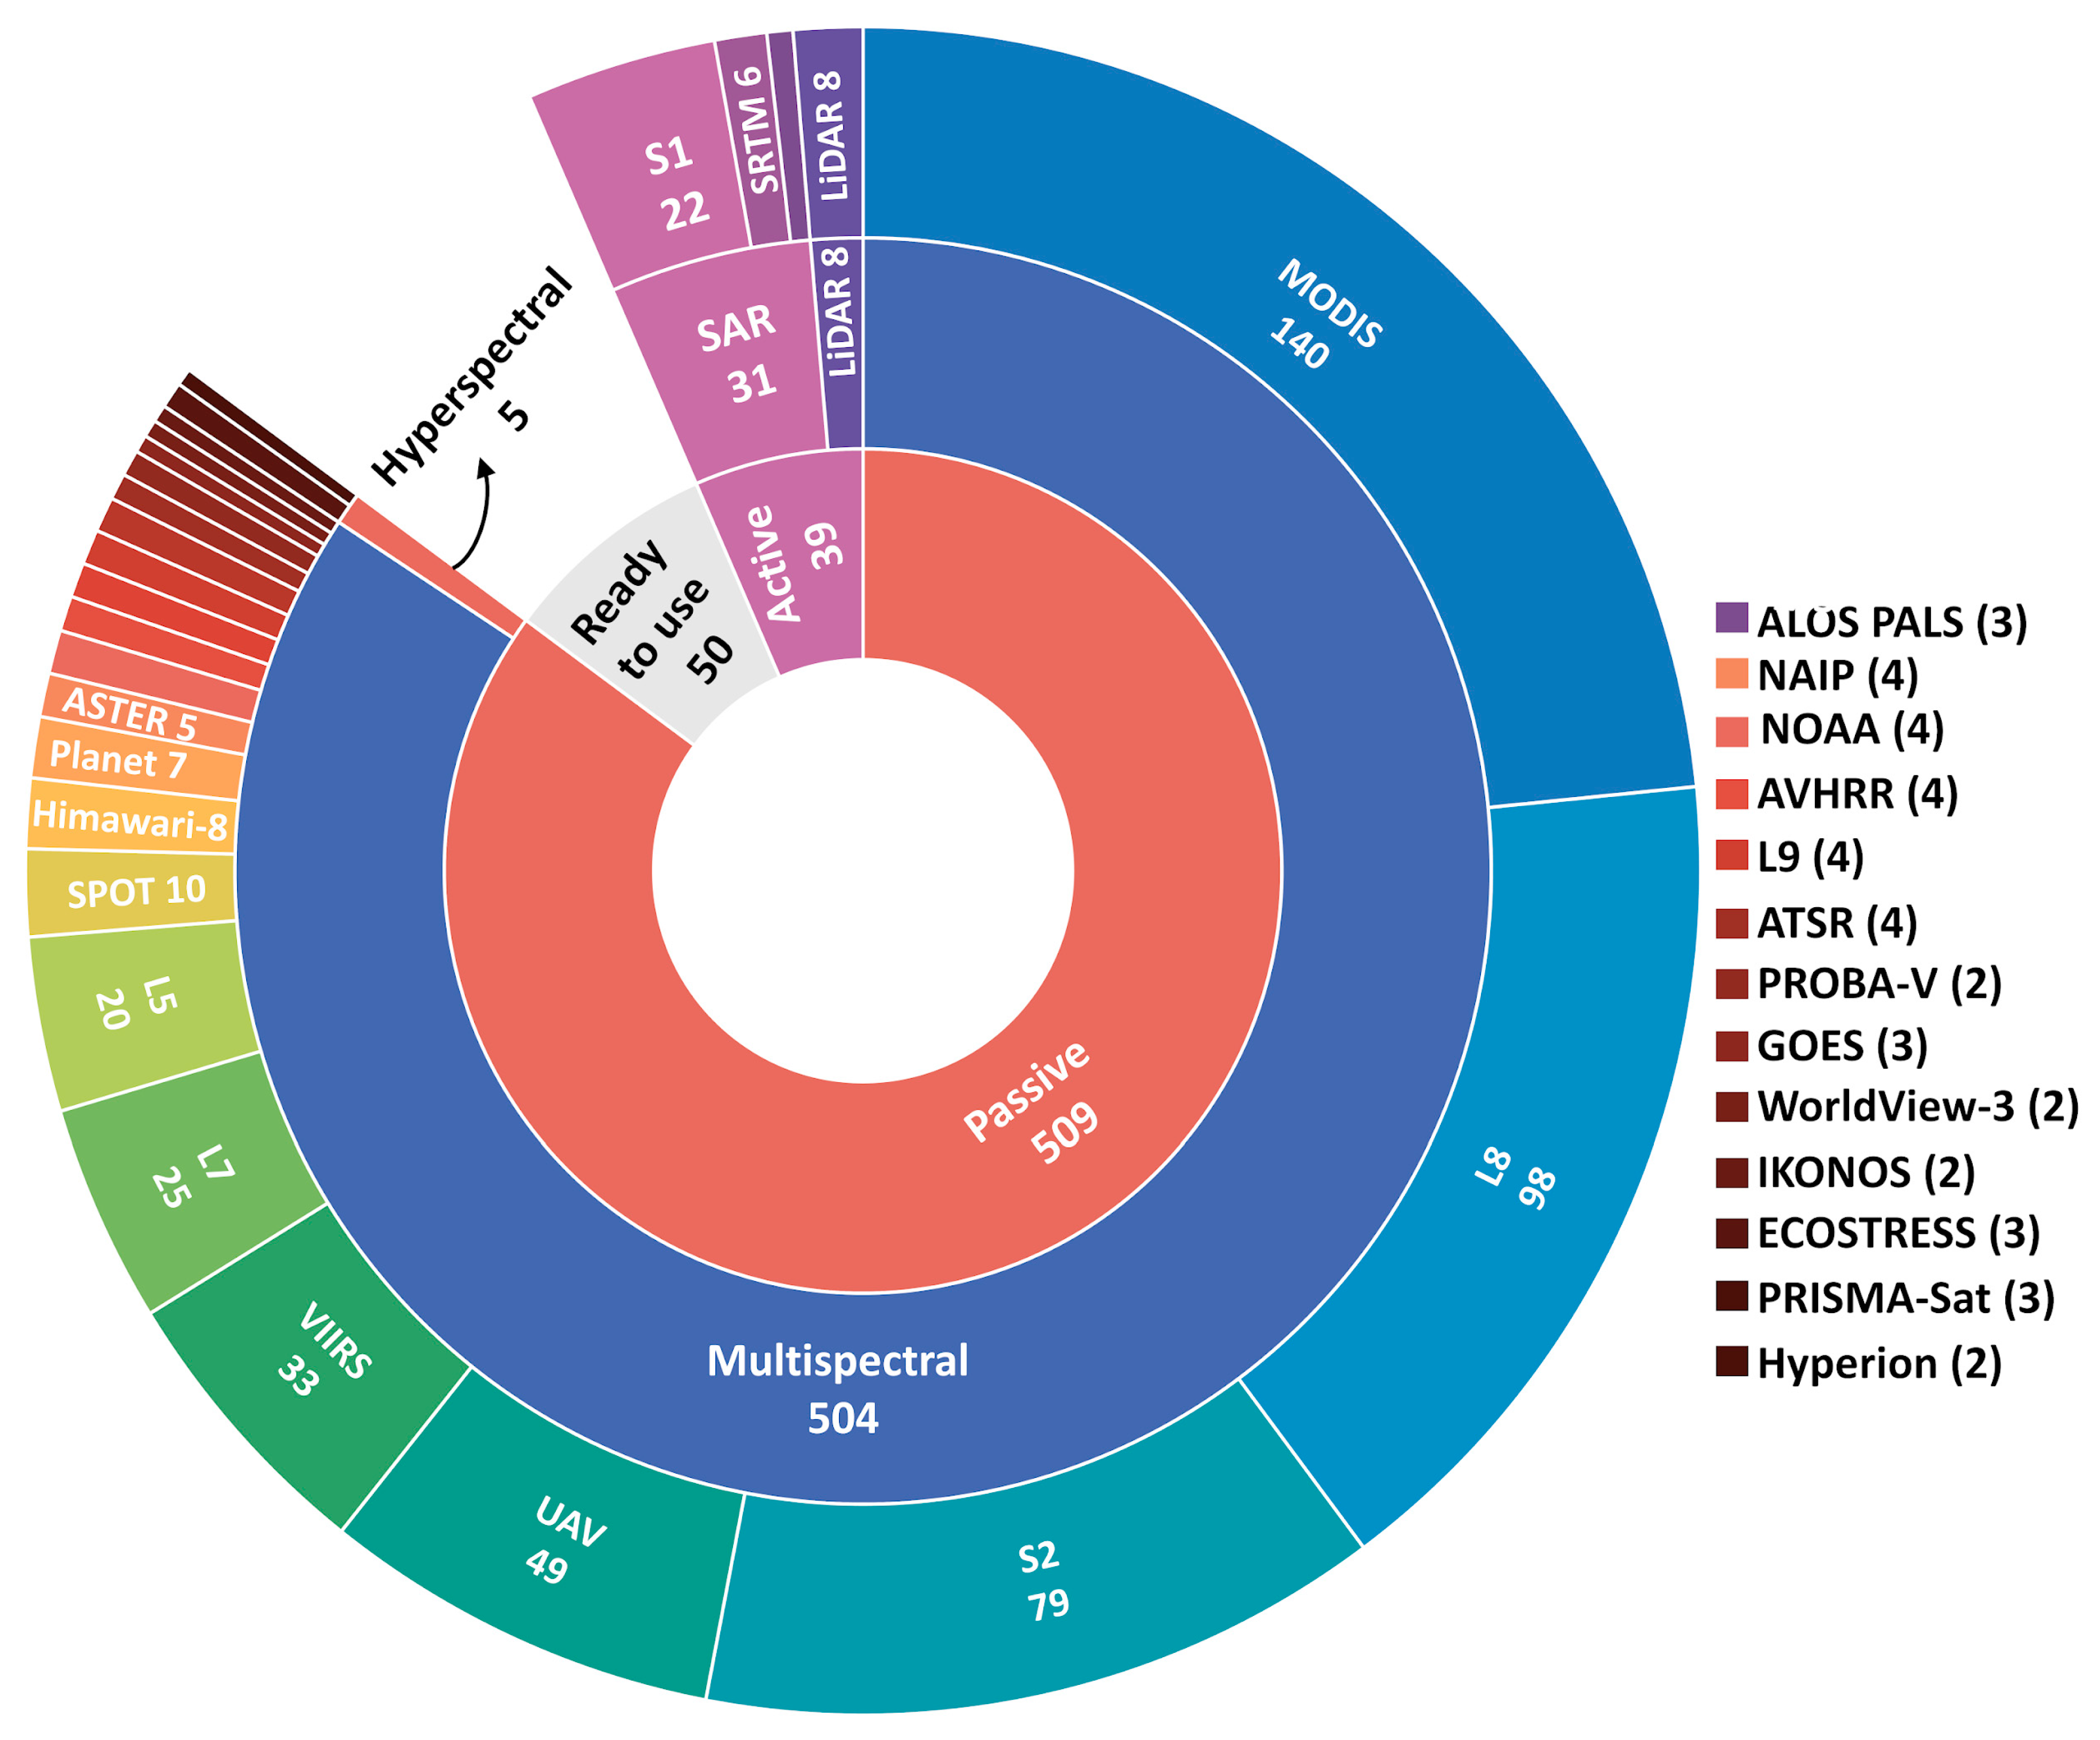
Figure 8 shows the number of studies that used different types of RS data in wildfire-related research. Among these, active RS was used in 39 studies. Synthetic Aperture Radar (SAR) was the most widely used active data type, appearing in 31 studies. Sentinel-1 (S1) was the most frequently used SAR sensor, with 22 studies, while Shuttle Radar Topography Mission (SRTM) and Advanced Land Observing Satellite—Phased Array type L-band Synthetic Aperture Radar (ALOS PALSAR) were used in six and three studies, respectively. In addition to SAR, Light Detection and Ranging (LiDAR) data were used in eight studies, highlighting a smaller but notable application of laser-based elevation or vegetation structure data in wildfire studies.
Passive RS sources were significantly more common and utilized 509 times. Within this category, multispectral (MS) data dominated, accounting for 504 times. The Moderate Resolution Imaging Spectroradiometer (MODIS) was the most widely used passive sensor, cited in 140 studies. Landsat-8 (L8) appeared in 98 studies, followed by Sentinel-2 (S2) in 79 and UAV-based MS imagery in 46. Several other MS satellite sensors were also represented, including Visible Infrared Imaging Radiometer Suite (VIIRS) in 33 studies, Landsat-7 (L7) in 25, Landsat-5 (L5) in 20, and Satellite Pour l’Observation de la Terre (SPOT) in 10. Himawari-8 and Planet imagery were each used in eight and seven studies, respectively. Other sources, such as Advanced Spaceborne Thermal Emission and Reflection Radiometer (ASTER), Advanced Very High-Resolution Radiometer (AVHRR), National Oceanic and Atmospheric Administration (NOAA), National Agriculture Imagery Program (NAIP), Landsat-9 (L9), Along-Track Scanning Radiometer (ATSR), Geostationary Operational Environmental Satellite (GOES), Ecosystem Spaceborne Thermal Radiometer Experiment on Space Station (ECOSTRESS), WorldView-3, IKONOS, and Project for On-Board Autonomy—Vegetation (PROBA-V), were used in fewer than six studies each.
Hyperspectral (HS) data were the least commonly used passive source, appearing in only five studies. Among these, PRecursore IperSpettrale della Missione Applicativa Satellite (PRISMA-Sat) was used in three studies, and Hyperion in two. In addition to raw RS data, 50 studies used ready-to-use products that were not sensor-specific but derived datasets prepared for direct analysis.
3.3.3. Topographic Variables
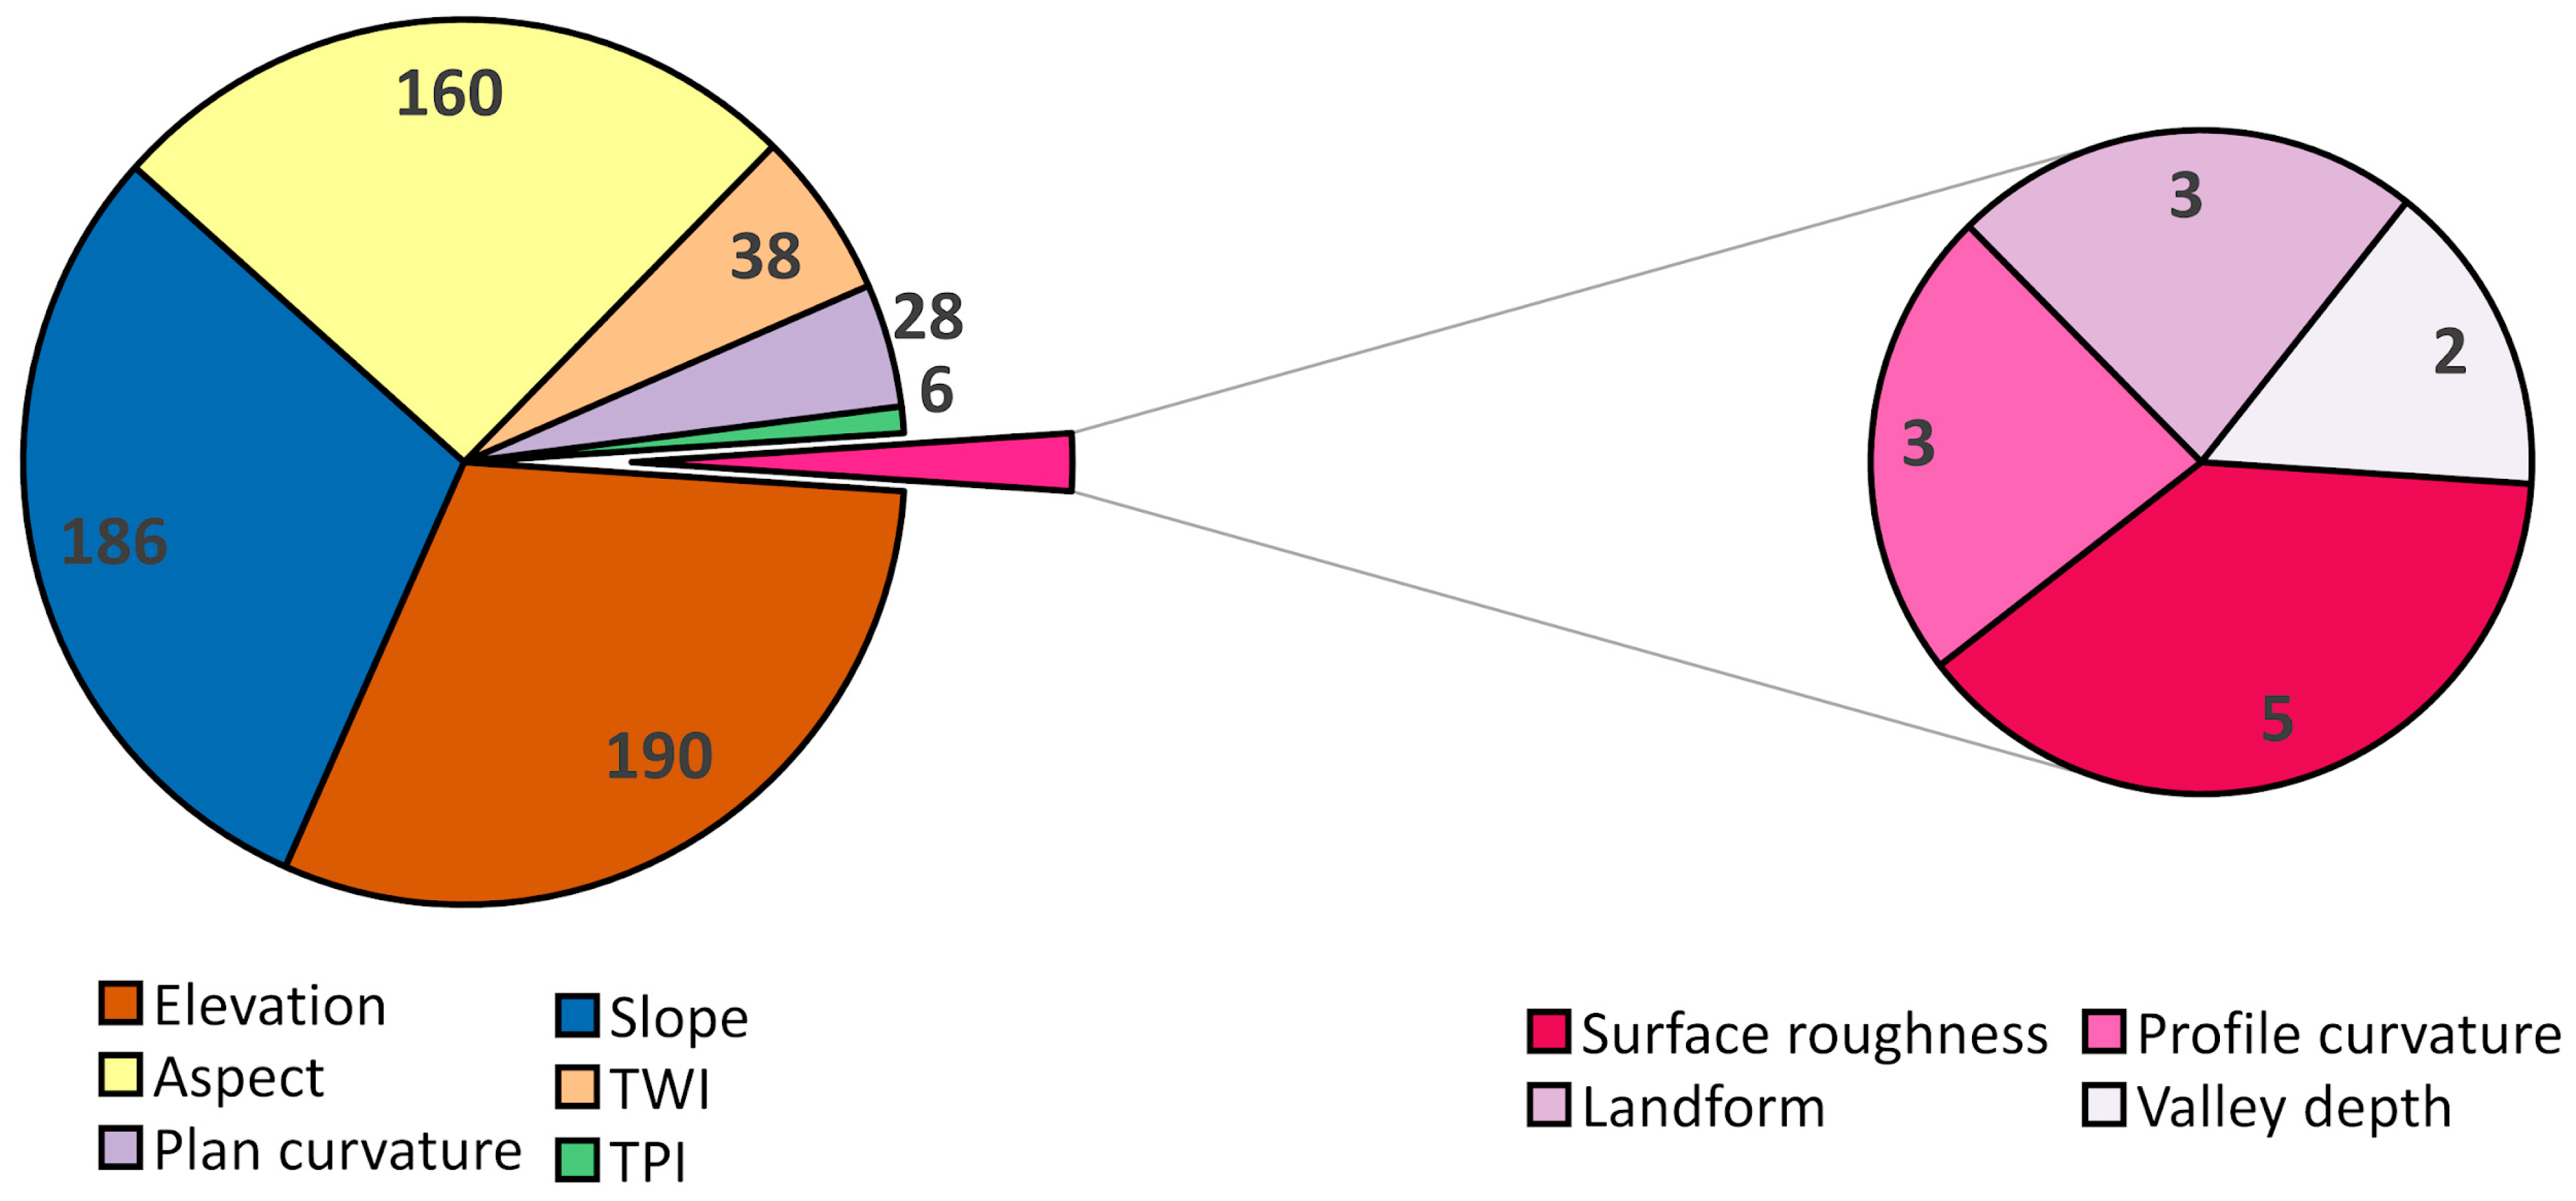
Topographic variables are another important data type frequently incorporated into wildfire-related studies. As shown in
Figure 9, elevation was the most used topographic feature, appearing in 190 studies, followed closely by slope in 186 studies and aspect in 160 studies. These three variables form the foundation of terrain analysis in wildfire research due to their significant influence on wildfire behavior and spread patterns. In addition to these core variables, more specialized terrain attributes were utilized less frequently. The Topographic Wetness Index (TWI) was reported in 38 studies, whereas plan curvature was reported in 28 studies. Other variables, such as the Topographic Position Index (TPI), surface roughness, profile curvature, landform, and valley depth, were included in fewer than 10 studies each. This pattern highlights the predominant use of basic elevation-derived parameters in wildfire modeling, with the limited but notable inclusion of more advanced topographic metrics.
3.3.4. Wildfire-Related Variables
Wildfire-related variables are another important data type used in wildfire research and are vital in understanding wildfire behavior, fuel characteristics, and the potential for wildfire spread. These variables include indices, fuel types, moisture content, and fire weather parameters that enable the prediction of wildfire danger, intensity, and spread patterns.
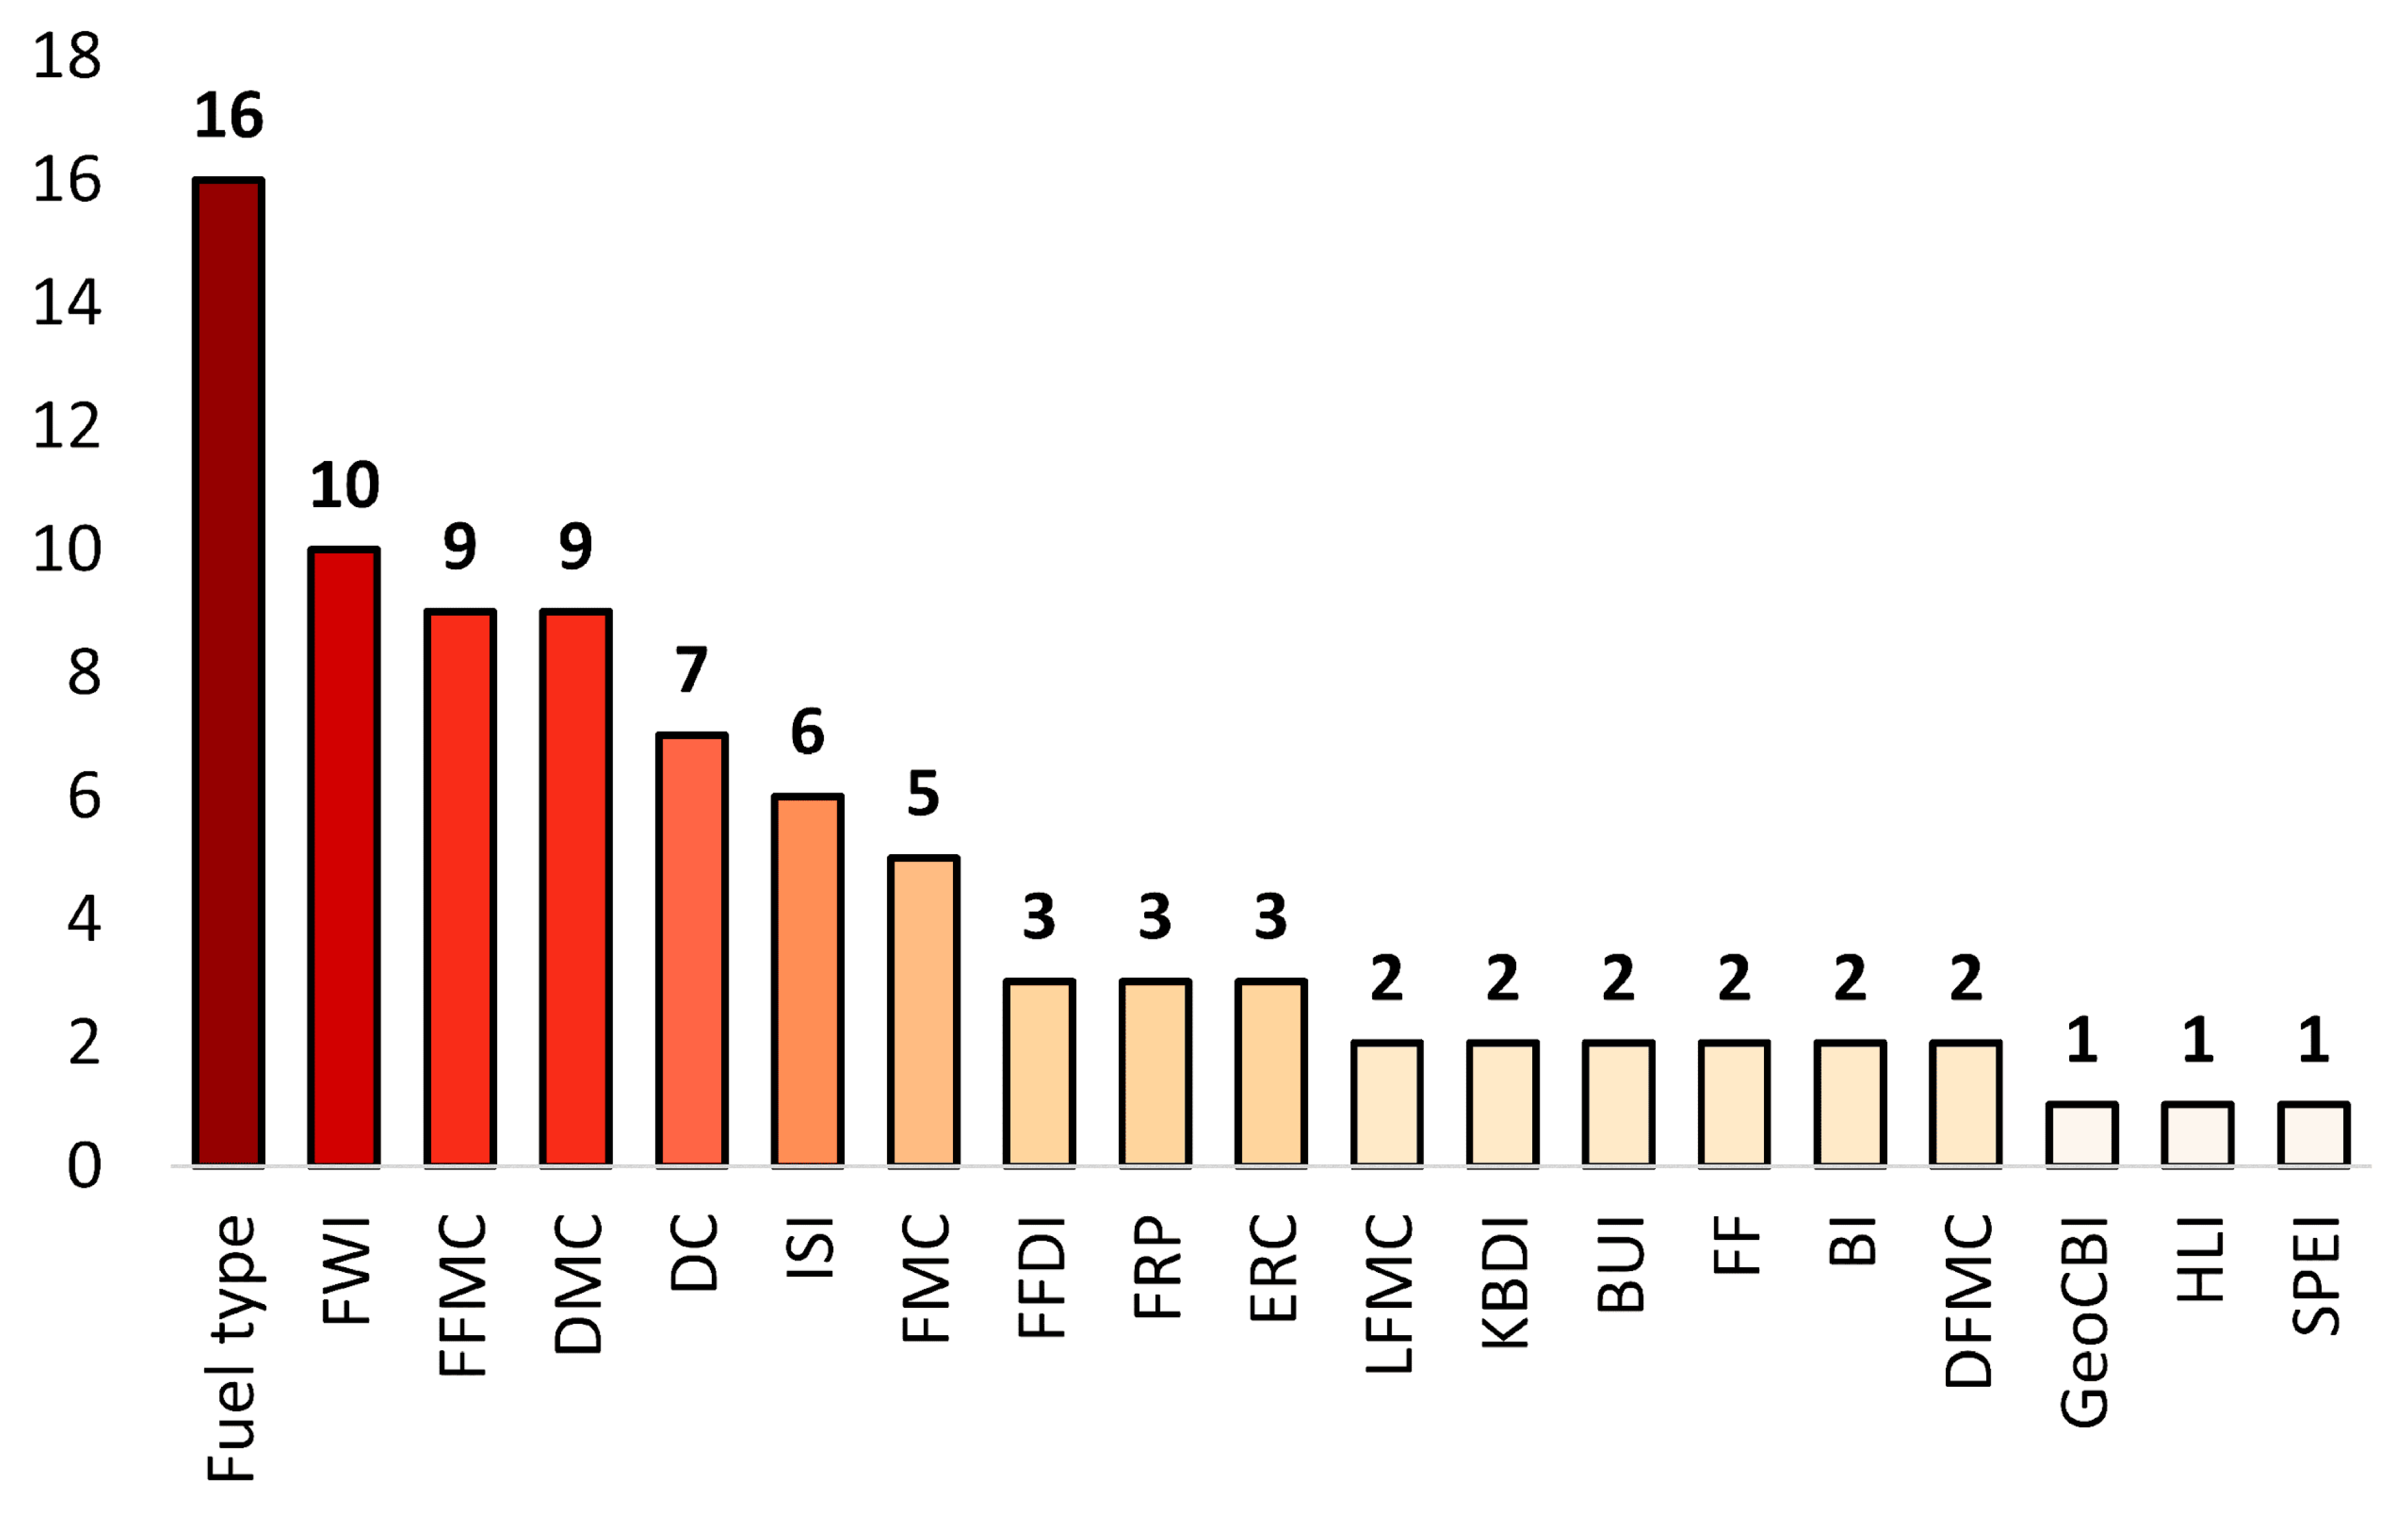
Figure 10 indicates the frequency of these variables in wildfire studies.
The analysis shows that fuel type was the most frequently used wildfire-related variable, appearing in 16 studies, highlighting the importance of understanding the available fuel for wildfire spread. The Fire Weather Index (FWI), a composite indicator of fire danger, appeared in 10 studies. Other key fire indices, such as the Fine Fuel Moisture Code (FFMC), Duff Moisture Code (DMC), and Drought Code (DC), were used in nine and seven studies, respectively, all of which contributed to wildfire risk and severity predictions. The Initial Spread Index (ISI) was included in six studies. Fuel moisture content, which indicates the readiness of fuels to ignite, was cited in 5 studies, while other, less common indices such as the Forest Fire Danger Index (FFDI), Fire Radiative Power (FRP), and Energy Release Component (ERC) were cited in three studies each. Other less frequently used variables included Live Fuel Moisture Content (LFMC), Keetch-Byram Drought Index (KBDI), Built-Up Index (BUI), Fuel Flammability (FF), Burning Index (BI), and Dead Fuel Moisture Content (DFMC), each appearing in two studies. Finally, variables such as the Geospatial Composite Burn Index (GeoCBI), Heat Load Index (HLI), and Standardized Precipitation-Evapotranspiration Index (SPEI) were used in only one study.
3.3.5. Anthropogenic Variables
Anthropogenic variables represent human-related factors that influence wildfire occurrence and risk.
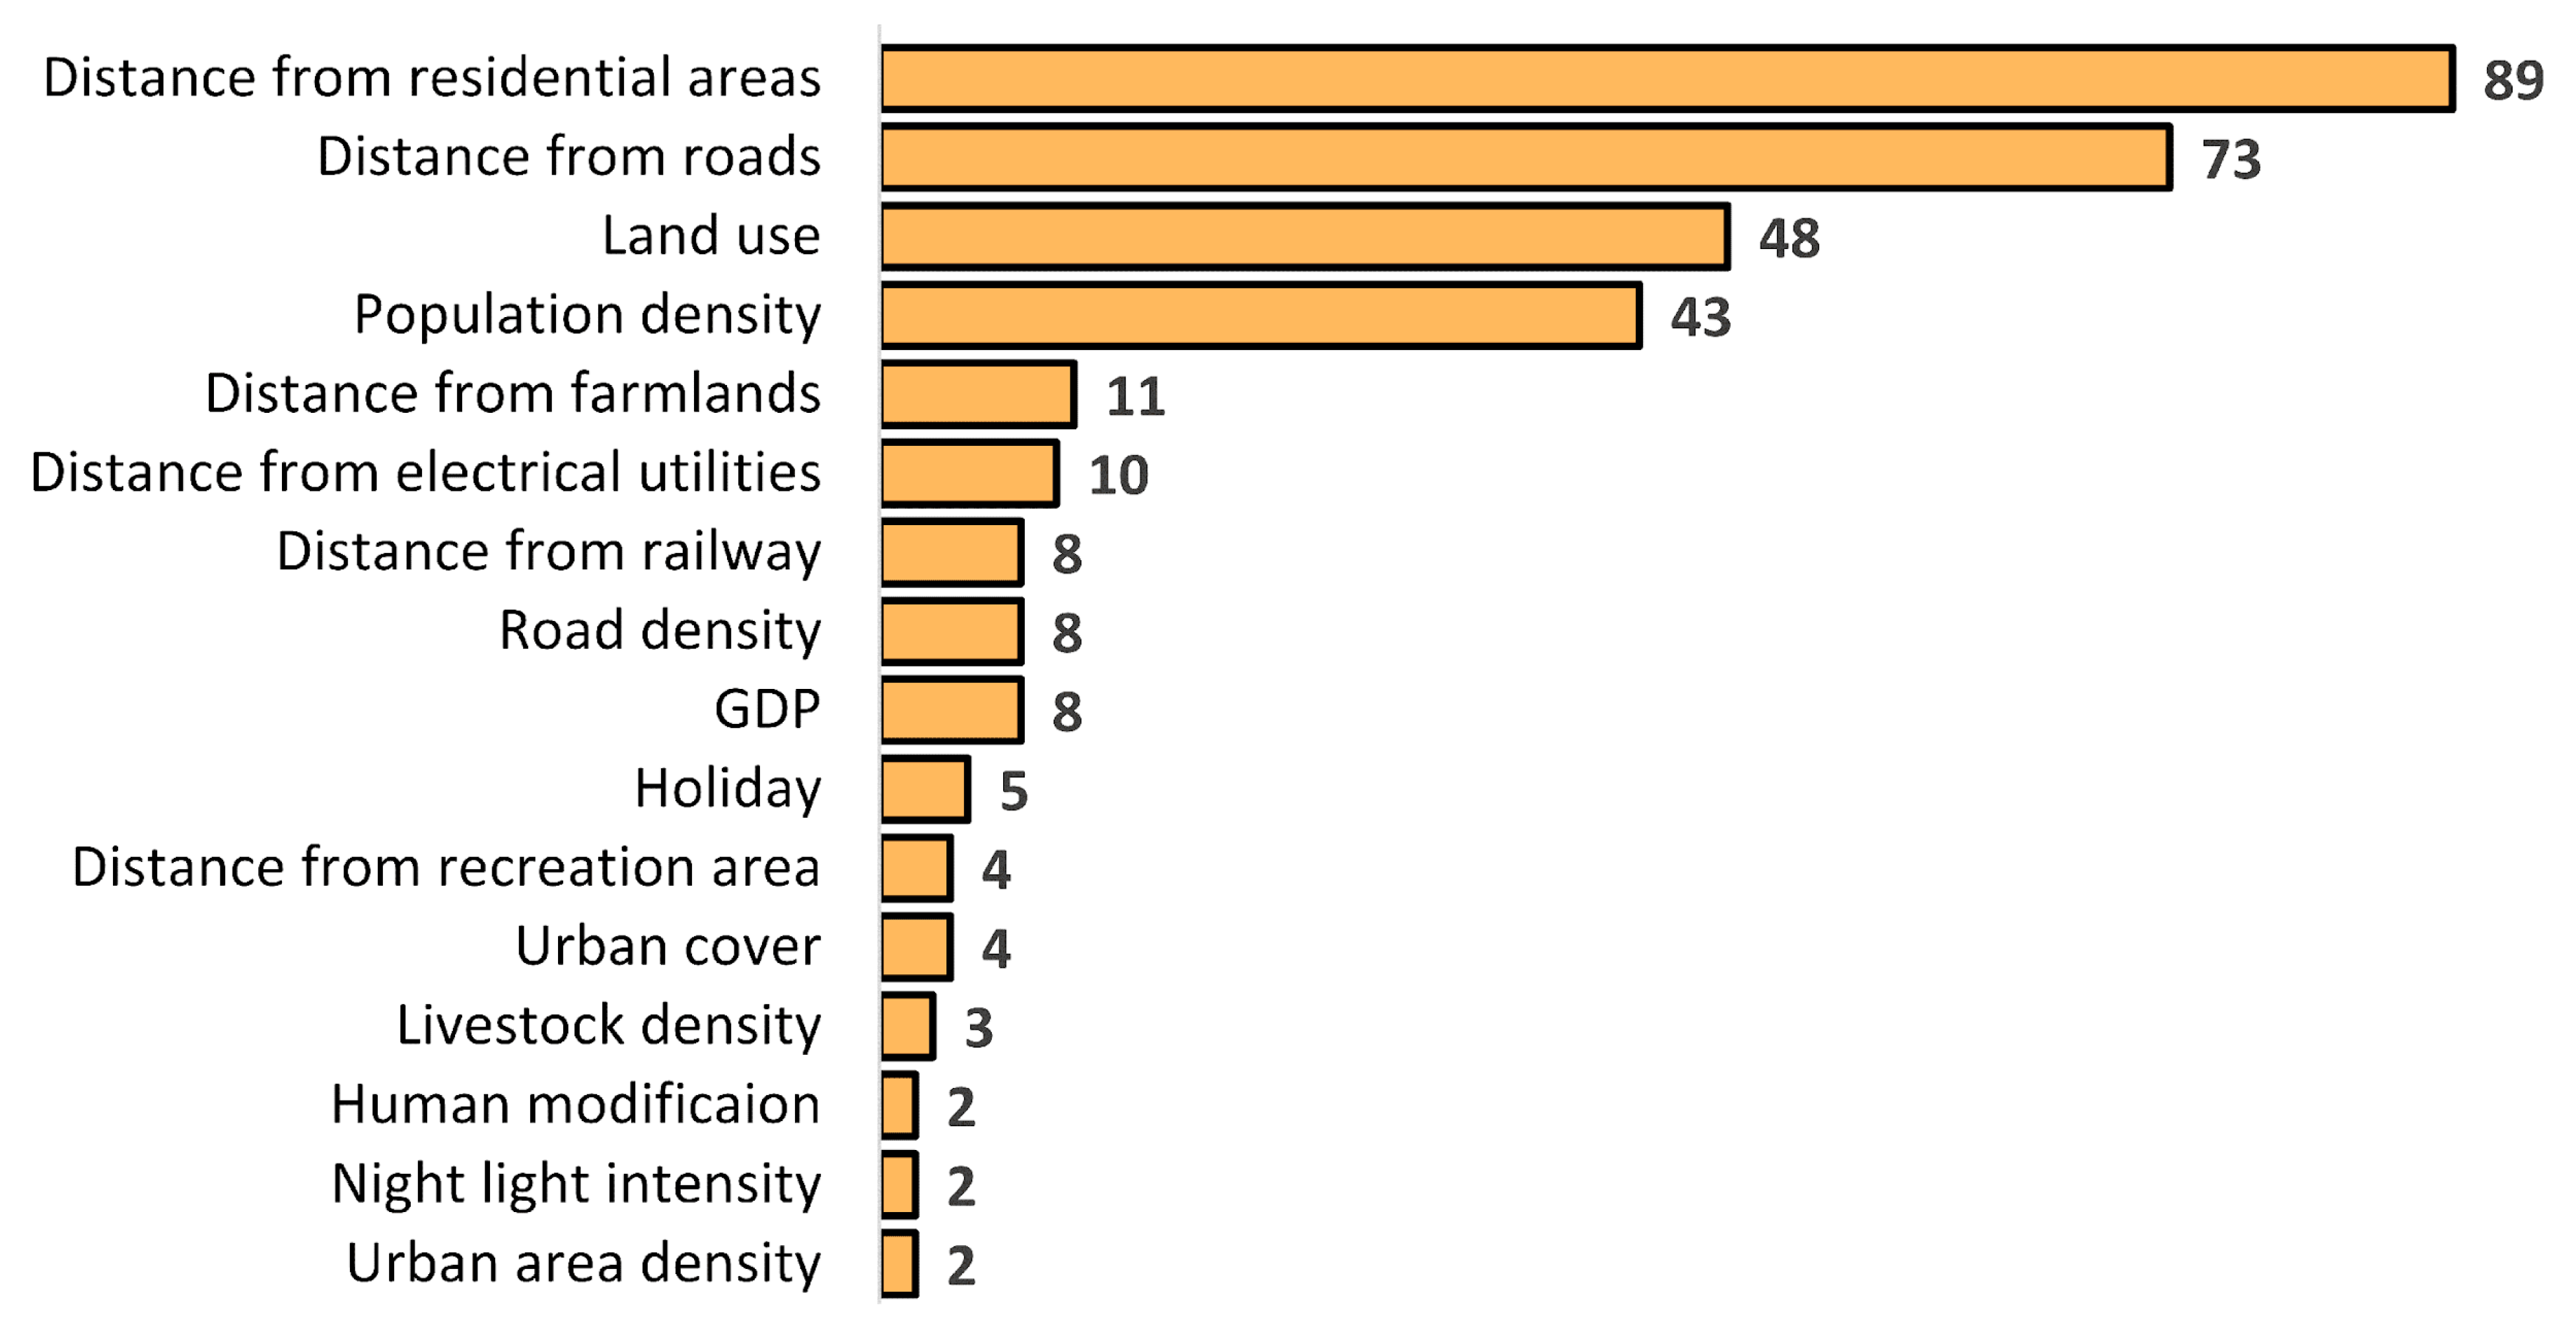
Figure 11 indicates that the most frequently used anthropogenic variable was distance from residential areas, included in 89 studies, followed by distance from roads in 73 studies and land use in 48 studies. Population density was used in 43 studies, reflecting its importance in modeling ignition probability and human impact. Other commonly reported variables included distance from farmland in 11 studies, distance from electrical utilities in 10 studies, distance from railway, road density, and Gross Domestic Product (GDP), each in eight studies. Less frequently used variables were holidays in five studies, distance from recreation areas and urban cover in four studies each, livestock density in three studies, and both urban area density and night light intensity, each in two studies.
3.3.6. Ground Truth Source
Ground truth is an important element in supervised learning and directly affects the model’s learning process. For wildfire applications, ground-truth data collection methods vary significantly across tasks, as shown in
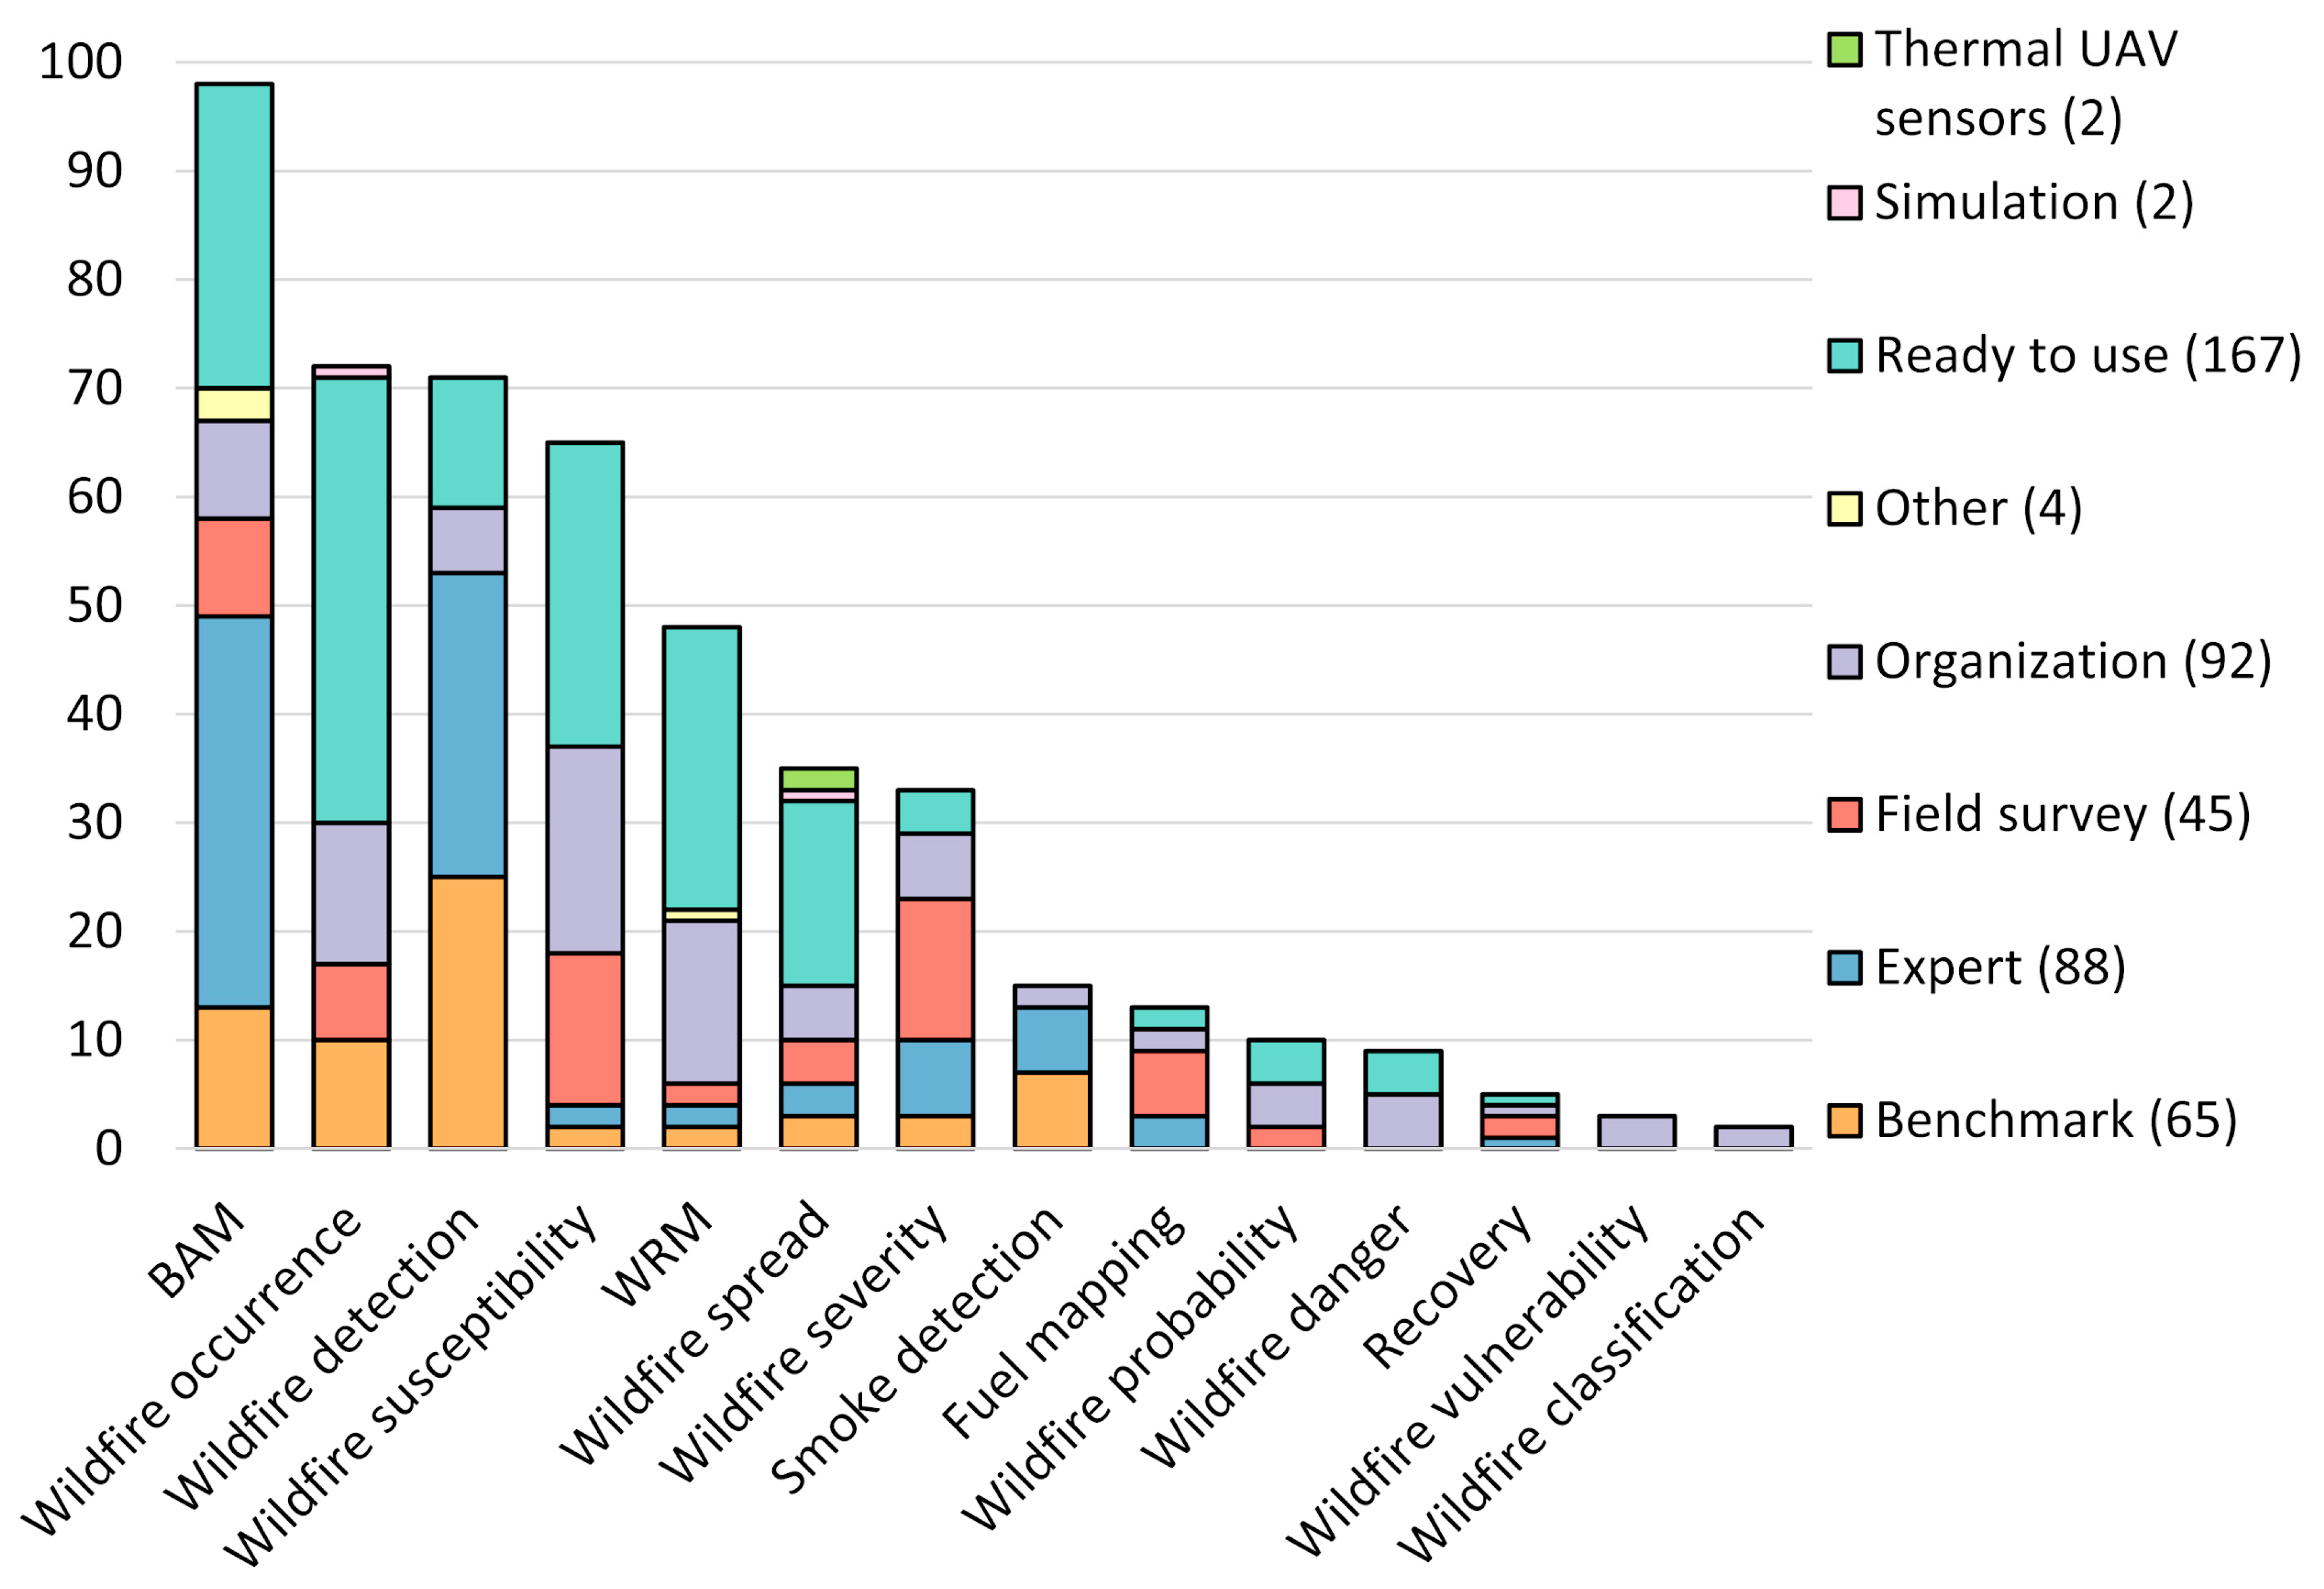
Figure 12. Ready-to-use datasets were the most frequently used and applied in 167 studies. These datasets typically consist of satellite fire products, such as MODIS and VIIRS active fire detections, providing researchers with convenient, large-scale data coverage. The second most common source was organizational data, used in 92 studies and often provided by environmental monitoring agencies such as Natural Resources Canada (NRCan). Expert interpretation was employed in 88 studies involving visual assessments or manual labeling performed by specialists. Benchmark datasets, often used for model evaluation and comparison, were utilized in 65 studies. Field surveys, known for their high accuracy and detail, were used in 45 studies. Simulation-based data (primarily used in wildfire spread prediction tasks) and thermal UAV sensors were used less frequently in two studies, whereas other unspecified methods were used in four studies.
Different wildfire tasks showed varying preferences for data-collection methods. BAM relied heavily on expert interpretation, with 36 studies using it, 28 relying on ready-to-use data, and 13 using benchmark datasets. Wildfire occurrence tasks most used ready-to-use data, found in 41 studies, followed by organizational data in 13 studies. Wildfire detection frequently relied on benchmark datasets and expert interpretation used in 25 and 28 studies, respectively. Wildfire susceptibility and WRM were supported by a balanced approach that combined field surveys and organizational data, highlighting the need for accurate environmental information. In wildfire severity assessment, 13 studies used field surveys, while seven relied on expert interpretation, reflecting the need for detailed post-fire condition data. Wildfire spread prediction studies showed a more even distribution of data sources and were among the few tasks that used simulation-based data and UAV thermal imagery. Benchmark datasets and expert interpretation primarily supported smoke detection. More specialized tasks, such as fuel mapping, wildfire probability, danger rating, recovery, vulnerability, and wildfire classification, were informed by limited studies using field, expert, or organizational sources.
3.4. AI Applications
Supervised learning algorithms have been widely adopted in wildfire research, with their applications generally falling into three main categories: classification, regression, and a combination of both.
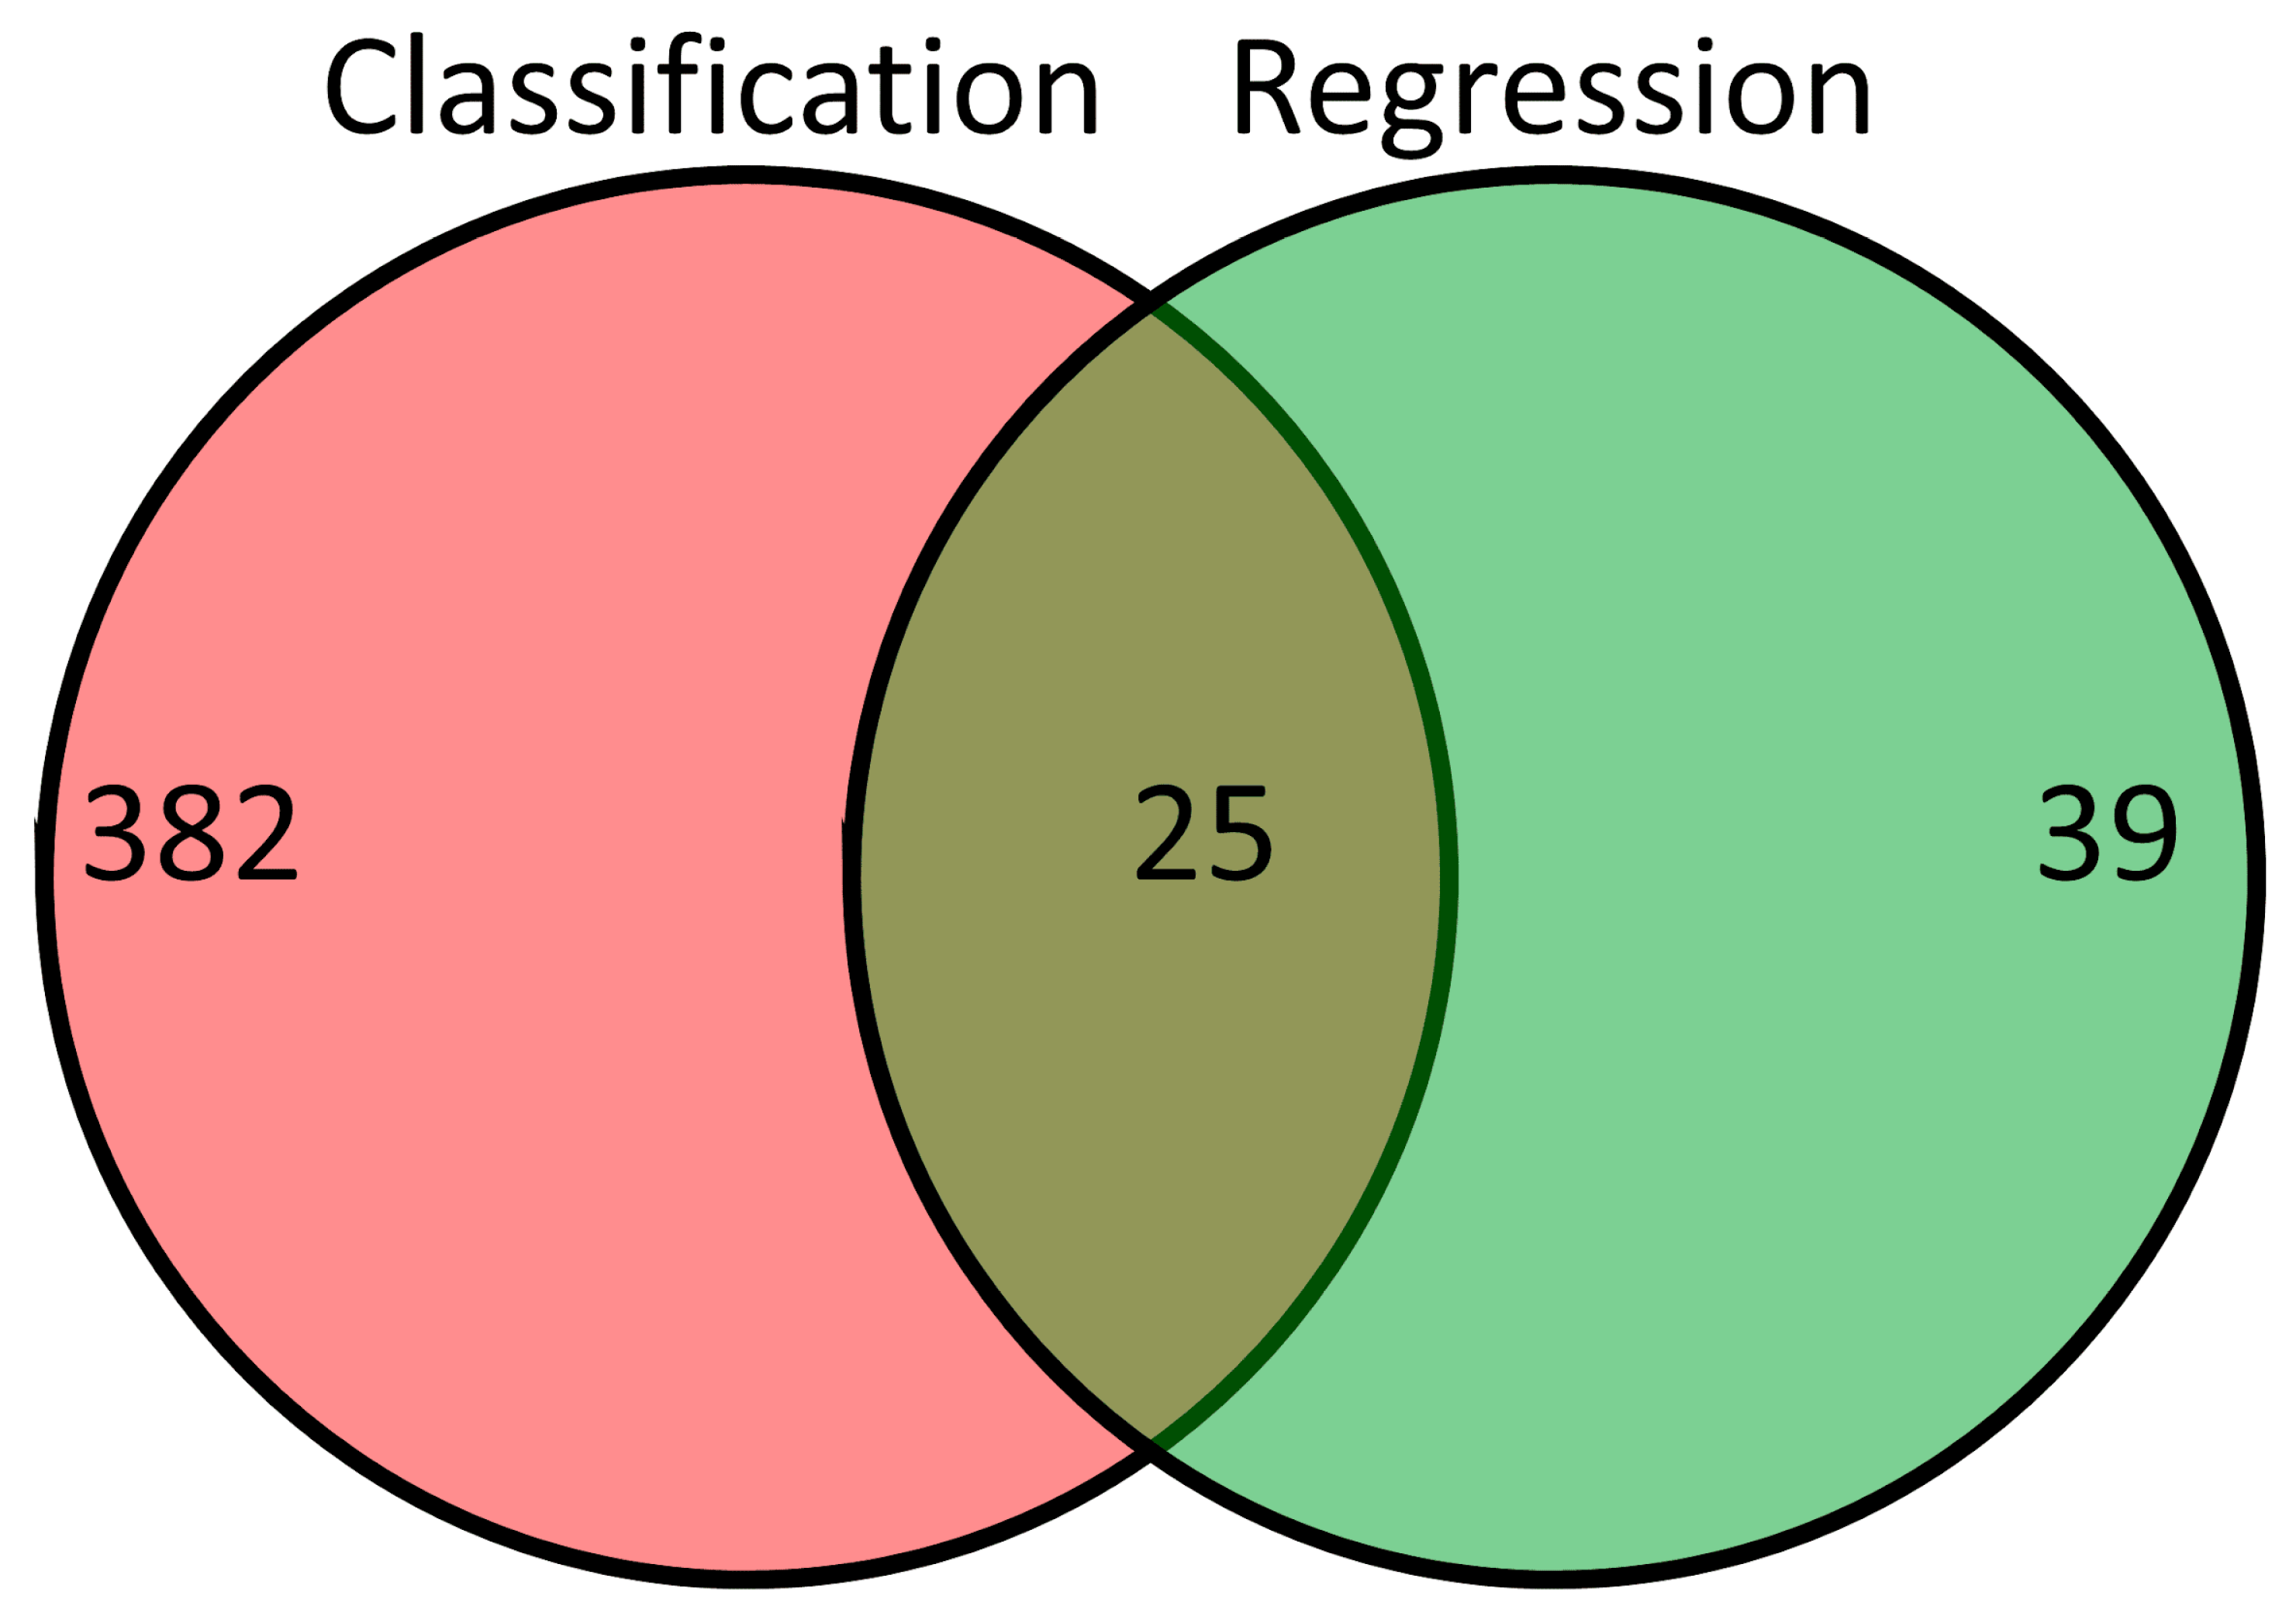
Figure 13 shows the number of studies for each group. Most wildfire-related AI studies focused on classification tasks, with 382 studies falling into this category. These tasks typically involve predicting fire occurrence, mapping burned areas, or identifying fire-prone regions using categorical labels. In contrast, regression-based functions, which aim to predict continuous variables such as wildfire spread rate, fuel moisture, etc., were addressed in 39 studies. A smaller subset of 25 studies employed a hybrid approach, combining classification and regression models to address complex wildfire problems that require both discrete and continuous outputs.
Examining the types of learning frameworks and algorithmic approaches used across classification and regression tasks helps better understand how AI has been applied in wildfire research. Therefore,
Table 3 presents the number of studies under each combination. Most studies relied on supervised learning, reflecting the common availability of labeled datasets in wildfire applications. Supervised learning dominated classification tasks, with ML approaches used in 236 studies and DL in 156. A smaller number of studies employed unsupervised learning, including eight with ML and five with DL, typically used in tasks without predefined labels. Semi-supervised learning, which uses labeled and unlabeled data, was less common, with just two DL-based classification studies.
In regression-focused studies, supervised learning again led, with 36 ML-based and 27 DL-based studies. Only one semi-supervised DL study was identified for regression tasks. This breakdown highlights the preference for supervised learning across wildfire studies and a growing adoption of DL techniques, particularly in classification tasks.
3.4.1. Traditional ML in Wildfire
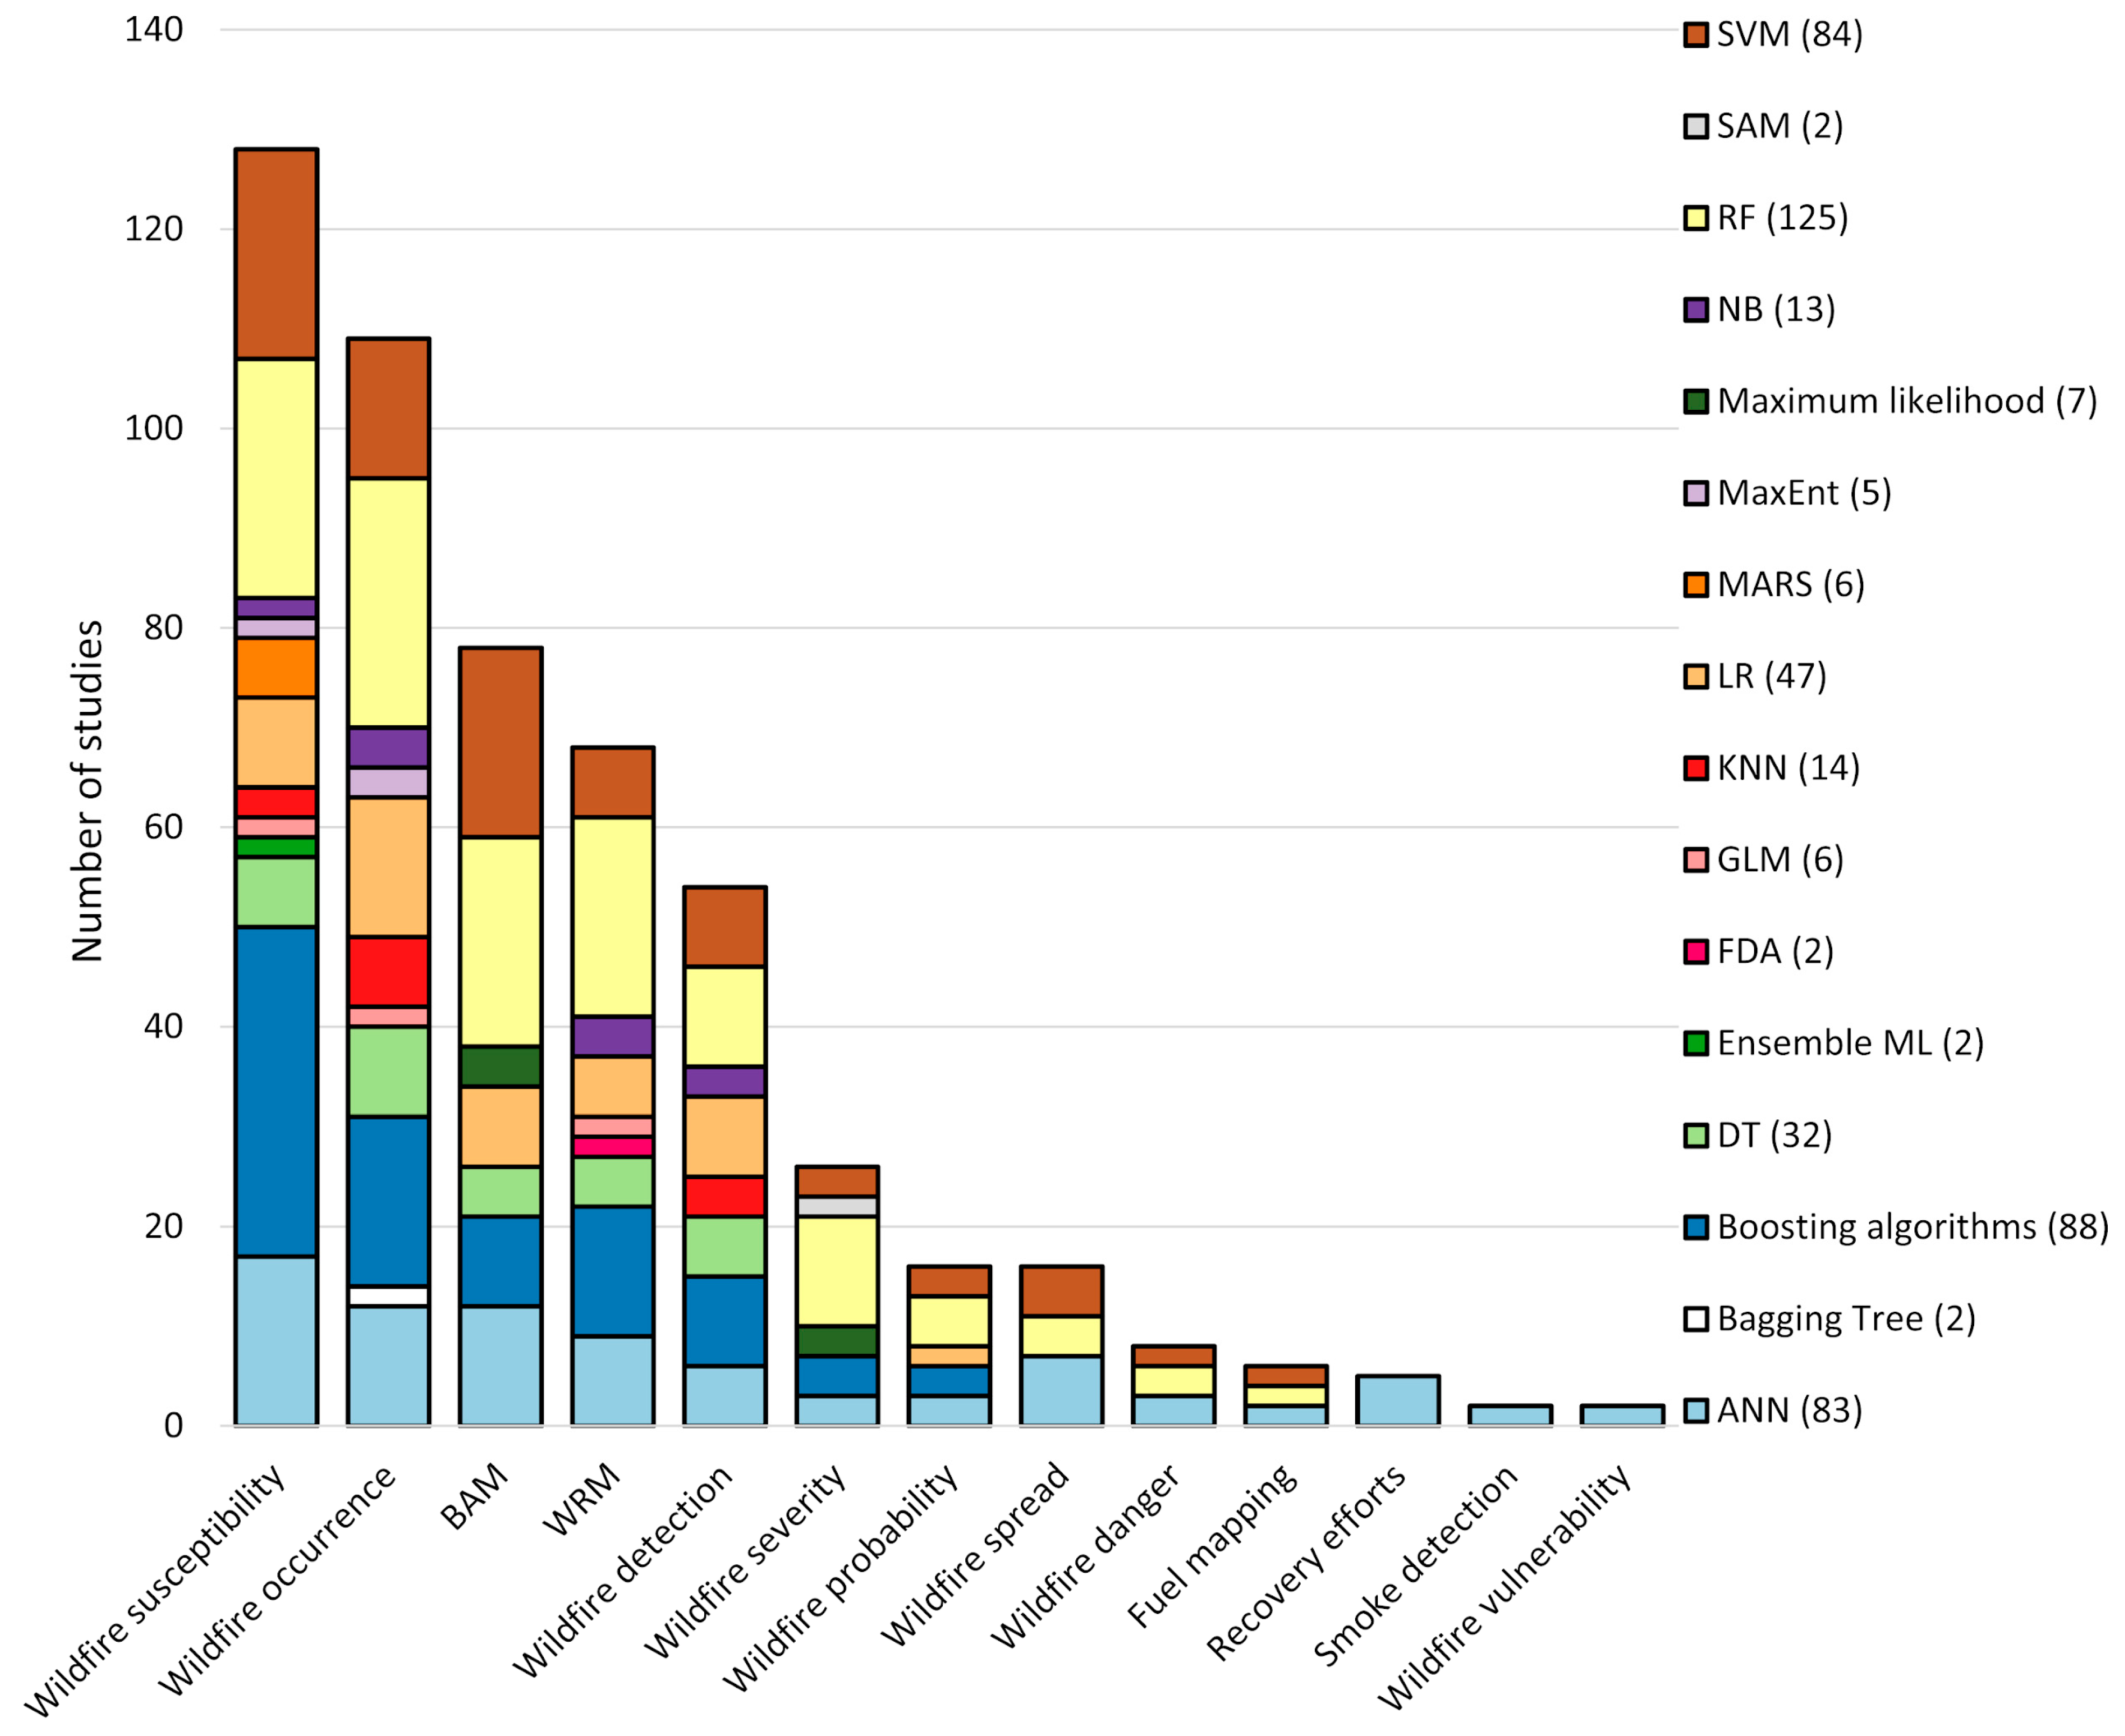
Traditional ML algorithms have been widely adopted in wildfire research, supporting various applications from prediction to post-fire assessment. Across all wildfire-related tasks, a total of 514 algorithmic uses were identified, illustrating the broad integration of ML in this field (
Figure 14). RF was the most frequently applied algorithm, used in 125 studies. It was most used in wildfire susceptibility mapping, with 24 studies, followed by 25 in wildfire occurrence prediction and 21 in BAM. Artificial neural networks (ANNs) were used in 83 studies overall, with 17 applied to susceptibility tasks, 12 to occurrence prediction, 12 to BAM, and additional applications across wildfire spread, WRM, recovery efforts, and vulnerability assessments. Support vector machine (SVM) was adopted in 84 studies, including 21 in susceptibility mapping, 19 in BAM, and 14 in occurrence prediction. Boosting algorithms such as Adaptive Boosting (AdaBoost) and Gradient Boosting were used in 88 studies, including 33 for susceptibility, 17 for occurrence, 13 for WRM, and 9 for BAM and wildfire detection.
Logistic regression (LR) was employed in 47 studies, most often for occurrence prediction, with 14 studies, followed by nine in susceptibility, eight in BAM, and eight in detection. Decision tree (DT) appeared in 32 studies, with frequent application in occurrence and susceptibility tasks. K-Nearest Neighbors (KNNs) were used in 14 studies, most of which were in occurrence and detection. Naive Bayes (NB) was applied in 16 studies in susceptibility, occurrence, and detection tasks. Generalized Linear Models (GLMs) and Multivariate Adaptive Regression Spline (MARS) were used in six studies, mainly in susceptibility and WRM. Maximum Entropy (MaxEnt) and maximum likelihood were used in five and seven studies, respectively, generally for BAM and occurrence prediction. Less commonly used methods included Bagging Trees, Fisher Discriminant Analysis (FDA), and Spectral Angle Mapper (SAM), each applied in two studies, mostly in susceptibility or detection.
Some wildfire tasks had notably fewer ML applications. Wildfire spread involved seven studies using ANN and four using RF. Fuel mapping relied on two ANN and two RF studies. Wildfire danger included three ANN and two RF studies. Moreover, recovery efforts, smoke detection, and wildfire vulnerability each involved 2 ANN-based studies.
3.4.2. DL in Wildfire
Like ML models, DL models are applied to various wildfire-related tasks.
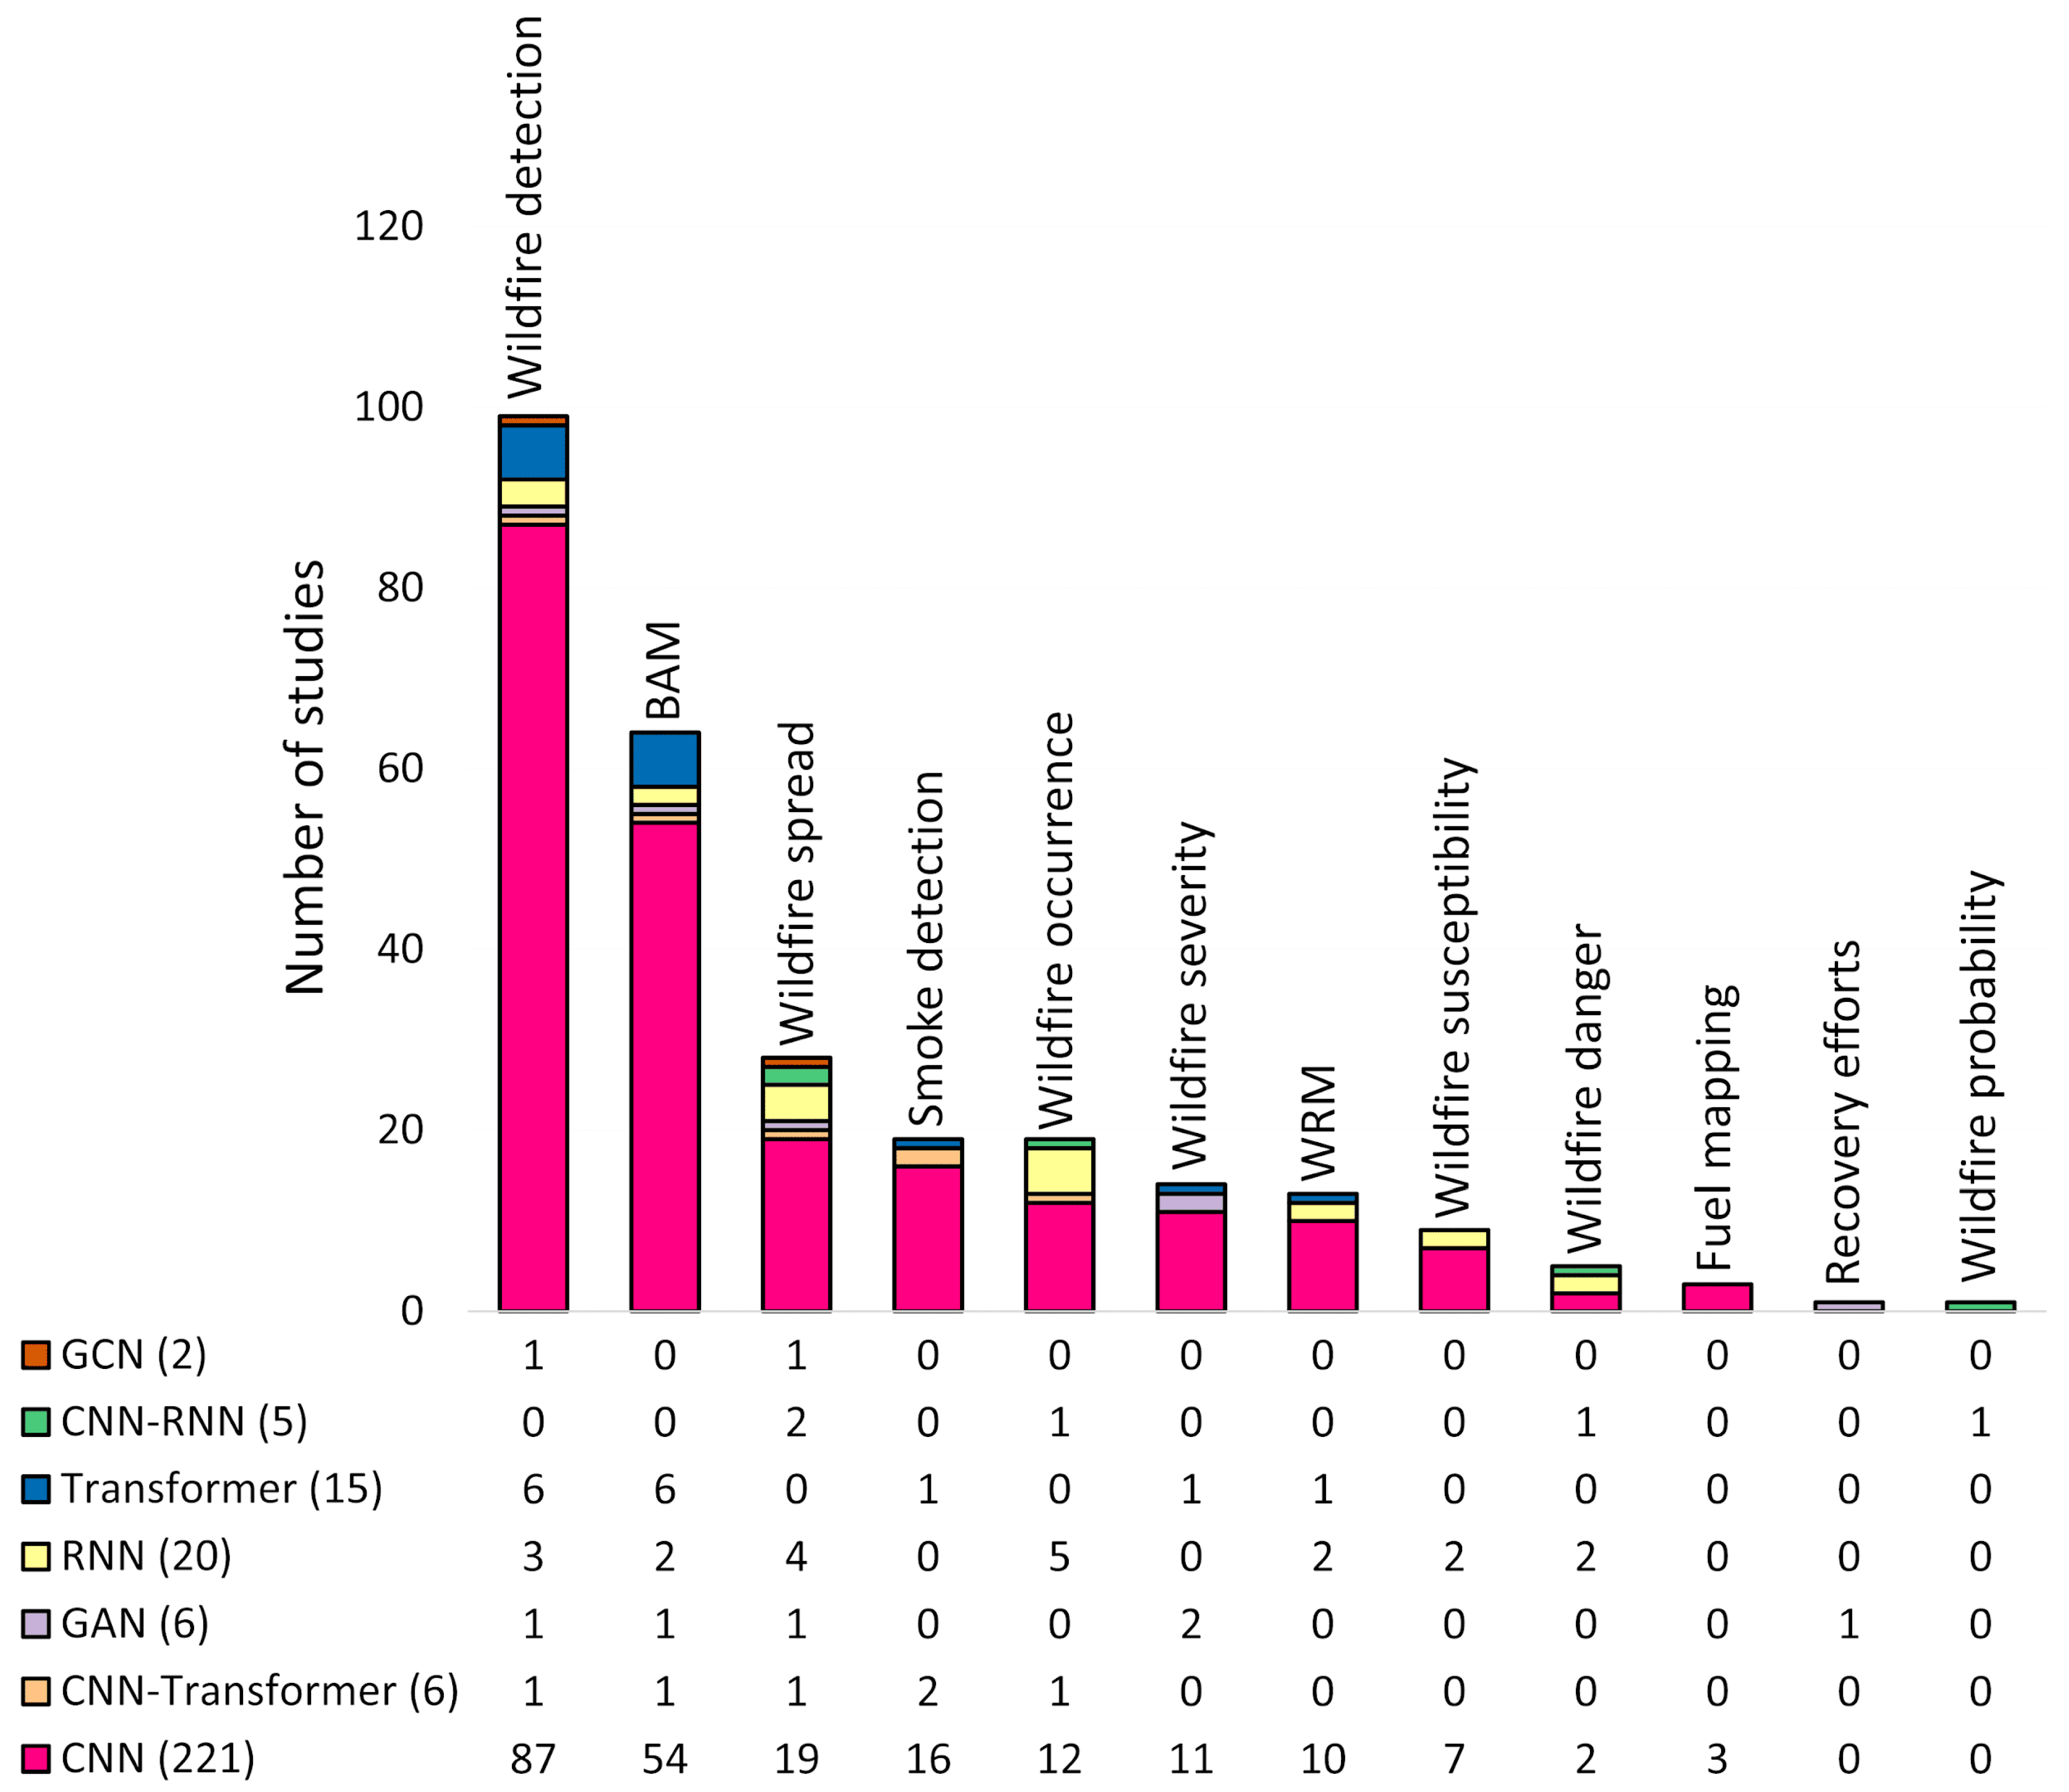
Figure 15 provides a detailed overview of the frequency of DL model applications across different wildfire-related tasks. In total, 275 instances of DL model use were identified, with CNNs being the most frequently applied approach, appearing in 221 studies. CNNs were predominantly employed in tasks such as wildfire detection, where they were used in 87 studies; BAM, with 54 studies; and wildfire spread prediction, represented in 19 studies. These applications highlight the significance of CNNs in tasks that require spatial feature extraction and classification.
Recurrent Neural Networks (RNNs), including Long Short-Term Memory (LSTM) networks, Gated Recurrent Units (GRUs), and typical RNNs, were employed in 20 studies. RNNs were primarily used for wildfire occurrence prediction in five studies, wildfire spread in four studies, and wildfire detection in three studies. This use of RNNs underscores the importance of sequential data modeling in wildfire research, particularly for tasks that require modeling temporal dependencies.
Transformers, used in 15 studies, were applied across several tasks, including wildfire detection and BAM. Their ability to extract long-range dependencies makes them useful for tasks that require learning from both spatial and temporal features. Moreover, generative adversarial networks (GANs), applied in only six studies, were used for functions such as wildfire severity and recovery efforts, underscoring their potential for generating synthetic data for fire event simulation and post-fire analysis.
Hybrid networks, such as CNN-RNN and CNN-Transformer models, appeared in five studies. These hybrid models combine the strengths of CNNs for spatial feature extraction with the temporal processing capabilities of RNNs or Transformers. They were primarily used for tasks such as wildfire spread and occurrence, where both spatial and temporal patterns are critical.
Graph Convolutional Networks (GCNs), the least used model in two studies, were applied to wildfire spread prediction, indicating emerging interest in graph-based models for spatially aware predictions in wildfire research. Certain wildfire-related tasks were less represented in DL applications, with wildfire danger and fuel mapping addressed in only two and three studies, respectively. Wildfire probability and recovery efforts were also underrepresented, with only one study each applying DL. Moreover, the task of vulnerability was not addressed using DL models at all, indicating a gap in the application of DL in this area.
The backbone architectures in the reviewed wildfire studies vary, with some models being more commonly used than others.
Table 4 shows the frequency of backbone architecture usage across the reviewed papers. The Residual Network (ResNet) family emerged as the most frequently used backbone, appearing in 23 studies and demonstrating widespread popularity in wildfire-related DL tasks. Other notable backbones include MobileNet, used in six studies, and the Visual Geometry Group (VGG), used in five studies. Additionally, models such as Extreme Inception (Xception), Densely Connected Convolutional Network (DenseNet), and Shifted Window Transformer (Swin Transformer) were used in three studies, indicating their growing use in the field. Inception, EfficientNet, HRNet, 3D CNN, DeepLabV3, GhostNet, and ViT each appeared in two studies.
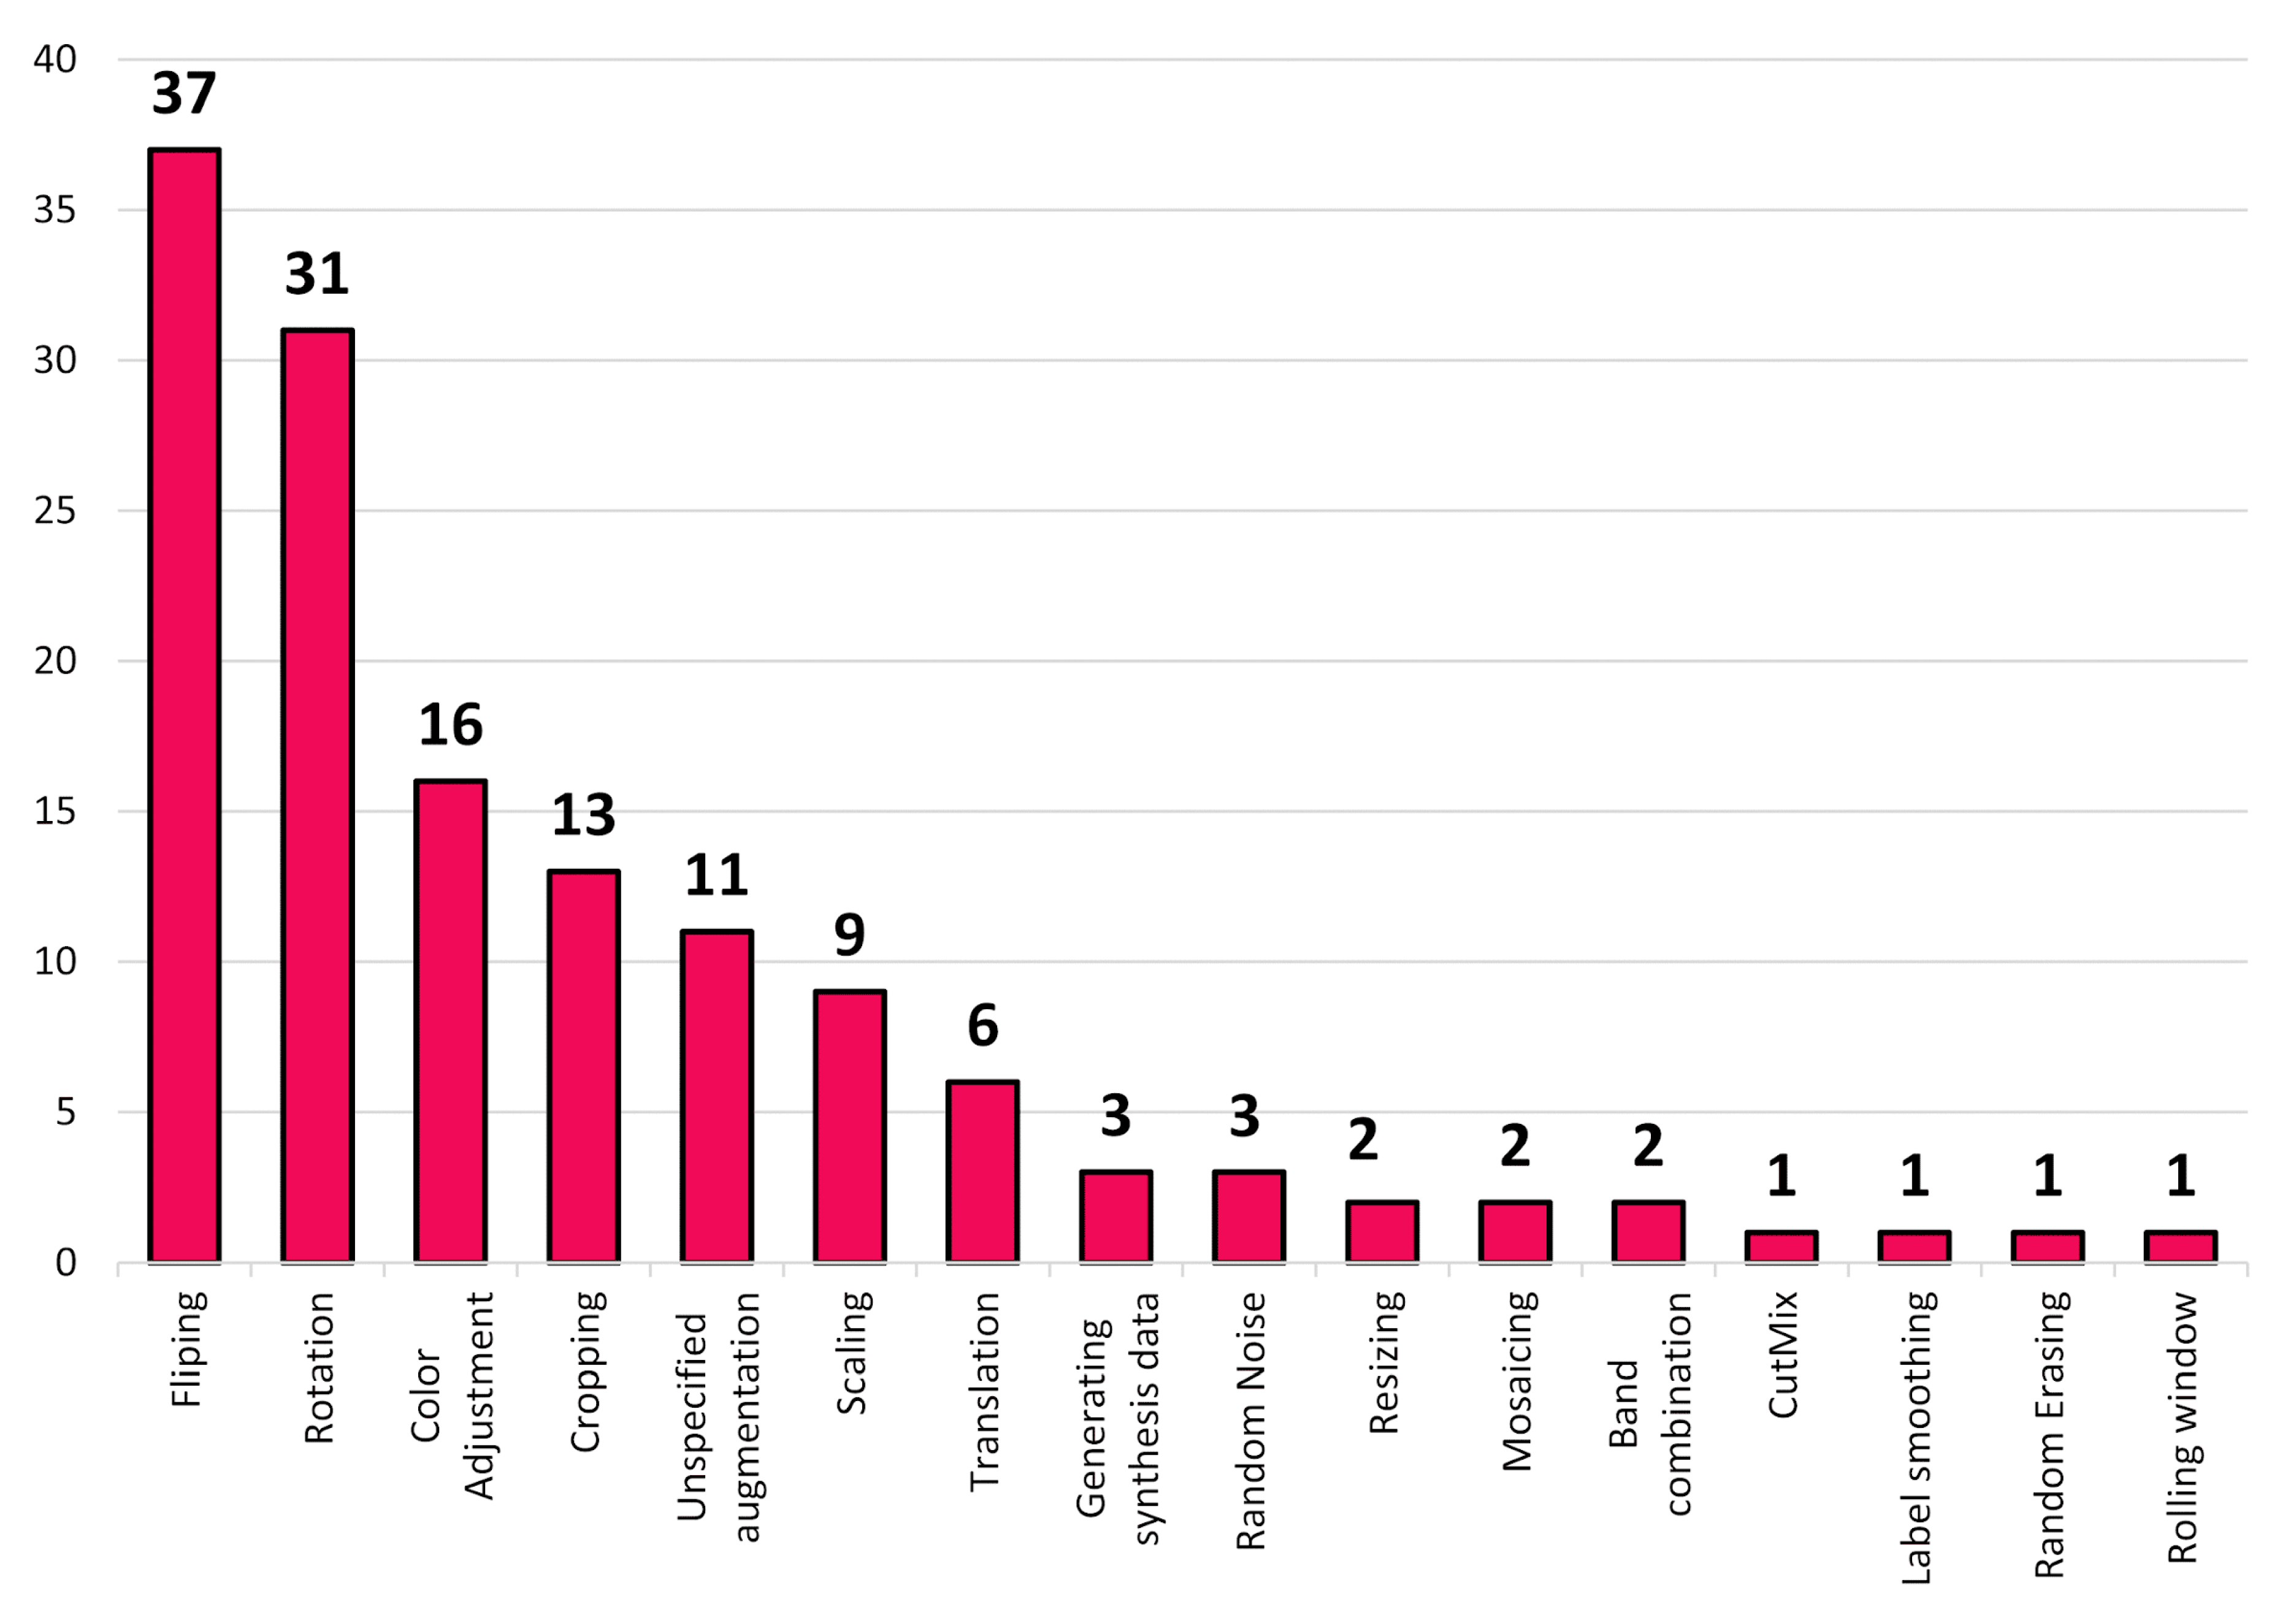
Data augmentation techniques play a crucial role in enhancing the performance and generalization of DL models by artificially increasing the diversity of the training data, allowing models to better handle real-world variability and reduce overfitting.
Figure 16 shows the frequency of different data augmentation techniques applied in the reviewed wildfire studies. Flipping was the most frequently applied technique, appearing in 37 studies, followed by rotation, which was used in 31 studies. Color adjustment was applied in 16 studies, underscoring the importance of enhancing image visual diversity. In comparison, cropping was used in 13 studies to simulate variations in the region of interest. Other techniques, such as scaling and translation, were used in nine and six studies, respectively. The unspecified augmentations (11 studies) refer to studies in which data augmentation methods were applied but not explicitly detailed, reflecting a lack of transparency or standardization in reporting. More advanced augmentation methods, including synthetic data generation, random noise addition, and resizing, were each used in fewer studies (two to three each). Mosaicing, band combination, CutMix, label smoothing, random erasing, and rolling window were used in one study each.
The use of pretraining strategies in DL models for wildfire-related tasks varies significantly across studies.
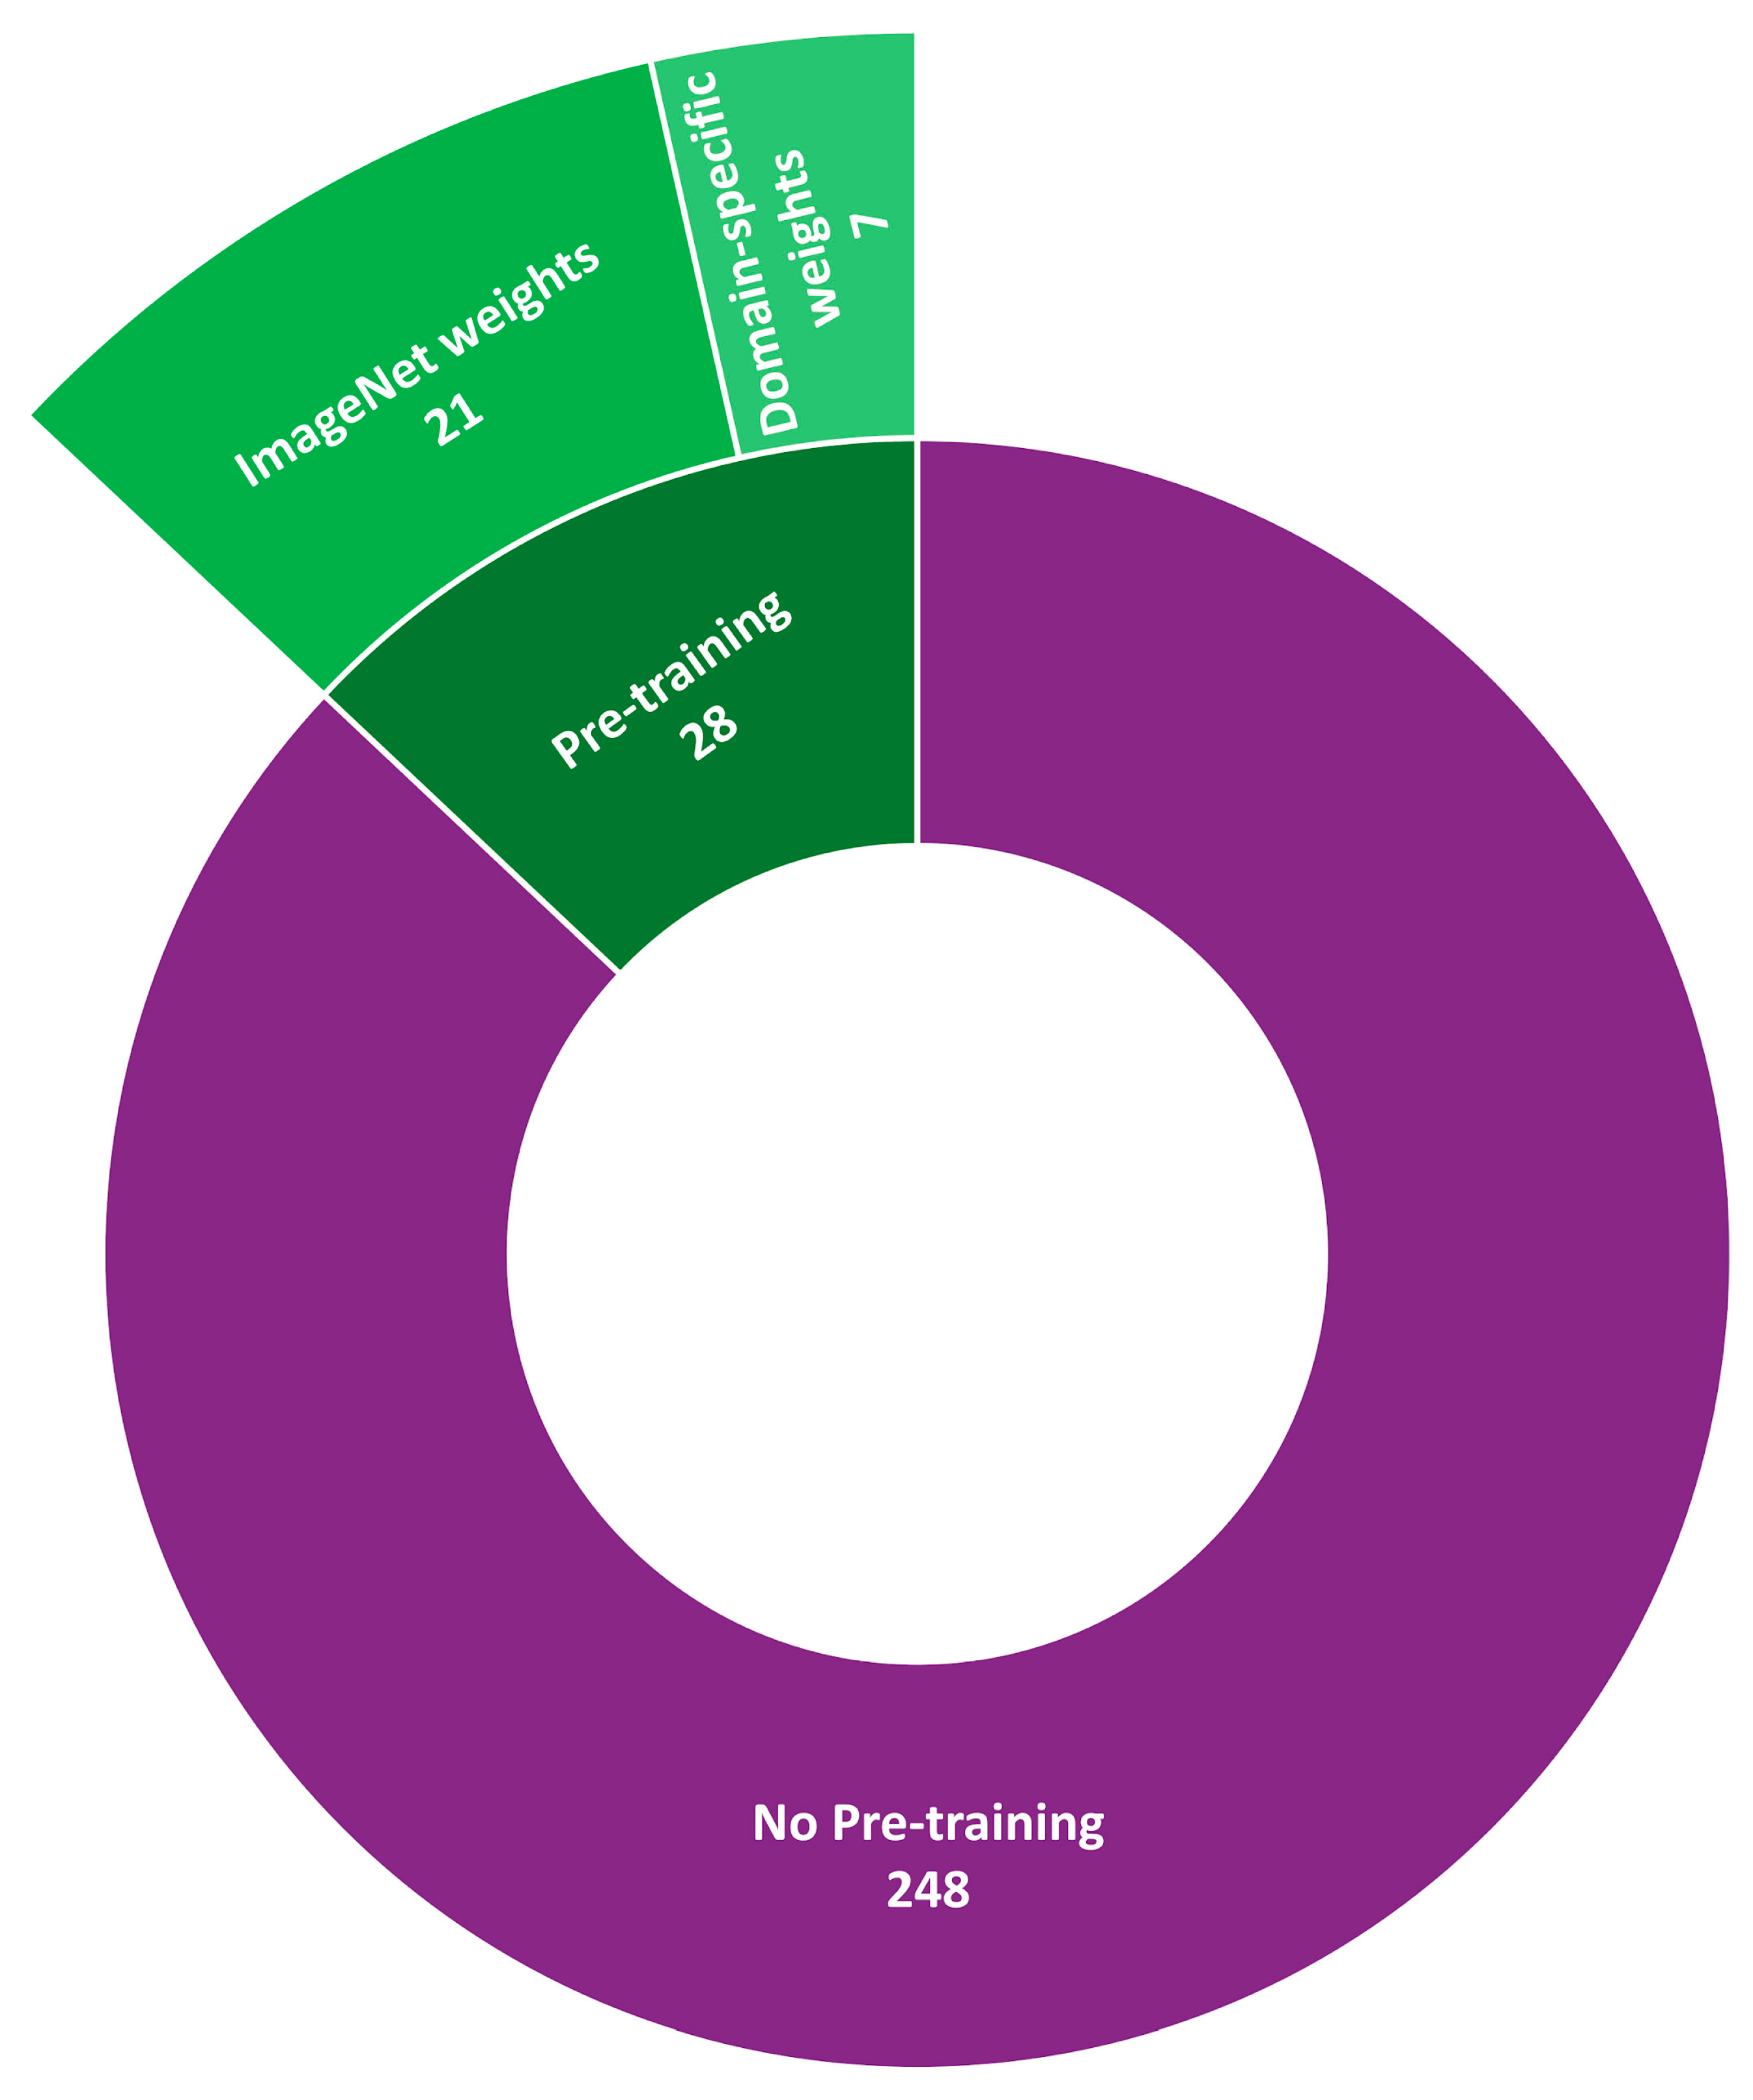
Figure 17 presents the distribution of studies based on pre-trained weights. Most of the studies (248 in total) did not use any form of pretraining, indicating a preference for training models from scratch in the specific wildfire domain. However, some studies used pre-trained weights to enhance model performance. Among these, 21 studies used ImageNet weights, suggesting a common approach in which models were first trained on a large, general-purpose dataset and then fine-tuned for wildfire-related tasks. A smaller subset of studies, seven in total, employed domain-specific pre-trained weights, with models trained in another domain fine-tuned for wildfire tasks.
3.4.3. Explainable AI (XAI)
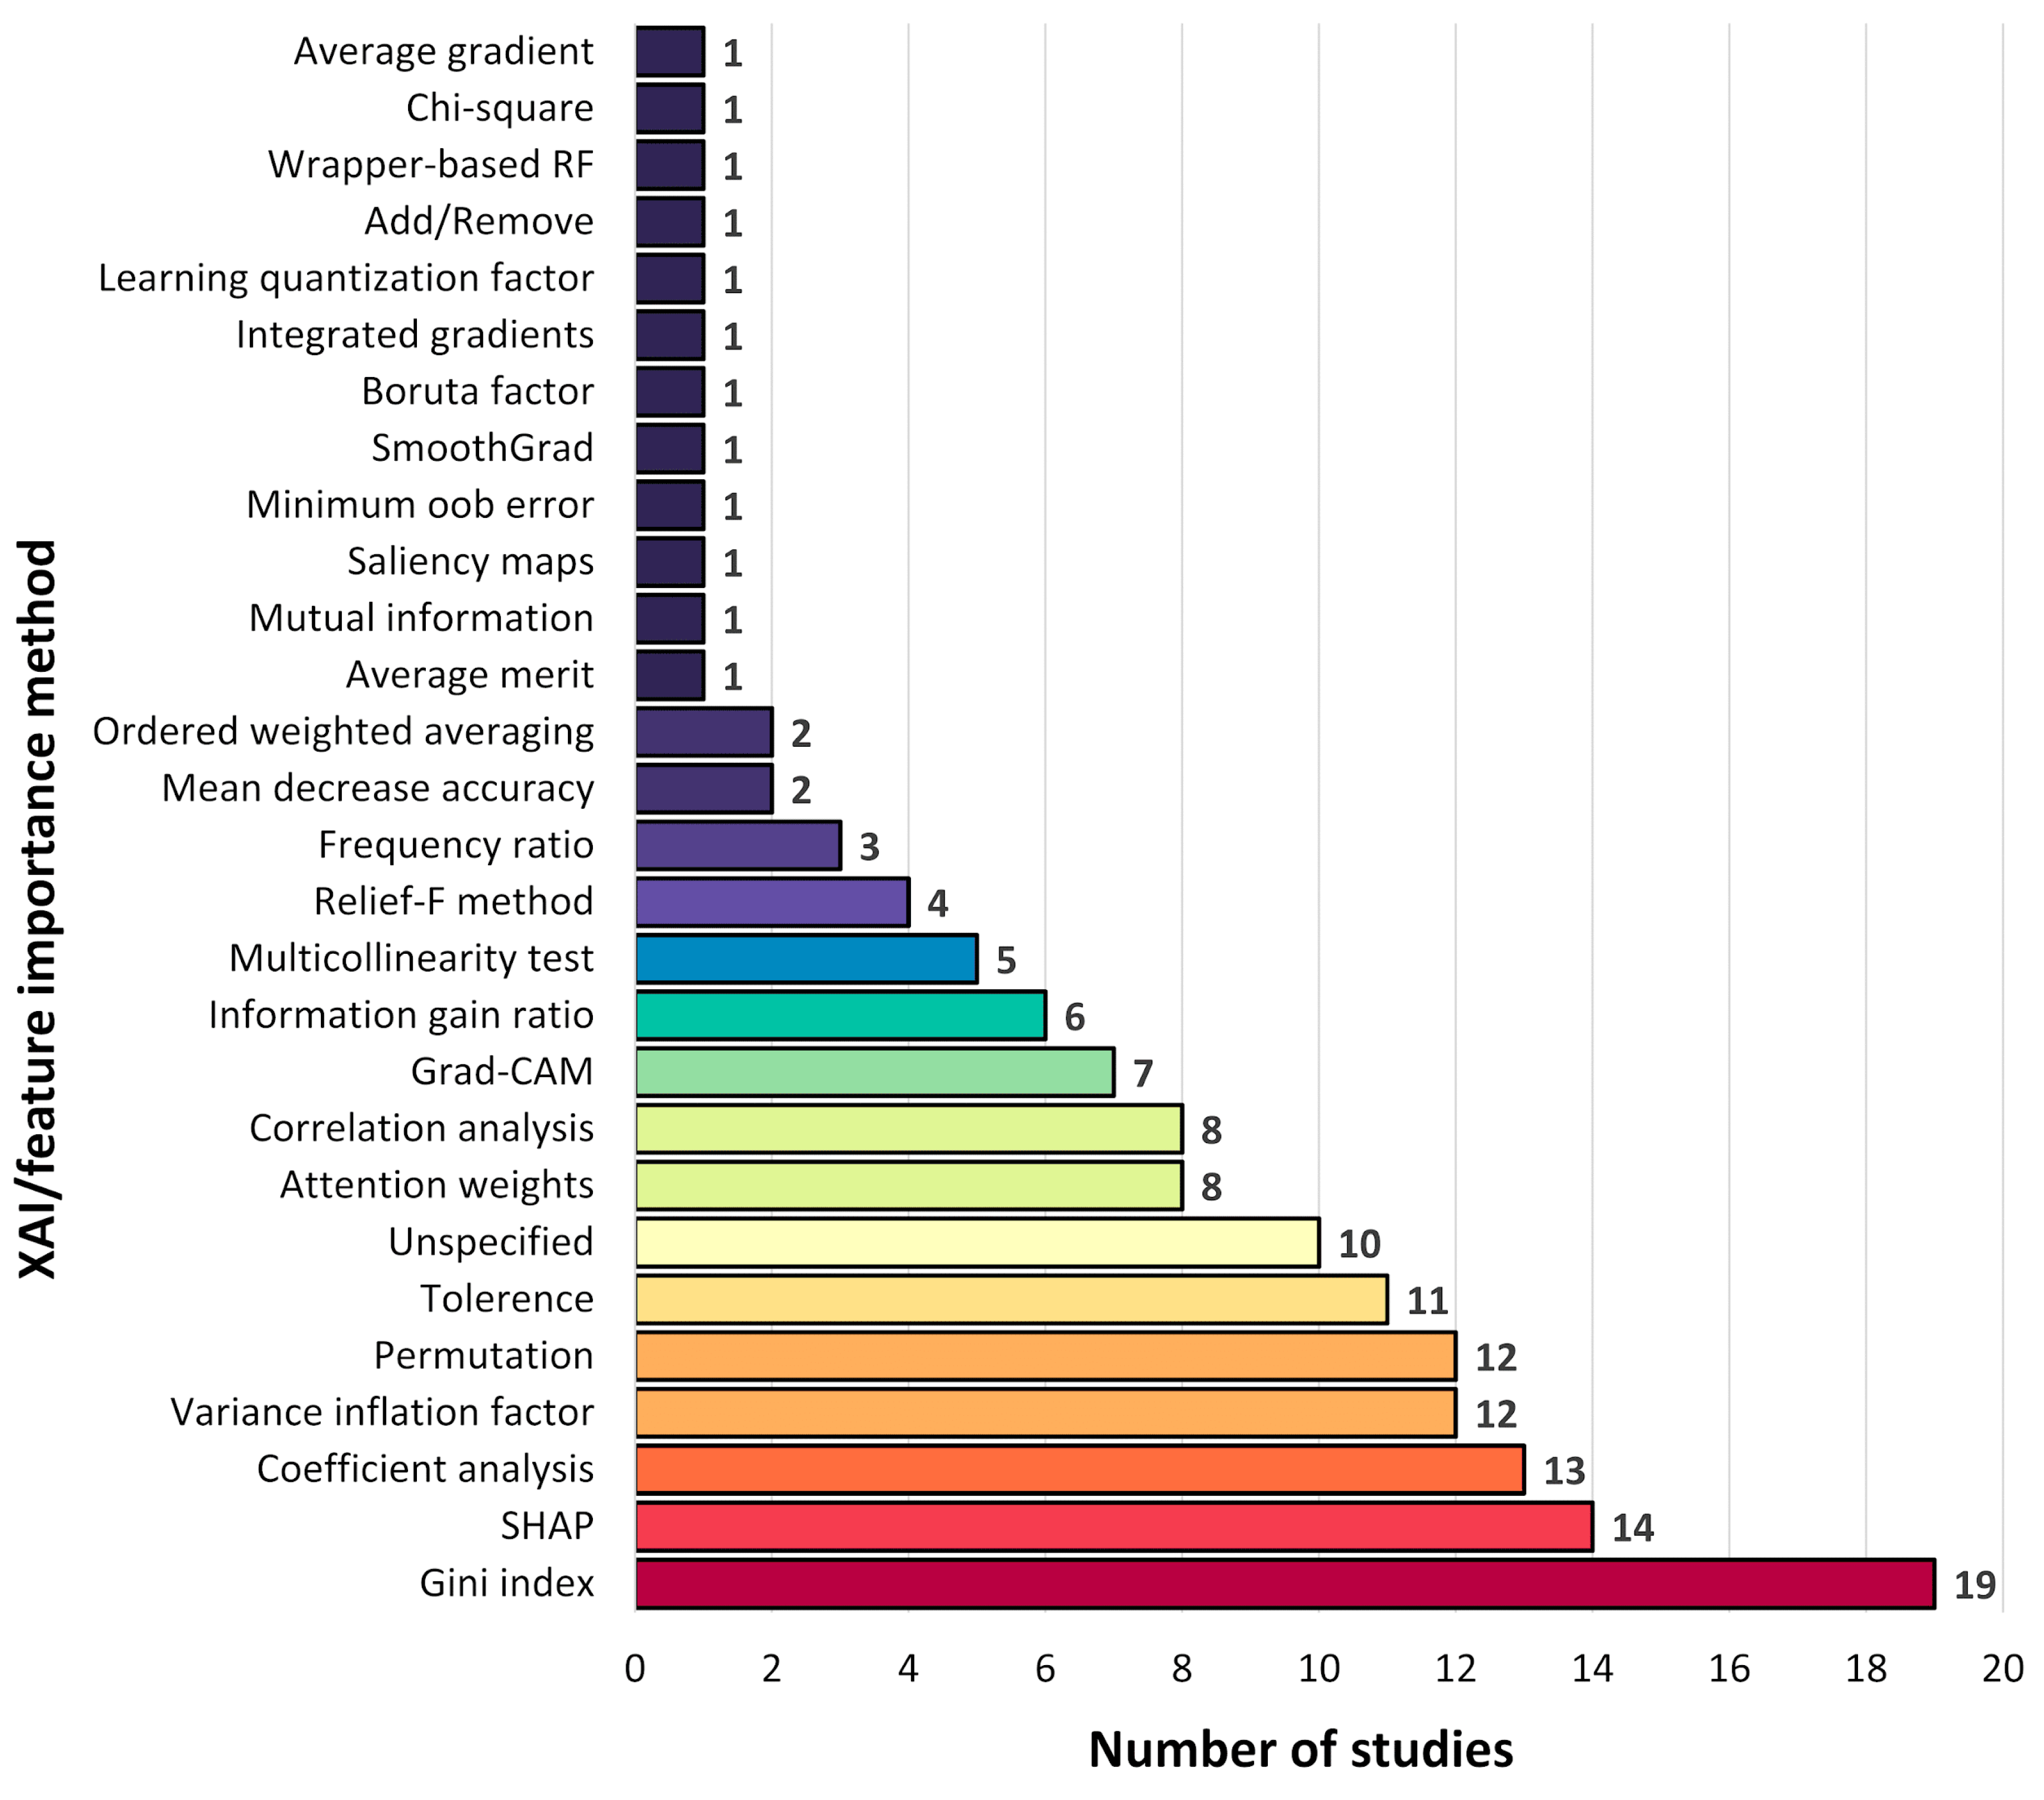
Researchers have adopted XAI techniques and feature-importance methods to enhance the interpretability of DL and traditional ML models in wildfire-related applications. These approaches play a critical role in identifying which input variables most influence the model’s decisions, thereby supporting transparency, trust, and informed decision-making. As shown in
Figure 18, a wide range of methods have been used to assess feature relevance and model behavior. The Gini index was the most frequently used method in 19 studies. SHAP (SHapley Additive exPlanations) was applied in 14 studies, while coefficient analysis was used in 13 studies. Both the variant inflation factor and permutation importance methods were employed in 12 studies, followed by tolerance analysis in 11 studies. 10 studies used XAI or feature importance techniques but did not specify the method. Attention weights and correlation analysis were reported in eight studies, and Grad-CAM was used in seven studies to visualize model attention regions. Other techniques included the information gain ratio in six studies, multicollinearity tests in five studies, and the Relief-F method in four studies. Less common approaches, such as frequency ratio, mean decrease accuracy, and ordered weighted averaging, were each used in two studies, whereas methods such as mutual information, saliency maps, SmoothGrad, and integrated gradients appeared only once.
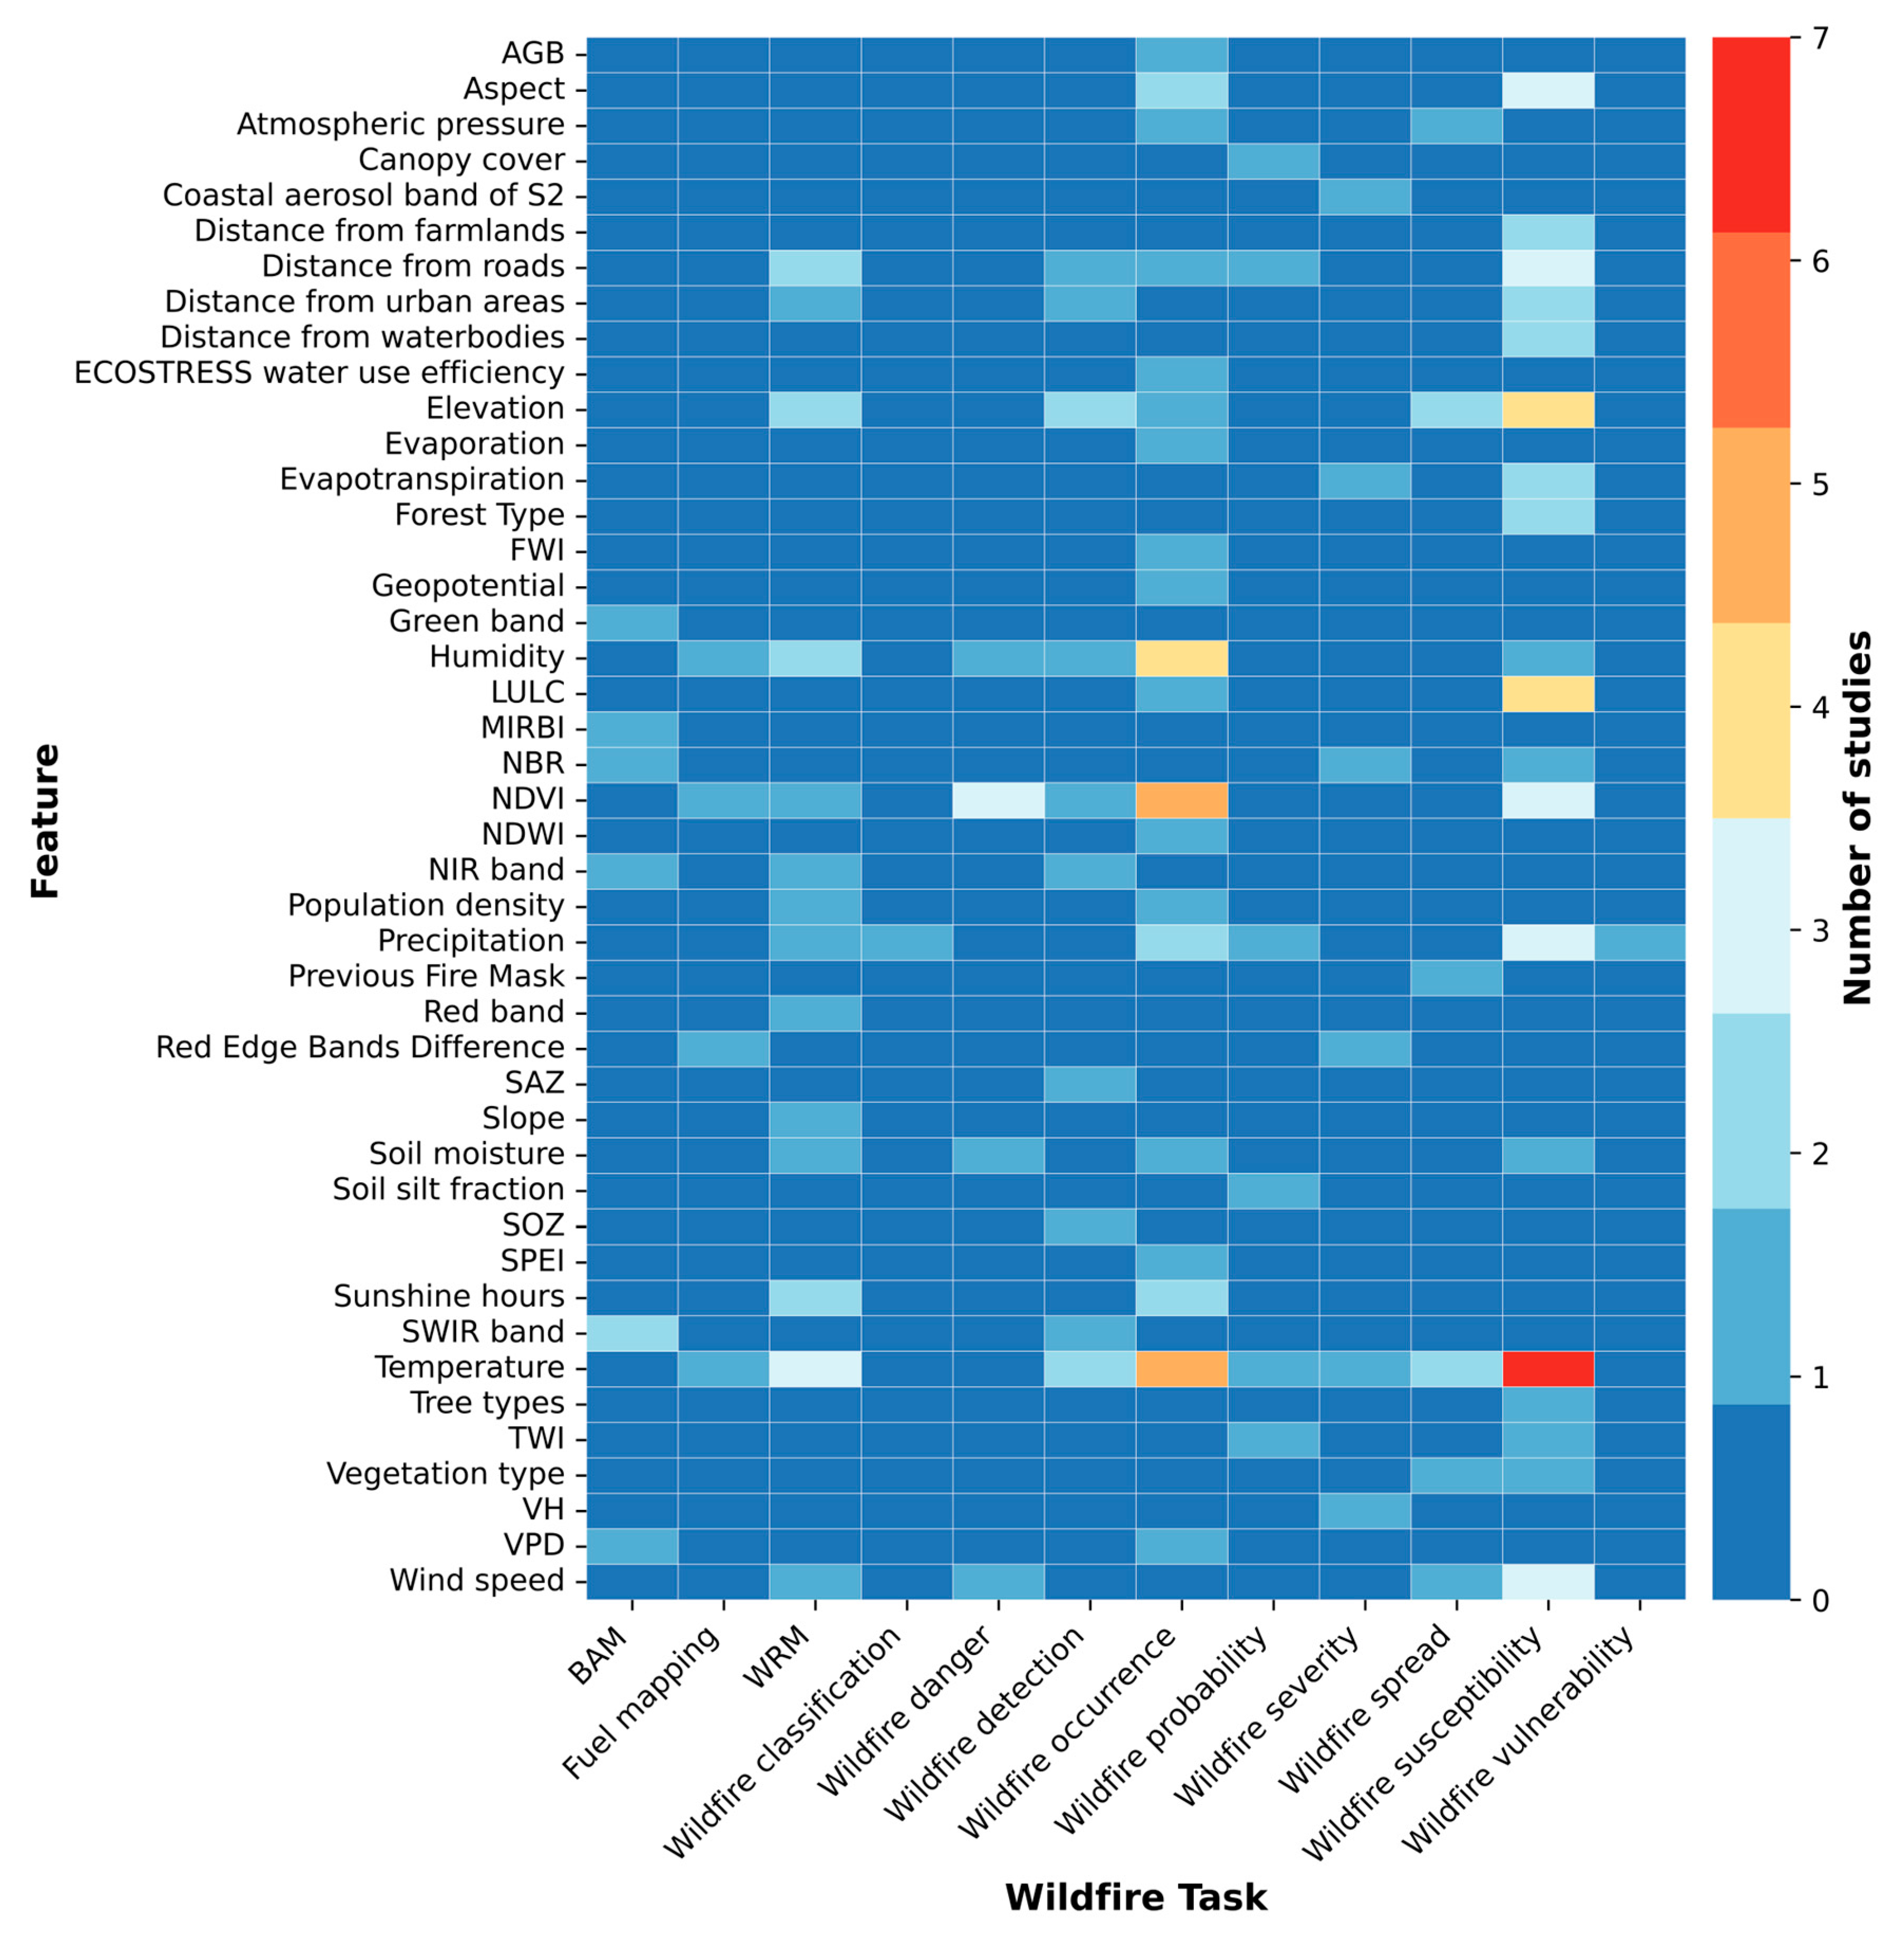
To better understand the drivers of DL and ML model decisions in wildfire research, we analyzed the frequency with which different features were identified as the most important across tasks.
Figure 19 illustrates the frequency with which specific features were identified as the most important across wildfire-related tasks in the reviewed papers. Temperature emerged as the most influential feature, highlighted in seven studies on wildfire susceptibility, five on wildfire occurrence, two on wildfire detection and spread, and one each on wildfire danger, probability, and severity. NDVI was also frequently emphasized in five studies on wildfire occurrence, three on wildfire danger, three on wildfire susceptibility, and one on fuel mapping. Terrain attributes such as elevation and aspect were also commonly identified as important features. For instance, elevation was considered important in four studies on wildfire susceptibility and two studies each on wildfire spread and detection, while aspect was found influential in three studies on wildfire susceptibility and two on wildfire occurrence. Anthropogenic variables, such as distance from roads and urban areas, were also notable, reported in three studies on wildfire susceptibility and, additionally, in detection and occurrence tasks. Spectral features and indices, including Short-Wave Infrared (SWIR), Near-Infrared (NIR), NBR, and MIRBI, were significant in BAM, severity analysis, and occurrence studies. Climatic and vegetation-related variables, such as humidity, precipitation, soil moisture, and canopy cover, also played a key role, with each recognized across multiple tasks.
3.5. Performance Metrics
Evaluating the performance of DL and traditional ML models in wildfire applications requires appropriate performance metrics. These metrics provide insight into how accurately a model can predict wildfire-related outcomes and help compare performance across different approaches. In the reviewed literature, researchers employed a variety of evaluation criteria depending on the specific nature of the task. Broadly, these metrics can be categorized into two groups: regression metrics, used for continuous output predictions (e.g., wildfire danger and severity), and classification metrics, used when the objective is to assign discrete labels (e.g., fire presence or risk levels). Each group of metrics will be discussed in detail in the following sections.
3.5.1. Regression Metrics
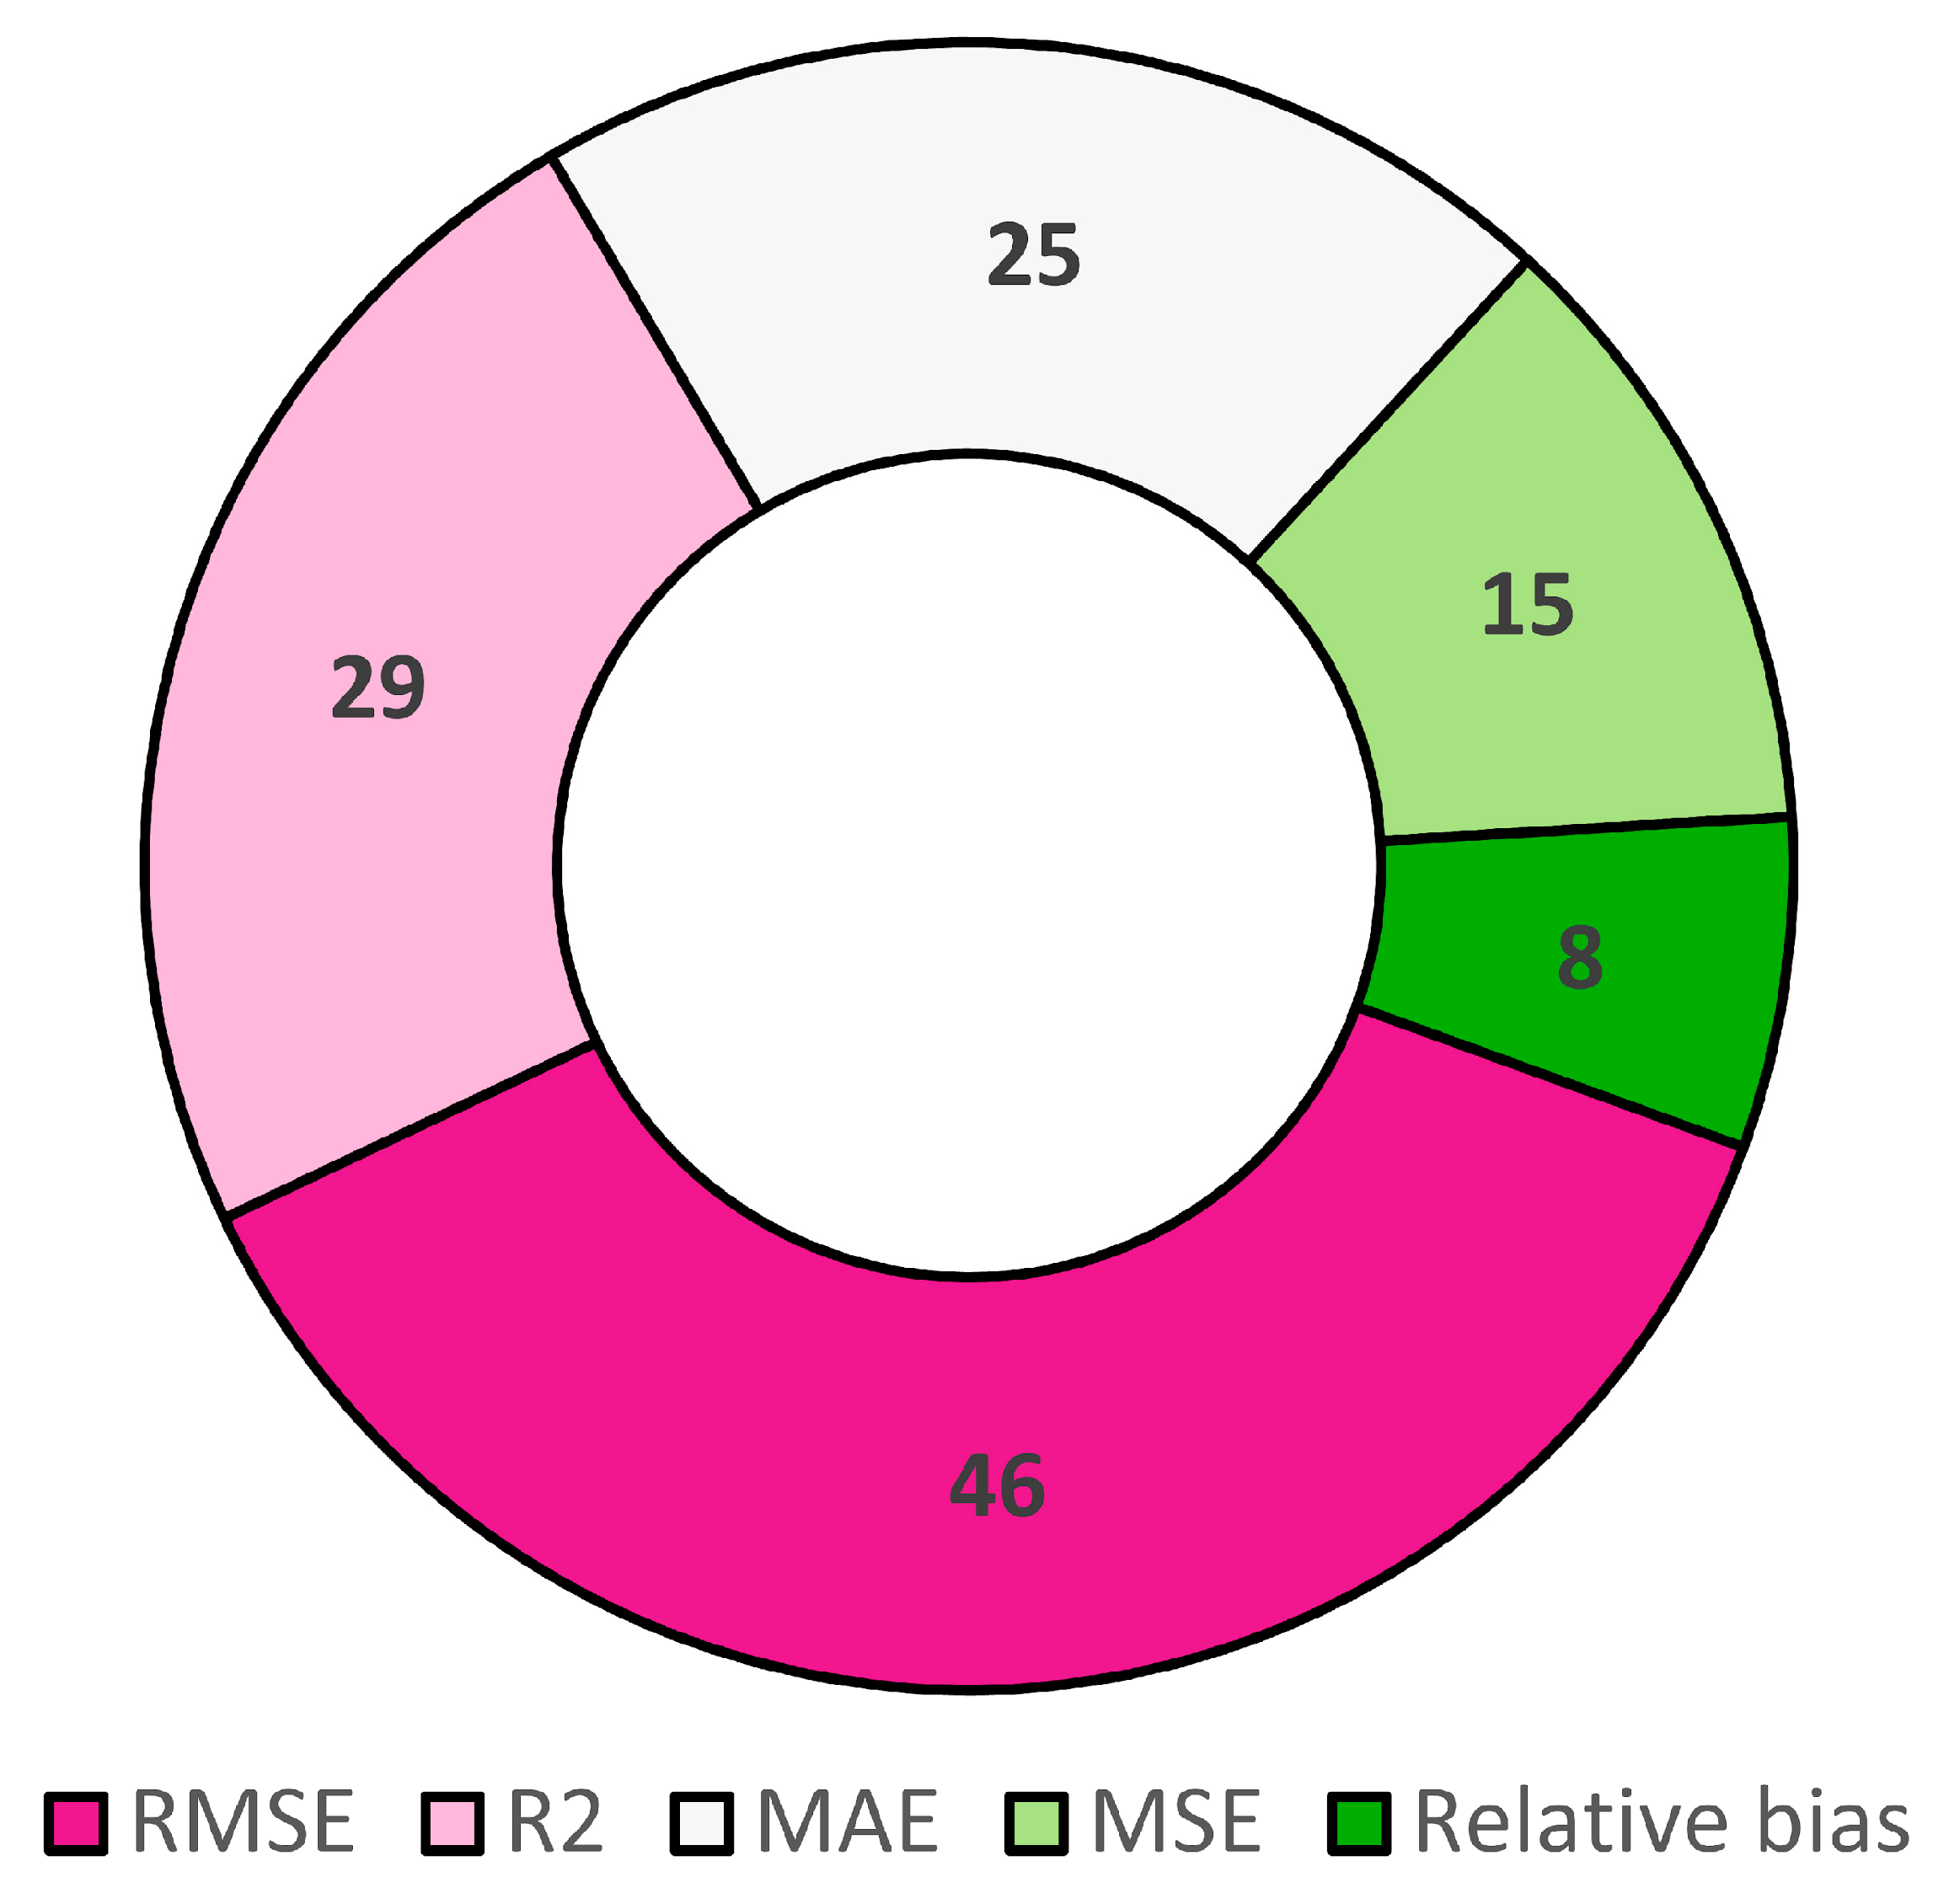
Regression metrics are essential for evaluating the performance of DL models in predicting continuous wildfire-related variables. As illustrated in
Figure 20, the frequency of use for each regression metric across the reviewed studies is presented. This figure shows that root mean squared error (RMSE) was the most used metric in 46 studies, indicating its widespread adoption for measuring the magnitude of prediction error. R-squared (R2) was used in 29 studies to assess the proportion of variance explained by the model. In comparison, Mean Absolute Error (MAE) appeared in 25 studies, providing an intuitive measure of average prediction error. Mean Squared Error (MSE) and relative bias were used in 15 and 8 studies, respectively.
3.5.2. Classification Metrics
In wildfire-related classification tasks, various performance metrics were used to evaluate DL and traditional ML models.
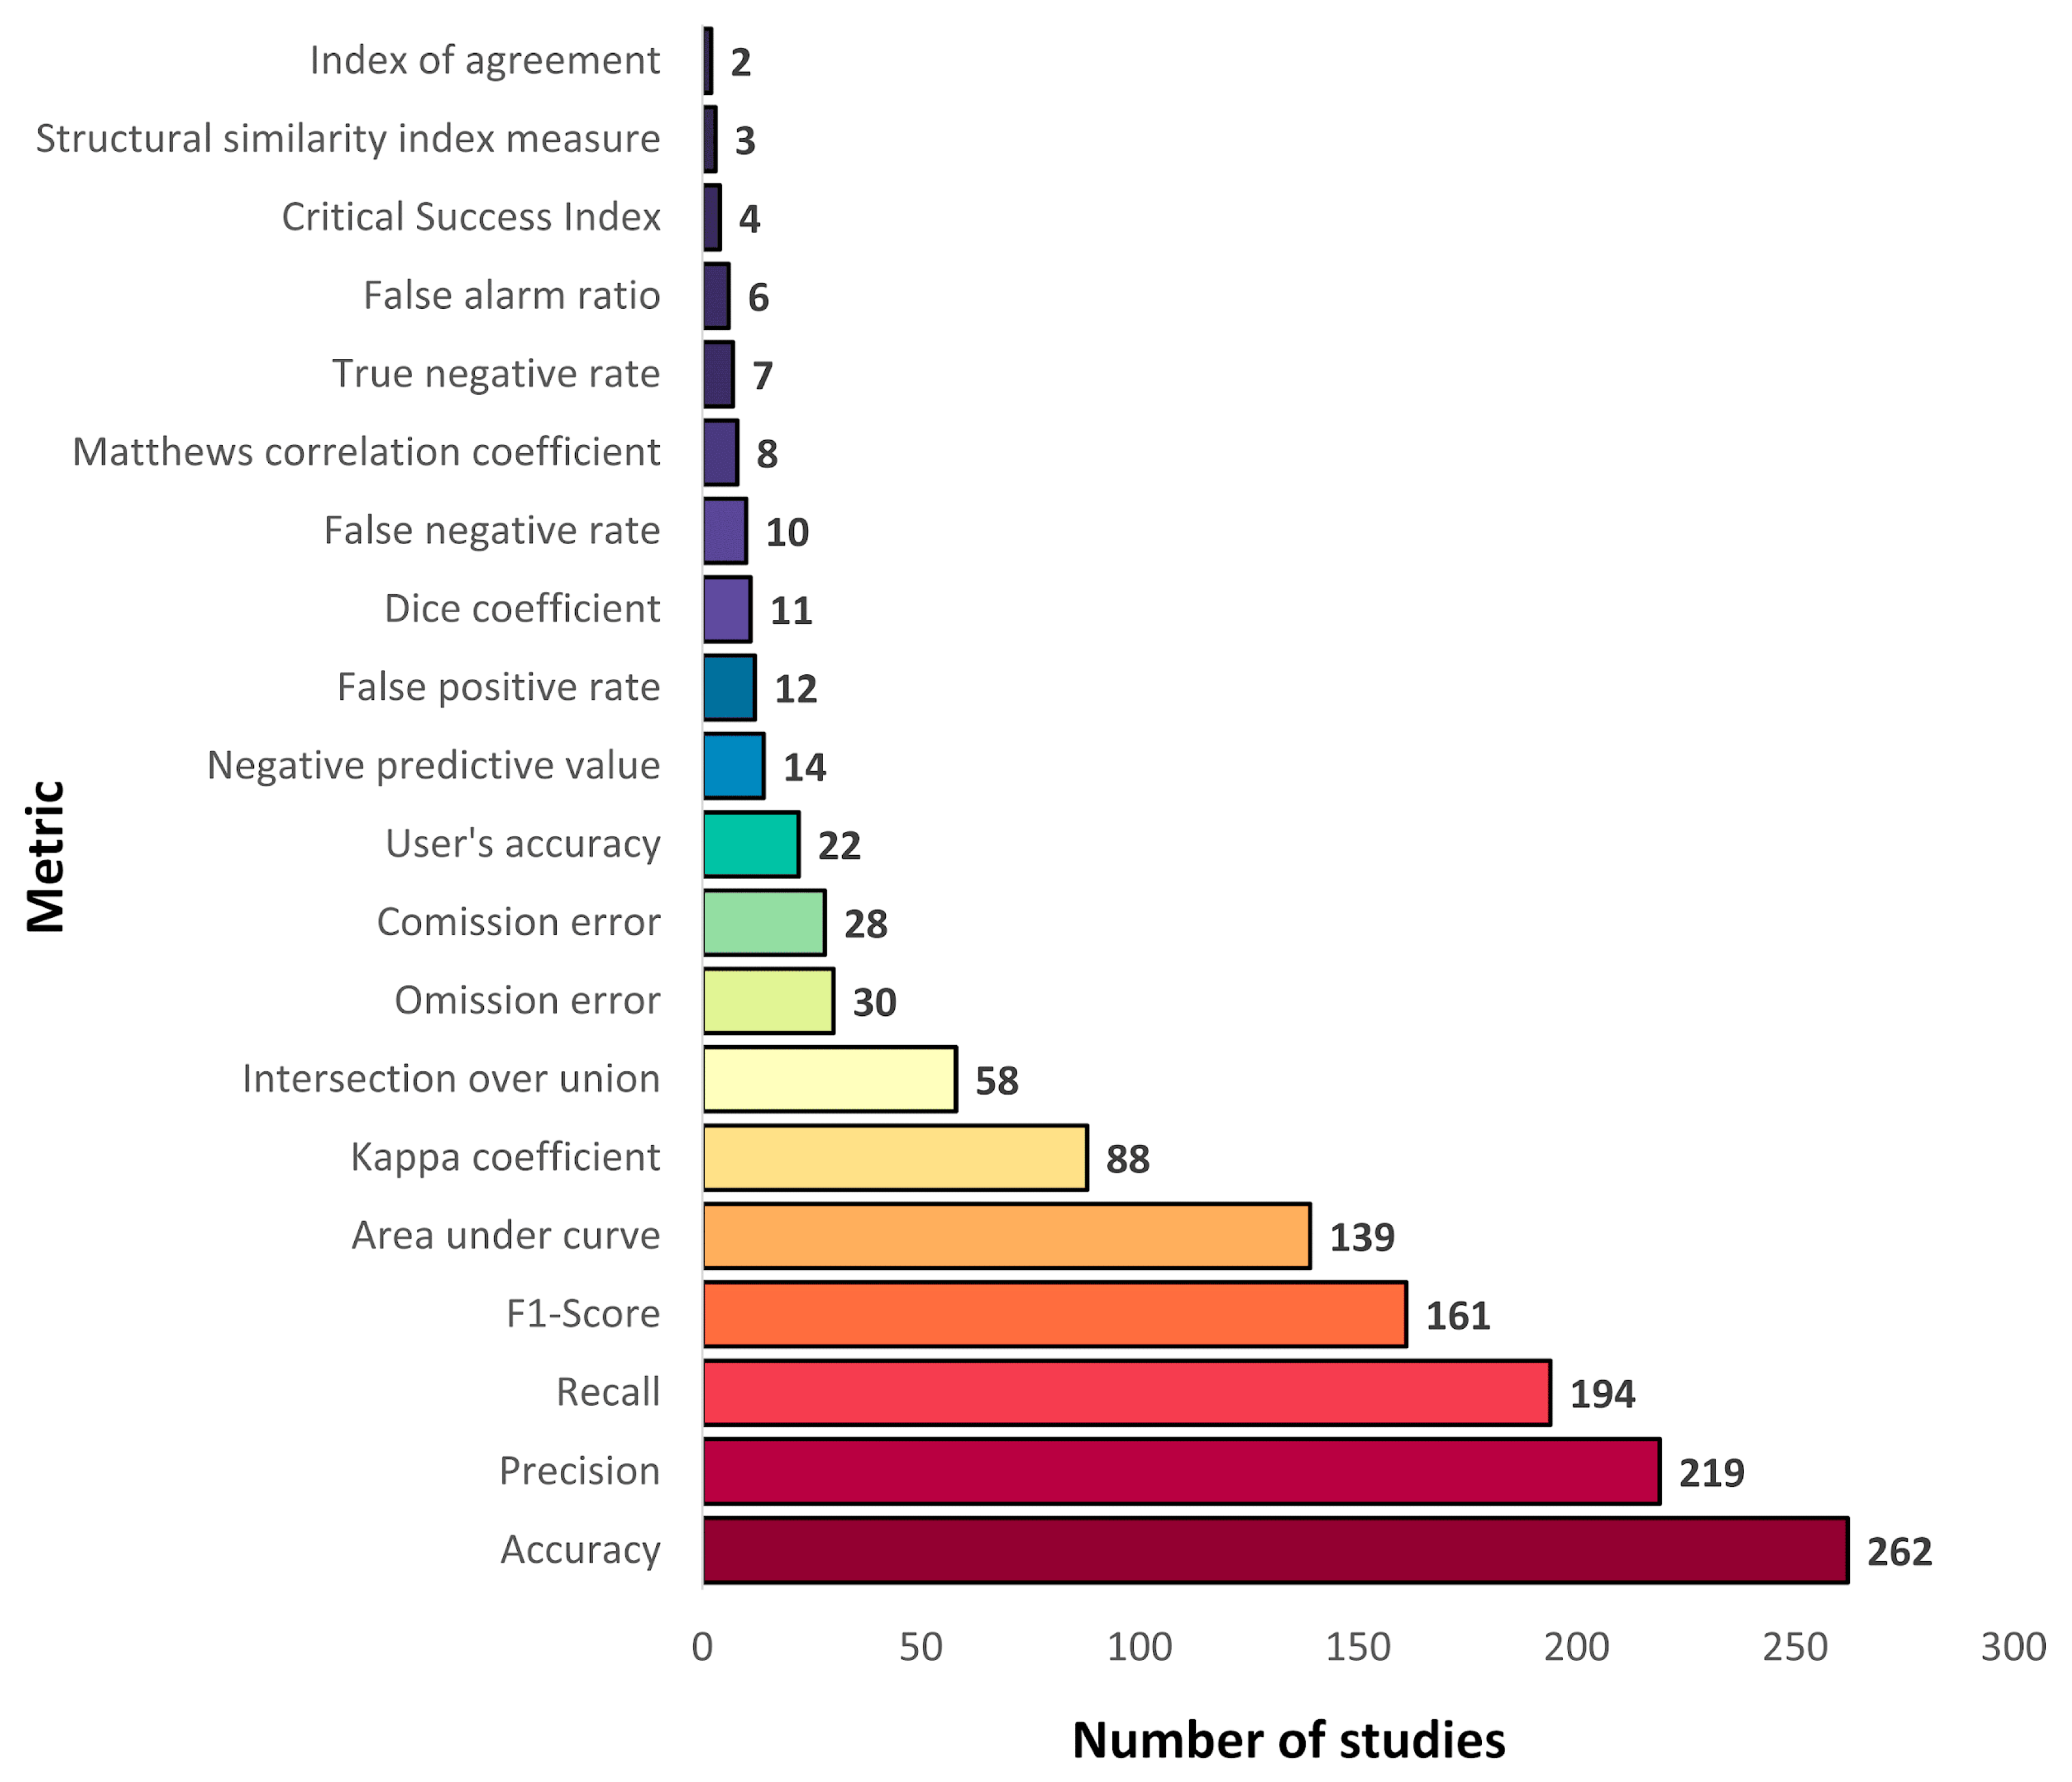
Figure 21 summarizes the most reported classification metrics in the reviewed studies. Accuracy was the most frequently used metric, reported in 262 studies, followed by precision in 219 studies, recall in 194 studies, and F1-score in 161 studies. These metrics are especially critical for assessing the balance between false positives and false negatives in wildfire detection, classification, and susceptibility mapping. The area under the curve was also widely applied, as mentioned in 139 studies. Other metrics, such as the Kappa coefficient, intersection over union, omission and commission errors, and user’s accuracy, were also used, though less frequently.
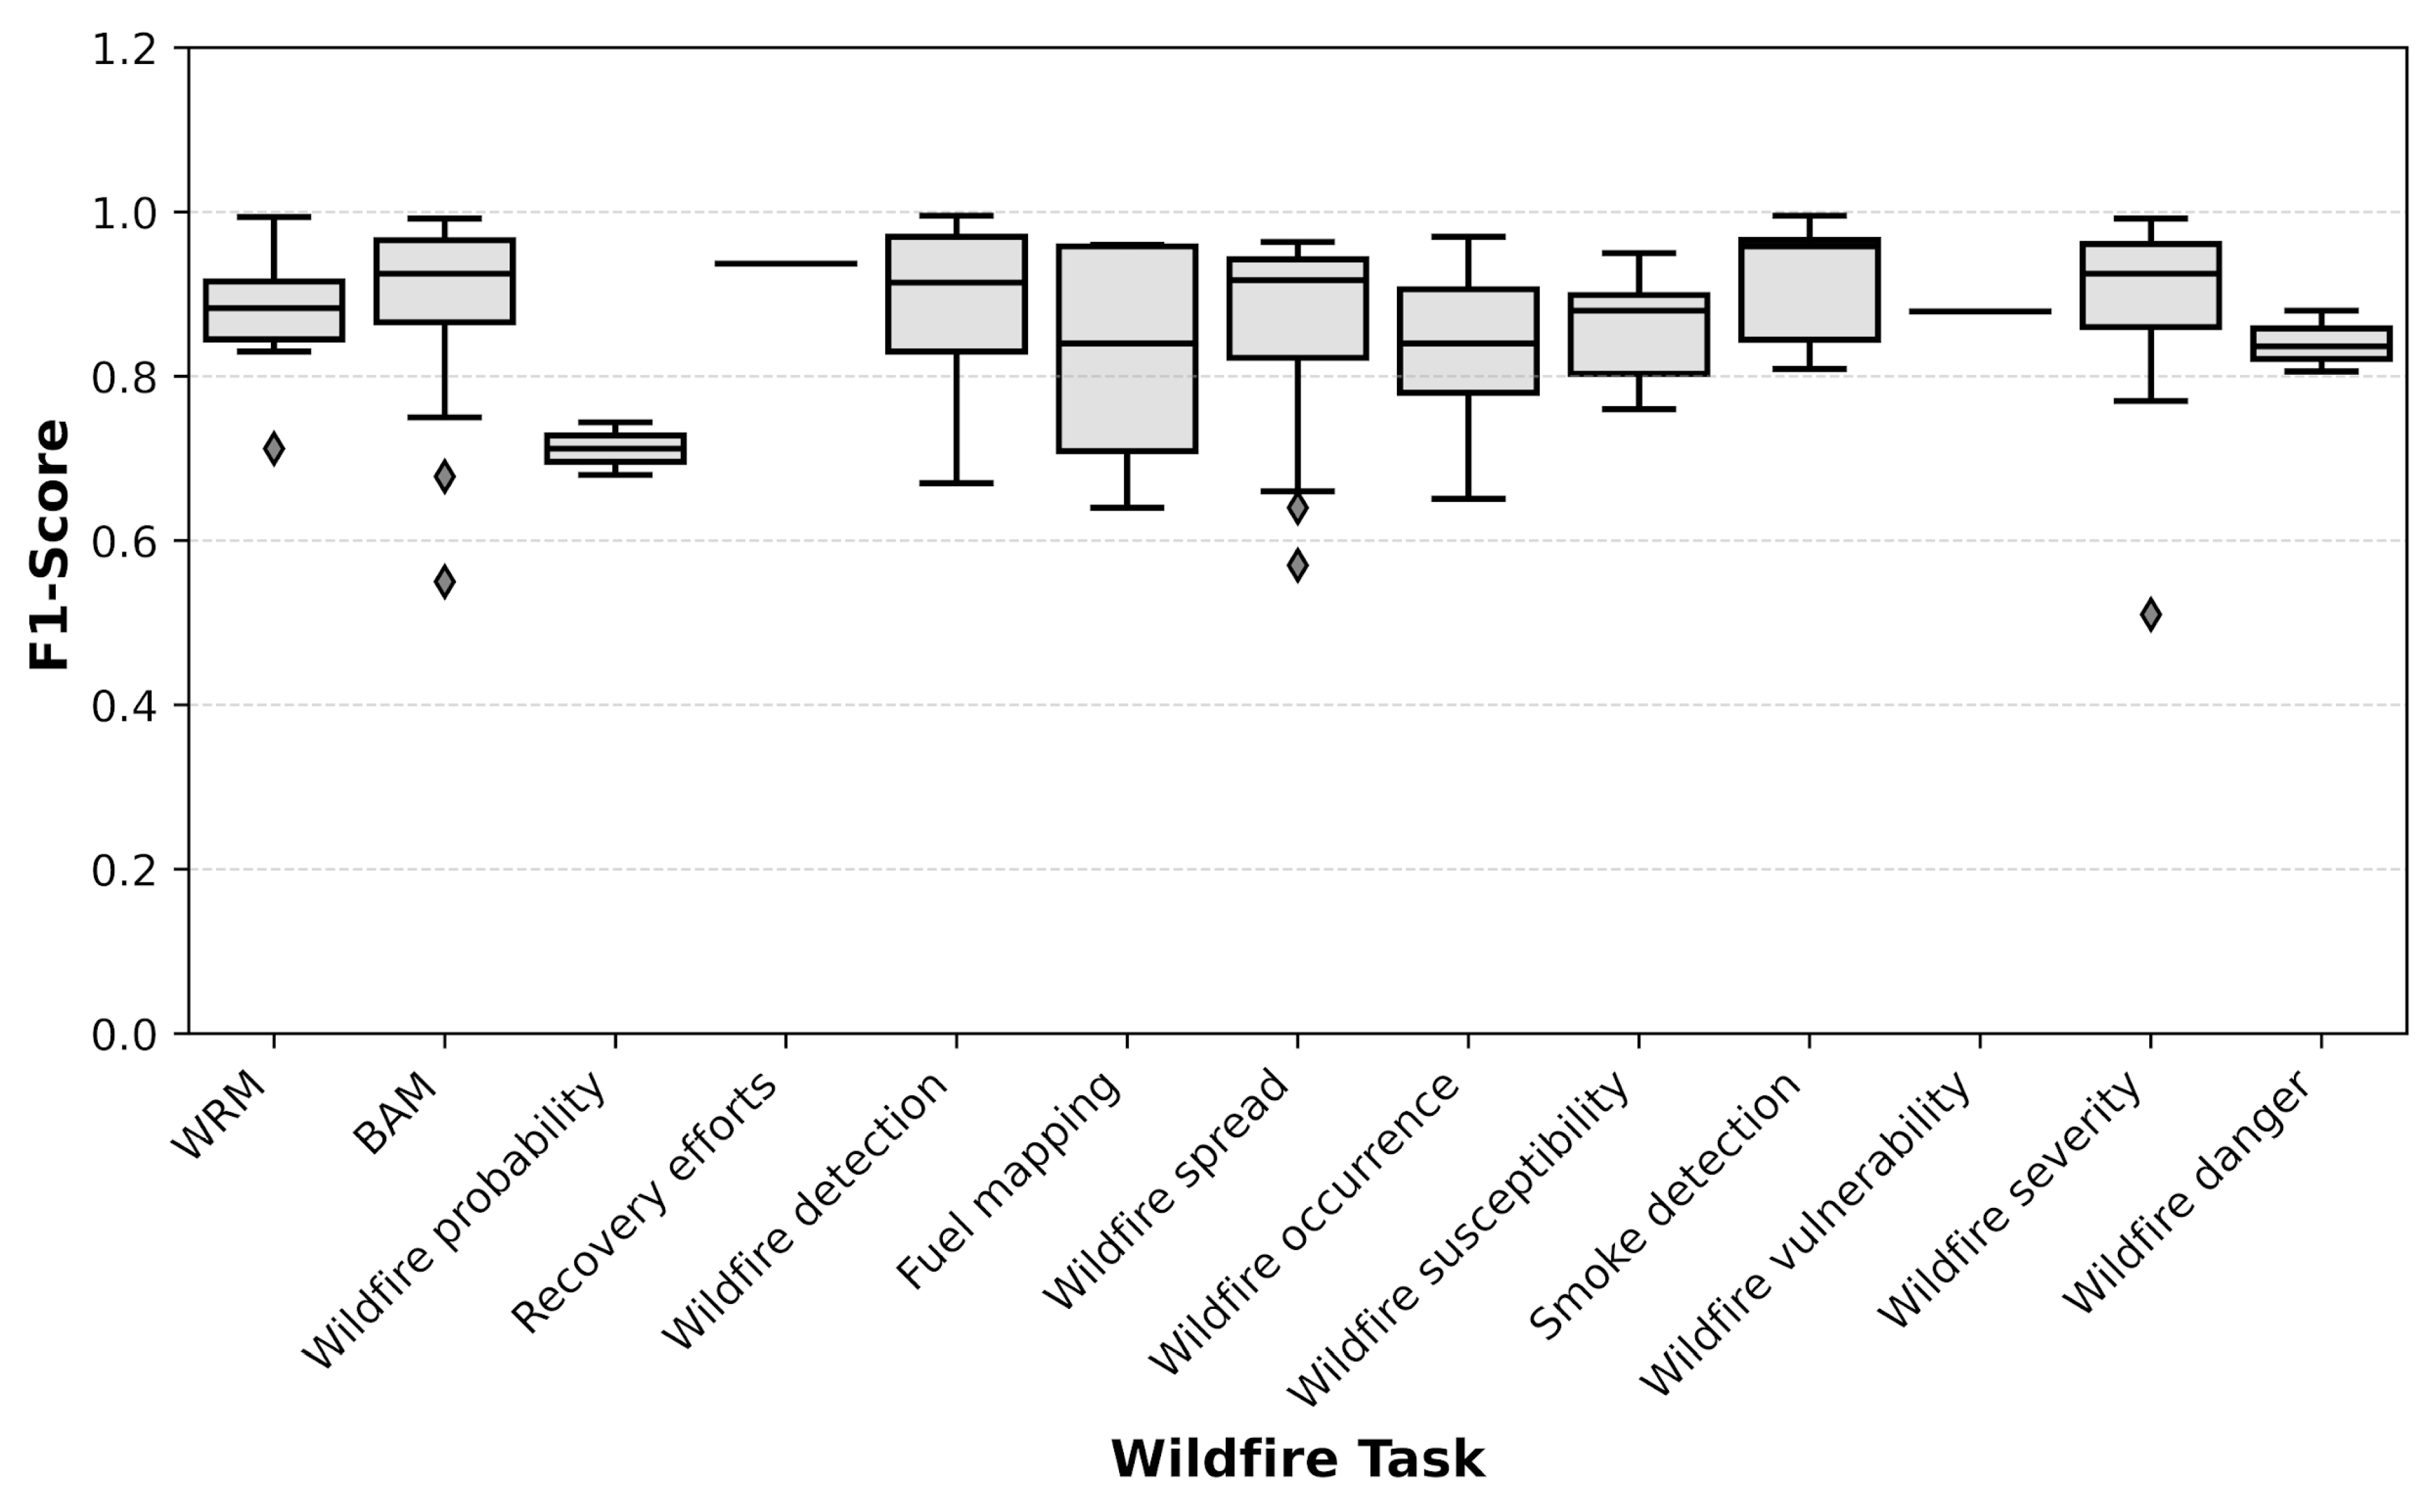
Understanding the performance of DL and traditional ML models across different wildfire-related tasks is essential, as it highlights areas of maturity in the literature and identifies tasks that may benefit from further methodological attention or data improvements. To provide consistency and comparability across studies, we focused on the F1-score, a metric that balances precision and recall, especially relevant in wildfire applications where the cost of false positives and false negatives can be high.
Figure 22 presents a box plot showing the distribution of F1-scores for each wildfire task. Overall, most tasks demonstrated strong performance, with mean F1-scores exceeding 0.8. Notably, tasks such as recovery efforts and wildfire vulnerability were reported in only one study, each appearing as a single horizontal line in the plot. Tasks such as recovery efforts and wildfire vulnerability showed consistent, high scores, with a single reported value of 0.937 and 0.879, respectively. Smoke detection, BAM, and WRM also achieved high mean F1-scores, reflecting reliable model outcomes. On the other hand, wildfire probability had the lowest mean score (0.712), while tasks such as wildfire severity and fuel mapping exhibited wider performance ranges, suggesting variability in data quality or model approaches. Importantly, studies reporting implausibly high F1-scores, such as wildfire detection and wildfire susceptibility with maximum values of 0.85 and 0.95, indicate probable reporting or formatting errors and should be interpreted cautiously.
4. Discussion
4.1. Trends and Research Priorities
The paper presents a comprehensive review of supervised learning in wildfire management from a meta-analytic perspective. The distribution of wildfire-related GeoAI studies across various journals highlights the increasing interdisciplinary integration and widespread scientific interest in this domain. Journals focusing on RS, ecology, environmental modeling, and natural hazards have all contributed to the literature, reflecting the multifaceted nature of wildfire research. This diversity indicates that wildfire management is a priority among geospatial scientists and a significant concern for researchers across various scientific fields. Therefore, collaboration with scientists from diverse fields will increase the likelihood of better wildfire management, as discussed in a wildfire review paper by [
26]. Moreover, wildfire-related studies in both specialized and general science journals further highlight its importance as a globally relevant environmental challenge.
These findings are consistent with recent international review studies that have reported rapid growth in the application of ML and DL techniques for wildfire management, particularly after 2015, driven by increased availability of satellite data and advances in computational capabilities [
10,
26]. Like global trends reported by these studies, our meta-analysis confirms the concentration of research on a limited set of dominant tasks, as identified in
Section 3. However, our systematic analysis of 449 studies provides a more comprehensive quantitative assessment of research trends across all wildfire management phases, highlighting additional gaps such as limited attention to recovery and vulnerability assessment tasks.
The evolution of wildfire-related research tasks over time highlights how scientific priorities have shifted in response to emerging challenges and technological advancements, such as state-of-the-art DL models, high-performance computing, and EO data [
84]. A notable spike in wildfire-related studies after 2020 coincides with a series of devastating wildfire events worldwide that emphasized the urgent need for advanced predictive and monitoring tools. For instance, the Dixie Fire in California (2021) [
97] became one of the largest in state history, burning nearly 963,000 acres and destroying the town of Greenville. In 2023, the Maui wildfires in Hawaii [
98] became the deadliest US wildfire in over a century, claiming more than 100 lives, while the Canadian wildfire season in 2023 [
99] broke all national records with over 18 million hectares burned and widespread transcontinental smoke impacts. Chile experienced one of its worst wildfire seasons in 2023, with over 430,000 hectares burned and extensive community damage. Greece faced an unprecedented series of wildfires in 2023, particularly in Evros, where more than 96,000 hectares of protected forest were lost in the EU’s largest recorded wildfire. Australia also saw ongoing fire threats in 2020–2021, following the devastating 2019–2020 Black Summer fires [
100]. These events attracted international attention, exposing gaps in existing response systems and prompting accelerated research into DL-based solutions. As a result, recent studies increasingly focus on critical tasks such as BAM, wildfire detection, recovery efforts, wildfire spread, etc.
In addition to this increase, the growing dominance of a limited subset of wildfire tasks, reflects their critical roles in operational response and post-fire analysis. Similarly, the increased attention to wildfire occurrence and susceptibility indicates a broader strategic focus on predicting and mitigating wildfire risks before ignition. The steady development of studies on wildfire spread, severity, and risk mapping suggests sustained interest in understanding wildfire dynamics and informing preparedness strategies. On the other hand, more specialized areas, such as smoke detection, have seen recent surges, likely driven by concerns about public health and advances in sensing technologies. Despite overall growth, some important areas, such as recovery efforts and wildfire vulnerability, remain relatively understudied, highlighting gaps in the literature that warrant further exploration. Moreover, fuel mapping is relatively underexplored, with few studies, although these maps are critically important for predicting wildfire spread. The fuel mapping application aims to classify vegetation types and biomass characteristics influencing wildfire behavior and intensity [
90]. For instance, the Canadian Fuel Map generated by NRCan consists of classes such as Spruce, Boreal Spruce, Pine, Conifer, Aspen, and Mixedwood [
101]. These fuel types are essential inputs to fire behavior models and operational tools such as the Canadian Fire Behavior Prediction (FBP) System. Therefore, expanding research on fuel mapping using AI methods could enhance the accuracy of fire-spread simulations and improve pre-fire planning and suppression strategies.
This evolution of ML and DL algorithms in wildfire management over time aligns with the findings of [
10], who noted the relatively slow adoption of ML-based research in wildfire science up to the 2000s compared with other fields, followed by a sharp increase in publication rate in the last decade.
In addition to using the F1-score as a unified metric for cross-study comparison, it is important to recognize that different wildfire tasks require task-specific evaluation criteria. For example, regression-based tasks such as wildfire spread prediction and fire weather estimation are more appropriately evaluated using metrics such as RMSE or MAE, while segmentation-based tasks such as BAM benefit from spatial metrics such as Intersection over Union (IoU). Similarly, detection-oriented tasks may prioritize recall to reduce missed fire events. These differences indicate that performance evaluation in wildfire GeoAI should be aligned with the specific objectives of each task.
While these findings are supported by frequency-based analysis, they also reflect underlying operational priorities in wildfire management. Tasks such as wildfire detection and BAM are more frequently studied because they directly support real-time decision-making and post-fire assessment. In contrast, tasks such as recovery assessment and vulnerability analysis require long-term monitoring, multi-source data integration, and more complex modeling frameworks, which partially explains their limited representation in the literature.
4.2. Spatial Patterns in Wildfire Research
Analysis of author affiliations and study areas indicates important patterns in the global distribution of wildfire-related research and reflects real-world wildfire risks and disparities in research capacity and data accessibility. Asia leads in first-author affiliations, with China accounting for nearly half of the continent’s contributions. This result highlights the region’s growing investment in environmental research and its interest in applying geospatial and AI-based approaches to wildfire challenges, supported by its access to advanced computational resources and substantial investments in AI research [
102]. However, in terms of study areas, North America, particularly the US, dominates, with research focused on tasks such as wildfire detection, spread prediction, and BAM. This focus indicates that even researchers outside North America frequently select the US and Canada as study areas, likely due to the regions’ extensive wildfire activity and the availability of high-quality, open-access geospatial data [
103]. Similarly, European and Australian regions are often chosen as study areas because they have robust wildfire monitoring systems, strong institutional frameworks, and longstanding public data policies [
102].
In contrast, despite being highly vulnerable to wildfires, many regions in Africa, Southeast Asia, and South America remain underrepresented in author affiliations and as study areas. This underrepresentation is particularly notable given that global wildfire datasets and assessments, such as the Global Fire Emissions Database (GFED) and the Fire Climate Change Initiative (FireCCI) products, indicate substantial fire activity in regions such as sub-Saharan Africa and parts of Southeast Asia. This highlights a clear mismatch between wildfire occurrence and research distribution, suggesting that factors such as data accessibility, monitoring infrastructure, and research capacity play a more significant role in shaping study locations than wildfire risk alone.
This imbalance is partly driven by limited research infrastructure and the lack of accessible, high-resolution wildfire data. European countries such as Greece, Spain, and Italy show a more balanced trend, with local researchers also focusing on domestic wildfire challenges and receiving strong institutional backing. Meanwhile, countries like Iran and India, although prominent in terms of author affiliation, tend to concentrate on wildfire susceptibility and risk management within national contexts.
In addition to data availability and research capacity, regional wildfire regimes also influence the selection of data sources and modeling approaches. For example, frequent low-intensity fires in African savanna ecosystems often exhibit rapid temporal dynamics, making moderate-resolution sensors such as MODIS more suitable for large-scale monitoring. In contrast, high-intensity forest fires in regions such as Australia and North America, particularly in eucalypt and boreal forests, require higher spatial resolution data (e.g., Sentinel-2 or Landsat) and more advanced modeling approaches to capture complex fire behavior and vegetation structure. These differences suggest that region-specific strategies are necessary, and future research should prioritize the development of tailored GeoAI models for understudied regions, such as sub-Saharan Africa and Southeast Asia, given their unique fire regimes and data constraints.
Therefore, addressing these disparities requires substantial investment in technological infrastructure, data acquisition, and AI development within underrepresented regions. In this study, we emphasize the importance of fostering international collaborations to facilitate the exchange of knowledge, data, and computational resources. Such partnerships can help close the global research gap and ensure that DL models are better suited to various environmental and geographic contexts. Furthermore, developing localized datasets and region-specific models will improve wildfire management activities.
This geographic imbalance aligns with findings from previous international studies, which also reported a strong concentration of wildfire research in North America, Europe, and Australia, largely due to better access to high-quality RS data, computational infrastructure, and institutional research support [
10,
102]. In contrast, wildfire-prone regions such as Africa and parts of South America remain underrepresented despite experiencing significant wildfire impacts. Our findings reinforce the global need to expand GeoAI-based wildfire research into data-scarce regions to improve global wildfire preparedness and risk assessment.
These patterns indicate that the geographic distribution of wildfire research is not solely driven by wildfire occurrence, but also by disparities in data accessibility, computational infrastructure, and institutional support. As a result, current GeoAI models may reflect biases toward well-studied regions, limiting their transferability and effectiveness in underrepresented areas.
4.3. Generalization in Wildfire Studies
While earlier sections highlighted the geographical and temporal concentration of wildfire studies, the scale at which these studies are conducted is equally critical. Landscape features such as vegetation type and density, canopy structure, and topographical variation differ significantly across regions, posing a central challenge for model generalization in wildfire prediction. Although most existing studies focus on local or regional scales, this localized emphasis poses a significant barrier to building ML and DL models that can generalize accurately across diverse ecosystems and administrative boundaries. It limits the adaptability of these models to varying fire regimes, land cover types, and climate conditions.
This limitation is not only methodological but also practical. Operational wildfire management systems require models that can perform consistently across different landscapes and climatic conditions. The current dominance of region-specific models limits the deployment of GeoAI solutions in large-scale or cross-border wildfire monitoring systems.
Despite the pressing global threat of wildfires intensified by climate change, relatively few studies extend to national, continental, or global scales. Only BAM task and detection models attempt to operate at broader scales. Even these studies used coarse RS satellite data, such as MODIS, on a global scale [
104,
105,
106], and a few studies used S2 and Landsat [
107,
108,
109]. Therefore, the uneven distribution of scales underscores the urgent need to design DL models that generalize across regions. Accurate, scalable models for various wildfire tasks are essential for tackling cross-border wildfire dynamics and enabling regional or global preparedness. Future research should use higher-resolution EO products, such as those derived from Sentinel-2, Landsat, and even Planet data, to address this limitation and develop more detailed, transferable models. Incorporating these richer datasets can improve spatial granularity and foster model performance at broader scales without sacrificing local relevance. Such efforts will be vital for establishing robust, multi-scale wildfire systems capable of addressing the growing complexity and geographic variability of wildfire events worldwide.
This limitation in model generalization has also been highlighted in international wildfire modeling studies, which emphasize that models trained in specific geographic regions often perform poorly when applied to different ecosystems or climatic conditions [
104,
106]. Our review confirms that most GeoAI wildfire models remain region-specific, indicating that developing globally transferable models remains a critical research challenge.
4.4. Geospatial Data Contribution in Wildfire Studies
In wildfire studies, various data types have been used, including meteorological, topographical, satellite, and anthropogenic variables. Each data type contains various features that offer valuable information about wildfires and environmental conditions. Among the meteorological variables, temperature, precipitation, wind speed, and humidity fundamentally shaped wildfire ignition conditions, fuel dryness, and spread velocity. In practice, these variables are critical components of operational wildfire danger rating systems and early warning platforms used by agencies such as the US Forest Service, Environment and Climate Change Canada, and Australia’s Bureau of Meteorology. Their frequent integration into predictive models underscores the dependence of real-world wildfire forecasting efforts on high-quality, timely weather data.
In addition to meteorological data, the widespread use of spectral indices, particularly NDVI, NBR, and EVI, underscores the importance of satellite-based vegetation monitoring for pre- and post-fire management. Indices like NBR are used to assess burn severity and track vegetation recovery. The use of change-detection indices (e.g., dNDVI, dNBR) also supports damage assessment and resource allocation after major fire events and confirms their important role in real-time disaster response and recovery efforts. Moreover, biophysical variables such as evapotranspiration, vegetation type, land cover, and canopy structure provide information on fuel availability, which is essential for wildfire spread modeling and WRM.
Topographic variables are another crucial input widely used across wildfire-related studies. Elevation, slope, and aspect are foundational elements in understanding wildfire behavior, as they influence wildfire spread rate, fuel distribution, and moisture retention [
1]. For example, wildfires tend to move faster uphill due to fuel preheating on steeper slopes, and certain aspects may retain more moisture depending on solar exposure [
11]. These variables are commonly incorporated into wildfire spread simulators and national behavior prediction systems. Although more advanced terrain metrics, such as the TWI, plan curvature, and surface roughness, are less frequently used, they offer additional insight into moisture distribution and drainage patterns, which are particularly valuable for modeling ignition potential in complex terrain. Therefore, it is recommended to use this extended set of topographic features in combination with traditional variables, such as elevation, slope, and aspect, to enhance the spatial accuracy of wildfire susceptibility and behavior models, especially in rugged or heterogeneous landscapes, such as southern British Columbia, Alberta, and western California. Moreover, high-resolution data sources, such as Light Detection and Ranging (LiDAR) point clouds, provide a powerful means of deriving these topographic variables with unprecedented detail and accuracy. Since topography remains relatively stable over time [
1], a single LiDAR data acquisition can be a long-term asset. It is therefore advisable to invest in LiDAR data collection in high-risk wildfire-prone regions such as the Canadian boreal forests, the western US, Greece, Portugal, Brazil, Australia, and Spain to support long-term modeling efforts. This would enhance model precision and enable the development of robust decision-support tools for wildfire management and mitigation.
Anthropogenic variables, such as camping, smoking, and land development, further enhance wildfire modeling by accounting for human influence on ignition and exposure. Fire susceptibility models commonly include features like distance to residential areas, roads, and power lines to identify human-caused ignition hotspots [
110]. The frequent use of distance to residential areas and roads stems from their direct association with fire ignition risk [
111]. Residential areas, particularly in or near wildland areas, are common ignition sources due to outdoor burning, faulty equipment, or human negligence [
112]. Roads, on the other hand, serve as pathways for both human activity and infrastructure and are often linked to increased ignition risk from vehicle accidents, machinery malfunctions, or recreational users engaging in activities that can inadvertently start wildfires [
113]. Infrastructure corridors, in particular, are known ignition pathways due to equipment failures or concentrated human activity [
111]. Given the frequent and significant relationship between these anthropogenic features and wildfire ignition, it is recommended that future wildfire models consider not only the proximity to residential areas and roads but also the intensity and nature of human activity within these zones. For example, integrating data on human activities, such as traffic patterns or residential building density, could provide more nuanced insights into fire risks. Additionally, incorporating seasonal and temporal variations in human activity, such as higher visitation rates during holiday seasons or specific recreational periods, would improve the precision of risk assessments.
Another important source of data in wildfire management is EO data, which can be used to monitor, forecast, and manage wildfire events. RS technologies can track wildfires across vast, inaccessible areas, providing real-time information on wildfire activity, intensity, progression, and damage assessment. Among the various types of RS data used, MODIS is among the most frequently used sources due to its high temporal resolution and broad coverage. MODIS data, though invaluable for large-scale monitoring, has limitations, particularly its low spatial resolution, which can hinder precise assessments of wildfire effects at the local level. This pattern highlights a fundamental trade-off in wildfire monitoring between spatial and temporal resolution. In operational contexts, timely detection often takes priority over fine spatial detail, which explains the continued reliance on moderate-resolution sensors such as MODIS.
As wildfire events become more frequent and severe, relying on MS sensors, such as L8 and S2, and UAV-based imagery remains critical. These sensors provide detailed vegetation cover, burn severity, and land use data, essential for understanding fire behavior, monitoring recovery, and assessing long-term environmental impacts [
12]. While active RS sources such as SAR and LiDAR are less commonly used, they offer unique advantages for wildfire management. SAR is particularly effective in detecting fire-affected areas through smoke, cloud cover, and other atmospheric conditions that obscure optical imagery. SAR’s ability to penetrate these barriers makes it a powerful tool during active wildfire events. LiDAR, on the other hand, offers detailed structural information on vegetation, which is crucial for assessing fuel load, canopy density, and post-fire recovery. However, the limited adoption of these active sensors in wildfire studies underscores the need for broader application and the development of cost-effective methods for integrating them into routine wildfire monitoring. The limited adoption of SAR data, despite its ability to operate under smoke and cloud conditions, suggests that challenges in data interpretation, preprocessing complexity, and integration into existing workflows remain barriers to its broader use in wildfire applications.
Although less frequently used, HS data also holds great potential for wildfire research. These sensors, such as PRISMA and Hyperion, provide rich spectral information that can be used to detect subtle changes in vegetation stress, moisture content, fuel mapping, and wildfire damage. An important consideration in the context of satellite data for wildfire management is the growing trend toward dedicated, real-time monitoring systems like Canada’s WildFireSat mission [
114]. Scheduled to launch in 2029, this mission will consist of a constellation of microsatellites that will provide near-real-time information on fire intensity, speed, and projected paths. The WildFireSat mission exemplifies the potential of dedicated satellite systems for wildfire monitoring and could serve as a model for other wildfire-prone countries. By following Canada’s approach, countries that frequently experience wildfires, such as Australia and the US, could enhance their fire management capabilities, providing better-informed wildfire responses, improving forest resource conservation, and implementing more effective prevention strategies.
4.5. Bridging Indigenous Knowledge and Western Science
Despite significant advancements in geospatial technologies, ML, and RS for wildfire prediction and response, a critical gap persists in integrating Western scientific approaches with Indigenous Traditional Knowledge (ITK). While Western science excels in quantitative modeling, satellite-based monitoring, and predictive analytics, Indigenous communities often hold place-based ecological knowledge developed over generations through lived experience, cultural practices, and direct observation of landscape dynamics [
115]. In many fire-prone regions, such as North America, Australia, and parts of Africa and South America, Indigenous communities have long used traditional burning practices to reduce fuel loads, maintain biodiversity, and prevent catastrophic wildfires [
115,
116,
117]. These practices, often referred to as “cultural burning,” offer insights into low-intensity, frequent fire regimes that promote ecosystem resilience. For example, in northern Australia, Indigenous-led cultural burning programs have been successfully implemented to reduce fuel loads and wildfire intensity, while also supporting biodiversity conservation and carbon emission reduction initiatives. Similarly, in North America, Indigenous fire stewardship practices have been reintroduced in regions such as California and British Columbia, where controlled burns guided by traditional knowledge have contributed to improved landscape resilience and reduced wildfire risk. These examples demonstrate the practical value of integrating Indigenous knowledge into modern wildfire management systems.
However, mainstream wildfire management frameworks often undervalue or overlook these knowledge systems, thereby missing opportunities for more holistic, adaptive, and community-based fire governance. Current GeoAI research largely fails to consider Indigenous land management perspectives [
115,
118]. This disconnect reflects broader challenges around epistemological bias, data sovereignty, and institutional barriers to co-produced knowledge.
Bridging this gap will require deliberate efforts to build frameworks for knowledge integration rather than merely knowledge extraction. Co-designing wildfire models with Indigenous communities, incorporating cultural and ecological indicators into RS datasets, and respecting Indigenous data governance principles (e.g., CARE and OCAP frameworks) are essential steps. Ultimately, integrating ITK with Western scientific tools not only strengthens wildfire resilience but also promotes social equity, cultural preservation, and environmental justice, objectives that are increasingly recognized as central to sustainable wildfire management in the era of climate change.
4.6. AI for Wildfire Management: Progress, Shortcomings, and Future Directions
Another major research direction in wildfire management is the application of AI, particularly supervised learning approaches. The dominance of classification tasks indicates that wildfire-related problems are often framed as categorical decisions, such as the presence or absence of fire, BAM classification, or susceptibility classification. This trend is largely driven by the abundance of labeled categorical datasets (e.g., burned/unburned pixels, fire/no-fire occurrences), which are readily available from satellite fire products such as MODIS and VIIRS, as well as from institutional data repositories.
A further breakdown of algorithmic trends demonstrates a strong preference for supervised learning, especially in classification tasks, where ML techniques (e.g., RF, SVM) were predominantly used. Among these algorithms, RF was the most frequently used, largely due to its robustness, ease of use, and ability to handle high-dimensional and non-linear data. Its dominance in tasks such as wildfire susceptibility mapping, occurrence prediction, and BAM reflects its strong performance on classification problems commonly encountered in wildfire research. ANNs and SVMs were also popular and used in various tasks. While ANNs offer strong modeling flexibility, especially for complex nonlinear relationships, their relatively lower interpretability compared to RF or DT may explain their less frequent use in operational contexts [
119]. SVMs were similarly favored for their significance in small-to-medium-sized datasets with clear margins between classes, demonstrating their use in susceptibility and BAM tasks [
120].
Unlike traditional ML and DL approaches, unsupervised DL methods remain underutilized, as reflected in the limited number of studies identified in
Section 3. This underrepresentation is particularly evident in tasks such as wildfire susceptibility, fuel mapping, and post-fire recovery, where labeled data are scarce and difficult to obtain. Given the growing volume of unlabeled satellite and UAV data, unsupervised and self-supervised methods offer valuable opportunities for discovering novel wildfire patterns and supporting early anomaly detection. In addition, the limited use of semi-supervised learning highlights a gap in leveraging partially labeled data, which is a common scenario in RS applications. Future research should therefore prioritize the development of semi-supervised and self-supervised models, particularly for regions with limited labeling resources and highly imbalanced datasets.
Similar to ML approaches, the findings of this review reveal a strong and growing integration of DL methods into wildfire research, particularly in tasks that require spatial feature extraction [
121]. The predominant use of CNNs across detection, BAM, and spread-prediction tasks demonstrates their suitability for geospatial data. However, this dominance also points to methodological concentration that may limit innovation and reduce the field’s capacity to tackle more complex wildfire processes. While CNNs are highly sufficient for spatial analysis [
122], their limited ability to model temporal or sequential patterns suggests a gap in addressing the dynamic nature of wildfire behavior over time [
1]. Recurrent models such as LSTM and GRU were only employed in a few studies, primarily in spread and occurrence prediction [
1,
15]. Given the temporal progression inherent in wildfire dynamics, this limited use suggests a missed opportunity to use sequential modeling techniques. Similarly, transformer models and hybrid architectures that combine spatial and temporal learning, such as CNN-RNN or CNN-Transformer networks, are underrepresented despite their proven advantages in extracting complex spatiotemporal dependencies [
123]. These models typically extract local spatial features with CNNs [
124], global contextual representations with transformer blocks [
78], and then use temporal modules [
125] to capture temporal relationships. Such architectures have demonstrated high accuracy in complex wildfire modeling tasks, particularly in spread prediction [
123]. Moreover, the limited use of GCNs is notable, as these models could offer powerful tools for spatially aware tasks such as spread modeling and infrastructure vulnerability assessment.
Another important trend observed is the concentration of DL applications around a few dominant wildfire-related tasks. This concentration also reflects differences in task complexity and data characteristics. Tasks such as wildfire detection and BAM benefit from relatively well-defined labels and strong spectral signatures, which facilitate model learning and lead to higher reported performance. In contrast, tasks such as wildfire susceptibility, severity assessment, and fuel mapping involve more complex interactions between environmental variables, temporal dynamics, and often imbalanced or uncertain labels, making them inherently more challenging for both ML and DL models. These differences highlight that model performance is strongly influenced by task-specific data properties rather than solely by algorithm choice.
Detection and BAM account for most studies, while critical but underexplored areas such as wildfire danger estimation, fuel mapping, post-fire recovery, and vulnerability assessment have received minimal attention. This imbalance reflects a lack of suitable labeled data or a reluctance to engage with tasks requiring integrating heterogeneous datasets (e.g., topographic, meteorological, and vegetation information). As a result, DL is not yet being fully utilized to support decision-making across the entire wildfire management cycle.
In terms of the backbone architecture, the results of the review also indicate a clear preference for a limited backbone architecture, with ResNet [
126] appearing far more frequently than others. While this may reflect its proven reliability and widespread availability, the limited exploration of alternative backbones, such as attention-based models [
127] or lightweight architectures, suggests a degree of inertia in methodological development. These underused models could offer significant advantages, such as better performance on small datasets or faster inference for real-time applications.
A particularly critical limitation revealed by this review is the widespread tendency to train DL models from scratch, despite the geographic imbalance highlighted in
Section 4.2, where many regions such as sub-Saharan Africa and Southeast Asia remain underrepresented. In these data-scarce regions, transfer learning and domain adaptation techniques are especially important, as they enable knowledge transfer from well-studied regions to areas with limited labeled data.
Despite the extensive success of pre-trained models in RS and broader computer vision, most wildfire studies opted to randomly initialize models. Only a modest number utilized ImageNet-pretrained weights [
81,
128,
129] and even fewer incorporated domain-specific pre-trained models [
130,
131,
132] that could have offered more contextual relevance. This pattern reflects a missed opportunity, especially given the well-documented constraints in wildfire datasets, such as limited labeled samples, geographic imbalance, and high class imbalance. Training from scratch increases computational cost and convergence time, and disadvantages models’ learning generalized representations, particularly in tasks where labeled wildfire data are sparse or fragmented [
133]. The underuse of transfer learning suggests either a lack of awareness about its benefits or difficulties in adapting pre-trained models to the wildfire context. Yet models pre-trained on related EO tasks such as vegetation mapping, land cover classification, or climate anomaly detection could provide strong starting points for wildfire models and drastically reduce the need for extensive labeled training sets.
Furthermore, the minimal adoption of domain adaptation strategies, such as fine-tuning from a similar wildfire-prone region, limits the scalability and transferability of current DL approaches. In the future, greater emphasis should be placed on integrating transfer learning and domain adaptation frameworks, including few-shot and meta-learning techniques, particularly suited to low-data regimes. Addressing this gap is crucial for building robust, generalizable wildfire prediction systems that can perform reliably across diverse geographic and temporal conditions.
Recent advances in AI, particularly Geo-foundation models, spatiotemporal transformer architectures, and graph neural networks (GNNs), represent a new generation of approaches in wildfire GeoAI. Geo-foundation models (e.g., Clay, Prithvi), trained on large-scale EO datasets, enable transferable feature learning and improved generalization across regions with limited labeled data. Similarly, spatiotemporal transformers provide a powerful framework for capturing complex temporal dynamics and long-range spatial dependencies in wildfire processes, while GNNs offer advantages for modeling spatial interactions and connectivity, including fire spread across heterogeneous landscapes and infrastructure networks. Despite their strong potential, these methods remain underexplored in current wildfire research due to high computational requirements, limited availability of large-scale labeled datasets, and challenges in operational deployment. However, they are expected to play a key role in developing next-generation, scalable, and generalizable wildfire monitoring and prediction systems.
These observations indicate that the selection of AI models in wildfire research is influenced not only by predictive performance but also by factors such as data availability, computational requirements, and interpretability. This explains the continued dominance of traditional ML methods alongside the gradual adoption of more complex DL architectures.
4.7. From Black Boxes to Transparent Models
Explainability refers to the ability to make the inner workings and decision-making processes of ML and DL models transparent and understandable to humans. In wildfire management, where decisions often carry high stakes and involve complex environmental interactions, interpretability is not just desirable but essential [
37]. XAI techniques and feature-importance analyses provide critical knowledge about which input variables most significantly influence model predictions, thereby supporting transparency, trust, and informed decision-making among researchers, practitioners, and policymakers. Our review reveals that various explainability methods have been employed across wildfire-related studies. Traditional feature-importance metrics such as the Gini index, coefficient analysis, and permutation importance were widely used, especially in traditional ML models like RF.
In contrast, DL-based studies increasingly employed modern XAI tools such as SHAP, Grad-CAM, saliency maps, and integrated gradients to visualize and quantify the influence of input features [
134]. Despite growing adoption, their use remains inconsistent and often limited to post hoc analysis. A notable pattern is the recurrent identification of variables such as temperature, NDVI, elevation, aspect, and proximity to anthropogenic features as critical predictors across various wildfire tasks, including susceptibility, occurrence, and detection. This consistency suggests the robustness of these variables in modeling and their importance for real-world monitoring. Crucially, identifying specific parameters as key drivers of wildfire behavior implies that those variables should be prioritized in data-collection strategies. For example, if deemed essential, temperature or NDVI data should be acquired at higher spatial and temporal resolutions to improve model performance and operational decision-making. Moving forward, greater attention should be given to embedding explainability into the model development pipeline, not just as an afterthought. Furthermore, the wildfire research community must encourage a more systematic use of XAI techniques and promote interpretability standards, especially in DL contexts where model complexity often obscures understanding. By doing so, we can enhance model transparency and accountability, guide targeted data acquisition, and improve the real-world applicability of wildfire prediction systems. This reinforces that explainability is not only a methodological consideration but also a practical requirement for integrating AI models into operational wildfire decision-making systems.
4.8. Wildfire Task-Level Performance: Gaps and Insights
Evaluating how ML and DL models perform across different wildfire-related tasks provides insight into which areas are methodologically mature and which require further development. Our review indicates that some tasks consistently report strong model performance, likely due to well-structured input features, clearer target definitions, and more abundant or higher-quality training data. For example, smoke detection, BAM, and WRM tasks tend to involve visually or spectrally distinct features, allowing models to extract meaningful patterns.
In contrast, tasks such as wildfire probability, severity assessment, and fuel mapping often exhibit more variable or weaker model performance. This can be attributed to several factors. Wildfire probability modeling faces challenges due to the inherently stochastic nature of wildfire ignition, which is influenced by unpredictable factors such as human activity or lightning strikes. Additionally, input data for this task is often imbalanced, with many more non-fire samples than wildfire samples, making it harder for models to learn meaningful patterns.
Severity and fuel mapping tasks are also complex, as they depend heavily on nuanced vegetation conditions, temporal dynamics, and burn intensity factors that may not be adequately captured by available RS data or may require higher spatial or temporal resolution than is commonly used. Inconsistencies in severity definitions across studies, as well as the use of different indices and thresholds, further contribute to the observed performance variation.
Moreover, low performance on specific tasks may reflect limitations in the quantity, quality, or spatial representativeness of the training data. Some studies may rely on coarse-resolution inputs or regionally biased datasets, restricting the model’s generalizability. Another reason for performance variability is the lack of standardized evaluation protocols; differing cross-validation methods, class balancing, and sample selection all impact reported results and comparability across studies. In addition, tasks reported in only a few studies may appear to show strong or weak performance, but there is limited evidence to draw firm conclusions. These underrepresented tasks need more research attention to validate results, standardize methods, and optimize input features.
Similar performance trends have been reported in international wildfire studies, where tasks such as BAM and fire detection typically achieve higher accuracy due to clearer spectral and spatial patterns, while susceptibility modeling and severity assessment remain more challenging due to complex environmental interactions and data limitations [
10,
37]. Our findings confirm these global patterns and provide additional quantitative evidence based on a large-scale meta-analysis. These performance differences highlight that model accuracy is strongly task-dependent and influenced by data quality, feature representation, and problem complexity, rather than solely by the choice of algorithm.
However, it is important to note that performance comparisons across studies remain inherently limited due to variations in datasets, spatial scales, annotation strategies, and evaluation protocols. As a result, the findings of this study should be interpreted as trend-based insights rather than direct evidence of algorithm superiority.
4.9. Limitations of the Review
This review has several methodological limitations that should be acknowledged. First, the literature search was limited to the Web of Science and Scopus databases, potentially excluding relevant studies indexed in other sources. Second, only peer-reviewed journal articles published in English were considered, excluding conference proceedings, gray literature, and non-English publications that may contain relevant methodological contributions. Third, although a comprehensive keyword strategy was employed, the rapidly evolving terminology in GeoAI and wildfire science may have led to the omission of some relevant studies. Finally, despite the use of a structured screening protocol and discussions among the authors to maintain consistency, some degree of subjectivity in study selection and categorization cannot be eliminated. These limitations should be considered when interpreting the findings and identified research trends presented in this review.
5. Conclusions
Wildfires represent an increasing global challenge, driven by climate change, expanding human activity, and increasing fuel availability, which together demand more effective and scalable monitoring and management strategies. This systematic review demonstrates that GeoAI, integrating RS, GIS, and supervised AI, has become a fundamental component of modern wildfire science, enabling large-scale analysis and improved decision support across multiple phases of wildfire management.
Our findings reveal important structural patterns and limitations in current wildfire research. The dominance of tasks such as burned-area mapping, wildfire detection, and susceptibility modeling reflects significant progress in areas supported by well-established datasets and clear target definitions. However, critical gaps remain in tasks such as post-fire recovery assessment, wildfire severity modeling, fuel characterization, and vulnerability analysis, which are essential for long-term ecosystem management and risk mitigation. These gaps highlight the need for more balanced research efforts that address the entire wildfire lifecycle rather than focusing primarily on detection and mapping.
A key implication of this study is the uneven distribution of wildfire research capacity worldwide. The concentration of studies in high-income regions reflects disparities in data availability, computational infrastructure, and institutional support. Addressing these disparities through international collaboration, open-access data initiatives, and capacity-building will be essential to improving global wildfire preparedness and resilience.
Methodologically, this review identifies significant opportunities to advance wildfire modeling by adopting emerging AI techniques, including transfer learning, spatio-temporal DL architectures, XAI frameworks, and Geo-foundation AI models. These approaches can improve model generalization, interpretability, and operational reliability, particularly in data-scarce environments and complex wildfire scenarios.
Future research should prioritize integrating high-resolution, multi-source EO data with advanced AI frameworks to develop scalable, transferable, and interpretable wildfire management systems. For example, combining Sentinel-2 optical data with Sentinel-1 SAR and meteorological datasets can improve robustness under cloud and smoke conditions, while the use of spatio-temporal models such as CNN–Transformer architectures, and temporal Geo-foundation models can better represent wildfire dynamics. Strengthening global data-sharing efforts, incorporating underrepresented regions, and promoting transparent, explainable modeling approaches will be essential to translating GeoAI advances into effective real-world wildfire management solutions. Importantly, this study demonstrates that observed research trends are shaped not only by methodological advancements but also by practical constraints such as data availability, operational requirements, and computational limitations. Addressing these constraints will be essential for translating GeoAI research into real-world wildfire management systems. By addressing these methodological and structural challenges, GeoAI has the potential to significantly enhance global wildfire preparedness, response, and long-term ecosystem resilience.