1. Introduction
Under the combined impacts of global climate change and rapid urbanization, urban flooding has become increasingly frequent and severe worldwide, posing substantial threats to urban safety, infrastructure systems, and sustainable development [
1,
2]. Scientifically mapping urban flood susceptibility is therefore essential for flood mitigation planning, drainage system optimization, and resilient urban governance. In recent years, advances in remote sensing have significantly enhanced the capacity for urban flood susceptibility mapping. Earlier studies [
3,
4,
5,
6,
7,
8] on urban flood susceptibility mapping commonly relied on remote sensing and geospatial datasets with spatial resolutions ranging from 30 m to kilometer scales, while only limited studies employed sub-10 m spatial resolution data. Such coarse or moderate spatial resolutions limit the ability to capture fine-scale urban heterogeneity, micro-topographic features, and detailed urban surface characteristics relevant to urban flood susceptibility. With the increasing availability of high-resolution Earth observation (EO) data, it has become possible to generate meter-level urban flood susceptibility maps with improved representation of urban spatial patterns [
9,
10]. Various EO-derived products, including high-resolution terrain data, land cover datasets, impervious surface maps, and SAR-based flood mapping products, have further improved the representation of urban environmental conditions and flood-prone spatial characteristics for urban flood susceptibility analysis [
11,
12].
Meanwhile, the methodological paradigm of flood susceptibility mapping has gradually shifted from traditional knowledge-driven approaches toward data-driven techniques, reflecting the increasing use of geospatial big data and machine learning for improving mapping accuracy and predictive capability. Early studies mainly relied on rule-based methods and multi-criteria decision analysis [
13,
14,
15,
16,
17,
18,
19,
20,
21], which depend heavily on expert knowledge and subjective weighting schemes. Physics-based hydrological and hydrodynamic models [
22,
23,
24,
25,
26,
27,
28,
29] provide strong process interpretability but require extensive input data and computational resources, limiting their application for large-area or high-resolution mapping [
30]. In contrast, data-driven methods, particularly machine learning and spatial statistical models, have demonstrated strong predictive performance in urban flood susceptibility mapping [
8,
11,
12,
31,
32,
33,
34,
35,
36,
37,
38,
39,
40,
41,
42,
43,
44,
45,
46,
47,
48,
49]. Recent studies have further incorporated advanced machine learning and deep learning approaches, including ensemble learning models [
11,
38,
39,
50], Maximum Entropy (MaxEnt) models [
3,
51,
52,
53], convolutional neural networks (CNNs) [
41,
42,
46,
54], Bayesian neural networks (BNNs) [
45,
55], graph neural networks (GNNs) [
56,
57], and physics-informed machine learning techniques [
40,
47], to improve flood susceptibility mapping accuracy and model interpretability under complex urban environments. In addition, explainable artificial intelligence methods such as SHAP have increasingly been used to interpret model responses and identify dominant flood-conditioning factors [
41,
43,
45,
58,
59].
Despite these advances, several challenges remain in urban flood susceptibility mapping. First, drainage pipeline density (PipeDen) is widely used as an indicator of urban drainage capacity, yet statistical models often show a positive relationship between PipeDen and flood susceptibility [
8,
11,
15,
16], which limits its physical interpretability. Second, most studies adopt a single spatial analysis unit, typically regular grids or administrative boundaries [
11,
16,
60], while flood susceptibility patterns and the influences of environmental variables may vary across spatial scales, indicating significant scale effects. Third, most machine learning models require both positive and negative samples [
52,
53], whereas reliable flood occurrence data are often limited, introducing uncertainty and reducing model robustness, especially for high-resolution mapping.
To address these challenges, this study develops a multi-scale urban flood susceptibility mapping framework based on the Maximum Entropy (MaxEnt) machine learning model and multi-source high-resolution geospatial data, including Earth observation (EO) data. A novel indicator, per capita drainage density (PCDD), is proposed to represent drainage capacity relative to urban population demand. In addition, a three-tier spatial unit system, including drainage catchments, street units, and grid cells, is constructed to systematically examine scale effects on spatial patterns, factor contributions, and model performance. Multi-scale indicators were derived from terrain, land use, drainage networks, precipitation, and population datasets. The MaxEnt model is adopted due to its suitability for presence-only data and limited flood samples. Two groups of models were developed at each scale using per capita drainage density (PCDD) and pipe density (PipeDen) as drainage capacity indicators. To the best of our knowledge, few previous studies have systematically compared urban flood susceptibility patterns, driving factors, and model performance across hydrologically meaningful nested spatial scales. In addition, the influence of alternative drainage-capacity indicators under presence-only and limited flood sample conditions remains insufficiently explored.
Accordingly, this study aims to accomplish the following: (1) examine the spatial clustering characteristics of urban flood occurrences across multiple spatial scales; (2) identify key driving factors and quantify their scale-dependent effects; (3) develop and compare multi-scale MaxEnt-based flood susceptibility models; and (4) generate high-resolution urban flood susceptibility maps and analyze their spatial distribution patterns. The proposed framework is applied to Nanchang, China, to demonstrate the effectiveness of multi-source geospatial data and MaxEnt modeling for high-resolution urban flood susceptibility mapping.
3. Methodology
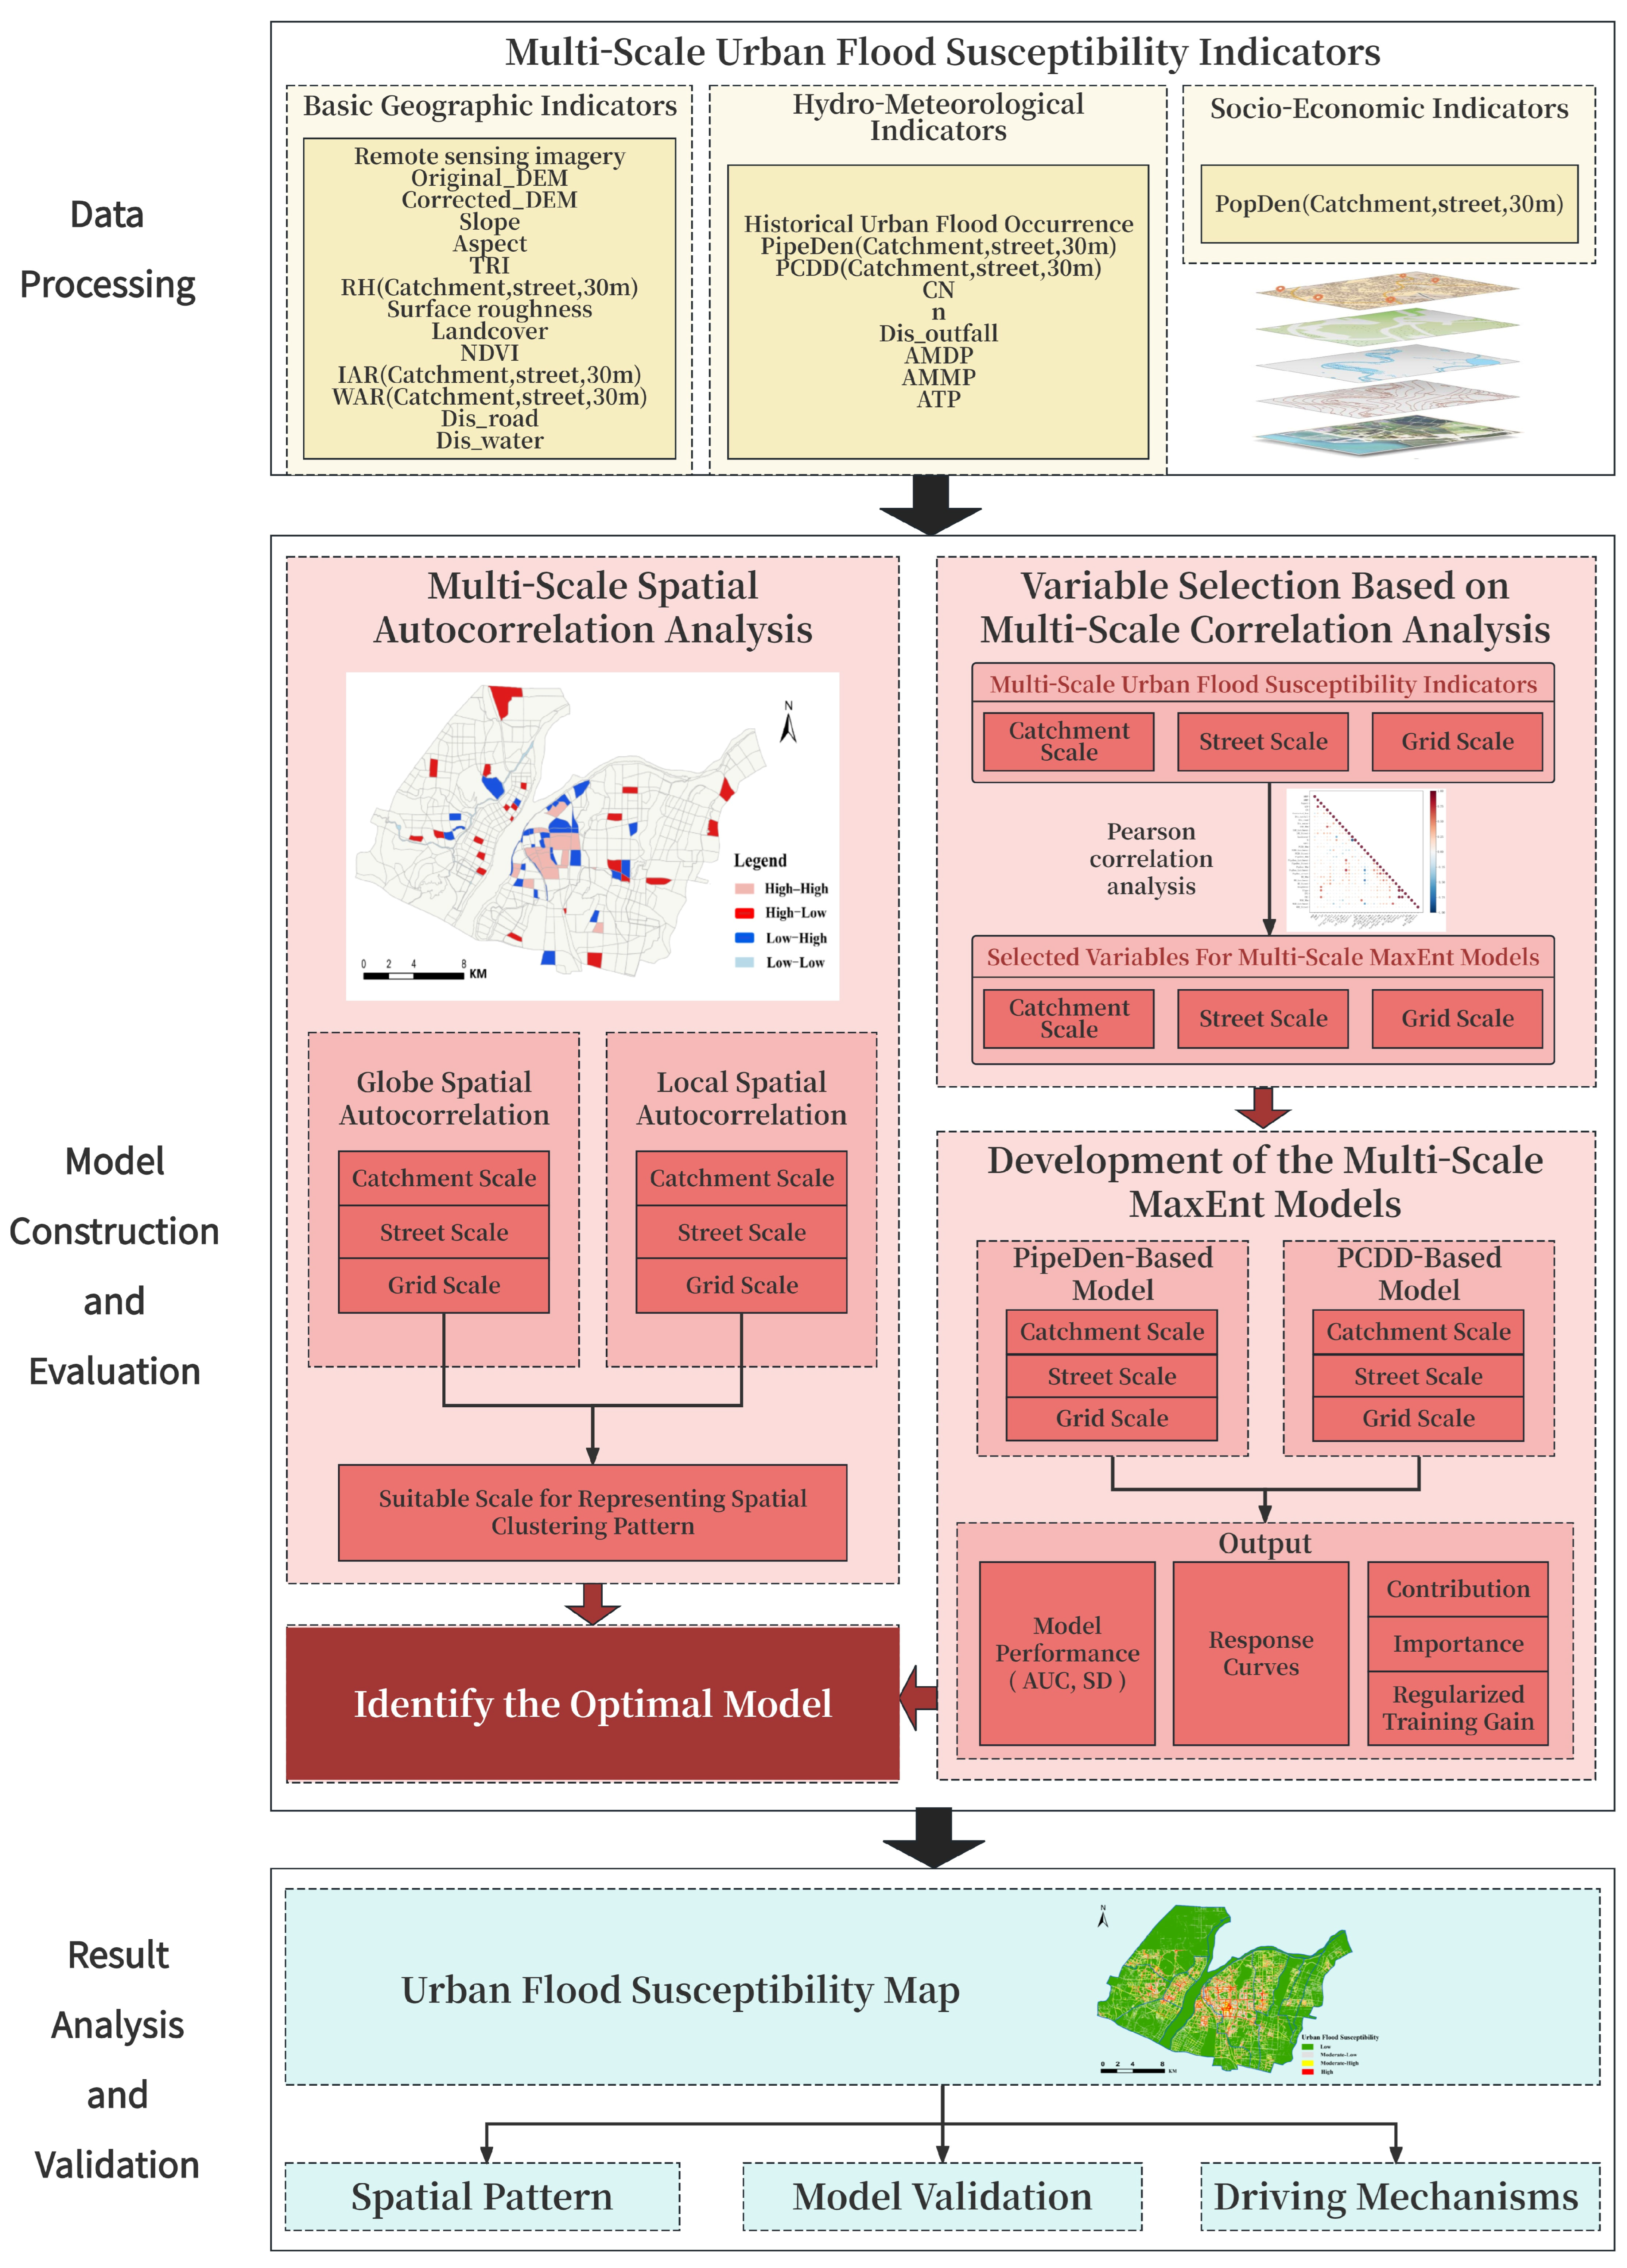
This study develops a multi-scale urban flood susceptibility mapping framework based on the MaxEnt model. The framework integrates multi-source high-resolution geospatial datasets to represent urban surface conditions, drainage capacity, and flood-prone spatial patterns. A three-tier spatial unit system (catchment, street, and grid) is constructed to support multi-scale analysis of flood susceptibility. The methodology includes multi-scale spatial unit construction, indicator development, spatial autocorrelation analysis, variable selection, multi-scale MaxEnt modeling, model evaluation, susceptibility mapping, and model validation. The overall workflow is illustrated in
Figure 2.
3.1. Development of the Multi-Scale Geographical Unit System
3.1.1. Limitations of Single Spatial Analysis Units
Urban flooding is influenced by complex interactions between hydrological processes and urban spatial structure, and its spatial distribution typically exhibits spatial autocorrelation [
61], spatial heterogeneity [
62], and scale dependence. However, most urban flood susceptibility studies rely on a single spatial analysis unit, typically regular grid cells, which leads to several methodological limitations.
First, single spatial units may inadequately represent spatial autocorrelation because grid cells are often treated as independent units without explicitly accounting for spatial interactions among neighboring areas, even though flood occurrences commonly cluster along roads and low-lying zones. Second, single spatial units may fail to capture spatial heterogeneity, as flood-related factors such as land use, drainage infrastructure, and surface characteristics can vary significantly within a single grid cell, leading to overgeneralized susceptibility estimates. Third, urban flood susceptibility exhibits scale dependence, and dominant driving factors may vary across spatial scales. In addition, regular grid units may disrupt hydrological connectivity by arbitrarily partitioning terrain-controlled flow paths and drainage networks. The above limitations indicate that single spatial analysis units are insufficient to represent the spatial characteristics of urban flood susceptibility, highlighting the need for a multi-scale spatial unit framework.
3.1.2. Delineation of Multi-Scale Spatial Units
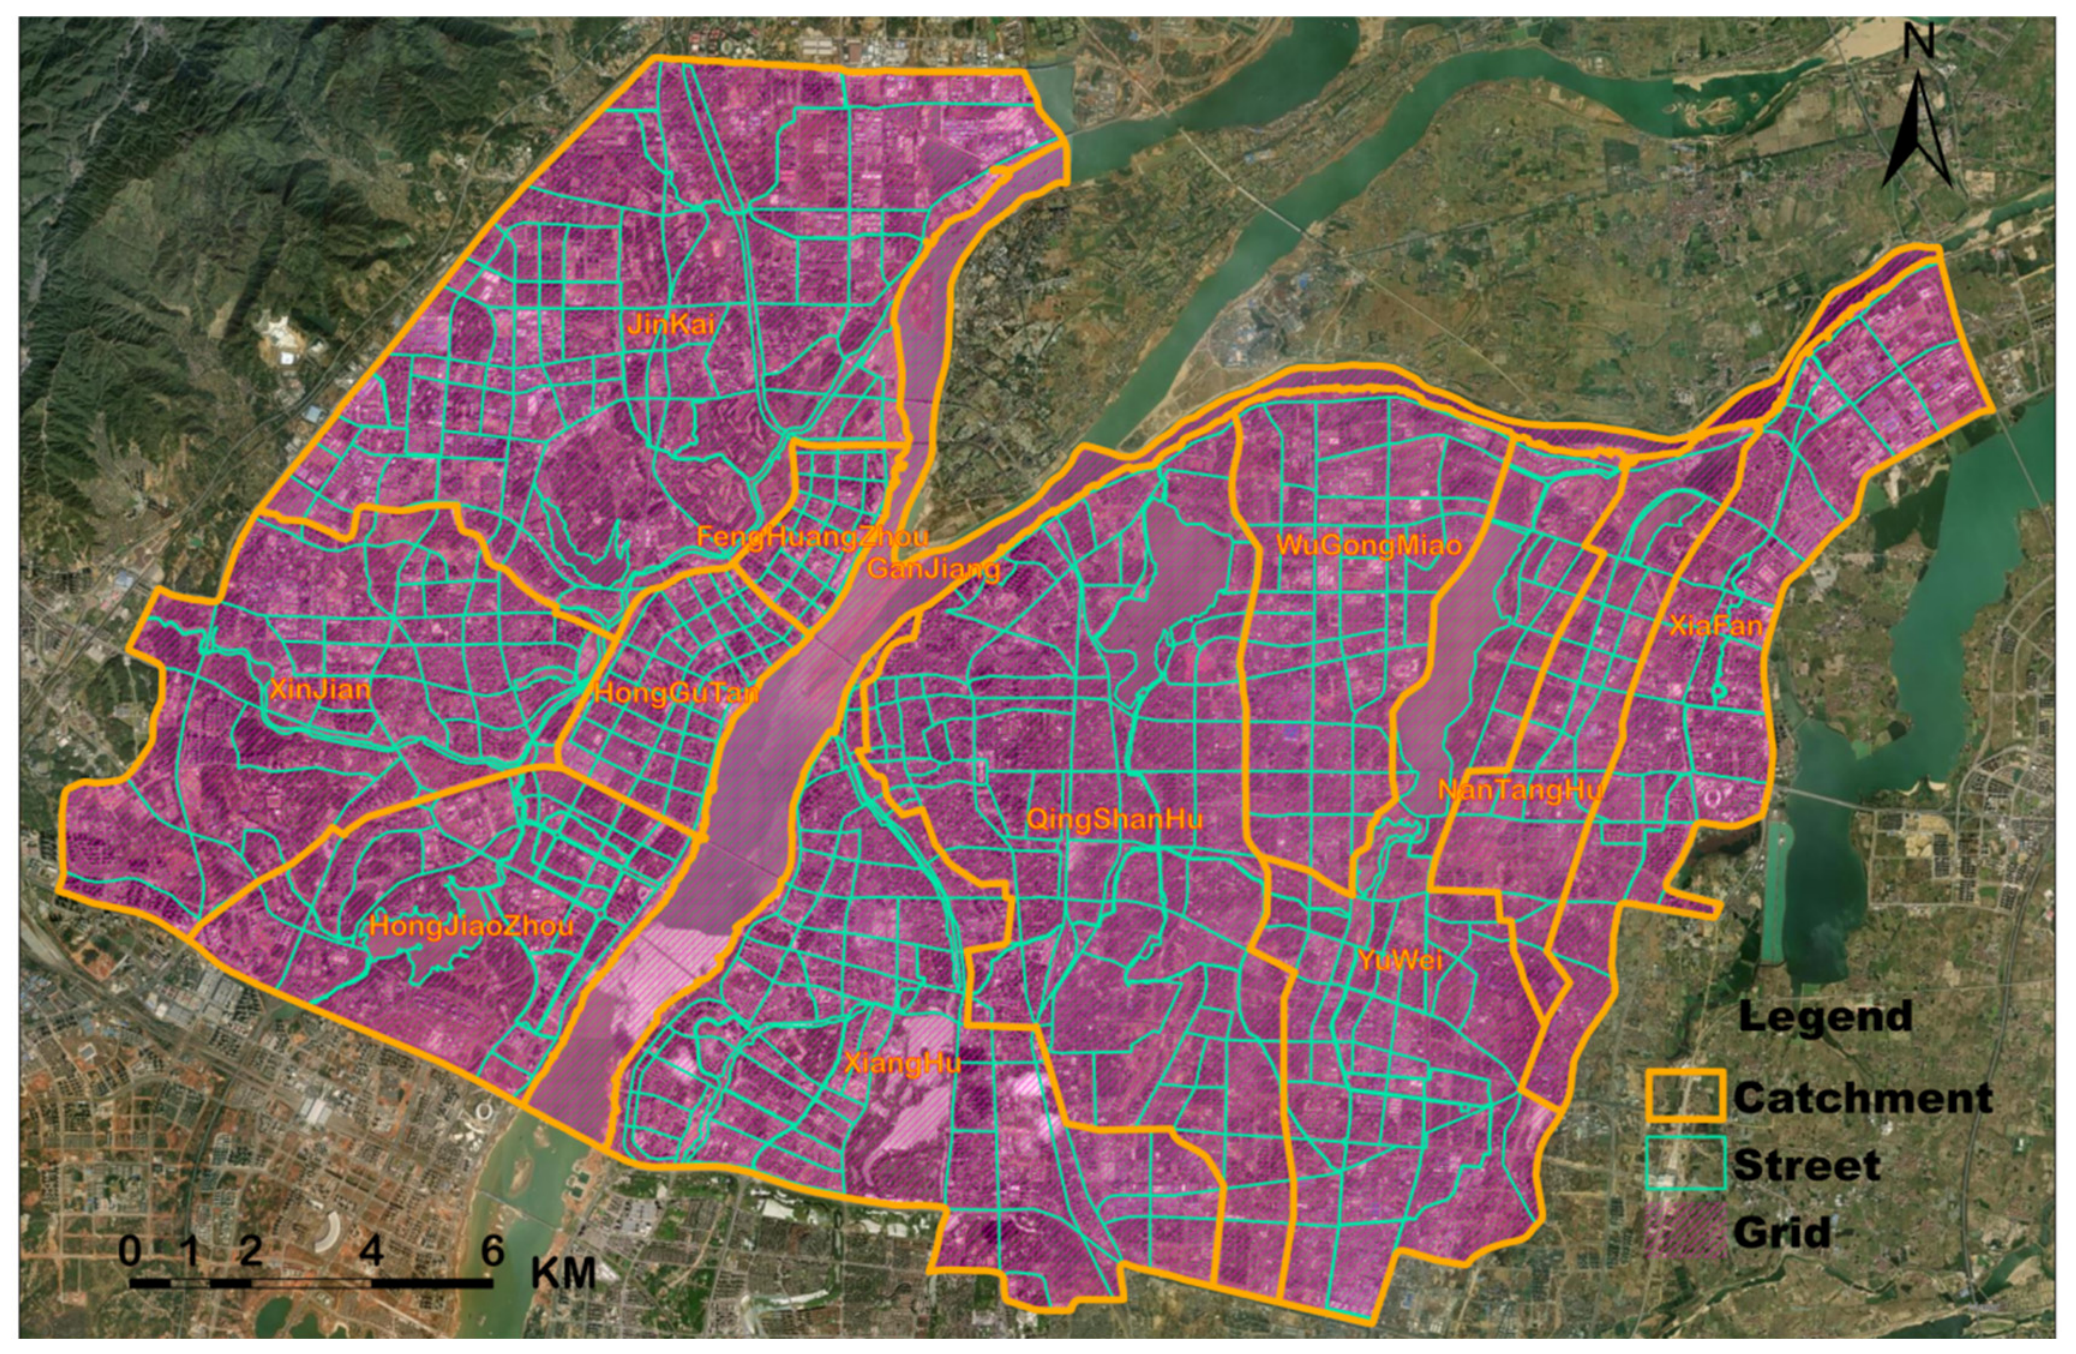
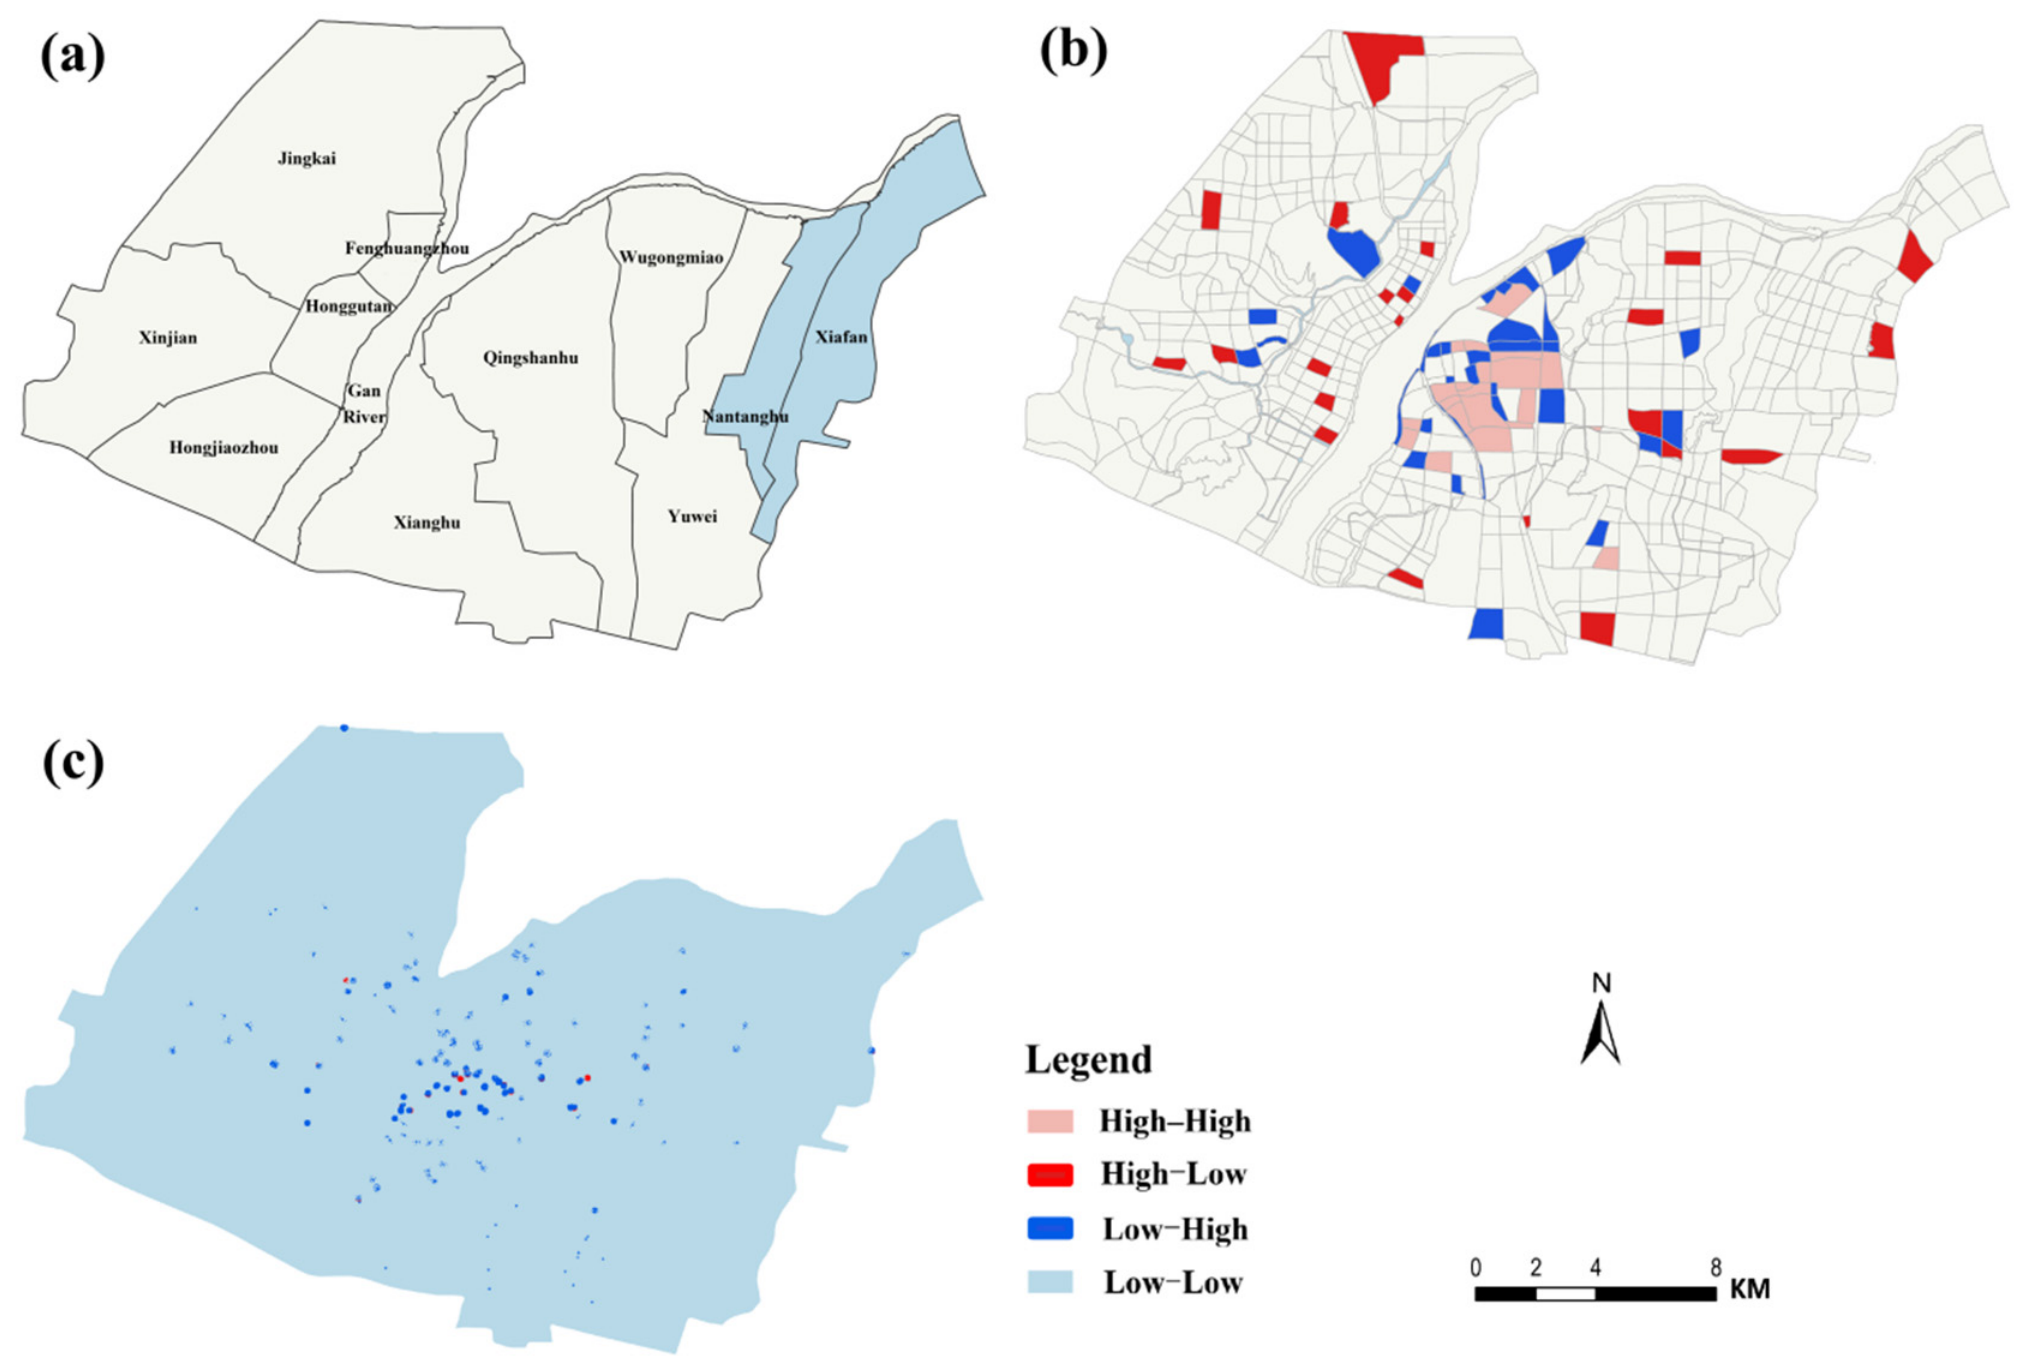
To overcome the limitations of single spatial analysis units, this study integrates geographic spatial principles and urban spatial structure to develop a three-tier geographical unit system, comprising catchment scale, street scale, and grid scale spatial units (
Figure 3). This unit system is designed to represent flood-related spatial characteristics at different spatial levels and to support scale-aware urban flood susceptibility modeling. The three spatial scales were primarily used as statistical spatial units for calculating neighborhood-scale aggregated indicators, rather than directly representing the final spatial resolution of the flood susceptibility maps.
At the catchment scale, the central urban area of Nanchang was divided into 12 catchment units (
Table 2) based on the official flood control planning scheme and topography-derived runoff characteristics. These units correspond to the city’s drainage management districts and represent the macro-level spatial organization and overall drainage conditions of the study area.
At the street scale, a total of 589 spatial units were delineated based on the 1:2000 land use map and major urban infrastructure boundaries. Natural and artificial water bodies were used as primary boundaries, followed by major road networks as secondary partition lines. This scale represents mesoscale urban drainage conditions and surface runoff pathways and reflects the spatial organization of urban built-up areas derived from high-resolution land use and remote sensing data.
At the grid scale, a regular grid system with a spatial resolution of 30 m × 30 m was established across the entire study area, comprising 419,288 grid cells. Surface characteristics within each grid cell were derived from high-resolution Earth observation datasets, including the digital elevation model, remote sensing imagery, and land use data, enabling fine-scale urban flood susceptibility mapping and spatial analysis.
3.2. Development of the per Capita Drainage Density (PCDD) Indicator Framework
3.2.1. Conceptual Development of PCDD
Drainage pipeline density (PipeDen), defined as the total length of drainage pipelines per unit area, is widely used as a proxy for urban drainage capacity in flood susceptibility studies. However, PipeDen primarily represents the spatial density of drainage infrastructure and does not account for drainage demand associated with population concentration, urban development intensity, and anthropogenic activities. In urban flood susceptibility analysis, highly populated areas are often associated with intensive urban construction, extensive impervious surfaces, and increased pressure on drainage systems. In highly urbanized areas, drainage capacity needs to serve concentrated populations and extensive impervious surfaces, meaning that urban flood susceptibility is influenced not only by drainage infrastructure supply but also by drainage demand under highly urbanized conditions.
To better represent the above relationship, this study proposes a per capita drainage density (PCDD) indicator, which evaluates drainage infrastructure provision relative to population-based drainage demand. By integrating drainage pipeline density with population distribution derived from geospatial datasets, PCDD reflects drainage capacity in relation to potential service demand rather than land area alone, providing a more suitable indicator for urban flood susceptibility modeling and multi-scale analysis.
For indicator formulation, statistical units are categorized into typical urban units and special units. Special units include water-dominated units (water area ratio > 90%) and uninhabited units with zero population density, which generally exhibit high natural flood buffering capacity or negligible exposure and are, therefore, assigned high PCDD values within a unified piecewise formulation. Based on the above classification, PCDD is defined using a unified piecewise formulation as follows:
where
represents the per capita drainage density of statistical unit
(km/person),
denotes the drainage density (km/km
2), and
denotes the population density (persons/km
2).
is the maximum value among typical urban units. Special units are assigned a value of
to reflect their higher natural flood buffering capacity. The multiplier was empirically selected to ensure clear separation from engineered drainage capacities without affecting the relative ranking of urban units.
Within this framework, PCDD provides a comparable measure of drainage-related flood mitigation capacity across heterogeneous urban environments and multiple spatial scales. Compared with PipeDen, PCDD (1) incorporates drainage demand through population normalization, (2) enables unified representation of engineered drainage systems and natural flood-regulating units, and (3) can be consistently applied across multiple spatial scales.
3.2.2. Multi-Scale Calculation of PCDD
The multi-scale calculation of PCDD consists of three steps. First, PipeDen was calculated as follows:
where
represents the drainage pipeline density (km/km
2) of statistical unit
i,
denotes the total pipeline length (km) within the unit, and
is the unit area (km
2).
Second, PopDen was calculated as follows:
where
represents the population density (persons/km
2) of statistical unit
i, and
denotes the total population count within that unit. Population data derived from a 100 m resolution raster dataset were aggregated to each statistical unit using zonal statistics to represent spatial variations in urban drainage demand and urbanization intensity across scales.
Finally, PCDD was calculated from PipeDen and PopDen (Equation (1)) at the catchment, street, and grid scales, enabling consistent assessment of drainage capacity relative to population demand across spatial scales.
3.3. Derivation of Multi-Scale Flood Susceptibility Indicators from Multi-Source Geospatial Data
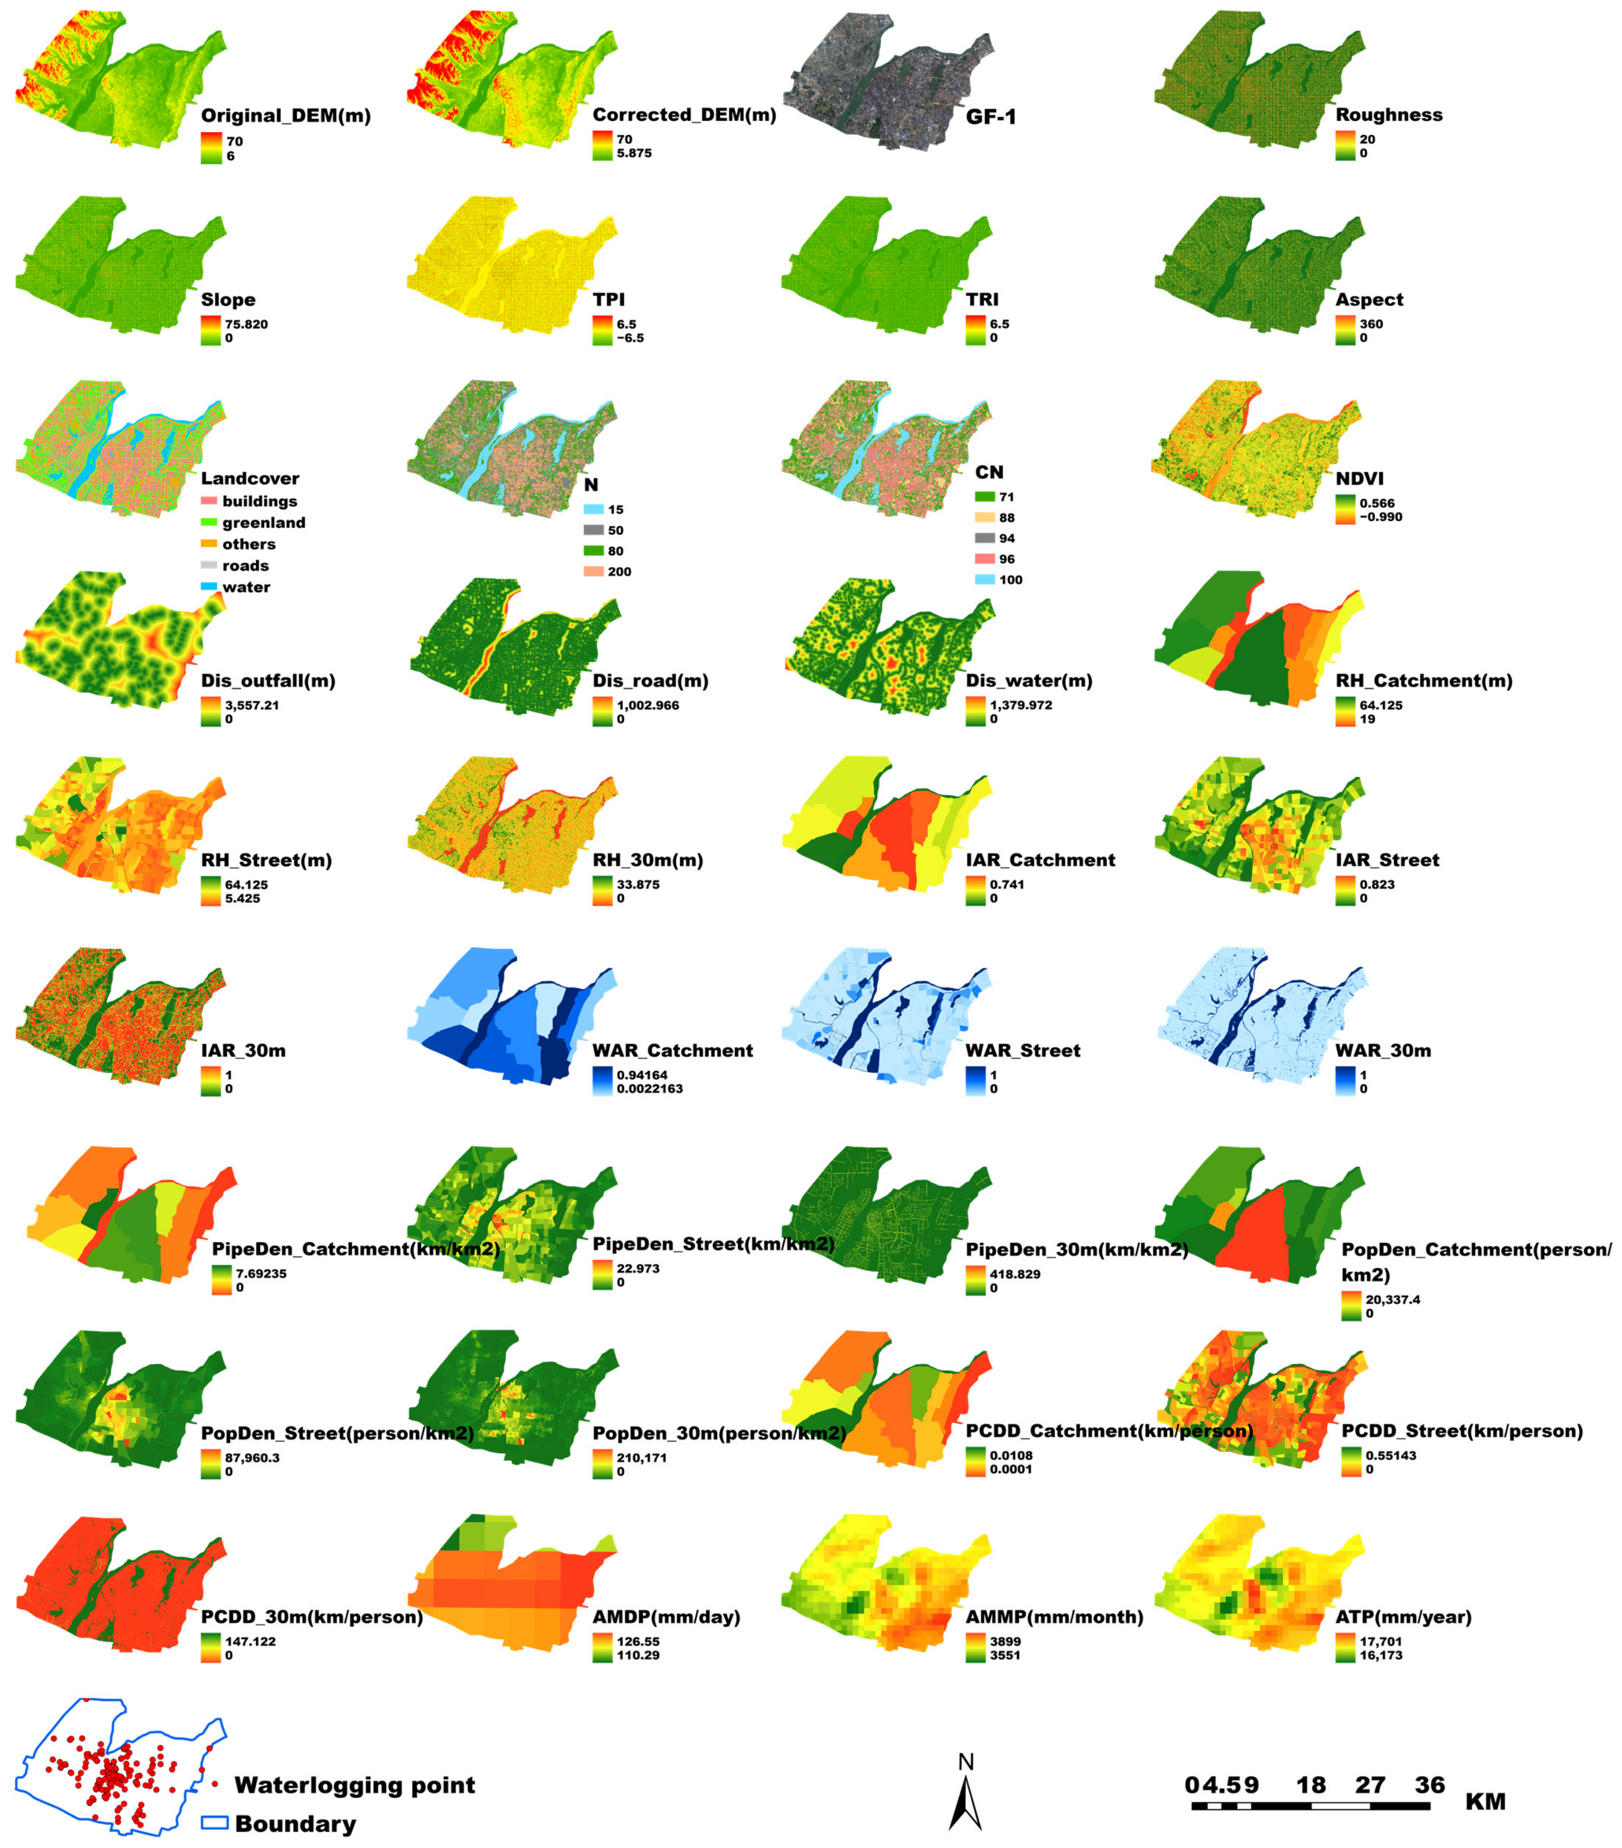
Multi-source high-resolution geospatial datasets, including Earth observation (EO) data, were integrated to derive multi-scale indicators for urban flood susceptibility mapping (
Figure 4).
GF-1 multispectral imagery with a spatial resolution of 2 m, provided by the Jiangxi Data and Application Center of the High-Resolution Earth Observation System, was used for surface information extraction and vegetation index calculation. The normalized difference vegetation index (NDVI) was calculated using the near-infrared and red bands according to Equation (4), as follows:
A 2 m resolution original digital elevation model (Original_DEM), provided by the Jiangxi Provincial Department of Natural Resources, was used to represent the terrain surface of the study area. To better represent urban micro-topography and surface flow conditions, a corrected digital elevation model (Corrected_DEM) was generated by modifying the original DEM according to urban surface characteristics. Building areas were elevated by 0.3 m to represent flow obstruction effects, while road surfaces were lowered by 0.15 m to represent preferential surface runoff pathways. These correction values were adopted based on previous high-resolution urban flood modeling studies [
63], which referenced the methodology proposed by the UK Environment Agency (EA) for representing urban surface flow characteristics in DEM correction. Based on the Corrected_DEM, terrain-related indicators were derived, including slope, aspect, terrain ruggedness index (TRI), topographic position index (TPI), and roughness. In addition, multi-scale relative height (RH) was calculated as the elevation range within each spatial unit at the catchment, street, and grid scales to represent terrain variation at different spatial levels.
Surface and urban spatial structure indicators were derived from land use data obtained from the Jiangxi Provincial Department of Natural Resources, including land cover types (Landcover), distance to roads (Dis_road), distance to water bodies (Dis_water), impervious area ratio (IAR), and water area ratio (WAR). IAR and WAR were calculated at multiple spatial scales to represent urban surface runoff and water storage conditions.
Flood-related infrastructure and hydrological conditions were characterized using drainage network data, land cover information, and flood occurrence records. A total of 142 historical flood locations from 2020 were used as presence samples. The flood locations were obtained from the Jiangxi Provincial Hydrological Monitoring Center and the Nanchang Municipal Urban Management Bureau. The datasets were cross-checked to remove duplicate and overlapping records through manual verification and spatial consistency checking. PipeDen and PCDD were calculated at the catchment, street, and grid scales based on the urban drainage pipeline network vector dataset provided by the Nanchang Municipal Urban Management Bureau according to Equations (1)–(3). Additional hydrological indicators included curve number (CN) and Manning’s roughness coefficient (N), derived based on land cover types to represent runoff potential and surface flow resistance. Distance to drainage outfalls (Dis_outfall) was calculated based on the drainage outfall vector dataset provided by the Nanchang Municipal Urban Management Bureau using Euclidean distance analysis.
Precipitation conditions were represented by annual maximum daily precipitation (AMDP), annual maximum monthly precipitation (AMMP), and annual total precipitation (ATP). AMDP was derived from the 4 km daily gridded meteorological dataset for China (2000–2020) [
64], while AMMP and ATP were calculated from the 1 km monthly precipitation dataset for China (1901–2024) [
65]. Both datasets were provided by the National Tibetan Plateau/Third Pole Environment Data Center.
Population density (PopDen) was derived from a 100 m resolution gridded population dataset for the Poyang Lake Basin (2000–2020) provided by the National Earth System Science Data Center of China [
66]. The dataset was aggregated to each spatial unit to represent spatial variations in urban drainage demand and urbanization intensity across scales. PopDen was calculated at the catchment, street, and grid scales.
All datasets were preprocessed through spatial reference unification and spatial resolution harmonization to ensure consistency across indicators and spatial scales. Several indicators, including RH, IAR, WAR, PipeDen, PopDen, and PCDD, were first calculated within different statistical spatial units (30 m grids, street units, and catchment units) to represent neighborhood-scale spatial characteristics. Subsequently, all final indicator layers used for MaxEnt modeling were rasterized and standardized to a 2 m spatial resolution consistent with the original high-resolution DEM and EO-derived datasets. The integrated datasets represent key components influencing urban flood susceptibility, including terrain conditions, surface characteristics, drainage infrastructure, hydrological forcing, and human exposure. These variables collectively form a multi-source geospatial indicator system for multi-scale urban flood susceptibility analysis.
3.4. Analysis of Multi-Scale Spatial Autocorrelation
To examine the spatial clustering patterns of historical urban flood occurrences, multi-scale spatial autocorrelation analysis was conducted at the catchment, street, and grid scales. Both global and local spatial autocorrelation were analyzed to evaluate overall spatial clustering and identify local clusters and spatial outliers.
Global Moran’s I was used to evaluate the overall spatial autocorrelation of urban flood occurrences at different spatial scales. The statistic ranges from −1 to 1 and is calculated as follows [
60]:
where
is the number of spatial units;
and
xj are the observed values at spatial units
i and
, respectively;
is the mean of all observations;
wij is the space weight between units
and
and
is the sum of all spatial weights. Global Moran’s I was calculated at the catchment, street, and grid scales using ArcGIS Pro 3.1.5.
Local spatial autocorrelation was analyzed using Anselin Local Moran’s I to identify spatial clusters and outliers. The statistic is calculated as follows:
where
is the Local Moran Index for spatial unit
;
is the variance of the observed values; and the remaining symbols are consistent with those defined for Global Moran’s Index. Based on the sign and magnitude of
and the deviation of
from
, four spatial association types were identified: High–High, Low–Low, High–Low, and Low–High. Local Moran’s I was computed at the catchment, street, and grid scales to compare localized clustering patterns across spatial scales.
3.5. Variable Selection Based on Multi-Scale Correlation Analysis
Prior to urban flood susceptibility modeling, correlation analysis among environmental variables was conducted to reduce multicollinearity and improve model robustness. Environmental variables derived from heterogeneous data sources may exhibit strong intercorrelations, which can lead to unstable parameter estimation and biased model performance. Therefore, correlation evaluation was applied as a preprocessing step for model input optimization.
To evaluate the effectiveness of the proposed PCDD indicator, two models were constructed at each spatial scale (catchment, street, and grid). One model used PipeDen to represent drainage capacity (hereafter referred to as the PipeDen-based model), while the other used PCDD (hereafter referred to as the PCDD-based model). The two models share the same modeling framework and input variables, differing only in the drainage capacity indicator. For each model and spatial scale, correlation analysis was independently performed on the corresponding environmental variables to ensure consistency of model inputs.
Pearson correlation analysis was used to quantify linear relationships between variables. The Pearson correlation coefficient ranges from −1 to 1, where values close to ±1 indicate strong correlation and values near 0 indicate weak association [
67]. Variable pairs with |r| > 0.7 were considered highly correlated. For each correlated pair, one variable was removed based on explanatory relevance and data quality. The analysis was repeated until all remaining variables satisfied |r| ≤ 0.7. The final set of selected variables was used as input for the multi-scale MaxEnt modeling.
3.6. Development of the Multi-Scale Maximum Entropy Models
Based on the selected environmental variables, the Maximum Entropy (MaxEnt) model was used to construct the multi-scale urban flood susceptibility models under the previously defined comparative modeling framework. MaxEnt estimates occurrence probability by maximizing entropy subject to environmental constraints derived from presence-only data, making it suitable for urban flood susceptibility modeling where absence data are unavailable [
52].
Given input environmental variables
and possible outputs
, the MaxEnt model estimates a conditional probability distribution
in the following form:
where
is a normalization factor;
denotes feature functions; and
represents the corresponding feature weights.
Model implementation was conducted using MaxEnt version 3.4.1 [
68]. For each model and spatial scale, flood occurrence data and environmental variables were imported. The dataset was randomly divided into 75% training data and 25% testing data. Each model was run ten times, and the average result was used as the final prediction. The maximum number of iterations was set to 1000, and the Jackknife test was enabled to evaluate variable importance. Model parameters were optimized using the R package ENMeval, and the optimal feature classes and regularization multipliers are listed in
Table 3.
3.7. Model Evaluation, Validation, and Urban Flood Susceptibility Mapping
After the MaxEnt models were constructed for each spatial scale and indicator scenario, multiple model outputs were generated for performance evaluation and interpretation, including urban flood susceptibility maps, receiver operating characteristic (ROC) curves, area under the ROC curve (AUC), standard deviations (SDs), response curves, and variable importance metrics (Jackknife test, percent contribution, and permutation importance).
A total of six MaxEnt models were constructed under different combinations of spatial scales and drainage capacity indicators (PipeDen and PCDD). Model performance was comprehensively evaluated based on model accuracy (AUC), model stability (SD), multi-scale spatial autocorrelation results, and the response patterns of PipeDen and PCDD. The model with the best overall performance was selected as the optimal model for urban flood susceptibility mapping and subsequent spatial analysis.
Urban flood susceptibility was estimated using the optimal MaxEnt model, which generates a logistic output representing the relative likelihood of flood occurrence for each grid cell. In this study, these values were interpreted as a flood susceptibility index. ArcGIS Pro was used to generate the urban flood susceptibility map. Susceptibility values were classified into four levels: low (<0.2), moderate–low (0.2–0.5), moderate–high (0.5–0.8), and high (>0.8). The spatial patterns of flood susceptibility were further analyzed at both the citywide and catchment scales based on the predefined drainage districts.
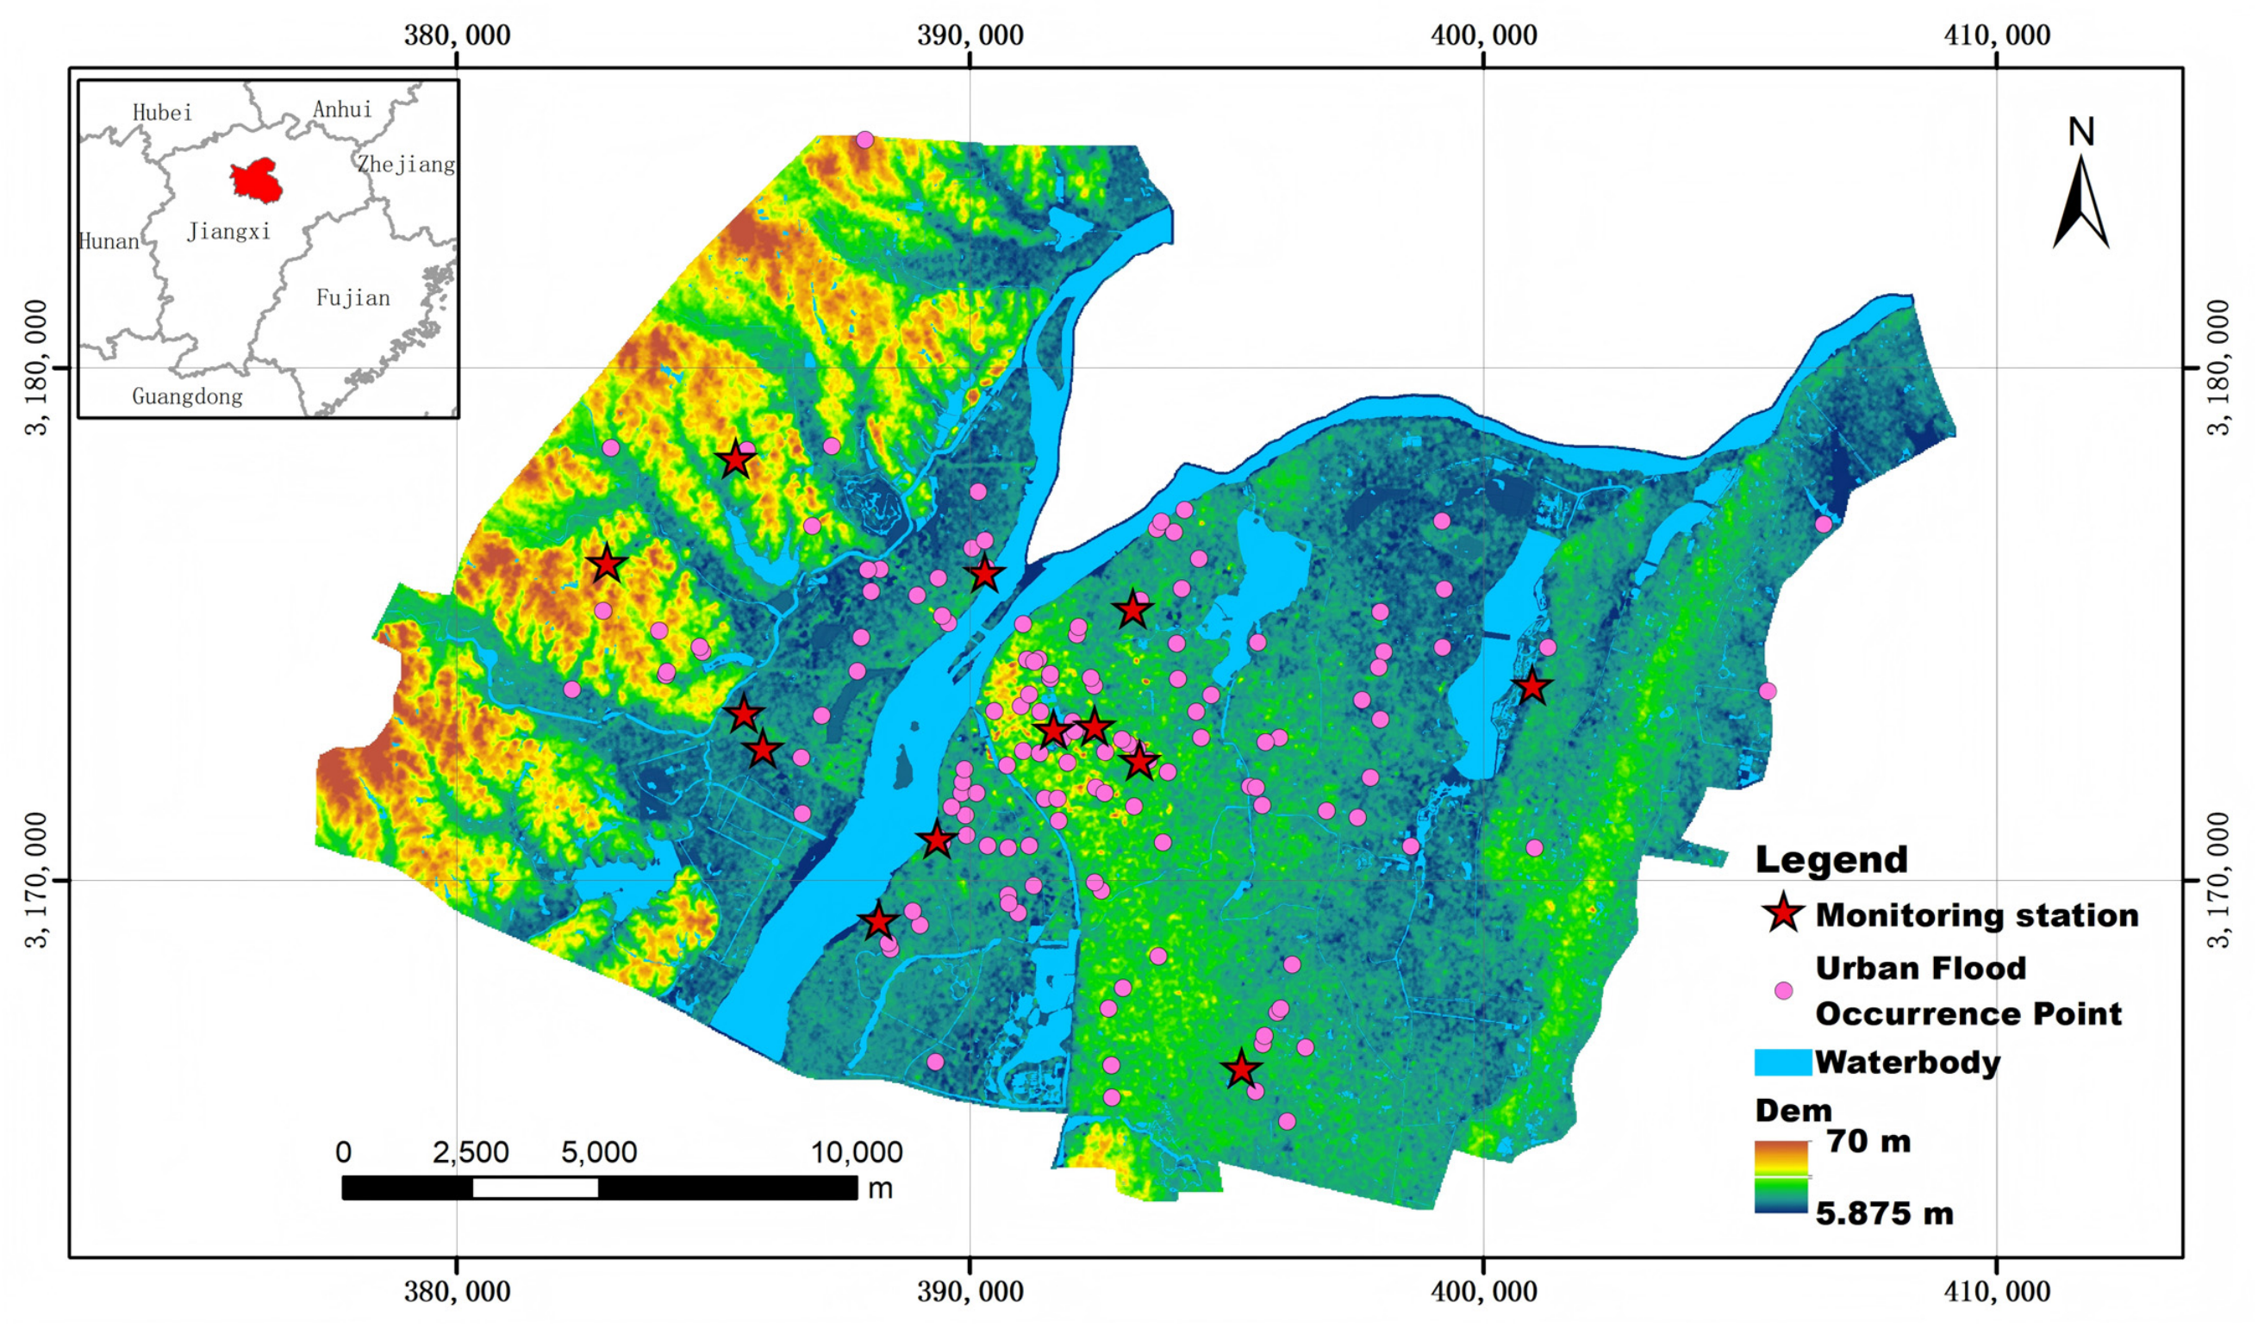
To further evaluate the reliability of the optimal flood susceptibility map, observed water-depth data from 13 urban flood monitoring stations provided by the Jiangxi Provincial Hydrological Monitoring Center were used for independent validation (shown in
Figure 1). The maximum observed water depth at each station in 2020 was compared with the corresponding flood susceptibility values derived from the optimal MaxEnt model through correlation analysis.
4. Results
4.1. Multi-Scale Spatial Autocorrelation
Global Moran’s I was calculated at the catchment, street, and grid scales to examine the spatial dependence of urban flood occurrences (
Table 4). The results show significant positive spatial autocorrelation at both the catchment and street scales, whereas no significant spatial autocorrelation was observed at the grid scale. Among the three scales, the street scale exhibited the strongest spatial clustering, as indicated by the highest Moran’s I value, the largest Z-score, and the smallest
p-value. In contrast, the grid scale showed a random spatial distribution pattern.
Local spatial autocorrelation analysis further revealed the spatial clustering patterns of urban flood occurrences at different scales (
Figure 5 and
Table 5). At the catchment scale, only a small number of analytical units showed statistically significant spatial autocorrelation, and no High–High clusters were identified, indicating weak local clustering at this scale. At the street scale, a considerable number of significant spatial units were detected, including High–High clusters, Low–Low clusters, and spatial outliers. High–High clusters were mainly concentrated in the central old urban area, indicating areas with high flood occurrence density surrounded by similar high-density areas. Low–High and High–Low outliers were mainly distributed around cluster boundaries and in outer urban areas. At the grid scale, significant spatial units were primarily identified as spatial outliers rather than clustered patterns, indicating a more dispersed spatial pattern at the grid scale. Overall, local spatial autocorrelation patterns varied significantly across spatial scales, with the street scale showing the most pronounced clustering characteristics.
4.2. Multi-Scale Variable Selection
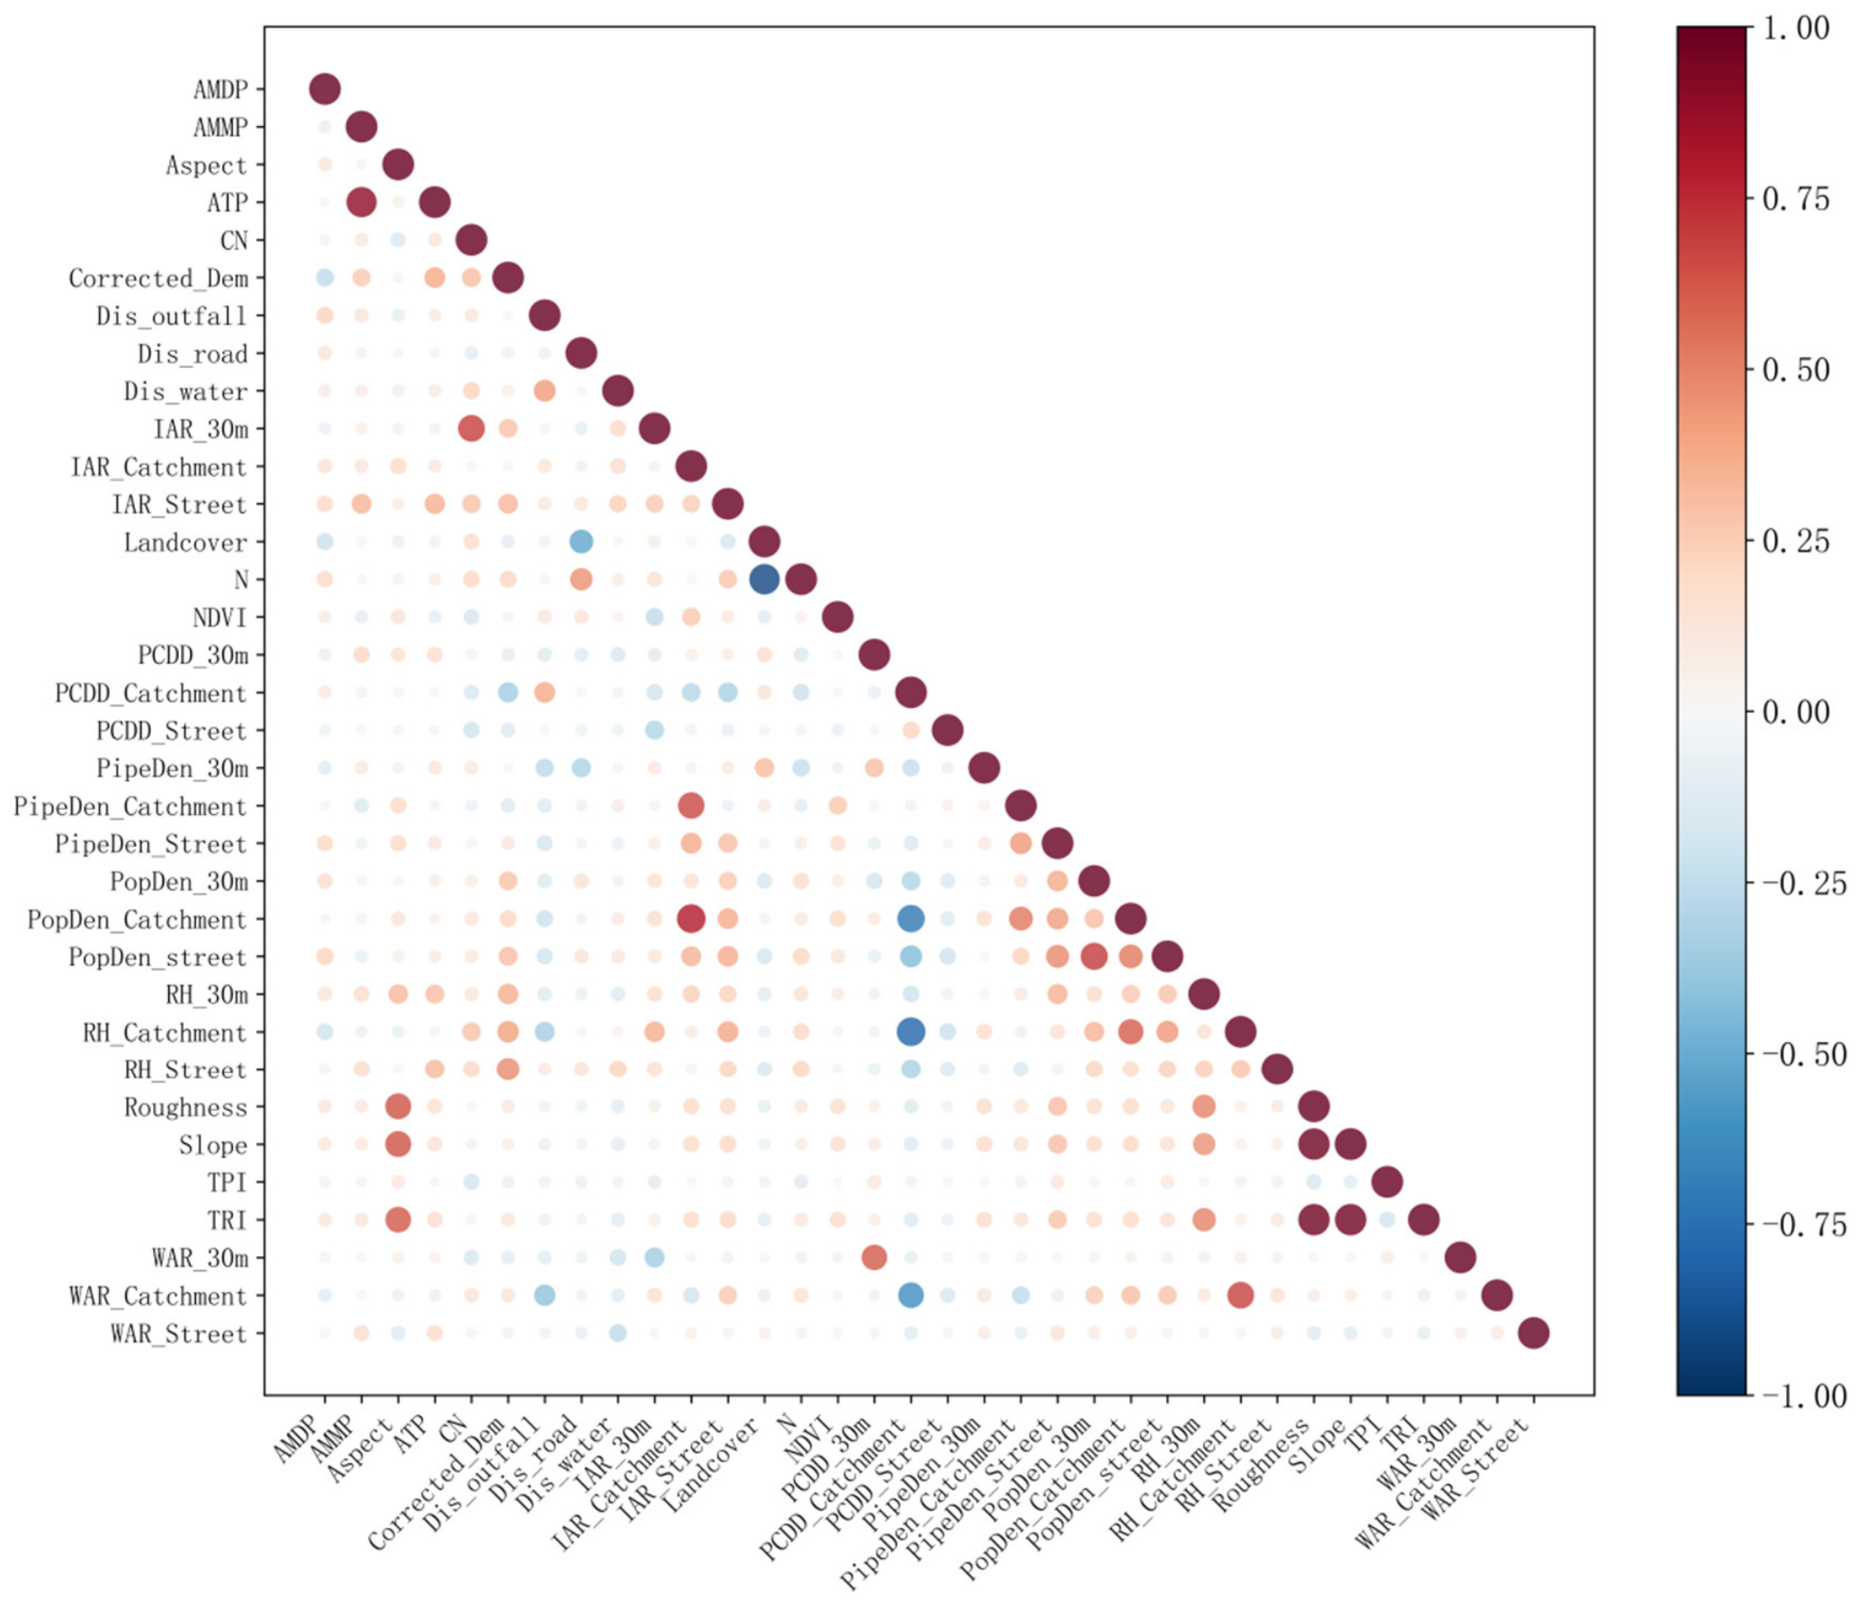
Pearson correlation coefficients were calculated for all environmental variables, and the results are shown in
Figure 6. Variables with strong pairwise correlations (|r| > 0.7) were excluded to reduce multicollinearity and redundancy in model inputs. Because the correlation structure among environmental variables differed across spatial scales and model types, the retained variables were not completely identical among the multi-scale MaxEnt models. The excluded variables for each spatial scale and model type are listed in
Table 6.
The correlation analysis results were generally consistent across spatial scales, with roughness, TRI, N, and ATP showing high correlations with other environmental variables and, therefore, being excluded in all models. However, some variable-selection results differed among spatial scales and model types due to differences in local correlation structures. For example, in the catchment scale PipeDen-based model, PopDen_Catchment showed a strong correlation with IAR_Catchment (|r| = 0.80) and was therefore excluded. In contrast, no similarly strong correlation was observed at the street or grid scales, so the corresponding population-density variables were retained in those models. Similarly, in the catchment scale PCDD-based model, RH_Catchment was excluded because of its strong correlation with PCDD_Catchment (|r| = 0.80), whereas no equivalent high-correlation relationship occurred at the street or grid scales.
Therefore, slight differences existed in the retained variables among the multi-scale MaxEnt models. Specifically, the catchment scale PipeDen-based model retained 16 variables, whereas the street scale and grid scale PipeDen-based models each retained 17 variables. Similarly, the catchment scale PCDD-based model retained 15 variables, whereas the street scale and grid scale PCDD-based models each retained 16 variables. After variable screening, a total of 29 environmental variables were retained for multi-scale MaxEnt modeling.
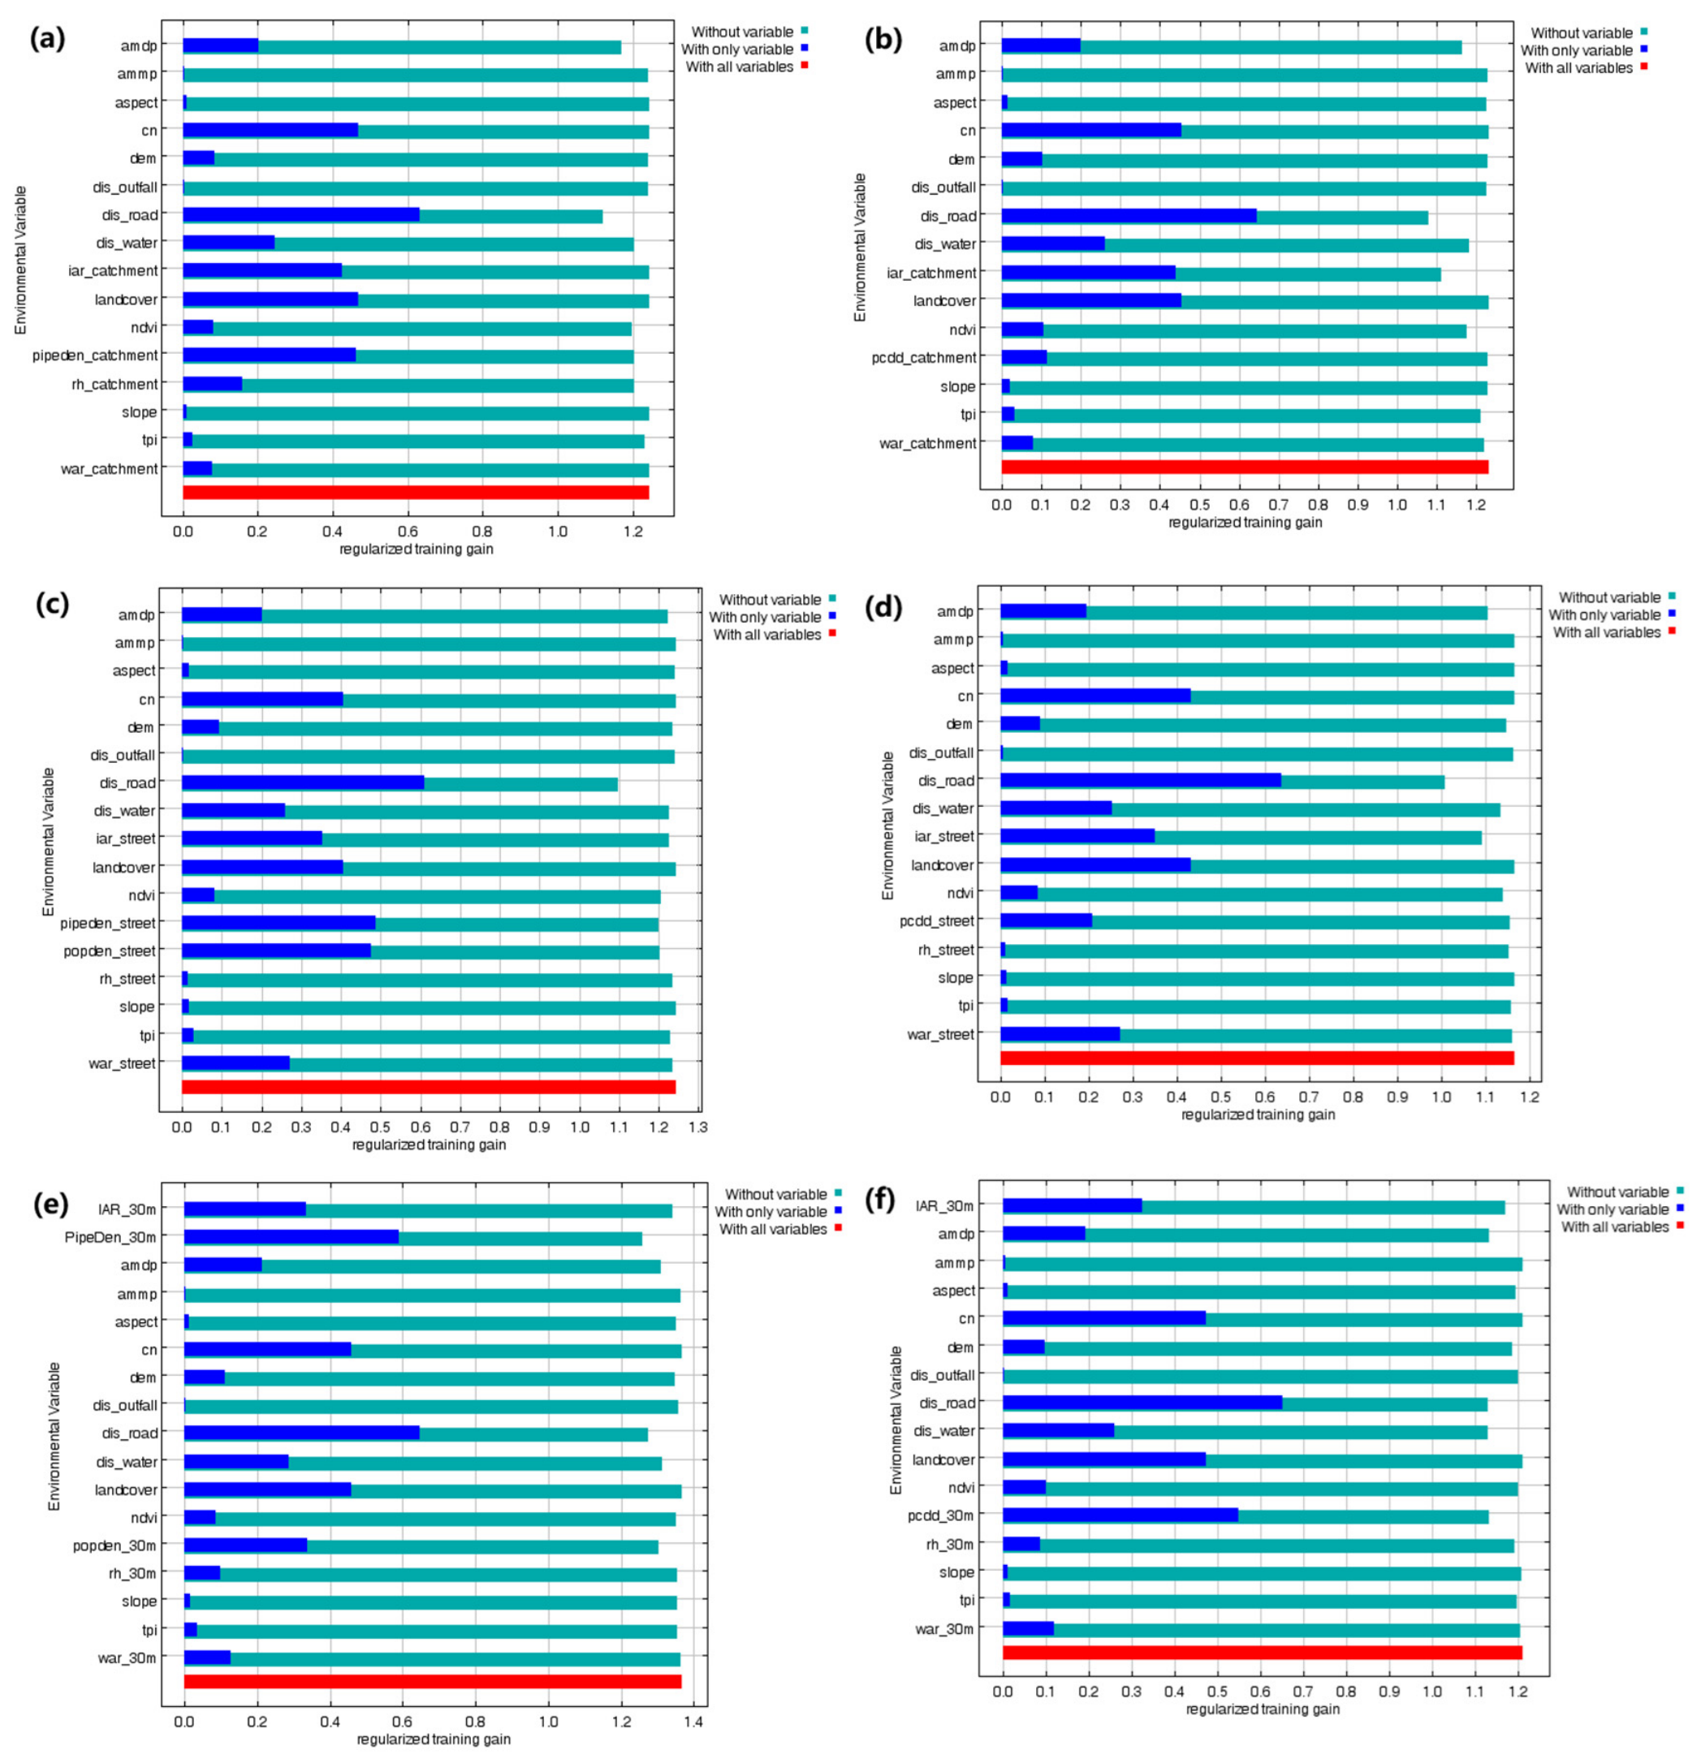
4.3. Contribution and Importance of Environmental Variables
This section presents the contribution and importance of environmental variables in the multi-scale MaxEnt models based on percentage contribution, permutation importance, and regularized training gain derived from Jackknife tests. PipeDen-based and PCDD-based models were constructed at each spatial scale, and the corresponding results are summarized in
Table 7,
Table 8 and
Table 9 and
Figure 7.
Distance to the nearest road (Dis_road) was the most influential variable in nearly all models, consistently ranking first in percentage contribution, permutation importance, and regularized training gain across most spatial scales and model types. Impervious area ratio (IAR) was the second most important predictor across spatial scales. In the PipeDen-based models, IAR ranked among the top contributors at all scales, while, in the PCDD-based models, its contribution further increased and consistently ranked second across scales.
Drainage-related variables showed clear differences between the PipeDen-based and PCDD-based models and across spatial scales. PipeDen ranked among the top contributors in the PipeDen-based models at all spatial scales. In contrast, PCDD showed relatively low importance at the catchment scale, moderate importance at the street scale, and higher importance at the grid scale, indicating increasing influence at finer spatial resolutions.
Distance to the nearest water body (Dis_water) and annual maximum daily precipitation (AMDP) exhibited moderate contributions and importance across most models and spatial scales. Water area ratio (WAR) showed relatively higher importance at the street scale, where it ranked among the top variables in both models, while its contribution and training gain were moderate at the catchment and grid scales.
Terrain-related variables, including DEM, slope, roughness, and relative height, as well as several precipitation indicators, showed relatively low contributions, permutation importance, and training gain across most models and spatial scales.
Overall, Dis_road, IAR, Dis_water, WAR, AMDP and drainage-related variables (PipeDen and PCDD) were identified as the dominant factors across the multi-scale MaxEnt models. The response relationships between these dominant factors and urban flood susceptibility are further analyzed in the following section.
4.4. Response Curves of the Dominant Factors
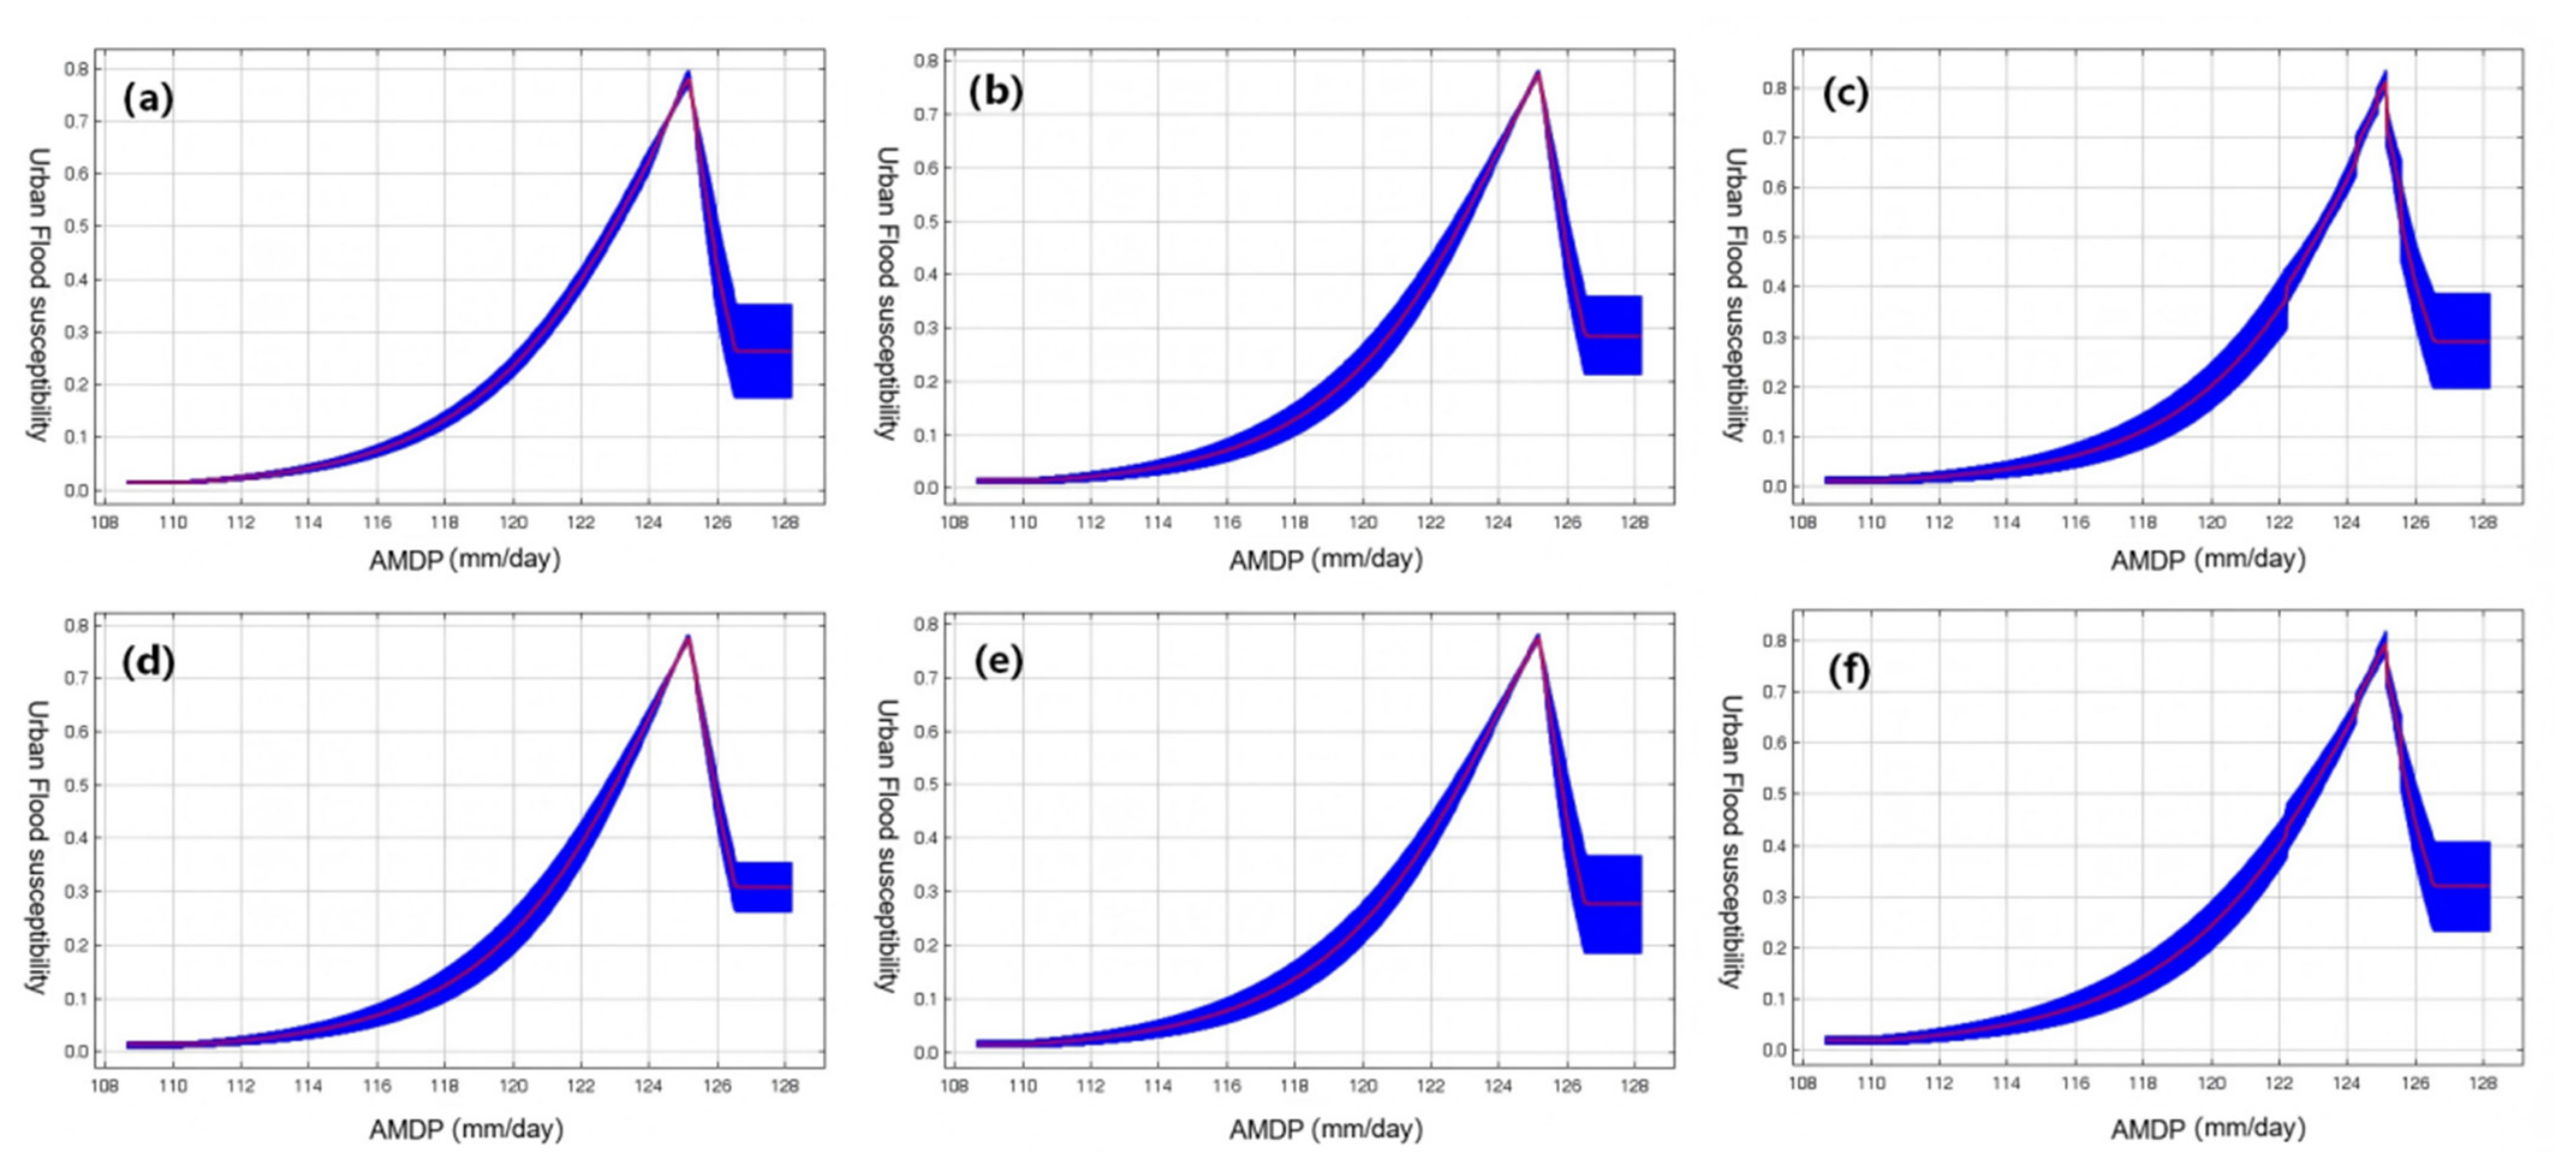
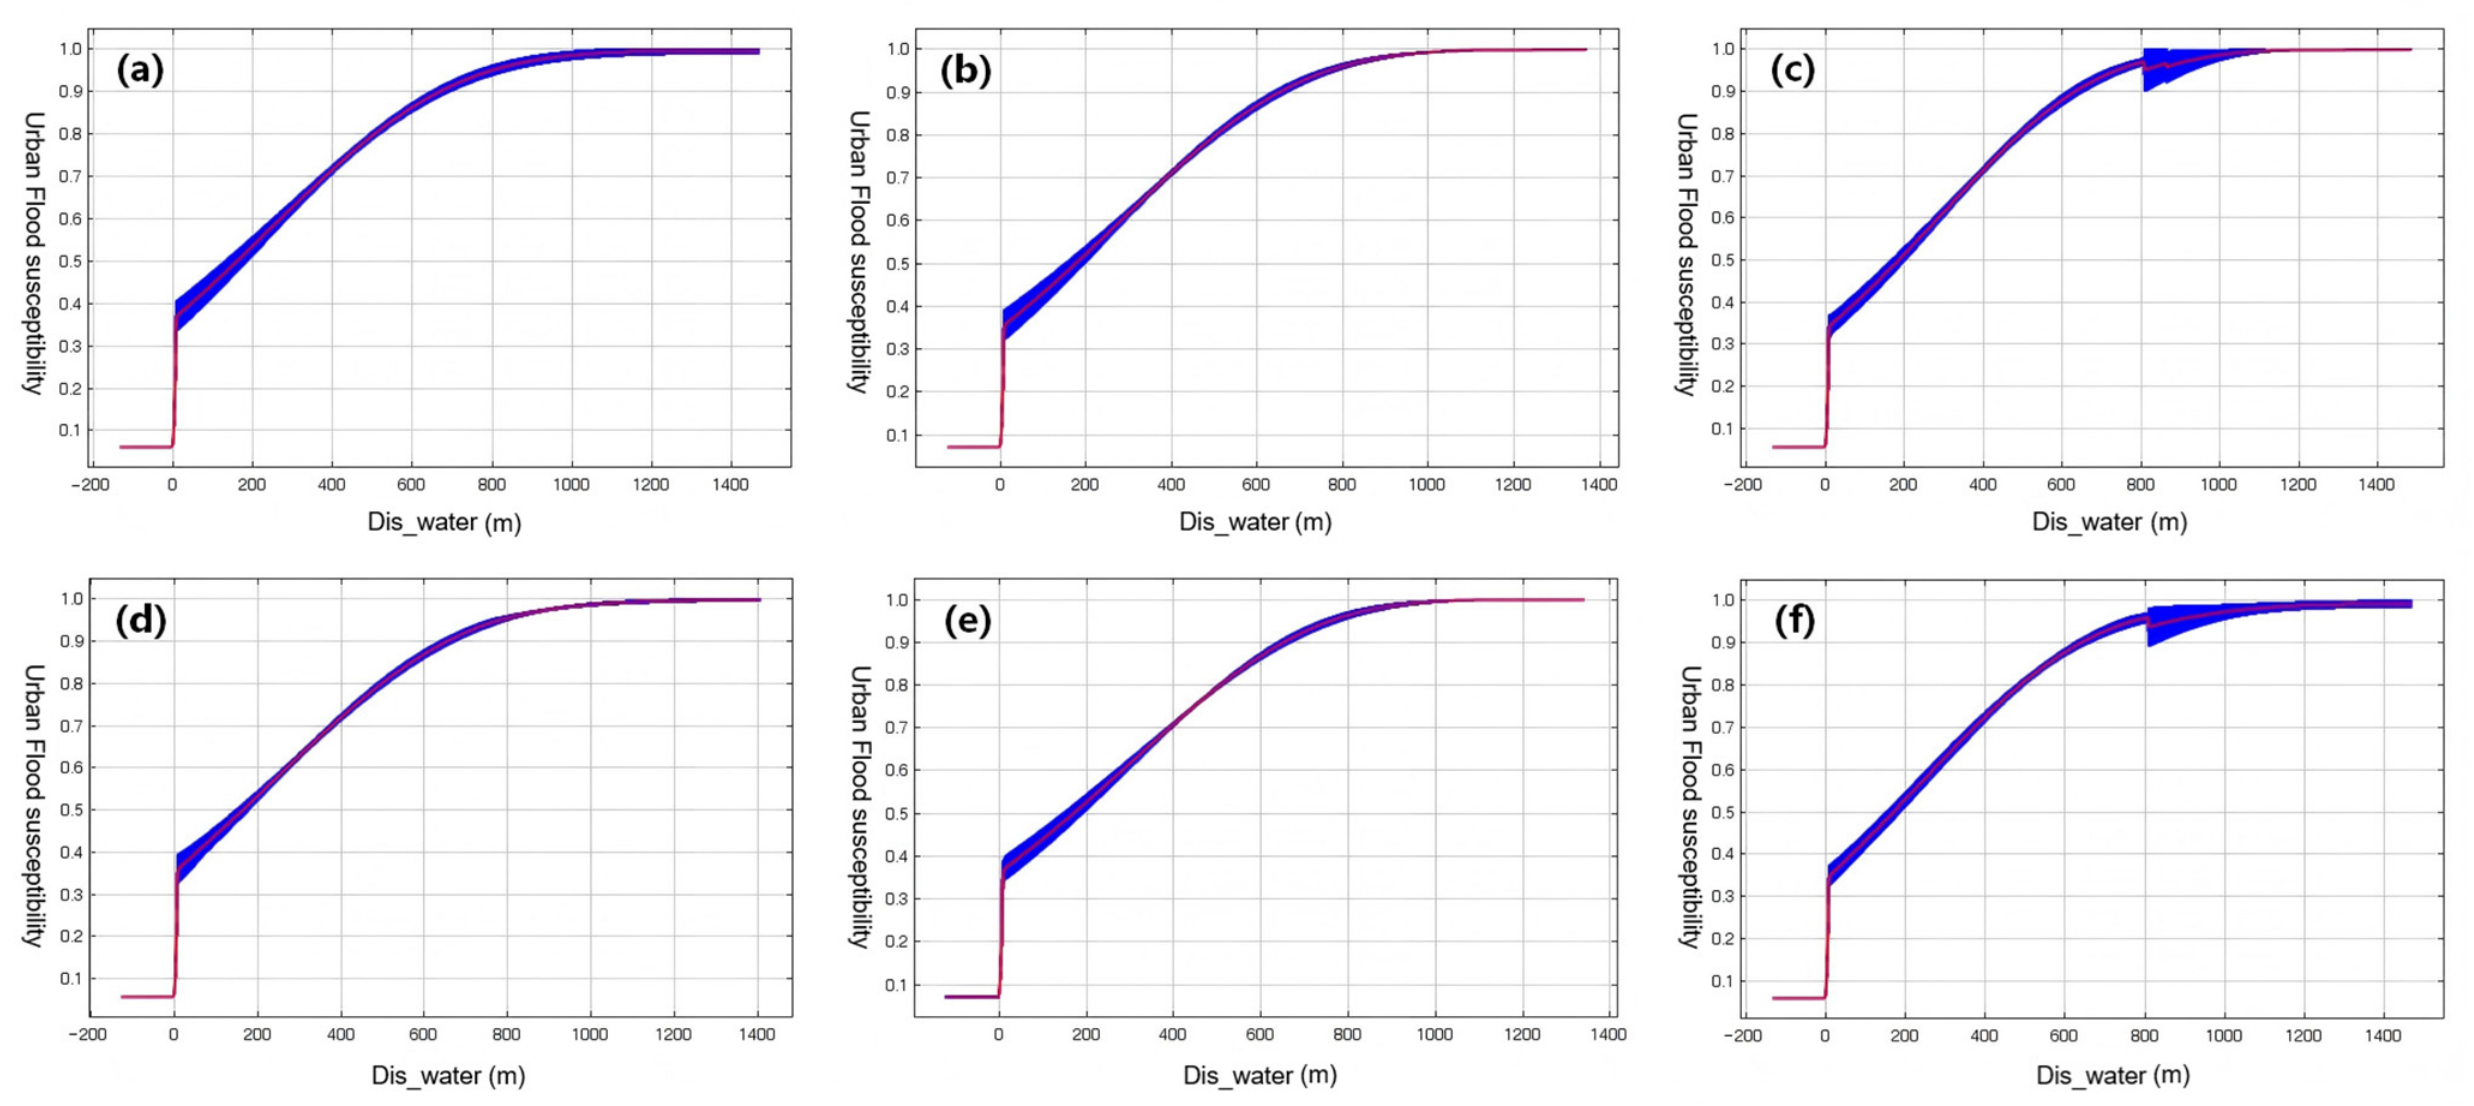
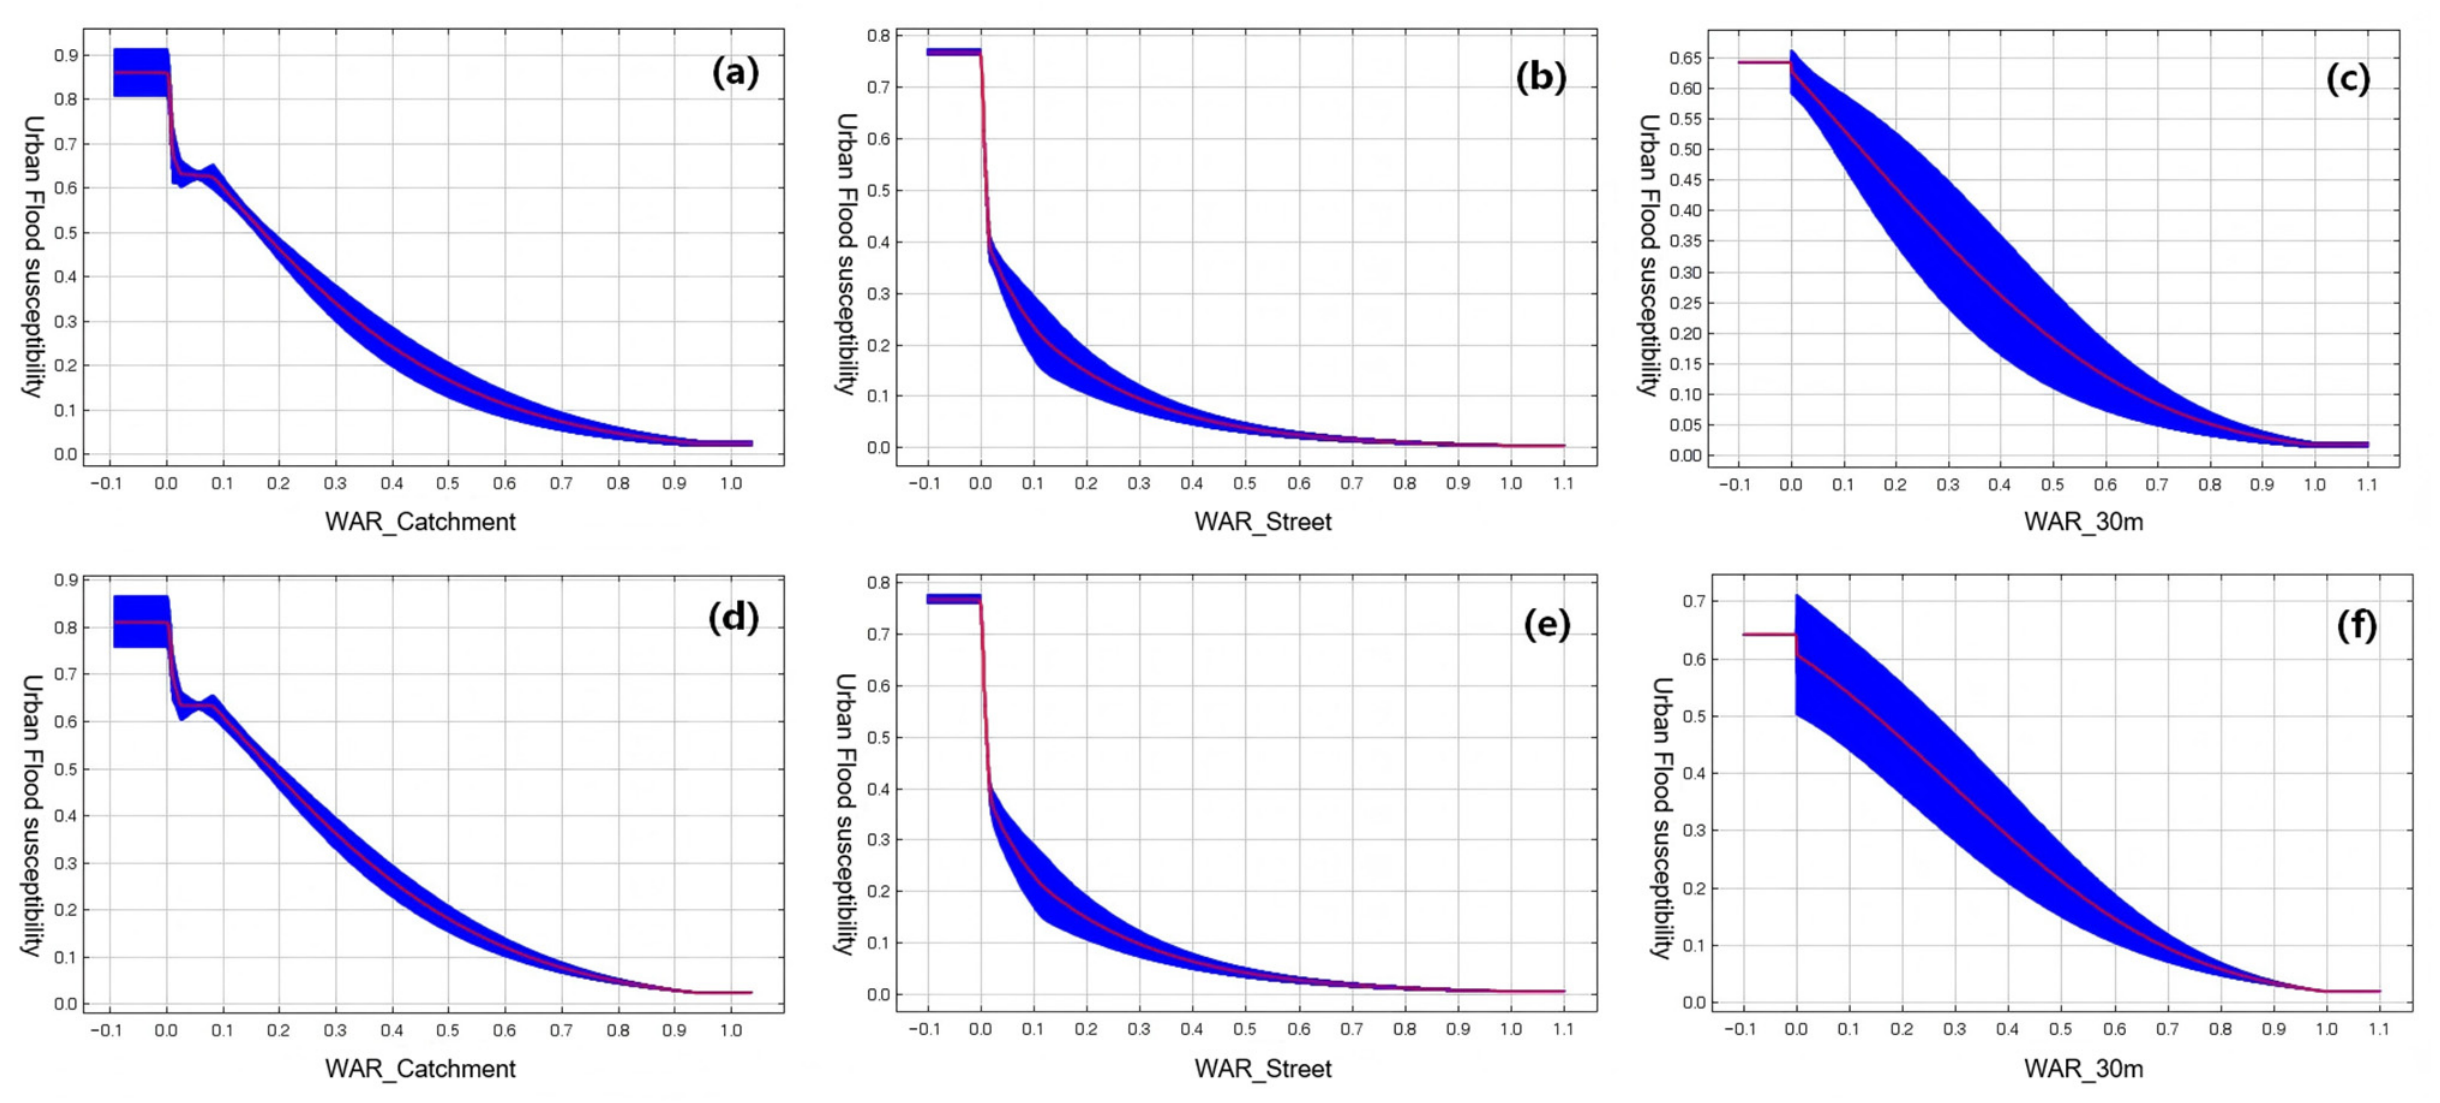
This section presents the response curves of the dominant environmental variables in the multi-scale MaxEnt models (
Figure 8,
Figure 9,
Figure 10,
Figure 11,
Figure 12,
Figure 13 and
Figure 14). Overall, for each dominant variable, the response curves show similar patterns across spatial scales, although the threshold values and slopes vary slightly among scales.
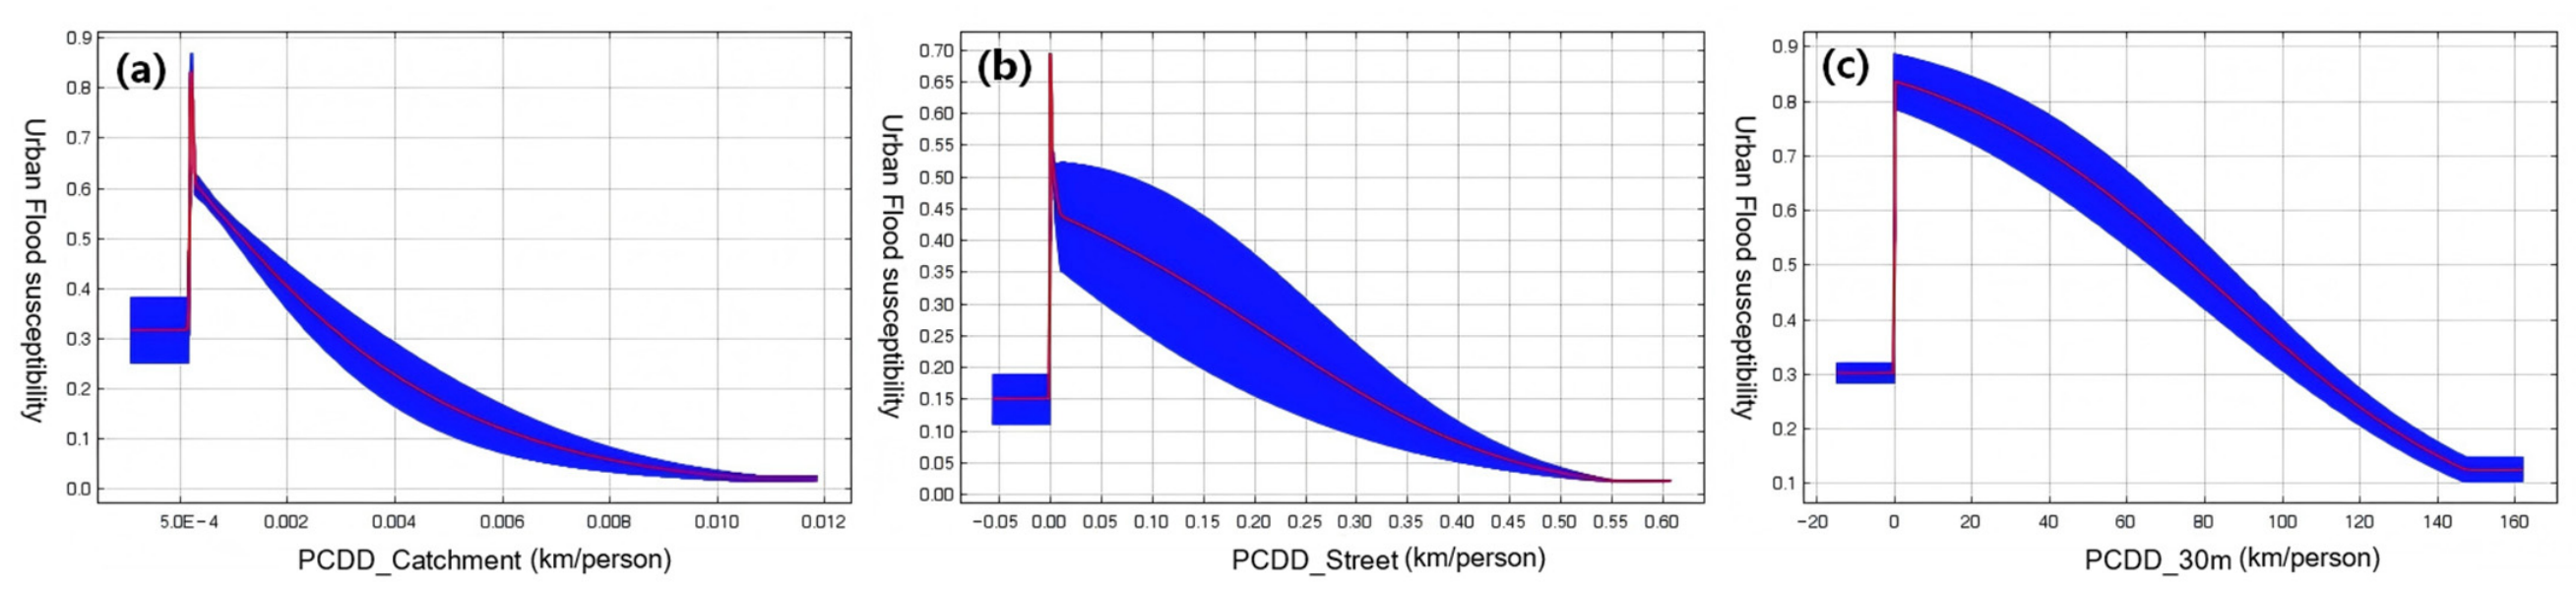
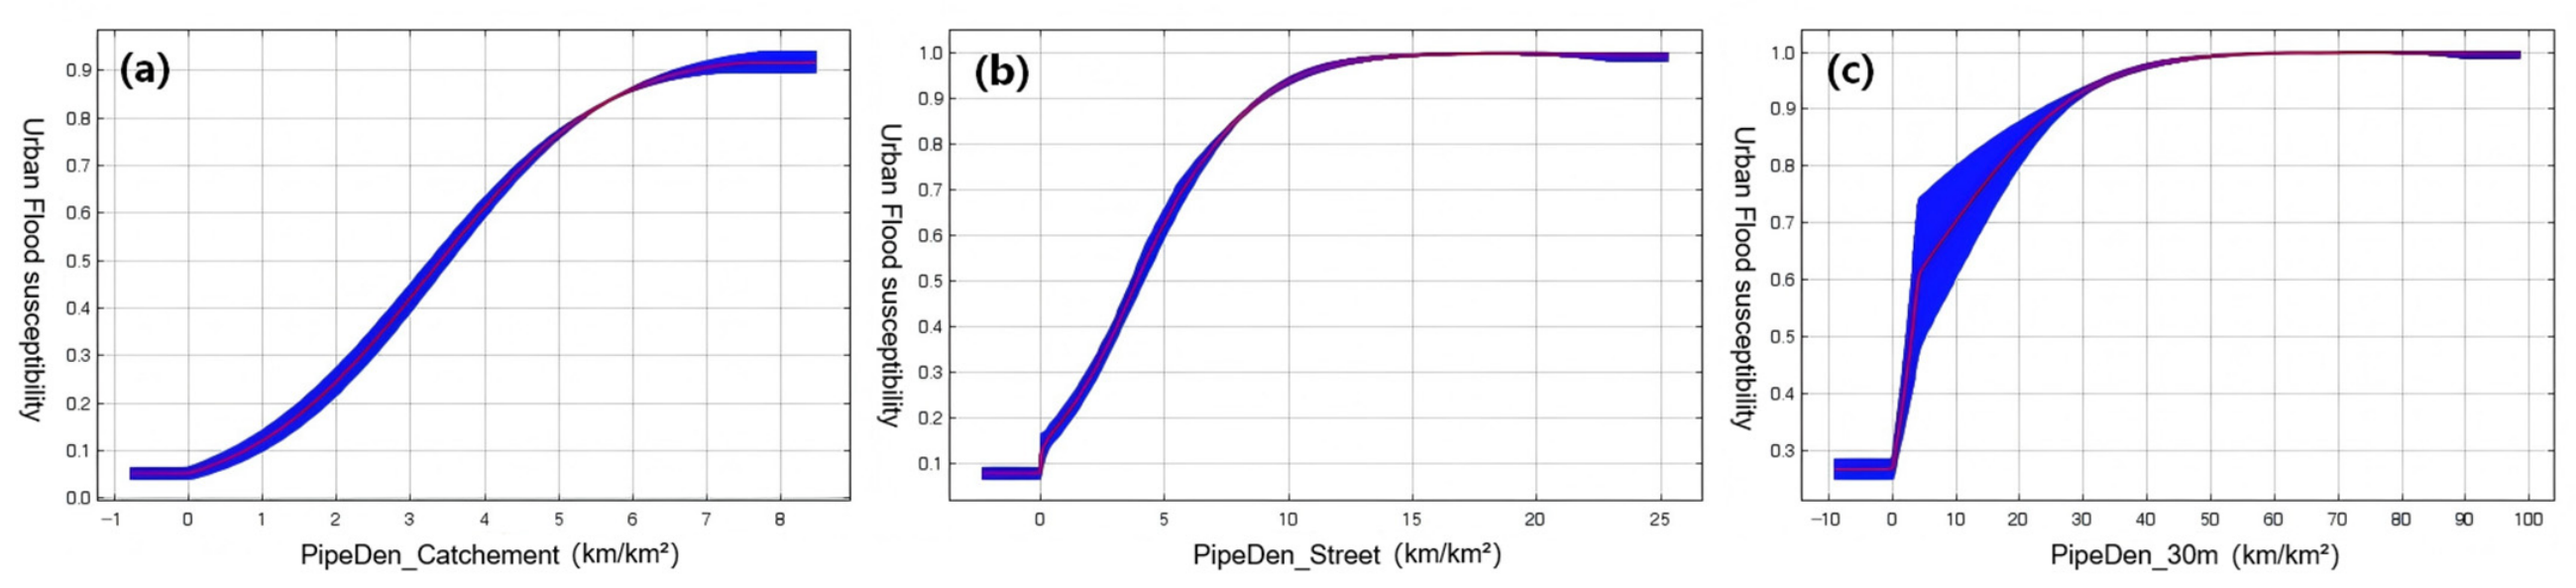
Drainage-related variables showed opposite response patterns. As shown in
Figure 8, PipeDen exhibited a positive S-shaped relationship with urban flood susceptibility, with susceptibility increasing rapidly at low to moderate PipeDen values and gradually stabilizing at higher values. Although the overall response patterns were generally consistent among scales, the threshold ranges varied among the different spatial-scale models. The catchment scale and street scale models showed rapid susceptibility increases when PipeDen was below approximately 7 km/km
2 and 13 km/km
2, respectively, whereas the grid scale model exhibited a broader threshold range and gradually approached saturation when PipeDen exceeded approximately 50 km/km
2. In contrast, as shown in
Figure 9, PCDD exhibited a negative relationship with urban flood susceptibility across all spatial scales. Susceptibility remained relatively high when PCDD values were close to zero and then decreased rapidly as PCDD increased, gradually approaching stable low levels beyond scale-dependent threshold ranges. Although the overall response patterns were generally consistent among the different spatial-scale models, the threshold ranges varied among scales. The catchment scale model became relatively stable when PCDD exceeded approximately 0.01 km/person, whereas the corresponding stabilization thresholds for the street scale and grid scale models were approximately 0.055 km/person and 145 km/person, respectively.
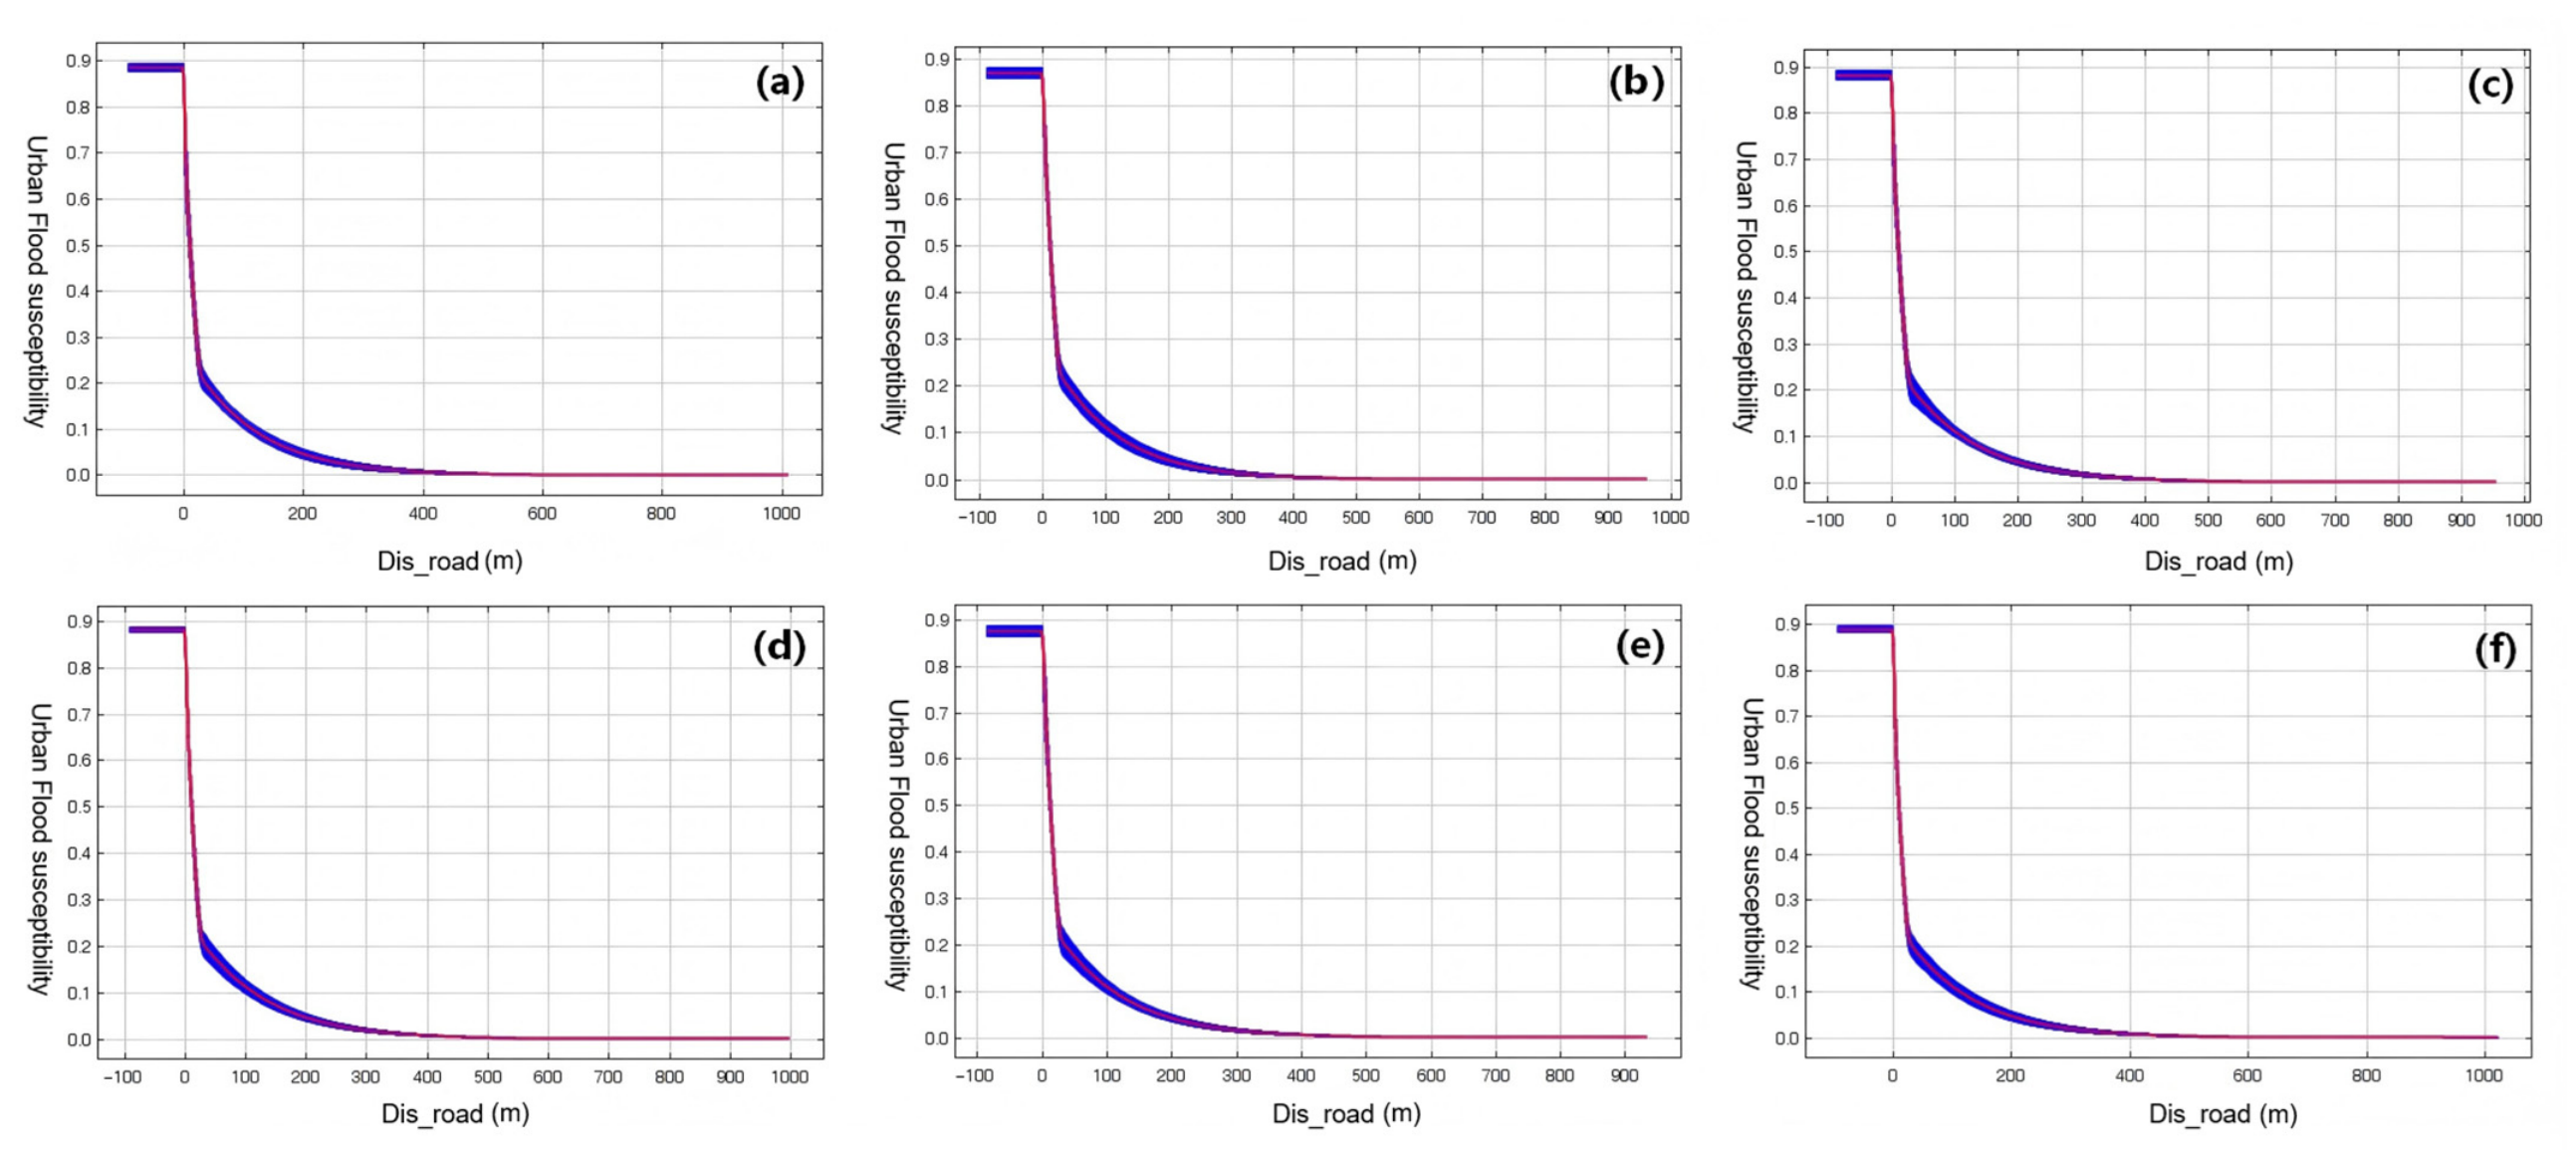
Distance to the nearest road (Dis_road) showed a negative relationship with urban flood susceptibility across all spatial scales (
Figure 10). Susceptibility decreased sharply at short distances and gradually stabilized as distance increased. The response patterns and threshold ranges of Dis_road were highly consistent among the different spatial-scale models. In all models, susceptibility decreased most rapidly within approximately 0–400 m from roads and became relatively stable beyond this distance.
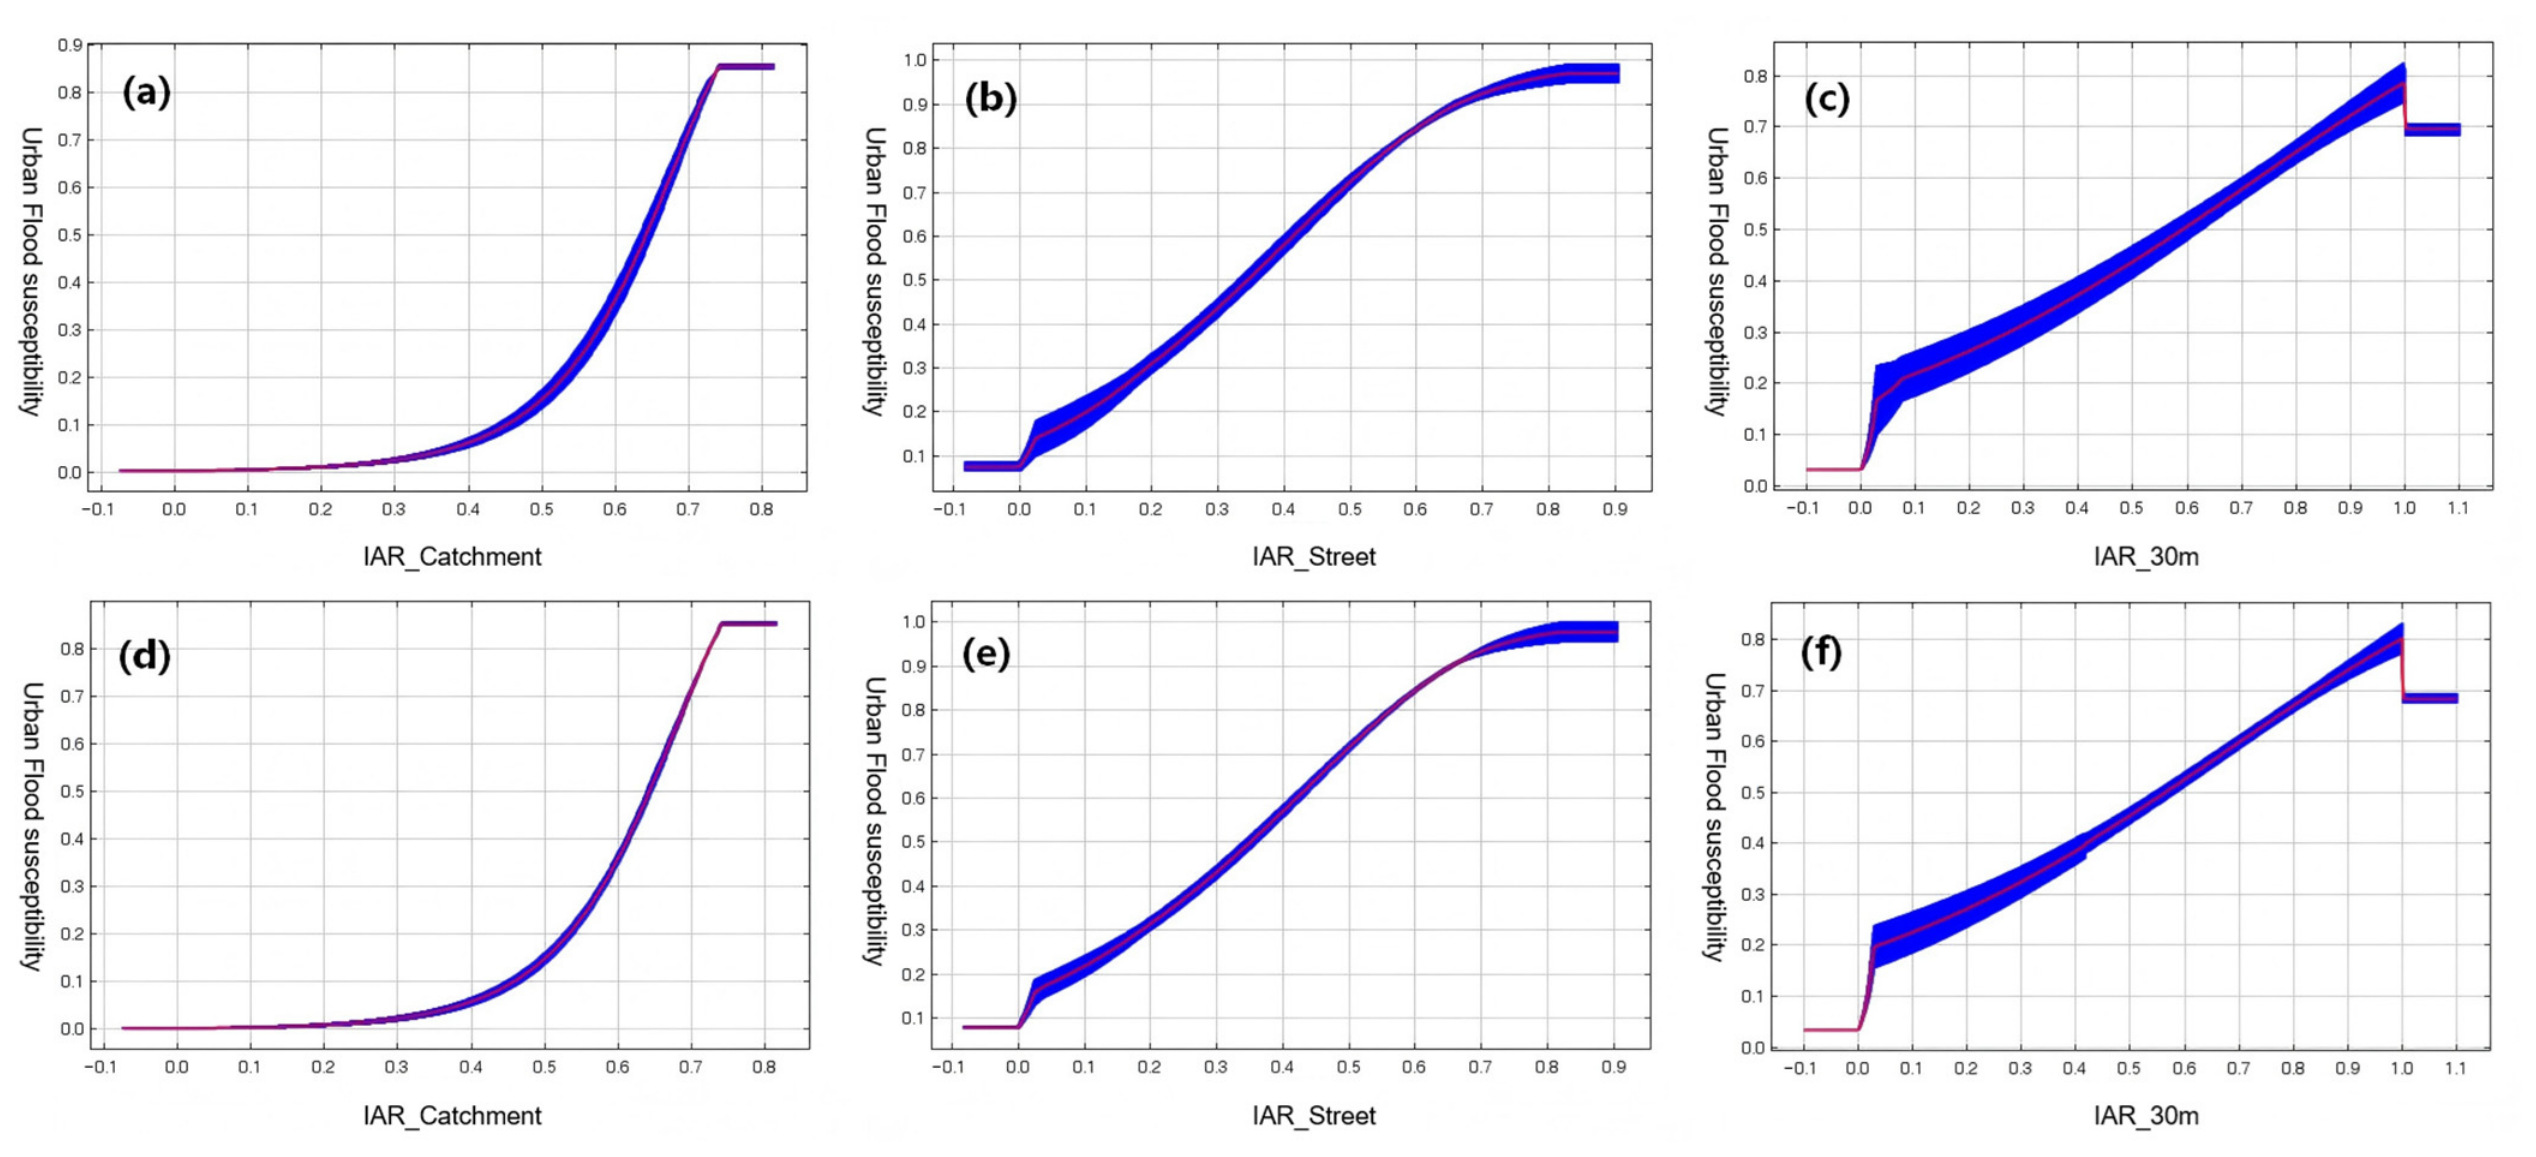
Impervious area ratio (IAR) showed a strong positive relationship with urban flood susceptibility across all spatial scales (
Figure 11). The response patterns and threshold ranges were generally similar between the PipeDen-based and PCDD-based models at the same spatial scale, whereas moderate scale-dependent differences were observed among the catchment, street, and grid scale models. At the catchment scale, susceptibility increased slowly at low IAR values, entered a rapid growth stage when IAR exceeded approximately 0.3, and gradually approached saturation when IAR reached approximately 0.75. In contrast, the street scale and grid scale models exhibited a two-stage response pattern. Susceptibility increased abruptly when IAR values slightly exceeded zero and then continued to increase more gradually as IAR increased further.
Among the hydrological and precipitation variables, AMDP exhibited a highly consistent unimodal relationship with urban flood susceptibility across all spatial-scale models (
Figure 12). Urban flood susceptibility increased progressively as AMDP increased and reached peak values when AMDP approached approximately 125–126 mm/day. Beyond this threshold range, susceptibility decreased sharply at extremely high AMDP values.
Distance to the nearest water body (Dis_water) showed a positive relationship with urban flood susceptibility across all spatial-scale models (
Figure 13). The response patterns were generally consistent among the different models. Susceptibility increased rapidly when Dis_water values slightly exceeded zero, followed by a more gradual increase as the distance from water bodies increased further. The response curves gradually approached saturation when Dis_water exceeded approximately 1000 m.
Water area ratio (WAR) showed a negative relationship with urban flood susceptibility across all spatial-scale models (
Figure 14). The response patterns and threshold ranges were generally similar between the PipeDen-based and PCDD-based models at the same spatial scale, whereas clear scale-dependent differences were observed among the catchment, street, and grid scale models. At the catchment scale, susceptibility decreased sharply when WAR increased from 0 to approximately 0.01, followed by a relatively stable stage near WAR values of 0.01–0.1, and then gradually decreased as WAR increased further. At the street scale, susceptibility exhibited a steeper initial decline near WAR = 0, decreasing rapidly from approximately 0.8 to 0.35 when WAR approached 0.01, followed by a more gradual decline. In contrast, the grid scale models showed only a slight abrupt decrease near WAR = 0, followed by a smoother and more continuous decline throughout the remaining WAR range.
Overall, the response curves reveal different types of relationships between environmental variables and urban flood susceptibility, and several variables show clear threshold or nonlinear response patterns across spatial scales.
4.5. Model Evaluation and Optimal Model Selection
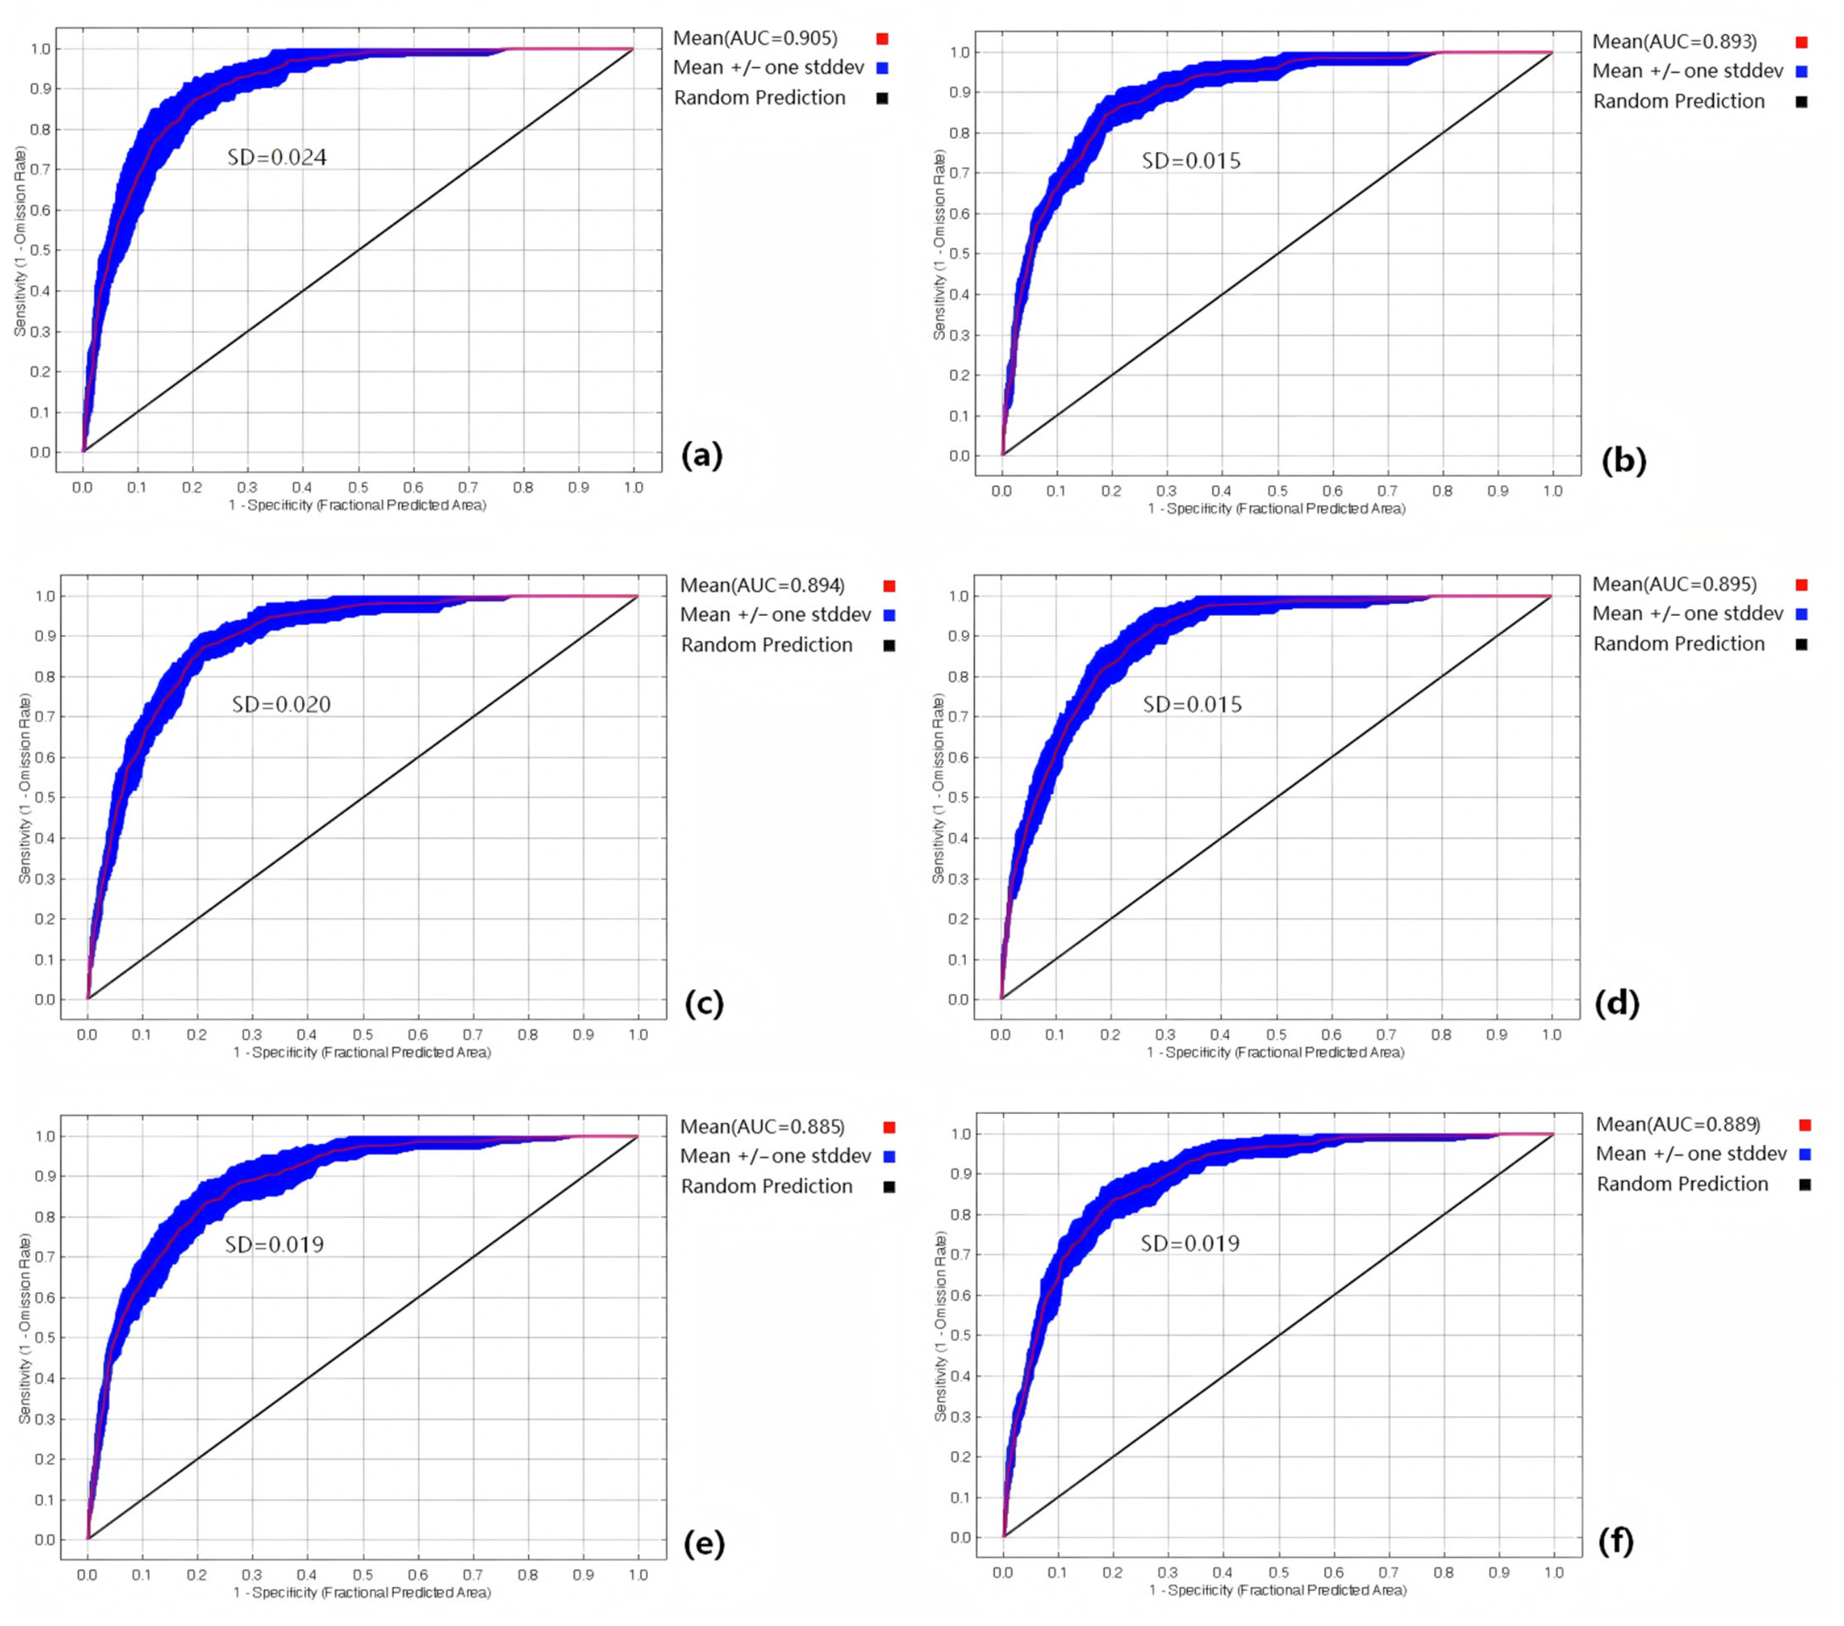
This section presents the evaluation of model performance using the area under the receiver operating characteristic curve (AUC) and standard deviation (SD). As shown in
Figure 15, all models achieved relatively high predictive performance (AUC > 0.88), with slight variations across spatial scales and model types. Among all six models, the PipeDen-based model at the catchment scale achieved the highest AUC value (0.905 ± 0.024), but it also had the largest SD, indicating relatively lower model stability. The PCDD-based model at the street scale (0.895 ± 0.015) achieved the second-highest AUC value and the lowest SD among all models, indicating relatively high predictive performance with the lowest variability. At the grid scale, both models produced relatively lower AUC values compared with the catchment and street scales.
According to the multi-scale spatial autocorrelation analysis (
Section 4.1), the street scale retained significant spatial autocorrelation while preserving sufficient spatial detail. In addition, the response curves (
Section 4.4) showed different relationships between the drainage indicators and urban flood susceptibility. The relationship between PCDD and flood susceptibility exhibited a consistent decreasing trend across spatial scales, whereas PipeDen showed a positive S-shaped relationship.
Considering model accuracy, model stability, the spatial autocorrelation results across scales, and the response patterns of drainage indicators, the PCDD-based model at the street scale was selected as the optimal model for urban flood susceptibility assessment.
4.6. Urban Flood Susceptibility Mapping and Spatial Pattern Analysis
Based on the optimal model identified in
Section 4.5, the spatial pattern of urban flood susceptibility in Nanchang was analyzed at both the citywide and catchment scales. The resulting susceptibility map (
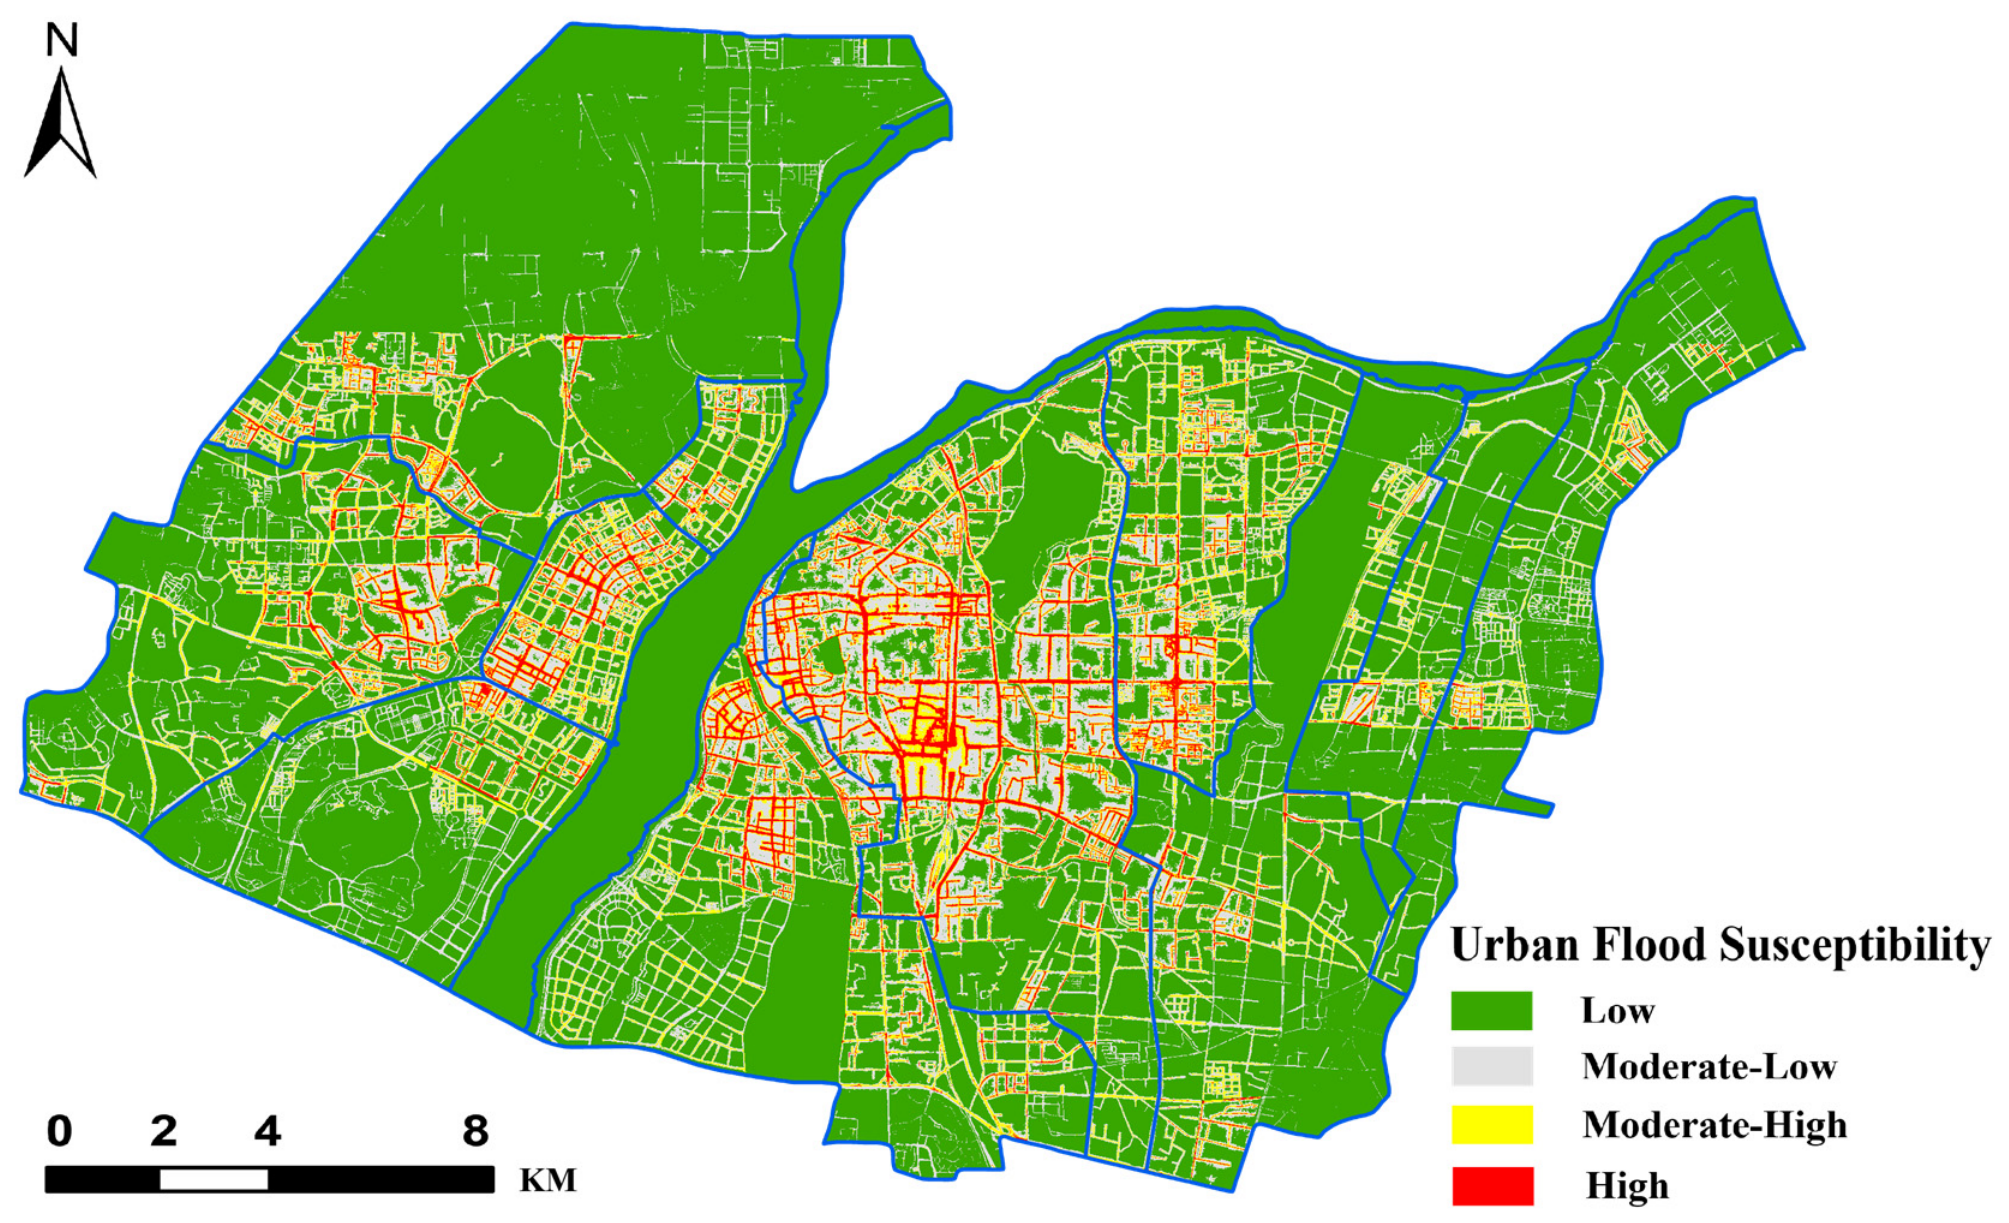
Figure 16) shows clear spatial heterogeneity across the study area.
At the citywide scale (
Figure 16 and
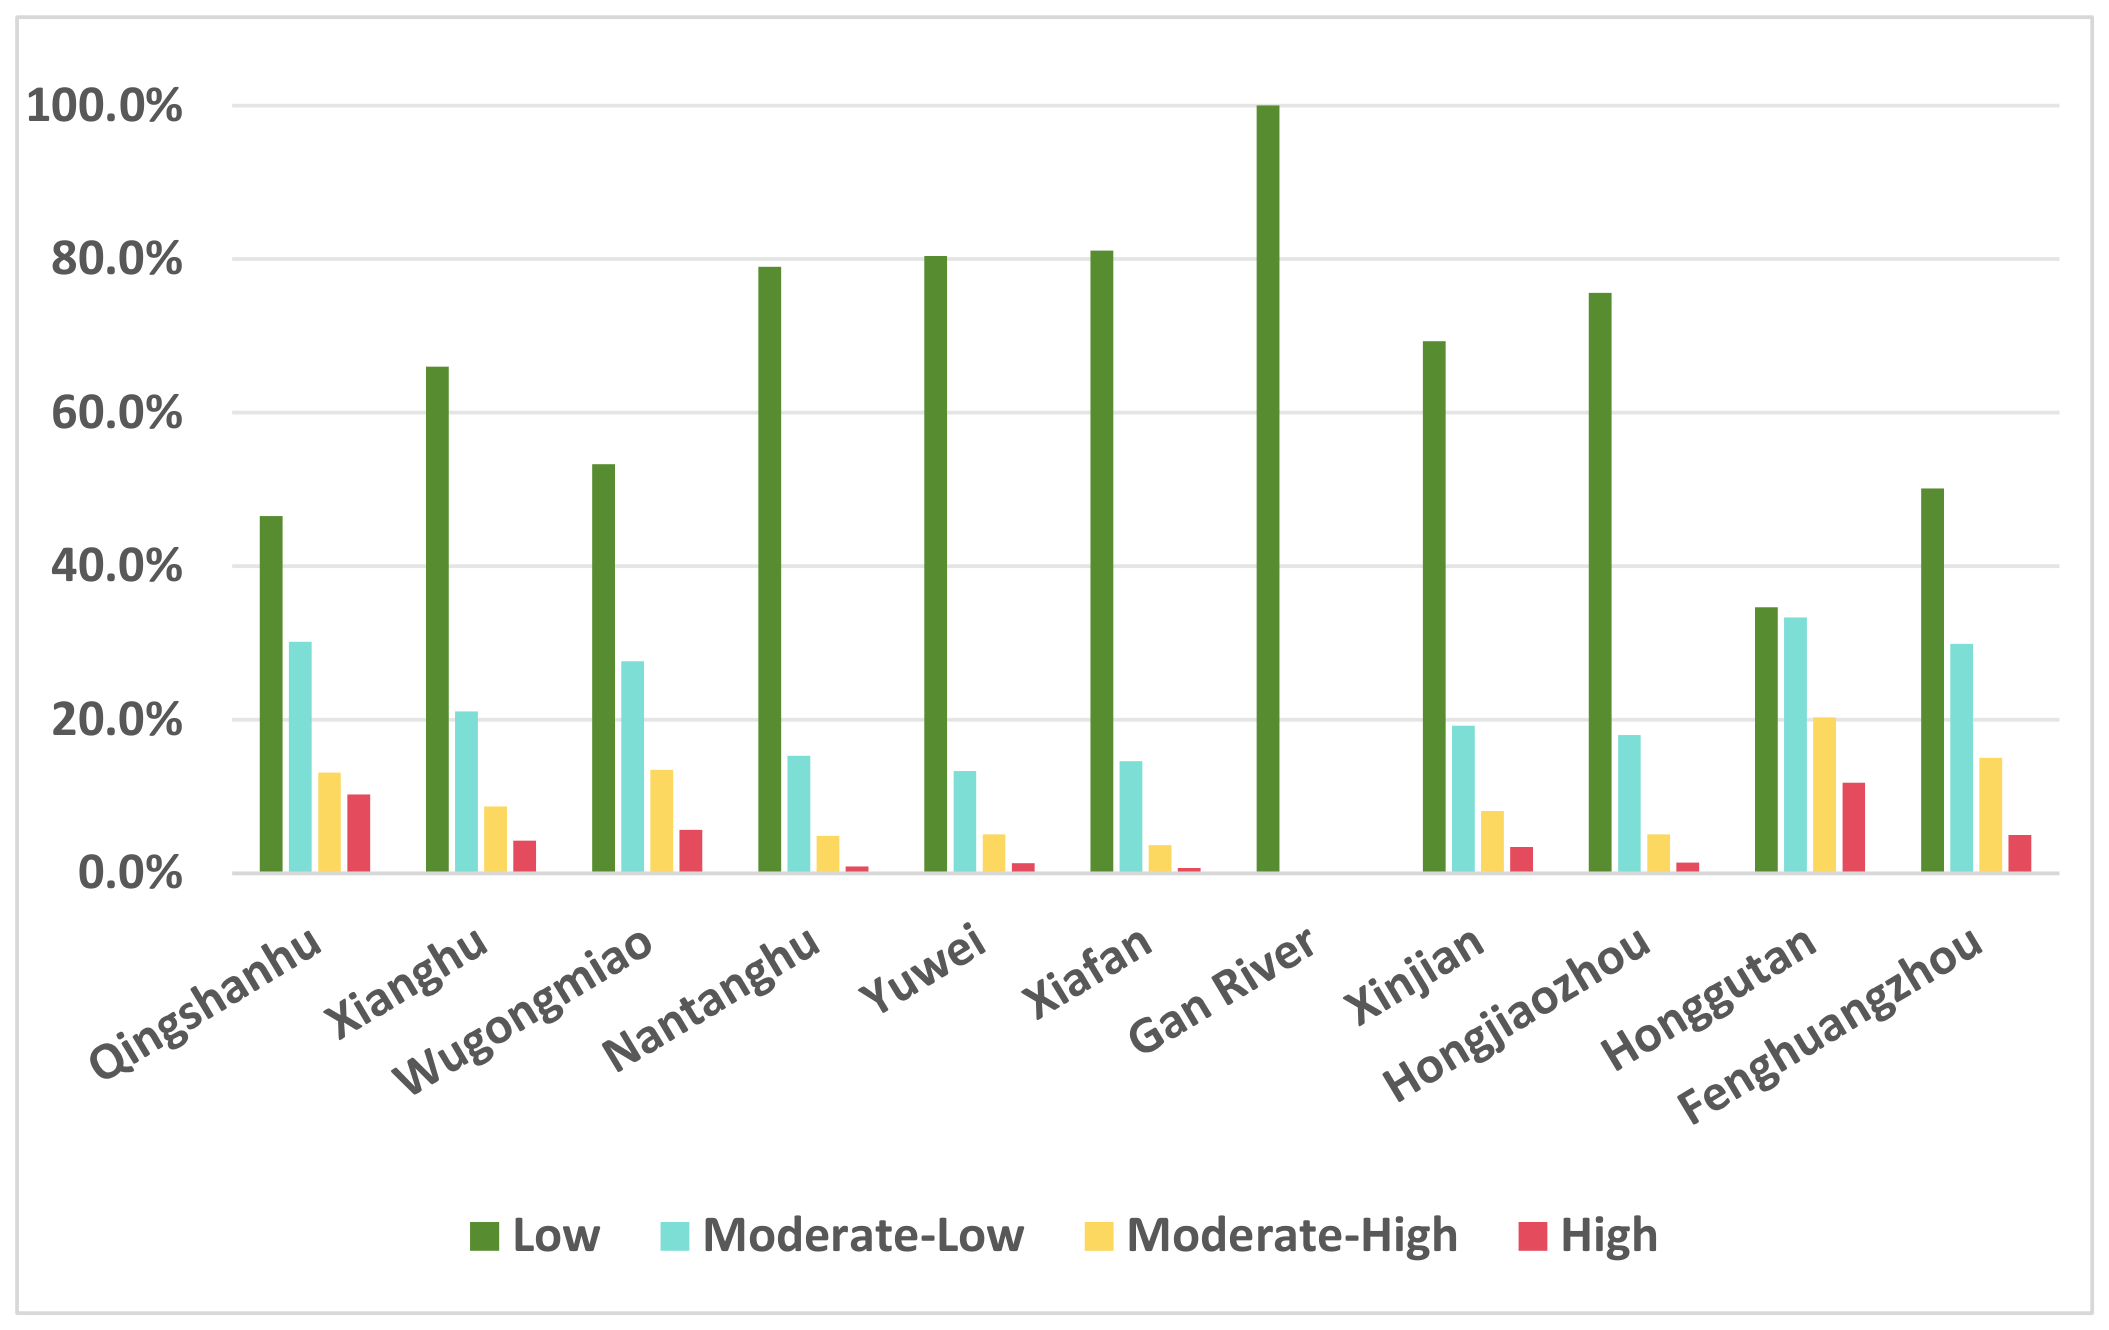
Table 10), low-susceptibility areas dominate the urban landscape, accounting for approximately 71% of the total area, followed by moderate–low (18%)-susceptibility, moderate–high-susceptibility (7%), and finally high-susceptibility areas (4%).
High-susceptibility areas are mainly distributed in continuous clusters along major arterial roads in the core urban corridor on both sides of the Gan River, particularly in Qingshanhu, Wugongmiao, and Honggutan districts, as well as adjacent areas such as eastern Xinjian, southern Jinkai, and northern Xianghu districts. Moderate–high-susceptibility areas are widely distributed along the urban road network, but are also found in built-up areas surrounding high-susceptibility arterial roads, especially in the central parts of Qingshanhu and other densely developed districts. Moderate–low-susceptibility areas are relatively scattered and are mainly located along some roads in southern Hongjiaozhou and northern Xinjian, as well as in built-up areas surrounding high-susceptibility zones in central urban districts. Low-susceptibility areas are mainly distributed in peripheral urban areas, water bodies, green spaces, and some residential districts outside the main urban core.
At the catchment scale (
Figure 17), noticeable differences in susceptibility distribution are observed among drainage districts. Honggutan and Qingshanhu exhibit relatively higher proportions of high-susceptibility areas, whereas Nantanghu, Yuwei, and Xiafan are dominated by low-susceptibility zones. The spatial distribution patterns at this scale further illustrate the heterogeneity of flood susceptibility across different drainage units.
4.7. Validation Using Observed Water Depth Data from Urban Flood Monitoring Stations
To further assess the reliability of the high-resolution flood susceptibility map generated by the optimal street scale PCDD-based model, the maximum observed water-depth data from 13 urban flood monitoring stations were used for independent validation (
Table 11).
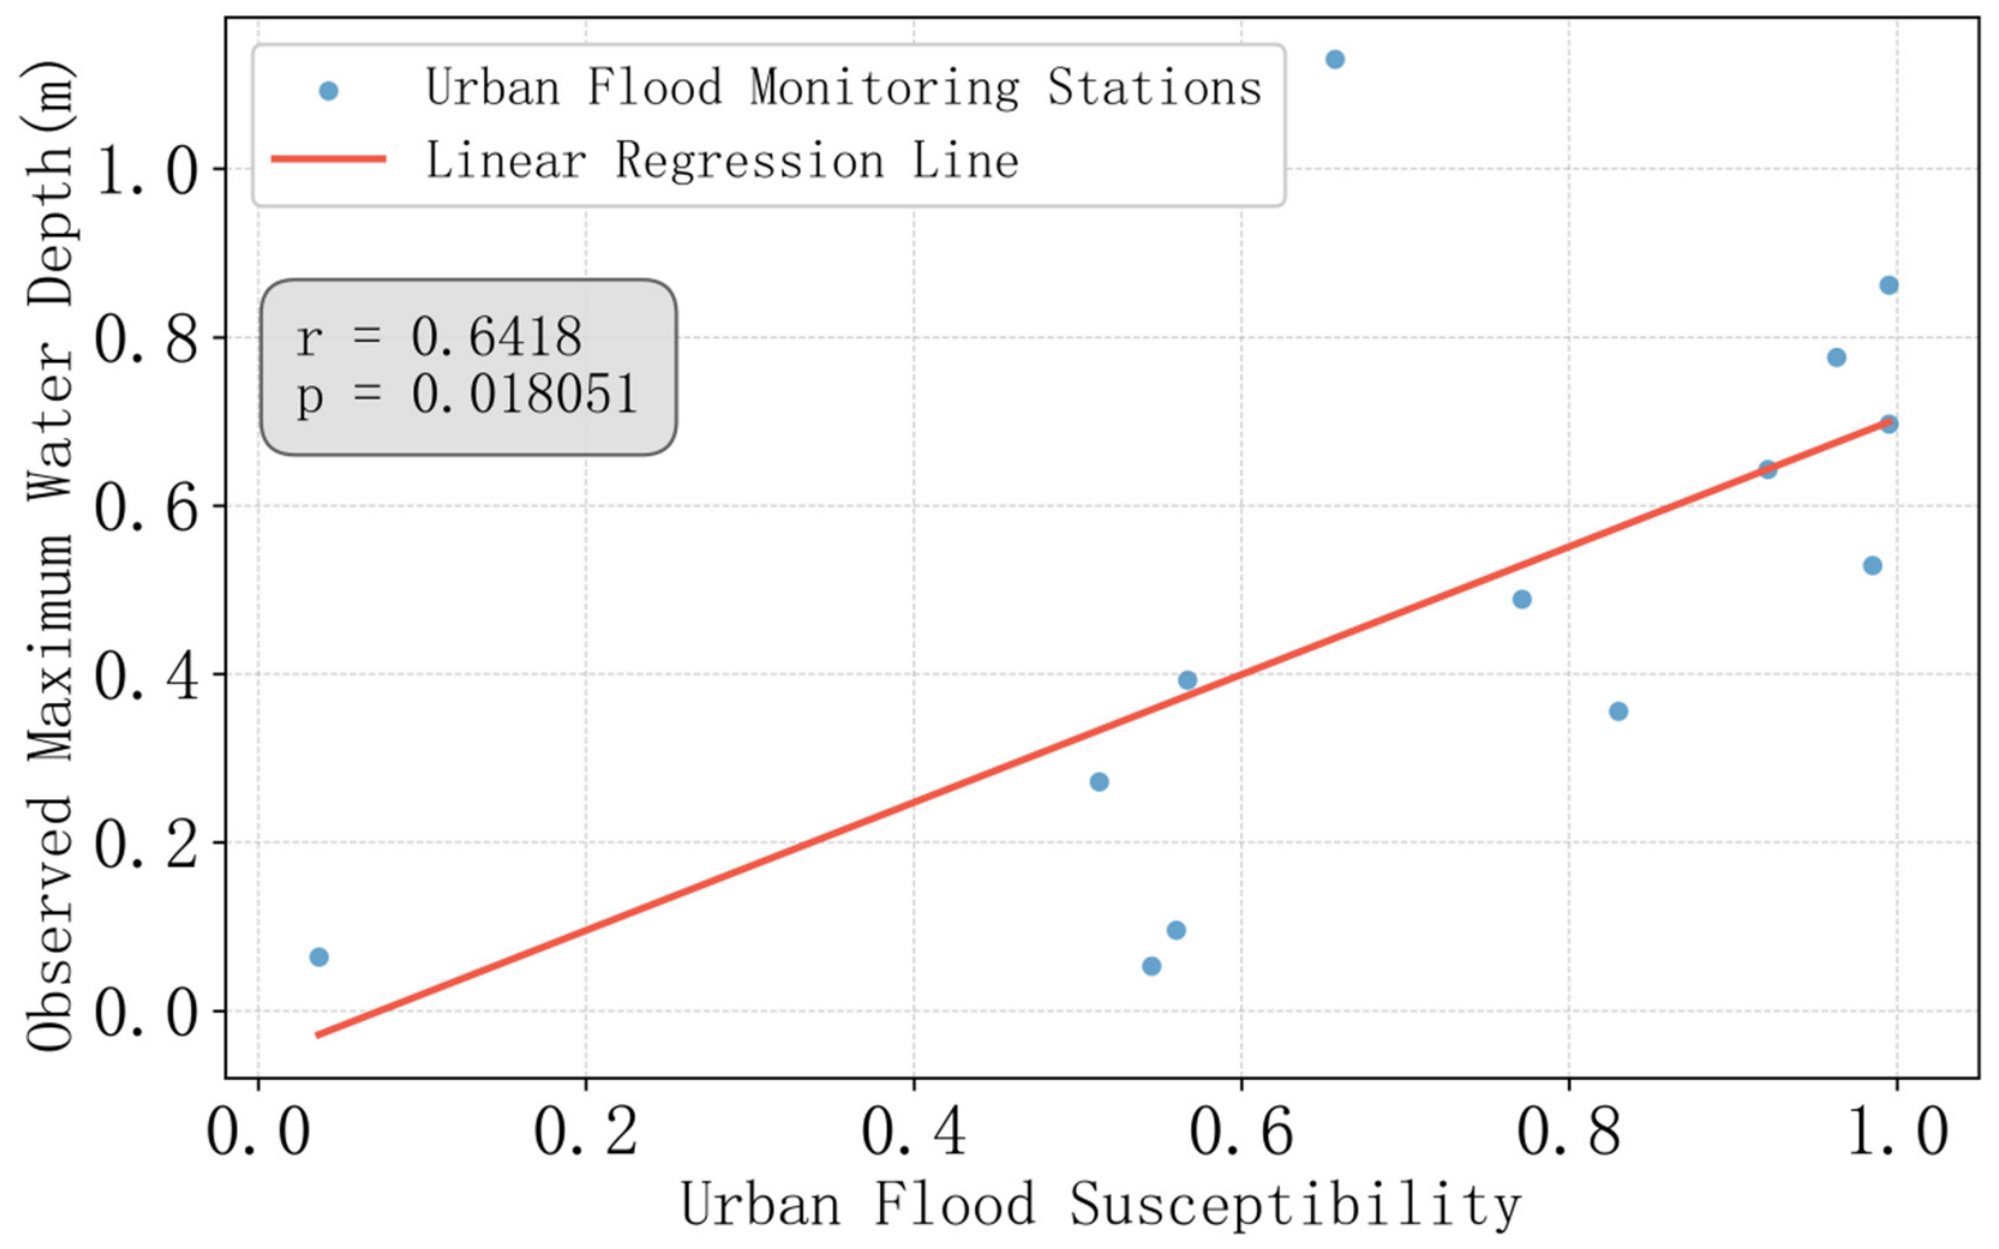
Figure 18 illustrates the relationship between modeled flood susceptibility and observed maximum water depth. A statistically significant positive Pearson correlation was observed between flood susceptibility and observed maximum water depth (r = 0.6418,
p = 0.018). In general, monitoring stations located in areas with higher modeled flood susceptibility tended to exhibit greater observed inundation depth, indicating reasonable consistency between the susceptibility map and observed urban flood conditions.
For example, station 0141210259, located in a high-susceptibility area (susceptibility = 0.995), recorded a relatively large maximum water depth of 0.862 m, whereas station 0141210262, located in a low-susceptibility area (susceptibility = 0.037), recorded a much smaller maximum water depth of 0.064 m.
5. Discussion
5.1. Spatial Scale Effects on Urban Flood Clustering
The results reveal a clear scale dependence in the spatial clustering of urban flood occurrences, indicating that the identification of flood-prone areas is highly sensitive to the choice of spatial units. This phenomenon is related to the modifiable areal unit problem (MAUP), wherein statistical results and spatial patterns vary with spatial resolution and zoning schemes. Therefore, selecting an appropriate spatial scale is critical for accurately identifying urban flood clustering patterns.
At the catchment scale, spatial clustering appears relatively weak because large spatial units aggregate heterogeneous land cover, drainage conditions, and micro-topographic characteristics. This aggregation effect tends to smooth spatial heterogeneity and may obscure localized clustering patterns of flood events.
At the grid scale, spatial autocorrelation becomes insignificant due to excessive spatial fragmentation. When spatial units are smaller than the effective spatial influence range of flood processes, most units contain no flood events, which dilutes spatial dependence in global spatial statistics and weakens clustering signals. This suggests that excessively fine spatial units may weaken the representation of spatial dependence in urban flood susceptibility patterns and introduce greater spatial noise in susceptibility analysis.
In contrast, the street scale provides a balance between spatial aggregation and spatial fragmentation, as it preserves significant spatial autocorrelation while maintaining sufficient spatial detail to capture localized clustering patterns. Therefore, the street scale is more suitable for representing the spatial structure of urban flood occurrences in the study area.
5.2. Comparison of Drainage Capacity Indicators: PCDD vs. PipeDen
The comparison between drainage pipeline density (PipeDen) and per capita drainage density (PCDD) reveals clear differences in response patterns and model performance across spatial scales, highlighting the importance of selecting appropriate indicators to represent urban drainage capacity.
The response curves show a positive relationship between PipeDen and urban flood susceptibility, which should be interpreted as a statistical association rather than a direct causal relationship. In highly urbanized areas, higher development intensity is usually associated with increased runoff generation and greater drainage demand, which often leads to denser drainage networks. In contrast, PCDD shows a consistent negative relationship with urban flood susceptibility across spatial scales, indicating that flood susceptibility decreases as PCDD increases. Unlike PipeDen, which mainly represents drainage infrastructure density, PCDD reflects the balance between drainage supply and population-related demand. In densely populated urban areas, lower PCDD values may reflect relatively limited drainage infrastructure provision compared with local population concentration and urban development intensity, which may be associated with higher urban flood susceptibility.
The response curves further indicate clear scale-dependent differences for both PipeDen and PCDD. Since both indicators were calculated within different statistical spatial units, their values and threshold ranges are directly influenced by spatial aggregation effects and local heterogeneity across catchment, street, and grid scales. In particular, the threshold ranges of PCDD varied considerably across spatial scales, especially at the grid scale where substantially larger PCDD values were observed. This phenomenon may partly reflect the combined effects of finer statistical units and scale mismatch between the 30 m grid units and the original 100 m population dataset. After spatial aggregation and normalization, some fine-scale grid units may contain relatively small population values, resulting in locally amplified PCDD values and increased response variability at the grid scale.
In addition to the differences in response patterns, the models incorporating PCDD generally showed more stable performance across spatial scales. At both the catchment and street scales, the PCDD-based models exhibited lower SD values than the PipeDen-based models, with SD reductions of 37.5% and 25.0%, respectively, while maintaining comparable predictive accuracy. At the grid scale, both models showed similar stability, but the PCDD-based model achieved a slightly higher AUC value.
Taken together, compared with PipeDen, PCDD provides a more suitable indicator for representing drainage conditions in urban flood susceptibility modeling, particularly for multi-scale analysis under heterogeneous urban environments.
5.3. Response Mechanisms and Scale-Dependent Effects of the Dominant Factors
The response curves presented in
Section 4.4 reflect the potential relationships between dominant environmental variables and urban flood susceptibility, and this section further discusses the mechanisms underlying these response patterns and their scale-dependent characteristics. The response characteristics of PipeDen and PCDD have already been discussed in
Section 5.2. Therefore, the following discussion focuses on the remaining dominant environmental variables.
Impervious surfaces increase runoff generation and reduce infiltration, resulting in a positive relationship between impervious area ratio (IAR) and urban flood susceptibility. The response patterns and threshold ranges of IAR are highly consistent between the PipeDen-based and PCDD-based models at the same spatial scale, but clear differences are observed among spatial scales. This scale-dependent response may be related to spatial aggregation effects. At the catchment scale, local impervious-surface variability is more likely to be averaged within large spatial units, leading to a more evident threshold-like response. In contrast, street- and grid-scale units preserve more local spatial heterogeneity, resulting in more gradual response trends across the observed IAR range.
Distance to roads (Dis_road) shows a negative relationship with urban flood susceptibility because urban roads often act as preferential flow paths where runoff from surrounding areas concentrates. The highly consistent response patterns and threshold ranges across different models and spatial scales suggest that the influence of road networks on runoff concentration is relatively stable and less sensitive to spatial-scale effects.
AMDP exhibits a unimodal relationship with urban flood susceptibility, with susceptibility increasing as daily rainfall rises from moderate to high levels, reaching a peak near the upper end of the observed precipitation range. The highly consistent threshold ranges among the multi-scale models suggest relatively stable precipitation-response characteristics across spatial scales. The subsequent decline at extreme values likely reflects response saturation and limited sample support at the highest rainfall levels rather than a direct causal effect.
Distance to the nearest water body (Dis_water) shows a positive relationship with urban flood susceptibility, indicating that areas farther from rivers or lakes tend to have higher flood risk. Areas closer to water bodies are usually nearer to drainage outlets and have better hydrological connectivity and storage capacity, facilitating runoff discharge and reducing water accumulation. The highly consistent response patterns and threshold ranges across different models and spatial scales suggest that the influence of urban water bodies on flood susceptibility is relatively stable and less sensitive to spatial-scale effects when represented by distance-based indicators.
Water area ratio (WAR) shows a negative relationship with urban flood susceptibility, as urban water bodies provide storage capacity and improve hydrological connectivity, helping reduce runoff accumulation. Similar to IAR, the response patterns and threshold ranges of WAR are highly consistent between the PipeDen-based and PCDD-based models at the same spatial scale, whereas clear differences are observed among the catchment, street, and grid scale models. This indicates that the effect of WAR is more sensitive to spatial-scale aggregation than to the choice of drainage-capacity indicator.
In some previous studies, topographic variables such as DEM, slope, roughness, and relative height have been identified as important drivers of urban flood susceptibility; in contrast, these variables show consistently low contributions in this study. This difference is likely due to the relatively flat terrain of the study area, where elevation variations are limited and surface runoff is primarily controlled by urban drainage systems and artificial surfaces rather than natural slopes. As a result, topographic effects are restricted to local-scale variations and play minor roles in influencing flood susceptibility.
Clear differences were observed in the scale sensitivity of different environmental variables. Variables such as PipeDen, PCDD, IAR, and WAR exhibited more evident scale-dependent response patterns, whereas Dis_road, Dis_water, and AMDP showed relatively consistent response curves and threshold ranges across different models and spatial scales. This difference may be related to the calculation methods of the environmental variables. PipeDen, PCDD, IAR, and WAR were first calculated within different statistical spatial units to represent neighborhood-scale spatial characteristics; therefore, their response patterns are more strongly influenced by spatial aggregation effects and scale-dependent heterogeneity. In contrast, variables such as Dis_road, Dis_water, and AMDP were directly derived from spatial distance analysis or meteorological datasets, resulting in relatively stable response patterns across scales.
Overall, the dominant environmental variables exhibit different nonlinear response patterns and scale sensitivities, highlighting the importance of considering both environmental characteristics and spatial-scale effects in urban flood susceptibility analysis.
5.4. Spatial Pattern and Driving Mechanisms of Urban Flood Susceptibility
The spatial pattern of urban flood susceptibility in Nanchang is controlled by runoff generation, flow routing, and drainage pressure, which are jointly influenced by urban development intensity, impervious surfaces, population density, and infrastructure distribution.
High- and moderate–high-susceptibility areas are predominantly distributed along major arterial roads because roads function as primary runoff pathways. Their relatively lower elevation and the presence of stormwater inlets cause runoff from surrounding impervious surfaces to concentrate along the road network during heavy rainfall events.
Flood susceptibility generally decreases from central urban areas to the urban periphery, which corresponds to the gradient in urban development intensity. Higher building density and impervious surface coverage in central districts generate greater runoff and place higher pressure on drainage systems, resulting in higher flood susceptibility than in less developed peripheral areas.
In older urban districts, such as Qingshanhu and northern Xianghu, dense development, high population density, and aging drainage infrastructure may reduce drainage efficiency; meanwhile, in newer districts, such as Honggutan and Wugongmiao, high population density, extensive impervious surfaces, and rapid urban development generate large runoff volumes and drainage demand, resulting in relatively high flood susceptibility.
Low-susceptibility areas are mainly distributed in northern Xinjian, southern Hongjiaozhou, and other peripheral districts. These areas generally have lower development intensity, lower impervious surface ratios, and lower population density, with more open space and better natural infiltration and storage capacity, resulting in lower runoff generation and lower drainage pressure, and therefore lower flood susceptibility.
These spatial patterns and driving mechanisms were further supported by independent validation using observed urban flood monitoring data. A statistically significant positive correlation was observed between modeled flood susceptibility and observed maximum inundation depth (r = 0.6418, p = 0.018), indicating reasonable consistency between the susceptibility map and actual urban flood conditions.
Only one monitoring station (0036519001) showed relatively high observed inundation depth despite moderate modeled susceptibility. This discrepancy may be related to localized drainage blockage, micro-topographic effects, temporary infrastructure failure, or other fine-scale urban hydrological factors that were not fully represented in the current model.
5.5. Limitations and Future Work
Despite the promising performance of the proposed framework, several limitations should be acknowledged.
First, the precipitation datasets used in this study have relatively coarse and inconsistent spatial resolutions. The daily precipitation dataset has a spatial resolution of approximately 4 km, whereas the monthly precipitation dataset has a spatial resolution of approximately 1 km; these publicly available datasets were adopted because higher-resolution and spatially consistent precipitation observations for the study area were not accessible during this study. Although the datasets have been validated in previous studies, the relatively coarse spatial resolution may limit the representation of localized urban rainfall variability, particularly for high-resolution urban flood susceptibility mapping. In addition, the precipitation indicators used in this study were derived from datasets corresponding to the year 2020 to maintain temporal consistency with other environmental and infrastructure datasets. Future studies could further incorporate multi-year climatic averages, higher-resolution precipitation products, radar rainfall data, and dense urban meteorological observations to improve the representation of long-term climatic conditions and spatial rainfall heterogeneity.
Second, the population density dataset used in this study was derived from a publicly available gridded population product based on dasymetric mapping techniques and geospatial covariates such as land cover. Although this dataset has been widely used in urban studies, uncertainties may still exist compared with detailed census-based population statistics. In addition, the spatial resolution of the population dataset (100 m) is coarser than the 30 m grid units used in the fine-scale analysis, which may introduce scale-mismatch effects during spatial aggregation and normalization. This issue may partly contribute to local fluctuations and amplified PCDD values in some fine-scale grid units, thereby affecting model stability at the grid scale. Future studies could further improve the accuracy of population distribution estimation by integrating finer-scale census data, mobile phone signaling data, or other dynamic population datasets where available.
Third, the treatment of special spatial units in the PCDD formulation introduces empirical assumptions. In this study, water-dominated units and uninhabited units were assigned a value of to represent their relatively higher natural flood buffering capacities. This parameter was empirically selected to ensure clear separation from typical urban units while maintaining model stability. However, the sensitivity of model performance to this parameter selection was not systematically evaluated. Future work could further investigate the sensitivity and uncertainty of different parameter settings through comparative experiments and sensitivity analysis.
Fourth, this study focuses on spatial susceptibility patterns based on static environmental and infrastructure conditions in 2020. Temporal variations in drainage conditions, drainage pipe capacity, infrastructure aging, urban development, and rainfall variability were not explicitly considered. These limitations may partly explain certain localized discrepancies between modeled flood susceptibility and observed inundation conditions at individual monitoring stations. Future studies could incorporate multi-temporal datasets and dynamic urban environmental information to further improve the temporal adaptability of urban flood susceptibility mapping.
Finally, the independent validation conducted in this study was based on observed water-depth data from 13 urban flood monitoring stations. Although the validation results showed a statistically significant positive correlation between modeled flood susceptibility and observed inundation depth, the relatively limited number of monitoring stations may still constrain the representativeness of the validation results. Future studies could incorporate more extensive urban flood monitoring data and event-based inundation observations to further improve the robustness and uncertainty assessment of high-resolution urban flood susceptibility mapping.