Article

Multi-Context Validation of Global Fractional Vegetation Cover Products in Croplands Using Multi-Source Crop FVC References


1
Key Laboratory for Geographical Process Analysis & Simulation of Hubei Province/College of Urban and Environmental Sciences, Central China Normal University, Wuhan 430079, China
2
National Engineering and Technology Center for Information Agriculture, MOE Engineering Research Center of Smart Agriculture, MARA Key Laboratory of Crop System Analysis and Decision Making, Jiangsu Key Laboratory for Information Agriculture, Nanjing Agricultural University, Nanjing 210095, China
3
State Key Laboratory of Remote Sensing and Digital Earth, Aerospace Information Research Institute, Chinese Academy of Sciences, Beijing 100094, China
*
Author to whom correspondence should be addressed.
Remote Sens. 2026, 18(11), 1727; https://doi.org/10.3390/rs18111727
Submission received: 21 March 2026 / Revised: 9 May 2026 / Accepted: 21 May 2026 / Published: 27 May 2026
(This article belongs to the Special Issue Advances in High-Resolution Crop Mapping at Large Spatial Scales)

Highlights

What are the main findings?
  • A multi-context validation framework (V1~V3) was established using multi-source CropFVC references (2000–2024) to evaluate global FVC products over croplands.
  • Across V1~V3, all products showed comparable accuracy (RMSE = 0.16~0.23) but consistent overestimation under dense canopy conditions.
  • Crop-specific validation preliminary revealed clear differences in retrieval difficulty, following wheat > maize > rice > soybean.
What are the implications of the main findings?
  • The shared bias patterns suggest common challenges in representing heterogeneous crop canopies rather than isolated algorithm-specific errors.
  • The integration of new UAV and Jilin-1 observations expands global CropFVC validation references and improves crop-oriented evaluation of global FVC products.

Abstract

Fractional Vegetation Cover of Crops (CropFVC) is a critical canopy parameter for monitoring crop growth, yet the behavior of widely used global FVC products (GLASS, GEOV1, GEOV2, and GEOV3) over croplands remains insufficiently understood due to fragmented validation references and limited crop-specific assessments. This study compiled a multi-source global CropFVC reference dataset (2000–2024) by integrating five international validation networks, the literature-derived samples, and newly acquired UAV and Jilin-1 satellite-derived CropFVC samples from China in 2024. The references were organized into three complementary validation contexts (V1~V3) to examine product behavior under different temporal coverage, crop purity, and reference conditions, together with spatio-temporal observations at the KONZ site. Results show that (1) across validation contexts, the evaluated products showed consistent behavior patterns, including shared overestimation under dense canopy conditions and reduced differences at low FVC levels; (2) spatio-temporal analysis at the KONZ site confirmed that peak-season deviations reflect shared response behavior rather than site-specific reference uncertainties; (3) historical mixed references (V1~V2) showed similar bias structures, whereas crop-specific validation (V3) preliminary revealed clearer crop-dependent responses, with predictive difficulty following winter wheat > maize > rice > soybean and improved stability after integrating 2024 observations. The integration of recent high-resolution crop observations expands existing global CropFVC references and enables behavior-oriented interpretation of global FVC products beyond simple accuracy ranking, providing an updated validation perspective for future development and application of global CropFVC products in agricultural monitoring.

1. Introduction

Fractional vegetation cover (FVC), defined as the vertical projection of the canopy area relative to the total land area [1], is a key biophysical parameter widely used to characterize vegetation and crop growth conditions. Fractional Vegetation Cover of Crops (CropFVC) reflects crop photosynthesis, transpiration, and carbon absorption, making it a valuable indicator for monitoring crop growth, predicting yields, managing cropland, and assessing agri-ecosystem health [2,3,4]. Accurate and timely CropFVC information therefore plays an important role in supporting smart and precision agricultural applications.
Remote sensing provides long-term, stable, and reliable FVC datasets [5,6]. Multi-scale remote sensing-based FVC products (Table A1), derived by different producing philosophies, have been widely applied in agricultural studies, among which GEOV1, GEOV2, GEOV3, and GLASS are the most prominent, as they consistently provide global FVC time series and are widely used in crop monitoring [7,8,9,10,11]. However, crop canopies, characterized by row structures, rapid seasonal development, heterogeneous soil backgrounds, and strong management-driven variability, differ substantially from natural vegetation ecosystems [12,13,14]. These structural and phenological differences introduce additional challenges for FVC retrieval and interpretation, highlighting the necessity of crop-oriented validation perspectives for existing FVC products in agricultural applications. Existing studies have examined global FVC products over croplands at local [15,16,17,18] or national scales [19,20]. Nevertheless, these studies remain fragmented across regions (Australia; China; Ukraine; Tunisia; Argentina; Spain; Italy; Canada; Chile; Kenya; France) and time periods (2011–2012; 2014–2020), limiting the understanding of product behavior under crop-specific validation contexts at the global scale.
Building on these crop-specific challenges, validation references are crucial for evaluating the reliability of global FVC products. Several global ground validation networks, such as VALERI (Validation of Land European Remote sensing Instruments) [21], Imagines (Implementing Multi-Scale Agricultural Indicators Exploiting Sentinels) [22], OLIVE (BELMANIP2 (Benchmark Land Multisite Analysis and Intercomparison of Products) and DIRECT2.0) [23], DIRECT2.1 [24], and GBOV (Ground-Based Observations for Validation) [25], have been widely used to assess the uncertainties in global FVC products for general vegetation types. For instance, Mu [26] used 34 global VALERI sites (2000–2014) covering forest, grassland, farmland, shrub, and pasture, to directly validate the GEOV1 FVC products and obtain an R2 of 0.795 and an RMSE of 0.159; while Liu [18] used 29 ImagineS sites (2016–2016) covering forest, grassland, farmland and shrub, to directly and indirectly validate GEOV2, GEOV3, and GLASS FVC products, showing that GLASS FVC achieved the highest spatiotemporal consistency and quantitative accuracy. However, few of these validation efforts explicitly target croplands, and crop-specific validation references at the global scale remain limited.
In addition to global reference datasets, local validation studies based on ground-truth field data have also provided valuable insight into FVC product performance. Field campaigns in agricultural regions, alpine meadows, and high-cold grasslands have contributed important reference information [27,28,29]. Although these datasets improve local evaluation reliability, their spatial coverage is typically restricted, and data sharing constraints limit their integration into large-scale validation frameworks. Consequently, they provide only restricted perspectives on crop-related uncertainties in global FVC products.
Overall, current validation efforts remain constrained by limited spatial coverage and uneven crop-type representation [30]. Existing global CropFVC references are largely dominated by mixed samples and mainly concentrated in Europe and North America, with very limited representation of pure single-crop observations and major crop-producing regions. Moreover, many available datasets were derived from earlier observation campaigns and lack recent crop-specific measurements. These limitations indicate that current validation evidence remains fragmented, making it difficult to distinguish robust behavior from dataset-specific validation effects, and thereby obscuring consistent patterns across different cropland conditions [31].
To address these validation constraints, we compiled CropFVC samples from five global reference datasets (DIRECT2.1, VALERI, ImagineS, OLIVE, GBOV) and existing literature, integrated them with high-precision field samples of major crops in China collected in 2024 using UAV and Jilin-1 satellite imagery. This integration resulted in a multi-source global CropFVC reference dataset spanning 2000–2024. Unlike previous validation studies that mainly relied on single-context references, this study organized the compiled references into three complementary validation contexts to reflect differences in temporal coverage, crop purity, and reference condition. Specifically, V1 represents long-term historical multi-source references, V2 provides a coverage-consistent subset for fair cross-product comparison, and V3 integrates historical references with recent high-resolution crop-specific observations to support an updated global CropFVC validation context. This multi-context validation strategy does not simply expand sample size or spatial coverage; rather, it enables product behavior to be interpreted under different reference conditions instead of relying on a single benchmark dataset. Using this framework, we examine the behavior and consistency of four widely used global FVC products (GLASS, GEOV1, GEOV2, and GEOV3) under crop-specific conditions. By incorporating recent high-precision crop observations from 2024, this study provides a crop-oriented global validation perspective and contributes an updated reference foundation for future agricultural monitoring studies.

2. Global FVC Products

The GEOV1 FVC product (1999–2020), developed by VITO and ESA, offers a 10-day temporal and ~1 km spatial resolution, using SPOT/VEGETATION, PROBA-V, MODIS, and auxiliary data [4]. GEOV2 (1999–2020), an improved version of GEOV1, maintains the same resolution but features enhanced processing and algorithms for greater accuracy and stability [32]. GEOV3 (2014–present) further advances the product with a finer 300 m spatial resolution and the same 10 days, leveraging additional satellite sources and complex algorithms to better capture global vegetation dynamics [10]. Here the three GEOV series products were obtained from the Copernicus Land Monitoring Service (https://land.copernicus.eu/en, accessed on 29 July 2025). The GLASS FVC product (2000–present) uses image element dichotomy and machine learning algorithms to conduct precise vegetation estimation [33]. The FVC product provides 500 m spatial and 8-day temporal resolution and was downloaded from the website (https://www.glass.hku.hk/download.html, accessed on 29 July 2025). These products were developed under different retrieval philosophies and target vegetation conditions, which supports the use of multiple validation contexts in this study rather than a single unified benchmark.

3. Materials and Methods

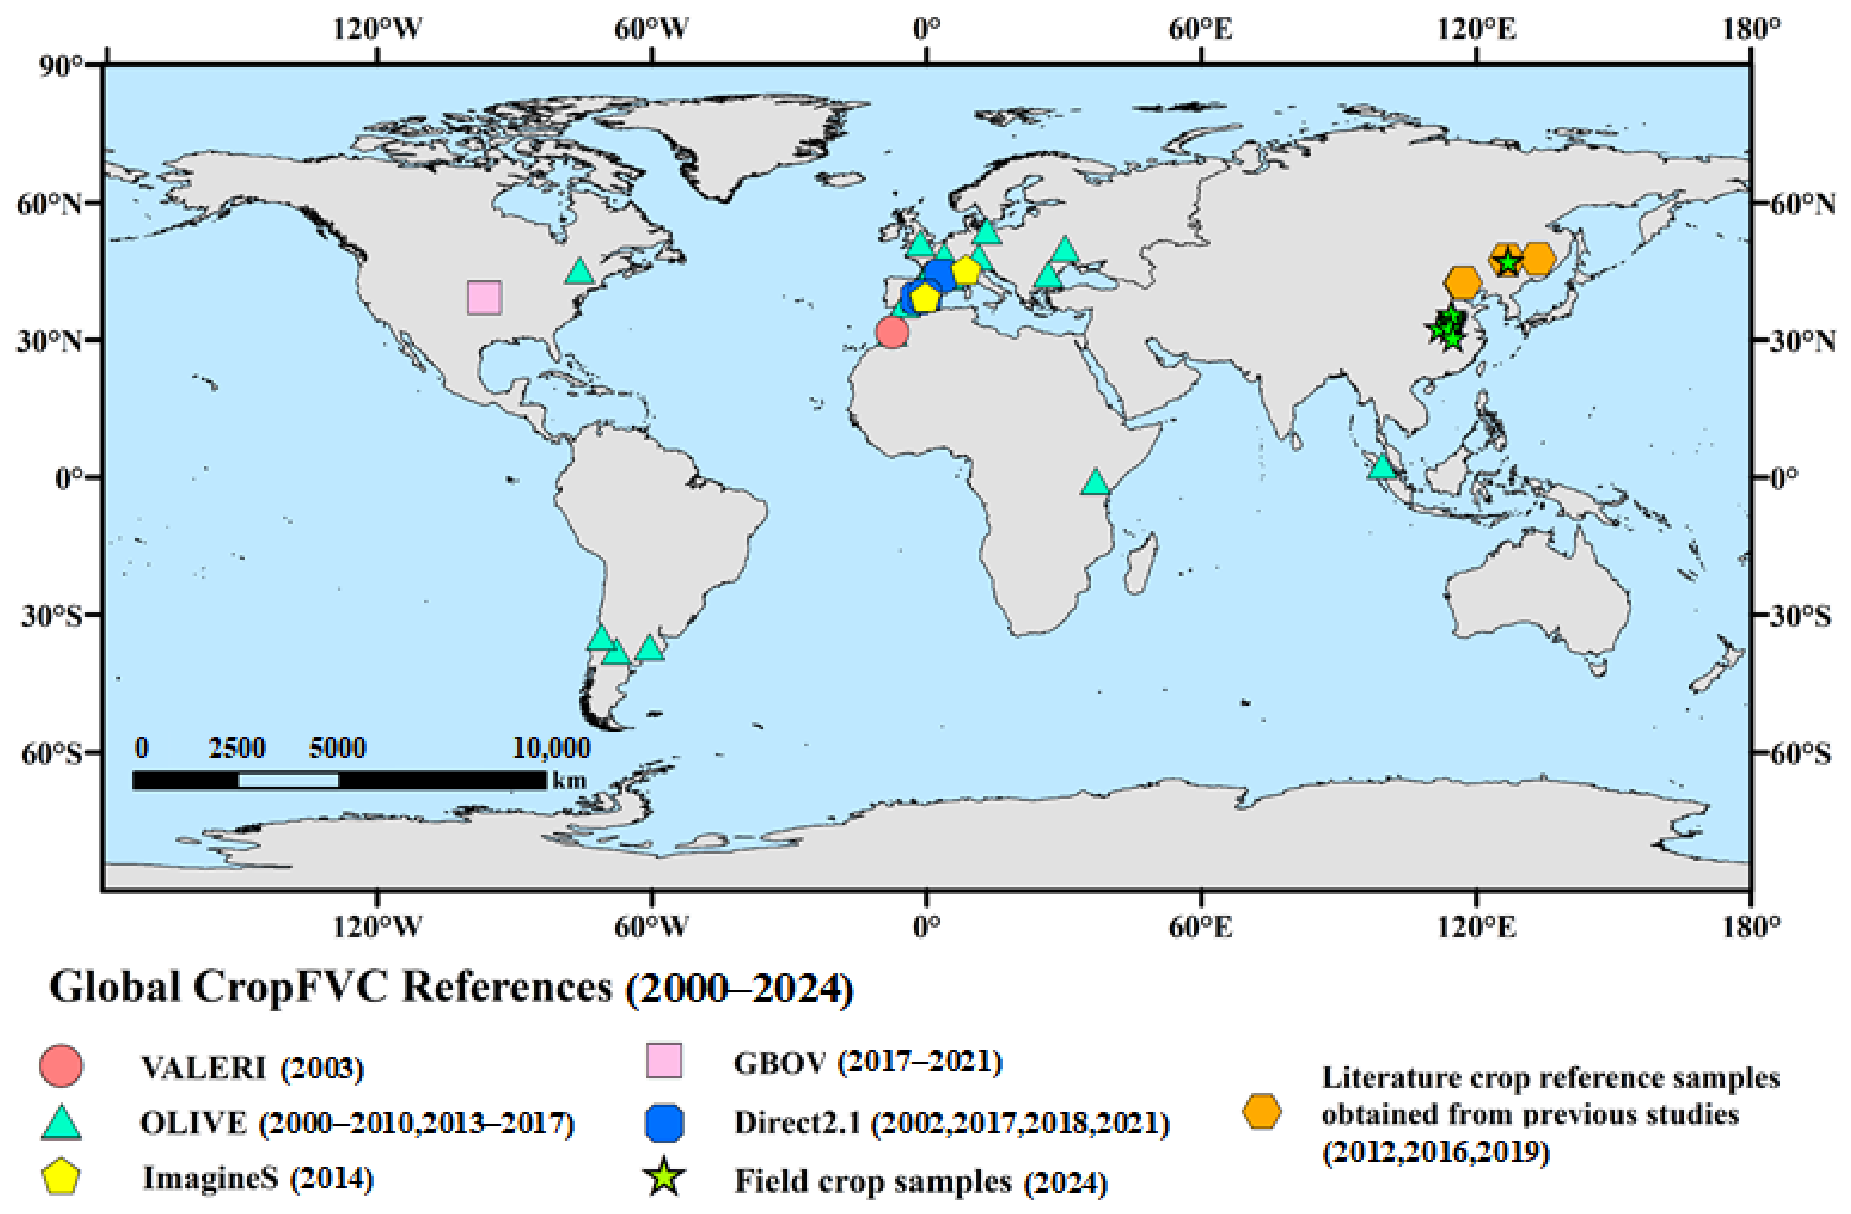
The compiled global CropFVC references (Figure 1) integrated samples from three sources. Specifically, the five publicly available global FVC reference datasets (DIRECT2.1, VALERI, ImagineS, OLIVE, GBOV) were originally downloaded from their official websites (Table A2). The publicly available field crop sites from the existing literature were obtained through academic databases. The pure CropFVC samples (soybean, maize, winter wheat, rice) from China’s main grain-producing regions were collected across a wide geographical range, using centimeter-level resolution UAV imagery and sub-meter resolution imagery from Jilin-1 satellite. Due to the heterogeneous origins of the reference datasets, this study does not assume a perfectly unified physical definition of FVC. Instead, the references are treated as context-dependent validation sources, and product behavior is examined relative to each reference condition. Differences in FVC definitions (e.g., green vegetation versus total vegetation, inclusion of senescent material) may introduce systematic shifts in absolute reference values and thus affect validation metrics such as RMSE and bias. However, such differences primarily act as magnitude offsets and are unlikely to alter the identification of consistent behavior patterns, including bias direction, relative product ranking, and cross-context consistency. This assumption underpins the design of the three validation datasets described below.
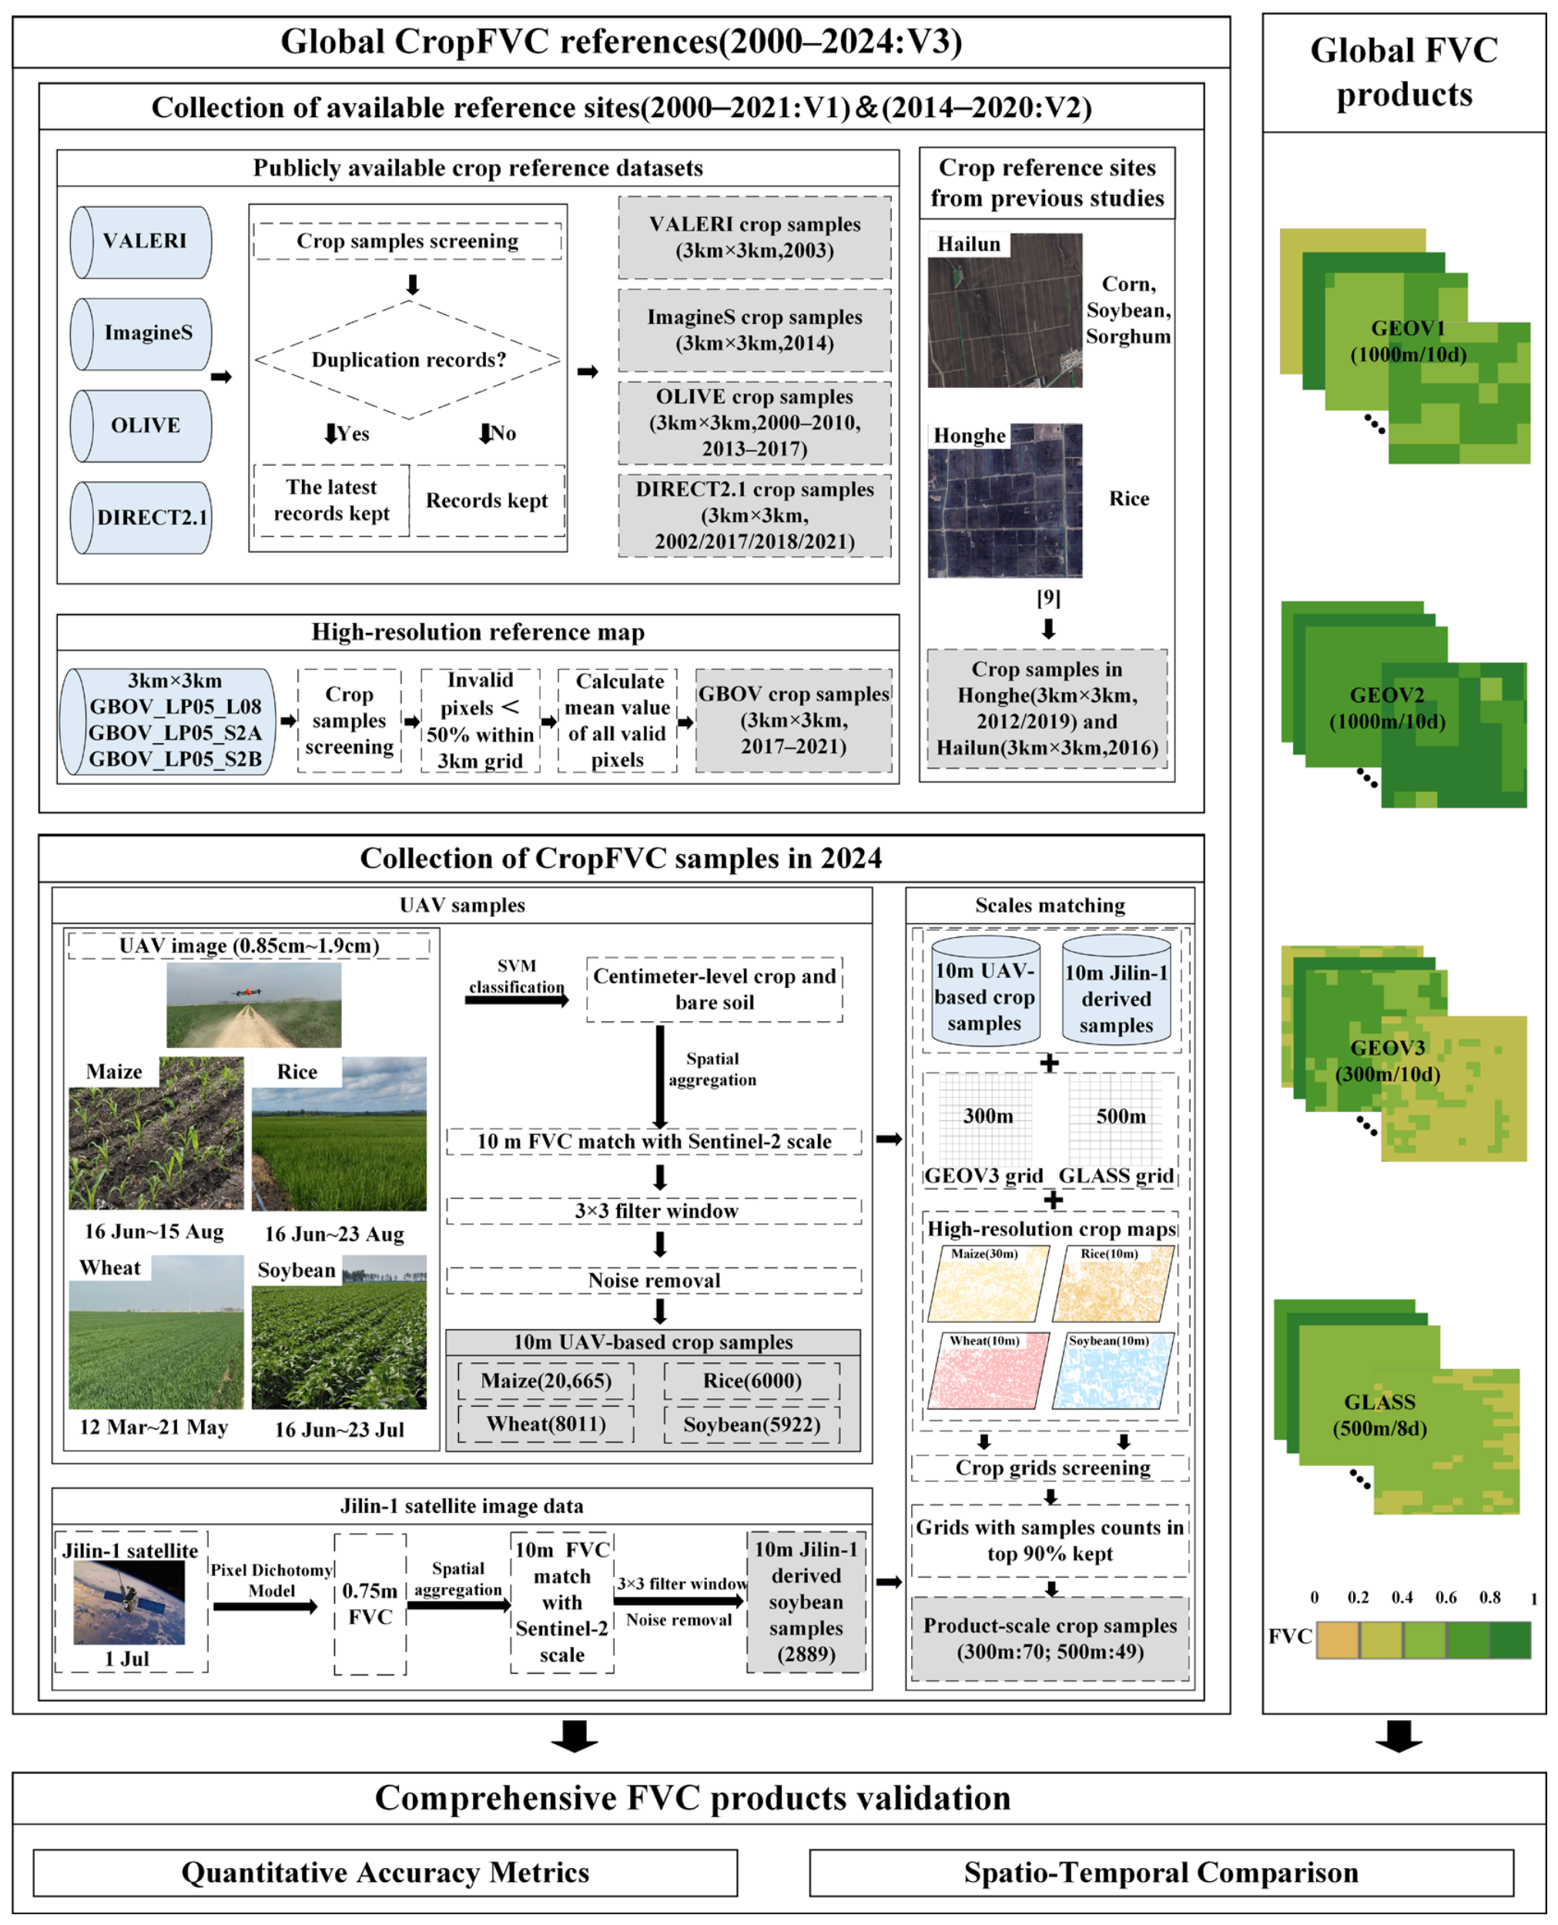
The compiled global CropFVC references from the three sources were then organized into three complementary validation datasets (V1~V3) to represent different reference conditions rather than independent experimental groups (Table 1). This design separates the influence of temporal coverage, reference heterogeneity, and crop-specific information when examining the behavior of global FVC products under diverse validation contexts. Validation Dataset V1 (2000~2021) represents long-term historical multi-source references with heterogeneous crop types, including 191 samples from the first two sources and primarily distributed across North America and Europe, Validation Dataset V2 (2014~2020) represents a coverage-consistent reference subset derived from the same sources as V1, comprising 124 samples restricted to locations where all four FVC products are simultaneously available. Validation Dataset V3 (2000~2024) represents an integrated global validation context that incorporates recent high-precision crop-specific observations, comprising 307 samples aggregated from all three reference sources. The data collection protocols and preprocessing workflows for the references and validation datasets are summarized in Figure 2.

3.1. Collection of Publicly Available Reference Sites

3.1.1. Global FVC Reference Datasets

The four global reference datasets with 3 km × 3 km sites are available for large-scale FVC validation: VALERI, ImagineS, OLIVE, and DIRECT 2.1 (More details are demonstrated in Table A2. Specifically, VALERI (2000–2006) [21] employed a cross-grid-transect sampling strategy to collect LAI-2000/hemispherical photography data. Sample FVC values were derived using empirical, non-parametric, and physically-based transfer functions, combining with ground-satellite co-kriging methods [21]. ImagineS (2014–present) [22] employed a stratified sampling strategy based on ESUs (Elementary Sampling Units, 10–30 m), deploying 30–50 non-boundary sites across Europe. Within each 3 km × 3 km site, 12–15 GPS-referenced gap fraction samples were collected and processed using CAN-EYE, and then upscaled to 10, 20, or 30 m resolutions vis physical-empirical transfer functions [22]. OLIVE (2000–present) integrated the BELMANIP and DIRECT 2.0 site networks to construct a global benchmark dataset, excluding regions with over 25% water bodies or sites spacing under 20 km [23]. DIRECT 2.1 (2000–2021) used 20 m × 20 m ESUs as the basic validation units to derive global samples, focusing primarily on Europe [24].
All the 3 km × 3 km sites were compiled into a structured CSV file including site name, country, coordinates, vegetation types, FVC value, and acquisition date. Since the four datasets partially overlap, duplicate samples with the same coordinates and dates were consolidated by retaining data from the most recently released reference datasets. Non-crop samples were then excluded based on vegetation type attributes. Among the remaining 3 km × 3 km crop sites, most are mixed-crops plantations. For example, VALERI includes one mixed crop sample (barley and wheat) from 2003. ImagineS provides five samples from 2014, including four pure rice samples and one mixed site (maize, soybean, and rice). OLIVE contains 69 samples (2000–2010, 2013–2017), featuring three pure alfalfa sites and one pure rice site; the rest are mixed crops such as oil palm, cereals, orchards, sunflower, maize, legumes, tubers, oil crops, fruits and vegetables, grapevines, and olives. DIRECT 2.1 adds four mixed crop samples (2002, 2017, 2018, and 2021) covering wheat, maize, soybean, rapeseed, sunflower, sugar beet, and potato.

3.1.2. High-Resolution Reference Map (GBOV)

The GBOV dataset (Table A2) provides FVC values at spatial resolution of 20 m and 30 m within 3 km × 3 km areas. Only 3 km × the 3 km sites with over 50% coverage of valid high-resolution FVC samples were retained, and their FVC values were calculated by averaging the high-resolution samples values within each site (Figure 2). Non-crop sites were then excluded by cross-checking the IGBP class attributes in the GBOV database and verifying site attributes, including dominant NLCD class and habitat types, from their own websites. Ultimately, the 3 km × 3 km KONZ site in the United States, comprising 90 time-series observations from 2017 to 2021, was retained. This site features mixed crop samples with annual rotation crop types, primarily including wheat, maize, sorghum, soybean, alfalfa, and oat.

3.1.3. CropFVC Samples from the Literature

To obtain more CropFVC samples, a limited number of publicly available datasets were collected; however, only the high-accuracy FVC dataset from Li [9] was retained after quality checks and attribute screening. It comprises 22 samples from two 3 km × 3 km sites in Northern China: Honghe (2012–2019), containing pure rice samples, and Hailun (2016), featuring mixed crops including maize, sorghum, and soybean.

3.2. Collection of CropFVC Samples in 2024

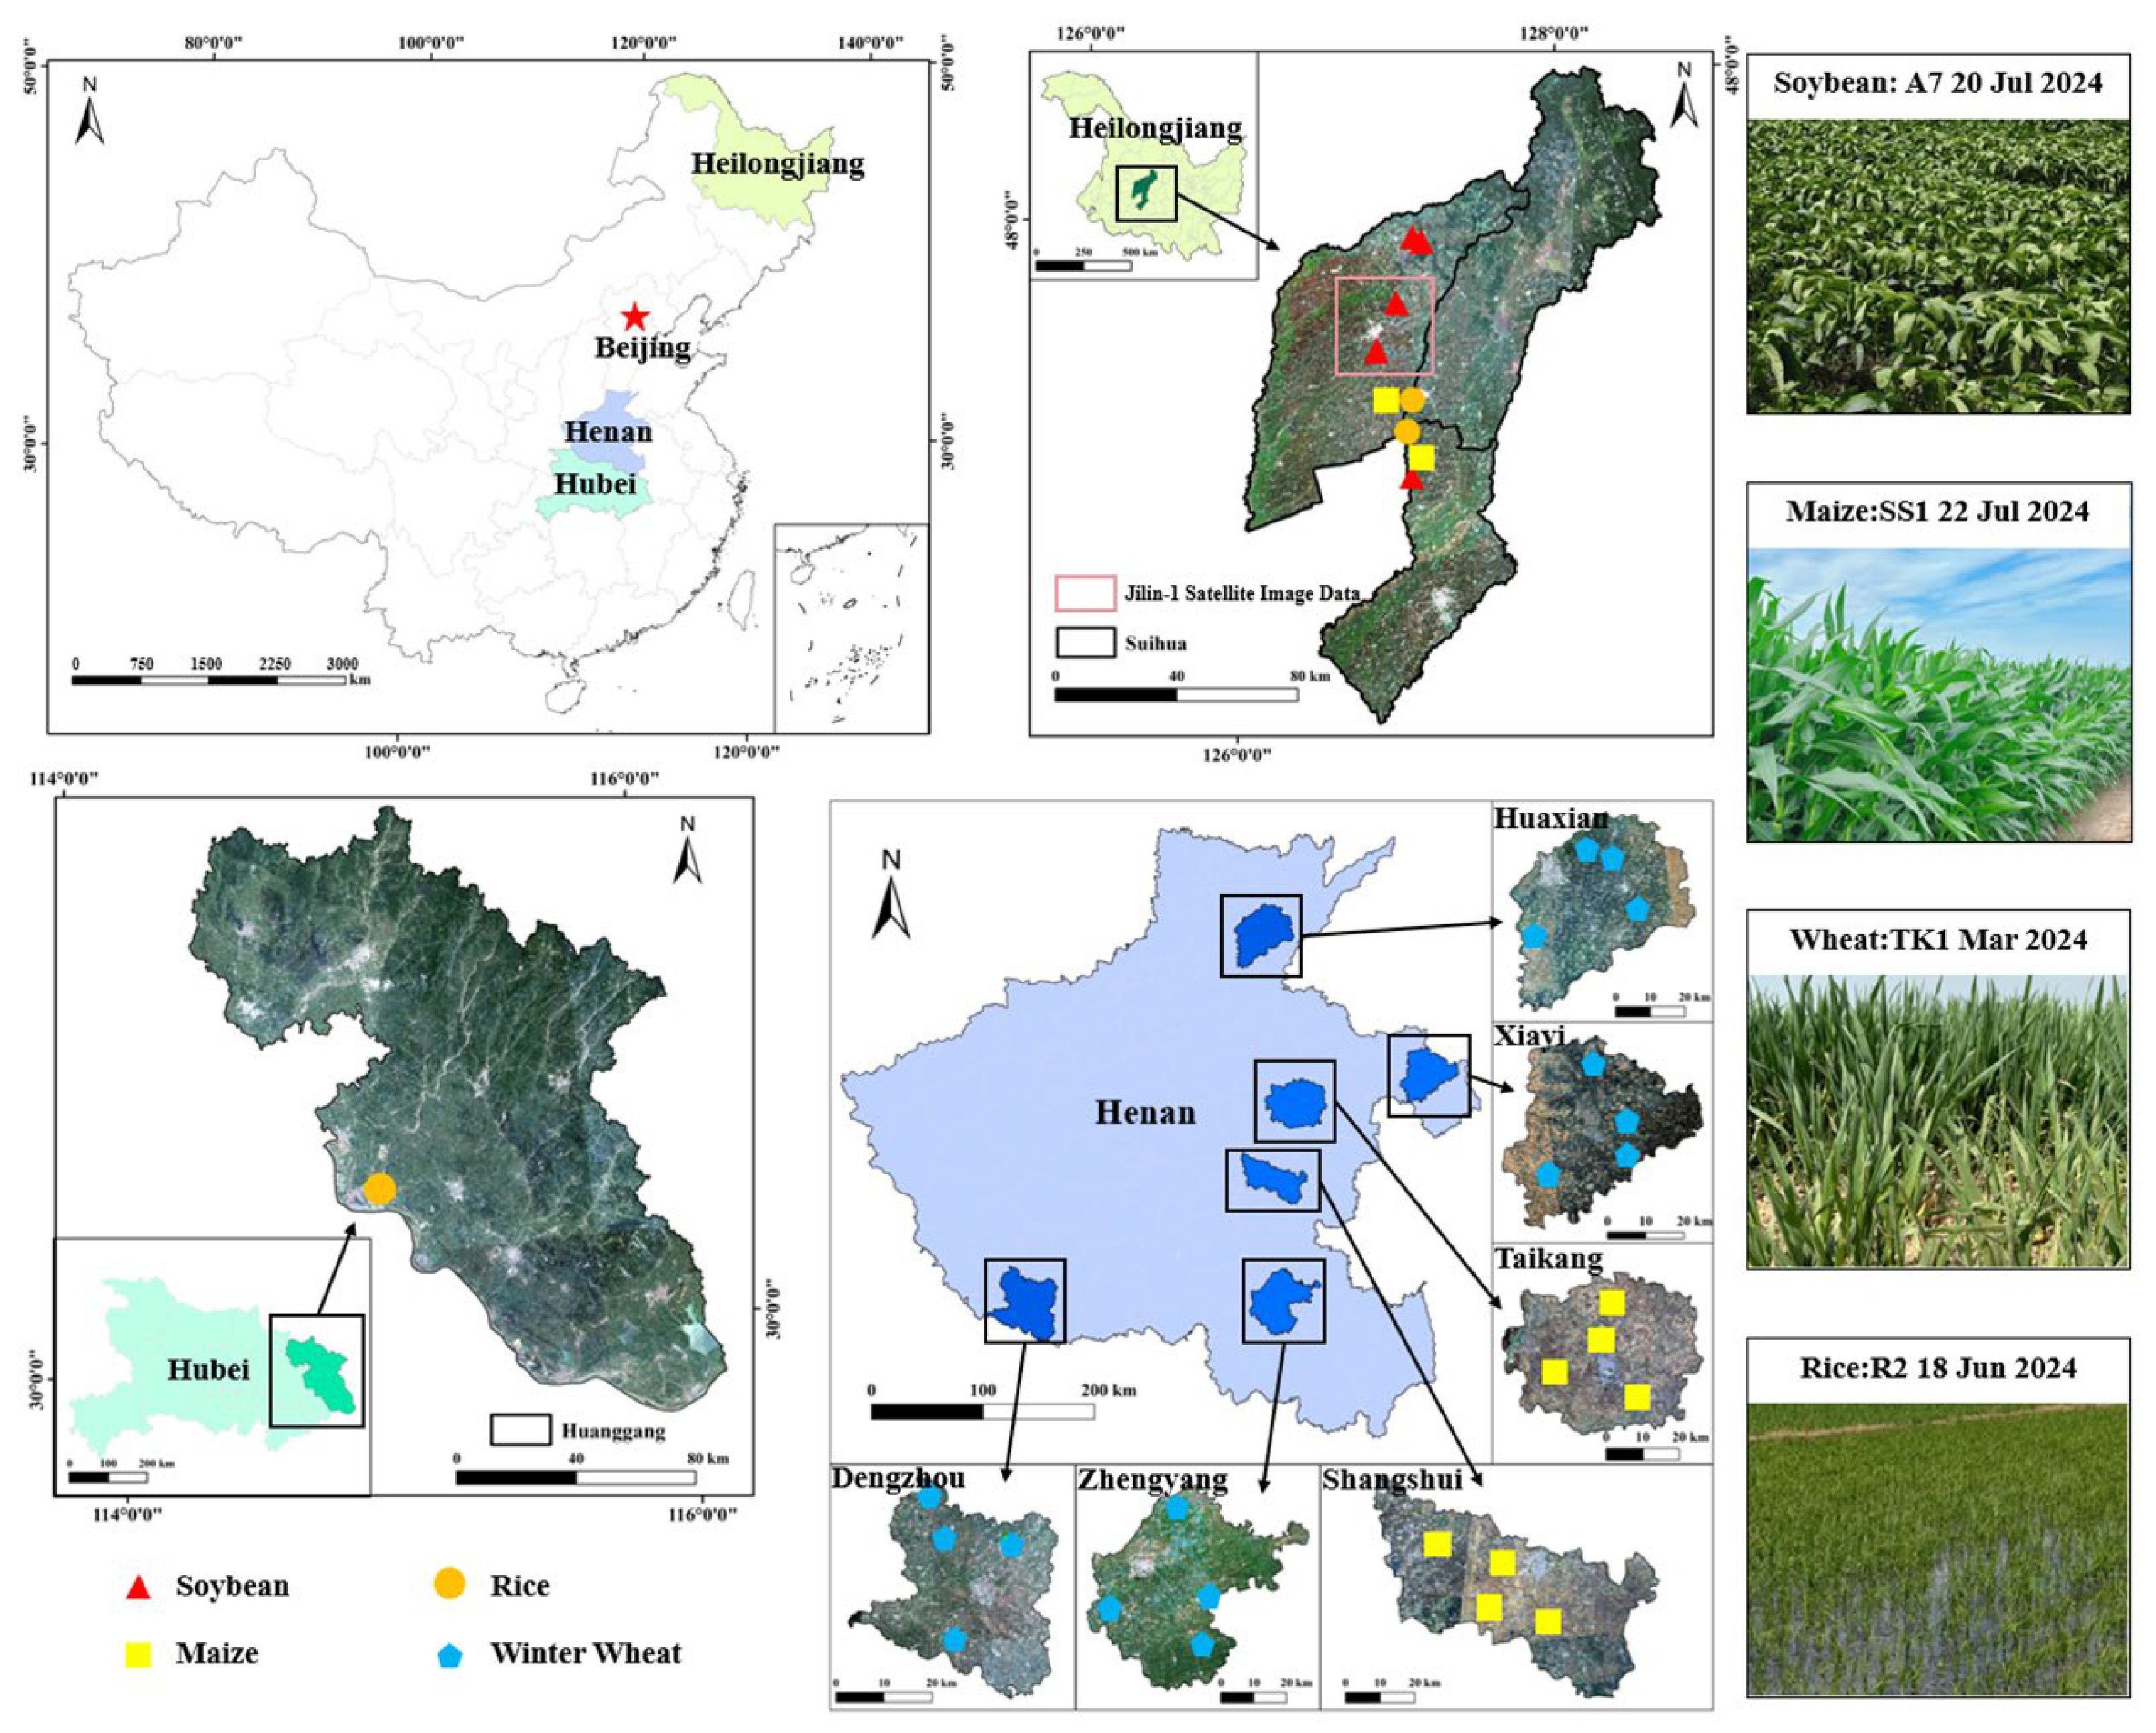
In the 2024 growing season, UAV-based CropFVC field sampling of maize, rice, winter wheat and soybean was conducted across China’s main grain-producing provinces, i.e., Heilongjiang, Henan, and Hubei (Figure 3). Additionally, high-resolution Jilin-1 satellite imagery (0.75 m) from 1 July 2024, was used to supplement mid-season soybean samples.

3.2.1. UAV-Based CropFVC Sampling

From March to August 2024, ten province-scale coordinated multi-site field experiments were conducted across China’s main grain-producing provinces (Table 1). All sites in these field areas were restricted to homogeneous cropland plots of at least 400 m × 400 m. A total of 96 UAV missions we conducted across 38 such sites, acquiring millions of high-resolution images. In Taikang County, five missions were performed within seasonal wheat–maize rotation fields.
The UAV mission aimed to acquire centimeter-resolution RGB and multispectral imagery using DJI Mavic 3E (M3E) (DJI, Shenzhen, China) and Mavic 3M (M3M) platforms (DJI, Shenzhen, China). The M3E is equipped with a 20 MP RGB camera capturing red, green, and blue bands, while the M3M integrates a 20 MP RGB sensor and a four-channel multispectral camera (5 MP per band) covering green, red, red-edge, and near-infrared wavelengths, enabling synchronous RGB and multispectral observations. All missions were conducted between 10:00 and 14:00 under clear, cloud-free conditions, thereby ensuring optimal solar elevation for the acquisition of high-quality data. To minimize edge effects in subsequent processing, the actual flight area was extended beyond the target plot by a minimum of 400 m × 400 m. Flight altitude was set to achieve centimeter-level spatial resolution, with flight parameters configured to 80% forward overlap and 70% side overlap. The spatial resolution of UAV raw images ranges from 0.85 to 1.90 cm for RGB and 1.44 to 3.25 cm for multispectral imagery. All data were preprocessed using the DJI Terra platform (V4.2.5), including radiometric and geometric correction and image mosaicking, creating a high-precision UAV-based crop observation database.
Based on the centimeter-level crop observation images, CropFVC samples at 10 m × 10 m Sentinel2-grids were derived using crop classification algorithms and statistical aggregation strategy. At each 400 m × 400 m site, a Support Vector Machine (SVM) classifier was first applied to UAV images to classify green crop and other pixels at centimeter resolution, using numerous manually selected high-confidence samples. To assess the reliability of the UAV-derived crop maps used for CropFVC sample generation, the SVM classification results were retrospectively evaluated using validation samples and visual interpretation. The overall classification accuracy ranged from 91.99% to 93.97% across the four crops, with Kappa coefficients ranging from 0.8255 to 0.8500. Specifically, the OA/Kappa values were 93.97%/0.8473 for maize, 92.09%/0.8255 for winter wheat, 92.53%/0.8500 for rice, and 91.99%/0.8340 for soybeans. These results indicate that the UAV-derived crop maps provide a reliable basis for extracting crop-specific FVC samples. The UAV-based crop maps were then aligned with 10 m × 10 m Sentinel-grids in a unified projected coordinate system; Finally, UAV-based CropFVC samples at 10 m resolution was derived through statistical aggregation following Equation (1):
F V C = N c r o p N c r o p + N o t h e r
where N c r o p denotes the amount of crop pixel counts in a 10 m × 10 m grid; and N o t h e r denotes the number of other kinds of pixel counts.

3.2.2. CropFVC Samples from Jilin-1 Satellite Imagery

At two 400 m × 400 m soybean sites in HaiLun, the 0.75 m Jilin-1 satellite image from 1 July 2024, was acquired and preprocessed using PIE-Ortho 7.0 platform to conduct radiometric calibration, MTF compensation, sensor correction, system geometry correction, and atmospheric correction [34]. Then, the Enhanced Vegetation Index (EVI) was calculated from the Blue, Red, and Near-Infrared bands of Jilin-1 imagery using Equation (2). CropFVC at 0.75 m resolution was subsequently derived using the pixel dichotomy model (Equation (3)). Because two UAV missions were conducted at these two soybean sites before and after the satellite image acquisition date (1 July 2024), we obtained high-precision pure vegetation (EVIv) and pure soil (EVIs) endmembers at 0.75 m, leveraging combination of visual interpretation and classification results from the centimeter-level UAV images. EVI was selected because it is less sensitive to soil background influences in row-crop systems, reduces saturation under dense canopies, and better decouples the canopy signal from atmospheric effects using the blue band [35,36,37].
E V I = 2.5 N I R R N I R + 6 R 7.5 B + 1
F V C = E V I E V I s E V I v + E V I s
The 0.75 m sub-meter CropFVC images were aligned with 10 m × 10 m Sentinel 2-grids using a unified projected coordinate system. CropFVC samples at 10 m resolution were then obtained by averaging all 0.75 m CropFVC values within each corresponding Sentinel-2 cell. Here, since the CropFVC was derived using a pixel dichotomy approach rather than discrete classification, conventional classification metrics such as OA and Kappa are not directly applicable. Jilin-1 imagery was used to supplement temporal gaps between two UAV campaigns when field UAV acquisition was not feasible. Although pixel-level validation of Jilin-1 FVC on the exact acquisition date was unavailable, UAV observations before and after the Jilin-1 acquisition over the same areas were used to support crop-type confirmation, temporal consistency checking, and sample screening. Together with crop distribution maps and visual interpretation, this procedure helped retain high-purity and temporally consistent crop samples for validation.

3.2.3. Construction of CropFVC Sample Database in 2024

Quality control procedures were applied to denoise and integrate the above sample data, producing reliable pure CropFVC samples at 10 m resolution. First, 10 m × 10 m cells containing extensive weed cover or other non-crop features, along with those severely affected by cloud contamination, were excluded through visual interpretation and imagery quality assessment. Then, Sentinel-2 NDVI was calculated for all sites and matched with the corresponding CropFVC samples. To mitigate misalignment caused by image scaling, a 3 × 3 moving average filter was applied simultaneously to both NDVI and CropFVC images. For each crop-specific sample dataset, NDVI values were grouped into 20 bins (0.05 each interval), with the top and bottom 5% in each bin removed as outliers. A linear regression between NDVI and CropFVC was then performed, and samples with large residuals (exceeding the 95th percentile of the crop-specific residual distribution) were removed as noises. Crop-specific noise thresholds were set as ±0.25 for winter wheat, ±0.10 for rice, ±0.15 for maize, and −0.10 to 0.06 for soybeans.
Following the above procedures, a 10 m pure CropFVC sample database was established, comprising 8662 winter wheat, 8074 soybean, 5945 rice, and 20,662 maize samples. The newly update database encompasses four reprehensive crops vital to global food security, containing FVC measurements at multiple key growth stages during 2024 growing season and spanning a wide geographical range across China. This database enriches existing global validation sample pools, strengthens global CropFVC validation, and offers valuable insights into the evaluation of FVC products. This database was subsequently integrated into the Validation Dataset V3 (2000~2024) through systematic spatial and temporal scale matching and alignment.

3.3. Spatio-Temporal Matching and Alignment

Temporal alignment was conducted based on the ‘closest date’ principle. Here, the FVC product observation closest to the sample acquisition date was selected, with a maximum allowable temporal difference of 14 days. In Validation Dataset V3 (2000–2024), the largest validation dataset, the average temporal difference between the FVC products and CropFVC samples was 2.39 ± 1.39 days (range: 0–5 days). The distribution is centered on 2 days (24.5%), and 76% of all matchups fall within 3 days. Only 7.6% of pairs reached the maximum temporal offset of 5 days. For the 2024 CropFVC samples specifically, the average difference was 2.28 ± 1.32 days (range: 0–5 days). These results indicate that, although a broader matching threshold was allowed to accommodate different temporal resolutions of the FVC products, most matched samples were temporally close to the product acquisition dates.
Due to temporal mismatch between acquisition periods of the four global FVC products and the various CropFVC references datasets, Validation Dataset V1 (2000–2021) and V2 (2014–2020) were used to assess all four products, while Validation Dataset V3 (2000–2024) was applied only to GEOV3 and GLASS. As V1 and V2 contain samples at 3 km × 3 km resolution, a downscaling procedure was applied to GLASS (500 m), GEOV1 (1 km), GEOV2 (1 km), and GEOV3 (300 m). All products were resampled to a unified 3 km × 3 km grid by generating vector grids centered on the same coordinates and calculating the mean FVC value within each cell, thereby ensuring scale consistency for validation.
For the 10 m pure CropFVC samples collected in 2024 and their corresponding GEOV3 and GLASS products, spatial matching was performed as follows. First, GEOV3 and GLASS grids for the 2024 sample sites were generated, and grids with target crop coverage exceeding two-thirds of the grid area were retained, using the newly updated high-resolution crop maps [38,39,40,41] as constraints (Table A3). Next, the product-resolution samples were obtained by averaging the 10 m FVC values within each retained 300 m or 500 m grid, with the upper/lower 10% (from residual analysis) excluded to minimize scaling uncertainties. These processes yielded 68 product-resolution CropFVC samples from 2024 for GEOV3 (rice: 4, winter wheat: 33, soybean: 8, maize: 23) and 48 for GLASS (rice: 4, winter wheat: 25, soybean: 8, maize: 11).
Although spatial aggregation may introduce some uncertainty due to nonlinear canopy reflectance and sub-pixel heterogeneity, mean aggregation was applied as a pragmatic approach to preserve dominant crop signals under realistic observation conditions and to maintain consistency across products with different spatial resolutions, aligning with the validation-oriented objective of this study. This strategy is particularly suitable for croplands, where row structures and heterogeneous soil backgrounds introduce additional sub-pixel variability compared with natural vegetation. To examine the sensitivity of the validation results to the aggregation method, we further compare mean and median aggregation. The comparison was used to assess whether the validation metrics and main product behavior patterns were affected by the choice of aggregation strategy. Th results showed only minor differences in validation metrics, with unchanged relative product ranking and bias patterns, indicating that the main conclusions were robust to the aggregation method.

3.4. Comprehensive Validation of FVC Products

3.4.1. Quantitative Accuracy Metrics

Five commonly used metrics were employed to evaluate and compare the performances of four global FVC products over crops: root mean square error (RMSE), the coefficient of determination (R2), Bias, mean absolute error (MAE), and relative bias (rBias). The calculation formulas are as follows:
R M S E = 1 N i = 1 N F V C t i F V C p i 2
R 2 = ( i = 1 N F V C p i F V C p ¯ F V C t i F V C t ¯ ) 2 i = 1 N F V C p i F V C p ¯ 2 i = 1 N F V C t i F V C t ¯ 2
B i a s = F V C p F V C t
M A E = 1 N i = 1 N F V C t i F V C p i
r B i a s = B i a s F V C t ¯
where F V C p i represents the FVC value obtained from the FVC product, and F V C t i denotes the corresponding FVC value from the validation sample.

3.4.2. Spatio-Temporal Comparison

Using the time-series CropFVC records from the KONZ site in the GBOV database, the four products were compared over the same period (2017~2020) to assess their temporal performances during the whole crop growing season. Tiled FVC maps of the four products within the 3 km × 3 km KONZ site area was analyzed to further evaluate their ability to capture spatial details in representative crop fields.

4. Results

4.1. Global Validation Patterns Across CropFVC Reference Contexts

Across the three validation contexts, the four global FVC products exhibited several consistent behavior patterns despite differences in reference composition and temporal coverage. Systematic overestimation was commonly observed under high-coverage crop conditions, while product differences became more evident when crop-specific high-resolution references were incorporated. Rather than representing independent experiments, Validation Datasets V1~V3 provide complementary perspectives on how reference heterogeneity and crop purity influence product behavior. The following subsections therefore describe product responses under historical multi-source references (V1~V2) and under the integrated crop-specific validation context (V3).

4.1.1. Behavior Under Historical Multi-Source References (V1~V2)

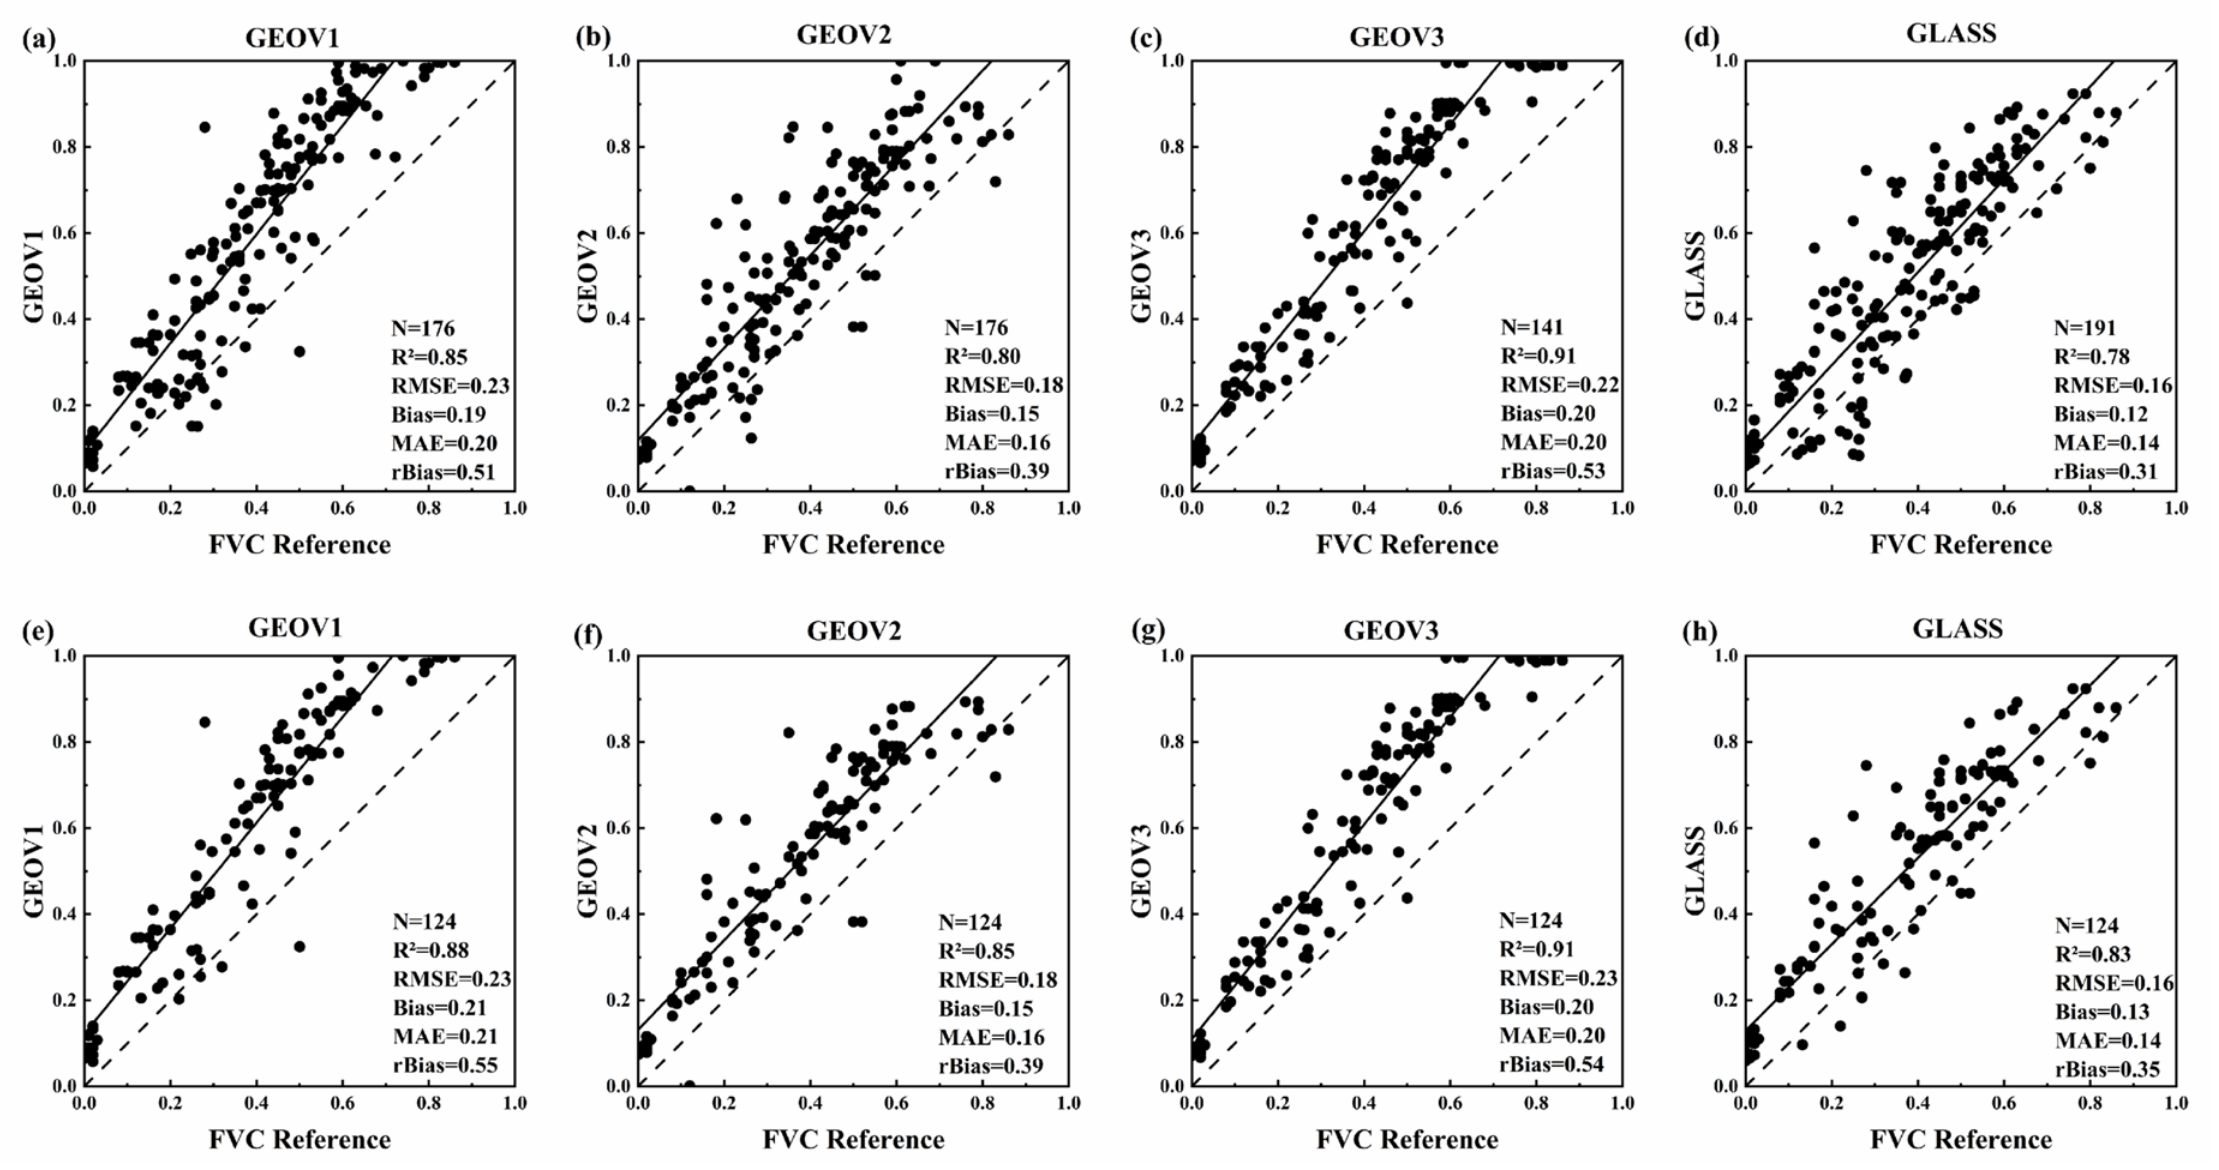
Based on the 191 mixed CropFVC samples from Validation Dataset V1 (Figure 4a–d), all four products exhibited consistent behavior characterized by systematic overestimation, particularly under high-coverage crop conditions. This pattern became more evident during the nearly mature growth stage, when GEOV3 and GEOV1 estimates frequently approached the saturation upper limit of 1. This indicates a shared saturation tendency under high-FVC conditions. At lower FVC levels, the scatter distributions of all products became more compact and aligned more closely with the 1:1 line, suggesting that differences among products were less pronounced under sparse canopy conditions. The heterogeneous nature of the historical multi-source references further contributed to variability in the scatter distributions. This was reflected by the wider spread of GEOV2 estimates within the 0.2~0.4 reference range.
Quantitatively, these behavior patterns are reflected in the reported metrics, with GLASS FVC showing lower RMSE values (RMSE = 0.16, R2 = 0.78, bias = 0.12), while GEOV1 exhibited comparatively larger deviations (RMSE = 0.23, R2 = 0.85, bias = 0.19). GEOV2 and GEOV3 displayed intermediate behavior, with GEOV2 showing slightly lower RMSE than GEOV3 (0.18 vs. 0.22).
When evaluated using the 124 mixed CropFVC samples from Validation Dataset V2 (Figure 4e–h), the overall scatter patterns remained consistent with those observed in V1, but with reduced dispersion and closer alignment to the 1:1 line. The persistent overestimation observed for GEOV1 and GEOV3 in the high-FVC range suggests that saturation effects are primarily related to product algorithm characteristics rather than reference uncertainties. This is supported by the observation that identical reference values produced similar bias patterns across products. The corresponding quantitative metrics again reflect this behavior, with GLASS maintaining relatively lower RMSE (0.16) and GEOV1 showing larger deviations (RMSE = 0.23), while GEOV2 and GEOV3 exhibited comparable intermediate behavior. Stratified evaluation across different FVC ranges (0~0.3, 0.3~0.8, and 0.8~1.0) further confirmed that product differences varied with crop-cover level. In the low-FVC range (0~0.3), GEOV3 achieved the lowest RMSE in both V1 and V2 (0.142 and 0.145, respectively). In contrast, GLASS consistently showed the best performance under medium- and high-FVC conditions, with RMSE values of 0.169 in the 0.3~0.8 range and 0.041 in the 0.8~1.0 range.

4.1.2. Behavior Under Integrated Crop-Specific Validation (V3)

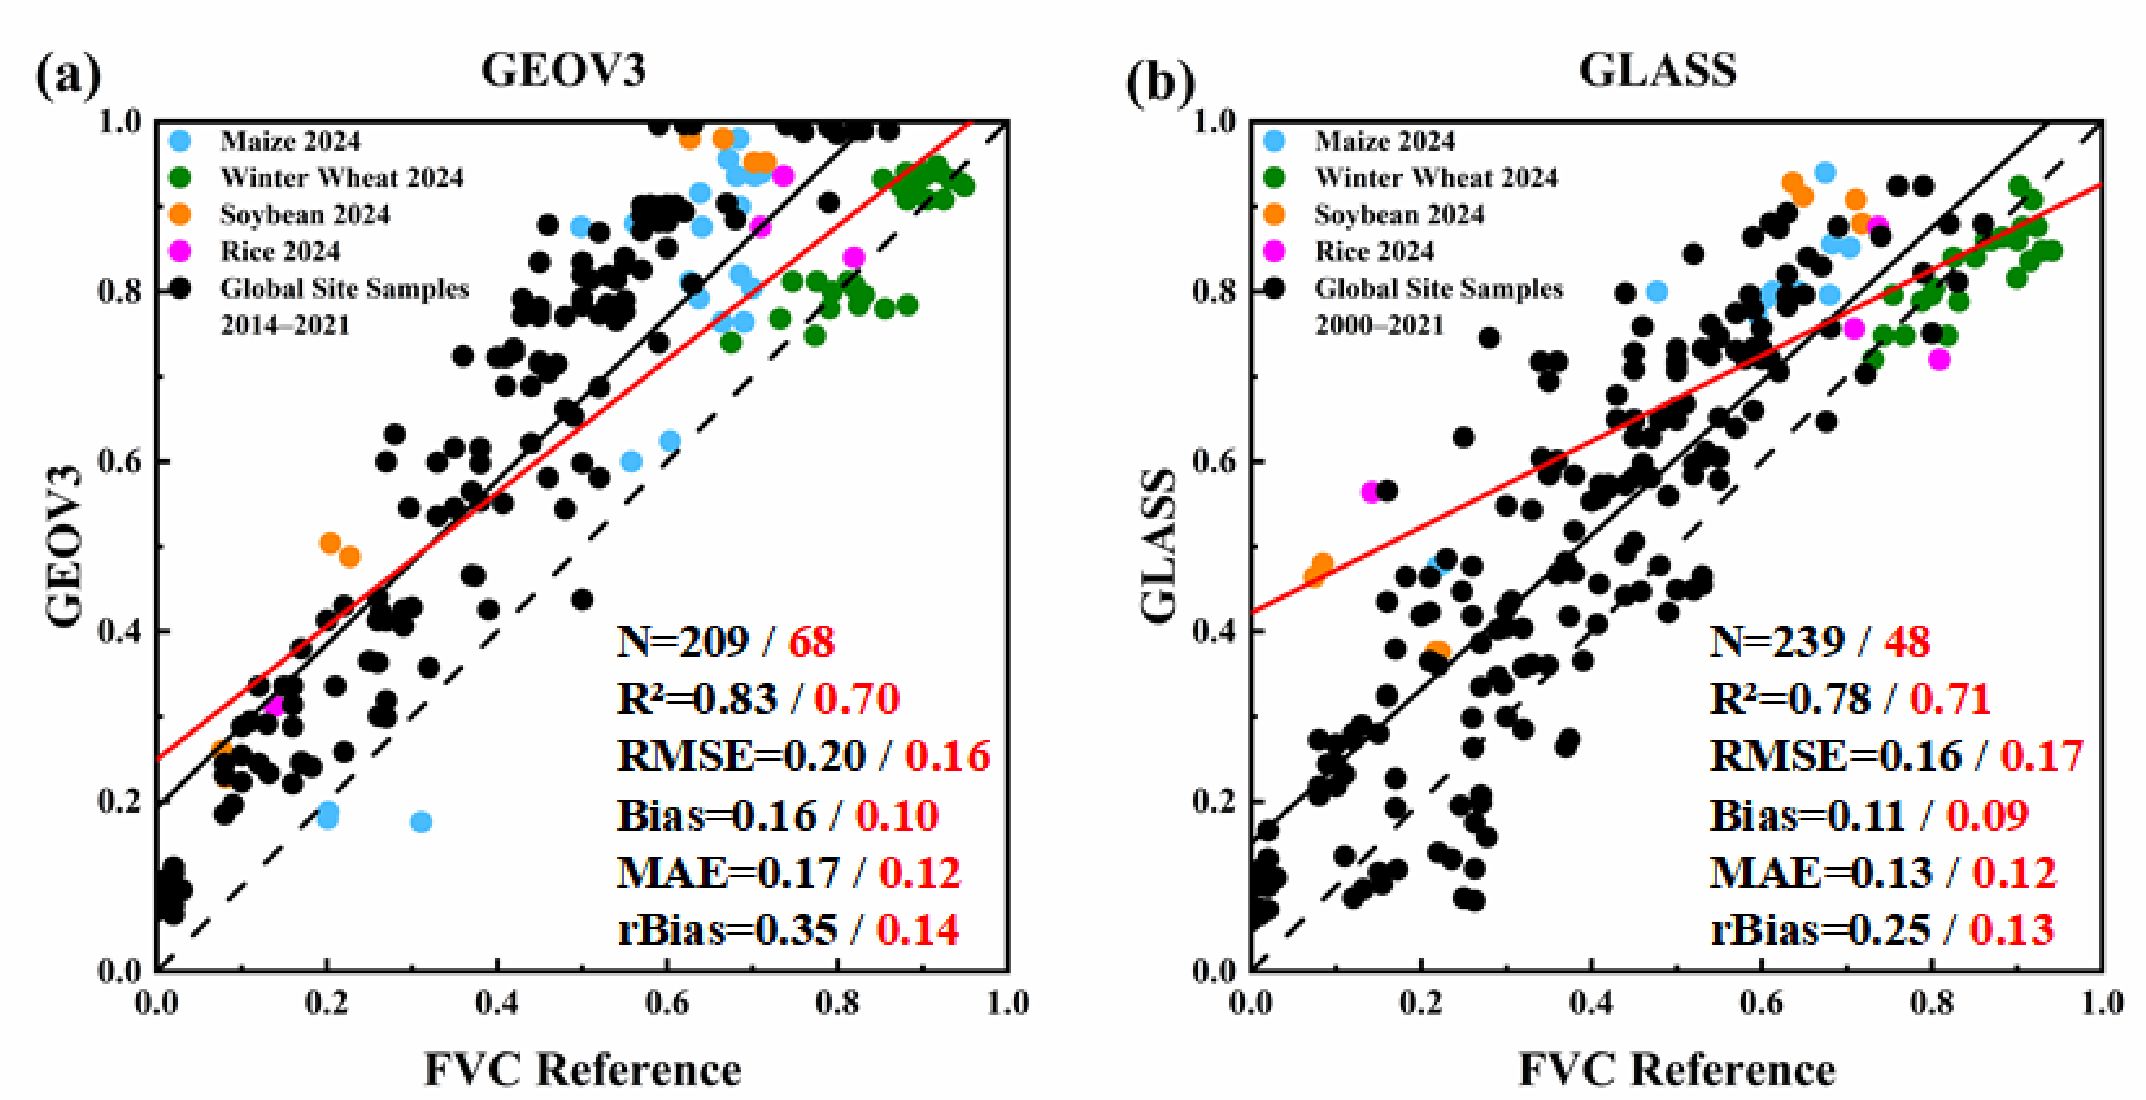
Validation Dataset V3 integrates historical mixed CropFVC references (black points in Figure 5) with scaled, product-resolution pure crop samples collected in 2024 (colored points in Figure 5), providing a crop-specific validation context distinct from the historical datasets. GEOV1 and GEOV2 were not included in V3 because their available records end before 2020 and do not overlap with the newly collected 2024 CropFVC samples; therefore, V3 was used only for GEOV3 and GLASS. Under this integrated reference condition, both GLASS and GEOV3 exhibited systematic overestimation patterns similar to those observed in V1~V2 (see Section 4.1.1), while the inclusion of recent pure crop samples reduced overall scatter and improved alignment with the 1:1 line. These consistent behavior patterns suggest that the incorporation of crop-specific observations primarily influences data dispersion rather than fundamentally altering product bias characteristics.
The corresponding evaluation metrics reflect these patterns, with GLASS showing relatively lower RMSE values (RMSE = 0.16, R2 = 0.78, bias = 0.11) and GEOV3 exhibiting slightly larger deviations (RMSE = 0.20, R2 = 0.83, bias = 0.16). Comparison between V1 (Figure 4c,d) and V3 (Figure 5a,b) indicates modest improvements in RMSE and bias for both products after incorporating the 2024 CropFVC samples, supporting the reliability and representativeness of the newly introduced references. Stratified evaluation further showed that similar FVC-level patterns were observed in V3. Under high-FVC conditions (0.8~1.0), GLASS maintained lower RMSE than GEOV3 (0.050 vs. 0.070), whereas GEOV3 showed relatively better performance under low-FVC conditions (0.148 vs. 0.175).
More importantly, the crop-wise analysis based on the 2024 samples revealed structured differences among crop types that were not evident under historical mixed references. Based on the crop-wise RMSE and bias analysis, it suggested a preliminary crop-dependent retrieval pattern, with predictive difficulty generally following the order of winter wheat > maize > rice > soybean, highlighting crop-specific sensitivity in FVC retrieval. Under this crop-oriented validation context, GEOV3 exhibited relatively stable behavior for rice and maize, while GLASS maintained more consistent performance across temporal sample distributions (∆RMSE: 0.01 vs. 0.04; ∆bias: 0.02 vs. 0.04). These findings indicate that differences between products become more structured when evaluated using crop-specific references rather than heterogeneous historical datasets. However, this pattern should be interpreted cautiously because the product-resolution sample sizes were limited for some crops, particularly rice (n = 4) and soybean (n = 8) for GEOV3.

4.2. Spatio-Temporal Behavior at the KONZ Site

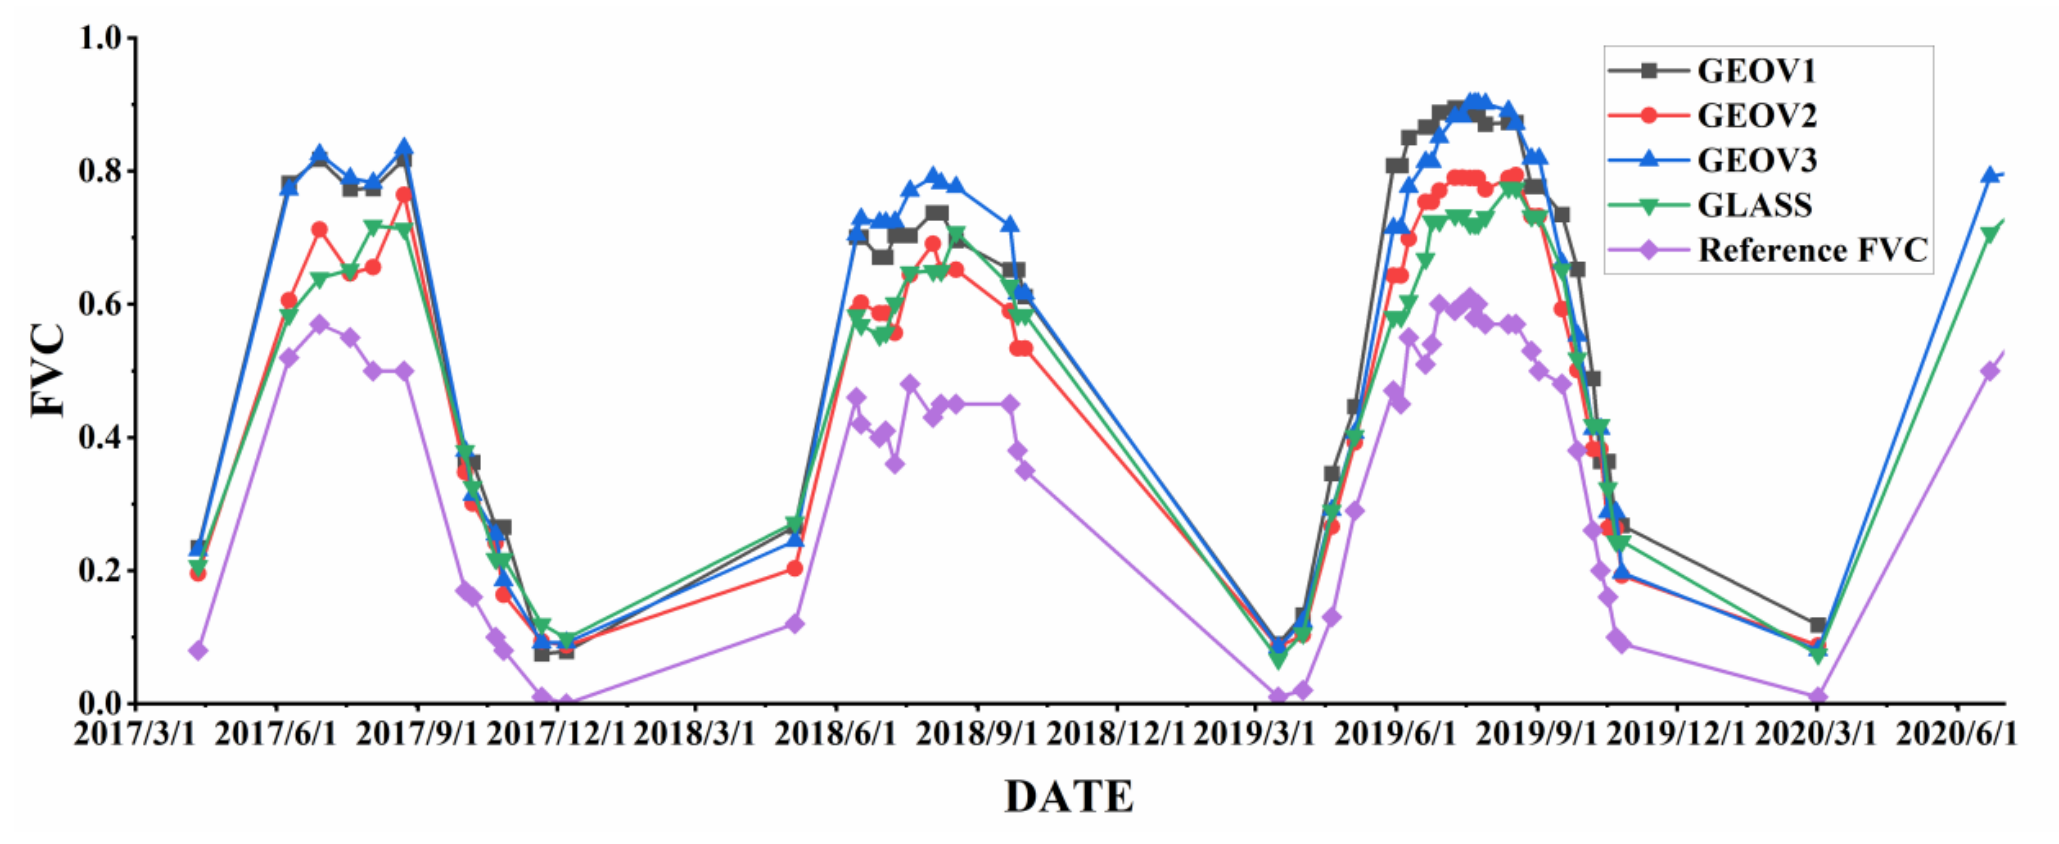
Figure 6 illustrates the temporal behavior of the four global FVC products during the 2017–2020 crop growing seasons at the KONZ site, based on time-series CropFVC records from the GBOV database. This site-based validation provides an independent spatio-temporal perspective to examine whether the behavior patterns identified in the global validation datasets persist at the seasonal scale. Over all years, the four products exhibited broadly consistent seasonal trajectories, capturing the overall phenological development of crops. A shared characteristic among products was the systematic overestimation relative to reference values, which became increasingly pronounced during peak canopy development. In contrast, differences among products were relatively small under low-FVC conditions, where all products closely followed the reference dynamics. These temporal patterns are consistent with the behavior observed across validation contexts in Section 4.1.
Although product trajectories were generally similar, subtle differences emerged in their temporal responses. GEOV2 and GLASS displayed comparable seasonal dynamics, while GEOV1 and GEOV3 followed similar temporal patterns with more pronounced deviations during periods of high canopy density. Rather than indicating isolated product errors, these deviations suggest a common saturation-related response under dense crop conditions.
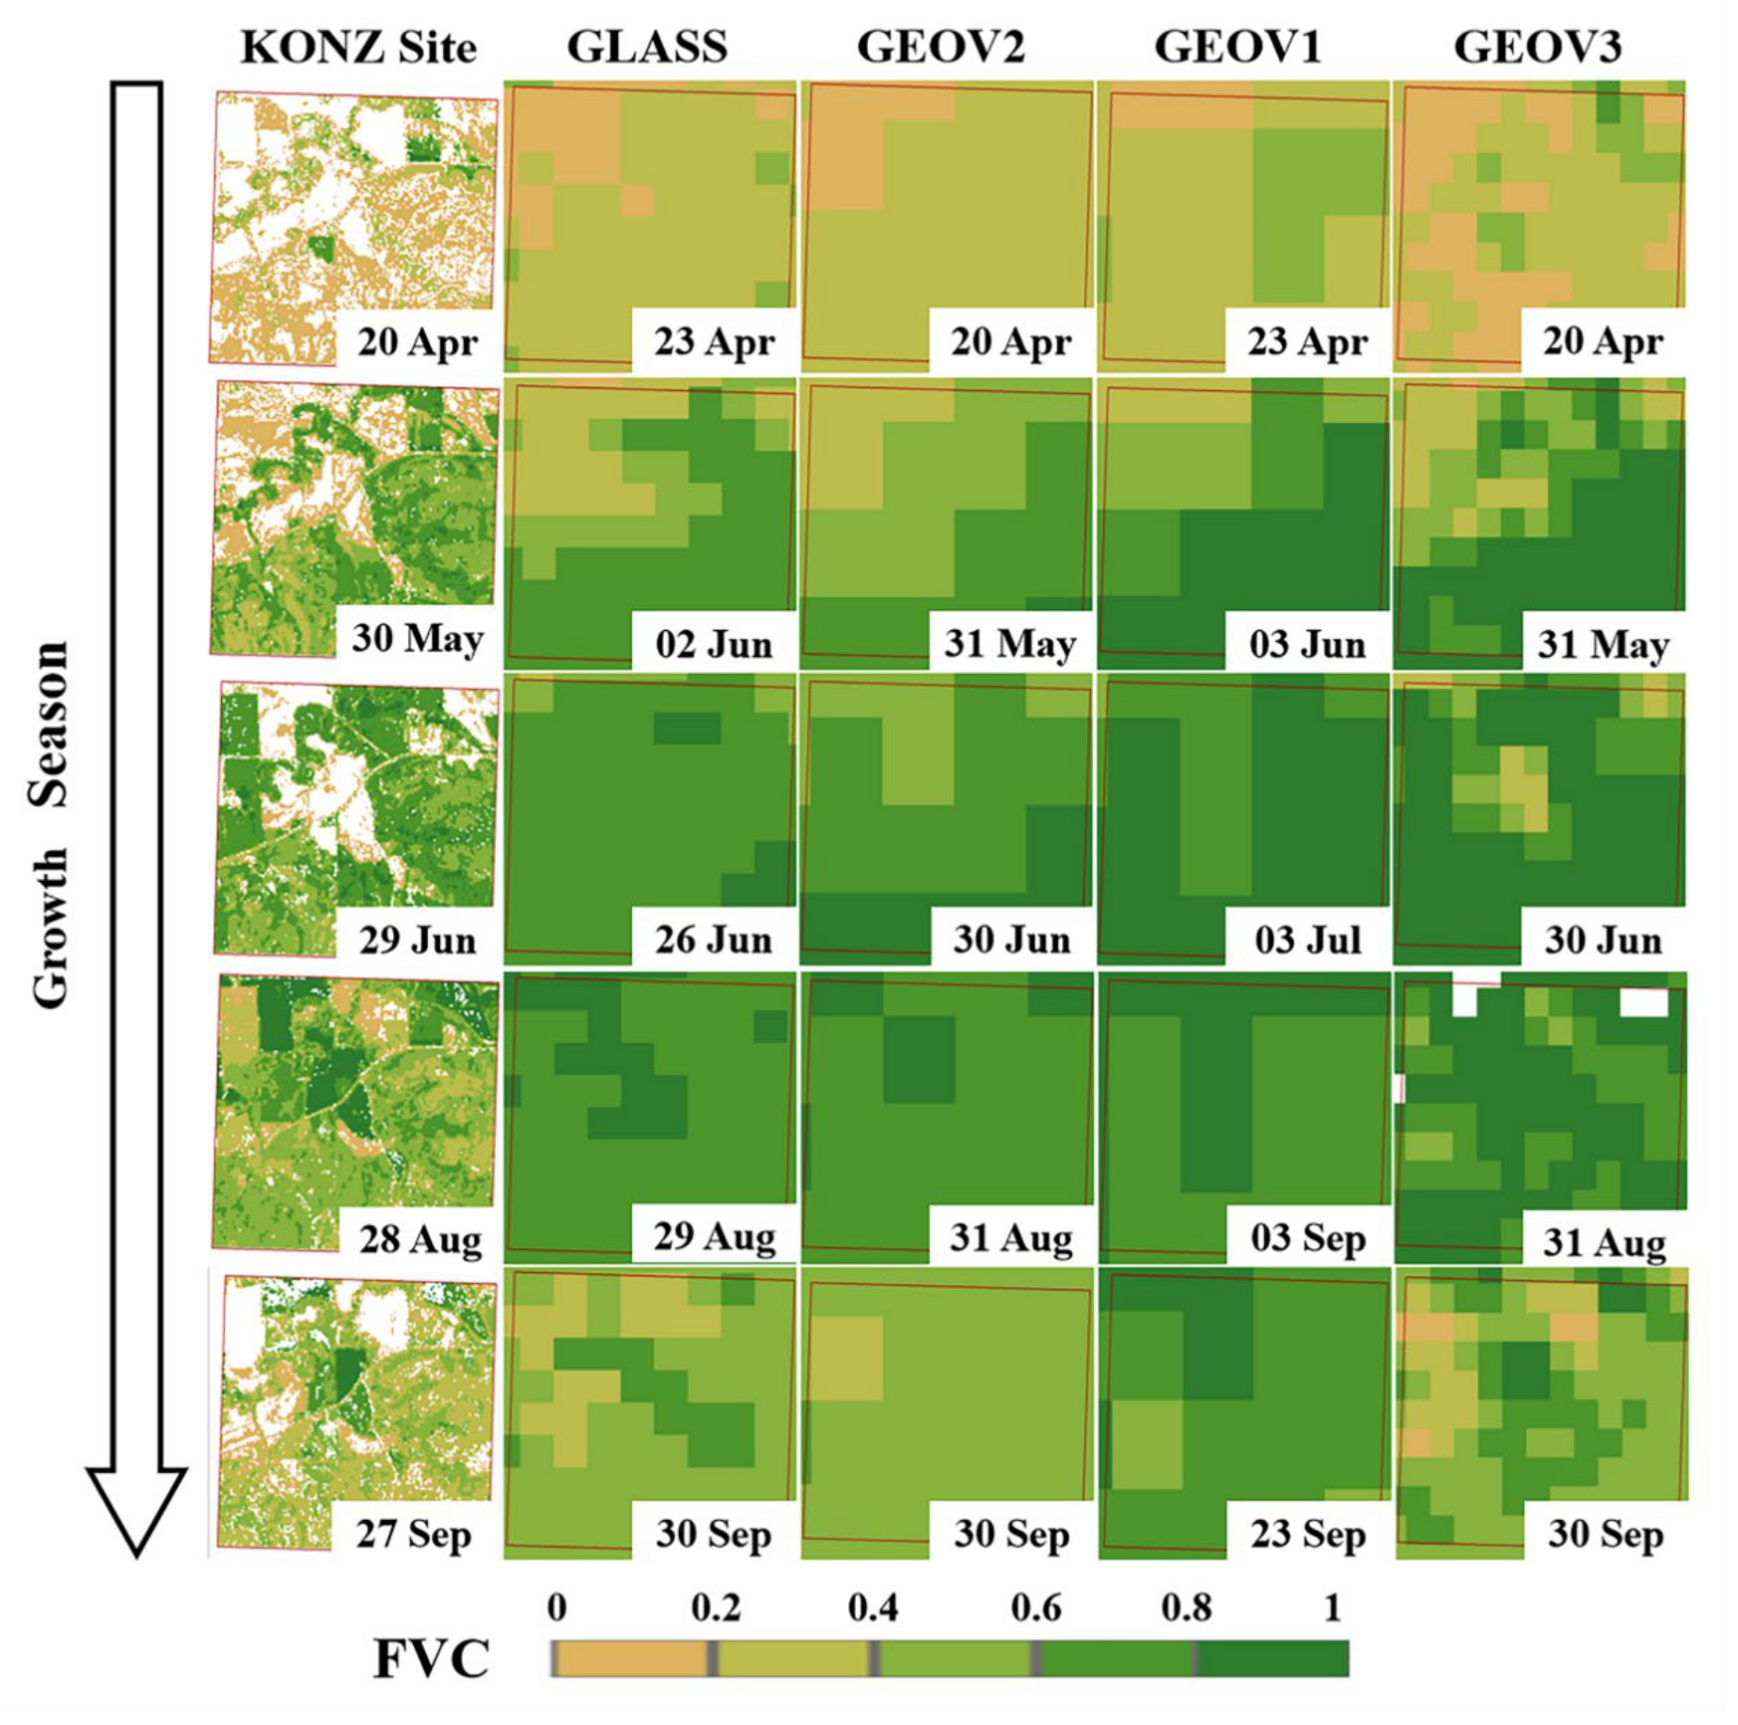
Given the greater availability of FVC observations and corresponding product acquisitions in 2019 (Figure 6), tiled FVC maps of the four products at the KONZ site were used to visually examine their spatial behavior at five key growth stages during that year (Figure 7). GBOV S2A high-resolution for 20 April, 30 May, 29 June, 28 August, and 27 September served as fine-scale references. These dates were selected based on the crop growth curves shown in Figure 6.
The results reveal the following: (1) All four products reproduced the overall spatial structure of the agricultural landscape, while GEOV3, benefiting from its finer spatial resolution, captured more detailed spatial variations within fields; (2) Differences among products became more apparent during the reproductive period, when higher reference FVC values amplified systematic overestimation patterns across products. For example, localized overestimation occurred in the southeast region for GEOV1 (3 June) and GEOV3 (31 May), whereas GLASS and GEOV2 maintained more moderate spatial responses during these periods. Overall, the spatial analysis supports the interpretation that high-FVC overestimation reflects product behavior under dense canopy conditions rather than isolated site-specific anomalies.

5. Discussion

5.1. Behavior Patterns of Global FVC Products over Crops

Previous studies have reported overestimation of FVC products under dense vegetation conditions, particularly when canopy cover approaches saturation [18,42,43]. However, most of these observations were derived from single-product evaluations or limited validation crop sites. It remains unclear whether such overestimation reflects product-specific limitations or represents a broader characteristic shared among global FVC retrieval approaches. The multi-context validation conducted in this study provides a broader perspective by examining multiple global FVC products under different CropFVC reference conditions. Importantly, although reference definitions differ, the consistent high-FVC overestimation across V1~V3 indicates that this pattern reflects robust product behavior rather than a dataset-specific effect. The consistent overestimation observed in this study might be partially explained by the interaction between the design of current global FVC retrieval schemes and the structural characteristics of crop canopies [27]. Croplands are typically characterized by row structures, variable planting densities, and heterogeneous soil backgrounds, which introduce pronounced sub-pixel variability when observed by moderate-/coarse-resolution satellite sensors [44,45]. Under such conditions, retrieval algorithms trained using generalized vegetation structural representations may have difficulty accurately capturing the spatial heterogeneity of crop canopies. This limitation becomes more evident when vegetation cover approaches its upper range. Under such conditions, the contribution of soil background diminishes and spectral signals become less sensitive to further increases in canopy density, increasing the uncertainty in retrieved canopy fraction. The GLASS FVC is estimated using a multivariate adaptive regression spline algorithm with high-quality Landsat TM/ETM+ train samples, where MODIS surface reflectance and derived spectral features are used as predictor variables [32,46]. In contrast, the GEOV FVC products adopt a hybrid architecture based on neural network trained with corrected CYCLOPES FVC samples products [10,18,47]. Although these products employ different retrieval strategies, both retrieval frameworks rely on global trained relationships and generalized vegetation structural representations. Consequently, similar limitations may emerge when these models are applied to crop-dominated landscapes where canopy structure and background conditions differ from those represented in the training datasets [12]. In addition to algorithmic factors, observational and scaling-related effects may also contribute to the overestimation, including illumination geometry [48], soil background treatment [49], residual phenological mismatch errors, and sub-pixel heterogeneity in coarse-resolution pixels. Together, these factors interact with retrieval algorithms, particularly under dense crop canopies, thereby contributing to the observed high-FVC overestimation.
Although GLASS consistently achieved the highest accuracy among the four widely used FVC products, consistent with previous local-scale findings [18,27,43,50], similar overestimation patterns were observed across different retrieval frameworks. This suggests that the bias is not solely associated with a specific algorithm. Instead, it likely reflects a common challenge in retrieving canopy fraction from coarse-resolution satellite observations over structurally heterogeneous cropland environments. Although KONZ represents a temperate crop-rotation system rather than all global croplands, its high-FVC overestimation pattern is consistent with the broader V1~V3 results, indicating that this behavior is not specific to the KONZ site. These findings indicate that the current global FVC products still face difficulties in balancing spatial resolution, retrieval stability, and crop structural representativeness. Future improvements may benefit from incorporating crop-specific canopy structural information and high-resolution validation data into global FVC retrieval frameworks.

5.2. Validation Implications of Integrating Recent High-Resolution CropFVC Samples

Although ground photography remains the most common traditional method for FVC sampling [20,50], its limited coverage, high labor cost, and access constraints [5,51] make it unsuitable for validating coarse-resolution products (>300 m). It is also impractical for nationwide crop sampling across major grain-producing regions of China, where overlapping crop seasons require extensive field campaigns. UAV-based FVC sampling has been widely adopted in previous FVC estimates and sampling studies [52,53] and showed high consistency with values obtained from ground photography [54]. Using UAV, we addressed these challenges and carried out ten province-scale campaigns cross multiple crops, growth stages, and regions, establishing a unique CropFVC sample dataset for China.
Here, the 2024 samples provide new validation insights, across both GEOV3 (300 m) and GLASS (500 m), we consistently observe the crop-wise accuracy ranking as wheat > maize > rice > soybean. The primary, shared driver is scale: in the study area, at 300/500 m, wheat and rice are typically cultivated in large, contiguous blocks that yield high-purity pixels. In contrast, maize and especially soybean occur in more fragmented mosaics with intercropping/rotation and frequent adjacency to bare-soil or road, which amplifies mixed-pixel issue and bias FVC retrievals. Product-specific mechanisms reinforce this pattern. GEOV3 inherits its production chain from earlier GEOV products, which relies on generalized canopy representations and does not explicitly incorporate crop-specific canopy structure parameters. While the performance of GLASS FVC is highly sensitive to training-sample representativeness and pixel purity, its accuracy varies across crops. Generally, wheat tends to have broader and more geographically diverse high-resolution training coverage and more homogeneous fields, yielding better-conditioned mapping. In contrast, soybean in the sampling area often has comparatively sparser, more geographically concentrated, and more heterogeneous training instances (and lower 500 m pixel purity), which degrades generalization and increases errors.
It is also observed that global FVC products exhibited different generalization behaviors across multi-year datasets, with GLASS demonstrating greater overall robustness. Meanwhile, GEOV3 showed its advantage in some crop-specific performance (rice and maize), evidenced by crop-wise RMSE and bias based on the 2024 samples. Here, independent fits could not be established for specific crops due to limited sample sizes (<10), particularly for rice and soybeans. The crop-wise retrieval pattern should therefore be regarded as preliminary, as limited sample sizes for some crops may affect the stability of crop-specific RMSE and bias estimates. In Figure 5, it is noteworthy that only a limited number of samples fall within the low-FVC range in the 2024 dataset. Consequently, uncertainties in this range should be interpreted cautiously. At low canopy cover, weak crop signals combined with stronger background contributions may amplify mixed-pixel effects, which could partly explain the larger overestimation observed for GLASS in this range. By contrast, product performances in the high-FVC range are more reliable, as stronger crop signals reduce mixed-pixel interference. In this range, GEOV3 consistently exhibits greater overestimation than GLASS, both in the historical global references and in the newly added 2024 samples (Figure 4 and Figure 5).
Overall, the newly collected 2024 CropFVC samples exhibit distributions consistent with the historical global references, indicating their representativeness for cropland validation. By integrating UAV-derived samples and Jilin-1 satellite imagery, this study enriched the existing global CropFVC references and provided additional evidence for evaluating global FVC products over croplands. The expanded reference database offers an updated validated resource for future studies on global crop FVC retrieval and product assessment.

5.3. Limitations and Future Outlook

Several limitations were outlined as follows: First, although this study substantially expanded the available CropFVC sample size, notable gaps in spatial and temporal coverage remain. Spatially, Oceania is unrepresented, South American samples are concentrated in the south, African data are limited to Kenya, and key crop-producing regions such as Ukraine and Brazil have low sample density. In terms of temporal coverage, data are sparse before 2013 and in the years 2022~2023. Furthermore, this study was limited to four global FVC products (with 2024 data only for GLASS and GEOV3) and focused solely on crop accuracy. These highlight the need for future work to expand spatiotemporal sampling and incorporate new high-resolution FVC products for more comprehensive evaluation.
Second, this study linked validation samples from eight independent datasets to FVC products using mean aggregation for spatial matching and a ‘closest date’ principle (±5 days) for temporal alignment. Sensitivity analyses indicate that temporal matching and aggregation choices did not substantially alter the main conclusions, however, inherent uncertainties remain due to differences in spatial and temporal resolutions among samples and products. At the spatial level, global site data were represented as the mean within a 3 km × 3 km grid, exceeding the resolution of the four target products and potentially introducing point-to-area scale mismatch bias. This bias was evident in GEOV1 validation, where differences in the number of 1 km pixels within each 3 km window affected the mean calculation and reduced matching accuracy; likewise, even when using updated high-resolution crop maps to control aggregation, fine-scale UAV data (10 m) may still lose spatial heterogeneity when aggregated to match coarser products. At the temporal level, the ±5-day matching window, chosen to balance product data availability and reliable comparison, may introduce systematic bias because rapid crop phenological changes within this period can affect the consistency between site observations and product values. These spatial and temporal uncertainties highlight inherent challenges in site-to-product validation. Future work may reduce these mismatches through improved scale-aware conversion strategies and more consistent canopy structural measurements, which would further strengthen crop-oriented validation frameworks.

6. Conclusions

Understanding the behavior of global FVC products over crops remains challenging due to fragmented validation references and the limited availability of crop-specific observations. By integrating multiple global public datasets, existing literature, and newly collected 2024 UAV- and Jilin-1-derived CropFVC samples from China, this study proposes a multi-context validation framework to interpret the behavior of global FVC products (GLASS, GEOV1, GEOV2, and GEOV3) under heterogeneous CropFVC reference conditions. The main conclusions are as follows:
(1) Across validation contexts V1~V3, the validation contexts, all four products exhibited comparable accuracy ranges, with RMSE values generally between 0.16 and 0.23. A consistent tendency toward overestimation was observed when crop canopy cover approached high values (exceed ~0.8), while differences among products became less pronounced in the low-FVC range.
(2) Spatio-temporal analysis at the KONZ site further confirmed that peak-season deviations represent a shared behavior among global FVC products rather than isolated algorithm-specific issues. Moreover, GLASS and GEOV2 had the closest agreement with the reference, with GLASS FVC values most closely matching. Deviations were most pronounced at high FVC values, where all products showed overestimation as the reference values increased.
(3) The 2024 samples provided preliminary evidence of crop-dependent retrieval difficulty, with predictive performance general following the order of wheat > maize > rice > soybean. This pattern should be further evaluated by using larger product-resolution crop samples in future studies. The results also revealed cross-year generalization differences between GEOV3 and GLASS, highlighting GEOV3’s class-specific advantages versus GLASS’s overall robustness. These findings indicate that current FVC products in crop-specific estimation and emphasize the need to develop dedicated crop-specific FVC models.
By integrating reference data from eight independent sources, this study expands existing global CropFVC references and provides an updated validation perspective for evaluating global FVC products over croplands. These findings highlight the importance of crop-oriented validation frameworks and suggest that future improvements in global FVC retrieval may benefit from incorporating crop-specific canopy structure information and higher-resolution reference observations.

Author Contributions

Conceptualization, L.X. and H.W.; Methodology, L.X., Y.Q., J.Z., T.C. and Q.J.; Software Y.Q.; Validation, L.X., Y.Q., J.Z. and H.M.; Formal analysis, L.X., Y.Q., J.Z. and H.W.; Investigation, L.X., Y.Q., J.Z. and H.M.; Resources, L.X., T.C., Q.J. and H.W.; Data curation, L.X.; Writing—original draft, L.X. and Y.Q.; Writing—review & editing, L.X., T.C., Q.J. and H.W.; Visualization, L.X., Y.Q.; Supervision, L.X., T.C. and H.W.; Project administration, T.C. and H.W.; Funding acquisition, L.X. and H.W. All authors have read and agreed to the published version of the manuscript.

Funding

This study was funded by the National Key R&D Program of China (2023YFB3906202), the National Natural Science Foundation of China (41701474 and U23A2020), and the Hubei Provincial Natural Science Foundation of China (2024AFA032).

Data Availability Statement

The GEOV series products were obtained from the Copernicus Land Monitoring Service portal. The GLASS FVC product was downloaded from the website (https://www.glass.hku.hk/download.html, accessed on 29 July 2025). The global CropFVC reference dataset compiled in this study, including samples aggregated to 300 m and 500 m spatial resolutions, will be publicly released upon acceptance of the manuscript through an open-access repository.

Acknowledgments

The authors are grateful to the anonymous reviewers for their constructive criticism and comments. We sincerely thank Sijia Li (Hunan University of Science and Technology) for his valuable discussions on the GBOV datasets, which provided helpful insights for this study.

Conflicts of Interest

The authors declare no conflicts of interest.

Appendix A

Table A1. Several global/regional FVC products.
ProductsSensorsSpatial CoverageTemporal CoverageSpatial/Temporal ResolutionCropFVC Estimation AccuraciesData Accessibility
Woody vegetation coverLandsat5 TM,
Landsat7 ETM+
Australia2000–201030 m/-——tony.gill@environment.nsw.gov.au
HJ-1 FVCMODIS, HJ-1China201030 m/15 d——muxihan@bnu.edu.cn
Hi-GLASS FVCLandsat8 OLI, GF-2China2013–present30 m/15 d——http://higlass.whu.edu.cn/ (accessed on 9 February 2025)
GLASS FVCLandsat TM/ETM+,
MODIS
Global2000–present500 m/8 dRMSE = 0.087;
Bias = 0.049 [45]
https://www.glass.hku.hk/download.html (accessed on 29 July 2025)
AVHRRGlobal1981–20205000 m/8 d——
CYCLOPES fCoverSPOT VGTGlobal1999–20071000 m/10 d——http://postel.mediasfrance.org/
ENVISAT fCoverMERISEurope2002–2012300 m/10 d——baret@avignon.inra.fr
LSA SAFMDFVCSEVIRI, AVHRREurope, Africa, South America2004–2015, 2017–present3000 m/daily——https://lsa-saf.eumetsat.int/en/data/products/vegetation/ (accessed on 29 July 2025)
MTFVC/ETFVCGlobal2004/2015–present3000 m, 1000 m/10 d
CGLOPS FCoverGEOV1SPOT VGT, PROBA-VGlobal1999–20201000 m/10 dRMSE = 0.20;
Bias < 0.01 [15]
https://land.copernicus.eu/en (accessed on 29 July 2025)
GEOV2SPOT VGT, PROBA-VGlobal1999–20201000 m/10 dRMSE = 0.20;
Bias = −0.06 [15]
GEOV3PROBA-V,
Sentinel 3/OLCI
Global2014–present300 m/10 dRMSE = 0.161;
STD = 0.161;
Bias = −0.005 [16]
MuSyQ FVCGF-1 WFV, MODISChina,
Global
2001–201916 m/10 d, 500 m/4 d——https://www.geodata.cn/data/index.html?word=MuSyQ%20FVC (accessed on 29 July 2025)
GVCFPMODISGlobal2001–present500 m/monthly, 8 d——https://thredds.nci.org.au/thredds/catalog/tc43/modis-fc/v310/tiles/catalog.html (accessed on 29 July 2025)
MUSESMODIS, VIIRSGlobal2000–20195000 m, 1000 m, 500 m, 250 m/8 d, monthly.
30 m/16 d, monthly
——https://muses.bnu.edu.cn/cpxz/FVCcp/ (accessed on
29 July 2025)
Table A2. Collection and construction of four publicly available crop reference data.
DatasetSpatial CoverageTemporal CoverageSpatial ResolutionCollection of Ground DataConstruction of FVC Reference SamplesData Accessibility
VALERIGlobal (multiple ecosystems) 2000–20063 km
  • LAI-2000/hemispherical photography
  • collected in cross/square/transect patterns across 3 km × 3 km sites [21].
FVC references derived via transfer functions (empirical/non-parametric/physical) with co-kriging of ground-satellite data [21]http://w3.avignon.inra.fr/valeri/
(accessed on 29 July 2025)
ImagineSGlobal (especially Europe) 2014–present3 km
  • Stratified land cover sampling of 30–50 non-boundary ESUs (10–30 m) per 3 km × 3 km
  • collecting 12–15 GPS-georeferenced gap fractions (DHP/LAI-2000) per unit [22]
Derived as gap fraction model (0–10° zenith), CAN-EYE processed, and upscaled via empirical/physical transfer functions with 10/20/30 m satellite data (e.g., SPOT, Landsat-8) [22]http://fp7-imagines.eu/
(accessed on 29 July 2025)
OLIVE FVCGlobal (standard sample sites)2000–present3 km
  • BELMANIP network (371 sites) integrates DIRECT/FLUXNET/AERONET
  • excluding >25% water bodies or <20 km spacing [23]
ECOCLIMAP integrates latitude-stratified surface types (grass/crops/forests) to resolve under-representation of bare soils and evergreen broadleaf forests [23]https://calvalportal.ceos.org/web/olive/site-description
(accessed on 29 July 2025)
DIRECT2.1Global (especially Europe) 2000–20213 km
  • FRM4VEG: 20 m × 20 m ESUs
  • FAPAR from DHP gap fractions and CCC via SPAD-502 (spectrophotometric-calibrated) [24]
Gap fraction model (0–10° zenith); DHP-derived green fraction (±10° zenith) via soil/senescence classification [24]https://calvalportal.ceos.org/lpv-direct-v2.1
(accessed on 29 July 2025)
GBOVGlobal (especially in North America)2013–present30 m, 20 m
  • Cross-patterned DHP (12 images/ESU) in 20–40 m ESUs
  • Nikon fisheye DSLR, with exposure/perpendicularity control [25]
FVC (LP-5): Upscaled RM-4 via transfer functions (Sentinel-2/Landsat 8), outputting 20m/300m products with uncertainty [25]https://land.copernicus.eu/global/gbov/dataaccessLP/
(accessed on 29 July 2025)
Table A3. Generation of 2024 10-m CropFVC samples and derivation of 300m/500m CropFVC samples.
Crops Collection of Ground DataGeneration of 10 m FVC High-Res Crop Maps for Aggregation ConstraintConstruction of FVC Reference Samples300 m FVC Samples 500 m FVC Samples
Rice UAV (0.85~1.90 cm for RGB; 1.44~3.25 cm for multispectral)① SVM classification to derive crops at centimeter-scale resolution
② Spatial aggregation to derive 10 m FVC on pixel-to-polygon grids generated from Sentinel-2 data
③ Exclusion of 10 m crop pixels with Cloud/water/mix via visual interpretation.
④ Abnormal removal using FVC-NDVI filter at 3 × 3 window; NDVI binning (20 bins), 5% FVC outlier removal
High-resolution (10/20 m) distribution maps of single-season rice in China from 2017 to 2024 [35]
& High-resolution (10 m) distribution Dataset of Double-Season Paddy Rice in China from 2016 to 2024 [36]
① Generate pixel-to-polygon grids based on GEOV3 and GLASS products
② Spatial Aggregation of 10 m FVC to 300 m and 500 m, using high-resolution crop maps as a constraint with a 66% threshold. Matching UAV-derived means with co-located product values
③ Footprints with a number of UAV points below the 10th percentile were excluded to ensure data quality.
④ UAV-based 300 m and 500 m datasets were used as validation pools
44
Winter
Wheat
UAV (0.85~1.90 cm for RGB; 1.44~3.25 cm for multispectral)China 10-m spatial resolution winter wheat identification dataset from 2018 to 2024 [37]3325
Soybean ① UAV (0.85~1.90 cm for RGB; 1.44~3.25 cm for multispectral)
②Jilin-1 Satellite Image Data (0.75 m)
Soybean distribution in Heilongjiang in 2024 (10 m)88
Maize UAV (0.85~1.90 cm for RGB; 1.44~3.25 cm for multispectral)Dataset on distribution of maize cultivation in China from 2001 to 2024 (30 m) [38]2311
Total numbers of FVC samples6848

References

  1. Gitelson, A.A.; Kaufman, Y.J.; Stark, R.; Rundquist, D. Novel algorithms for remote estimation of vegetation fraction. Remote Sens. Environ. 2002, 80, 76–87. [Google Scholar] [CrossRef]
  2. Arneth, A. Uncertain future for vegetation cover. Nature 2015, 524, 44–45. [Google Scholar] [CrossRef] [PubMed]
  3. Baret, F.; Hagolle, O.; Geiger, B.; Bicheron, P.; Miras, B.; Huc, M.; Berthelot, B.; Niño, F.; Weiss, M.; Samain, O.; et al. LAI, fAPAR and fCover CYCLOPES global products derived from VEGETATION: Part 1: Principles of the algorithm. Remote Sens. Environ. 2007, 110, 275–286. [Google Scholar] [CrossRef]
  4. Camacho, F.; Cernicharo, J.; Lacaze, R.; Baret, F.; Weiss, M. GEOV1: LAI, FAPAR essential climate variables and FCOVER global time series capitalizing over existing products. Part 2: Validation and intercomparison with reference products. Remote Sens. Environ. 2013, 137, 310–329. [Google Scholar] [CrossRef]
  5. Li, L.; Mu, X.; Jiang, H.; Chianucci, F.; Hu, R.; Song, W.; Qi, J.; Liu, S.; Zhou, J.; Chen, L.; et al. Review of ground and aerial methods for vegetation cover fraction (fCover) and related quantities estimation: Definitions, advances, challenges, and future perspectives. ISPRS J. Photogramm. Remote Sens. 2023, 199, 133–156. [Google Scholar] [CrossRef]
  6. Hassanpour, R.; Majnooni-Heris, A.; Fakheri Fard, A.; Verrelst, J. Monitoring Biophysical Variables (FVC, LAI, LCab, and CWC) and Cropland Dynamics at Field Scale Using Sentinel-2 Time Series. Remote Sens. 2024, 16, 2284. [Google Scholar] [CrossRef]
  7. Fang, H.; Wei, S.; Liang, S. Validation of MODIS and CYCLOPES LAI products using global field measurement data. Remote Sens. Environ. 2012, 119, 43–54. [Google Scholar] [CrossRef]
  8. Baret, F.; Weiss, M.; Lacaze, R.; Camacho, F.; Makhmara, H.; Pacholcyzk, P.; Smets, B. GEOV1: LAI and FAPAR essential climate variables and FCOVER global time series capitalizing over existing products. Part1: Principles of development and production. Remote Sens. Environ. 2013, 137, 299–309. [Google Scholar] [CrossRef]
  9. Li, S.; Fang, H.; Zhang, Y.; Wang, Y. Comprehensive evaluation of global CI, FVC, and LAI products and their relationships using high-resolution reference data. Sci. Remote Sens. 2022, 6, 100066. [Google Scholar] [CrossRef]
  10. Baret, F.; Weiss, M.; Verger, A.; Smets, B. ATBD for LAI, FAPAR and FCover from PROBA-V 300m Resolution (GEOV3); ImagineS: Paris, France, 2016; Available online: https://www.fp7-imagines.eu/media/Documents/ImagineS_RP2.1_ATBD-LAI300m_I1.73.pdf (accessed on 1 October 2025).
  11. Cui, Y.; Liu, S.; Li, X.; Geng, H.; Xie, Y.; He, Y. Estimating maize yield in the black soil region of Northeast China using land surface data assimilation: Integrating a crop model and remote sensing. Front. Plant Sci. 2022, 13, 915109. [Google Scholar] [CrossRef]
  12. Xu, L.; Zhang, J.; Cheng, T.; Jiao, Q.; Qin, Y.; Ma, H.; Wu, H. A Hybrid RTM-Informed Machine Learning Framework with Crop-Specific Canopy Structural Parameterization for Crop Fractional Vegetation Cover Estimation. Remote Sens. 2026, 18, 751. [Google Scholar] [CrossRef]
  13. Raman, R.; Neely, H.L.; Rajan, N.; Siegfried, J.; Ibrahim, A.M.H.; Adams, C.B.; Hardin, R.G. Soil background effects on UAS and proximal remote sensing-derived vegetation indices. Agron. J. 2026, 118, e70281. [Google Scholar] [CrossRef]
  14. Jin, J.; Cheng, X.; Cai, Y.; Qin, Y.; Zhu, Q.; Wang, W.; Liu, X.; Wu, J. Guiding VI selection for phenology monitoring: Differential sensitivity of vegetation indices to temporal dynamics in canopy leaf area and pigment. Remote Sens. Environ. 2026, 335, 115296. [Google Scholar] [CrossRef]
  15. Martínez-Sánchez, E.; Sánchez-Zapero, J. Scientific Quality Evaluation: LAI, FAPAR, FCOVER Collection 1km Version 1 & Version 2; Issue 11.00; Document No. CGLOPS1_SQE2019_LAI1km_V1&V2; EOLAB, Copernicus Global Land Operations–Lot 1. 2020. Available online: https://land.copernicus.eu/en/technical-library/scientific-quality-evaluation-fraction-of-absorbed-photosynthetically-active-radiation-1-km-version-1 (accessed on 16 March 2026).
  16. Sánchez-Zapero, J.; Martínez-Sánchez, E. Quality Assessment Report: LAI, FAPAR, FCOVER from Sentinel-3/OLCI Collection 300m Version 1.1; Issue 1.20; Document No. CGLOPS1_QAR_LAI300m-V1.1; EOLAB, Copernicus Global Land Operations—Lot 1. 2022. Available online: https://land.copernicus.eu/en/technical-library/quality-assessment-report-sentinel-3-olci-fraction-of-green-vegetation-cover-333-m-version-1 (accessed on 2 October 2025).
  17. Fuster, B.; Sánchez-Zapero, J.; Camacho, F.; García-Santos, V.; Verger, A.; Lacaze, R.; Weiss, M.; Baret, F.; Smets, B. Quality Assessment of PROBA-V LAI, fAPAR and fCOVER Collection 300 m Products of Copernicus Global Land Service. Remote Sens. 2020, 12, 1017. [Google Scholar] [CrossRef]
  18. Liu, D.; Jia, K.; Wei, X.; Xia, M.; Zhang, X.; Yao, Y.; Zhang, X.; Wang, B. Spatiotemporal Comparison and Validation of Three Global-Scale Fractional Vegetation Cover Products. Remote Sens. 2019, 11, 2524. [Google Scholar] [CrossRef]
  19. Ding, Y.; Zheng, X.; Jiang, T.; Zhao, K. Comparison and validation of long time serial global GEOV1 and regional Australian MODIS fractional vegetation cover products over the Australian continent. Remote Sens. 2015, 7, 5718–5733. [Google Scholar] [CrossRef]
  20. Zhao, J.; Li, J.; Liu, Q.; Xu, B.; Mu, X.; Dong, Y. Generation of a 16 m/10-day fractional vegetation cover product over China based on Chinese GaoFen-1 observations: Method and validation. Int. J. Digit. Earth. 2023, 16, 4229–4246. [Google Scholar] [CrossRef]
  21. Baret, F.; Weiss, M.; Allard, D.; Garrigues, S.; Leroy, M.; Jeanjean, H.; Fernandes, R.; Myneni, R.; Privette, J.; Morisette, J.; et al. VALERI: A network of sites and a methodology for the validation of medium spatial resolution land satellite products. Remote Sens. Environ. 2005, 76, 36–39. Available online: https://hal.inrae.fr/hal-03221068 (accessed on 2 October 2025).
  22. Camacho, F.; Baret, F.; Lacaze, R. Guidelines for a Field Campaign. 2015. Available online: http://fp7-imagines.eu/pages/documents.php (accessed on 29 July 2025).
  23. Baret, F.; Morissette, J.T.; Fernandes, R.A.; Champeaux, J.L.; Myneni, R.B.; Chen, J.; Plummer, S.; Weiss, M.; Bacour, C.; Garrigues, S.; et al. Evaluation of the representativeness of networks of sites for the global validation and intercomparison of land biophysical products: Proposition of the CEOS-BELMANIP. IEEE Trans. Geosci. Remote Sens. 2006, 44, 1794–1803. [Google Scholar] [CrossRef]
  24. Brown, L.A.; Camacho, F.; García-Santos, V.; Origo, N.; Fuster, B.; Morris, H.; Pastor-Guzman, J.; Sánchez-Zapero, J.; Morrone, R.; Ryder, J.; et al. Fiducial reference measurements for vegetation bio-geophysical variables: An end-to-end uncertainty evaluation framework. Remote Sens. 2021, 13, 3194. [Google Scholar] [CrossRef]
  25. Lerebourg, C.; Dash, J.; Grousser, R. Ground-Based Observations for Validation (GBOV) of Copernicus Global Land Products: Algorithm Theoretical Basis Document—Vegetation Products (RM4, RM6, RM7, and FCOVER), Version 2.3; ACRI-ST: Grasse, France, 2024; Available online: https://gbov.land.copernicus.eu/api/v1/document_versions/3/document (accessed on 6 August 2025).
  26. Mu, X.; Song, W.; Gao, Z.; McVicar, T.R.; Donohue, R.J.; Yan, G. Fractional vegetation cover estimation by using multi-angle vegetation index. Remote Sens. Environ. 2018, 216, 44–56. [Google Scholar] [CrossRef]
  27. Mu, X.; Huang, S.; Ren, H.; Yan, G.; Song, W.; Ruan, G. Validating GEOV1 fractional vegetation cover derived from coarse-resolution remote sensing images over croplands. IEEE J. Sel. Top. Appl. Earth Obs. Remote Sens. 2014, 8, 439–446. [Google Scholar] [CrossRef]
  28. Chen, J.; Huang, R.; Yang, Y.; Feng, Z.; You, H.; Han, X.; Yi, S.; Qin, Y.; Wang, Z.; Zhou, G. Multi-scale validation and uncertainty analysis of GEOV3 and MuSyQ FVC products: A case study of an alpine grassland ecosystem. Remote Sens. 2022, 14, 5800. [Google Scholar] [CrossRef]
  29. Huang, R.; Chen, J.; Feng, Z.; Yang, Y.; You, H.; Han, X. Fitness for purpose of several fractional vegetation cover products on monitoring vegetation cover dynamic change—A case study of an alpine grassland ecosystem. Remote Sens. 2023, 15, 1312. [Google Scholar] [CrossRef]
  30. Fang, H.; Zhang, Y.; Wei, S.; Li, W.; Ye, Y.; Sun, T.; Liu, W. Validation of global moderate resolution leaf area index (LAI) products over croplands in northeastern China. Remote Sens. Environ. 2019, 233, 111377. [Google Scholar] [CrossRef]
  31. Claverie, M.; Vermote, E.F.; Weiss, M.; Baret, F.; Hagolle, O.; Demarez, V. Validation of coarse spatial resolution LAI and FAPAR time series over cropland in southwest France. Remote Sens. Environ. 2013, 139, 216–230. [Google Scholar] [CrossRef]
  32. Verger, A.; Baret, F.; Weiss, M. GEOV2/VGT: Near real time estimation of global biophysical variables from VEGETATION-P data. In Proceedings of the 2013 7th International Workshop on the Analysis of Multi-Temporal Remote Sensing Images (Multi-Temp), Banff, AB, Canada, 25–27 June 2013; pp. 1–4. [Google Scholar] [CrossRef]
  33. Jia, K.; Liang, S.; Liu, S.; Li, Y.; Xiao, Z.; Yao, Y.; Jiang, B.; Zhao, X.; Wang, X.; Xu, S.; et al. Global land surface fractional vegetation cover estimation using general regression neural networks from MODIS surface reflectance. IEEE Trans. Geosci. Remote Sens. 2015, 53, 4787–4796. [Google Scholar] [CrossRef]
  34. Yang, S.; Huang, S.; Bai, Y.; Jia, Y.; Ba, Q.; Tian, S.; Zhong, X. On-orbit Absolute Radiometric Calibration for the Multi-Spectral Imager of Jilin-1/GP02 based on Multiple Stable Targets. Remote Sens. Technol. Appl. 2023, 38, 803–815. [Google Scholar]
  35. Sousa, D.; Small, C. Which Vegetation Index? Benchmarking Multispectral Metrics to Hyperspectral Mixture Models in Diverse Cropland. Remote Sens. 2023, 15, 971. [Google Scholar] [CrossRef]
  36. Liu, L.; Xie, Y.; Zhu, B.; Song, K. Rice leaf chlorophyll content estimation with different crop coverages based on Sentinel-2. Ecol. Inform. 2024, 81, 102622. [Google Scholar] [CrossRef]
  37. Huete, A.; Didan, K.; Miura, T.; Rodriguez, E.P.; Gao, X.; Ferreira, L.G. Overview of the radiometric and biophysical performance of the MODIS vegetation indices. Remote Sens. Environ. 2002, 83, 195–213. [Google Scholar] [CrossRef]
  38. Shen, R.; Pan, B.; Peng, Q.; Dong, J.; Chen, X.; Zhang, X.; Ye, T.; Huang, J.; Yuan, W. High-resolution distribution maps of single-season rice in China from 2017 to 2022. Earth Syst. Sci. Data 2023, 15, 3203–3222. [Google Scholar] [CrossRef]
  39. Pan, B.; Zheng, Y.; Shen, R.; Ye, T.; Zhao, W.; Dong, J.; Ma, H.; Yuan, W. High Resolution Distribution Dataset of Double-Season Paddy Rice in China. Remote Sens. 2021, 13, 4609. [Google Scholar] [CrossRef]
  40. Yang, G.; Li, X.; Liu, P.; Yao, X.; Zhu, Y.; Cao, W.; Cheng, T. Automated in-season mapping of winter wheat in China with training data generation and model transfer. ISPRS J. Photogramm. Remote Sens. 2023, 202, 422–438. [Google Scholar] [CrossRef]
  41. Peng, Q.; Shen, R.; Li, X.; Ye, T.; Dong, J.; Fu, Y.; Yuan, W. A twenty-year dataset of high-resolution maize distribution in China. Sci. Data 2023, 10, 658. [Google Scholar] [CrossRef]
  42. Mu, X.; Yang, Y.; Xu, H.; Guo, Y.; Lai, Y.; McVicar, T.R.; Xie, D.; Yan, G. Improvement of NDVI mixture model for fractional vegetation cover estimation with consideration of shaded vegetation and soil components. Remote Sens. Environ. 2024, 314, 114409. [Google Scholar] [CrossRef]
  43. Zhao, T.; Mu, X.; Song, W.; Liu, Y.; Xie, Y.; Zhong, B.; Xie, D.; Jiang, L.; Yan, G. Mapping spatially seamless fractional vegetation cover over China at a 30-m resolution and semimonthly intervals in 2010–2020 based on Google Earth Engine. J. Remote Sens. 2023, 3, 0101. [Google Scholar] [CrossRef]
  44. Fang, G.; Wang, C.; Dong, T.; Wang, Z.; Cai, C.; Chen, J.; Liu, M.; Zhang, H. A Landscape-Clustering Zoning Strategy to Map Multi-Crops in Fragmented Cropland Regions Using Sentinel-2 and Sentinel-1 Imagery with Feature Selection. Agriculture 2025, 15, 186. [Google Scholar] [CrossRef]
  45. Li, Z.; Chen, J.; Chen, X.; Guo, Y.; Shen, M.; Xu, D.; Wang, C. Sensitivity of different soil-resistant vegetation indices to soil moisture and soil type. J. Remote Sens. 2026, 6, 0994. [Google Scholar] [CrossRef]
  46. Jia, K.; Yang, L.; Liang, S.; Xiao, Z.; Zhao, X.; Yao, Y.; Zhang, X.; Jiang, B.; Liu, D. Long-term global land surface satellite (GLASS) fractional vegetation cover product derived from MODIS and AVHRR data. IEEE J. Sel. Top. Appl. Earth Obs. Remote Sens. 2018, 12, 508–518. [Google Scholar] [CrossRef]
  47. Verger, A.; Sánchez-Zapero, J.; Weiss, M.; Descals, A.; Camacho, F.; Lacaze, R.; Baret, F. GEOV2: Improved smoothed and gap filled time series of LAI, FAPAR and FCover 1 km Copernicus Global Land products. Int. J. Appl. Earth Obs. Geoinf. 2023, 123, 103479. [Google Scholar] [CrossRef]
  48. Pan, Y.; Wu, W.; He, J.; Zhu, J.; Su, X.; Li, W.; Li, D.; Yao, X.; Cheng, T.; Zhu, Y.; et al. A Novel Approach for Estimating Fractional Cover of Crops by Correcting Angular Effect Using Radiative Transfer Models and UAV Multi-Angular Spectral Data. Comput. Electron. Agric. 2024, 222, 109030. [Google Scholar] [CrossRef]
  49. Jiang, H.; Wei, X.; Chen, Z.; Zhu, M.; Yao, Y.; Zhang, X.; Jia, K. Influence of Different Soil Reflectance Schemes on the Retrieval of Vegetation LAI and FVC from PROSAIL in Agriculture Region. Comput. Electron. Agric. 2023, 212, 108165. [Google Scholar] [CrossRef]
  50. Jia, K.; Liang, S.; Wei, X.; Yao, Y.; Yang, L.; Zhang, X.; Liu, D. Validation of Global Land Surface Satellite (GLASS) fractional vegetation cover product from MODIS data in an agricultural region. Remote Sens. Lett. 2018, 9, 847–856. [Google Scholar] [CrossRef]
  51. Fernández-Guisuraga, J.M.; Verrelst, J.; Calvo, L.; Suárez-Seoane, S. Hybrid inversion of radiative transfer models based on high spatial resolution satellite reflectance data improves fractional vegetation cover retrieval in heterogeneous ecological systems after fire. Remote Sens. Environ. 2021, 255, 112304. [Google Scholar] [CrossRef]
  52. Zhong, G.; Chen, J.; Huang, R.; Yi, S.; Qin, Y.; You, H.; Han, X.; Zhou, G. High spatial resolution fractional vegetation coverage inversion based on UAV and Sentinel-2 data: A case study of alpine grassland. Remote Sens. 2023, 15, 4266. [Google Scholar] [CrossRef]
  53. Zhang, X.; Bao, Y.; Wang, D.; Xin, X.; Ding, L.; Xu, D.; Hou, L.; Shen, J. Using UAV LiDAR to extract vegetation parameters of inner Mongolian grassland. Remote Sens. 2021, 13, 656. [Google Scholar] [CrossRef]
  54. Melville, B.; Fisher, A.; Lucieer, A. Ultra-high spatial resolution fractional vegetation cover from unmanned aerial multispectral imagery. Int. J. Appl. Earth Obs. Geoinf. 2019, 78, 14–24. [Google Scholar] [CrossRef]
Figure 1. Global CropFVC samples from different sources.
Remotesensing 18 01727 g001
Figure 2. Study framework for multi-source global CropFVC reference dataset and the multi-context validation strategy.
Remotesensing 18 01727 g002
Figure 3. 2024 CropFVC sampling in China. Note, each dot represents a homogeneous UAV mission crop area (maize, rice, winter wheat and soybean) larger than 400 m × 400 m; the red frame indicates the coverage area of Jilin-1 satellite imagery.
Remotesensing 18 01727 g003
Figure 4. Product performance on Validation Dataset V1 (ad) and V2 (eh). The dashed line in each panel denotes the 1:1 line, and the solid line represents the linear regression fit. Black points are validation crop samples.
Remotesensing 18 01727 g004
Figure 5. Product performance on Validation Dataset V3. (a) Performance of GEOV3; (b) Performance of GLASS. Note that black points denote global site references, and colored points correspond to the 2024 CropFVC samples. The black solid line is the linear regression fit for the global site references, and the red solid line is the linear regression fit for the 2024 CropFVC samples. The dashed line denotes the 1:1 line. Black text indicates accuracy for all sample points, and red text indicates accuracy for the 2024 sample points.
Remotesensing 18 01727 g005
Figure 6. Temporal comparison of four products at the KONZ site (2017–2020). Solid lines represent the four product trajectories, and symbols denote individual reference observations.
Remotesensing 18 01727 g006
Figure 7. Spatial behavior of four FVC products at the KONZ site (2019).
Remotesensing 18 01727 g007
Table 1. 2024 UAV-based CropFVC Sampling Mission in China.
LocationCrop TypeNumber of SitesSampling Dates
HuaXian (Henan)Winter Wheat428 March 2024, 27 April 2024, 15 May 2024
TaiKang (Henan)Winter Wheat422 March 2024, 1 May 2024, 21 May 2024
ZhengYang (Henan)Winter Wheat421 March 2024, 26 April 2024, 14 May 2024
DengZhou (Henan)Winter Wheat421 March 2024, 26 April 2024, 14 May 2024
XiaYi (Henan)Winter Wheat418 April 2024, 18 May 2024
ShangShui (Henan)Maize423 July 2024, 15 August 2024
TaiKang (Henan)Maize414 July 2024, 23 July 2024
HaiLun (Heilongjiang)Maize218 June 2024, 23 July 2024
HuangGang (Hubei)Rice117 July 2024, 1 August 2024, 23 August 2024
HaiLun (Heilongjiang)Rice118 June 2024, 23 July 2024
SuiHua (Heilongjiang)Rice118 June 2024, 23 July 2024
HaiLun (Heilongjiang)Soybean418 June 2024, 23 July 2024
SuiHua (Heilongjiang)Soybean118 June 2024, 23 July 2024
Disclaimer/Publisher’s Note: The statements, opinions and data contained in all publications are solely those of the individual author(s) and contributor(s) and not of MDPI and/or the editor(s). MDPI and/or the editor(s) disclaim responsibility for any injury to people or property resulting from any ideas, methods, instructions or products referred to in the content.