Article

Research on the Influence of Aerosol Optical Thickness Distribution on Apparent Brightness Contrast Under Vertical Non-Uniformity

College of Meteorology and Oceanography, National University of Defense Technology, Changsha 410073, China
*
Author to whom correspondence should be addressed.
Remote Sens. 2026, 18(11), 1718; https://doi.org/10.3390/rs18111718
Submission received: 14 April 2026 / Revised: 17 May 2026 / Accepted: 21 May 2026 / Published: 27 May 2026
(This article belongs to the Section Atmospheric Remote Sensing)

Highlights

What are the main findings?
  • Aerosol layer center height exhibits the most significant regulatory effect on apparent brightness contrast, followed by vertical width, while peak intensity shows the weakest influence. And the closer the aerosol layer center height is to the observation height, the larger the vertical width, or the stronger the peak intensity, the faster the apparent brightness contrast decays with vertical distance.
  • Rectangular profiles show step-like visibility changes, whereas Gaussian profiles exhibit continuous, smooth contrast decay.
What are the implications of the main findings?
  • The proposed layered aerosol model can effectively quantify the effect of vertical distribution of aerosol optical thickness on apparent brightness contrast, and guide visibility prediction for typical weather processes such as aerosol pollution within temperature inversion layers.
  • The results provide theoretical support for the optimization of atmospheric correction and visual range estimation in remote sensing and target detection.

Abstract

The vertical non-uniform distribution of aerosol optical thickness is a core element in regulating atmospheric radiative transmission and influencing the apparent brightness contrast between the target and background. However, current research mainly focuses on the macroscopic effects of the aerosol optical thickness, and the mechanism by which vertical variations in aerosol distribution regulate apparent brightness contrast remains inadequately understood. Therefore, in this study, a layered superposition aerosol model is established using extinction coefficient profiles from ground-based lidar observations with an ideal Gaussian or rectangular aerosol layer. An apparent brightness contrast model is then developed using the SBDART radiative transfer model. The influences of center height, vertical width, and peak intensity on contrast are analyzed, and their effects are quantified using maximum contrast and slant visibility. The results show that the closer the aerosol layer center height is to the observation height, the larger the vertical width, or the stronger the peak intensity, the faster the visual contrast decays with vertical distance. The influence of center height is the most significant, with slant visibility variations for Gaussian and rectangular distributions reaching up to 164.9% and 187.3%, respectively. The influence of vertical width gradually saturates as the width increases, while the influence of peak intensity is the weakest, with almost no effect on near-range contrast. Moreover, the regulatory characteristics of the Gaussian and rectangular distributions are distinctly different: the rectangular distribution exhibits a stronger local step effect, whereas the influence of the Gaussian distribution is more global and persistent.

1. Introduction

The apparent brightness contrast is a core optical parameter characterizing the brightness difference between the target and the background, and is a core basic indicator in the fields of visibility assessment, remote sensing accuracy calibration, and aerospace safety assurance [1]. During the radiation transmission process, the apparent brightness contrast between the target and the background depends on the object’s light attenuation, the target’s inherent brightness, and the path radiance enhancement process during radiation transmission, and the optical thickness of the aerosol, which is the primary factor regulating this brightness change process [2]. However, current research focuses more on the macroscopic effect of the optical thickness of the entire layer of aerosols, and pays insufficient attention to the influence of the vertical distribution of optical thickness on apparent brightness contrast [3,4]. Under the vertical non-uniform aerosol distribution pattern, even if the optical thickness of the entire layer remains unchanged, the difference in the distribution of aerosol optical thickness in the vertical layer will lead to different changes in apparent brightness contrast, which has important guiding value for the accurate prediction of visibility of typical weather processes such as inversion layer aerosol pollution and dust transport [5,6]. Therefore, research on the influence of aerosol optical thickness distribution on apparent brightness contrast under vertical non-uniformity is urgently needed.
At present, the research on aerosol observation and radiative transfer effects has formed a relatively complete technical system. In terms of observation means, they mainly include Ground-based remote sensing, Satellite remote sensing and Balloonborne (BIS) in situ detection. Ground-based remote sensing takes aerosol lidar and sun photometer as the core equipment: Lidar can realize high-precision inversion of the vertical profile of atmospheric extinction coefficient, combined with the Koschmieder formula, it can carry out the preliminary estimation of slant visibility and apparent brightness contrast, and it is the mainstream means of near-surface and boundary-layer aerosol monitoring [7,8]. However, this method generally ignores the effect of path-scattered radiation and simply follows the assumption of uniform path, which limits the inversion accuracy under non-uniform atmospheric conditions [9]; solar photometer can observe key parameters such as aerosol optical thickness for a long period of time, but it relies on sunlight irradiation, and it is not able to observe continuously under extreme nighttime and cloudy rainy conditions, so it is difficult to satisfy the demand of all-weather vertical structure detection [10,11]. Satellite remote sensing can realize macro-monitoring of aerosols in large regions and global scales, and effectively capture the transport processes of dust and pollutants on a large scale, but satellite observation is easily interfered by factors such as surface albedo, cloud cover, and snow and ice subsurface, and has limited ability to identify the details of vertical aerosol stratification, making it difficult to accurately depict the differences in vertical distribution of optical thickness [12,13,14]. BIS can directly obtain aerosol concentration, particle size distribution and optical profiles at different altitudes through balloonborne aerosol counters, light scattering sensors, etc. Although the observation range is limited, it has the advantages of high vertical resolution and accurate measurement results [15,16], and provides key data in the observation of the vertical structure of boundary layer sand and dust, tropospheric wildfire plume, and stratospheric volcanic ash. It has become an indispensable supplementary means for remote sensing observation [17,18].
In terms of theoretical and modeling studies, most of the early studies were based on the assumption of a homogeneous atmosphere to carry out simplified calculations of apparent brightness contrast, which can hardly reflect the real impact of the vertical non-uniform distribution of aerosols. With the development of radiative transfer modes, various kinds of refined radiative transfer modes, such as SBDART, 6S, SHDOM, LBLRTM, etc., have been widely used, which can accurately simulate the complex physical processes, such as multiple scattering, path radiation, polarization, and inhomogeneous medium, and can effectively make up for the deficiencies of the traditional simplified algorithms. Among them, the SBDART model has become a mainstream tool for the calculation of aerosol radiative transfer and apparent brightness contrast because of its high computational efficiency, flexible inputs, and suitability for stratified atmosphere modeling [4,19].
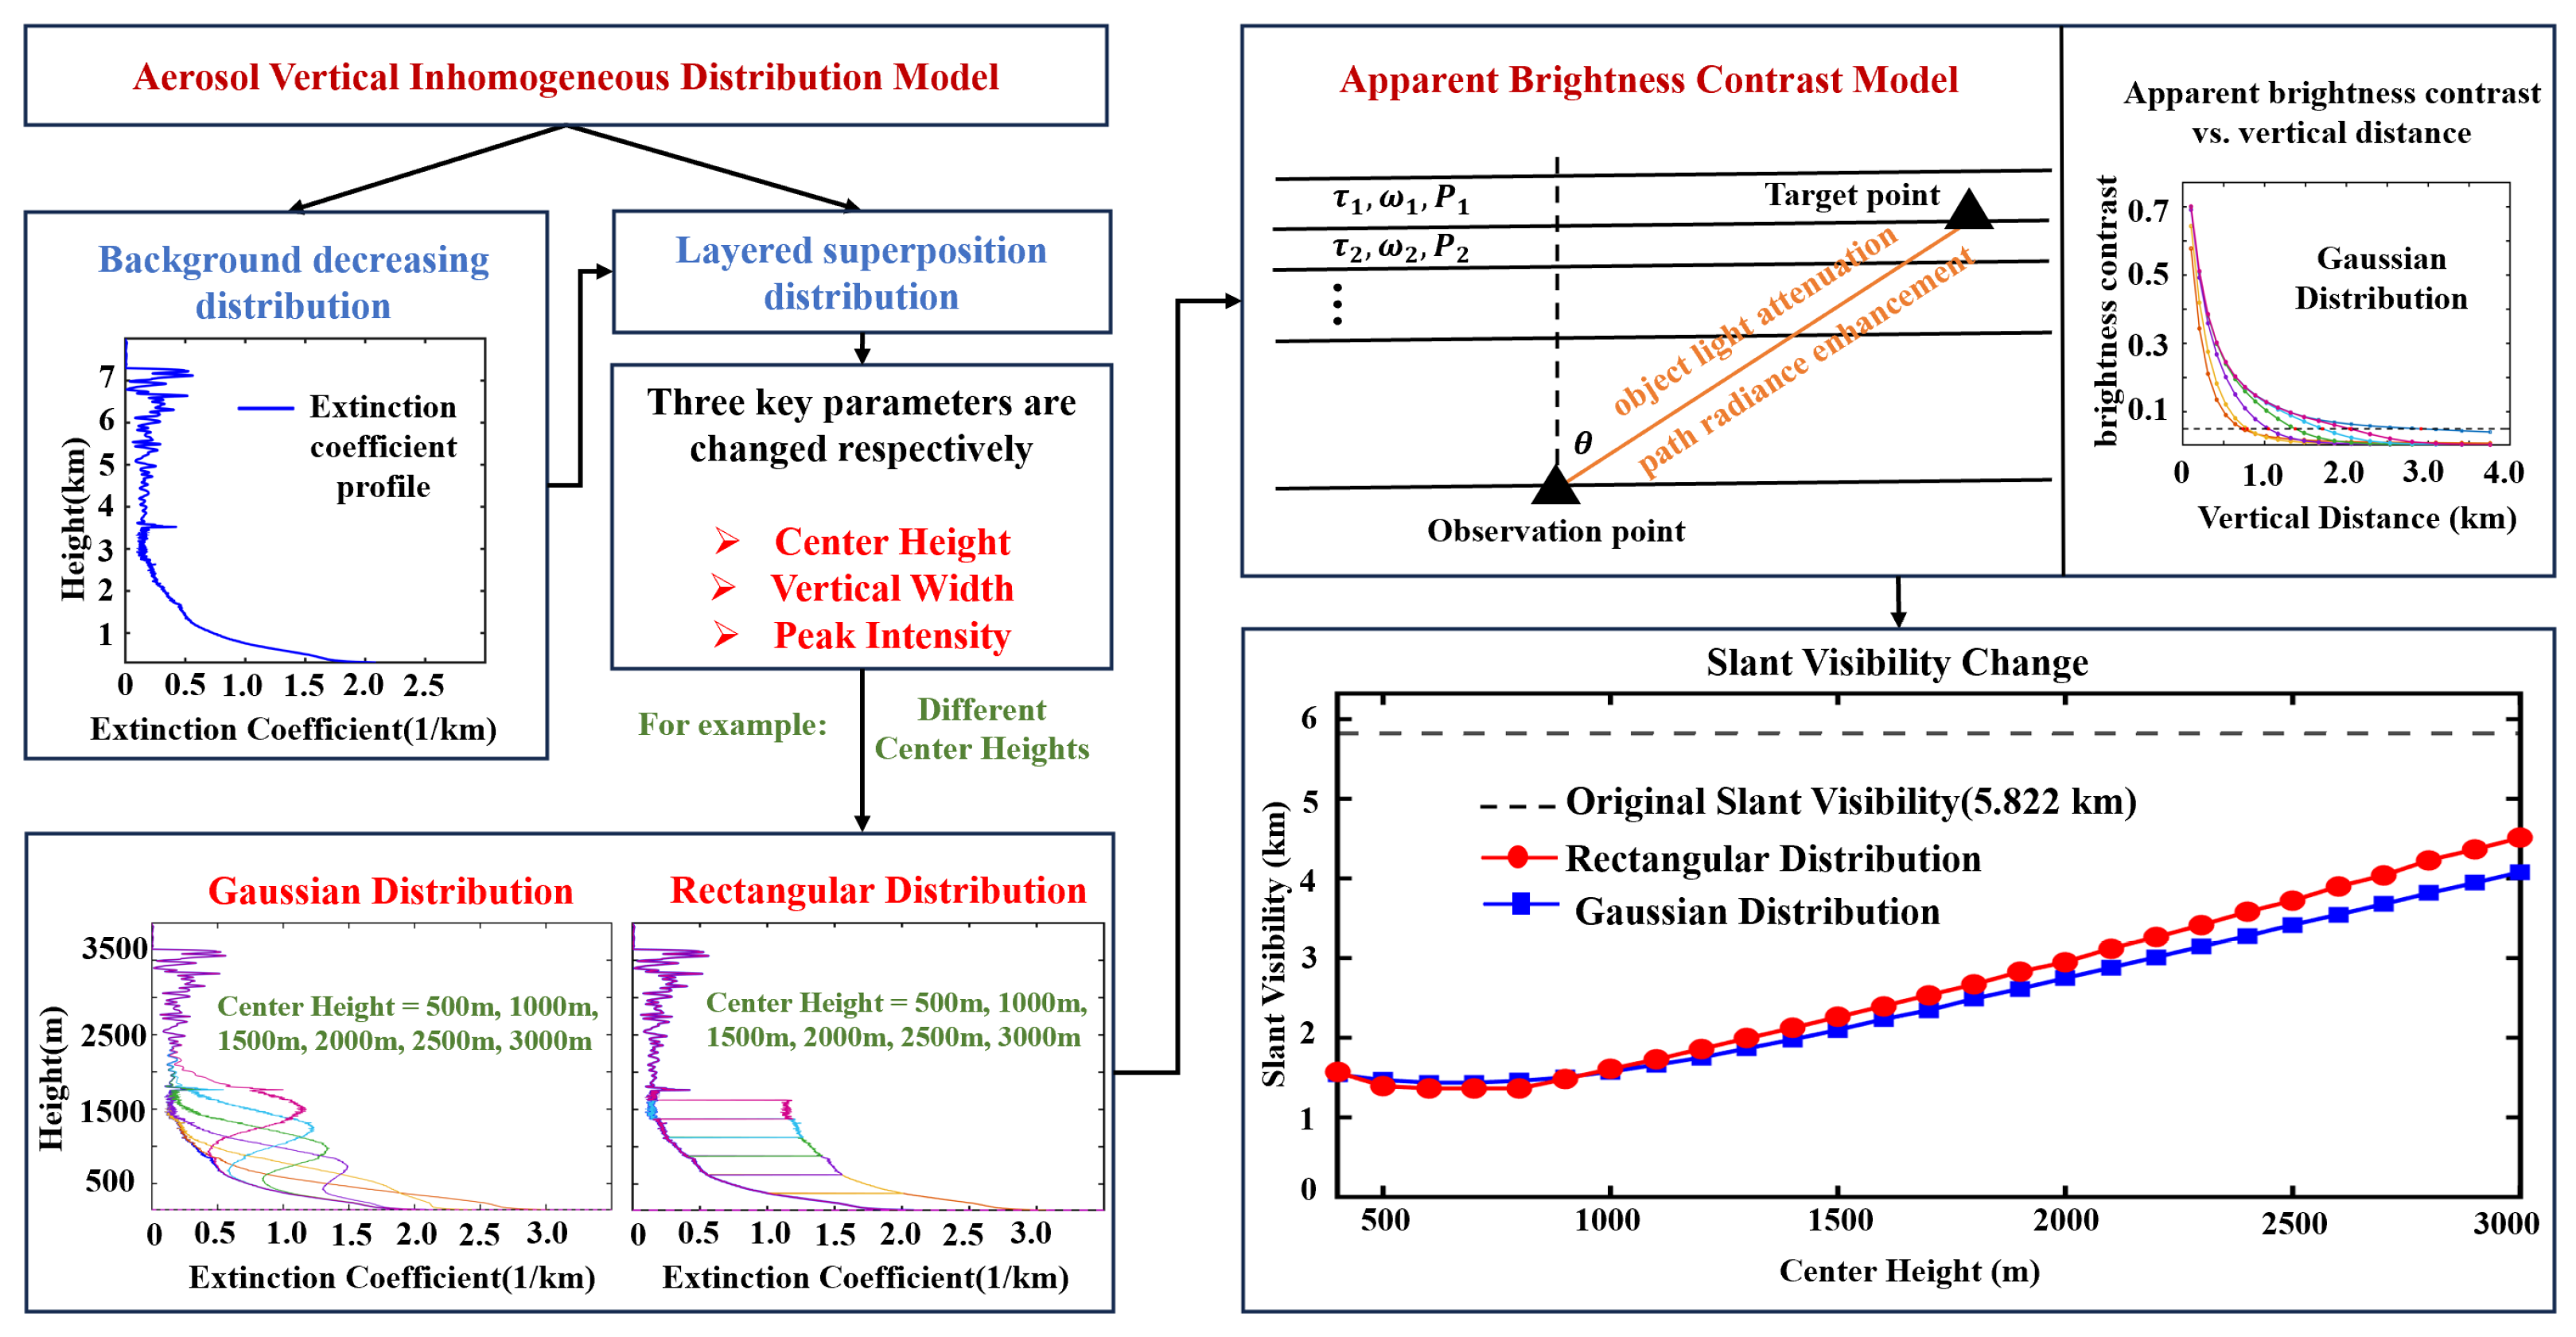
However, most current model studies, despite their capability to simulate inhomogeneous atmospheres, have focused primarily on the analysis of total-column aerosol visibility and have not systematically clarified the regulatory mechanism of optical thickness distribution differences on the attenuation law of apparent brightness contrast under vertical inhomogeneity, and research on different vertical distribution patterns of aerosols in complex atmospheres is relatively scarce [20,21], making it difficult to support accurate simulation and prediction of changes in apparent brightness contrast in real atmospheres. Therefore, regarding the influence of aerosol optical thickness distribution on apparent brightness contrast under vertical inhomogeneity, this paper independently established a layered superposition distribution model, including both Gaussian and rectangular distributions as two extreme morphologies, based on the “background decreasing” distribution model of aerosols, and constructed an apparent brightness contrast model between the target object and the background using the SBDART radiative transfer model. It explored the regulatory mechanism of the influence of three key parameters—center height, vertical width, and peak intensity—on apparent brightness contrast, and quantified the influence intensity of each parameter using maximum contrast and slant visibility.
The structure of this paper is as follows: Section 2 describes the observation instruments, data processing, and the construction of specific models. Section 3 simulates the background radiation distribution of the aerosol vertical non-uniform distribution model, and explores the attenuation law of three key parameters—center height, vertical width, and peak intensity—of Gaussian and rectangular aerosol layers on apparent brightness contrast. Section 4 discusses the sensitivity analysis of different key parameters. Section 5 provides a summary and outlook.

2. Materials and Methods

2.1. Data

Different vertical distributions of aerosol optical thickness essentially correspond to varied profiles of the extinction coefficient under the premise that the optical thickness of the whole layer remains unchanged. Therefore, this study uses the vertical profile data of aerosol extinction coefficient obtained by the APL series aerosol lidar observation. Based on active laser remote sensing technology, the core principle of this observation equipment is to emit a pulsed laser into the atmosphere and use the backscattered echo signals from atmospheric aerosol particles and air molecules to retrieve the extinction coefficient profiles at different altitudes. It can achieve high-precision detection of atmospheric extinction coefficient profiles, cloud layer information, and atmospheric boundary layer height, providing reliable data support for the study of aerosol vertical distribution. Depending on the type of scattering signal, the common inversion methods include the elastic scattering method and the Raman scattering method: when the concentration of low-altitude aerosols is high, the Fernald backward integration method is mostly used to retrieve the extinction coefficient; under conventional atmospheric conditions, the retrieval is performed using the nitrogen vibrational-rotational Raman scattering signal profile [22,23].
The original observation data output of this equipment includes time, nitrogen channel AD data, nitrogen channel photon data, elastic channel AD data, elastic channel photon data, cloud height and thickness at various altitudes, distance correction data, and extinction data. The distance correction data and extinction data were observed in sets every five minutes. Therefore, the data preprocessing was carried out in two steps: First, the extinction coefficient profile data corresponding to the effective observation time were extracted. Second, considering that the initial detection height of the equipment was 150 m and the signal below 300 m was greatly affected by the geometric overlap factor, the area below 300 m was defined as an effective blind zone and removed, i.e., the value was set to 0. Only the extinction data of the height layer above 300 m were retained for subsequent analysis. Finally, the aerosol extinction coefficient vertical profile dataset corresponding to different observation times was obtained.

2.2. Model

2.2.1. Aerosol Vertical Non-Uniform Distribution Model

In the real atmospheric environment, the non-uniformity of the vertical distribution of aerosols is a common feature [24]. Dominated by surface emissions and turbulent diffusion processes, aerosols generally exhibit a background decreasing distribution [25,26]. However, when driven by dynamic and thermal processes such as temperature inversion layer interception [7], long-distance transport of dust, and lifting of industrial emission plumes, a layered superposition distribution is easily formed, that is, aerosol concentration peaks appear at specific height layers, forming local high-concentration aerosol layers. This type of complex vertically inhomogeneous structure takes into account the complexity of atmospheric scattering and absorption of solar radiation, and can describe the vertical aerosol distribution characteristics of the real atmosphere under special conditions.
Background decreasing distribution is characterized by high near-surface aerosol concentration, with the extinction coefficient exhibiting a natural gradient, decreasing with altitude. Under normal circumstances, the extinction coefficient data of real atmospheric observations naturally exhibit the background characteristics of “high near-surface, decreasing with altitude”. Therefore, this study selects real lidar observation data that meet the requirements as the natural carrier of this type.
Layered superposition distribution, which is based on background decreasing, a high-concentration aerosol layer is formed at a specific altitude due to processes such as temperature inversion interception and dust transport. To investigate the influence of real aerosol layered superposition, this study uses Gaussian and rectangular distributions to construct extinction coefficient increment profiles under two extreme morphologies. That is, while retaining the spatial distribution characteristics of the measured background extinction coefficient, the local aerosol layered extinction coefficient increments constructed based on the Gaussian distribution and rectangular distribution are superimposed. Its core formula is as follows:
σ t o t a l ( z i ) = σ o b s ( z i ) + Δ σ lay ( z i )
where z i denotes the i-th discrete height level ( z i = 300 + 6 × ( i 1 ) , unit: m); σ o b s ( z i ) represents the observed background extinction coefficient at height z i from lidar measurements (unit: km−1). Δ σ lay ( z i ) is the increment of the aerosol stratification extinction coefficient at height z i (unit: km−1); σ t o t a l ( z i ) is the total extinction coefficient output by the model (unit: km−1), and is only calculated by superposition in the effective height range above 300 m.
(1) For the Gaussian distribution, the incremental contribution of the locally concentrated layer to the aerosol extinction coefficient at height z i is as follows:
Δ σ lay ( z i ) = S · exp ( z i z c ) 2 2 ω 2
(2) For the rectangular distribution, the incremental contribution of the locally concentrated layer to the aerosol extinction coefficient at height z i is as follows:
Δ σ lay ( z i ) = S , z c w z i z c + w 0 , e l s e
In the formulas, each parameter is an adjustable parameter with a clear physical meaning. The value can be set based on the lidar detection range and the real atmospheric aerosol layering characteristics to adapt to the simulation needs of different layering scenarios. Among them: the peak intensity S (Unit: km−1) characterizes the increase in peak extinction coefficient of the superimposed aerosol layer, which determines the concentration of the layer; the center height z c (unit: m) characterizes the vertical height corresponding to the peak concentration of the superimposed aerosol layer, which can be adjusted according to the simulation scenario; the vertical width ω (unit: m) characterizes the vertical coverage thickness of the superimposed aerosol layer and determines its vertical diffusion range, and a larger ω corresponds to a wider vertical coverage and a more gradual decay in concentration.

2.2.2. Apparent Brightness Contrast Model Between the Target and the Background Based on Extinction Coefficient Profile and SBDART Radiative Transfer Mode

This study realizes the accurate inversion of the apparent brightness contrast based on the extinction coefficient profile and the SBDART radiative transfer mode. First, the extinction coefficient data obtained by lidar observation are applied to the layered superposition distribution model, established in this paper. The vertical profiles of extinction coefficients of different shapes on the detection path can be used as input parameters of the SBDART radiative transfer model. The SBDART (Santa Barbara DISORT Atmospheric Radiative Transfer) model [27] is a plane-parallel atmospheric radiative transfer software package developed in 1998 by the Department of Earth Sciences at the University of California, Santa Barbara. This model has been widely used in fields such as aerosol radiation effect assessment, slant visibility measurement, and shortwave radiation simulation [28,29,30,31]. The model integrates three core modules: (1) a high-precision radiative transfer solver based on the discrete ordinate method (DISORT); (2) the LOWTRAN7 low-resolution atmospheric transmission module; (3) an aerosol and cloud droplet scattering simulation module based on Mie theory. SBDART is capable of calculating radiative transfer processes from the ultraviolet to the infrared wavelength range and is applicable to various atmospheric radiation studies under both clear-sky and cloudy conditions.
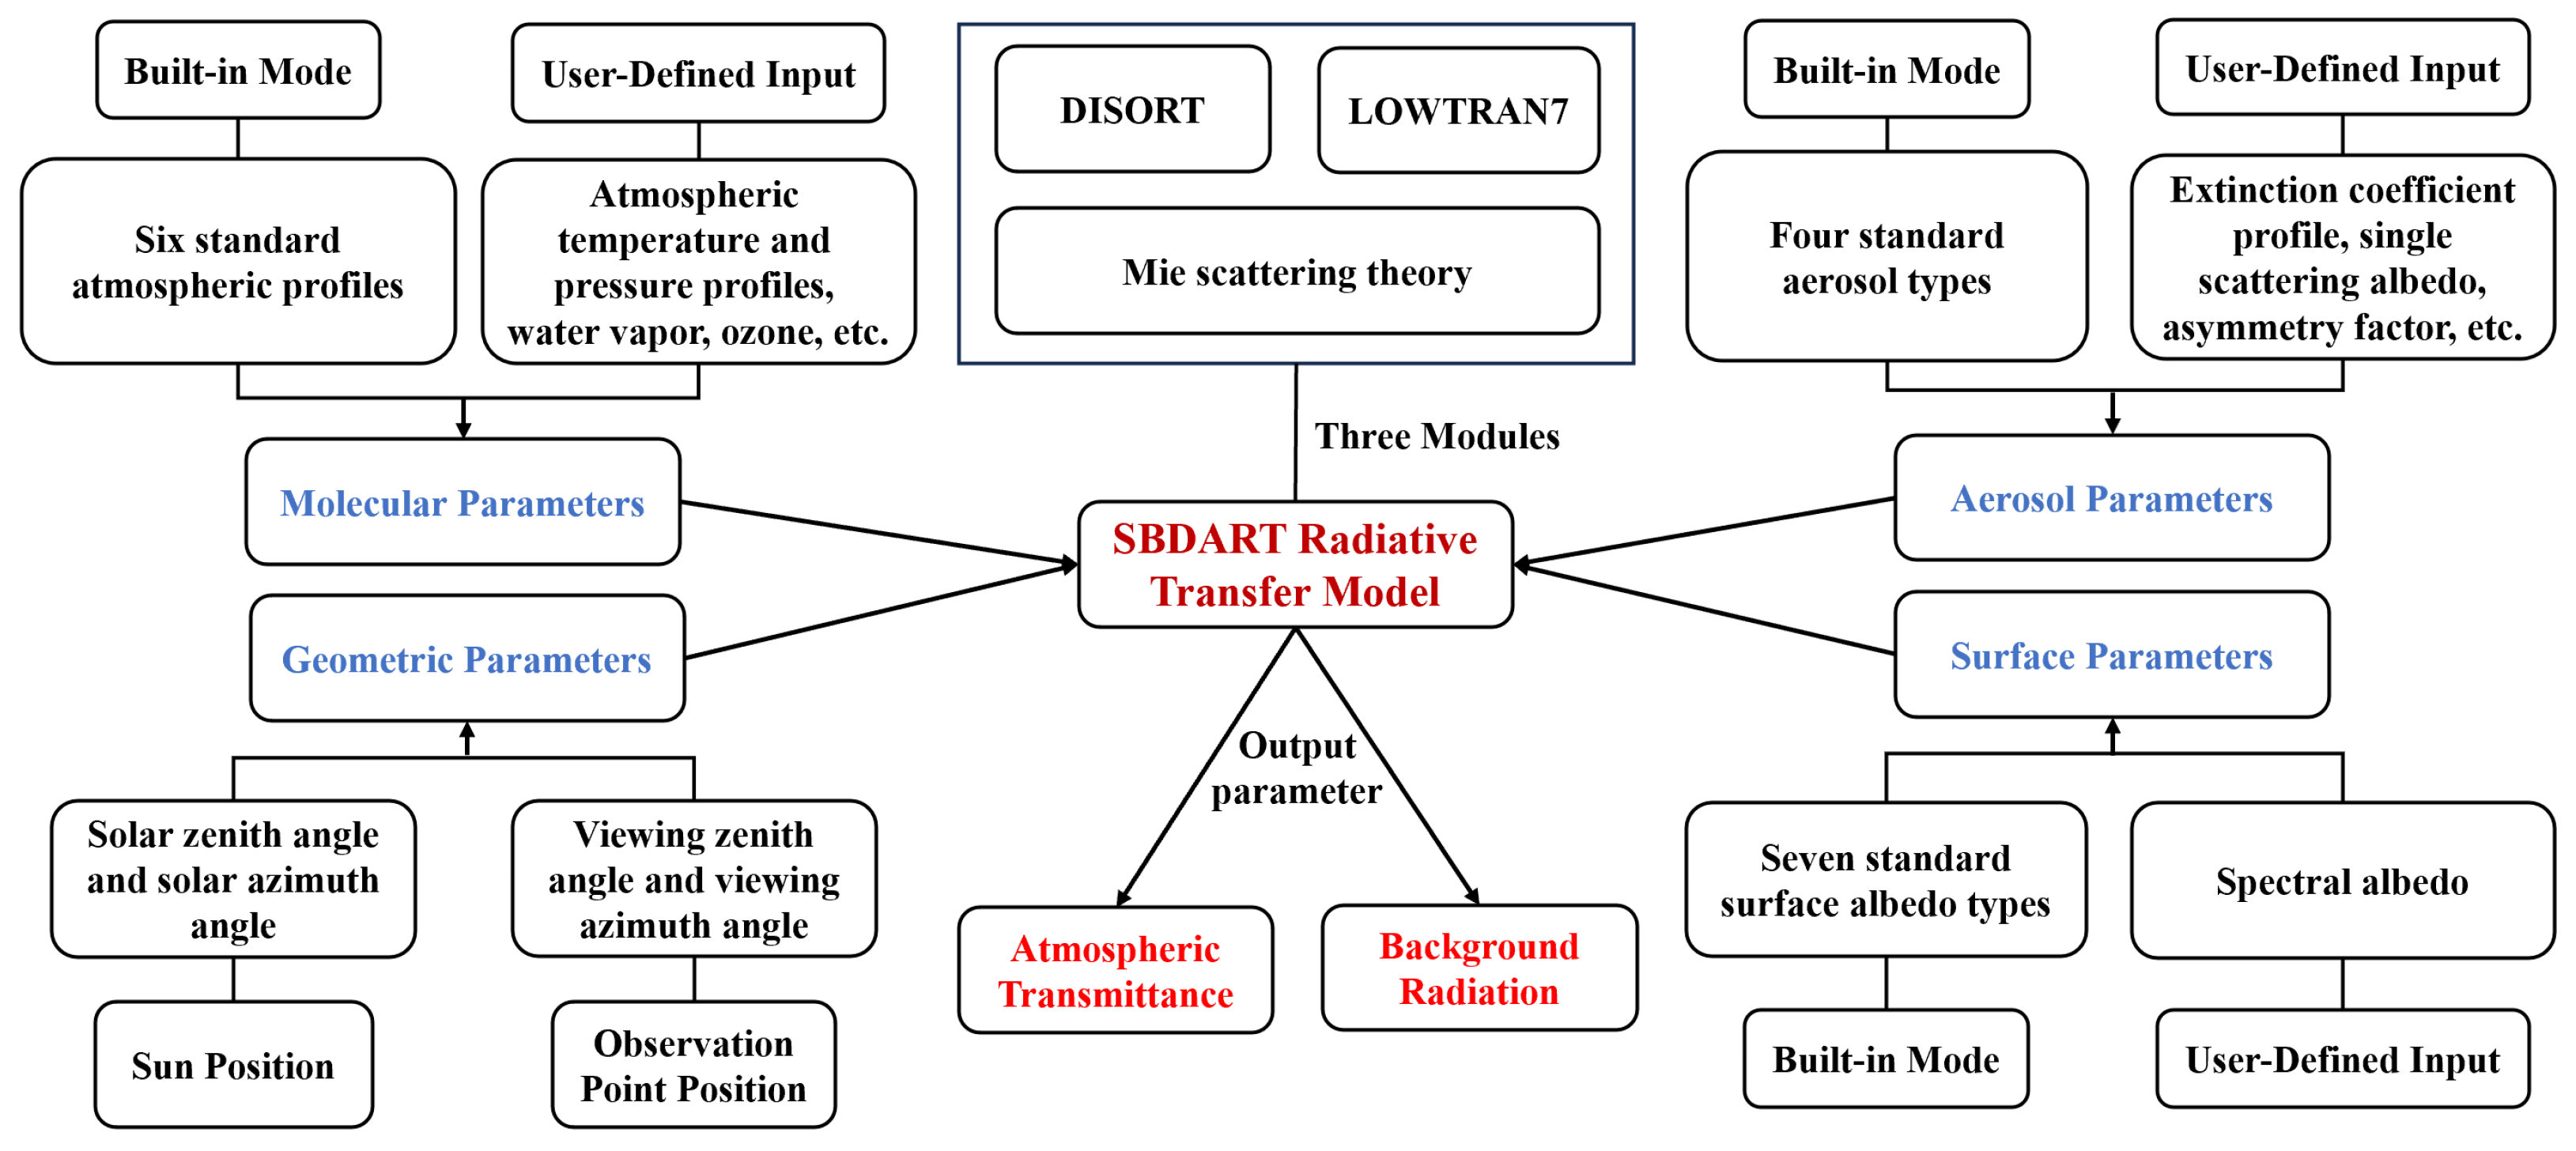
The core algorithm of the SBDART model is the discrete ordinate method (DISORT) [32,33,34]. This method discretizes the angular variable in the radiative transfer equation into a finite number of Gaussian quadrature angles, transforming the original integro-differential equation into a system of linear ordinary differential equations, which are then solved analytically layer by layer for the atmosphere. As shown in Figure 1, the input parameters of SBDART are set through the INPUT file. The main input parameters include the following: (1) Molecular parameters: SBDART provides six standard atmospheric profiles and also supports user-defined profiles of atmospheric temperature, pressure, water vapor, and ozone. (2) Aerosol parameters: SBDART provides four preset tropospheric aerosol types (rural, urban, oceanic, and tropospheric). Users can also customize aerosol extinction coefficient profiles, single scattering albedo, asymmetry factor, and other parameters through the aerosol.dat file. (3) Geometric parameters: including solar zenith angle, solar azimuth angle, observation zenith angle, and observation azimuth angle. (4) Surface parameters: including seven standard surface albedo types, with support for user-defined spectral albedo. Additionally, cloud parameters such as cloud phase, cloud top/base height, cloud optical thickness, and cloud droplet effective radius can be set. Running SBDART yields key parameters including background radiation and atmospheric transmittance, providing a foundation for the inversion of apparent brightness contrast and slant visibility.
The apparent brightness [28] contrast is usually defined as the difference between the brightness of the target and the background divided by the brightness of the background. Under ideal atmospheric conditions, the contrast is determined only by the difference in the inherent reflectivity between the target and the background, which is called the inherent contrast. However, in the actual atmosphere, due to the existence of path radiation brightness, the apparent brightness of both the target and the background will change, which is manifested as the target brightness weakening due to atmospheric attenuation, while the path radiation brightness increases the background brightness [2]. The apparent brightness can be expressed as the sum of the brightness of the inherent brightness reaching the observer after absorption and scattering between the observation point and the target and the brightness of the additional air column. This additional air column is the brightness of the air column generated by the path radiation between the target and the observer, which is a kind of atmospheric scattering radiation brightness. Therefore, the apparent brightness of the target and the background can be expressed as follows:
B o = B o * · T R + B R B b = B b * · T R + B R
where B o * is the inherent brightness of the target itself, B b * is the inherent brightness of the background where the target is located; B o and B b are the apparent brightness of the target and the background, respectively; T R is the atmospheric transmittance; B R is the additional air column brightness. Therefore, the apparent brightness contrast C can be expressed as follows:
C = B o B b B o = B o * B b * B b * · l + B R B b T R l
The first factor on the right side of the formula is the inherent brightness contrast, which can be expressed as C 0 , C 0 = B o * B b * B b * ; the second factor is called the contrast transmission coefficient, which can be expressed as Y, Y = 1 + B R B b T R l . Since the additional air column brightness B R can be expressed by the inherent brightness of the background where the observation point is located B o b * and the inherent brightness of the background where the target object is located B b * :
B R = B o b * B b * · T R
Therefore, the apparent brightness contrast formula can be simplified to the following:
C = C 0 · Y = B o * B b * B b * · B b * T R B o b *
This study focuses on the visible light band, and the target object can be regarded as a blackbody, so the inherent brightness of the target object itself B o * can be set to zero; the apparent brightness contrast between the target and the background is only related to the contrast transmission coefficient. Therefore, simply introducing the background radiation and atmospheric transmittance calculated by SBDART into the contrast expression yields the apparent brightness contrast.
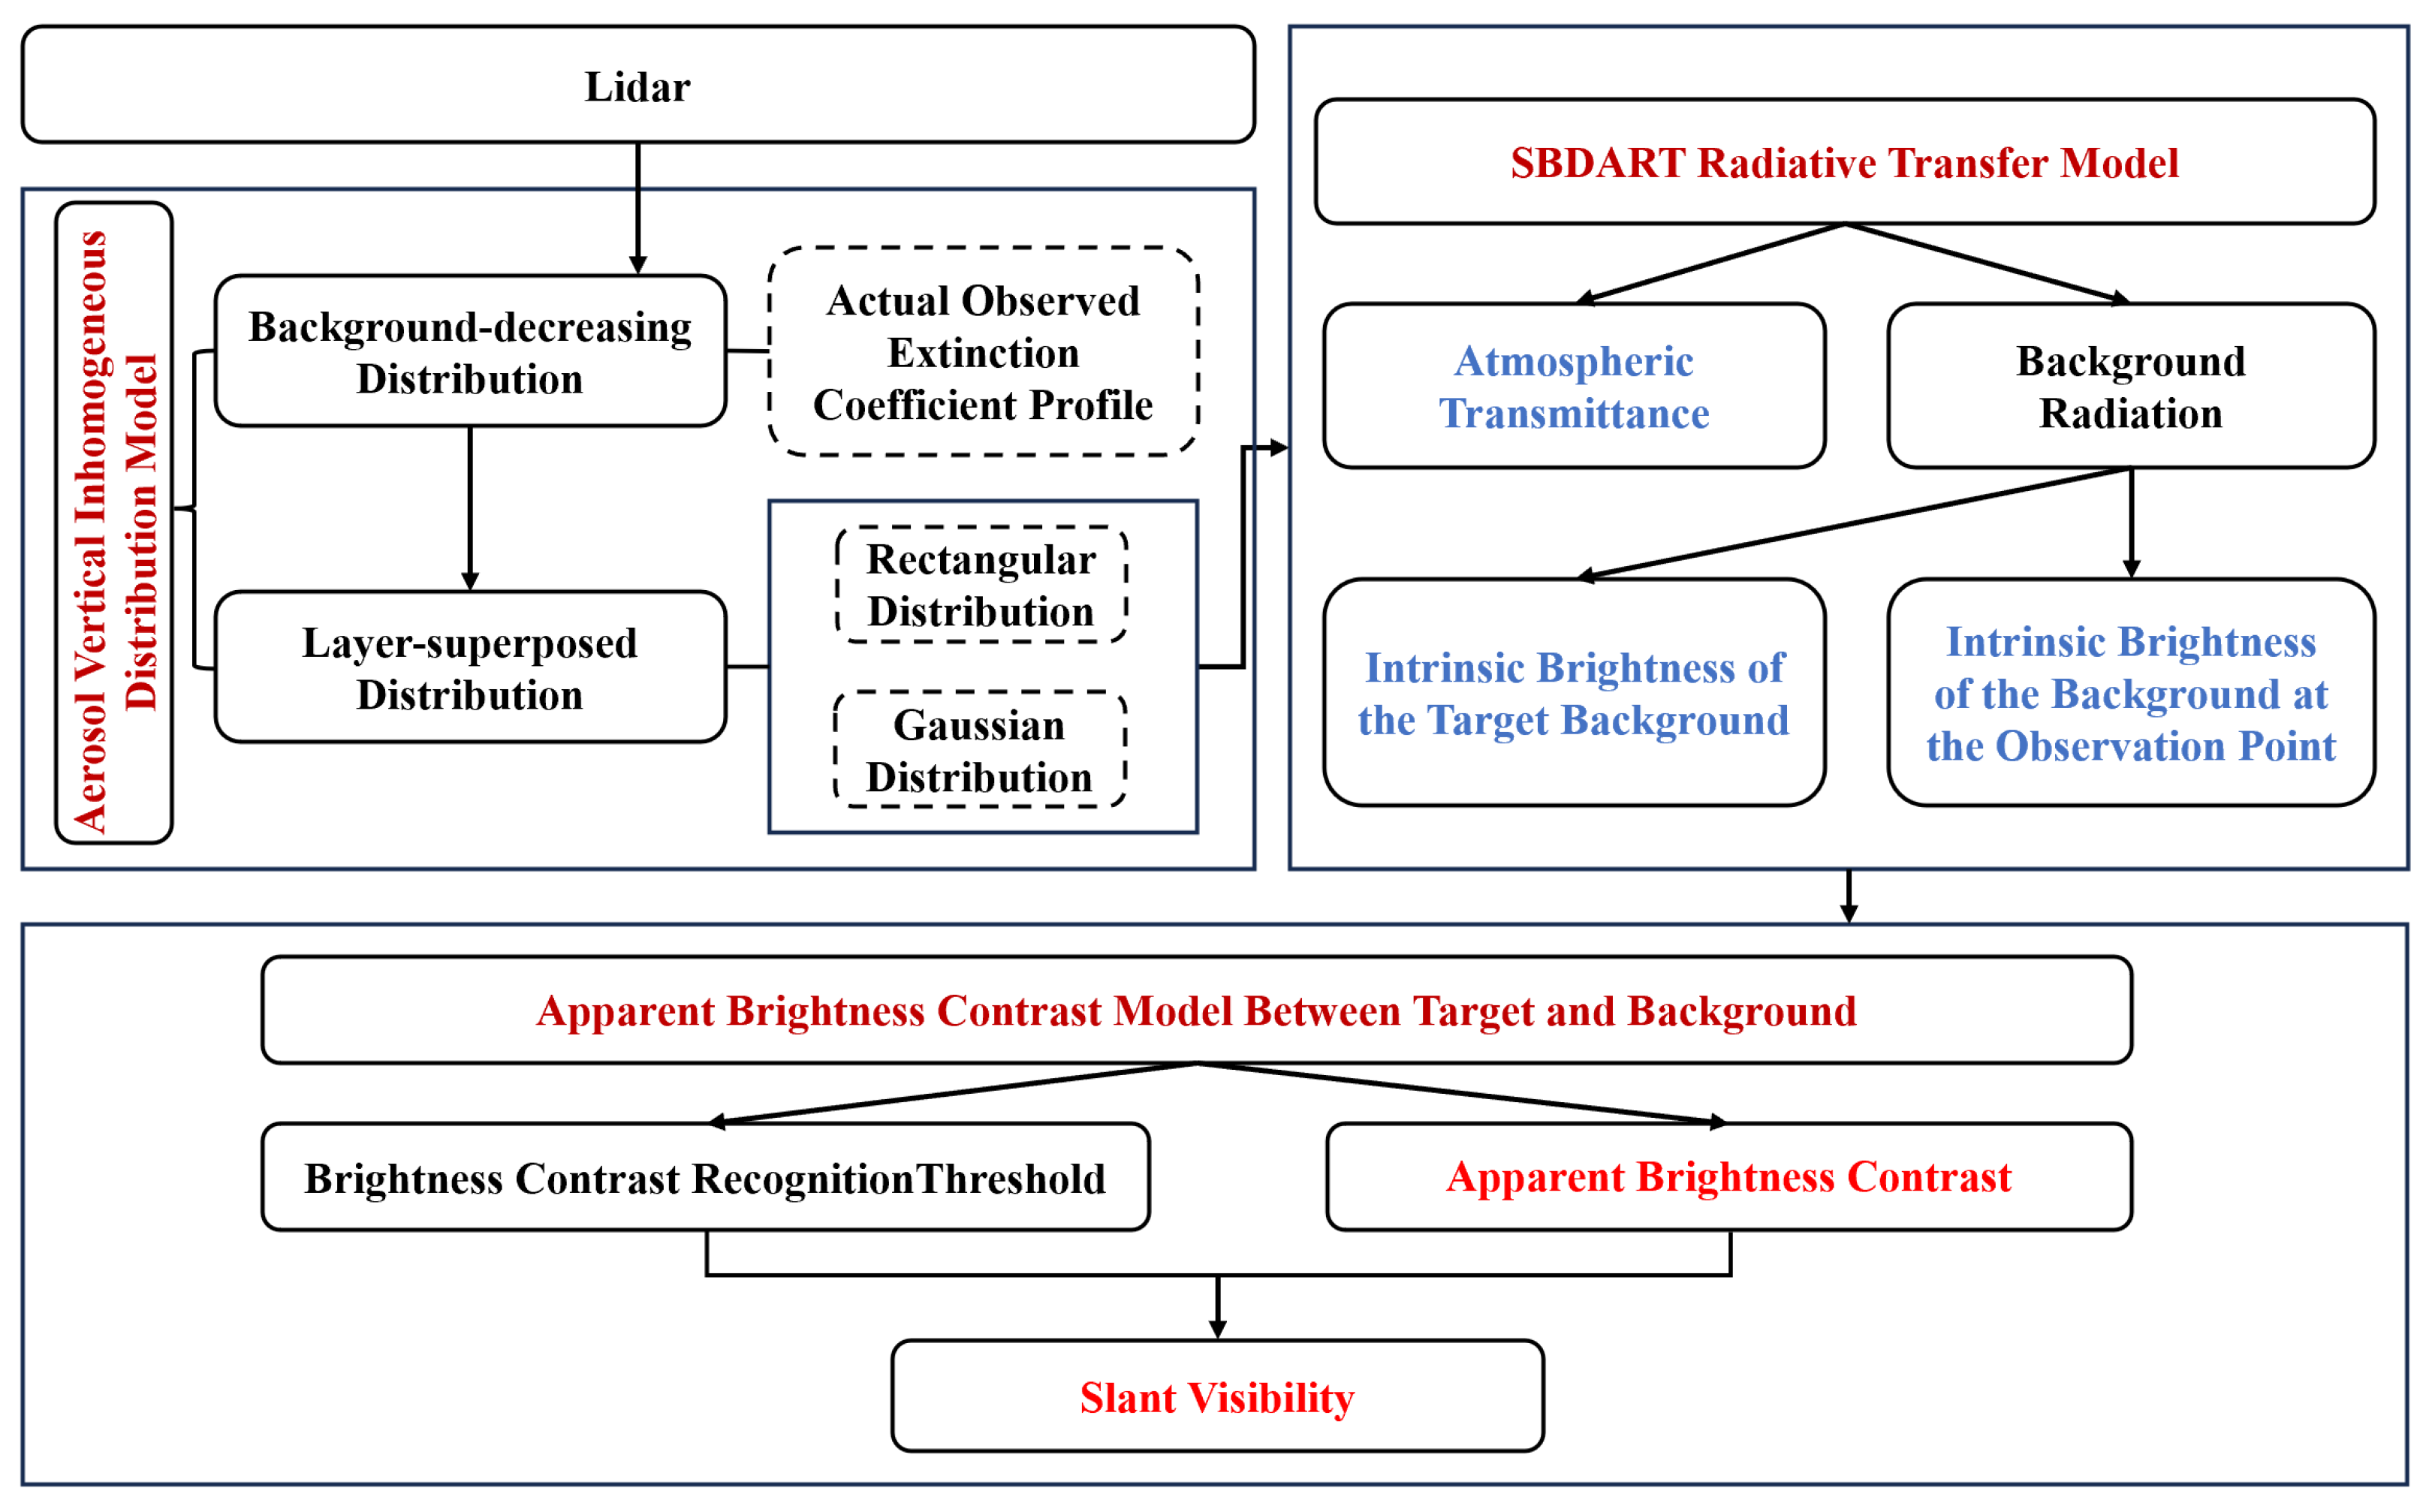
The flowchart for calculating the apparent brightness contrast and slant visibility is shown in Figure 2. Slant visibility is closely related to the apparent brightness contrast between the target and the background. The relationship between apparent brightness contrast and the recognition threshold determines whether the target object can be distinguished from the background. The recognition threshold S is the minimum contrast at which the target can be distinguished. The International Civil Aviation Organization (ICAO) recommends a value of 0.05, while the World Meteorological Organization (WMO) recommends a value of 0.02 [35]. To reflect a higher visibility requirement, this paper adopts S = 0.05. When C > S , the target object is visible; when C < S , the target object is invisible; when C = S , the observer can just distinguish the target object from the background. That is as follows:
B b * T R B o b * = S
At this point, the distance R between the observer and the target object is the slant visibility.

3. Results

To investigate the influence of aerosol optical thickness distribution under vertically non-uniform morphology on the apparent brightness contrast between the target and the background, this section discusses the regulation of the three key parameters of Gaussian and rectangular aerosol layers—center height, vertical width, and peak intensity—on the apparent brightness contrast between the target and the background, as shown in Figure 3. This study adopts the urban aerosol model, with aerosol optical property parameters based on the urban aerosol composition in the LITMS aerosol database [36]. According to this model, urban aerosols are primarily composed of water-soluble particles (61% volume fraction), black carbon (22%), and dust-like particles (17%) [36]. Consistent with the input requirements of the SBDART model, the aerosol particles were set to be spherical particles, the single scattering albedo at 550 nm is set to 0.85, the asymmetry factor at 550 nm is set to 0.65 [37,38], and the complex refractive index is set to 1.55 − 0.03i. This parameter combination represents moderately absorbing urban or industrial aerosols and has been widely used in SBDART-based aerosol radiative transfer studies [39].
The entire experiment used the original extinction data at 20:29:59 on 1 March 2025 as the control group. Under the fixed observation geometry of 0.301 km observation height, 60.0° zenith angle, and 60.0° azimuth angle, two of the parameters were fixed, and the other parameter was changed for the experimental group. Sensitivity analysis was performed on the key parameters. When the variables are center height and vertical width, in order to clearly display the vertical distribution characteristics and superposition effect of the extinction coefficient profiles of the original background and the superimposed aerosol layer under the same coordinate system, peak value normalization processing is performed on the superimposed aerosol layer profile when visualizing the profile. That is, the maximum value of the aerosol layer profile is scaled to be consistent with the maximum value of the original extinction profile. The formula is as follows:
β a e r o , n o r m ( z ) = β a e r o ( z ) × m a x ( β o r i g ( z ) ) m a x ( β a e r o ( z ) )
In the equation, β a e r o , n o r m ( z ) is the aerosol extinction coefficient profile after peak normalization; β a e r o ( z ) is the Gaussian distribution profile to be normalized; m a x ( β o r i g ( z ) ) is the peak value of the original aerosol extinction coefficient profile, and m a x ( β a e r o ( z ) ) is the peak value of the profile to be normalized, and the ratio of these two values constitutes the peak scaling factor.
However, the calculation process of the extinction coefficient profile after the aerosol layer is superimposed is still a direct addition. When the variable is the peak intensity, no normalization processing is required.

3.1. Effect of Different Center Heights on Apparent Brightness Contrast Attenuation

To explore the regulation law of the vertical distribution position of the aerosol layer on the brightness contrast, this section fixes the peak intensity of the superimposed aerosol layer at 1.0 km−1 and the vertical width at 500 m, and gradually increases the center height with a step of 100 m from 400 m to 3000 m, and analyzes the variation characteristics of apparent brightness contrast with vertical distance when superimposing aerosol layers with different center heights.
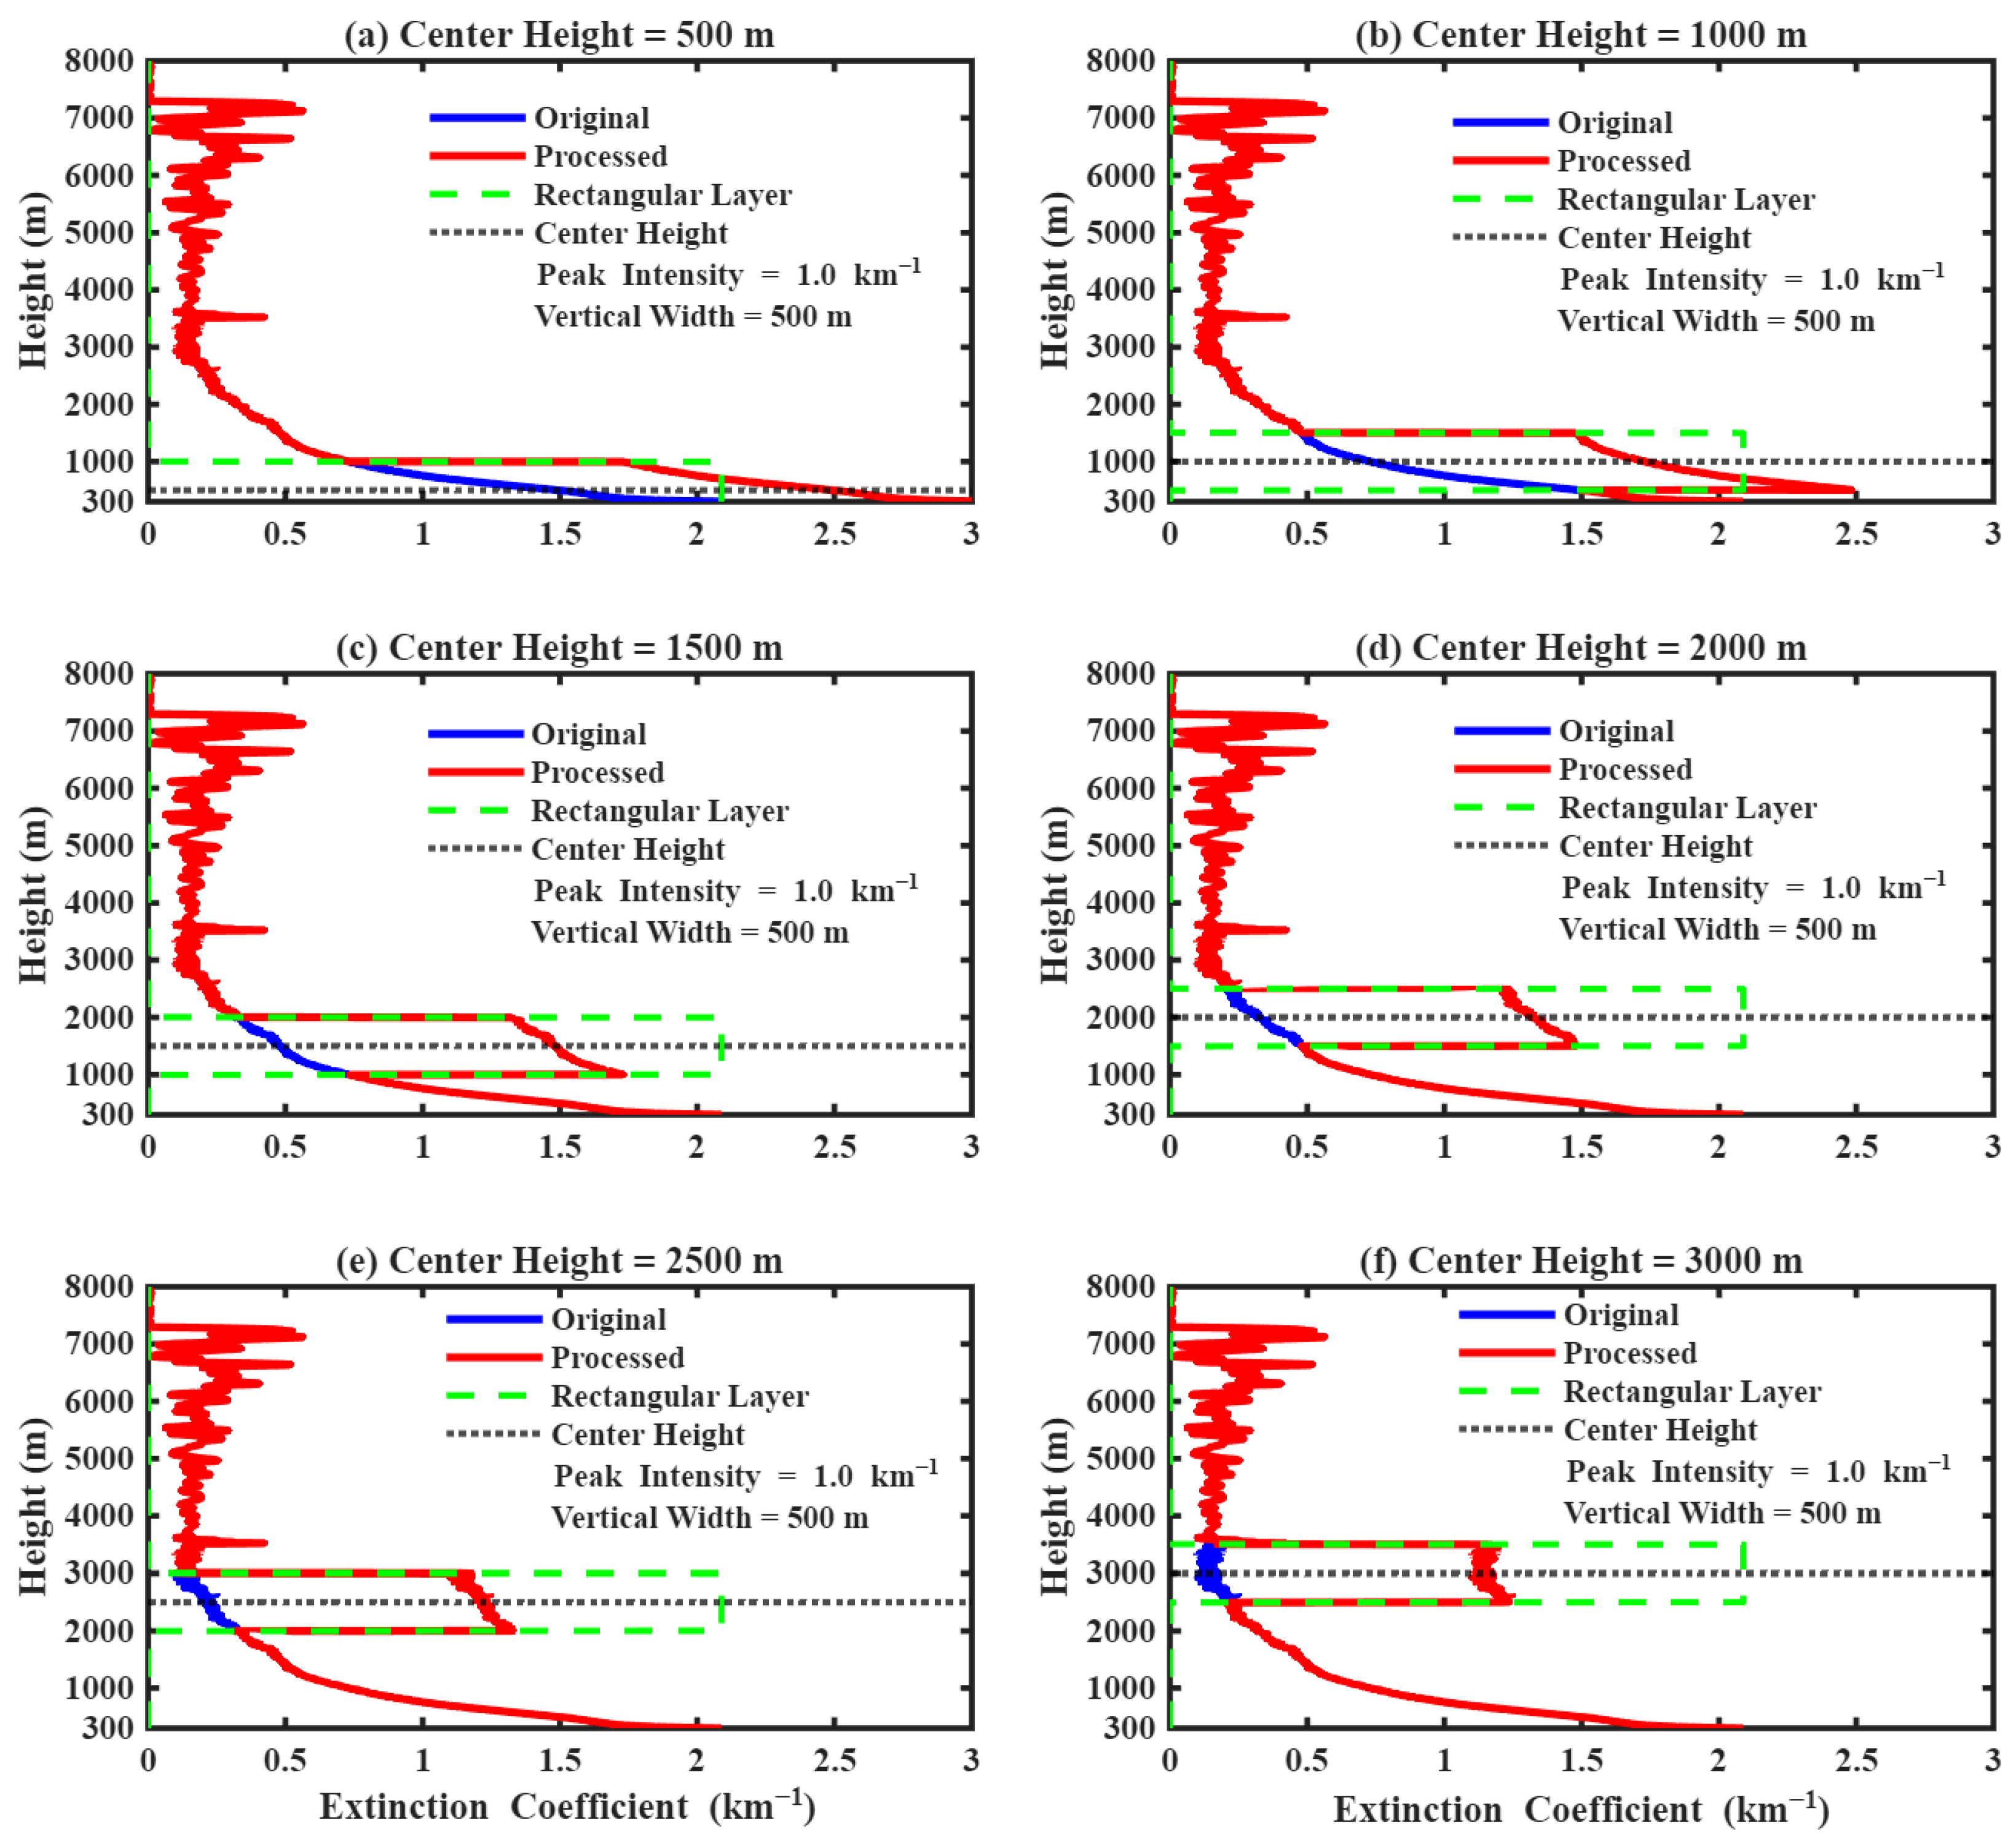
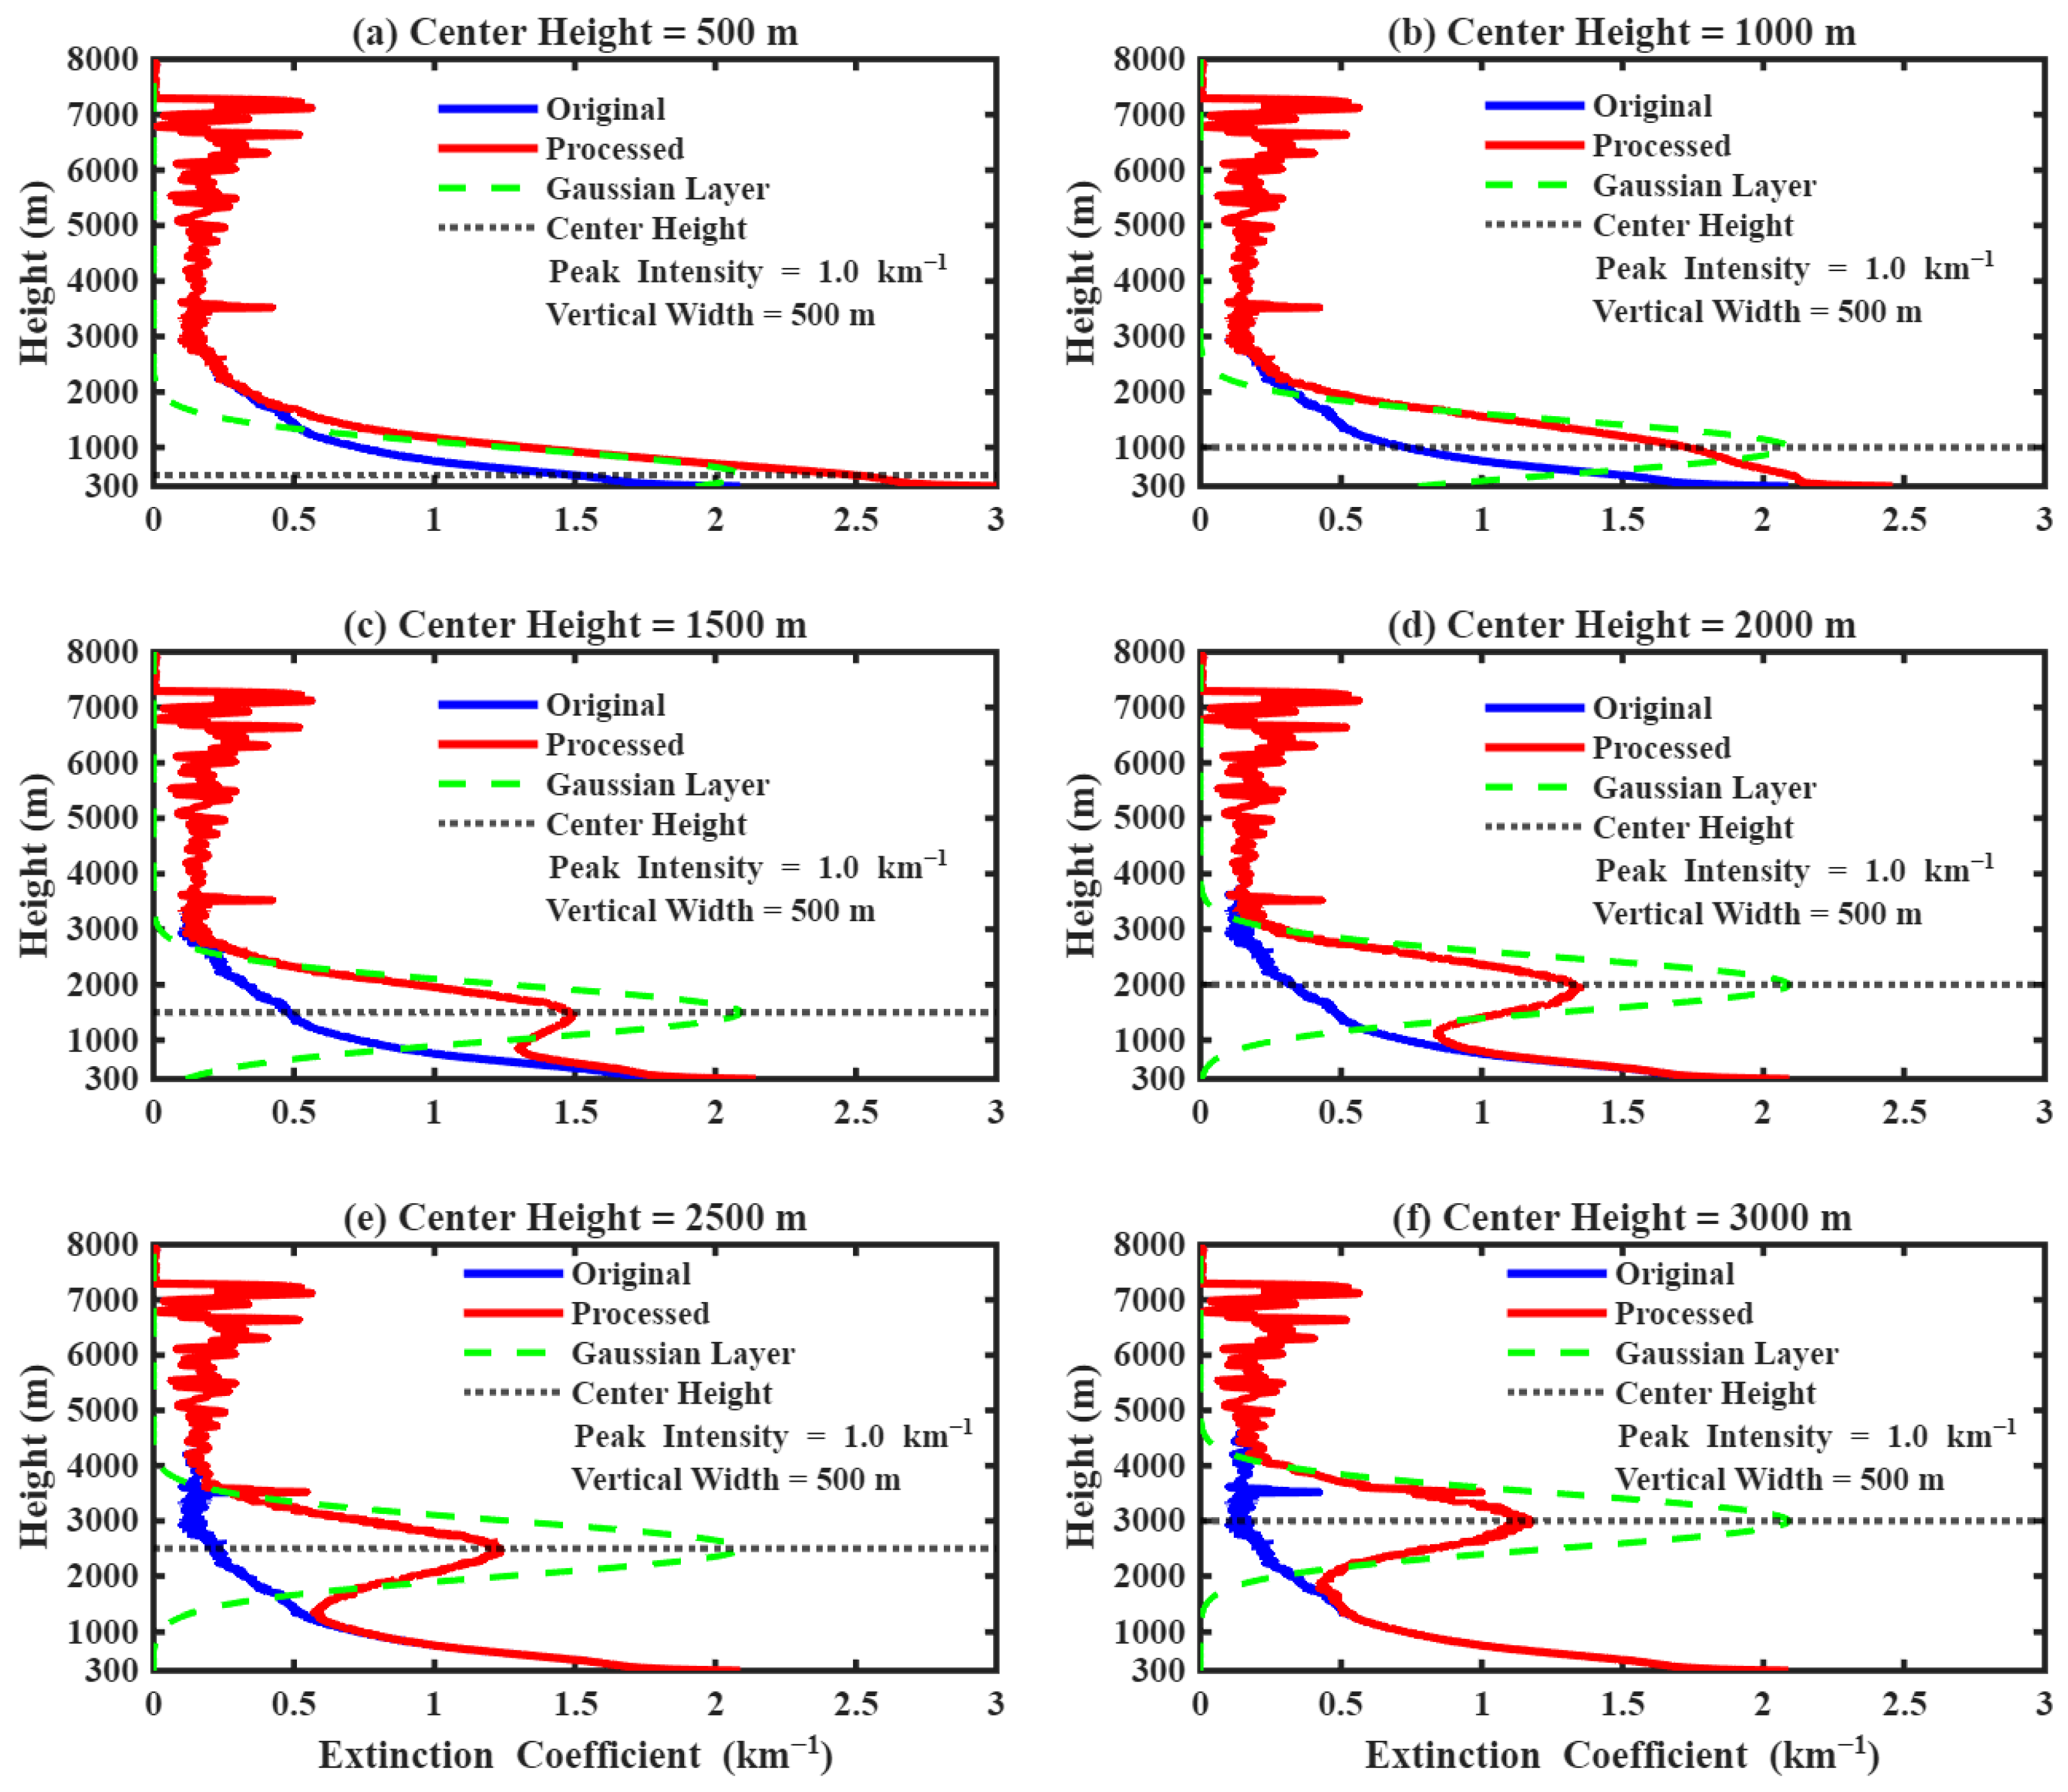
Figure 4a–f and Figure 5a–f show the extinction coefficient profiles (aerosol layer peak normalization) of Gaussian and rectangular distributions at different center heights (500 m, 1000 m, 1500 m, 2000 m, 2500 m, 3000 m), respectively. The change in the center height of the aerosol layer directly determines the location and intensity distribution of its disturbance to the atmospheric extinction profile. The original extinction coefficient profile exhibits a typical background decreasing distribution characteristic. The extinction coefficient decreases rapidly with increasing altitude, with the maximum value below 1 km and gradually approaching 0 above 3 km, reflecting the dominant extinction effect of near-surface atmospheric particulate matter and water vapor.
As can be seen from Figure 4, the superimposed aerosol layer profiles show a typical Gaussian distribution of “high in the middle and smoothly decaying on both sides”, and the morphology of the superimposed profiles shows significant differences with the change of the center height, and the distribution of optical thicknesses changes differently: with the increase in the center height, the deviation area of the superimposed profiles and the original profiles gradually shifts upward, and the optical thickness distribution near the center height is the largest. As can be seen from Figure 5, the superposed aerosol layer profiles show a typical rectangular distribution, and the superposed profiles show a platform extinction enhancement within the vertical width of the rectangular layer, and the extinction increment is constant. With the increase in the center height, the independent strong extinction layer is gradually shifted from the near-surface boundary layer to the middle and upper troposphere, which significantly changes the vertical structure of the original profiles.
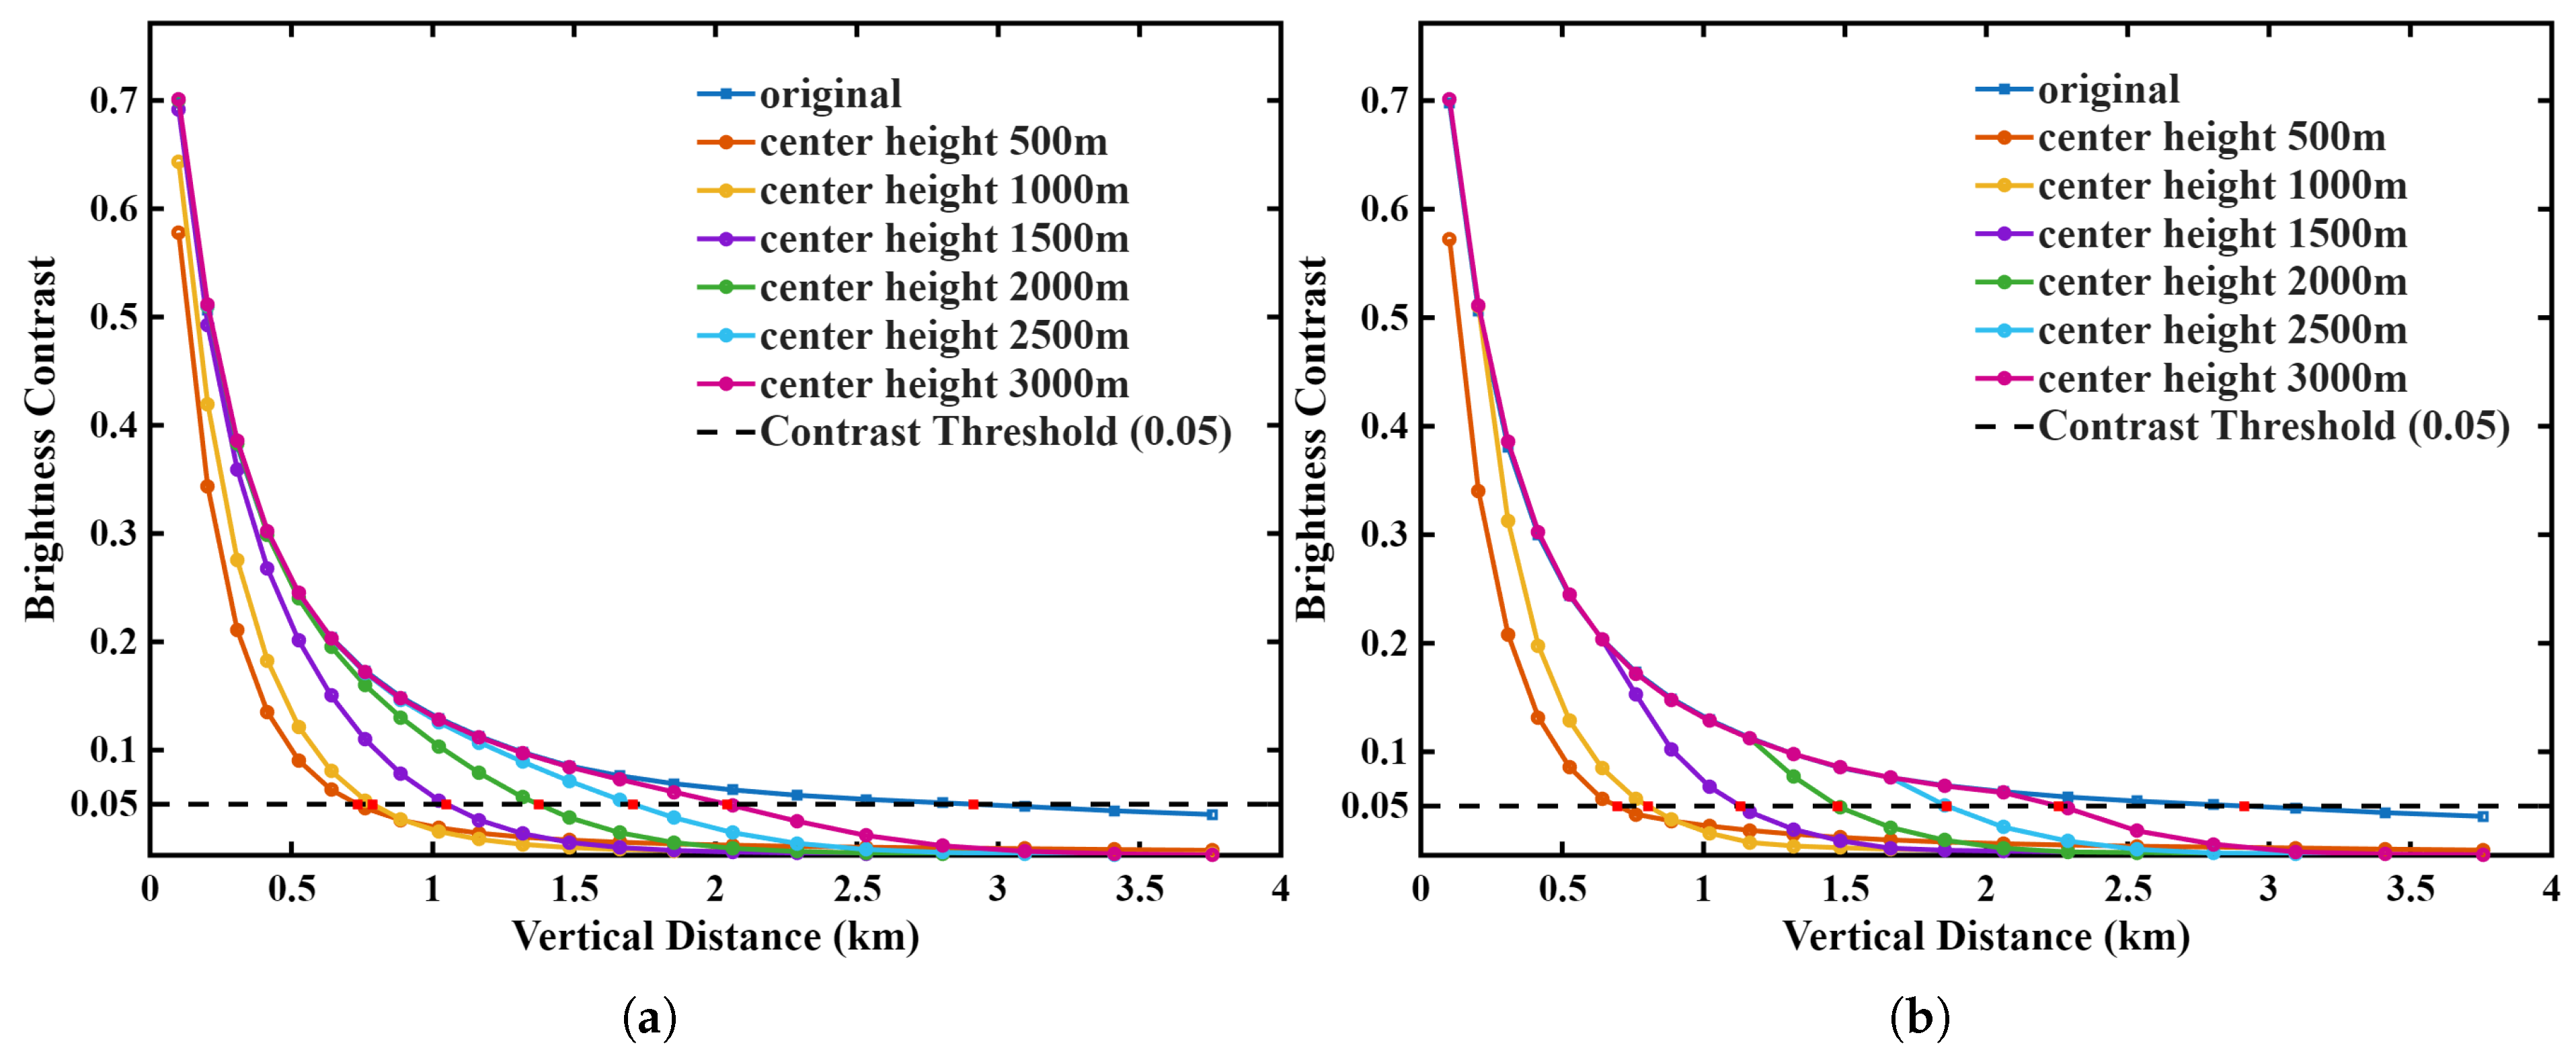
Figure 6a,b show the variation of apparent brightness contrast with vertical distance when Gaussian and rectangular aerosol layers are superimposed at different center heights, respectively. The results show that all the curves of the two distributions are below the original curves when the aerosol layer with a vertical width of 500 m and a peak intensity of 1.00 km−1 is superimposed, which indicates that the vertically layered aerosols accelerate the attenuation of the apparent brightness contrast significantly. In addition, the contrasts of both distributions decay monotonically with the increase in the observation distance, and the decay is nearly exponential within 1 km, and then slows down to 0 after 1 km. The closer the center height is to the observation height, the faster the contrast decay is, the steeper the curve decreases, and the shorter the vertical critical distance is when the recognition threshold of 0.05 is reached; with the rise of the center height, the decay rate slows down, and the critical distance increases gradually, and the difference between the curve and the original curve gradually decreases.
From Figure 6a, we can see that in the case of Gaussian distribution, the decay of apparent brightness contrast with vertical distance is relatively smooth, while the influence of the rectangular distribution shown in Figure 6b is more segmented: due to the constant extinction increment inside the layer and no additional extinction outside the layer, when the observation path does not completely pass through the rectangular layer, the curve is very small compared with the original curve; when the path enters into the coverage area of the rectangular layer, there is a phased accelerated decay of contrast, forming a steeper decline than the Gaussian distribution; when the center height is higher than 2000 m, the extinction effect of the rectangular layer on the near-surface observation path disappears, and the curve converges to the original profile, the recovery of the attenuation rate is faster than that of the Gaussian distribution, and the critical vertical distance returns to the level of the original aerosol layer at an early time, which shows that the effect of the rectangularly distributed aerosol layer is more localized, with a significant effect on contrast only in the altitude range where the path is fully traversed.
Further quantitative analysis of the two characteristic parameters of maximum apparent brightness contrast and slant visibility reveals that, under the condition of fixed peak intensity and vertical width, the increase in the height of the center of the aerosol layer has a significant slowing-down effect on the attenuation of the target apparent brightness contrast, and the maximum apparent brightness contrast and slant visibility show obvious regular changes.
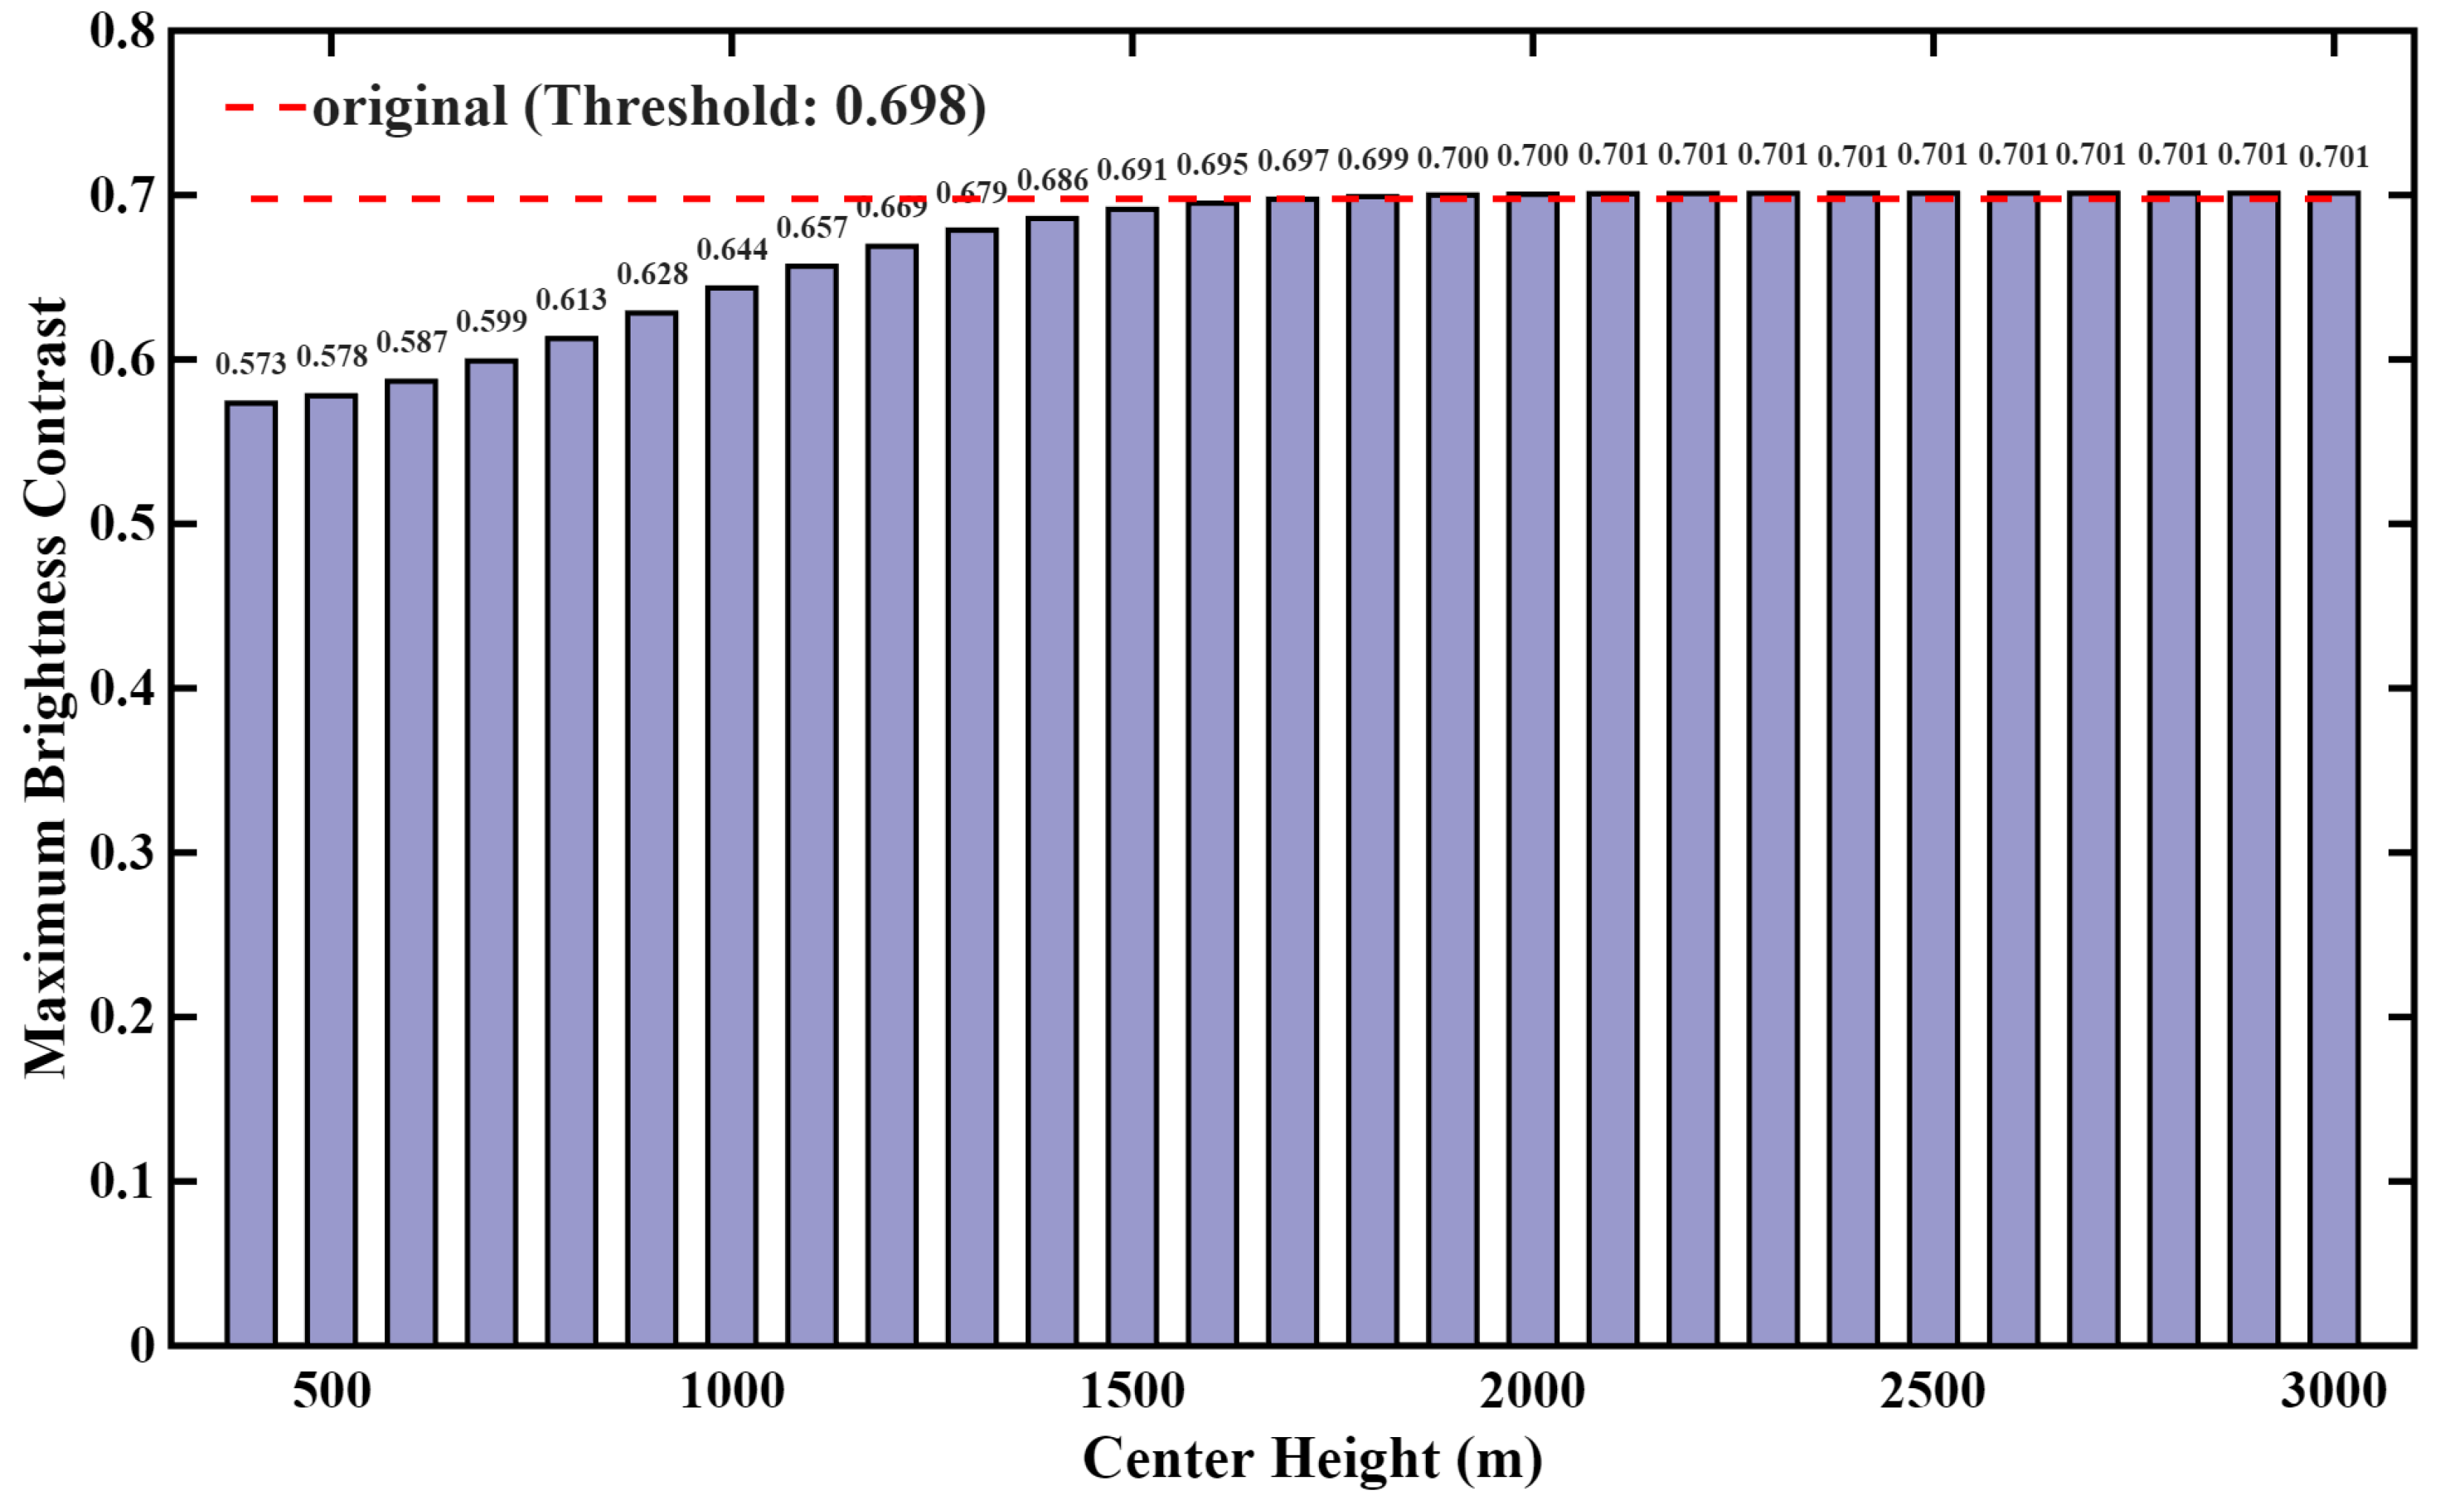
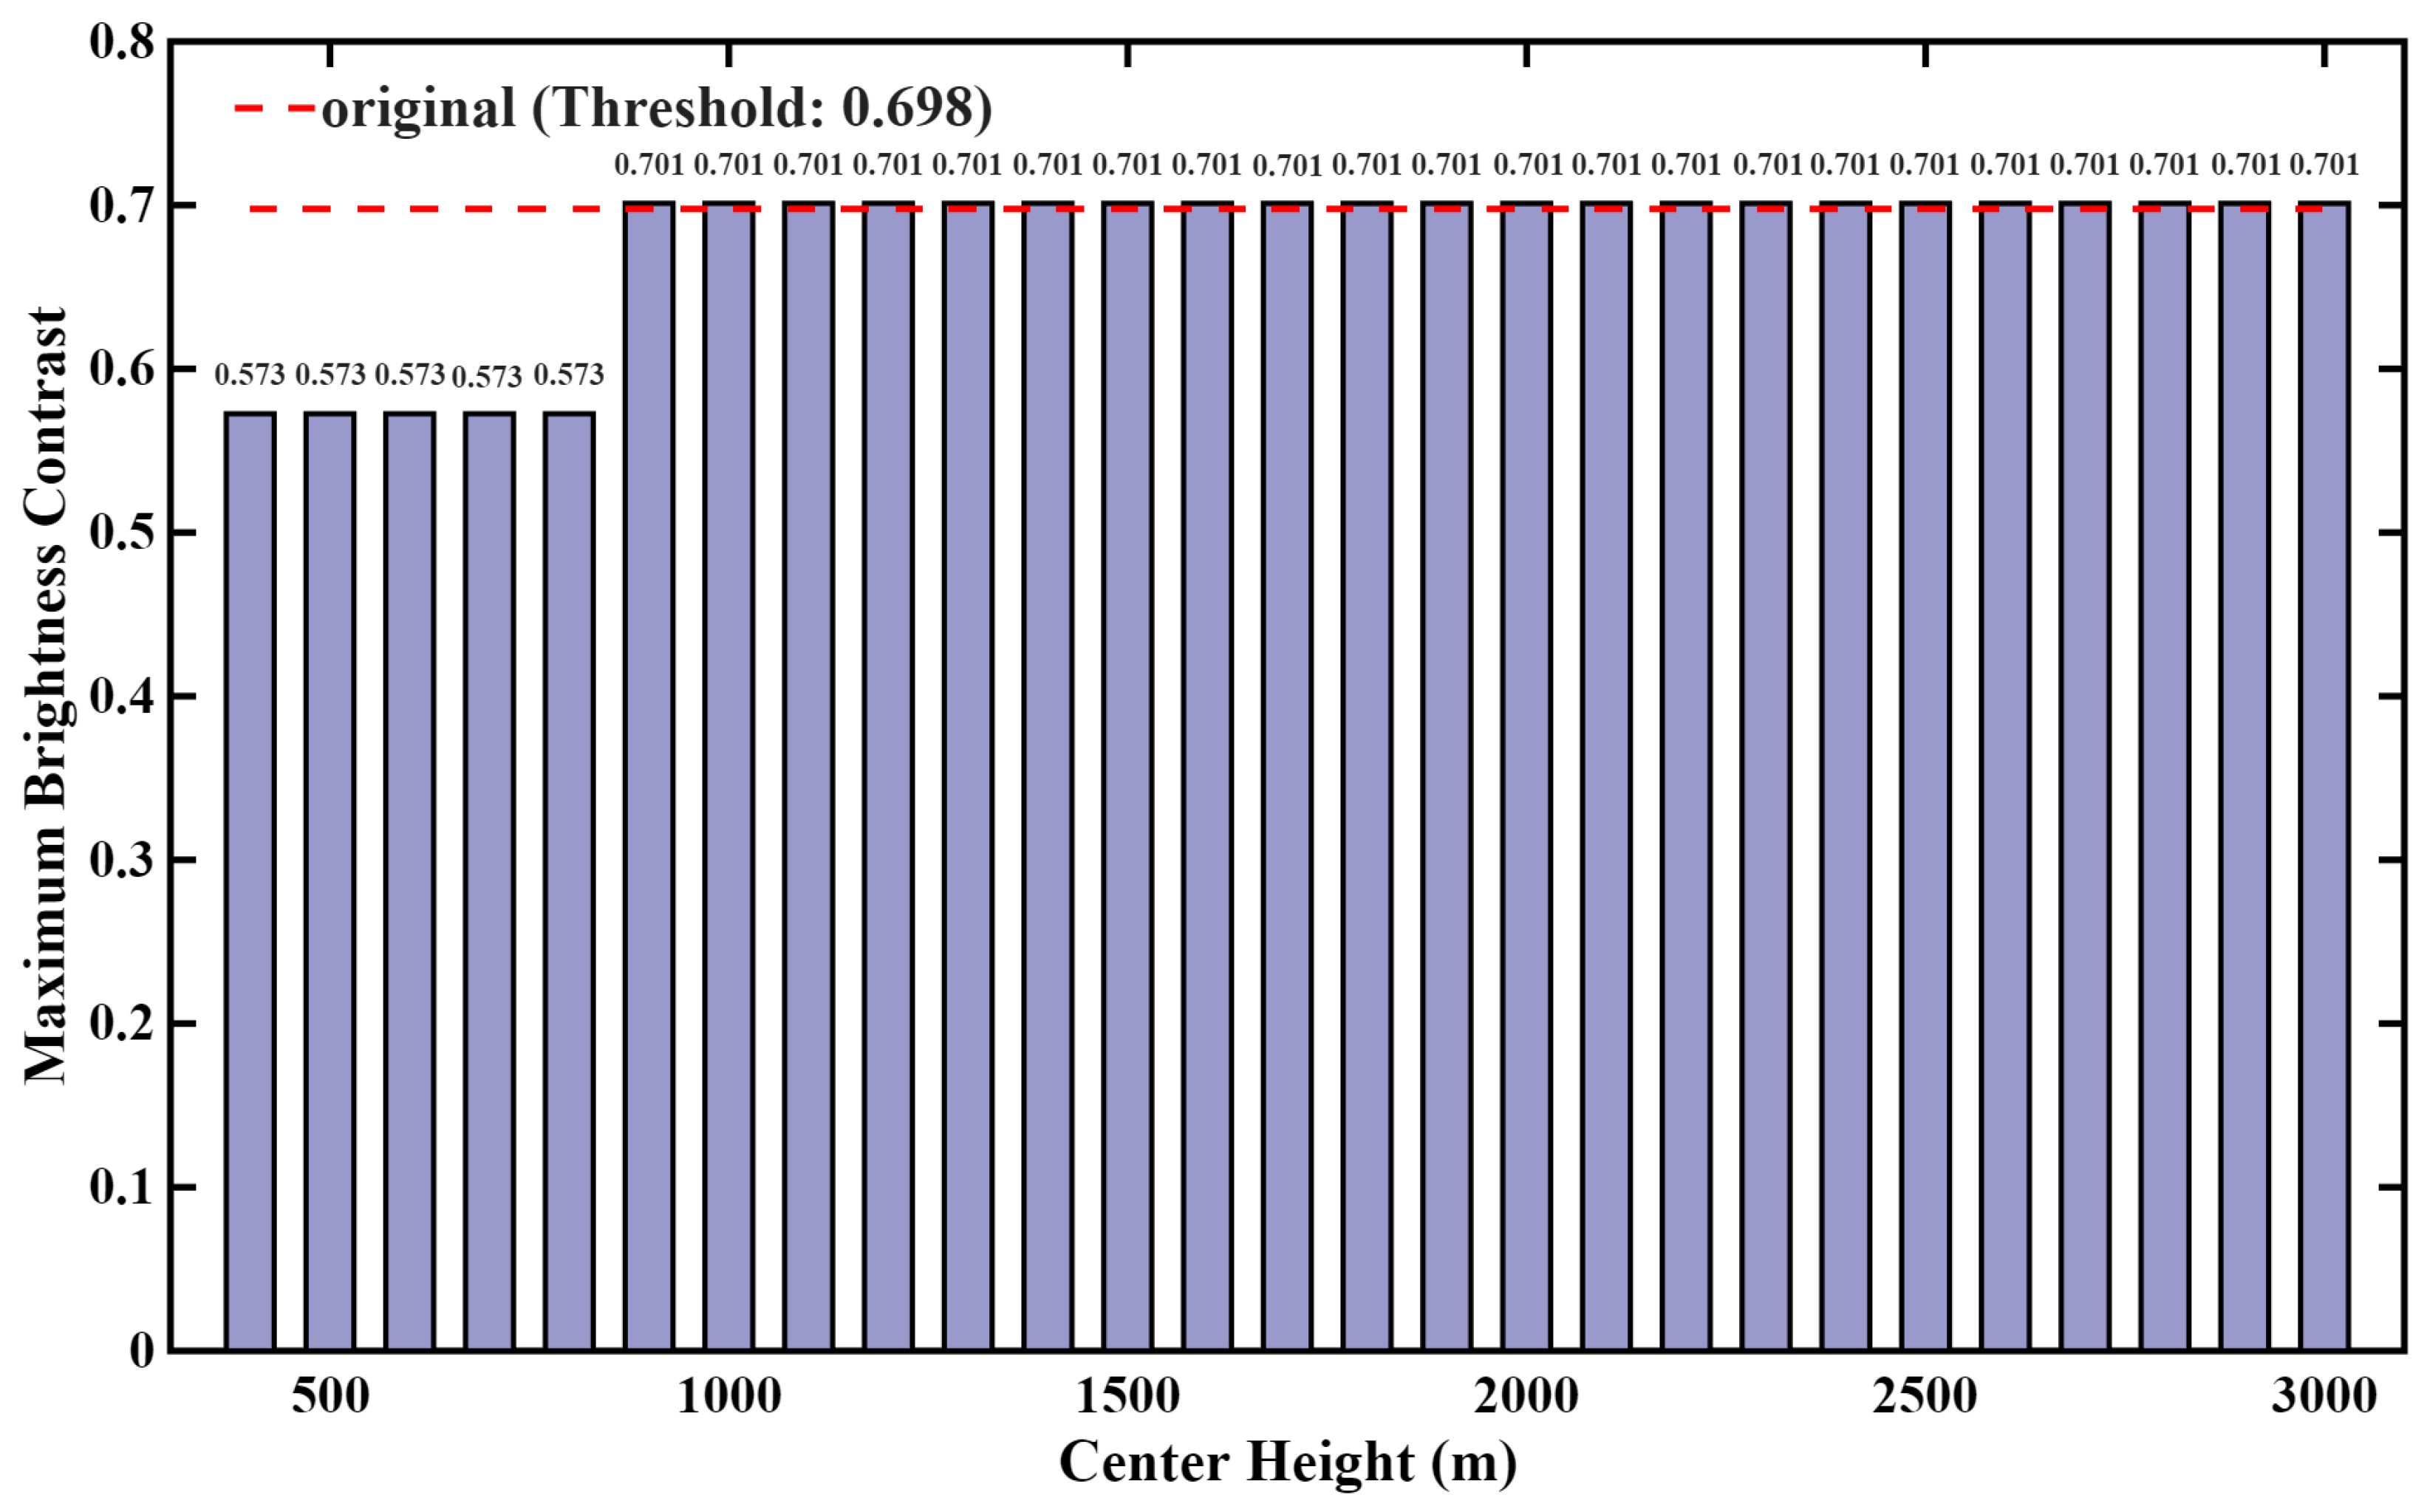
Figure 7 and Figure 8 show the effects of Gaussian and rectangular aerosol layers with different center heights on the maximum contrast, and the red dashed line shows the original maximum contrast (0.698) without other aerosol superimposed layers. Both distributions show that the maximum contrast increases monotonically with the elevation of the center height and gradually converges to the original level, indicating that the extinction effect of the aerosol layer on the near-surface target diminishes with the increase in the distance between the observation height and the center height, and the suppression of the maximum contrast also disappears gradually.
For the Gaussian distribution, it can be seen from Figure 7 that the maximum contrast shows a smooth and gradual recovery with the elevation of the center height: when the center height is 400 m, the maximum contrast decreases from 0.698 to 0.573, with a decrease of about 17.9%; with the elevation from 400 m to 2000 m, the contrast rises from 0.573 to 0.700, and recovers to the original level from 1700 m to 1800 m; after exceeding 2000 m, it stabilizes at 0.701, i.e., the attenuation effect on the near-surface visual luminance basically disappears. In contrast, Figure 8 shows that the effect of rectangular distribution shows a significant step change: in the range of 400–800 m center height, the maximum contrast is stable at 0.573, with a constant decrease of 17.9%; when the center height exceeds 800 m, the maximum contrast jumps directly from 0.573 to 0.701, and quickly returns to the original level, and remains at the same level at subsequent heights, which proves that the extinction effect of the rectangularly distributed aerosol layer is strictly localized, and the maximum contrast is suppressed only when the observation path passes through the inner region of the layer completely.
Figure 9 shows the effects of the center heights of Gaussian and rectangular aerosol layers on the slant visibility, in which the black dashed line is the original slant visibility (5.822 km) when there is no other aerosol layer superimposed. Overall, both distributions show that the visibility increases with the rise of the center height, and the visibility is much lower than the original level in the height range of 500 m–1000 m. With the rise of the center height, the visibility gradually recovers, but even at the highest center height of 3000 m, the visibility in both distributions (Gaussian distribution 4.08 km, rectangular distribution 4.51 km) is still not back to the original level.
The differences between the two distributions are mainly reflected in the following: 1. low center height section (400–900 m): the visibility of the rectangular distribution decreases more drastically, down to 1.36 km, which is about 5.6% shorter than that of the Gaussian distribution at the same altitude, which is 1.44 km. This is because the rectangular layer has a constant and concentrated extinction increment in the near-surface path, which has a stronger attenuation effect on the near-surface targets, while the Gaussian distribution has a more uniform effect on the path due to the smooth change of extinction increment, and the visibility decreases a little bit slower. 2. Medium and high center height section (1000–3000 m): with the rise of the center height, the visibility of the rectangular distribution recovers faster than that of the Gaussian distribution, and the difference between the two is widened gradually. At the center height of 2000 m, the visibility of the rectangular distribution is 2.95 km, which is about 7.3% higher than that of the Gaussian distribution of 2.75 km. At the center height of 3000 m, the visibility of the rectangular distribution of 4.51 km is about 10.5% higher than that of the Gaussian distribution of 4.08 km. This difference is due to the “localized” feature of the rectangular distribution: when the aerosol layer moves upward, its extinction effect is strictly limited to the inner region of the layer, and the part of the path that does not pass through is not affected; whereas the Gaussian distribution, due to the extension of the tail of extinction increment, has a wider influence on the path, which results in a slower recovery of the visibility. On the whole, the distribution pattern of aerosol layers significantly affects the slant visibility change characteristics: the rectangular distribution has a stronger compression effect on visibility at low center heights, but its effect decreases rapidly with the rise of the center height, while the Gaussian distribution has a more persistent effect, and the recovery of visibility is more gradual.
The core physical mechanism of this law is as follows: the center height of the aerosol layer determines its relative vertical position to the observation point, no matter the superposition of aerosol layer is Gaussian or rectangular distribution, the closer the center height is to the observation height, the greater the optical thickness of the aerosol on the path of the light transmission, the stronger the extinction effect is, the faster the contrast attenuation is, and the target will be lower than the recognition threshold within a short distance. On the contrary, the higher the center height is, the weaker the extinction is, the slower the contrast decay is, and the visibility on the slant course is gradually recovered. However, there are significant differences in the influence patterns of the two distributions: the rectangular aerosol layer has a strictly localized influence on the path due to the constant extinction increment within the layer, and only compresses the apparent luminance contrast and slant visibility when the observation path passes completely through the layer, and once the lower boundary of the layer is out of the near-surface observation path, its influence decreases rapidly, and slant visibility recovers approximately linearly with the height increase; whereas, the Gaussian layer has a linear recovery with the height increase. On the other hand, the Gaussian distribution has a smooth bell-shaped distribution of extinction increments, and the extinction effect extends upward and downward through the tails, which affects the paths in a wider range, and even if the center height is far away from the observation height, the extinction in the tails still affects the paths in a sustained way, resulting in a relatively slower recovery of the slant visibility.
In summary, the center height of the aerosol layer regulates the contrast decay law by changing the extinction length on the path, and the effect is constrained by the distribution pattern: the closer the center height is to the observation height, the stronger the extinction is, and the worse the target visibility is; on the contrary, the extinction is weakened, and the visibility is improved. Comparing the two distributions, it can be seen that the rectangular distribution has a stronger compression effect on the low-altitude paths, while the Gaussian distribution has a more persistent effect.

3.2. Effect of Different Vertical Widths on Apparent Brightness Contrast Attenuation

To investigate the regulatory mechanism of the vertical coverage of the aerosol layer on the apparent brightness contrast, this section fixed the peak intensity of the superimposed aerosol layer at 1.0 km−1 and the center height at 2000 m, and gradually increased the vertical width with a step of 250 m from 250 m to 3000 m, and analyzed the variation characteristics of apparent brightness contrast with vertical distance when superimposing aerosol layers of different vertical widths.
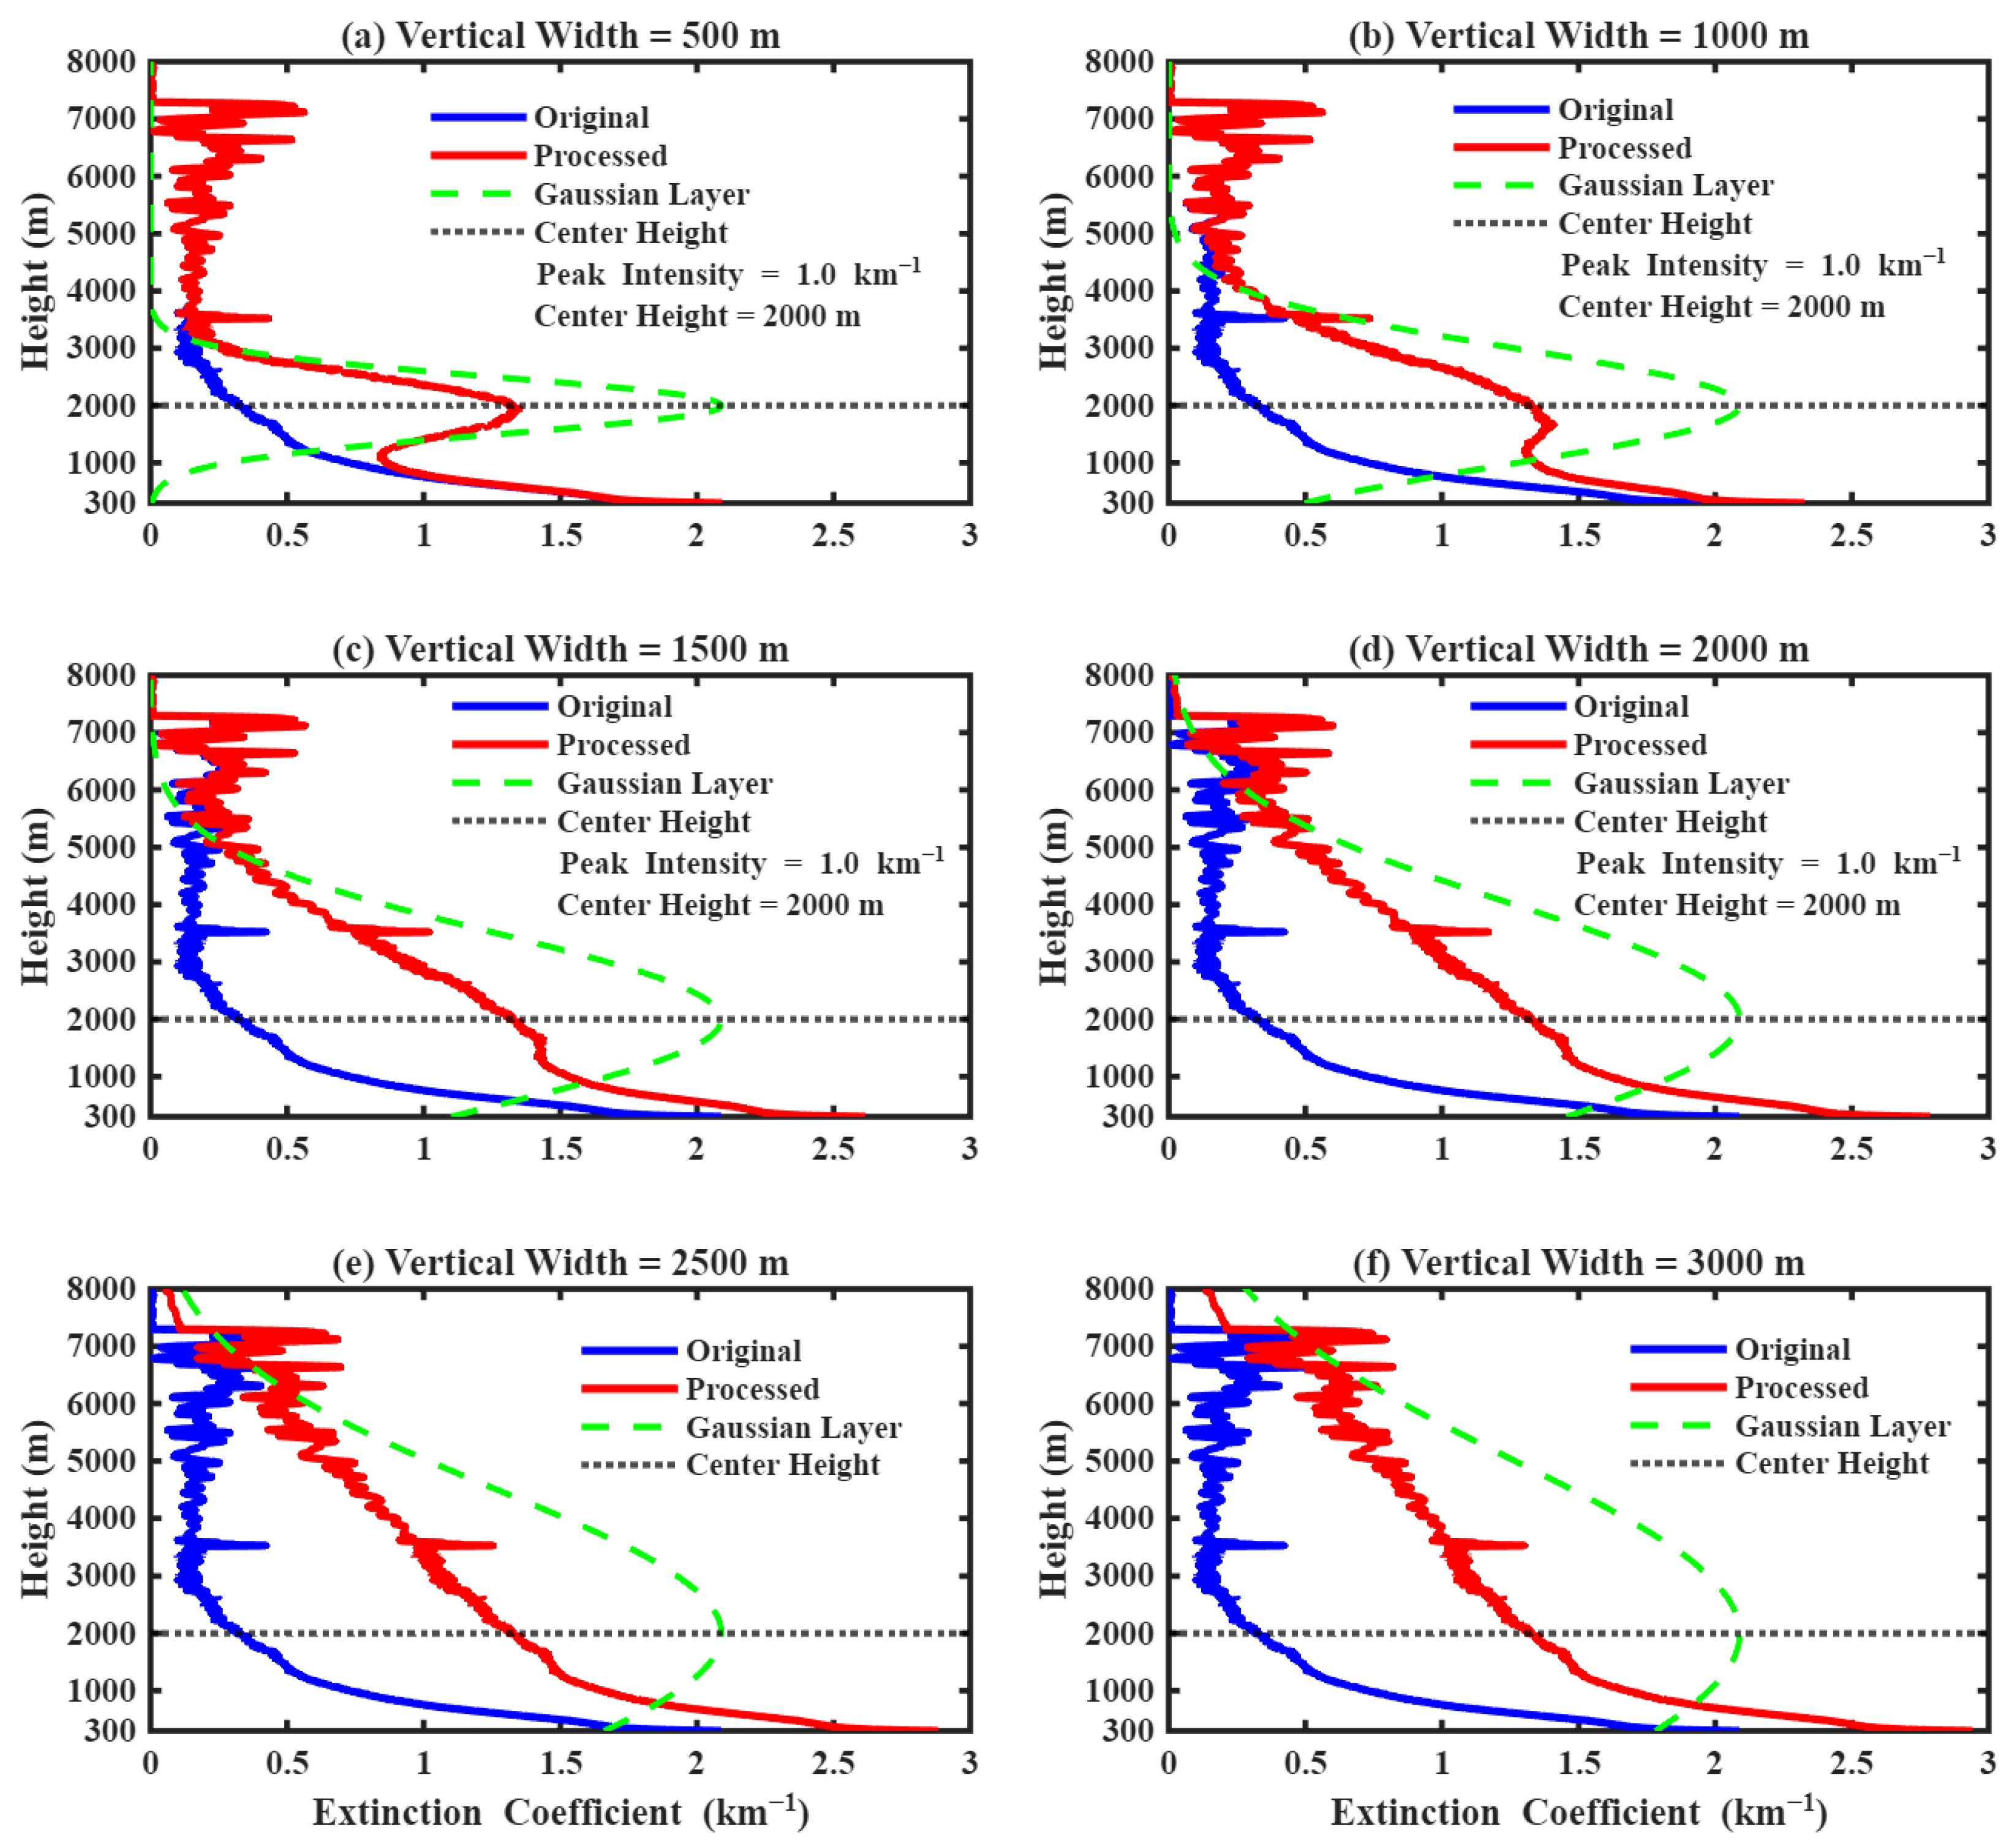
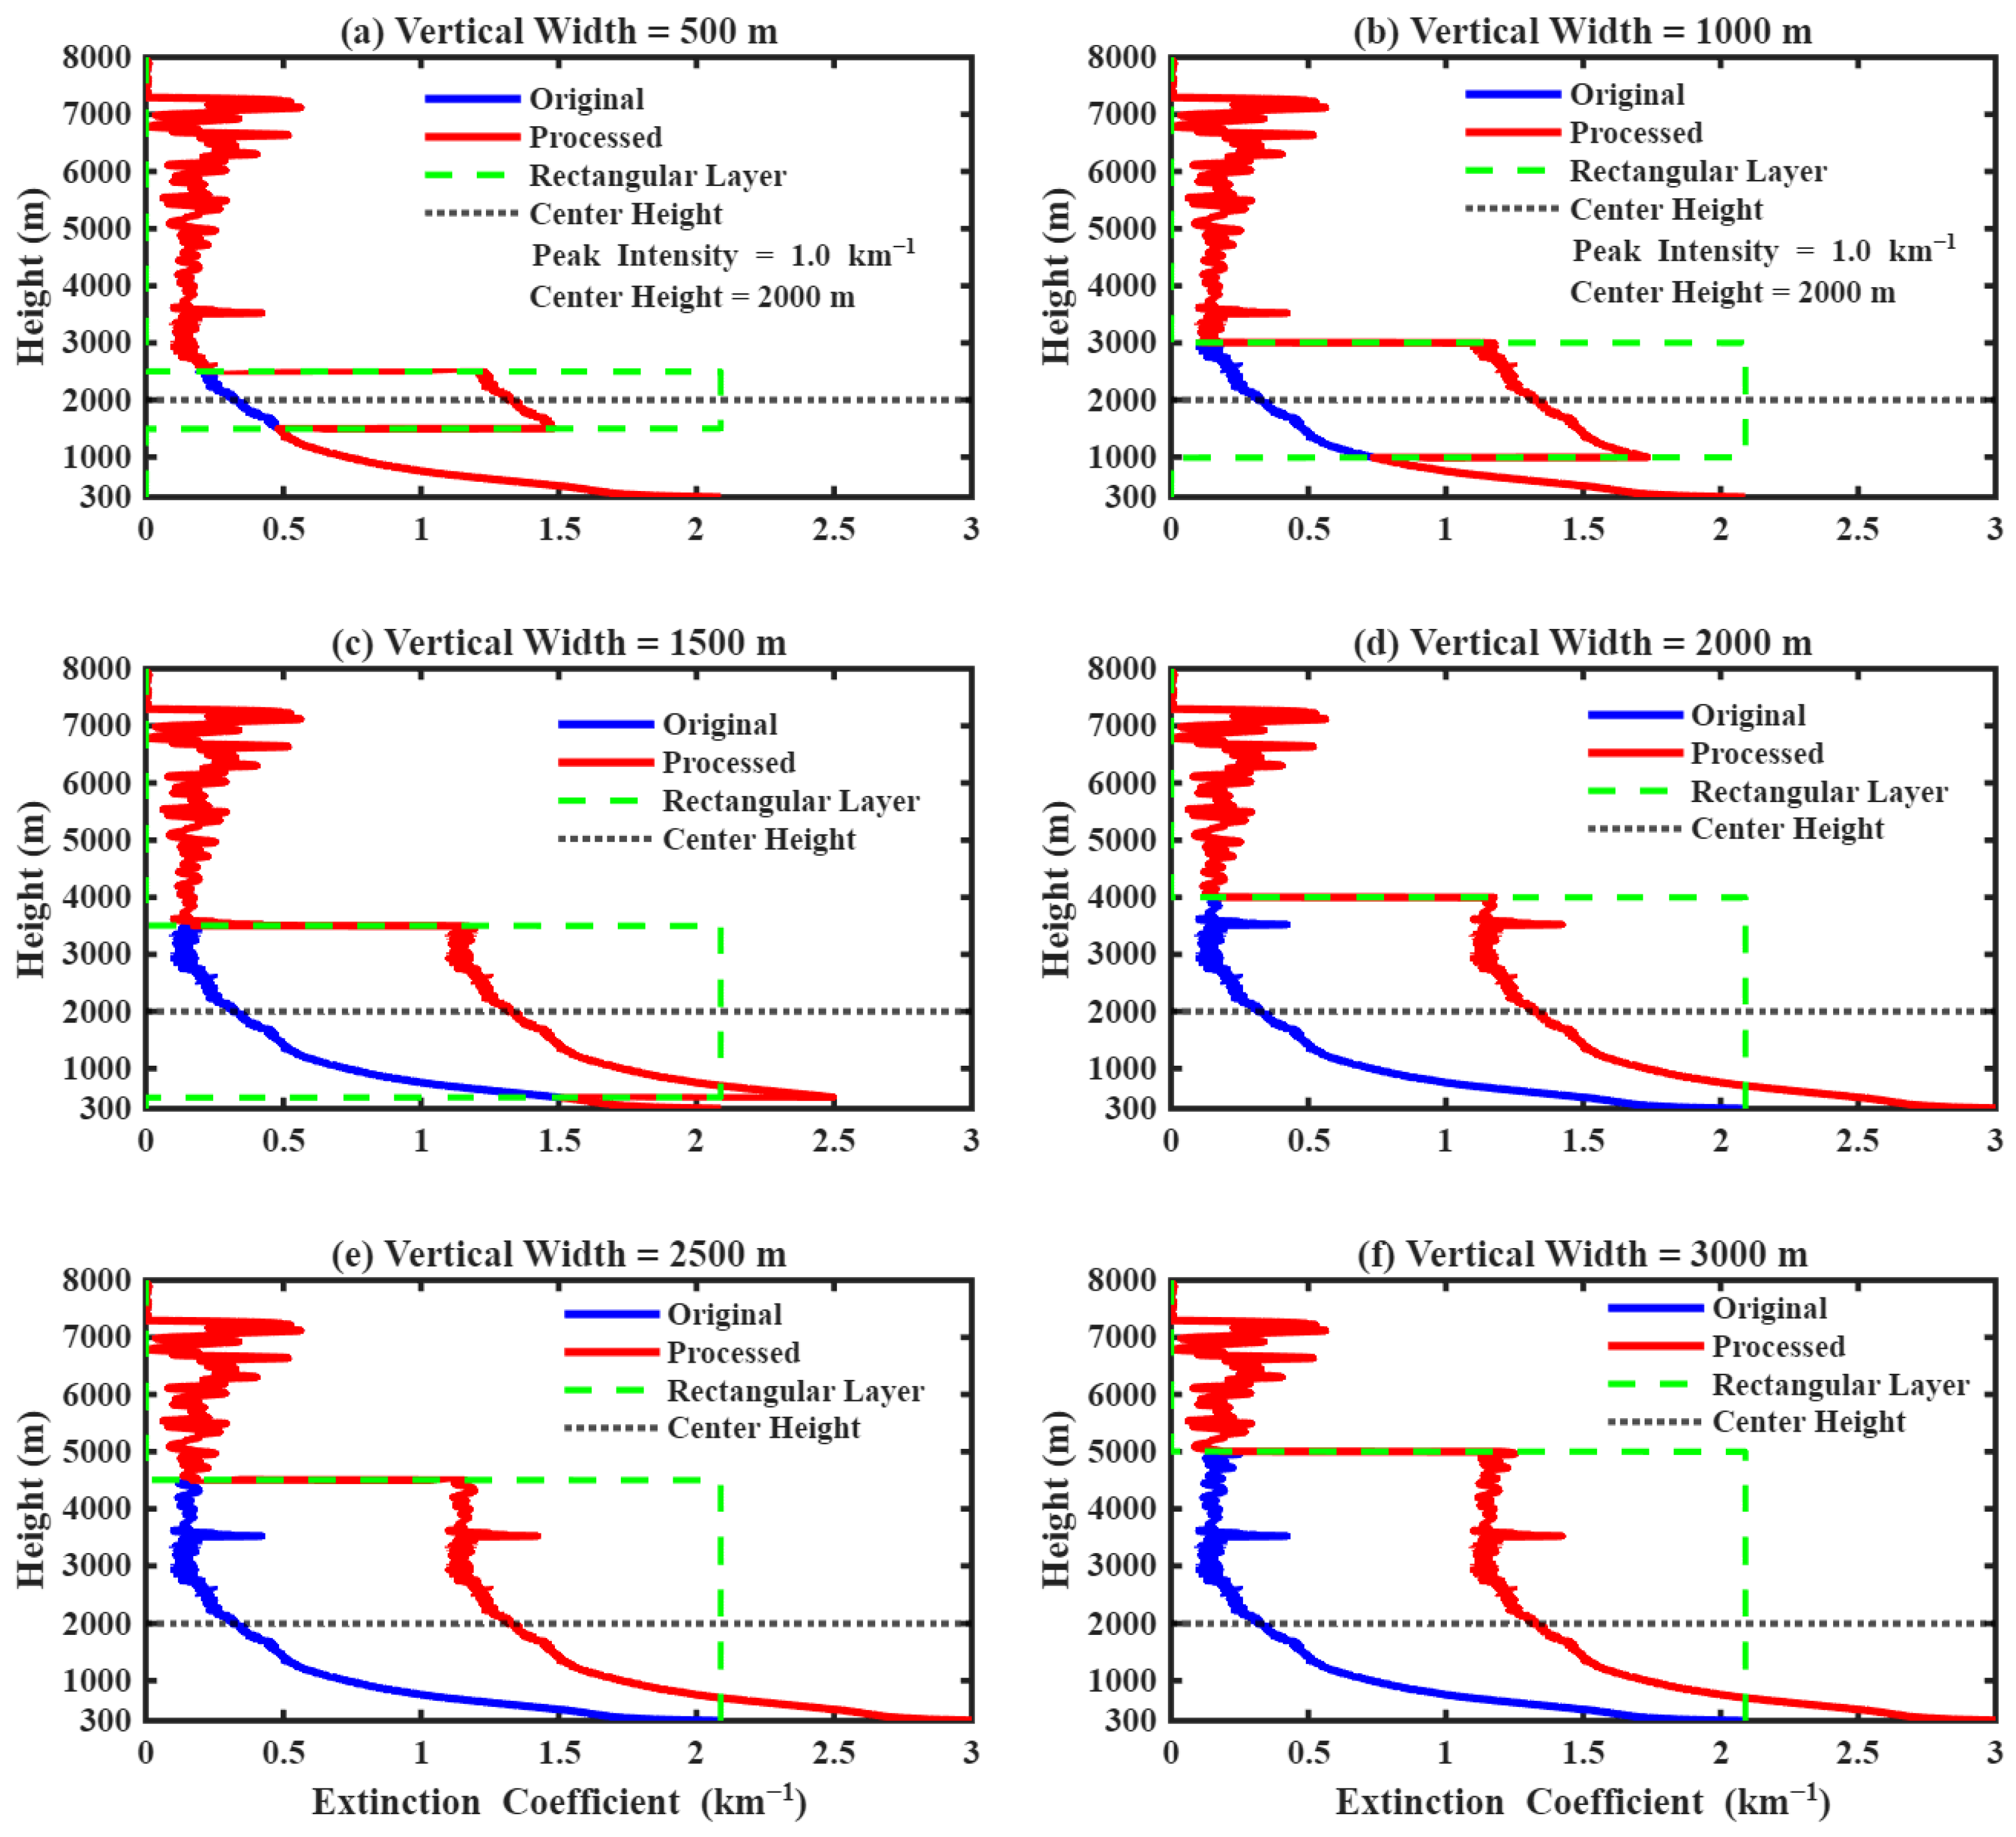
Figure 10a–f and Figure 11a–f show the extinction coefficient profiles (aerosol layer peak normalization) of Gaussian and rectangular distributions at different vertical widths (500 m, 1000 m, 1500 m, 2000 m, 2500 m, 3000 m), respectively. The variation in the vertical width of the aerosol layer directly determines the range and intensity distribution of its disturbance to the atmospheric extinction profile. The original profile still exhibits the typical distribution characteristics of high values near the ground and rapid decay with increasing altitude, representing the reference extinction structure without aerosol interference.
As can be seen in Figure 10, the morphology of the original profiles with different vertical widths of the Gaussian aerosol layer is significantly different from that of the original profiles: when the vertical width is 500 m, the morphology of the superimposed contours is relatively sharp, and the deviation from the original profiles is the narrowest; with the gradual increase in the vertical width, the deviation from the original profiles gradually expands to the upper and lower sides, and the incremental coverage of the extinction coefficients expands continuously; when the vertical width is increased to 2000–3000 m, the uplifted area of the superimposed contours almost covers the main extinction intervals of the original profiles, and the perturbation to the overall extinction structure reaches the strongest, with the largest degree of deviation from the original profiles. As can be seen from Figure 11, when the vertical width of the rectangular aerosol layer is 500 m, the superposed contours only form a narrow uniform extinction platform near the center height of 2000 m, and the outer contour of the platform coincides with the original profile; with the gradual increase in the vertical width, the upper and lower boundaries of the rectangular layer are extended to the high altitude and near the ground, the vertical coverage of the extinction platform is expanding, the extinction increment in the platform remains constant, and the boundary of the contour lifting area is always clear. When the vertical width increases to 2000–3000 m, the lower boundary of the rectangular layer extends to the near ground, the upper boundary covers the middle and upper troposphere, and the whole observation path is covered by the uniform extinction area, and the disturbance of the extinction platform reaches its strongest.
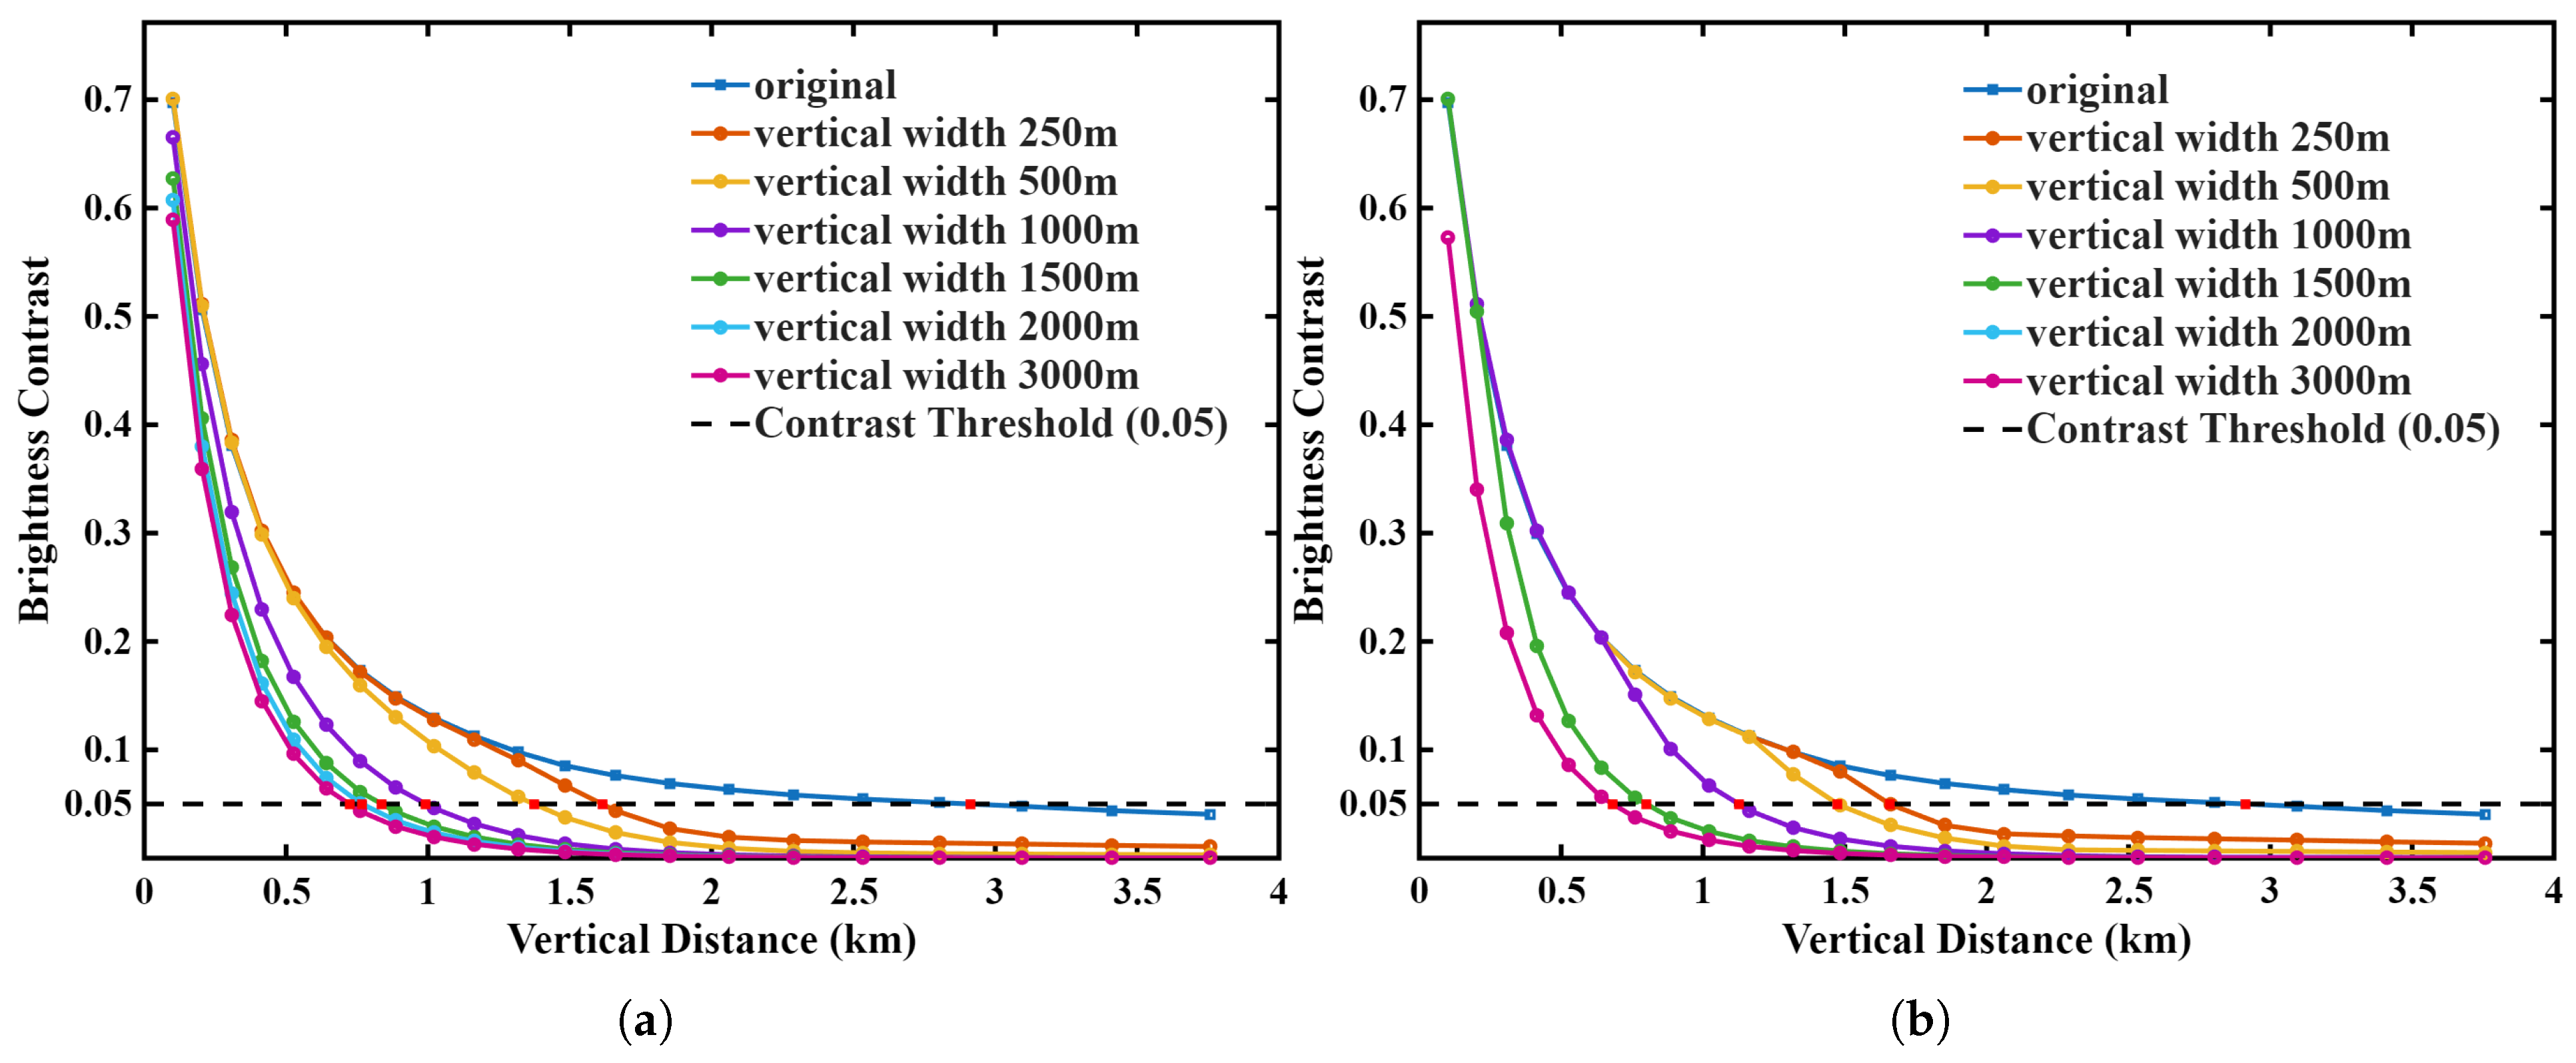
Figure 12a,b show the variation in apparent brightness contrast with vertical distance when Gaussian and rectangular aerosol layers are superimposed under different vertical widths, respectively. The results show that all the curves of the two distributions are located below the original curves after superimposing an aerosol layer with a center height of 2000 m and a peak intensity of 1.0 km−1. The larger the vertical width of the aerosol layer is, the greater the degree of attenuation of the apparent brightness contrast is, the more obvious is the enhancement of the attenuation rate, and the smaller is the visible range of the target.
It can be seen from Figure 12a that, for the Gaussian-distributed aerosol layer, the contrast attenuation shows a smooth and gradual change with the increase in vertical width: when the width is small, the extinction increment is concentrated near the center height, which has a limited effect on the path as a whole, and the curve has a small difference with the original curve; as the width increases, the tail effect of the extinction increment extends to the near ground, the effective extinction length on the path continues to increase, the overall contrast curve is shifted downward, the decay rate is accelerated gradually, and the critical vertical distance is shortened greatly; when the vertical width continues to increase from 1500 m to 3000 m, the slope of the attenuation at the near distance is still steepening, but the downward offset of the curve is decreasing. From Figure 12b, it can be seen that for the rectangular aerosol layer, when the vertical width is small, the curve only shows a short accelerated decay when the path enters into the layer; as the width increases, the lower boundary of the rectangular layer expands near the ground, the length of the uniform extinction section that the path passes through increases, and the decreasing section of the contrast curve advances; when the width is large enough, the whole observation path is covered by the uniform extinction area, and the contrast decreases sharply in the near distance.
Further quantitative analysis showed that the vertical width of the aerosol layer was significantly correlated with the maximum brightness contrast and the slant visibility at a fixed peak intensity and center height, and each parameter showed a regular decreasing characteristic with increasing width.
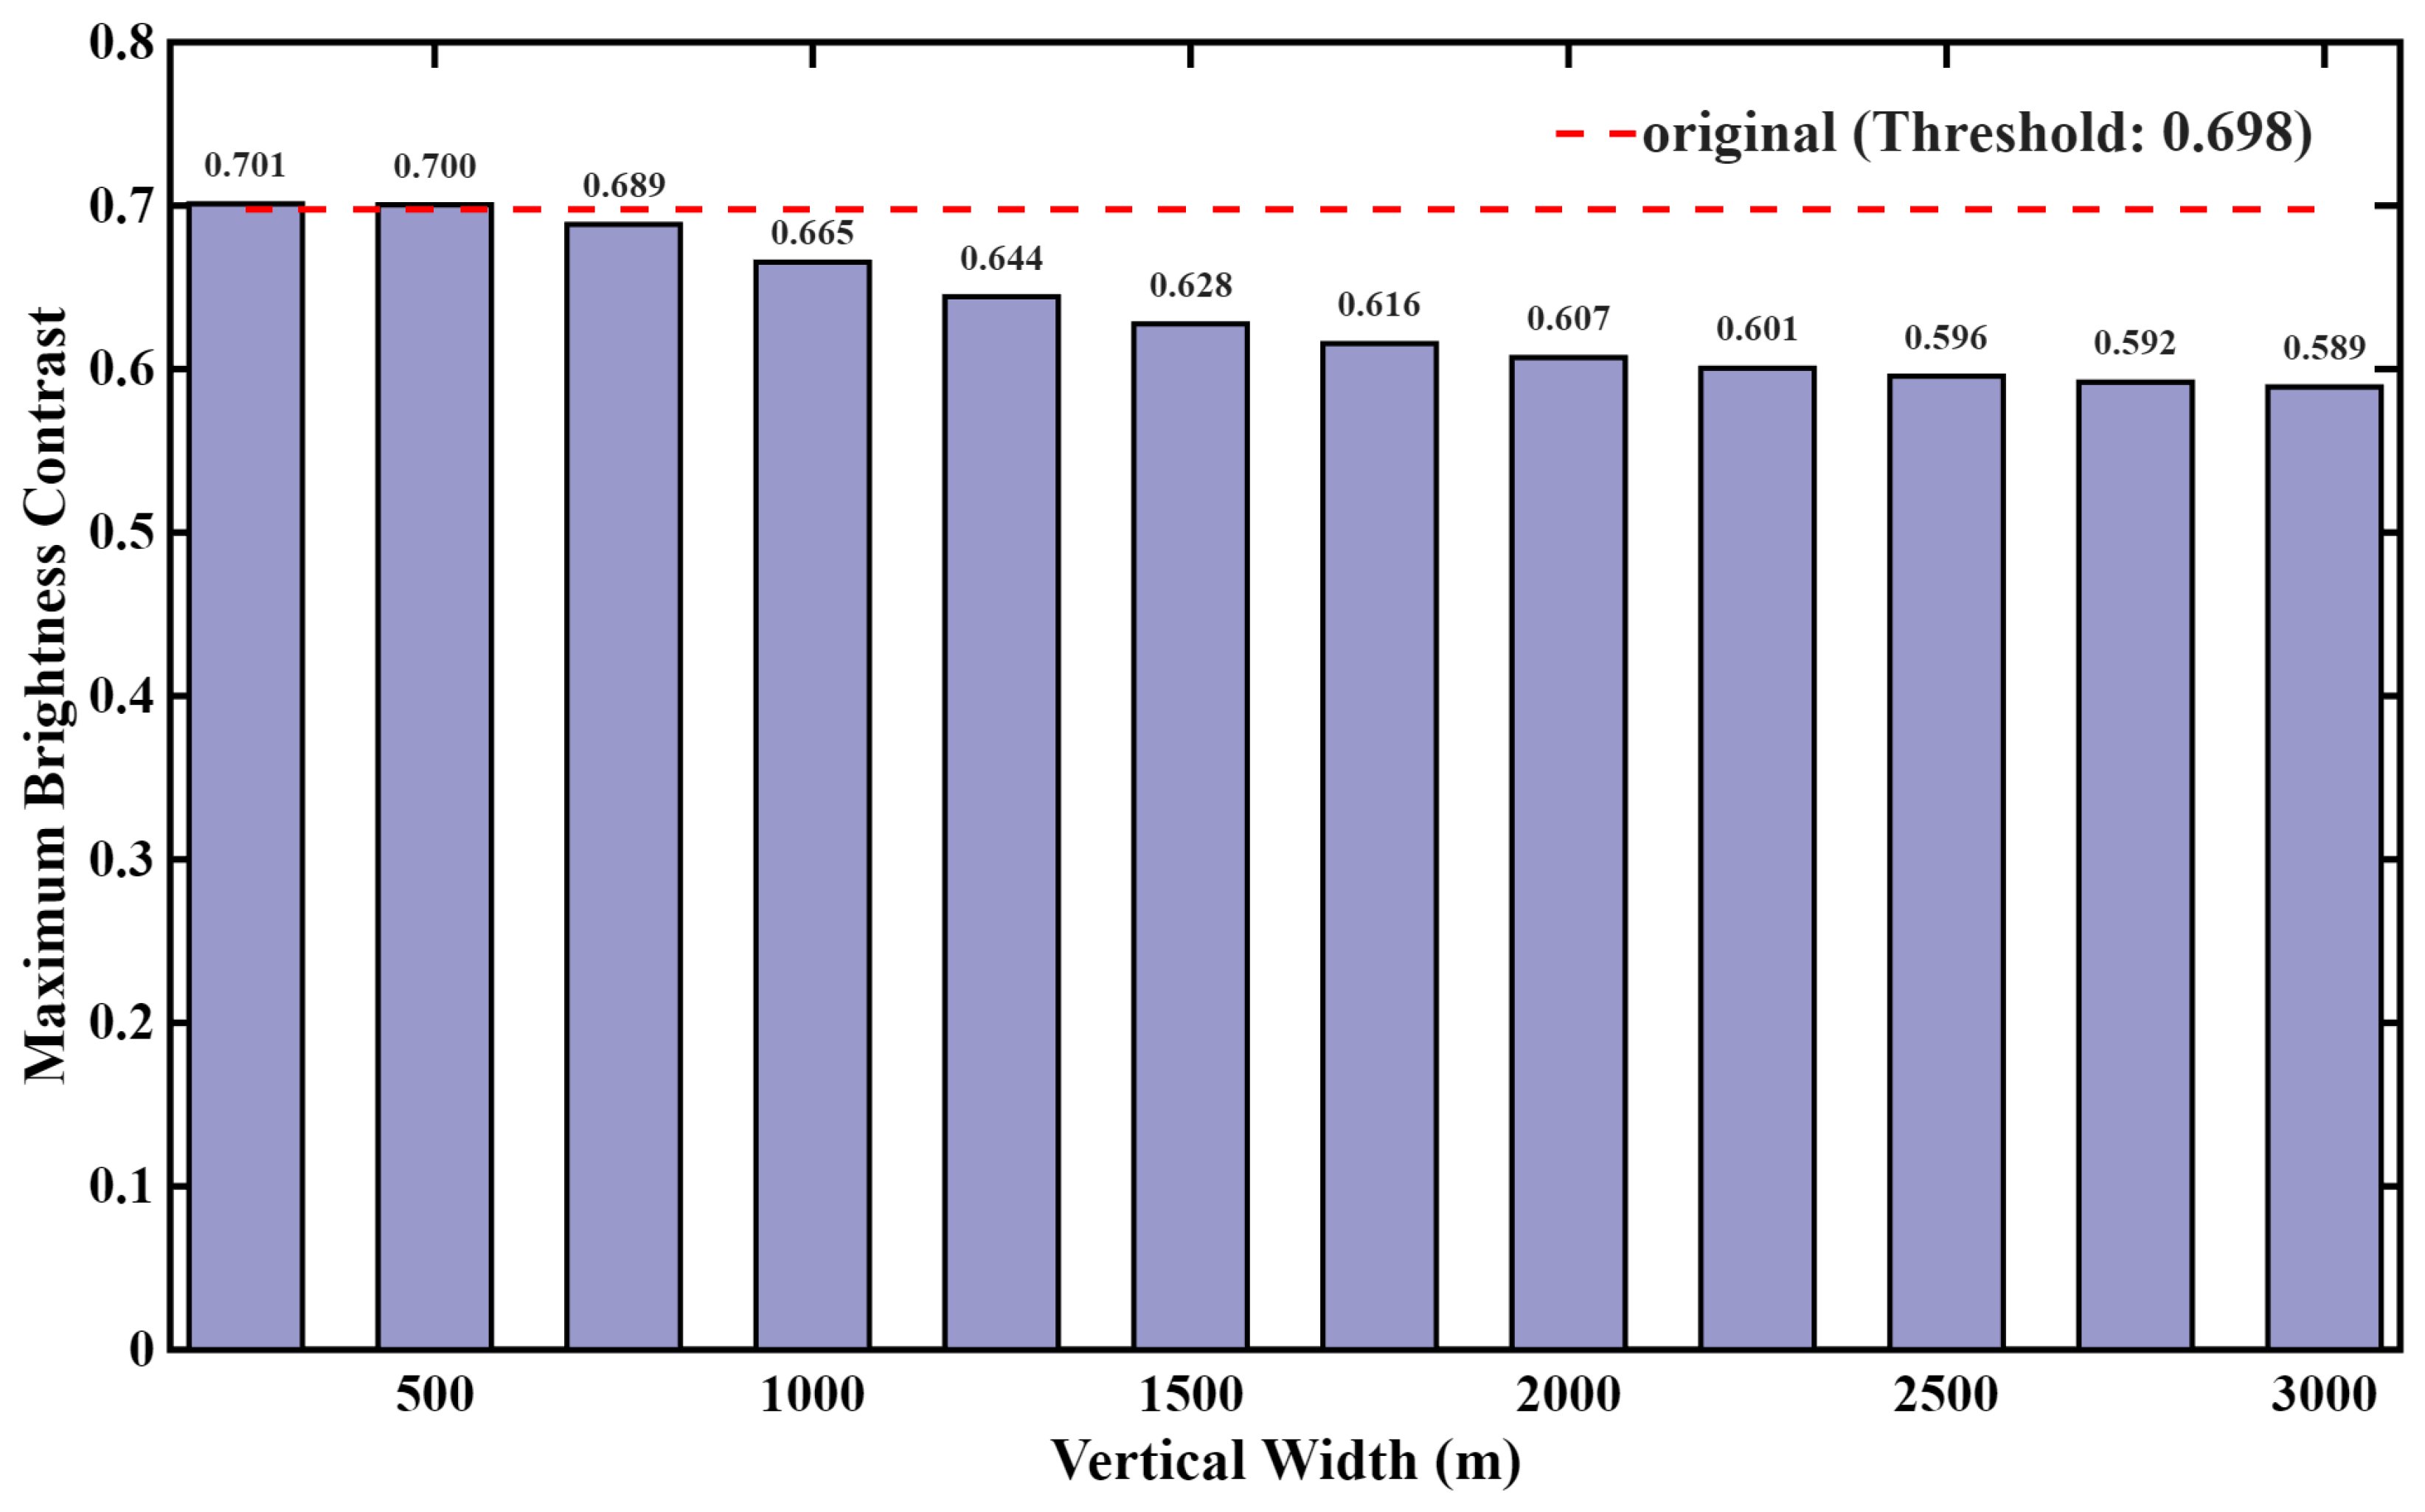
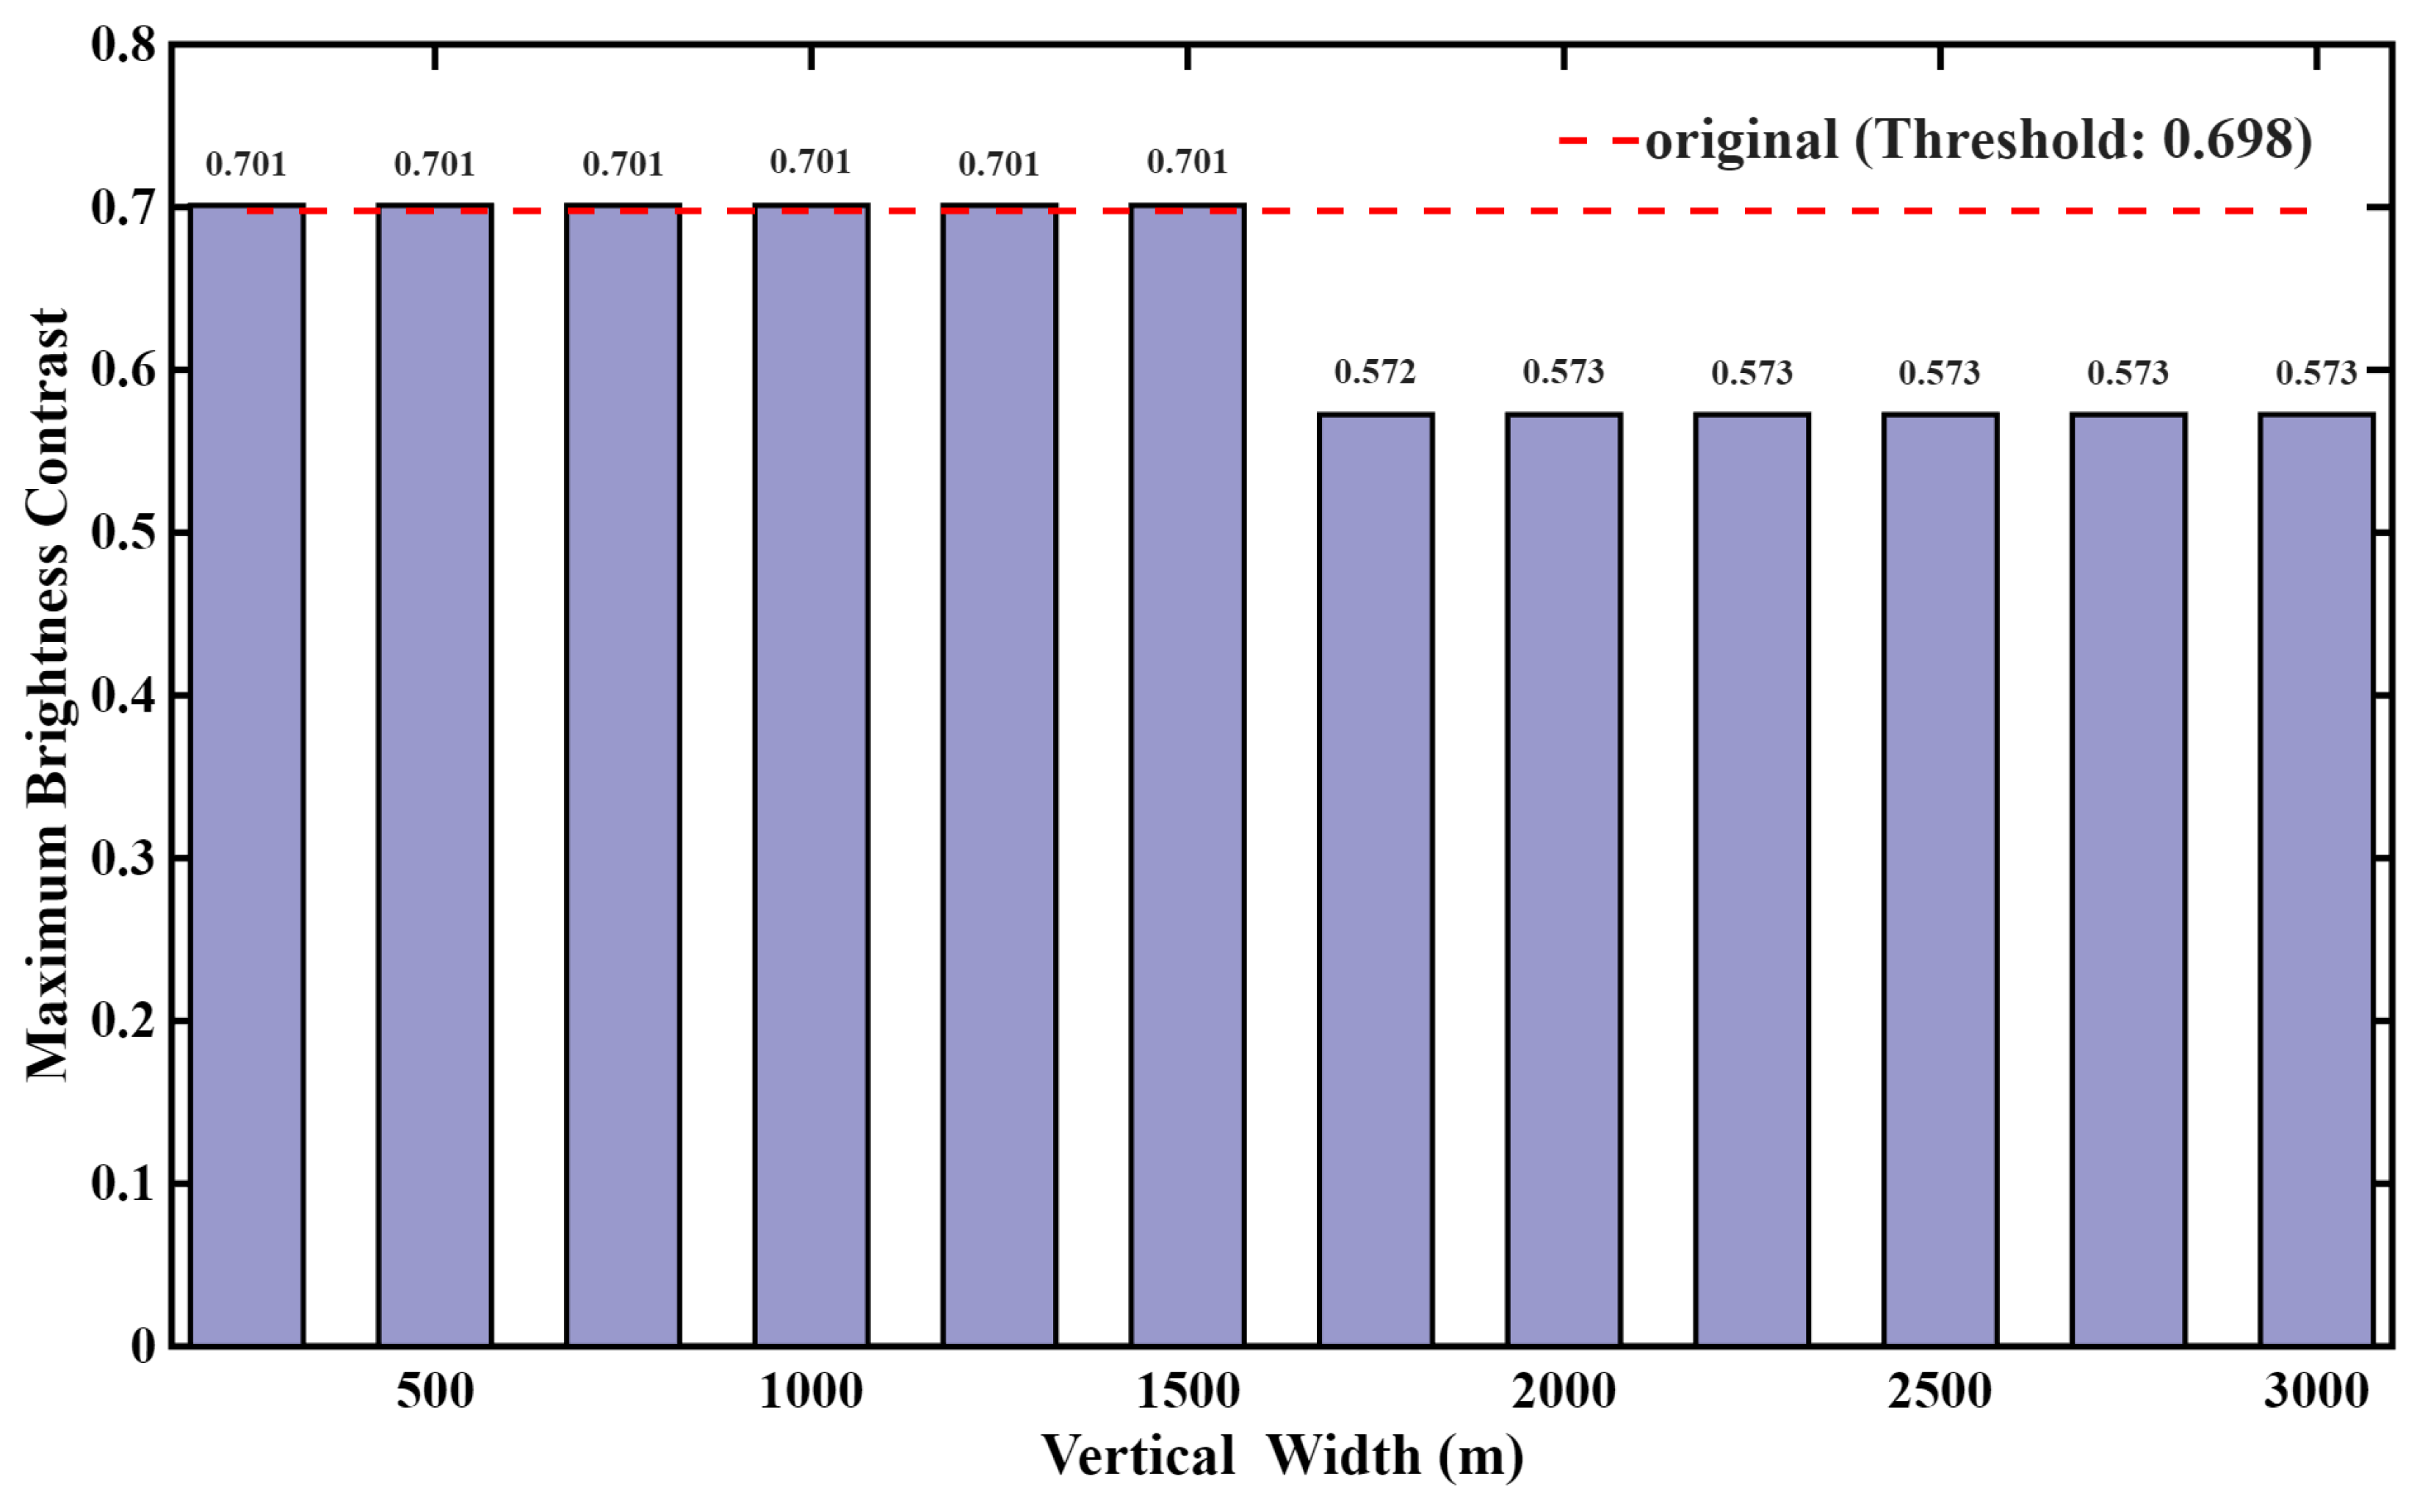
Figure 13 and Figure 14 show the effects of Gaussian and rectangular aerosol layers with different vertical widths on the maximum apparent brightness contrast, respectively, and the red dashed line is the original maximum contrast (0.698) without the additional aerosol superimposed layer. Both distributions show a monotonically decreasing trend of maximum contrast with increasing vertical width, indicating that the extinction effect of the aerosol layer increases with the expansion of its vertical coverage, and the suppression effect on maximum contrast is also intensified.
For Gaussian distribution, it can be seen from Figure 13 that the maximum contrast shows a smooth and gradual decay with the increase in vertical width: when the vertical width is 250 m and 500 m, the maximum contrast is almost no difference with the original level; with the gradual increase in the width to 3000 m, the contrast decreases from 0.701 to 0.589, with a decrease of about 16.0%, and there is no obvious mutation during the whole process, reflecting the characteristics of Gaussian distribution: the extinction effect gradually spreads with the increase in width, and the cumulative effect on the optical thickness of the path is increasing. In contrast, Figure 14 shows that the effect of rectangular distribution shows a significant step change: in the vertical width range of 250–1500 m, the maximum contrast is always maintained at 0.701, with a small difference from the original level; when the width exceeds 1500 m, the maximum contrast directly steps down from 0.701 to 0.572, with a drop of about 18.1%, and the contrast basically remained constant when the width continued to increase. This also proves that the extinction effect of the rectangularly distributed aerosol layer is strictly localized, and only when the width is increased to such an extent that the lower boundary of the rectangular layer extends to the near-surface observation path, the maximum contrast is significantly suppressed.
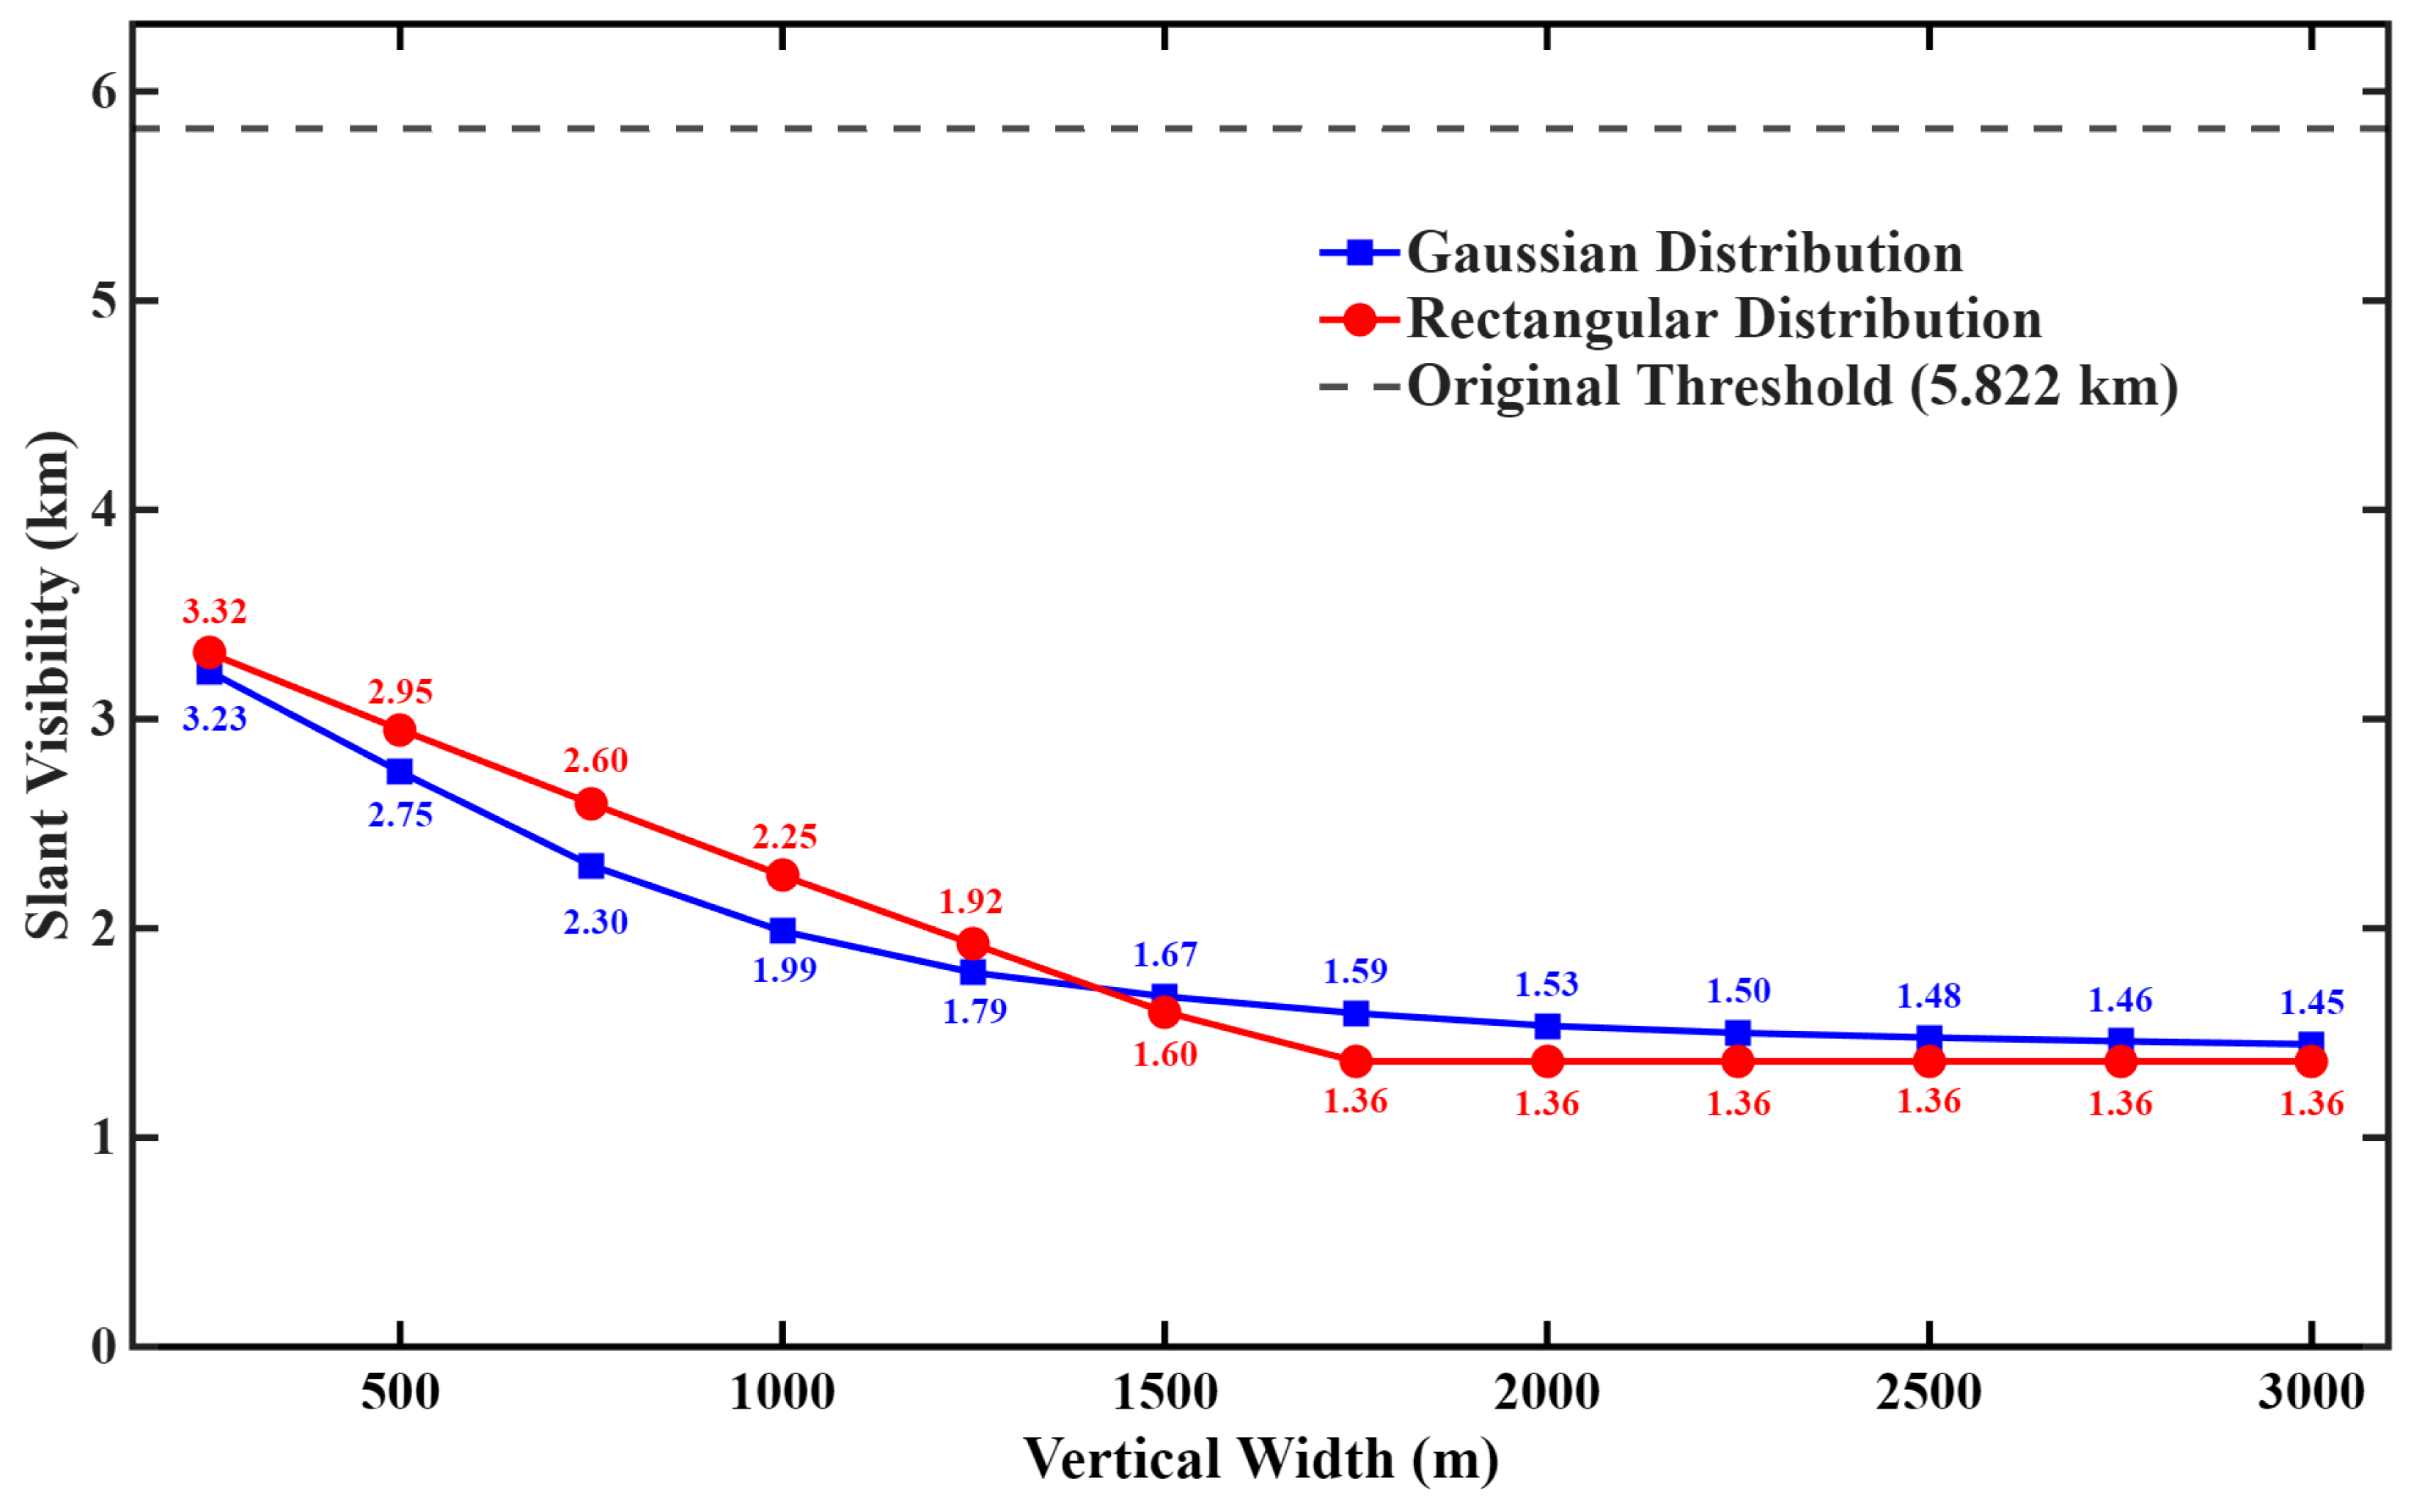
Figure 15 shows the effects of the vertical widths of the aerosol layers with Gaussian and rectangular distributions on the slant visibility, where the black dashed line shows the original slant range visibility (5.822 km) when no other aerosol layers are superimposed. Overall, the slant visibility is significantly lower than the original slant range visibility (5.822 km) when different vertical widths of aerosol layers are superimposed, which proves that the vertical widths of the aerosol layers are an important factor influencing the contrast of visual brightness. Both distributions show the trend of decreasing slant visibility with increasing vertical width, and the two curves have three similar points, which are about 250 m, 1500 m and 3000 m, respectively. Then, the whole curve is divided into two segments, and the relative extinction capacities of Gaussian and rectangular distributions are different at different vertical widths.
The differences between the two distributions are mainly reflected in the following: 1. Narrow vertical width section (250–1250 m): the visibility of the two distributions shows a smooth decreasing trend with the increase in the width, but the Gaussian distribution has a stronger extinction effect, the visibility decreases more drastically, and the visibility under the same width is slightly lower than that of the rectangular distribution. For example, the difference in visibility between the two is greatest at 750 m vertical width, and the 2.30 km of Gaussian distribution is about 11.5% lower than that of 2.60 km of rectangular distribution. This is because the extinction increment of the Gaussian distribution has a bell-shaped diffusion, and even if the width is small, its tail extends to the near surface, which produces continuous extra extinction on the path, while the extinction effect of the rectangular distribution is strictly confined to the layer, and the paths are not completely covered in the low widths, so the overall extinction is weak, and therefore, the visibility decreases more gently. 2. Wide vertical width (1500–3000 m): at the same width of 750 m, the difference in the visibility of the sloped range is about 11.5% lower than that of the rectangular distribution, which is about 2.60 km. 2. Wide vertical width section (1500–3000 m): the visibility of rectangular distribution is slightly lower than that of the Gaussian distribution under the same width. The visibility of the Gaussian distribution still shows a slow decreasing trend from 1.67 km to 1.45 km, while the visibility of the rectangular distribution plunges from 1.60 km to 1.36 km directly after the width exceeds 1500 m, and remains constant during the subsequent increase in width, and no longer fluctuates with the width change. This difference stems from the “localization” characteristic of the rectangular distribution: when the lower boundary of the rectangular layer extends to the near-surface observation path, the whole path is covered by a uniform extinction zone, and the extinction capacity increases rapidly, and the visibility can be reduced to the lowest level quickly; whereas the Gaussian distribution, due to the extension of the extinction increment’s tail, will still be affected by the extinction increment’s tail, even if the width continues to increase. On the whole, the distribution pattern of the aerosol layer significantly affects the visibility change characteristics: there is an obvious critical width for the rectangular distribution, and once the width exceeds the threshold of the path coverage, the visibility drops to the lowest level rapidly and stays stable; whereas, the visibility of the Gaussian distribution decreases continuously with the increase in the width without any obvious critical inflection point, which makes the process of the change more persistent.
The core physical mechanism of this law is as follows: the vertical width of the aerosol layer determines the vertical coverage of its extinction effect, regardless of the superposition of the aerosol layer is Gaussian or rectangular distribution, the larger the vertical width, the longer the interval covered by the aerosol layer on the light transmission path, the larger the overall optical thickness accumulation, the stronger the extinction effect, the faster the contrast attenuation, and the visibility of the target is significantly weakened; on the contrary, the smaller the vertical width, the relatively gentle contrast attenuation, and the slant visibility is higher. However, there is a significant difference between the two distributions: the Gaussian aerosol layer has a typical tail diffusion characteristic, even if the vertical width is small and the main body of the layer is narrow, the weak extinction tail extending up and down can still cover the observation light path and continue to produce extinction loss, so the weakening effect on target visibility is stronger and more lasting under the condition of narrow width; whereas, the extinction of the rectangular aerosol layer is strictly confined to the inner layer, and there is no extinction outside of the layer, so it is difficult to cover the near-surface observation path under the narrow-width condition, and the interference to the optical path is weak, and the extinction attenuation effect will be concentrated and intense only when the layer completely covers the observation optical path.
In summary, the vertical width of the aerosol layer regulates the contrast degradation law by changing the vertical coverage interval of extinction and the cumulative total amount of extinction in the optical path, and the effect is constrained by the distribution pattern: the larger the vertical width is, the wider the range of extinction affecting the optical path, the stronger the cumulative extinction, and the worse the target visibility is, and vice versa, the extinction interference is weak, and the visibility is better, and the effect of vertical width on the apparent brightness contrast is characterized by “slowing down when the width increases” in the range from 250 m to 3000 m. Comparing the two distributions, it can be seen that the tail extinction effect of the Gaussian distribution is dominant in the narrow vertical width condition, which has a stronger ability to weaken the visibility, while the local strong extinction characteristic of the rectangular distribution in the wide vertical width condition is emphasized, and the extinction suppression effect is more concentrated and more intense.

3.3. Effect of Different Peak Intensities on Apparent Brightness Contrast Attenuation

To investigate the regulatory mechanism of aerosol extinction capability on apparent brightness contrast, this section fixed the center height of the superimposed aerosol layer at 2000 m and the vertical width at 500 m, and gradually increased the peak intensity of the aerosol layer from 0.50 km−1 to 3.00 km−1 in increments of 0.50 km−1 (0.50 km−1, 1.00 km−1, 1.50 km−1, 2.00 km−1, 3.50 km−1, 3.00 km−1), and analyzed the variation characteristics of apparent brightness contrast with vertical distance when superimposing aerosol layers with different peak intensities.
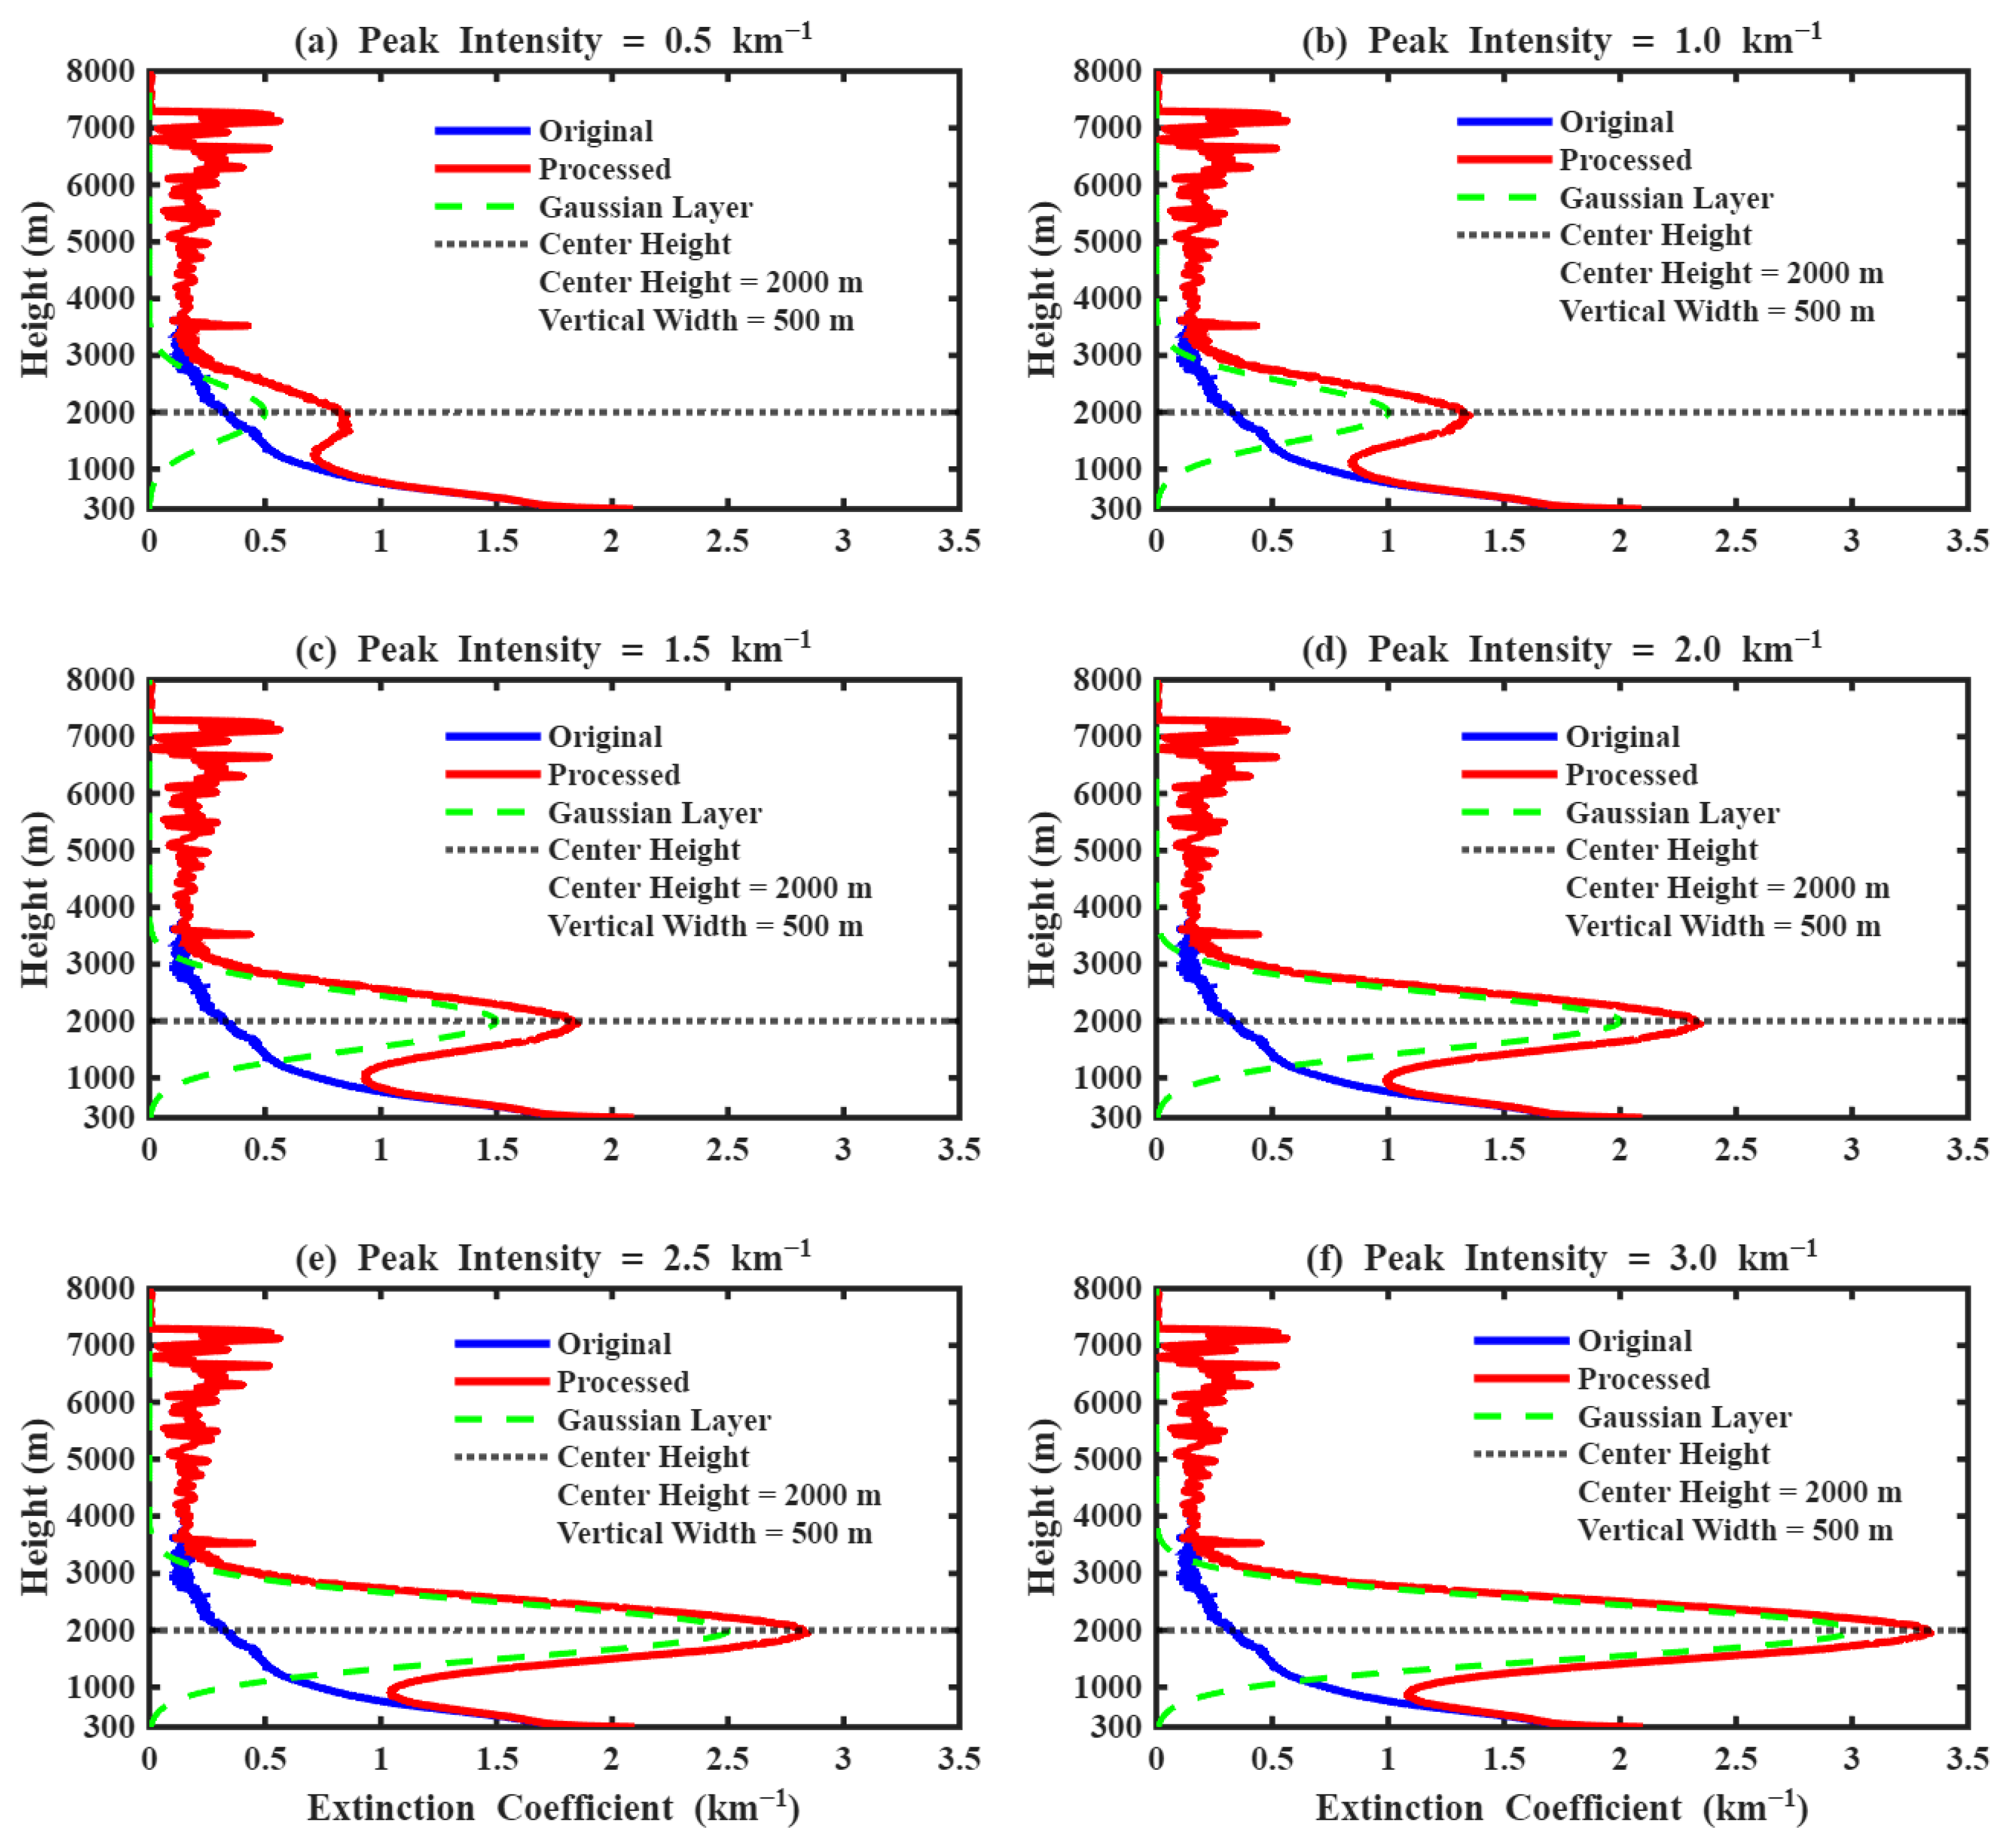
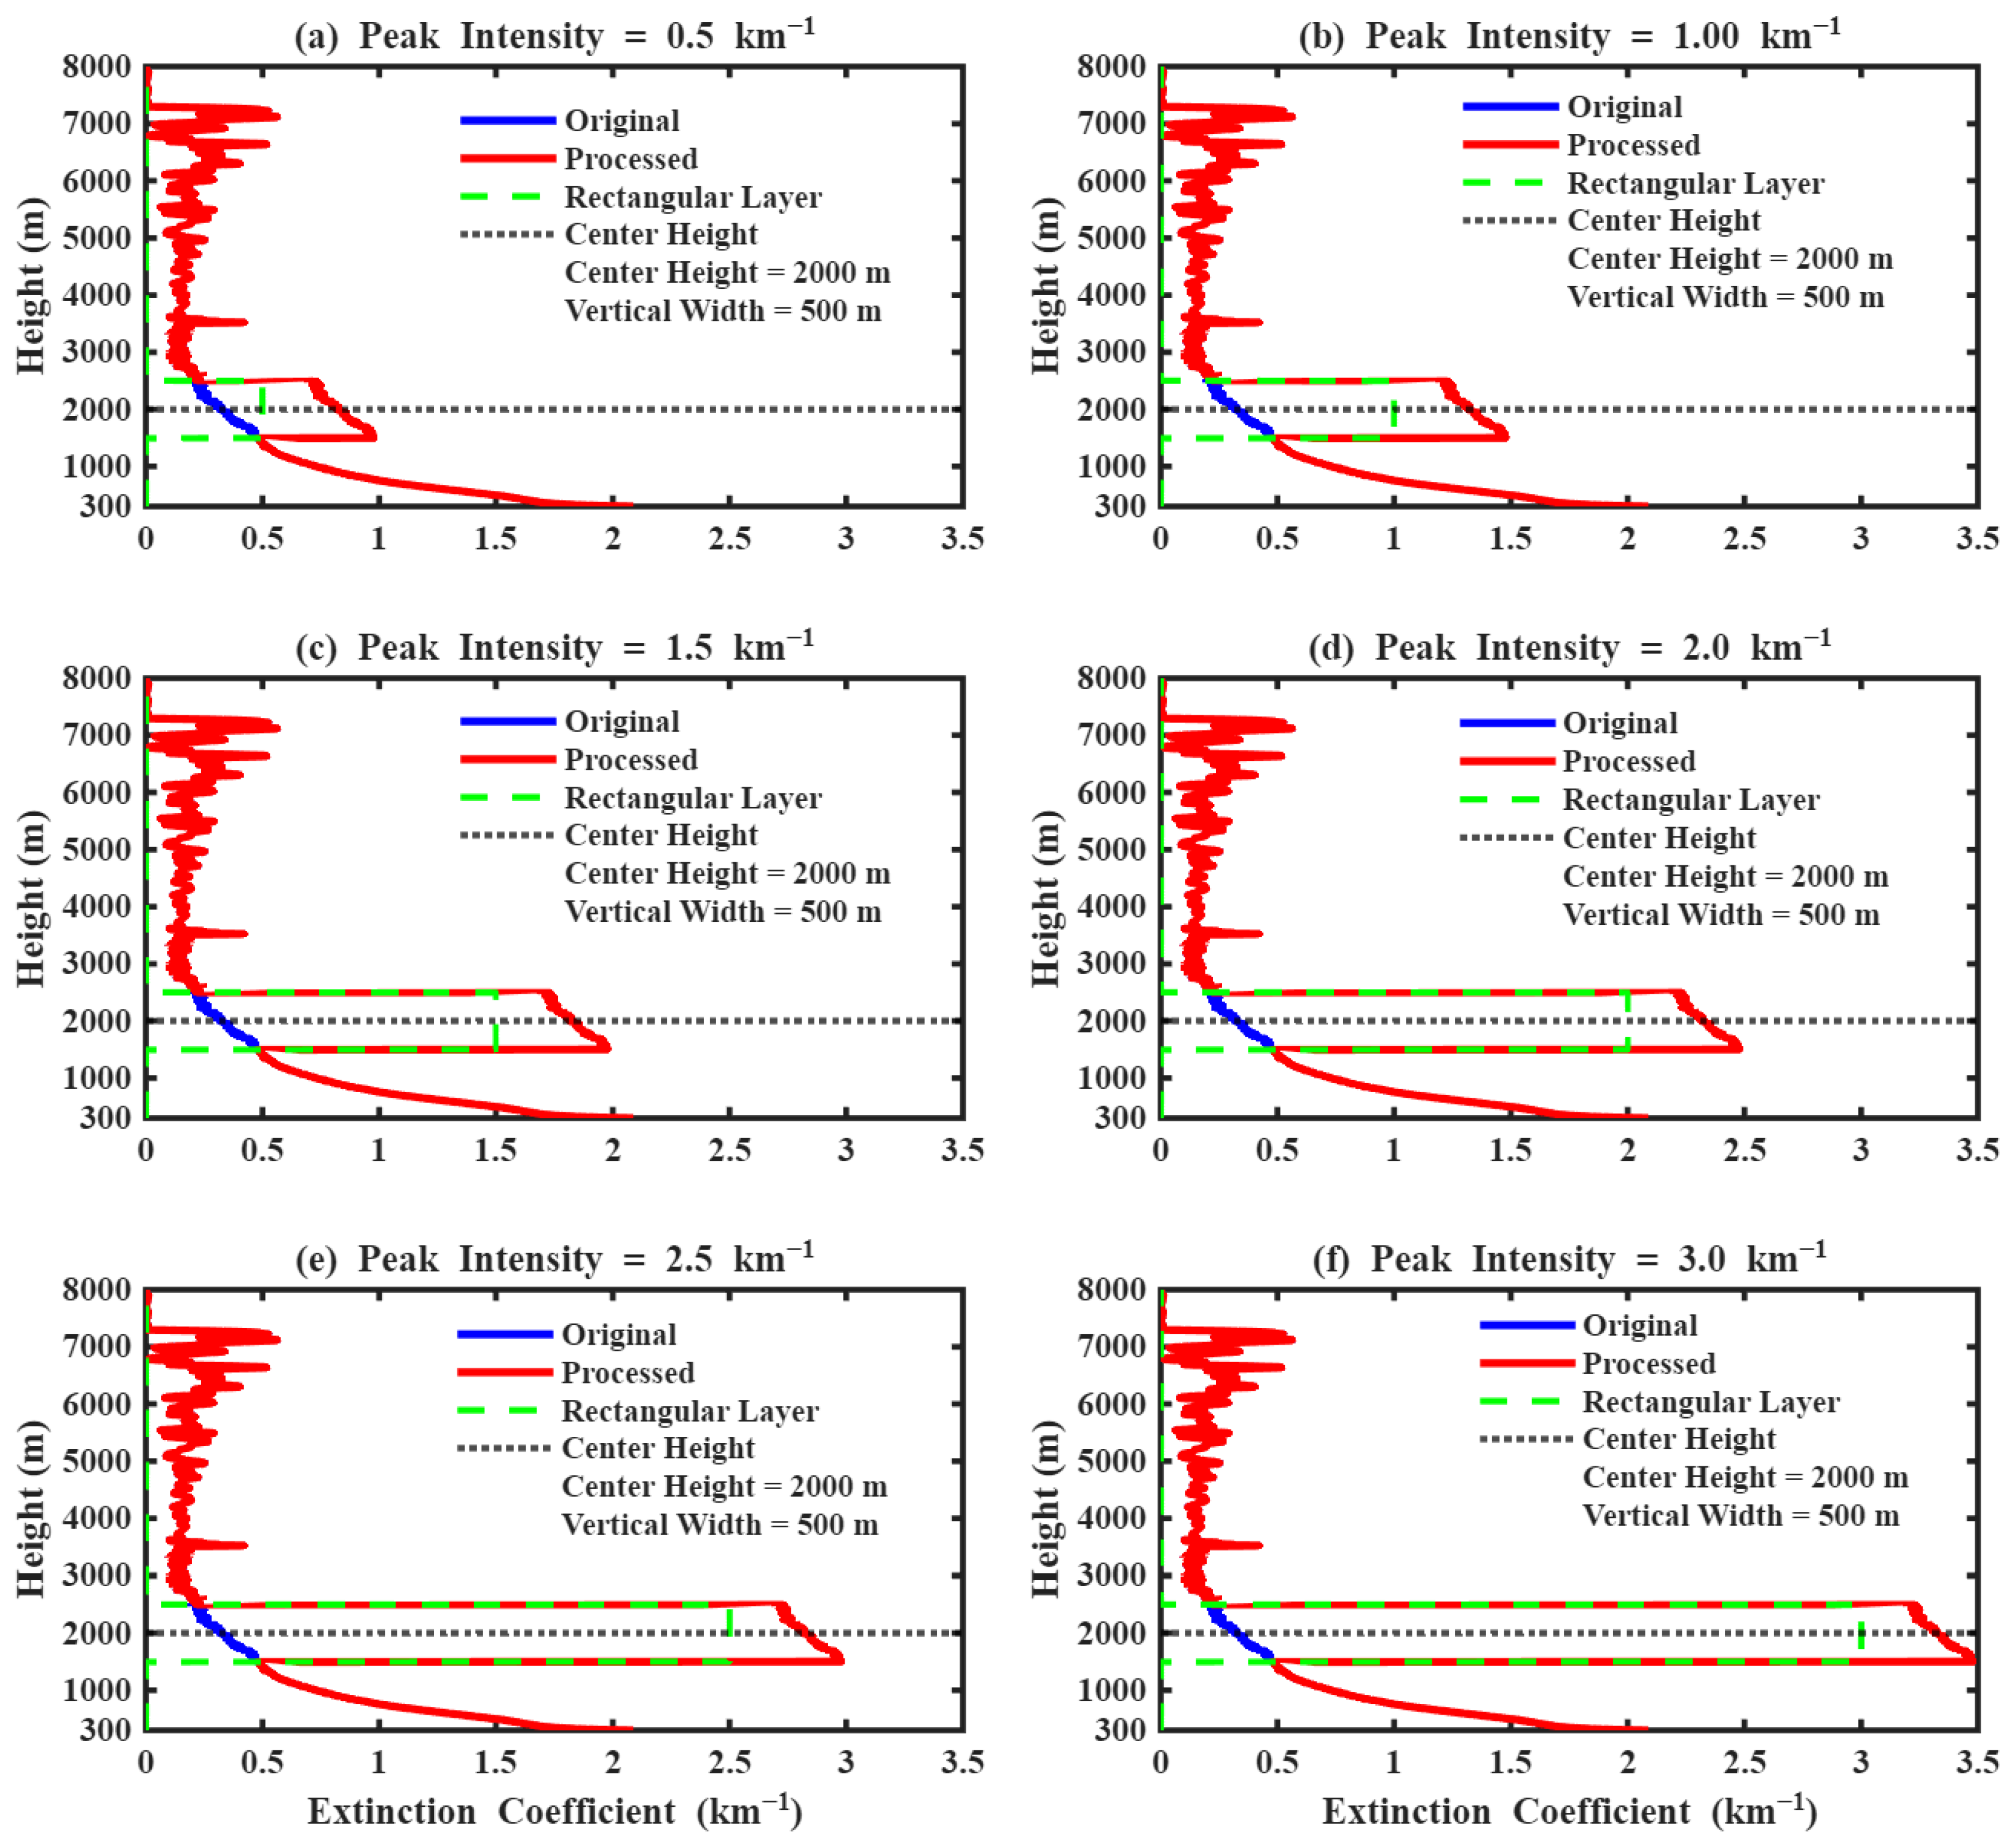
Figure 16a–f and Figure 17a–f show the extinction coefficient profiles of Gaussian and rectangular distributions at different peak intensities (0.5 km−1, 1.0 km−1, 1.5 km−1, 2.0 km−1, 2.5 km−1, 3.0 km−1), respectively. Under the condition of fixed center height and vertical width, the change in the peak intensity of the aerosol layer directly determines the amplitude of its disturbance to the atmospheric extinction profile. The original extinction profile consistently exhibits a baseline characteristic of high values near the ground and rapid decay with increasing altitude.
As can be seen in Figure 16, the morphology of extinction profiles with different peak intensities of Gaussian aerosol layers shows significant differences with the peak intensities: when the peak intensity is 0.5 km−1, the superimposed profiles only show a small increase near the center height of 2000 m, and the deviation from the original profiles is very small; with the increase in peak intensity to 3.00 km−1, the superimposed contours continue to increase near 2000 m, and the deviation from the original profiles increases significantly, and the uplifted area does not expand with the increase in intensity, which indicates that the peak intensity only changes the extinction value of the aerosol layer, but does not affect its vertical distribution characteristics. It can be seen from Figure 17 that, after the superposition of the rectangular aerosol layer with different peak intensities, the extinction profile shows a uniform platform lifting characteristic within the vertical width of the rectangular layer: when the peak intensity is 0.5 km−1, the extinction platform in the rectangular layer is only slightly lifted, and the difference with the original profile is relatively small; with the increase in the peak intensity, the extinction platform in the rectangular layer increases constantly and the height of the platform continues to rise, and the boundary of the elevated area of the contour line is always clear; when the peak intensity increases to 3.0 km−1, the extinction platform in the rectangular layer reaches the highest level, and the most significant change is made to the extinction structure in the layer, but the outer contour line is still the same as that of the original profile line.
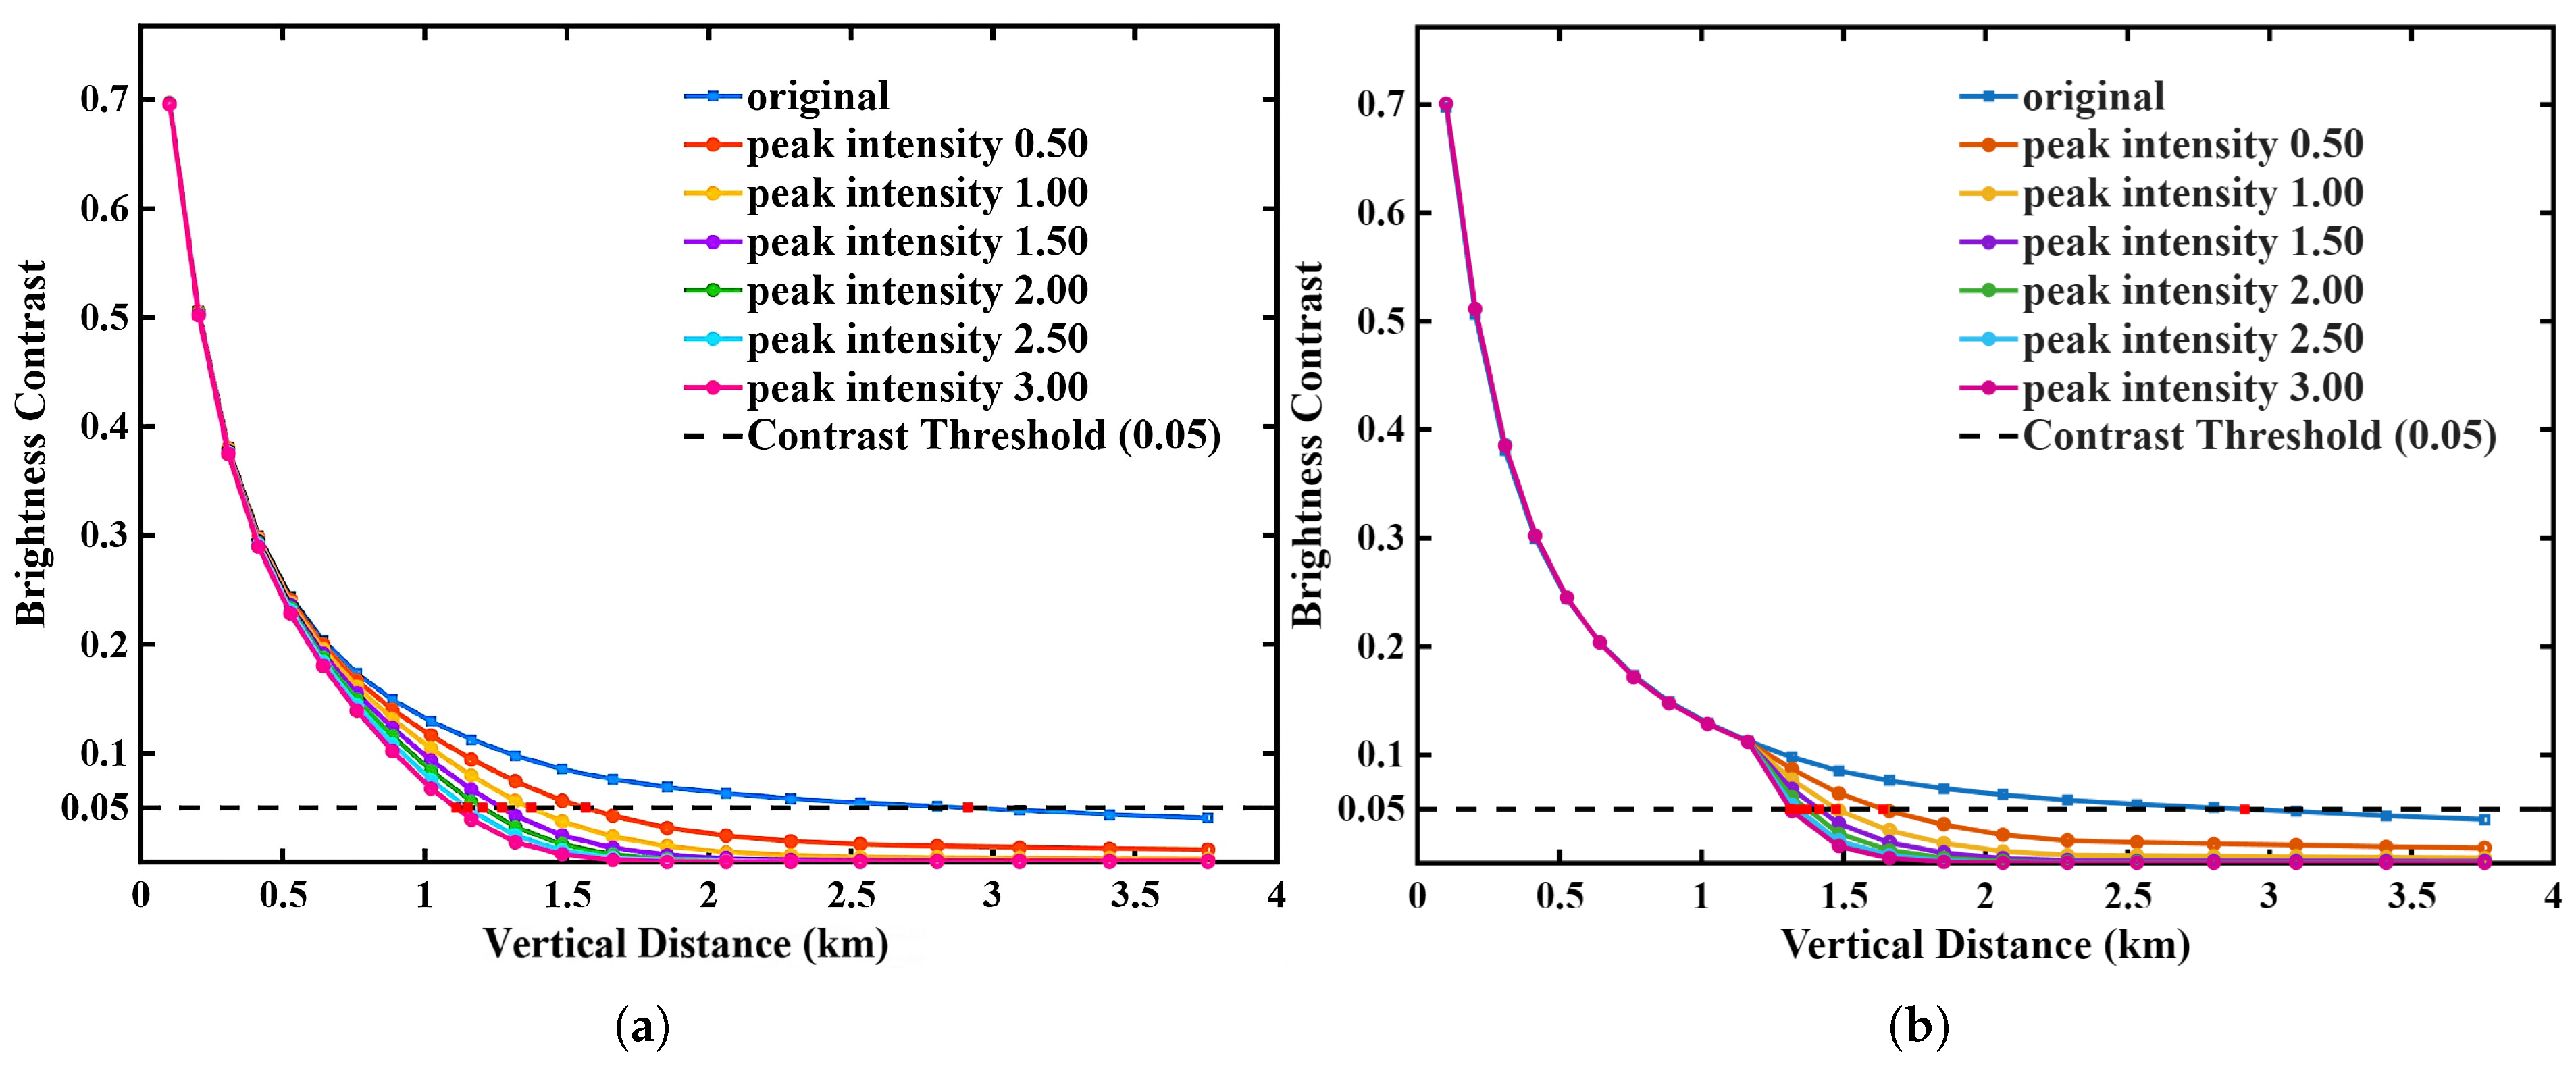
Figure 18a,b show the variation in target-to-background apparent brightness contrast with vertical distance when Gaussian and rectangular aerosol layers are superimposed under different peak intensity conditions, respectively. The results show that all the curves of the two distributions are below the original curves after superimposing the aerosol layer with a center height of 2000 m and a vertical width of 500 m. This confirms that the superimposition of the aerosol layer will significantly aggravate the attenuation of the apparent brightness contrast. The peak intensities only change the extinction strength, so all the curves in the two maps overlap almost completely in the near-range attenuation section within 1 km, and there is no obvious separation. As the vertical distance increases, the curves with different peak intensities begin to diverge, and the whole map shows the characteristic of “overlapping in the near-range and diverging in the long-range”. In addition, the contrasts of both distributions decay monotonically with the increase in the vertical distance, the higher the peak intensity, the faster the contrast decay, the steeper the curve decline, and the shorter the vertical critical distance when reaching the recognition threshold of 0.05; with the decrease in the peak intensity, the rate of decay slows down, the critical distance increases gradually, and the difference between the curve and the original curve narrows gradually.
From Figure 18a, it can be seen that the contrast curve of the Gaussian distribution is uniform and regular, and the curves of different peak intensities maintain a smooth and continuous decay pattern, with no sudden change point, and only shifting downward in parallel with the increase in peak intensity. This is due to the fact that the Gaussian aerosol layer is a bell-shaped gradient profile, the peak intensity increase will raise the extinction level of the whole optical path, and the weakening effect on the optical transmission is uniform and gradual, so the image only shows the overall shift of the curve, and the attenuation trend is always stable. On the contrary, the rectangular distribution curve in Figure 18b shows segmental step characteristics, in sharp contrast to the Gaussian distribution: when the vertical distance is within about 1 km, the curve of the superimposed aerosol layer and the original curve are almost close to each other, and there is no obvious difference in attenuation; when the path enters into the coverage range of the rectangle, the curve in the aerosol layer corresponds to the interval of the optical path appears to be obviously steeply declining, forming a section of steep step attenuation. The greater the peak intensity, the more pronounced the decline and the more prominent the characteristics of the decay mutation in this falling section.
Further quantitative analyses showed that at a fixed center height and vertical width, the peak aerosol layer intensity had a negligible effect on the maximum contrast and a significant negative correlation with the slant visibility.
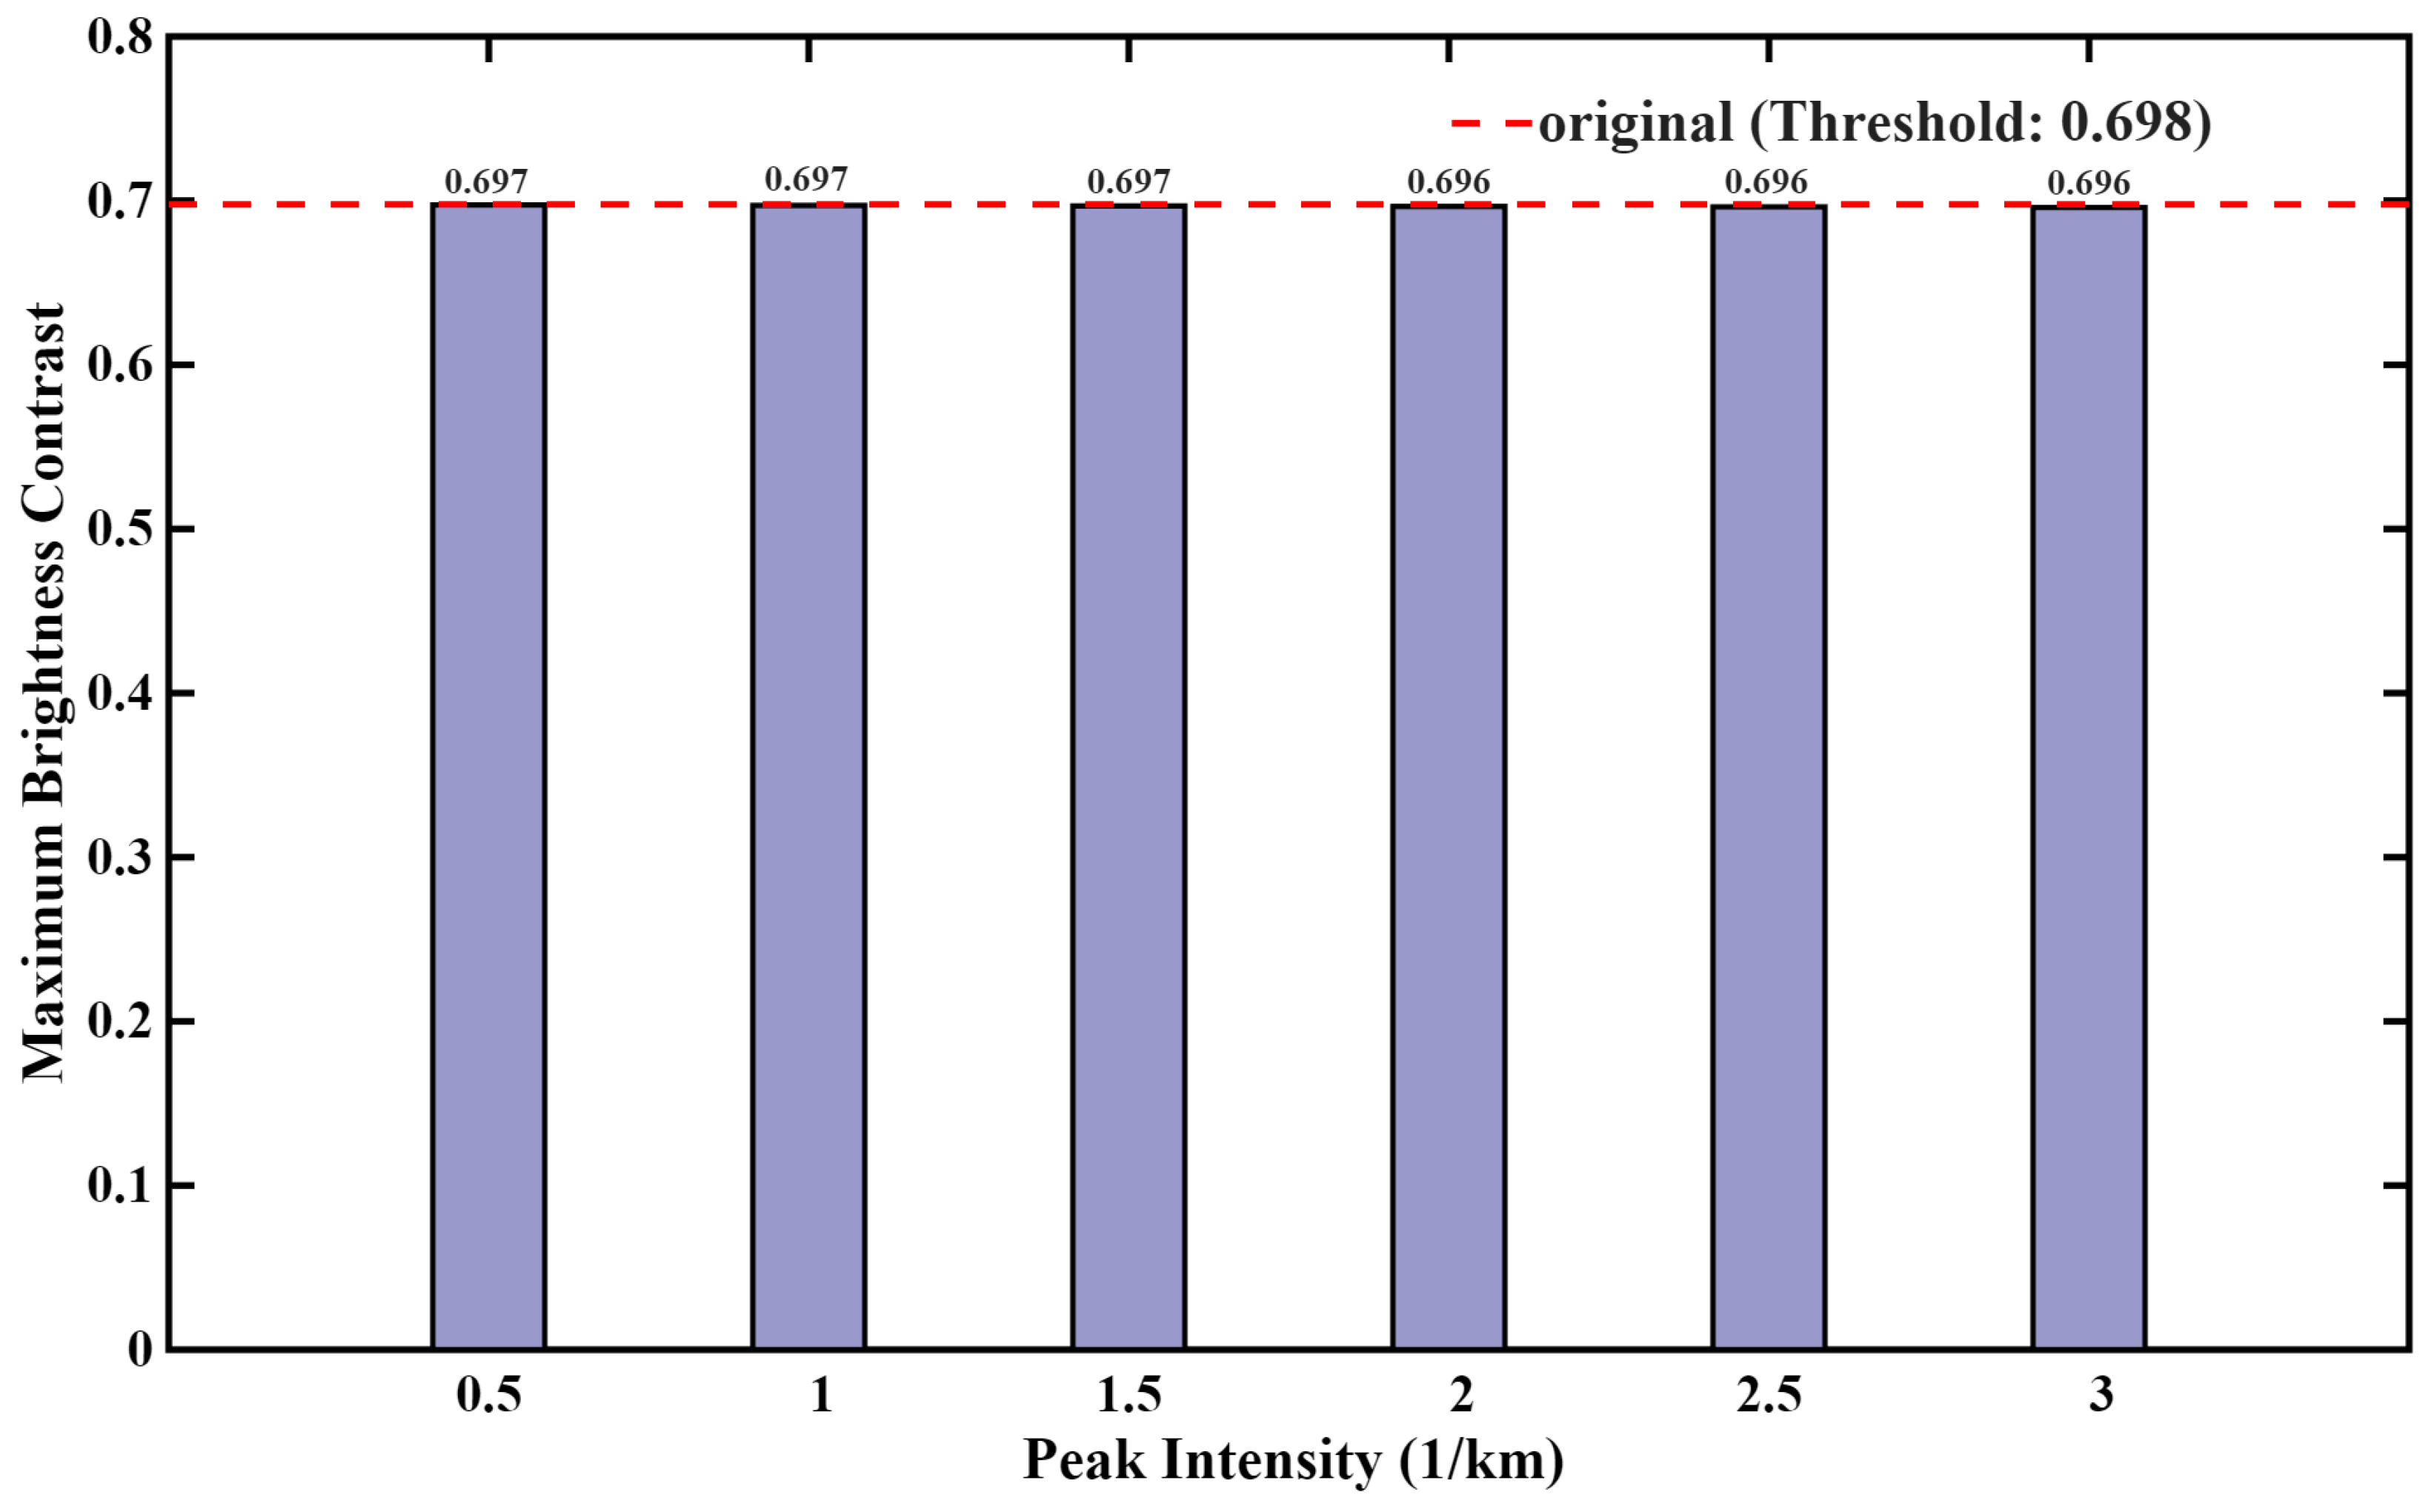
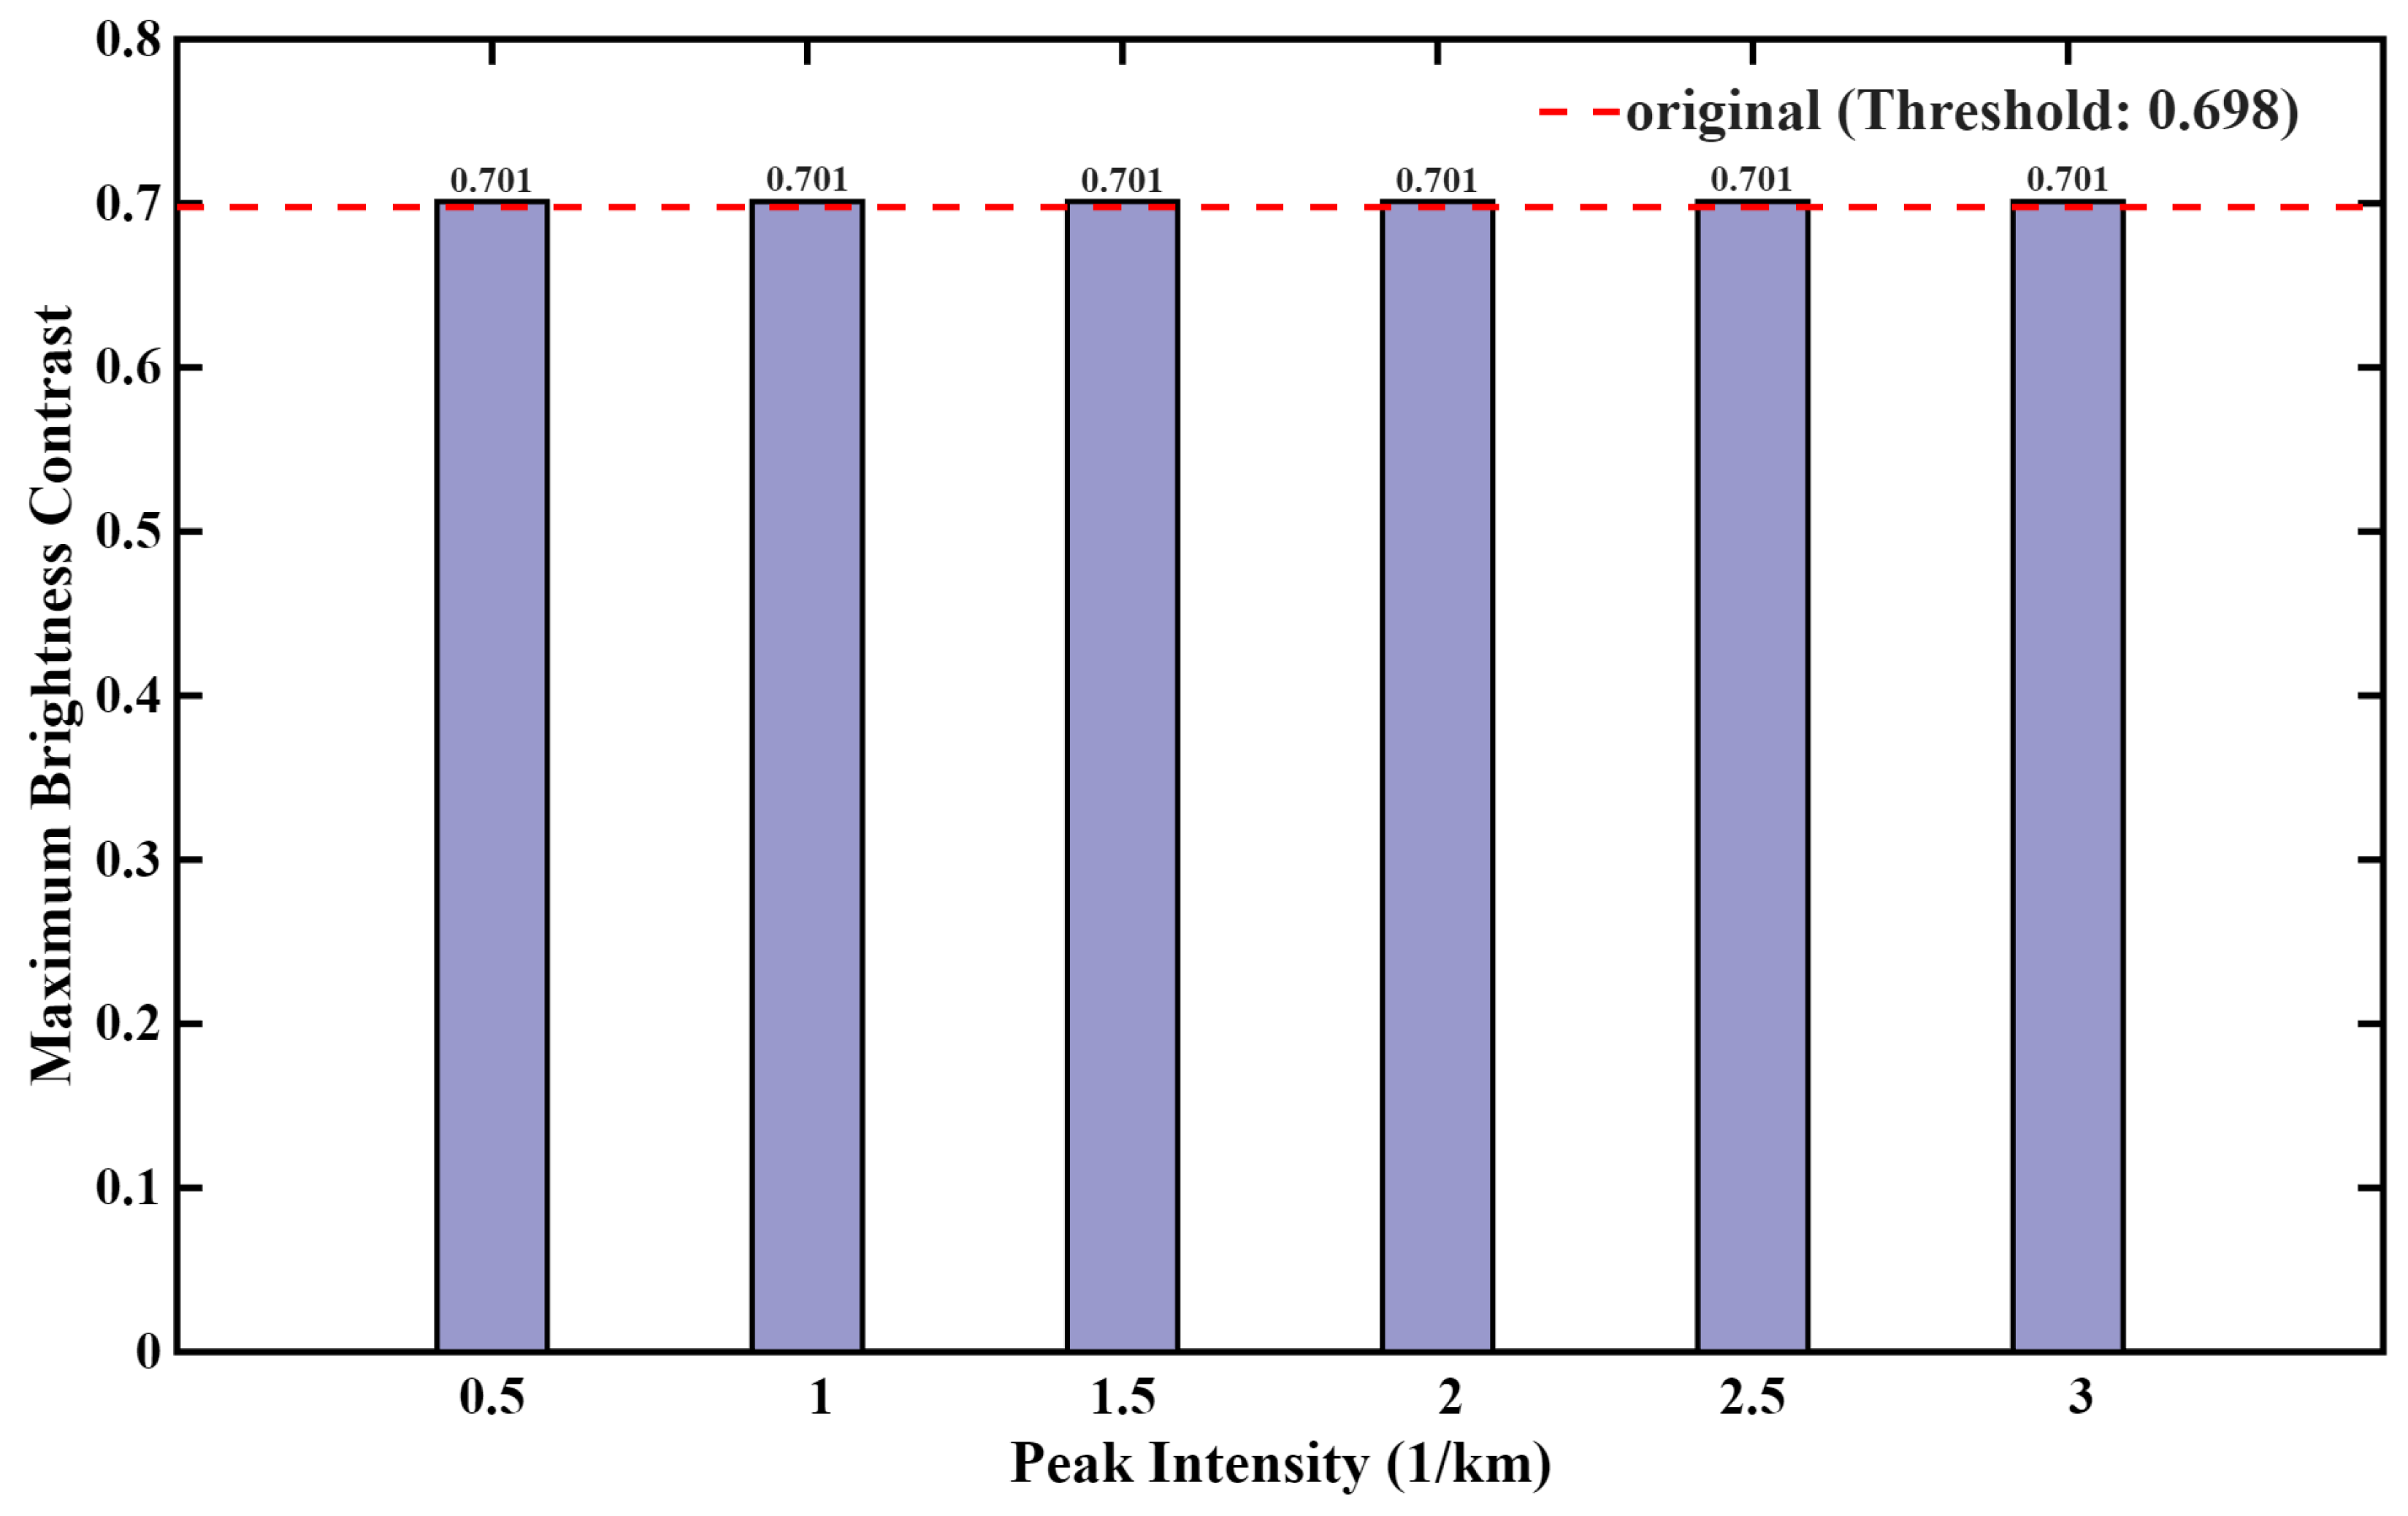
Figure 19 and Figure 20 show the effects of Gaussian and rectangular aerosol layers on the maximum apparent brightness contrast under different peak intensity conditions, with the red dashed line showing the original maximum contrast (0.698) without an additional aerosol layer. The overall fluctuation of maximum contrast with peak intensity for both distributions is very weak, in contrast to the significant modulation effects of center height and vertical width, indicating that the peak intensity has very little effect on the maximum contrast under the condition of fixing the location and extent of the layers.
For the Gaussian distribution, Figure 19 shows that the maximum contrast shows a very slight decreasing trend with the increase in the peak intensity: at a peak intensity of 0.5–1.5 km−1, the maximum contrast stabilizes at 0.697, which is almost the same as the original level; as the intensity rises to 2.0–3.0 km−1, the contrast only slightly decreases to 0.696, with a decrease of less than 0.3%, and the overall contrast remains near the original level. This is because the extinction tail of the Gaussian distribution is very weak at low altitudes, and even if the peak intensity increases, the overall extinction increment of the near-ground optical path is very limited, so the maximum contrast is almost unaffected. In contrast, Figure 20 shows that the maximum contrast of the rectangular distribution stays stable at 0.701 under all the peak intensity conditions, and does not fluctuate with the peak intensity at all. This phenomenon is directly related to the localized characteristics of the rectangular layer: under the current configuration with a center height of 2000 m and a vertical width of 500 m, the rectangular layer is located in the high altitude zone of 1000–3000 m, and has almost no influence on the near-ground optical path, so even if the peak intensity increases and the extinction level within the layer rises, the maximum apparent brightness contrast near the ground will not be changed. In summary, under the condition of fixed center height and vertical width, the modulation effect of peak intensity on the maximum contrast is very limited: the Gaussian distribution only shows a very weak decreasing trend, while the maximum contrast of the rectangular distribution is not affected at all.
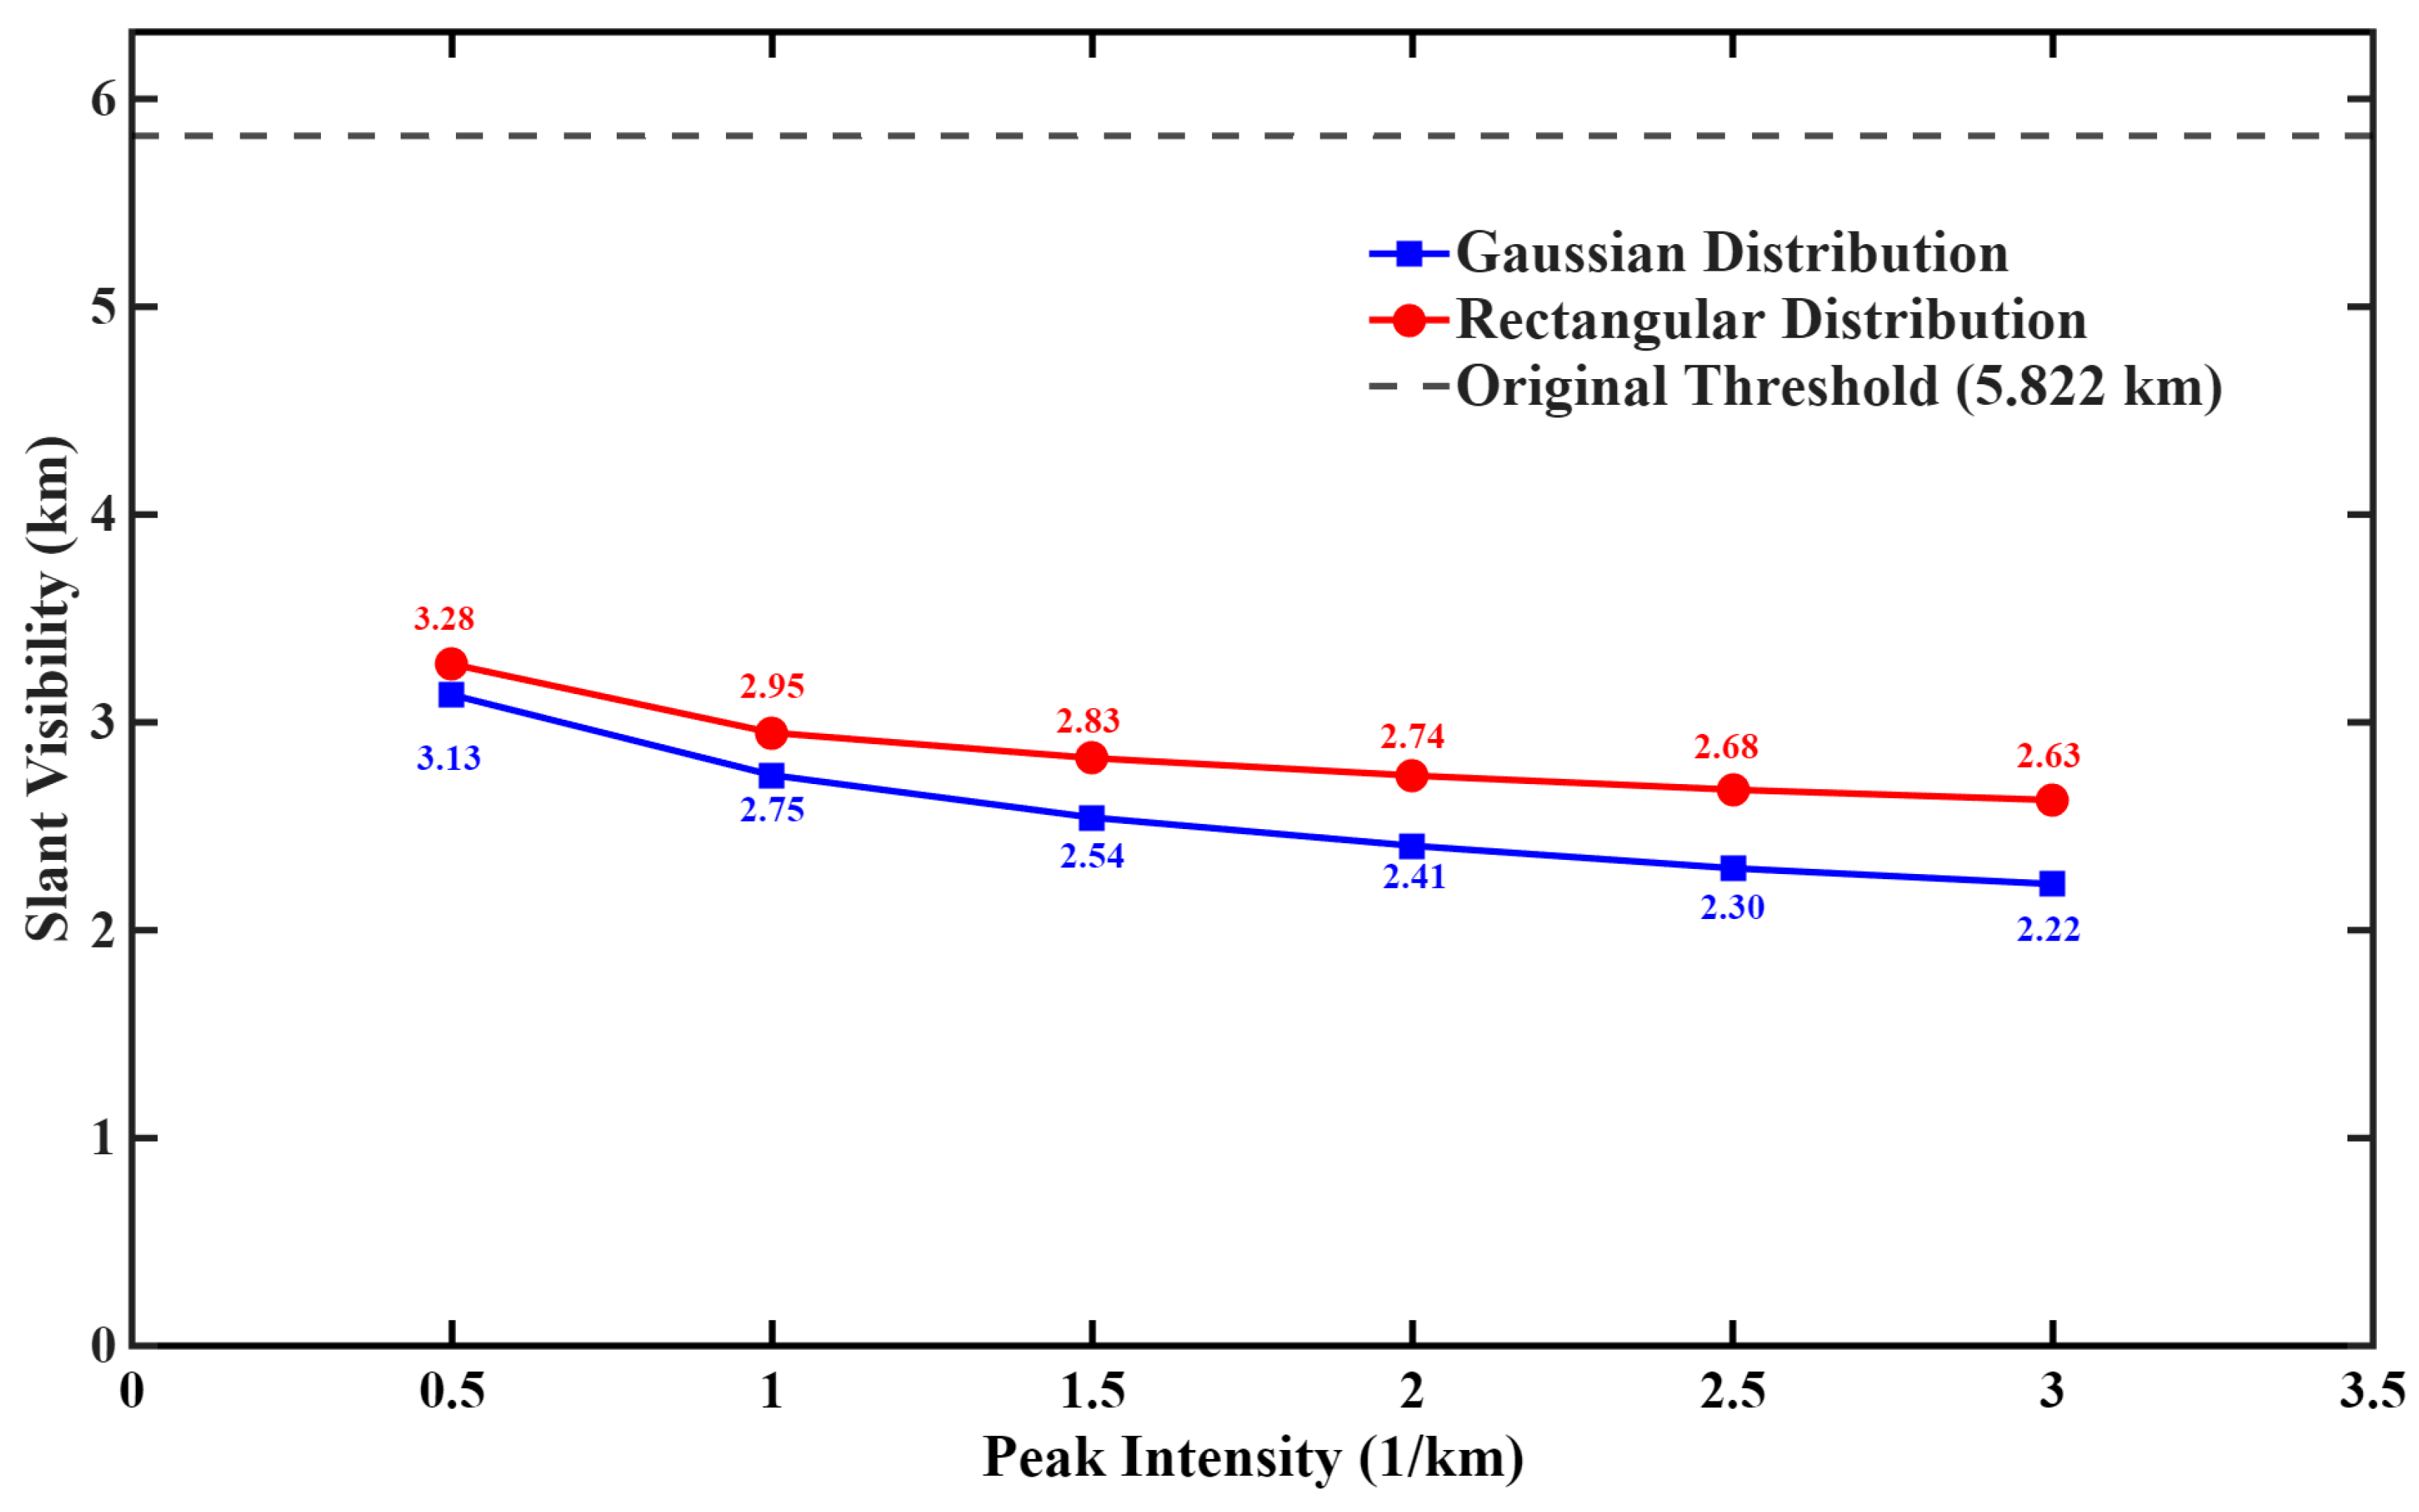
Figure 21 shows the effects of the peak intensity of Gaussian and rectangular aerosol layers on the slant range visibility, where the black dashed line shows the original slant visibility (5.822 km) when no other aerosol layers are superimposed. Overall, the slant visibility is significantly lower than the original slant visibility after the superimposition of aerosol layers with different peak intensities, which proves that the peak intensities of the aerosol layers are an important factor influencing the contrast of visual brightness. The Gaussian distribution curve is always below the rectangular distribution curve, and the peak intensity and the slant range visibility of both distributions show a strong negative correlation: the correlation coefficients between the peak intensity and the slant range visibility are −0.992 for the Gaussian distribution and −0.991 for the rectangular distribution.
The differences between the two distributions are mainly reflected in the following: 1. Full intensity band (0.5–3.0 km−1): the visibility of both distributions shows a smooth decrease with the increase in peak intensity, and the Gaussian distribution has a stronger extinction effect and a more drastic decrease in visibility, which is always lower than that of rectangular distribution under the same intensity. This is because the extinction increment of the Gaussian distribution has a bell-shaped diffusion, and even if the layer position is fixed, its extinction tail will continue to extinguish the near-surface paths, while the extinction effect of the rectangular distribution is strictly confined to the layer, and thus the visibility decreases more slowly. 2. Characteristics of the trend: the visibility of the Gaussian distribution shows a sustained and uniform decreasing trend with the increase in the peak intensity, and the decreasing amplitude of the rectangular distribution gradually narrows with the increase in intensity, which leads to the situation that the difference of the two distributions’ slant visibility increases with the increase in the peak intensity. For example, at a peak intensity of 0.5 km−1, the Gaussian distribution of 3.13 km is about 4.6% lower than that of the rectangular distribution of 3.28 km, while at a peak intensity of 3.0 km−1, the Gaussian distribution of 2.22 km is about 15.6% lower than that of the rectangular distribution of 2.63 km.
The core physical mechanism of this law is as follows: the peak intensity of the aerosol layer determines its own extinction ability, regardless of whether the superimposed aerosol layer is a Gaussian or rectangular distribution. The greater the peak intensity, the stronger the extinction effect, the faster the contrast degradation, and the target falls below the recognition threshold in a short distance. However, there is a significant difference between the two distributions: the extinction level of the Gaussian distribution is synchronized with the peak intensity, and the weakening effect on the path is always uniformly enhanced; while the rectangular distribution is only the extinction level of the layer is increased with the intensity, and the extinction loss is limited under the fixed path conditions, and therefore, the downward trend tends to be saturated in the late stage. On the whole, the distribution pattern of aerosol layers significantly affects the response characteristics of the oblique visibility to the peak intensity: the visibility of the Gaussian distribution decreases continuously and uniformly with the increase in the peak intensity, and the extinction effect is global and persistent; while the visibility of the rectangular distribution decreases gradually and narrowly with the increase in the intensity, and the extinction effect is local and limited.
In summary, the peak intensity of the aerosol layer affects the attenuation of apparent brightness contrast by directly regulating its extinction capacity, and is constrained by the distribution pattern: the larger the peak intensity, the stronger the extinction loss of the optical path, and the worse the visibility of the target, and vice versa, the extinction is weakened and the visibility is improved. Comparing the two distributions, it can be seen that the Gaussian distribution has a wider range of influence by the extinction tail effect, and the attenuation process is more uniform, while the rectangular distribution has a strong weakening effect on the contrast only in the layer coverage area, and the local characteristics are prominent.


4. Discussion

The magnitude of change in maximum contrast and slant visibility for the Gaussian and rectangular distribution cases, respectively, when the three key parameters are changed is shown in Table 1, from which it can be clearly seen that there are significant differences in the modulation of the maximum contrast and slant visibility by the center height, vertical width and peak intensity, and the sensitivity characteristics are different in different distribution patterns.

4.1. Magnitude of Change in Maximum Contrast

Over the variation range of center height from 400 m to 3000 m, the maximum contrast of both distributions increases from 0.573 to 0.701, with a change amplitude of 22.3%. The change in center height exhibits a strong sensitivity response for both distributions, with the only difference being that the maximum contrast of the Gaussian distribution increases smoothly, while that of the rectangular distribution shows a sudden increase at a center height of 900 m. Over the variation range of vertical width from 250 m to 3000 m, the maximum contrast of the Gaussian distribution gradually decreases from 0.701 to 0.589, a reduction of 16.0%, while that of the rectangular distribution drops sharply from 0.701 to 0.573, a reduction of 18.3%. Over the variation range of peak intensity from 0.50 km−1 to 3.00 km−1, the maximum contrast of the Gaussian distribution decreases from 0.697 to 0.696, a reduction of only 0.1%, remaining almost unchanged, while the maximum contrast of the rectangular distribution remains constant at 0.701. Therefore, the influence of peak intensity on maximum contrast is almost negligible.

4.2. Magnitude of Change in Slant Visibility

Over the variation range of center height from 400 m to 3000 m, the slant visibility of the Gaussian distribution increases from 1.54 km to 4.08 km, an increase of 164.9%, while that of the rectangular distribution increases from 1.57 km to 4.51 km, an increase of 187.3%. The increases for both distributions are significantly higher than those for other parameters, indicating that center height is the most sensitive factor affecting slant visibility. Over the variation range of vertical width from 250 m to 3000 m, the slant visibility of the Gaussian distribution decreases from 3.23 km to 1.45 km, a reduction of 55.1%, while that of the rectangular distribution decreases from 3.32 km to 1.36 km, a reduction of 59.0%, with the rectangular distribution showing a larger reduction. The reductions for both distributions are significantly lower than those for center height, indicating that vertical width is the second most sensitive factor. Over the variation range of peak intensity from 0.50 km−1 to 3.00 km−1, the slant visibility of the Gaussian distribution decreases from 3.13 km to 2.22 km, a reduction of only 29.1%, while that of the rectangular distribution decreases from 3.28 km to 2.63 km, a reduction of only 19.8%, with the Gaussian distribution showing a significantly larger reduction than the rectangular distribution. Compared with center height and vertical width, the influence of peak intensity is the smallest, indicating that among the vertical structural parameters of the aerosol layer, the distribution position and coverage range are more decisive than the extinction capability itself.

4.3. Summary of This Section

The center height of the aerosol layer has the most significant role in regulating the apparent brightness contrast, followed by the vertical width, and the peak intensity is the weakest. The differences in the regulation of the three types of parameters are essentially due to their different mechanisms of radiative transfer: the center height changes the distribution of extinction paths, the vertical width changes the coverage of extinction, and the peak intensity changes the magnitude of extinction, which together constitute a complete regulation system of the vertical structure of the aerosol layer on the visibility of the target. In addition, the distribution pattern also has a significant modulation effect on the parameter sensitivity: the local extinction characteristics of the rectangular distribution make it more sensitive to the changes of the center height and the vertical width, and show a stronger stepwise response; while the diffusion characteristics of the Gaussian distribution make it more sensitive to the changes of the peak intensity, and show a more sustained gradual response.

5. Conclusions

The apparent brightness contrast between the target and the background can intuitively reflect the optical difference between the target and the background. It is a key indicator for measuring atmospheric visibility, supporting remote sensing identification of targets, and ensuring the safety of low-altitude flight. During radiative transmission, the attenuation of the target signal and the enhancement of path radiation jointly determine the characteristics of the change in apparent brightness contrast, and the optical thickness of aerosol is a key factor affecting this process. However, most current studies start from the overall optical thickness of aerosol and analyze its macroscopic impact on atmospheric transmittance and visibility, lacking a detailed discussion on the vertical structure of aerosol and the vertical distribution differences of optical thickness, making it difficult to explain the problem of visibility differences under vertical non-uniform conditions. In this regard, this study uses Gaussian and rectangular aerosol layers as simulation objects and systematically studies the influence and regulation mechanism of center height, vertical width, and peak intensity on the attenuation law of apparent brightness contrast, and quantifies the effect intensity of different vertical structure parameters. The following conclusions were obtained:
1.
The center height of the aerosol layer has the most significant regulatory effect on apparent brightness contrast. The center height directly determines the relative position of the aerosol layer and the observation path. The closer the center height is to the observation height, the stronger the extinction effect, the smaller the maximum contrast, and the faster the attenuation of apparent brightness contrast. As the distance between the center height and the observation height increases, the extinction effect is significantly weakened, and the slant visibility is significantly improved. Furthermore, due to the strictly localized extinction of the rectangular distribution, both the maximum contrast and slant visibility exhibit a step-like characteristic when the center height exceeds approximately 800 m; whereas the Gaussian distribution, owing to its tail extinction effect, exhibits a more sustained and gradual influence.
2.
The vertical width of the aerosol layer affects the overall attenuation degree by changing the extinction coverage range. The larger the vertical width, the wider the coverage range of aerosol in the vertical direction, the stronger the extinction accumulation effect, and both slant visibility and maximum contrast decrease accordingly; when the width increases to a certain extent, its influence gradually tends to saturate. Furthermore, after the vertical width exceeds 1500 m, both the maximum contrast and slant visibility of the rectangular distribution exhibit a pronounced step-like decrease, whereas the changes in the Gaussian distribution remain consistently smooth and continuous.
3.
The peak intensity of the aerosol layer mainly regulates the extinction amplitude, and its influence on medium and long-range targets is more prominent. The higher the peak intensity, the stronger the aerosol extinction ability, but the effect on the contrast of near-range targets is limited. The degree of attenuation of apparent brightness contrast of different peak intensities is almost the same at near distances, but a large differentiation occurs at far distances. Furthermore, under the same center height and vertical width, the maximum contrast and slant visibility of the Gaussian distribution are smaller than those of the rectangular distribution at the same peak intensity, indicating that the Gaussian distribution has a stronger extinction capability.

However, this study still has certain limitations and needs further optimization: First, this study uses ideal Gaussian and rectangular distributions to simulate the aerosol layer. Although the basic laws of parameter sensitivity are revealed through these two extreme morphological profiles, the vertical distribution of real plumes often lies between Gaussian and rectangular shapes, with complex structures such as multi-peak and skewness. The sharpness of their boundaries directly affects the way extinction acts along the path. Future research can combine observed real plume profiles from field campaigns to construct aerosol layer models that are closer to reality, further validate and improve the conclusions of this study, and enhance the accuracy and applicability of target visibility assessment in complex atmospheric environments. Second, the experiment was carried out under the conditions of fixed observation height, zenith angle and azimuth angle, without considering the influence of different observation geometries on the regulation law. In the future, the sensitivity analysis of observation geometric parameters can be expanded to improve the evaluation model under different scenarios.

Author Contributions

Conceptualization, R.D. and S.H.; methodology, S.L. and S.H.; software, S.L.; validation, S.L. and J.M.; formal analysis, S.L. and S.Y.; investigation, S.L., R.D., J.M., J.Z., S.Y., Y.L. and H.Z.; resources, R.D.; data curation, S.L. and H.Z.; writing—original draft preparation, S.L.; writing—review and editing, R.D., J.M. and J.Z.; visualization, S.L. and Y.L.; supervision, R.D.; project administration, R.D.; funding acquisition, S.H. All authors have read and agreed to the published version of the manuscript.

Funding

This research was supported by the Science Foundation of Hunan Province (2024JJ2058) and the National Science Foundation of China (Grant Numbers: 42175154, 42205122 and 462105367).

Data Availability Statement

Data are available upon reasonable request from the corresponding author.

Acknowledgments

The authors thank all those who provided technical support and assistance in this study. During the preparation of this manuscript, the authors used DeepL v4.0.6052.0 Translator for English translation. The authors have reviewed and edited the output and take full responsibility for the content of this publication.

Conflicts of Interest

The authors declare no conflicts of interest. The funders had no role in the design of the study; in the collection, analyses, or interpretation of data; in the writing of the manuscript; or in the decision to publish the results.

Abbreviations

The following abbreviations are used in this manuscript:
ADAnalog-to-Digital Converte
i.e.,id est

References

  1. Ma, Y.; Zhang, X. Retrieval of Atmospheric Slant Path Visibility by Integrating Satellite Observations and Numerical Simulations. Acta Opt. Sin. 2026, 46, 0501002. [Google Scholar]
  2. Bi, L.; Ding, S.; Zong, R.; Yi, B. Examining Asian Dust Refractive Indices for Brightness Temperature Simulations in the 650–1135 cm−1 Spectral Range. J. Quant. Spectrosc. Radiat. Transf. 2020, 247, 106945. [Google Scholar] [CrossRef]
  3. Zhao, M.; Dai, T.; Cheng, Y.; Goto, D.; Yumimoto, K.; Shi, G. Global Assimilation of NRL MODIS Aerosol Optical Thickness and Its Impact on Aerosol Direct Radiative Effect over a Full Year. Atmos. Res. 2026, 336, 108819. [Google Scholar] [CrossRef]
  4. Che, H.; Zhang, X.; Wang, Y.; Zhang, L.; Shen, X.; Zhang, X.; Wang, H.; Li, L.; Sun, J.; Zhang, Y.; et al. Aerosol Optical and Radiative Properties and Their Environmental Effects in China: A Review. Earth-Sci. Rev. 2024, 248, 104634. [Google Scholar] [CrossRef]
  5. Zhu, Z.; Li, H.; Fan, S.; Xu, W.; Fang, R.; Liu, B.; Gong, W. The Covariability between Temperature Inversions and Aerosol Vertical Distribution over China. Atmos. Pollut. Res. 2024, 15, 101994. [Google Scholar] [CrossRef]
  6. Klein, G.; Ceamanos, X.; Vidot, J.; Es-Sayeh, M.; Ramon, D.; Moulana, M. Enhancing Surface Albedo and Aerosol Retrieval from MTG-I/FCI by Accounting for Earth’s Sphericity and Light Polarization Effects Using a Simple Near-Real-Time-Compatible Approach. In Proceedings of the EGU General Assembly 2026, Vienna, Austria, 3–8 May 2026. EGU26-7562. [Google Scholar]
  7. Li, Q.; Di, H.; Chen, N.; Cheng, X.; Yang, J.; Yuan, Y.; Yan, Q.; Hua, D. Atmospheric Vertical Structure Variations during Severe Aerosol Pollution Events Based on Lidar Observations. Atmos. Chem. Phys. 2026, 26, 5063–5083. [Google Scholar] [CrossRef]
  8. Zhang, Z.; Kuang, Z.; Li, C.; Deng, Q.; Wu, D.; Liu, D. Iterative Inversion Method for Retrieving the Optical Properties of Aerosol under Cloud by Ground-Based Scanning Lidar. Opt. Express 2025, 33, 3743–3758. [Google Scholar] [CrossRef]
  9. Chen, L.; Yu, Z.; Wang, S.; He, C.; Zhao, M.; Liu, A.; Wang, Z. Extinction Coefficient Inversion Algorithm with New Boundary Value Estimation for Horizontal Scanning Lidar. Remote Sens. 2025, 17, 1736. [Google Scholar] [CrossRef]
  10. Pinardi, G.; Friedrich, M.M.; Vigouroux, C.; Langerock, B.; De Smedt, I.; Fayt, C.; Hermans, C.; Beirle, S.; Wagner, T.; Zhou, M.; et al. Intercomparison of MAX-DOAS, FTIR and Direct Sun HCHO Vertical Columns at Xianghe, China. Atmos. Meas. Tech. 2026, 19, 1259–1276. [Google Scholar] [CrossRef]
  11. Zha, Y.; Zhang, J.; Gao, J.; He, J. Impact of MODIS-Derived Cloud Cover on Aerosol Optical Depth Measured with a Sun Photometer: A Case Study from Nanjing, China. Int. J. Remote Sens. 2013, 34, 8534–8548. [Google Scholar] [CrossRef]
  12. Li, P.; Xue, Y.; Dionisi, D.; He, B.; Wang, P.; Li, H. Detecting the Layer Height of Smoke and Dust Aerosols over Land and Ocean Using Ultraviolet Dual-Wavelength Measurements. Remote Sens. Environ. 2025, 331, 115001. [Google Scholar] [CrossRef]
  13. Wei, Y.; Zhu, Y.; Liu, J.; Cao, Y.; Wang, Y.; Huang, K.E.; Zheng, B.; Rosenfeld, D.; Wang, M. Lack of Vertical Co-Location Between Aerosols and Clouds Biases the Satellite-Based Quantification of the Twomey Effect. J. Geophys. Res. Atmos. 2025, 130, e2025JD045463. [Google Scholar] [CrossRef]
  14. Rogozovsky, I.; Ansmann, A.; Hofer, J.; Chudnovsky, A. Unveiling Atmospheric Layers: Vertical Pollution Patterns and Prospects for High-Resolution Aerosol Retrievals Using the Eastern Mediterranean as a Case Study. Environ. Sci. Technol. 2025, 59, 12181–12195. [Google Scholar] [CrossRef]
  15. Schmale, J.; Pohorsky, R.; Lonardi, M.; Temel, Y.; Dyson, J.; Calmer, R.; Favre, L. From the Arctic to Antarctica: Observations of Vertical Aerosol Distribution from Tethered Balloon Measurements. In Proceedings of the EGU General Assembly 2025, Vienna, Austria, 27 April–2 May 2025. EGU25–10134. [Google Scholar]
  16. Franco, M.A.; Valiati, R.; Holanda, B.A.; Meller, B.B.; Kremper, L.A.; Rizzo, L.V.; Carbone, S.; Morais, F.G.; Nascimento, J.P.; Andreae, M.O.; et al. Vertically Resolved Aerosol Variability at the Amazon Tall Tower Observatory under Wet Season Conditions. Atmos. Chem. Phys. 2024, 24, 8751–8770. [Google Scholar] [CrossRef]
  17. Weigel, R.; Kandler, K.; Scheibe, M.; Smith, K.; Valero, L.; Eichhorn, L.K.; Jost, S.; Röck, K.; Gisinger, S.; Baron, A.; et al. Coordinated Vertical Tandem-Profiling of a Saharan Dust Intrusion over Central Europe on 20 June 2024 Based on Balloon-Borne Soundings from Two Different Sites. In Proceedings of the EGU General Assembly 2025, Vienna, Austria, 27 April–2 May 2025. EGU25-9134. [Google Scholar]
  18. Khaykin, S.; Sicard, M.; Leblanc, T.; Sakai, T.; Balugin, N.; Berthet, G.; Chevrier, S.; Chouza, F.; Feofilov, A.; Gantois, D.; et al. Global Transport of Stratospheric Aerosol Produced by Ruang Eruption from EarthCARE ATLID, Limb-Viewing Satellites and Ground-Based Lidar Observations. Atmos. Chem. Phys. 2026, 26, 607–622. [Google Scholar] [CrossRef]
  19. Wang, Y.; Du, J.; Wang, Y.; Qin, Y.; Yan, Q.; Song, Y.; Di, H.; Hua, D. Error Simulation of Atmospheric Scattered Radiance and Its Influence on Slant Visibility Based on the SBDART Model and Monte Carlo Method. Appl. Opt. 2023, 62, 2541–2553. [Google Scholar] [CrossRef]
  20. Shen, L.; Cheng, Y.; Bai, X.; Dai, H.; Wei, X.; Sun, L.; Yang, Y.; Zhang, J.; Feng, Y.; Li, Y.; et al. Vertical Profile of Aerosol Number Size Distribution during a Haze Pollution Episode in Hefei, China. Sci. Total Environ. 2021, 786, 147549. [Google Scholar] [CrossRef]
  21. Ren, H.; Hu, W.; Wei, L.; Yue, S.; Zhao, J.; Li, L.; Wu, L.; Zhao, W.; Ren, L.; Kang, M.; et al. Measurement Report: Vertical Distribution of Biogenic and Anthropogenic Secondary Organic Aerosols in the Urban Boundary Layer over Beijing during Late Summer. Atmos. Chem. Phys. 2021, 21, 12949–12970. [Google Scholar] [CrossRef]
  22. Wang, Y.; Jia, L.; Li, X.; Lu, Y.; Di, H.; Hua, D. Measurement Method for Slant Visibility with Slant Path Scattered Radiance Correction by Lidar and the SBDART Model. Opt. Express 2021, 29, 837–853. [Google Scholar] [CrossRef]
  23. Nakajima, T.Y.; Imai, T.; Uchino, O.; Nagai, T. Influence of Daylight and Noise Current on Cloud and Aerosol Observations by Spaceborne Elastic Scattering Lidar. Appl. Opt. 1999, 38, 5218–5228. [Google Scholar] [CrossRef] [PubMed]
  24. Zhao, S.; He, J.; Dong, L.; Qi, S.; Yin, D.; Chen, J.; Yu, Y. Contrasting Vertical Circulation between Severe and Light Air Pollution inside a Deep Basin. Bull. Am. Meteorol. Soc. 2023, 104, E411–E434. [Google Scholar] [CrossRef]
  25. Xiong, J.; Wang, Y.; Tao, M.; Dong, W.; Zhou, L.; Wang, L. Vertical Structure of the Aerosols in the Troposphere over the North China Plain: An Analysis Based on Observations and Simulations from 2007 to 2022. Atmos. Res. 2025, 327, 108348. [Google Scholar]
  26. Ferrero, L.; Cappelletti, D.; Moroni, B.; Sangiorgi, G.; Perrone, M.G.; Crocchianti, S.; Bolzacchini, E. Wintertime Aerosol Dynamics and Chemical Composition across the Mixing Layer over Basin Valleys. Atmos. Environ. 2012, 56, 143–153. [Google Scholar] [CrossRef]
  27. Ricchiazzi, P.; Yang, S.; Gautier, C.; Sowle, D. SBDART: A Research and Teaching Software Tool for Plane-Parallel Radiative Transfer in the Earth’s Atmosphere. Bull. Am. Meteorol. Soc. 1998, 79, 2101–2114. [Google Scholar]
  28. Zhao, X.; Huang, L.; Li, M.; Han, C.; Nie, T. Atmospheric Scattering Model and Non-Uniform Illumination Compensation for Low-Light Remote Sensing Image Enhancement. Remote Sens. 2025, 17, 2069. [Google Scholar]
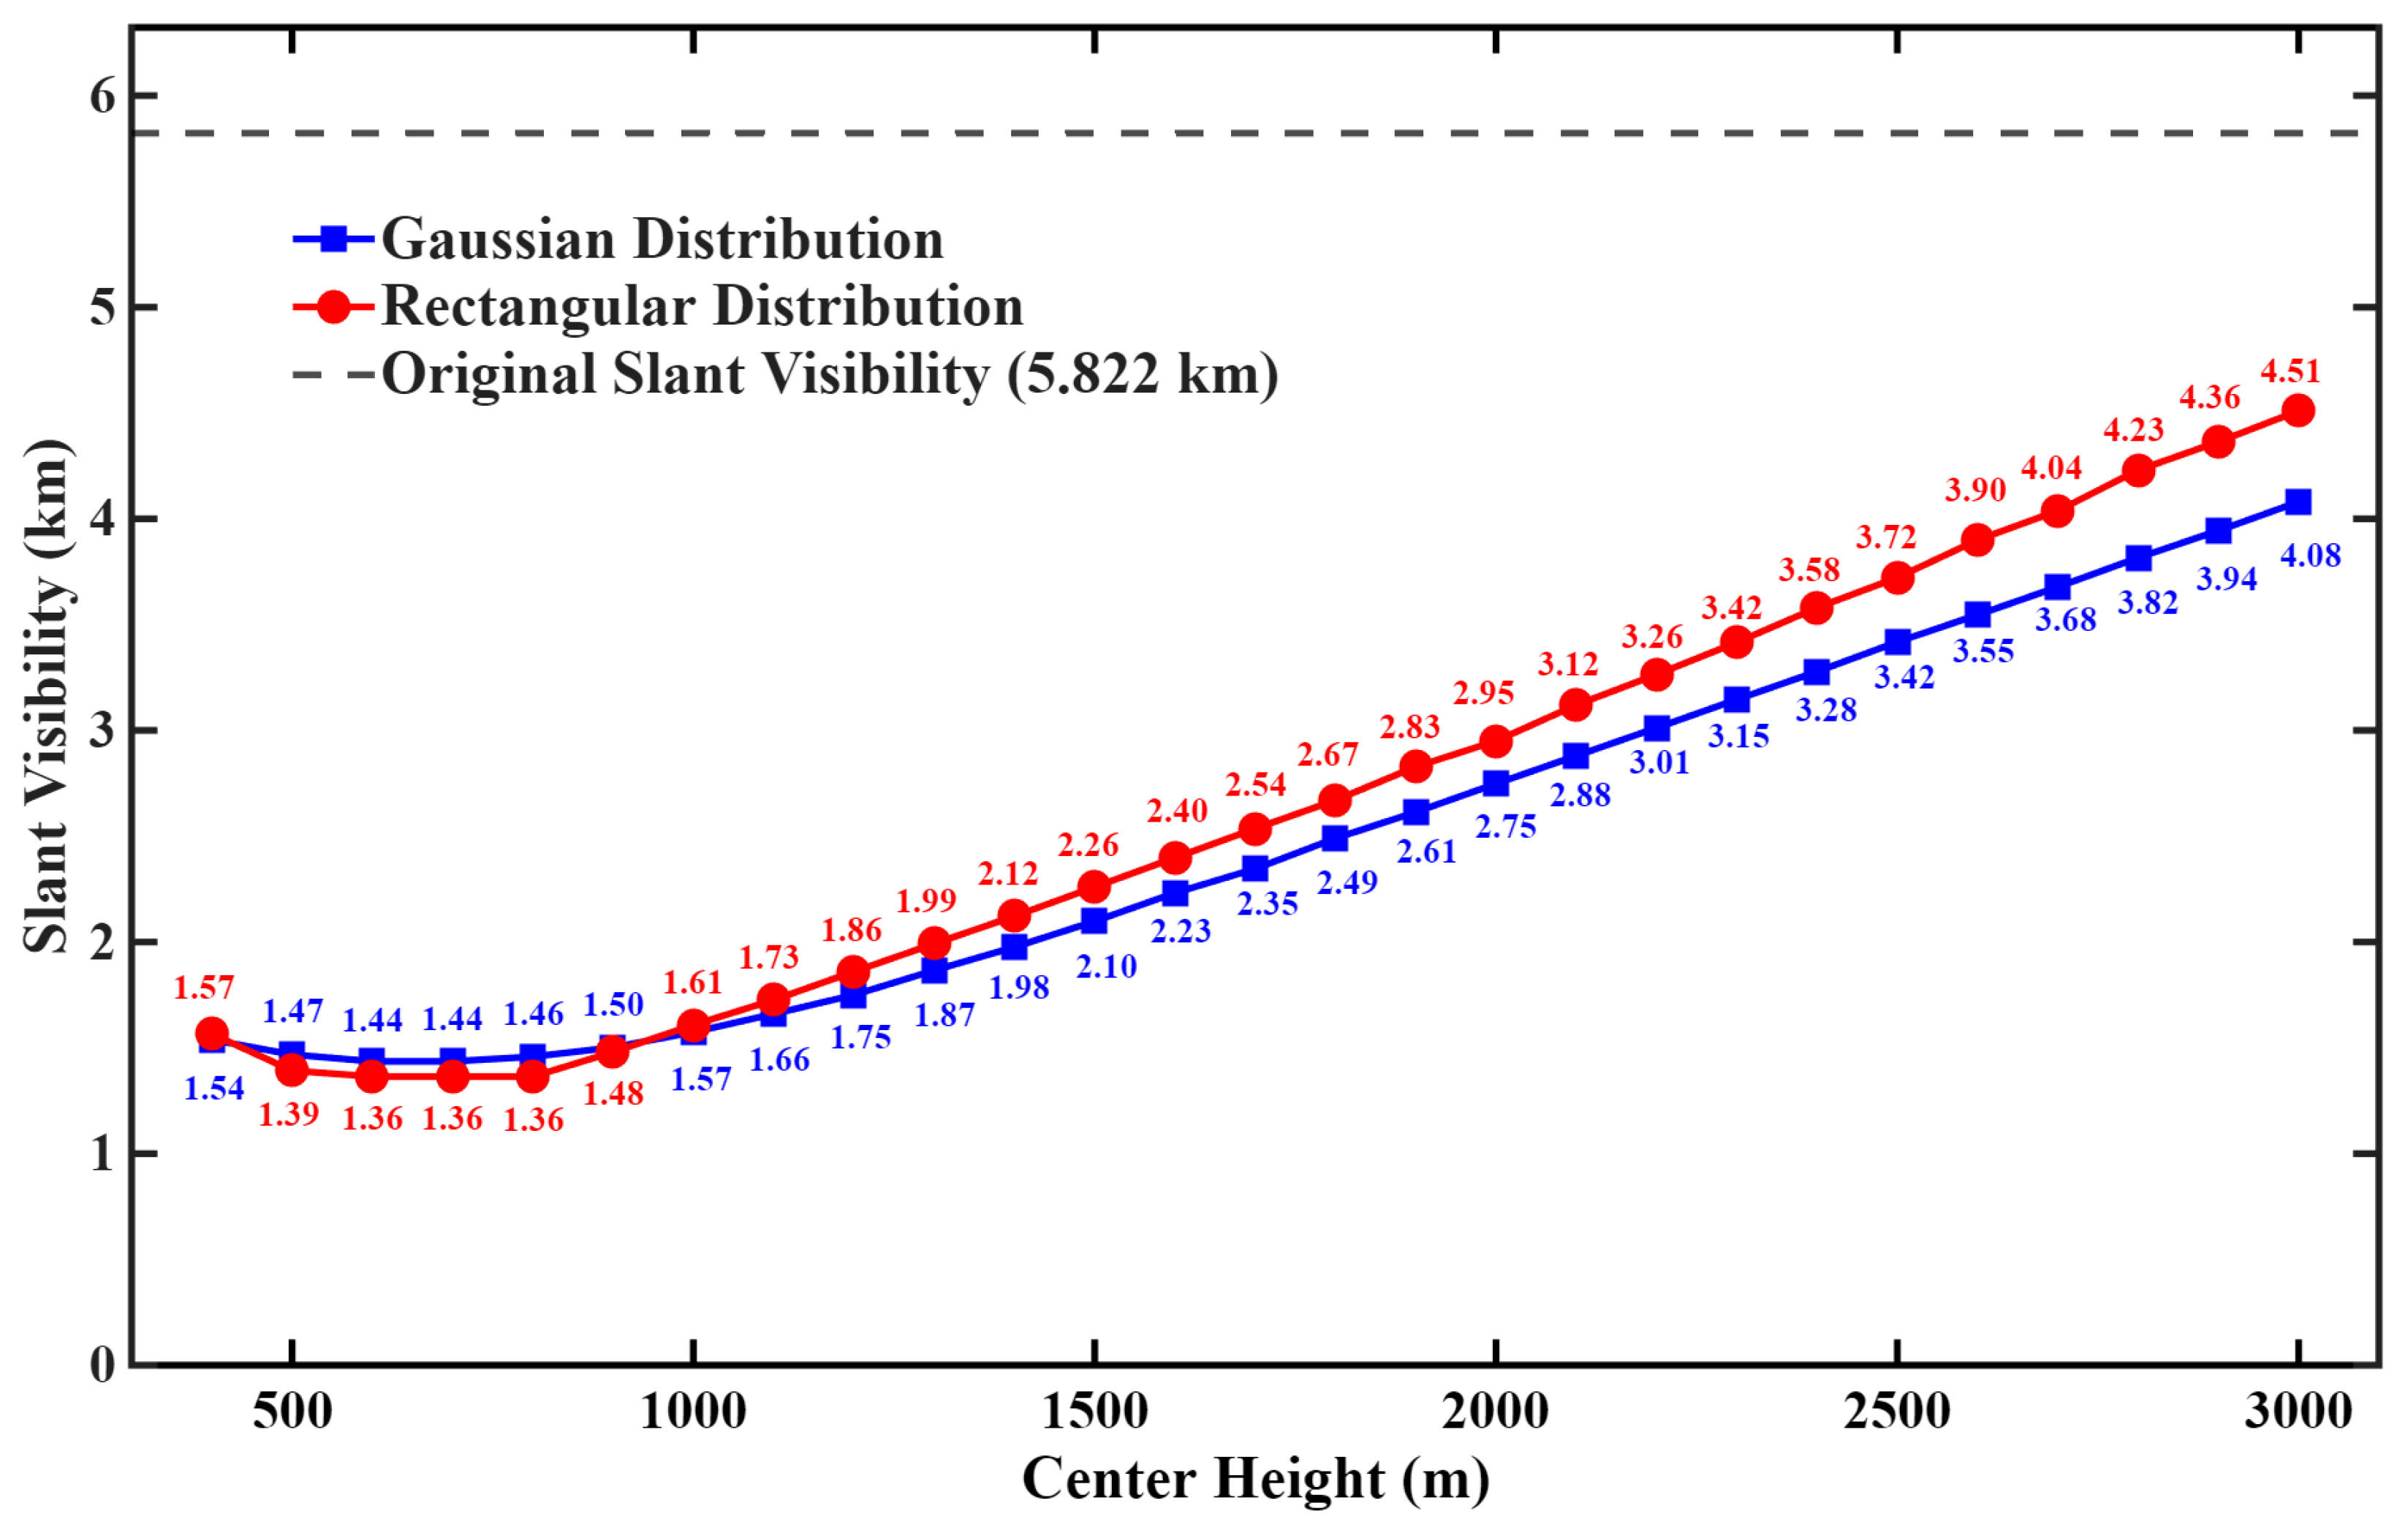
  29. Deng, T.; Zou, Y.; Hu, S.; Li, F.; He, G.; Ouyang, S.; Zhang, X.; Wang, Q.; Zhang, Z.; Mai, B.; et al. Study on the Characteristics of Actinic Radiation and Direct Aerosol Radiation Effects in the Pearl River Delta Region. Atmos. Environ. 2023, 309, 119937. [Google Scholar]
  30. Huang, G.; Chen, Y.; Liu, Q.; Wang, P.; He, Q.; He, Q.; Li, S.; Shao, W.; Fan, T. Accurate Shortwave Radiation Simulation with a Two-Layer Aerosol Model in Xinjiang Region. J. Meteorol. Res. 2024, 38, 69–87. [Google Scholar] [CrossRef]
  31. Ma, Y.; Zhu, J.; Zhang, Y. Slant-Range Visibility Retrieval Method Based on Atmospheric Radiative Transfer and δ-Two-Stream Approximation. Acta Opt. Sin. 2023, 43, 1201004. [Google Scholar]
  32. Stamnes, K.; Tsay, S.-C.; Wiscombe, W.; Jayaweera, K. Numerically Stable Algorithm for Discrete-Ordinate-Method Radiative Transfer in Multiple Scattering and Emitting Layered Media. Appl. Opt. 1988, 27, 2502–2509. [Google Scholar]
  33. Shi, Y.-N.; Weng, F. An Accelerated Discrete Ordinate Method (ADOM) Developed for Scalar Radiative Transfer by Merging Adjacent Clear-Sky Atmospheric Layers: Forward and Jacobians Derivation. J. Adv. Model. Earth Syst. 2025, 17, e2025MS005136. [Google Scholar]
  34. Xie, Y.; Zhu, Z.; Weng, F.; Li, Z.; Han, X. Simulations of GaoFen-5 Directional Polarimetric Camera (DPC) Observations Using the Advanced Vector Discrete Ordinate Radiative Transfer Model. Adv. Atmos. Sci. 2025, 42, 486–500. [Google Scholar] [CrossRef]
  35. Wang, J. New Technical Assessment of Haze and Visibility Observation. Presented at the AMS 2020 Annual Meeting, Boston, MA, USA, 13 January 2020. Paper 435. [Google Scholar]
  36. Rublev, A.N. Algorithms and Calculations of Aerosol Phase Functions; Internal Note IAE-5715/16 of Russian Research Center; Kurchatov Institute: Moscow, Russia, 1994. [Google Scholar]
  37. World Meteorological Organization (WMO). A Preliminary Cloudless Standard Atmosphere for Radiation Computation. In World Climate Research Programme, WCP-112, WMO/TD-No. 24; WCP: Geneva, Switzerland, 1986. [Google Scholar]
  38. Xia, X.; Chen, H.; Goloub, P.; Zhang, W.; Chatenet, B.; Wang, P. A Compilation of Aerosol Optical Properties and Calculation of Direct Radiative Forcing over an Urban Region in Northern China. J. Geophys. Res. Atmos. 2007, 112. [Google Scholar] [CrossRef]
  39. Achad, M.; Lopez, M.L.; Palancar, G.G.; Toselli, B.M. Retrieving the Relative Contribution of Aerosol Types from Single Particle Analysis and Radiation Measurements and Calculations: A Comparison of Two Independent Approaches. J. Aerosol Sci. 2013, 64, 11–23. [Google Scholar] [CrossRef]
Figure 1. SBDART Radiative Transfer Simulation Flowchart. The blue font in the figure represents the four main input parameters, and the red font is to highlight the SBDART radiative transfer model and the output results.
Remotesensing 18 01718 g001
Figure 2. Flowchart for calculating the apparent brightness contrast and slant visibility of the target object and the background.
Remotesensing 18 01718 g002
Figure 3. Experimental procedure. The profiles in the left half of the figure is the profiles of the extinction coefficient changing with height; In the upper right half of the figure, the lines in the figure show the apparent brightness contrast as a function of vertical distance, and in the figure below, the lines show the visibility of slant range as a function of parameters.
Remotesensing 18 01718 g003
Figure 4. Overlay profiles of Gaussian-distributed aerosol layers at different center heights (peak normalized).
Remotesensing 18 01718 g004
Figure 5. Overlay profiles of rectangularly distributed aerosol layers with different center heights (peak normalized).
Remotesensing 18 01718 g005
Figure 6. The effect of superimposing aerosol layers of different center heights on the apparent brightness contrast, The vertical distance corresponding to the red square in the figure is the critical vertical distance that is exactly recognizable: (a) For Gaussian Distribution. (b) For Rectangular Distribution.
Remotesensing 18 01718 g006
Figure 7. Effect of center height on maximum contrast during stacking of Gaussian-distributed aerosol layers.
Remotesensing 18 01718 g007
Figure 8. Effect of center height on maximum contrast during stacking of Rectangular-distributed aerosol layers.
Remotesensing 18 01718 g008
Figure 9. Effect of different center heights on the slant visibility when Gaussian and rectangular distribution aerosol layers are superimposed.
Remotesensing 18 01718 g009
Figure 10. Overlay profiles of Gaussian-distributed aerosol layers at different vertical widths (peak normalized).
Remotesensing 18 01718 g010
Figure 11. Overlay profiles of rectangular-distributed aerosol layers at different vertical widths (peak normalized).
Remotesensing 18 01718 g011
Figure 12. The effect of superimposing aerosol layers of different vertical widths on the apparent brightness contrast: (a) For Gaussian Distribution. (b) For Rectangular Distribution.
Remotesensing 18 01718 g012
Figure 13. Effect of vertical width on maximum contrast during stacking of Gaussian-distributed aerosol layers.
Remotesensing 18 01718 g013
Figure 14. Effect of vertical width on maximum contrast during stacking of Rectangular-distributed aerosol layers.
Remotesensing 18 01718 g014
Figure 15. Effect of different vertical widths on the slant visibility when Gaussian and rectangular distribution aerosol layers are superimposed.
Remotesensing 18 01718 g015
Figure 16. Overlay profiles of Gaussian-distributed aerosol layers at different peak intensities.
Remotesensing 18 01718 g016
Figure 17. Overlay profiles of Rectangular-distributed aerosol layers at different peak intensities.
Remotesensing 18 01718 g017
Figure 18. The effect of superimposing aerosol layers of different peak intensities on the apparent brightness contrast: (a) For Gaussian Distribution. (b) For Rectangular Distribution.
Remotesensing 18 01718 g018
Figure 19. Effect of peak intensity on maximum contrast during stacking of Gaussian-distributed aerosol layers.
Remotesensing 18 01718 g019
Figure 20. Effect of peak intensity on maximum contrast during stacking of Rectangular-distributed aerosol layers.
Remotesensing 18 01718 g020
Figure 21. Effect of different peak intensities on the slant visibility when Gaussian and rectangular distribution aerosol layers are superimposed.
Remotesensing 18 01718 g021
Table 1. Variation ranges of quantitative parameters with changes in the three key parameters.
Key ParameterMaximum ContrastSlant Visibility
GaussianRectangularGaussianRectangular
Center Height22.3%22.3%164.9%187.3%
Vertical Width16.0%18.3%55.1%59.0%
Peak Intensity0.1%0.0%29.1%19.8%
Disclaimer/Publisher’s Note: The statements, opinions and data contained in all publications are solely those of the individual author(s) and contributor(s) and not of MDPI and/or the editor(s). MDPI and/or the editor(s) disclaim responsibility for any injury to people or property resulting from any ideas, methods, instructions or products referred to in the content.