Article

Distinct but Likely Interdependent Roles of Secondary Organic and Inorganic Aerosol Formation in Aerosol Scattering

1
Institute for Environmental and Climate Research, College of Environment and Climate, Jinan University, Guangzhou 511443, China
2
Guangzhou Institute of Tropical and Marine Meteorology of China Meteorological Administration, GBA Academy of Meteorological Research, Guangzhou 510640, China
3
School of Computer Science and Engineering, Sun Yat-sen University, Guangzhou 510275, China
4
Key Laboratory of Ecology and Environment in Minority Areas, Minzu University of China, National Ethnic Affairs Commission, Beijing 100081, China
*
Author to whom correspondence should be addressed.
Remote Sens. 2026, 18(11), 1713; https://doi.org/10.3390/rs18111713
Submission received: 24 April 2026 / Revised: 21 May 2026 / Accepted: 23 May 2026 / Published: 26 May 2026
(This article belongs to the Section Atmospheric Remote Sensing)

Highlights

What are the main findings?
  • SOA and SIA formations exert distinct but likely coupled impacts on aerosol size evolution and scattering efficiency.
  • A pronounced co-enhancement of aerosol size and hygroscopicity promotes aerosol scattering.
What are the implications of the main findings?
  • Submicron aerosol mass concentration retrieval from lidar and satellite observations should account for the covariation characteristics between aerosol scattering efficiency and hygroscopicity.
  • Accurate retrieval of aerosol chemical composition from remote sensing of aerosol optical properties requires consideration of variations in scattering efficiency driven by aerosol chemical transformations.

Abstract

Aerosol scattering strongly influences the Earth’s atmosphere energy balance and actinic flux, yet its efficiency remains uncertain due to limited understanding of chemical effects. Scattering efficiency primarily depends on aerosol size, scattering refractive index, and hygroscopicity, which are determined by emissions and chemical processes; however, their covariation characteristics are rarely explored. Here, we use long-term measurements of submicron aerosol size distributions, chemical composition, scattering properties, and hygroscopicity in Guangzhou to investigate their covariations and links to secondary aerosol formation. The results indicate that dry-state volume scattering efficiency (VSE) was mainly driven by variations in aerosol size (R2 = 0.74), despite substantial refractive index variability (1.4–1.6), which showed overall independent variations with size. Source apportionment and case analyses suggest distinct size ranges for secondary organic (SOA) and inorganic aerosols (SIA). Accordingly, a new lognormal fitting methodology is proposed to retrieve particle volume size distribution (PVSD)-associated aerosol components by combining PVSD and composition data. Retrieved geometric mean diameters of SOA ( D g , S O A , 175–400 nm; 246 ± 44 nm) and SIA ( D g , S I A , 200–600 nm; 382 ± 68 nm) are significantly correlated (R2 = 0.43), indicating coupled formation of SOA and SIA and their interdependent roles in aerosol scattering. In addition, pronounced joint increases in dry-state VSE and aerosol hygroscopicity driven by the co-enhancement of aerosol size and hygroscopicity are further revealed. These results demonstrate the interconnected roles of secondary aerosol formation in controlling scattering efficiency and underscore the need to better represent SOA–SIA interactions in simulating aerosol radiative effects and address the covariations of aerosol hygroscopicity and dry-state scattering efficiency in aerosol remote sensing.

1. Introduction

Aerosols exert a profound influence on the Earth’s atmosphere by scattering and absorbing solar radiation [1,2], thereby modulating the planet’s radiative balance, degrading visibility, and shaping climate dynamics. Aerosol scattering efficiency, defined as the ability of particles to scatter light per unit mass or volume, is key in quantifying and understanding aerosol scattering effects in the radiative energy balance [3,4] and visibility impairment [5,6,7,8,9]. For example, Kinne, et al. [10] compared aerosol optical properties across models, revealing discrepancies in scattering efficiency as a key source of inter-model spread in climate projections. Despite its importance, aerosol scattering efficiency is often simplified in models and calculated using fixed-size distributions, refractive indices, and hygroscopicity for different aerosol components [11,12,13,14]. The collective evidence, from Charlson, et al. [1] to recent syntheses such as [3], underscores that advancing our understanding of scattering efficiency is vital for refining estimations of direct aerosol radiative effects, improving visibility forecasts and remote sensing of aerosol mass concentrations [15], and reducing uncertainties in climate simulations, setting the stage for region-specific investigations.
The scattering ability of an aerosol particle is determined by its size, refractive index, and shape [3]. The refractive index is determined by aerosol chemical composition [16,17], and the scattering ability is mostly associated with the real part of the refractive index (mr). For accumulation mode submicron aerosols, the aerosol scattering coefficient closure test could generally be achieved through the assumption of spherical particles [18] for regions with small influences of dust. Therefore, the mass scattering efficiency (MSE), defined as scattering coefficient per unit aerosol mass, is a complex function of size, composition, mixing state, and density [19,20,21]. Indeed, aerosol size distribution, refractive index, and hygroscopicity serve as the primary drivers of scattering efficiency [19], without considering the meteorological parameter RH. Models calculate aerosol scattering efficiency based on assumptions on size distributions, refractive index, and hygroscopicity of different components. Each refractive index differs greatly among aerosol components, with the refractive index of organic aerosols (OA) remaining mostly elusive and varying in a wide range [22,23,24,25]. In addition, the complex interplays among aerosol compositions would give rise to great challenges in predicting refractive index [11,16]. Hence, the refractive index might vary in a wide range for atmospheric aerosols. For example, the study by Zhao, et al. [26] investigated variations in the mr in four sites of China and revealed a larger-than-expected variation range in mr, in the range of 1.36 to 1.78; this variation might partially be associated with OA. This degree of mr variations could result in significant variations in scattering efficiency. For example, for an aerosol diameter of 300 nm, scattering efficiency with mr of 1.78 is about six times that with mr of 1.36, which shares the same quantitative scattering efficiency changes resulting from increasing aerosol diameter from 300 nm to 450 nm for the fixed mr of 1.36. Results of Zarzana, et al. [27] demonstrate that a small perturbation of mr (0.003) can lead to uncertainty of 1% in direct aerosol radiative forcing estimations. He and Zhao [28] reported mr as the most sensitive parameter in aerosol scattering calculations. Therefore, the investigations on driving factors and mechanisms for regional aerosol scattering should focus on covariations of aerosol size distributions, mr, and hygroscopicity, and their relations with chemical processes. However, this is rarely done in the existing literature.
Most of the currently available dry-state scattering efficiency investigations focus on MSE of aerosol components, which are usually retrieved using multilinear regression methods [8,19,29] or estimated according to measured size distributions of different components [13,30,31]. Results of these methods are widely applied in models and visibility prediction practices, for example, the empirical formulas from the Interagency Monitoring of Protected Visual Environments (IMPROVE) network for predicting particle extinction coefficient [32]. However, it is known that the size distribution of different aerosol components varies among seasons and regions, and depends highly on emissions as well as formation pathways and mechanisms. For example, the results of Chen, et al. [33] demonstrate that MSEs of sulfate and nitrate increased with the elevated pollution levels due to a corresponding increase in size, highlighting both the limitations of using static assumptions about aerosol size and refractive index and the essentiality of considering dynamic aerosol properties for prediction. This needs comprehensive observations and investigations into how primary emissions and secondary formations shape aerosol size distributions and influence refractive index in different regions. In addition, the covariation characteristics between dry-state scattering efficiency and aerosol hygroscopicity were rarely investigated before. This hinders the complete understanding of variations in aerosol scattering and corresponding radiative effects.
The Pearl River Delta (PRD) region, one of the largest city clusters in the world, has a population of nearly 90 million and produces more than 8% of China’s gross domestic product. The rapid economic development and high population density have led to complex and diverse sources of aerosols, which are further influenced by various chemical and physical processes that alter their size and composition. Existing investigations on sources and secondary formation of aerosols in this area demonstrate that aerosol pollution in PRD urban areas is typical of urban pollution in southern China. For example, traffic and cooking are the dominant primary sources of urban aerosols [34,35,36]. Both active gas-phase and multiphase chemistry play significant roles in secondary aerosol formation due to high relative humidity characteristics in southern China. As a result, urban areas in southern China may share some similar mechanisms of aerosol scattering change. In addition, PRD is a humid region with a yearly average RH higher than 70%. The covariations between dry-state aerosol scattering and hygroscopicity might significantly impact aerosol scattering in ambient air [6]. For example, despite a significant reduction in PM2.5 mass concentrations in southern China, improvement in visibility has been limited partly due to increased dry-state aerosol scattering efficiency and hygroscopicity [6]. For example, both results of Liu, et al. [8] and Liu, et al. [7] have reported the significant role of ammonium nitrate in visibility degradation in PRD and the eastern part of southern China.
In this study, we comprehensively analyze observations of aerosol size distributions, optical properties, hygroscopicity, and chemical compositions in an urban area of PRD to identify key factors driving variations in aerosol scattering and their relations with the formation of secondary aerosols. Our analysis is based on long-term measurements, including year-long observations of particle number size distributions (PNSD) and PM1 chemical composition in the dry state, as well as six months of observations of aerosol scattering under dry and near-ambient RH conditions. Using these datasets, we address the following key questions regarding aerosol scattering efficiency: (1) Is dry-state aerosol scattering efficiency primarily driven by size distribution, considering the large variability of refractive index reported in Shen, et al. [37]? (2) How do primary emissions and secondary aerosol formation shape size distributions, and what are their impacts on dry-state scattering efficiency? (3) Did dry-state scattering efficiency vary correlatedly with aerosol hygroscopicity? (4) Can we identify recommended aerosol size ranges for modeling aerosol scattering in this region? The materials and methods are detailed in Section 2. The controlling factors of dry-state scattering efficiency and key emission and chemical processes influencing aerosol size distributions, variation characteristics of dry-state scattering efficiency and hygroscopicity, as well as implications for simulating aerosol radiative effects, are discussed in Section 3, followed by conclusions and recommendations in the final section.

2. Materials and Methods

2.1. Field Measurements

A year-long field campaign was conducted from 1 March 2022 to 28 February 2023 at Haizhu Wetland Park (23°05′N, 113°22′E) in Guangzhou, China, to measure aerosol size distributions, optical properties, and chemical compositions. The park is located within the urban area and is surrounded by major roads, residential complexes, office buildings, and commercial centers, all at distances greater than 1 km. Therefore, the site is representative of the general aerosol pollution characteristics in the Guangzhou urban environment. During the entire observation period, instruments were housed in a temperature-controlled laboratory maintained at approximately 24 °C.
A Scanning Mobility Particle Sizer (SMPS, TSI, Shoreview, MN, USA) was used to measure PNSD of dried aerosols in the size range of ~16 to ~800 nm (changed slightly in different periods). A Quadrupole Aerosol Chemical Speciation Monitor (Q-ACSM, Aerodyne, Billerica, MA, USA) was deployed to quantify the mass concentrations and chemical composition of non-refractory submicron particulate matter (NR-PM1), including ammonium (NH4), nitrate (NO3), sulfate (SO4), chloride (Cl), and organic components. Black carbon (BC) mass concentrations were measured using an AE33 aethalometer [38] by measuring aerosol light absorption. Aerosols were sampled through a PM2.5 inlet (BGI, SCC 2.354, MesaLabs, Lakewood, CA, USA), which requires 8 L/min for a 2.5 μm cut. A 1.8 m Nafion dryer was installed downstream of the impactor to maintain a low RH (<25%) in the sampling lines, as monitored by the inlet RH sensor of the Q-ACSM. Note that sampling the RH of indoor instruments was seasonally dependent and slightly higher in summer. The instrument flow rates were set as follows: Q-ACSM at 3 L/min, SMPS at 0.3 L/min, and AE33 at 5 L/min. All sampling tubes and the Nafion dryer were mounted vertically to minimize sampling losses.
Between 27 July 2022 and 28 February 2023 (mainly autumn and winter), an outdoor self-assembled nephelometer system (Aurora 3000, Ecotech, acoem, Melbourne, Australia) was deployed on the container roof to measure aerosol scattering coefficients of total suspended particles (TSP) at three wavelengths (450, 525, 635 nm) under both near-dry (RH < 15%) and near-ambient RH (20% < RH < 95%) conditions. Details of this system are described in Qiao, et al. [39].

2.2. Source Apportionment of Organic Aerosols

The multilinear engine (ME-2) technique [40] was applied to the OA mass spectra to apportion OA sources. Unlike traditional Positive Matrix Factorization (PMF), ME-2 incorporates a priori source profiles to constrain the rotational freedom of factor solutions, limiting the deviation of resolved factor profiles from the input spectra. The ME-2 source apportionment procedure follows the methodology outlined in Liu, et al. [8] and Zhai, et al. [41]. Briefly, a four-factor solution was explored with the scalar a (which defines the allowed variation from the prior profiles) varied from 0.1 to 0.5. The profiles for hydrocarbon-like OA (HOA) and cooking-related OA (COA) from Liu, et al. [8] were used as constraints. The final solution, selected with a = 0.3 (see Figure S1), resolved two primary OA (POA) factors and two SOA factors. The POA factors included HOA (O/C ≈ 0.17) and COA (O/C ≈ 0.12), while the SOA factors included less-oxygenated OA (LOOA; O/C ≈ 0.57) and more-oxygenated OA (MOOA; O/C ≈ 1.26). Additional details on the spectral profiles of these OA factors are provided in Section S1 of the Supplementary Materials.

2.3. Source Apportionment of Aerosol Volume Size Distributions

As demonstrated by Ogulei, et al. [42], the PMF method can also be applied to identify sources of aerosol size distributions. In such applications, the resolved PNSD factors have also been used to interpret the sources of aerosol mass when combined with chemical fingerprints obtained from aerosol mass spectrometry. In this study, given that primary and secondary aerosols are often internally mixed during atmospheric aging, PMF analysis was directly applied to PVSD converted from measured PNSD. This approach better aligns with the mass concentration measurements from the Q-ACSM and facilitates the identification of source-specific size ranges of aerosol mass. A PVSD matrix was input into the PMF model (PMF2, version 4.2) to resolve source factors [43,44]. Following the approaches of Ogulei, et al. [42] and Du, et al. [45], the uncertainty matrix used in the PMF analysis is estimated as follows:
e i j = C 1 × X i j + X j ¯ ,
U n c i j = e i j + C 2 × X i j ,
where e i j is the measurement error. C 1 and C 2 are assumed to be 0.01 and 0.1, according to Ogulei, et al. [42]. X i j is the data in the jth size bin of the PVSD matrix at the ith time point, while X j ¯ is the arithmetic mean of the jth size bin.
Five PVSD factors were identified based on a comprehensive analysis that considered their diurnal patterns, modal characteristics in PVSD, contributions to total volume concentrations, and correlations with chemical components. Details on the selection of factor numbers and PVSD factor analysis are provided in Section S2 of the Supplementary Materials and Section 3.2. In the source apportionment of PVSD factors as presented in Section 3.2, ammonium, nitrate, and sulfate were grouped into ammonium sulfate (AS) and ammonium nitrate (AN), following the approach proposed by Gysel, et al. [46]. Correlation analyses between the mass concentrations of OA factors, BC, AS, and AN with the resolved PVSD factors were conducted to aid in PVSD source identification. In addition, the densities of aerosol species used for volume calculations in this study were generally consistent with those in Kuang, et al. [47]: 1.78 g/cm3 for AS and AN, 1.0 g/cm3 for HOA and COA, 1.2 g/cm3 for LOOA, 1.4 g/cm3 for MOOA, and 1 g/cm3 for BC, based on Zhou, et al. [48].

2.4. Aerosol Refractive Index Retrievals, Aerosol Effective Diameter, and Aerosol Scattering Efficiency Calculations

The scattering closure method is commonly used to retrieve mr, as mr is the most important parameter governing aerosol scattering when the PNSD and BC mass concentrations are known. Based on this principle, Shen, et al. [37] retrieved mr values during the campaign of this study when aerosol scattering measurements were available and analyzed the influence of POA emissions and SOA formation on mr variability. As the mr retrievals and dataset used in this study are identical to those in Shen, et al. [37], we do not repeat the retrieval procedures here. The key aspects are summarized as the following: (1) Conversion of scattering coefficients to match PNSD measurements: The conversion of measured aerosol scattering coefficients of total suspended particles ( σ s p ,   T S P , n e p h ) to those of aerosol scattering coefficients of PM1 ( σ s p ,   P M 1 , n e p h ) needs the ratio of σ s p ,   T S P , n e p h / σ s p ,   P M 1 , n e p h , which depends highly on the prevalence of coarse aerosols such as dust and sea spray. However, the possibility of dust events and sea spray aerosols at this inland site was extremely low, and observation results of this ratio across seasons at the same Guangzhou urban demonstrate that variations in this ratio of σ s p ,   T S P , n e p h / σ s p ,   P M 1 , n e p h were mainly driven by pollution levels ( σ s p ,   T S P , n e p h ). The ratio of σ s p ,   T S P , n e p h / σ s p ,   P M 1 , n e p h statistically ranged from 1.1 to 1.3 for conditions of σ s p ,   T S P , n e p h higher than 50 Mm−1; and details were carefully discussed in Shen, et al. [37]. Therefore, the statistical relationship between σ s p ,   T S P , n e p h / σ s p ,   P M 1 , n e p h and σ s p ,   T S P , n e p h was acquired in Shen, et al. [37] and used to convert observed σ s p ,   T S P , n e p h to σ s p ,   P M 1 , n e p h . This step accounts for the fact that the PNSD in this study only covers particles with diameters below 800 nm, which approximately corresponds to PM1. (2) BC mass size distribution and mixing state: The BC size distribution for diameters > 100 nm in Guangzhou was represented using a single lognormal mode, based on Li, et al. [49], with a geometric mean diameter ( D g ) of 258 nm and a geometric standard deviation ( σ g ) of 1.69. The BC mixing state was characterized using two parameters: the mass fraction of externally mixed BC (Rext = 0.56) and the number fraction of internally mixed BC (Rcsm = 0.13), defined as BC-containing particles represented by the core–shell model among all BC-containing and BC-free particles. Based on these parameters, BC mass measured by the AE33 was distributed by size and mixing state. (3) Assumptions for non-BC aerosols: The imaginary part of the refractive index for BC-free aerosols was fixed at 10−7. Assumptions about all input parameters, as well as corresponding sensitivity tests, were described and comprehensively discussed in detail in Shen, et al. [37]. With these inputs, scattering closure was performed using the BHCOAT code [50,51] to iteratively retrieve the mr that minimizes the difference between modeled and measured aerosol scattering at 525 nm, under the same light-source conditions as the nephelometer. The resulting value is denoted as mrc525. Details of the scattering closure calculations are provided in Section S3 of the Supplementary Materials. The conversion from σ s p ,   T S P , n e p h to σ s p ,   P M 1 , n e p h introduces uncertainty, which is the primary source of error in retrieving mrc525, as shown in Shen, et al. [37]. However, for cases with σ s p ,   T S P , n e p h > 50 Mm−1, the standard deviation of the ratio σ s p ,   T S P , n e p h / σ s p ,   P M 1 , n e p h is less than 10%. Shen, et al. [37] analyzed the same dataset over PRD to investigate factors influencing mrc525. They found that the refractive index retrieved via optical closure is consistent with conclusions derived from size-resolved refractive index measurements from another campaign conducted at the Guangzhou urban area. This indicates that, although the absolute values of mrc525 may contain some uncertainty, its variation characteristics are captured. Influences of different input parameters on mrc525 are comprehensively evaluated in Shen, et al. [37]. In addition, although only points with σ s p ,   T S P , n e p h > 50 Mm−1 are selected for VSE calculations, these points account for approximately 75% of all data points, therefore generally representative of this site.
The aerosol effective diameter (Deff) is a commonly used statistical parameter that characterizes the overall aerosol size and is defined as
D e f f = 10 750 D p 3 d N / d l o g D p   ( D p ) d l o g D p 10 750 D p 2 d N / d l o g D p   ( D p ) d l o g D p ,
where D p is the aerosol diameter and d N / d l o g D p   ( D p ) is the PNSD.
VSE of PM1, defined as aerosol scattering per unit volume, is calculated as follows:
V S E = σ s p ,   P M 1 ( 525 ) V t o t , P M 1 ,
where V t o t , P M 1 is the total PM1 volume concentration calculated from the PNSD measurements. σ s p ,   P M 1 ( 525 ) is converted from σ s p ,   P M 1 , n e p h at 525 nm using the formula σ s p ,   P M 1 525 = σ s p ,   P M 1 , n e p h ( 525 ) × C , where C is the correction factor to account for truncation errors and light-source non-idealities [52], which are calculated using the Mie theory with PNSD, BC mass concentrations, as well as BC mixing states and m r c 525 . Details about the calculations of C are presented in Section S3. Note that VSE was calculated only for σ s p ,   T S P , n e p h > 50 Mm−1 (~75% of data points) due to the fact that the conversion from σ s p ,   T S P , n e p h to σ s p ,   P M 1 , n e p h would bear uncertainties near 10% for σ s p ,   T S P , n e p h   < 50 Mm−1 on the basis of simultaneous measurements of σ s p ,   T S P , n e p h and σ s p ,   P M 1 , n e p h conducted in the Guangzhou urban area.

2.5. Retrieving Aerosol Volume Size Distributions of SOA and SIA

The measured PVSD could often be represented as the superposition of multiple log-normal modes, described by the following function [53]:
f D p = i = 1 n V i 2 π log σ g , i · e x p log D p log D g , i 2 2 l o g 2 σ g , i ,
here, D p denotes the aerosol diameter (nm), n is the number of log-normal modes, V is the total volume concentration ( μ m 3 / c m 3 ), σ g is the geometric standard deviation, and D g is the geometric mean diameter (nm). The PVSDs of SOA and SIA could commonly be parameterized using log-normal functions, as validated in previous studies (e.g., Luo, et al. [54]). Results in Section 3.2 show that primary aerosols (including POA and BC), SOA, and SIA exhibit distinctly different diameter ranges in their volume distributions. Moreover, SOA and SIA generally dominate the NR-PM1 mass. Both source apportionment and case analyses results introduced in Section 3.2 further highlighted that PVSDs of primary aerosols, SOA, and SIA could be generally fitted using a lognormal distribution. Based on this, we developed a new volume-fitting methodology to try to characterize the PVSDs of SOA and SIA on the basis of a lognormal-fitting assumption. Note that volume distribution is a concept that is similar to mass distribution, which is independent of aerosol mixing state. Therefore, this assumption and this volume distribution retrieval method do not involve the assumption of aerosol mixing state.
In principle, the V t o t , P M 1 measured by the SMPS can be expressed as V t o t , P M 1 = V t o t , P O A + B C + V t o t , S O A + V t o t , S I A + V t o t , x , where V t o t , P O A + B C , V t o t , S O A , and V t o t , S I A represent total volume concentrations associated with POA + BC, SOA, and SIA, respectively, while V t o t , x represents total volume concentrations of mass that could not be identified by the aerosol mass spectrometer, including mass missed due to the sampling efficiency of the PM1 impactor of the ACSM, and mass that could not be identified by the ACSM, such as dust, as well as measurement uncertainties. The average fraction of V t o t , x calculated as 1 − ( V t o t , P O A + B C + V t o t , S O A + V t o t , S I A )/ V t o t , P M 1 is 0.23. In view of this, an unconstrained four-mode fitting algorithm was proposed to retrieve size parameters associated with POA + BC, SOA, and SIA. That is, the observed PVSD could be represented using the following formula:
P V S D P M 1   =   P V S D P O A + B C +   P V S D S O A +   P V S D S I A +   P V S D x
With PVSD of each lognormal mode formulated as
P V S D i ( D p ) = V t o t , i 2 π log σ g , i · e x p log D p log D g , i 2 2 l o g 2 σ g , i
where V t o t , i represents the total volume concentration of each mode, as discussed. D g , i and σ g , i denote the geometric mean diameter and standard deviation of the log-normal distribution for each mode. The V t o t , P O A + B C , V t o t , S O A , and V t o t , S I A are three measured parameters derived from mass concentrations of POA + BC, SOA, and SIA, while V t o t , x is derived as V t o t , P M 1 − ( V t o t , P O A + B C + V t o t , S O A + V t o t , S I A ). Therefore, the essence of these fitting is to retrieve size parameters ( D g , i and σ g , i ) using observed volume concentrations of components as constraints. The objective function Q is solved for this purpose:
Q = D p v D p v f i t D p 2 / D p v D p 2 ,
where v D p is the volume concentration of the PVSD at D p , and v f i t D p , D g , V , σ is the volume concentration of the fitted PVSD at D p .
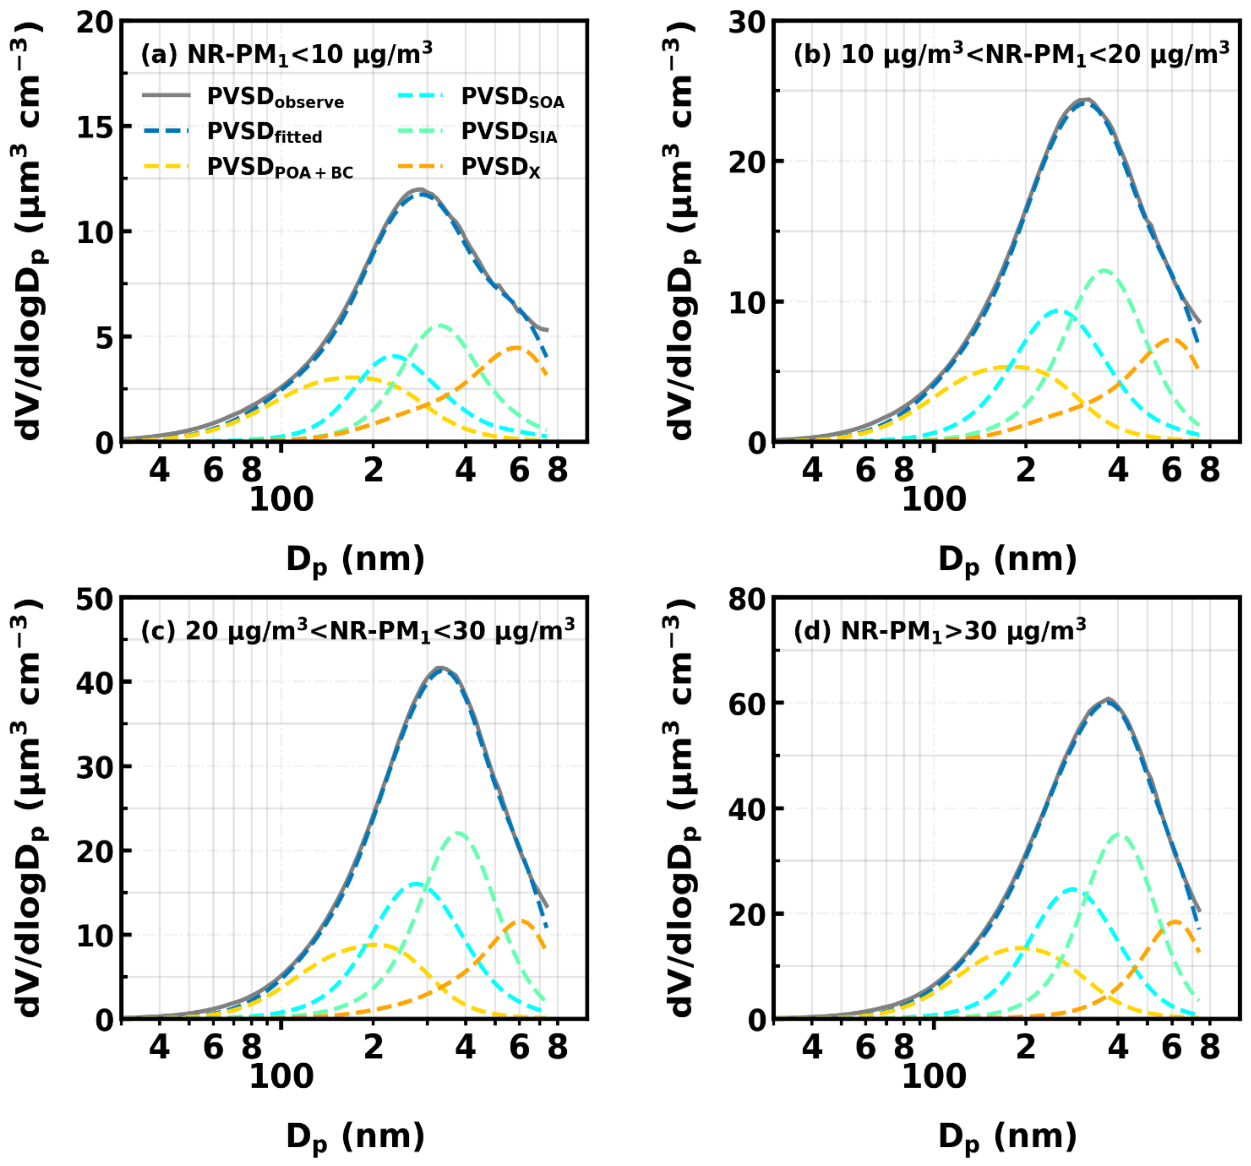
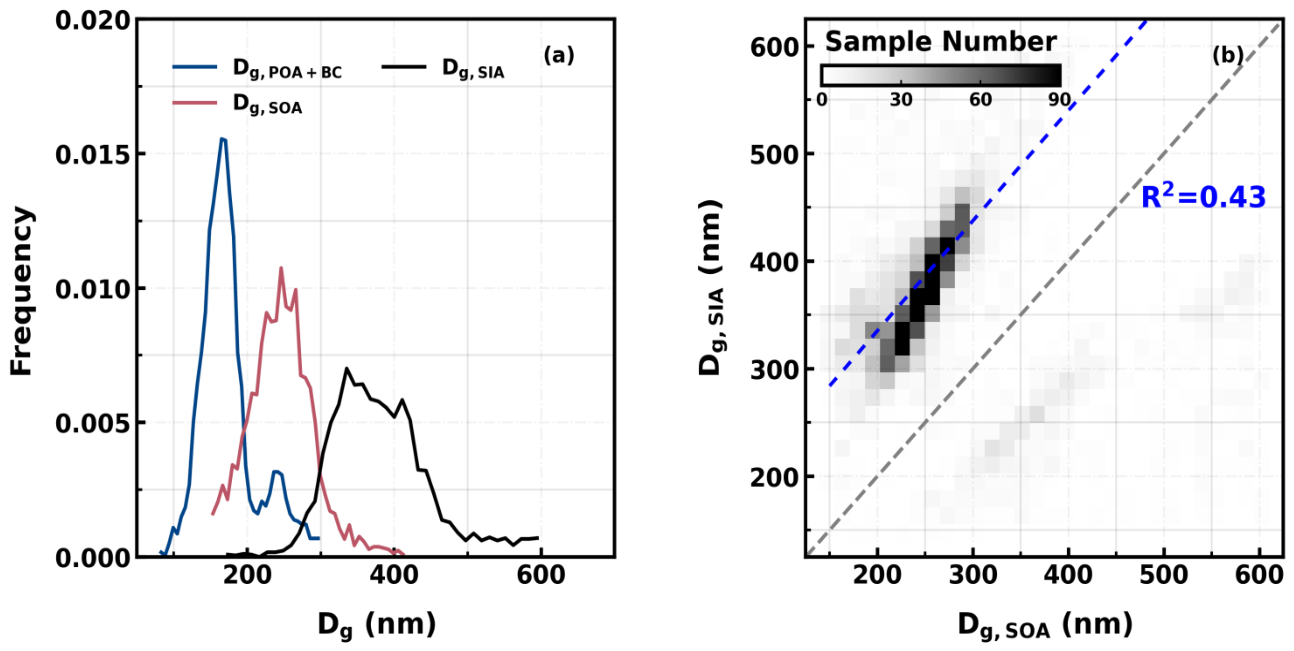
The D g , i for each mode was constrained to 100–800 nm (close to the lower and upper bounds of PVSD), and σ g , i in the range of 1.1–3. The range of σ g , i was empirically determined based on fitting the observed PVSD using a lognormal fitting. Therefore, the retrieval does not constrain the relative size of POA + BC, SOA, SIA, and those unidentified by ACSM. Only one criterion was used to determine the effectiveness of the retrieval: D g , i or σ g , i cannot fall on the boundary values of the set range; 78% of the fittings satisfy this criterion. The seasonal distributions, diurnal occurrences, and associated pollution levels for data points with retrieval failures are shown in Figure S9. Most retrieval failures occur during clean summertime periods, with another non-negligible portion occurring during autumn. Therefore, the conclusions presented in Section 3.4 may be less representative of clean conditions. The overall performance of the fittings under different pollution levels is shown in Figure 1. The retrieved D g , x peaks near 600 nm, which is consistent with the ACSM having a sampling efficiency substantially below 100% for diameters with a vacuum aerodynamic diameter near 1 μm due to the non-ideal cutoff of the impactor [55]. The probability distribution of the relative difference between observed V t o t , P M 1 and fitted V t o t , P M 1 is also shown in Figure S10, with the average of 3.6 ± 3.2%.
Although the newly developed volume-fitting technique likely provides valuable insights into the size distribution characteristics of SOA and SIA, the fitted parameters for a specific PVSD at any single time point may not be unique. Consequently, this method is not designed to exactly retrieve instantaneous POA, SOA, and SIA volume size distributions. Instead, it is better suited for statistically analyzing these characteristics over extended observation periods. As demonstrated by the repeated synthetic tests (Figures S11 and S12), while results for individual cases may vary slightly across runs, the overarching statistical trends remain consistent and do not alter the main conclusions.

2.6. Aerosol Hygroscopicity Retrieval from Light Scattering Enhancement Factor Measurements

The hygroscopicity parameter κ f ( R H ) was derived from humidified scattering measurements, as described in Kuang, et al. [56] and Qiao, et al. [39]. The simultaneous measurements of aerosol light scattering under dry-state and near-ambient RH conditions provide online measurements of the aerosol light scattering enhancement factor at 525 nm, which is defined as f ( R H w ) = σ s p ( R H w ,   525 ) σ s p ( R H 0 ,   525 ) ; σ s p represents the aerosol scattering coefficient, and R H 0 / R H w correspond to the RH in the dry and wet nephelometers placed almost in ambient air. Note that R H w would differ with the RH of the ambient air ( R H a i r ) due to temperature changes, for example, the heat-associated light source of the nephelometer shelf, as detailed by Qiao, et al. [39]. Results of Qiao, et al. [39] demonstrate that more than 85% of data points exhibit ∆RH = R H a i r R H w values ranging from −6% to 6%, with ∆RH exhibiting distinct diurnal variations and R H w even slightly higher than R H a i r during the daytime. Overall, R H w varied coherently but deviates slightly with R H a i r . In addition, the potential influences of tubing inconsistencies among nephelometers and corresponding corrections were also introduced in Qiao, et al. [39]. A method was proposed by Kuang, et al. [56] to derive the aerosol hygroscopicity parameter from online measurements of aerosol light scattering enhancement associated with aerosol hygroscopic growth and wavelength dependence of aerosol scattering. Therefore, online derivation of bulk aerosol hygroscopicity parameter κ f ( R H ) that could be approximately understood as the average of aerosol populations with scattering of each aerosol particle as the weighting function could be achieved through measurements of the outdoor nephelometer system as detailed in Qiao, et al. [39].

3. Results

3.1. Role of Aerosol Size Dominates over Refractive Index in Driving Dry-State Scattering Efficiency Variations

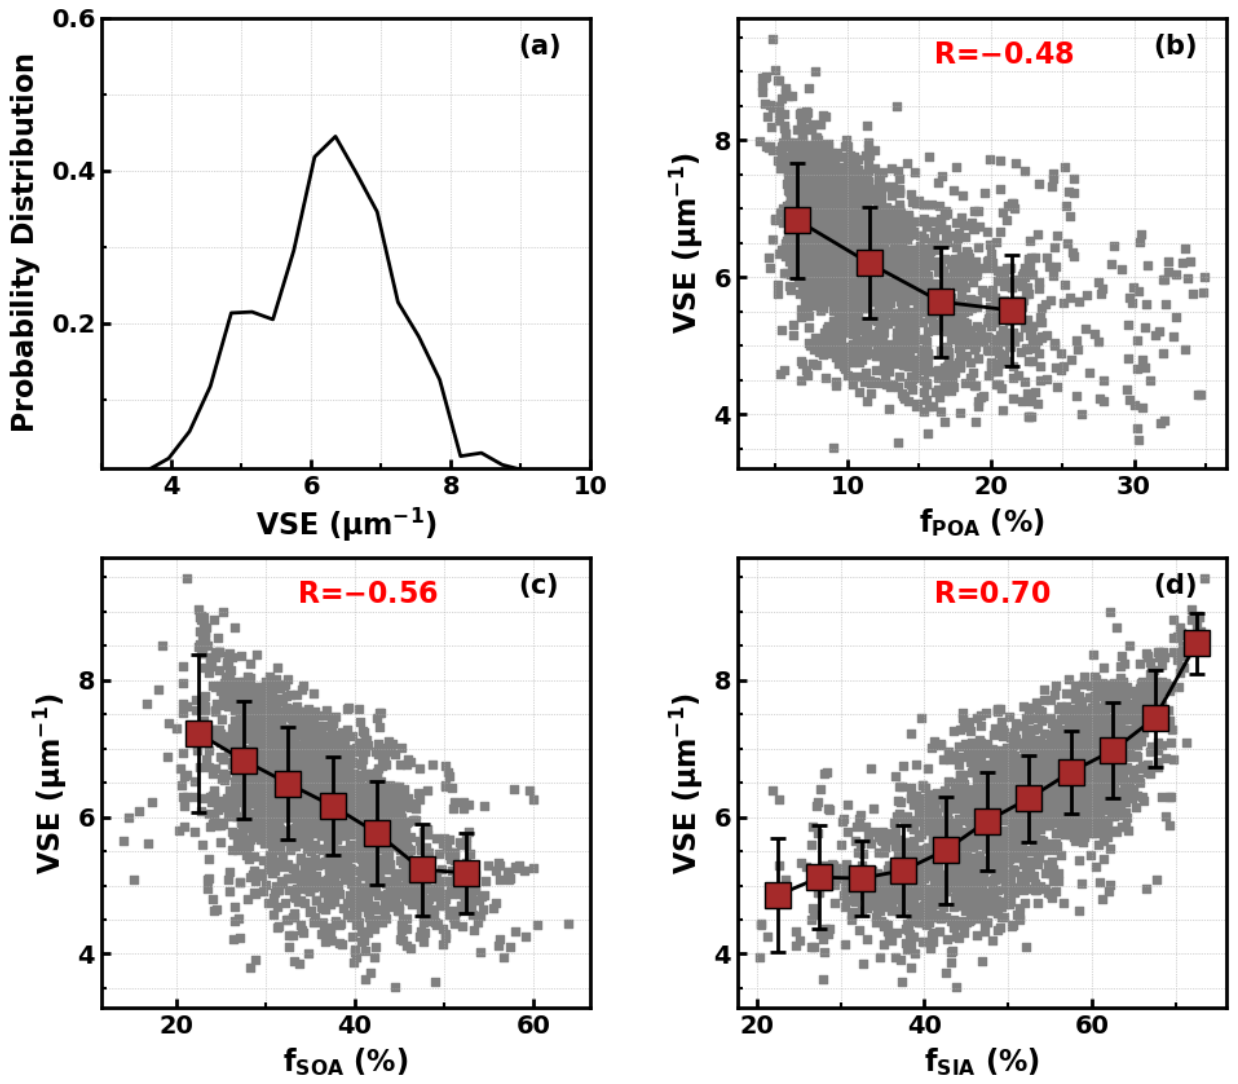
As shown in Figure 2a, the derived VSE ranges from 4 to 9 μm−1, with an average of 6.25 ± 0.96 μm−1, indicating substantial variability. This range is generally consistent with values reported by Xu, et al. [6], who conducted measurements at a background site in PRD during autumn 2019. Liu, et al. [8] reported lower PM1 MSEs for POA and LOOA, both below 4 m2/g. In contrast, AS, AN, and MOOA exhibited higher MSEs. Given that VSE can be calculated from MSE using VSE = MSE × ρ (where ρ is aerosol density), the corresponding VSE values from Liu, et al. [8] suggest that POA and LOOA exhibit VSEs near or below 4 μm−1, whereas AN and MOOA approach ~9 μm−1. These findings imply that the lower end of the VSE range observed in this study may be influenced by POA and LOOA, while the upper end may be attributed to AN and MOOA. However, the results of Liu, et al. [8] were based on a single-month campaign in urban Guangzhou and did not include simultaneous measurements of aerosol size and refractive index, limiting the ability to fully resolve the factors controlling MSE variability. Notably, while LOOA and MOOA showed contrasting effects on MSE, the overall impacts of SOA formation on aerosol scattering efficiency in this region remain elusive. Figure 2b–d shows the correlations between VSE and the mass fractions of POA (fPOA), SOA (fSOA), and SIA (fSIA) in NR-PM1. VSE is negatively correlated with POA (R = −0.48) and positively correlated with SIA, indicating that POA emissions reduce aerosol scattering efficiency while SIA formation enhances it. Interestingly, VSE also decreases with increasing SOA mass fraction, suggesting that SOA formation generally tends to lower aerosol scattering efficiency.
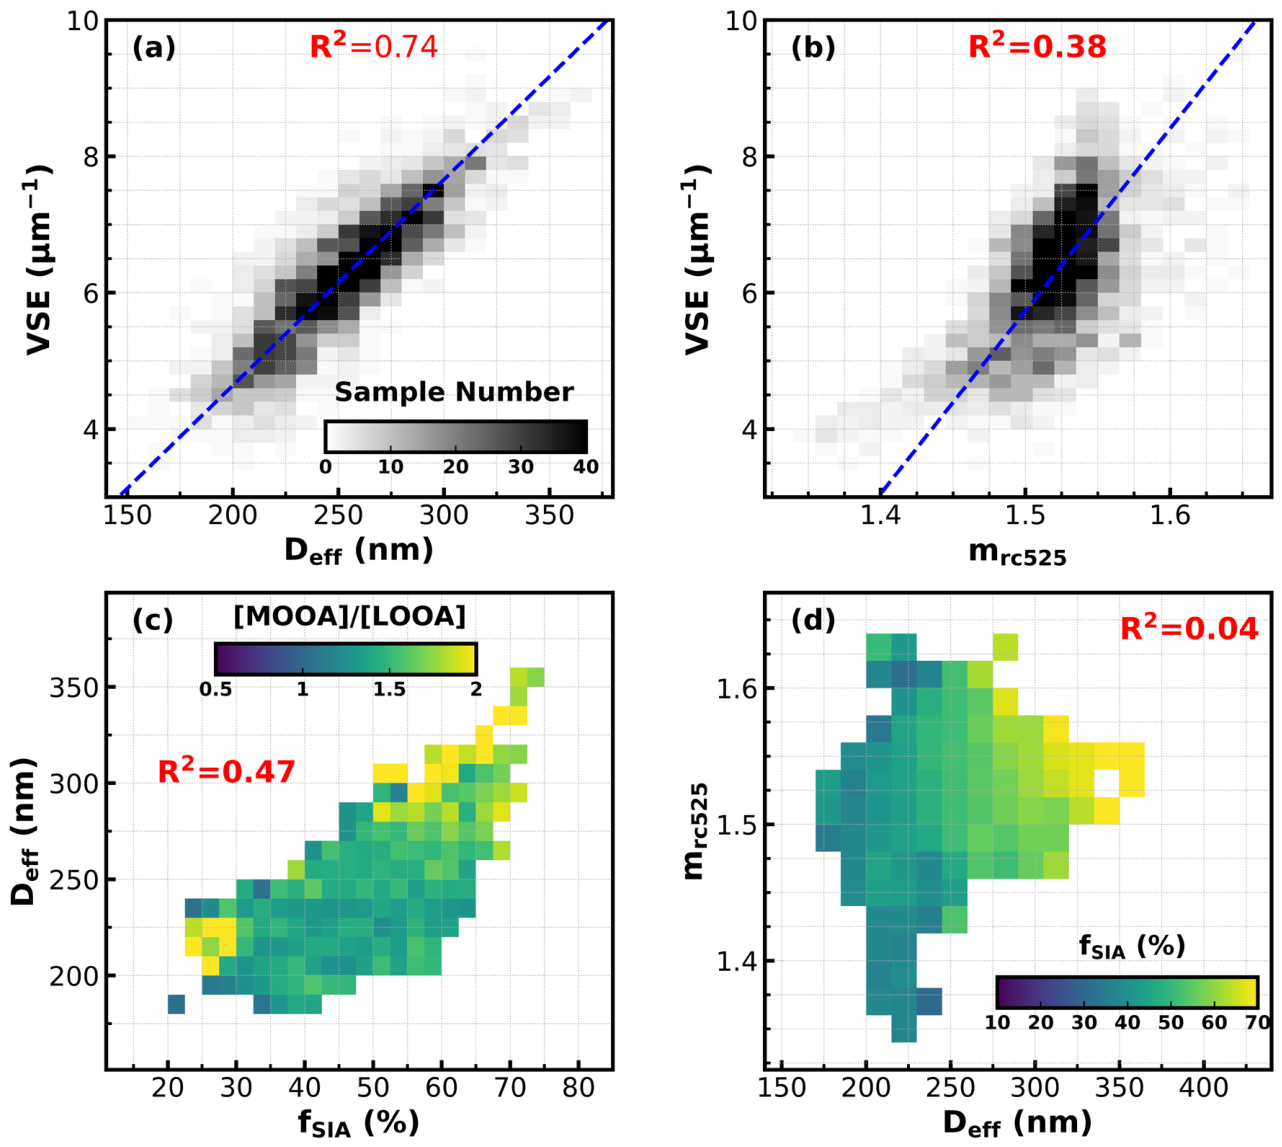
As mentioned in the introduction, primary emissions and secondary aerosol formation influence VSE by modifying aerosol size and refractive index. The effective diameter Deff, representing overall aerosol size, ranges from 175 to 350 nm, with an average of 254 ± 32 nm. The retrieved real part of the scattering refractive index at 525 nm (mrc525) generally varies between 1.4 and 1.6, with an average of 1.52 ± 0.04. These findings indicate considerable variability in both aerosol size and refractive index, contributing to the observed spread in VSE. The relationships between VSE, Deff, and mrc525 are shown in Figure 3a,b. VSE exhibits an almost linear increase with Deff, with a coefficient of determination (R2) of 0.74. In contrast, most mrc525 values lie between 1.48 and 1.55, and the R2 between VSE and mrc525 is only 0.38—substantially lower than that for Deff. These results suggest that although substantial variations in refractive index do affect VSE, aerosol size is the dominant factor controlling VSE variability. Correlation analyses between Deff and the mass fractions of aerosol components indicate that increases in Deff are primarily associated with SIA formation, with an R2 of 0.47 between Deff and fSIA (Figure 3c). In contrast, Deff is negatively correlated with fSOA (R = −0.47) and fPOA (R = −0.46). These trends help explain the overall enhancement of VSE by SIA and the reductions in VSE associated with mass-fraction increases in SOA and POA, as shown in Figure 2.
However, Liu, et al. [8] reported that the VSE of MOOA is even higher than that of SIA. This finding is supported by the results of Shen, et al. [37], which showed that the mr of MOOA is substantially higher than that of SIA (more than 1.6 versus ~1.53). To further investigate the role of MOOA in modulating VSE, the covariation between Deff and mrc525 is examined, as shown in Figure 3d. The results show a very weak positive correlation (R2 = 0.04), indicating that aerosol size and refractive index vary largely independently. Interestingly, as fSIA exceeds 50%, the mrc525 values converge toward, but remain slightly higher than the typical mr of SIA (~1.53). The ratio of MOOA to LOOA mass concentrations under different SIA conditions is also shown in Figure 3c. When SIA dominates, the [MOOA]/[LOOA] ratio generally exceeds 1.5, suggesting that it is MOOA that enhances the overall mrc525 beyond ~1.53. According to the quantitative analysis conducted by Shen, et al. [37], the mr of SIA is higher than that of POA and LOOA, but lower than that of MOOA. Therefore, when POA or LOOA dominates, both the aerosol mr and size are generally lower than those under SIA-dominant conditions. However, POA or LOOA dominance conditions are very scarce, as demonstrated by Zhai, et al. [41], whereas most conditions are dominated by SIA and SOA, composed of more MOOA than LOOA, possibly explaining the weak positive correlation observed between Deff and mrc525. Moreover, Figure 3c shows that at fixed SIA mass fractions, an increase in [MOOA]/[LOOA] is associated with higher Deff, suggesting that MOOA tends to reside in larger particle sizes compared to LOOA. Although SIA mass concentrations are positively correlated with SOA (R = 0.66; Figure S6a), fSIA and fSOA are negatively correlated (R = −0.68; Figure S6b). If the increase ratio is fixed, then the mass fractions would likely remain. This apparent contradiction likely arises because, at high SIA mass loadings, the absolute increase in SIA mass outpaces that of SOA, whereas at lower SIA concentrations, SOA may increase more rapidly, as shown in Figure S6a. Additionally, Figure S6d shows that high MOOA fractions typically occur when the SOA mass fraction is low, implying that as the SOA mass fraction increases, both the SIA and MOOA fractions tend to decrease. Therefore, the observed negative correlation between VSE and SOA mass fraction is not inconsistent with previous findings that MOOA exhibits strong scattering efficiency. Rather, it reflects the shift in aerosol composition and size distribution associated with changes in SOA abundance.

3.2. Source Apportionment of Aerosol Volume Size Distributions and Case Analyses Suggest Distinct Size Ranges Associated with Primary Emissions and Secondary Aerosol Formation

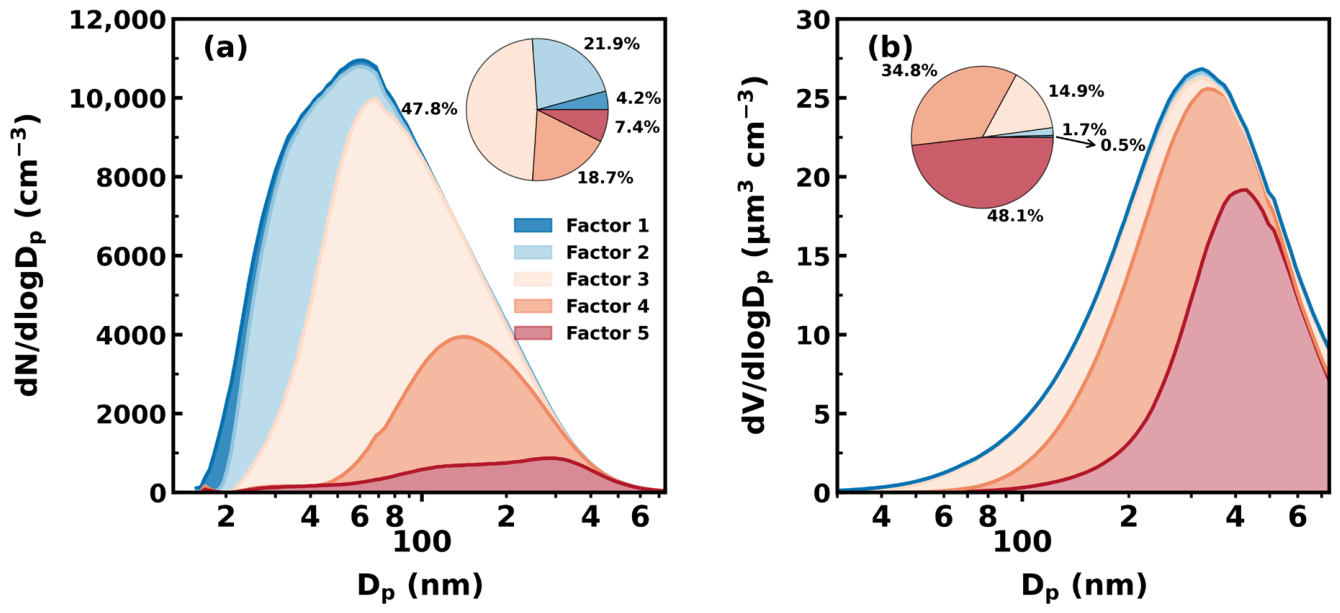
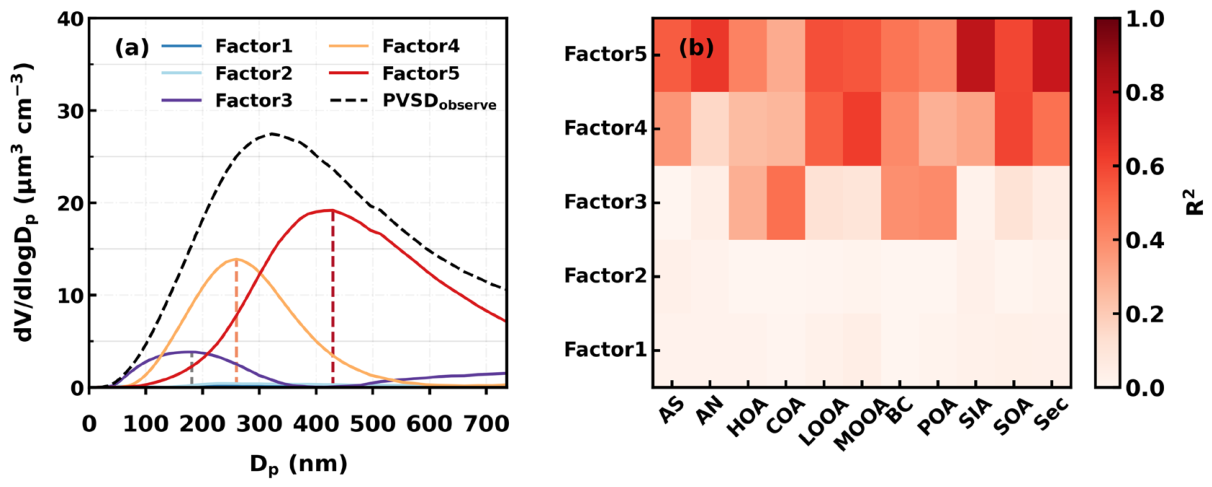
The PVSD factor analysis was used to isolate the size distribution associated with primary emissions, SOA, and SIA. Five factors were identified, with Factors 4 and 5 dominated by secondary aerosols. As described in Section 2.3, source apportionment was applied to the observed PVSD over a full year (1 March 2022 to 28 February 2023) to better distinguish the roles of primary emissions and secondary formation in shaping aerosol size characteristics. The average PVSDs of the five resolved factors are shown in Figure 4a, and peak diameter as well as volume contribution of each factor are also summarized in Table S1. Within the Deff range of 175 to 350 nm, Factor 3 (peak at 181 nm) and Factor 4 (peak at 260 nm) dominate the aerosol volume near 175 nm. Factor 4 is the main contributor in the 200–300 nm size range, while Factor 5 (peak at 430 nm) dominates for diameters larger than 300 nm. Together, Factors 4 and 5 account for 83% of the total aerosol volume concentration, contributing 34.8% and 48.1%, respectively (Figure 5b).
Factors 1 and 2 exhibit relatively small volume size distributions, together contributing only 2.2% to the total aerosol volume (Figure 5b). However, when converting their PVSDs to corresponding PNSDs under the assumption of external mixing, it becomes evident that their PNSDs are dominated by particles peaking at approximately 20.2 nm and 32.2 nm, despite peaks of their PVSDs occurring at larger diameters (~270 nm and ~241 nm, respectively). The diurnal variation in the number concentrations of Factor 2 (Figure S7) indicates pronounced temporal patterns, suggesting strong links to ultrafine particle emissions from primary sources such as cooking; however, the influence of new particle formation could not be excluded, consistent with findings by Cai, et al. [57]. As such, while Factors 1 and 2 have non-negligible and even notable impacts on aerosol number concentrations (Figure 5a), their contribution to scattering is negligible due to their limited volume and small size.
The PVSD of Factor 3 primarily spans 40 to 300 nm, with an additional minor mode appearing beyond 400 nm (Figure 4a). Factor 3 shows stronger correlations with primary species, HOA (R2 = 0.29), COA (R2 = 0.48), and BC (R2 = 0.38), than with secondary species (Figure 4b, 0.11 for SOA and 0.01 for SIA). Its diurnal variation shows a pronounced peak during nighttime, coinciding with the accumulation of POA (Figure S4), indicating that Factor 3 is predominantly associated with primary aerosol emissions. Shen, et al. [37] previously applied PMF analysis to observed PNSDs during a two-month winter campaign at the same site and found that the PVSD of POA was primarily distributed at 100–300 nm. The average ratio between the total volume of Factor 3 and that of POA is 0.88, indicating that Factor 3 alone cannot fully explain the observed POA volume, suggesting that a portion of POA mass also resides within the size range represented by Factors 4 and 5. Factor 3 shows the largest contribution to total number concentrations (47.8%), despite contributing only 14.9% to the total volume (Figure 5). This finding is consistent with previous studies, which show that traffic-emitted particles typically peak in number at diameters between 60 and 80 nm [58,59], while cooking emissions in China tend to produce particles in the 30–100 nm range at typical cooking temperatures [60,61].
Factors 4 and 5 are primarily associated with secondary aerosol formation and regional secondary sources [62]. The combined volume of these two factors exhibits a strong correlation with secondary components volume (SIA + SOA), with the R2 being as high as 0.85. Factor 4 shows the strongest correlation with SOA (R2 = 0.6), particularly with MOOA (R2 = 0.62) (Figure 4b), indicating a dominant contribution from SOA. The average ratio between the total volume of Factor 4 and that of SOA is 1.22, suggesting that Factor 4 is largely associated with SOA; however, it may also include POA contributions, considering both the volume ratio of Factor 3 and POA below 1 and the relatively larger POA size range reported by Shen, et al. [37]. Factor 5 exhibits the highest correlation with SIA (R2 = 0.79) while also showing a notable correlation with SOA (R2 = 0.59) (Figure 4b). The average ratio between the total volume of Factor 5 and that of SIA is 1.45, supporting its primary association with SIA. However, contributions from other components, such as MOOA, are also likely, particularly since MOOA can increase aerosol size at a fixed SIA mass fraction, as discussed in Section 3.1, especially considering that aqueous SIA formation is usually associated with aqueous SOA formation, which produces highly oxygenated organic aerosol [41,63].
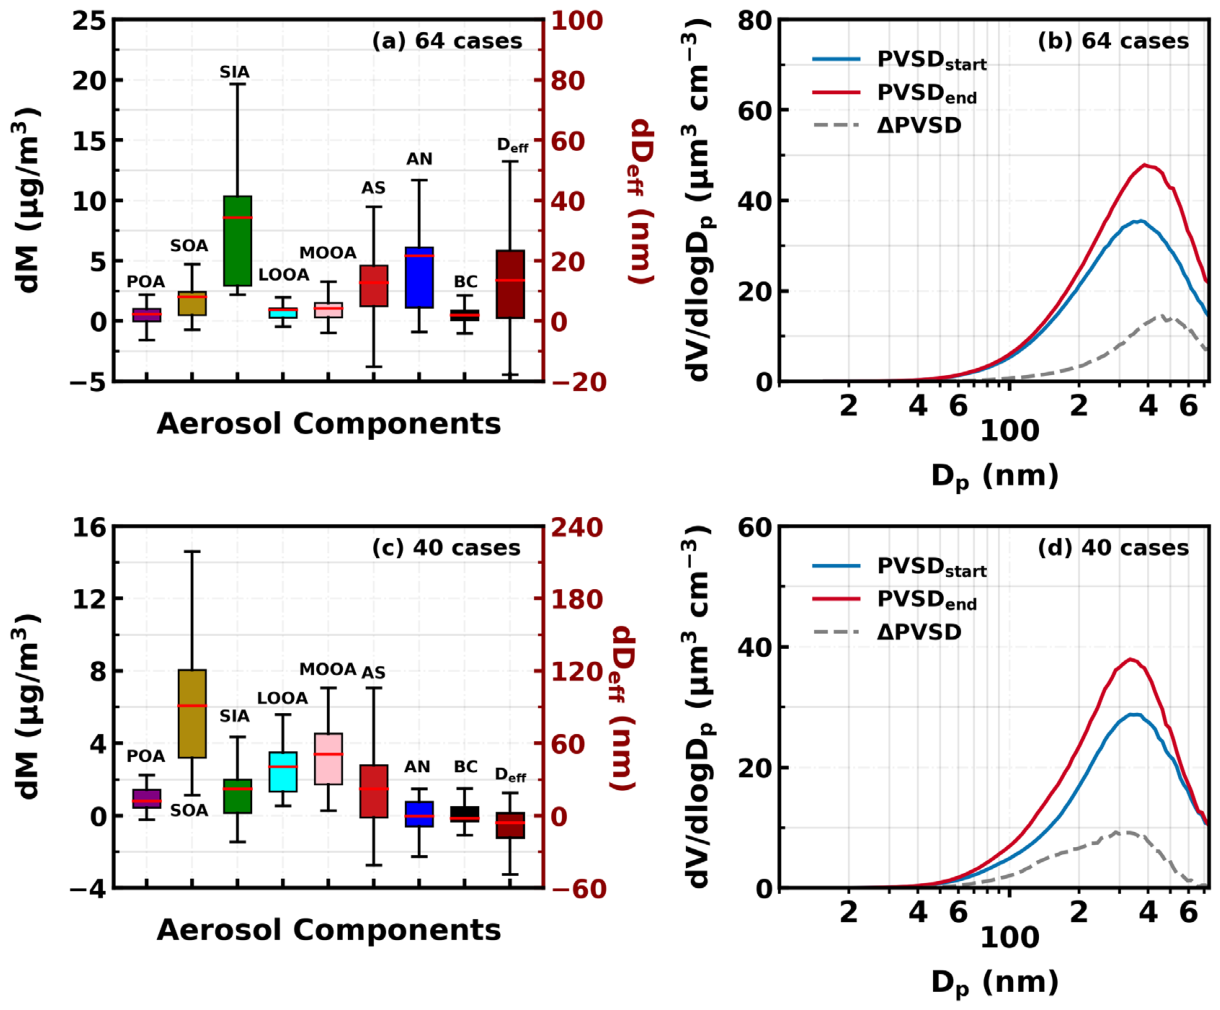
To better understand the distinct impacts of SOA and SIA formation on aerosol size, specific SOA and SIA increase events were identified for further analysis. This approach focuses on the responses of Deff and PVSD to rapid increases in the mass concentrations of SIA or SOA. A total of 64 SIA-dominated events (∆SIA/∆Others ≥ 1.5) and 40 SOA-dominated events (∆SOA/∆Others ≥ 1.5) were identified, where ∆Others represents the change in total mass concentration excluding SIA or SOA. For the SIA increase cases, AN is the primary contributor to the mass increase and, on average, leads to a Deff increase of 14 nm (Figure 6a, 79% of identified cases corresponding to Deff increase). This is accompanied by a shift in the volume-mode diameter from 371.8 to 385.4 nm, further supporting the finding that SIA formation substantially enhances aerosol size. The peak diameter of the increased aerosol volume distribution is 461.4 nm (Figure 6b), closely matching the peak diameter of Factor 5 (430 nm), indicating that Factor 5 is predominantly associated with SIA. In contrast, for the SOA increase cases, LOOA contributes slightly less than MOOA to the mass increase and, on average, leads to a Deff decrease of 5 ± 21 nm (Figure 6c, 66% of identified cases corresponding to Deff decrease), with no shift in the volume mode diameter. The peak diameter of the average increased aerosol volume distribution is 289 nm (Figure 6d), which is close to but noticeably larger than the peak diameter of Factor 4 (260 nm), suggesting that while Factor 4 is mainly associated with SOA, it may also include contributions from POA. These results further suggest the overall contrasting impacts of SIA and SOA formation on aerosol size. In addition, the combined results of source apportionment and case analysis demonstrate that PVSDs of SOA and SIA could be generally represented by lognormal functions, which allow for retrievals of SOA and SIA size on the basis of aerosol chemical composition and size measurements as introduced in Section 3.3.

3.3. Seasonal Variations in Aerosol Size and Their Links to SOA and SIA

As indicated in Section 3.1, aerosol scattering efficiency is primarily governed by size rather than refractive index. However, in modeling aerosol radiative properties, the mass size distributions of SOA and SIA—highly dependent on chemical processes—are often assumed to be fixed. Moreover, the formation of SOA and SIA is generally not independent, as the two are partially entangled. Therefore, examining seasonal variations in the key parameters of SOA and SIA mass size distributions is essential for improving regional simulations of aerosol optical properties and radiative effects in atmospheric models [4], and for providing new insights into aerosol radiative effects simulations.
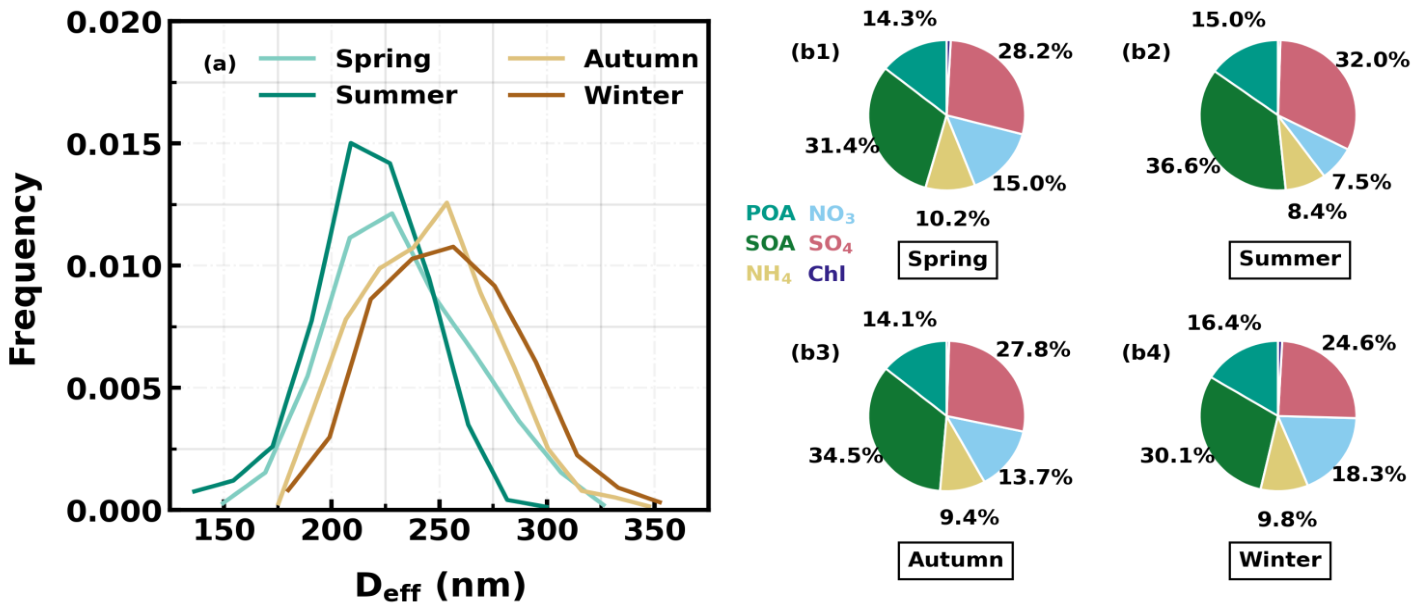
The seasonal probability distributions of Deff are shown in Figure 7a. The average Deff values from spring to winter are 232 ± 33 nm, 218 ± 26 nm, 245 ± 31 nm, and 254 ± 33 nm, respectively, indicating substantial intra-seasonal and seasonal variability driven by changes in emissions and secondary aerosol formation, as discussed in Section 3.1. Interestingly, the seasonal variation in average Deff does not correspond with changes in the fraction of SIA in NR-PM1. Although spring exhibits the highest SIA fraction (~53.4%), it is associated with the obviously lower Deff than winter and autumn, suggesting that overall mass fractions of aerosol components are insufficient to explain variations in aerosol size distributions. As shown in the average PNSDs in Figure S8, ultrafine particle concentrations are substantially higher in spring (by more than 70%) than in autumn and winter, even though POA concentrations are lower in spring (2.7 μg/m3) compared to autumn (3.2 μg/m3) and winter (3.1 μg/m3). One possible reason is that new particle formation (likely favored by less precipitation compared to summer) and subsequent growth via secondary aerosol formation might be more prevalent in spring, as indicated by the average PNSD in spring, likely contributing to the observed reduction in Deff. The lowest Deff in summer might be associated with the higher rainfall in summer than in spring during this year (Figure S13a), which could scavenge larger aerosol particles through cloud formation and precipitation processes in this region. The higher temperature in summer (Figure S13b) that favors more volatile organic compounds partitioning into the gas phase could also reduce aerosol size. In combination with back-trajectory analysis in different seasons (Figure S14), air masses arriving at the Guangzhou urban area in summer mainly come from clean, over-ocean regions. Therefore, clean air masses, together with precipitation processes, are likely the main reasons for the smaller aerosol size in summer. These results also suggest that, although SIA generally occupies larger sizes than SOA, the mass size distributions of SOA and SIA can vary substantially among seasons depending on formation conditions and mechanisms. As a result, the dry-state VSE is smallest in summer and highest in winter, as shown in Figure S15a.
Using the method described in Section 2.5, key parameters associated with PVSDs of primary aerosols, SOA, and SIA, namely the geometric mean diameter D g and geometric standard deviation σ g of POA + BC, SIA, and SOA, were retrieved from PVSD measurements and constrained with chemical composition measurements. The general probability distributions of D g associated with POA + BC, SOA, and SIA are presented in Figure 8a. These retrievals are consistent with, and provide quantitative support for the findings in Section 3.1 and Section 3.2, showing that SIA generally occupies the largest size range, followed by SOA and then POA. The average values of D g , S I A , D g , S O A , and D g , P O A + B C are 382 ± 68 nm, 246 ± 44 nm, and 174 ± 38 nm, respectively, consistent with the factor analysis results. In addition, the average σ g values associated with SIA, SOA, and POA + BC are 1.31 ± 0.08, 1.36 ± 0.12, and 1.53 ± 0.18, suggesting wide variations in PVSD shape of primary aerosols, which depend highly on emission conditions [49]. The seasonal probability distributions of D g , S O A and D g , S I A are presented in Figure S16. The average D g , S O A from spring to winter are 258 ± 43 nm, 231 ± 43 nm, 238 ± 46 nm, and 257 ± 38 nm, respectively (Figure S16a). The average D g , S I A from spring to winter are 396 ± 59 nm, 361 ± 77 nm, 373 ± 75 nm, and 399 ± 51 nm (Figure S16b), respectively. Both D g , S O A and D g , S I A are smallest in summer, and they are much larger in spring and winter. Since SOA and SIA are generally secondarily formed in the atmosphere, mass size distributions of secondarily formed aerosols depend on the size distributions of preexisting particles. In summer, as shown in Figure 7, preexisting aerosols are smaller than in winter, leading to newly formed SIA and SOA residing in smaller particles. These results imply that D g , S I A and D g , S O A are intrinsically interdependent because both SOA and SIA formation modify the mass size distributions of existing aerosols. This inference is supported in Figure 8b, which shows a clearly positive correlation (R2 = 0.43) between retrieved D g , S I A and D g , S O A for most points beyond the 1:1 line. Note that conditions corresponding to D g , S I A / D g , S O A lower than one were also retrieved but are not accounted in the correlation analysis due to the small portion (~15%). Overall, the retrieved results indicate that mass size distributions of SOA and SIA are likely inherently entangled. For points above the 1:1 line in Figure 8b, their relationship can be expressed as D g , S I A = 1.02 ×   D g , S O A + 130.48.
It is well known that as pollution evolves, aerosols accumulate and their sizes generally increase. The variations in D g , S I A and D g , S O A under different NR-PM1 mass concentrations are shown in Figure S17. As NR-PM1 concentrations increase from less than 10 μg/m3 to above 30 μg/m3, the average diameters of SOA and SIA shift to larger sizes, with D g , S O A increasing from 229 nm to 271 nm and D g , S I A increasing from 362 nm to 413 nm. In addition, σ g , S O A increases from 1.26 to 1.35, while σ g , S I A decreases from 1.36 to 1.31. These results indicate substantial variations in the PVSDs of SOA and SIA, reflecting the complex interactions between their formation processes. The increase in σ g , S O A is likely associated with the diverse formation pathways of SOA, which include condensation of low-volatility organic vapors and aqueous-phase reactions of dissolved organic molecules; both pathways may coexist under polluted conditions and enhance SOA mass, as demonstrated by Zhai, et al. [41]. While SIA formation is also complex, its final formation step generally occurs via dissolution in aerosol water for both nitrate and sulfate. Consequently, SIA formation is likely selectively favored in aerosols with abundant water, and is partially supported by results shown in Figure 6b, which shows that the peak diameter of SIA increase occurs at diameters likely containing most abundant water. This selectivity may reduce σ g , S I A . The diurnal variations of   D g , S I A and D g , S O A in different seasons are shown in Figure S18. Notably, D g , S I A and D g , S O A exhibit distinct diurnal increases during spring and summer, rising from morning to afternoon, indicating that active photochemistry in these seasons substantially enhances the average size of SOA.
The observed substantial variations in the PVSDs of SOA and SIA, as well as their likely interdependence, have important implications for simulating aerosol direct radiative effects: (1) simulating aerosol radiative effects using fixed volume size distributions inevitably introduces large uncertainties, and these biases may vary considerably across regions, seasons, and pollution levels; and, more importantly (2), the sizes of SOA and SIA are not independent but closely linked. Neglecting the covariations in SOA and SIA sizes might lead to significant errors in estimating aerosol radiative effects.

3.4. Pronounced Joint Increase in Dry-State Aerosol Scattering Efficiency and Aerosol Hygroscopicity

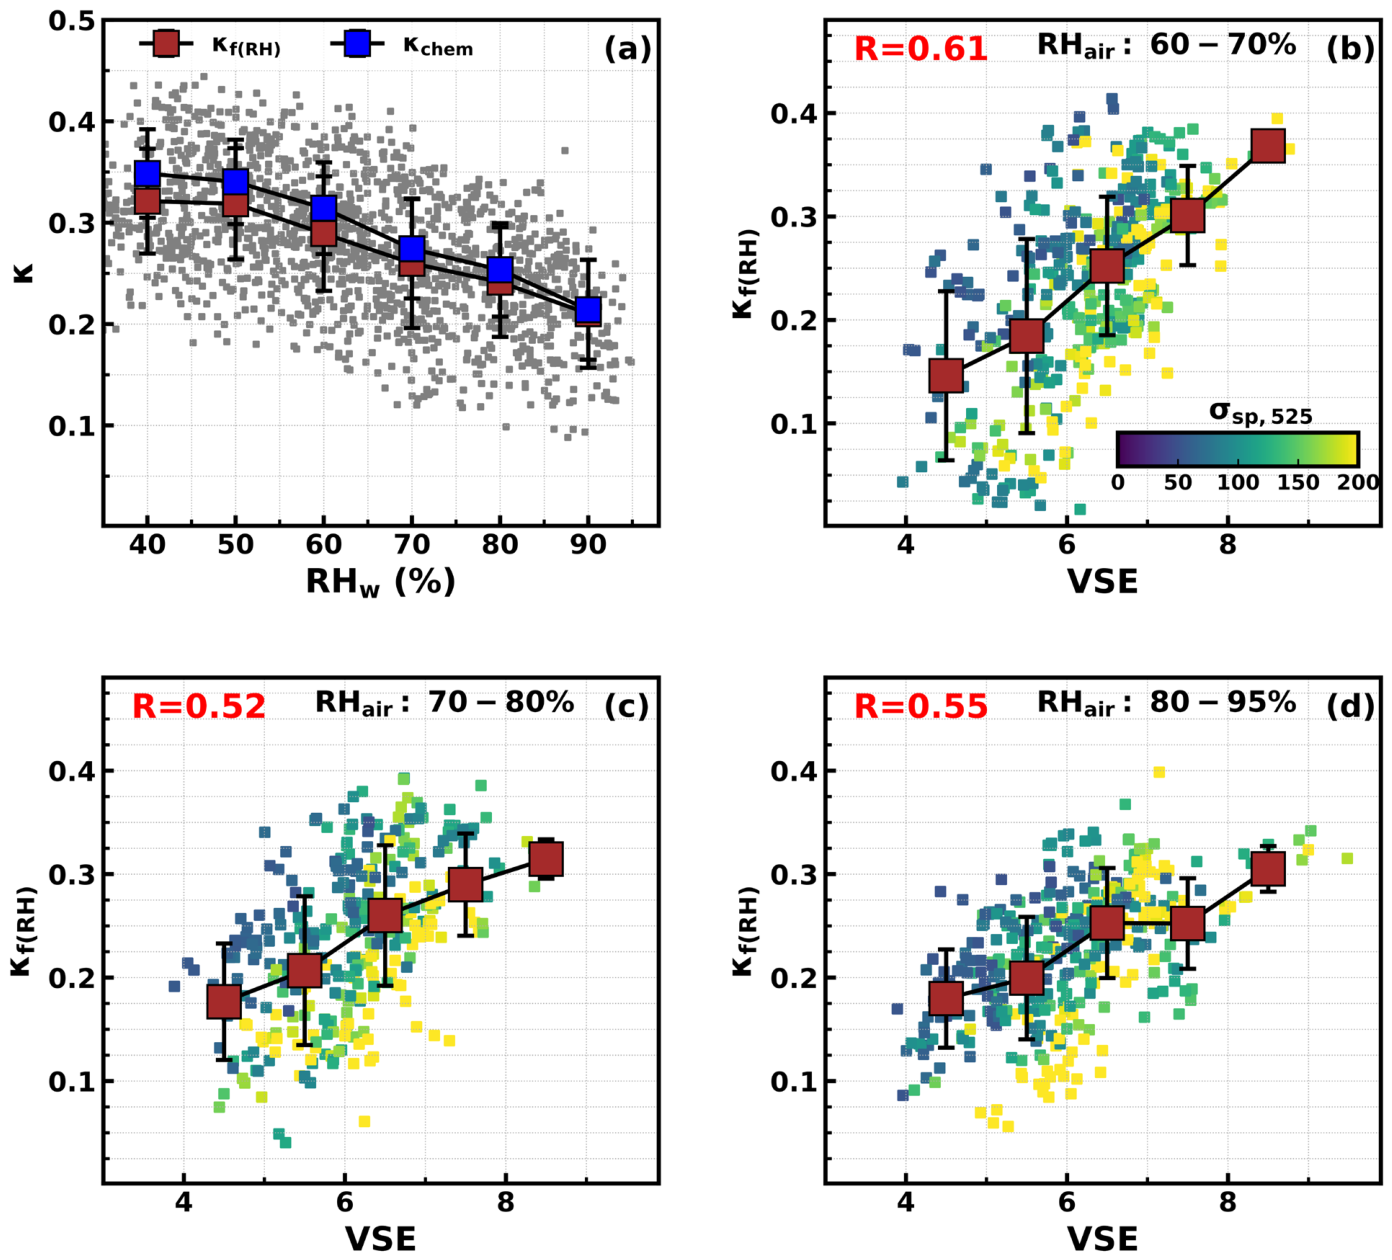
Aerosol hygroscopicity is a key factor that determines the interactions between aerosols and surrounding water vapor in ambient air, and therefore plays a significant role in aerosol scattering; however, its measurements were usually conducted at controlled and fixed RH conditions [64,65]. In this study, the newly developed outdoor nephelometer system enabled aerosol hygroscopicity measurements under near-ambient RH conditions, providing direct observations under different RH conditions. Note that the aerosol hygroscopicity in ambient air would not only be affected by aerosol chemical compositions and RH, but also by the RH history it has experienced and corresponding crystallization/deliquescence behavior, as illustrated by Martin, et al. [66] and confirmed by Qiao, et al. [39]. Based on the results of Qiao, et al. [39], κ f ( R H ) results during days with minimum R H a i r below 35% were excluded due to potential impacts of crystallization and gradual deliquescence on aerosol hygroscopicity (~20% of observations), allowing us to explore κ f ( R H ) variations under deliquesced conditions. Scatter plots (hourly averaged) of derived κ f ( R H ) versus R H w (at which aerosol hygroscopicity was measured) is shown in Figure 9a. The results show that aerosol hygroscopicity generally decreases as RH increases. From the thermodynamic perspective, it is well known that the κ would differ much under different RH conditions for inorganic aerosol components [67]. For example, the κ of metastable ammonium sulfate at RH of 70% and 80% (>200 nm, while the Kelvin effect could be neglected) are 0.66 and 0.57, which could be predicted using the Extended Aerosol Inorganic Model (E-AIM [68]). Results of previous studies also demonstrated potentially non-negligible RH dependence of OA hygroscopicity, albeit with complex dependence characteristics [36,69]. However, the RH dependence characteristics of aerosol hygroscopicity for ambient aerosols, which represent a complex mixture of organic and inorganic components, remain scarce [70].
Moreover, the aerosol hygroscopicity under corresponding R H w conditions could also be calculated using measurements of submicron aerosol chemical compositions and is denoted as κ c h e m . In brief, κ c h e m is calculated based on the volume mixing rule, which includes influences of inorganics and different OA factors. The κ values of POA and BC are set to 0, and those of LOOA and MOOA are set to 0.16 and 0.36, which are predicted using an empirical relationship between κ O A and O/C under subsaturated conditions ratio reported by Kuang, et al. [71]. The κ values of inorganic salt group ( κ i n o r g ) under corresponding R H w conditions are predicted using Model-III of E-AIM under metastable state with mole concentrations of ammonium, sulfate, nitrate, and chloride, as well as R H w as inputs. The results of κ c h e m are also shown in Figure 9a. This suggests that considering only RH-dependent hygroscopicity of inorganic species using E-AIM could generally capture the observed RH dependence of κ f ( R H ) . The complex RH dependence of κ of inorganic aerosol components needs to be addressed in scattering calculations in radiative effect simulations; however, constant κ values for AS and AN were generally applied for this purpose [4].
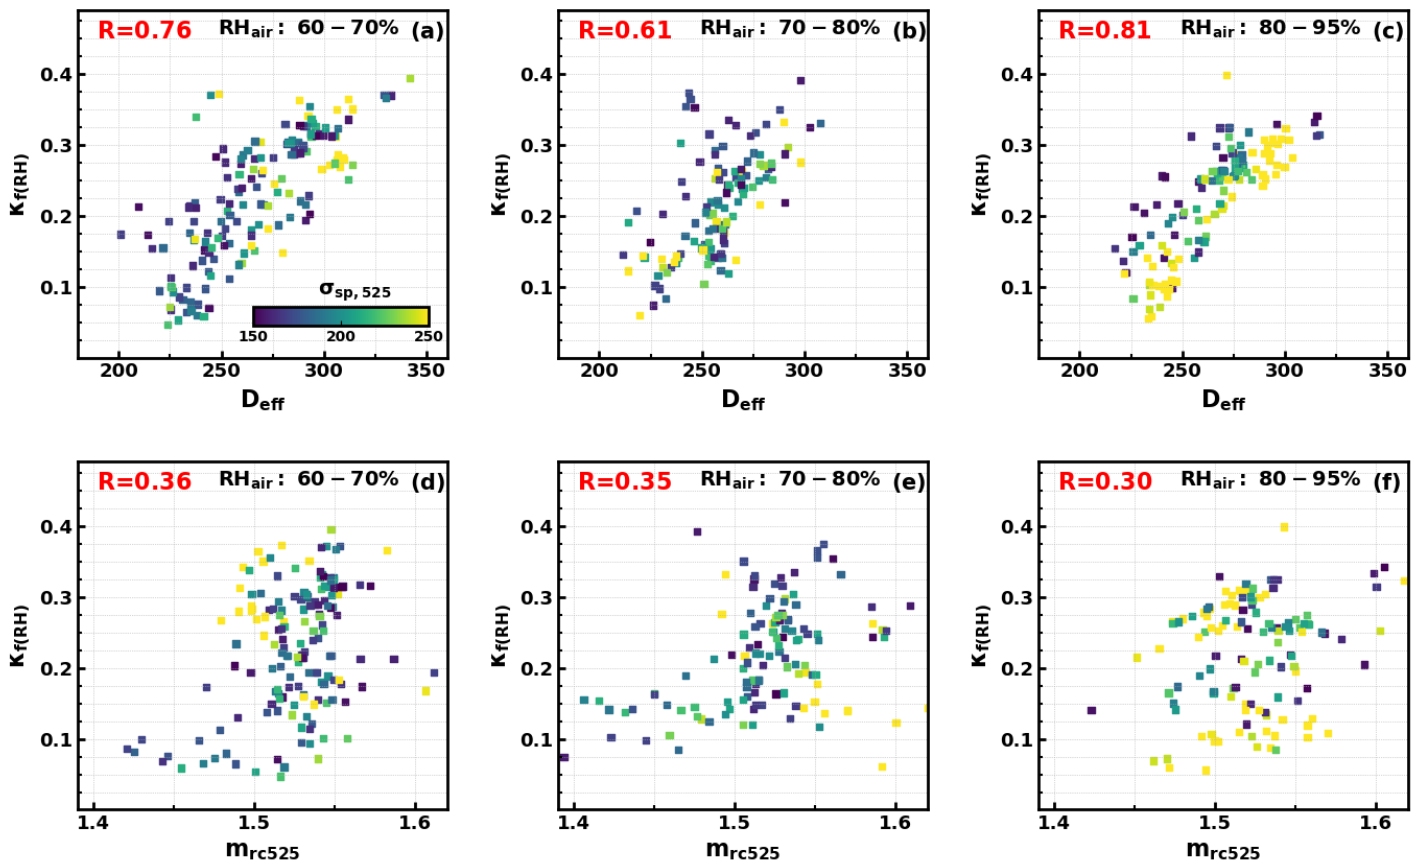
Therefore, the relationships between VSE and κ f ( R H ) were further explored under three R H a i r ranges (60–70%, 70–80%, and 80–95%). This approach minimizes the influence of RH and investigates potential covariations between VSE and κ f ( R H ) under RH ranges where aerosol–water interactions play significant roles in aerosol scattering. The results are shown in Figure 9b–d. Under three different RH ranges, VSE increased jointly with κ f ( R H ) . Xue, et al. [72] also reported the joint increase phenomenon of VSE and aerosol hygroscopicity; however, their results showed that VSE and aerosol hygroscopicity both increased from clean to polluted conditions. In contrast, the results presented in Figure 9b–d show that under both relatively clean or polluted conditions, VSE and κ f ( R H ) varied widely, yet still exhibited remarkable joint increase characteristics. Specifically, for conditions of σ s p ,   525 higher than 200 Mm−1, the correlations between VSE and κ f ( R H ) for RH ranges of 60–70%, 70–80%, and 80–90% increased from 0.61, 0.52, and 0.55 to 0.76, 0.65, and 0.72. These results indicate that variations in VSE and κ f ( R H ) are inherently and tightly linked, especially under relatively polluted conditions in the PRD region.
Given the observed co-enhancement characteristics of VSE and κ f ( R H ) , the variation characteristics between aerosol size, refractive index represented by Deff, m r c 525 , and κ f ( R H ) are further explored and shown in Figure 10. The results show that under different RH ranges, κ f ( R H ) shows a joint increase with Deff, with the correlation coefficient between them reaching beyond 0.8. For comparison, mrc525 shows much weaker correlations (around 0.3) with κ f ( R H ) , with mrc525 mostly lying in the range of 1.5–1.55.
Compared with size, aerosol hygroscopicity is known to be strongly affected by chemical processes. The results presented in Figure 9a indicate that the overall closure could be achieved by jointly considering inorganic aerosol with high hygroscopicity and organic aerosol with much lower hygroscopicity. In general, higher aerosol hygroscopicity corresponds to a higher fraction of inorganic aerosol components. Therefore, the revealed joint increase phenomena of Deff and κ f ( R H ) is consistent with the aforementioned finding that inorganic aerosol generally drives the increase in aerosol size, while the fraction increase in POA and SOA tends to reduce it. These results demonstrate that the joint increase in aerosol size and aerosol hygroscopicity, strongly shaped by chemical processes, plays the dominant role in determining how efficiently aerosols scatter light in ambient air.

4. Discussion

Aerosol–radiation interactions are among the most critical processes governing the Earth’s atmospheric energy balance and strongly influencing actinic flux, thereby affecting atmospheric photochemistry. Among these interactions, aerosol scattering typically dominates, yet accurately modeling aerosol scattering remains a major challenge in climate and atmospheric chemistry simulations. Accurate retrieval of dry-state aerosol scattering and aerosol size remains one of the major challenges in aerosol mass concentration and chemical composition retrieval from remote sensing techniques. Most models or remote sensing techniques focus on aerosol mass, while aerosol size, refractive index, and hygroscopicity are rarely represented at the process level, and scattering properties are often parameterized using fixed size distributions, refractive indices, and hygroscopicity. Shen, et al. [37] demonstrated that aerosol refractive indices in urban Guangzhou vary substantially (~1.4–1.6) due to differences between primary and secondary organic aerosols. Despite this variability, the present study confirms that condensation-mode aerosol size is the dominant factor controlling variations in dry-state aerosol scattering efficiency, with squared correlation coefficients of 0.74 and 0.38 for Deff and scattering refractive index mr, respectively. In addition, simultaneous measurements of aerosol light-scattering enhancement factor in nearly ambient RH conditions reveal RH dependence of aerosol hygroscopicity and clear co-enhancement characteristics of dry-state volume scattering efficiency and aerosol hygroscopicity, especially under relatively polluted and high-RH conditions, suggesting significant variations in aerosol scattering efficiency in ambient air that involve the processes of aerosol hygroscopicity. The aerosol size plays the dominant role in determining the joint increase in dry-state scattering efficiency and aerosol hygroscopicity. Although seasonal variations in VSE might be generally characterized from SMPS measurements combined with Mie theory, the nephelometer data required for the scattering and hygroscopicity analyses were only available from late July 2022 to February 2023. Consequently, observations for spring and early summer are generally lacking, meaning that the seasonal covariation characteristics of size, refractive index, and aerosol hygroscopicity during these periods warrant further exploration in future studies.
Comprehensive source apportionment and size retrieval analysis on year-long observations of submicron aerosol size distributions and chemical compositions in urban Guangzhou show that primary aerosols from traffic and cooking emissions are generally smaller than aerosols formed through secondary processes with respect to volume size distribution, consistent with previous findings. The study further reveals contrasting effects of SOA and SIA on condensation-mode particle size: SIA formation significantly increases aerosol size, whereas SOA formation tends to reduce it. By combining size distributions and chemical composition data, volume size distributions of SOA and SIA were retrieved using a newly developed volume-fitting technique. Ultimately, the volume size distribution ranking of primary aerosols < SOA < SIA is supported by three independent lines of evidence: (1) the source apportionment analysis itself; (2) specific case studies capturing isolated SIA and SOA formation events; and (3) direct quantitative retrievals using joint aerosol chemical composition and volume size distribution measurements. While each individual method carries inherent uncertainties, the convergence of all three independent approaches on the exact same physical trend strongly supports the validity of our conclusions regarding distinct volume size distributions of SOA and SIA. The SOA and SIA volume size distribution retrieval analysis also suggests substantial seasonal and pollution-level variations, with both SOA and SIA sizes likely smallest in summer and largest in winter and spring, and generally smaller under clean conditions than under polluted conditions. Crucially, SOA and SIA sizes are likely interdependent, highlighting that chemical processes affecting aerosol optical properties must be considered jointly rather than independently.
These findings have important implications for simulating aerosol direct radiative effects and possibly for aerosol remote sensing. Aerosol scattering in ambient air is largely determined by particle size, refractive index, and hygroscopicity, which are all strongly influenced by secondary aerosol formation. Ignoring the coupled effects of SOA and SIA formation might lead to systematic biases. At least three key challenges should be addressed to accurately represent aerosol chemical processes in radiative effect simulations: (1) SOA formation involves multiple sources of volatile organic compounds and complex chemical pathways, highly dependent on aerosol properties such as water content and pH, complicating accurate representation of refractive index variations. (2) Although the refractive index of inorganic aerosols is relatively well known, size is the dominant factor shaping their scattering response. Accurately modeling SIA at the size level remains challenging due to uncertainties in formation mechanisms and size-dependent formation coefficients for nitrate and sulfate, which hinder the accurate representations of SIA volume size distribution evolutions. (3) Aerosol scattering coefficients are strongly influenced by hygroscopic growth. Integrated assessments of how chemical processes influence size, refractive index, and hygroscopicity in a comprehensive way remain limited but very important for aerosol radiative effects simulations.
Despite these challenges, empirical relationships between key parameters, such as volume size distributions of secondary organic and inorganic aerosols, might improve regional simulations of aerosol radiative effects and aerosol remote sensing. These findings may also add useful insights for other urban regions with similar pollution characteristics. The methods developed here for analyzing scattering efficiency, size characteristics, refractive index, and hygroscopicity can be applied to other regions to derive representative aerosol parameters and establish relationships for linking aerosol scattering to aerosol chemistry in aerosol remote sensing.

Supplementary Materials

The following supporting information can be downloaded at: https://www.mdpi.com/article/10.3390/rs18111713/s1. Section S1: Source apportionment analysis of organic aerosols; Section S2: Source apportionment of aerosol volume size distributions; Section S3: Mie calculations and aerosol scattering coefficient correction factor calculations [73,74]; Section S4: Other supporting information. The figures and tables in supplementary materials are listed below. Figure S1. Mass spectral profiles, diurnal cycles and correlations with external data of HOA (a–c), COA (d–f), LOOA (g–i) and MOOA (j–l) from ME2-ACSM analysis for the entire year; Figure S2. Diagnostic plots of the 5-factor solution in the unconstrained PVSD PMF. Figure S3. Results of the four-factor solution: (a) number and (b) volume size distribution of each factor resolved by PVSD PMF; (c) diurnal variations of the volume concentration for each factor; (d) squared correlation coefficients between volume concentrations of chemical components and resolved PVSD factors. Figure S4. Results of the five-factor solution: (a) number and (b) volume size distribution of each factor resolved by PVSD PMF; (c) diurnal variations of the volume concentration for each factor; (d) squared correlation coefficients between volume concentrations of chemical components and resolved PVSD factors. Figure S5. Results of the six-factor solution: (a) number and (b) volume size distribution of each factor resolved by PVSD PMF; (c) diurnal variations of the volume concentration for each factor; (d) squared correlation coefficients between volume concentrations of chemical components and resolved PVSD factors. Figure S6. (a) Relationships between SOA and SIA mass concentrations, with the red line indicating 1:1 line. (b) Relationships between fSIA and fSOA. (c) Relationships between fSIA and fPOA with colors representing the average mass ratio of POA to SOA. (d) Relationships between fSOA and VSE. Both colors in (b) and (d) represent the average mass ratio of MOOA to LOOA. Figure S7. Average diurnal variations of total aerosol number concentration calculated from PNSD converted from PVSD of resolved five factors. Figure S8. The average aerosol number size distributions of different seasons. Figure S9. (a) The number of points that fall on boundaries in the retrievals under different seasons and NR-PM1 mass concentration ranges; (b) The diurnal variations in number of points that fall on boundaries under different NR-PM1 levels. Figure S10. Probability distributions of relative difference between observed V t o t , P M 1 and fitted V t o t , P M 1 . Figure S11. Average results of observed (gray solid line) and fitted (blue dashed line) PVSD with the four-mode fitting method under four different NR-PM1 levels: (a) <10 μg/m3, (b) 10–20 μg/m3, (c) 20–30 μg/m3, (d) >30 μg/m3. Colored dashed lines represent fitted average PVSDs of the four modes: PVSDPOA+BC (yellow), PVSDSOA (cyan), PVSDSIA (light green), PVSDX (orange). Figure S12. (a) Annual probability distributions of retrieved D g , P O A + B C , D g , S O A and D g , S I A . (b) Relationships between D g , S O A and D g , S I A with color scales indicating sample numbers in each grid; the dashed blue line and squared correlation coefficient represent linear fit for data points above the 1:1 dashed gray line. Figure S13. (a) Monthly variations in precipitation and (b) seasonal diurnal variations in temperature during the observation period. Figure S14. The 72h back trajectories of airflow in four seasons during 2022–2023. Figure S15. Seasonal probability distributions of (a) VSE at 525 nm and (b) mrc525. Figure S16. Seasonal probability distributions of (a) retrieved D g , S O A and (b) D g , S I A . Figure S17. (a) Probability distributions of D g , S O A and (b) σ g , S O A at four different NR-PM1 levels; (c) Probability distributions of D g , S I A and (d) σ g , S I A at four different NR-PM1 levels. Figure S18. Average diurnal variations of D g , S O A and D g , S I A in four seasons. Table S1. Volume contribution and peak diameter of PNSD and PVSD for each factor from PVSD PMF analysis.

Author Contributions

L.L. and Y.K. designed the aerosol experiments. M.H. and Y.K. wrote the manuscript. F.Y. and L.L. conducted long-term Q-ACSM measurements. M.H., H.X. and M.Z. helped maintain and calibrate the Q-ACSM and SMPS. L.L. provided the meteorological datasets. G.Z. provided insights into data analysis, and all the authors contributed to revisions of this paper. All authors have read and agreed to the published version of the manuscript.

Funding

This work is supported by the National Natural Science Foundation of China (42175083, 42105092), the Guangdong Basic and Applied Basic Research Foundation (2025A1515011641), the Key Innovation Team of Guangdong Meteorological Bureau (GRMCTD202506-ZD06), and the Fundamental Research Funds for the Central Universities.

Data Availability Statement

All data presented in the figures of this manuscript are freely available at Kuang, Y. (2025) [75].

Conflicts of Interest

The authors declare no conflicts of interest.

References

  1. Charlson, R.J.; Schwartz, S.E.; Hales, J.M.; Cess, R.D.; Coakley, J.A.; Hansen, J.E.; Hofmann, D.J. Climate Forcing by Anthropogenic Aerosols. Science 1992, 255, 423–430. [Google Scholar] [CrossRef]
  2. Li, J.; Carlson, B.E.; Yung, Y.L.; Lv, D.; Hansen, J.; Penner, J.E.; Liao, H.; Ramaswamy, V.; Kahn, R.A.; Zhang, P.; et al. Scattering and absorbing aerosols in the climate system. Nat. Rev. Earth Environ. 2022, 3, 363–379. [Google Scholar] [CrossRef]
  3. Bellouin, N.; Quaas, J.; Gryspeerdt, E.; Kinne, S.; Stier, P.; Watson-Parris, D.; Boucher, O.; Carslaw, K.S.; Christensen, M.; Daniau, A.L.; et al. Bounding Global Aerosol Radiative Forcing of Climate Change. Rev. Geophys. 2020, 58, e2019RG000660. [Google Scholar] [CrossRef] [PubMed]
  4. Latimer, R.N.C.; Martin, R.V. Interpretation of measured aerosol mass scattering efficiency over North America using a chemical transport model. Atmos. Chem. Phys. 2019, 19, 2635–2653. [Google Scholar] [CrossRef]
  5. Malm, W.C.; Sisler, J.F.; Huffman, D.; Eldred, R.A.; Cahill, T.A. Spatial and seasonal trends in particle concentration and optical extinction in the United States. J. Geophys. Res. Atmos. 1994, 99, 1347–1370. [Google Scholar] [CrossRef]
  6. Xu, W.; Kuang, Y.; Bian, Y.; Liu, L.; Li, F.; Wang, Y.; Xue, B.; Luo, B.; Huang, S.; Yuan, B.; et al. Current Challenges in Visibility Improvement in Southern China. Environ. Sci. Technol. Lett. 2020, 7, 395–401. [Google Scholar] [CrossRef]
  7. Liu, J.; Ren, C.; Huang, X.; Nie, W.; Wang, J.; Sun, P.; Chi, X.; Ding, A. Increased aerosol extinction efficiency hinders visibility improvement in eastern China. Geophys. Res. Lett. 2020, 47, e2020GL090167. [Google Scholar] [CrossRef]
  8. Liu, L.; Kuang, Y.; Zhai, M.; Xue, B.; He, Y.; Tao, J.; Luo, B.; Xu, W.; Tao, J.; Yin, C.; et al. Strong light scattering of highly oxygenated organic aerosols impacts significantly on visibility degradation. Atmos. Chem. Phys. 2022, 22, 7713–7726. [Google Scholar] [CrossRef]
  9. Yao, L.; Kong, S.; Zheng, H.; Chen, N.; Zhu, B.; Xu, K.; Cao, W.; Zhang, Y.; Zheng, M.; Cheng, Y.; et al. Co-benefits of reducing PM2.5 and improving visibility by COVID-19 lockdown in Wuhan. npj Clim. Atmos. Sci. 2021, 4, 40. [Google Scholar] [CrossRef]
  10. Kinne, S.; Schulz, M.; Textor, C.; Guibert, S.; Balkanski, Y.; Bauer, S.E.; Berntsen, T.; Berglen, T.F.; Boucher, O.; Chin, M.; et al. An AeroCom initial assessment—Optical properties in aerosol component modules of global models. Atmos. Chem. Phys. 2006, 6, 1815–1834. [Google Scholar] [CrossRef]
  11. Zhao, G.; Tan, T.; Zhao, W.; Guo, S.; Tian, P.; Zhao, C. A new parameterization scheme for the real part of the ambient urban aerosol refractive index. Atmos. Chem. Phys. 2019, 19, 12875–12885. [Google Scholar] [CrossRef]
  12. Zhai, S.; Jacob, D.J.; Brewer, J.F.; Li, K.; Moch, J.M.; Kim, J.; Lee, S.; Lim, H.; Lee, H.C.; Kuk, S.K.; et al. Relating geostationary satellite measurements of aerosol optical depth (AOD) over East Asia to fine particulate matter (PM2.5): Insights from the KORUS-AQ aircraft campaign and GEOS-Chem model simulations. Atmos. Chem. Phys. 2021, 21, 16775–16791. [Google Scholar] [CrossRef]
  13. Lowenthal, D.; Kumar, N. Light Scattering from Sea-Salt Aerosols at Interagency Monitoring of Protected Visual Environments (IMPROVE) Sites. J. Air Waste Manag. Assoc. 2012, 56, 636–642. [Google Scholar] [CrossRef]
  14. Guerreiro, C.; Horálek, J.; Leeuw, F.; Foltescu, V.; González Ortiz, A. Air Quality in Europe—2015 Report; European Environment Agency: Copenhagen, Denmark, 2015. [Google Scholar]
  15. Snider, G.; Weagle, C.L.; Martin, R.V.; van Donkelaar, A.; Conrad, K.; Cunningham, D.; Gordon, C.; Zwicker, M.; Akoshile, C.; Artaxo, P.; et al. SPARTAN: A global network to evaluate and enhance satellite-based estimates of ground-level particulate matter for global health applications. Atmos. Meas. Tech. 2015, 8, 505–521. [Google Scholar] [CrossRef]
  16. Liu, Y.; Daum, P.H. Relationship of refractive index to mass density and self-consistency of mixing rules for multicomponent mixtures like ambient aerosols. J. Aerosol Sci. 2008, 39, 974–986. [Google Scholar] [CrossRef]
  17. Zhao, G.; Hu, M.; Zhu, W.; Tan, T.; Shang, D.; Zheng, J.; Du, Z.; Guo, S.; Wu, Z.; Zeng, L.; et al. Parameterization of the ambient aerosol refractive index with source appointed chemical compositions. Sci. Total Environ. 2022, 842, 156573. [Google Scholar] [CrossRef] [PubMed]
  18. Ma, N.; Zhao, C.S.; Nowak, A.; Müller, T.; Pfeifer, S.; Cheng, Y.F.; Deng, Z.Z.; Liu, P.F.; Xu, W.Y.; Ran, L.; et al. Aerosol optical properties in the North China Plain during HaChi campaign: An in-situ optical closure study. Atmos. Chem. Phys. 2011, 11, 5959–5973. [Google Scholar] [CrossRef]
  19. Hand, J.L.; Malm, W.C. Review of aerosol mass scattering efficiencies from ground-based measurements since 1990. J. Geophys. Res.-Atmos. 2007, 112, D16203. [Google Scholar] [CrossRef]
  20. Malm, W.C.; Kreidenweis, S.M. The effects of models of aerosol hygroscopicity on the apportionment of extinction. Atmos. Environ. 1997, 31, 1965–1976. [Google Scholar] [CrossRef]
  21. White, W.H. On the theoretical and empirical basis for apportioning extinction by aerosols: A critical review. Atmos. Environ. 1986, 20, 1659–1672. [Google Scholar] [CrossRef]
  22. Moise, T.; Flores, J.M.; Rudich, Y. Optical Properties of Secondary Organic Aerosols and Their Changes by Chemical Processes. Chem. Rev. 2015, 115, 4400–4439. [Google Scholar] [CrossRef] [PubMed]
  23. Li, K.; Li, J.; Liggio, J.; Wang, W.; Ge, M.; Liu, Q.; Guo, Y.; Tong, S.; Li, J.; Peng, C.; et al. Enhanced Light Scattering of Secondary Organic Aerosols by Multiphase Reactions. Environ. Sci. Technol. 2017, 51, 1285–1292. [Google Scholar] [CrossRef] [PubMed]
  24. Lambe, A.T.; Cappa, C.D.; Massoli, P.; Onasch, T.B.; Forestieri, S.D.; Martin, A.T.; Cummings, M.J.; Croasdale, D.R.; Brune, W.H.; Worsnop, D.R.; et al. Relationship between Oxidation Level and Optical Properties of Secondary Organic Aerosol. Environ. Sci. Technol. 2013, 47, 6349–6357. [Google Scholar] [CrossRef]
  25. Li, Y.; Bai, B.; Dykema, J.; Shin, N.; Lambe, A.T.; Chen, Q.; Kuwata, M.; Ng, N.L.; Keutsch, F.N.; Liu, P. Predicting Real Refractive Index of Organic Aerosols From Elemental Composition. Geophys. Res. Lett. 2023, 50, e2023GL103446. [Google Scholar] [CrossRef]
  26. Zhao, G.; Hu, M.; Fang, X.; Tan, T.; Xiao, Y.; Du, Z.; Zheng, J.; Shang, D.; Wu, Z.; Guo, S.; et al. Larger than expected variation range in the real part of the refractive index for ambient aerosols in China. Sci. Total Environ. 2021, 779, 146443. [Google Scholar] [CrossRef]
  27. Zarzana, K.J.; Cappa, C.D.; Tolbert, M.A. Sensitivity of Aerosol Refractive Index Retrievals Using Optical Spectroscopy. Aerosol Sci. Technol. 2014, 48, 1133–1144. [Google Scholar] [CrossRef]
  28. He, B.; Zhao, C. A novel method to quantify the uncertainty contribution of aerosol–radiation interaction factors. Atmos. Chem. Phys. 2025, 25, 7765–7776. [Google Scholar] [CrossRef]
  29. Han, T.; Xu, W.; Chen, C.; Liu, X.; Wang, Q.; Li, J.; Zhao, X.; Du, W.; Wang, Z.; Sun, Y. Chemical apportionment of aerosol optical properties during the Asia-Pacific Economic Cooperation summit in Beijing, China. J. Geophys. Res. Atmos. 2015, 120, 12281–12295. [Google Scholar] [CrossRef]
  30. Tao, J.; Zhang, Z.; Wu, Y.; Zhang, L.; Wu, Z.; Cheng, P.; Li, M.; Chen, L.; Zhang, R.; Cao, J. Impact of particle number and mass size distributions of major chemical components on particle mass scattering efficiency in urban Guangzhou in southern China. Atmos. Chem. Phys. 2019, 19, 8471–8490. [Google Scholar] [CrossRef]
  31. Gao, Y.; Lai, S.C.; Lee, S.C.; Yau, P.S.; Huang, Y.; Cheng, Y.; Wang, T.; Xu, Z.; Yuan, C.; Zhang, Y.Y. Optical properties of size-resolved particles at a Hong Kong urban site during winter. Atmos. Res. 2015, 155, 1–12. [Google Scholar] [CrossRef]
  32. Tao, J.; Zhang, L.; Wu, Y.; Zhang, Z. Evaluation of the IMPROVE formulas based on Mie model in the calculation of particle scattering coefficient in an urban atmosphere. Atmos. Environ. 2020, 222, 117116. [Google Scholar] [CrossRef]
  33. Chen, D.; Zhao, Y.; Zhang, J.; Yu, H.; Yu, X. Characterization and source apportionment of aerosol light scattering in a typical polluted city in the Yangtze River Delta, China. Atmos. Chem. Phys. 2020, 20, 10193–10210. [Google Scholar] [CrossRef]
  34. Guo, J.; Zhou, S.; Cai, M.; Zhao, J.; Song, W.; Zhao, W.; Hu, W.; Sun, Y.; He, Y.; Yang, C.; et al. Characterization of submicron particles by time-of-flight aerosol chemical speciation monitor (ToF-ACSM) during wintertime: Aerosol composition, sources, and chemical processes in Guangzhou, China. Atmos. Chem. Phys. 2020, 20, 7595–7615. [Google Scholar] [CrossRef]
  35. Chen, W.; Ye, Y.; Hu, W.; Zhou, H.; Pan, T.; Wang, Y.; Song, W.; Song, Q.; Ye, C.; Wang, C.; et al. Real-Time Characterization of Aerosol Compositions, Sources, and Aging Processes in Guangzhou During PRIDE-GBA 2018 Campaign. J. Geophys. Res. Atmos. 2021, 126, e2021JD035114. [Google Scholar] [CrossRef]
  36. Zhou, W.; Xu, W.; Kim, H.; Zhang, Q.; Fu, P.; Worsnop, D.R.; Sun, Y. A review of aerosol chemistry in Asia: Insights from aerosol mass spectrometer measurements. Environ. Sci. Process. Impacts 2020, 22, 1616–1653. [Google Scholar] [CrossRef] [PubMed]
  37. Shen, J.; Kuang, Y.; Liu, L.; Yuan, F.; Luo, B.; Qiao, H.; Zhai, M.; Zhao, G.; Xu, H.; Li, F.; et al. Refractive index enhancement by secondary organic aerosol formation in humid southern China challenges model assumptions. Atmos. Chem. Phys. 2025, 25, 11233–11246. [Google Scholar] [CrossRef]
  38. Drinovec, L.; Močnik, G.; Zotter, P.; Prévôt, A.S.H.; Ruckstuhl, C.; Coz, E.; Rupakheti, M.; Sciare, J.; Müller, T.; Wiedensohler, A.; et al. The “dual-spot” Aethalometer: An improved measurement of aerosol black carbon with real-time loading compensation. Atmos. Meas. Tech. 2015, 8, 1965–1979. [Google Scholar] [CrossRef]
  39. Qiao, H.; Kuang, Y.; Yuan, F.; Liu, L.; Zhai, M.; Xu, H.; Zou, Y.; Deng, T.; Deng, X. Unlocking the Mystery of Aerosol Phase Transitions Governed by Relative Humidity History Through an Advanced Outdoor Nephelometer System. Geophys. Res. Lett. 2024, 51, e2023GL107179. [Google Scholar] [CrossRef]
  40. Canonaco, F.; Tobler, A.; Chen, G.; Sosedova, Y.; Slowik, J.G.; Bozzetti, C.; Daellenbach, K.R.; El Haddad, I.; Crippa, M.; Huang, R.J.; et al. A new method for long-term source apportionment with time-dependent factor profiles and uncertainty assessment using SoFi Pro: Application to 1 year of organic aerosol data. Atmos. Meas. Tech. 2021, 14, 923–943. [Google Scholar] [CrossRef]
  41. Zhai, M.; Kuang, Y.; Liu, L.; He, Y.; Luo, B.; Xu, W.; Tao, J.; Zou, Y.; Li, F.; Yin, C.; et al. Insights into characteristics and formation mechanisms of secondary organic aerosols in the Guangzhou urban area. Atmos. Chem. Phys. 2023, 23, 5119–5133. [Google Scholar] [CrossRef]
  42. Ogulei, D.; Hopke, P.K.; Chalupa, D.C.; Utell, M.J. Modeling source contributions to submicron particle number concentrations measured in Rochester, New York. Aerosol Sci. Technol. 2007, 41, 179–201. [Google Scholar] [CrossRef]
  43. Paatero, P.; Tapper, U. Positive matrix factorization: A non-negative factor model with optimal utilization of error estimates of data values. Environmetrics 1994, 5, 111–126. [Google Scholar] [CrossRef]
  44. Ulbrich, I.M.; Canagaratna, M.R.; Zhang, Q.; Worsnop, D.R.; Jimenez, J.L. Interpretation of organic components from Positive Matrix Factorization of aerosol mass spectrometric data. Atmos. Chem. Phys. 2009, 9, 2891–2918. [Google Scholar] [CrossRef]
  45. Du, W.; Zhao, J.; Wang, Y.; Zhang, Y.; Wang, Q.; Xu, W.; Chen, C.; Han, T.; Zhang, F.; Li, Z.; et al. Simultaneous measurements of particle number size distributions at ground level and 260 m on a meteorological tower in urban Beijing, China. Atmos. Chem. Phys. 2017, 17, 6797–6811. [Google Scholar] [CrossRef]
  46. Gysel, M.; Crosier, J.; Topping, D.O.; Whitehead, J.D.; Bower, K.N.; Cubison, M.J.; Williams, P.I.; Flynn, M.J.; McFiggans, G.B.; Coe, H. Closure study between chemical composition and hygroscopic growth of aerosol particles during TORCH2. Atmos. Chem. Phys. 2007, 7, 6131–6144. [Google Scholar] [CrossRef]
  47. Kuang, Y.; Huang, S.; Xue, B.A.; Luo, B.A.; Song, Q.C.; Chen, W.; Hu, W.W.; Li, W.; Zhao, P.S.; Cai, M.F.; et al. Contrasting effects of secondary organic aerosol formations on organic aerosol hygroscopicity. Atmos. Chem. Phys. 2021, 21, 10375–10391. [Google Scholar] [CrossRef]
  48. Zhou, Y.; Ma, N.; Wang, Q.; Wang, Z.; Chen, C.; Tao, J.; Hong, J.; Peng, L.; He, Y.; Xie, L.; et al. Bimodal distribution of size-resolved particle effective density: Results from a short campaign in a rural environment over the North China Plain. Atmos. Chem. Phys. 2022, 22, 2029–2047. [Google Scholar] [CrossRef]
  49. Li, F.; Luo, B.; Zhai, M.; Liu, L.; Zhao, G.; Xu, H.; Deng, T.; Deng, X.; Tan, H.; Kuang, Y.; et al. Black carbon content of traffic emissions significantly impacts black carbon mass size distributions and mixing states. Atmos. Chem. Phys. 2023, 23, 6545–6558. [Google Scholar] [CrossRef]
  50. Bohren, C.F.; Huffman, D.R. Absorption and Scattering by a Sphere. In Absorption and Scattering of Light by Small Particles; Wiley: New York, NY, USA, 1998; pp. 82–129. [Google Scholar]
  51. Cheng, Y.F.; Berghof, M.; Garland, R.M.; Wiedensohler, A.; Wehner, B.; Müller, T.; Su, H.; Zhang, Y.H.; Achtert, P.; Nowak, A.; et al. Influence of soot mixing state on aerosol light absorption and single scattering albedo during air mass aging at a polluted regional site in northeastern China. J. Geophys. Res. Atmos. 2009, 114, D00G10. [Google Scholar] [CrossRef]
  52. Müller, T.; Laborde, M.; Kassell, G.; Wiedensohler, A. Design and performance of a three-wavelength LED-based total scatter and backscatter integrating nephelometer. Atmos. Meas. Tech. 2011, 4, 1291–1303. [Google Scholar] [CrossRef]
  53. Whitby, K.T. The physical characteristics of sulfur aerosols. Atmos. Environ. 1978, 12, 135–159. [Google Scholar] [CrossRef]
  54. Luo, B.; Kuang, Y.; Huang, S.; Song, Q.; Hu, W.; Li, W.; Peng, Y.; Chen, D.; Yue, D.; Yuan, B.; et al. Parameterizations of size distribution and refractive index of biomass burning organic aerosol with black carbon content. Atmos. Chem. Phys. 2022, 22, 12401–12415. [Google Scholar] [CrossRef]
  55. Shao, L.; Li, W.; Yang, S.; Shi, Z.; Lü, S. Mineralogical characteristics of airborne particles collected in Beijing during a severe Asian dust storm period in spring 2002. Sci. China Ser. D Earth Sci. 2007, 50, 953–959. [Google Scholar] [CrossRef]
  56. Kuang, Y.; Zhao, C.; Tao, J.; Bian, Y.; Ma, N.; Zhao, G. A novel method for deriving the aerosol hygroscopicity parameter based only on measurements from a humidified nephelometer system. Atmos. Chem. Phys. 2017, 17, 6651–6662. [Google Scholar] [CrossRef]
  57. Cai, J.; Chu, B.; Yao, L.; Yan, C.; Heikkinen, L.M.; Zheng, F.; Li, C.; Fan, X.; Zhang, S.; Yang, D.; et al. Size-segregated particle number and mass concentrations from different emission sources in urban Beijing. Atmos. Chem. Phys. 2020, 20, 12721–12740. [Google Scholar] [CrossRef]
  58. Hopke, P.K.; Feng, Y.C.; Dai, Q.L. Source apportionment of particle number concentrations: A global review. Sci. Total Environ. 2022, 819, 153104. [Google Scholar] [CrossRef]
  59. Kim, S.; Kim, N.G.; Kim, J.; Kim, H.; Kim, K.H.; Choi, W.; Kwak, K.H.; Kim, C.; Woo, S.H.; Lee, S.; et al. Impact of vehicles at the roadside of expressway in urban area: Simultaneous measurement of particle size distribution and positive matrix factorization. Sci. Total Environ. 2024, 949, 175051. [Google Scholar] [CrossRef] [PubMed]
  60. Zhao, Y.; Zhao, B. Emissions of air pollutants from Chinese cooking: A literature review. Build. Simul. 2018, 11, 977–995. [Google Scholar] [CrossRef]
  61. Yeung, L.L.; To, W.M. Size distributions of the aerosols emitted from commercial cooking processes. Indoor Built Environ. 2008, 17, 220–229. [Google Scholar] [CrossRef]
  62. Ren, J.; Zhang, F.; Chen, L.; Cao, G.; Liu, M.; Li, X.; Wu, H.; Cheng, Y.; Li, Z. Identifying the hygroscopic properties of fine aerosol particles from diverse sources in urban atmosphere and the applicability in prediction of cloud nuclei. Atmos. Environ. 2023, 298, 119615. [Google Scholar] [CrossRef]
  63. Kuang, Y.; He, Y.; Xu, W.; Yuan, B.; Zhang, G.; Ma, Z.; Wu, C.; Wang, C.; Wang, S.; Zhang, S.; et al. Photochemical Aqueous-Phase Reactions Induce Rapid Daytime Formation of Oxygenated Organic Aerosol on the North China Plain. Environ. Sci. Technol. 2020, 54, 3849–3860. [Google Scholar] [CrossRef]
  64. Peng, C.; Wang, Y.; Wu, Z.; Chen, L.; Huang, R.-J.; Wang, W.; Wang, Z.; Hu, W.; Zhang, G.; Ge, M.; et al. Tropospheric aerosol hygroscopicity in China. Atmos. Chem. Phys. 2020, 20, 13877–13903. [Google Scholar] [CrossRef]
  65. Kuang, Y.; Xu, W.; Tao, J.; Ma, N.; Zhao, C.; Shao, M. A Review on Laboratory Studies and Field Measurements of Atmospheric Organic Aerosol Hygroscopicity and Its Parameterization Based on Oxidation Levels. Curr. Pollut. Rep. 2020, 6, 410–424. [Google Scholar] [CrossRef]
  66. Martin, S.T.; Rosenoern, T.; Chen, Q.; Collins, D.R. Phase changes of ambient particles in the Southern Great Plains of Oklahoma. Geophys. Res. Lett. 2008, 35, L22801. [Google Scholar] [CrossRef]
  67. Wang, Z.; Cheng, Y.; Ma, N.; Mikhailov, E.; Pöschl, U.; Su, H. Dependence of the hygroscopicity parameter κ on particle size, humidity and solute concentration: Implications for laboratory experiments, field measurements and model studies. Atmos. Chem. Phys. Discuss. 2017, 2017, 1–33. [Google Scholar] [CrossRef]
  68. Wexler, A.S.; Clegg, S.L. Atmospheric aerosol models for systems including the ions H+, NH4+, Na+, SO42−, NO3, Cl, Br, and H2O. J. Geophys. Res. Atmos. 2002, 107, ACH 14-1–ACH 14-14. [Google Scholar] [CrossRef]
  69. Rastak, N.; Pajunoja, A.; Acosta Navarro, J.C.; Ma, J.; Song, M.; Partridge, D.G.; Kirkevåg, A.; Leong, Y.; Hu, W.W.; Taylor, N.F.; et al. Microphysical explanation of the RH-dependent water affinity of biogenic organic aerosol and its importance for climate. Geophys. Res. Lett. 2017, 44, 5167–5177. [Google Scholar] [CrossRef]
  70. Zhao, P.; Ge, S.; Su, J.; Ding, J.; Kuang, Y. Relative humidity dependence of hygroscopicity parameter of ambient aerosols. J. Geophys. Res. Atmos. 2022, 127, e2021JD035647. [Google Scholar] [CrossRef]
  71. Kuang, Y.; He, Y.; Xu, W.; Zhao, P.; Cheng, Y.; Zhao, G.; Tao, J.; Ma, N.; Su, H.; Zhang, Y.; et al. Distinct diurnal variation in organic aerosol hygroscopicity and its relationship with oxygenated organic aerosol. Atmos. Chem. Phys. 2020, 20, 865–880. [Google Scholar] [CrossRef]
  72. Xue, B.; Kuang, Y.; Xu, W.; Zhao, P. Joint increase of aerosol scattering efficiency and aerosol hygroscopicity aggravate visibility impairment in the North China Plain. Sci. Total Environ. 2022, 839, 156279. [Google Scholar] [CrossRef]
  73. Wex, H.; Neusüß, C.; Wendisch, M.; Stratmann, F.; Koziar, C.; Keil, A.; Wiedensohler, A.; Ebert, M. Particle scattering, backscattering, and absorption coefficients: An in situ closure and sensitivity study. J. Geophys. Res.-Atmos. 2002, 107, LAC 4-1–LAC 4-18. [Google Scholar] [CrossRef]
  74. Cheng, Y.; Wiedensohler, A.; Eichler, H.; Heintzenberg, J.; Tesche, M.; Ansmann, A.; Wendisch, M.; Su, H.; Althausen, D.; Herrmann, H. Relative humidity dependence of aerosol optical properties and direct radiative forcing in the surface boundary layer at Xinken in Pearl River Delta of China: An observation based numerical study. Atmos. Environ. 2008, 42, 6373–6397. [Google Scholar] [CrossRef]
  75. Kuang, Y. From Chemistry to Scattering: Distinct but Interdependent Roles of Secondary Organic and Inorganic Aerosol Formation [Data Set]; Zenodo: Geneva, Switzerland, 2025. [Google Scholar] [CrossRef]
Figure 1. Average results of observed (gray solid line) and fitted (blue dashed line) PVSD with the four-mode fitting method under four different NR-PM1 levels: (a) <10 μg/m3, (b) 10–20 μg/m3, (c) 20–30 μg/m3, (d) >30 μg/m3. Colored dashed lines represent fitted average PVSDs of the four modes: PVSDPOA+BC (yellow), PVSDSOA (cyan), PVSDSIA (light green), PVSDX (orange).
Remotesensing 18 01713 g001
Figure 2. (a) Probability distribution of derived VSE. (bd) Scatter plots of VSE versus fPOA, fSOA, and fSIA; red squares with error bars represent average values and standard deviations.
Remotesensing 18 01713 g002
Figure 3. Correlations of VSE at 525 nm with (a) Deff and (b) mrc525; color scales indicate sample counts in each grid, and blue dashed lines show the fitted trends. (c) Relationship between fSIA and Deff, with colors indicating the average mass ratio of MOOA to LOOA. (d) Relationship between Deff and mrc525, with colors representing the average fSIA.
Remotesensing 18 01713 g003
Figure 4. (a) The volume size distributions of five factors (Factor 1–Factor 5) from PVSD PMF analysis; the black dashed line shows the observed PVSD, vertical dashed lines correspond to peak diameters of Factors 3–5. (b) Squared correlation coefficient between volume concentrations of chemical compositions and resolved PVSD factors.
Remotesensing 18 01713 g004
Figure 5. Profiles of (a) number and (b) volume size distributions from PVSD PMF analysis. Colors indicate Factors 1–5, and pie charts show each factor’s contribution to the total number or volume.
Remotesensing 18 01713 g005
Figure 6. Mass concentrations and effective diameter changes for (a,b) 64 SIA-dominated events and (c,d) 40 SOA-dominated events identified in this study. (a,c) Box plots present ranges of absolute mass concentration changes from the 25th to 75th percentile, with whiskers representing the 5th to 95th percentile, and red lines indicating the mean. (b,d) Average aerosol volume size distributions at the start and end of the events, along with dashed lines showing the corresponding changes in volume size distribution.
Remotesensing 18 01713 g006
Figure 7. (a) Seasonal probability distributions of Deff. (b1b4) Average mass fractions of aerosol chemical components in NR-PM1 from spring (March–May) to winter (December–February).
Remotesensing 18 01713 g007
Figure 8. (a) Annual probability distributions of retrieved D g , P O A + B C , D g , S O A , and D g , S I A . (b) Relationships between D g , S O A and D g , S I A with color scales indicating sample numbers in each grid; the dashed blue line and squared correlation coefficient represent a linear fit for data points above the 1:1 dashed gray line.
Remotesensing 18 01713 g008
Figure 9. (a) Scatter plots of observed κ f ( R H ) against R H w , with red squares showing the average κ f ( R H ) under different R H w bins; blue squares indicate average κ c h e m derived from aerosol chemical compositions. (bd) Covariation characteristics of κ f ( R H ) and VSE under different R H a i r ranges, with colors representing dry-state scattering at 525 nm ( σ s p ,   525 ). Red squares and error bars represent average values and standard deviations.
Remotesensing 18 01713 g009
Figure 10. Covariations characteristics of Deff and κ f ( R H ) (ac), and of mrc525 and κ f ( R H ) (df) under R H a i r ranges odf 60–70%, 70–80%, and 80–95%. Colors of scatter points represent corresponding dry-state scattering at 525 nm ( σ s p ,   525 ).
Remotesensing 18 01713 g010
Disclaimer/Publisher’s Note: The statements, opinions and data contained in all publications are solely those of the individual author(s) and contributor(s) and not of MDPI and/or the editor(s). MDPI and/or the editor(s) disclaim responsibility for any injury to people or property resulting from any ideas, methods, instructions or products referred to in the content.