1. Introduction
Fouling critically affects the structural stability of railroad tracks. Fouling fills ballast voids with fine materials such as degraded aggregates, coal dust, clay, tie wear, or pumped slurry from the subgrade [
1]. The accumulation of fines reduces drainage capacity, limits interparticle contact, and weakens load transfer within the ballast layer. As fouling progresses, ballast stiffness and shear strength decline, increasing susceptibility to geometric degradation and track instability. Under repeated train loading, fouled ballast can contribute to progressive misalignment and eventual derailment [
2,
3]. Previous studies have shown that cyclic loading alters aggregate gradation and particle morphology, accelerating fine generation and reducing void ratio [
4]. These degradation processes directly increase fouling severity and degrade ballast mechanical performance. Quantifying fouling is therefore essential for understanding ballast behavior under service conditions and ensuring track safety.
Sampling followed by laboratory testing represents the conventional approach for ballast assessment. This destructive approach requires coring to evaluate deviations from standard gradation envelopes. Several indices quantify contamination based on ballast mass or volume. These include the Fouling Index (FI), Percentage Void Contamination (PVC), and Macro Void Ratio (MVR). FI measures fouling by combining the weights passing No. 4 and No. 200 sieves relative to the total sample mass [
5]. PVC evaluates fine intrusion using density and porosity relationships [
6]. MVR further incorporates moisture and interparticle contact, providing broader diagnostic insight [
7]. MVR incorporates moisture effects and interparticle contact conditions.
Surface condition monitoring is critical for ballast assessment. Fouling, moisture retention, and particle degradation can alter the exposed ballast layer and progressively reduce drainage and load transfer [
8,
9]. Subsurface inspection methods provide valuable information on ballast depth, layer interfaces, and internal moisture distribution; however, they provide limited characterization of surface texture, particle morphology, localized fines accumulation, and spatial variability across the ballast surface [
10]. Surface-based sensing methods address this gap by evaluating exposed aggregate conditions, including shoulder ballast, crib ballast, and exposed profile sections, that directly reflect ballast degradation and drainage performance. These measurements complement subsurface evaluations and support earlier detection of ballast deterioration [
11,
12]. Therefore, early-stage fouling assessment requires a non-contact and non-destructive surface evaluation method capable of detecting degradation before severe visual distress develops. In this context, moisture should not only be treated as a source of measurement uncertainty. Water accumulation also acts as an indicator of drainage blockage and fouled ballast behavior, which strongly influence track stability and long-term performance.
Hyperspectral imaging (HSI) has emerged as a promising surface-based, non-contact method for evaluating granular materials because spectral reflectance is sensitive to particle composition, texture, and spectral mixing behavior, with recent studies supporting transportation infrastructure assessment under field conditions [
13]. HSI operates on the principle of Diffuse Reflectance Spectroscopy (DRS), which measures the intensity of light reflected from a surface across a wide range of wavelengths. HSI translates subtle spectral variations into quantitative information by capturing reflected light in hundreds of narrow spectral bands. These spectral responses reveal chemical and physical changes associated with ballast fouling and surface degradation [
14,
15]. HSI performance depends on how light interacts with the outermost layers of porous materials through absorption and scattering mechanisms [
16]. For instance, the presence of water induces strong absorption features around 1400 nm, while fouling materials such as clay or coal alter reflectance patterns due to changes in mineralogy, texture, or iron oxide content [
17,
18]. Through these interactions, HSI enables precise, non-invasive detection of fouling and moisture content, making it highly effective for surface condition assessment.
HSI demonstrated high accuracy in detecting ballast contamination under controlled laboratory conditions. Clean, clay-fouled, and coal-fouled samples under varied moisture conditions exhibited distinct spectral signatures across the Near Infrared range. These spectrally specific features enable precise classification of fouling type and moisture state, with reported accuracies exceeding 95% [
19]. Recent laboratory investigations further demonstrated that Near Infrared hyperspectral sensing is sensitive to moisture exposure mechanisms even when water ingress occurs beneath the observed surface. Controlled experiments on railroad timber specimens showed that NIR reflectance features associated with O–H absorption reliably distinguish vapor-driven and liquid water exposure conditions, confirming the feasibility of detecting subsurface moisture effects through surface spectral response [
20]. The strong performance highlights HSI’s sensitivity to moisture absorption, fine intrusion, and compositional changes that influence light scattering and reflectance; however, laboratory environments simplify the complexity of real-world fouling. These uncontrolled and overlapping mechanisms introduce complex spectral variability that laboratory samples alone cannot fully replicate. Therefore, comparing hyperspectral reflectance of field-collected ballast with that of controlled laboratory-fabricated mixtures is necessary to evaluate whether lab-based models reliably represent real-world fouling scenarios.
Field validation remains essential for ballast condition assessment technologies, as operational railroad environments introduce variability beyond laboratory-fabricated conditions [
8,
21]. Hyperspectral imaging has yet to be evaluated for ballast fouling using field-collected samples; however, field-based ballast spectral characterization remains unreported. Field ballast is subject to uncontrolled and overlapping mechanisms that laboratory-fabricated samples alone cannot replicate. In operational trackbeds, fouling originates from multiple sources, including subgrade pumping, ballast degradation, and external materials such as grain and coal transported by rail [
22,
23]. Surface chemistry, compaction, moisture, and roughness further influence ballast reflectance behavior under field conditions; however, ballast-specific DRS variability remains insufficiently understood [
24,
25].
Spectral features therefore serve as key comparison criteria between laboratory-fabricated and field ballast samples. Hyperspectral data requires preprocessing to reduce baseline drift and high-frequency noise to ensure reliable extraction of diagnostic features. Baseline correction methods preserve absorption features while reducing background variability, enabling consistent comparison across samples [
26,
27].
Spectral similarity provides a quantitative basis for comparing laboratory and field reflectance behavior. Common metrics include Root Mean Square Error, Pearson correlation, and Spectral Angle Mapper (SAM). Intensity-based metrics are sensitive to illumination variation and moisture effects [
28,
29]. SAM evaluates spectral shape rather than magnitude, enabling robust similarity assessment under variable field conditions [
30].
To the best of the authors’ knowledge, this study presents the first field validation of HSI for railroad ballast fouling assessment using field-collected ballast samples. Samples collected from a derailment site were benchmarked against laboratory-fabricated mixtures. Hyperspectral reflectance spectra are preprocessed using baseline correction techniques, and spectral similarity between field and laboratory samples is evaluated using SAM. This approach assesses whether laboratory-derived spectral models reliably represent real-world fouling conditions and establishes the feasibility of applying HSI for in situ ballast fouling assessment. Accordingly, the objectives of this study are:
To characterize ballast fouling and moisture conditions in a field-collected derailment sample using hyperspectral reflectance and established geotechnical fouling indices.
To quantify spectral similarity between field-collected ballast and laboratory-fabricated mixtures to evaluate the representativeness of laboratory-based spectral models.
2. Materials and Methods
2.1. Field Ballast Sampling
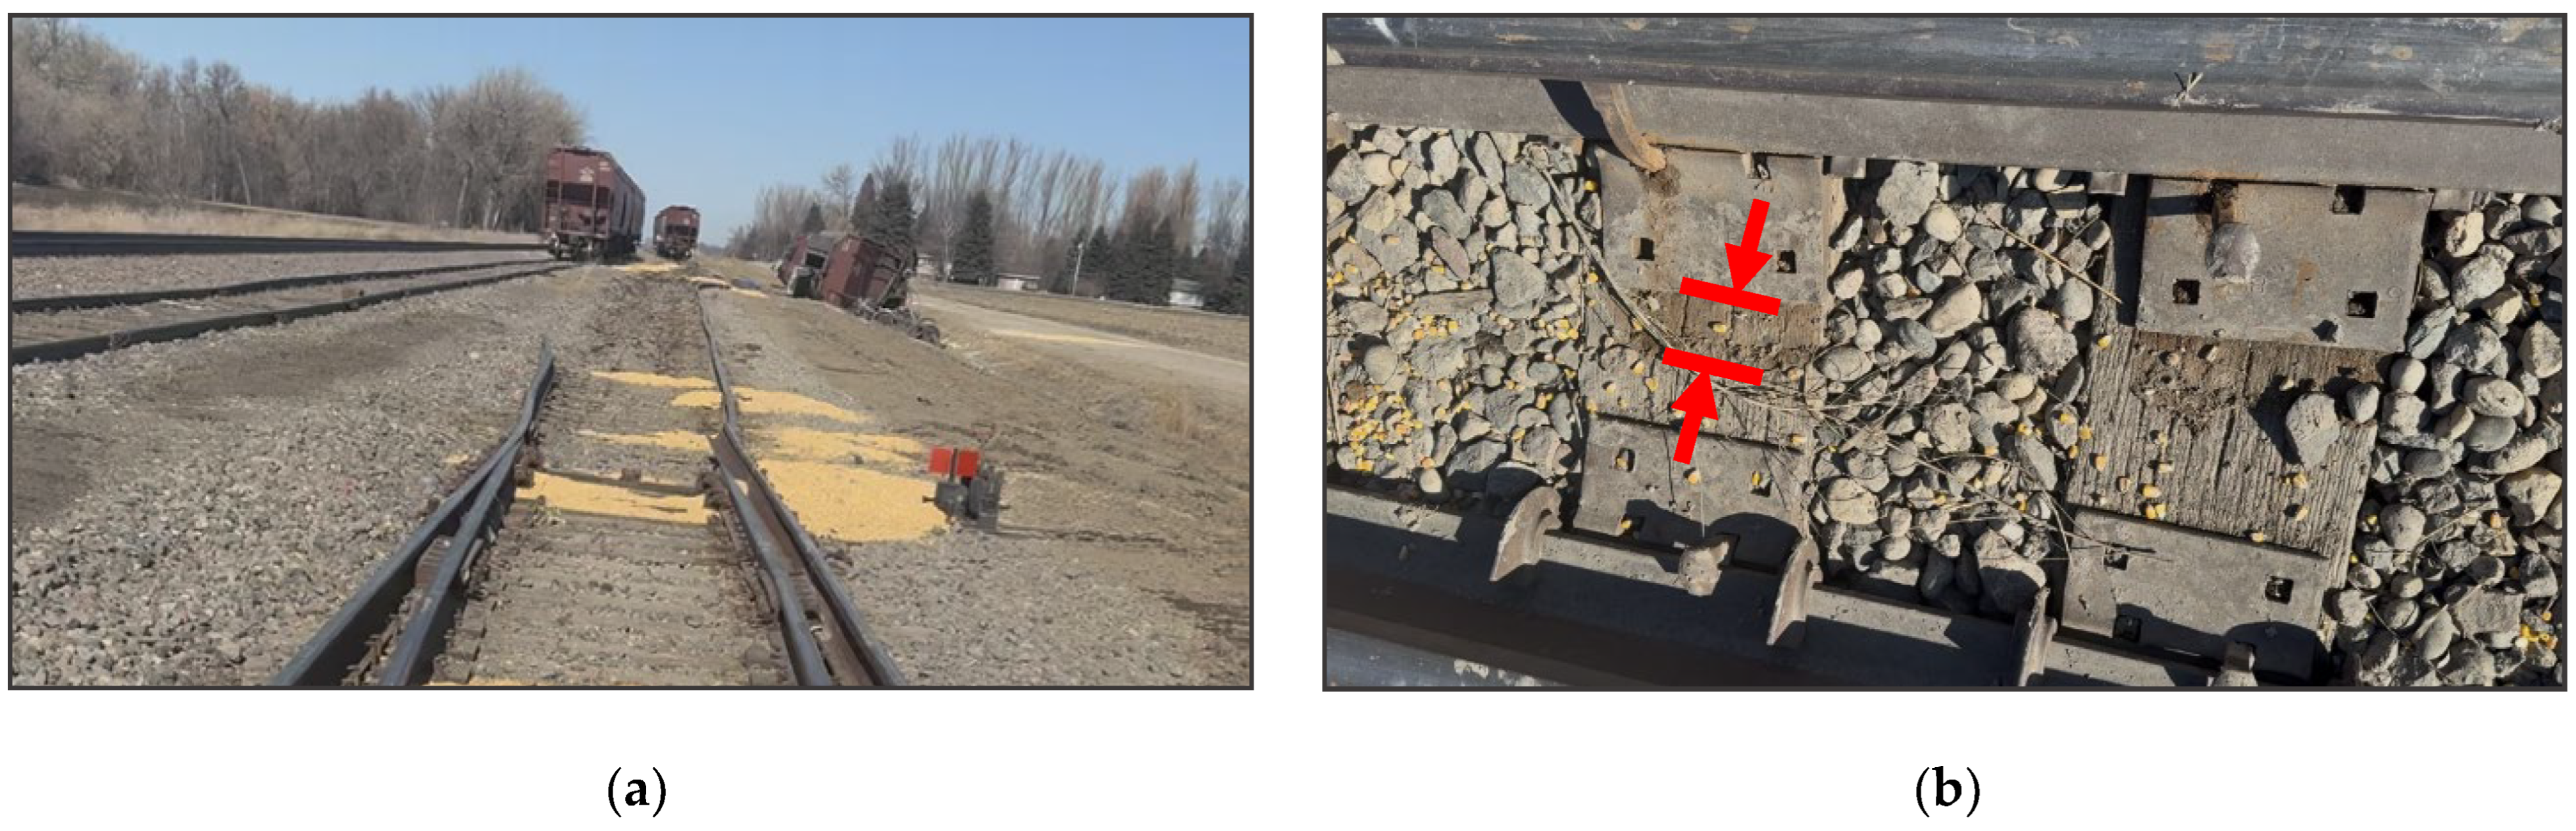
On 24 February 2025, a derailment occurred near Grand Forks North Dakota in a local freight transit line. Ten railcars derailed due to gauge widening (
Figure 1a). The track segment supported two shuttle trains with approximately 230 freight railcars per month. The track section was inspected quarterly, with repairs performed as needed based on inspection findings. This segment represents typical loading and climatic conditions of cold-region rail networks across the northern Great Plains. Specific accident details, including the site location and track design properties, are withheld for confidentiality. Field observations indicated noticeable tie expansion at the failed segment (
Figure 1b), indicating severe ballast fouling and drainage impairment. A portion of the removed ballast was retained for laboratory analysis.
Approximately 45 kg (99.2 lb) of ballast was collected during track repair activities while maintenance crews excavated the failed material. Although excavation depth was not documented during emergency repair, the collected material represents the active ballast layer involved in load transfer and drainage at the failure location. The material was sealed in capped containers to preserve moisture and transported to the laboratory six days after collection. Samples remained sealed for 25 days before subsampling. A total of 14.17 kg (31.24 lb) of ballast was randomly shoveled from the bins and divided into five containers, each weighing an average of 2.83 kg (6.24 lb) with a standard deviation of 0.10 kg (0.22 lb). The container used for scanning measured approximately 32.4 cm × 26.4 cm × 6.4 cm (12.75″ × 10.38″ × 2.5″), providing an open surface area of about 849 cm2 (131.56 in2).
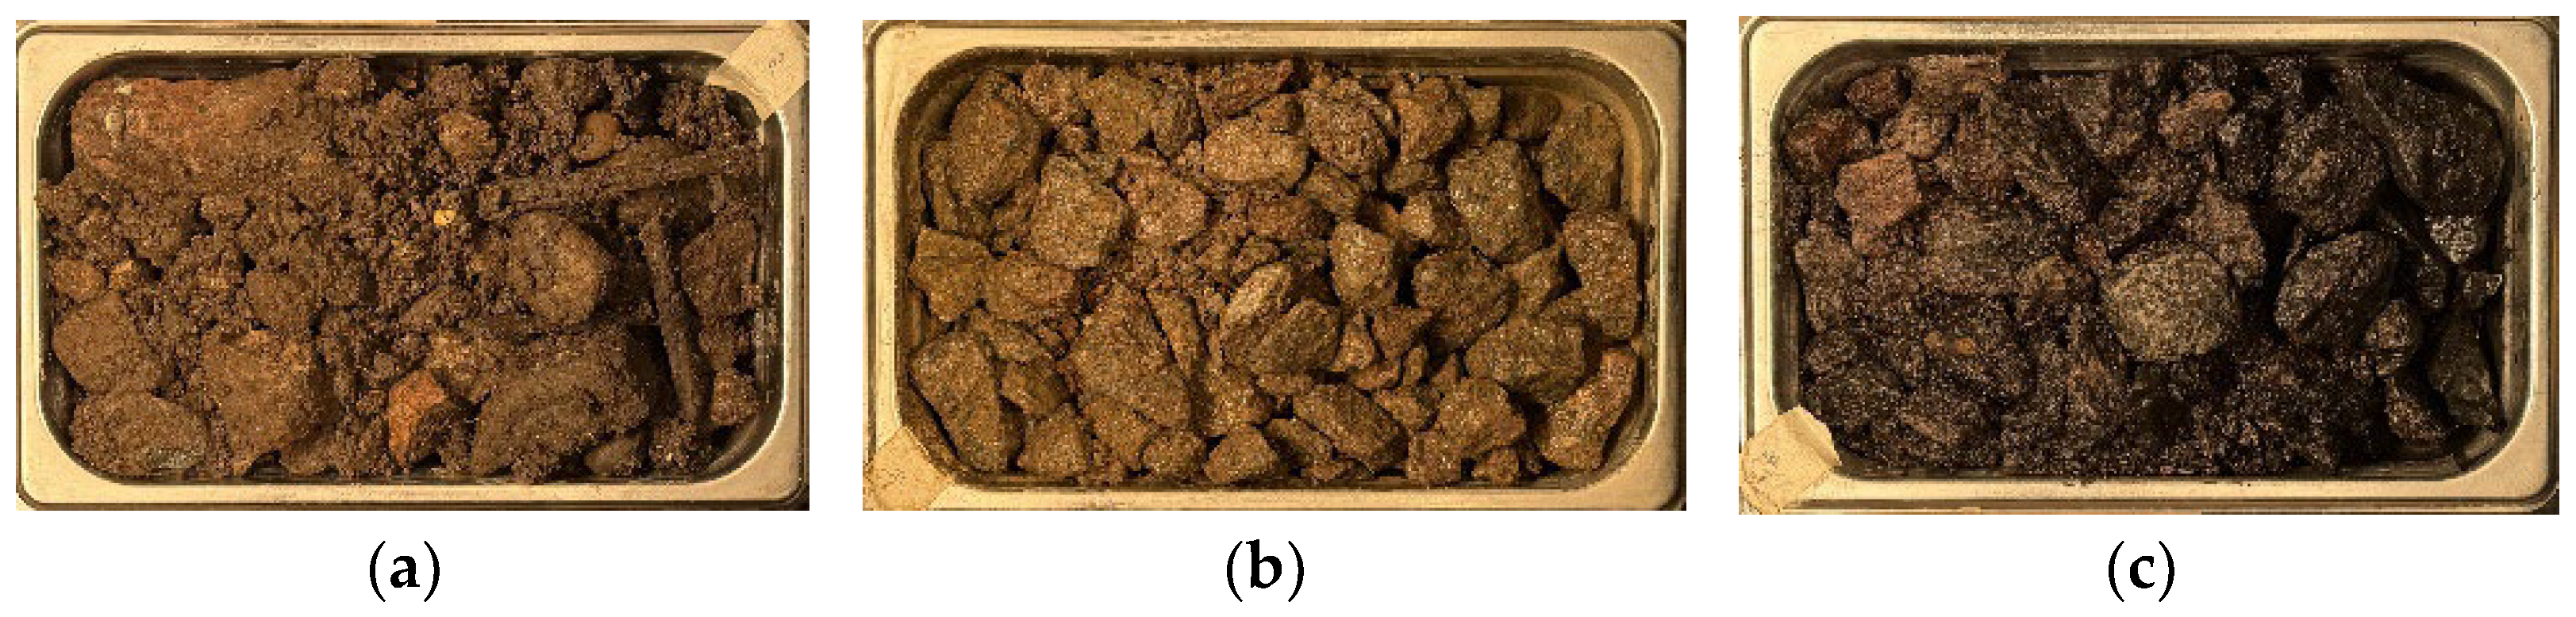
Each sample was processed in three sequential stages to evaluate the spectral response of ballast under varying fouling and moisture conditions: potentially fouled-wet (as-received), potentially fouled-dry (oven-dried), and clean-dry (oven-dried and sieved). Fouled ballast refers to aggregate containing a significant amount of fine particles (typically <9.5 mm), while clean ballast consists of coarse aggregate with minimal fines. Wet ballast represents fouled material that retains moisture, whereas dry ballast refers to material from which free water has been removed, typically through oven drying [
31,
32].
First, samples were analyzed in their as-received condition. They were then oven-dried to remove retained moisture. The oven-drying process followed ASTM C136-06 at 110 ± 5 °C for 24 h to eliminate free moisture while preserving particle integrity, producing dry samples [
33]. This procedure removed moisture while preserving aggregate integrity. The fines moisture content was calculated using Equation (1).
represents mass loss due to drying and
represents dry fines mass passing the 9.5 mm (3/8″) sieve. A fine moisture content of approximately 3% marks the critical moisture threshold, marking the onset of moisture-induced weakening in fouled ballast. At this level, fines begin to retain water within voids, forming thin films that lubricate particle contacts and reduce interparticle friction. When moisture exceeds this threshold, the ballast matrix softens and loses interlock, allowing particles to slide and rearrange more easily under cyclic loading. This behavior results in a substantial reduction in shear strength up to 50% lower than the dry condition and increased deformation, especially in ballast layers affected by fouling or inadequate drainage [
34].
Finally, each sample was mechanically sieved for 10 min using a standard sieve shaker. Coarse particles retained above the 9.5 mm (3/8″) sieve were separated from finer fouling materials, as specified in ASTM C136-06 [
33]. The clean-dry condition was represented by the reassembled coarse fraction, free of fines, simulating restored ballast. The combined moisture content and sieve analysis results provided a quantitative basis for distinguishing the fouled-wet, fouled-dry, and clean-dry stages of ballast processing.
2.2. Conventional Fouling Characterization
Ballast fouling severity was quantified using three established indices: Fouling Index FI, Percentage Void Contamination PVC, and Macro Void Ratio MVR. These indices provide complementary mass-based, volume-based, and hybrid characterizations of ballast degradation.
FI is a mass-based indicator originally introduced by [
1] to quantify the accumulation of fouling particles in ballast based on standard gradation limits. It is defined as the sum of material passing through the No. 4 (4.75 mm) and No. 200 (0.075 mm) sieves as Equation (2).
P4 is the percent by weight passing the No. 4 sieve and
P200 is the percent passing the No. 200 sieve. The
FI effectively captures the presence of both coarse and very fine fouling particles. According to AREMA guidelines, ballast is considered clean when
FI < 1, moderately clean between 1 and 10, and highly fouled when FI exceeds 40. These classifications help interpret fouling severity; values above 20 (categorized as fouled or highly fouled) are often associated with substantial reductions in permeability and compromised drainage performance [
5].
PVC is a volumetric indicator designed to estimate the proportion of void space filled by fouling material. It is expressed as Equation (3).
is the bulk volume of fouling material (typically defined as particles passing the 9.5 mm sieve), and
is the volume of voids in the clean, compacted ballast (retained above the 9.5 mm sieve).
was determined by measuring the bulk volume of material passing the 9.5 mm sieve. To calculate
, the clean ballast (retained above the 9.5 mm sieve) was placed in a cylindrical mold and compacted using a three-layer method. Each layer was tamped 25 times with a steel rod to achieve uniform density. The void volume was then computed by subtracting the solid volume of compacted aggregate from the total container volume, ensuring consistent measurement of internal voids across samples [
35].
Clean ballast typically exhibits PVC values below 20%, with voids accounting for up to 45% of its volume; as fouling increases, these voids fill, reducing drainage and structural integrity. When PVC exceeds 50%, fouling reaches the sleeper base, triggering substructure failure. Cleaning is recommended before PVC exceeds 30% to maintain performance. PVC accounts for density differences between ballast and fouling, e.g., coal fills voids efficiently at low mass. PVC values greater than 100% indicate displacement of coarse particles, highlighting advanced degradation and the need for immediate maintenance [
6].
MVR is a ballast condition metric that evaluates volumetric relationships between the solid ballast fraction and its moisture interaction. MVR has been used in drainage and permeability studies to identify the hydraulic performance of granular media and vulnerability due to excessive moisture and fouling [
7] as Equation (4).
is the specific gravity of ballast;
is the unit weight of water;
is the volume of the sample and
is the dry weight of ballast particles retained on the 12 mm sieve. MVR reflects the effective void space in ballast, accounting for moisture, volume, and particle mass. MVR values below 1.3 indicate clean ballast with high drainage capacity; values between 1.3 and 1.8 suggest moderate fouling with partial void infill; values from 1.8 to 2.5 indicate fouled ballast with impaired drainage; and values above 2.5 reflect highly fouled conditions with clogged voids and poor structural performance. As MVR increases, the risk of plastic deformation under repeated loading increases, especially in wet conditions. MVR is therefore a strong indicator of both hydraulic and mechanical ballast degradation [
7].
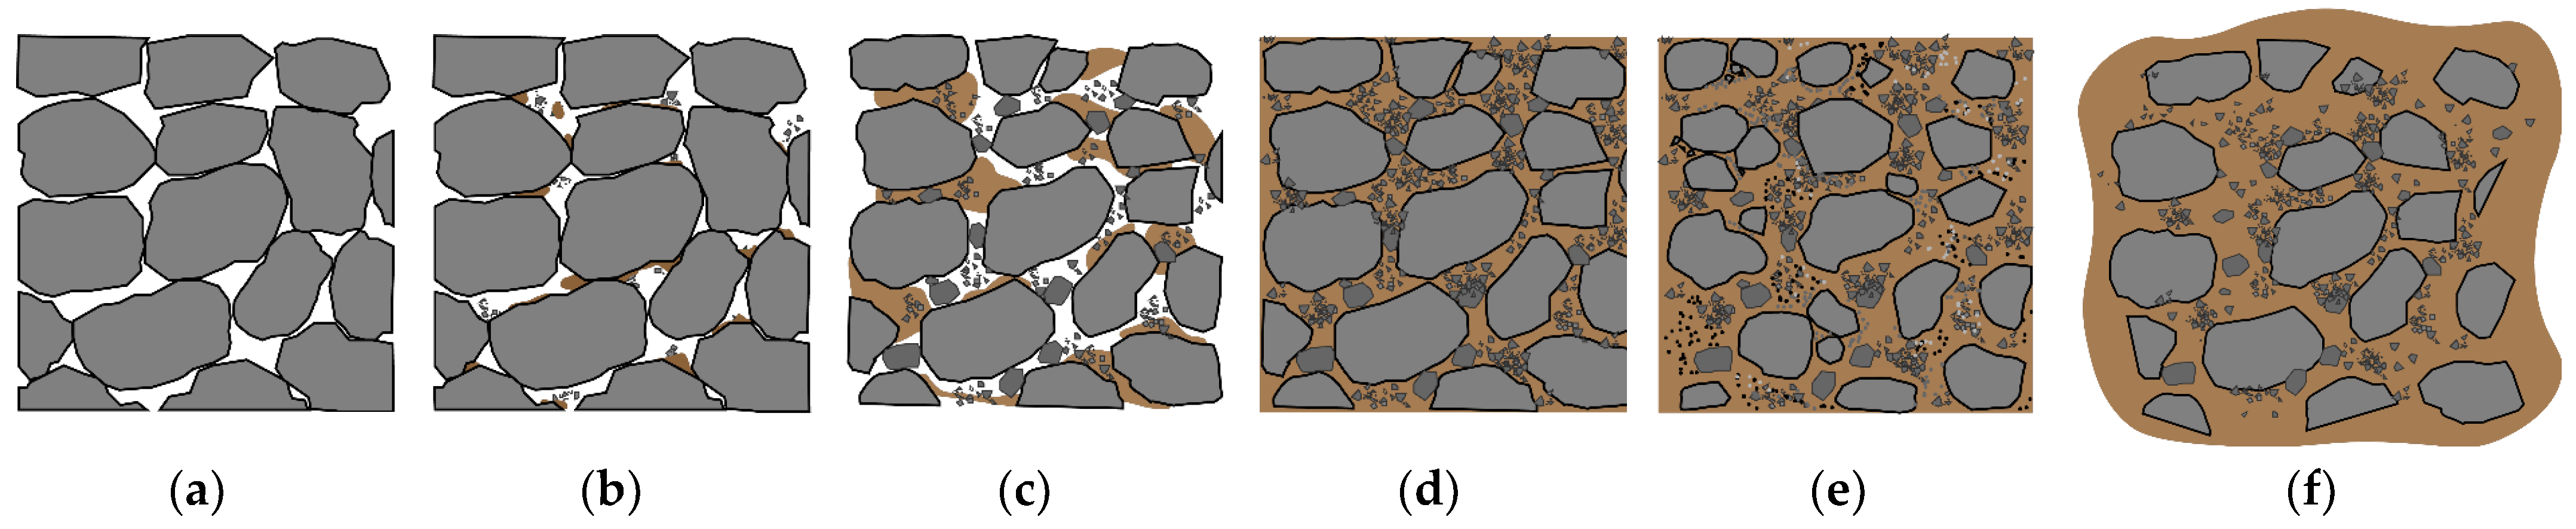
Figure 2 shows six categories of progressive ballast fouling: (a) fouling content associated with less than 5% PVC (clean, MVR < 0.5), (b) 5–20% PVC (minor fouled), (c) 20–100% PVC (severely fouled, MVR > 0.75), (d) 100% PVC (fully fouled), (e) more than 100% PVC due to heavily eroded particles (beyond fully fouled), and (f) more than 100% PVC due to slurry-induced ballast displacement (beyond fully fouled) [
6,
7]. In
Figure 2f, fouling occupies voids and can displace coarse particles outward, disrupting aggregate interlock and structural integrity. This extreme fouling condition leads to inflated values in PVC, as the volume of fouling exceeds the original void space. Together, these conditions highlight how extreme fouling can physically distort ballast structure and mislead index-based interpretations, underscoring the need to evaluate PVC and MVR jointly for accurate assessment of ballast condition.
2.3. Laboratory Sample Fabrication
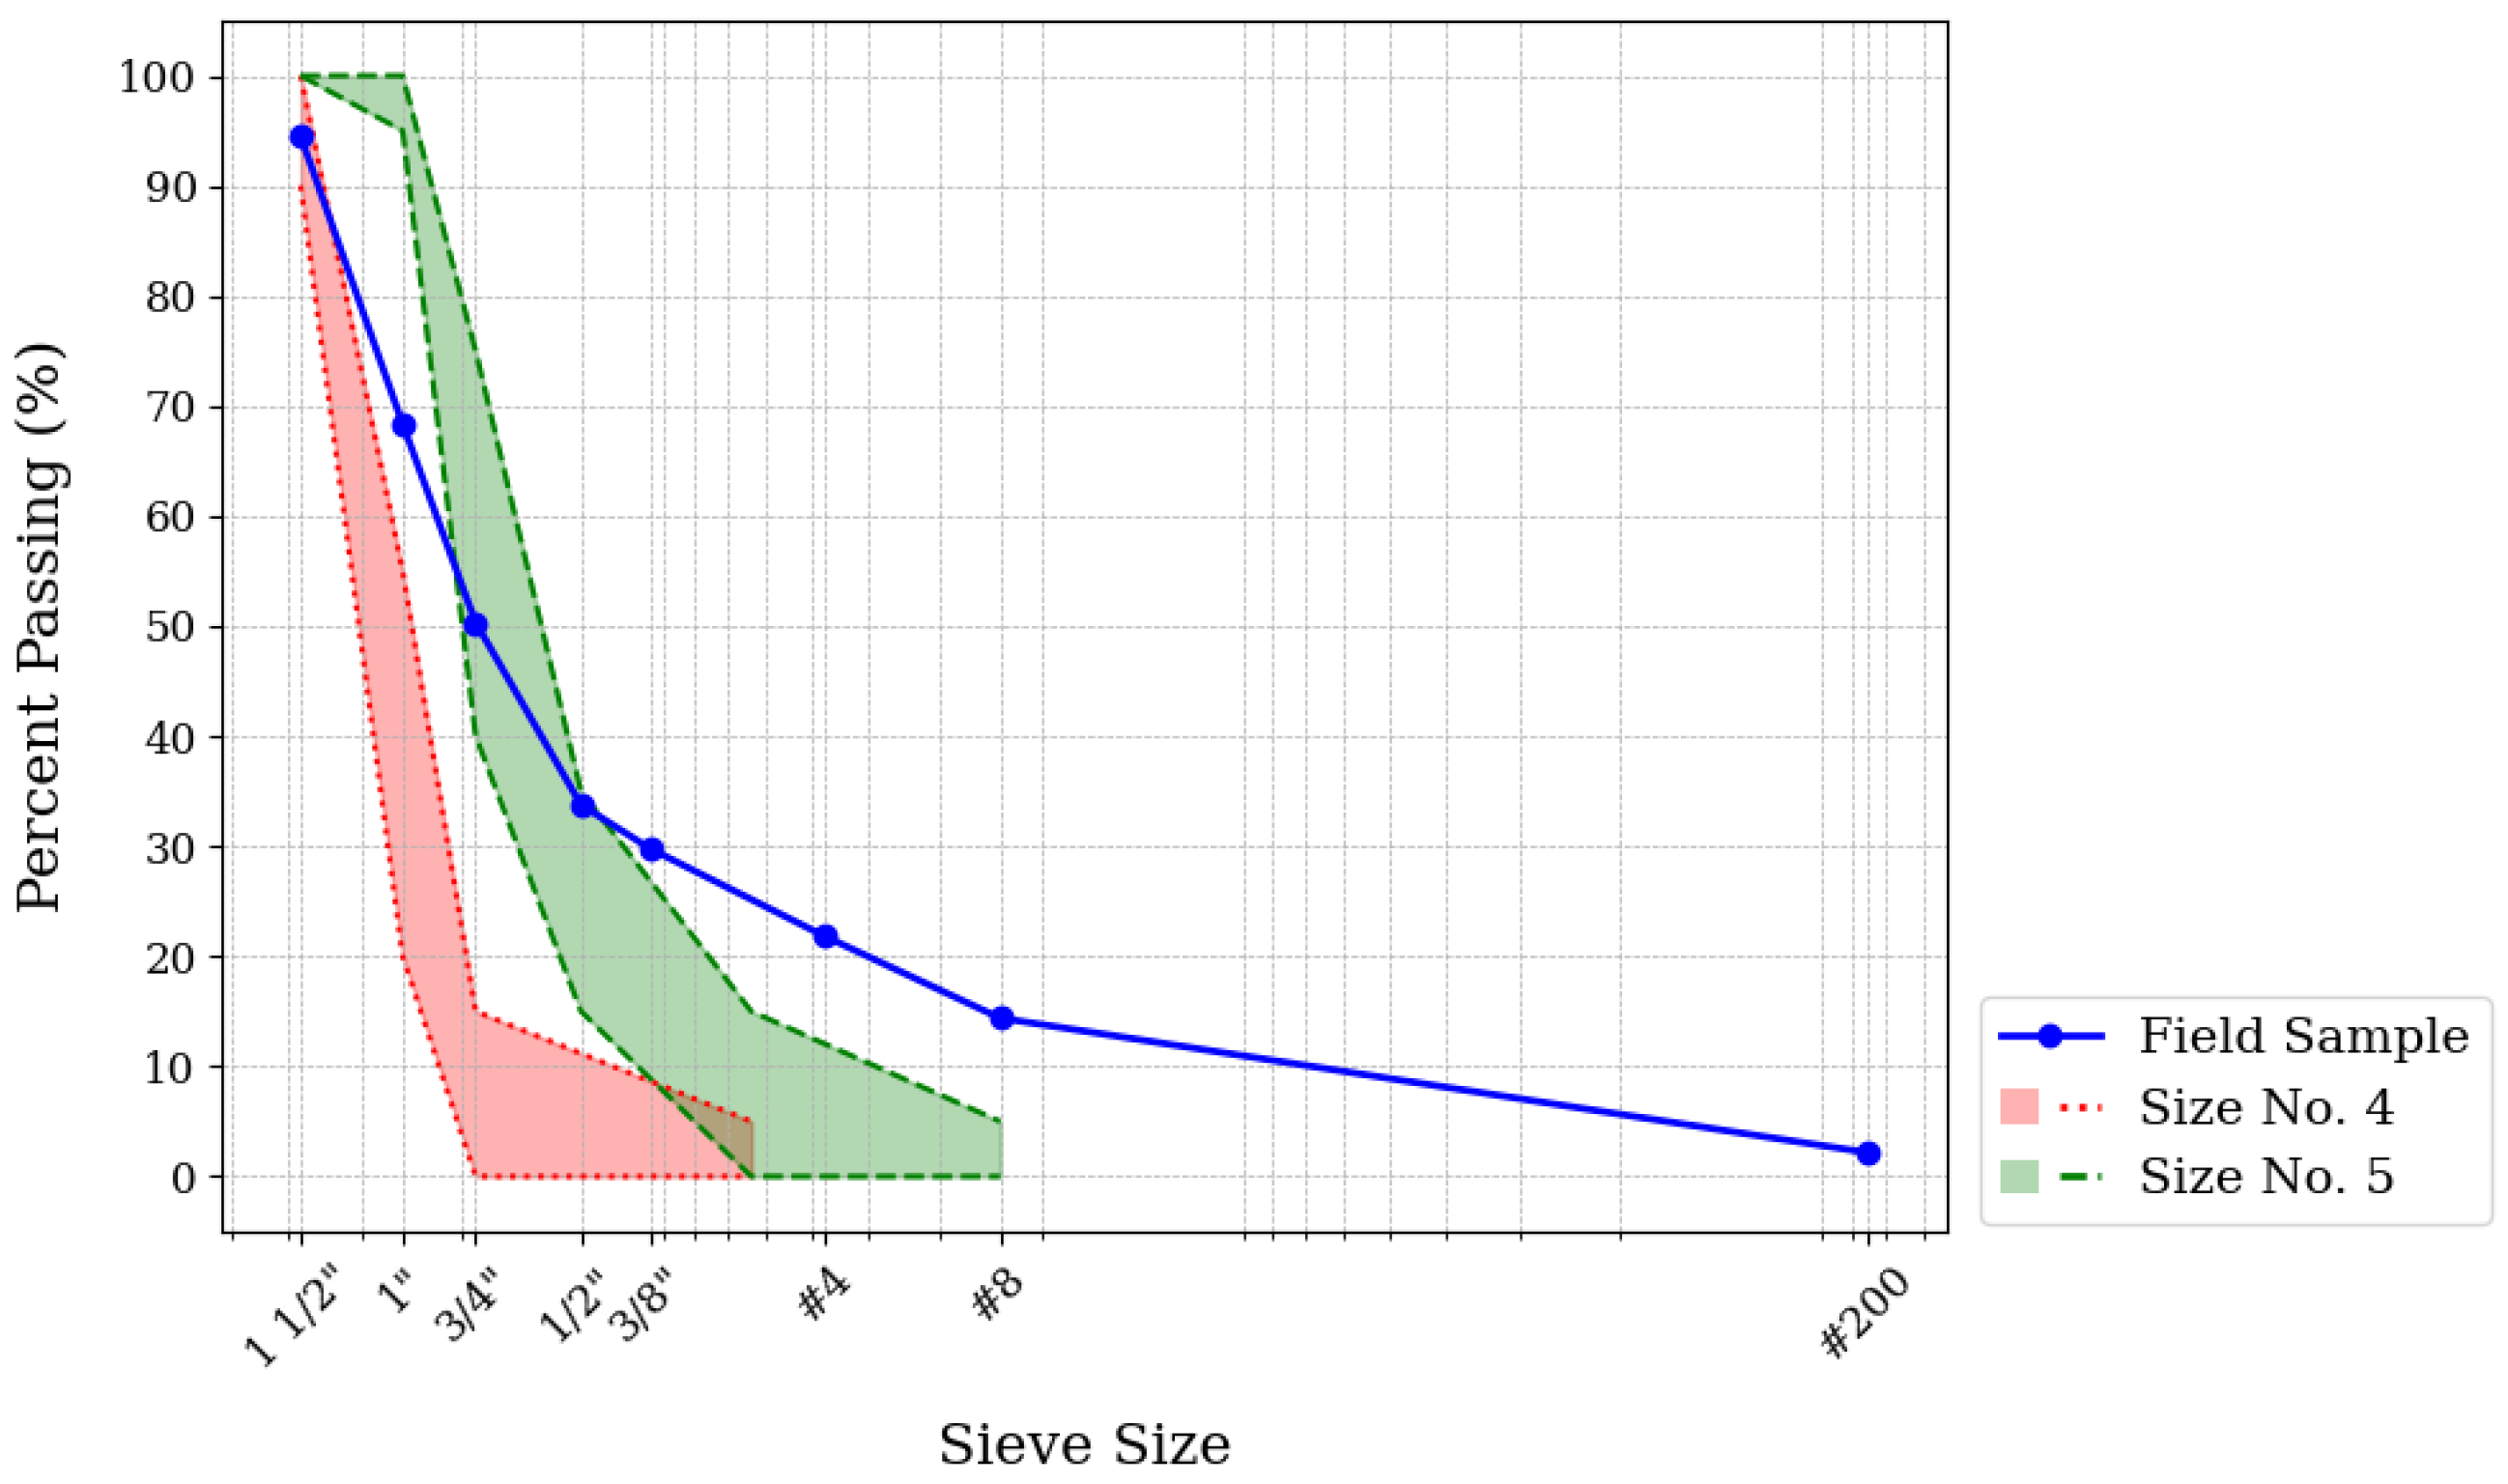
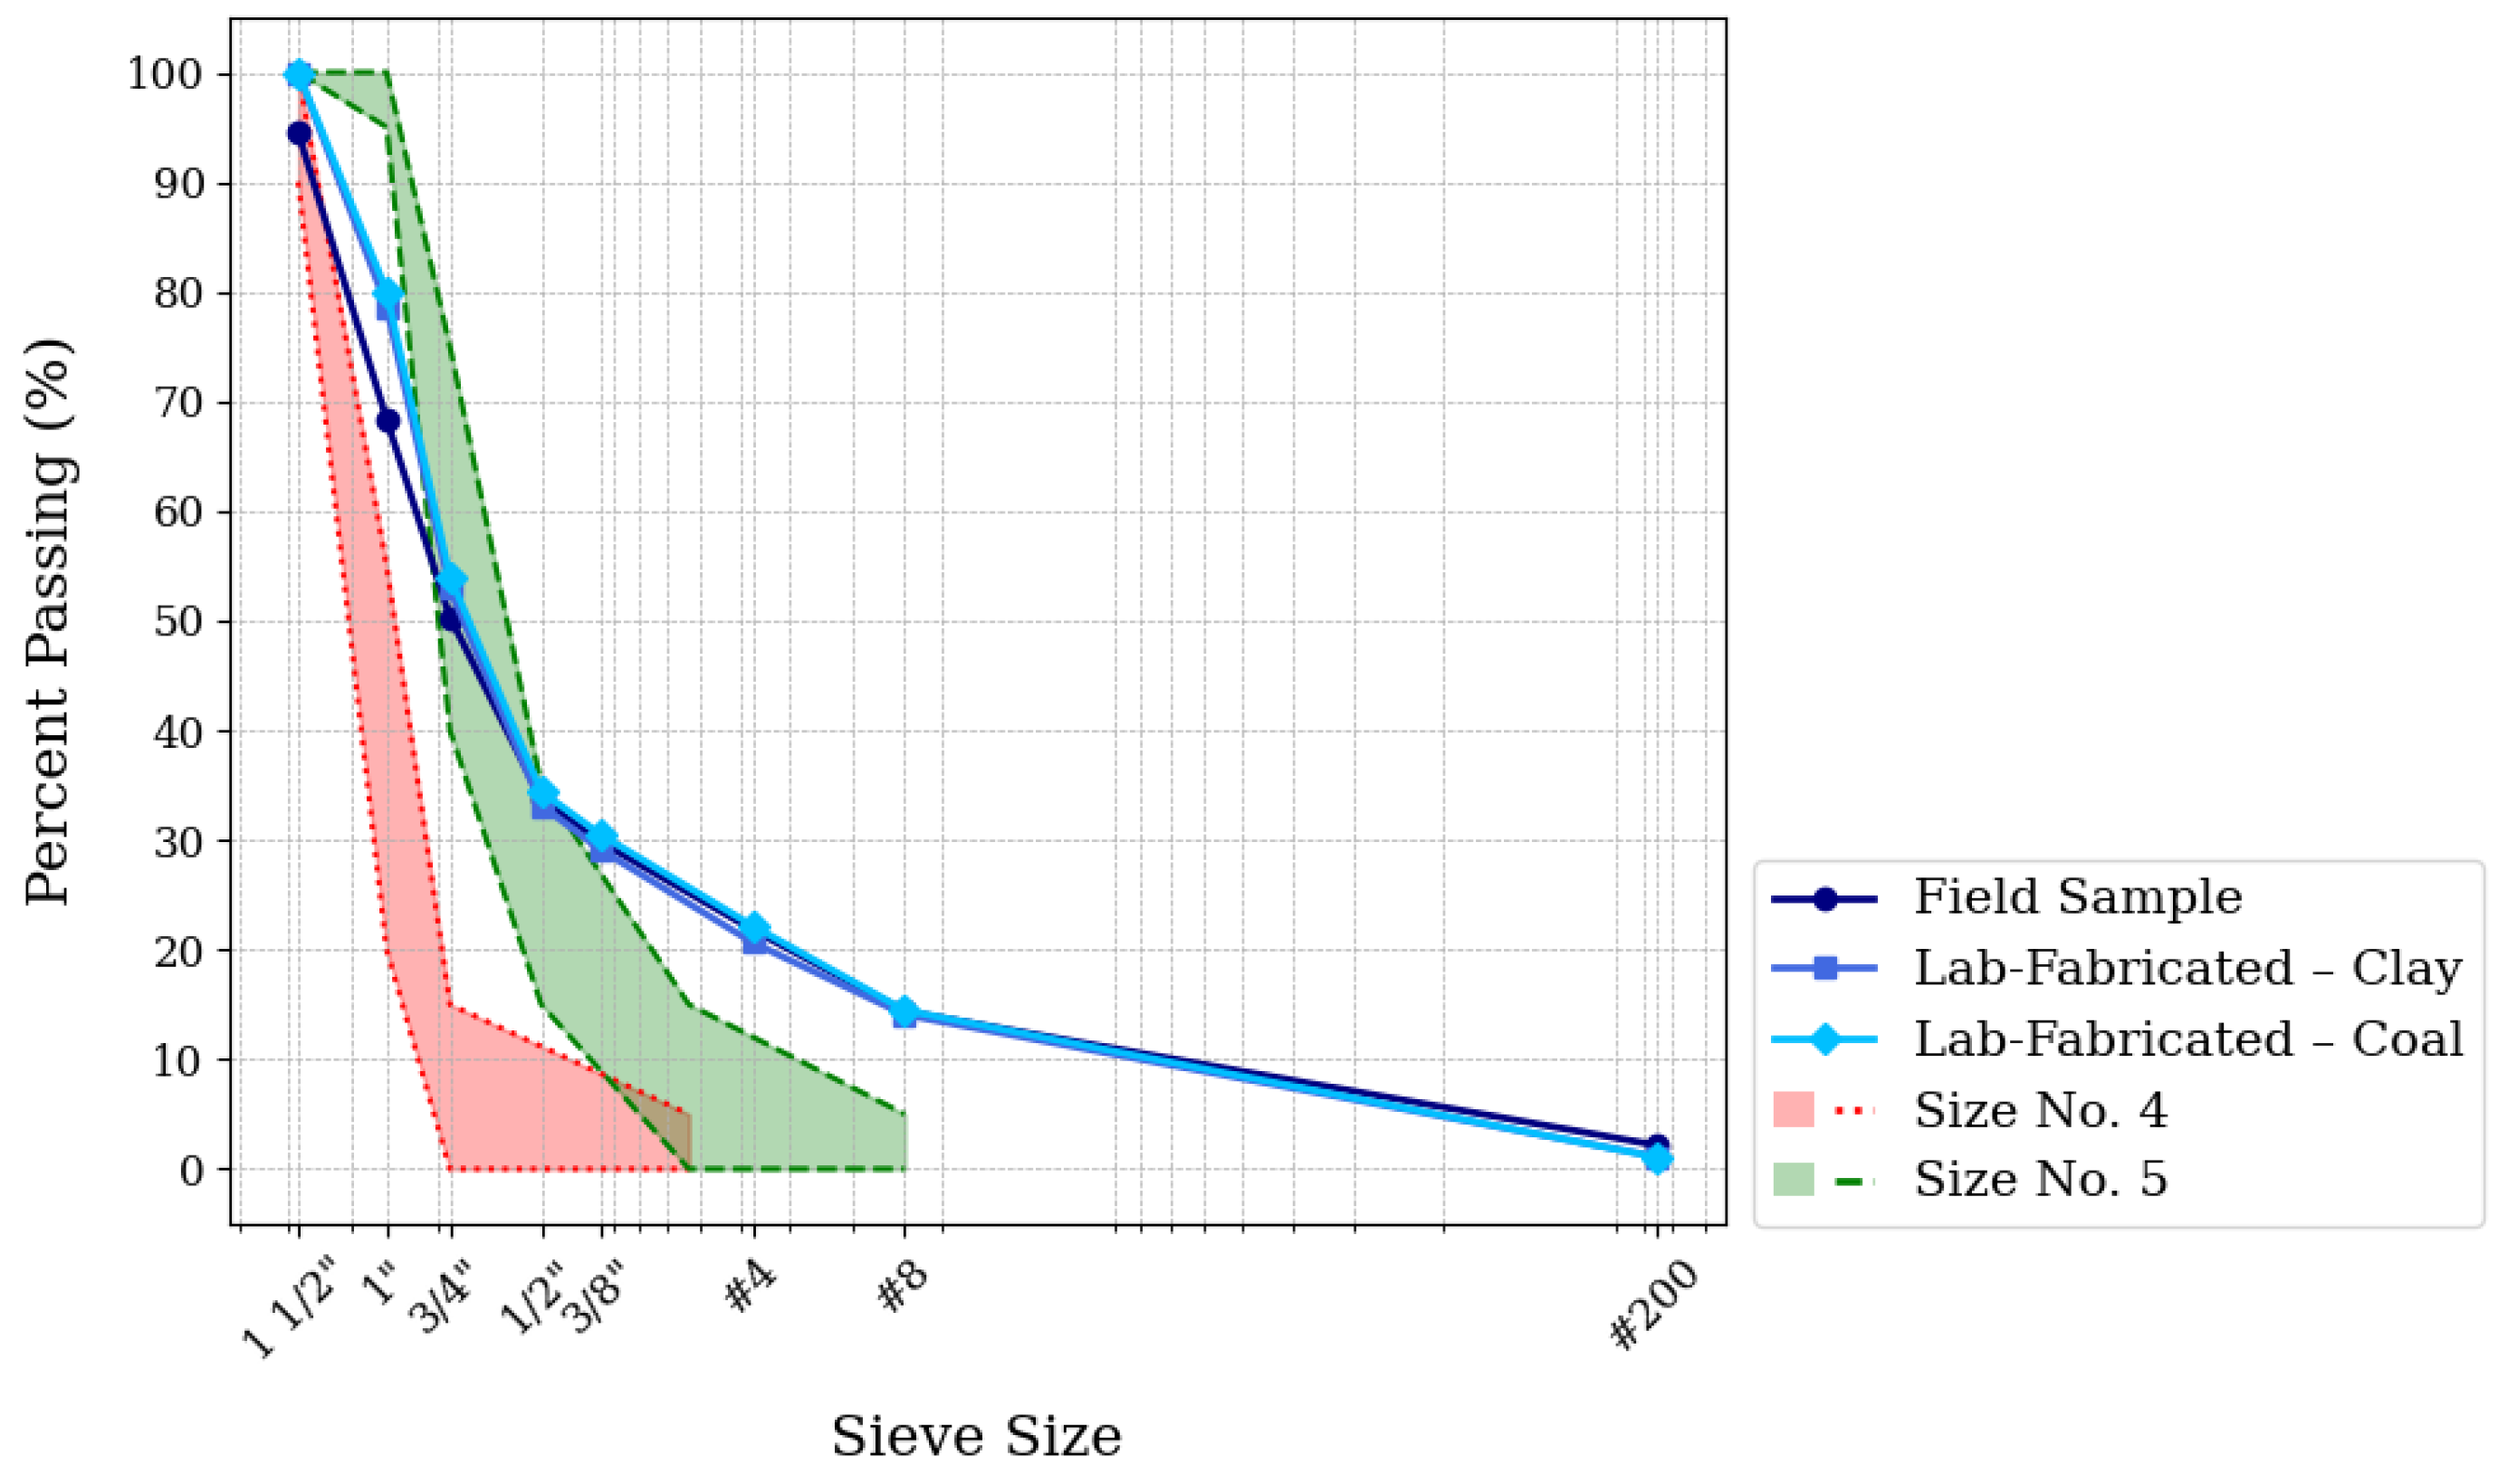
Laboratory-fabricated samples were prepared using granite aggregates matching the gradation and total mass of the field-collected ballast (around 14.17 kg). The field sieve analysis was replicated to match the particle size distribution. Clay and coal powders served as fouling agents: clay simulated subgrade intrusion and moisture retention, while coal represented surface-level fouling typical of coal transport corridors. Granite aggregates retained above the No. 200 sieve were mixed with controlled amounts of either clay or coal fines (passing the No. 200 sieve) to reproduce field-like fouling conditions. The fouled-wet laboratory mixtures were conditioned to match the moisture state of the field material during hyperspectral scanning. Each mixture was scanned in the same container as the field sample to preserve spatial consistency. Samples were prepared in three stages: fouled-wet, fouled-dry, and clean-dry by oven drying at 110 ± 5 °C for 24 h and re-sieving following ASTM C136-06 [
33]. This consistent preparation and conditioning approach ensured direct comparison between laboratory and field spectral responses.
2.4. Hyperspectral Imaging Setup
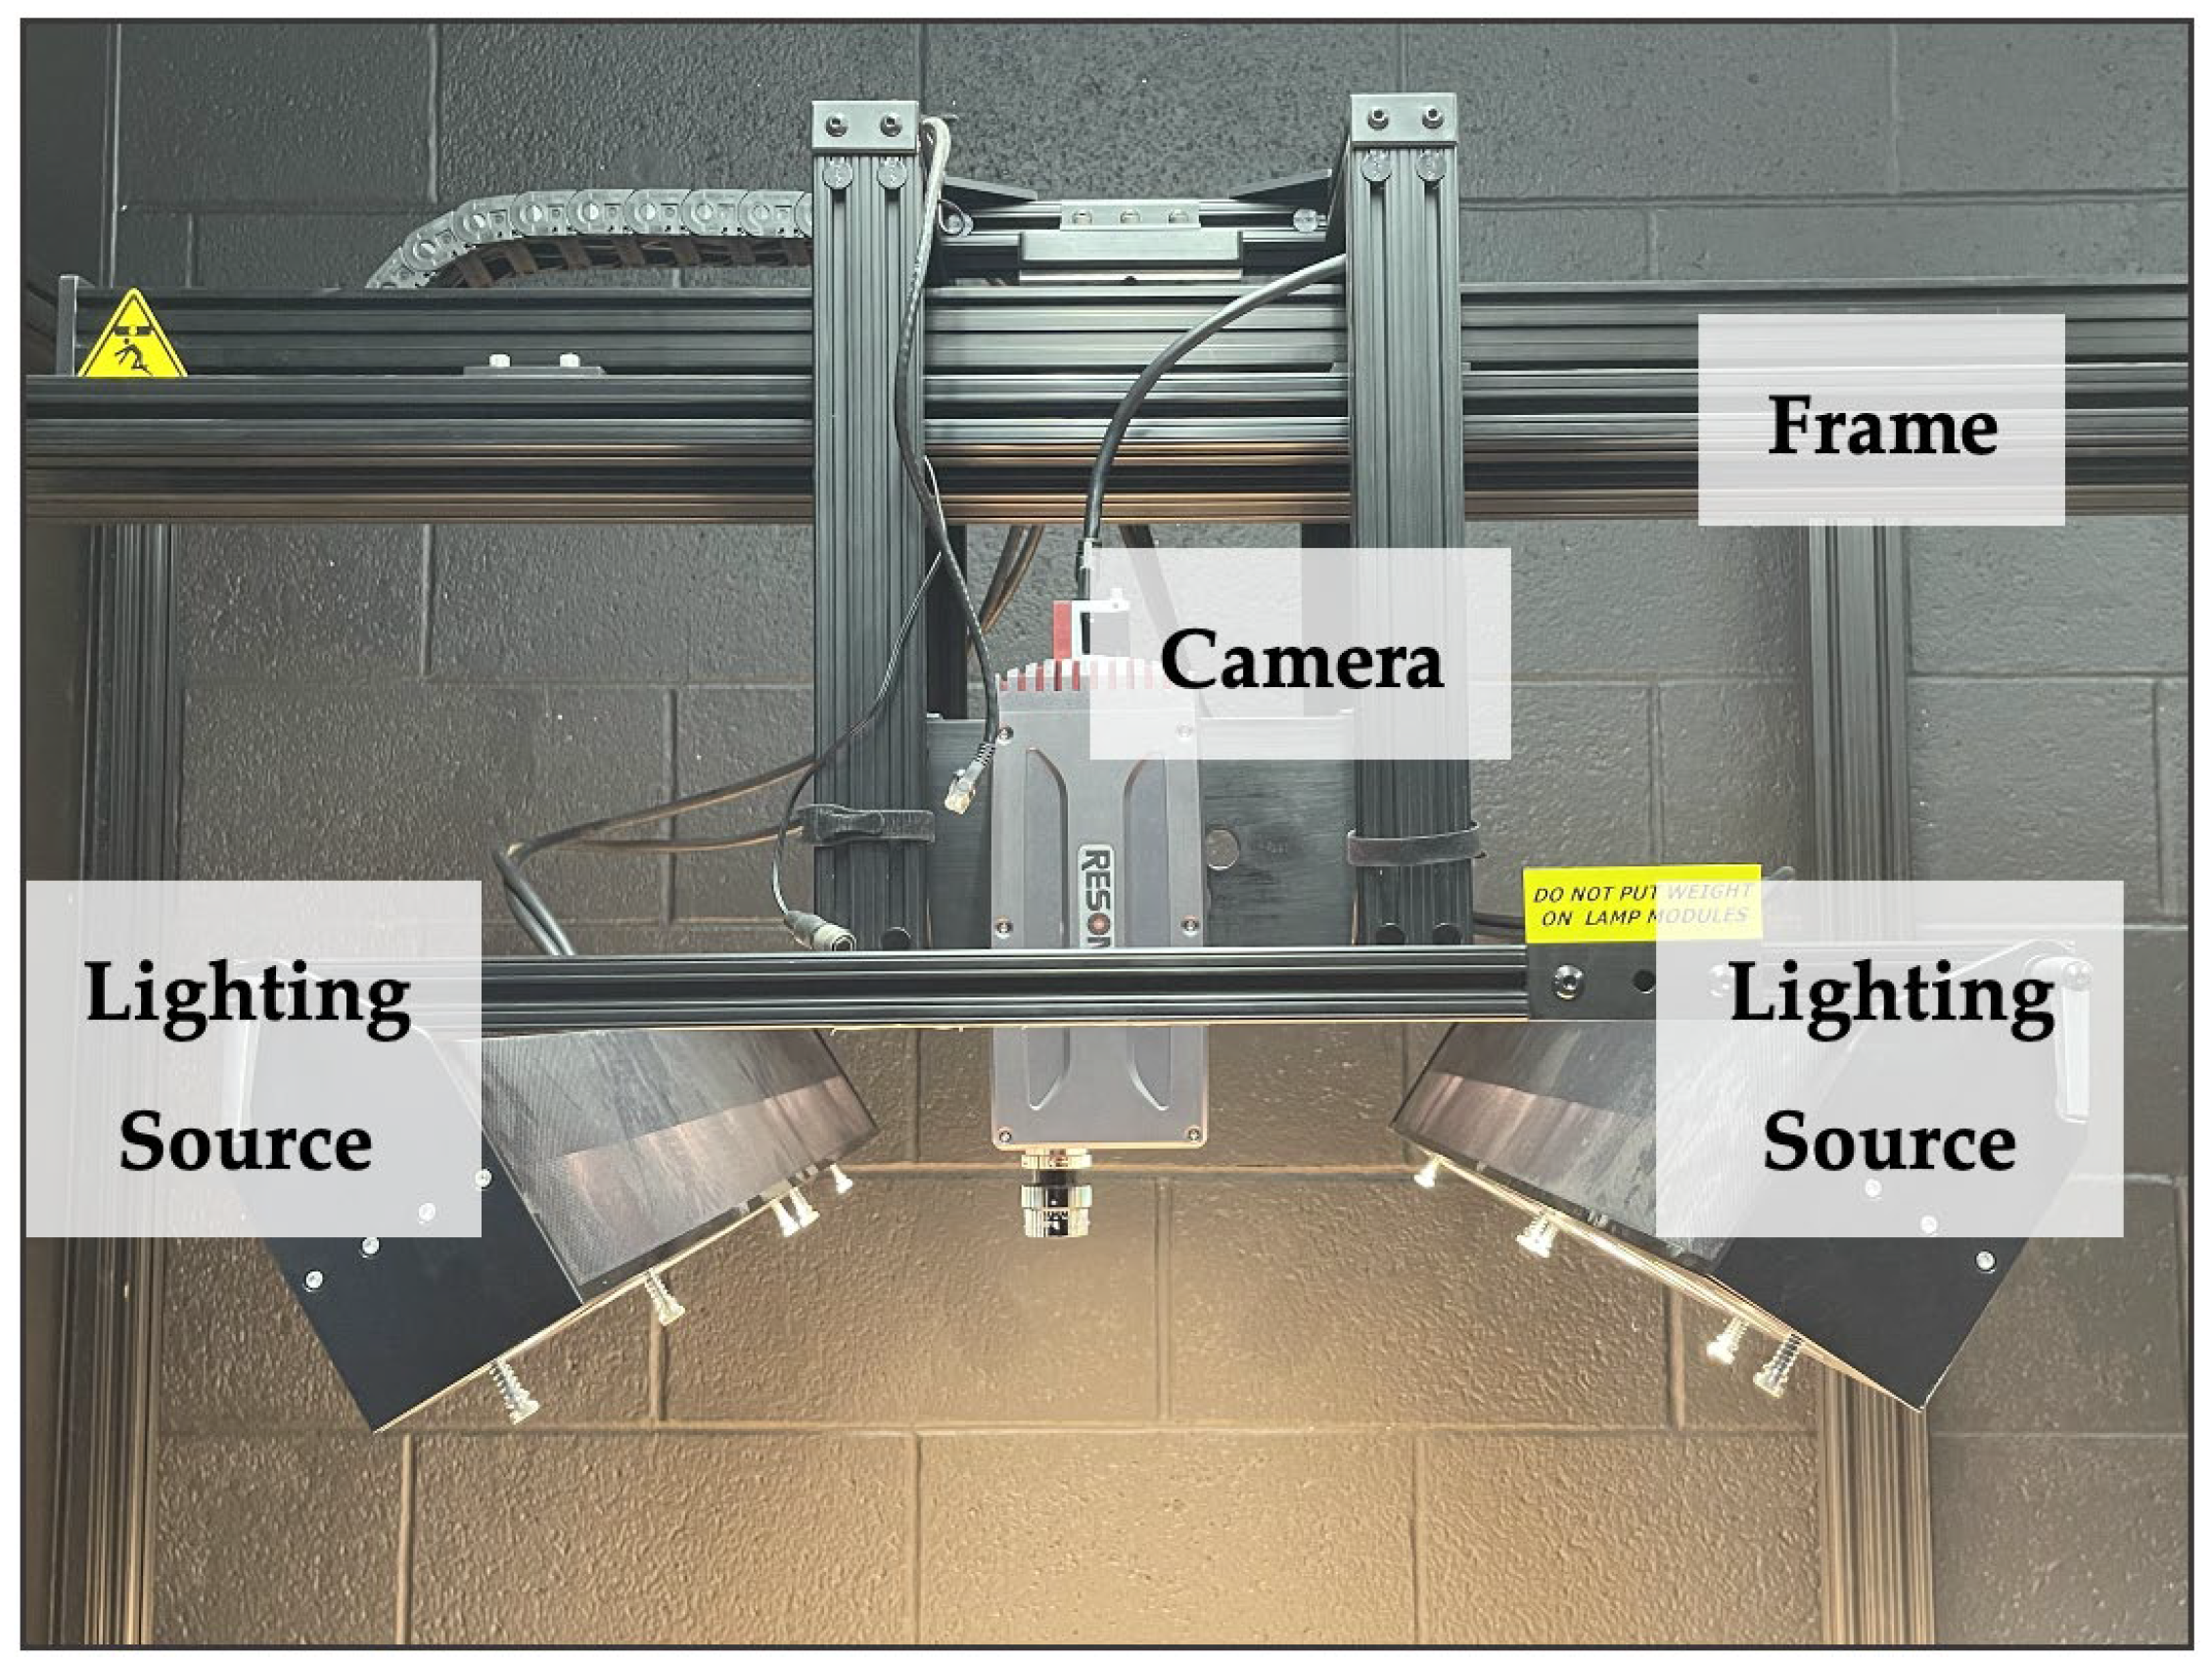
Hyperspectral data collected using an in-frame pushbroom scanning system (
Figure 3) equipped with two Resonon hyperspectral cameras: Pika XC2 and Pika IR+. The Pika XC2 covered the Visible to Near Infrared (VNIR) range of 400–1000 nm with 447 channels. The Pika IR+ captured reflectance in the Near Infrared (NIR) range of 900–1700 nm across 336 spectral channels. Both cameras operated in line-scan mode, recording high-resolution data with 640 (NIR) and 1600 (VNIR) spatial pixels, respectively. A fixed vertical distance of 55.88 cm (22 in) between the camera lenses and the sample surface ensured consistent imaging geometry. Illumination was provided by two parallel rows of halogen lamps mounted on either side of the camera assembly. These lighting units were integrated into the same frame and moved with the scanner to maintain uniform illumination across the scanning area. Elevated noise and instability near the edge wavelengths reduced signal reliability below 500 nm and above 1600 nm. Therefore, the spectral analysis was limited to 500–1000 nm for VNIR and 1000–1600 nm for NIR, where the signal-to-noise ratio remained most stable.
The selected VNIR (500–1000 nm) and NIR (1000–1600 nm) ranges are highly sensitive to surface fouling characteristics and moisture content. VNIR wavelengths capture electronic transitions of light photons upon interaction with matter. Specifically, the rough surface of the ballast causes diffuse reflection of light, which influences the formation of fouling-related color variations in ballast. The NIR range detects overtone and combination bands associated with oxygen–hydrogen molecule (O–H), carbon–hydrogen module (C–H), and water absorption features, key indicators of clay and coal-based fouling. This spectral selection is supported by prior studies on soil and mineral degradation [
17]. A derivative-based preprocessing technique was applied to enhance spectral feature discrimination under variable field conditions.
2.5. Relative Reflectance Conversion
Raw hyperspectral data were converted to relative reflectance using both dark and white references to ensure accurate reflectance measurements. The white reference was obtained by scanning a 99% reflective Teflon-coated plate, while the dark signal measurement was captured by covering the camera lens entirely to block incident light. Calibrated reflectance
was computed as Equation (5).
is the raw sample intensity; is the dark signal measurement, and is the white reference collected over the same field of view.
After relative reflectance conversion, each hyperspectral data cube was converted into a one-dimensional spectral signal by averaging reflectance values across the sample surface at each wavelength as Equation (6).
where
denotes the reflectance value at spatial location
and wavelength
,
and
denote the spatial dimensions of the hyperspectral data cube, and
denotes the spatially averaged reflectance spectrum at wavelength
. Spatial averaging preserves spectral information, which is the primary focus of this study, while removing spatial components. The resulting signal represents the mean reflectance spectrum of the scanned ballast sample, capturing material specific spectral features and minimizing the influence of surface texture and illumination variability.
2.6. Signal Preprocessing
Signal preprocessing is critical to ensure that spectral similarity metrics capture true compositional differences rather than baseline drift or measurement noise. The asymmetrically reweighted penalized least squares (arPLS) method was applied for baseline correction. This method estimates the low-frequency background component of each spectrum by solving Equation (7).
where
denotes the observed spectrum,
denotes the estimated baseline, and
denotes a diagonal weighting matrix, where
denotes the number of spectral bands. The symbol
denotes a user-defined parameter that controls the trade-off between fidelity to the data and smoothness of the baseline. The operator
denotes a second-order difference operator that penalizes curvature in the baseline.
The weighting matrix is updated iteratively to reduce the influence of spectral peaks on baseline estimation. At each iteration, the residual
, defined as
, is used to update the weights according to Equation (8).
where
and
denote the mean and standard deviation of the negative residuals, respectively, and
denotes the spectral band index. The corrected spectrum is obtained by subtracting the estimated baseline from the observed spectrum (Equation (9)):
where
denotes the spectrum after baseline correction. This correction enhances absorption-related spectral features while reducing low-frequency background variation [
36].
The iterative process continues until convergence based on a user-defined stopping criterion or a maximum number of iterations. In this study, the user-defined parameters include the smoothing parameter set to 100, the convergence ratio set to , and the maximum number of iterations set to 50, all selected based on empirical performance.
2.7. Spectral Angle Mapper
The Spectral Angle Mapper (SAM) is a widely used similarity metric in hyperspectral analysis. It measures the angle between two spectral vectors in an
n-dimensional space, where
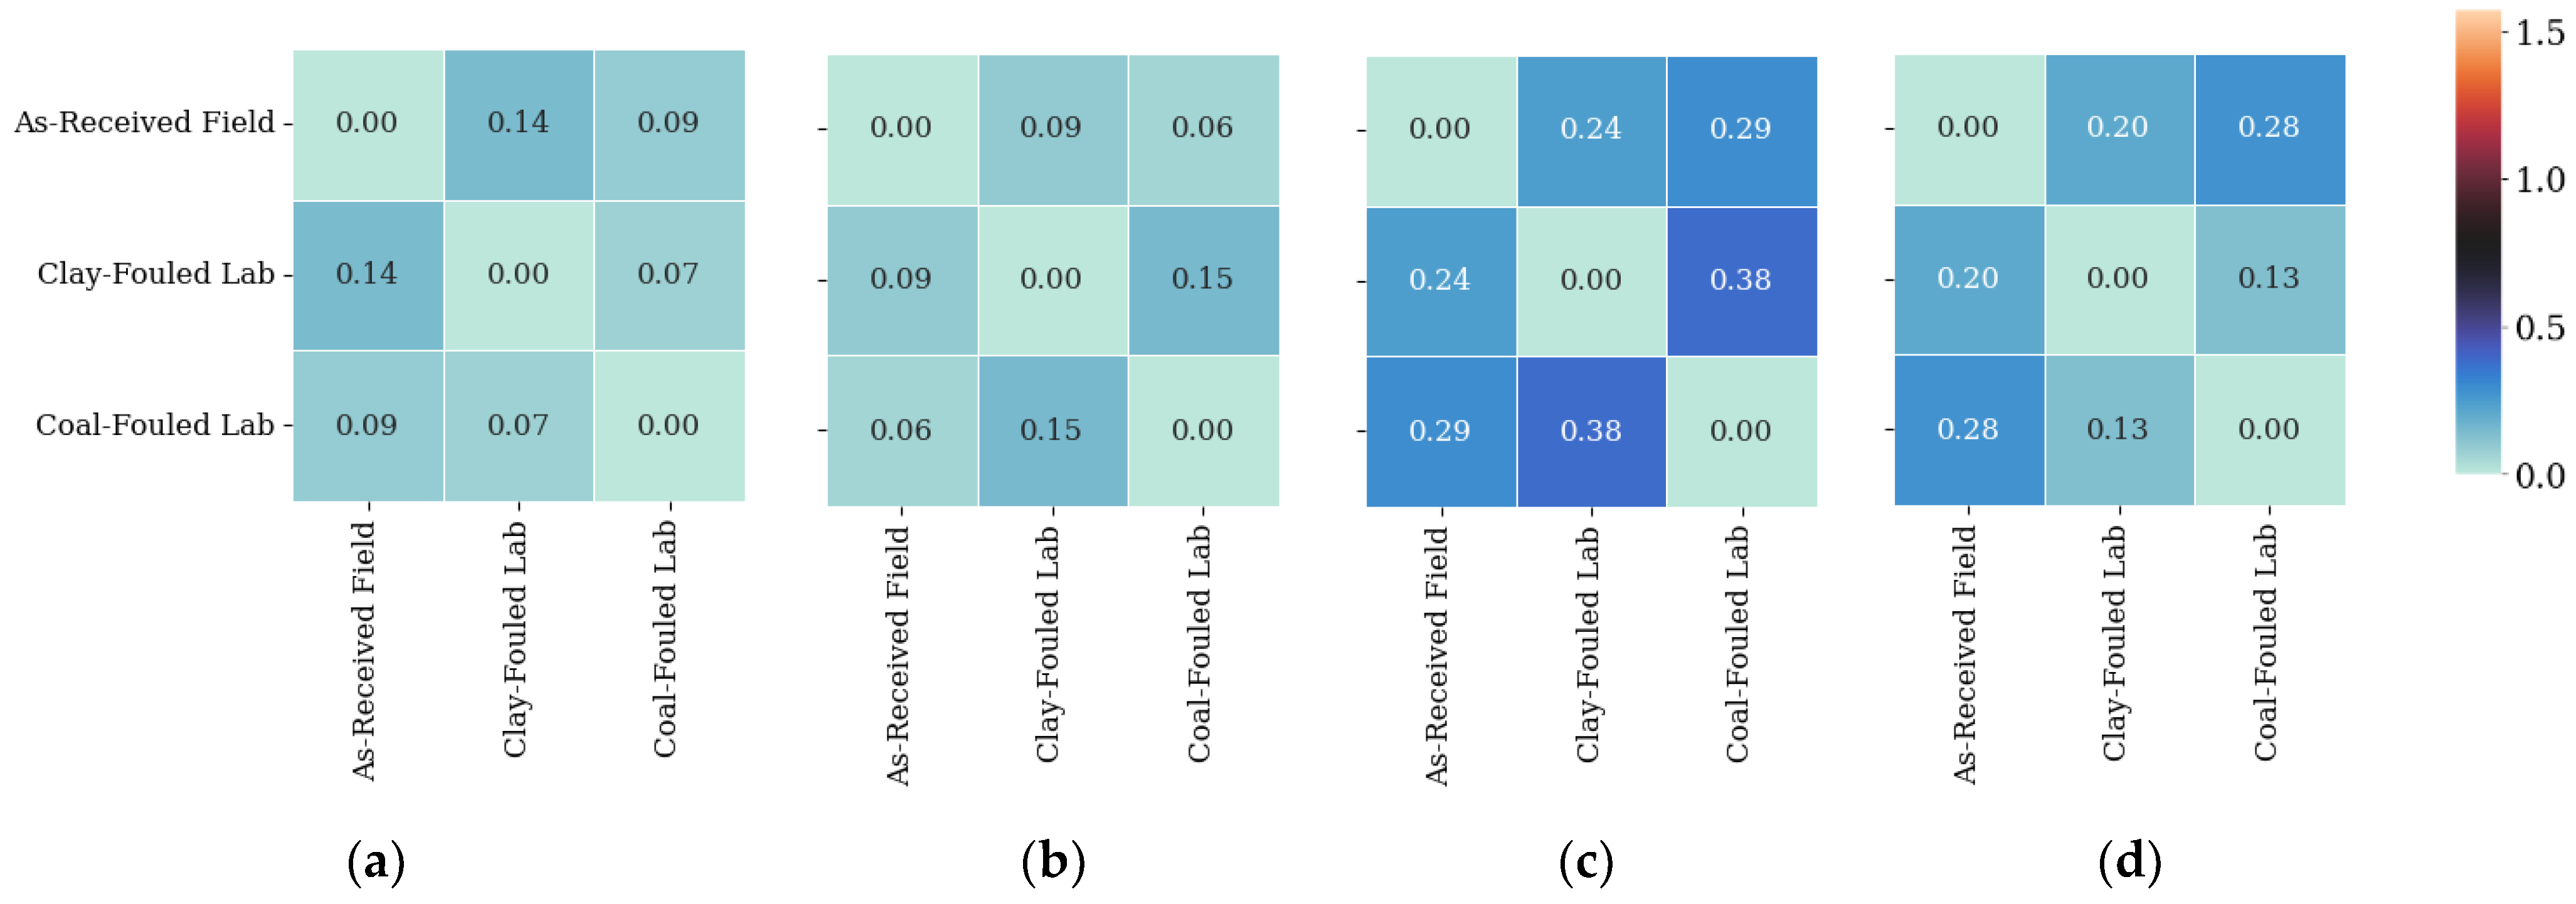
n represents the number of wavelength bands. SAM quantifies spectral similarity based on vector shape while disregarding magnitude differences, which makes it robust to variations in illumination and moisture commonly present in field-collected data. SAM analysis was performed on both raw and arPLS-corrected spectra to evaluate how preprocessing influences feature-level spectral similarity rather than assigning equal influence to all wavelengths. SAM is expressed as Equation (10).
and
are the reflectance vectors of two spectra. SAM returns an angle in radians ranging from 0 (identical spectra) to π/2 (completely dissimilar or orthogonal). Smaller angles indicate greater spectral similarity. Angles below 0.1 radians typically indicate strong similarity, whereas angles above 0.3 radians suggest significant spectral divergence or mismatch [
29,
37]. This interpretive framework supports consistent evaluation of spectral agreement between field and laboratory data.
2.8. Data Collection Repeatability
Five independent replicates were collected for each ballast condition to ensure reproducibility and statistical reliability: as-received, oven-dried, and sieved. Each replicate was independently prepared and scanned under identical drying, sieving, and imaging protocols. This ensured that observed differences in spectral reflectance were attributable to material condition rather than procedural variation. For each wavelength the mean reflectance and standard deviation were calculated across the replicates as Equations (11) and (12).
where
denotes the reflectance value at wavelength λ for the ith replicate,
denotes the mean reflectance,
denotes the standard deviation, and
is the number of replicates. Then, the 95% confidence intervals (CIs) were calculated using the standard error of the mean (SEM) as Equations (13) and (14):
Narrow bands indicate high measurement consistency while wider bands may reflect increased variability due to moisture content and fouling distribution. This statistical approach ensured robustness of spectral measurements and supported confidence in subsequent analyses, such as similarity metrics.
The Coefficient of Variation (CoV) was also computed to assess relative variability in reflectance magnitude across replicates as Equation (15).
Low CoV values (less than 2%) indicated excellent reproducibility of spectral signatures across replicates, further supporting the precision and reliability of hyperspectral measurements.
4. Discussion
4.1. Interpretation of Ballast Condition
The geotechnical results indicate that the sampled ballast represents an advanced fouling condition because gradation shifts, high fines content, and elevated fouling indices consistently reflected degradation of the load-bearing structure. The increase in fine particles reduces void space and restricts drainage, while elevated fines moisture promotes interparticle lubrication and loss of shear resistance under cyclic loading. These combined effects increase susceptibility to deformation and track instability. This behavior aligns with known degradation mechanisms in heavily fouled ballast systems. Track failure typically results from multiple interacting factors, including geometry, maintenance condition, and vehicle–track interaction. Therefore, the observed ballast condition should not be interpreted as the sole cause of the derailment event.
4.2. Spectral Response and Field–Laboratory Consistency
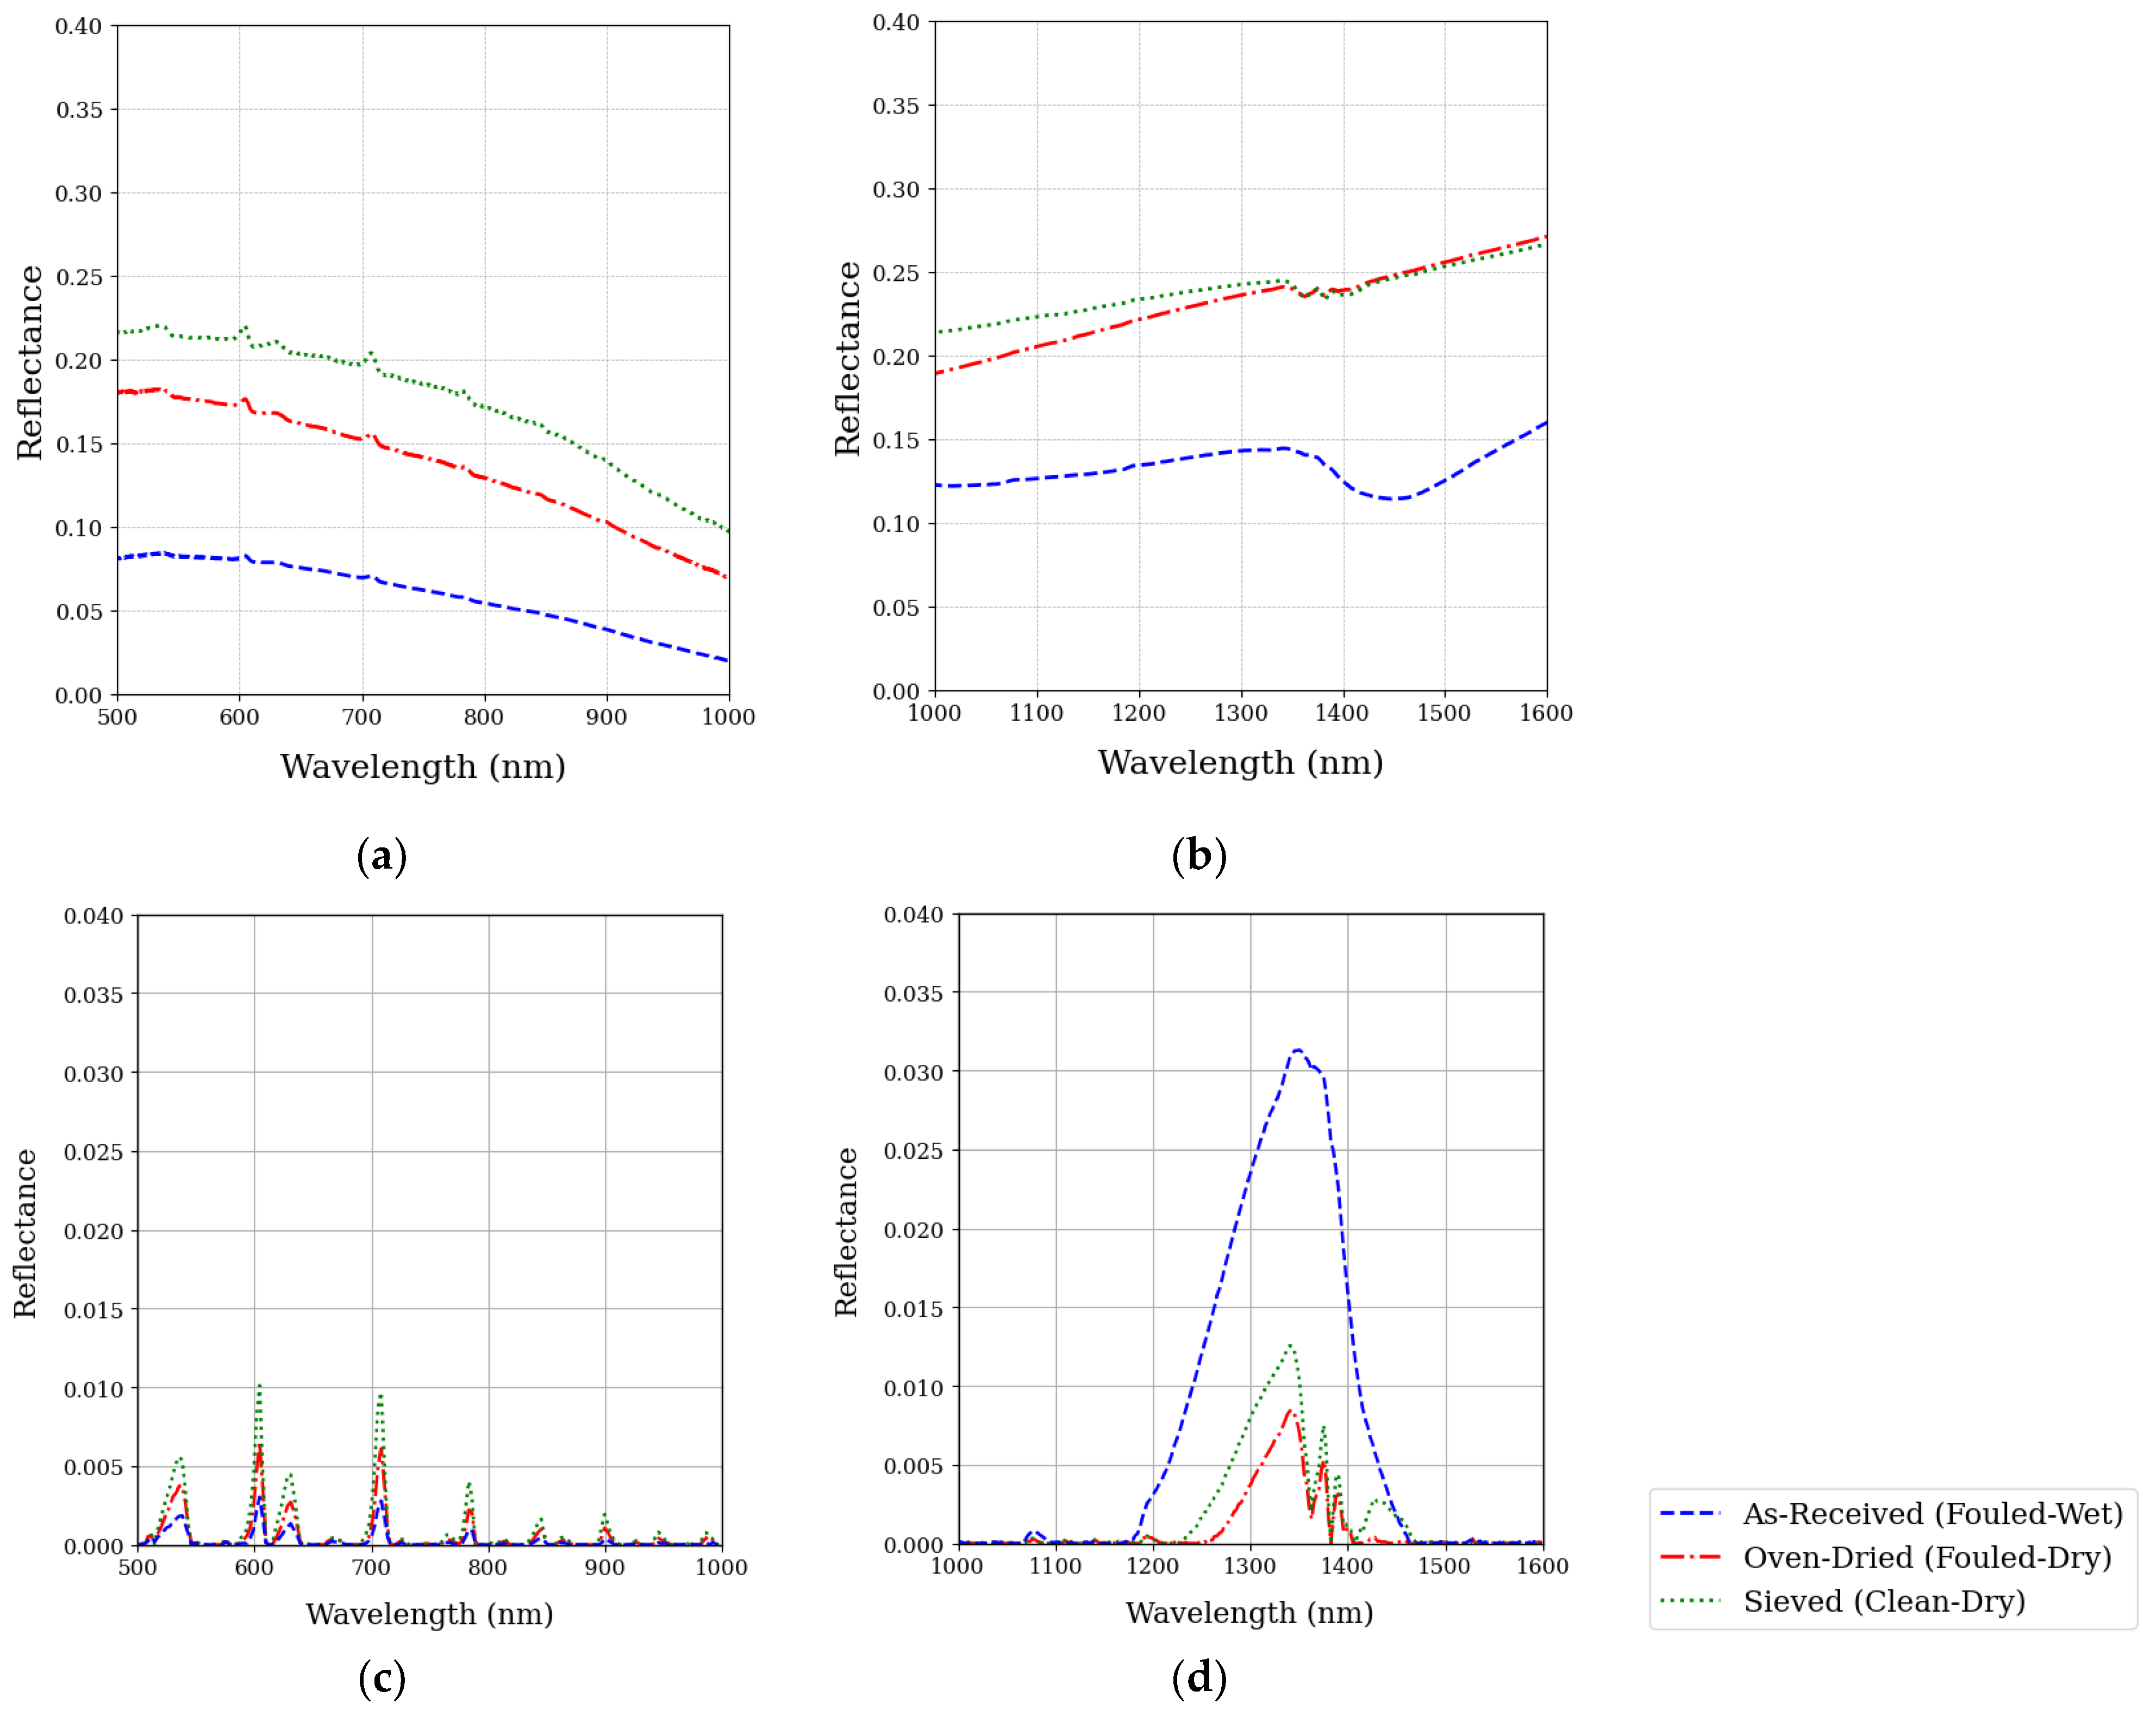
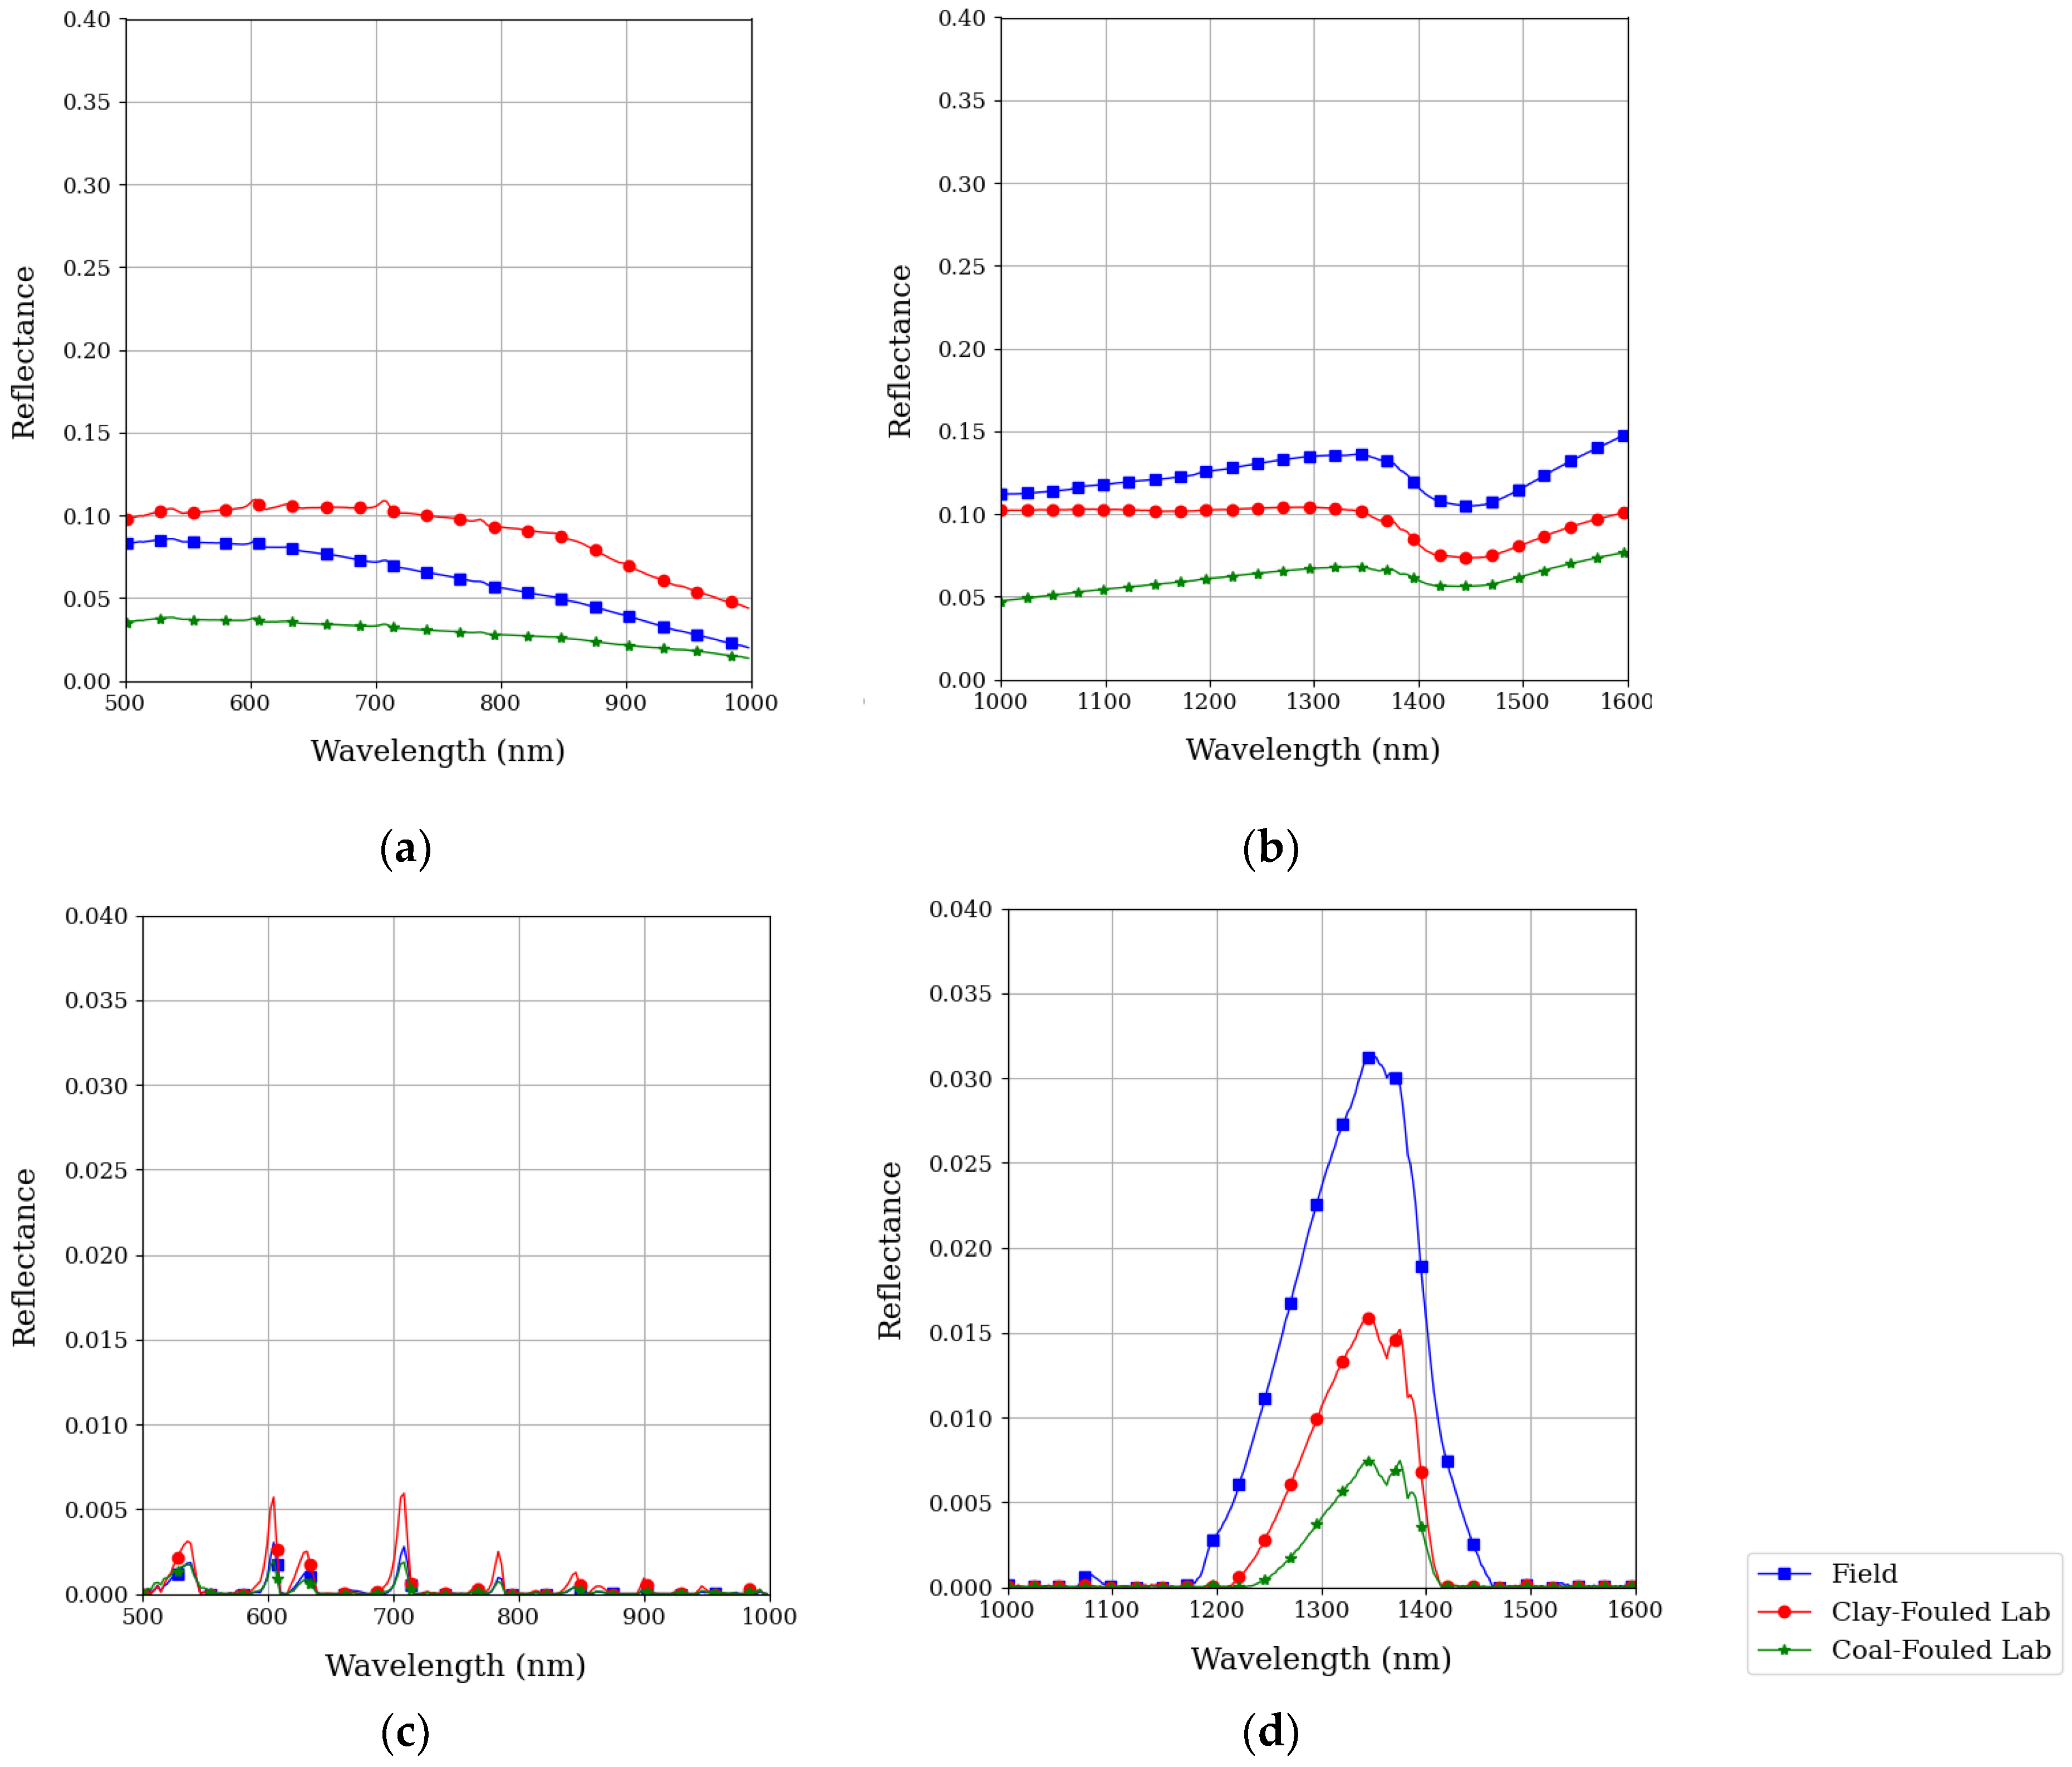
The spectral results demonstrate that hyperspectral reflectance responds consistently to both fouling and moisture because absorption and scattering mechanisms depend on fines content and water presence. The progressive increase in reflectance from fouled-wet to clean-dry conditions reflects reduced absorption and improved scattering from cleaner aggregate surfaces, while the pronounced absorption feature near 1400 nm confirms sensitivity to moisture through O–H bonding. Flatter spectral gradients in fouled conditions indicate increased surface heterogeneity and fine material coverage, which modifies reflectance behavior across both VNIR and NIR ranges. Spectral discrimination depends on both absorption behavior and non-selective scattering effects. Surface roughness, particle size, and composition control reflectance variation. Spatial averaging reduces variability across heterogeneous surfaces. This process stabilizes the spectral signal without removing scattering effects.
Baseline correction improved discrimination between ballast states by removing low-frequency distortion and emphasizes absorption-related features, which underlying spectral structure. The stronger separation observed in the NIR range compared to the VNIR range indicates that NIR wavelengths capture moisture-related spectral changes more effectively, while VNIR shows lower sensitivity under the tested conditions. This behavior indicates that moisture-related absorption dominates spectral variability under heavily fouled conditions. This behavior indicates that water is both a direct spectral contributor through O–H absorption and an indirect indicator of fouling as retained moisture accumulates within voids filled by fines and reflects impaired drainage conditions. As fouling progresses, fine particles increase water retention and modify light scattering and absorption, which amplifies spectral differences in the NIR region. Therefore, the presence of moisture projects the presence and severity of fouling in the spectral signal, even when fines are not directly isolated. SAM-based separation thus demonstrates that spectral shape captures both moisture-driven absorption and fouling-related structural changes, providing a robust indicator of ballast condition.
The comparison between field and laboratory samples indicated that controlled mixtures reproduce dominant spectral behavior while simplifying compositional variability. Field samples remain more compositionally complex due to mixed contamination sources and environmental exposure. Baseline-corrected spectra provide the most reliable comparison by reducing intensity offsets and emphasizing shape-based similarity, while the closer agreement with clay-fouled mixtures suggests that mineral-based fines better represent field contamination compared to coal-based mixtures.
4.3. Practical Implications, Limitations, and Future Directions
The results indicate that hyperspectral imaging can detect ballast fouling and moisture at the surface without direct contact, which supports its use for non-contact railroad track condition assessment; however, the current study is based on a single extreme fouling case and a limited number of field samples, which limits generalization across different fouling severities. In addition, the samples were scanned after transport and subsequent laboratory processing including oven drying and sieving. This processing may alter natural moisture distribution and packing conditions relative to in situ measurements, which introduces uncertainty in representing undisturbed field conditions, particularly because drying removes moisture-driven absorption features and sieving alters fines distribution that influences surface reflectance. Localized evaporation and pore moisture migration during transport, storage, and laboratory handling may further influence spectral behavior.
The controlled laboratory environment represents simplified conditions relative to field variability associated with changing illumination, environmental exposure, and operational railroad conditions. Practical implementation for large-scale railroad infrastructure requires integration with mobile platforms, such as vehicle-mounted or unmanned aerial systems, to enable continuous data acquisition across extended track networks.
The surface-based nature of hyperspectral sensing limits direct assessment of deeper ballast layers, particularly in thick ballast beds; however, surface condition monitoring remains critical because fouling, moisture retention, and particle degradation progressively alter the exposed ballast layer and reduce drainage and load transfer. Field deployment must also address variable illumination conditions, which can be mitigated through relative reflectance normalization using white reference panel measurements, or ratio-based spectral indices that reduce sensitivity to intensity variation. In addition, spatial variability within field ballast, including heterogeneous fouling distribution and localized moisture accumulation, may influence spectral consistency across larger track segments.
Future work should include ballast samples spanning clean, moderately fouled, and heavily fouled conditions to establish broader applicability and evaluate spectral consistency across contamination levels. In situ hyperspectral measurements using portable or vehicle-mounted systems should be conducted to capture undisturbed conditions and reduce handling effects, while laboratory mixtures should be expanded to include mixed-source contamination to better represent real-world fouling. Future studies should also develop laboratory mixtures with controlled FI, PVC, and MVR values and establish regression relationships between these parameters and spectral response to enable quantitative prediction of ballast condition in field applications. Additional studies should evaluate illumination variability, seasonal effects, and temporal changes in spectral response, and incorporate spatial analysis of hyperspectral data cubes to enable mapping of fouling distribution using pixel-level methods such as spectral unmixing and data-driven classification.
5. Conclusions
This study evaluates hyperspectral imaging (HSI) as a non-contact method for assessing railroad ballast fouling using a field sample collected from a derailment site and compared with laboratory-fabricated mixtures. Geotechnical characterization confirms severe ballast degradation, with a Fouling Index (FI) of 24.53%, Percentage Void Contamination (PVC) of 195.4%, and Macro Void Ratio (MVR) of 2.87, which collectively indicate substantial loss of void structure, reduced drainage capacity, and near-saturated conditions within the fines fraction. These conditions provide a physically grounded baseline for interpreting spectral behavior under extreme fouling.
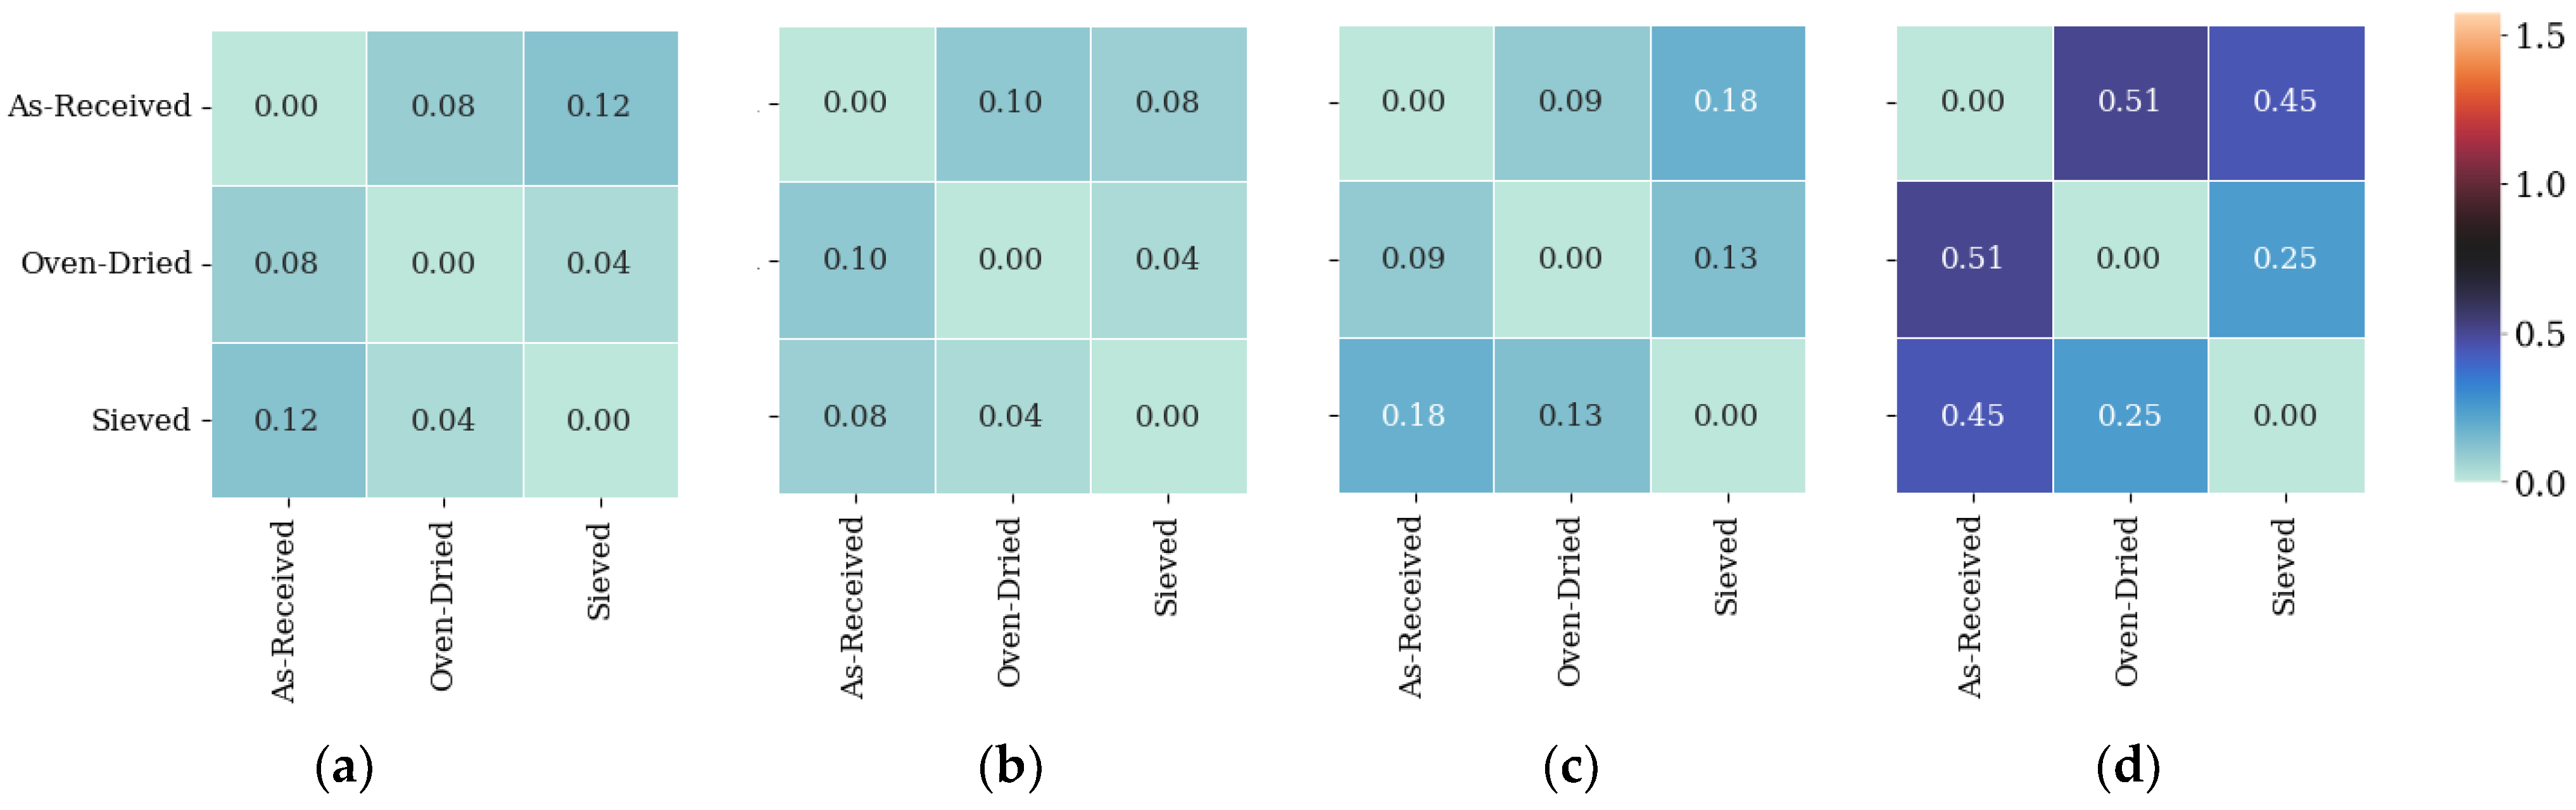
HSI reflectance measurements show low variability and repeatable spectral responses across ballast conditions, with Coefficient of Variation (CoV) values below 2% and narrow confidence intervals across the Visible–Near Infrared (VNIR) and Near Infrared (NIR) ranges. Reflectance increases from fouled-wet to clean-dry conditions, while a pronounced absorption feature near 1400 nm indicates strong sensitivity to moisture. Baseline correction enhances spectral discrimination by reducing low-frequency distortion and emphasizing absorption-related features, and Spectral Angle Mapper (SAM) analysis shows a maximum separation of 0.51 radians between fouled-wet and fouled-dry states, which confirms that moisture produces the dominant spectral contrast.
Comparison between field and laboratory samples shows that controlled mixtures reproduce dominant spectral trends while simplifying compositional variability. The agreement in spectral shape, particularly after baseline correction, supports the use of laboratory-fabricated mixtures for controlled analysis and model development, although field samples exhibit additional variability due to mixed contamination sources and environmental effects. These differences indicate that laboratory mixtures provide a simplified but useful representation of field fouling behavior.
The results demonstrate that HSI can distinguish ballast fouling and moisture at the surface under severe degradation conditions, which supports its potential for non-contact railroad track condition assessment. However, the method is limited to surface characterization and does not directly capture subsurface fouling conditions, and the present findings are based on a single extreme case, which limits generalization across fouling levels. Future work should include in situ measurements, broader fouling conditions, and integration with complementary techniques to enable comprehensive field-scale assessment of ballast conditions.