Article

An Absorption-Based Bio-Optical Framework for Phytoplankton Size Class Retrieval in the Arabian Sea


by
R. Chandrasekhar Naik
1,2,
Aneesh A. Lotliker
2,*,
Sudarsana Rao Pandi
3,
Joaquim I. Goes
4,
Rupam Kalita
2,
Sanjiba Kumar Baliarsingh
2 and
Alakes Samanta
2
1
KUFOS-INCOIS Joint Research Centre, Kerala University of Fisheries and Ocean Studies (KUFOS), Panangad 682506, Kerala, India
2
Indian National Centre for Ocean Information Service (INCOIS), Ministry of Earth Sciences, Hyderabad 500090, Telangana, India
3
National Centre for Polar and Ocean Research (NCPOR), Ministry of Earth Sciences, Vasco-da-Gama 403804, Goa, India
4
Lamont-Doherty Earth Observatory (LDEO), Columbia University, Palisades, NY 10964, USA
*
Author to whom correspondence should be addressed.
Remote Sens. 2026, 18(10), 1451; https://doi.org/10.3390/rs18101451
Submission received: 1 February 2026 / Revised: 12 March 2026 / Accepted: 18 March 2026 / Published: 7 May 2026
(This article belongs to the Section Biogeosciences Remote Sensing)

Highlights

What are the main findings?
  • A regionally tuned absorption-based model was developed to estimate phytoplankton size classes (PSCs) in the Arabian Sea.
  • The aph(443)-S443–510 relationship clearly distinguishes pico-, nano-, and micro-phytoplankton in this region.
  • Satellite PSC maps reveal strong regional contrasts across the Arabian Sea.
What are the implications of the main findings?
  • The absorption-based PSC model shows better agreement with in-situ HPLC-derived PSC classifications.
  • Application of the in situ-derived aph-based PSC model to VIIRS aph(443) products reveals synoptic-scale spatial and seasonal variability in phytoplankton size structure.
  • Absorption-based PSC models provide a cost-effective satellite framework for monitoring phytoplankton community shifts and ecosystem dynamics.

Abstract

Phytoplankton size classes (PSCs) fundamentally regulate ocean productivity, biogeochemical cycling, and carbon export, yet their distribution and optical variability across the Arabian Sea remain poorly constrained. This study develops and validates a regionally tuned absorption-based approach for phytoplankton size class estimation using in situ phytoplankton absorption spectra (aph(λ)) collected during six research cruises between 2016 and 2024. A significant power-law relationship between aph(443) and the spectral slope (S443–510) (R2 = 0.963, p < 0.001) provided a consistent optical basis for distinguishing PSCs. Co-located HPLC pigment data were used to derive empirical aph(443) thresholds for pico- (≤0.011 m−1), nano- (0.011–0.059 m−1), and micro-phytoplankton (>0.059 m−1). Class-specific mean spectra showed clear optical distinctions consistent with size-dependent pigment packaging. Model evaluation showed reduced error and improved regression agreement relative to existing aph- and chl-a-based models when applied to the Arabian Sea dataset, with regression slopes close to unity (0.78–0.81) across all PSCs. This regional model also improved representation of transitional nano communities, which are commonly associated with higher uncertainties in global models. The empirical relationships developed in this study were applied to VIIRS Level 3 aph(443) data for 2024 to generate PSC distributions. Satellite-derived PSC fields revealed pronounced spatial gradients and regional contrasts across the Arabian Sea, including micro-phytoplankton blooms in the northern Arabian Sea and mixed nano-dominated communities along the western Arabian Sea (Somali coast). Pico-phytoplankton dominated the low-absorption oligotrophic offshore waters, while nano-phytoplankton were most common in transitional regions influenced by moderate nutrient inputs. Taken together, these results demonstrate that the combined aph(443)-S443–510 framework provides a practical, regionally optimized method for retrieving PSCs at synoptic scales across the Arabian Sea, supporting improved bio-optical modelling and satellite-based monitoring of phytoplankton community structure in this region.

1. Introduction

Phytoplankton forms the foundation of the marine food web and plays a major role in regulating Earth’s climate by driving the biological carbon pump (BCP), whereby photosynthetically fixed carbon from the surface is transferred to the deep ocean [1,2]. Their optical characteristics provide valuable insights into primary productivity, size classes (PSCs), community composition, and photoacclimation state, all of which are collectively shaped by ambient light and nutrient conditions [3,4]. The absorption properties of phytoplankton vary systematically with cell size, pigment composition, light history, and intracellular pigment packaging effects [5,6,7,8]. As ocean temperatures continue to rise and stratification and nutrient supply continue to shift under a changing climate, absorption-based assessments have become increasingly valuable for detecting changes in phytoplankton diversity, carbon cycling pathways, and the effectiveness of the BCP in different marine environments [9].
Ocean-colour remote sensing provides an essential means for monitoring large-scale spatiotemporal variability in phytoplankton dynamics, a crucial component of the global carbon cycle. While satellite-derived chlorophyll a (chl-a) has historically served as a proxy for phytoplankton biomass and primary productivity [10,11], chl-a alone cannot fully resolve the taxonomic or size class diversity within phytoplankton assemblages. In contrast, phytoplankton absorption properties retain strong signatures of cell size and functional type, motivating the development of absorption-based and inherent optical property (IOP) methods that leverage spectral variations in phytoplankton absorption characteristics to infer size structure and functional types at synoptic scales [12,13,14,15,16,17].
In the north Indian Ocean, particularly within the Arabian Sea, strong physical–biogeochemical couplings tightly link monsoon-driven hydrographic variability with phytoplankton bloom dynamics and community composition. During winter, cold–dry northeasterly winds promote strong convective mixing and nutrient entrainment. Lateral advection due to enhanced mesoscale eddy activity creates pronounced gradients in light and nutrient availability, leading to dynamic shifts in phytoplankton size classes and taxonomic groups [18,19,20]. These monsoonal forcings also interact with one of the world’s most intense oxygen minimum zones (OMZs) [21]. The expansion of the Arabian Sea OMZ under changing climate conditions [22,23,24] has been reported to alter nutrient stoichiometry and alter ecological niches for phytoplankton and microbial communities [25,26]. The increasing frequency and persistence of Noctiluca scintillans blooms, a mixotrophic dinoflagellate favoured over diatoms under low-oxygen, stratified, and ammonium-rich conditions, exemplifies how climate-driven shifts in hydrography and nutrient dynamics can restructure planktonic ecosystems at basin scales [22,25,27]. During the summer monsoon, strong coastal upwelling and Ekman pumping transport cold, nutrient-rich subsurface waters into the euphotic zone, leading to enhanced surface chl-a and intense phytoplankton blooms, with upwelling velocities of approximately ~1 m d−1 near 70 m depth [28]. Sustained wind-driven mixing maintains nutrient supply, favouring large diatom-dominated blooms along the Oman and southwest Indian coasts, while episodic stratification and regenerated production support recurrent blooms of the mixotrophic dinoflagellate Noctiluca scintillans in the northeastern and central Arabian Sea [25,29,30].
However, Noctiluca blooms have not been reported during the summer monsoon in recent years, as summer monsoon conditions are characterized by intense upwelling, elevated nitrate and silicate availability, and strong vertical mixing, which collectively promote diatom dominance over mixotrophic or bloom-forming dinoflagellates. During the warmer, highly stratified, and generally nutrient-limited inter-monsoon periods, picoplankton has been observed to dominate [29,31,32].
Detecting phytoplankton community shifts on climate-relevant timescales is particularly challenging using shipboard measurements alone, given their limited spatial and temporal coverage in a rapidly evolving basin like the Arabian Sea. Now and in the foreseeable future, satellite observations remain the only practical means of detecting phytoplankton community changes at the time and space scales required to study climate-driven changes in ocean ecosystems. These patterns highlight the importance of combining optical and biogeochemical measurements to better understand how phytoplankton size class (PSC) variability influences regional carbon cycling and climate feedback. Optical proxies such as phytoplankton absorption coefficients (aph) and particle backscattering (bbp) have proven to be useful as they offer scalable insights into PSCs’ structure and functional diversity, offering improved representation of ecosystem processes in bio-optical and biogeochemical models [33,34,35]. Such approaches are particularly relevant in the Arabian Sea, where rapid environmental changes are known to drive strong shifts in phytoplankton communities, with implications for ecosystem stability and carbon fluxes.
PSCs are functional groupings based on cell size, comprising pico-phytoplankton (0.2–2 µm), nano-phytoplankton (2–20 µm), and micro-phytoplankton (>20 µm), each with distinct ecological, optical, and biogeochemical roles [2,36]. Phytoplankton can be classified into these size classes using microscopic observations, pigment-based approaches, and bio-optical methods, including specific absorption coefficients and the spectral slope of the phytoplankton absorption spectrum [36,37,38]. The phytoplankton absorption spectral slope in the 443–510 nm (S443–510) region varies strongly with phytoplankton size class and physiological state [39,40]. This wavelength range is also critical because it exhibits pronounced changes in ocean reflectance in the UV–visible domain, enabling a stable relationship between phytoplankton size classes and reflectance band ratios derived from satellite observations.
In this study, the relationship between aph(443) and the spectral slope (S443–510) was examined, and its applicability for distinguishing PSCs in the Arabian Sea was assessed. The objectives of this study are as follows: (a) to evaluate existing phytoplankton size class (PSC) models using in situ HPLC measurements and aph-based size class estimates in the Arabian Sea; (b) to refine absorption-based PSC relationships to reduce associated uncertainties; and (c) to examine the seasonal and spatial variability of PSCs at synoptic scale using satellite-retrieved aph observations in the Arabian Sea. This study demonstrates that the combined use of aph(443) and spectral slope provides a practical framework for partitioning PSCs and supports improved ecological interpretation of satellite ocean-colour observations in the Arabian Sea.

2. Materials and Methodology

2.1. Study Area and Sampling

Field observations were conducted at multiple locations across the Arabian Sea during several research cruises spanning different seasonal phases (Table 1). The stations occupied during these campaigns span approximately 10–22.5°N and 64.5–76.5°E (Figure 1), allowing sampling across a wide range of hydrographic provinces in the northern Arabian Sea. These include regions influenced by late winter phytoplankton blooms, areas affected by Noctiluca scintillans, as well as comparatively low-biomass oligotrophic waters and transitional zones. Water samples were collected using a CTD rosette system (Sea-Bird Scientific, Bellevue, WA, USA) equipped with Niskin bottles (General Oceanics, Miami, FL, USA). For phytoplankton absorption measurements, 2–5 L of seawater were filtered onto 25 mm Whatman GF/F filters (nominal pore size ~0.7 µm; Cytiva, Marlborough, MA, USA) under gentle vacuum pressure (<25 hPa) and stored in pre-cleaned autoclaved Petri dishes. For pigment-based size class analysis, 2–5 L seawater samples were filtered onto GF/F filters (25 and 47 mm; Cytiva, Marlborough, MA, USA). The filters were immediately stored in liquid nitrogen onboard and subsequently transferred to −80 °C storage for laboratory analysis. All filtrations were conducted under low-light conditions to minimize pigment degradation. In total, 75 aph samples and 27 co-located pigment samples were collected across six cruises (Table 1).

2.2. Phytoplankton Absorption (aph) Measurements

Surface phytoplankton absorption was measured using a Shimadzu UV–Visible spectrophotometer (UV-2600; Shimadzu Corporation, Kyoto, Japan) equipped with an integrating sphere, following the quantitative filter technique (QFT) [41,42]. Absorbance spectra were recorded over the wavelength range of 400–700 nm at 1 nm intervals. Residual scattering and baseline offsets were corrected by subtracting the optical density at 700 nm [43]. The absorption of total particulate matter was corrected for path-length amplification (β-effect) and converted into absorption coefficients ( a p ( λ ) , m−1) following [3]:
a p   ( λ ) = 2.303   × A c ( λ ) × S V
where (Ac( λ )) is the corrected absorbance, (S) is the filter clearance area (m2), and (V) is the filtered volume in litres (L). Detrital absorption spectra (ad( λ )) were measured after pigment extraction in warm methanol [44]. From the measured spectral values of ap(λ) and ad(λ), the phytoplankton absorption coefficient was derived as:
a p h =   a p   ( λ )     a d   ( λ )
The spectral slope between 443 and 510 nm (S443–510) was calculated following the published methods described in the literature [40]:
S 443 510   = a p h 443 a p h 510 443 510
Phytoplankton size classes (PSCs) were estimated from aph(443) in line with the previously published empirical thresholds [40]: pico-phytoplankton (aph(443) < 0.011 m−1), nano-phytoplankton (0.011 ≤ aph(443) < 0.059 m−1), and micro-phytoplankton (aph(443) ≥ 0.059 m−1). PSC thresholds were tuned using 27 stations where in situ absorption measurements were collocated with HPLC pigment observations. These stations span oligotrophic offshore waters as well as bloom-influenced regions within the sampled domain. During threshold tuning, a range of lower and upper aph(443) boundary values was systematically tested to identify the combination that maximized agreement with dominant HPLC-derived PSC classifications. A sensitivity analysis showed that agreement was relatively stable for variations in the upper threshold (0.055–0.063 m−1), while moderate sensitivity was observed for the lower boundary (0.009–0.013 m−1), reflecting the transitional nature of the pico–nano size range. The selected thresholds represent a balance between maximizing agreement and maintaining consistency with pigment-based classifications. This evaluation ensured that the selected aph(443) thresholds were not dependent on a single boundary choice but remained stable within a realistic range of values derived from the collocated dataset. The relative contribution of each PSC to total absorption was quantified using the fractional contribution ( f s i z e )which represents the portion of total absorption at 443 nm (aph, total(443)) attributed to each size class (pico-, nano- and micro-phytoplankton) as:
f s i z e   = a p h ,   s i z e   ( 443 ) a p h ,   t o t a l   ( 443 )
where the numerator represents the absorption coefficient at 443 nm corresponding to a specific PSC, and the denominator a p h , t o t a l ( 443 ) represents the total phytoplankton absorption at 443 nm. The fractional contributions satisfy unity constraint ( f p i c o + f n a n o + f m i c r o = 1 ) . The fractional contributions e was multiplied by 100 to express the results as percentage contributions (% PSC), representing the optical dominance of pico-, nano-, and micro-phytoplankton. To optimize PSC-specific fractions, a constrained nonlinear optimization was implemented using Solver (GRG Nonlinear), minimizing the sum of squared errors (SSE) between observed and modelled % PSC. This optimization enforced non-negativity and a unity-sum constraint (sum of f = 1) [45]. This practical and reproducible approach was preferred over full-spectrum inversion techniques [13] as it is well-suited to absorption-based datasets and provides stable empirical partitioning of phytoplankton size classes.

2.3. Phytoplankton Pigment and Chlorophyll-a (Chl-a) Analysis

Phytoplankton pigments were analyzed using reversed-phase high-performance liquid chromatography (HPLC) following established analytical protocols at two laboratories using inter-comparable workflows. For cruise SS383, frozen GF/F filters were extracted with 4 mL of 100% chromatography-grade acetone, sonicated, and allowed to extract overnight at low temperatures in the dark. All chemicals and reagents used were of analytical grade and obtained from Merck (Darmstadt, Germany). The extracts were clarified by centrifugation (10 min at 2000 rpm), and a 700 µL aliquot was mixed with 300 µL of 1 M ammonium acetate buffer. Subsequently, 100 µL of the extract–buffer mixture was injected into a Waters™ HPLC system (quaternary gradient pump 2535, autosampler 2707, PDA detector 2998; Waters Corporation, Milford, MA, USA) equipped with an XBridge C18 column. Pigments were separated using a binary gradient of methanol and 25 mM ammonium acetate (70:30, v/v) following the previously published procedures [46,47]. Detection was performed at 450 and 665 nm using a photodiode array (PDA) detector, and pigments were identified based on retention time and spectral matching with commercial pigment standards (DHI, Hørsholm, Denmark). Detector response factors obtained from standards were used to convert chromatographic peak areas into pigment concentrations (µg L−1), accounting for both injection volume and filtered sample volume. For the RR2306 cruise, the pigment samples were processed at the NASA Goddard Space Flight Center using the widely adopted method described in the literature [48]. This approach, based on a Dry Lab-optimized reversed-phase HPLC system with PDA detection (Agilent Technologies, Santa Clara, CA, USA), is routinely applied at NASA-GSFC and provides stable retention times and reliable separation of phytoplankton pigments. In both analytical workflows, routine calibration and quality control included replicate injections, standard verification runs, and inspection of chromatographic peak purity. Pigment concentrations were subsequently converted to size class chl-a fractions using diagnostic pigment-based coefficients reported in the literature to derive PSCs [49]. In addition to HPLC-based pigment quantification, chl-a concentrations were determined spectrophotometrically following established methods [50]. Filters were extracted in 90% acetone and stored in the dark at 4 °C for 24 h. The extracts were centrifuged (4000 rpm, 10 min), and absorbance was measured at 750, 664, 647, and 630 nm using a double-beam UV–visible spectrophotometer (Shimadzu Corporation, Kyoto, Japan). The chl-a concentrations were calculated after baseline correction (OD750) using standard equations, providing an independent estimate of phytoplankton biomass. The spectrophotometric chl-a measurements were subsequently cross-validated with the HPLC pigment data. The HPLC-derived pigment data were subsequently used to derive PSC fractions and to evaluate the performance of the absorption-based PSC model developed in this study.

2.4. Satellite Data Processing and PSC Mapping

Satellite-derived phytoplankton absorption products were used to examine the spatial distribution and seasonal dynamics of phytoplankton size classes (PSCs) across the Arabian Sea. Monthly Level 3, 4 km resolution products of the aph(443) were obtained from the Visible Infrared Imaging Radiometer Suite (VIIRS) satellite for the year 2024 (NASA Ocean Color website: https://oceancolor.gsfc.nasa.gov/ (accessed on 5 September 2025). Standard NASA ocean-colour quality control flags were applied to exclude pixels affected by clouds, high glint, and other atmospheric contamination. For validation, collocated Level 2 VIIRS aph(443) data were extracted at the geographic coordinates of the in situ sampling stations using a ±25 km spatial and ±5-day temporal window. These satellite-derived values were then compared with the corresponding in situ HPLC pigment-based and absorption-derived PSC estimates to evaluate the model performance and retrieval consistency (see Section 3.5). Spatial visualization of PSC distributions was performed using the empirically calibrated aph(443)-based partitioning model derived in this study (Section 3.1). Monthly VIIRS aph(443) composites were converted into PSC fractional contributions (%pico, %nano, %micro) by applying the corresponding regression relationships (Equations (6)–(8)). These were subsequently rendered as gridded maps representing the relative dominance of each phytoplankton size class during different months of 2024. To support spatial interpretation, PSC classifications derived from in situ absorption measurements were overlaid on the corresponding VIIRS Level 3 VIIRS chl-a composites where each station was marked with a colour indicating pico-, nano- and micro-phytoplankton dominance (Figure S1). This overlay allowed us to directly compare satellite-observed surface biomass patterns and the phytoplankton community structure measured in situ. The combined visualization provides a synoptic view of PSC variability across the region and helps identify areas where in situ observations align with, or diverge from, broader satellite-derived bloom patterns in the Arabian Sea. Satellite data processing and visualization were carried out using Python (version 3.13.2; Python Software Foundation, Wilmington, DE, USA) within JupyterLab (version 4.3.6).

3. Results

3.1. Phytoplankton Size Partitioning Based on the aph(443)-S443–510 Relationship

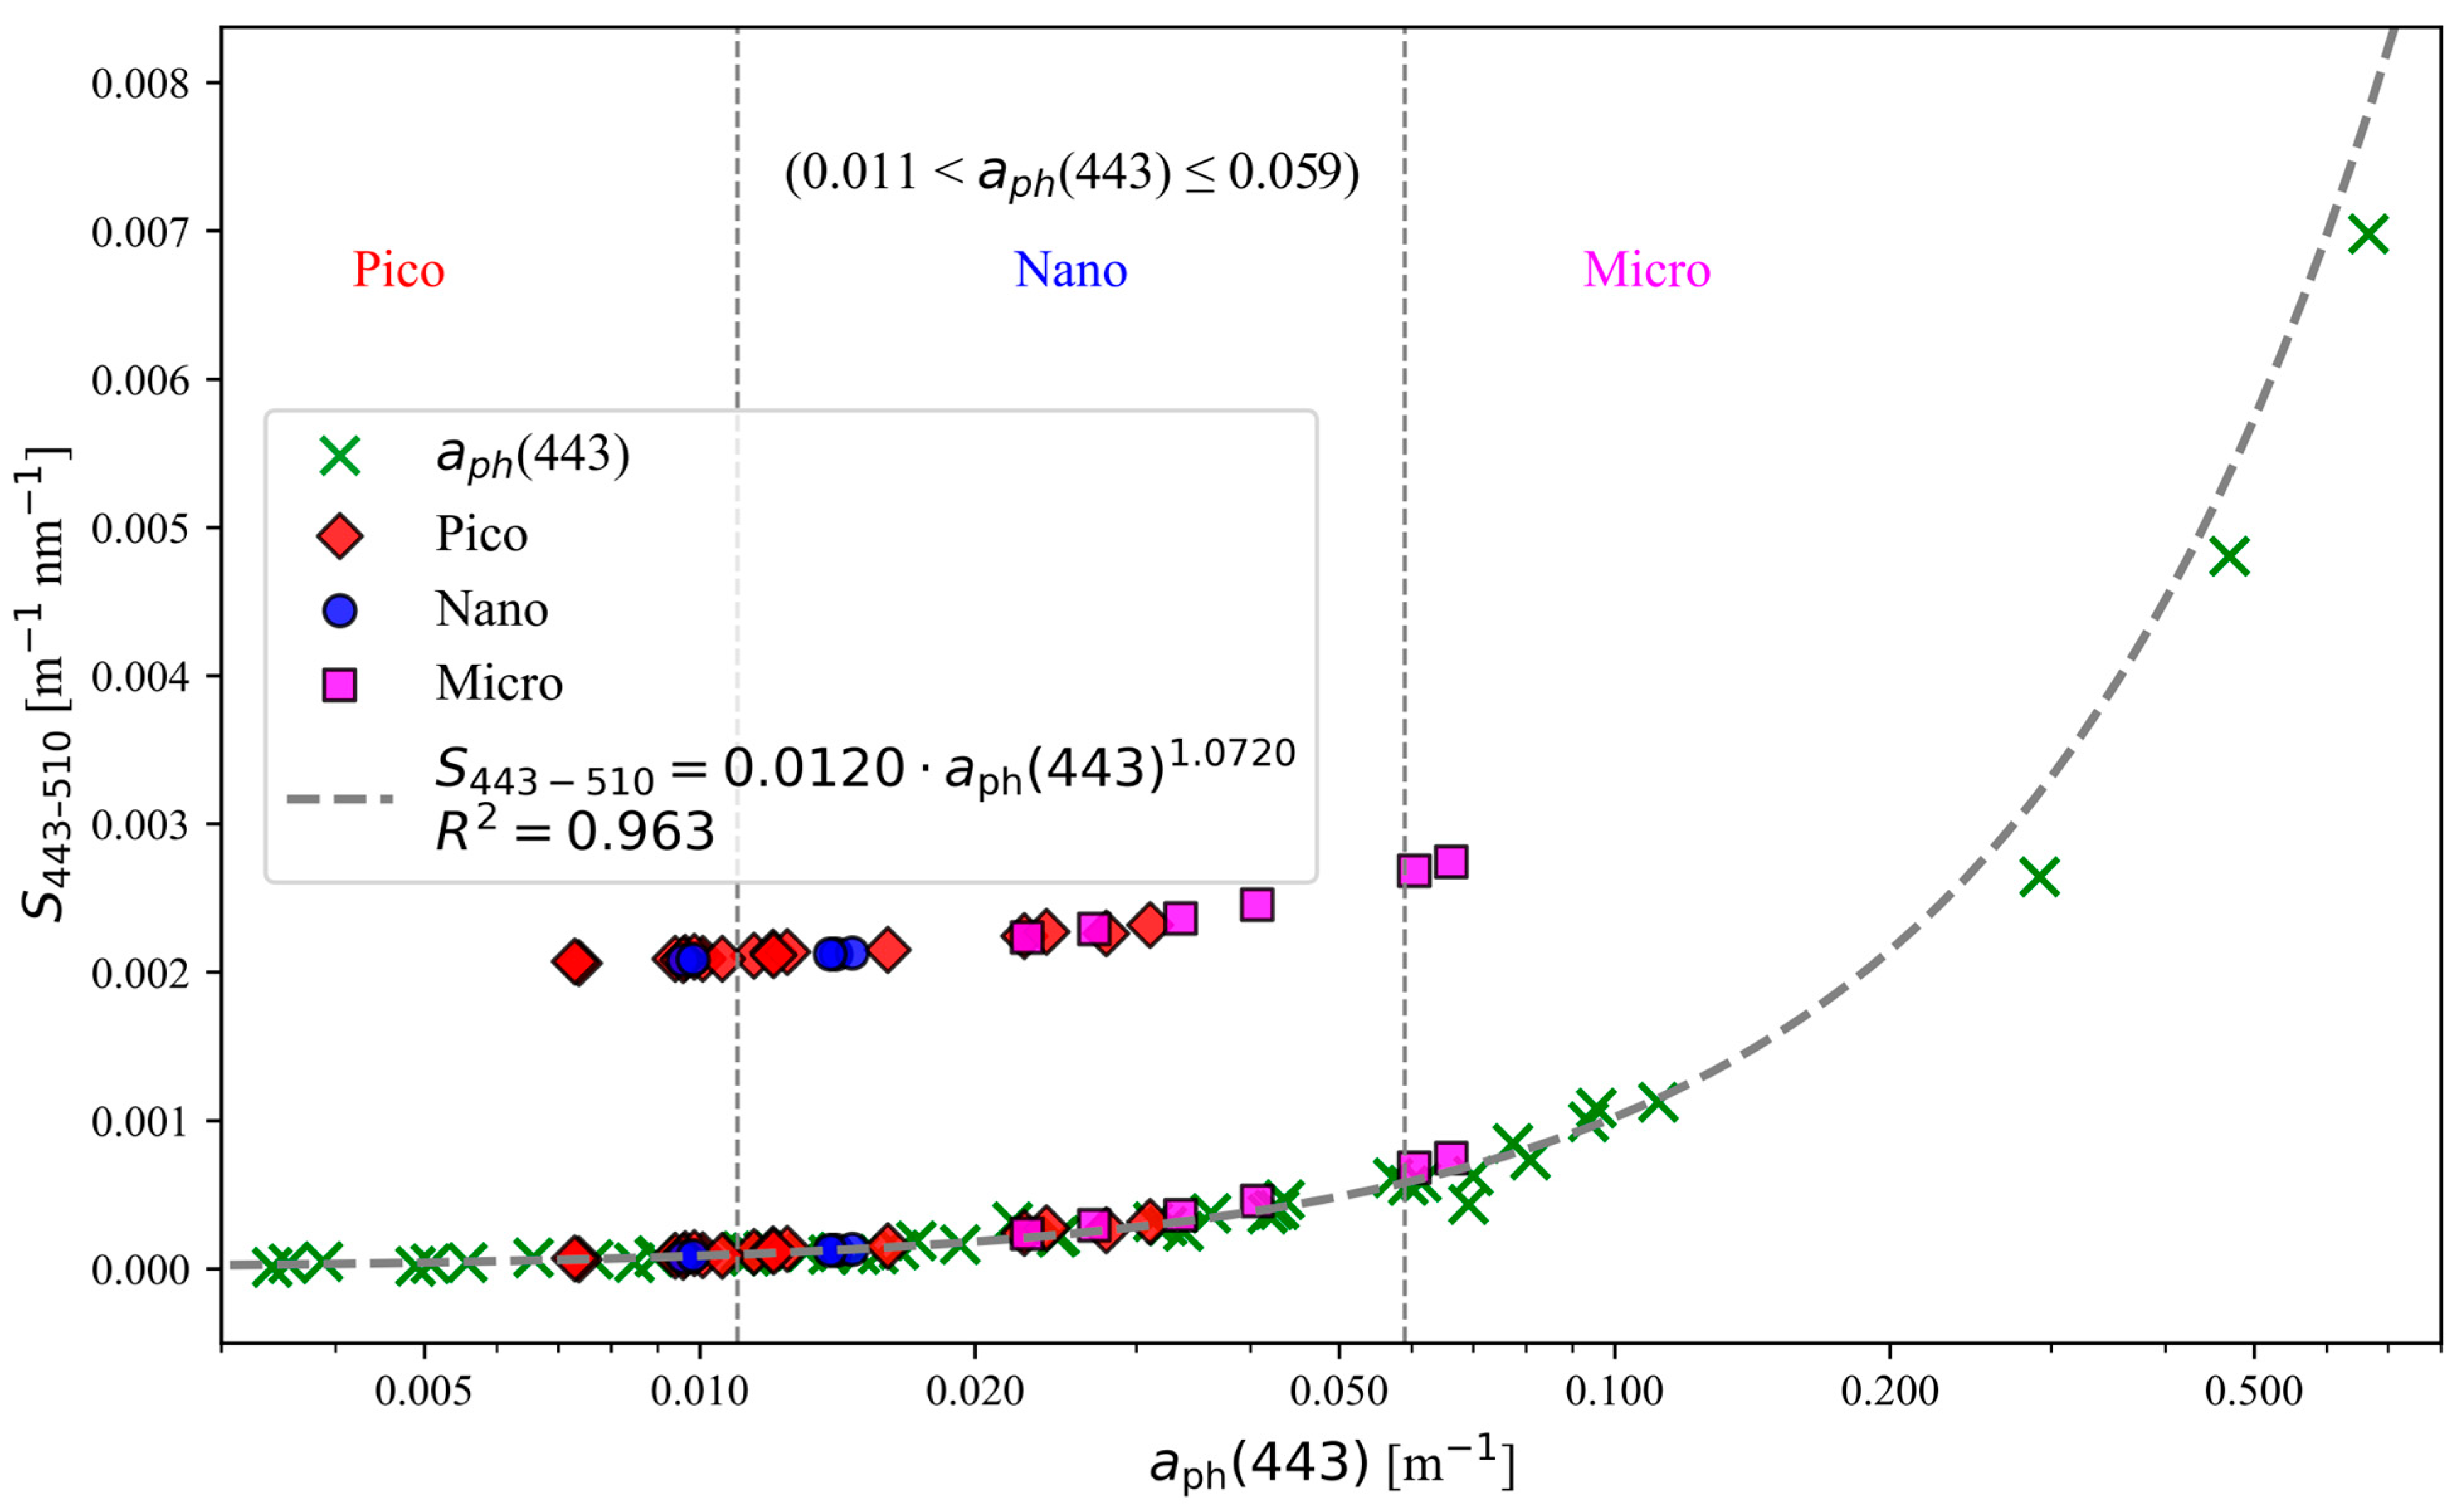
A comprehensive set of phytoplankton absorption spectra collected during six research cruises spanning multiple seasonal phases in the Arabian Sea was analyzed to characterize bio-optical variability and phytoplankton size structure (Figure 1). The aph(443)-S443–510 relationship was derived from 75 in situ absorption measurements collected across pre-monsoon (SS348, SS356, SS383), summer monsoon (RR2306), post-monsoon (SN181), and winter monsoon (SAMA025) conditions, covering a broad range of seasonal phases and trophic regimes within the Arabian Sea. The sampled locations encompassed both phytoplankton bloom conditions (cruises SS348 and SS356) and non-bloom conditions, which were objectively identified using concurrent satellite ocean-colour imagery (Figure S1). A highly significant power-law relationship was found between aph(443) and the spectral slope S443–510, accurately explaining 96% of variance across the dataset (R2 = 0.963, p < 0.001, Figure 2).
S 443 510 = 0.012 × [ a p h ( 443 ) ] 1.072
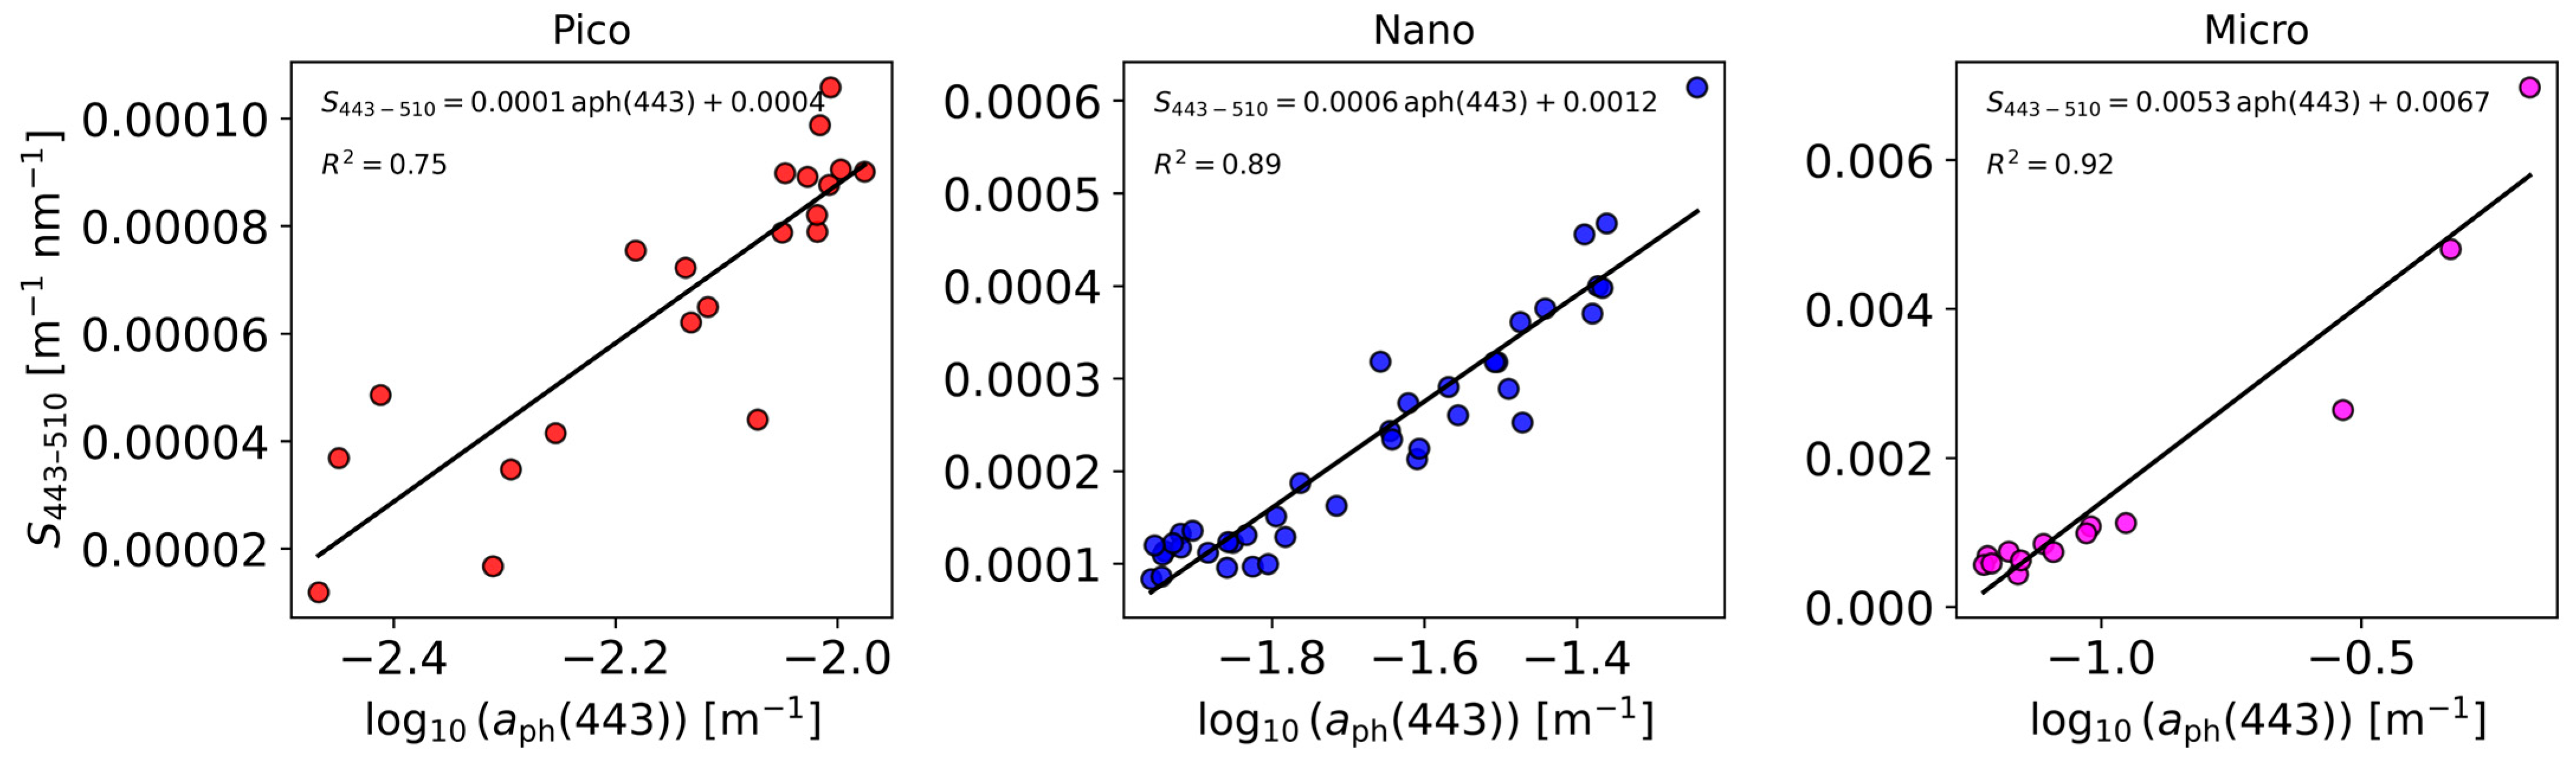
This relationship provides a quantitative optical basis for differentiating PSCs in the Arabian Sea region. Of the 75 absorption measurements, 27 stations had collocated HPLC pigment observations, allowing direct comparison with the pigment-based PSC diagnostic of following [49]. Although the number of pigment-collocated stations is limited, these samples span contrasting trophic conditions and phytoplankton size-dominance, providing a suitable basis for empirical threshold calibration within the sampled domain. These collocated observations were used to tune region-specific aph(443) thresholds. Thresholds were selected at values where agreement between HPLC-derived PSC classes and aph-based classifications showed maximum separation between pico- and micro-phytoplankton while minimizing misclassification across the nano boundary. The resulting empirically derived thresholds were: pico-phytoplankton (aph(443) ≤ 0.011 m−1); nano-phytoplankton (0.011 < aph(443) ≤ 0.059 m−1); and micro-phytoplankton (aph(443) > 0.059 m−1). To assess the performance of these thresholds, the aph(443) class boundaries proposed by [40] were first applied to the 27 collocated stations. These thresholds (0.023 and 0.069 m−1) resulted in lower agreement with HPLC-derived dominant size classes, primarily due to underestimation of micro-dominated stations and overestimation of pico dominance. A range of alternative boundary values was therefore evaluated, and the threshold pair providing the highest agreement between aph-derived and pigment-derived dominant classifications was selected. These thresholds were subsequently applied to the full dataset to derive class-specific log-linear relationships between aph(443) and S443–510 (Figure 3):
Spico = 0.0001 × log10[aph(443)] + 0.0004, (R2 = 0.75), aph(443) ≤ 0.011 m−1
Snano = 0.0006 × log10[aph(443)] + 0.0012, (R2 = 0.89), 0.011 < aph(443) ≤ 0.059 m−1
Smicro = 0.0053 × log10[aph(443)] + 0.0067, (R2 = 0.92)], aph(443) > 0.059 m−1
Overlaying the HPLC-derived PSC classifications within the aph(443) and S443–510 domain (Figure 2) revealed a clear optical separation between pico- and micro-phytoplankton. Pico-dominated samples clustered in the low-absorption and high-slope region, whereas micro-phytoplankton occupied the high-absorption and low-slope region. Nano-phytoplankton fell between these two size classes and exhibited partial overlap with both adjacent classes, reflecting the known optical ambiguity of this intermediate size group. Across the 27 collocated stations, aph-based PSC assignments matched HPLC classifications in approximately ~61% of cases. Most discrepancies occurred near the pico–nano and nano–micro class boundaries, rather than being randomly distributed. Taken together, these results demonstrate that aph(443) and S443–510 provide a reliable optical diagnostic for distinguishing broad small-versus-large-cell phytoplankton communities (pico vs. micro) in the Arabian Sea, while the nano size class remains intrinsically more uncertain due to its intermediate optical characteristics, consistent with previous PSC studies.

3.2. Distinct Phytoplankton Absorption Spectral Signatures Across PSCs

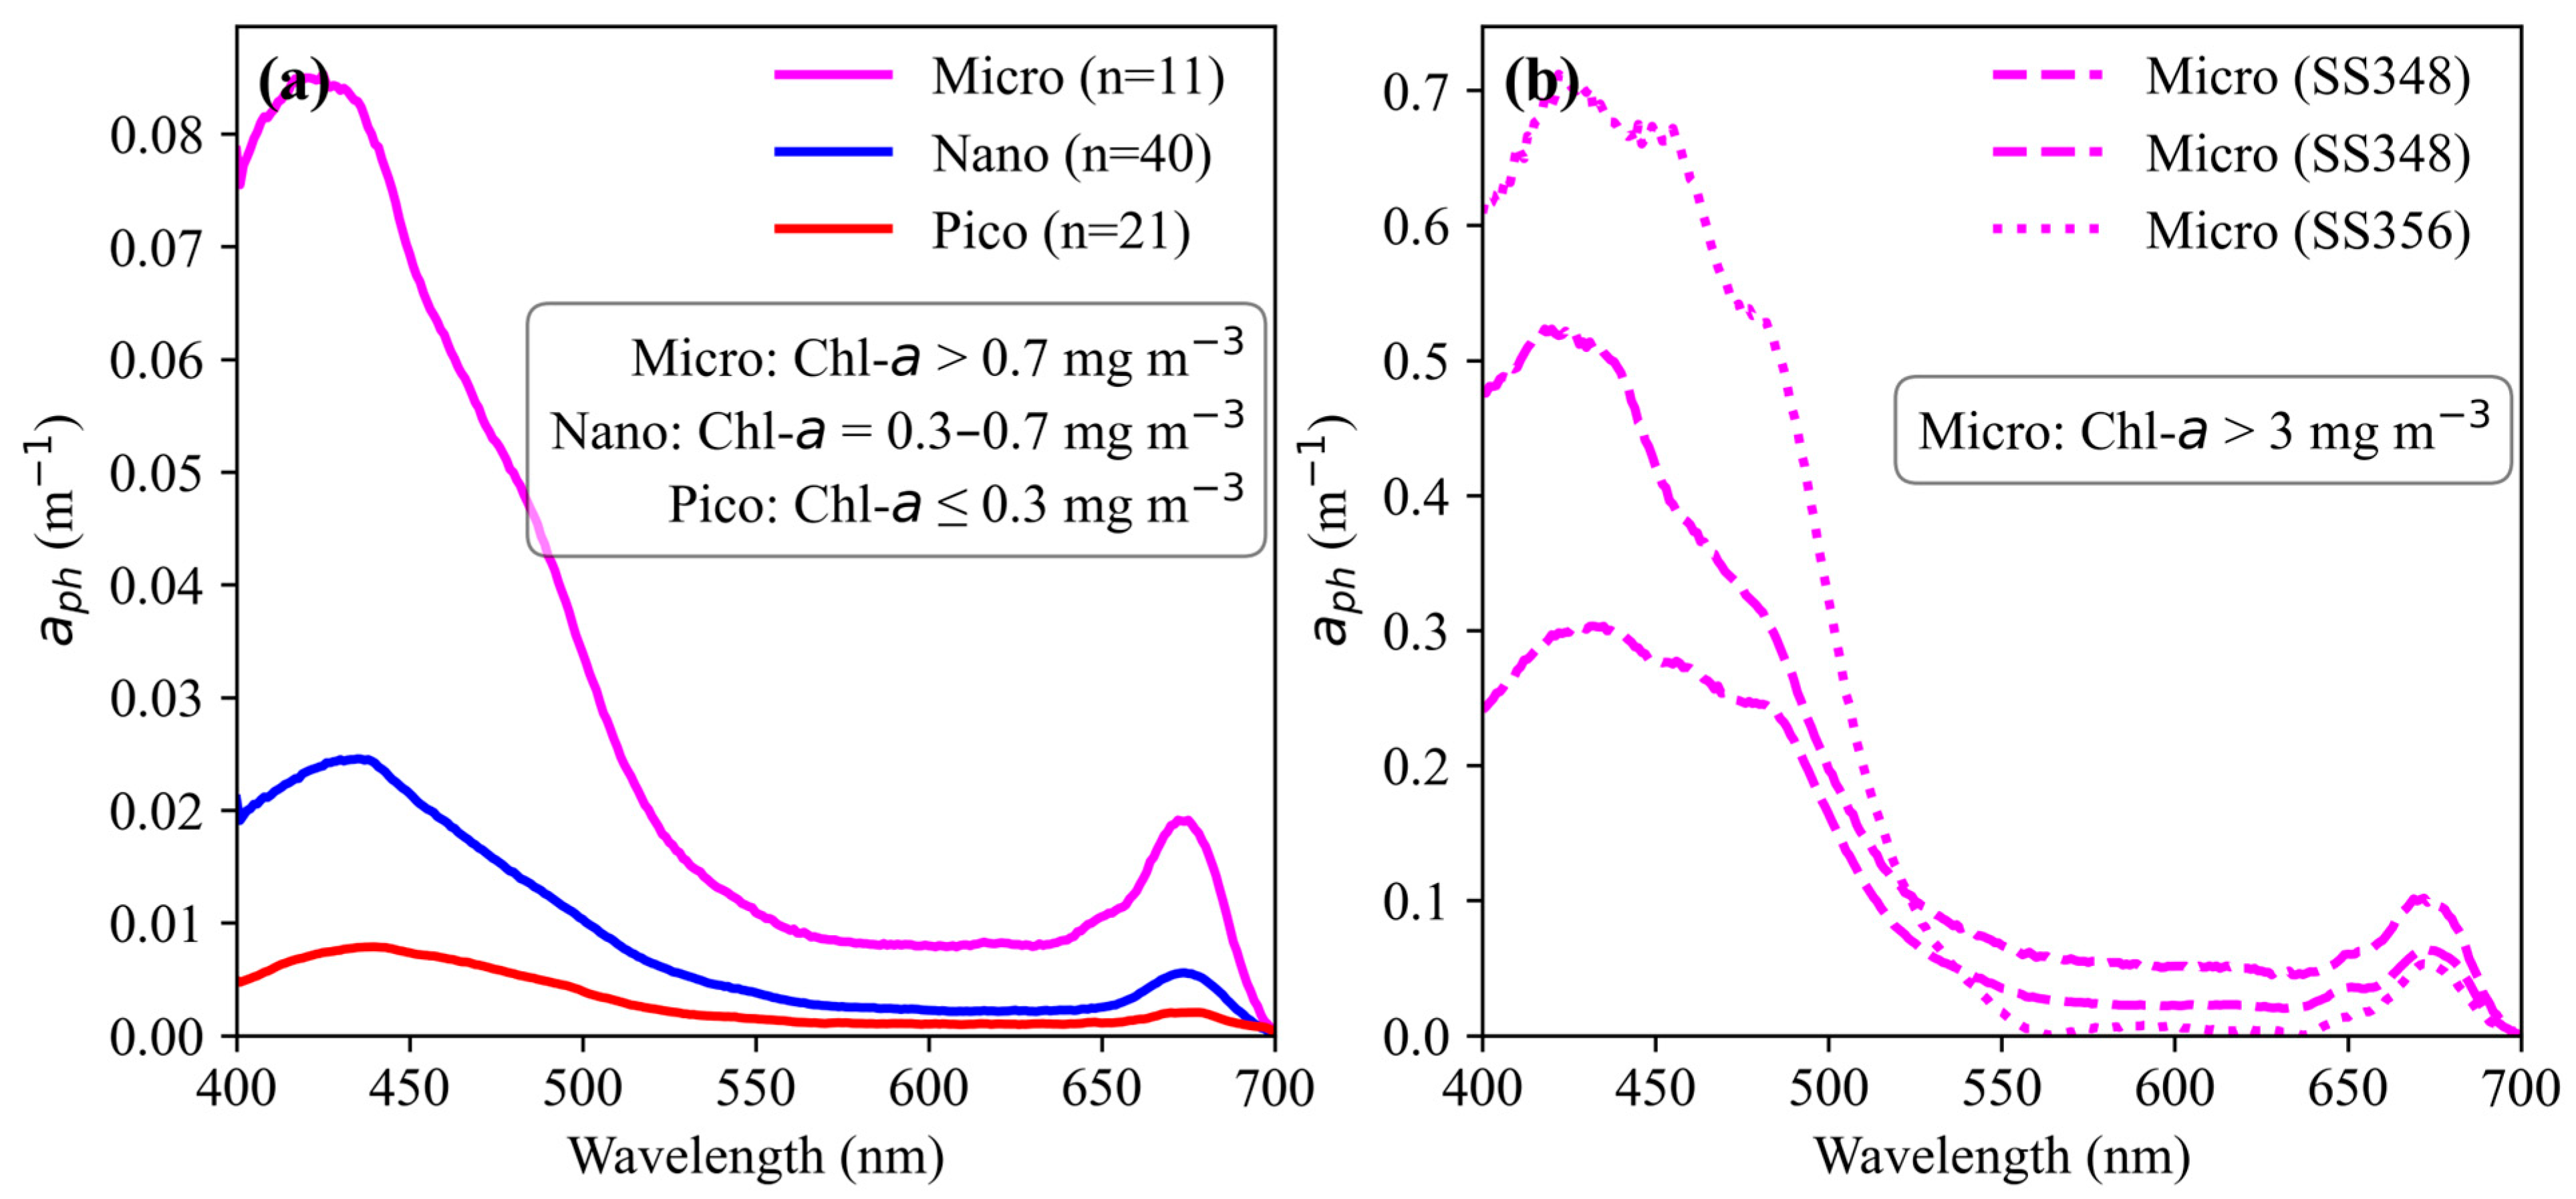
To further examine the optical basis of the aph(443)–S443–510 relationship described by Equation (5) in Section 3.1, PSC-specific absorption spectra were analyzed to identify characteristic spectral signatures associated with different phytoplankton size classes. Mean absorption spectra grouped according to aph(443)-derived PSC classifications showed consistent and systematic differences in both magnitude and spectral shape (Figure 4a,b). Under low-biomass (oligotrophic to mesotrophic) conditions, micro-phytoplankton (chl-a > 0.7 mg m−3) exhibited the highest absorption magnitudes, characterized by a strong peak near 443 nm and a secondary peak near 675 nm (Figure 4a). Their spectra also showed a pronounced decline between 443 and 510 nm, a feature typically associated with higher pigment concentration and stronger pigment packaging in larger cells. Nano-phytoplankton (chl-a: 0.3–0.7 mg m−3) displayed intermediate absorption magnitudes and moderately steep slopes, reflecting their transitional optical character. In contrast, pico-phytoplankton (chl-a ≤ 0.3 mg m−3) exhibited the lowest absorption values and the steepest slopes in the blue region, consistent with their smaller cell size, reduced pigment packaging, and higher pigment-specific absorption efficiency. During high-biomass conditions, micro-phytoplankton (chl-a > 3 mg m−3) exhibited substantially higher absorption values and greater spectral variability between samples (Figure 4b). The high-biomass spectra showed additional shoulders around ~490 nm and 550–580 nm, features commonly attributed to elevated concentrations of accessory pigments such as carotenoids and xanthophylls that are abundant in large-cell communities. These pigment-driven spectral features further highlight the optical distinction between pico- and micro-phytoplankton groups but may also introduce additional variability near PSC boundaries. Collectively, the combined patterns of aph(443) magnitude and S 443 510 provide a clear distinction between small and large phytoplankton groups. High aph(443) values coupled with shallow or more complex spectral slopes typically indicate micro-phytoplankton dominance, whereas low aph(443) values with steep blue-region slopes are indicative of pico-dominated waters. Nano-phytoplankton occupies an intermediate optical range and often overlaps with both adjacent classes, making their discrimination inherently more uncertain. Although bloom-related spectral changes and accessory pigments can enhance optical differentiation, they may also introduce variability that blurs class boundaries.

3.3. PSCs Fractional Variability Along the aph(443) Gradient

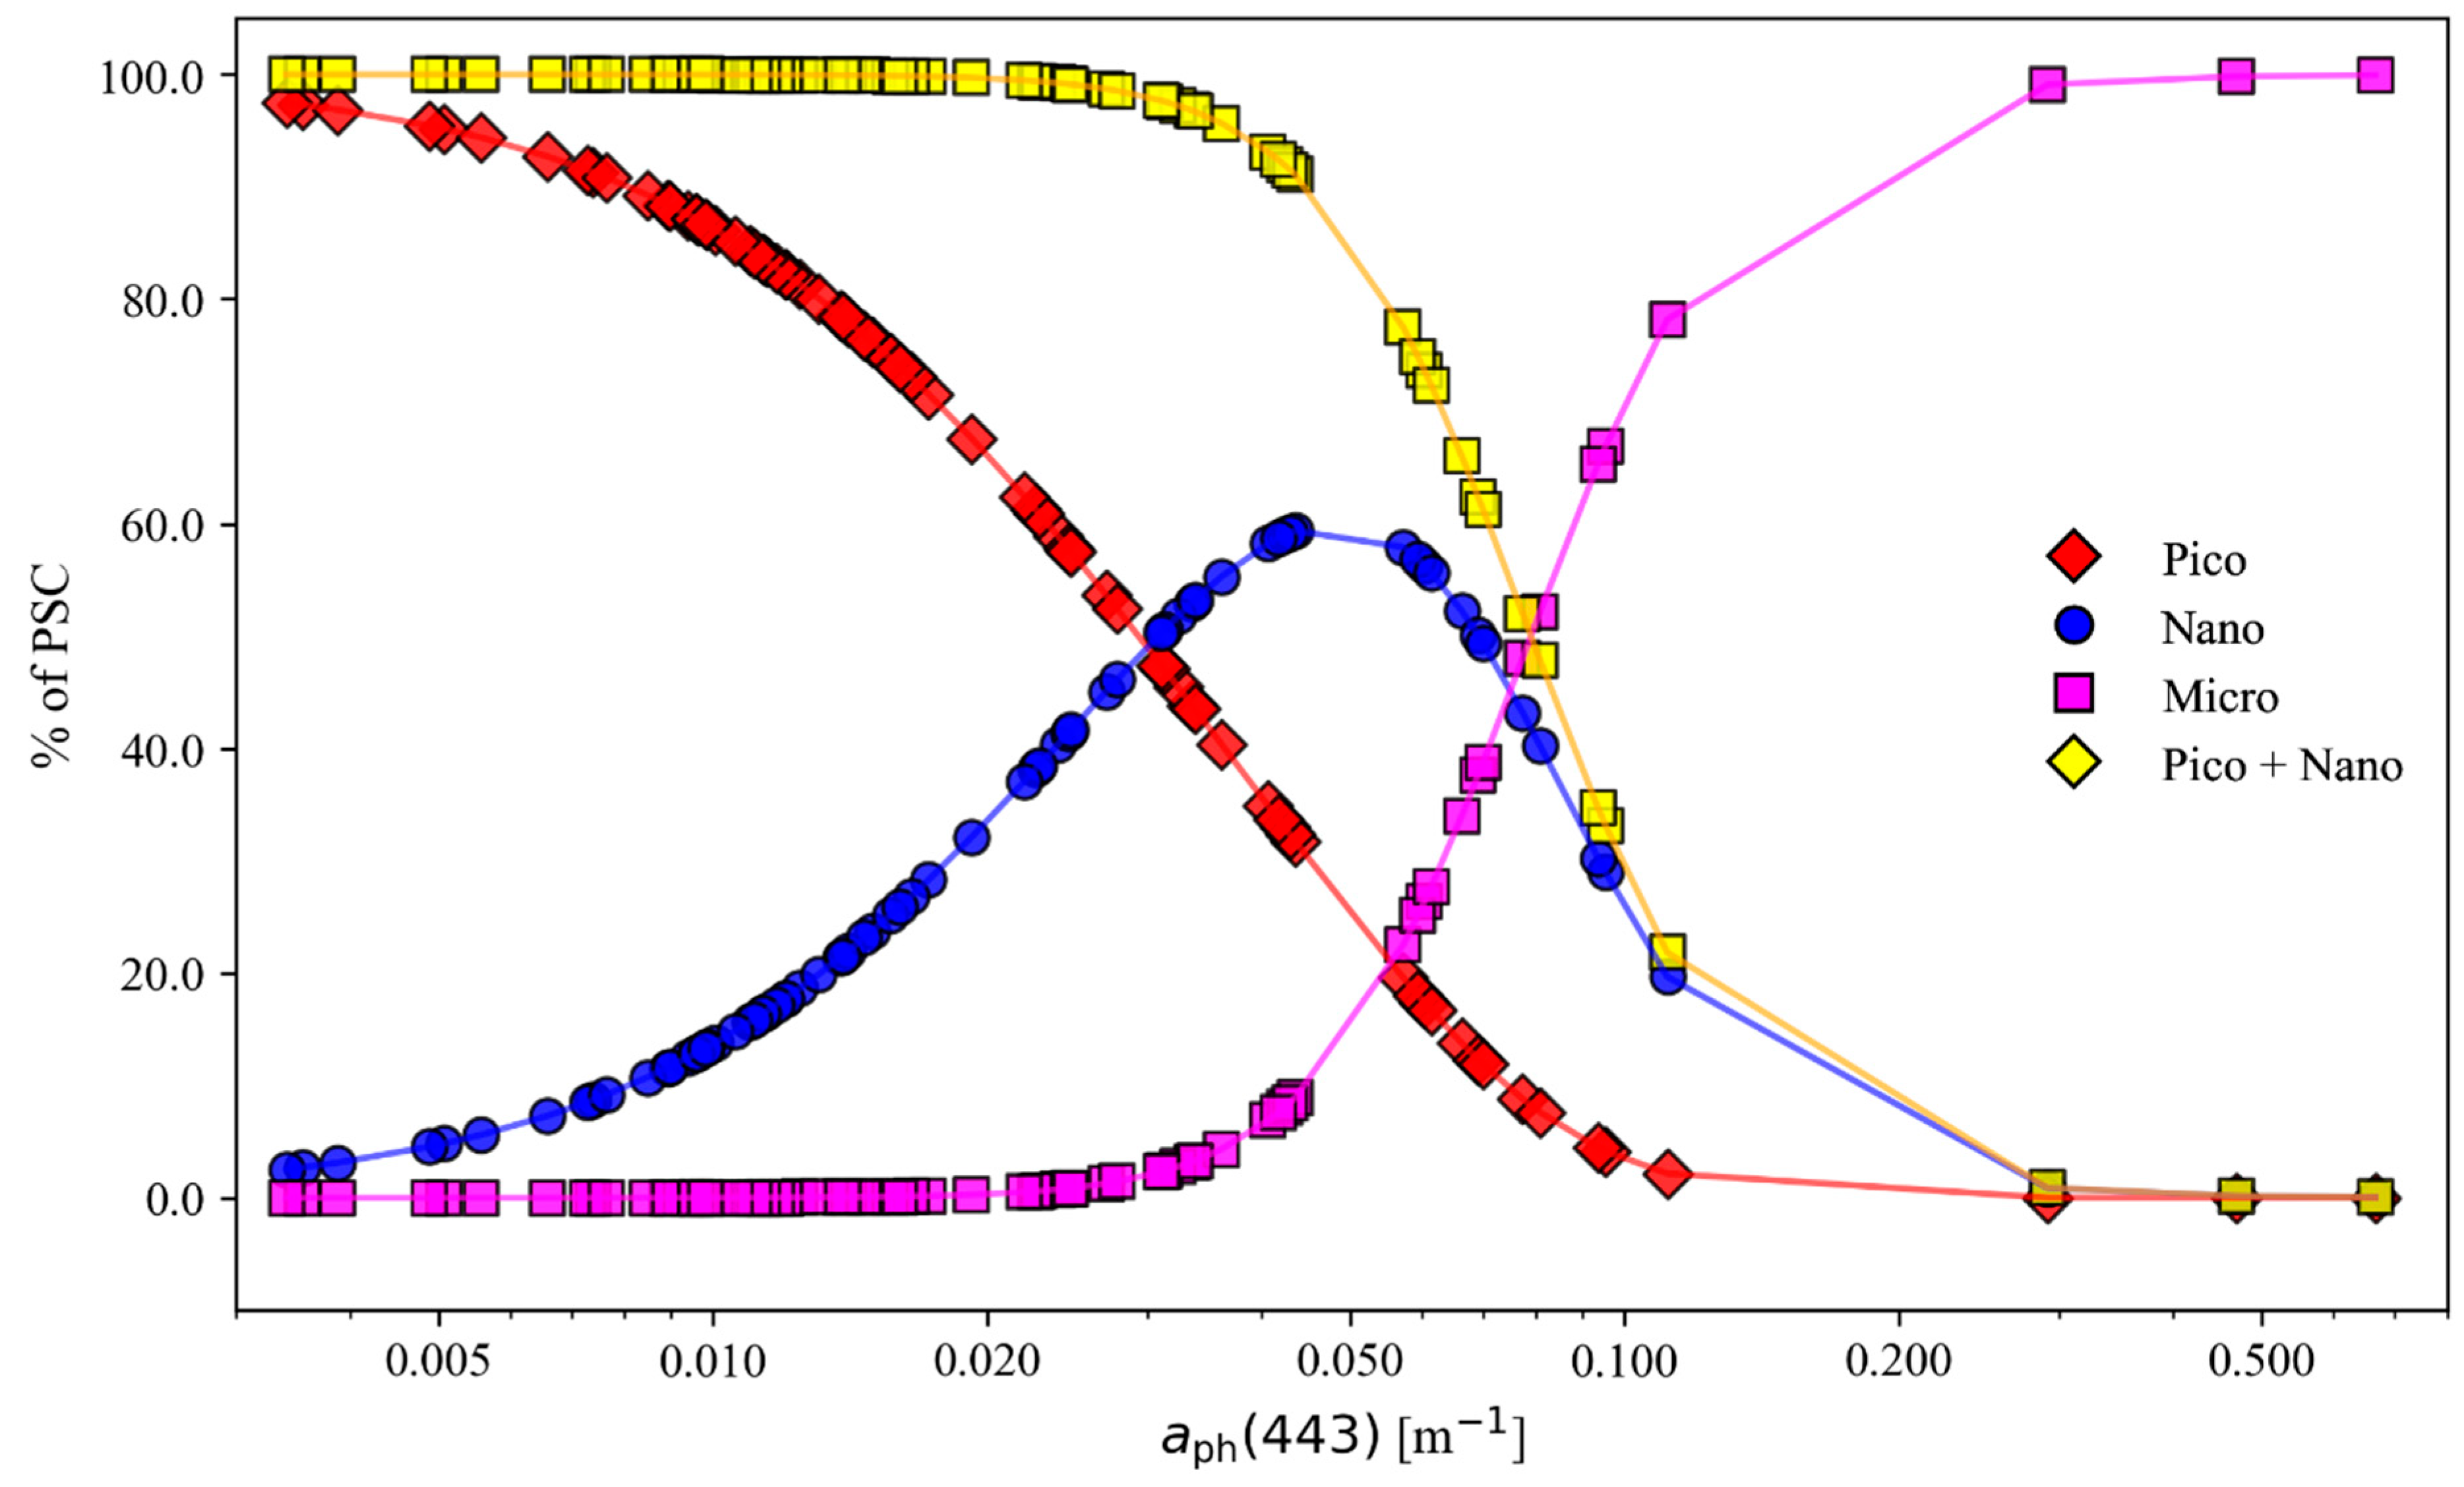
The fractional contributions (% PSC) of pico-, nano-, and micro-phytoplankton along the aph(443) gradient revealed a systematic shift in phytoplankton community structure (Figure 5). At low absorption (aph(443) < 0.011 m−1), pico-phytoplankton dominated, contributing more than 80% of the total PSC fraction, although their contribution declined rapidly with increasing absorption. Nano-phytoplankton reached peak fractional abundance (~60%) at intermediate aph(443) values (0.011 < aph(443) ≤ 0.059 m−1), reflecting their transitional role between small and large size classes. In contrast, micro-phytoplankton contributions increased sharply at higher absorption values (aph(443) (>0.059 m−1)) and became dominant during bloom conditions, with individual samples approaching ~100% micro-phytoplankton dominance. At low aph(443) values, the combined fractional contributions of pico- and nano-phytoplankton remain very high, together comprising nearly 100% of the community, indicating that small phytoplankton dominate in oligotrophic to moderately productive conditions. Across the dataset, a consistent pattern emerged in which total phytoplankton absorption increased with increasing aph(443), while the relative contributions of pico- and nano-phytoplankton declined progressively (Figure 5). In contrast, the fraction of micro-phytoplankton increased steadily as aph(443) increased, reflecting their dominance under higher-biomass conditions. This contrasting behaviour between small and large cells illustrates a clear structural shift in the community: pico- and nano-phytoplankton prevail under low absorption conditions, whereas increasing aph(443), corresponds to a transition toward micro-phytoplankton-dominated assemblages. Similar transitions have been documented in pigment-based PSC assessments across the chl-a gradients [13,16,49,51,52] where pico- and nano-phytoplankton dominate oligotrophic, low-biomass waters, whereas micro-phytoplankton prevail under high-biomass bloom conditions. This agreement between absorption-based and pigment-based approaches supports the use of aph-based partitioning as a diagnostic tool for characterizing the shifts in phytoplankton community structure across varying biomass and ecological regimes.

3.4. Comparative Evaluation of PSC Models Using In Situ Observations

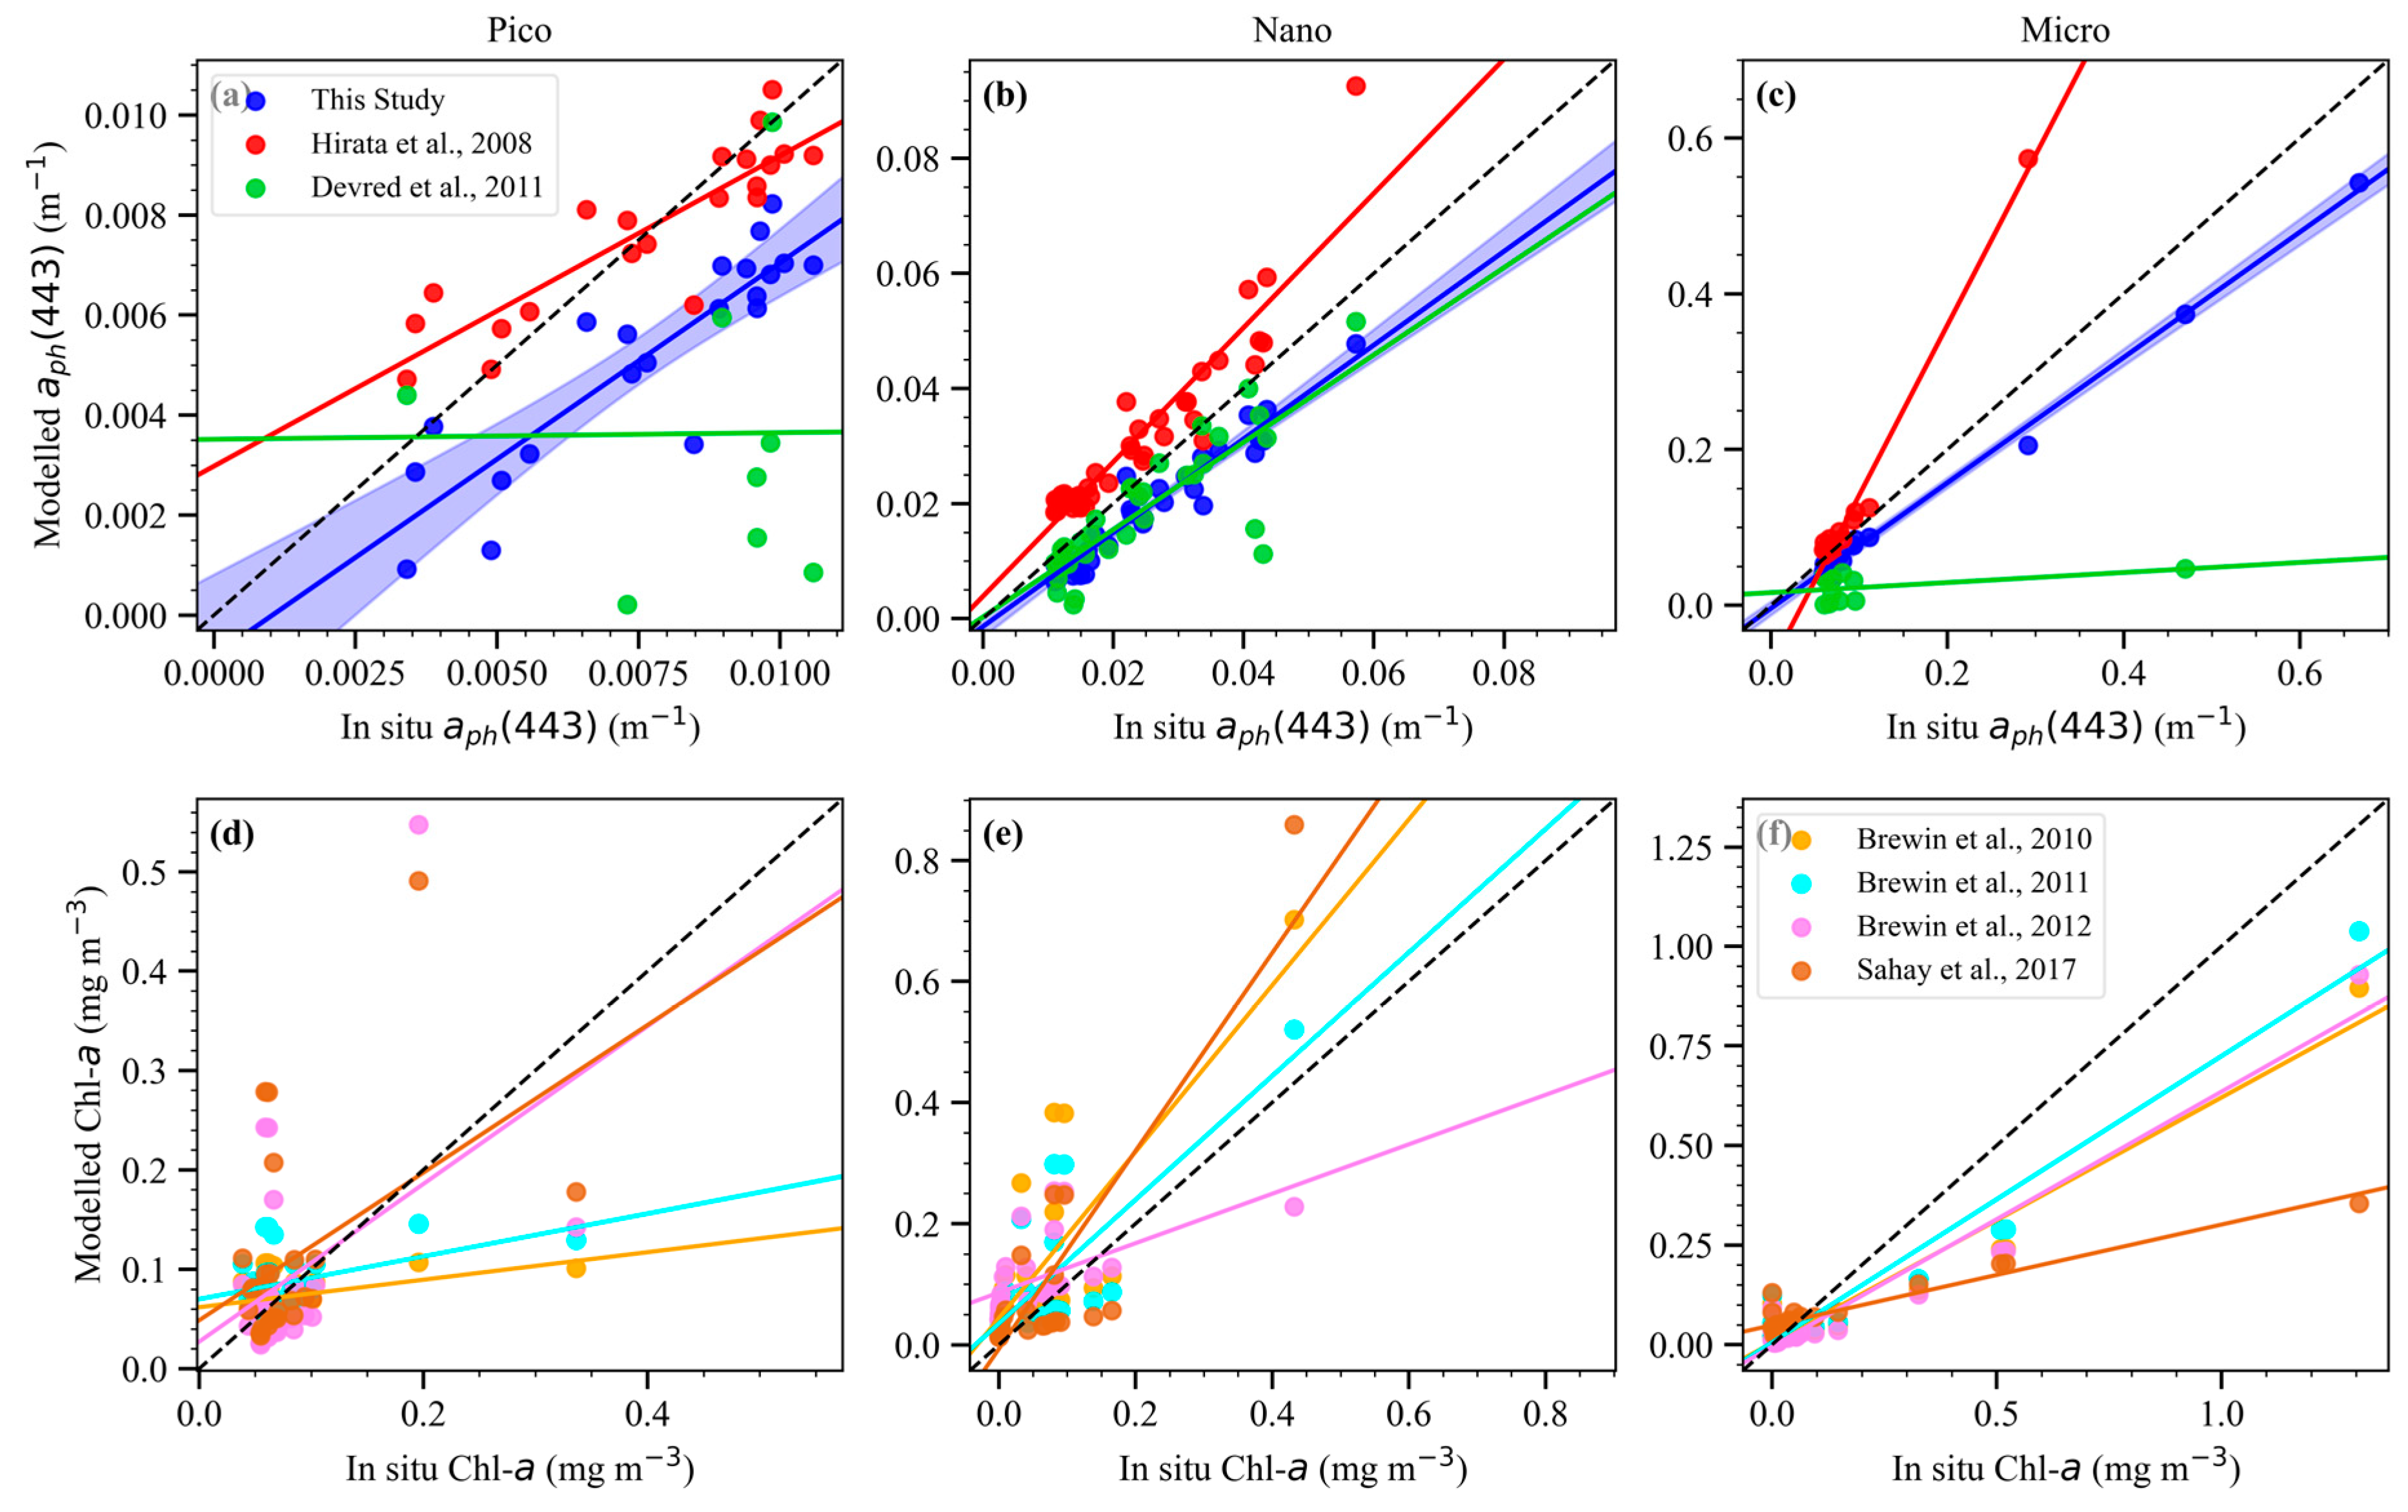
The performance of the aph(443)-based PSC model developed in this study was evaluated against previously published PSC formulations using both absorption and chlorophyll relationships (Figure 6; Table 2). Comparisons using in-situ aph(443) observations showed that the present model exhibited lower RMSE and closer regression agreement relative to previously published absorption-based models when applied to the Arabian Sea dataset [16,40]. Across pico-, nano-, and micro-phytoplankton classes, the regression slopes for the present model ranged from 0.786 to 0.815, indicating close agreement between modelled and in situ aph(443) (Figure 6). In contrast, existing absorption models for the nano- and micro-phytoplankton classes exhibited slopes greater than unity, together with higher RMSE values (Table 2), suggesting systematic overestimation when applied to the Arabian Sea dataset [40]. The globally tuned model of [16] showed weak regression slopes for the pico- and micro-phytoplankton classes, indicating limited applicability under the regional optical conditions [16]. These differences likely arise because the Arabian Sea exhibits distinct phytoplankton communities, and absorption–size relationships compared with the colder high-latitude regions where the global models were originally developed. Evaluation of chlorophyll-based PSC formulations [13,14,19,53] further highlighted the limitations of pigment-only partitioning for this region (Figure 6). Chlorophyll-based PSC models evaluated in this study showed systematic underestimation of both pico- and micro-phytoplankton fractions, as evidenced by large deviations from the 1:1 line and elevated error metrics (Figure 6; Table 2) [19]. This behaviour likely reflects the underlying Brewin-type parameterization adopted in that model, in which phytoplankton size fractions are inferred solely from total chl-a. The chl-a based PSC models exhibited substantially higher uncertainties, particularly for nano-phytoplankton, where regression slopes ranged from 0.41 to 1.63 (Table 2). These large uncertainties highlight the known difficulty of resolving nano- and micro-phytoplankton communities based solely on bulk chl-a, especially in optically complex waters where accessory pigments and mixed phytoplankton assemblages strongly influence pigment-based diagnostics. In contrast, the aph-based PSC model developed in this study consistently produced lower RMSE values (0.0027–0.0508) for all three size classes (Table 2), indicating reduced error relative to the global aph-based and chl-a-based models evaluated here. The reduced error and improved regression agreement likely reflect the tighter coupling between phytoplankton absorption and cell size, as well as the advantage of using region-specific aph(443) thresholds optimized using collocated HPLC pigment measurements. This regional tuning enables the absorption–size relationships to more accurately represent the optical characteristics of phytoplankton communities observed in the Arabian Sea.
Taken together, the comparison between the PSC model outputs and in situ observations indicates that the regionally tuned aph(443)-based PSC model developed in this study provides a more consistent representation of pico-, nano-, and micro-phytoplankton variability in the Arabian Sea than previously published models. The improved ability to resolve smaller size classes, particularly transitional nano-phytoplankton, highlights the potential of absorption-based partitioning as a diagnostic tool for characterizing phytoplankton community structure across diverse trophic regimes of the Arabian Sea.

3.5. Seasonal Mapping and Validation of Satellite-Retrieved PSCs Using aph-Based Model

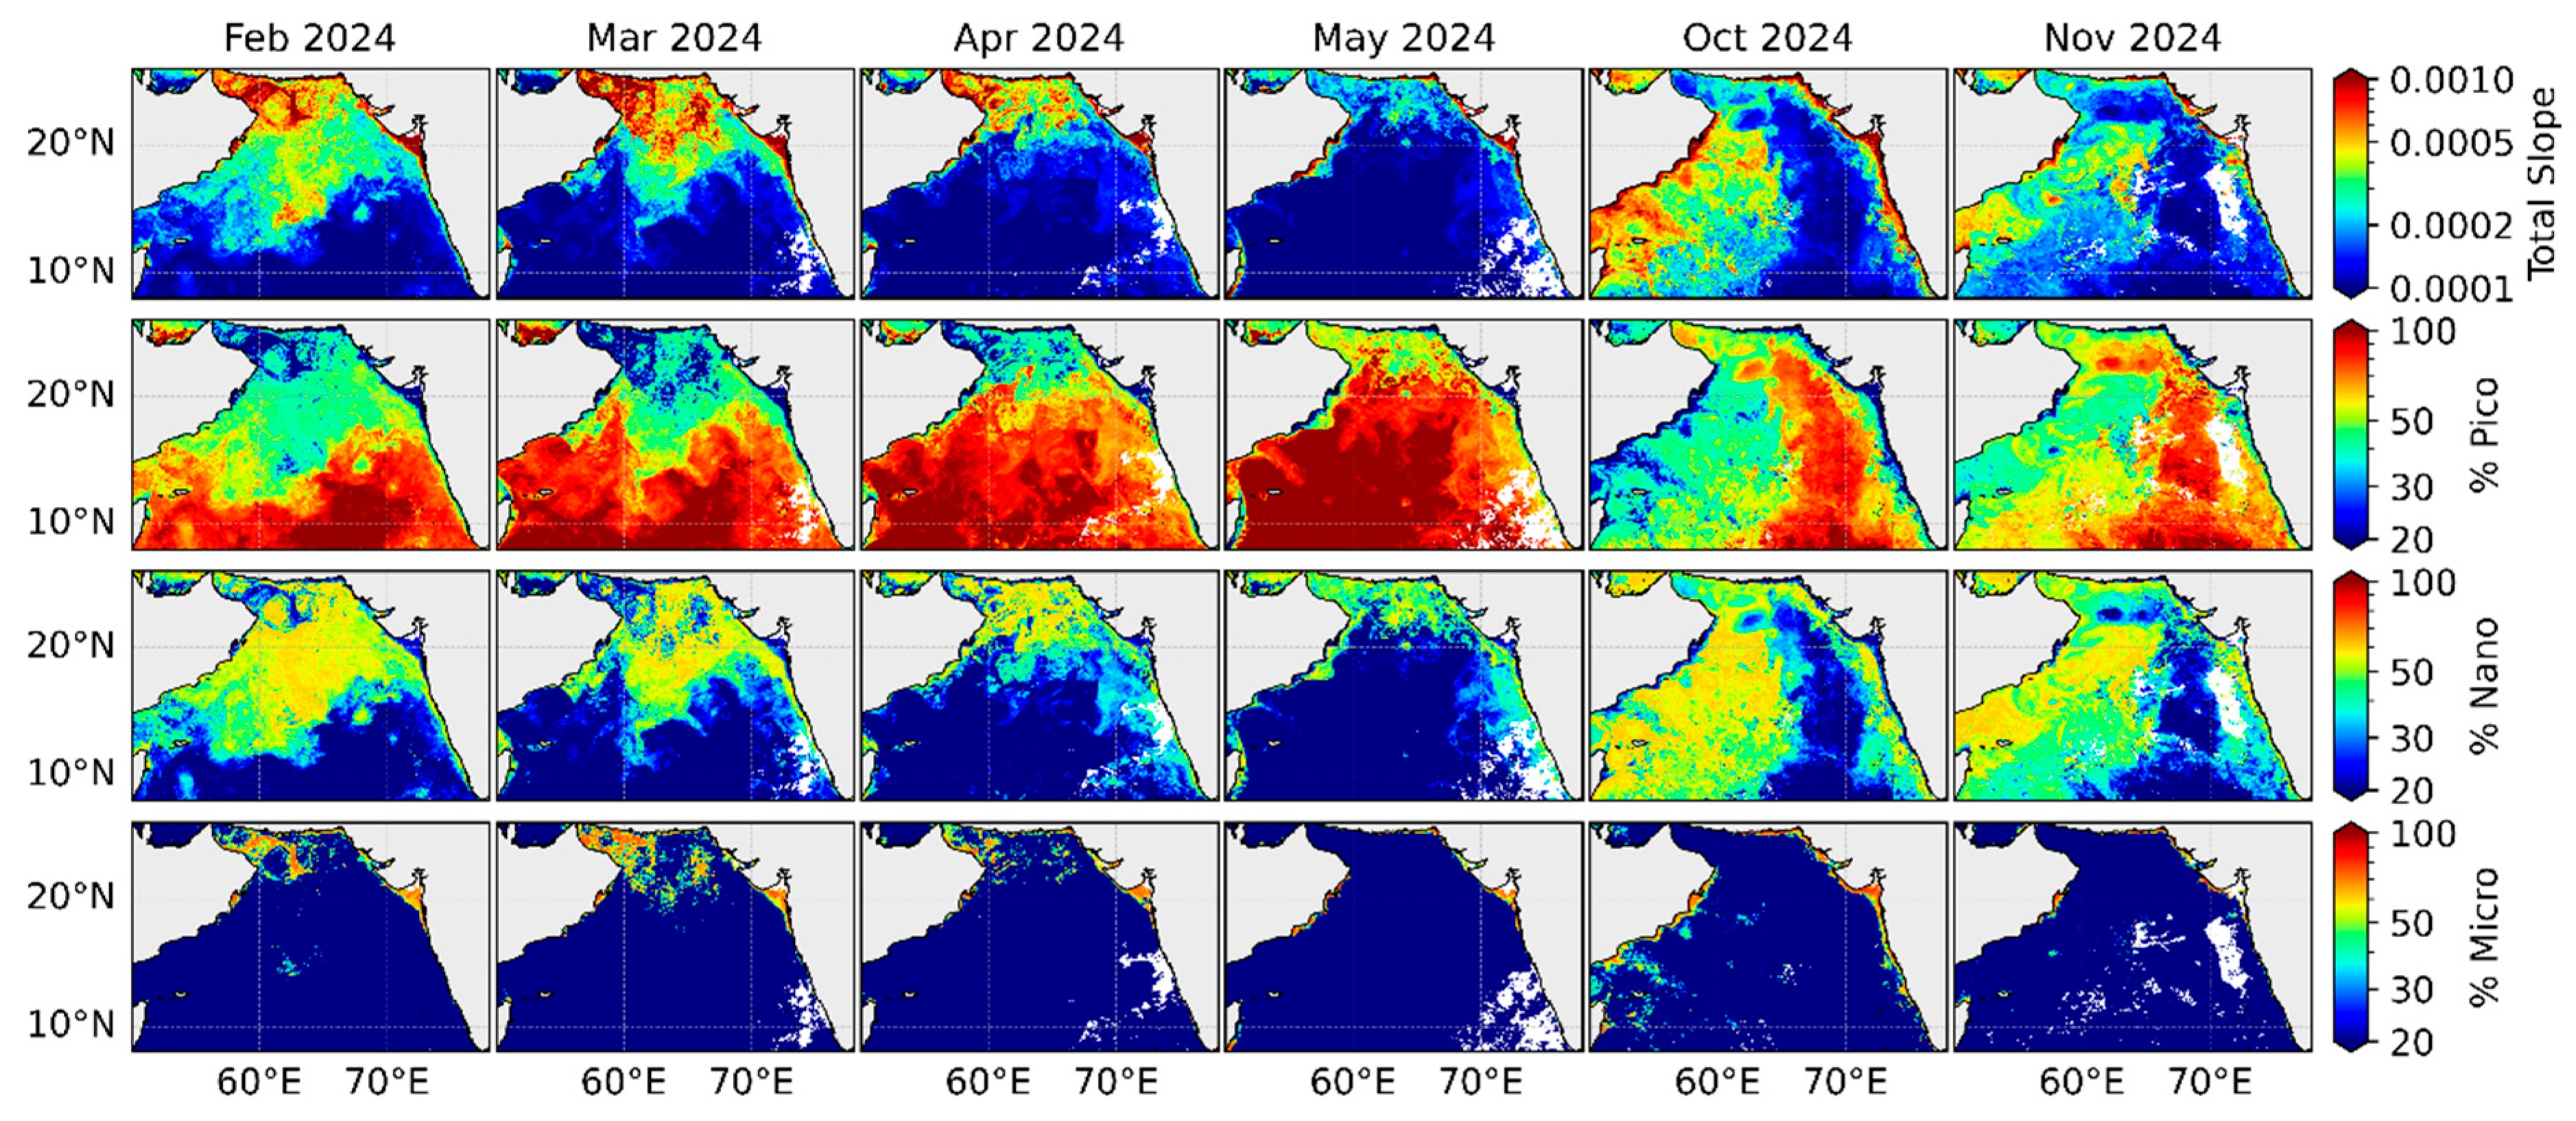
Satellite-based mapping of PSC distributions was performed using SNPP-VIIRS Level 3 monthly composites (4 km resolution) by applying the empirically derived equations for pico-, nano-, and micro-phytoplankton obtained from in situ absorption spectra (Section 3.1). The resulting monthly composites provide a synoptic view of PSC patterns across the Arabian Sea during the late winter–pre-monsoon period (February–May) and the post-monsoon transition period (October–November) of 2024 (Figure 7) [18,22]. During the late winter–pre-monsoon period, pico-phytoplankton consistently dominated the central and open-ocean regions of the Arabian Sea, accounting for more than 80% of the phytoplankton biomass in oligotrophic offshore waters. Nano-phytoplankton displayed elevated fractions in coastal and transitional waters, forming a peripheral band between the offshore pico-dominated basin and more productive coastal regions. Their contributions generally ranged between 30 and 60%, particularly during March–April. Because of persistent cloud cover during the summer monsoon, satellite imagery from June to September 2024 was excluded from the analysis. During the post-monsoon transition period, PSC distributions showed increased spatial variability, with enhanced nano- and micro-phytoplankton fractions across coastal and northern regions of the basin.
In the northern Arabian Sea, including the northwestern Arabian Sea and the Sea of Oman region, elevated micro-phytoplankton fractions were observed during the late winter and early pre-monsoon months. Micro-phytoplankton concentrations were highest in regions influenced by coastal productivity and winter bloom activity, especially along the northwestern Arabian Sea and the northeastern margin. In contrast, the western Arabian Sea along the Somali coast exhibited comparatively high spectral slope values during the post-monsoon transition months (October–November) without a corresponding dominance of micro-phytoplankton. Instead, satellite-derived PSC fields indicated more mixed phytoplankton communities with substantial contributions from nano-phytoplankton. Enhanced nano fractions were observed in coastal and transitional waters forming part of the peripheral band separating the productive coastal regions from the oligotrophic offshore basin [18,54]. The contrast between micro-phytoplankton-dominated blooms in the northern Arabian Sea and the more mixed communities observed along the Somali coast highlights the regional variability in phytoplankton size structure across the Arabian Sea. These patterns are derived from optical PSC distributions obtained from satellite observations and are interpreted in the context of previously reported regional studies. This seasonal framing presented here highlights differences in PSC distributions between the late winter–pre-monsoon and post-monsoon transition periods.
Validation against 27 collocated in-situ HPLC pigment observations demonstrated a 74% agreement between satellite-derived PSC classifications and pigment-based PSC estimates (Table 3). Most discrepancies occurred at the nano–micro class boundaries and in optically complex nearshore regions, reflecting the known challenges in resolving transitional phytoplankton communities using remote sensing and pigment-based approaches. Taken together, the absorption-based PSC retrievals from satellite observations capture the spatial variability and seasonal transitions of phytoplankton size structure across the Arabian Sea. This approach provides a practical framework for synoptic assessment of seasonal and regional shifts in phytoplankton functional composition across the study region.

4. Discussion

4.1. Absorption Slope Dynamics and Size-Dependent Optical Signatures of Phytoplankton

The strong power-law relationship between a p h ( 443 ) and S443–510 (R2 = 0.96, p < 0.001) (Figure 2) indicates that these optical parameters can serve as effective optical indicators for distinguishing PSCs in the Arabian Sea. Although both aph(443) and S443–510 are derived from the same absorption spectrum, they represent different characteristics. The aph(443) parameter reflects the absorption magnitude at a single wavelength, whereas S443–510 describes how absorption changes across the wavelength range. Because the spectral slope is determined by the relative change in absorption between wavelengths rather than by absolute magnitude, these two parameters are not mathematically dependent on each other. The strong relationship, therefore, reflects underlying size-dependent optical properties, particularly the pigment packaging effect [39]. The persistence of this relationship across pre-monsoon, monsoon, and post-monsoon observations further suggests that it reflects intrinsic size-dependent absorption characteristics rather than seasonal forcing alone. The derived regression equations (Figure 3) captured regional variability and enabled differentiation of pico-, nano-, and micro-phytoplankton populations across bloom and non-bloom regimes, consistent with observations made during the Arabian Sea JGOFS programme [29,31,32]. These results align closely with the global absorption-based PSC models [13,40], while the region-specific fine-tuning improves representation of trophic and optical gradients characteristic of the Arabian Sea. This adjustment therefore represents a regionally optimized parameterization adapted to the Arabian Sea optical conditions rather than a direct transfer of globally derived boundary values. Similar a p h -slope relationships reported in previous optical studies [16,19,33,55] have also been shown to respond to shifts in phytoplankton community structure, allowing detection of transitions from small-cell (pico/nano) to large-cell (micro) dominance. The spatial patterns observed are consistent with previously reported seasonal mixing and stratification processes in the region [25,26], which are known to influence phytoplankton community structure. The predictive performance of the regression models highlights the potential of absorption-based approaches to resolve PSCs patterns at synoptic scales, providing insights into seasonal shifts in phytoplankton size structure variability in the Arabian Sea [56,57,58,59].
Distinct absorption spectral signatures across PSCs under low- and high-biomass conditions revealed clear optical differentiation of community structure in the Arabian Sea (Figure 4). The aph(443)-S443–510 based classification captured size-dependent absorption variability, with pico-phytoplankton in oligotrophic waters characterized by low absorption and steep blue-region slopes [39,60], nano-phytoplankton showing intermediate absorption and spectral curvature [13,16], and micro-phytoplankton associated with bloom conditions, exhibiting high absorption and pronounced chlorophyll peaks near 443 and 675 nm [12,19,25]. These optical patterns are consistent with trends documented in earlier pigment-based studies [33,40,49] supporting the interpretation that increasing aph(443) corresponds to shifts toward larger, more pigment-rich phytoplankton. The transition from pico to micro that dominated communities along the absorption gradient also reflects the well-known inverse link between cell size and pigment packaging efficiency [60,61]. Elevated absorption observed during bloom periods (Figure 4b) is consistent with previously reported occurrences of large diatoms and mixotrophic dinoflagellates under enhanced-nutrient conditions [19,25]. Nano-phytoplankton, however, tended to show mixed spectral traits, likely due to their taxonomic diversity and overlapping pigment signatures, a source of optical ambiguity noted in other regional and global PSC studies [16,33]. The partial overlap observed along the aph(443) gradient highlights the intrinsic continuum of phytoplankton size structure, particularly within the nano fraction. A threshold sensitivity analysis further indicated that agreement between aph-based and pigment-derived classifications remained relatively stable for variations in the upper boundary, while moderate sensitivity was observed near the pico–nano transition. Most discrepancies occurred near class boundaries, reflecting gradual ecological transitions rather than random misclassification. Such transitional behaviour has been widely reported in previous PSC studies, where nano-sized communities are generally more difficult to resolve because they occupy intermediate optical and ecological regimes between pico- and micro-dominated assemblages [13,16]. Despite this transitional variability, an aph(443)-based approach was able to capture the major shifts in size structure and identify bloom development across different tropic regimes [19,62]. By adapting and refining the established bio-optical approaches [13,40,49], the present study demonstrates that absorption-derived PSCs provide a regionally tuned framework for tracking changes in phytoplankton community composition in the Arabian Sea. The present analysis includes observations collected across pre-monsoon, summer monsoon, winter monsoon and post-monsoon seasonal phases; however, the summer monsoon phase is represented by a single cruise (RR2306, June 2023). Although this cruise captured peak monsoon hydrographic conditions, additional observations across multiple monsoon cycles would further strengthen the assessment of interannual variability in PSCs.

4.2. Optical and Ecological Interpretation of PSC Transitions Along the aph(443) Gradient

The changes observed in the PSC fractions along the aph(443) gradient are consistent with established ecological and bio-optical patterns describing how phytoplankton communities vary across different light environments (Figure 5). At the low end of the absorption range (aph(443) < 0.011 m−1), pico-phytoplankton dominate, consistent with their competitive advantage in oligotrophic environments, where small cell size and high surface-to-volume ratios support efficient nutrient uptake and light harvesting [49]. Their decline with increasing aph(443) corresponds to a transition toward higher-biomass conditions typically associated with larger phytoplankton. Nano-phytoplankton reach their highest relative abundance at intermediate aph(443) levels (0.011 < aph(443) ≤ 0.059 m−1), reflecting their role as a transitional group between pico- and micro-dominated communities, as widely reported in global optical and pigment-based studies [16,40]. In the higher absorption regime (aph(443) > 0.059 m−1), micro-plankton become more prevalent, consistent with bloom conditions documented in previous regional studies [19,25]. This size-structured progression aligns with well-established patterns in phytoplankton ecology, where small cells tend to dominate under oligotrophic conditions, while larger cells are more common in nutrient-enriched or bloom-prone environments [13,16,40,49,62]. The inverse relationship between total absorption and the contribution of small cells also reflects the influence of pigment packaging and cellular geometry on optical properties [60,61]. Similar trends have been documented using both pigment-based [51,52] and absorption-based approaches [19,33]. Together, these consistencies support the use of aph(443)-derived PSC partitioning for interpreting phytoplankton community variability across contrasting trophic states in the Arabian Sea.

4.3. Performance of the PSC Model and Its Application to Regional Phytoplankton Dynamics in the Arabian Sea

The absorption-based PSC model showed that the use of regionally tuned absorption–size relationships resulted in reduced error and improved agreement in PSC estimates for the Arabian Sea dataset. The comparison presented here is based on descriptive performance metrics (regression slope, R2, and RMSE) rather than formal statistical significance testing. The model showed a good consistency with in situ aph(443) measurements, yielding the slopes close to unity (0.78–0.81) and relatively low errors across the pico-, nano-, and micro-phytoplankton groups (Table 2). These results suggest that the regionally tuned PSC model captures the optical characteristics of the different PSCs in the Arabian Sea with improved consistency relative to the global approach. These findings are consistent with the well-established relationships between phytoplankton absorption and cell size documented in earlier optical studies [39,60,61], which describe predictable changes in absorption magnitude and spectral slope across size classes. In comparison, global aph-based PSC models [16,40] exhibited less consistent performance in the Arabian Sea, with higher regression slopes and larger errors than those obtained with the regionally tuned PSC model. The threshold adjustment presented here, therefore, represents a regionally optimized calibration tailored to the optical and trophic characteristics of the Arabian Sea, rather than a direct transfer of globally derived boundary values. Similar differences have been noted when global PSC models are applied to low-latitude environments, where pigment packaging, taxonomic composition, and light–nutrient conditions differ from those in the regions where those models were originally developed [33,49,51]. The distinctive oligotrophic-to-mesotrophic optical characteristics of the Arabian Sea, such as relatively high pigment-specific absorption in small cells and stronger packaging effects in micro-phytoplankton, likely contribute to these differences and highlight the importance of regional tuning [25,26]. The chl-a-based PSC models [13,14,19,53] also showed larger uncertainties (Figure 6, Table 2), particularly for the nano size class. This behaviour is consistent with previous findings that bulk chl-a is not always a reliable indicator of cell size, because it is strongly influenced by photoacclimation, pigment composition, and taxonomic variability [49,63]. The complex optical environment of the Arabian Sea, shaped by monsoon-driven stratification and mixing [18,54] and episodic blooms with variable pigment composition [25,26], further affects chlorophyll-based size relationships. These factors likely contribute to the higher error ranges observed in chl-a-based models and highlight the advantages of absorption-based approaches in this region.
Overall, these results support the application of absorption-based approaches for describing phytoplankton community structure in low-latitude marine ecosystems and provide a regionally consistent basis for applying the model to satellite-derived aph(443) fields to examine large-scale patterns of PSCs. The present tuning is primarily based on observations from the northern and central Arabian Sea. Expanded sampling across additional hydrographic provinces would further strengthen basin-scale validation, particularly in regions characterized by persistent upwelling and strong monsoon forcing. Although the number of collocated samples is limited, the stations span contrasting trophic regimes and size-dominance states. When applied to satellite-derived aph(443) observations, the framework provides a synoptic view of phytoplankton size class variability across the basin and helps identify regional contrasts between the northern Arabian Sea and the western Arabian Sea.
Synoptic-scale satellite observations using SNPP-VIIRS Level 3 aph(443) data revealed pronounced seasonal and spatial variability in PSC distributions across the Arabian Sea (Figure 7). The empirically tuned aph(443)-based PSC framework effectively captured clear transitions in community structure across different trophic regimes. During the late winter–pre-monsoon period, pico-phytoplankton dominated the oligotrophic central Arabian Sea, while nano-phytoplankton were more prevalent in coastal and transitional regions, forming an intermediate band between offshore oligotrophic waters and more productive coastal zones. Such size-structured distributions are consistent with previously reported trophic gradients in the Arabian Sea, where small phytoplankton typically dominate stratified offshore waters and larger phytoplankton occur in nutrient-enriched regions influenced by mixing or upwelling processes [18,22]. The ecological interpretations presented here are based on optical PSC patterns derived from satellite and in situ absorption measurements and are interpreted in the context of previously reported regional studies; they do not represent direct measurements of nutrient dynamics or ecosystem processes in the present dataset [35,51]. Enhanced micro-phytoplankton fractions observed in the northern Arabian Sea along the Sea of Oman during the late winter and early pre-monsoon period are consistent with previously documented winter convective mixing events in this region [18,29,30]. Cooling and vertical mixing during the northeast monsoon introduce nutrients into the euphotic zone, stimulating phytoplankton blooms often dominated by larger diatoms and other micro-phytoplankton groups [29,30]. The coincidence of elevated absorption slopes and increased micro-phytoplankton fractions observed in this study suggests that the absorption-based PSC framework effectively captures these bloom-driven shifts in phytoplankton community structure associated with winter mixing in the northern Arabian Sea. In contrast, the western Arabian Sea along the Somali coast exhibited comparatively higher total absorption slope values during the post-monsoon transition period without a corresponding dominance of micro-phytoplankton. Instead, the satellite-derived PSC fields indicated more mixed phytoplankton communities with substantial contributions from nano-phytoplankton. This pattern coincides with the western Arabian Sea upwelling system along the Somali coast and may reflect seasonal changes in phytoplankton community structure associated with the relaxation phase of the southwest monsoon [18,64,65,66]. During this period, changes in nutrient supply and stratification can lead to shifts in phytoplankton community composition, often favouring intermediate-sized phytoplankton assemblages rather than large bloom-forming species [18,54]. The contrast between micro-phytoplankton-dominated blooms in the northern Arabian Sea and the more mixed nano-dominated communities along the Somali coast highlights the strong regional variability in phytoplankton size structure across the Arabian Sea.
Overall, these satellite-derived PSC patterns demonstrate that the regionally tuned absorption-based approach can resolve large-scale spatial and seasonal variability in phytoplankton community structure across different hydrographic regimes of the Arabian Sea. By linking satellite-retrieved aph(443) products with empirically derived PSC relationships, the method provides a synoptic framework for examining phytoplankton size class variability across contrasting hydrographic regimes of the Arabian Sea. Such observations contribute to improved understanding of regional phytoplankton dynamics and support the development of satellite-based ecological monitoring approaches in monsoon-influenced ocean systems. Further validation with expanded in situ observations across additional regions of the basin would help strengthen the broader applicability of this approach.

5. Conclusions

This study demonstrates that aph(443) and S443–510 can serve as practical optical indicators for distinguishing PSCs in the Arabian Sea. The strong relationship between these two variables enabled effective differentiation of pico-, nano-, and micro-phytoplankton, and absorption-based classifications showed good agreement with pigment-derived measurements. When applied to VIIRS aph observations, the framework reproduced large-scale spatial and seasonal patterns, ranging from pico-dominated oligotrophic waters to enhanced micro-phytoplankton fractions associated with winter mixing in the northern Arabian Sea. Overall, the combined use of in situ absorption measurements with satellite-derived aph products provides a practical framework for monitoring phytoplankton community variability at regional scales. The regionally tuned absorption–size relationships developed in this study provide an empirical basis for improving satellite-based PSC retrievals in optically complex, monsoon-influenced environments such as the Arabian Sea. With continued improvements in bio-optical algorithms and expanded in situ observations, this approach can support more robust satellite-based monitoring of phytoplankton community structure and ecosystem variability in monsoon-influenced marine systems.

Supplementary Materials

The following supporting information can be downloaded at: https://www.mdpi.com/article/10.3390/rs18101451/s1, Figure S1: Spatial distribution of phytoplankton size classes (micro, nano, pico-phytoplankton) overlaid on composite satellite-derived surface chlorophyll-a concentrations (mg m−3) for each research cruise (SS348, SS356, SS383, RR2306, SN181, SAMA025) in the Arabian Sea. Coloured markers indicate the sampled stations assigned to each size class based on HPLC pigment analysis.

Author Contributions

R.C.N.: Data curation, Conceptualization, Formal analysis, Methodology, Writing—original draft, A.A.L.: Conceptualization, Data curation, Methodology, Formal analysis, and Supervision, J.I.G.: Technical support, Formal analysis, Methodology, review and editing, S.R.P. and S.K.B.: Methodology, Data curation, review and editing, R.K. and A.S.: Data curation, Formal analysis, review and editing. All authors have read and agreed to the published version of the manuscript.

Funding

This research received no external funding. The APC was funded by the Indian National Centre for Ocean Information Services (INCOIS), India.

Data Availability Statement

The satellite data used in the study are openly available, and the access links are provided in the methodology section. The in-situ data presented in this study are available on reasonable request from the corresponding author.

Acknowledgments

The authors gratefully acknowledge the financial support provided by the Indian National Centre for Ocean Information Services (INCOIS), Ministry of Earth Sciences (MoES), Government of India, which enabled the successful completion of the research cruises and associated analysis. We thank the Centre for Marine Living Resources and Ecology (CMLRE) for facilitating access to the research vessel FORV Sagar Sampada, and the National Institute of Ocean Technology (NIOT) for the vessels Sagar Nidhi and Sagar Manjusha. Special thanks are extended to the captain and crew of R/V Roger Revelle for their support during the EKAMSAT programme under MoES. We sincerely thank Crystal Thomas (NASA Goddard Space Flight Center, Greenbelt, MD, USA ) for conducting the HPLC pigment analysis as part of the EKAMSAT collaboration. This manuscript was accelerated and fine-tuned during the first author’s visit to Columbia University, Lamont-Doherty Earth Observatory (LDEO), New York, USA, supported by the Trevor Platt IOCCG Scholarship, and we gratefully acknowledge the International Ocean Colour Coordinating Group (IOCCG) for this opportunity. Joaquim I. Goes contribution to this work is supported by NASA Grants 80NSSC20K0014 and 80NSSC24K0893. We also thank Antonio Mannino (Ocean Ecology Laboratory, NASA Goddard Space Flight Center, Greenbelt, MD, USA) for his support and contributions to this study as a part of EKAMSAT programme. This work forms part of the doctoral research of R. Chandrasekhar Naik. The INCOIS Contribution number is 704, and the NCPOR Contribution number is J-92/2025-26.

Conflicts of Interest

The authors declare no conflict of interest.

References

  1. Falkowski, P.G.; Barber, R.T.; Smetacek, V. Biogeochemical Controls and Feedbacks on Ocean Primary Production. Science 1998, 281, 200–206. [Google Scholar] [CrossRef] [PubMed]
  2. Brewin, R.J.W.; Sathyendranath, S.; Platt, T.; Bouman, H.; Ciavatta, S.; Dall’Olmo, G.; Dingle, J.; Groom, S.; Jönsson, B.; Kostadinov, T.S.; et al. Sensing the ocean biological carbon pump from space: A review of capabilities, concepts, research gaps and future developments. Earth-Sci. Rev. 2021, 217, 103604. [Google Scholar] [CrossRef]
  3. Fujiki, T.; Taguchi, S. Variability in chlorophyll a specific absorption coefficient in marine phytoplankton as a function of cell size and irradiance. J. Plankton Res. 2002, 24, 859–874. [Google Scholar] [CrossRef]
  4. Pandi, S.R.; Tripathy, S.C.; Shaju, S.S.; Minu, P.; Kerkar, A.U.; Bajish, C.C.; Anilkumar, N. Interannual variability of surface bio-optical characteristics in the frontal zones of the Indian sector of the Southern Ocean during austral summer. Polar Sci. 2023, 36, 100944. [Google Scholar] [CrossRef]
  5. Lohrenz, S.E. A novel theoretical approach to correct for pathlength amplification and variable sampling loading in measurements of particulate spectral absorption by the quantitative filter technique. J. Plankton Res. 2000, 22, 639–657. [Google Scholar] [CrossRef]
  6. Babin, M.; Stramski, D.; Ferrari, G.M.; Claustre, H.; Bricaud, A.; Obolensky, G.; Hoepffner, N. Variations in the light absorption coefficients of phytoplankton, nonalgal particles, and dissolved organic matter in coastal waters around Europe. J. Geophys. Res. Oceans 2003, 108, 3211. [Google Scholar] [CrossRef]
  7. Lohrenz, S.E.; Weidemann, A.D.; Tuel, M. Phytoplankton spectral absorption as influenced by community size structure and pigment composition. J. Plankton Res. 2003, 25, 35–61. [Google Scholar] [CrossRef]
  8. Bricaud, A.; Claustre, H.; Ras, J.; Oubelkheir, K. Natural variability of phytoplanktonic absorption in oceanic waters: Influence of the size structure of algal populations. J. Geophys. Res. Oceans 2004, 109, C11010. [Google Scholar] [CrossRef]
  9. Hayward, A.; Pinkerton, M.H.; Wright, S.W.; Gutiérrez-Rodriguez, A.; Law, C.S. Twenty-six years of phytoplankton pigments reveal a circumpolar Class Divide around the Southern Ocean. Commun. Earth Environ. 2024, 5, 92. [Google Scholar] [CrossRef]
  10. O’Reilly, J.E.; Maritorena, S.; Mitchell, B.G.; Siegel, D.A.; Carder, K.L.; Garver, S.A.; Kahru, M.; McClain, C. Ocean color chlorophyll algorithms for SeaWiFS. J. Geophys. Res. Oceans 1998, 103, 24937–24953. [Google Scholar] [CrossRef]
  11. Behrenfeld, M.J.; Falkowski, P.G. Photosynthetic rates derived from satellite-based chlorophyll concentration. Limnol. Oceanogr. 1997, 42, 1–20. [Google Scholar] [CrossRef]
  12. Sathyendranath, S.; Cota, G.; Stuart, V.; Maass, H.; Platt, T. Remote sensing of phytoplankton pigments: A comparison of empirical and theoretical approaches. Int. J. Remote Sens. 2001, 22, 249–273. [Google Scholar] [CrossRef]
  13. Brewin, R.J.W.; Sathyendranath, S.; Hirata, T.; Lavender, S.J.; Barciela, R.M.; Hardman-Mountford, N.J. A three-component model of phytoplankton size class for the Atlantic Ocean. Ecol. Modell. 2010, 221, 1472–1483. [Google Scholar] [CrossRef]
  14. Brewin, R.J.W.; Devred, E.; Sathyendranath, S.; Lavender, S.J.; Hardman-Mountford, N.J. Model of phytoplankton absorption based on three size classes. Appl. Opt. 2011, 50, 4535–4549. [Google Scholar] [CrossRef]
  15. Devred, E.; Sathyendranath, S.; Stuart, V.; Maass, H.; Ulloa, O.; Platt, T. A two-component model of phytoplankton absorption in the open ocean: Theory and applications. J. Geophys. Res. Oceans 2006, 111, C03011. [Google Scholar] [CrossRef]
  16. Devred, E.; Sathyendranath, S.; Stuart, V.; Platt, T. A three component classification of phytoplankton absorption spectra: Application to ocean-color data. Remote Sens. Environ. 2011, 115, 2255–2266. [Google Scholar] [CrossRef]
  17. Pandi, S.R.; Tripathy, S.C.; Mendes, C.R.B.; Naik, R.C.; Padhi, S.K.; Lotliker, A.A.; Mohan, R. Three-component models for the detection of phytoplankton size classes in the Indian sector of the Southern Ocean: Insights into climate-driven community shifts. J. Mar. Syst. 2025, 251, 104115. [Google Scholar] [CrossRef]
  18. Wiggert, J.D.; Hood, R.R.; Banse, K.; Kindle, J.C. Monsoon-driven biogeochemical processes in the Arabian Sea. Prog. Oceanogr. 2005, 65, 176–213. [Google Scholar] [CrossRef]
  19. Sahay, A.; Ali, S.M.; Gupta, A.; Goes, J.I. Ocean color satellite determinations of phytoplankton size class in the Arabian Sea during the winter monsoon. Remote Sens. Environ. 2017, 198, 286–296. [Google Scholar] [CrossRef]
  20. Albin, K.J.; Jyothibabu, R.; Alok, K.T.; Santhi Krishnan, S.; Sherin, C.K.; Gupta, G.V.M. Effects of seasons and successive upwelling phases on phytoplankton size classes in the Southeast Arabian Sea. Mar. Environ. Res. 2024, 198, 106568. [Google Scholar] [CrossRef]
  21. Naqvi, S.W.A.; Bange, H.W.; Farías, L.; Monteiro, P.M.S.; Scranton, M.I.; Zhang, J. Marine hypoxia/anoxia as a source of CH4 and N2O. Biogeosciences 2010, 7, 2159–2190. [Google Scholar] [CrossRef]
  22. Goes, J.I.; Thoppil, P.G.; Gomes, H.D.R.; Fasullo, J.T. Warming of the Eurasian landmass is making the Arabian sea more productive. Science 2005, 308, 545–547. [Google Scholar] [CrossRef] [PubMed]
  23. Lachkar, Z.; Lévy, M.; Smith, K.S. Strong Intensification of the Arabian Sea Oxygen Minimum Zone in Response to Arabian Gulf Warming. Geophys. Res. Lett. 2019, 46, 5420–5429. [Google Scholar] [CrossRef]
  24. Rixen, T.; Cowie, G.; Gaye, B.; Goes, J.; Do Rosário Gomes, H.R.; Hood, R.R.; Lachkar, Z.; Schmidt, H.; Segschneider, J.; Singh, A. Reviews and syntheses: Present, past, and future of the oxygen minimum zone in the northern Indian Ocean. Biogeosciences 2020, 17, 6051–6080. [Google Scholar] [CrossRef]
  25. Do Rosário Gomes, H.; Goes, J.I.; Matondkar, S.G.P.; Buskey, E.J.; Basu, S.; Parab, S.; Thoppil, P. Massive outbreaks of Noctiluca scintillans blooms in the Arabian Sea due to spread of hypoxia. Nat. Commun. 2014, 5, 4862. [Google Scholar] [CrossRef]
  26. Goes, J.I.; Tian, H.; Gomes, H.D.R.; Anderson, O.R.; Al-Hashmi, K.; deRada, S.; Luo, H.; Al-Kharusi, L.; Al-Azri, A.; Martinson, D.G. Ecosystem state change in the Arabian Sea fuelled by the recent loss of snow over the Himalayan-Tibetan Plateau region. Sci. Rep. 2020, 10, 7422. [Google Scholar] [CrossRef]
  27. Sarma, N.S.; Baliarsingh, S.K.; Pandi, S.R.; Lotliker, A.A.; Samanta, A. Noctiluca blooms intensify when northwesterly winds complement northeasterlies in the northern Arabian Sea: Possible implications. Oceanologia 2022, 64, 717–734. [Google Scholar] [CrossRef]
  28. Shi, W.; Wang, M. Phytoplankton biomass dynamics in the Arabian Sea from VIIRS observations. J. Mar. Syst. 2022, 227, 103670. [Google Scholar] [CrossRef]
  29. Madhupratap, M.; Kumar, S.P.; Bhattathiri, P.M.A.; Kumar, M.D.; Raghukumar, S.; Nair, K.K.C.; Ramaiah, N. Mechanism of the biological response to winter cooling in the northeastern Arabian Sea. Nature 1996, 384, 549–552. [Google Scholar] [CrossRef]
  30. Kumar, S.P.; Ramaiah, N.; Gauns, M.; Sarma, V.V.S.S.; Muraleedharan, P.M.; Raghukumar, S.; Kumar, M.D.; Madhupratap, M. Physical forcing of biological productivity in the Northern Arabian Sea during the Northeast Monsoon. Deep Sea Res. II 2001, 48, 1115–1126. [Google Scholar] [CrossRef]
  31. Tarran, G.A.; Burkill, P.H.; Edwards, E.S.; Malcolm, E.; Woodward, S. Phytoplankton community structure in the Arabian Sea during and after the SW monsoon, 1994. Deep Sea Res. II 1999, 46, 655–676. [Google Scholar] [CrossRef]
  32. Ramaiah, N.; Raghukumar, S.; Mangesh, G.; Madhupratap, M. Seasonal variations in carbon biomass of bacteria, thraustochytrids and microzooplankton in the Northern Arabian Sea. Deep Sea Res. II 2005, 52, 1910–1921. [Google Scholar] [CrossRef]
  33. Kostadinov, T.S.; Siegel, D.A.; Maritorena, S. Global variability of phytoplankton functional types from space: Assessment via the particle size distribution. Biogeosciences 2010, 7, 3239–3257. [Google Scholar] [CrossRef]
  34. Mouw, C.B.; Chen, H.; McKinley, G.A.; Effler, S.; O’Donnell, D.; Perkins, M.G.; Strait, C. Evaluation and optimization of bio-optical inversion algorithms for remote sensing of Lake Superior’s optical properties. J. Geophys. Res. Oceans 2013, 118, 1696–1714. [Google Scholar] [CrossRef]
  35. IOCCG. Phytoplankton Functional Types from Space; Reports of the International Ocean-Colour Coordinating Group, No. 15; Sathyendranath, S., Ed.; IOCCG: Dartmouth, NS, Canada, 2014. [Google Scholar]
  36. Sieburth, J.M.N.; Smetacek, V.; Lenz, J. Pelagic ecosystem structure: Heterotrophic compartments of the plankton and their relationship to plankton size fractions. Limnol. Oceanogr. 1978, 23, 1256–1263. [Google Scholar] [CrossRef]
  37. Turner, K.J.; Mouw, C.B.; Hyde, K.J.W.; Morse, R.; Ciochetto, A.B. Optimization and assessment of phytoplankton size class algorithms for ocean color data on the Northeast U.S. continental shelf. Remote Sens. Environ. 2021, 267, 112733. [Google Scholar] [CrossRef]
  38. Flander-Putrle, V.; Francé, J.; Mozetič, P. Phytoplankton pigments reveal size structure and interannual variability of the coastal phytoplankton community (Adriatic sea). Water 2021, 14, 23. [Google Scholar] [CrossRef]
  39. Ciotti, Á.M.; Lewis, M.R.; Cullen, J.J. Assessment of the relationships between dominant cell size in natural phytoplankton communities and the spectral shape of the absorption coefficient. Limnol. Oceanogr. 2002, 47, 404–417. [Google Scholar] [CrossRef]
  40. Hirata, T.; Aiken, J.; Hardman-Mountford, N.; Smyth, T.J.; Barlow, R.G. An absorption model to determine phytoplankton size classes from satellite ocean colour. Remote Sens. Environ. 2008, 112, 3153–3159. [Google Scholar] [CrossRef]
  41. Ferrari, G.M.; Tassan, S. A method for the experimental determination of light absorption by aquatic heterotrophic bacteria. J. Plankton Res. 1998, 20, 757–766. [Google Scholar] [CrossRef]
  42. Tassan, S.; Ferrari, G.M. A Sensitivity analysis of Transmittence-Reflectence Method for measuring Light absorption by aquatic particles. J. Plankton Res. 2002, 24, 757–774. [Google Scholar] [CrossRef]
  43. Green, S.A.; Blough, N.V. Optical absorption and fluorescence properties of chromophoric dissolved organic matter in natural waters. Limnol. Oceanogr. 1994, 39, 1903–1916. [Google Scholar] [CrossRef]
  44. Kishino, M.; Takahashi, M.; Okami, N.; Ichimura, S. Estimation of the spectral absorption coefficients of phytoplankton in the sea. Bull. Mar. Sci. 1985, 37, 634–642. [Google Scholar]
  45. Barati, R. Application of excel solver for parameter estimation of the nonlinear Muskingum models. KSCE J. Civ. Eng. 2013, 17, 1139–1148. [Google Scholar] [CrossRef]
  46. Kurian, S.; Roy, R.; Repeta, D.J.; Gauns, M.; Shenoy, D.M.; Suresh, T.; Sarkar, A.; Narvenkar, G.; Johnson, C.G.; Naqvi, S.W.A. Seasonal occurrence of anoxygenic photosynthesis in Tillari and Selaulim reservoirs, Western India. Biogeosciences 2012, 9, 2485–2495. [Google Scholar] [CrossRef]
  47. Srichandan, S.; Baliarsingh, S.K.; Lotliker, A.A.; Prakash, S.; Samanta, A.; Sahu, K.C. A baseline investigation of phytoplankton pigment composition in contrasting coastal ecosystems of north-western Bay of Bengal. Mar. Pollut. Bull. 2020, 160, 111708. [Google Scholar] [CrossRef]
  48. Van Heukelem, L.; Thomas, C.S. Computer-assisted high-performance liquid chromatography method development with applications to the isolation and analysis of phytoplankton pigments. J. Chromatogr. A 2001, 910, 31–49. [Google Scholar] [CrossRef]
  49. Uitz, J.; Claustre, H.; Morel, A.; Hooker, S.B. Vertical distribution of phytoplankton communities in open ocean: An assessment based on surface chlorophyll. J. Geophys. Res. Oceans 2006, 111, C08005. [Google Scholar] [CrossRef]
  50. Strickland, J.D.H.; Parsons, T.R. A Practical Handbook of Seawater Analysis; Fisheries Research Board of Canada: Ottawa, ON, Canada, 1972. [Google Scholar]
  51. Brewin, R.J.W.; Sathyendranath, S.; Jackson, T.; Barlow, R.; Brotas, V.; Airs, R.; Lamont, T. Influence of light in the mixed-layer on the parameters of a three-component model of phytoplankton size class. Remote Sens. Environ. 2015, 168, 437–450. [Google Scholar] [CrossRef]
  52. Roy, R.; Chitari, R.; Kulkarni, V.; Krishna, M.S.; Sarma, V.V.S.S.; Anil, A.C. CHEMTAX-derived phytoplankton community structure associated with temperature fronts in the northeastern Arabian Sea. J. Mar. Syst. 2015, 144, 81–91. [Google Scholar] [CrossRef]
  53. Brewin, R.J.W.; Hirata, T.; Hardman-Mountford, N.J.; Lavender, S.J.; Sathyendranath, S.; Barlow, R. The influence of the Indian Ocean Dipole on interannual variations in phytoplankton size structure as revealed by Earth Observation. Deep Sea Res. II 2012, 77–80, 117–127. [Google Scholar] [CrossRef]
  54. Banse, K.; McClain, C.R. Winter blooms of phytoplankton in the Arabian Sea as observed by the Coastal Zone Color Scanner. Mar. Ecol. Prog. Ser. 1986, 34, 201–222. [Google Scholar] [CrossRef]
  55. Prakash, S.; Ramesh, R.; Sheshshayee, M.S.; Dwivedi, R.M.; Raman, M. Quantification of new production during a winter Noctiluca scintillans bloom in the Arabian Sea. Geophys. Res. Lett. 2008, 35, L08604. [Google Scholar] [CrossRef]
  56. Vinayachandran, P.N.M.; Masumoto, Y.; Roberts, M.J.; Huggett, J.A.; Halo, I.; Chatterjee, A.; Amol, P.; Gupta, G.V.M.; Singh, A.; Mukherjee, A.; et al. Reviews and syntheses: Physical and biogeochemical processes associated with upwelling in the Indian Ocean. Biogeosciences 2021, 18, 5967–6029. [Google Scholar] [CrossRef]
  57. Varunan, T.; Shanmugam, P. A model for estimating size-fractioned phytoplankton absorption coefficients in coastal and oceanic waters from satellite data. Remote Sens. Environ. 2015, 158, 235–254. [Google Scholar] [CrossRef]
  58. Buesseler, K.; Ball, L.; Andrews, J.; Benitez-Nelson, C.; Belastock, R.; Chai, F.; Chao, Y. Upper ocean export of particulate organic carbon in the Arabian Sea derived from thorium-234. Deep Sea Res. II 1998, 45, 2461–2487. [Google Scholar] [CrossRef]
  59. Garrison, D.L.; Gowing, M.M.; Hughes, M.P.; Campbell, L.; Caron, D.A.; Dennett, M.R.; Shalapyonok, A.; Olson, R.J.; Landry, M.R.; Brown, S.L.; et al. Microbial food web structure in the Arabian Sea: A US JGOFS study. Deep Sea Res. II 2000, 47, 1387–1422. [Google Scholar] [CrossRef]
  60. Bricaud, A.; Morel, A.; Babin, M.; Allali, K.; Claustre, H. Variations of light absorption by suspended particles with chlorophyll a concentration in oceanic (case 1) waters: Analysis and implications for bio-optical models. J. Geophys. Res. Oceans 1998, 103, 31033–31044. [Google Scholar] [CrossRef]
  61. Ciotti, A.M.; Bricaud, A. Retrievals of a size parameter for phytoplankton and spectral light absorption by colored detrital matter from water-leaving radiances at SeaWiFS channels in a continental shelf region off Brazil. Limnol. Oceanogr. Methods 2006, 4, 237–253. [Google Scholar] [CrossRef]
  62. Bock, N.; Goes, J.; Claustre, H.; Taillandier, V.; Gomes, H.D.R. Influence of mini warm pool extent on phytoplankton productivity and export in the Arabian sea. Deep Sea Res. I 2024, 214, 104406. [Google Scholar] [CrossRef]
  63. Mouw, C.B.; Hardman-Mountford, N.J.; Alvain, S.; Bracher, A.; Brewin, R.J.W.; Bricaud, A.; Ciotti, A.M.; Devred, E.; Fujiwara, A.; Hirata, T.; et al. A consumer’s guide to satellite remote sensing of multiple phytoplankton groups in the global ocean. Front. Mar. Sci. 2017, 4, 41. [Google Scholar] [CrossRef]
  64. Queste, B.Y.; Vic, C.; Heywood, K.J.; Piontkovski, S.A. Physical Controls on Oxygen Distribution and Denitrification Potential in the North West Arabian Sea. Geophys. Res. Lett. 2018, 45, 4143–4152. [Google Scholar] [CrossRef]
  65. Al-Yamani, F.; Yamamoto, T.; Al-Said, T.; Alghunaim, A. Dynamic hydrographic variations in northwestern Arabian Gulf over the past three decades: Temporal shifts and trends derived from long-term monitoring data. Mar. Pollut. Bull. 2017, 122, 488–499. [Google Scholar] [CrossRef]
  66. Schott, F.A.; Xie, S.P.; McCreary, J.P. Indian Ocean circulation and climate variability. Rev. Geophys. 2009, 47, RG1002. [Google Scholar] [CrossRef]
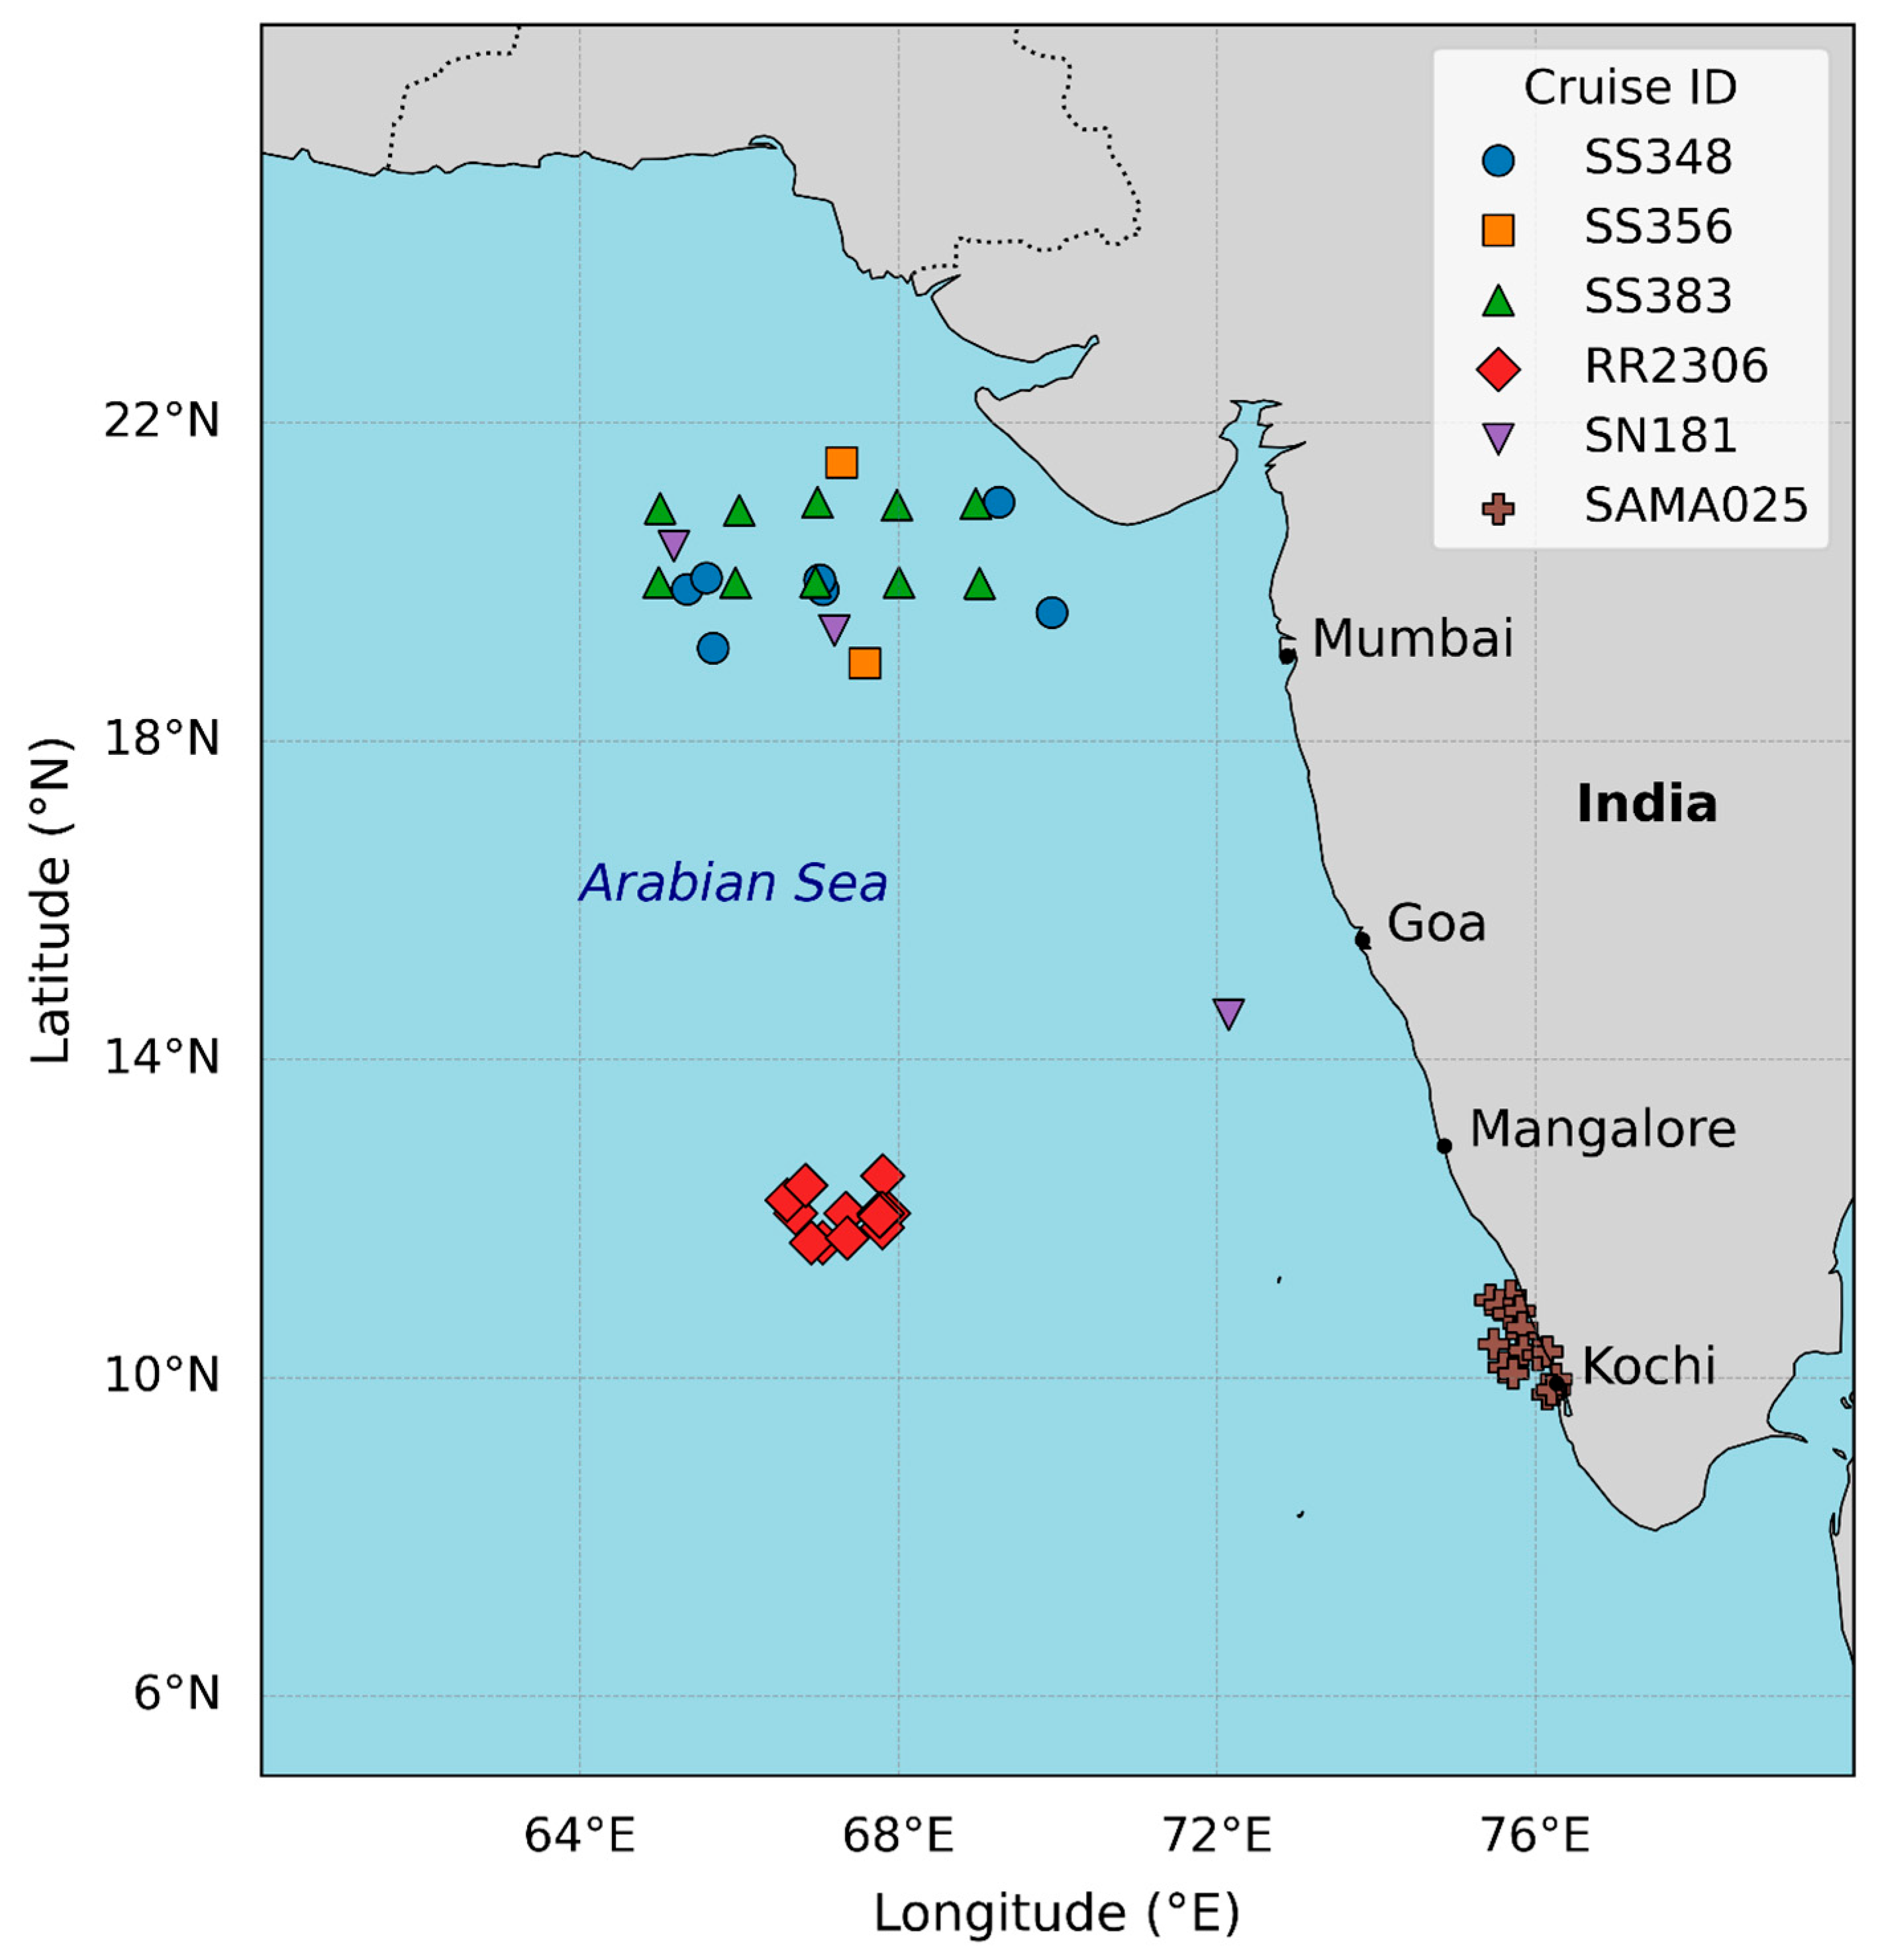
Figure 1. Map of the study area showing the sampling locations during six research cruises: SS348 (2016), SS356 (2017), and SS383 (2019) onboard ORV Sagar Sampada; RR2306 (2023) onboard R/V Roger Revelle; SN181 (2023) onboard Sagar Nidhi; and SAMA025 (2024) onboard Sagar Manjusha.
Remotesensing 18 01451 g001
Figure 2. The relationship between spectral slope S443–510 and phytoplankton absorption at 443 nm (aph(443)), with phytoplankton size classes (pico, nano, micro) estimated from HPLC pigment analysis. In the visual presentation, phytoplankton size classes are displaced at S = 0.002. lines. Vertical dashed lines indicate threshold boundaries for size classes, and the fitted power-law curve for all data points is shown.
Remotesensing 18 01451 g002
Figure 3. Empirical relationships between the spectral slope S443–510 and log10-transformed phytoplankton absorption coefficient aph(443) for pico-, nano-, and micro-phytoplankton size classes.
Remotesensing 18 01451 g003
Figure 4. Mean phytoplankton absorption spectra (aph(λ)) for different size classes in the study region. (a) Low-biomass conditions: Spectrally averaged aph(λ) for micro-, nano-, and pico-phytoplankton, classified using in situ chl-a concentrations (micro: >0.7 mg m−3; nano: 0.3–0.7 mg m−3; pico: ≤0.3 mg m−3). (b) High-biomass conditions: Representative absorption spectra for micro-phytoplankton (chl-a > 3 mg m−3) from different cruises (SS348, and SS356).
Remotesensing 18 01451 g004
Figure 5. Percent contribution of the three phytoplankton size classes (PSCs) with phytoplankton absorption (aph), shown on a logarithmic x-axis.
Remotesensing 18 01451 g005
Figure 6. Comparison of modelled and in situ phytoplankton size class (PSC) estimates for pico-, nano-, and micro-phytoplankton using (ac) absorption-based models and (df) chlorophyll-based models. The dashed line indicates the 1:1 reference. Coloured lines represent regression fits, and the blue shaded region in panels (ac) shows the 95% confidence interval of the model developed in this study. Previously published models are also included for comparison [13,14,16,19,40,53].
Remotesensing 18 01451 g006
Figure 7. Monthly distributions (February–May and October–November 2024) of the spectral slope (S443–510) and the fractional contributions of pico-, nano-, and micro-phytoplankton (%PSCs) across the Arabian Sea. PSC fractions were derived from VIIRS-derived aph(443) using regionally calibrated bio-optical thresholds established from in-situ absorption measurements. Warmer colours indicate higher spectral slopes or higher fractional dominance for the respective phytoplankton size classes.
Remotesensing 18 01451 g007
Table 1. Summary of research cruises in the Arabian Sea, including cruise ID, research vessel, sampling period, monsoonal season, and the number of surface samples analyzed for phytoplankton absorption (aph).
Cruise IdResearch VesselDate/MonthSeasonal
Phase
Number of aph Samples Collected
SS348Sagar SampadaMarch 2016PRM9
SS356Sagar SampadaFebruary 2017PRM8
SS383Sagar SampadaFebruary 2019PRM10
RR2306Roger RevelleJune 2023MON18
SN181Sagar NidhiOctober 2023POM3
SAMA025Sagar ManjushaJanuary 2024WM27
PRM = Pre-monsoon; MON = Summer monsoon; POM = Post-monsoon; WM = Winter monsoon.
Table 2. Statistical performance of absorption-based (aph(443)) and chlorophyll-based PSC models evaluated against in situ observations from the Arabian Sea dataset. Model performance is presented for the regionally tuned PSC model developed in this study and for previously published global PSC formulations, all evaluated using the same in situ dataset.
Model TypePSCnSlopeRMSEBiasReference Model
aph
Pico210.7860.0027−0.0024Present study
Nano400.8150.0066−0.0057
Micro140.8050.0508−0.0356
Pico210.62060.00120.0001Hirata et al., 2008 [40]
Nano401.16710.00960.0078
Micro122.18350.08270.035
Pico80.01320.0062−0.005Devred et al., 2011 [16]
Nano350.7590.0087−0.0055
Micro110.06450.1384−0.0862
chl-a
Pico270.13840.0537−0.0079Brewin et al., 2010 [13]
Nano271.37440.11620.0648
Micro270.61590.1191−0.0429
Pico270.2150.05340.0064Brewin et al., 2011 [14]
Nano271.02120.07920.0365
Micro270.71850.0925−0.029
Pico270.79340.09740.0104Brewin et al., 2012 [53]
Nano270.40790.08980.0528
Micro270.63980.1172−0.0492
Pico270.74260.0950.0278Sahay et al., 2017 [19]
Nano271.6340.10280.0291
Micro270.25260.2082−0.043
For each PSC (pico-, nano-, and micro-phytoplankton), the table reports the number of samples (n), regression slope, root mean square error (RMSE), and bias between modelled and in situ observations.
Table 3. Validation of absorption-based phytoplankton size class (PSCs) classification using VIIRS aph(443) and in situ pigment data. The table provides station-wise comparisons between in situ PSCs and VIIRS-derived PSC categories (±5-day window) for 27 stations from the February 2019 and June 2023 cruises.
St. IDDateLatLongTChl-aMicro%Nano%Pico%Sat aphSatellite DataaPSCsResult
SS14 February 201920.98468.9710.179427.18147.51825.3010.0051Nearest on 20190203 (−1 d)PicoDisagree
SS25 February 201920.96867.9820.173930.13743.5926.2730.000911 × 11 on 20190205 (0 d)PicoDisagree
SS36 February 201920.99966.9860.154312.0734.2553.680.021111 × 11 on 20190208 (+2 d)PicoAgree
SS47 February 201920.89966.0020.183120.9447.19631.8650.0051Nearest on 20190207 (0 d)PicoDisagree
SS58 February 201920.92665.010.158217.71134.39347.8960.00773 × 3 on 20190207 (−1 d)PicoAgree
SS69 February 201919.99764.990.213923.89452.23123.8750.003611 × 11 on 20190208 (−1 d)PicoDisagree
SS710 February 201919.98865.9540.247316.35455.26428.3810.0067Nearest on 20190211 (+1 d)PicoDisagree
SS811 February 201920.00566.9610.2484027.70872.2920.0093Nearest on 20190211 (0 d)PicoAgree
SS912 February 201919.99668.010.1274049.11850.8820.0078Nearest on 20190212 (0 d)PicoAgree
SS1013 February 201919.98469.0190.4243019.36880.6320.01773 × 3 on 20190213 (0 d)PicoAgree
RR111 June 202312.07167.8080.1512.4082.066685.5250.00911 × 11 on 20230612 (+1 d)PicoAgree
RR211 June 202312.0767.8740.11113.8342.524283.6410.00913 × 3 on 20230612 (+1 d)PicoAgree
RR312 June 202311.88967.8010.0938.98951.64289.3680.01083 × 3 on 20230613 (+1 d)PicoAgree
RR413 June 202312.53667.8070.12511.1853.118785.6960.00673 × 3 on 20230618 (+5 d)PicoAgree
RR514 June 202312.04567.7550.10515.4591.902882.6380.01093 × 3 on 20230613 (−1 d)PicoAgree
RR615 June 202312.04867.7530.10813.6222.50383.8750.0113Nearest on 20230613 (−2 d)PicoAgree
RR716 June 202312.05367.7740.10913.4181.828384.7540.011Nearest on 20230618 (+2 d)PicoAgree
RR817 June 202312.0767.340.1167.11061.369291.520.0114Nearest on 20230618 (+1 d)PicoAgree
RR918 June 202311.767.0510.25175.165.060819.7790.031Nearest on 20230618 (0 d)NanoDisagree
RR1018 June 202311.766.9031.70567.52922.3510.1210.0768Nearest on 20230618 (0 d)MicroAgree
RR1119 June 202312.0766.7070.50876.6677.686715.6460.1136Nearest on 20230617 (−2 d)MicroAgree
RR1219 June 202312.23566.5990.21258.9074.113836.9790.088711 × 11 on 20230617 (−2 d)MicroAgree
RR1320 June 202312.41766.8320.73178.83512.2678.89760.1259Nearest on 20230618 (−2 d)MicroAgree
RR1420 June 202311.7667.3560.72976.45214.3299.21830.0125Nearest on 20230618 (−2 d)PicoDisagree
RR1521 June 202312.06267.7590.0717.13370.649492.2170.01093 × 3 on 20230618 (−3 d)PicoAgree
RR1622 June 202312.06567.7980.07611.4610.865387.6740.01143 × 3 on 20230618 (−4 d)PicoAgree
RR1723 June 202312.03167.7640.08719.0390.995179.9660.0112Nearest on 20230618 (−5 d)PicoAgree
SS = SS383, RR = Roger Revelle, TChl-a = HPLC-based total chlorophyll-a, Sat aph = SNPP-VIIRS Level-2 satellite aph, DD = day difference (in parentheses after the date of “Satellite Data” column), aPSCs = in situ aph PSCs dominant.
Disclaimer/Publisher’s Note: The statements, opinions and data contained in all publications are solely those of the individual author(s) and contributor(s) and not of MDPI and/or the editor(s). MDPI and/or the editor(s) disclaim responsibility for any injury to people or property resulting from any ideas, methods, instructions or products referred to in the content.