


Analysis of Ionospheric Disturbances in China During the December 2023 Geomagnetic Storm Using Multi-Instrument Data


Abstract
1. Introduction
2. Data and Methods
3. Ionospheric TEC Fluctuations
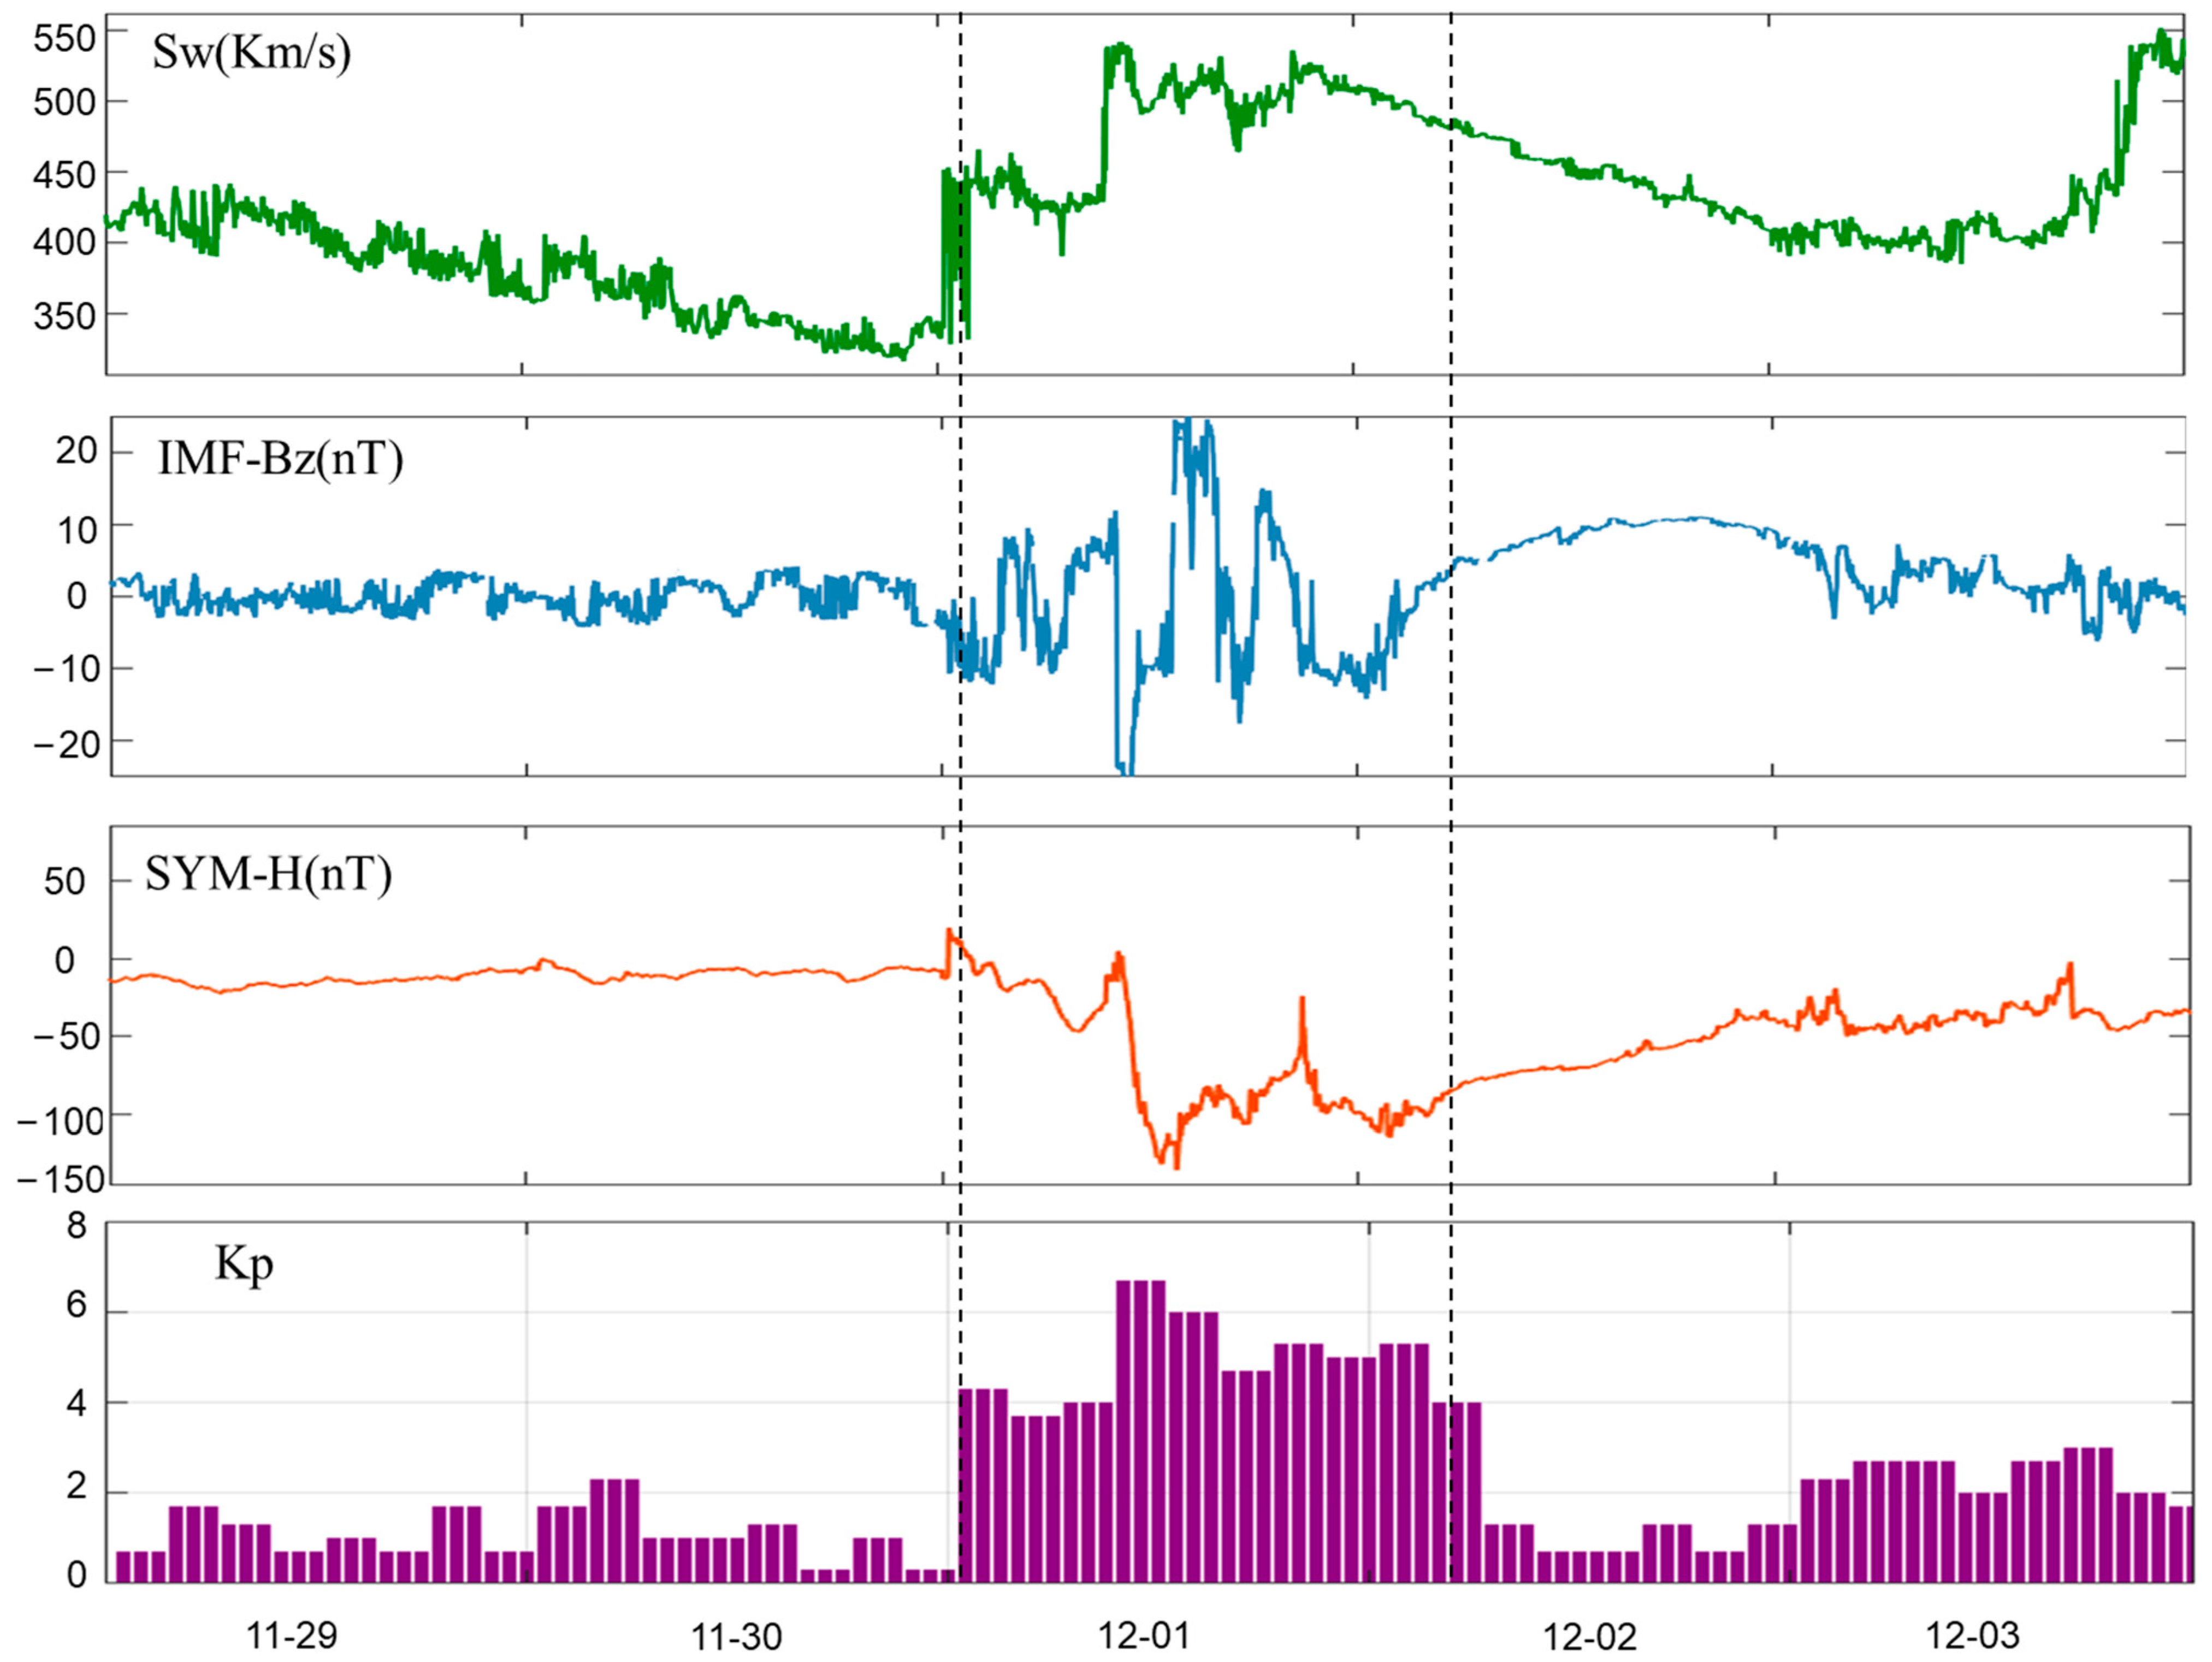
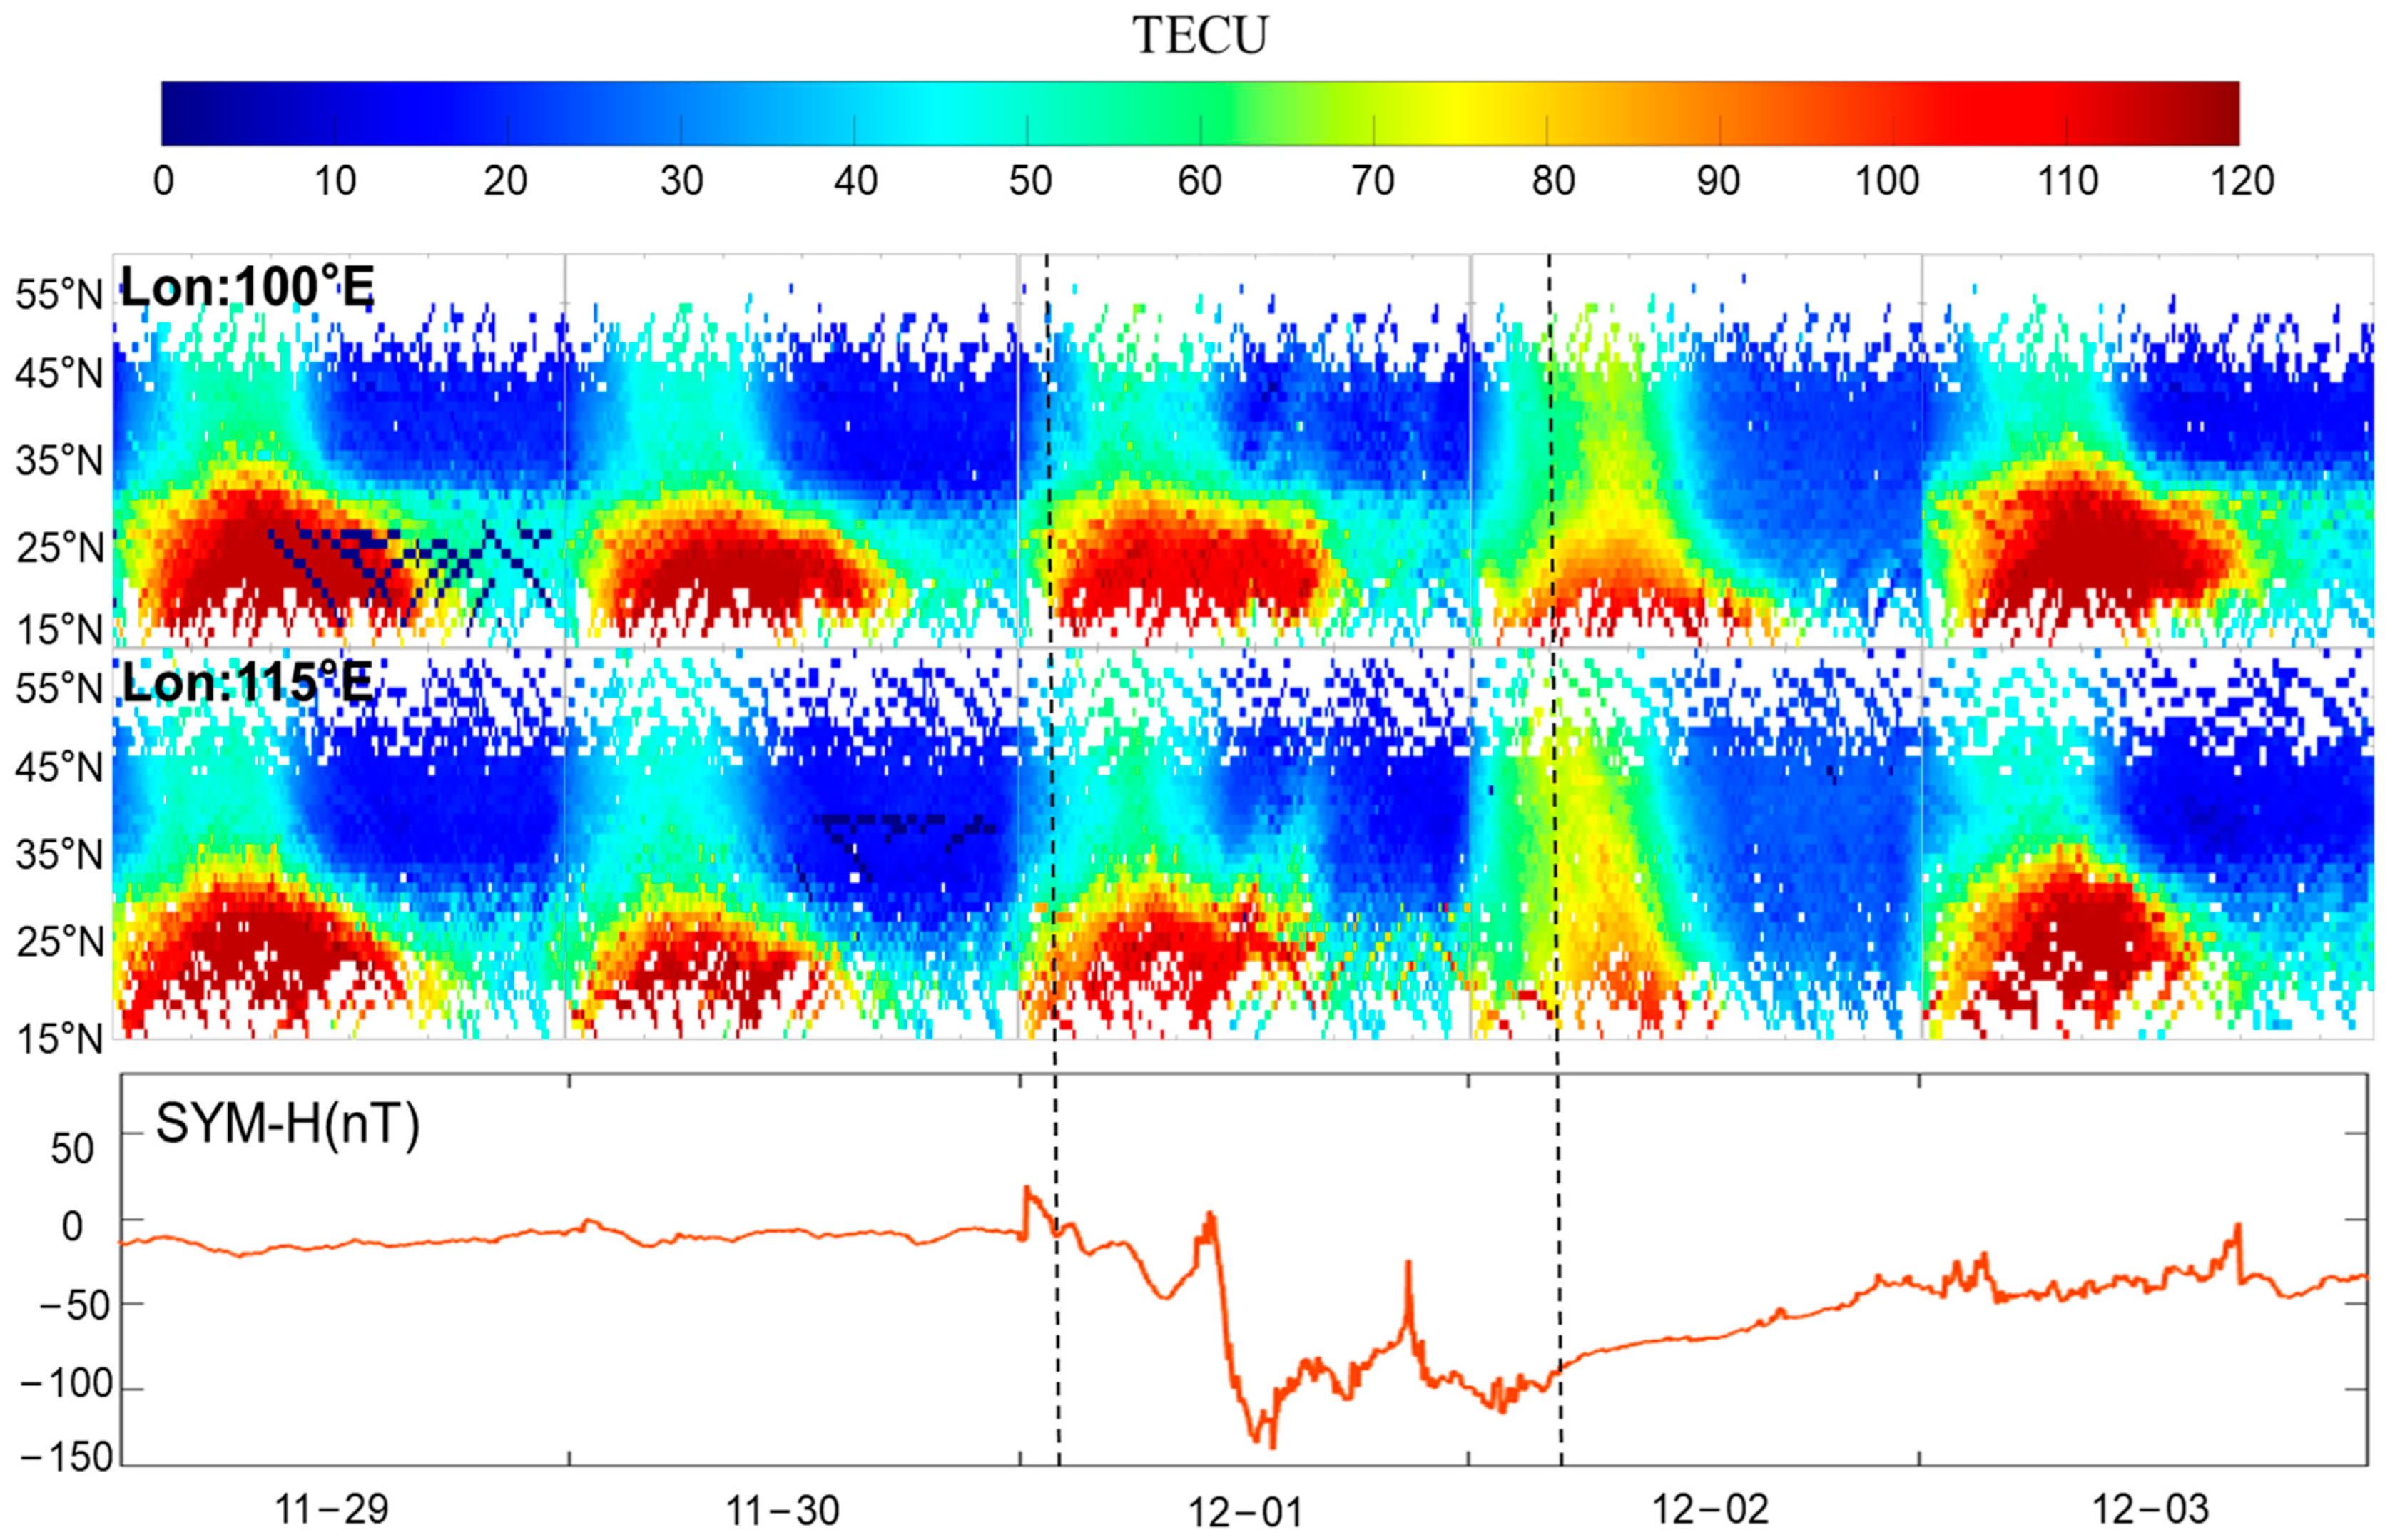
3.1. Geomagnetic Conditions During the December 2023 Geomagnetic Storm
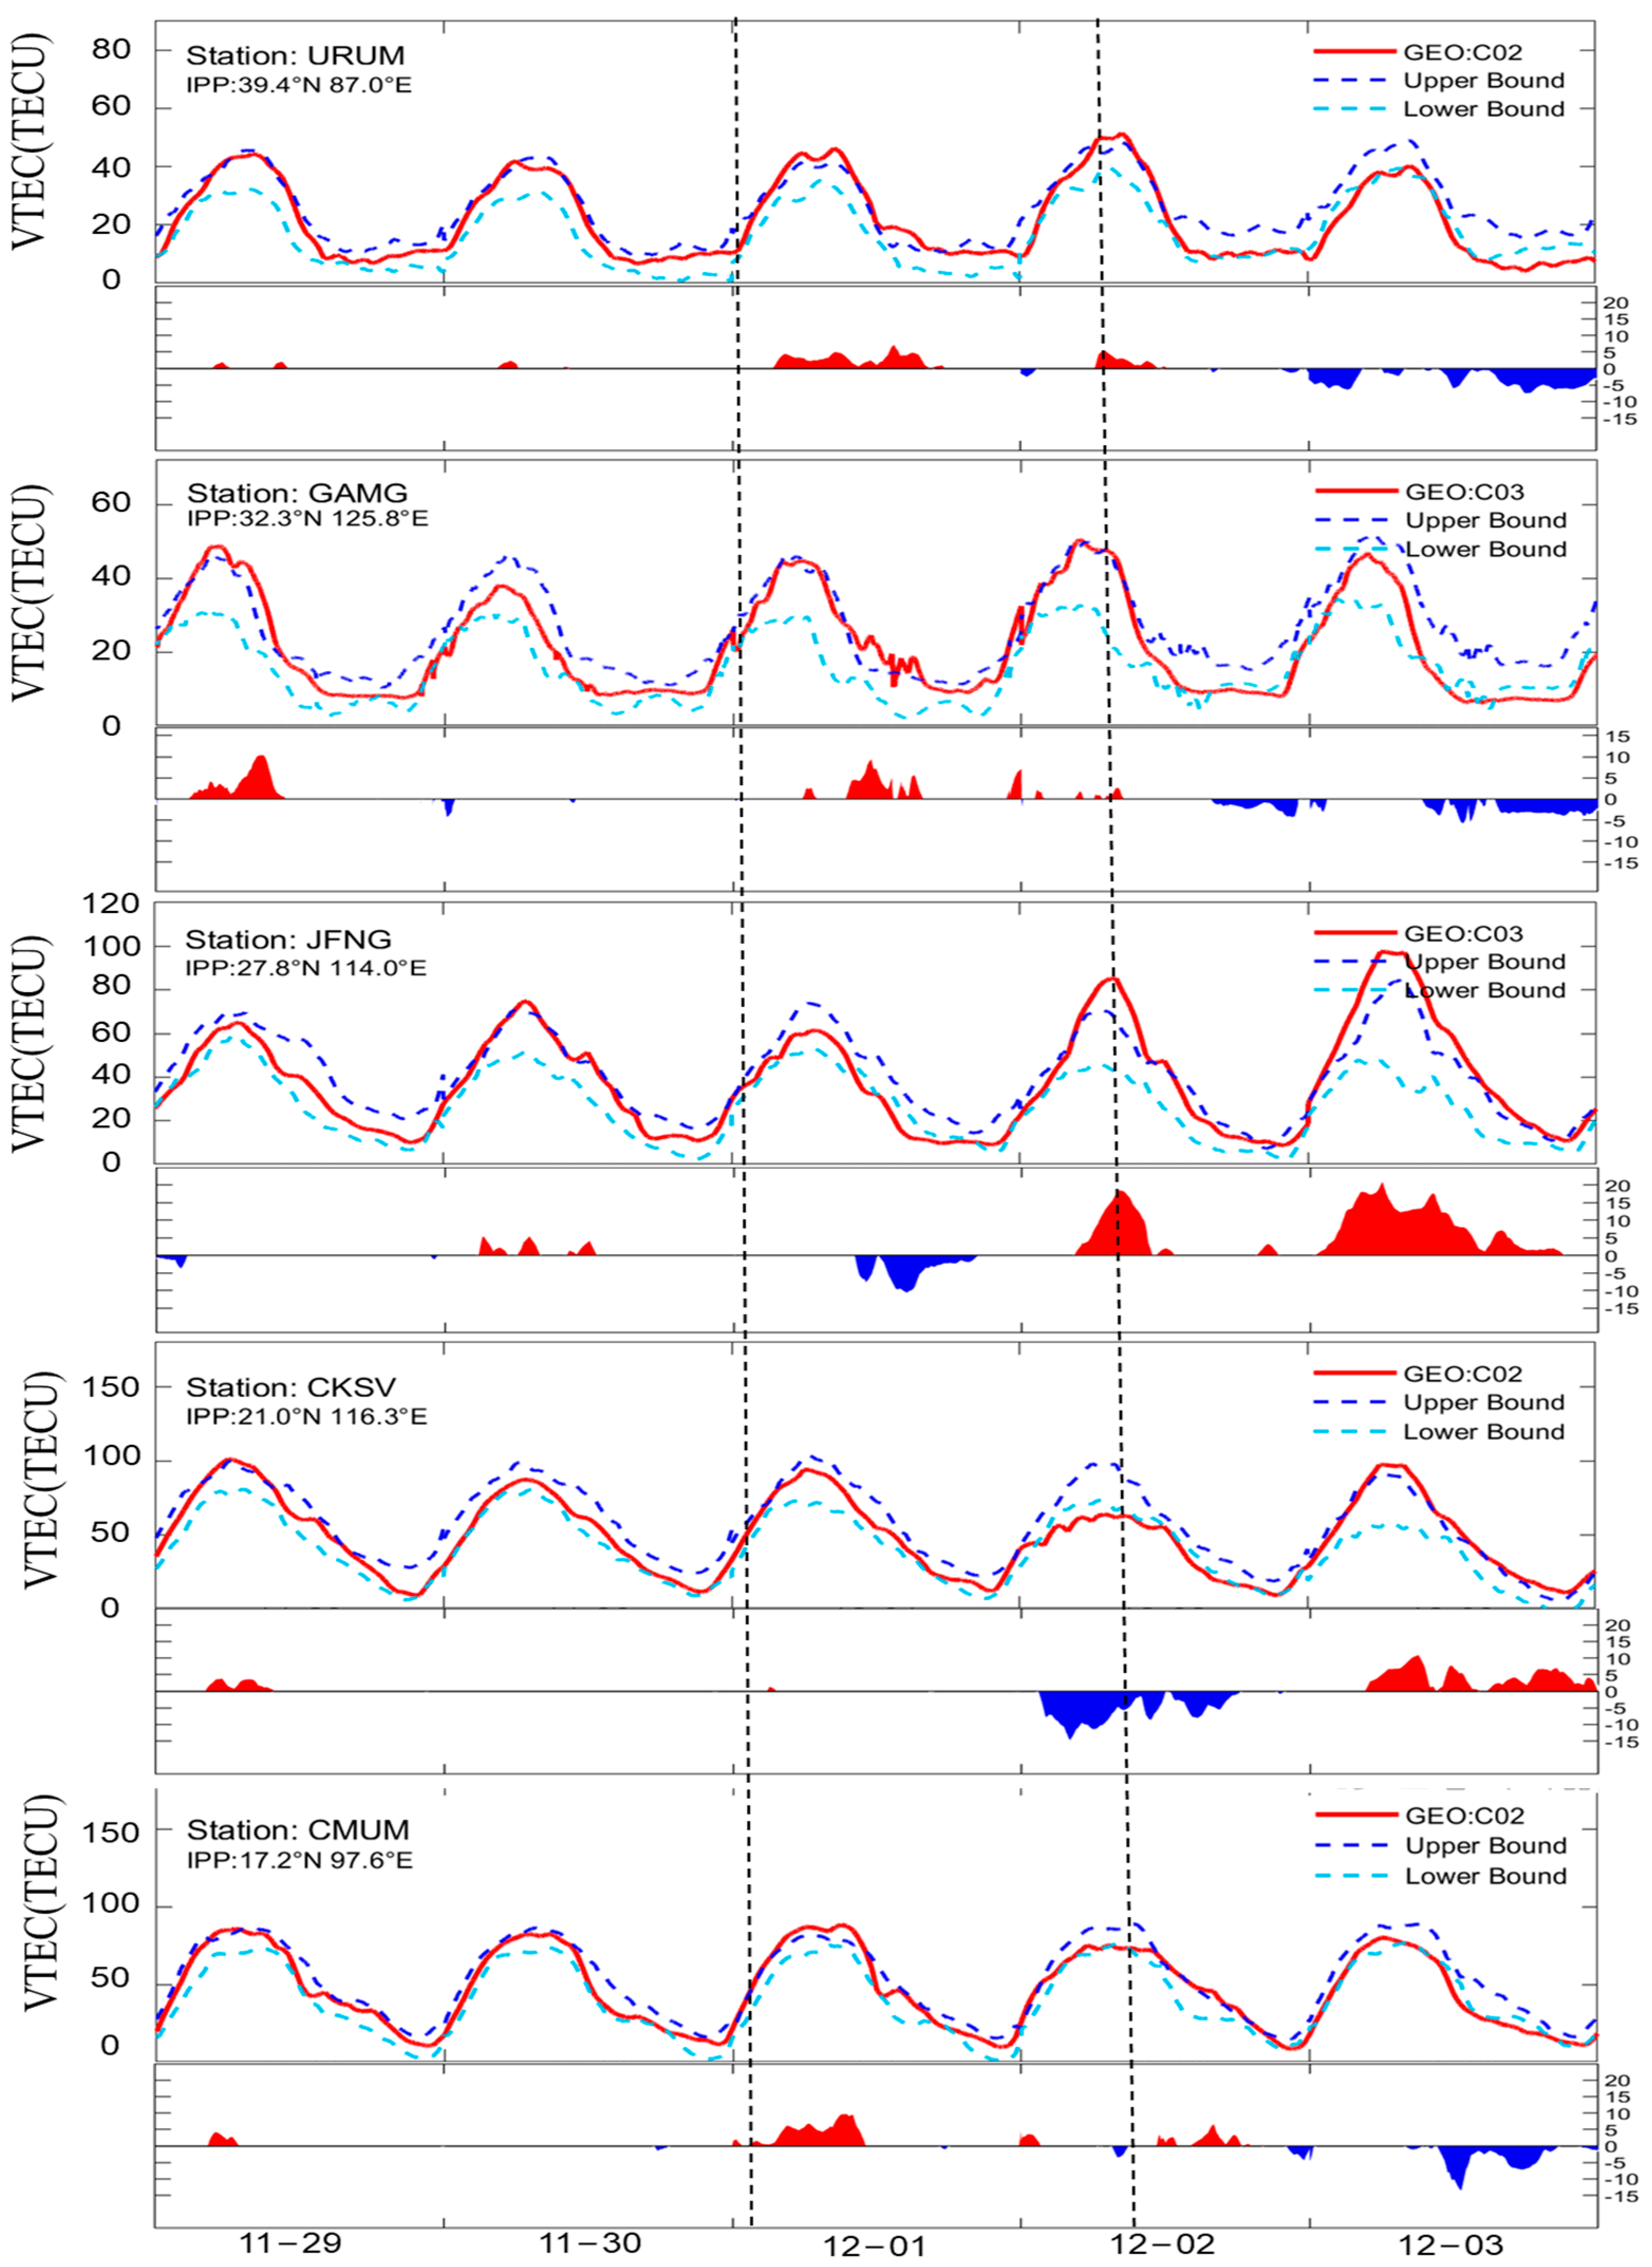
3.2. Ionospheric TEC Variations
4. Analysis of Ionospheric Disturbance Characteristics and Multi-Data Source Verification
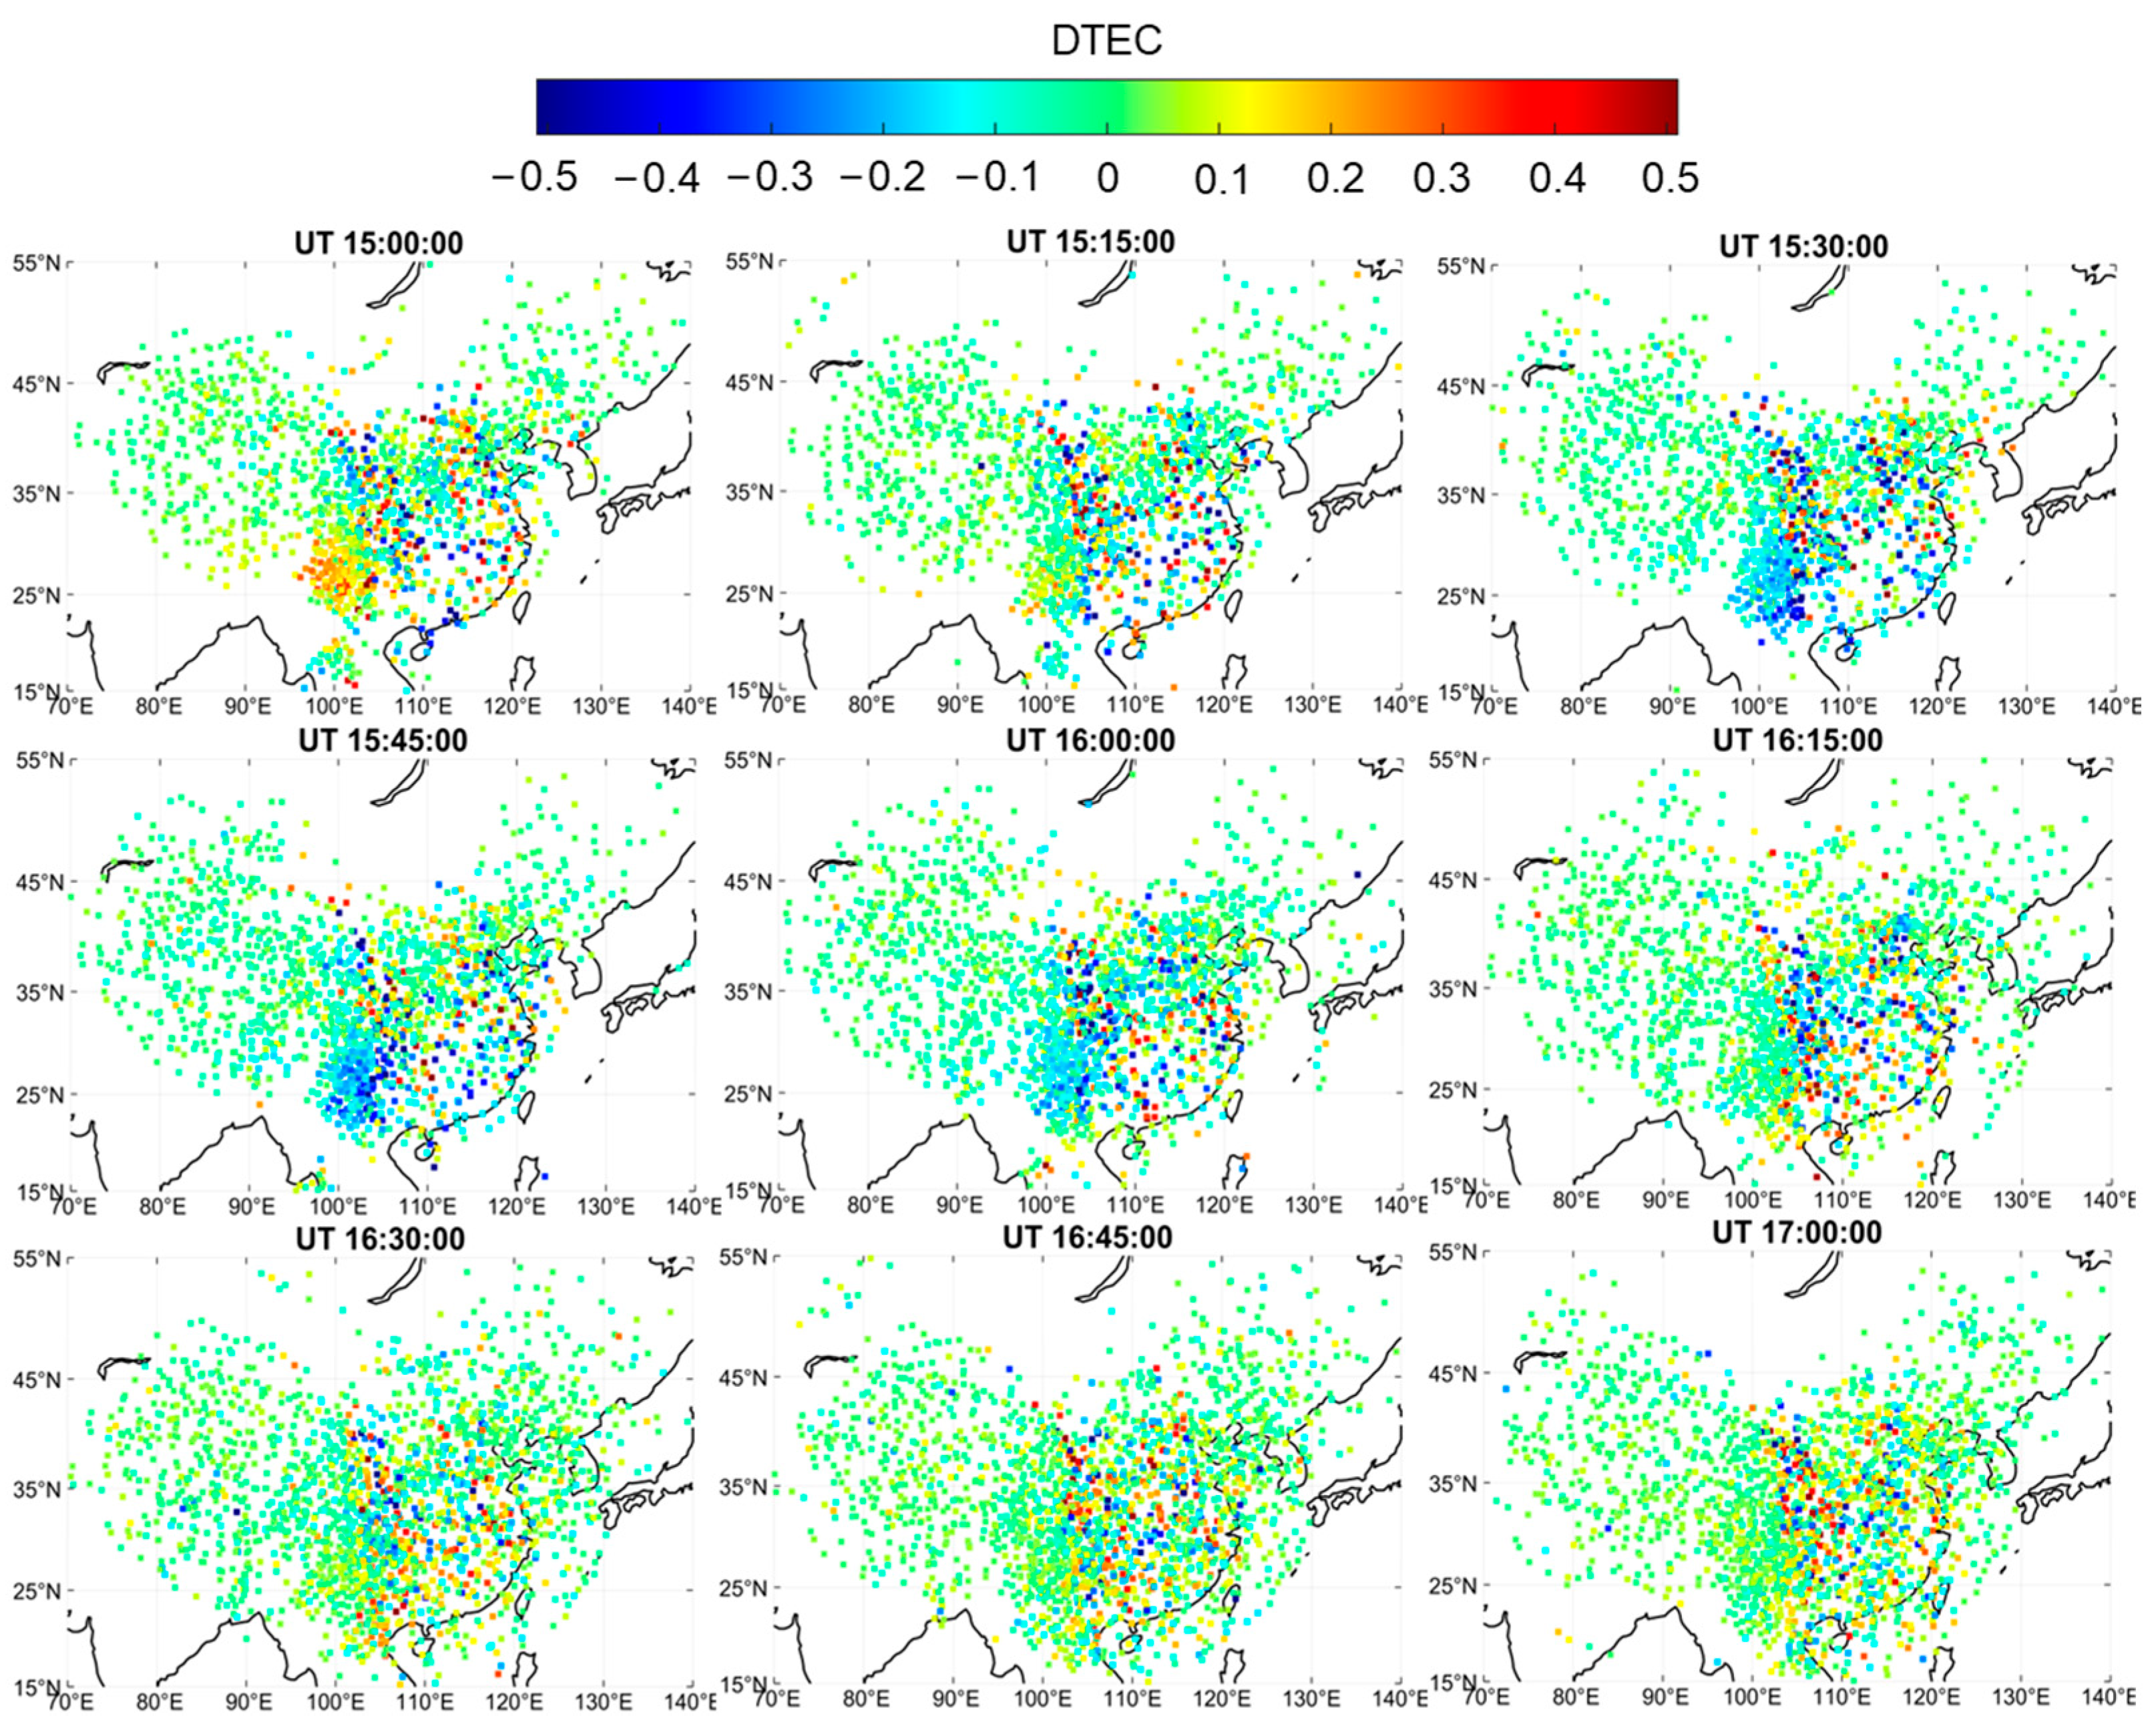
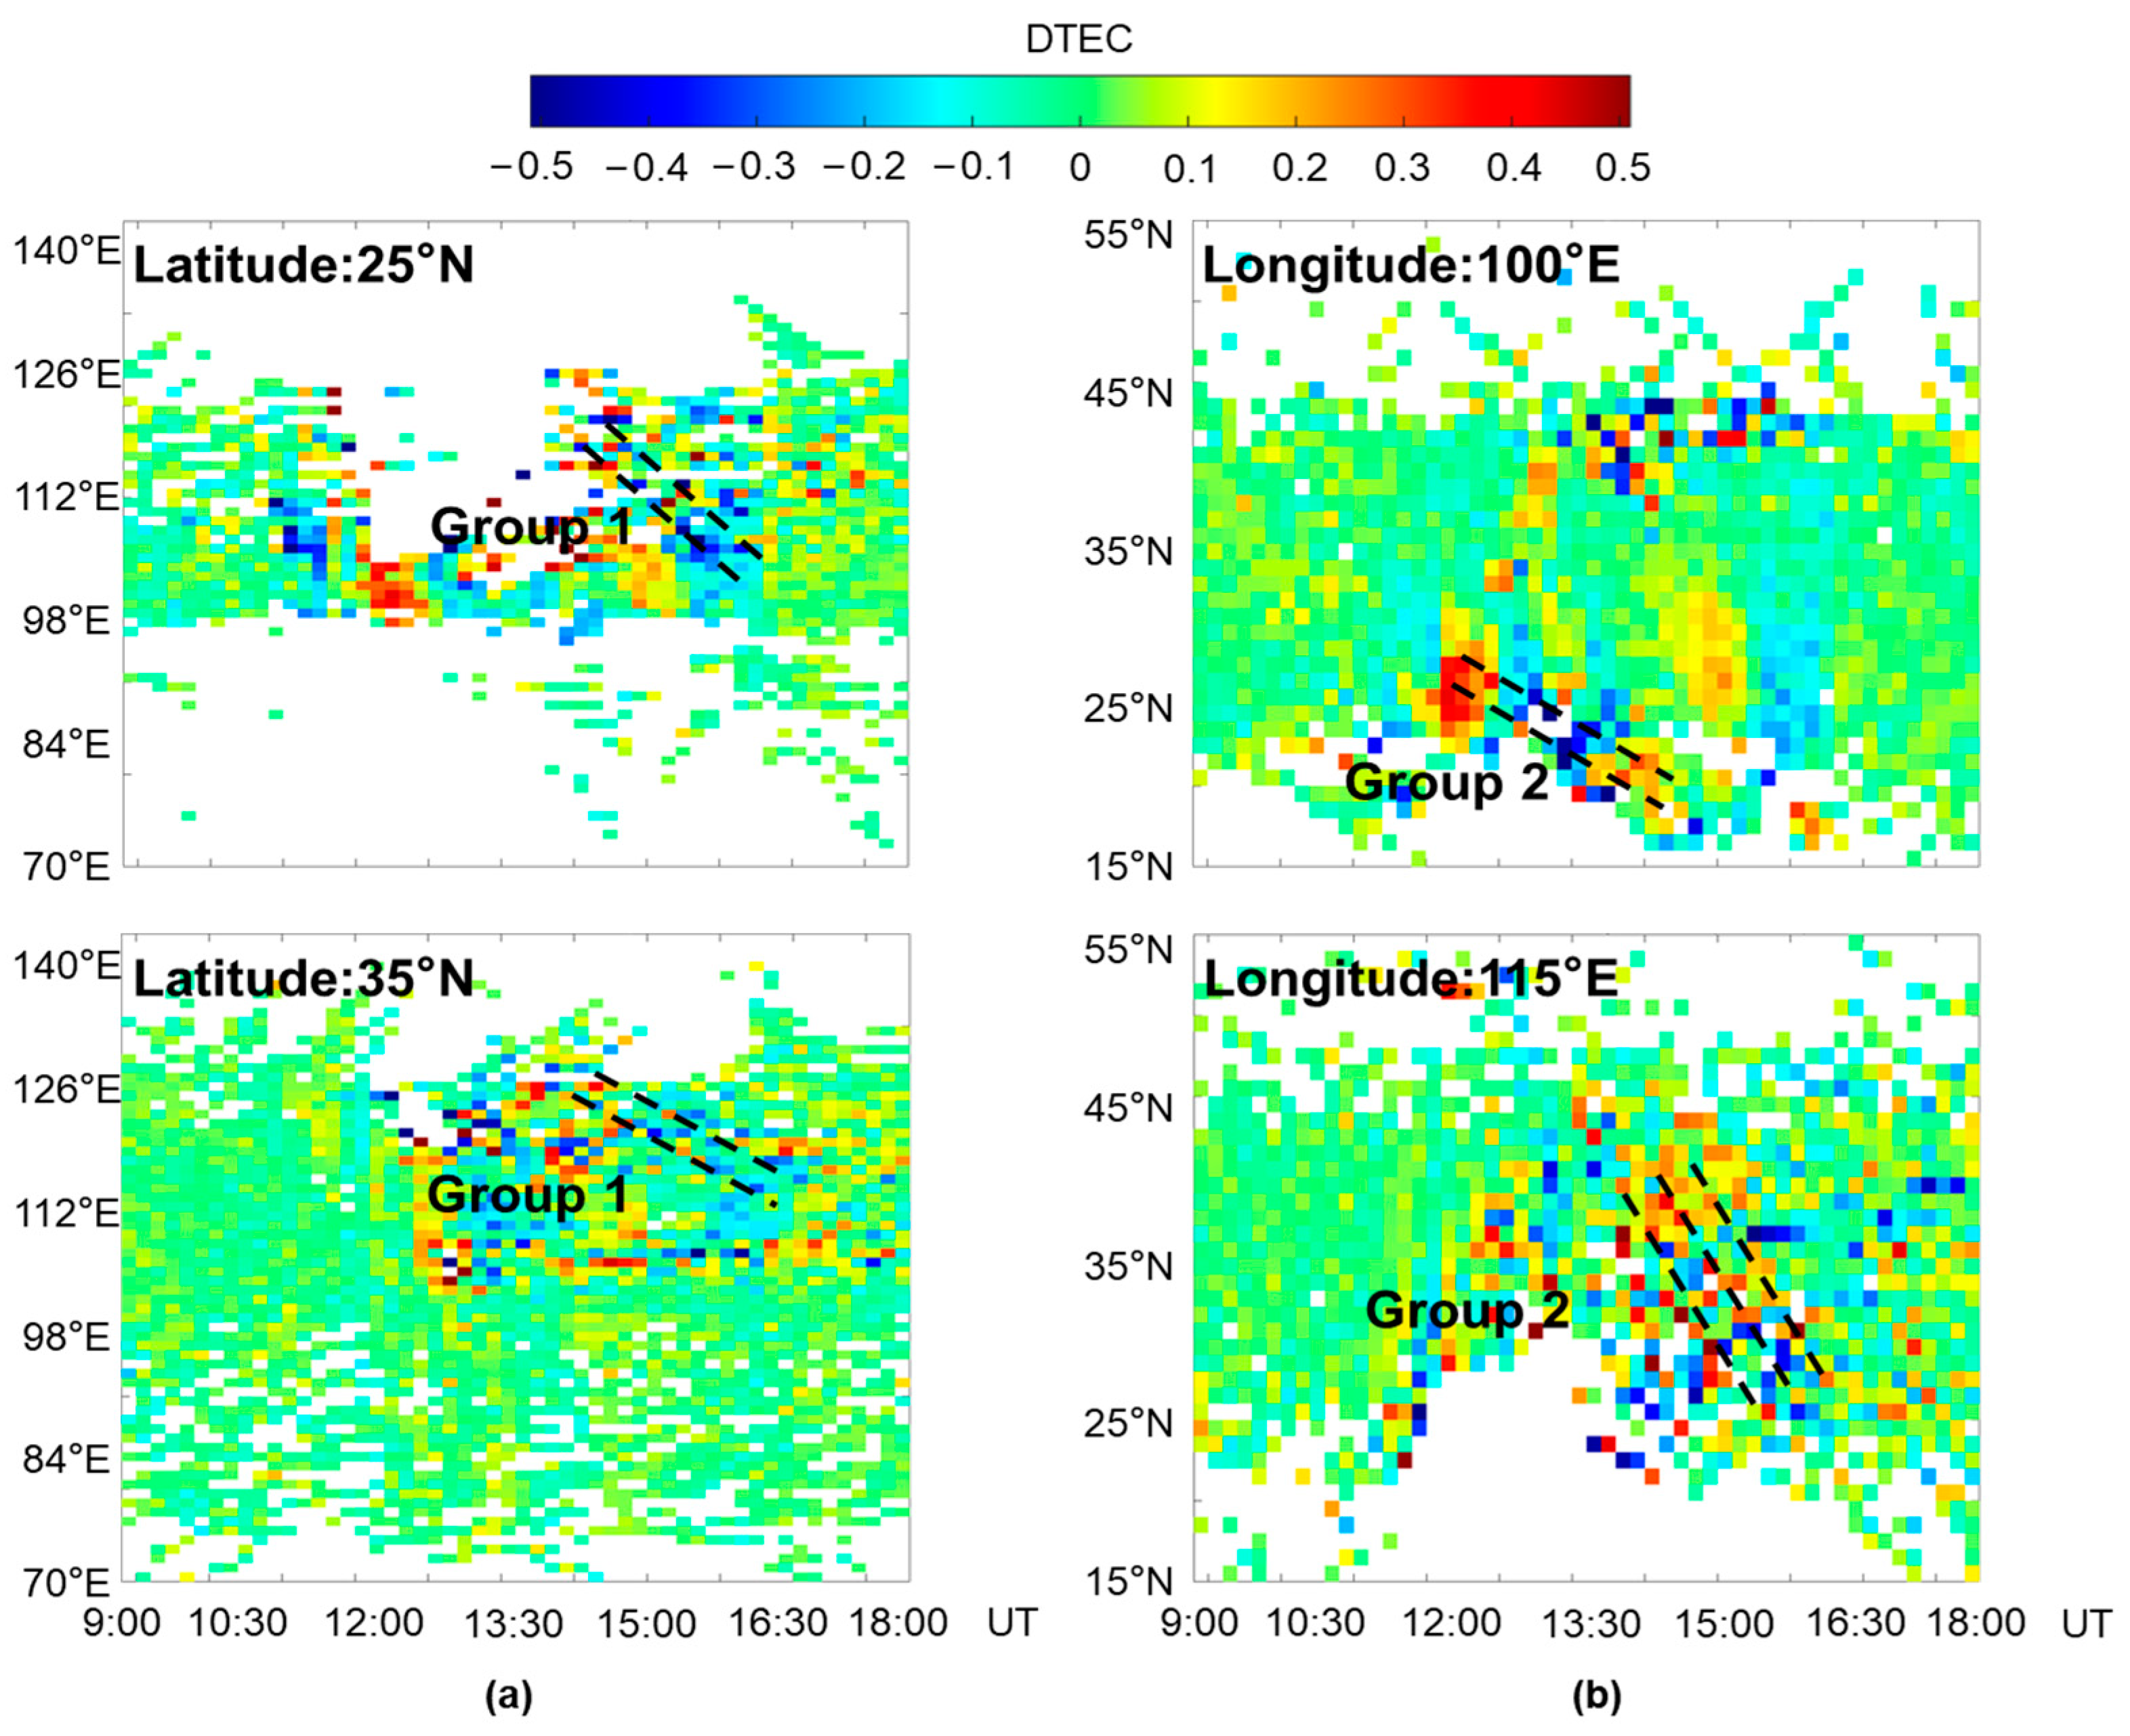
4.1. Analysis of MSTID Propagation Characteristics Based on TEC Data
4.2. Validation of MSTIDs and Their Ionospheric Impact Through Electron Density Observations
4.3. Relationship Between Thermospheric Composition Changes and MSTIDs
4.4. Multi-Source Validation of MSTID Characteristics
5. Analysis of Multi-Instrument Data on the Impact of Disturbances on PPP Performance
6. Conclusions
- (1)
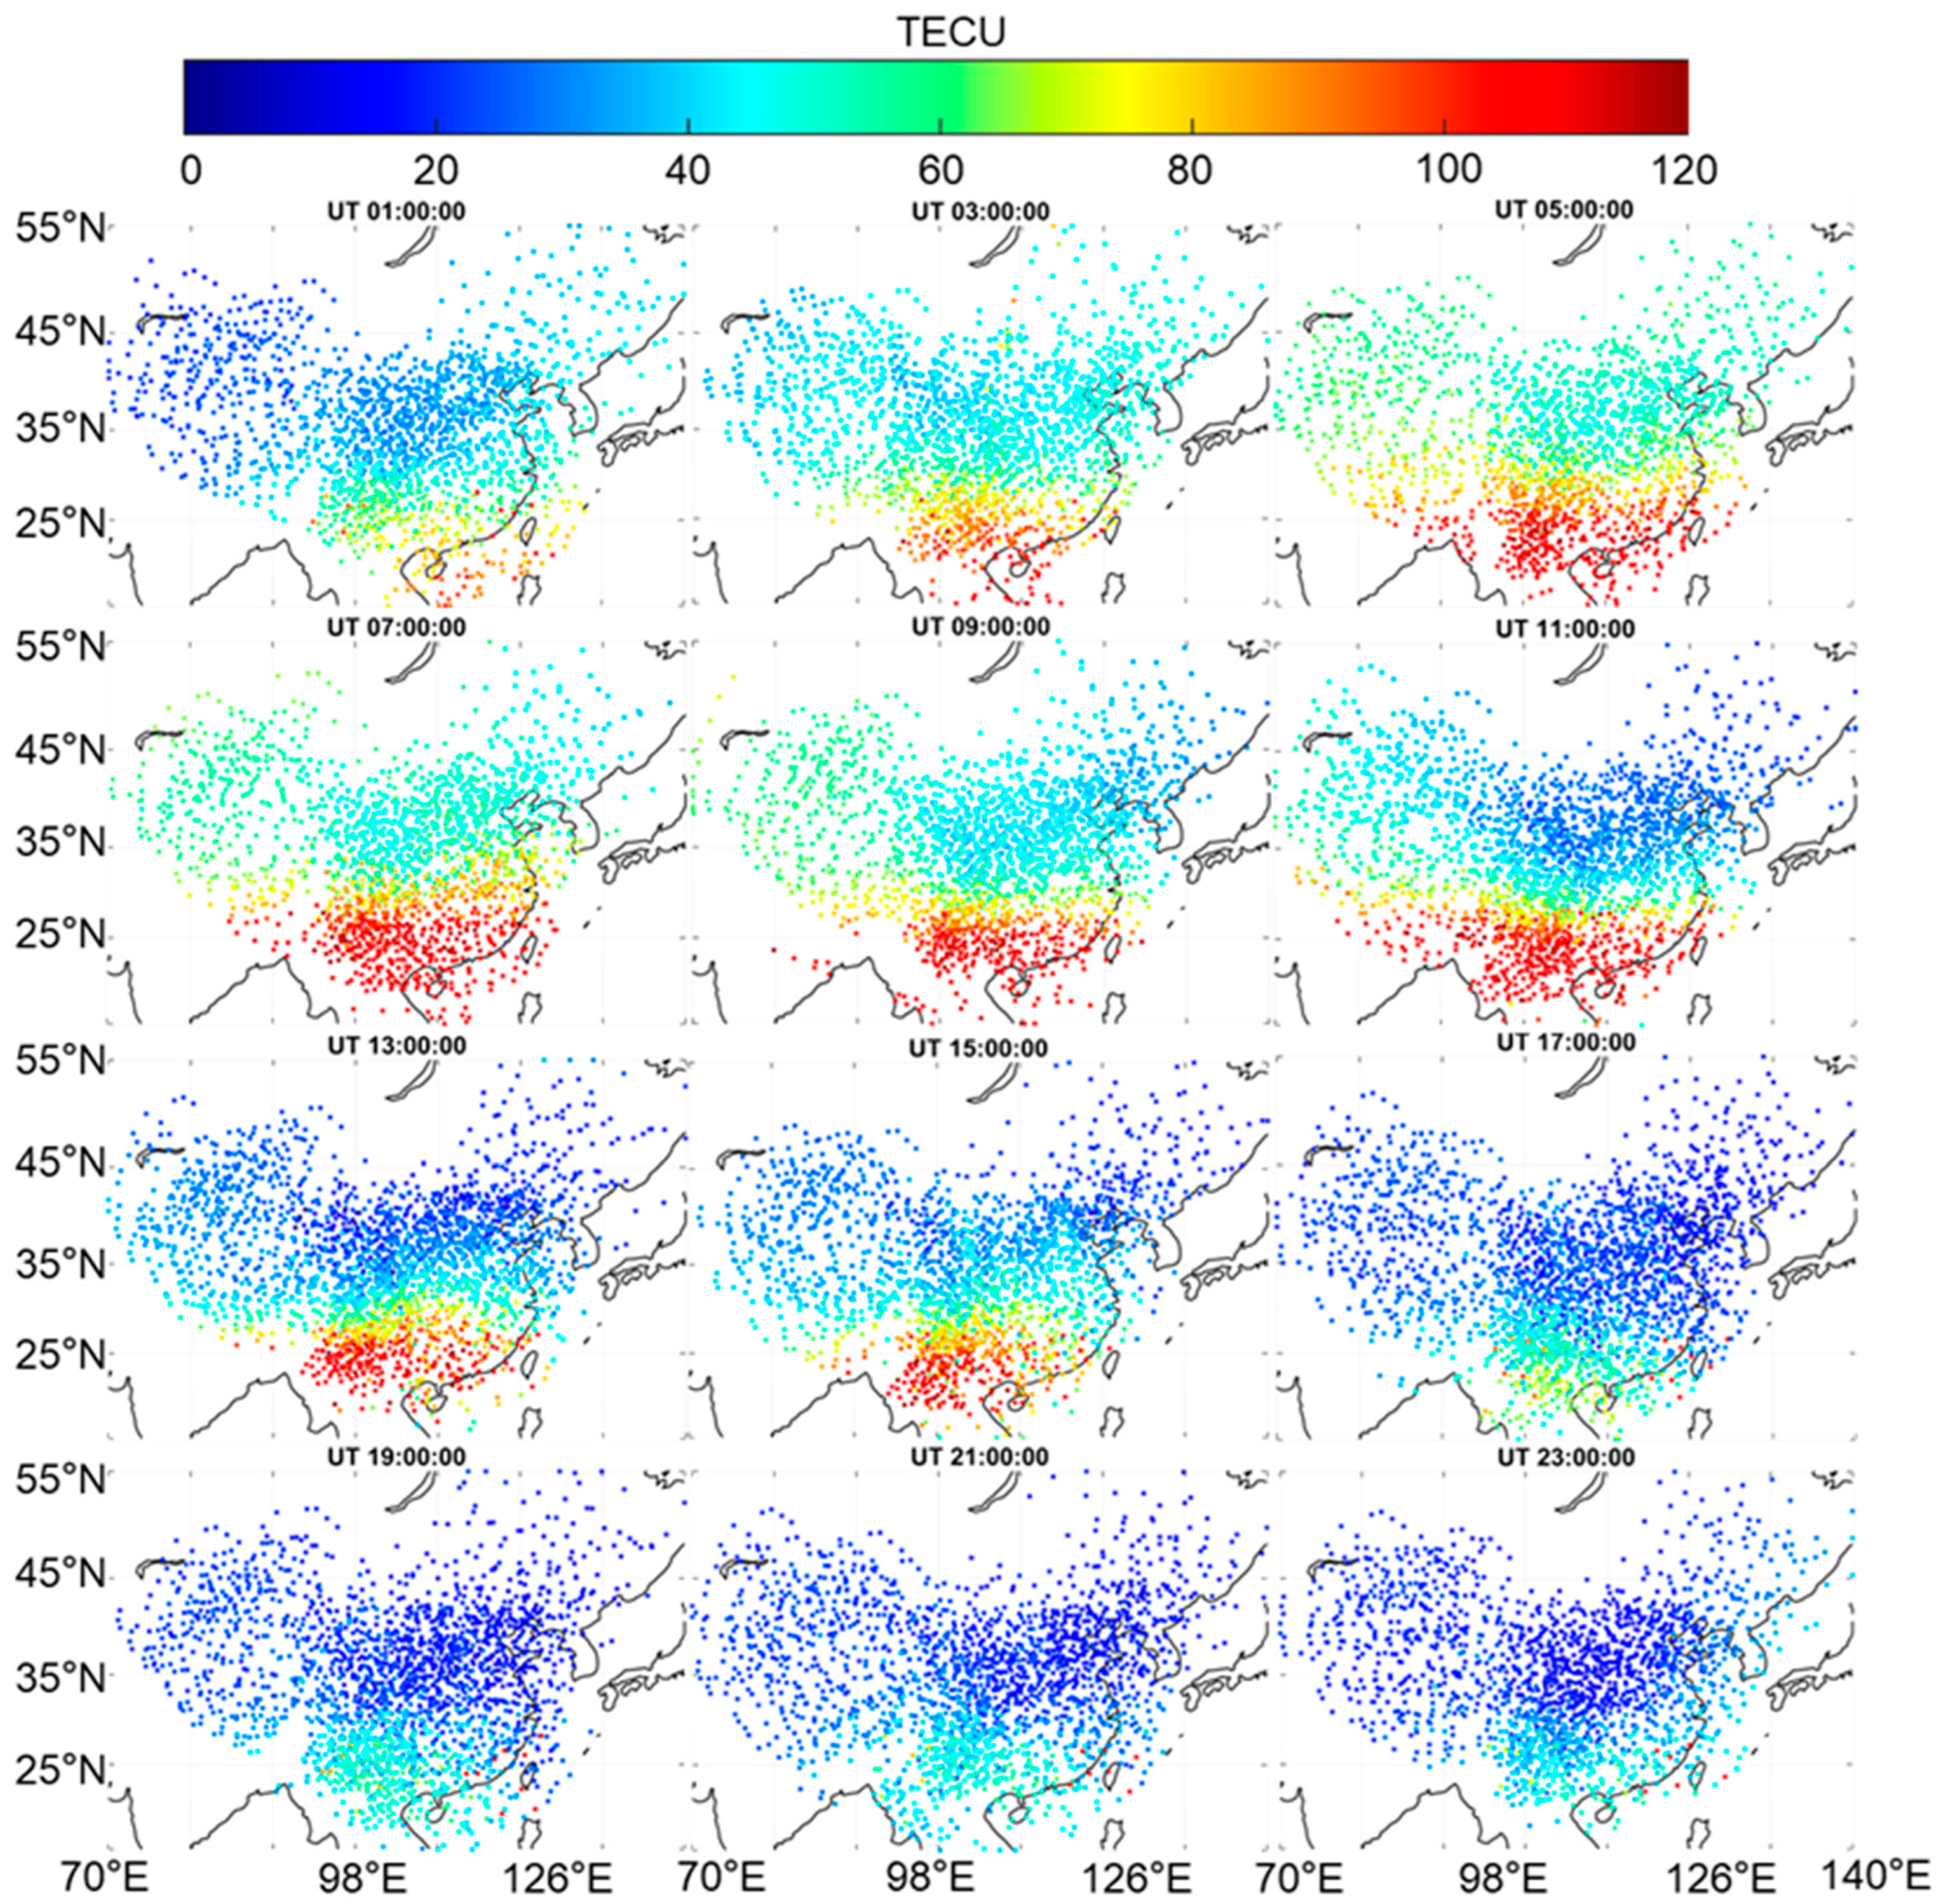
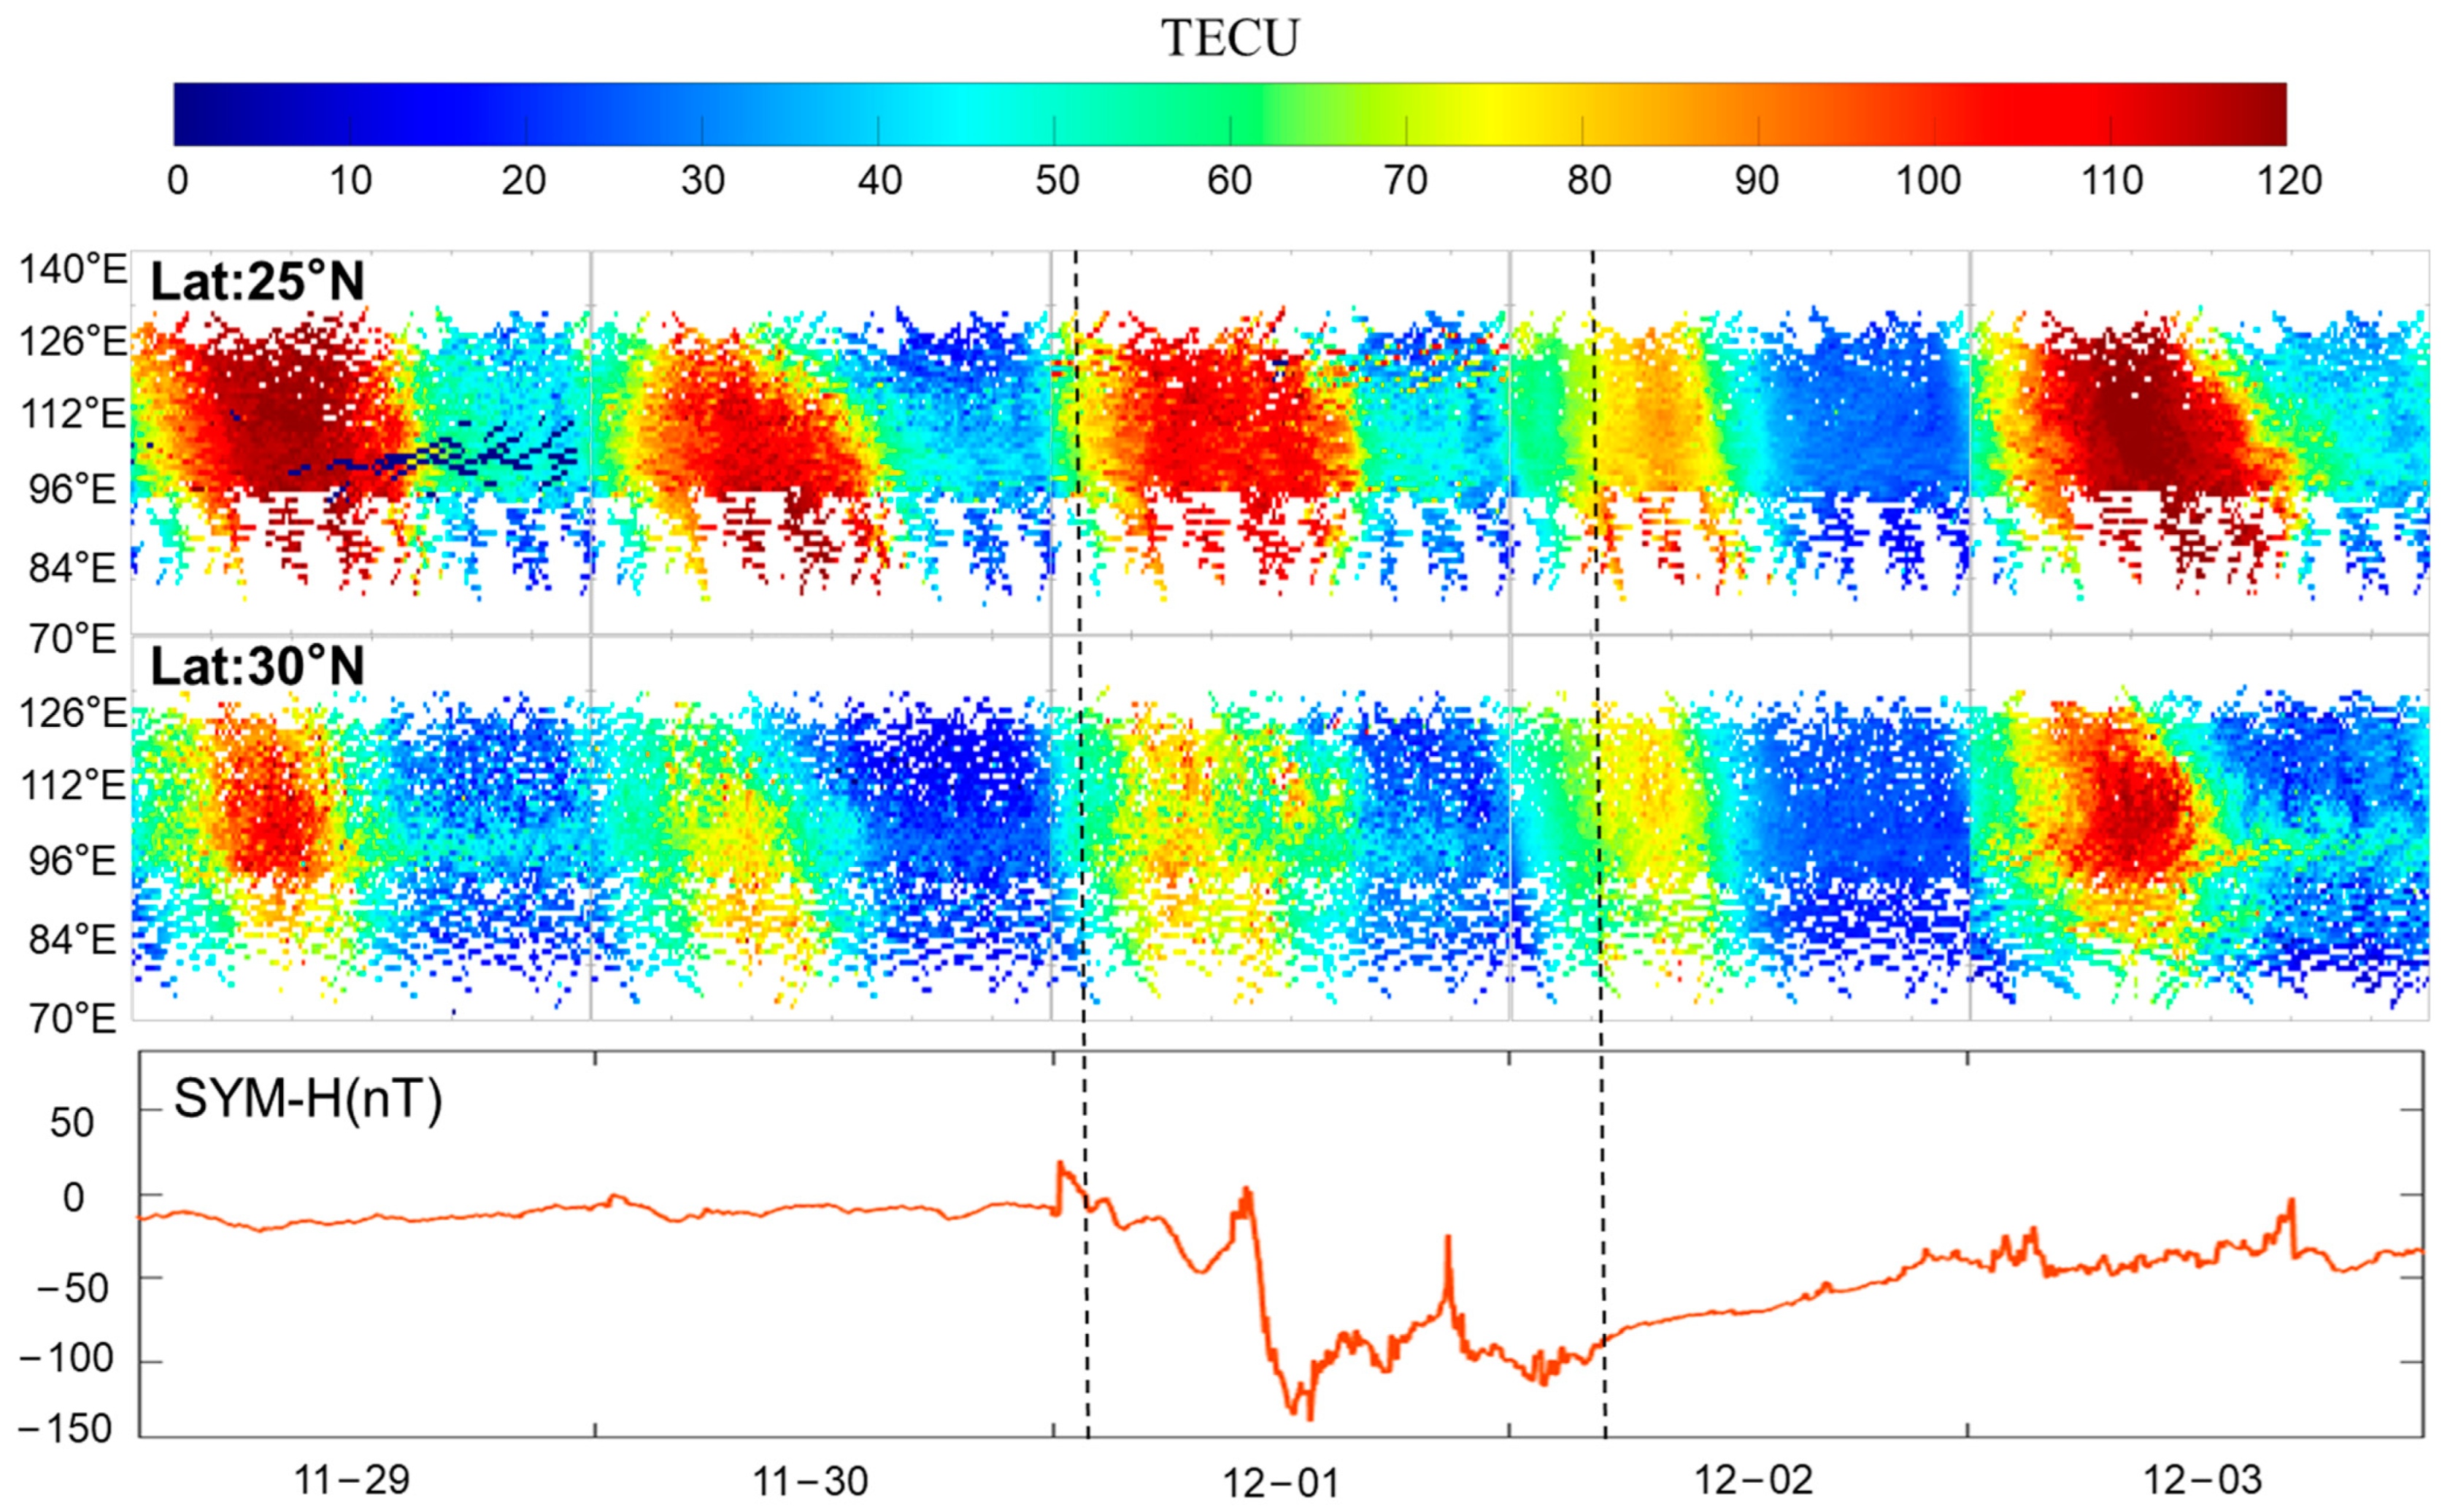
- Significant increases in VTEC were observed during the storm, particularly in low-latitude regions (25°N–30°N), where VTEC peaked at 129 TECU at 11:00 UT on 1 December. In contrast, mid-latitude regions (35°N–45°N) exhibited a more moderate increase, with VTEC reaching 113 TECU at 07:00 UT. These regional differences are attributed to the combined effects of prompt penetration of electric fields, neutral wind dynamics, and the expansion of the equatorial ionization anomaly.
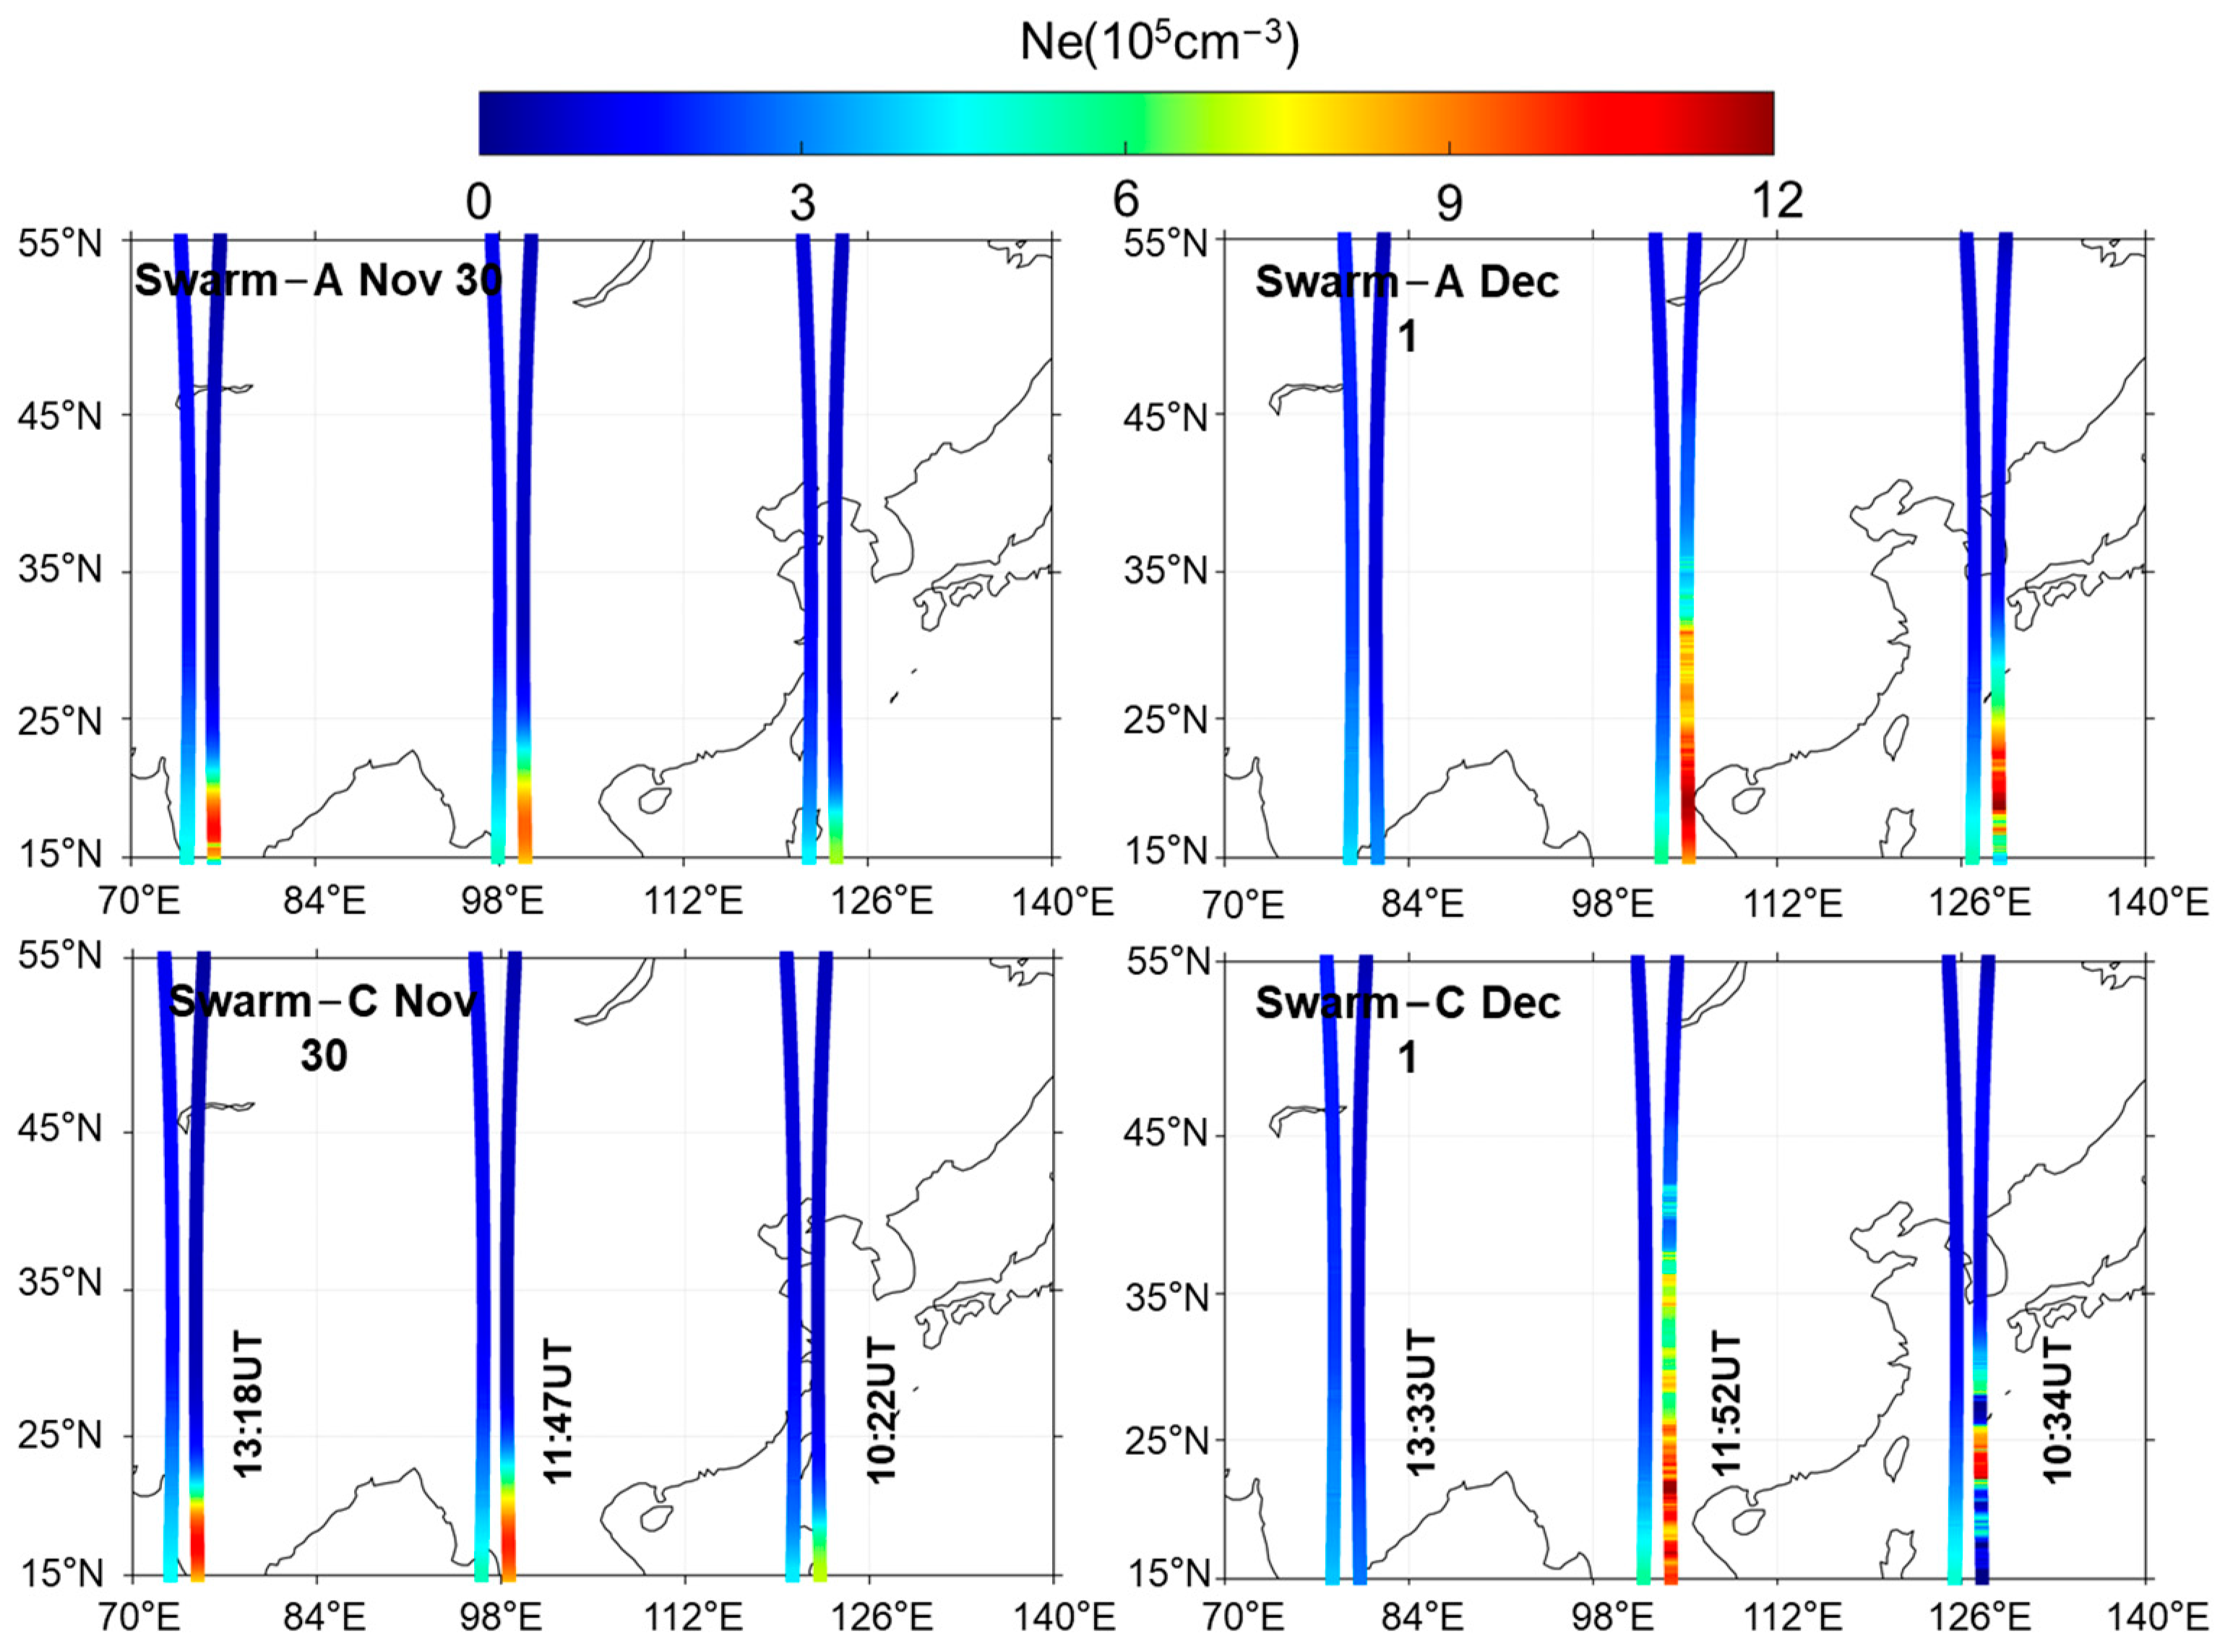
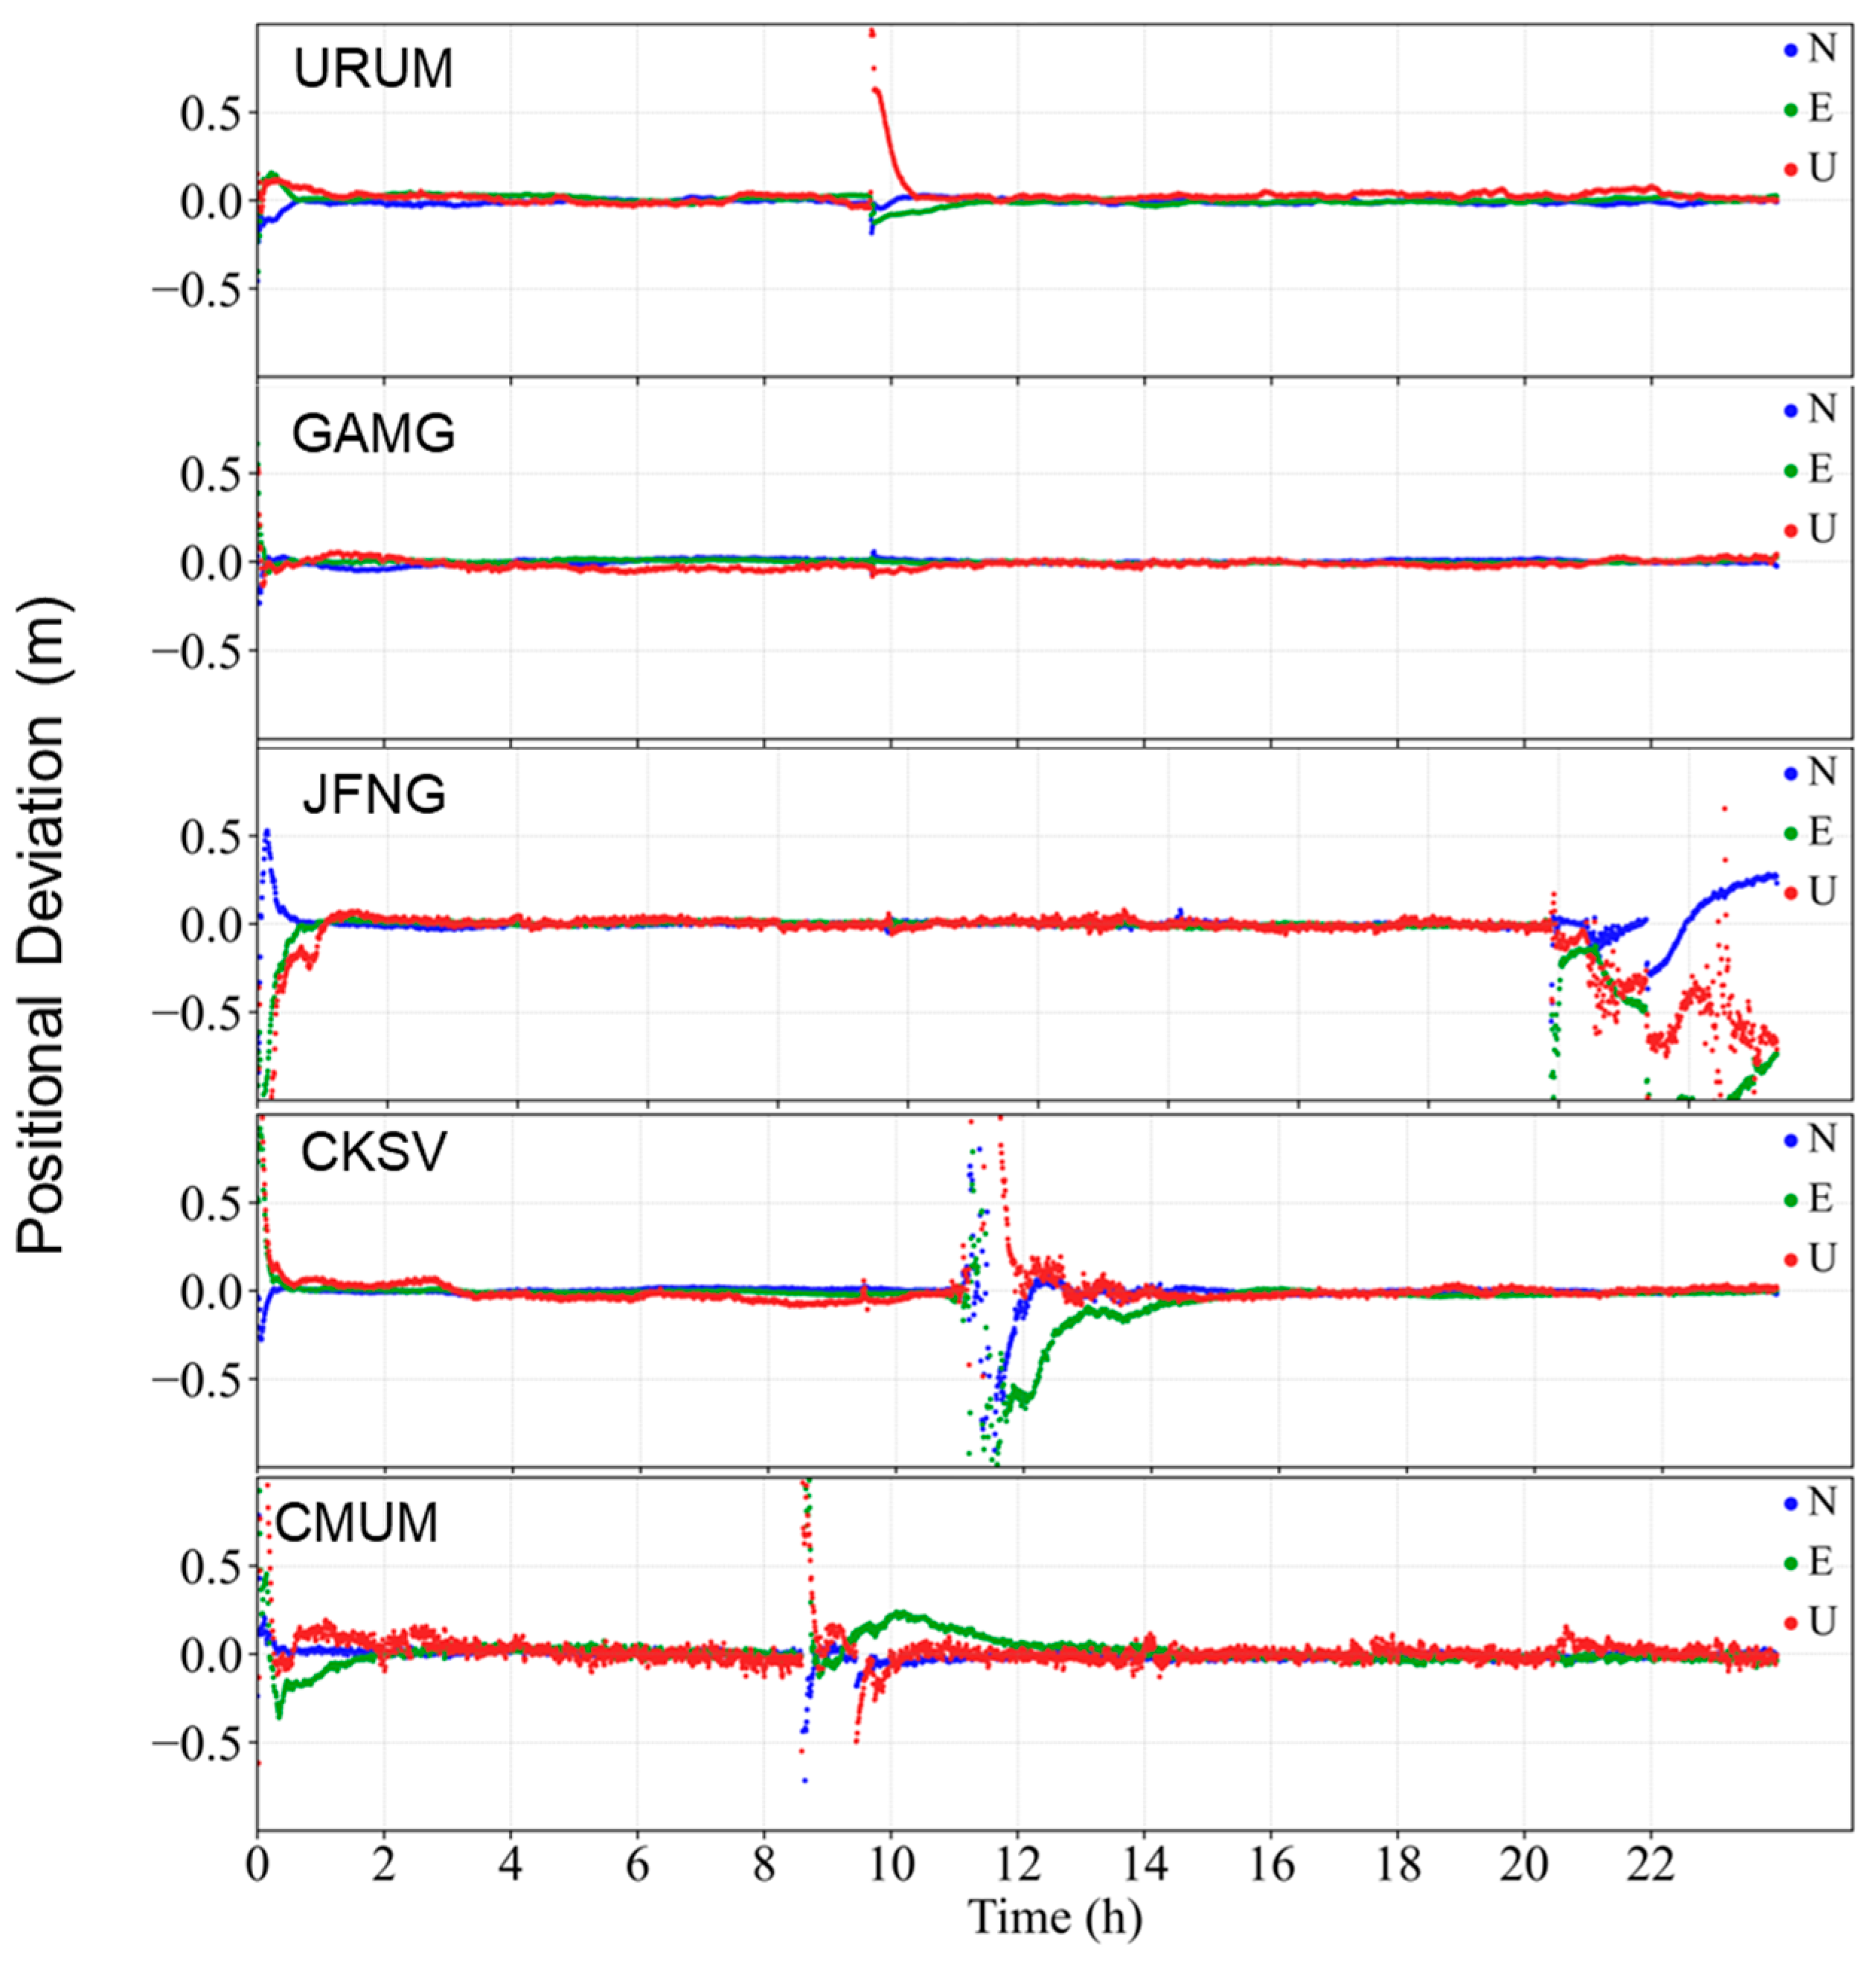
- (2)
- The rapid fluctuations in VTEC during the storm, especially at low latitudes, introduced significant errors in GNSS signal propagation delays, leading to degraded positioning precision. This highlights the vulnerability of GNSS systems to ionospheric disturbances during geomagnetic storms, particularly in low-latitude regions.
- (3)
- The findings of this study are consistent with previous observations of ionospheric responses to geomagnetic storms, such as the 2020 event reported by Smith et al. (2023), where similar enhancements in VTEC at low latitudes were observed. However, the timing of the VTEC peak in this study (07:00 UT on 1 December) differs from that observed in other events, which may reflect the unique characteristics of the December 2023 storm.
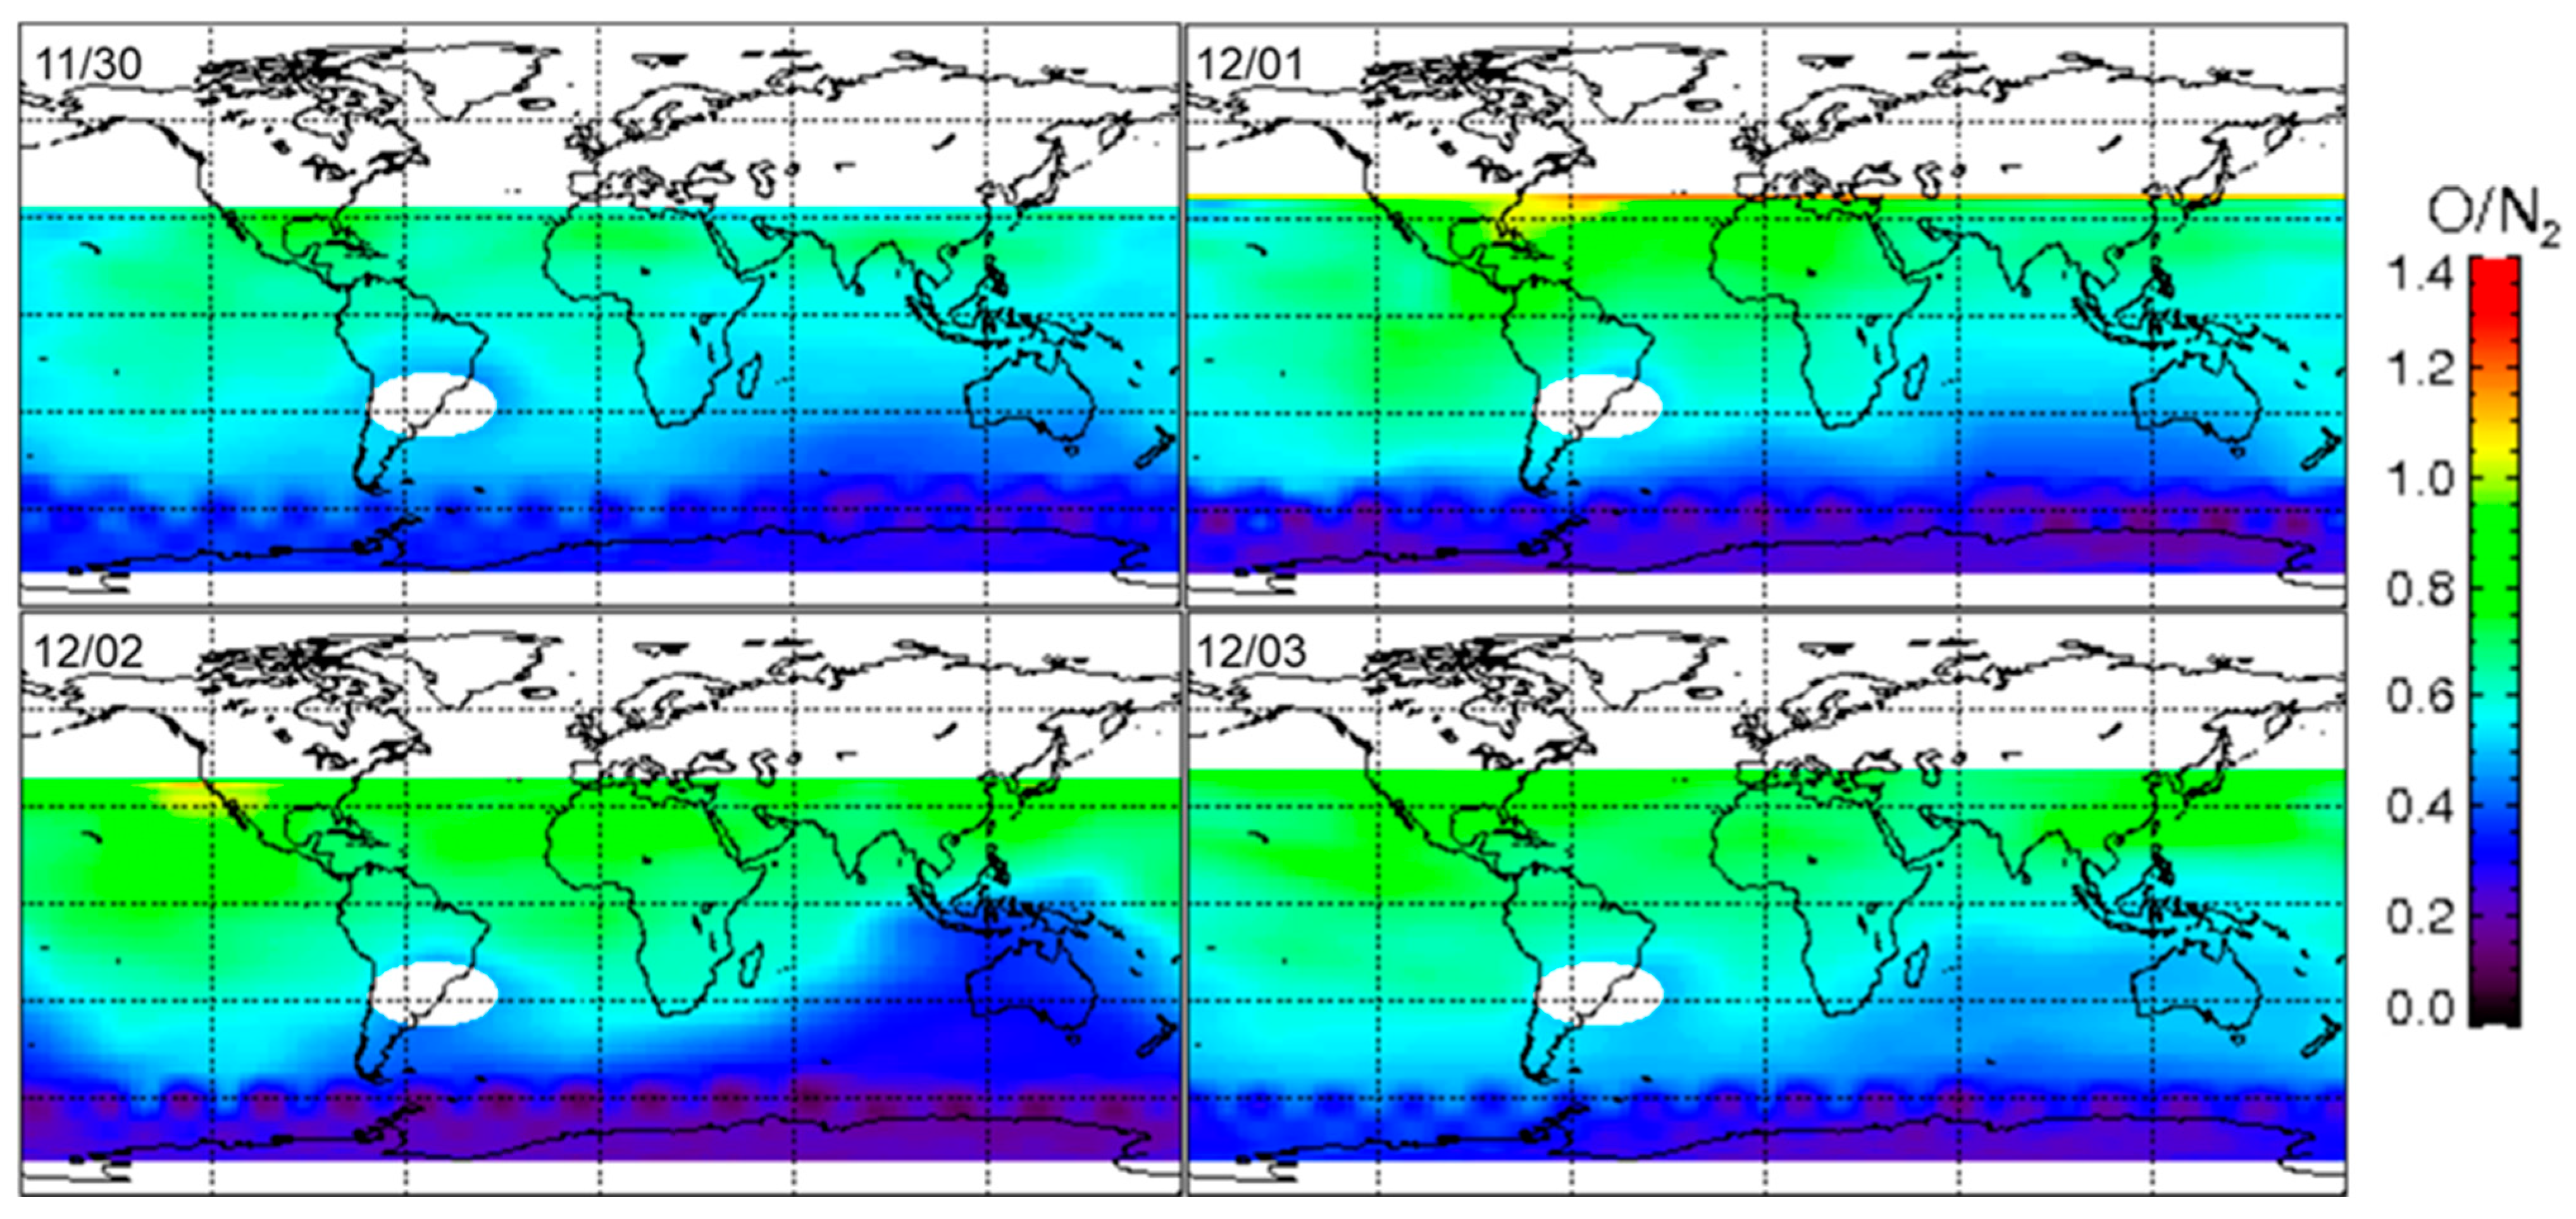
- (4)
- The study also reveals that the thermospheric [O]/[N2] ratio significantly increased over southern and central China during the storm, particularly within the range of 25°N–40°N. This increase in atomic oxygen concentration contributed to the enhancement of electron density, further exacerbating ionospheric disturbances.
- (5)
- The comprehensive analysis of VTEC variations, combined with multi-instrument data validation, demonstrates the importance of considering regional differences in ionospheric response when assessing the impact of geomagnetic storms on GNSS positioning accuracy. These findings provide a scientific basis for improving ionospheric modeling and GNSS positioning stability, particularly in mid- and low-latitude regions.
Author Contributions
Funding
Data Availability Statement
Acknowledgments
Conflicts of Interest
References
- Gonzalez, W.D.; Joselyn, J.A.; Kamide, Y.; Kroehl, H.W.; Rostoker, G.; Tsurutani, B.T.; Vasyliunas, V.M. What Is a Geomagnetic Storm? J. Geophys. Res. Space Phys. 1994, 99, 5771–5792. [Google Scholar] [CrossRef]
- Tsurutani, B.T.; Gonzalez, W.D.; Gonzalez, A.L.C.; Guarnieri, F.L.; Gopalswamy, N.; Grande, M.; Kamide, Y.; Kasahara, Y.; Lu, G.; Mann, I.; et al. Corotating Solar Wind Streams and Recurrent Geomagnetic Activity: A Review. J. Geophys. Res. Space Phys. 2006, 111. [Google Scholar] [CrossRef]
- Hajra, R.; Echer, E.; Tsurutani, B.T.; Gonzalez, W.D. Solar Cycle Dependence of High-Intensity Long-Duration Continuous AE Activity (HILDCAA) Events, Relativistic Electron Predictors? J. Geophys. Res. Space Phys. 2013, 118, 5626–5638. [Google Scholar] [CrossRef]
- Ratovsky, K.G.; Klimenko, M.V.; Yasyukevich, Y.V.; Klimenko, V.V.; Vesnin, A.M. Statistical Analysis and Interpretation of High-, Mid- and Low-Latitude Responses in Regional Electron Content to Geomagnetic Storms. Atmosphere 2020, 11, 1308. [Google Scholar] [CrossRef]
- Tang, J.; Yang, D.; Liu, H. Study of Chinese Regional Ionospheric TEC Response to Magnetic Storms during April 23–25, 2023. GPS Solut. 2024, 28, 205. [Google Scholar] [CrossRef]
- Yao, Y.; Liu, L.; Kong, J.; Zhai, C. Analysis of the Global Ionospheric Disturbances of the March 2015 Great Storm. J. Geophys. Res. Space Phys. 2016, 121, 12157–12170. [Google Scholar] [CrossRef]
- Lissa, D.; Srinivasu, V.K.D.; Prasad, D.S.V.V.D.; Niranjan, K. Ionospheric Response to the 26 August 2018 Geomagnetic Storm Using GPS-TEC Observations along 80° E and 120° E Longitudes in the Asian Sector. Adv. Space Res. 2020, 66, 1427–1440. [Google Scholar] [CrossRef]
- Zhao, K.; Yan, W.; Yang, H.; Yang, X. Preliminary Analysis of Ionospheric Responses to Geomagnetic Storms Using the BDS GEO Satellites. IOP Conf. Ser. Mater. Sci. Eng. 2020, 780, 042060. [Google Scholar] [CrossRef]
- Vankadara, R.K.; Panda, S.K.; Amory-Mazaudier, C.; Fleury, R.; Devanaboyina, V.R.; Pant, T.K.; Jamjareegulgarn, P.; Haq, M.A.; Okoh, D.; Seemala, G.K. Signatures of Equatorial Plasma Bubbles and Ionospheric Scintillations from Magnetometer and GNSS Observations in the Indian Longitudes during the Space Weather Events of Early September 2017. Remote Sens. 2022, 14, 652. [Google Scholar] [CrossRef]
- Liu, J.; Zhang, D.-H.; Coster, A.J.; Zhang, S.-R.; Ma, G.-Y.; Hao, Y.-Q.; Xiao, Z. A Case Study of the Large-Scale Traveling Ionospheric Disturbances in the Eastern Asian Sector during the 2015 St. Patrick’s Day Geomagnetic Storm. Ann. Geophys. 2019, 37, 673–687. [Google Scholar] [CrossRef]
- Tsagouri, I.; Belehaki, A.; Koutroumbas, K.; Tziotziou, K.; Herekakis, T. Identification of Large-Scale Travelling Ionospheric Disturbances (LSTIDs) Based on Digisonde Observations. Atmosphere 2023, 14, 331. [Google Scholar] [CrossRef]
- Tsurutani, B.T.; Zank, G.P.; Sterken, V.J.; Shibata, K.; Nagai, T.; Mannucci, A.J.; Malaspina, D.M.; Lakhina, G.S.; Kanekal, S.G.; Hosokawa, K.; et al. Space Plasma Physics: A Review. IEEE Trans. Plasma Sci. 2023, 51, 1595–1655. [Google Scholar] [CrossRef]
- Tsurutani, B.T.; Gonzalez, W.D.; Tang, F.; Akasofu, S.I.; Smith, E.J. Origin of Interplanetary Southward Magnetic Fields Responsible for Major Magnetic Storms near Solar Maximum (1978–1979). J. Geophys. Res. Space Phys. 1988, 93, 8519–8531. [Google Scholar] [CrossRef]
- Khuntia, S.; Mishra, W.; Agarwal, A. Evolution of Interacting Coronal Mass Ejections Driving the Great Geomagnetic Storm on 10 May 2024. arXiv 2025, arXiv:2504.03335. [Google Scholar]
- Tsurutani, B.; Mannucci, A.; Ijima, B.; Saito, A.; Yumoto, K.; Abdu, M.; sobral, J.; Gonzalez, W.; Guarnieri, F.; Tsuda, T.; et al. Global Dayside Ionospheric Uplift Andenhancements Due to Interplanetary Shock Electric Fields. J. Geophys. Res. 2004, 109, A08302. [Google Scholar] [CrossRef]
- Mannucci, A.J.; Tsurutani, B.T.; Iijima, B.A.; Komjathy, A.; Saito, A.; Gonzalez, W.D.; Guarnieri, F.L.; Kozyra, J.U.; Skoug, R. Dayside Global Ionospheric Response to the Major Interplanetary Events of October 29–30, 2003 “Halloween Storms”. Geophys. Res. Lett. 2005, 32, L12S02. [Google Scholar] [CrossRef]
- Tsurutani, B.T.; Verkhoglyadova, O.P.; Mannucci, A.J.; Saito, A.; Araki, T.; Yumoto, K.; Tsuda, T.; Abdu, M.A.; Sobral, J.H.A.; Gonzalez, W.D.; et al. Prompt Penetration Electric Fields (PPEFs) and Their Ionospheric Effects during the Great Magnetic Storm of 30–31 October 2003. J. Geophys. Res. Space Phys. 2008, 113, A05311. [Google Scholar] [CrossRef]
- Imtiaz, N.; Younas, W.; Khan, M. Response of the Low- to Mid-Latitude Ionosphere to the Geomagnetic Storm of September 2017. Ann. Geophys. 2020, 38, 359–372. [Google Scholar] [CrossRef]
- Cheng, P.-H.; Lin, C.; Otsuka, Y.; Liu, H.; Rajesh, P.K.; Chen, C.-H.; Lin, J.-T.; Chang, M.T. Statistical Study of Medium-Scale Traveling Ionospheric Disturbances in Low-Latitude Ionosphere Using an Automatic Algorithm. Earth Planets Space 2021, 73, 105. [Google Scholar] [CrossRef]
- Smith, A.R.; Ozturk, D.S.; Delamere, P.; Lu, G.; Kim, H. Investigating the Interhemispheric Asymmetry in Joule Heating During the 2013 St. Patrick’s Day Geomagnetic Storm. Space Weather 2023, 21, e2023SW003523. [Google Scholar] [CrossRef]
- Ye, H.; Yi, W.; Zhou, B.; Wu, J.; Yu, B.; Tian, P.; Wang, J.; Long, C.; Lu, M.; Xue, X.; et al. Multi-Instrumental Observations of Midlatitude Plasma Irregularities over Eastern Asia during a Moderate Magnetic Storm on 16 July 2003. Remote Sens. 2023, 15, 1160. [Google Scholar] [CrossRef]
- Calabia, A.; Anoruo, C.; Shah, M.; Amory-Mazaudier, C.; Yasyukevich, Y.; Owolabi, C.; Jin, S. Low-Latitude Ionospheric Responses and Coupling to the February 2014 Multiphase Geomagnetic Storm from GNSS, Magnetometers, and Space Weather Data. Atmosphere 2022, 13, 518. [Google Scholar] [CrossRef]
- Singh, R.; Lee, Y.S.; Song, S.M.; Kim, Y.H.; Yun, J.Y.; Sripathi, S.; Rajesh, B. Ionospheric Density Oscillations Associated With Recurrent Prompt Penetration Electric Fields During the Space Weather Event of 4 November 2021 Over the East-Asian Sector. J. Geophys. Res. Space Phys. 2022, 127, e2022JA030456. [Google Scholar] [CrossRef]
- Fuller-Rowell, T.J.; Codrescu, M.V.; Moffett, R.J.; Quegan, S. Response of the Thermosphere and Ionosphere to Geomagnetic Storms. J. Geophys. Res. Space Phys. 1994, 99, 3893–3914. [Google Scholar] [CrossRef]
- Wan, X.; Xiong, C.; Gao, S.; Huang, F.; Liu, Y.; Aa, E.; Yin, F.; Cai, H. The Nighttime Ionospheric Response and Occurrence of Equatorial Plasma Irregularities during Geomagnetic Storms: A Case Study. Satell. Navig. 2021, 2, 23. [Google Scholar] [CrossRef]
- Jin, S.; Jin, R.; Kutoglu, H. Positive and Negative Ionospheric Responses to the March 2015 Geomagnetic Storm from BDS Observations. J. Geod. 2017, 91, 613–626. [Google Scholar] [CrossRef]
- Yue, X.; Wang, W.; Lei, J.; Burns, A.; Zhang, Y.; Wan, W.; Liu, L.; Hu, L.; Zhao, B.; Schreiner, W.S. Long-Lasting Negative Ionospheric Storm Effects in Low and Middle Latitudes during the Recovery Phase of the 17 March 2013 Geomagnetic Storm. J. Geophys. Res. Space Phys. 2016, 121, 9234–9249. [Google Scholar] [CrossRef]
- Tang, J.; Gao, X.; Yang, D.; Zhong, Z.; Huo, X.; Wu, X. Local Persistent Ionospheric Positive Responses to the Geomagnetic Storm in August 2018 Using BDS-GEO Satellites over Low-Latitude Regions in Eastern Hemisphere. Remote Sens. 2022, 14, 2272. [Google Scholar] [CrossRef]
- Tang, J.; Gao, X.; Li, Y.; Zhong, Z. Study of Ionospheric Responses over China during September 7–8, 2017 Using GPS, Beidou (GEO), and Swarm Satellite Observations. GPS Solut. 2022, 26, 55. [Google Scholar] [CrossRef]
- Cai, X.; Burns, A.G.; Wang, W.; Qian, L.; Solomon, S.C.; Eastes, R.W.; McClintock, W.E.; Laskar, F.I. Investigation of a Neutral “Tongue” Observed by GOLD During the Geomagnetic Storm on May 11, 2019. J. Geophys. Res. Space Phys. 2021, 126, e2020JA028817. [Google Scholar] [CrossRef]
- Nguyen, C.T.; Berthelier, J.-J.; Petitdidier, M.; Amory-Mazaudier, C.; Huy, M.L. Climatology of Nighttime Medium-Scale Traveling Ionospheric Disturbances at Mid and Low Latitudes Observed by the DEMETER Satellite in the Topside Ionosphere During the Period 2005–2010. J. Geophys. Res. Space Phys. 2022, 127, e2022JA030517. [Google Scholar] [CrossRef]
- Ding, F.; Wan, W.; Ning, B.; Zhao, B.; Li, Q.; Zhang, R.; Xiong, B.; Song, Q. Two-Dimensional Imaging of Large-Scale Traveling Ionospheric Disturbances over China Based on GPS Data. J. Geophys. Res. Space Phys. 2012, 117, A08318. [Google Scholar] [CrossRef]
- Tang, J.; Li, Y.; Yang, D.; Ding, M. An Approach for Predicting Global Ionospheric TEC Using Machine Learning. Remote Sens. 2022, 14, 1585. [Google Scholar] [CrossRef]
- Akala, A.O.; Oyeyemi, E.O.; Amaechi, P.O.; Radicella, S.M.; Nava, B.; Amory-Mazaudier, C. Longitudinal Responses of the Equatorial/Low-Latitude Ionosphere Over the Oceanic Regions to Geomagnetic Storms of May and September 2017. J. Geophys. Res. Space Phys. 2020, 125, e2020JA027963. [Google Scholar] [CrossRef]
- Tsurutani, B.T.; Lakhina, G.S.; Verkhoglyadova, O.P.; Gonzalez, W.D.; Echer, E.; Guarnieri, F.L. A Review of Interplanetary Discontinuities and Their Geomagnetic Effects. J. Atmos. Sol.-Terr. Phys. 2011, 73, 5–19. [Google Scholar] [CrossRef]
- Paznukhov, V.V.; Sopin, A.A.; Galushko, V.G.; Kashcheyev, A.S.; Koloskov, A.V.; Yampolski, Y.M.; Zalizovski, A.V. Occurrence and Characteristics of Traveling Ionospheric Disturbances in the Antarctic Peninsula Region. J. Geophys. Res. Space Phys. 2022, 127, e2022JA030895. [Google Scholar] [CrossRef]
Disclaimer/Publisher’s Note: The statements, opinions and data contained in all publications are solely those of the individual author(s) and contributor(s) and not of MDPI and/or the editor(s). MDPI and/or the editor(s) disclaim responsibility for any injury to people or property resulting from any ideas, methods, instructions or products referred to in the content. |
© 2025 by the authors. Licensee MDPI, Basel, Switzerland. This article is an open access article distributed under the terms and conditions of the Creative Commons Attribution (CC BY) license (https://creativecommons.org/licenses/by/4.0/).
Share and Cite
Tang, J.; Wang, S.; Wang, J.; Hu, M.; Xu, C. Analysis of Ionospheric Disturbances in China During the December 2023 Geomagnetic Storm Using Multi-Instrument Data. Remote Sens. 2025, 17, 1629. https://doi.org/10.3390/rs17091629
Tang J, Wang S, Wang J, Hu M, Xu C. Analysis of Ionospheric Disturbances in China During the December 2023 Geomagnetic Storm Using Multi-Instrument Data. Remote Sensing. 2025; 17(9):1629. https://doi.org/10.3390/rs17091629
Chicago/Turabian StyleTang, Jun, Sheng Wang, Jintao Wang, Mingxian Hu, and Chaoqian Xu. 2025. "Analysis of Ionospheric Disturbances in China During the December 2023 Geomagnetic Storm Using Multi-Instrument Data" Remote Sensing 17, no. 9: 1629. https://doi.org/10.3390/rs17091629
APA StyleTang, J., Wang, S., Wang, J., Hu, M., & Xu, C. (2025). Analysis of Ionospheric Disturbances in China During the December 2023 Geomagnetic Storm Using Multi-Instrument Data. Remote Sensing, 17(9), 1629. https://doi.org/10.3390/rs17091629