2.3.1. Threshold Method for Rainfall Event Forecasting
Yao et al. [
21] proposed a three-factor forecasting method that utilizes the PWV value, the change in PWV from adjacent epochs, and its rate of change to predict whether a rainfall event will occur in the near future. In such threshold-based rainfall forecasting methods, if one or more forecast factors exceed their corresponding optimal thresholds, the model predicts the possibility of rainfall occurring within a specified time window. If rainfall actually occurs within that time frame, it is considered an accurate forecast; otherwise, it is considered a false alarm. According to the World Meteorological Organization’s definition of short-term rainfall forecasting [
29], this study selects a 12 h forecast window. Consequently, four possible outcomes can arise from the forecast: (1)
: the forecast predicts rain, and rainfall occurs within the next 12 h; (2)
: the forecast predicts rain, but no rainfall occurs within the next 12 h; (3)
: the forecast predicts no rain, but rainfall occurs within the next 12 h; (4)
: the forecast predicts no rain, and no rainfall occur within the next 12 h. For the purpose of statistical analysis, a 2 × 2 contingency table is employed to summarize the specific values of
,
,
and
.
In this study, the following key performance indicators are primarily used: (1) probability of detection (
POD), also referred to as recall, which represents the proportion of accurately forecasted rainfall events among the total true rainfall events. It reflects the model’s ability to correctly identify rainfall events, with higher values indicating better model performance; (2) false alarm rate (
FAR), which represents the proportion of erroneously forecasted rainfall events among the total forecasted rainfall events. It reflects the false reporting rate of the model’s rainfall forecasts, with lower values indicating better performance; (3) critical success index (
CSI), which is a combined metric of both
POD and
FAR. Its value ranges from 0 to 1, with higher values indicating better model performance. The calculation formulas for
CSI,
POD, and
FAR are given by Equations (7)–(9).
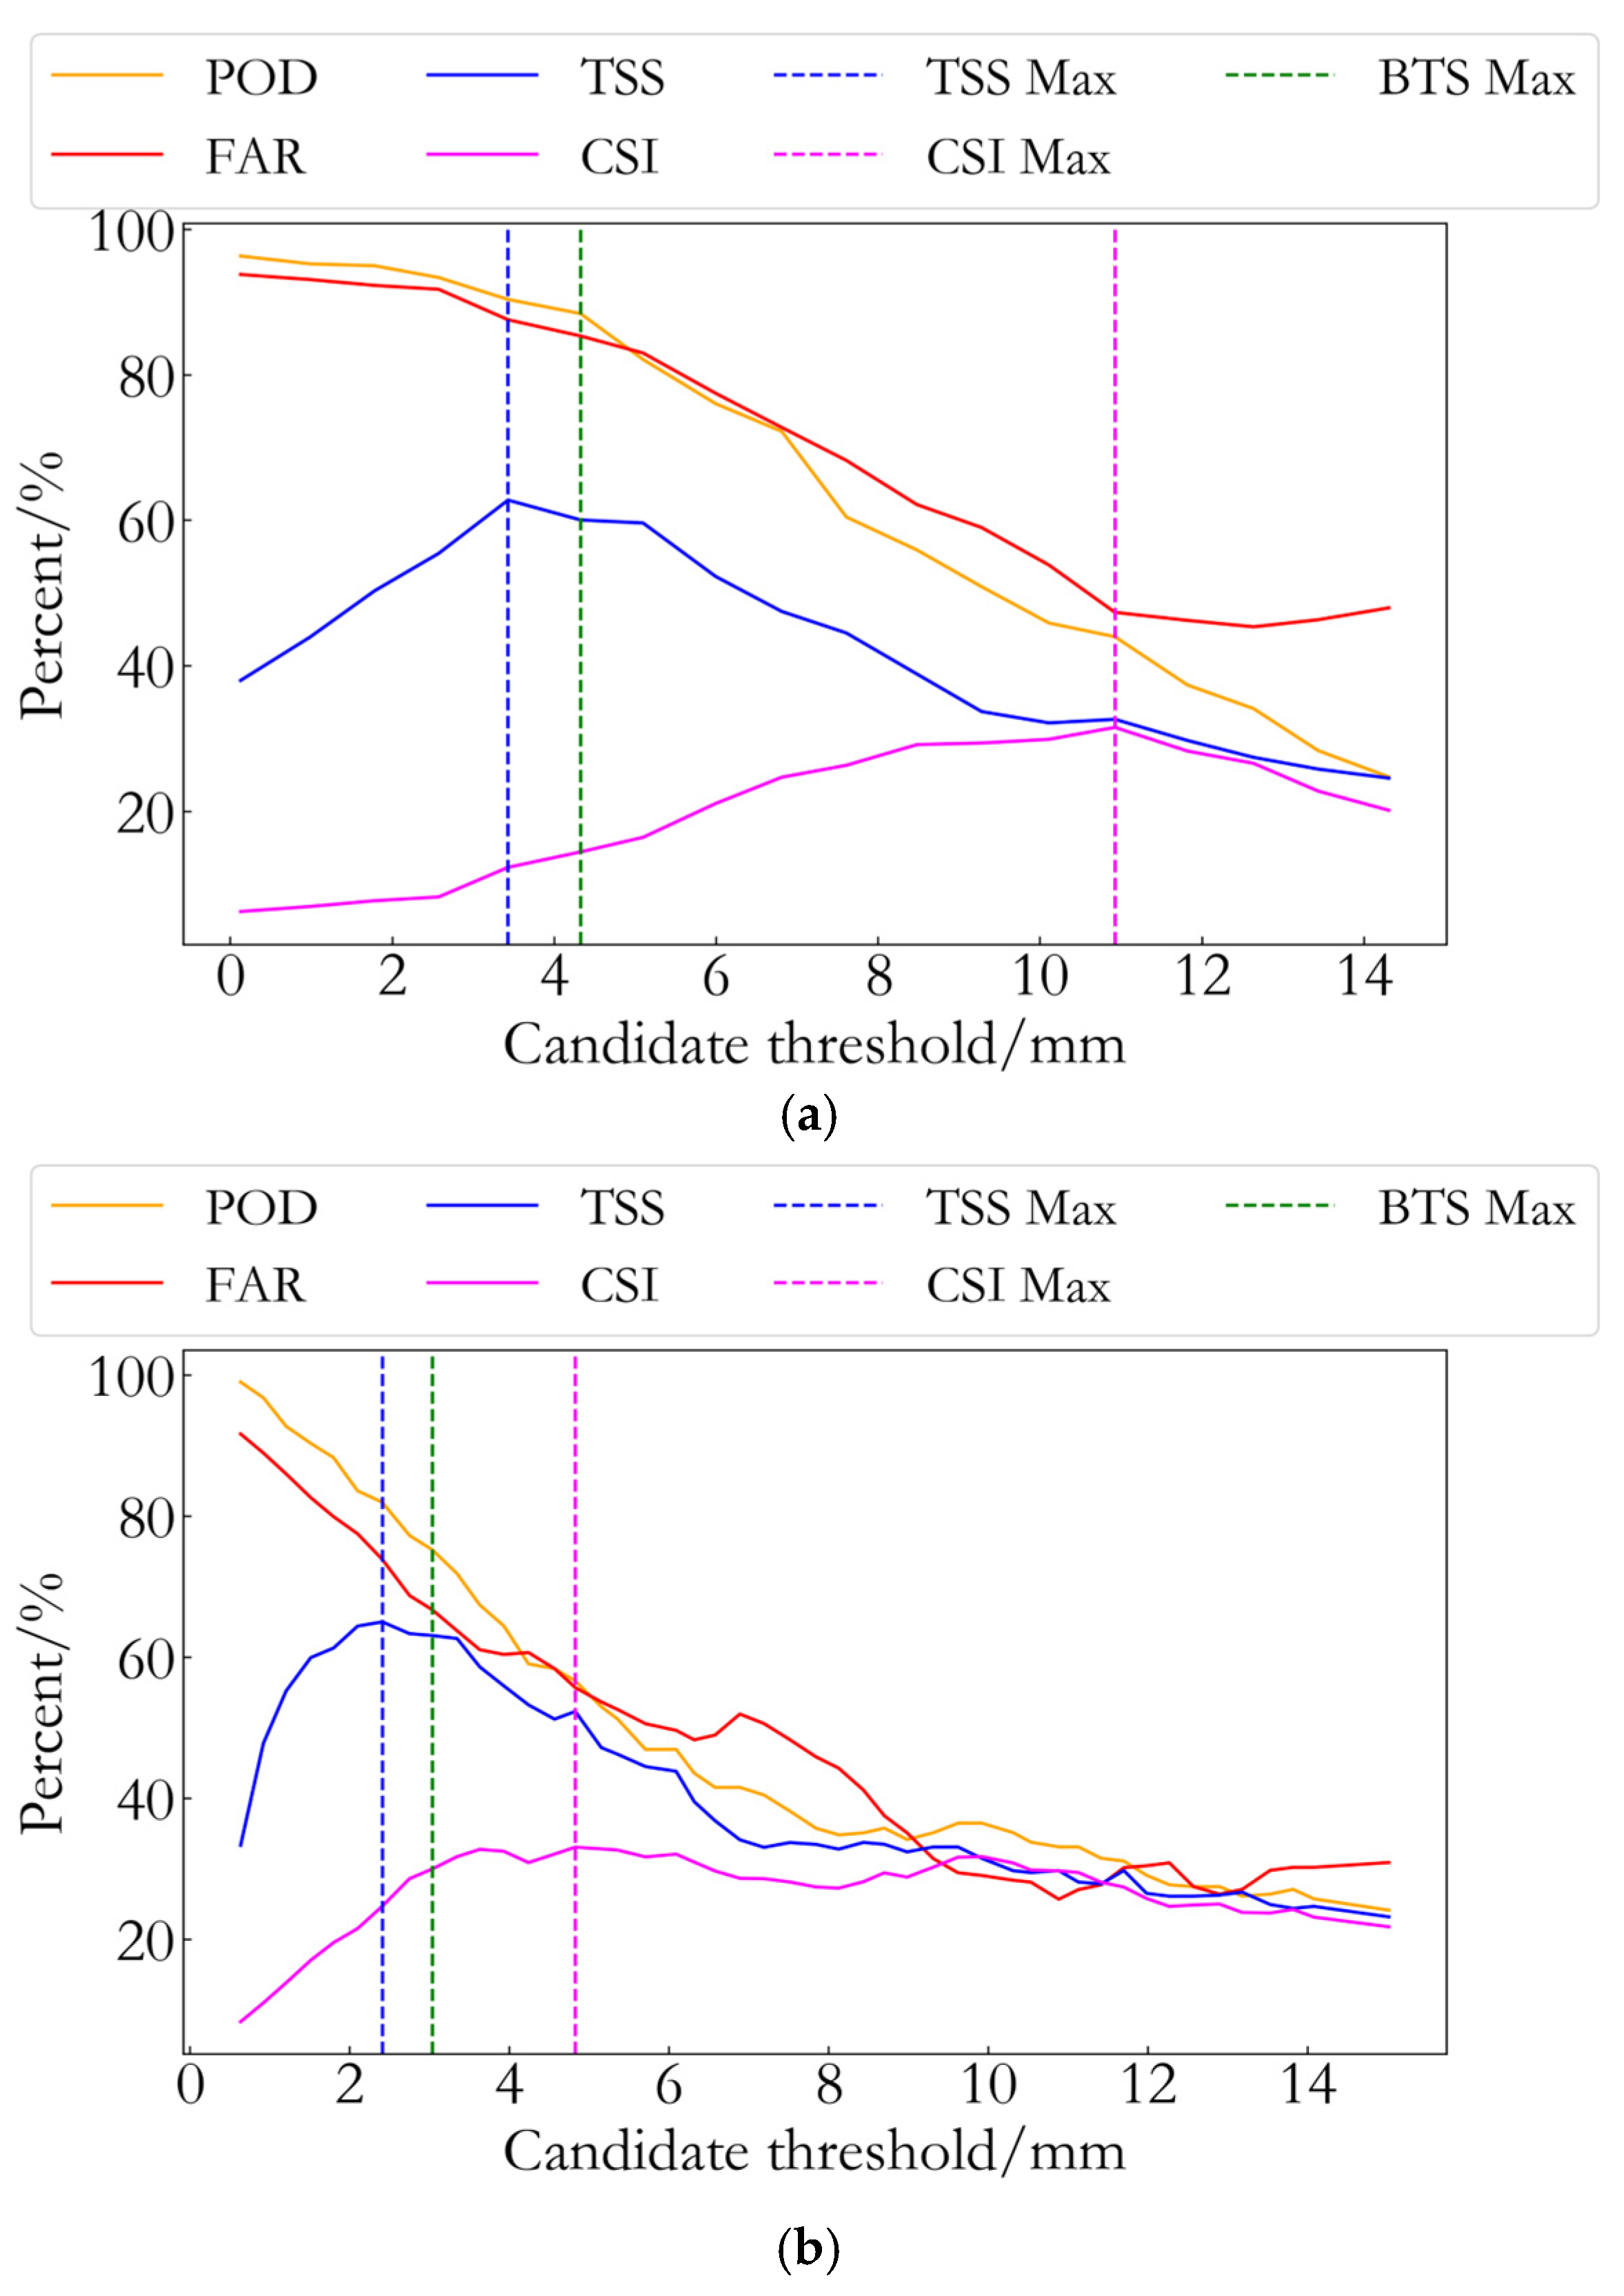
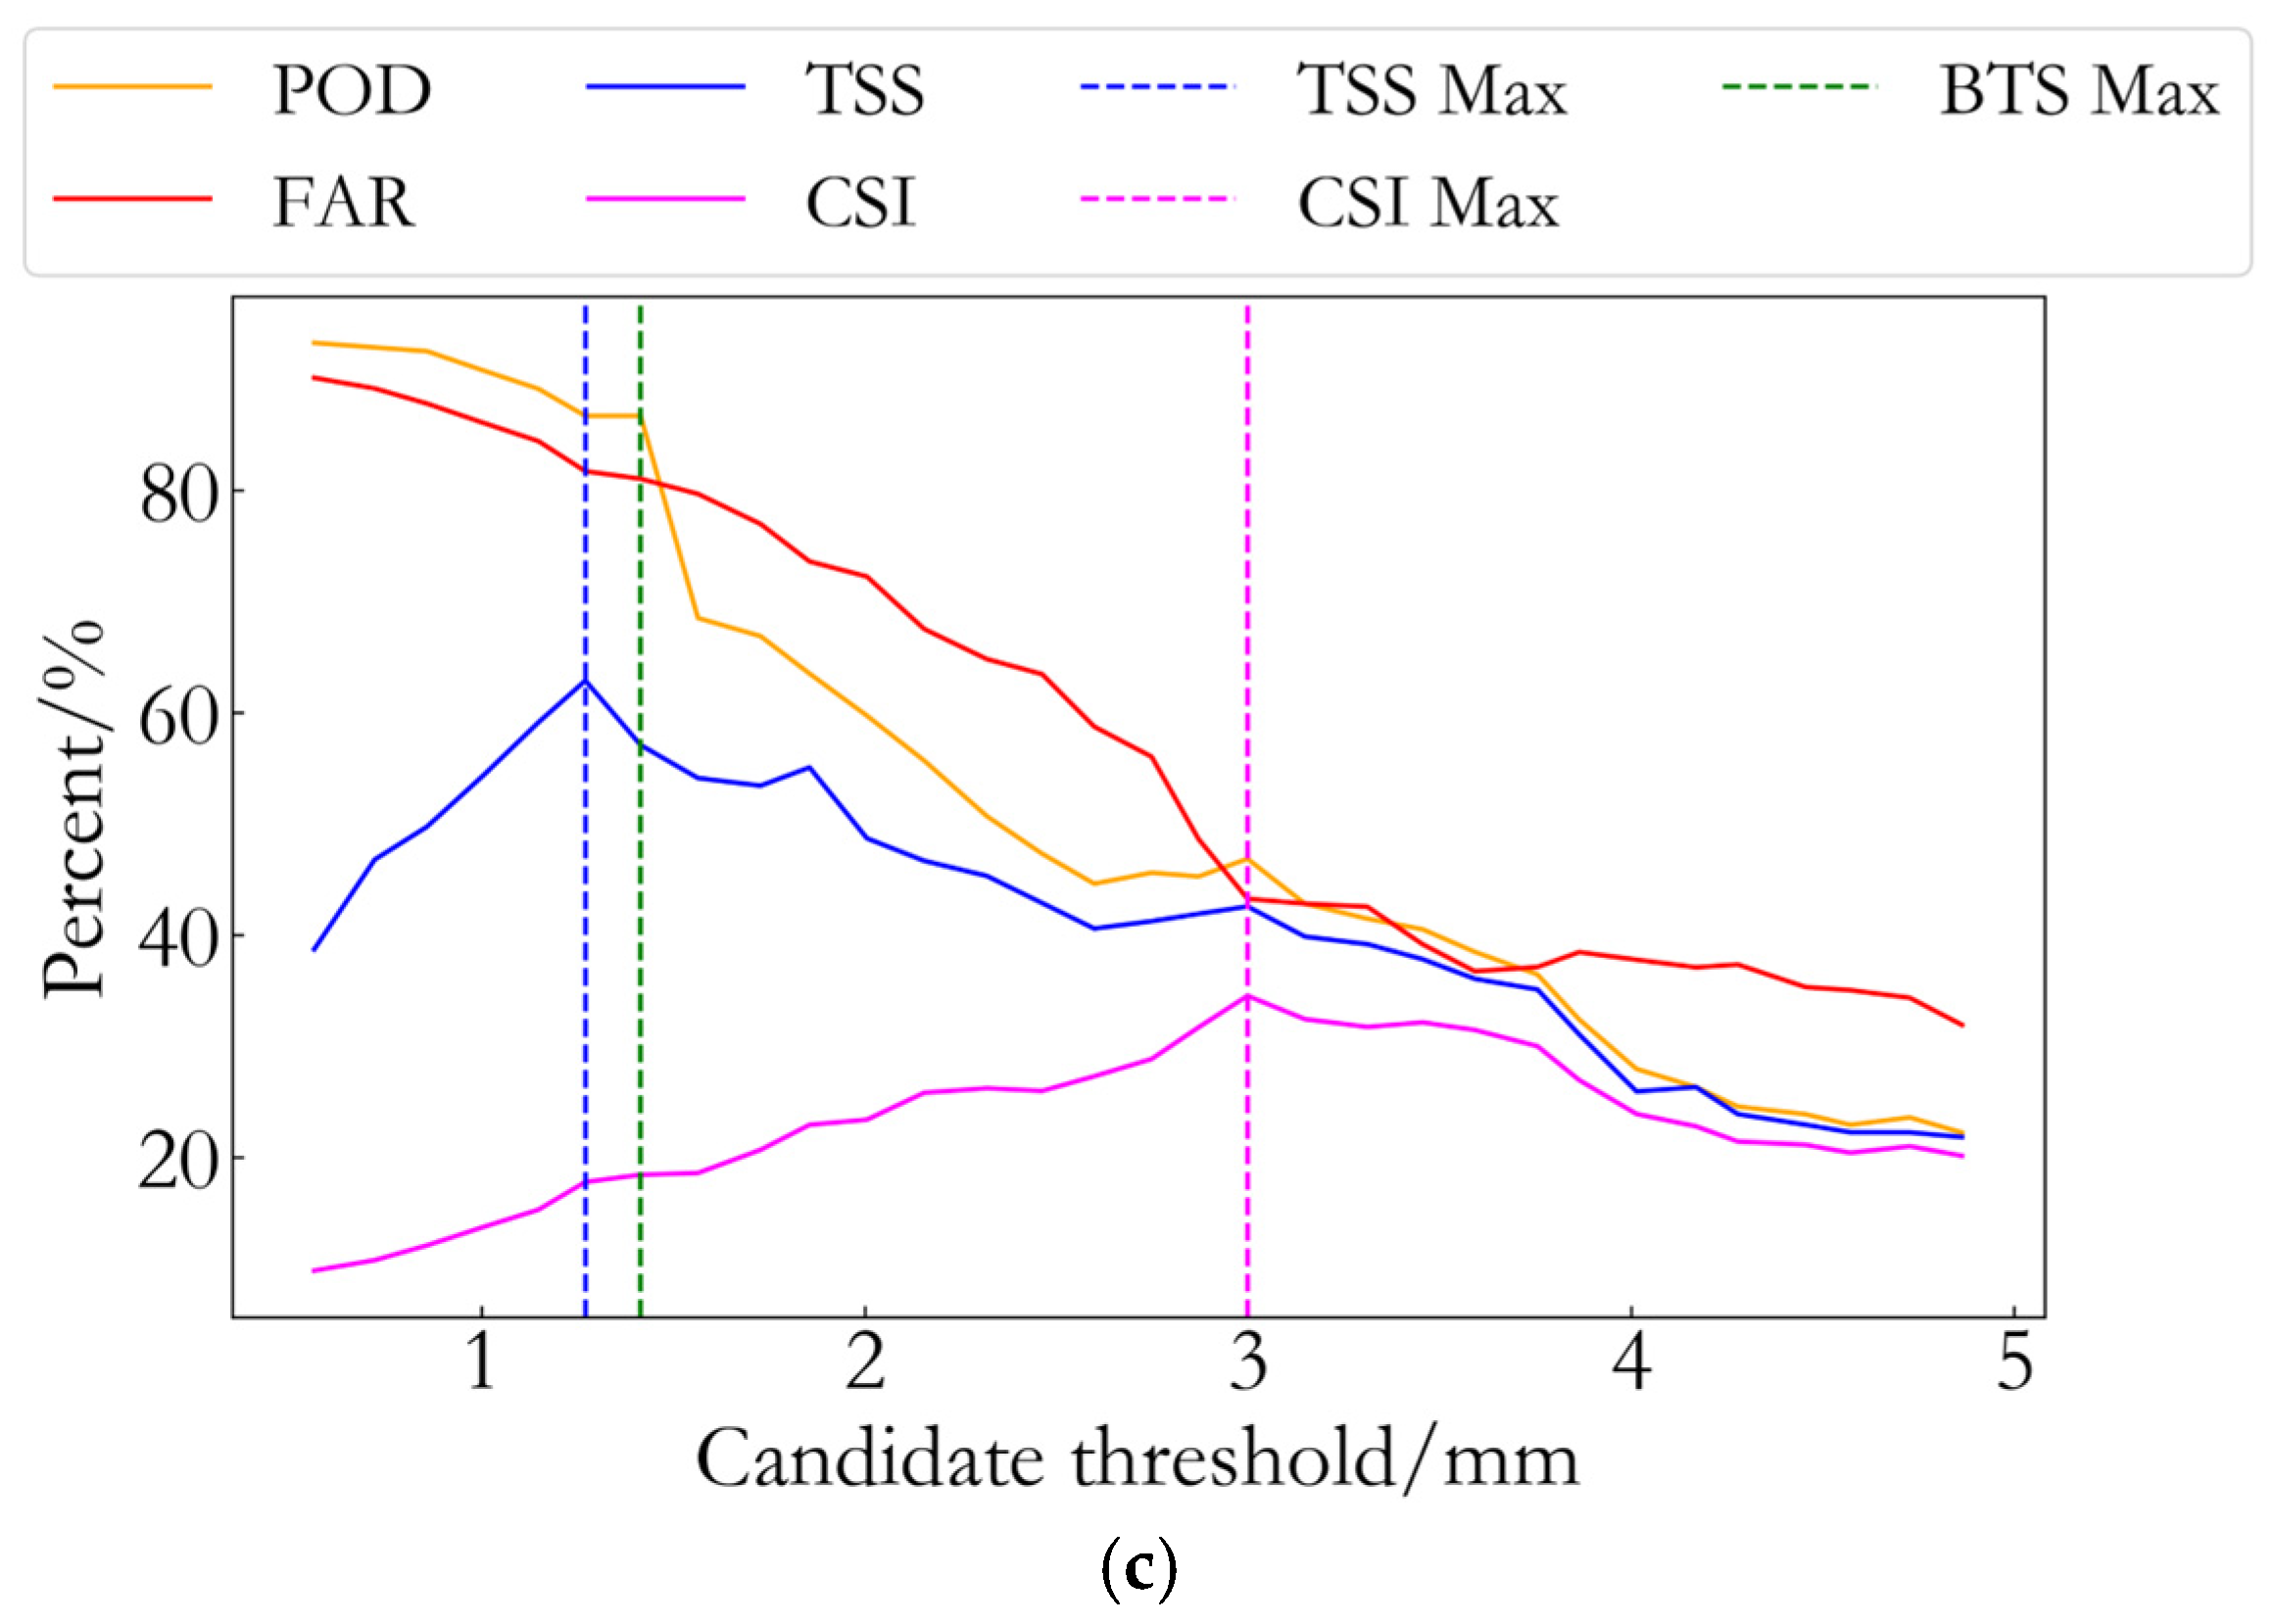
In threshold-based rainfall forecasting methods, determining the optimal threshold for each forecast factor is one of the key steps. In [
30], Li et al. employed the
CSI to determine the optimal threshold for each forecast factor, achieving good results in the prediction of heavy rainfall events. However, the optimal thresholds obtained using the
CSI method often result in lower
POD values, leading to the underreporting of numerous rainfall events. Therefore, the
CSI method seems to be more suitable for forecasting heavy rainfall events, with relatively poor applicability to events of varying intensities. The true skill statistic (
TSS) method [
31], which evaluates model performance by balancing
POD and
FAR, can still yield high values even in the presence of a high
FAR. This suggests that the
TSS method may sometimes tend to accept forecasts with higher false alarm rates, potentially leading to an overprediction of rainfall events and affecting the reliability of the forecast results. The calculation formula for
is shown in Equation (10).
To address the limitations of the two aforementioned methods, this study proposes the
BTS method. The core concept of the
BTS method is to maximize the
value by considering both
POD and
FAR simultaneously, thereby optimizing the threshold selection process and avoiding over-reliance on any single metric. In rainfall event forecasting, the
method effectively balances the trade-off between missed detections and false alarms, further enhancing the accuracy and reliability of the forecasts. The calculation formula for the
BTS value is as follows:
The process for determining the optimal threshold proposed in this study is as follows:
(1) For a given forecast factor, the specific values for each time step within the 12 h preceding the start of each rainfall event (defined as a rainfall event on a given day, e.g., 26 May being a single rainfall event) are calculated. For instance, if a rainfall event occurs at 17:00, the values of the forecast factor are calculated for each full hour from 12 h prior to that time, resulting in a total of 12 values. These 12 values are then sorted from the minimum to the maximum;
(2) From the sorted values of the forecast factor in step (1), the minimum value is selected as the minimum candidate threshold, and the value at the 80% position in the sorted list is selected as the maximum candidate threshold. Then, between the minimum and maximum candidate thresholds, a series of thresholds are selected at fixed intervals (with fixed intervals of 1 mm for PWV, 0.2 mm for PWV increment, and 0.1 mm/h for PWV growth rate) to generate all candidate thresholds for the forecast factor;
(3) Based on the experimental GNSS buoy data, each candidate threshold generated in step (2) is used to forecast the rainfall event. The BTS is then calculated using Equation (8) for each candidate threshold, resulting in a BTS value for each threshold. The threshold corresponding to the maximum BTS value is selected as the optimal threshold for the month, which is then used for forecasting subsequent rainfall events.
2.3.2. Random Forest Method for Rainfall Event Forecasting
This study establishes a short-term rainfall forecasting model based on historical data of rainfall events and their associated meteorological factors using the Random Forest method [
32,
33]. The specific steps are as follows:
(1) Data collection and integration
PWV data were collected from the GNSS buoy, while precipitation, temperature, atmospheric pressure, and relative humidity at the buoy location were obtained via bilinear interpolation from the surrounding ERA5 data. The temporal resolution is set to hourly, with UTC time used for uniform alignment;
(2) Data cleaning and normalization
The collected data undergo cleaning, including the removal of missing and outlier values. Subsequently, input variables such as temperature, atmospheric pressure, relative humidity, and atmospheric PWV are normalized, with their values scaled between 0 and 1 to reduce the impact of dimensional differences on model training;
(3) Feature variable selection
Based on the target of rainfall event prediction, temperature, pressure, relative humidity, and PWV are selected as input feature variables, while the occurrence of rainfall is treated as the output target variable. These features reflect the relationship between meteorological factors and rainfall amounts;
(4) Validation Set Division and Stratified K-fold Cross-validation
To assess the generalization performance of the model, a 10-fold stratified cross-validation method is employed. The data are divided into a training set (70%), a validation set (15%), and a test set (15%). The dataset consists of 331 non-rain events and 104 rain events, with rain events being notably less frequent. The “train_test_split” method is used to ensure that the test set maintains the same proportion of rain and non-rain events as the original dataset (achieved through the “stratify” parameter).
The remaining 70% of the data are used as the training set. A 10-fold stratified cross-validation is then performed on the training set using the “StratifiedKFold” method. This method ensures that each fold’s training and validation sets contain an appropriate proportion of both rain and non-rain events, which is critical due to the significant class imbalance between rain and non-rain events. Without stratification, traditional K-fold cross-validation could result in certain folds having an insufficient number of samples from one class, adversely affecting the model’s training and evaluation. By using stratified cross-validation, we enhance the model’s ability to learn from both classes and improve its robustness;
(5) Random Forest Model Parameter Optimization
After the cross-validation procedure, the hyperparameters of the Random Forest model are optimized using grid search combined with cross-validation. Key parameters, including the number of decision trees (n_estimators), maximum tree depth (max_depth), minimum samples required to split a node (min_samples_split), and minimum samples required at a leaf node (min_samples_leaf), are determined. These parameters are optimized to balance model complexity and prediction accuracy, thereby enhancing the model’s generalization ability;
(6) Model Training and Final Evaluation
Once the model’s hyperparameters are optimized through cross-validation, the final model is trained using the entire training set, which includes all the data from the 10-fold cross-validation. The independent test set is then used to evaluate the model, ensuring that the test data remains unseen during training and cross-validation. This independent evaluation mitigates the risk of overfitting and ensures that the model’s generalization ability is properly assessed;
(7) Model Performance Evaluation
The trained model is independently validated using the test set data. Metrics such as CSI, POD, and FAR are employed to quantify the accuracy, sensitivity, and false alarm rate of the model’s predictions, providing a comprehensive evaluation of the model’s performance in forecasting rainfall events.


 ,
, 


