1. Introduction
Globally, rising temperatures contribute to discomfort, economic losses, migration, and increased mortality rates [
1,
2]. Climate change threatens food security by reducing agricultural productivity [
3] and has various indirect effects on habitat quality and urban biodiversity, influencing population dynamics and ecosystem services [
1]. Additionally, rising temperatures pose serious health risks, particularly in low-income countries [
2].
Drought is one of the most critical risks associated with climate change, increasing in both frequency and severity [
4]. However, its impacts are not solely determined by the hazard itself but are largely shaped by the socio-environmental context and the characteristics of affected systems [
5]. The World Disaster Report [
6] estimates that approximately 530 million people experienced drought and food insecurity between 2004 and 2013. Drought directly affects key economic sectors—including agriculture, energy, tourism, timber, and fisheries—which are heavily dependent on water. Indirect consequences include job losses, business closures, investment declines, and economic instability [
7]. Understanding the complexity of drought impacts requires an analysis of the broader context in which these events occur, as well as the interactions between individual and collective responses at household and community levels [
8].
In urban areas, prolonged heat waves, soil dryness, and water shortages resulting from rising temperatures and extended dry periods can significantly affect populations [
9]. Cities tend to be particularly vulnerable to drought events [
10], often facing increased risks of infectious diseases due to compromised water supplies and sanitation infrastructure [
11]. However, while urban areas suffer from these challenges, rural households are often more severely impacted due to their lower socio-economic status and greater dependence on agriculture [
4,
12]. The effects of drought also vary across countries [
13]. In developing nations—particularly in Africa, where urban thermal environments are changing rapidly—studies highlight growing concerns about rising malnutrition and disease rates [
14,
15,
16]. Similar concerns have been raised in Brazil, where researchers emphasize the implications for public health [
17]. In developed countries, the focus tends to be on economic consequences, such as in Australia, where agriculture is a key economic sector [
18], or on physical damages and social disruptions, as seen in the Netherlands [
19]. Additionally, developed nations often prioritize policy responses to mitigate the impacts of drought on water resources and supply infrastructures [
20,
21].
In Syria, drought is a defining characteristic of its semi-arid climate, marked by alternating wet and dry cycles [
22]. Long-term meteorological data reveal an increasing trend in temperature and a decreasing trend in precipitation [
23], leading to a rise in drought frequency, severity, and duration [
22]. Since 1990, Syria has become increasingly susceptible to extreme weather events, with more than two major occurrences per decade [
24,
25]. Studies by ACSAD [
13] project a significant decline in precipitation, particularly from September to November and March to May, by 2050.
Atmospheric temperature and precipitation are key indicators of climate change intensity [
26]. To analyze Syria’s recent recurring drought patterns, previous studies have primarily focused on meteorological drought trends using different datasets and widely applied indices such as the Standardized Precipitation Index (SPI) and the Standardized Precipitation Evapotranspiration Index (SPEI). These indices rely on data from Syria’s national network of weather stations, but a major limitation is the significant spatial and temporal gaps in meteorological records. The distribution of these stations is uneven, concentrated mainly in major water resource areas; many are not automated, and a substantial number have been destroyed during the ongoing civil war, coinciding with worsening climate impacts.
To address these data limitations, other researchers have turned to remote sensing techniques, using indicators such as the Normalized Difference Vegetation Index (NDVI) and Land Surface Temperature (LST) to assess drought impacts, particularly in the agricultural sector. However, NDVI values fluctuate not only due to meteorological and hydrological factors but also due to socio-demographic and administrative influences, particularly during Syria’s prolonged conflict. Distinguishing the effects of these additional variables from those of climate change has proven challenging, limiting the applicability of previous studies in modeling the spatiotemporal dynamics of climate change in Syria.
Nevertheless, several factors support the use of LST as a crucial meteorological proxy for monitoring climate dynamics in Syria. Rising temperatures contribute to increased evaporative losses from water bodies, vegetation, and soils, which in turn affect agricultural water use [
27,
28]. Studies have also observed a negative correlation between precipitation and LST across various regions [
26,
29], while a strong relationship between LST and air temperature has been well documented [
30,
31]. Remote sensing-derived LST data can help overcome the limitations of sparse meteorological stations and data gaps, offering valuable insights into drought recurrence and climate change patterns.
Furthermore, increasing LST trends in Syria may indicate the expansion of the urban heat island (UHI) effect and changes in soil moisture storage. These trends reflect shifts in land use and land cover (LULC), particularly the rapid urbanization occurring in many parts of the country. The well-established link between urban LST increases and LULC changes [
32] highlights the importance of satellite-based LST products for assessing climate vulnerability in urban areas.
Given these factors, this study focuses exclusively on temperature rise over the past two decades at a regional scale. By developing an integrated methodology that leverages remote sensing and geographic information system (GIS) techniques, this research systematically identifies the areas most severely impacted, i.e., where temperature rise exceeds drought thresholds. Understanding the drivers of these changes, as well as analyzing population distribution and land cover characteristics, will enable national and local authorities, along with non-governmental organizations (NGOs), to design targeted mitigation and adaptation strategies. These insights are particularly crucial in the context of Syria’s reconstruction efforts, where climate resilience must be integrated into long-term planning.
This study makes several scientific and practical contributions in the fields of remote sensing applications, climate change analysis, and climate-driven socio-economic impacts. The key scientific contributions of this research include the following:
Advancing climate change monitoring in conflict-affected regions by integrating remote sensing (RS) and geographic information system (GIS) techniques into a novel methodology. This approach addresses a critical challenge in climate research: the lack of reliable meteorological records in conflict zones, providing an effective alternative for climate monitoring in data-scarce environments.
A new focus on temperature trends at a national scale by shifting the emphasis from precipitation trends and water availability, which have dominated previous drought studies in Syria, to temperature rise as a primary climate stressor. This study systematically identifies the most thermally affected pockets across the country, offering spatially explicit insights into regions most vulnerable to rising temperatures.
Identification of climate hotspots and their future risks through the analysis of MODIS LST (MOD11C3 and MOD11A2) datasets, revealing unexpected climate vulnerabilities in historically stable areas, including coastal regions previously considered resilient to climate change.
The study also projects long-term impacts, emphasizing that these climate hotspots will worsen food security challenges, accelerate land degradation, and increase urban vulnerability.
The rest of the paper is organized as follows. The methodology, including the study area, data, and framework of methodology, is described in
Section 2. The results are presented in
Section 3 which contains two subparagraphs: (1) the diagnostic of a general trend of temperature rise; (2) the identification of pockets most affected by temperature rise. The discussion is detailed in the
Section 4 by dividing it into five subparagraphs: (1) the interpretation of results; (2) the analysis of climate threats in affected pockets; (3) the analysis of impact and response; (4) the propositions; (5) the limitations and implications.
Section 5 presents the conclusion.
2. Methodology
2.1. Study Area
Syria spans a total area of 18,517,971 hectares, of which 6 million hectares are cultivated lands, while the rest consists of steppe and rocky mountains [
33]. The country experiences a Mediterranean climate, characterized by cold, wet winters; warm, wet springs; hot, dry summers; and dry autumns. Aridity in Syria increases from west to east and north to south, with decreasing annual precipitation and increasing evapotranspiration rates [
22].
2.1.1. Agricultural Stability Zones
Based on total mean annual precipitation, Syria is divided into 5 agricultural stability zones [
34]:
Zone 1: Receives more than 350 mm/year.
Zone 2: Receives between 250 and 350 mm/year.
Zone 3: Receives more than 250 mm/year in at least half of the observed years.
Zone 4: Receives between 200 and 250 mm/year, but rarely less than 200 mm/year.
Zone 5: Receives less than 200 mm/year.
2.1.2. Geographical Regions and Climate
Syria’s diverse topography contributes to its varying climate conditions. The country can be divided into four main geographic regions [
33,
35]:
Mediterranean Coastal Region (West): Temperature ranges between 8 °C and 29.9 °C, with annual rainfall varying from 365 to 1365 mm.
Mountainous Region (East of the Coast): Temperature fluctuates between 4 °C and 27.4 °C, with annual rainfall between 500 and 1820 mm.
Steppe and Northern Plains (East of the Mountains): Encompassing Damascus, Homs, Hama, Aleppo, Hasaka, and Daraa, this region experiences temperatures between 2.5 °C and 37.7 °C, with rainfall ranging from 50 to 600 mm/year.
Southeastern Desert (Bordering Jordan and Iraq): The most arid region, with temperatures varying from 2.5 °C to 39.7 °C, and annual precipitation ranging between 20 and 370 mm.
2.1.3. Drought Patterns and Climate Trends
A recent meteorological analysis (1961–2012) identified three distinct regions in Syria with different temporal drought patterns [
22]:
Northeastern Inland Desert;
Southern Mountainous Landscape;
Northwestern Mediterranean Coast.
These findings highlight Syria’s spatially diverse drought evolution, emphasizing the need for region-specific adaptation and mitigation strategies.
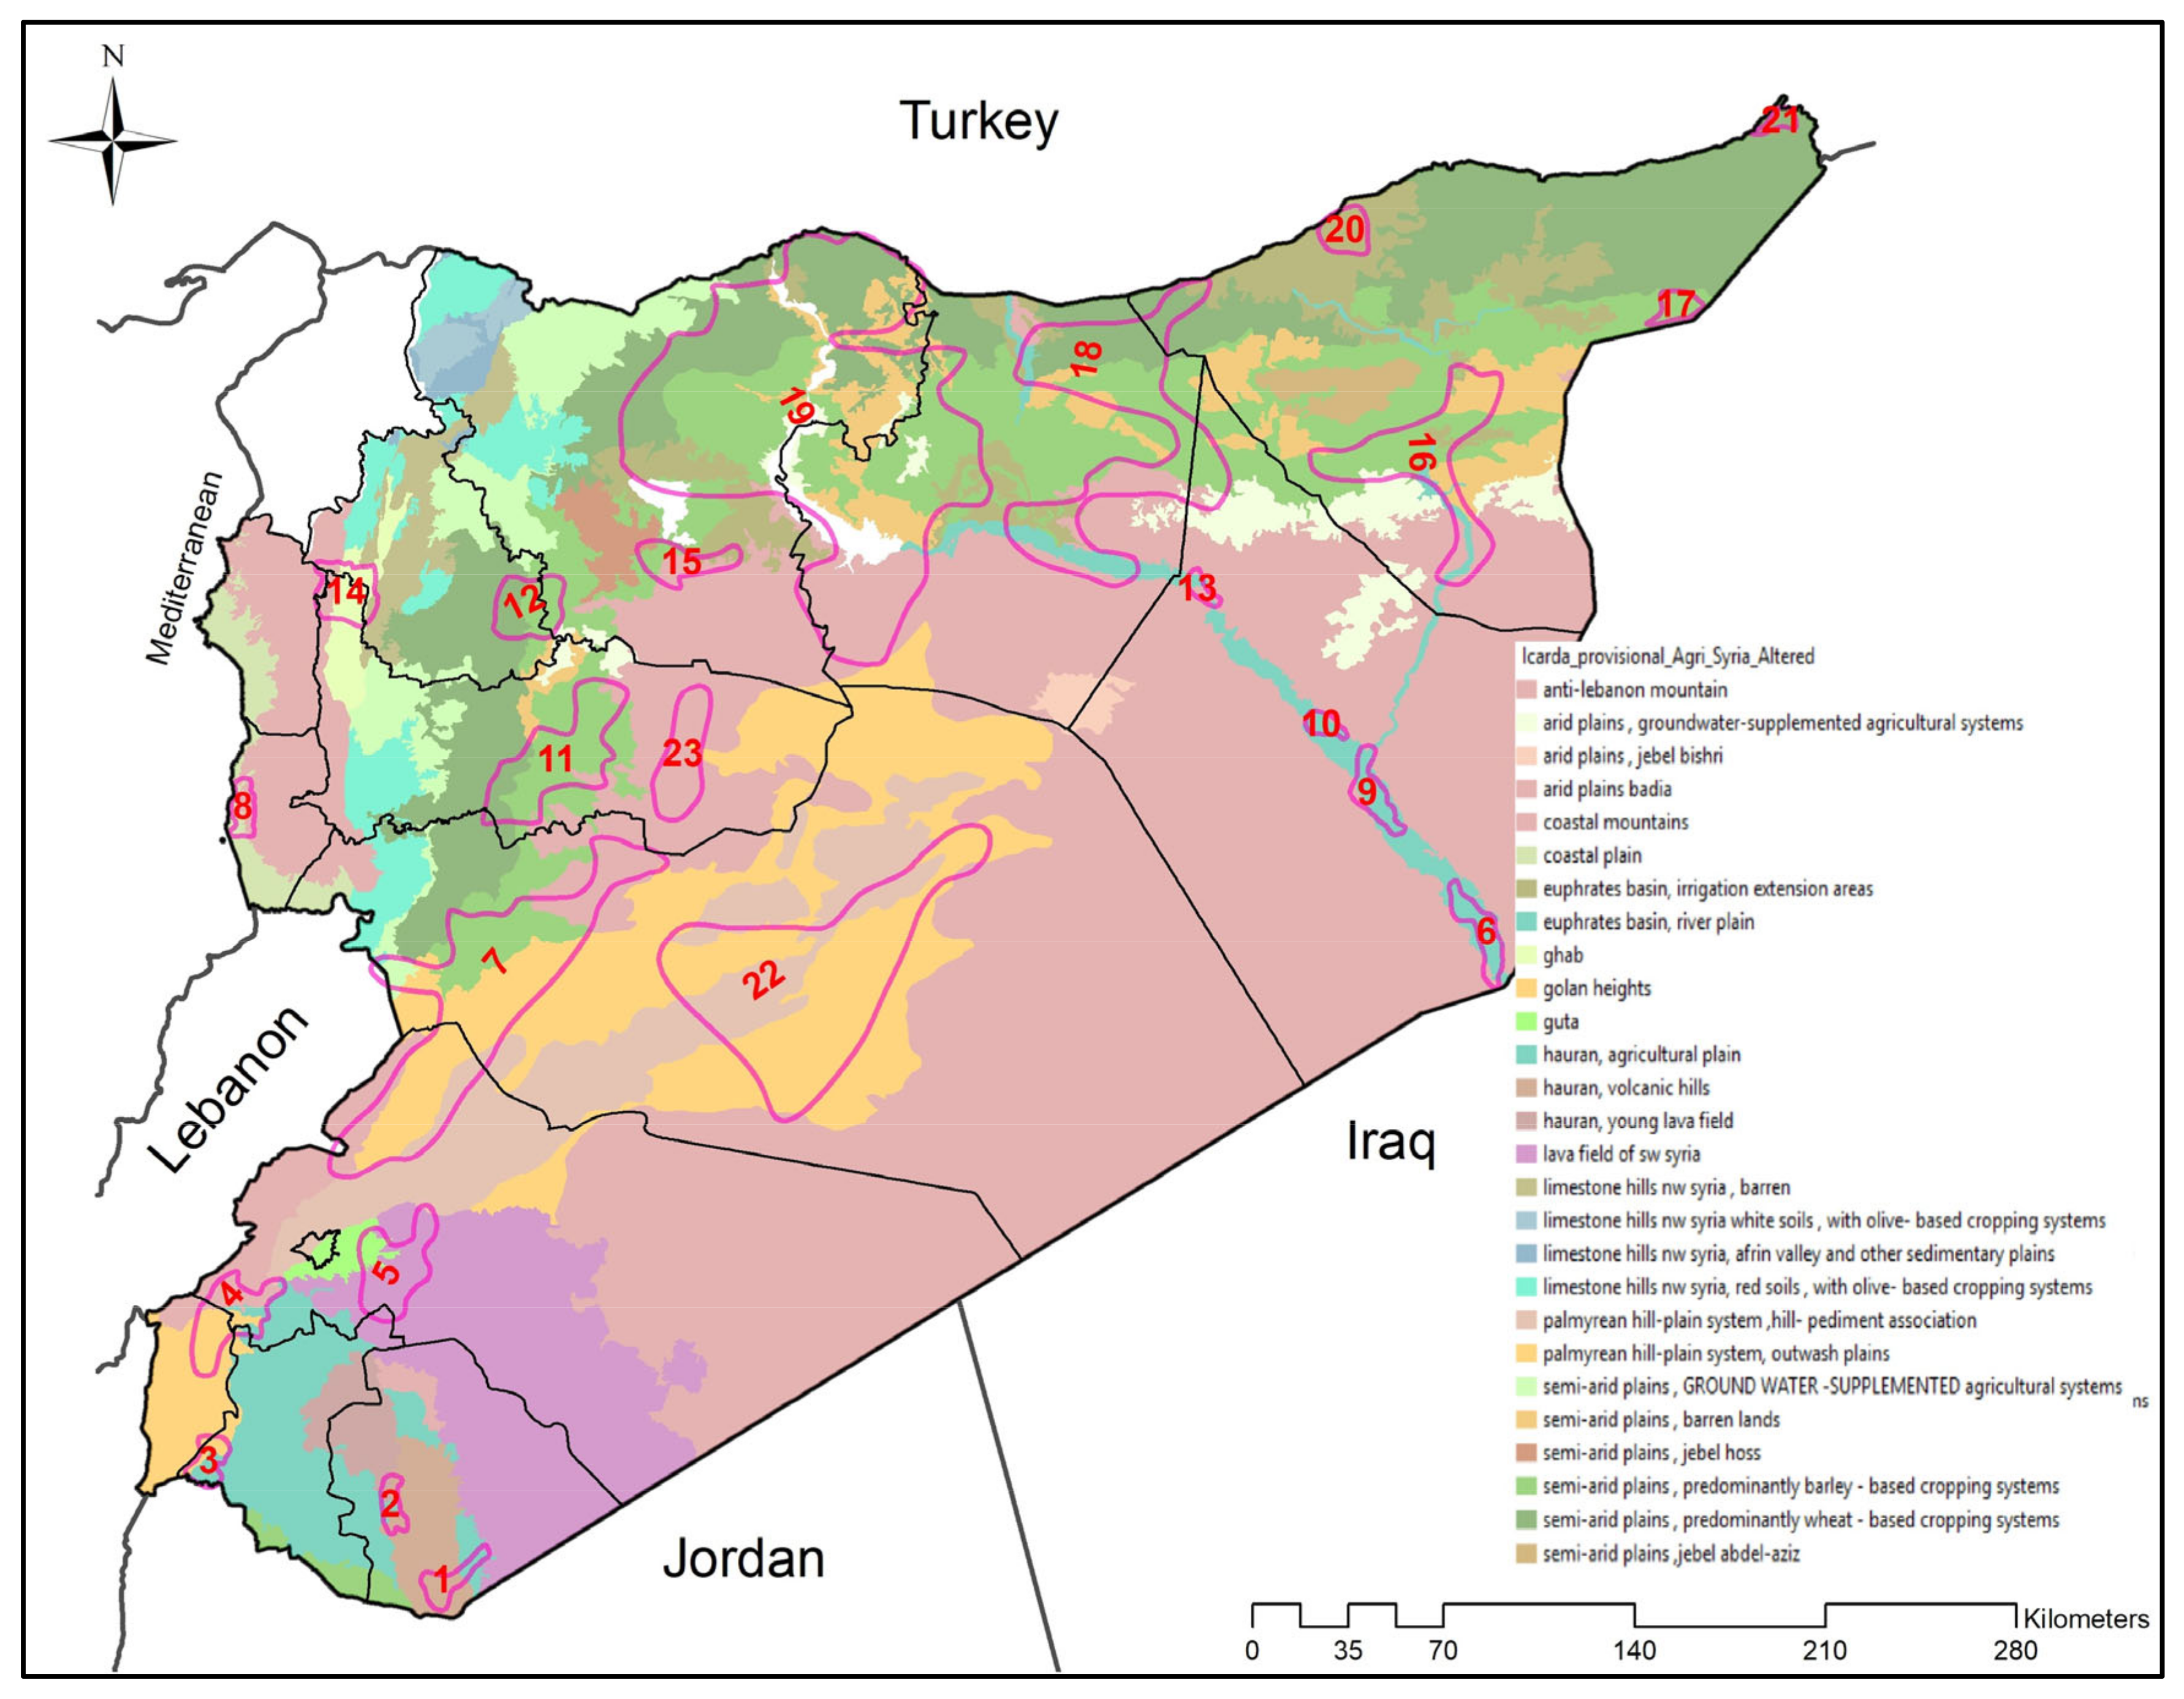
Figure 1 displays the study area including the main natural and geographical features.
2.2. Data
This study primarily utilizes Land Surface Temperature (LST) remote sensing products, specifically MOD11A2 and MOD11C3, along with various thematic maps, including land cover (2019), land use, water bodies, agricultural stability zones, and urban community centers.
The LST products (MOD11A2 and MOD11C3) were obtained from Moderate Resolution Imaging Spectroradiometer (MODIS) measurements aboard the Terra satellite. The MOD11A2 product, which provides 8-day composite LST data at ~1 km spatial resolution, was processed for the period 2000–2021 using the Google Earth Engine (GEE) platform. Meanwhile, the MOD11C3 product, a monthly composite dataset with ~5.5 km spatial resolution, was downloaded for the same period (2000–2021) from the Atmosphere Archive and Distribution System (LAADS) Distributed Active Archive Center (DAAC) (LAADS DAAC) in HDF format (
https://ladsweb.modaps.eosdis.nasa.gov/).
The five shapefile layers utilized in this research were sourced from the National Environmental Observatory (NEO) under the Ministry of Local Administration and Environment in Syria (MLOAE). The land cover map was originally obtained from OpenStreetMap (OSM), while the land use map was derived from Provisional Agri Syria Altered, a dataset compiled by ICARDA in 2010.
The water bodies layer includes 169 dams of various sizes distributed across different regions of Syria. These dams serve multiple purposes, including electricity generation, rainwater harvesting, flood regulation, and supporting agricultural and pastoral activities in arid and semi-arid areas.
The agricultural stability zones layer was initially developed by the Ministry of Agriculture, in collaboration with experts from the FAO and UNDP. It delineates five distinct agricultural zones based on average total annual rainfall, which are further explained in the Study Area section. These zones are crucial for understanding agricultural productivity, land use planning, and environmental management in Syria.
The urban community layer was initially based on the 2004 population census (Central Bureau of Statistics), with subsequent updates in 2011 and 2019, reflecting demographic changes over time.
2.3. Overview of the Proposed Framework
This study aims to identify regions experiencing a significant rise in temperature, making them increasingly susceptible to extreme weather events such as heat waves. These areas endure prolonged thermal stress, which adversely affects agriculture and accelerates desertification. Furthermore, the methodology explores high-frequency temporal patterns of thermal drought within specific spatial pockets, offering crucial insights into unsustainable climatic conditions. Given these challenges, there is an urgent need for well-structured response strategies to effectively mitigate climate variability and its consequences in these vulnerable regions. To achieve this objective, the methodology follows a structured workflow, illustrated in
Figure 2, and is divided into two main phases. Phase 1: Modeling Temperature Rise focuses on diagnosing both the temporal and spatial trends of temperature increase and is further divided into two parallel stages:
Phase 2: Spatial Analysis of Climate Threats in Affected Pockets aims to quantify the potential impact of rising temperatures on urban communities and agricultural lands within these vulnerable areas.
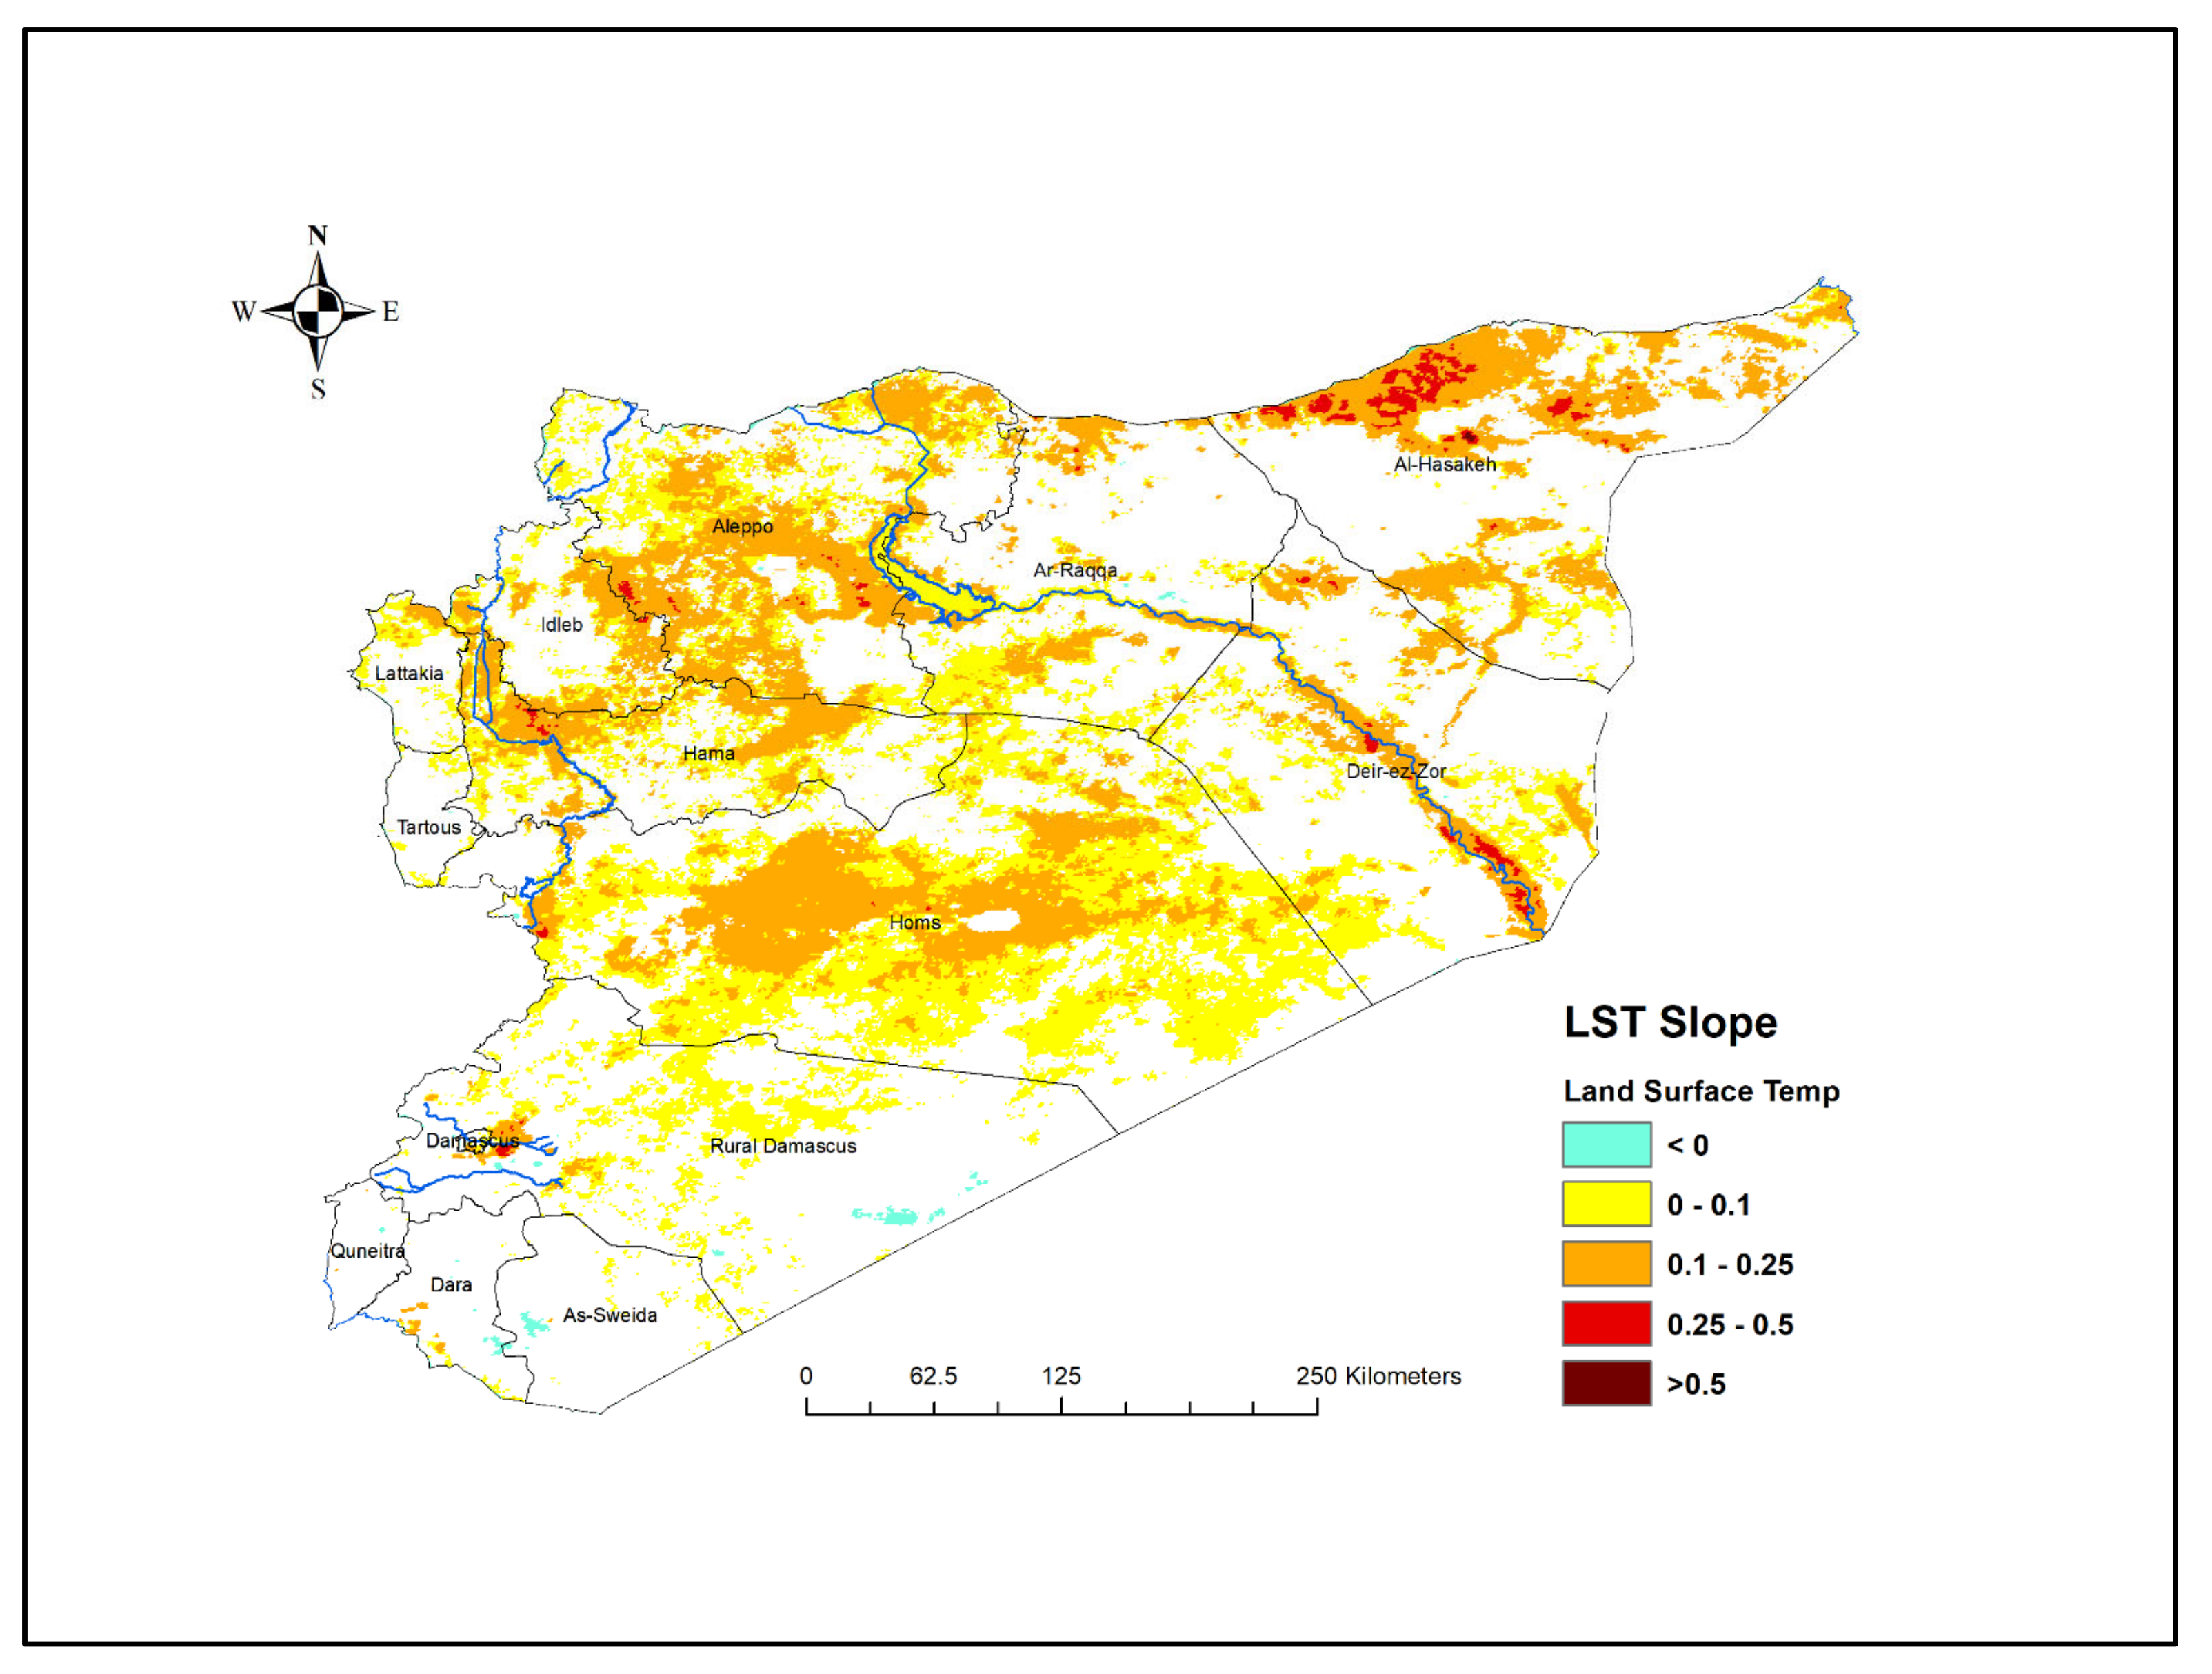
In Phase 1, Mann–Kendall and Sen’s slope indicators are employed in Stage 1 to analyze long-term trends in Land Surface Temperature (LST), based on annual averages. This step helps pinpoint regions by exhibiting a significant warming trend and delineates the areas experiencing the most substantial temperature increases. To enhance the precision of this analysis, MOD11A2 data, with their high spatiotemporal resolution (8-day intervals at 1 km resolution), are utilized within the Google Earth Engine (GEE) environment. This dataset enables accurate detection of localized variations in surface temperature, facilitating the identification of regions undergoing notable thermal changes.
Mann–Kendall and Sen’s slope indicators were calculated for each pixel by using the following equation [
36]:
where x
i is a time series, and j > i.
The p-value, derived from the Mann–Kendall equation, represents the confidence level in assessing the statistical significance of temperature changes. Regions that exhibit a high confidence level (above 95%) along with a positive slope, as determined by Sen’s slope equation, indicate a significant and consistent increase in temperature.
To map the pockets most affected by temperature rise in Stage 2 of Phase 1, the Temperature Condition Index (TCI) was employed as the first step in identifying regions where temperatures exceed drought thresholds. This analysis aims to evaluate the impact of temperature rise on agricultural productivity and, consequently, on the urban communities that rely on these agricultural systems.
Figure 2.
Framework of the methodology.
Figure 2.
Framework of the methodology.
For this purpose, the study utilized the MOD11C3 dataset, which offers coarser spatial resolution but ensures regular monthly coverage. By focusing on broader spatial patterns, this dataset provides a more comprehensive perspective on long-term climate trends, allowing for the identification of regions experiencing recurring drought conditions.
2.3.1. Data Processing and Analysis
The MOD11C3 dataset was preprocessed in the ERDAS environment through the following steps:
Clipping images to the study area over Syria.
Reprojecting the data using the UTM-N37 geographic reference system.
Stacking time-series layers monthly to compute the TCI values for the region.
The study analyzed monthly stacked layers (2000–2021) to calculate the pixel-wise drought frequency based on TCI values. Any pixel exhibiting drought conditions for at least 50% of the time was classified as a drought-affected site. To refine the analysis and minimize spatial variance in the drought layer, focal statistics were applied to the final dataset. A minimum function was implemented across a 3 × 3 pixel neighborhood, effectively extending the detected drought impact to the surrounding areas.
Using the “Extract Multi Values to Points” tool in ArcGIS, the final drought map was overlaid with urban community maps of Syria. Any urban site experiencing a dominant historic drought trend for at least one month was classified as “affected”. The more frequently an urban site exhibited this trend, the higher its classification, with some areas labeled as “deeply affected”.
2.3.2. Geospatial Classification of Affected Areas
In the second step, the “ConvexHull” method using spatial analyst tools by ArcGIS 10.8 was applied to consolidate spatially close urban sites into a single polygon, incorporating the core of temperature rise. This process generated a drought-affected map, highlighting areas that are under severe thermal stress.
Urban sites that do not directly experience thermal stress but are situated within affected pockets were classified as “low-affected sites”. This classification helps distinguish between core-impacted regions and those at potential risk due to proximity.
Pixel-wise monthly TCI values were calculated from 2000 to 2021 based on satellite—“LST” values as shown in Equation (2) [
37]:
where T, T
max, and T
min are smoothed values of monthly “LST” obtained from the monthly MOD11C3 product provided at ~5.6 km spatial resolution.
Every pixel with a TCI value of less than 40% (as at this percent the thermal stress affects the vegetation health [
37]) is classified as thermal-stress-affected (see
Table 1). This study identified a pixel as thermal-stress-affected if it had a TCI value of less than 40% for at least 13 months from 2000 to 2021 (22 years).
In the second phase, an advanced spatial analysis was conducted to assess the impact of rising temperatures on urban communities and agricultural lands within the most vulnerable regions. To achieve this, the identified high-risk pockets were overlaid with various thematic maps, including agricultural stability zones (ASZs), urban settlements, water bodies, land use, and land cover classifications. This integration allowed for a comprehensive evaluation of each pocket’s significance based on its geographic position, population density, and level of dependency on natural resources. The analysis further examined the strain on surface water resources and the implications for agricultural productivity, both of which directly affect the livelihoods of rural communities. To illustrate the methodological framework,
Figure 2 presents a detailed flowchart outlining the different datasets utilized and the sequential steps undertaken in this research. This updated methodology provides a structured and systematic approach to identifying temperature-affected pockets and evaluating their repercussions on socio-economic and environmental factors.
4. Discussion
4.1. Interpretation
The growing drought frequency is mostly related to climate change, which has highly impacted the arid and semi-arid areas such as the eastern Mediterranean region. It could be interpreted within the big spatial scale where global warming affects the general circulation of the atmosphere, especially Hadley Cell “HC”, which transports energy and angular momentum poleward and organizes the three-dimensional tropical atmospheric circulation [
39]. Several studies have reported poleward expansion in the Hadley Cell in the northern and southern hemispheres and a shift in the subtropical dry zone toward the poles, linking these changes to the effects of global warming [
40]. This, in turn, will lead to drier conditions for the latitudes of the study area.
Considering factors of less spatial dimensions, in recent decades, the highest daily maximum temperature on Earth was reported in Kuwait and southern Iraq, exceeding fifty degrees during the summer. These extreme temperatures activate thermal low-pressure systems associated with a dry, hot continental eastern wind, especially in northern and northeast Syria.
Concurrently, Yildiz et al. (2016) [
41] reported more frequent drought periods at the Syrian–Turkish border (Jarablus) during 1973–2010. This leads to an increase in evaporation due to high temperature [
42] and a decrease in surface water levels and soil moisture because of the significant negative trend in the mean annual flow of the Euphrates [
41]. This leads to more frequent dust storms across the region [
43], which exacerbates the rising heating trend there.
It is worth mentioning that the drought also affects regions with abundant annual rainfall (more than 600 mm/year), such as coastal and southwest mountainous areas. The thermal depressions extending from the southeast lead to an increase in the frequency of hot dry eastern winds. As the wind ascends the eastern slopes of coastal mountains and descends along the western slopes, it heats up adiabatically, resulting in hotter and drier winds. These winds often bring extreme temperatures and contribute to wildfires, as observed in the coastal region of Syria in the fall of 2020.
The land degradation may have contributed to the significant rise in temperature in some identified pockets. The good pastures have decreased by about 12% (~2300 km
2) between 2000 and 2015 [
34], and this may have affected the lands in the large pocket N°22 in the Syrian steppes where the rate of overgrazing escalated during the war. The urban growth in Tartous governorate, as it was considered a safe place for refuge during the war, could also be an additional cumulative reason for the increase in temperature observed in the pocket N°8.
4.2. Analysis of Climate Threats in Affected Pockets
4.2.1. Spatial Demographic Analysis
The affected regions, identified in this study, include around 1343 urban communities inhabited by more than two and a half million Syrians at the base of the population density distribution data in 2019. The analysis of the spatial distribution of drought-affected populations in the five agricultural stability zones in Syria (
Figure 5) showed that most of them (about 60%) live in the first, second, and third zones (20%, 33%, and 8%, respectively). In addition, most of the affected residents in the fifth zones (more than 533 thousand habitants) live on the banks of the Euphrates and Khabur rivers, where the lands are fertile, irrigated, and overexploited.
As seen in
Figure 6, the largest drought-affected pocket is the N°19, which contains 649 urban communities resided by about 900 thousand habitants. It covers, at the east of Aleppo, the fertile agricultural lands around Al-Asad artificial lake and those located north of natural Jabbul lake, which is included in the 1971 RAMSAR convention for the wetlands. Most of these agricultural lands are located within the West Maskana, Est Maskana, and Al-Asad Establishment irrigation projects. At the east of this pocket, there are also two important drought-affected areas (the N°18 and the N°16) in the Upper Euphrates, inhabited by more than 300,000 peoples and covering vast irrigated agricultural lands. These three affected pockets are likely to interconnect over time.
The second largest pocket, the N°22, is located in the heart of the desert. It includes only five cities, the most important of which are Palmyra and Sokhneh, home to about 58 thousand and 18 thousand people, respectively, at the base of the 2010 demographic census. Currently, these five towns are empty due to the war. Palm oases in the vicinity of Palmyra are the most important feature in this pocket.
The large pocket N°7 is distributed between the 5th, 4th, and 3rd agricultural stability zones and extends from the Kalmon Mountains in the south to the west plains of Homs in the north. It contains about 96 cities and villages, and more than 250 thousand people inhabit it. This pocket is very close to the N°5 at the south, N°11 at the north, and N°23 at the northeast.
The most striking result of this study is the appearance of some drought-affected areas in the first agricultural stability zone, which is heavily rainy. These areas are clustered in four pockets: N°3, N°4, N°8 and N°14. In the south of Syria, the pocket N°4 contains about 45 villages along the slopes of Mount Hermon, whose peak is covered with snow most of the year. It extends over about 623 km2 of land, inhabited by more than 125,000 people, and is mainly invested in planting fruit trees such as walnuts, apricots, and berries. Pocket N°8 is situated in the coastal region, including Tartous city and about 44 surrounding villages, and inhabited by more than 300 thousand people, while its population before the crisis was less than 200 thousand. This pocket’s estimated area of 154 km2 is mainly invested in olive, citrus fruits, and protected crops. To its northeast, the pocket N°14, with an estimated area of 438 km2, is distributed between the coastal mountains and “Ghab” plain on the borders of three governorates: Lattakia, Hama, and Idleb. More than fifty thousand people live in this area, which is mainly covered by various kinds of irrigated crops and fewer forests and fruit trees.
4.2.2. Spatial Analysis of Land Covers
The intersection between the 2019 landcover map and the layer of drought-affected pockets shows the domination of croplands in all drought-affected pockets, except the two pockets N°7 and N°22 where the bare lands and sparse vegetation are the most spread cover (see
Figure 7). The area of croplands represents about 65% of all pockets’ area. Those lands are spread mainly in the irrigated plains of Maskana and Al-Asad Establishment projects, the Ghouta area of Damascus, the Al-Ghab Plains, the irrigated banks of Euphrates, and the southwestern Hauran plains. The bare lands/spare vegetation, herbaceous lands, water, built-up land, shrubs, and forests represent about 17.1%, 12.6%, 2.2%, 1.6%, 0.9%, and 0.27%, respectively, of all pockets’ area.
Figure 6.
Areas and populations of drought-affected pockets in Syria between 2000 and 2021 (source: authors).
Figure 6.
Areas and populations of drought-affected pockets in Syria between 2000 and 2021 (source: authors).
Figure 7.
Distribution of land covers in affected pockets (source: authors).
Figure 7.
Distribution of land covers in affected pockets (source: authors).
Additional analysis of the data obtained from provisional Agri Syria Altered completed by ICARDA in 2010 (
Figure 8) showed that more than 11,000 km
2 of drought-affected areas, characterized as semi-arid lands, have wheat and barley cultivated. About 6286 km
2 of those areas exist in the pocket N°19 and are spread across Aleppo and AlRaqa governorates. Other important pockets planted by wheat and barley are the N°18 (about 1921 km
2), the N°16 (about 754 km
2), the N°11 (about 1143. km
2), and the N°7 (about 875 km
2) in the governorates of Alraqa, Hasaka, Hama, and Homs, respectively.
4.2.3. Spatial Analysis of Water Bodies
Among the 169 dams of various sizes in Syria, this research identified 31 inside the several thermal-stressed pockets. Only in the southern region of Syria, where 5 small affected pockets (N°1, N°2, N°3, N°4, and N°5) were identified, 11 dams are threatened by the rise in temperature. The risk of losing the functional importance for which the dams were built also threatens about 8 others located in the sole pocket, the N°7, in the central region of Syria. In the Badia region, which is the more arid area in Syria, 3 dams within the pocket N°22 are under the same risk. The previously mentioned dams are small and built to help the herders and enhance agriculture in the surrounding farms during the dry seasons. The loss of water in these small lakes because of the increasing evaporation and the augmented need for irrigation will deteriorate the livelihood of local populations.
In the largest pocket, N°19, there are only three dams at risk of temperature rise, but among these is the hydroelectric dam “Al-Asad”, the biggest in Syria. The large water reservoir of these dams was put into service in 1973 (the construction started in 1968) and is mainly employed in the West Maskana, West Maskana, and Al-Asad Establishment irrigation projects. The increased water abstraction for irrigation since the 1970s is the main cause of the significant reduction in the mean annual flows in the downstream in Euphrates basin in Syria (by about 30–40%), but the minor role of recurrent drought events in this region is expected to increase in the future [
44]. The increasing frequency of drought events and decreases in the annual flow of the Euphrates significantly augment the demand for water bodies for irrigation [
41]. These causes reduce electricity generation at the dams in the Euphrates basin [
45].
Within the rainy “Ghab” plain, two small dams, also built for enhancing crop irrigation, especially in summer, were identified under thermal pressure in the pocket N°14.
4.3. Impact and Response Analysis
Syria’s vulnerability to drought is exacerbated by multiple factors, including inefficient irrigation systems, water extractions by other regional actors in the eastern Mediterranean [
46], the increasing frequency of heat waves, and the heavy reliance on rainfed and groundwater-dependent agriculture [
35]. The USAID has projected a significant decline in vegetation levels across Syria [
35], a concerning trend given that the identified thermally stressed pockets cover nearly 25% of the country’s croplands, while agriculture contributes approximately 25% of the national GDP [
35,
47].
A prolonged drought in these pockets has accelerated the contraction of cultivable lands and increased desertification rates in many regions [
48]. This decline has led to reduced crop productivity, negatively impacting Syria’s economy, just as was observed between 2007 and 2009, when severe drought contributed to widespread agricultural failure [
13,
46]. According to the UN Office for the Coordination of Humanitarian Affairs (OCHA) [
45], approximately 150,000 farmers lost their harvest during the 2007–2008 season, leading to food insecurity for over 1 million people in Al-Hasaka, Al-Raqqa, Aleppo, and Deir Ezzor governorates. The resulting economic hardship and resource scarcity drove mass internal displacement from rural to urban areas [
13,
46], further straining infrastructure and public services, destabilizing urban centers, and increasing the risk of political unrest and regional conflicts [
25,
46]. In response to this crisis, the Syrian government issued an appeal for
$20 million in international aid to mitigate what was then considered the worst drought in four decades [
49].
The relationship between drought and migration remains a subject of academic debate. While Selby et al. (2017) affirmed that the 07/2006–09/2008 drought in northeastern Syria contributed to migration, their analysis found that its scale was not as extensive as often claimed in the literature [
50]. However, the identification of drought-affected pockets in this study—where more than 3.3 million people lived in 2010—provides a logical explanation for the waves of internal migration that preceded the Syrian war in 2011. Many people from the eastern and northern regions migrated toward urban centers, particularly Aleppo and Damascus, seeking better living conditions. As the war escalated, the loss of security further accelerated these migration flows. The sudden and large-scale population movement placed enormous pressure on urban infrastructure and natural resources, rendering cities more vulnerable to the impacts of climate change.
By 2019, the population in the identified drought-affected pockets had declined to approximately 2.5 million people, reflecting not only rural-to-urban migration but also widespread displacement to neighboring countries and Europe [
51]. Research has increasingly highlighted land degradation as a major driver of Syrian international migration, as deteriorating environmental conditions worsen already fragile livelihoods [
52]. The link between climate change and displacement is undeniable [
51]. Between 2014 and 2016, hundreds of thousands of Syrians reached Europe’s borders seeking asylum [
53], and in 2021 alone, over 78,000 Syrians applied for asylum in the EU, marking a 70% increase from the previous year [
54].
Forced displacement of established populations acts as a multiplier effect on the impacts of global climate change, intensifying socio-economic instability and compounding humanitarian crises [
51]. Understanding the role of climate change in Syrian out-migration has become even more critical in light of Cesar sanctions on the Syrian government and the devastating impact of COVID-19, both of which have weakened the resilience of Syrian communities and further exacerbated displacement pressures.
4.4. Propositions
Agriculture remains the primary source of income for many communities in drought-affected pockets, making their social and economic stability highly vulnerable to climatic fluctuations. Consequently, immediate actions are required to mitigate the adverse effects of rising temperatures, particularly in semi-arid regions.
Before 2011, water scarcity was already a growing concern in Syria [
55]. However, with the government and various agencies currently focused on addressing the ongoing war’s human and economic toll [
49], the long-term effects of climate change risk being overlooked. These effects will only exacerbate existing challenges, particularly regarding water shortages, posing a formidable obstacle to any future economic reconstruction efforts [
55]. Therefore, integrating drought management into broader economic development planning is essential. Recognizing the role of social safety nets in building economic resilience among vulnerable populations is crucial [
24]. This approach should include long-term strategies for water resource management, economic and social development, and environmental sustainability while also emphasizing the need for a sustained Drought Early-Warning System [
22].
However, due to the ongoing conflict, Syria has been unable to establish a comprehensive disaster policy and emergency management framework [
49]. To address this gap, international organizations and donors should support the Syrian government in implementing an effective planning framework [
24]. This framework must account for regional variations in drought severity, differentiating between areas based on their unique climatic and geographic characteristics. The drought-affected regions identified in this study can serve as a foundation for long-term national mitigation and adaptation strategies.
Sanctions imposed on the Syrian government have further constrained efforts to mitigate drought and combat desertification, limiting international collaboration in addressing these critical issues. Despite these challenges, several key policy options remain available. Improving water-use efficiency and productivity in agriculture, enhancing groundwater management and monitoring, and establishing international agreements for the sustainable management of transboundary rivers are among the most effective strategies [
46]. As temperatures continue to rise, domestic and agricultural water demand will inevitably increase, leading to greater seawater infiltration into coastal aquifers due to both rising sea levels and excessive groundwater extraction [
55]. Given these risks, expanding access to groundwater resources—which typically respond to droughts later than traditional water supply systems—will be essential in mitigating disaster risks [
11].
The UN-HABITAT Urban Recovery Framework (URF) in Syria [
56] has outlined several recommendations for strengthening water resource management. These include rehabilitating wastewater treatment plants to minimize water and soil contamination while maximizing the use of treated wastewater for irrigation and simultaneously reducing irrigated agriculture [
56]. Enhancing agricultural practices is another critical factor in increasing resilience to drought [
24]. The FAO Plan of Action for Syria [
57] sought to strengthen rural and peri-urban communities, institutions, and ecosystems, enhancing their ability to absorb, adapt to, and recover from conflict-related disruptions. Additionally, the plan aimed to reduce risks, anticipate future shocks, and mitigate their effects on food security and nutrition [
57]. The FAO’s recent initiatives have focused on four priority areas: (1) improving household food security and nutrition, (2) promoting sustainable livelihoods and employment, (3) ensuring the sustainable use of natural resources, and (4) enhancing the capacity of institutions, civil society organizations, and other key stakeholders.
Scientific advancements in breeding drought-resistant crop varieties will be instrumental in ensuring the sustainability of rainfed agriculture in Syria [
24]. In parallel, the UN-HABITAT URF has emphasized the importance of conservation farming practices to minimize water and fertilizer consumption [
56]. Additionally, a shift in agricultural policy is required, one that prioritizes local and regional markets over the current extractive agricultural model, which fails to consider resource regeneration [
55]. This new approach, as proposed by Daher (2022) [
55], should incorporate ecological solutions that regulate the relationship between farmers and natural resources, ensuring the sector’s long-term sustainability.
Each affected pocket requires a detailed qualitative study to analyze its interconnections with neighboring regions. If current trends persist, these drought-affected pockets are likely to expand and become more interconnected in the coming years. This progression will lead to further environmental degradation, increased socio-economic pressures, and complex cascading effects that will further challenge resilience and adaptation efforts.
4.5. Limitations and Implications
The prolonged war has created extremely challenging working conditions. The destruction of meteorological monitoring stations and the inability to conduct field surveys on climate impacts throughout the conflict—due to the fragmented control of territories by different groups—have severely limited direct data collection. Moreover, researchers’ restricted or unsafe movement during the war has made field surveys virtually impossible.
Given these constraints, remote sensing methods, when cross-referenced with findings from various studies that have examined the impacts of climate change on migration patterns, population movements, and agricultural production, can significantly enhance the reliability of analytical results. Integrating satellite-based data, including precipitation and NDVI, presents a promising direction for future drought detection and climate impact assessments in Syria.
5. Conclusions
Drought in Syria is not solely the result of human activities but is also driven by multiple climate change-related factors. These influences range from global atmospheric circulation patterns and the penetration of semi-tropical air masses into higher latitudes within the Hadley Cell to the formation of surface thermal lows due to direct heating of the Earth’s surface, which amplifies continental climatic characteristics. Additionally, topographical factors and adiabatic heating further shape regional climate conditions.
The interaction of these atmospheric and geographical factors creates a highly complex and dynamic climate system, with varying impacts across different regions. Syria, in particular, is subject to diverse atmospheric systems, ranging from polar-origin cold air masses to hot tropical currents, including moist Mediterranean flows and continental air masses originating from regions as varied as the Siberian plains and arid deserts.
Amid these climatic shifts, monitoring temperature rise in conflict-affected countries presents an additional challenge. The destruction or loss of ground-based climate monitoring stations has severely limited the ability to obtain accurate climate data. In this context, remote sensing applications have become essential for tracking temperature fluctuations and assessing their environmental and economic consequences. However, maximizing the reliability of these technologies requires enhancing confidence in analytical results through integrated methodologies that combine satellite data, climate models, and available ground verification methods. Understanding the current and future impacts of rising temperatures on human and natural resources is critical, as it directly contributes to the exacerbation of conflict-related consequences, including forced migration and economic decline, particularly in key sectors such as agriculture and water resource management. Recognizing the interplay between climate change and conflict is fundamental to developing effective adaptation strategies that mitigate environmental stressors and their socio-economic repercussions.
This 22-year study on drought in Syria has identified 23 drought-affected pockets, covering an area of over 31,000 km2. Notably, drought has impacted regions previously considered climatically stable and resilient to direct climate change effects, including coastal areas with historically high rainfall levels. These findings challenge conventional assumptions and highlight the unpredictable nature of regional climate change impacts.
The identified drought-affected pockets have had severe consequences for both urban areas and agricultural lands, affecting over 2.5 million people, down from 3.3 million in 2010, across 1343 settlements. In terms of agriculture, 65% of these drought-affected areas remain cultivated with various crops, accounting for approximately 25% of Syria’s croplands. Alarmingly, more than 11,000 km2 of these semi-arid lands continue to produce wheat and barley, relying on 31 dams within these pockets for supplementary irrigation. The emergence of new climatic conditions in these regions is accelerating land degradation, posing a significant threat to agricultural productivity and further worsening food insecurity in Syria.
Against the backdrop of a thirteen-year-long crisis, these climatic shifts are compounding socio-economic vulnerabilities, pushing millions of people toward internal displacement and migration, particularly to Europe. The increasing severity and persistence of drought conditions are not only reshaping Syria’s landscape but also driving long-term demographic changes that could have profound implications for regional stability.
In conclusion, the drought-affected pockets identified in this research serve as a crucial reference for Syria’s future reconstruction efforts. Given their spatial and local specificities, each of these pockets requires in-depth studies to better understand their unique vulnerabilities. Additionally, assessing the pre-crisis expansion rates of major cities within these pockets could provide valuable insights into internal migration patterns and their correlation with drought. Furthermore, a comprehensive review of planning studies at local, regional, and national levels is essential to effectively address these climate-impacted regions and to formulate targeted mitigation and adaptation policies that ensure sustainable resilience in the years ahead.


