Article

Potential of EnMAP Hyperspectral Imagery for Regional-Scale Soil Organic Matter Mapping

by
Yassine Bouslihim
1,* and
Abdelkrim Bouasria
2,3
1
National Institute of Agricultural Research (INRA), Rabat 10000, Morocco
2
Faculty of Science, Chouaib Doukkali University, El Jadida 24000, Morocco
3
Agmetrix, El Jadida 24000, Morocco
*
Author to whom correspondence should be addressed.
Remote Sens. 2025, 17(9), 1600; https://doi.org/10.3390/rs17091600
Submission received: 12 December 2024 / Revised: 12 January 2025 / Accepted: 17 January 2025 / Published: 30 April 2025

Abstract

:
The emergence of new-generation hyperspectral satellites offers more potential for mapping soil properties. This study presents the first assessment of EnMAP (Environmental Mapping and Analysis Program) hyperspectral imagery for soil organic matter (SOM) prediction and mapping using actual spectral data from 282 soil samples. Different spectral preprocessing techniques, including Savitzky–Golay (SG) smoothing, the second derivative of SG, and Standard Normal Variate (SNV) transformation, were evaluated in combination with embedded feature selection to identify the most relevant wavelengths for SOM prediction. Partial Least Squares Regression (PLSR) models were developed under different pre-treatment scenarios. The best performance was obtained using SNV preprocessing with the top 30 EnMAP bands (wavelengths) selected, giving R2 = 0.68, RMSE = 0.34%, and RPIQ = 1.75. The combination of SNV with feature selection successfully identified significant wavelengths for SOM prediction, particularly around 550 nm in the Vis–NIR region, 1570–1630 nm, and 1600 nm and 2200 nm in the SWIR region. The resulting SOM predictions exhibited spatially consistent patterns that corresponded with known soil–landscape relationships, highlighting the potential of EnMAP hyperspectral data for mapping soil properties despite its limited geographical availability. While these results are promising, this study identified limitations in the ability of PLSR to extrapolate predictions beyond the sampled areas, suggesting the need to explore non-linear modeling approaches. Future research should focus on evaluating EnMAP’s performance using advanced machine learning techniques and comparing it to other available hyperspectral products to establish robust protocols for satellite-based soil monitoring.

1. Introduction

Soil organic matter (SOM) plays an important role in soil quality, agricultural productivity, and global carbon cycling [1,2]. As one of the largest terrestrial carbon pools, its dynamics have significant implications for climate change mitigation and adaptation strategies [3,4]. The spatial monitoring of SOM is therefore crucial for both environmental management and agricultural sustainability [5,6].
While laboratory spectroscopic methods like visible–near-infrared (Vis–NIR) and mid-infrared (MIR) have proven highly accurate for SOM prediction [7,8,9], they are limited to point measurements and cannot capture its spatial distribution across landscapes without extensive sampling campaigns and interpolation [10,11]. Multispectral satellite sensors, such as Sentinel-2 and Landsat-8, have been widely used to map soil properties due to their free accessibility, high temporal resolution, and relatively simple data processing requirements [12,13,14,15]. For instance, a study by Lin et al. (2020) [16] demonstrated a novel method for estimating SOM by fusing Sentinel-2 and Sentinel-3 images, showing improved model accuracy in capturing spatiotemporal dynamics for areas with higher SOM content. Bouslihim et al. (2024) [15] utilized pansharpened Landsat-8 data to predict SOM content using different spectral indices. High-resolution mapping techniques were explored by Zhou et al. (2020) [17], who combined Sentinel-1 and Sentinel-2 data with machine learning algorithms to digitally map soil organic carbon and total nitrogen, enhancing mapping accuracy. Furthermore, Landsat-8 images were analyzed for their effectiveness in mapping SOM, both with single-temporal and multi-temporal synthesized images, highlighting improvements when environmental variables were included [18].
These studies underscore the significant role of Sentinel-1, Sentinel-2, and Landsat satellites in advancing soil organic matter mapping, providing cost-effective and reliable data for environmental monitoring and agricultural management. However, their broad spectral bands limit the detection of specific absorption features related to soil organic matter components, potentially reducing prediction accuracy [19,20].
Hyperspectral data from satellite platforms offer a promising alternative by providing both detailed spectral information and spatial coverage needed for quantitative SOM mapping [10,21]. The narrow spectral bands of hyperspectral sensors can better capture the specific absorption features of organic matter components in the visible to shortwave infrared regions (400–2500 nm) [22]. However, using hyperspectral remote sensing for SOM mapping presents several specific challenges. First, the high dimensionality of hyperspectral data leads to multicollinearity between adjacent bands, making it crucial to identify the most relevant wavelengths for SOM prediction [20,23]. Second, atmospheric effects and the signal-to-noise ratio can significantly impact the quality of spaceborne hyperspectral data, particularly in key absorption regions related to soil properties. Third, the presence of vegetation cover, crop residues, and soil surface conditions (roughness and moisture) can interfere with the soil spectral signal [24,25]. Additionally, the complex nature of SOM, which exists in various forms and degrees of decomposition, results in overlapping spectral features that can be difficult to isolate and quantify [26,27]. These challenges necessitate the careful consideration of preprocessing techniques, feature selection methods, and modeling approaches to achieve reliable SOM predictions from hyperspectral imagery [28,29].
Various spaceborne hyperspectral sensors have demonstrated potential for SOM prediction. The Chinese ZY1-02D hyperspectral satellite, combined with first derivative processing and feature selection, has shown high prediction accuracy using Random Forest models [30]. The Italian PRISMA sensor has been successfully applied for SOM mapping using machine learning approaches and feature selection methods [31]. The Chinese Gaofen-5 satellite has achieved promising results through advanced processing techniques like fractional-order derivatives and discrete wavelet transforms [32]. These examples highlight how different hyperspectral platforms, when combined with appropriate processing methods, can effectively capture the spectral signatures necessary for quantitative SOM prediction across various landscapes. However, the higher dimensionality and complexity of hyperspectral data require more sophisticated processing techniques and careful evaluation to determine whether the additional spectral information justifies the increased computational and analytical demands [20]. For instance, previous studies have tested different approaches to select significant wavelengths, including hybrid feature selection methods that combine Random Forest and self-adaptive searching algorithms [23]. These approaches have proven effective in extracting characteristic spectral regions and optimizing input data for soil property prediction models. The variable importance measure derived from Random Forest techniques has been particularly successful in identifying significant wavelength regions associated with biochemical absorption features [33]. When combined with algorithms like ‘ranger’ package for band selection, these methods have demonstrated improved modeling accuracy and stability in SOM prediction compared to traditional approaches [34]. Furthermore, feature selection methods are valuable not only for computational efficiency but also for identifying the most significant wavelengths contributing to SOM prediction, enabling direct comparison between different hyperspectral sensors, and guiding future spaceborne mission designs [35]. This identification of key spectral regions helps focus attention on wavelengths that contribute most significantly to SOM prediction, potentially streamlining sensor design and data processing requirements while maintaining prediction accuracy.
Given the importance of appropriate modeling techniques for handling high-dimensional spectral data, Partial Least Squares Regression (PLSR) has emerged as a widely adopted approach for SOM prediction from hyperspectral imagery. PLSR’s ability to handle multicollinearity and high-dimensional data makes it particularly suitable for processing the complex spectral information identified through feature selection methods. Studies have demonstrated PLSR’s robust performance, achieving R2 values ranging from 0.75 to 0.91 when combined with appropriate preprocessing techniques [36,37]. The model’s effectiveness is further enhanced when coupled with spectral preprocessing methods such as Savitzky–Golay smoothing and first-order differential transformations [38,39]. PLSR has shown sensitivity to specific spectral regions, including visible light bands, near-infrared centered around 1400 nm, and the range of 1900–2450 nm [40], aligning with the wavelengths identified as significant through feature selection approaches. When compared to other regression techniques like Support Vector Machine Regression (SVMR), PLSR has demonstrated superior accuracy and robustness [41,42], particularly when integrated with genetic algorithms and variable importance in projection (VIP) scores for optimal band selection [43,44].
The Environmental Mapping and Analysis Program (EnMAP) represents a new generation of hyperspectral satellites with enhanced capabilities for soil applications [45]. Its high spectral resolution (6.5 nm in Vis–NIR and 10 nm in SWIR (shortwave infrared)) and improved signal-to-noise ratio compared to previous sensors like Hyperion suggests strong potential for soil applications [46]. While several studies have investigated soil organic carbon (SOC) prediction using simulated EnMAP data [47], reporting promising results, no published research has yet evaluated the actual EnMAP sensor’s performance for this application since its launch in 2022.
This study aims to evaluate, for the first time, the capability of actual EnMAP hyperspectral imagery for SOM prediction and mapping. We assess different spectral preprocessing techniques including Savitzky–Golay smoothing and Standard Normal Variate (SNV), combined with a feature selection approach to optimize the extraction of SOM-relevant spectral information. Furthermore, Partial Least Squares Regression (PLSR) models are developed and validated using ground reference data. The results provide important insights into the operational potential of EnMAP for large-scale SOM monitoring and digital soil mapping applications.

2. Materials and Methods
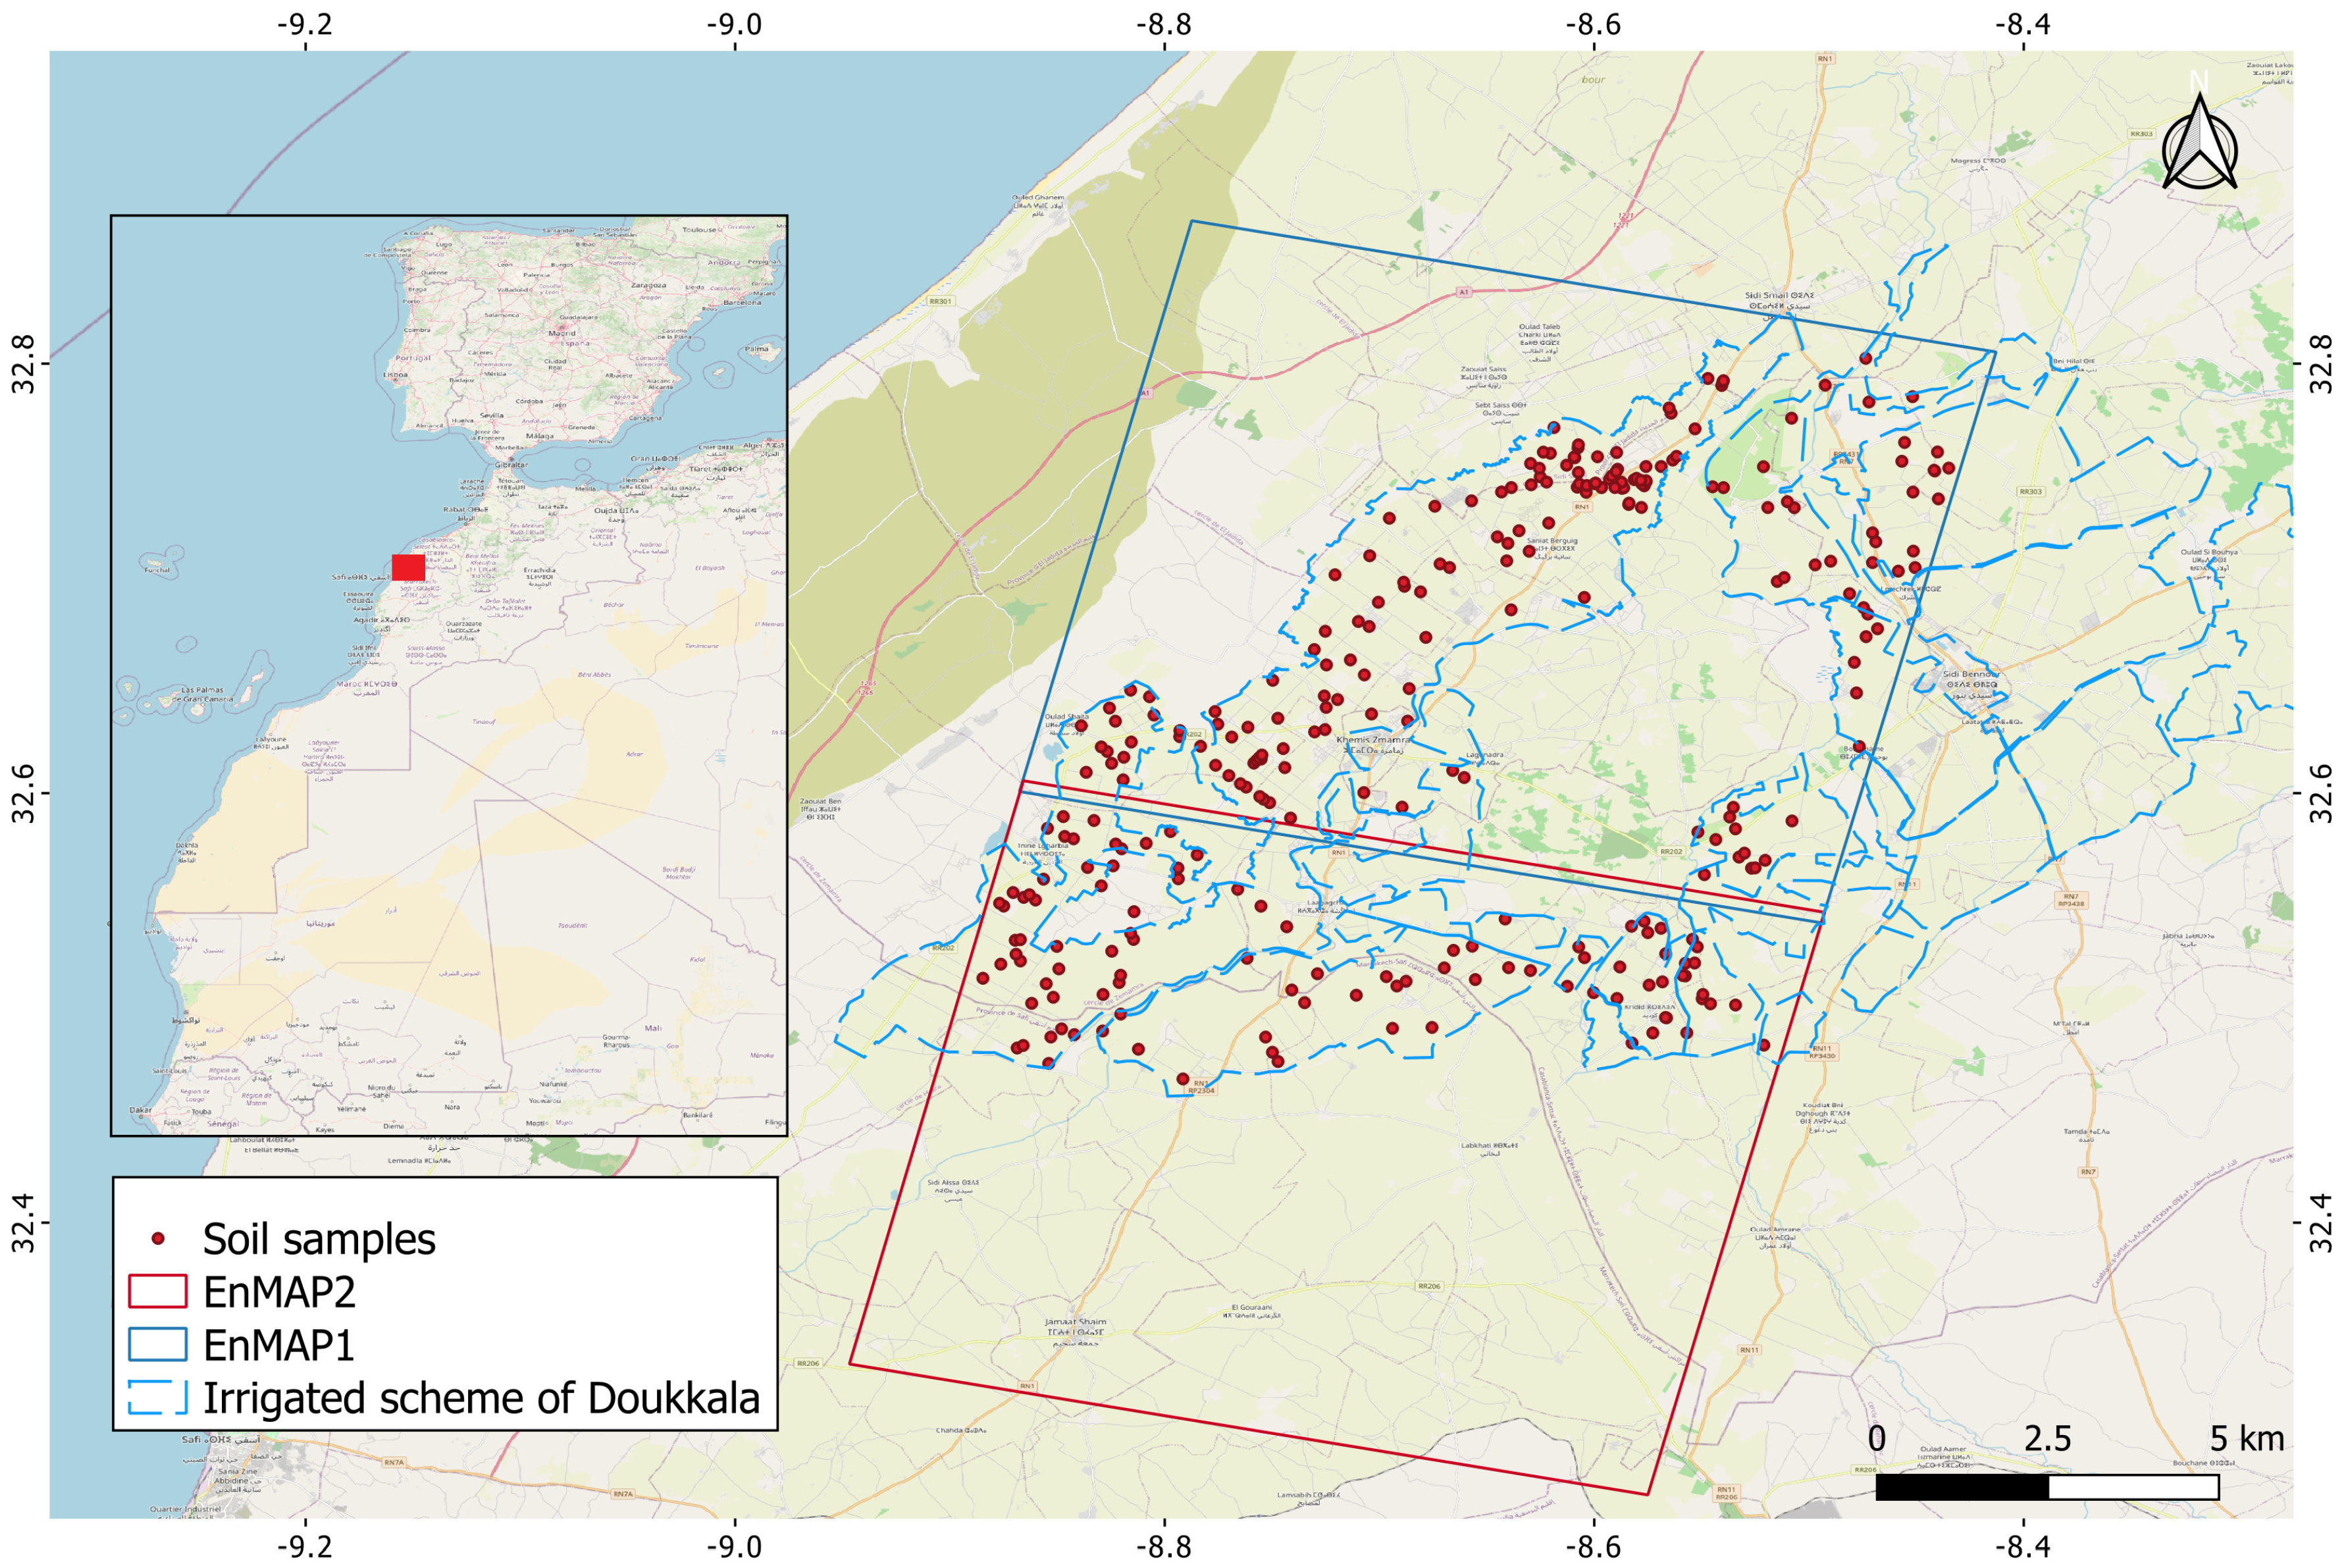
2.1. Study Area

Doukkala Plain in western Morocco is a key agricultural region characterized by extensive irrigated lands. The study area, located between 32°40′N and 33°81′N latitude and 8°40′W and 8°90′W longitude, includes parts of Sidi Bennour, Sidi Smail, Zemamra, and Gharbia and a substantial portion of the High Section within the Doukkala irrigation scheme (Figure 1). Positioned at an altitude of 120–130 m, this region is characterized by a semi-arid climate with an average annual rainfall of 312 mm, a mean temperature of 19.4 °C, and an annual evapotranspiration of 3.84 mm [48]. Despite these favorable conditions, the landscape is dominated by small-scale farms, most of which measure 5 hectares or less [49]. The region contains some major soil types including isohumic soils, slightly developed soils, vertisols, calcimagnesic soils, and iron sesquioxide-rich soils [48].
New irrigation infrastructure introduced in the late 1990s and early 2000s, primarily reliant on water from the Oum Er Rbia River, initially enabled diverse crop rotations and supported agricultural intensification. However, recent years have seen a decline in water availability, leading to a continual decrease in irrigation allocations. This reduction has significantly disrupted crop rotation practices and poses increasing challenges to the long-term sustainability of agriculture in the Doukkala irrigation scheme [50].

2.2. Soil Sampling and Analysis

A total of 282 topsoil samples (0–30 cm depth) were obtained from the Regional Office for Agricultural Development of Doukkala (ORMVAD) database. These samples were collected between June and July 2021. The soil sampling locations were randomly distributed to cover the entire irrigated scheme (blue polygons) as these samples were collected as part of ORMVAD’s routine soil monitoring program, which aims to assess all agricultural lands in the region (Figure 1). All soil samples were collected from the topsoil layer (0–30 cm). Soil samples were prepared and analyzed in ORMVAD’s soil laboratory. The SOM content was measured using the Walkley and Black oxidation method [51] after converting the SOC values using the 1.724 factor.
The SOM values in these samples were assumed to remain relatively stable over the period leading up to the EnMAP imagery acquisition in 2024. This assumption is supported by findings in the literature, which indicate that soil organic carbon (SOC) content in agricultural soils exhibits only minor changes over several years under consistent management practices. For instance, De Rosa et al. (2024) [52] reported a SOC change rate of −0.04 ± 0.01 g/kg per year between 2009 and 2018 for European agricultural soils, based on revisited LUCAS sampling points. Therefore, the three-year gap between soil sampling in 2021 and the EnMAP imagery from 2024 is expected to have a minimal impact on the accuracy of the predictions.

2.3. Environmental Mapping and Analysis Program (EnMAP)

The Environmental Mapping and Analysis Program (EnMAP) is a German hyperspectral satellite mission that provides high-quality Earth observation data. The sensor operates across a broad spectral range, covering the visible and near-infrared (Vis–NIR: 420–1000 nm) and shortwave infrared (SWIR: 900–2450 nm) regions, with a total of 224 spectral bands [46,53]. The satellite provides a swath width of 30 km with a spatial resolution of 30 × 30 m. In this study, two EnMAP scenes acquired in August 2024 under cloud-free conditions were used. The geographical extent of both scenes is shown in Figure 1. The imagery was obtained at processing Level 2A, which provides bottom-of-atmosphere reflectance after atmospheric correction, making it directly usable for quantitative analysis. Several spectral ranges were excluded due to strong water vapor absorption, including bands between 1330.86 and 1461.11 nm (with bands 131–135 already excluded from the source data) and between 1796 and 1938 nm. Additionally, the spectral range between 911.57 and 921.32 nm was removed by the data provider due to quality issues. Bands 100 and 101 (at 933 nm) were identified as having low-quality reflectance values and were excluded by us for the same reason. After removing these spectral ranges, 162 bands remained and were used for SOM prediction. Furthermore, an NDVI threshold of 0.3 was applied for both scenes to extract bare soil pixels [3]. Also, the concentrated built-up areas were delineated manually and masked. Table 1 presents the characteristics of the EnMAP imagery [53].

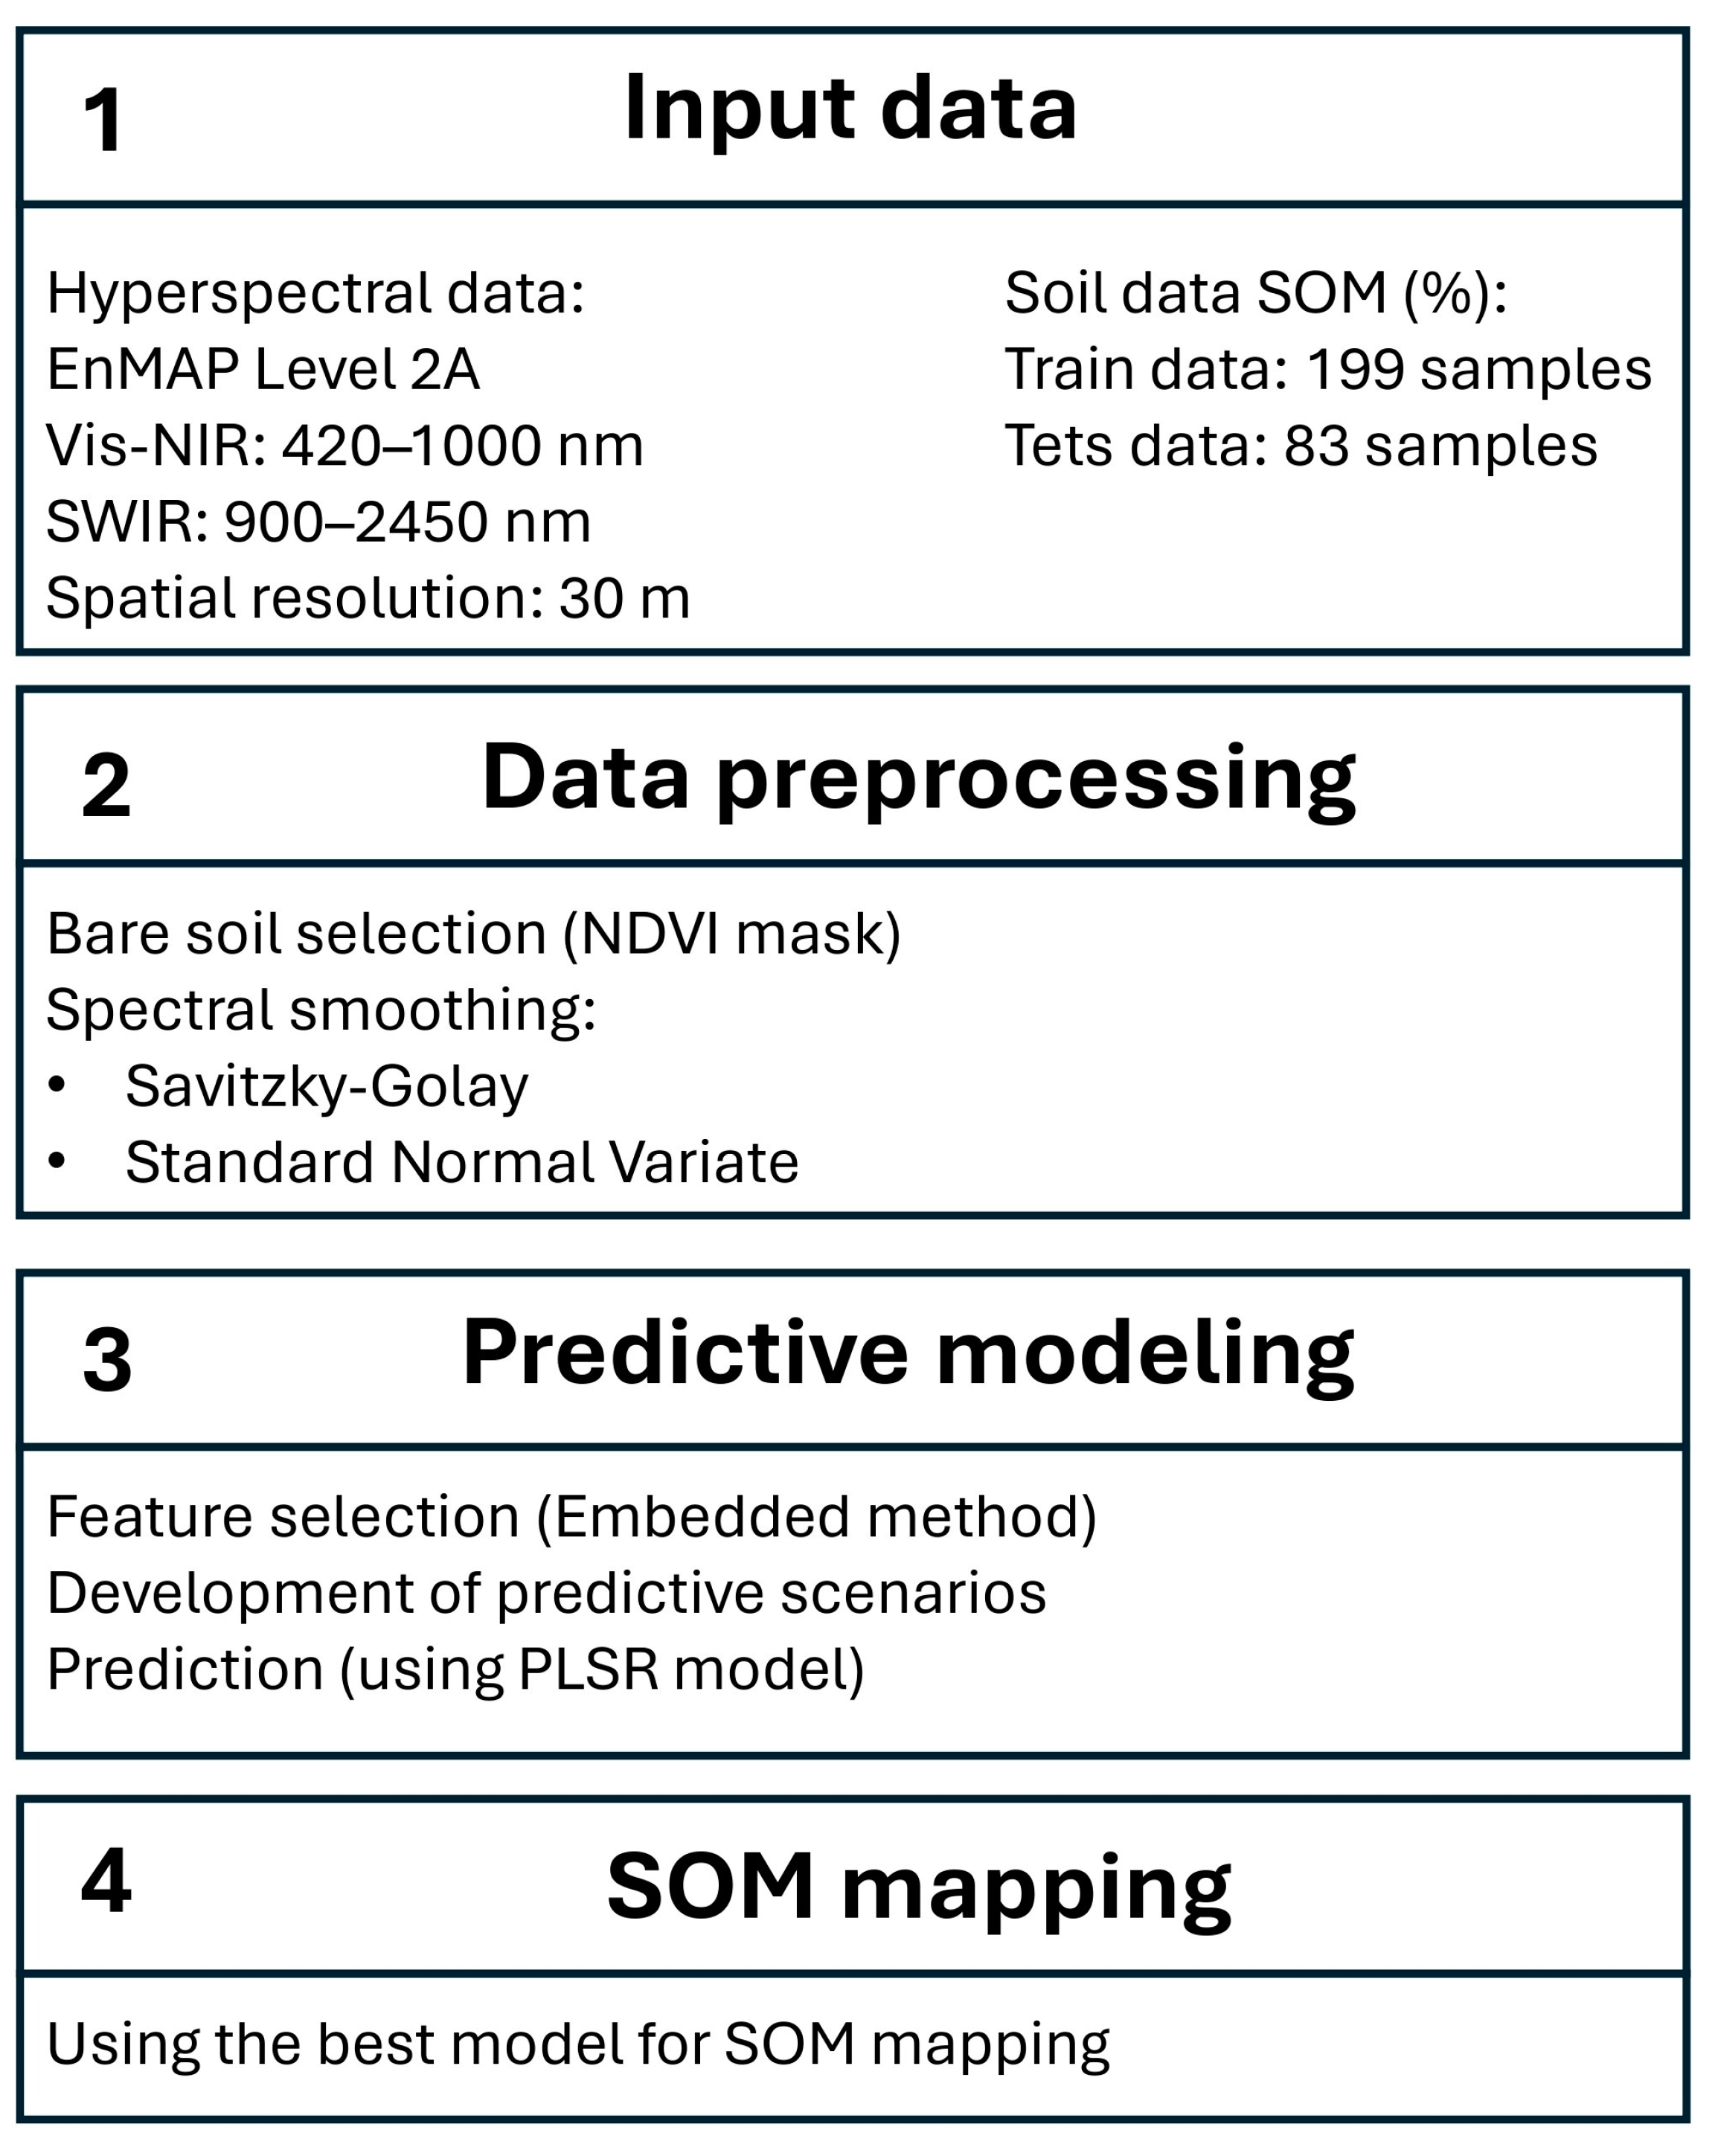
2.4. Data Preprocessing

Spectral smoothing and noise reduction techniques are essential preprocessing steps in hyperspectral data analysis, particularly for enhancing the signal-to-noise ratio and improving the extraction of meaningful spectral features [28]. These techniques help minimize random noise while preserving important spectral characteristics that are crucial for the quantitative analysis of soil properties [29]. The quality of spectral information directly influences the accuracy of prediction models, making the selection of appropriate smoothing techniques particularly important [54].
In this study, two different spectral preprocessing approaches were tested. First, the Savitzky–Golay (SG) smoothing filter was applied with a window size of 13 and a second-order polynomial. This method performs local polynomial regression to determine the smoothed value for each data point, effectively reducing noise while maintaining the shape and height of spectral peaks [55]. The SG filter is useful for hyperspectral data as it preserves higher moments of the spectral peaks and can be applied to unequally spaced data [56]. Second, we tested the second derivative of the Savitzky–Golay filter using the same parameters (SG_2nd). Derivative spectroscopy can enhance subtle spectral features and minimize baseline effects, potentially improving the detection of overlapping absorption features characteristic of soil organic matter [57]. Furthermore, the Standard Normal Variate (SNV) transformation was evaluated. The SNV performs a row-wise transformation that removes multiplicative interferences of scatter and particle size, centering and scaling each spectrum individually [58]. This technique has proven effective in reducing the physical variability between samples while maintaining chemical information [59,60].

2.5. Predictive Modeling and Feature Selection

The dataset was randomly partitioned into training (n = 199) and testing (n = 83) categories. All the steps are shown in Figure 2. Feature selection was performed using an embedded method based on Random Forest importance scores. This approach was chosen as it considers the interaction between features while selecting the most relevant variables and performs feature selection as part of the model training process [61]. For each spectral preprocessing method (SG, SG_2nd, and SNV), feature selection was performed using Random Forest’s embedded method to identify the most relevant spectral bands for SOM prediction. The selection of 30 bands was chosen to reduce model complexity, improve computational efficiency, and minimize redundant spectral information. This dimensionality reduction was particularly important for the final spatial prediction step, where processing a reduced number of bands significantly decreases computational demands while maintaining model performance. The importance of each spectral band was quantified using the Mean Decrease in Accuracy (%IncMSE) metric, which measures the decrease in model accuracy when each predictor is randomly permuted.
This process resulted in eight different modeling scenarios (Table 2): (1) raw spectral data without preprocessing, (2) raw spectral data with the selected top 30 bands, (3) SG with all the bands, (4) SG with 30 selected features, (5) SG_2nd with all the bands, (6) SG_2nd with 30 selected features, (7) SNV with all the bands, and (8) SNV with 30 selected features. For each scenario, Partial Least Squares Regression (PLSR) was employed for SOM prediction [62,63]. The optimal number of components (ncomp) for each PLSR model was determined through cross-validation on the training dataset to avoid overfitting [64].
Model performance was evaluated using three complementary statistical metrics. The coefficient of determination (R2) (Equation (1)) quantifies the proportion of variance in the observed data explained by the model predictions, with values ranging from 0 to 1, where higher values indicate better model performance. The root mean square error (RMSE) (Equation (2)) measures the average magnitude of prediction errors, with lower values indicating better model accuracy. The ratio of performance to inter-quartile range (RPIQ) (Equation (3)) was calculated by dividing the inter-quartile range of observed values by the RMSE, providing a standardized measure of model performance that is less sensitive to outliers than traditional metrics [65,66]. In the final stage, the best processing method and model were applied to the EnMAP scenes to generate spatial predictions of SOM across the irrigated scheme of Doukkala.
R 2 = i = 1 n y i y ¯ y i ^ y ^ ¯ i = 1 n y i y ¯ 2 i = 1 n y i ^ y ^ ¯ 2 2
where y i is the observed value, y i ^ is the predicted value, y ¯ is the mean of the observed values, y ^ ¯ is the mean of the predicted values, and n is the number of observations.
R M S E = 1 n i = 1 n y i y i ^ 2
where n is the number of observations and y i and y i ^ are as defined above.
R P I Q = I Q R R M S E
where the IQR represents the range between the first (25th percentile) and third quartiles (75th percentile) of the observed data. A higher RPIQ value indicates better model performance.

3. Results

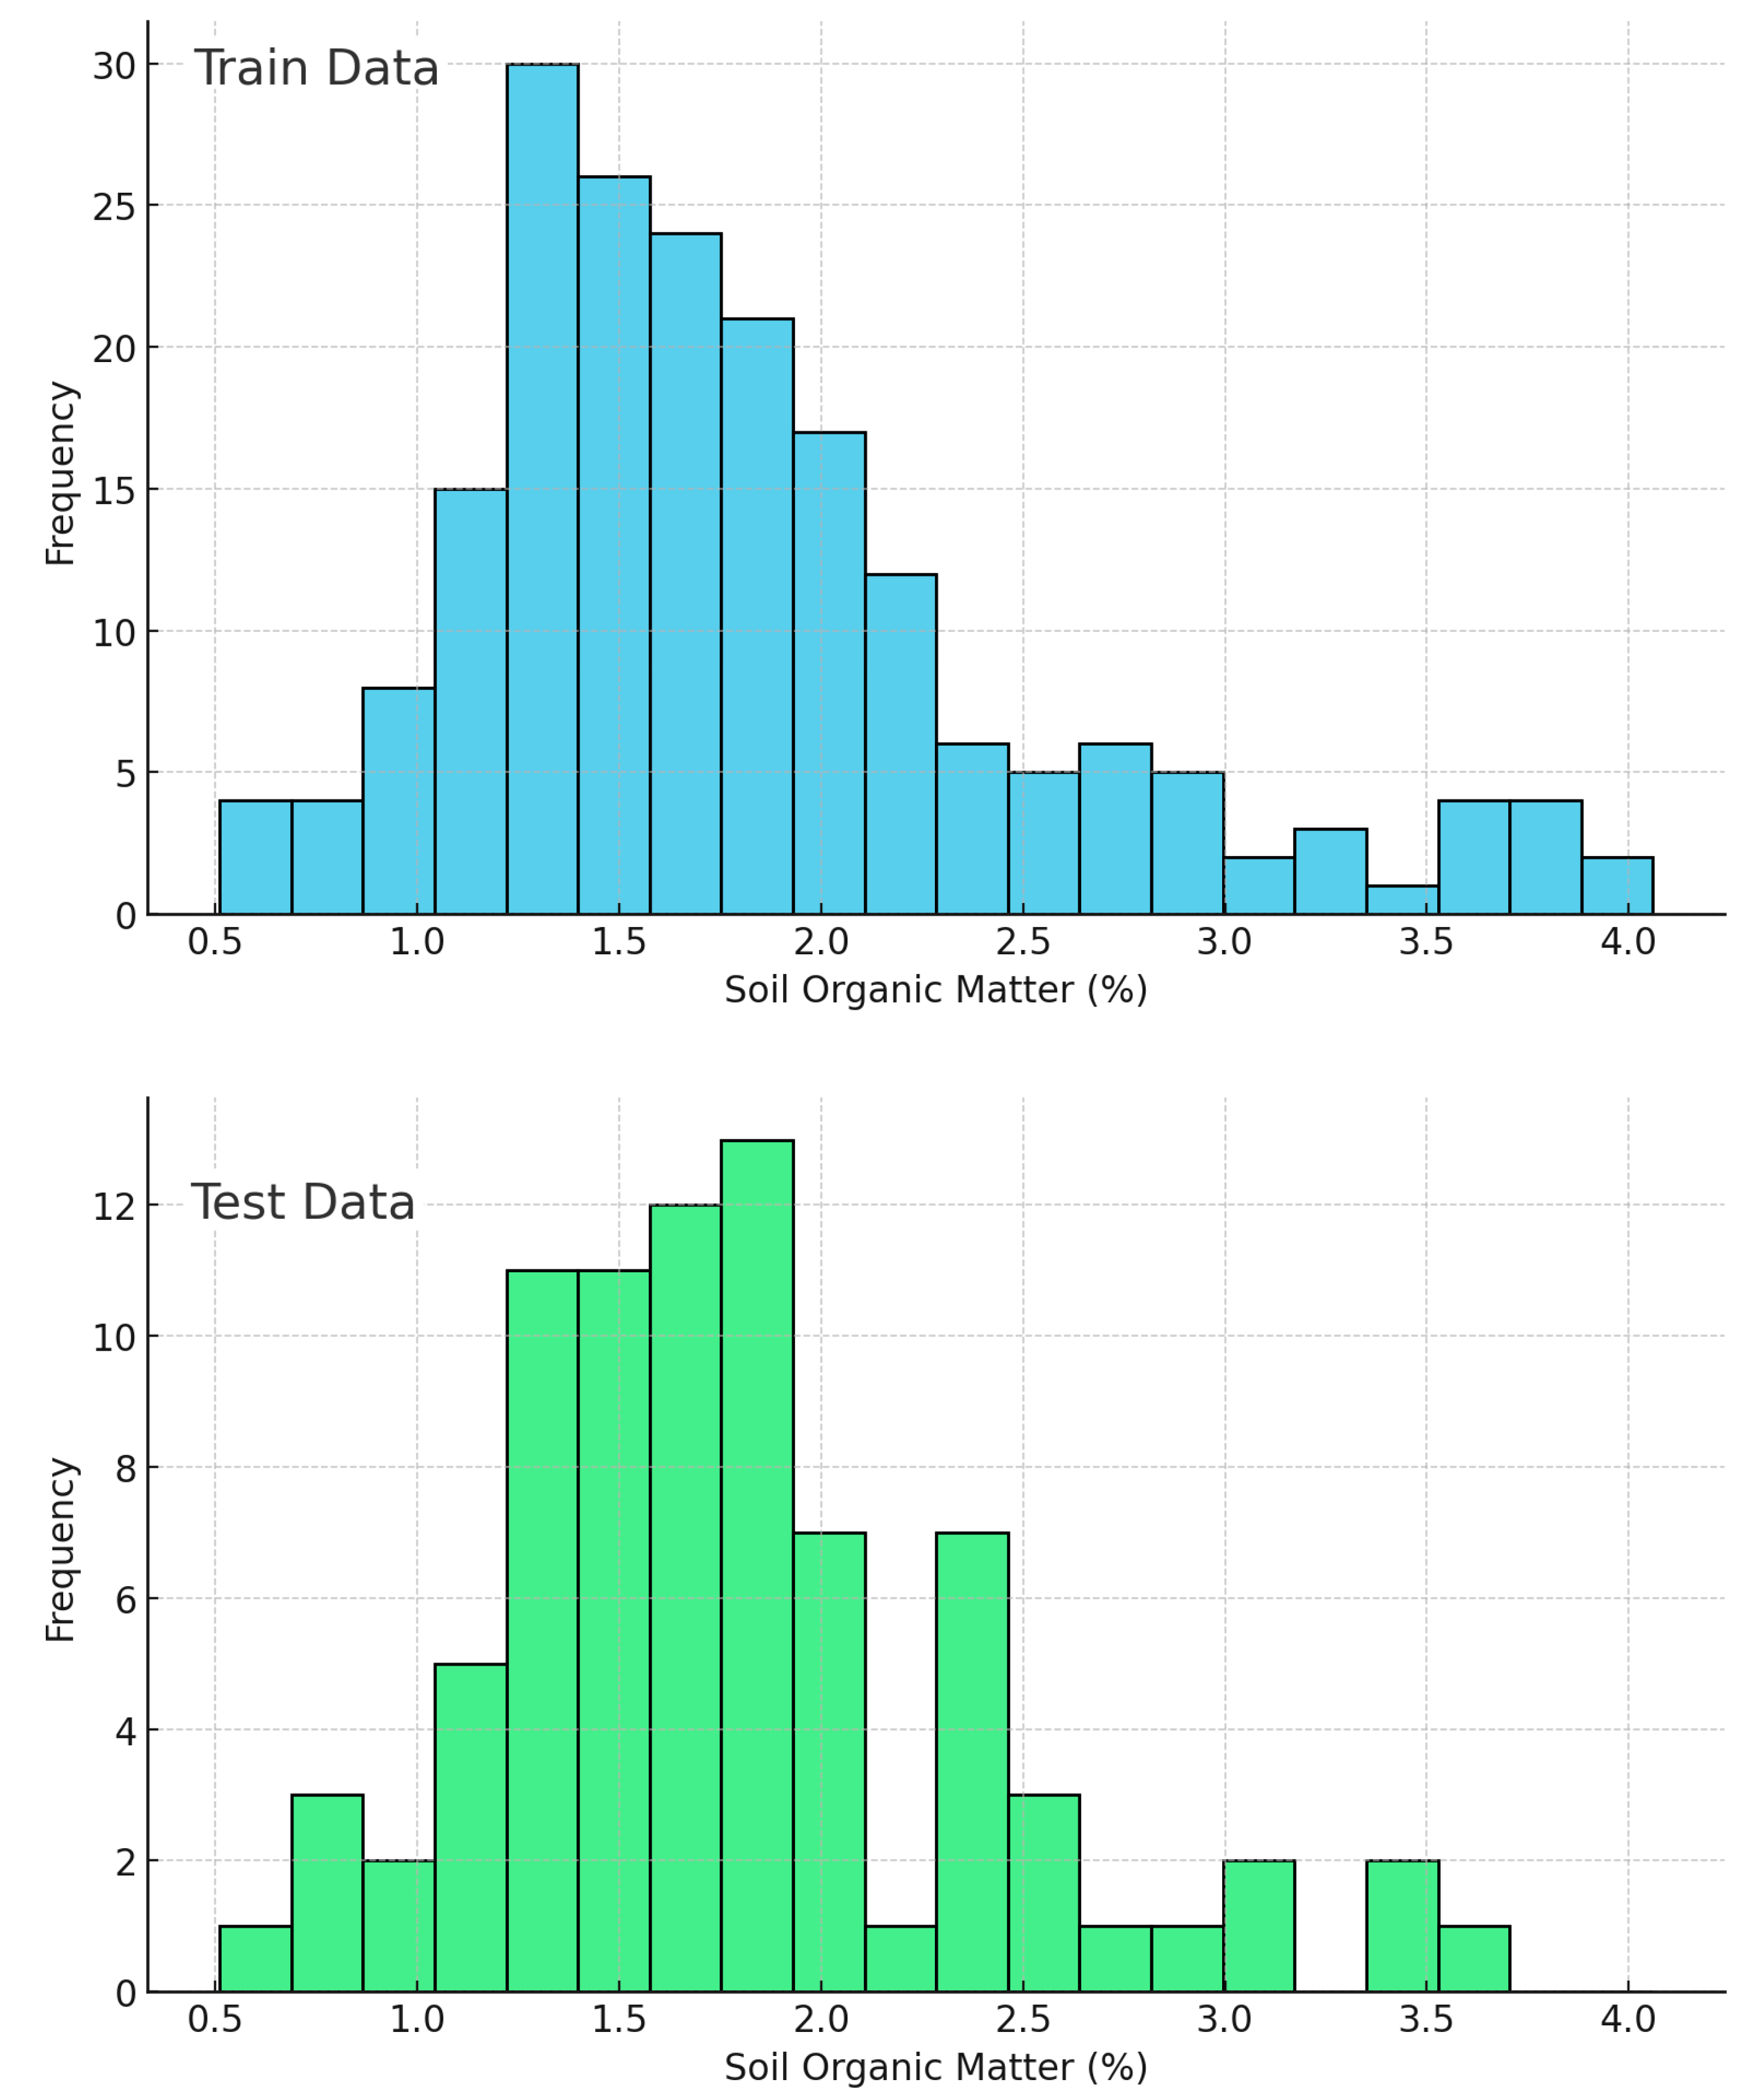
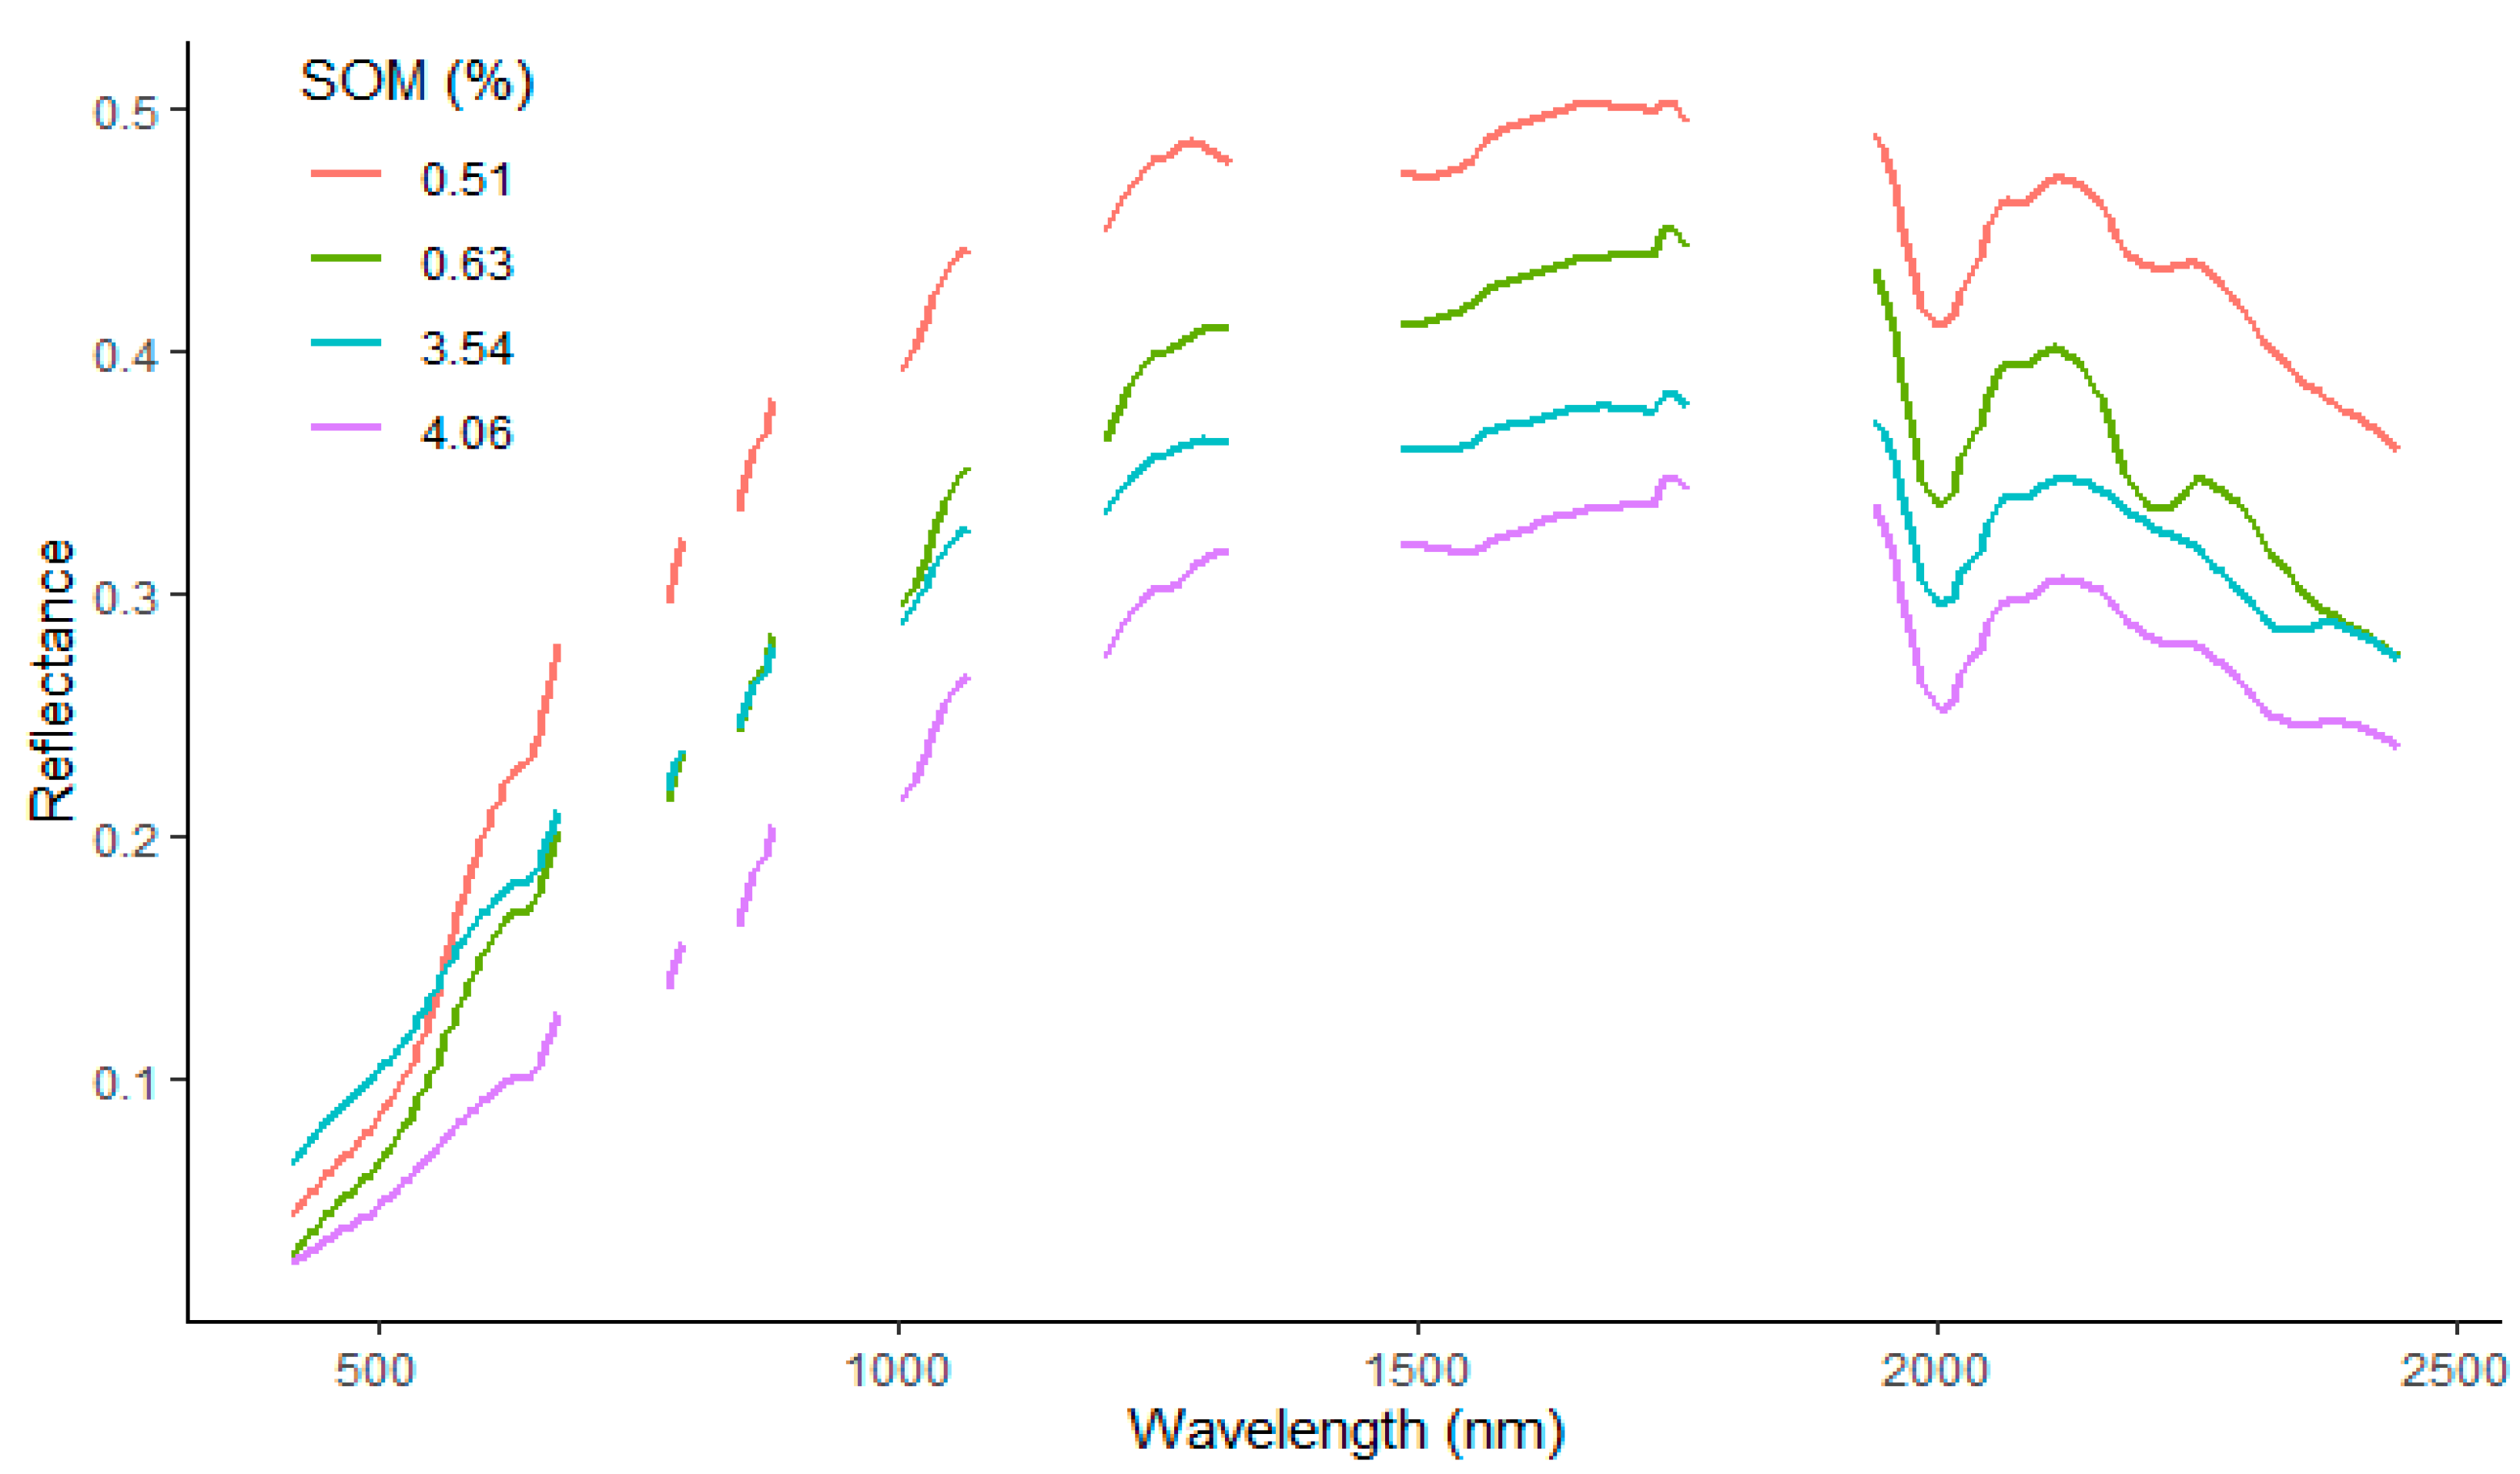
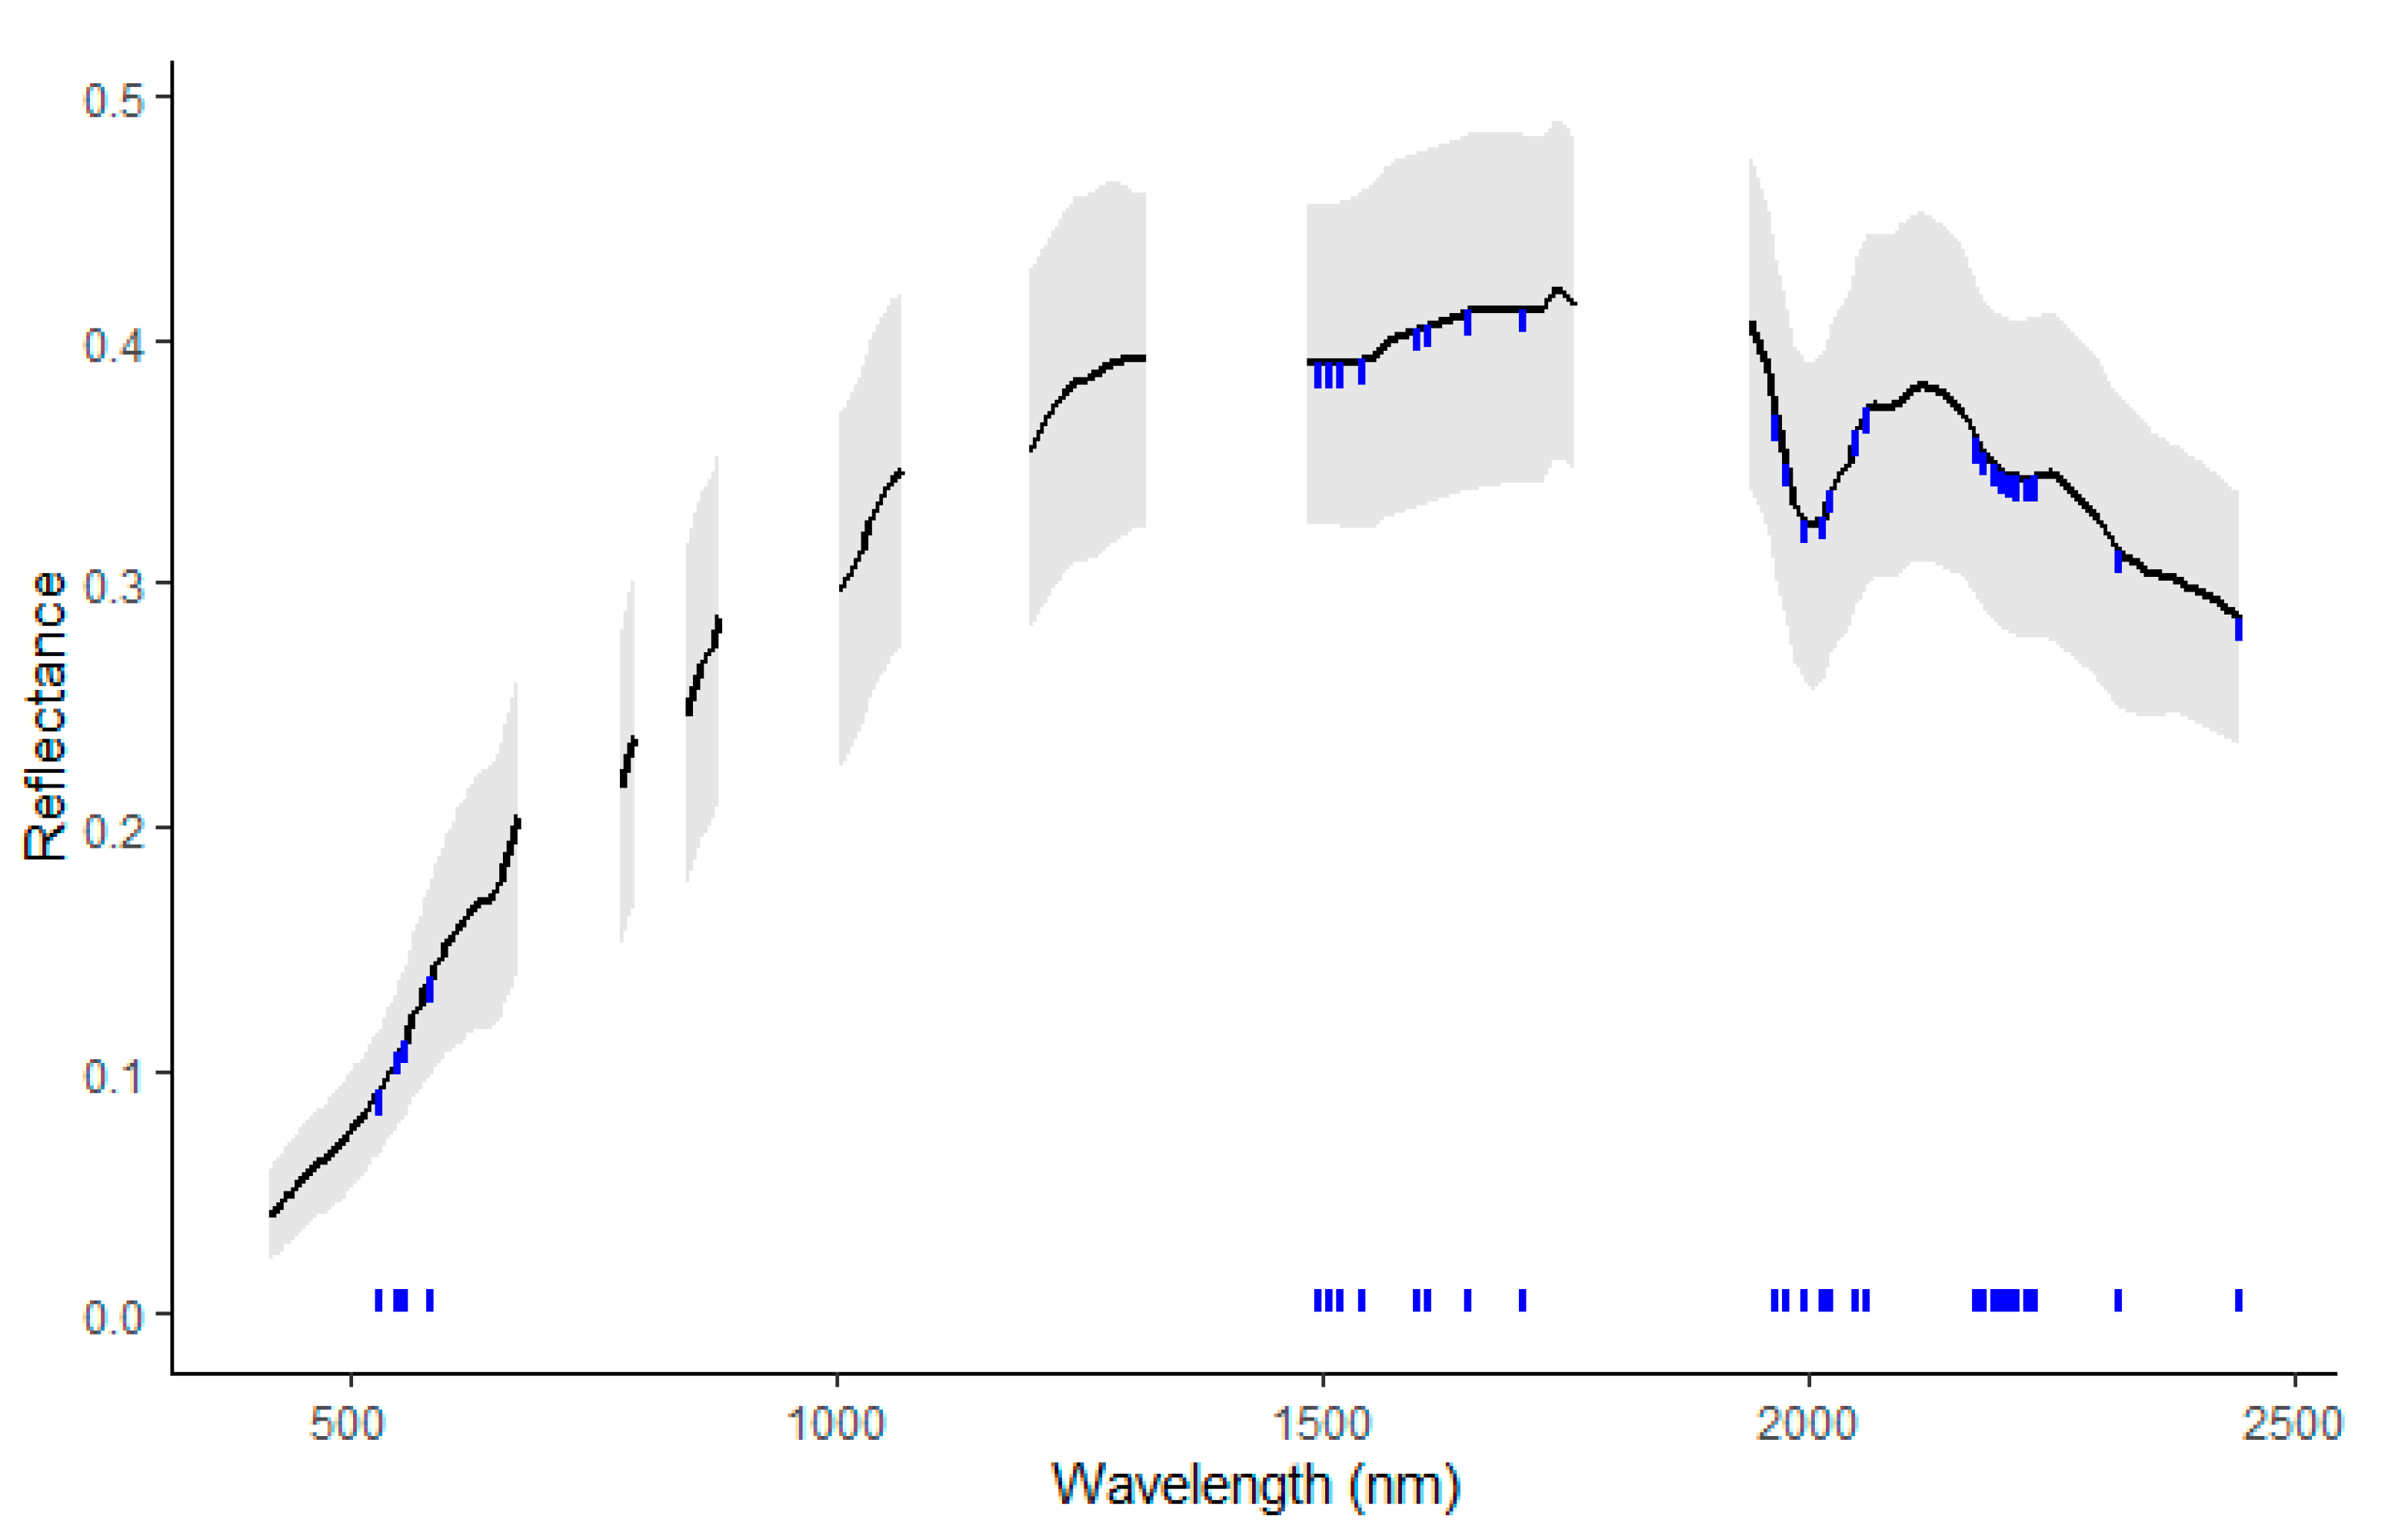
3.1. Soil and Spectral Data

The SOM content in the training dataset (n = 199) ranged from 0.51% to 4.06%, with a mean value of 1.81% and standard deviation of 0.71%. The test dataset (n = 83) showed a similar distribution (Table 3), with values ranging from 0.63% to 3.54% and a mean of 1.77% (standard deviation = 0.60%). Both datasets exhibited positive skewness (training: 1.08 and test: 0.86), indicating a right-tailed distribution, with more samples having lower SOM values. The coefficient of variation (CV) was 39.46% for the training set and 33.90% for the test set, suggesting moderate variability in SOM content across the study area. The similar statistical distributions (Figure 3) between training and test sets indicate that the random splitting process successfully maintained representative samples in both subsets, which is crucial for robust model development and validation
Figure 4 presents the smoothed reflectance spectra of four soil samples with different SOM contents (0.51%, 0.63%, 3.54%, and 4.06%) obtained from EnMAP imagery, with the bands removed (for more details, see Section 2.3). Soil samples with higher SOM content show consistently lower reflectance values. The lowest SOM content (0.51%) corresponds to the highest reflectance curve, with peak values of 0.5 in the NIR region around 1750 nm. In contrast, the highest SOM content (4.06%) shows the lowest reflectance curve, with peak values only reaching 0.34; 0.63% and 3.54% display reflectance values between these extremes, maintaining the same inverse relationship with SOM content. Three major absorption features are visible around 1550 nm, 2000 nm, and 2200 nm. All spectra show a rapid increase in reflectance in the visible region (418–890 nm), followed by a more gradual increase until reaching their peaks, after which they show a decrease from 2260 to 2422 nm.

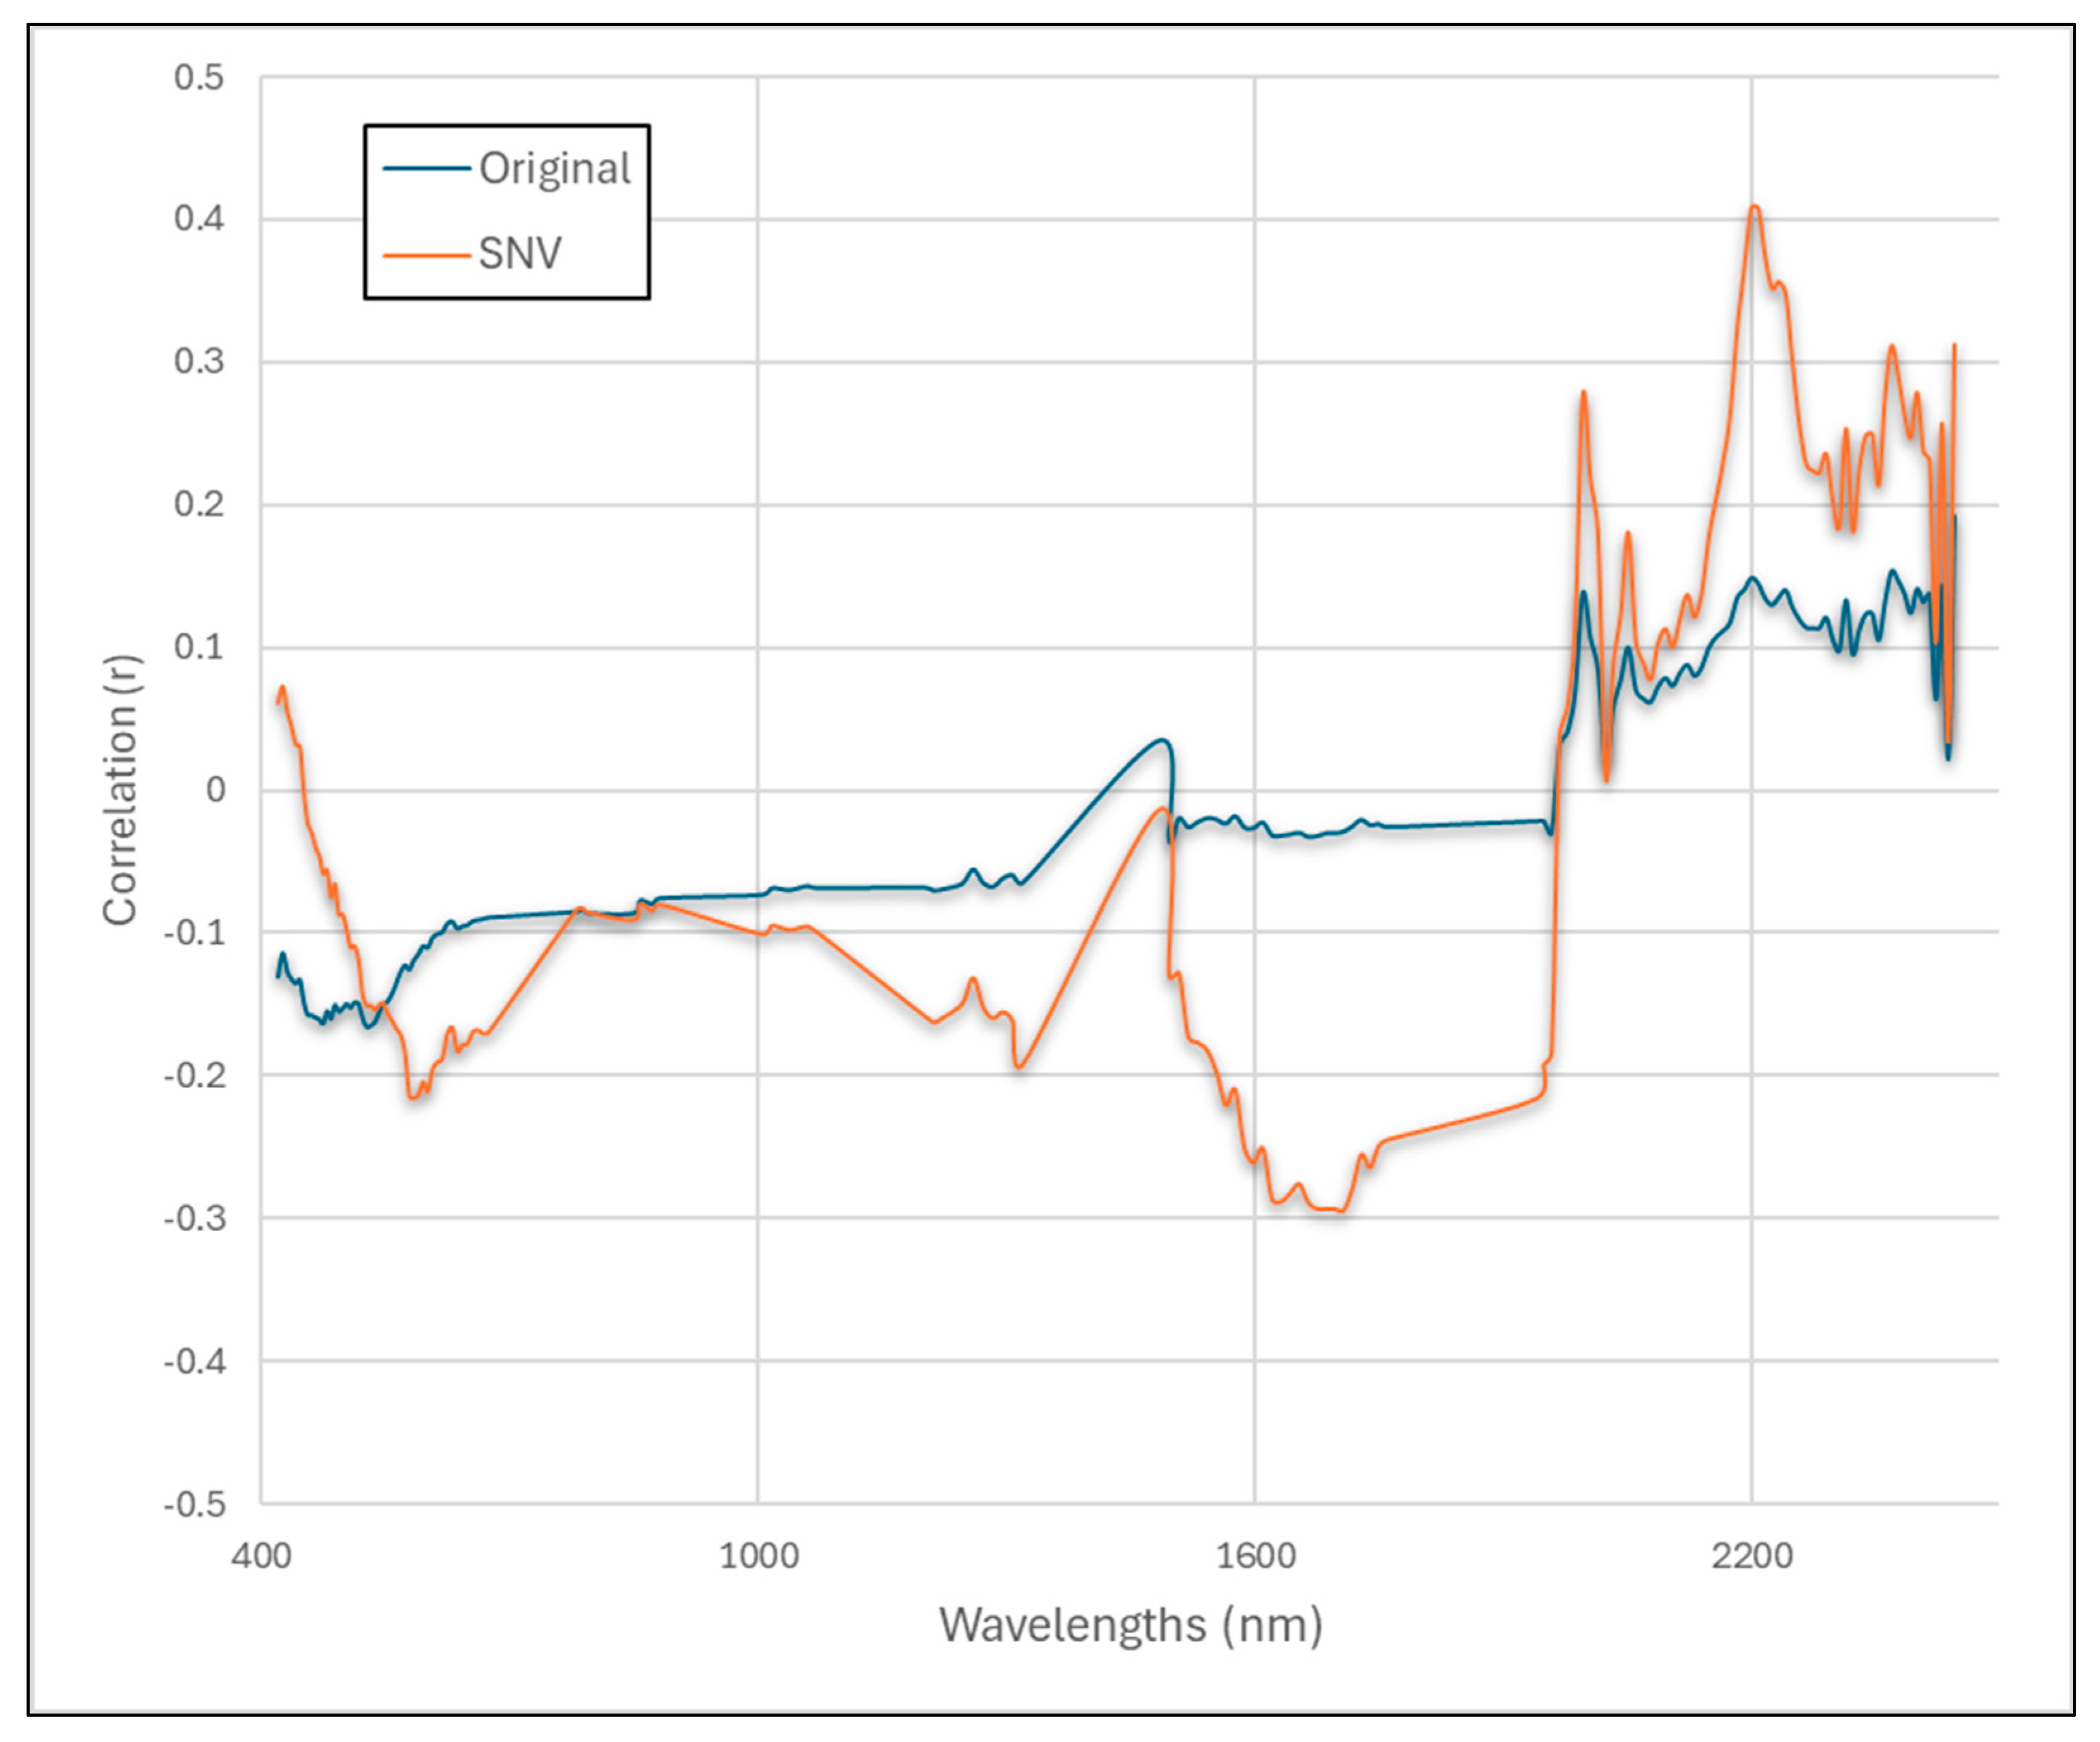
3.2. Smoothing Effect

The correlation analysis between spectral reflectance and SOM content revealed varying impacts of SNV preprocessing across different wavelength regions (Figure 5). In the visible range (400–700 nm), the SNV initially reduced the correlation strength in the early visible region (418–450 nm) from −0.13 to around 0.05 but showed notable enhancement in the 550–600 nm range, particularly at 582.64 nm and 577.17 nm, where correlations strengthened from approximately −0.118 and −0.125 to −0.216 and −0.215, respectively. The NIR region (700–1400 nm) exhibited relatively stable correlations in the 700–900 nm range, with minimal SNV impact maintaining weak negative correlations around −0.08. However, the 1199–1300 nm range showed more substantial improvements, with correlations strengthening from approximately −0.06 to −0.16. The most significant enhancements were observed in the SWIR region (1400–2500 nm), particularly in several key ranges. The 1575–1650 nm range showed an improvement from weak negative (−0.02 to −0.03) to moderate negative correlations (−0.21 to −0.29). The strongest positive correlations after SNV preprocessing were found in the 2150–2250 nm range, with peak correlations achieved at 2199.45 nm and 2207.86 nm (improving from 0.148 and 0.144 to 0.407). The 2300–2400 nm range also demonstrated significant enhancement at 2369.21 nm, where the correlation improved from 0.153 to 0.311, with consistent strengthening throughout this range from approximately 0.12–0.15 to 0.25–0.31.

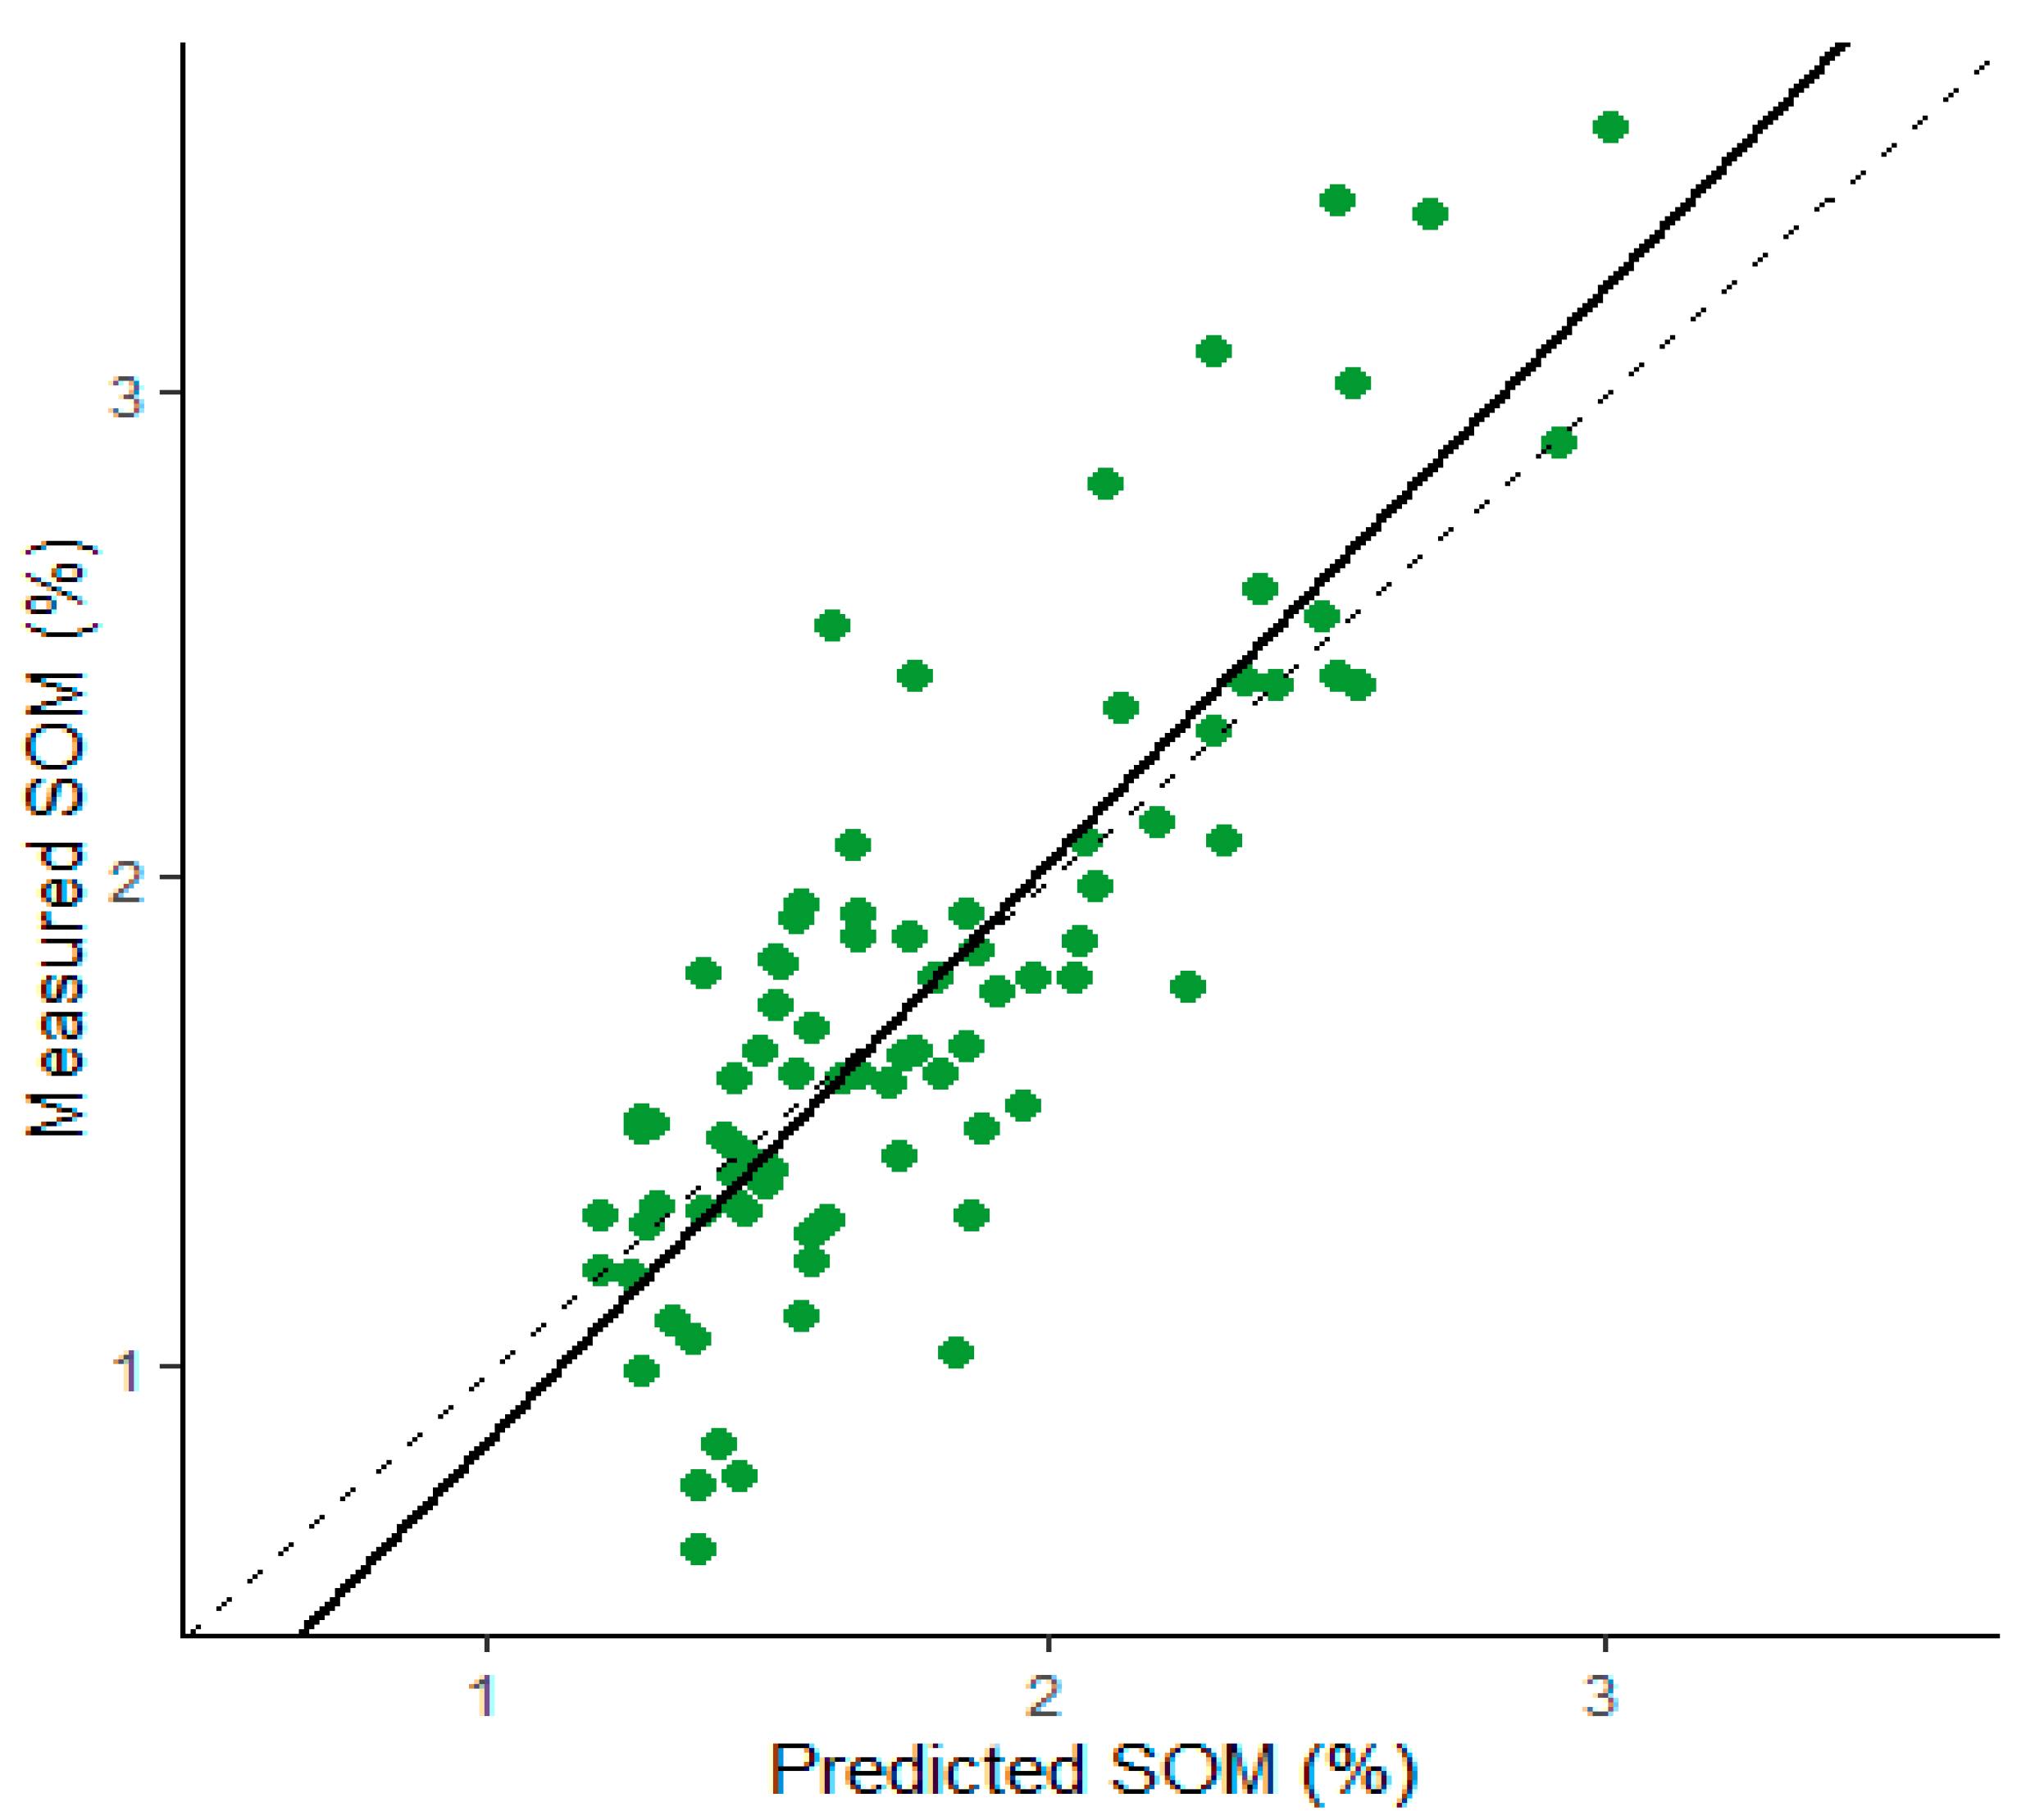
3.3. Predictive Modeling Performance

The PLSR performance metrics show varying results across different preprocessing scenarios using full EnMAP spectral bands versus the selected top 30 features (Table 4). The SNV preprocessing with 30 selected features (SNV and 30 F) achieved the highest R2 of 0.68, with an RMSE of 0.34 and RPIQ of 1.75. The SNV using all EnMAP bands performed similarly well, with an R2 of 0.67, RMSE of 0.34, and RPIQ of 1.74. The original spectra using all EnMAP bands achieved an R2 of 0.60, RMSE of 0.39, and RPIQ of 1.56. When using only the top 30 selected features (Original and 30 F), the performance decreased to an R2 of 0.53, RMSE of 0.43, and RPIQ of 1.41. For SG, using all EnMAP bands achieved an R2 of 0.58, RMSE of 0.39, and RPIQ of 1.53, while its second derivative (SG_2nd) showed similar performance, with an R2 of 0.58, RMSE of 0.39, and RPIQ of 1.53. When models were built using only the top 30 features, both SG variations showed decreased performance. SG and 30 F achieved an R2 of 0.56, RMSE of 0.41, and RPIQ of 1.47, while SG_2nd and 30 F yielded an R2 of 0.52, RMSE of 0.42, and RPIQ of 1.43. The results demonstrate that models using all EnMAP bands generally performed better than those using only the top 30 selected features, except in the case of SNV preprocessing, where feature selection slightly improved model performance. However, the best PLSR model tends to overestimate and underestimate low and high SOM values, respectively (Figure 6).

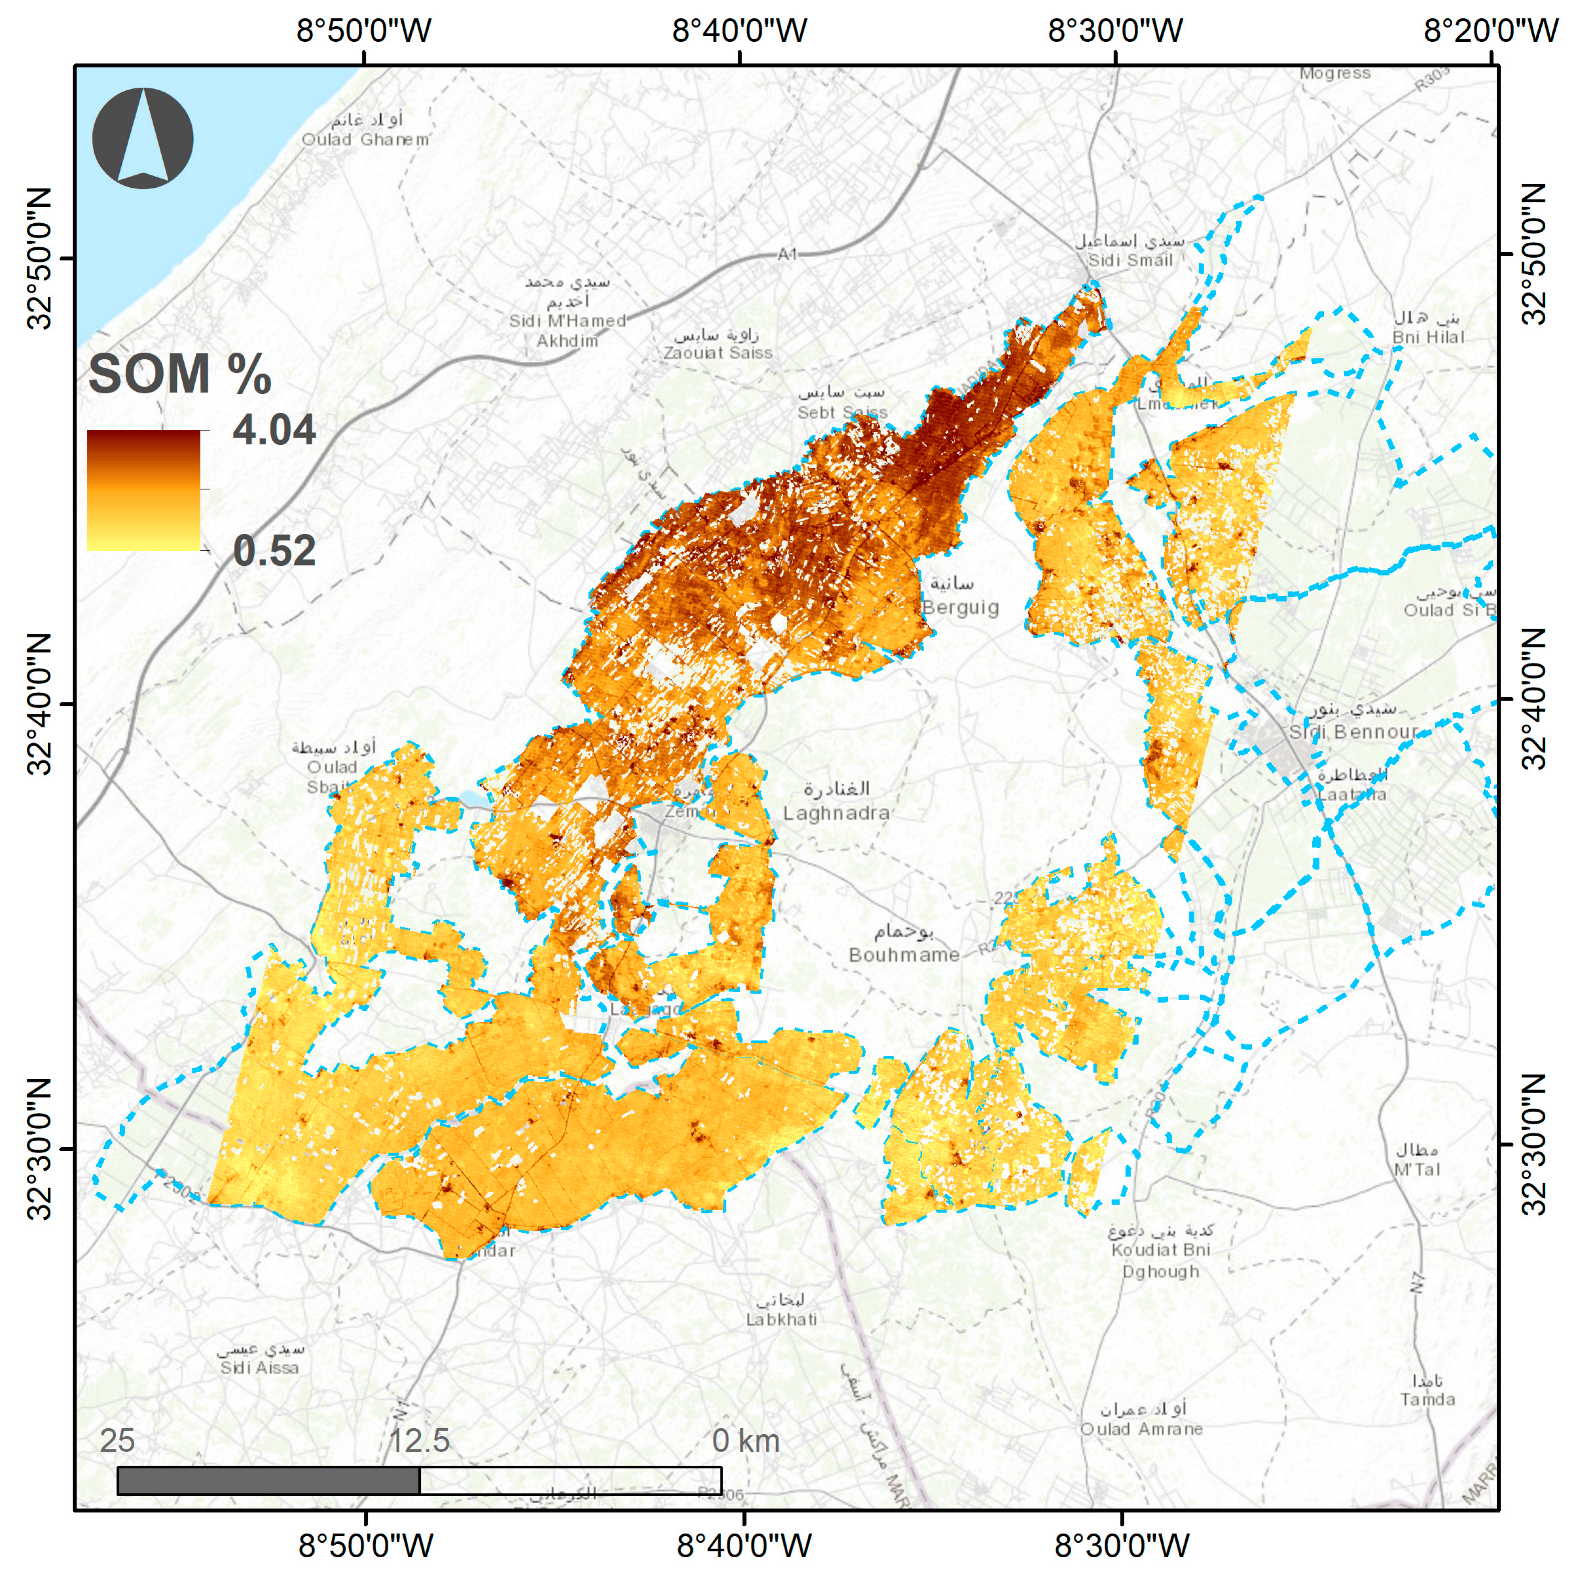
3.4. Spatial Prediction of SOM

Figure 7 illustrates the spatial distribution of SOM content across the irrigated agricultural scheme of Doukkala, derived from EnMAP hyperspectral imagery. The SOM content ranges from 0.52% to 4.04%, represented by a color gradient from light yellow (low SOM) to dark brown (high SOM). The spatial patterns of SOM distribution closely align with the measured values from soil samples used for model training, particularly within the irrigated perimeters (delineated by blue polygons). The EnMAP-derived SOM map reveals distinct spatial patterns, with higher concentrations (>3%) in the northeastern section, likely associated with intensive agricultural practices, while central and western portions exhibit moderate SOM levels (1–2.5%). When analyzing the SOM distribution outside the irrigated scheme, we noted that PLSR overestimated SOM values in the “triangle of sand” region (the missing area inside the irrigated scheme), which is known for its low SOM content. This overestimation highlights PLSR’s limitations in extrapolating values outside sampled areas.

4. Discussion

4.1. Wavelengths Important for SOM Prediction

The spectral reflectance patterns observed in soil samples align with established principles, where soils with lower SOM content exhibit higher reflectance, while SOM-rich soils show reduced reflectance across the spectrum. This relationship reflects organic matter’s role in increasing soil light absorption [67,68].
The distribution of selected wavelengths across the entire spectral range indicates the absence of specific wavelengths for SOM prediction, primarily due to the heterogeneous composition and varying mineralization degrees of soil organic matter [20,26]. Our results show concentrations of selected wavelengths in the SWIR region (1977–2059 nm, 2182–2232 nm, and beyond 2300 nm, including 2322.13 nm and 2445 nm; Figure 8), consistent with previous studies that have highlighted these regions’ importance in SOC prediction [27,69]. In the Vis–NIR range, specific bands (530–582 nm) demonstrate significance for SOM prediction [70], particularly when the 550 nm band is combined with wavelengths at 460 nm and 580 nm [71,72]. Additionally, wavelengths in the ranges of 1570–1630 nm have proven effective in predictive models [73], with bands around 1600 nm helping to minimize soil moisture interference in SOM detection [24]. The wavelength region around 2200 nm is particularly crucial for SOM prediction due to its association with hydroxyl bands and clay minerals, which are closely linked to organic matter content [74,75].

4.2. Predictive Approach

The similarity between the selected wavelengths and the existing literature demonstrates that combining the SNV with embedded feature selection successfully identified the most significant wavelengths for SOM prediction. The application of SNV preprocessing enhanced this wavelength selection process, aligning with various studies that have demonstrated its effectiveness in improving model accuracy and stability [57,76]. The role of the SNV in spectral analysis is crucial as it normalizes spectra by removing scatter effects, which is essential for accurate wavelength selection and subsequent modeling [77,78]. This preprocessing technique has been particularly effective in minimizing the influence of soil moisture and other interfering variables, thereby improving the performance of PLSR models in predicting SOM [25,76]. Yang et al. (2022) [76] demonstrated this by combining SNV preprocessing with Particle Swarm Optimization and Convolutional Neural Networks, achieving improved SOM estimation accuracy in desert soils (R2 = 0.71). Similarly, Carvalho et al. (2022) [79] reported that the SNV combined with Support Vector Machines and near-infrared spectroscopy achieved R2 = 0.70, effectively mitigating spectral data scattering effects. These results underscore the importance of preprocessing methods like the SNV in reducing noise and enhancing the predictive capability of spectral analysis models [80].
PLSR’s effectiveness for SOM and SOC prediction from hyperspectral data is well-documented. Reis et al. (2021) [36] achieved R2 = 0.75 using PLSR with hyperspectral imaging, while De Santana et al. (2019) [81] demonstrated improved predictions through external parameter orthogonalization to address moisture interference. Additional validation comes from Lu et al. (2023) [82] and Yang et al. (2023) [9], who confirmed PLSR’s adaptability across diverse environmental conditions and its effectiveness with strategic spectral transformations using the Chinese VIS–NIR soil spectral library.

5. Limitations and Future Research

Despite the overall satisfactory performance of PLSR in predicting SOM within sampled areas, several limitations were identified in this study. The model showed constraints in extrapolating predictions beyond sampled regions, highlighting the need to explore non-linear approaches such as Random Forest, Cubist, neural networks, or ensemble machine learning methods. These methods may better capture complex non-linear soil–spectra relationships and improve prediction accuracy in unsampled areas.
Additionally, this study faced temporal constraints due to the gap between the soil data collected in 2021 and the EnMAP imagery acquired in 2024. However, this three-year gap is relatively insignificant when compared to findings from the LUCAS soil data, where a comparison between 2009 and 2018 showed variations in SOM for cropland points of up to 2 g/kg [52,83]. These variations fall within the typical prediction uncertainty, supporting the assumption that SOM in the region remains stable under consistent management practices. Nevertheless, for future monitoring purposes, aligning soil sample collection dates more closely with imagery acquisition is recommended to further enhance accuracy.
The availability of spaceborne hyperspectral imagery further restricted the temporal and spatial completeness of predictions. Cloud cover and the requirement for bare soil conditions limited suitable acquisitions, and the relatively short operational period of new sensors, combined with their constrained acquisition frequency, hindered the availability of multi-temporal datasets.
Several methodological aspects could be improved in future research. The current study relied on two preprocessing approaches (SG and SNV) and a feature selection method. Future work should investigate the potential of other preprocessing techniques, such as continuum removal, multiplicative scatter correction, or wavelet transformations. Additionally, more sophisticated feature selection algorithms, including genetic algorithms or recursive feature elimination, could be explored to optimize wavelength selection.
Future research directions should focus on several key areas, such as (i) evaluating EnMAP’s capability to predict other soil parameters, including texture, electrical conductivity, and soil nutrients, (ii) comparing EnMAP’s performance to other available hyperspectral products such as PRISMA and Geofen-5, (iii) developing multi-sensor approaches that combine EnMAP data with other remote sensing sources (e.g., Sentinel-2 and radar) to improve spatial and temporal coverage, (iv) investigating the potential of deep learning approaches for handling the high dimensionality and complexity of hyperspectral data, (v) assessing the temporal stability of SOM predictions using multi-temporal EnMAP acquisitions, (vi) exploring the integration of ancillary data (terrain attributes and climate variables) to improve prediction accuracy, and (vii) investigating how spatial modeling approaches might complement spectral-based predictions.
Additionally, future studies should investigate the impact of soil moisture, surface roughness, and vegetation residues on EnMAP spectral signatures and subsequent SOM predictions. The development of robust correction methods for these factors would enhance the operational utility of EnMAP for soil monitoring. Such comparative analyses and methodological improvements would provide valuable insights into the relative strengths and limitations of different hyperspectral sensors and analytical approaches for soil property mapping, ultimately contributing to more robust and comprehensive soil monitoring frameworks. The integration of these advanced techniques with EnMAP’s capabilities could lead to more accurate and reliable soil property maps at regional scales.

6. Conclusions

This study demonstrates the operational potential of EnMAP hyperspectral imagery for SOM prediction and mapping in agricultural landscapes. The comprehensive evaluation of different preprocessing techniques revealed that SNV transformation combined with selective wavelength features provides optimal results for PLSR modeling. The selected wavelengths in both Vis–NIR (530–582 nm) and SWIR regions (1977–2059 nm, 2182–2232 nm, and beyond 2300 nm) align with known absorption features related to SOM components, validating EnMAP’s capability to capture relevant spectral information for SOM prediction.
Key limitations identified include PLSR’s reduced performance in extrapolating predictions to unsampled areas. These constraints suggest the need to explore more robust non-linear modeling approaches that might better capture complex soil–spectra relationships. Additionally, future research should evaluate EnMAP’s capability to predict other soil parameters and compare its performance to other available hyperspectral sensors like PRISMA to establish comprehensive protocols for satellite-based soil monitoring.
Despite these limitations, our findings confirm EnMAP’s utility for regional-scale SOM mapping, offering new possibilities for soil monitoring through spaceborne hyperspectral imagery. This work establishes a foundation for future applications of hyperspectral remote sensing in digital soil mapping.

Author Contributions

Conceptualization, Y.B. and A.B.; methodology, Y.B.; software, Y.B.; validation, Y.B.; formal analysis, Y.B.; data curation, Y.B. and A.B.; writing—original draft preparation, Y.B. and A.B.; and writing—review and editing, Y.B. and A.B. All authors have read and agreed to the published version of the manuscript.

Funding

This research received no external funding.

Data Availability Statement

Soil data are available upon request from the corresponding author. The EnMAP images are freely available through the EnMAP Data Access Portal (https://planning.enmap.org/ (accessed on 12 October 2024)).

Acknowledgments

We would like to thank the Regional Office for Agricultural Development of Doukkala (ORMVAD) for providing the soil data and the German Aerospace Center (DLR) for providing the EnMAP images.

Conflicts of Interest

Author Abdelkrim Bouasria is co-founder of the Agmetrix company. The remaining authors declare that the research was conducted in the absence of any commercial or financial relationships that could be construed as a potential conflict of interest.

References

  1. Bhattacharyya, S.S.; Ros, G.H.; Furtak, K.; Iqbal, H.M.; Parra-Saldívar, R. Soil carbon sequestration–An interplay between soil microbial community and soil organic matter dynamics. Sci. Total Environ. 2022, 815, 152928. [Google Scholar] [CrossRef]
  2. John, K.; Bouslihim, Y.; Ofem, K.I.; Hssaini, L.; Razouk, R.; Okon, P.B.; Isong, I.A.; Agyeman, P.C.; Kebonye, N.M.; Qin, C. Do model choice and sample ratios separately or simultaneously influence soil organic matter prediction? Int. Soil Water Conserv. Res. 2021, 10, 470–486. [Google Scholar] [CrossRef]
  3. Das, S.; Kim, P.J.; Nie, M.; Chabbi, A. Soil organic matter in the anthropocene: Role in climate change mitigation, carbon sequestration, and food security. Agric. Ecosyst. Environ. 2024, 375, 109180. [Google Scholar] [CrossRef]
  4. Minasny, B.; McBratney, A.B.; Arrouays, D.; Chabbi, A.; Field, D.J.; Kopittke, P.M.; Morgan, C.L.; Padarian, J.; Rumpel, C. Soil carbon se-questration: Much more than a climate solution. Environ. Sci. Technol. 2023, 57, 19094–19098. [Google Scholar] [CrossRef]
  5. Conant, R.T.; Ogle, S.M.; Paul, E.A.; Paustian, K. Measuring and monitoring soil organic carbon stocks in agricultural lands for climate mitigation. Front. Ecol. Environ. 2010, 9, 169–173. [Google Scholar] [CrossRef]
  6. Peng, L.; Wu, X.; Feng, C.; Gao, L.; Li, Q.; Xu, J.; Li, B. Assessing the potential of multi-source remote sensing data for cropland soil organic matter mapping in hilly and mountainous areas. Catena 2024, 245, 108312. [Google Scholar] [CrossRef]
  7. Ben-Dor, E.; Chabrillat, S.; Demattê, J.; Taylor, G.; Hill, J.; Whiting, M.; Sommer, S. Using Imaging Spectroscopy to study soil properties. Remote Sens. Environ. 2009, 113, S38–S55. [Google Scholar] [CrossRef]
  8. Ng, W.; Minasny, B.; Montazerolghaem, M.; Padarian, J.; Ferguson, R.; Bailey, S.; McBratney, A.B. Convolutional neural network for simultaneous prediction of several soil properties using visible/near-infrared, mid-infrared, and their combined spectra. Geoderma 2019, 352, 251–267. [Google Scholar] [CrossRef]
  9. Yang, M.; Chen, S.; Xu, D.; Hong, Y.; Li, S.; Peng, J.; Ji, W.; Guo, X.; Zhao, X.; Shi, Z. Strategies for predicting soil organic matter in the field using the Chinese Vis-NIR soil spectral library. Geoderma 2023, 433, 116461. [Google Scholar] [CrossRef]
  10. Chabrillat, S.; Ben-Dor, E.; Cierniewski, J.; Gomez, C.; Schmid, T.; van Wesemael, B. Imaging Spectroscopy for Soil Mapping and Monitoring. Surv. Geophys. 2019, 40, 361–399. [Google Scholar] [CrossRef]
  11. John, K.; Bouslihim, Y.; Isong, I.A.; Hssaini, L.; Razouk, R.; Kebonye, N.M.; Agyeman, P.C.; Penížek, V.; Zádorová, T. Mapping soil nutrients via different covariates combinations: Theory and an example from Morocco. Ecol. Process. 2022, 11, 23. [Google Scholar] [CrossRef]
  12. Castaldi, F.; Hueni, A.; Chabrillat, S.; Ward, K.; Buttafuoco, G.; Bomans, B.; Vreys, K.; Brell, M.; van Wesemael, B. Evaluating the capability of the Sentinel 2 data for soil organic carbon prediction in croplands. ISPRS J. Photogramm. Remote Sens. 2019, 147, 267–282. [Google Scholar] [CrossRef]
  13. Gholizadeh, A.; Žižala, D.; Saberioon, M.; Borůvka, L. Soil organic carbon and texture retrieving and mapping using proximal, airborne and Sentinel-2 spectral imaging. Remote Sens. Environ. 2018, 218, 89–103. [Google Scholar] [CrossRef]
  14. Bouasria, A.; Namr, K.I.; Rahimi, A.; Ettachfini, E.M.; Rerhou, B. Evaluation of Landsat 8 image pansharpening in estimating soil organic matter using multiple linear regression and artificial neural networks. Geo Spat. Inf. Sci. 2022, 25, 353–364. [Google Scholar] [CrossRef]
  15. Bouslihim, Y.; John, K.; Miftah, A.; Azmi, R.; Aboutayeb, R.; Bouasria, A.; Razouk, R.; Hssaini, L. The effect of covariates on Soil Organic Matter and pH variability: A digital soil mapping approach using random forest model. Ann. GIS 2024, 30, 215–232. [Google Scholar] [CrossRef]
  16. Lin, C.; Zhu, A.-X.; Wang, Z.; Wang, X.; Ma, R. The refined spatiotemporal representation of soil organic matter based on remote images fusion of Sentinel-2 and Sentinel-3. Int. J. Appl. Earth Obs. Geoinf. 2020, 89, 102094. [Google Scholar]
  17. Zhou, T.; Geng, Y.; Chen, J.; Pan, J.; Haase, D.; Lausch, A. High-resolution digital mapping of soil organic carbon and soil total nitrogen using DEM derivatives, Sentinel-1 and Sentinel-2 data based on machine learning algorithms. Sci. Total Environ. 2020, 729, 138244. [Google Scholar] [CrossRef]
  18. Luo, C.; Zhang, W.; Zhang, X.; Liu, H. Mapping of soil organic matter in a typical black soil area using Landsat-8 synthetic images at different time periods. Catena 2023, 231, 107336. [Google Scholar] [CrossRef]
  19. Casa, R.; Castaldi, F.; Pascucci, S.; Palombo, A.; Pignatti, S. A comparison of sensor resolution and calibration strategies for soil texture estimation from hyperspectral remote sensing. Geoderma 2013, 197–198, 17–26. [Google Scholar] [CrossRef]
  20. Castaldi, F.; Palombo, A.; Santini, F.; Pascucci, S.; Pignatti, S.; Casa, R. Evaluation of the potential of the current and forthcoming multispectral and hyperspectral imagers to estimate soil texture and organic carbon. Remote Sens. Environ. 2016, 179, 54–65. [Google Scholar] [CrossRef]
  21. Gomez, C.; Rossel, R.A.V.; McBratney, A.B. Soil organic carbon prediction by hyperspectral remote sensing and field vis-NIR spectroscopy: An Australian case study. Geoderma 2008, 146, 403–411. [Google Scholar] [CrossRef]
  22. Rossel, R.A.V.; Lee, J.; Behrens, T.; Luo, Z.; Baldock, J.; Richards, A. Continental-scale soil carbon composition and vulnerability modulated by regional environmental controls. Nat. Geosci. 2019, 12, 547–552. [Google Scholar] [CrossRef]
  23. Yue, M.; Qi-gang, J.; Zhi-guo, M.; Hua-xin, L. Black soil organic matter content estimation using hybrid selection method based on rf and gabpso. Spectrosc. Spectr. Anal. 2018, 38, 181–187. [Google Scholar]
  24. Wang, S.-F.; Cheng, X.; Song, H.-Y. Analysis of the Effect of Moisture on Soil Organic Matter Determination and Anti-Moisture Interference Model Building Based on Vis-NIR Spectral Technology. Guang Pu Xue Yu Guang Pu Fen Xi Guang Pu 2016, 36, 3249–3253. [Google Scholar]
  25. Wang, Y.-P.; Lee, C.-K.; Dai, Y.-H.; Shen, Y. Effect of wetting on the determination of soil organic matter content using visible and near-infrared spectrometer. Geoderma 2020, 376, 114528. [Google Scholar] [CrossRef]
  26. Ben-Dor, E.; Inbar, Y.; Chen, Y. The reflectance spectra of organic matter in the visible near-infrared and short wave infrared region (400–2500 nm) during a controlled decomposition process. Remote Sens. Environ. 1997, 61, 1–15. [Google Scholar] [CrossRef]
  27. Xu, L.; Hong, Y.; Wei, Y.; Guo, L.; Shi, T.; Liu, Y.; Jiang, Q.; Fei, T.; Liu, Y.; Mouazen, A.M.; et al. Estimation of Organic Carbon in Anthropogenic Soil by VIS-NIR Spectroscopy: Effect of Variable Selection. Remote Sens. 2020, 12, 3394. [Google Scholar] [CrossRef]
  28. Rinnan, Å.; van den Berg, F.; Engelsen, S.B. Review of the most common pre-processing techniques for near-infrared spectra. TrAC Trends Anal. Chem. 2009, 28, 1201–1222. [Google Scholar] [CrossRef]
  29. Rossel, R.V.; Behrens, T. Using data mining to model and interpret soil diffuse reflectance spectra. Geoderma 2010, 158, 46–54. [Google Scholar] [CrossRef]
  30. Guo, H.; Zhang, R.; Dai, W.; Zhou, X.; Zhang, D.; Yang, Y.; Cui, J. Mapping Soil Organic Matter Content Based on Feature Band Selection with ZY1-02D Hyperspectral Satellite Data in the Agricultural Region. Agronomy 2022, 12, 2111. [Google Scholar] [CrossRef]
  31. Gasmi, A.; Gomez, C.; Chehbouni, A.; Dhiba, D.; El Gharous, M. Using PRISMA Hyperspectral Satellite Imagery and GIS Approaches for Soil Fertility Mapping (FertiMap) in Northern Morocco. Remote Sens. 2022, 14, 4080. [Google Scholar] [CrossRef]
  32. Meng, X.; Bao, Y.; Ye, Q.; Liu, H.; Zhang, X.; Tang, H.; Zhang, X. Soil Organic Matter Prediction Model with Satellite Hyperspectral Image Based on Optimized Denoising Method. Remote Sens. 2021, 13, 2273. [Google Scholar] [CrossRef]
  33. Chen, R.; Xue, W.; Zi-Wen, W.; Hao, Q.; Tie-Min, M.; Zheng-Guang, C. Wavelength selection method of near-infrared spectrum based on random forest feature importance and interval partial least square method. Spectrosc. Spectr. Anal 2023, 43, 1043–1050. [Google Scholar]
  34. Shi, Y.; Zhao, J.; Song, X.; Qin, Z.; Wu, L.; Wang, H.; Tang, J. Hyperspectral band selection and modeling of soil organic matter content in a forest using the Ranger algorithm. PLoS ONE 2021, 16, e0253385. [Google Scholar] [CrossRef] [PubMed]
  35. Salas, E.A.L.; Kumaran, S.S. Perimeter-Area Soil Carbon Index (PASCI): Modeling and estimating soil organic carbon using relevant explicatory waveband variables in machine learning environment. Geo Spat. Inf. Sci. 2023, 27, 1739–1746. [Google Scholar] [CrossRef]
  36. Reis, A.S.; Rodrigues, M.; dos Santos, G.L.A.A.; de Oliveira, K.M.; Furlanetto, R.H.; Crusiol, L.G.T.; Cezar, E.; Nanni, M.R. Detection of soil organic matter using hyperspectral imaging sensor combined with multivariate regression modeling procedures. Remote Sens. Appl. Soc. Environ. 2021, 22, 100492. [Google Scholar] [CrossRef]
  37. Chen, Y.; Wang, J.; Liu, G.; Yang, Y.; Liu, Z.; Deng, H. Hyperspectral Estimation Model of Forest Soil Organic Matter in Northwest Yunnan Province, China. Forests 2019, 10, 217. [Google Scholar] [CrossRef]
  38. Zhang, X.; Yao, Y.; Yan, X. Effects of Spectral Resolution and Spectral Preprocessing on the Estimation Accuracy of Soil Organic Matter Content. In Proceedings of the 2022 10th International Conference on Agro-geoinformatics (Agro-Geoinformatics), Quebec City, QC, Canada, 11–14 July 2022; pp. 1–6. [Google Scholar]
  39. Yu, L.; Hong, Y.; Zhou, Y.; Zhu, Q.; Xu, L.; Li, J.; Nie, Y. Wavelength variable selection methods for estimation of soil organic matter content using hyperspectral technique. Trans. Chin. Soc. Agric. Eng. 2016, 32, 95–102. [Google Scholar]
  40. Xu, M.; Zhou, S.; Ding, W.; Wu, S.; Wu, W. Hyperspectral reflectance models for predicting soil organic matter content in coastal tidal land area, northern Jiangsu. Trans. Chin. Soc. Agric. Eng. 2011, 27, 219–223. [Google Scholar]
  41. Zheng, G.; Dongryeol, R.Y.U.; Caixia, J.I.A.O.; Changqiao, H.O.N.G. Estimation of organic matter content in coastal soil using reflectance spectroscopy. Pedosphere 2016, 26, 130–136. [Google Scholar] [CrossRef]
  42. Subi, X.; Eziz, M.; Zhong, Q. Hyperspectral Estimation Model of Organic Matter Content in Farmland Soil in the Arid Zone. Sustainability 2023, 15, 13719. [Google Scholar] [CrossRef]
  43. Sun, W.; Liu, S.; Zhang, X.; Li, Y. Estimation of soil organic matter content using selected spectral subset of hyper-spectral data. Geoderma 2022, 409, 115653. [Google Scholar] [CrossRef]
  44. Jin, J.; Wu, M.; Song, G.; Wang, Q. Genetic algorithm captured the informative bands for partial least squares re-gression better on retrieving leaf nitrogen from hyperspectral reflectance. Remote Sens. 2022, 14, 5204. [Google Scholar] [CrossRef]
  45. Guanter, L.; Kaufmann, H.; Segl, K.; Foerster, S.; Rogass, C.; Chabrillat, S.; Kuester, T.; Hollstein, A.; Rossner, G.; Chlebek, C.; et al. The EnMAP Spaceborne Imaging Spectroscopy Mission for Earth Observation. Remote Sens. 2015, 7, 8830–8857. [Google Scholar] [CrossRef]
  46. Storch, T.; Honold, H.-P.; Chabrillat, S.; Habermeyer, M.; Tucker, P.; Brell, M.; Ohndorf, A.; Wirth, K.; Betz, M.; Kuchler, M.; et al. The EnMAP imaging spectroscopy mission towards operations. Remote Sens. Environ. 2023, 294, 113632. [Google Scholar] [CrossRef]
  47. Ward, K.J.; Chabrillat, S.; Brell, M.; Castaldi, F.; Spengler, D.; Foerster, S. Mapping Soil Organic Carbon for Airborne and Simulated EnMAP Imagery Using the LUCAS Soil Database and a Local PLSR. Remote Sens. 2020, 12, 3451. [Google Scholar] [CrossRef]
  48. Bounif, M.; Bouasria, A.; Rahimi, A.; El Mjiri, I. Study of agricultural land use variability in Doukkala irrigated area between 1998 and 2020. In Proceedings of the 2021 Third International Sustainability and Resilience Conference: Climate Change, Sakheer, Bahrain, 15–16 November 2021; pp. 170–175. [Google Scholar]
  49. Bouasria, A.; Namr, K.I.; Rahimi, A.; Ettachfini, E.M. Geospatial Assessment of Soil Organic Matter Variability at Sidi Bennour District in Doukkala Plain in Morocco. J. Ecol. Eng. 2021, 22, 120–130. [Google Scholar] [CrossRef] [PubMed]
  50. Tibhirine, Z.; Namr, K.I.; Bouasria, A.; El Bourhrami, B.; Ettayeb, H. Geospatial and temporal assessment of the variability of soil organic matter and electrical conductivity in irrigated semi-arid area. Geol. Ecol. Landsc. 2023, 1–12. [Google Scholar] [CrossRef]
  51. FAO. Standard Operating Procedure for Soil Organic Carbon Walkley-Black Method Titration and Colorimetric Method; Food & Agriculture Organization: Québec City, QC, Canada, 2019. [Google Scholar]
  52. De Rosa, D.; Ballabio, C.; Lugato, E.; Fasiolo, M.; Jones, A.; Panagos, P. Soil organic carbon stocks in European croplands and grasslands: How much have we lost in the past decade? Glob. Chang. Biol. 2023, 30, e16992. [Google Scholar] [CrossRef] [PubMed]
  53. Chabrillat, S.; Foerster, S.; Segl, K.; Beamish, A.; Brell, M.; Asadzadeh, S.; Milewski, R.; Ward, K.J.; Brosinsky, A.; Koch, K.; et al. The EnMAP spaceborne imaging spectroscopy mission: Initial scientific results two years after launch. Remote Sens. Environ. 2024, 315, 114379. [Google Scholar] [CrossRef]
  54. Nocita, M.; Stevens, A.; van Wesemael, B.; Aitkenhead, M.; Bachmann, M.; Barthès, B.; Ben Dor, E.; Brown, D.J.; Clairotte, M.; Csorba, A.; et al. Soil spec-troscopy: An alternative to wet chemistry for soil monitoring. Adv. Agron. 2015, 132, 139–159. [Google Scholar]
  55. Seema; Ghosh, A.K.; Das, B.S.; Reddy, N. Application of VIS-NIR spectroscopy for estimation of soil organic carbon using different spectral preprocessing techniques and multivariate methods in the middle Indo-Gangetic plains of India. Geoderma Reg. 2020, 23, e00349. [Google Scholar]
  56. Ribeiro, S.G.; Teixeira, A.D.S.; de Oliveira, M.R.R.; Costa, M.C.G.; Araújo, I.C.D.S.; Moreira, L.C.J.; Lopes, F.B. Soil Organic Carbon Content Prediction Using Soil-Reflected Spectra: A Comparison of Two Regression Methods. Remote Sens. 2021, 13, 4752. [Google Scholar] [CrossRef]
  57. Hong, Y.; Chen, Y.; Yu, L.; Liu, Y.; Liu, Y.; Zhang, Y.; Liu, Y.; Cheng, H. Combining fractional order derivative and spectral variable selection for organic matter estimation of homogeneous soil samples by VIS–NIR spectroscopy. Remote Sensing 2018, 10, 479. [Google Scholar] [CrossRef]
  58. Barnes, R.J.; Dhanoa, M.S.; Lister, S.J. Standard Normal Variate Transformation and De-Trending of Near-Infrared Diffuse Reflectance Spectra. Appl. Spectrosc. 1989, 43, 772–777. [Google Scholar] [CrossRef]
  59. Liu, Y.; Liu, Y.; Chen, Y.; Zhang, Y.; Shi, T.; Wang, J.; Hong, Y.; Fei, T.; Zhang, Y. The influence of spectral pretreatment on the selection of representative calibration samples for soil organic matter estimation using Vis-NIR reflectance spectroscopy. Remote Sens. 2019, 11, 450. [Google Scholar] [CrossRef]
  60. Cao, J.; Yang, H. A dynamic normalized difference index for estimating soil organic matter concentration using visible and near-infrared spectroscopy. Ecol. Indic. 2023, 147, 110037. [Google Scholar] [CrossRef]
  61. Breiman, L. Random forests. Mach. Learn. 2001, 45, 5–32. [Google Scholar] [CrossRef]
  62. Das, B.; Chakraborty, D.; Singh, V.K.; Das, D.; Sahoo, R.N.; Aggarwal, P.; Murgaokar, D.; Mondal, B.P. Partial least square re-gression based machine learning models for soil organic carbon prediction using visible–near infrared spectroscopy. Ge Oderma Reg. 2023, 33, e00628. [Google Scholar]
  63. Zhu, J.; Jin, Y.; Zhu, W.; Lee, D.K. VIS-NIR spectroscopy and environmental factors coupled with PLSR models to predict soil organic carbon and nitrogen. Int. Soil Water Conserv. Res. 2024, 12, 844–854. [Google Scholar] [CrossRef]
  64. Dahhani, S.; Raji, M.; Bouslihim, Y. Synergistic Use of Multi-Temporal Radar and Optical Remote Sensing for Soil Organic Carbon Prediction. Remote Sens. 2024, 16, 1871. [Google Scholar] [CrossRef]
  65. Al Masmoudi, Y.; Bouslihim, Y.; Doumali, K.; Hssaini, L.; Namr, K.I. Use of machine learning in Moroccan soil fertility prediction as an alternative to laborious analyses. Model. Earth Syst. Environ. 2022, 8, 3707–3717. [Google Scholar] [CrossRef]
  66. Bouslihim, Y.; Rochdi, A.; Aboutayeb, R.; El Amrani-Paaza, N.; Miftah, A.; Hssaini, L. Soil Aggregate Stability Mapping Using Remote Sensing and GIS-Based Machine Learning Technique. Front. Earth Sci. 2021, 9, 748859. [Google Scholar] [CrossRef]
  67. Asgari, N.; Ayoubi, S.; Demattê, J.A.M.; Dotto, A.C. Carbonates and organic matter in soils characterized by reflected energy from 350–25000 nm wavelength. J. Mt. Sci. 2020, 17, 1636–1651. [Google Scholar] [CrossRef]
  68. Lin, L.; Liu, X. Water-based measured-value fuzzification improves the estimation accuracy of soil organic matter by visible and near-infrared spectroscopy. Sci. Total Environ. 2020, 749, 141282. [Google Scholar] [CrossRef] [PubMed]
  69. Wang, S.; Guan, K.; Zhang, C.; Lee, D.; Margenot, A.J.; Ge, Y.; Peng, J.; Zhou, W.; Zhou, Q.; Huang, Y. Using soil library hyperspectral reflectance and machine learning to predict soil organic carbon: Assessing potential of airborne and spaceborne optical soil sensing. Remote Sens. Environ. 2022, 271, 112914. [Google Scholar] [CrossRef]
  70. Xu, S.; Shi, X.; Wang, M.; Zhao, Y. Effects of Subsetting by Parent Materials on Prediction of Soil Organic Matter Content in a Hilly Area Using Vis–NIR Spectroscopy. PLoS ONE 2016, 11, e0151536. [Google Scholar] [CrossRef]
  71. Srivastava, R.; Sarkar, D.; Mukhopadhayay, S.S.; Sood, A.; Singh, M.; Nasre, R.A.; Dhale, S.A. Development of hyperspectral model for rapid monitoring of soil organic carbon under precision farming in the Indo-Gangetic Plains of Punjab, India. J. Indian Soc. Remote Sens. 2015, 43, 751–759. [Google Scholar] [CrossRef]
  72. Zhang, H.-L.; Xie, C.; Tian, P. Measurement of Soil Organic Matter and Total Nitrogen Based on Visible/Near Infrared Spec-troscopy and Data-Driven Machine Learning Method. Spectrosc. Spectr. Anal. 2023, 43, 2226–2231. [Google Scholar]
  73. Yanli, L.; Youlu, B.; Liping, Y.; Hongjuan, W. Hyperspectral extraction of soil organic matter content based on principal component regression. New Zealand J. Agric. Res. 2007, 50, 1169–1175. [Google Scholar] [CrossRef]
  74. Vohland, M.; Emmerling, C. Determination of total soil organic C and hot water-extractable C from VIS-NIR soil reflectance with partial least squares regression and spectral feature selection techniques. Eur. J. Soil Sci. 2011, 62, 598–606. [Google Scholar] [CrossRef]
  75. Zhou, Q.; Ding, J.; Ge, X.; Li, K.; Zhang, Z.; Gu, Y. Estimation of soil organic matter in the Ogan-Kuqa River Oasis, Northwest China, based on visible and near-infrared spectroscopy and machine learning. J. Arid. Land 2023, 15, 191–204. [Google Scholar] [CrossRef]
  76. Yang, P.; Hu, J.; Hu, B.; Luo, D.; Peng, J. Estimating soil organic matter content in desert areas using in situ hyper-spectral data and feature variable selection algorithms in southern Xinjiang, China. Remote Sens. 2022, 14, 5221. [Google Scholar] [CrossRef]
  77. Grisanti, E.; Totska, M.; Huber, S.; Krick Calderon, C.; Hohmann, M.; Lingenfelser, D.; Otto, M. Dynamic localized SNV, Peak SNV, and partial peak SNV: Novel standardization methods for preprocessing of spectroscopic data used in pre-dictive modeling. J. Spectrosc. 2018, 2018, 5037572. [Google Scholar] [CrossRef]
  78. Roussel, S.A.; Igne, B.; Funk, D.B.; Hurburgh, C.R. Noise Robustness Comparison for near Infrared Prediction Models. J. Near Infrared Spectrosc. 2011, 19, 23–36. [Google Scholar] [CrossRef]
  79. Carvalho, J.K.; Moura-Bueno, J.M.; Ramon, R.; Almeida, T.F.; Naibo, G.; Martins, A.P.; Santos, L.S.; Gianello, C.; Tiecher, T. Combining different pre-processing and multivariate methods for prediction of soil organic matter by near infrared spectroscopy (NIRS) in Southern Brazil. Geoderma Reg. 2022, 29, e00530. [Google Scholar] [CrossRef]
  80. Torniainen, J.; Afara, I.O.; Prakash, M.; Sarin, J.K.; Stenroth, L.; Töyräs, J. Automated preprocessing of near infrared spectroscopic data. In Bio-Optics: Design and Application; Optica Publishing Group: Washington, DC, USA, 2019; p. DS2A-6. [Google Scholar]
  81. De Santana, F.B.; de Giuseppe, L.O.; de Souza, A.M.; Poppi, R.J. Removing the moisture effect in soil organic matter determination using NIR spectroscopy and PLSR with external parameter orthogonalization. Microchem. J. 2019, 145, 1094–1101. [Google Scholar] [CrossRef]
  82. Lu, W.; Du, H.; Chen, Y. Soil Organic Matter Inversion Based on Imaging Spectral Data in Straw-Covered Noncul-tivated Land. J. Sens. 2023, 2023, 7479031. [Google Scholar] [CrossRef]
  83. Ward, K.J.; Foerster, S.; Chabrillat, S. Estimating Soil Organic Carbon using multitemporal PRISMA imaging spectroscopy data. Geoderma 2024, 450, 117025. [Google Scholar] [CrossRef]
Figure 1. Spatial distribution of soil samples and limits of EnMAP scenes.
Remotesensing 17 01600 g001
Figure 2. Methodological flowchart.
Remotesensing 17 01600 g002
Figure 3. Distribution of SOM (%) data from training and test datasets.
Remotesensing 17 01600 g003
Figure 4. EnMAP reflectance curves for different values of SOM (%).
Remotesensing 17 01600 g004
Figure 5. Correlation coefficients (r) between SOM (%) and (i) original EnMAP spectra and (ii) spectra smoothed by Standard Normal Variate (SNV).
Remotesensing 17 01600 g005
Figure 6. Validation scatter plot of observed vs. predicted SOM (%) using PLSR with SNV and the top 30 features on the independent test dataset. The dotted line represents the ideal fit, the solid line represents the model fit, and the green dots represent the validation data (observed vs. predicted).
Remotesensing 17 01600 g006
Figure 7. Spatial distribution of SOM (%) using EnMAP, the blue polygons represent the irrigated scheme.
Remotesensing 17 01600 g007
Figure 8. Selected wavelengths from EnMap (indicated by blue line segments). Black lines represent the mean of the sample spectra, and gray areas indicate the standard deviation (SD).
Remotesensing 17 01600 g008
Table 1. EnMAP technical characteristics.
Spectral RangeSpectral ResolutionSNR (Signal-to-Noise Ratio)
Vis–NIR420–1000 nm6.5 nmVNIR: >400:1 at 495 nm
SWIR900–2450 nm10 nmSWIR: >170:1 at 2200 nm
Table 2. Description of the eight modeling scenarios used for SOM prediction using PLSR.
ScenarioPreprocessing MethodSpectral DataDescription
1OriginalAll bandsRaw spectral data without preprocessing
2Original30 bandsRaw spectral data with selected top 30 bands
3SGAll bandsSavitzky–Golay smoothing using complete EnMAP spectral data
4SG30 bandsSavitzky–Golay smoothing with selected top 30 bands
5SG_2ndAll bandsSecond derivative of SG using complete EnMAP spectral data
6SG_2nd30 bandsSecond derivative of SG with selected top 30 bands
7SNVAll bandsStandard Normal Variate using complete EnMAP spectral data
8SNV30 bandsStandard Normal Variate with selected top 30 bands
Table 3. Descriptive statistics of SOM (%) values within training and test datasets.
N° SamplesMinMaxMeanStandard DeviationCoefficient of VariationSkewness
Training data1990.514.061.810.7139.461.08
Test data830.633.541.770.633.90.86
Table 4. PLSR validation performances under different scenarios using independent test datasets.
ModelR2RMSE (%)RPIQ
Original0.600.391.56
Original and 30 F0.530.431.41
SG0.580.391.53
SG and 30 F0.560.411.47
SG2nd0.580.391.53
SG2nd and 30 F0.520.421.43
SNV0.670.341.74
SNV and 30 F0.680.341.75
30 F: Top 30 selected features, SG: Savitzky–Golay, SG2nd: Savitzky–Golay 2nd derivative, and SNV: Standard Normal Variate.
Disclaimer/Publisher’s Note: The statements, opinions and data contained in all publications are solely those of the individual author(s) and contributor(s) and not of MDPI and/or the editor(s). MDPI and/or the editor(s) disclaim responsibility for any injury to people or property resulting from any ideas, methods, instructions or products referred to in the content.

