Article

Comparative Analysis of Satellite-Based Precipitation Products During Extreme Rainfall from Super Typhoon Yagi in Hanoi, Vietnam (September 2024)

1
Department of Hydraulic Works and Construction (DHWC), Ministry of Agriculture and Environment (MAE), Hanoi 100000, Vietnam
2
Center for Hydrometeorology and Remote Sensing (CHRS), Department of Civil and Environmental Engineering, University of California, Irvine (UCI), Irvine, CA 92697-2175, USA
3
Department of Geography, College of Humanities and Social Sciences, King Saud University, Riyadh 11451, Saudi Arabia
*
Author to whom correspondence should be addressed.
Remote Sens. 2025, 17(9), 1598; https://doi.org/10.3390/rs17091598
Submission received: 28 February 2025 / Revised: 16 April 2025 / Accepted: 22 April 2025 / Published: 30 April 2025

Abstract

:
This study aimed to compare and evaluate three satellite-based precipitation estimation products: Integrated Multi-satellitE Retrievals for Global Precipitation Measurement Early Run (IMERG-Early Run), Climate Prediction Center MORPHing technique Real Time (CMORPH-RT), and Precipitation Estimation from Remotely Sensed Information using Artificial Neural Networks-Dynamic Infrared Rain rate Now (PDIR-Now) to identify the optimal integration strategies to improve the extreme rainfall estimation during Super Typhoon Yagi (September, 2024) in Hanoi, Vietnam, using validation data from 25 ground stations. In-depth analysis of three extreme rainfall series during Typhoon Yagi (6–9 September 2024), examining 93 extreme rainfall events at the 95th percentile precipitation threshold (R95p = 21.78 mm/h), combined with statistics at lower percentile thresholds (R1p, R5p, R10p, and R90p) and upper percentile threshold (R99p), revealed IMERG-Early best captured the peak rainfall, CMORPH-RT achieved highest total rainfall accuracy, while PDIR-Now offered the best spatial analysis. However, limitations included time lags, inability to detect rainfall events above R99p (41.69 mm/hour), and low detection rates (8–12%) in areas first impacted by the typhoon. This study identified that integration strategies combining different satellite products based on their strengths at specific time scales showed potential for improved rainfall estimation: PDIR-Now with IMERG-Early (1–3 h) and IMERG-Early with CMORPH-RT (6–12 h). These integration approaches accounted for each product’s unique capabilities in capturing different aspects of extreme rainfall during super typhoon events.

1. Introduction

According to the IPCC’s Sixth Assessment Report [1,2], in the context of climate change, both the frequency and intensity of extreme rainfall events are projected to increase significantly in most global regions, including coastal and other low-lying cities. This phenomenon is attributed to global warming, which leads to an increase in the capacity for holding atmospheric water vapor and enhanced convective processes [3]. Extreme rainfall is considered one of the most dangerous hydrometeorological phenomena, causing significant negative impacts on natural systems and humans worldwide [4]. It can be identified through the intensity of rainfall, usually classified into light rain ( R < 2 mm/h), moderate rain ( 2 R < 20 mm/h), and heavy rain ( R 20 mm/h) [5]. However, for extreme rainfall events, there is no standardized definition; it can be defined using a threshold of R 20 mm/h or using percentile thresholds, such as the 95th or 99th percentile (typically the 95th) of rainfall distribution for a specific location and time period [6]. An analysis Knutson et al. [7] indicated that the intensity of rainfall in tropical cyclones (TCs) will increase by approximately 7% per degree Celsius increase in the sea surface temperature, consistent with the Clausius–Clapeyron law on atmospheric water vapor holding capacity. Research Lin et al. [8], Chiao and Lin [9] demonstrated that when cyclones weaken and interact with topography, secondary circulation can persist and even intensify locally due to orographic effects and moisture convergence. This process typically generates prolonged areas of heavy rainfall, especially on windward mountain slopes. Chen et al. [10] indicated that the heavy rainfall associated with landfalling TCs depends not only on moisture transport but also con multiple mechanisms including extratropical transition processes, monsoon interactions, land surface processes and topographic influences, mesoscale convective system activities within the cyclone, and boundary-layer energy exchange processes.
Therefore, the accurate and timely monitoring of extreme rainfall events play a crucial role in disaster risk management and the development of climate change adaptation strategies [11,12]. The importance of extreme rainfall monitoring is demonstrated through multiple aspects. Primarily, it provides critical information for early warning systems for floods and landslides. As Alfieri et al. [13] indicated in their Earth’s Future study, improving the accuracy and estimated lead time of extreme rainfall events can significantly reduce flood-related casualties and property damage. Additionally, extreme rainfall plays a vital role in better understanding hydrological cycles and related atmospheric processes, contributing to improvements in climate and weather models [14].
In this context, satellite precipitation products have become indispensable tools for monitoring extreme rainfall, especially in regions with sparse ground observation networks. Kidd et al. [15] emphasized that satellite precipitation products provide global coverage with high spatial and temporal resolution, enabling the continuous monitoring of extreme rainfall events on a large scale. Currently, various satellite precipitation products are widely used in scientific and operational communities. Integrated Multi-satellitE Retrievals for Global Precipitation Measurement (IMERG) is National Aeronautics and Space Administration’s (NASA’s) advanced product, providing global precipitation estimates with a 0.1° spatial resolution and 30 min temporal resolution, combining data from multiple satellites and ground observation stations [16]. Climate Prediction Center Morphing Technique (CMORPH) is another widely used National Oceanic and Atmospheric Administration (NOAA) product providing high-resolution global precipitation data [17]. Recently, the Center for Hydrometeorology and Remote Sensing at University of California Irvine’s (CHRS-UCI’s) Precipitation Estimation from Remotely Sensed Information using Artificial Neural Networks-Now (PDIR-Now) product has attracted scientific community attention for its near-real-time precipitation estimation capabilities [18].
Additionally, there are other satellite precipitation estimation products such as Global Satellite Mapping of Precipitation (GSMaP) developed by the Japan Aerospace Exploration Agency (JAXA), with its NOW variant offering near-real-time estimates with approximately 4 h latency and 0.1° spatial resolution [19]; Climate Hazards Group InfraRed Precipitation with Station data (CHIRPS) developed by the United States Geological Survey (USGS) and Climate Hazards Center (CHC), which provides long-term (1981–present) precipitation data at 0.05° resolution [20]; and Soil Moisture to Rain-Advanced SCATterometer (SM2RAIN-ASCAT) developed by the European Space Agency (ESA), which uniquely derives rainfall estimates from soil moisture observations [21]. Advanced geostationary satellites such as Himawari-9 (Japan Meteorological Agency) [22], GeoKompsat-2B (Korea Meteorological Administration) [23], and FengYun-4B (China Meteorological Administration) provide high-frequency observations (10 min temporal resolution) covering the Asia–Pacific region [24], while Multi-Source Weighted-Ensemble Precipitation (MSWEP) optimizes accuracy by merging gauge, satellite, and reanalysis data at 3-hourly temporal and 0.1° spatial resolution [25]. The FY-4B Advanced Geostationary Radiation Imager (AGRI) [26] and Geostationary Interferometric Infrared Sounder (GIIRS) [27] instruments further enhance precipitation detection capabilities through high-resolution thermal infrared observations and atmospheric water vapor profiling, respectively. Each product has its own characteristics regarding estimation methodology and application scope.
The relationship between extreme rainfall and TC circulation is a complex issue in tropical meteorology. Wang et al. [28] detailed circulation characterized by strong upward airflow in the eyewall region and downward airflow in the outer regions, creating and maintaining characteristic spiral rainbands; particularly during the post-landfall phase, circulation structure undergoes significant changes. The complex interaction between these circulation systems poses significant challenges in accurately estimating extreme rainfall from satellite data during cyclone events. Research Tan et al. [29] on satellite precipitation product performance during Southeast Asian cyclone events revealed a tendency to underestimate extreme rainfall intensity in cyclone core regions, where wind speeds are high, and humidity is elevated. This may be due to current rainfall estimation algorithms struggling to process extreme atmospheric conditions. Chen et al. [30] expanded this analysis, indicating that the underestimation of extreme rainfall intensity is not limited to cyclone events but is also common in regions with complex terrain. This highlights the crucial role of topographic factors and local microclimate in significantly influencing satellite rainfall estimation accuracy.
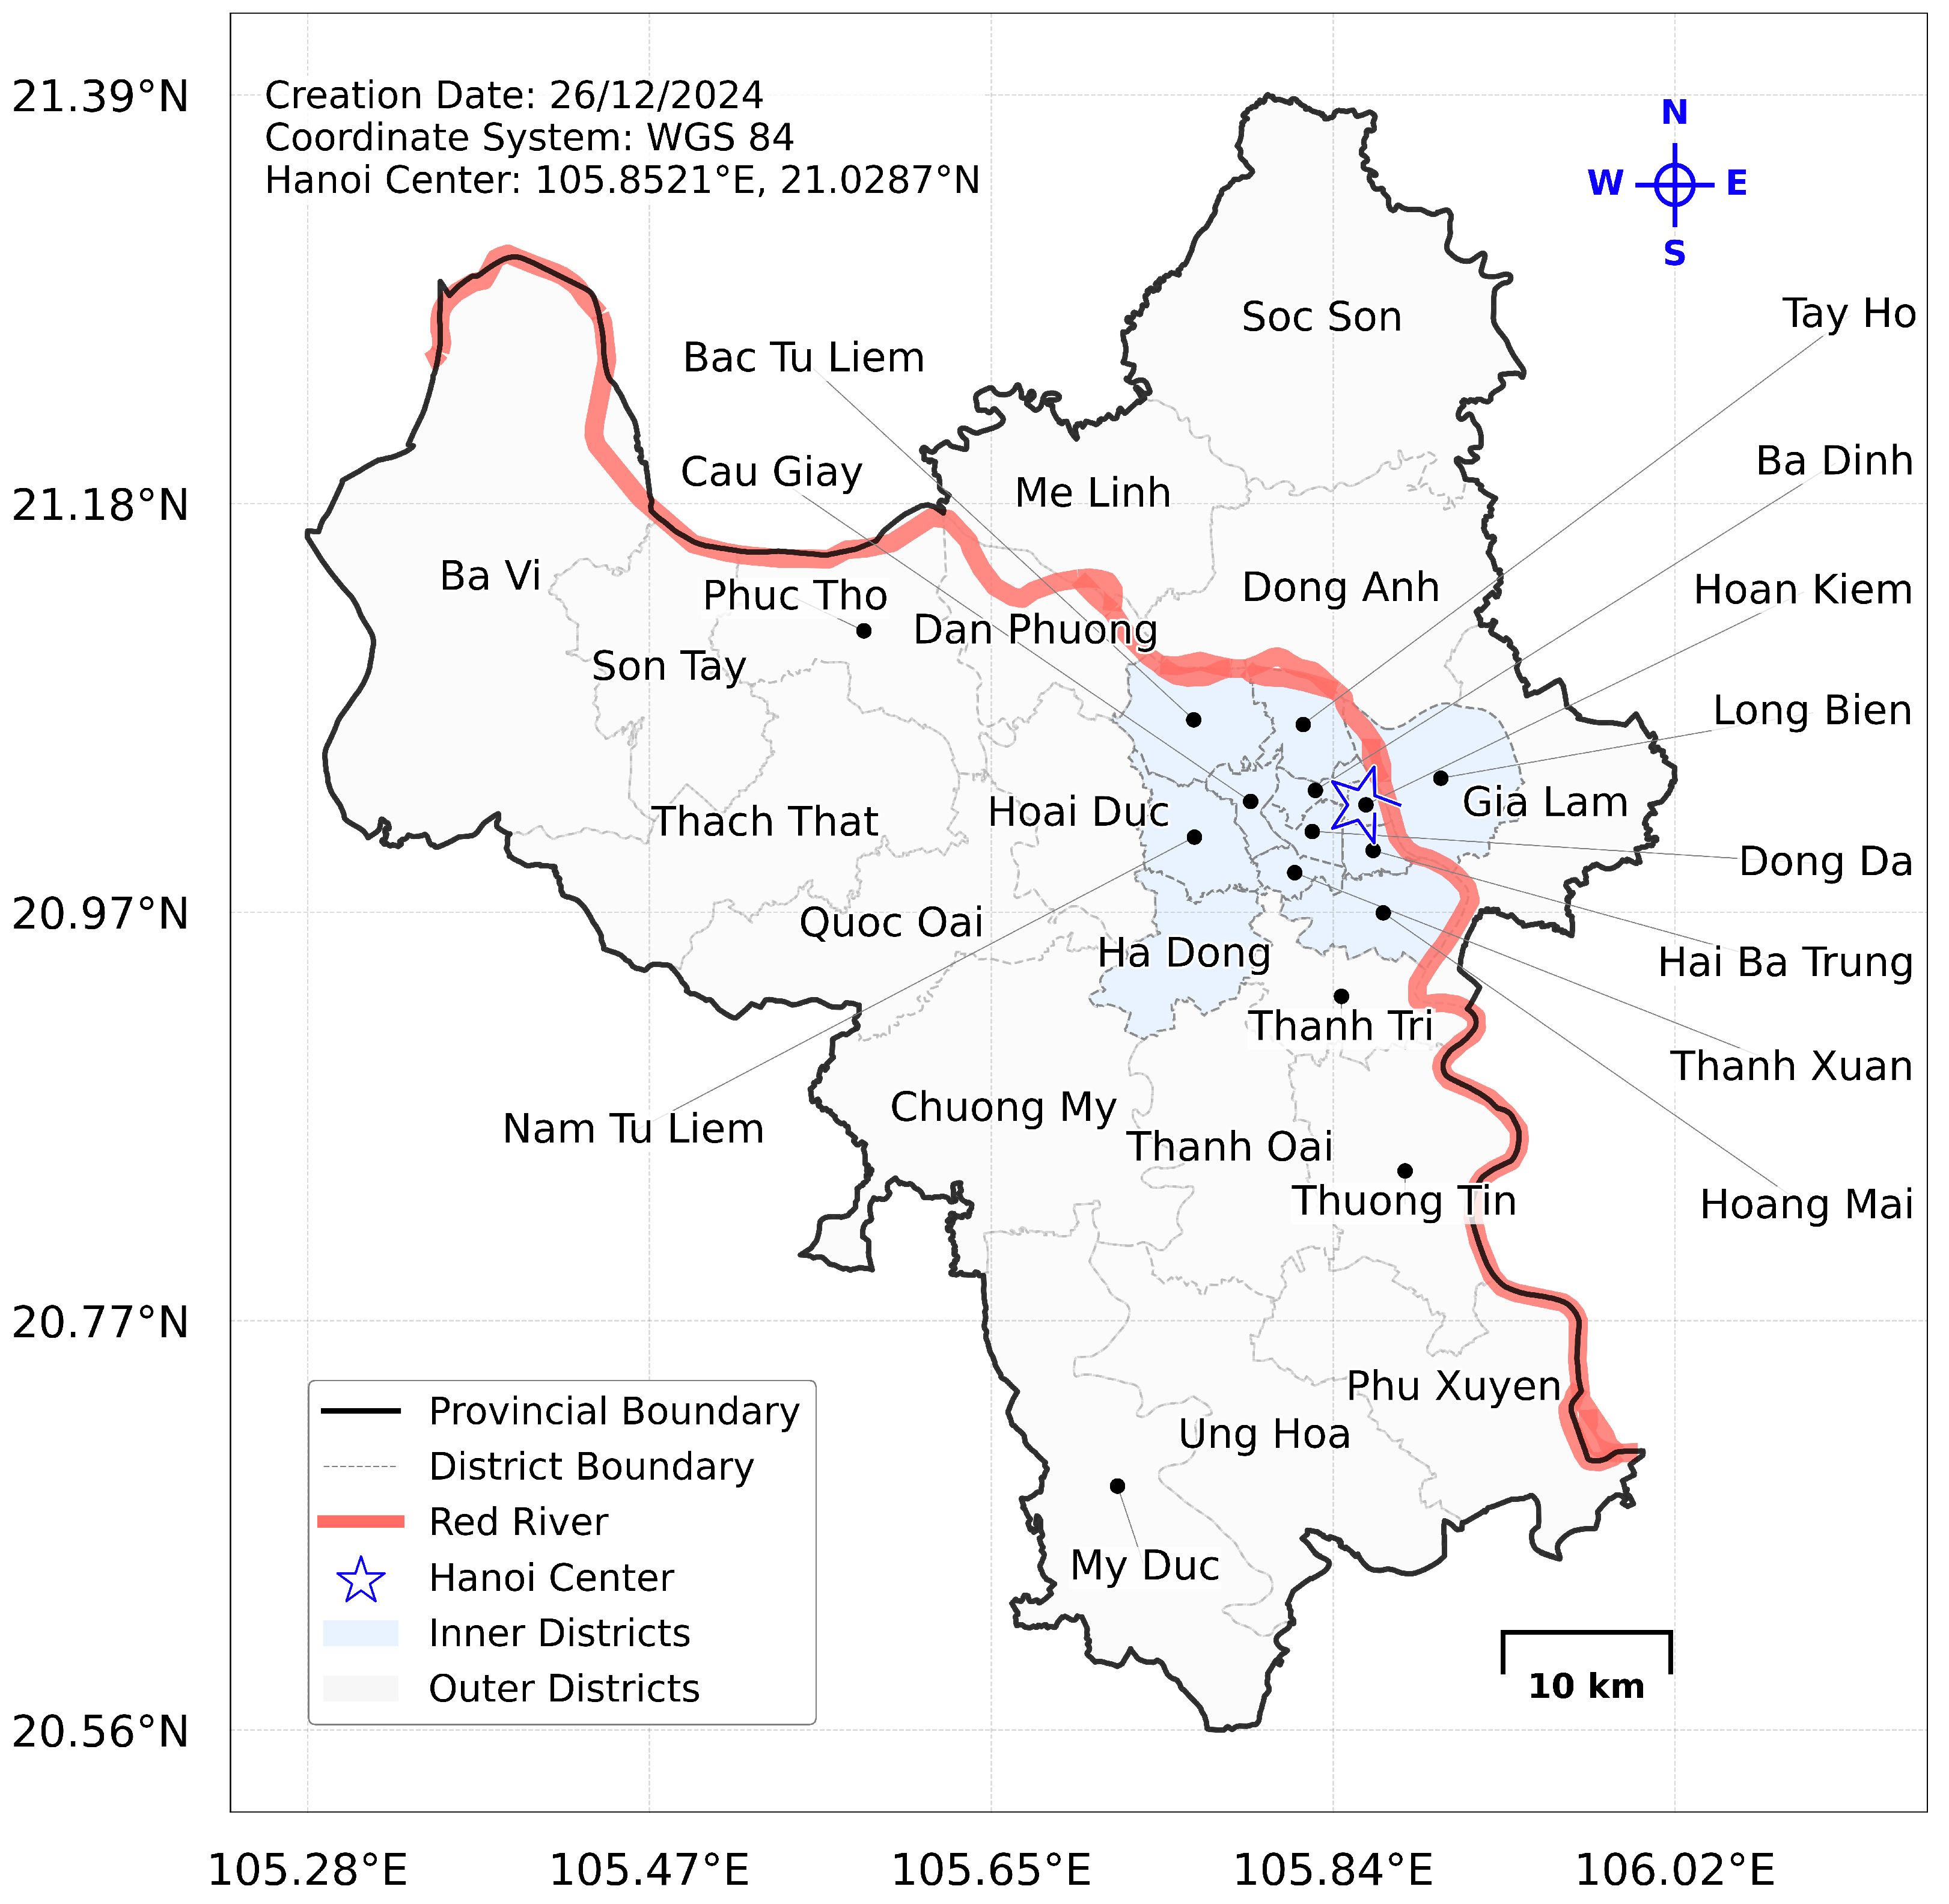
This study aimed to evaluate the performance of three satellite precipitation products, IMERG-Early, CMORPH-RT, and PDIR-Now, in estimating extreme rainfall associated with Super Typhoon Yagi in Hanoi, Vietnam. The specific objectives included analyzing the capability to capture the spatial–temporal characteristics of extreme rainfall, identifying the strengths and limitations of each product, and proposing methods to improve estimation accuracy. The research scope focused on the districts of Hanoi from 6 to 11 September 2024, utilizing data from the four satellite precipitation products according to the coordinates and observational data from 25 ground stations. Assessment was conducted through spatial analysis, temporal analysis, total rainfall amount, rainfall intensity, etc., for time intervals from 1 to 24 h. the research results aim to expand understanding of satellite precipitation product performance in estimating extreme rainfall from Super Typhoon Yagi, while providing scientific basis to enhance extreme rainfall monitoring and estimation accuracy, thereby contributing to disaster risk reduction.

2. Case Study, Materials, and Methods

2.1. Case Study

2.1.1. Study Area

Hanoi, Vietnam’s capital (21.0278°N, 105.8342°E), is located in the Red River Delta region (see Figure 1). The city spans 3342.92 km² with 30 subdivisions (12 inner districts and 18 outer districts) and 8.4 million inhabitants. The terrain comprises three main regions: mountainous areas (100–1300 m elevation), lowland plains (5–20 m elevation), and transitional hills, with the Red River as its primary water source. Characterized by a humid tropical monsoon climate with four distinct seasons, Hanoi has an average annual temperature of 23.6 °C (ranging from 6 °C in January to 40 °C in June). The city experiences 1800–2000 mm annual rainfall with 79% average humidity. Extreme weather events, particularly typhoons and tropical depressions, frequently occur from June to October.

2.1.2. Super Typhoon Yagi

Figure 2 illustrates Super Typhoon Yagi, the strongest typhoon in the South China Sea in 30 years, that formed on 1 September 2024, off the Philippines coast and impacted multiple Southeast Asian countries.
The storm intensified rapidly, increasing by 7 Beaufort levels [31] in 2 days, reaching super typhoon intensity (level 16, gusts > level 17) by 10 a.m. 5 September 2024. Yagi’s strong winds extended to a radius of 250 km (level 8), 150 km (level 10), and 80 km (level 12). Making landfall in Vietnam on 7 September 2024 for over 12 h, the maximum recorded winds reached level 14 (gusts to 17) at Bai Chay (Quang Ninh), level 13 (gusts to 14) at Bach Long Vi Island (Hai Phong), level 9 (gusts to 12) at Ba Lat (Thai Binh), level 12 (gusts to 13) at Hai Duong, and level 6 (gusts to 10) in Hanoi. Though dissipating by 8 September 2024 in the evening, the subsequent rainfall exceeded 200 mm/day across the northern provinces’ river basins for several days.
Super Typhoon Yagi struck Vietnam with unprecedented intensity, maintaining levels 12–14 near Quang Ninh and the Hai Phong coastline despite crossing Hainan Island. By 10 September 2024, the impact in northern Vietnam was severe (see Figure 3): 319 deaths, 26 missing, 1976 injuries, and 20 of 25 northern provinces affected. Approximately 3 million people lost access to safe drinking water, while 295,000 houses were damaged (42,000 destroyed), with total damage reaching USD 3.4 billion. Agricultural losses included 200,000 hectares of crops, 50,000 livestock, and 2 million poultry. In Hanoi specifically, there were 21 casualties, 24,800 fallen trees, 12 damaged 110 kilovolts (kV) power lines, and 32 locations with flooding exceeding 0.5 m, affecting 6521 houses; Chuong My district experienced the worst flooding, reaching a 1.5 m depth for several days.

2.2. Materials

2.2.1. Ground Observation Stations

As shown in Figure 4, this study employed 25 well-functioning automatic rain gauges from the Vietnam Rainfall Automatic Information Network (Vrain) monitoring system in Hanoi as ground truth reference data during Super Typhoon Yagi’s landfall. Each station comprised three key components: a rain sensor, a data logger, and a management platform. The system featured 10 min update cycles through SMS/GPRS/3G/4G transmission, allowing data collection in various intervals (1–24 h) via its cloud-based platform (see Table A1), ensuring reliable and rapid precipitation monitoring under extreme weather conditions.
A significant limitation of the current study was the absence of ground-based radar data in the research area. Ground-based radar plays a crucial role in evaluating satellite precipitation products due to its ability to provide precipitation information with high spatiotemporal resolution (on the order of minutes and hundreds of meters) [15,34]. Particularly during extreme weather events such as super typhoons, radar data can capture the detailed structures and rapid changes in precipitation systems that surface station networks often cannot fully detect [35,36]. The absence of radar data may affect the reliability of satellite product evaluation, especially in identifying spatial variations in high-intensity rainfall. Nevertheless, with a network of 25 Vrain stations distributed to cover area and terrain variations, combined with 10 min update cycles, this still provided valuable data that served as a good reference basis for comparative analysis.

2.2.2. Satellite Precipitation

IMERG-Early provides near-real-time global precipitation estimates with primary coverage between 60°N and 60°S. Using forward propagation due to the short latency, the dataset offers precipitation measurements at 0.1° (10 km) spatial resolution and 30 min temporal resolution. The data are available approximately 4 h after the observation time, making it suitable for rapid monitoring. Currently at Version 07B, IMERG-Early has been producing data from June 2000 to present, incorporating both the TRMM and GPM era observations. The product merges and intercalibrates multiple satellite microwave estimates with microwave-calibrated infrared (IR) satellite estimates [37].
CMORPH-RT produces global precipitation analyses between 60°N and 60°S at high spatial and temporal resolution. The product provides estimates at an 8 km (0.07277°) spatial resolution at the equator and 30 min temporal resolution [38]. While interpolated to 8 km grid spacing, the actual satellite-derived resolution is coarser (approximately 12 × 15 km). CMORPH-RT has been operational since 3 December 2002, with an 18 h latency. The technique uniquely uses precipitation estimates derived exclusively from low-orbit satellite microwave observations, with features transported via geostationary satellite IR data [17].
PDIR-Now, developed by the Center for Hydrometeorology and Remote Sensing at UCI, delivers global precipitation estimates for the region between 60°N and 60°S. The product features a fine spatial resolution of 0.04° × 0.04° (4 km × 4 km) and a temporal resolution of one hour. By utilizing high-frequency sampled IR imagery, PDIR-Now achieves remarkably short latency (30–60 min). The product is implemented on UCI’s iRain system and uniquely handles IR imagery uncertainties through dynamic Tb-R curve adjustments [39].

2.3. Methods

This study employed comprehensive statistical analyses to evaluate four satellite precipitation products during Super Typhoon Yagi, including spatial autocorrelation (Moran’s I), quantitative error metrics, and event detection indices. These methods were complemented with multi-temporal analyses across different accumulation periods (1–24 h) and detailed rainfall characteristic calculations to assess product performance under extreme typhoon conditions.

2.3.1. Moran’s I Index

Moran’s I is a statistical measure used to evaluate spatial autocorrelation, assessing whether values of a variable of interest tend to be clustered, dispersed, or randomly distributed across space [40,41]. The Moran’s I statistic is expressed by Equation (1):
M o r a n s I = ( N / W ) × ( i j w i j ( x i x ¯ ) ( x j x ¯ ) ) ( i ( x i x ¯ ) 2 )
where
N represents the number of observation points;
wij denotes the spatial weight between points i and j (typically distance-based);
W is the sum of all weights ( i j w i j );
xi and xj are the values at points i and j, respectively;
x ¯ represents the mean value of all points.
The index ranges from −1 to +1, where positive values (+) indicate clustered distribution, negative values (−) suggest dispersion, and values near 0 indicate random spatial distribution.

2.3.2. Quantitative Evaluation Indices

This group included three basic statistical indices evaluating precipitation estimation accuracy:
  • Correlation coefficient (CC):
    C C = C o v ( S , O ) / ( σ s × σ o )
    C o v ( S , O ) is the covariance between satellite precipitation (S) and observed precipitation (O); σ s and σ o are the standard deviations of satellite and ground-observed precipitation, respectively. CC values range from [−1 to 1], with CC = 1 indicating perfect correlation between the two data series.
  • Root Mean Square Error (RMSE):
    R M S E = [ ( S i O i ) 2 / n ]
    S i and O i are satellite- and ground-observed precipitation values at time i, respectively; n is the total number of value pairs. RMSE shares the same unit as the original data (mm/h), and values closer to 0 indicate higher accuracy of satellite precipitation estimates.
  • Relative bias (BIAS):
    B I A S = ( S i O i ) / n
    BIAS indicates whether the satellite product tends to overestimate or underestimate compared to actual observations, expressed as a percentage. Positive BIAS indicates an overestimation tendency, while negative BIAS indicates an underestimation tendency compared to observed values.

2.3.3. Event Detection Evaluation Indices

According to Wilks [42], these indices evaluate the ability to detect events exceeding extreme rainfall thresholds, based on Table 1.
H, M, F and N represent the number of correct detections, missed events, false alarms, and correct negatives of extreme rainfall threshold exceedances, respectively.
  • Probability of detection (POD):
    P O D = H / ( H + M )
    POD assesses the ratio of correctly detected extreme rainfall events, with values ranging from 0 to 1. POD = 1 indicates perfect detection capacity.
  • False alarm ratio (FAR):
    F A R = F / ( H + F )
    FAR measures the ratio of false predictions to total threshold exceedance predictions, with values ranging from 0 to 1. FAR = 0 is the ideal value.
  • Critical success index (CSI):
    C S I = H / ( H + M + F )
    CSI is a comprehensive index combining both POD and FAR to evaluate overall detection performance, with values ranging from 0 to 1. CSI = 1 indicates perfect detection performance.
The combination of POD, FAR, and CSI forms a complete evaluation index set for the detection capacity of extreme rainfall events [42,43].

2.3.4. Calculation of Rainfall Characteristics

  • Percentile precipitation threshold (Rp):
    Rp = x ÷ P ( X x ) = p
    Rp is the precipitation threshold at percentile p; p is the percentile value ( 0 < p < 1 ), e.g., p = 0.95 corresponds to R95p; x is the rainfall value at percentile threshold p; X is the dataset of rainfall values > 0 ; P ( X x ) is the probability that any rainfall value is less than or equal to x.
  • Total rainfall (TR):
    TR = 1 n R i
    TR is the total rainfall during the study period (mm); R i is the rainfall at time i (mm); and ∑ is the summation operator from i = 1 to n, where n is the total number of observations.
  • Rainfall intensity for accumulation period (RItw):
    RI tw = i = 1 n R i / tw
    RItw is the rainfall intensity for the accumulation period (mm/h); R i is the accumulated rainfall within time window t w (mm); tw is the time window (1 h, 3 h, 6 h, 12 h, 24 h); n is the number of values in the data series; i is the time step index (i = 1, 2, 3, ⋯, n).

3. Results

3.1. Spatiotemporal Distribution

3.1.1. Spatial Analysis

The analysis of 93 extreme rainfall events (R95p = 21.78 mm/h) recorded from 22 out of 25 monitoring stations demonstrated distinct spatial differentiation of these events (see 
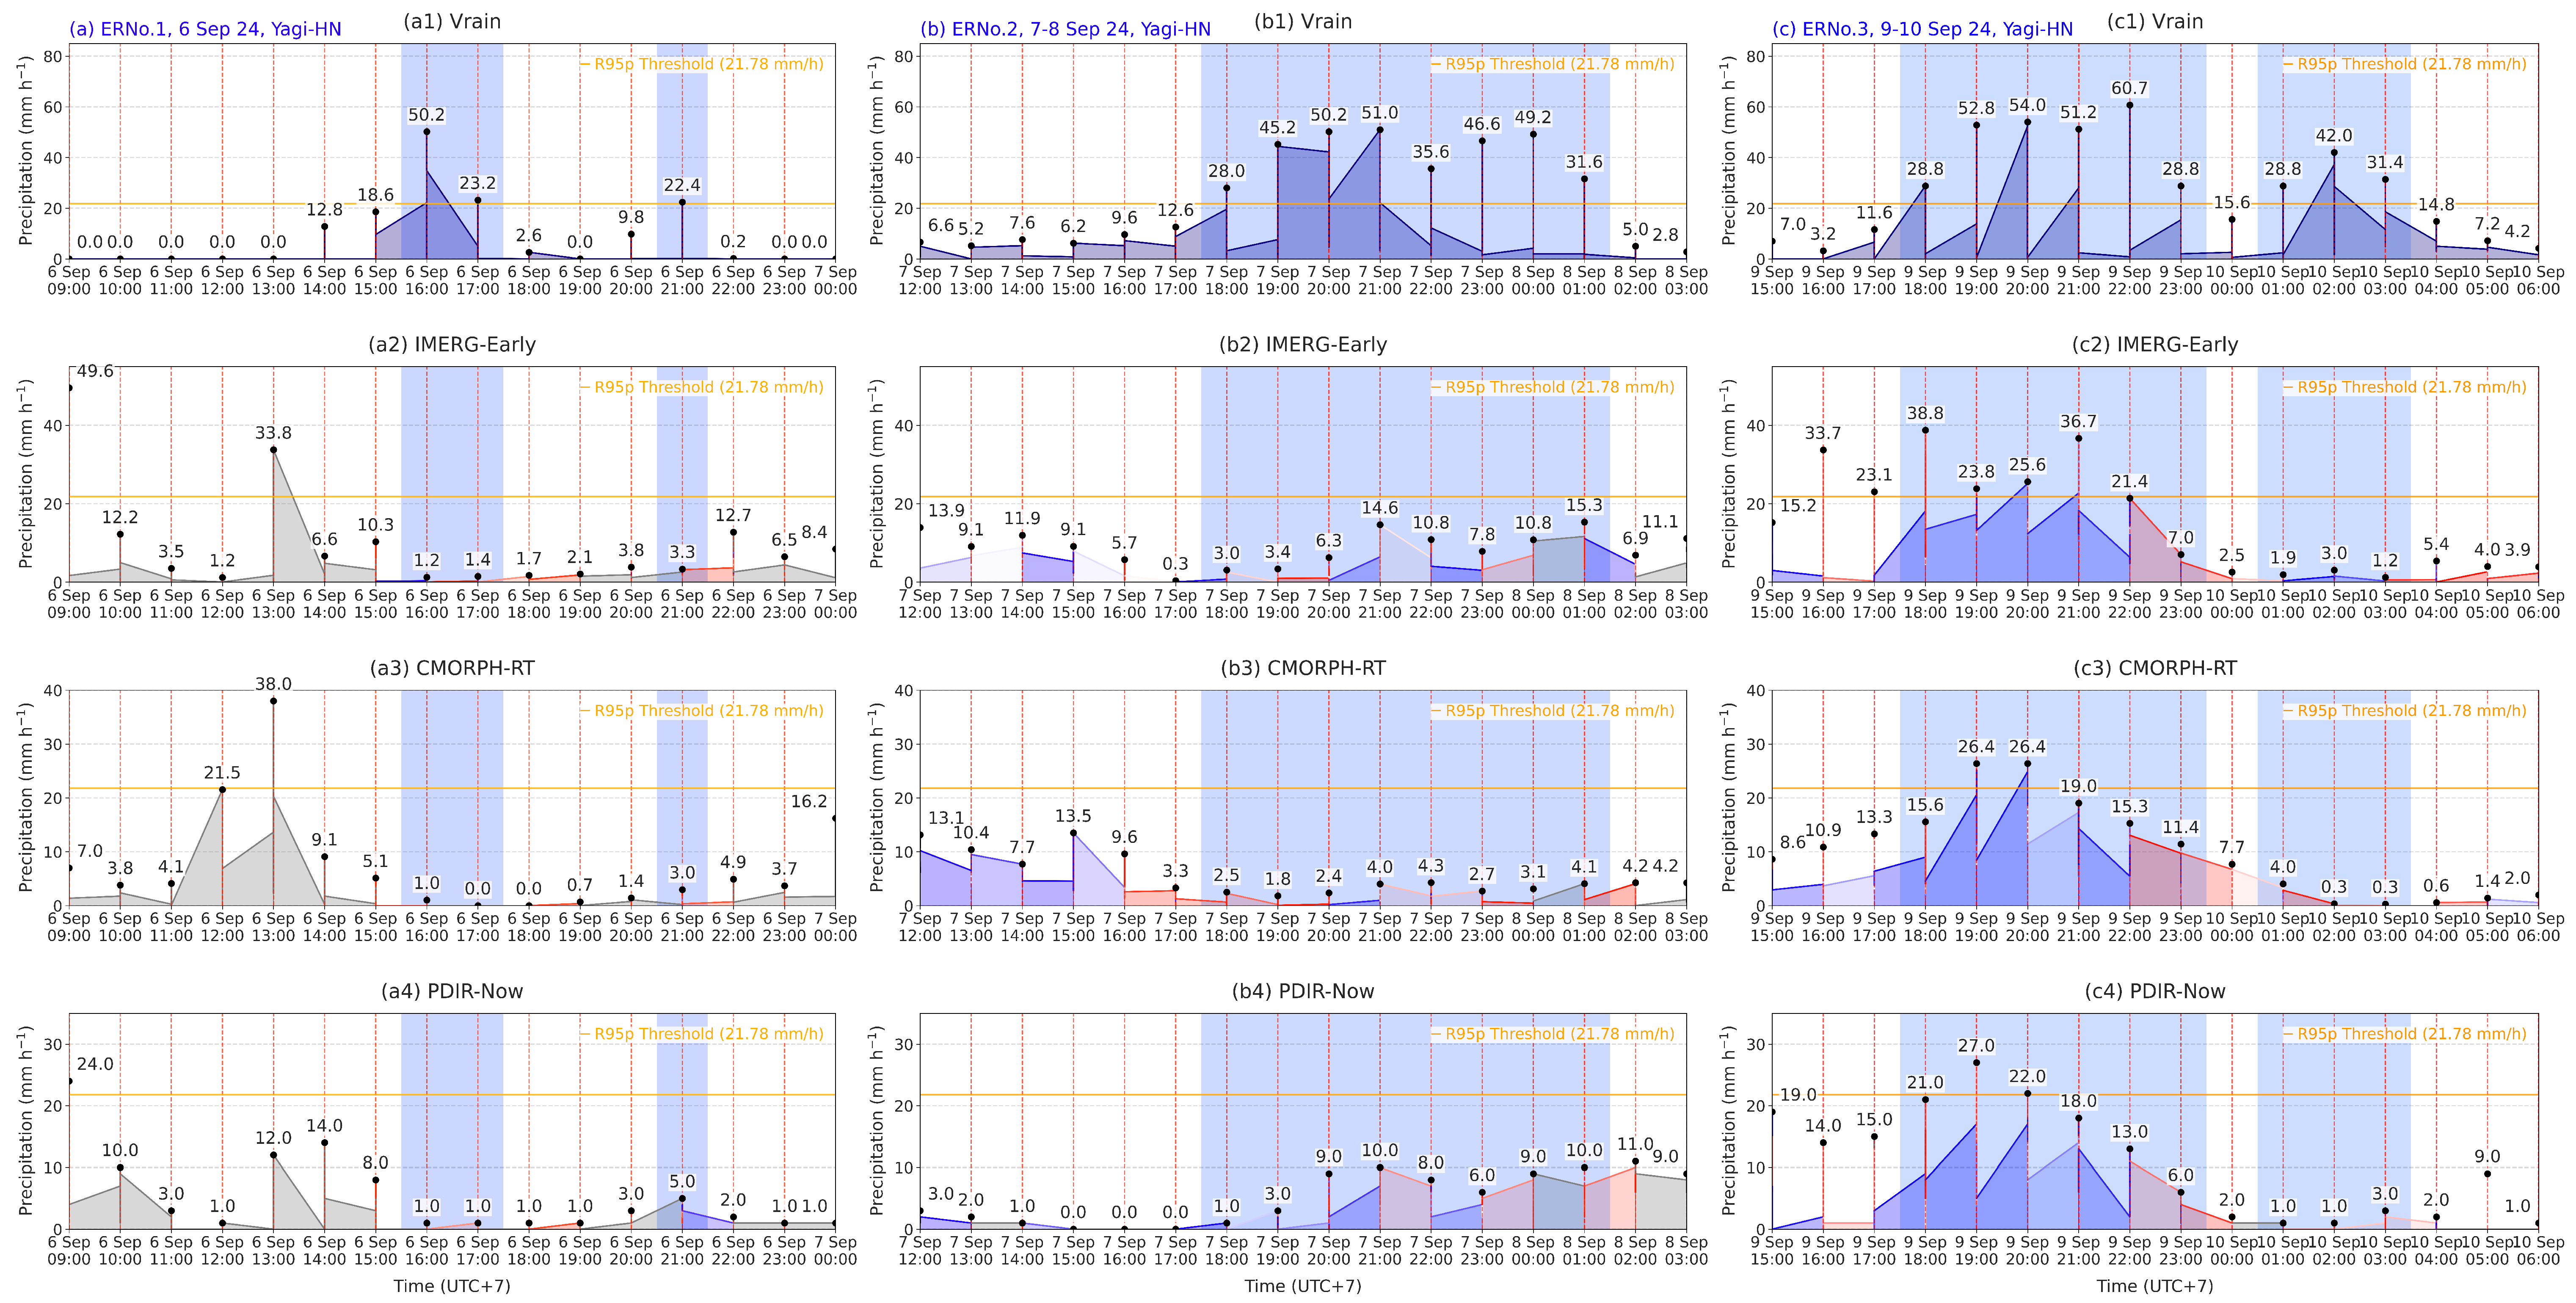
Table A3). In this study, we identified three significant extreme rainfall series during Typhoon Yagi’s active period. The first extreme rainfall series (abbreviation: ERNo.1) occurred on 6 September 2024, from 15:00 to 17:00, with a peak rainfall intensity of 50.2 mm/h. The second extreme rainfall series (ERNo.2) lasted from 19:00 on 7 September 2024 to 01:00 on 8 September 2024, reaching 51 mm/h. The third extreme rainfall series (ERNo.3) extended from 18:00 on 9 September 2024 to 03:00 on 10 September 2024, with 60.7 mm/h. As illustrated in Figure 5, when compared with Vrain, the satellite precipitation products demonstrate distinct temporal characteristics in recording these series.
From an alternative analytical perspective, the rainfall comparison charts (Figure 5(a5,b5,c5); details in Figure A1) visually represent precipitation data from VRain, IMERG-Early, CMORPH-RT, and PDIR-Now across 25 observation stations. During ERNo.1, satellite precipitation products severely underestimated extreme rainfall amounts, showing values near 0 mm compared to VRain’s multiple high peaks, particularly at the Huong Son and Cho Chay stations, with values of 50.2–40.6 mm (Figure 5(a5)). In ERNo.2, the satellite products demonstrate improved spatial pattern recognition, with values ranging from 4 to m10 mm, yet still substantially lower than VRain measurements at Quoc Oai, Chuc Son, Thanh Oai, and Thuong Tin, which recorded 51, 49.4, 50.2, and 48.4 mm, respectively (Figure 5(b5)). For ERNo.3, significant improvement in satellite rainfall estimates was evident (15.8–14.1 mm compared to VRain’s 60.7–17 mm at Huong Son and Cho Chay), accurately identifying the high-intensity rainfall core in Hanoi while maintaining strong spatial consistency with ground observations (Figure 5(c5)).
ERNo.1 (Figure 6a), all products show significant performance degradation. Moran’s I values decrease dramatically for PDIR-Now to 0.111 (Figure 6(a3)), IMERG-Early to 0.574 (Figure 6(a1)), and CMORPH-RT to 0.524 (Figure 6(a2)). Regression lines show nearly flat slopes (0–0.02) across all products, with strong negative correlations in IMERG-Early (CC = −0.673, Figure 6(a1)) and CMORPH-RT (CC = −0.428, Figure 6(a2)), while PDIR-Now (CC = −0.117, Figure 6(a3)) exhibits weak negative correlation.
For ERNo.2 (Figure 6b), there is a significant increase in the spatial correlation, with PDIR-Now showing superior spatial organization (Moran’s I = 0.82, Figure 6(b3)), IMERG-Early (Moran’s I = 0.767, Figure 6(b1)), and CMORPH-RT (Moran’s I = 0.645, Figure 6(b2)) also increasing substantially. However, the regression lines show nearly flat slopes (0–0.03), and correlation coefficients deteriorate across all products: PDIR-Now (CC = 0.078, Figure 6(b3)), IMERG-Early (CC = −0.12, Figure 6(b1)), and CMORPH-RT (CC = −0.146, Figure 6(b2)).
For ERNo.3 (Figure 6c), satellite products IMERG-Early (Moran’s I = 0.575, Figure 6(c1)), CMORPH-RT (Moran’s I = 0.466, Figure 6(c2)), and PDIR-Now (Moran’s I = 0.553, Figure 6(c3)) demonstrate moderate spatial correlation within a 60 km radius. Satellite products show relatively consistent performance, with slopes ranging from 0 to 0.2: IMERG-Early (CC = 0.522, Figure 6(c1)), PDIR-Now (CC = 0.51, Figure 6(c3)), and CMORPH-RT (CC = 0.25, Figure 6(c2)).
Spatial analysis reveals three key findings: (1) Moran’s I index shows the unstable capability of satellite products in capturing precipitation structures: PDIR-Now fluctuates from 0.820 to 0.111, IMERG-Early from 0.767 to 0.574, and CMORPH-RT from 0.645 to 0.466; (2) 60 km correlation analysis distinguishes two precipitation types: organized precipitation (ERNo.3) with gradual gradients (slopes 0–0.20, CC up to 0.522) is better captured by satellites than localized precipitation (ERNo.1,2) with abrupt variations (slopes 0–0.03, CC down to −0.673); (3) satellite products are more reliable in capturing widespread, organized precipitation systems but show significant limitations in measuring high-intensity localized rainfall, evidenced by large negative biases in ERNo.2 (CMORPH-RT: −22.903 mm, PDIR-Now: −17.456 mm, IMERG-Early: −16.576 mm).

3.1.2. Temporal Analysis

This study conducted multi-temporal analysis to evaluate the performance of satellite precipitation products in estimating the extreme rainfall from Super Typhoon Yagi. Specifically, from hourly rainfall data, this study calculated accumulated precipitation for 1, 3, 6, 12, and 24 h(s) intervals based on three primary factors: (1) typhoon rainfall characteristics with varying intensities and durations, ranging from short showers (1–3 h) to prolonged rainfall events (12–24 h); (2) practical application requirements, where hourly rainfall data play a crucial role in flash flood warnings, while 24 h accumulated data are more suitable for river flood forecasting and water resource management [44,45]; and (3) the temporal resolution of satellite precipitation products, with IMERG-Early and CMORPH-RT at 30 min and PDIR-Now at one hour. CCs were calculated in 6 h sliding windows, generating a series of CCs showing the temporal variation in the relationships between satellite and Vrain data. These CC values were normalized to [−1, 1] and converted to gradient color steps with five main levels: red for low correlation (−1 ≤ CC ≤−0.5), gray for weak correlation (−0.5 < CC < 0), light green for moderate correlation (0 ≤ CC < 0.5), turquoise for strong correlation (0.5 ≤ CC < 0.8), and navy for very strong correlation (0.8 ≤ CC ≤ 1). This method allows quick identification of time periods with high compatibility between data sources while highlighting times of significant differences.
The extreme rainfall threshold R95p (21.78 mm/h, Table A2 and Figure 7) is shown as a dark orange line, helping to evaluate each satellite precipitation product’s capability to detect major rainfall events. Among the three products, IMERG-Early demonstrated the best performance in capturing rainfall peaks, specifically detecting 49.6 mm/h, 26.2 mm/h, and 38.8 mm/h compared to Vrain of 50.2 mm/h, 51 mm/h, and 60.7 mm/h at ERNo.1, ERNo.2, and ERNo.3, respectively (Figure 7a,b).
The time lag analysis in Figure 7 and Figure 8 reveals distinct differences in the satellite products across the two analysis cases. Regarding peak rainfall intensity tracking for the three major events ERNo.1, ERNo.2, and ERNo.3 (Figure 8a and Table A5) (occurring at 16:00 on 6 September 21:00 on 7 September and 22:00 on 9 September 2024, with peak intensities of 50.2 mm/h, 51 mm/h, and 60.7 mm/h, respectively), IMERG-Early and PDIR-Now demonstrated early detection capability at peak 2 (+240 and +300 min, respectively) but showed delayed reporting at peaks 1 (−180 and −120 min, respectively) and 3 (−240 and −180 min, respectively). Meanwhile, CMORPH-RT consistently exhibited significant time lags (−180 min) across all three events. In analyzing a single extreme event (ERNo.3) during the night of 9 September 2024 (Figure 8b and Table A6) with three consecutive recorded rainfall peaks (22:00: 60.7 mm/h, 20:00: 54 mm/h, and 19:00: 52.8 mm/h), all products showed improvement in temporal accuracy. CMORPH-RT and PDIR-Now showed exceptional improvement, progressing from a −180 min lag at peak 1-3 (22:00) to achieving real-time detection (0 min lag) at peak 3-3 (19:00). IMERG-Early demonstrated gradual improvement in timing accuracy, reducing its lag from −240 min to −60 min across the peaks.
The above analysis only demonstrates the time lag analysis of satellite rainfall products tracking Vrain’s trend according to rainfall peaks during extreme events. Nevertheless, these differences suggest an optimal integration strategy for extreme rainfall monitoring. IMERG-Early and PDIR-Now can be utilized for early warning when they demonstrate advance detection of high-intensity events. CMORPH-RT and PDIR-Now show high reliability in he real-time monitoring of event evolution, particularly as their time lag decreases.

3.2. Basic Characteristics of Extreme Rainfall

3.2.1. Total Rainfall

Based on the total rainfall throughout the study period and the quantitative analysis of the rainfall intensity across different time windows (1 h, 3 h, 6 h, 12 h, and 24 h) (Figure 9), the results reveal significant variations among the precipitation estimation products. During the analysis period from 00:00 on 6 September 2024 to 00:00 on 12 September 2024 at 25 stations in Hanoi, the IMERG-Early product shows consistent overestimation across all time scales, with a total rainfall (Equation (9)) of 14,090.6 mm, substantially exceeding the Vrain observations of 9159.2 mm by 53.8%. The CMORPH-RT product demonstrates remarkable alignment with ground observations, recording 9172.82 mm (merely 0.1% higher than ground observations), while PDIR-Now shows a slight underestimation with 8921.00 mm (2.6% lower).
The temporal analysis reveals (Equation (10)) distinct patterns across different temporal scales. For short durations (1–3 h), while all products underestimate rainfall, IMERG-Early shows relatively better performance among the considered satellite products. In the medium duration range (6–12 h), IMERG-Early shows significant overestimation (approximately 250 mm compared to Vrain’s 200mm at 12 h), while PDIR-Now and CMORPH-RT maintain impressive accuracy with measurements closely aligned with the observed values. For the long duration (24 h), IMERG-Early continues its trend of overestimation (approximately 280 mm compared to Vrain’s 210 mm), while both PDIR-Now (approximately 195 mm) and CMORPH-RT demonstrate closer alignment with ground observations.
These findings suggest specific optimal applications for different products based on their performance characteristics. For short-term (1–3 h) precipitation monitoring and urban flood early warning systems, while all products show underestimation, IMERG-Early demonstrates relatively better performance. For medium-term (6–12 h) regional flood forecasting, PDIR-Now and CMORPH-RT demonstrate the most reliable accuracy, with both products showing particularly strong performance in the 12 h duration. For long-term (24 h) flood risk management, a comprehensive approach utilizing PDIR-Now and CMORPH-RT would be most effective, as these products maintain the closest accuracy to ground observations at this timescale. This multi-product approach would provide more robust and reliable precipitation monitoring, benefiting from the complementary strengths of each product while mitigating their individual limitations. The selection of appropriate precipitation products should be carefully considered based on the specific requirements of the application, particularly regarding temporal resolution and accuracy needs.

3.2.2. Extreme Rainfall Threshold Analysis

In extreme rainfall analysis, two primary methodologies are employed for threshold determination: relative thresholds based on statistical percentiles or return periods (Equation (8)) and absolute thresholds (e.g., 50.8 mm/day in the United States, 100 mm/day in China). This study adopted the relative threshold approach using statistical percentile-based criteria, as it better captured local climate characteristics and precipitation variability while facilitating effective inter-regional comparisons across diverse rainfall regimes and temporal scales [6,46]. This methodology, recommended by the World Meteorological Organization [47], is consistently applied in evaluating satellite precipitation product performance across multiple temporal resolutions (including time windows of 1, 3, 6, 12, and 24 h). The assessment incorporates comprehensive percentile analysis as shown in Table A7, specifically examining both lower percentile (R1p, R5p, R10p) and upper percentile (R90p, R95p, R99p) threshold characteristics to evaluate rainfall intensity capture by satellite products against ground observations [6].
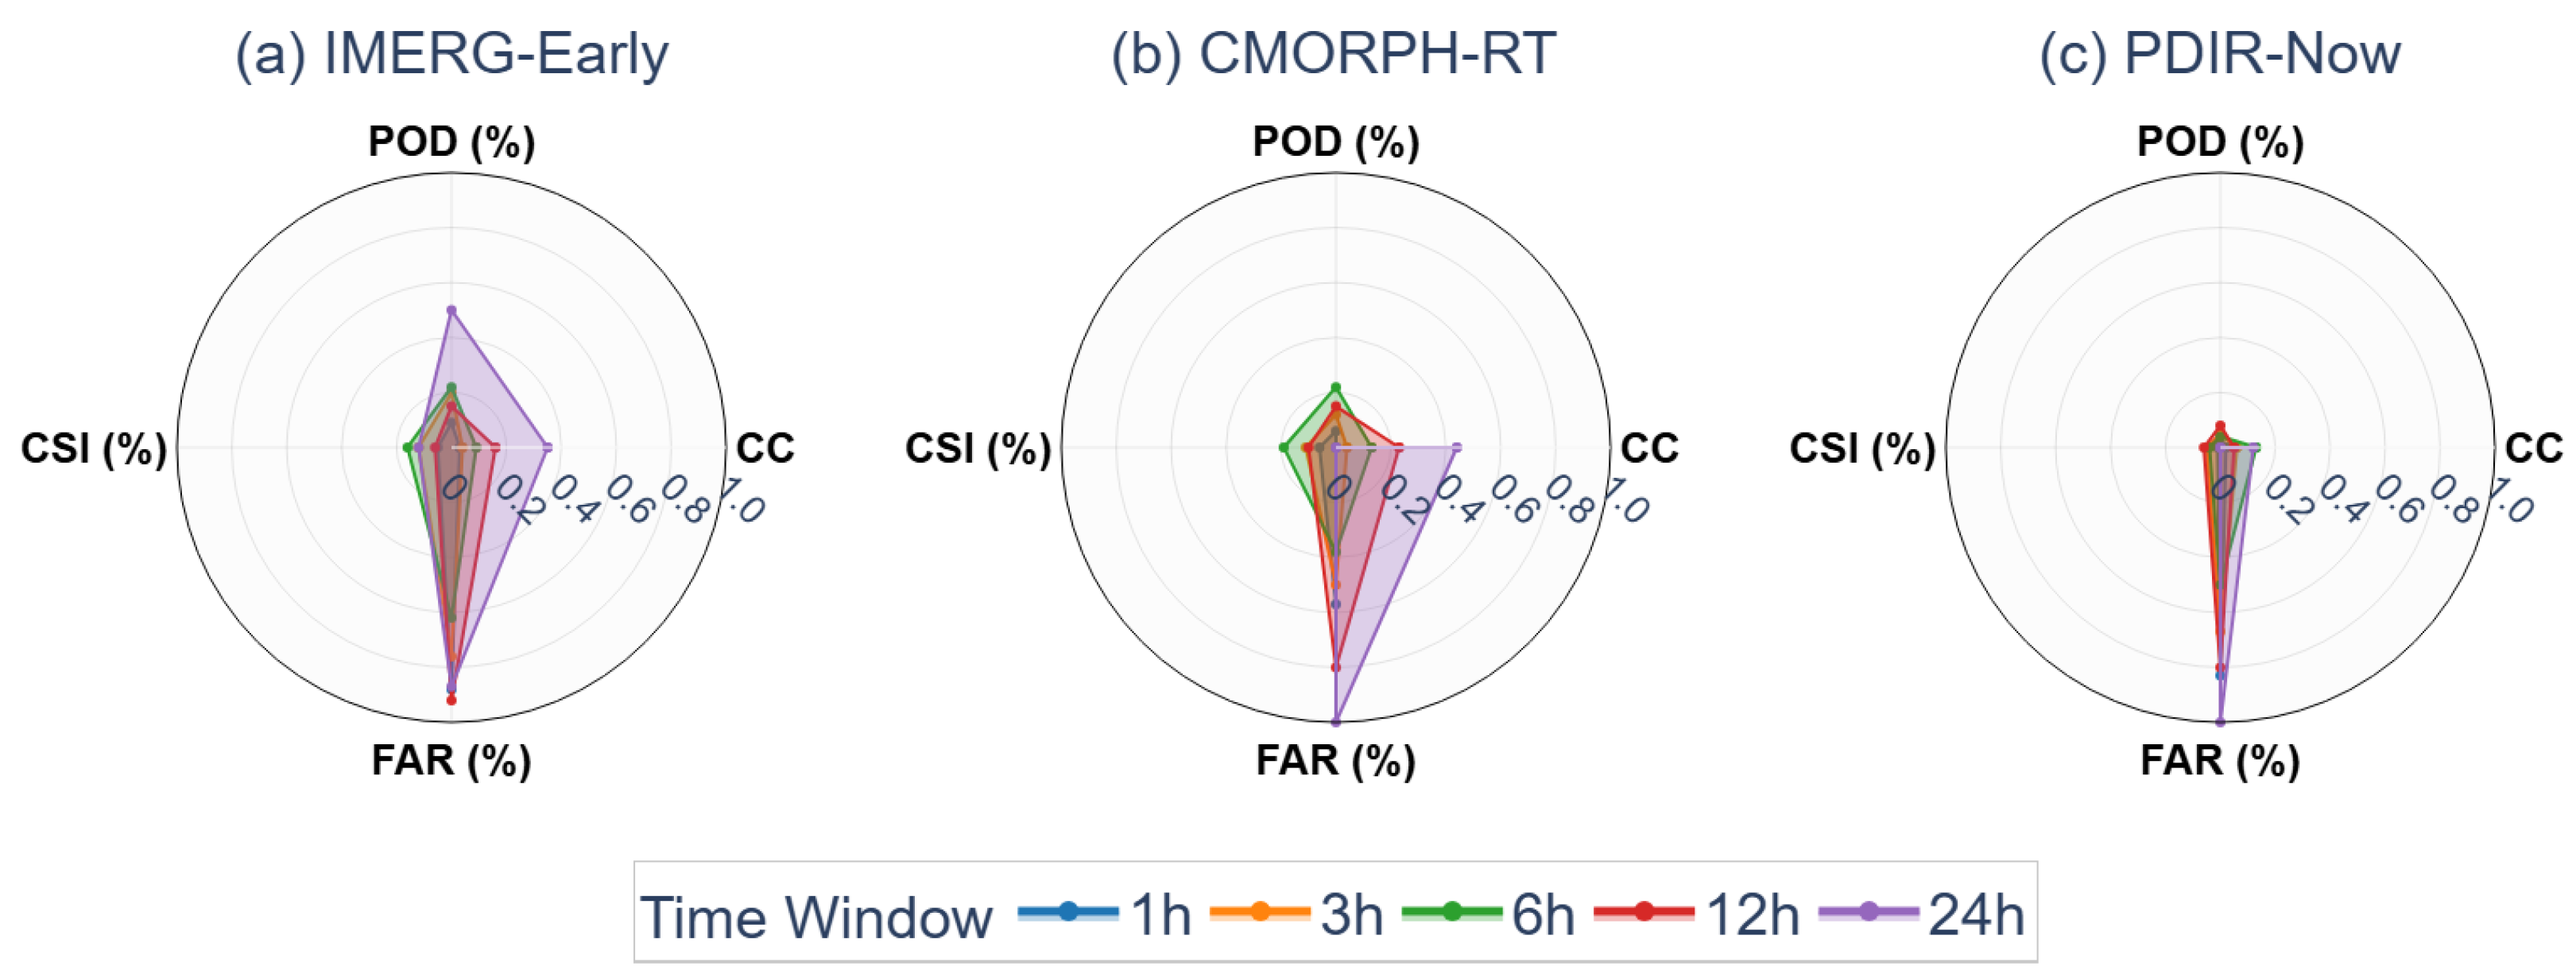
Quantitative analysis of rainfall detection capabilities across satellite products reveals distinct performance patterns across temporal scales (Figure 10 and Table A7). For 1 h windows, CMORPH-RT shows superior performance in light rainfall (R1p–R10p = 0.2 mm/h) with a 48.3% detection rate, followed by PDIR-Now (39.1%). However, this performance advantage diminishes with increasing time windows, dropping to 33.4% for 6 h and 13.9% for 12 h windows.
For heavy rainfall (R90p), detection capabilities improve with longer time windows. IMERG-Early and CMORPH-RT show comparable performance for 6 h windows (16.5% and 16.2% respectively), while for 24 h windows, IMERG-Early achieves its best performance with a 46.9% detection rate.
For extreme rainfall (R95p), IMERG-Early maintains relatively consistent detection rates across 3–6 h windows (15–17%), while other products show declining performance. Notably, for very extreme events (R99p), detection becomes challenging across all time windows, with only IMERG-Early showing capability (44.4%) for 24 h windows.
These findings suggest that satellite product selection should consider temporal resolution: CMORPH-RT excels in short-term light rainfall detection, IMERG-Early proves more reliable for heavy rainfall across longer time windows, while PDIR-Now shows moderate but consistent performance for light to moderate rainfall. The results highlight the need to improve detection algorithms, particularly for extreme rainfall events at shorter time scales.

3.3. Error and Uncertainty Analysis

The error and uncertainty analysis of satellite-based precipitation products in estimating extreme rainfall reveals significant challenges in accurately capturing high-intensity precipitation events (Table A2). Specifically, this is demonstrated by three key evaluation metrics: CC (Equation (2)), RMSE (Equation (3)), and BIAS (Equation (4)).
Firstly, the correlation coefficients are low across all products, particularly for short time intervals (1–6 h) with CCs < 0.15, indicating difficulties in capturing the short-term dynamics of extreme precipitation. All three satellite products show only modest improvement with temporal aggregation. This suggests that satellite-based precipitation products have limitations in reflecting the dynamic characteristics of extreme rainfall events.
Secondly, RMSE increases with temporal scale, reflecting the cumulative nature of precipitation estimation errors. On the 1 h scale, products show relatively uniform RMSE values (7.82–8.69 mm); however, this disparity widens considerably at the 24 h scale, with IMERG-Early showing the highest error (76.75 mm). This indicates that product reliability decreases substantially when estimating large accumulated rainfall amounts.
Finally, regarding BIAS, IMERG-Early demonstrates a clear overestimation tendency (53.84), while PDIR-Now shows a slight underestimation (−2.60). CMORPH-RT exhibits the most neutral bias (0.15), suggesting a balance between overestimation and under estimation. These figures indicate that satellite rainfall estimation algorithms still require calibration to better capture the intensity of extreme precipitation events.

3.4. Event-Specific Performance

The analysis of extreme rainfall event detection performance from three datasets reveals a strong correlation between accuracy and accumulation time scales (Equations (5)–(7)). The number of detected extreme rainfall events decreases with the temporal scale from 93 events for 1 h to 8 events for 24 h intervals, while detection performance significantly improves (Table A2).
At short time scales (1 h), despite the high number of events (93), the coincident detection rates remain limited: IMERG-Early is the highest at 8.60%, followed by CMORPH-RT at 6.45%, and PDIR-Now at merely 1.08%. However, for longer intervals (24 h) with eight events, the performance notably improves: IMERG-Early reaches 50%, while CMORPH-RT and PDIR-Now show no detection capability.
The performance diagrams (Figure 11) clearly illustrate this trend through the movement of evaluation points toward the upper right corner with increasing accumulation periods, particularly evident in the 24 h curves of IMERG-Early. However, enhanced performance at longer time scales comes with certain limitations: IMERG-Early exhibits a high FAR (0.87) and overestimation tendency (220.68 mm compared to the observed threshold of 158.74 mm for the 24 h series), while CMORPH-RT demonstrates better balance with lower FAR (0.38 for 6 h series) despite POD ranging only from 0.06 to 0.22.
These findings emphasize that satellite-based products demonstrate superior capability in capturing long-duration accumulated rainfall events, while significant challenges remain in accurately detecting short-duration, high-intensity extreme rainfall events.

3.5. Extreme Rainfall Characteristics Along Typhoon’s Impact Direction

After making landfall in Quang Ninh, Hai Phong, and Thai Binh provinces, Super Typhoon Yagi tracked west–northwestward across Hai Duong and Hung Yen provinces before its eye directly impacted Hanoi on 7 September 2024 (Figure 12). However, one day prior to the eye’s arrival in Hanoi, the Vrain stations had already recorded extreme rainfall events due to the typhoon’s outer rainbands.
The analysis of extreme rainfall events at six Vrain stations (Huong Son, Cho Chay, Phu Xuyen, Thuong Tin, Thanh Tri, and Trau Quy) (Figure 4)—which were the initial ground-based rain gauge stations to interact with Super Typhoon Yagi—revealed differential effects of the super typhoon on precipitation patterns across Vrain stations in terms of the number of extreme rainfall events, rainfall intensity, precipitation hours, and total rainfall accumulation (Figure 13 and Table A3). Thanh Tri and Thuong Ti recorded the highest number of extreme rainfall hours (9 h) with a significant increase (+141.9%) compared to the baseline level, accompanied by high precipitation frequency (6.25%) and substantial total rainfall accumulation (302.8 mm and 337.2 mm, respectively). Notably, at Huong Son station, located adjacent to mountainous terrain, not only recorded the highest instantaneous rainfall intensity (60.7 mm/h, +38.3%) but also registered two-thirds of the most severe extreme events (ERNo.1 and ERNo.3), accumulating 277.9 mm of total rainfall, which is consistent with the rainfall study results in windward slope areas by Chen et al. [10]. Meanwhile, Trau Quy station, situated on the peripheral track of the typhoon, demonstrated significant decreases across all indicators: rainfall intensity (−1.8%), lowest total rainfall accumulation (28.2 mm), and lowest frequency of extreme precipitation events (0.69%, −73.1%). This pattern is further confirmed by the substantial difference in extreme rainfall hours between the initial typhoon interaction stations (averaging 5.7 h) compared to the remaining stations (3.1 h), thereby clearly reflecting the decisive role of geographical location (through the distribution of monitoring stations) along the typhoon’s track in determining the magnitude of extreme rainfall impacts.
Regarding three satellite products, the analysis of extreme rainfall detection rates (R95p) at six initial interaction stations with Super Typhoon Yagi shows a strong correlation with the time lag. Combined with the time lag analysis of the satellite products during Super Typhoon Yagi (Figure 8a), IMERG-Early and CMORPH-RT, with lower time lags (−180 to +240 min), demonstrated the best detection capability, although still very limited. Specific calculations at the three stations with the most extreme events (Thuong Tin, Thanh Tri: nine events and Huong Son: seven events, Table A3) revealed that CMORPH-RT detected 3/25 events (12.0%), with the best performance at Thuong Tin station (2/9 events, 22.2%), IMERG-Early only detected 2/25 events (8.0%). Meanwhile, PDIR-Now with larger and unstable time lags (−360 to +300 min), failed to detect any extreme rainfall events. This was particularly evident during the extreme rainfall event on 9 September 2024, when all products showed negative time lags, resulting in significant negative intensity biases (−72% to −100%) compared to Vrain. These results indicate that large time lags are a primary factor limiting satellite products’ ability to detect and accurately estimate extreme rainfall intensities under strong typhoon conditions.

4. Discussion

The algorithmic structure of satellite precipitation products largely explains the performance differences observed in this study. CMORPH-RT, with its "morphing" technique, provides temporal stability but tends to smooth spatial extremes due to interpolation processes; PDIR-Now, utilizing high-frequency IR imagery with dynamic Tb-R curve adjustments, exhibits high sensitivity to abrupt changes in precipitation fields; while IMERG-Early, with its multi-satellite approach, better preserves extreme values but sacrifices temporal consistency.
The improvement in time lag during the ERNo.3 (Figure 8) sequence suggests an adaptive capability of satellite algorithms when sufficient data on evolving precipitation systems accumulates. However, this capability does not manifest in the initial phases when early forecast information is most critical, creating significant challenges for developing effective early warning systems [13].
The compensation effect in the CMORPH-RT estimates (error of only +0.1% in total rainfall) reflects a balance between the overestimation of light rainfall and the underestimation of heavy rainfall, rather than the accurate measurement of individual events. This suggests that satellite products need to upgrade their algorithms’ ability to consider the ability to capture temporal-intensity distribution patterns, not just cumulative totals.
Poor performance in the initial impact areas of the typhoon reveals challenges of transitional atmospheric conditions when typhoons interact with topography. Current satellite algorithms in this study, predominantly calibrated for oceanic conditions, have not yet adequately addressed the complex interactions between wind, moisture, and mountainous or coastal terrain, this analytical result aligns with several previous studies [8,10].
The temporal performance patterns of these products suggest the need for multi-scale warning systems (1–3–6–12–24 h) with different integration strategies, which will be outlined in the conclusions. Therefore, we believe that future research should focus on the physical mechanisms affecting satellite detection capabilities under super typhoon conditions and developing adaptive correction algorithms for different typhoon phases. Additionally, incorporating ground-based radar data would enable detailed analysis of raindrop structures and signal scattering, thereby improving algorithmic performance under extreme rainfall conditions.

5. Conclusions and Recommendations

This study evaluated three satellite-based precipitation products (IMERG-Early, CMORPH-RT, and PDIR-Now) for extreme rainfall estimation during Super Typhoon Yagi in Hanoi, validated against Vrain.
In terms of spatial distribution, the satellites showed varying capabilities across events: PDIR-Now demonstrated the highest but most unstable performance (Moran’s I fluctuating from 0.82 in ERNo.2 to 0.111 in ERNo.1); IMERG-Early and CMORPH-RT showed moderate variability (Moran’s I ranging from 0.767 to 0.574 and 0.645 to 0.466, respectively). Regarding temporal lag analysis, IMERG-Early and PDIR-Now exhibited premature detection for ERNo.2 rainfall peak, occurring 240–300 min before the actual event; however, these same products lagged behind by 120–240 min when detecting ERNo.1 and ERNo.3 rainfall peaks; meanwhile, CMORPH-RT demonstrated consistent detection delays of around 180 min throughout all three extreme rainfall events. With respect to single-event analysis (ERNo.3), all products showed improved temporal accuracy, with CMORPH-RT and PDIR-Now demonstrating the most significant improvement, progressing from a 180-min lag at the first peak (22:00) to real-time detection (0 min lag) at the final peak (19:00). Additionally, IMERG-Early gradually improved its accuracy, reducing lag from 240 to 60 min. In terms of total rainfall, CMORPH-RT achieved the highest accuracy (error +0.1%), while IMERG-Early showed the largest overestimation (+53.8%). As for rainfall intensity, CMORPH-RT performed best in light rainfall detection at the 1 h scale (48.3% below R10p); nevertheless, none of the products could detect rainfall above the R99p = 41.69 mm/h. Furthermore, in the typhoon’s initial impact areas, CMORPH-RT and IMERG-Early showed the best detection capability, though success rates remained low (12% and 8% respectively). Based on these findings, this study proposes an integrated approach using multiple satellite products across different time scales to optimize rainfall estimation. For 1–3 h, combining PDIR-Now and IMERG-Early is recommended to leverage their heavy rainfall detection capability, though temporal lag issues must be considered; for 6–12 h, using IMERG-Early and CMORPH-RT will better track rainfall system evolution; for longer time scales (24 h), CMORPH-RT is recommended for its high accuracy in total rainfall estimation.
Regarding recommendations to improve extreme rainfall estimation accuracy, three key enhancements are proposed based on the analysis: (1) development of a time lag correction algorithm considering rainfall intensity and extreme event patterns, as shown in the event-specific analysis (ERNo.3) where temporal accuracy improved significantly; (2) implementation of weighted integration methods based on each product’s strengths using IMERG-Early’s capability to capture rainfall intensity, CMORPH-RT’s high total rainfall accuracy (+0.1%), and PDIR-Now’s superior spatial structure detection (Moran’s I = 0.82); and (3) enhancement in extreme rainfall detection capabilities through consideration of station locations and local topography, particularly important for initial impact areas where detection rates were notably low (8–12%) despite extreme rainfall records (up to 60.7 mm/h at Huong Son station located adjacent to the windward slope area). As part of future research, other satellite-based precipitation products, such as GSMaP NOW, CHIRPS, SM2RAIN-ASCAT, and MSWEP, as well as those derived from satellites like Himawari-9, GK-2B, and FY-4B (including AGRI and GIIRS), will also be explored for their potential in extreme rainfall monitoring.

Author Contributions

Methodology and writing—original draft, V.D.N.; formal and data analysis, N.R., V.D. and F.A.; funding acquisition, F.A.; conceptualization and research ideas, P.N.; supervision and research progress management, S.S.; writing—review and editing, all authors, with significant contributions from N.R. and V.D. All authors have read and agreed to the published version of the manuscript.

Funding

This research was funded by King Saud University, Riyadh, Saudi Arabia, grant number RSDP2024R896.

Data Availability Statement

The raw data supporting the conclusions of this article will be made available by the authors upon request, with the exception of rainfall measurements from the 25 gauge stations in Hanoi, Vietnam.

Acknowledgments

This study was supported by VNMHA, CHS-UCI, and DHWC. The authors thank VNDMS for typhoon tracking data, the Vietnam Northern Delta Regional Hydrometeorological Station, and National Centre for Hydro-Meteorological Network for rain gauge data (researched and installed by WATEC). We appreciate NASA, NOAA, CHRS-UCI, and JAXA for providing satellite rainfall products (IMERG-Early, CMORPH-RT, PDIR-Now, and 30 m DSM), and Hanoi’s local authorities and meteorological stations for their data collection support during Super Typhoon Yagi.

Conflicts of Interest

The authors declare no conflicts of interest.

Abbreviations

4D-VarFour-Dimensional Variational Data Assimilation
AGRIAdvanced Geostationary Radiation Imager
BIASRelative Bias
CCCorrelation Coefficient
CHCClimate Hazards Center
CHRSCenter for Hydrometeorology and Remote Sensing
CMORPHClimate Prediction Center Morphing Technique
CSICritical Success Index
CVCoefficient of Variation
DEMDigital Elevation Model
DSMDigital Surface Model
DHWCDepartment of Hydraulic Works and Construction of Vietnam
ECMWFEuropean Centre for Medium-Range Weather Forecasts
ESAEuropean Space Agency
FARFalse Alarm Ratio
GIIRSGeostationary Interferometric Infrared Sounder
GPMGlobal Precipitation Measurement
GPRSGeneral Packet Radio Service
GSMaPGlobal Satellite Mapping of Precipitation
hHour
IMERG-Early         Integrated Multi-satellitE Retrievals for Global Precipitation Measurement Early Run
IPCCIntergovernmental Panel on Climate Change
JAXAJapan Aerospace Exploration Agency
MSWEPMulti-Source Weighted-Ensemble Precipitation
NASANational Aeronautics and Space Administration
NOAANational Oceanic and Atmospheric Administration
PDIR-NowPrecipitation Estimation from Remotely Sensed Information using Artificial Neural Networks-Now
PODProbability of Detection
RI w Rainfall Intensity for Accumulation Period
RMSERoot Mean Square Error
RpPercentile precipitation threshold
SM2RAIN-ASCATSoil Moisture to Rain-Advanced Scatterometer
SMSShort Message Service
TbBrightness Temperature
TCsTropical Cyclones
TRTotal rainfall
UCIUniversity of California, Irvine
USGSUnited States Geological Survey
UTMUniversal Transverse Mercator
VDMSVietnam Disaster Management System
VNMHAVietnam Meteorological and Hydrological Administration
VrainVietnam Rainfall Automatic Information Network
WATECWater Resources Engineering and Technology Joint Stock Company
WGS84World Geodetic System 1984
WMOWorld Meteorological Organization

Appendix A

Appendix A.1. Appendix Tables

Table A1. Satellite and Vrain dataset in Hanoi, 6–11 September 2024 (Unit: mm/h).
IDGaugeProvinceY(WGS84)X(WGS84)DateTimeVrainIMERG-EarlyCMORPH-RTPDIR-Now
1Phu XuyenHanoi 20.735993 105.914119 0600:00:000001.00
1Phu XuyenHanoi 20.735993 105.914119 0601:00:00008.620
1Phu XuyenHanoi 20.735993 105.914119 0602:00:000000
1Phu XuyenHanoi 20.735993 105.914119 0603:00:00006.470
1Phu XuyenHanoi 20.735993 105.914119 0604:00:000000
1Phu XuyenHanoi 20.735993 105.914119 0605:00:00009.290
1Phu XuyenHanoi 20.735993 105.914119 0606:00:0000.3700
1Phu XuyenHanoi 20.735993 105.914119 0607:00:00009.841.00
1Phu XuyenHanoi 20.735993 105.914119 0608:00:0001.8609.00
1Phu XuyenHanoi 20.735993 105.914119 0609:00:0002.4009.00
25Suoi HaiHanoi 21.178569 105.361707 1114:00:003.80.1401.00
25Suoi HaiHanoi 21.178569 105.361707 1115:00:000.62.0202.00
25Suoi HaiHanoi 21.178569 105.361707 1116:00:0003.7407.00
25Suoi HaiHanoi 21.178569 105.361707 1117:00:0006.2906.00
25Suoi HaiHanoi 21.178569 105.361707 1118:00:0000.8200
25Suoi HaiHanoi 21.178569 105.361707 1119:00:006.4000
25Suoi HaiHanoi 21.178569 105.361707 1120:00:000.8000
25Suoi HaiHanoi 21.178569 105.361707 1121:00:000000
25Suoi HaiHanoi 21.178569 105.361707 1122:00:000000
25Suoi HaiHanoi 21.178569 105.361707 1123:00:000000
Note: dataset contains 3600 rows of hourly observations from 25 stations.
Table A2. Performance analysis of satellite rainfall estimation products with Vrain.
TimeSourceVrain_Source_Vrain_Source_Vrain_CoincidentCCRMSEBIASPODFARCSI
Window Threshold Threshold Peak Peak Event_ Event
(mm) (mm) (mm) (mm) Count (%)
1 hIMERG-Early21.7815.4660.749.58938.600.038.6953.840.090.880.05
1 hCMORPH-RT21.7813.1360.738.00936.450.008.180.150.060.570.06
1 hPDIR-Now21.7812.0060.727.00931.080.027.82−2.600.010.830.01
3 hIMERG-Early48.6140.75140.785.054020.000.0421.4253.840.200.760.12
3 hCMORPH-RT48.6132.82140.767.024012.500.0419.590.150.120.500.11
3 hPDIR-Now48.6128.00140.768.00405.000.0618.25−2.600.050.670.05
6 hIMERG-Early87.1573.18170.8147.592321.740.0936.1553.840.220.620.16
6 hCMORPH-RT87.1555.74170.8112.382321.740.1332.310.150.220.380.19
6 hPDIR-Now87.1544.30170.8103.00234.350.1330.10−2.600.040.500.04
12 hIMERG-Early124.76143.58198.6253.571315.380.1657.8253.840.150.920.06
12 hCMORPH-RT124.76114.65198.6152.151315.380.2356.750.150.150.800.10
12 hPDIR-Now124.7679.00198.6186.00137.690.0548.64−2.600.080.800.06
24 hIMERG-Early158.74220.68211.7285.98850.000.3576.7553.840.500.870.12
24 hCMORPH-RT158.74147.29211.7162.6380.000.4453.560.150.001.000.00
24 hPDIR-Now158.74123.65211.7197.0080.000.1262.09−2.600.001.000.00
Table A3. Calculation results of distribution of extreme precipitation events ( R 95 p = 21.78 mm/h) across monitoring stations during 6–11 September 2024. Total gauge stations recording extreme events: 22/25, total extreme events observed: 93, mean event frequency per station: 4.23.
No.StationDistrictNumberMaxPercentageTotal
of Events Rainfall (%) Rainfall
(mm/h) (mm/h)
1Thuong TinThuong Tin952.89.68337.2
2Thanh TriThanh Tri950.29.68302.8
3Thanh OaiThanh Oai854.08.60288.0
4Huong SonMy Duc760.77.53277.9
5An KhanhHoai Duc542.25.38174.8
6Quoc OaiQuoc Oai551.05.38176.9
7Cau RamUng Hoa537.05.38151.8
8Van DinhUng Hoa552.45.38187.6
9Chuc SonChuong My549.45.38168.2
10Phu XuyenPhu Xuyen541.25.38162.2
11Mieu MonChuong My427.64.30100.2
12Thach ThatThach That323.03.2367.2
13Suoi HaiBa Vi346.63.23124.8
14Phuc ThoPhuc Tho338.63.2392.8
15Quang OaiThach That335.63.2390.6
16Bat BatBa Vi349.23.23117.6
17Cho ChayChuong My347.43.23123.2
18Hoai DucHoai Duc235.82.1559.6
19Dap DayPhu Xuyen227.02.1553.0
20Xuan MaiChuong My229.22.1551.8
21Kim AnhSoc Son125.61.0825.6
22Chau QuyGia Lam128.21.0828.2
Table A4. Statistical characteristics of Vrain and satellite rainfall estimation products.
ProductMeanMaxTotalRain Duration
(mm/h) (mm/h) (mm) (h)
Vrain2.5460.709159.201852
IMERG-Early3.9149.5814,090.603049
CMORPH-RT2.5538.009172.822350
PDIR-Now2.4827.008921.002178
Table A5. Time lag analysis for the detection and tracking of three rainfall peaks (peak 1, 2, and 3) of three extreme rainfall series (corresponding to ERNo.1, ERNo.2, and ERNo.3) during Super Typhoon Yagi’s activity (positive/negative values correspond to earlier/delayed detection).
Event DetailsSourceTime Lag (min)Peak Value (mm/h)Ratio to Vrain (%)
ERNo.1IMERG-Early−18033.867.3
Peak 1CMORPH-RT−18038.075.7
Time: 06/09/2024 16:00PDIR-Now−12014.027.9
Vrain: 50.2 mm/h
ERNo.2IMERG-Early+24015.330.0
Peak 2CMORPH-RT−36013.526.5
Time: 07/09/2024 21:00PDIR-Now+30011.021.6
Vrain: 51.0 mm/h
ERNo.3IMERG-Early−24038.863.9
Peak 3CMORPH-RT−18026.443.5
Time: 09/09/2024 22:00PDIR-Now−18027.044.5
Vrain: 60.7 mm/h
Table A6. Time lag analysis of peak rainfall (peak 1-3, 2-3, and 3-3) fluctuations during the extreme rainfall event of 9–10 September 2024 (ERNo.3) (positive/negative values correspond to earlier/delayed detection).
Event DetailsSourceTime Lag (min)Peak Value (mm/h)Ratio to Vrain (%)
ERNo.3IMERG-Early−24038.863.9
Peak 1-3CMORPH-RT−18026.443.5
Time: 09/09/2024 22:00PDIR-Now−18027.044.5
Vrain: 60.7 mm/h
ERNo.3IMERG-Early−12038.871.8
Peak 2-3CMORPH-RT−6026.448.9
Time: 09/09/2024 20:00PDIR-Now−6027.050.0
Vrain: 54.0 mm/h
ERNo.3IMERG-Early−6038.873.4
Peak 3-3CMORPH-RT026.450.0
Time: 09/09/2024 19:00PDIR-Now027.051.1
Vrain: 52.8 mm/h
Table A7. Calculation results of detailed detection rates by rainfall thresholds of satellite rainfall estimation products in comparison with Vrain.
SourceBelow R1pBelow R5pBelow R10pAbove R90pAbove R95pAbove R99p
Time window: 1 h
Vrain Threshold0.2 mm/h0.2 mm/h0.2 mm/h12.80 mm/h21.78 mm/h41.69 mm/h
IMERG-Early0.2490.2490.2490.1160.0860
CMORPH-RT0.4830.4830.4830.0950.0650
PDIR-Now0.3910.3910.3910.0850.0110
Time window: 3 h
Vrain Threshold0.07 mm/h0.07 mm/h0.07 mm/h9.93 mm/h15.98 mm/h31.34 mm/h
IMERG-Early0.1710.1590.1560.1380.1750
CMORPH-RT0.3970.3880.3860.1260.1500
PDIR-Now0.2150.2150.2120.1090.0670
Time window: 6 h
Vrain Threshold0.03 mm/h0.03 mm/h0.07 mm/h8.67 mm/h13.41 mm/h23.56 mm/h
IMERG-Early0.1460.1340.1390.1650.1590
CMORPH-RT0.3340.3250.3400.1620.1590
PDIR-Now0.1130.1110.1120.1010.0510
Time window: 12 h
Vrain Threshold0.02 mm/h0.03 mm/h0.1 mm/h7.36 mm/h10.97 mm/h15.45 mm/h
IMERG-Early0.0390.0440.0690.2260.1240.062
CMORPH-RT0.1390.1690.2380.2260.0810
PDIR-Now0.0450.0440.0690.1130.0310
Time window: 24 h
Vrain Threshold0.01 mm/h0.09 mm/h0.26 mm/h6.10 mm/h7.53 mm/h9.09 mm/h
IMERG-Early0000.4690.2400.444
CMORPH-RT00.1470.2930.20600
PDIR-Now0000.0990.0560

Appendix A.2. Appendix Figures

Figure A1. Comparative analysis of hourly precipitation estimates from satellite products corresponding to the coordinates of Vrain stations in Hanoi, Vietnam, along a west-to-east transect during three distinct rainfall series reaching maximum rainfall peaks: (a) ERNo.1 at 16:00, 6 September 2024; (b) ERNo.2 at 21:00, 7 September 2024; and (c) ERNo.3 at 22:00, 9 September 2024.
Remotesensing 17 01598 g0a1
Figure A2. Data sets from three major extreme rainfall series during the active phases of Super Typhoon Yagi: (a) 6 September 2024, 15:00–17:00; (b) 7 September 2024, 19:00 to 8 September 2024, 01:00; and (c) 9 September 2024, 18:00 to 10 September 2024, 03:00. (a1a4) Precipitation patterns derived from Vrain and three satellite products (IMERG-Early, CMORPH-RT, and PDIR-Now) during ERNo.1. (b1b4) Spatial distribution of rainfall from the same data sources during ERNo.2. (c1c4) Precipitation analysis from the aforementioned observational and satellite-based products during ERNo.3.
Remotesensing 17 01598 g0a2

References

  1. IPCC. Summary for Policymakers. In Climate Change 2023: Synthesis Report; Core Writing Team, Lee, H., Romero, J., Eds.; IPCC report; Contribution of Working Groups I, II and III to the Sixth Assessment Report of the Intergovernmental Panel on Climate Change; Intergovernmental Panel on Climate Change: Geneva, Switzerland, 2023. [Google Scholar] [CrossRef]
  2. IPCC. Climate Change 2021: The Physical Science Basis; Core Writing Team, Masson-Delmotte, V., Zhai, P., Eds.; IPCC report; Working Group I Contribution to the Sixth Assessment Report of the Intergovernmental Panel on Climate Change; Intergovernmental Panel on Climate Change: Geneva, Switzerland, 2021. [Google Scholar]
  3. Trenberth, K.E. Changes in precipitation with climate change. Clim. Res. 2011, 47, 123–138. [Google Scholar] [CrossRef]
  4. Kundzewicz, Z.W.; Kanae, S.; Seneviratne, S.I.; Handmer, J.; Nicholls, N.; Peduzzi, P.; Mechler, R.; Bouwer, L.M.; Arnell, N.; Mach, K.; et al. Flood risk and climate change: Global and regional perspectives. Hydrol. Sci. J. 2014, 59, 1–28. [Google Scholar] [CrossRef]
  5. Tokay, A.; Short, D.A. Evidence from Tropical Raindrop Spectra. J. Appl. Meteorol. Climatol. 1996, 35, 355–371. [Google Scholar] [CrossRef]
  6. Easterling, D.; Rusticucci, M.; Semenov, V.; Alexander, L.V.; Allen, S.; Benito, G.; Cavazos, T.; Nicholls, N.; Easterling, D.; Goodess, C.; et al. Changes in Climate Extremes and their Impacts on the Natural Physical Environment. In Managing the Risks of Extreme Events and Disasters to Advance Climate Change Adaptation; Cambridge University Press: Cambridge, UK, 2012; Chapter 3; pp. 109–230. [Google Scholar]
  7. Knutson, T.; Camargo, S.J.; Chan, J.C.L.; Emanuel, K.; Ho, C.H.; Kossin, J.; Mohapatra, M.; Satoh, M.; Sugi, M.; Walsh, K.; et al. Tropical Cyclones and Climate Change Assessment: Part II: Projected Response to Anthropogenic Warming. Bull. Am. Meteorol. Soc. 2020, 101, E303–E322. [Google Scholar] [CrossRef]
  8. Lin, Y.L.; Ensley, D.B.; Chiao, S.; Huang, C.Y. Orographic Influences on Rainfall and Track Deflection Associated with the Passage of a Tropical Cyclone. Mon. Weather. Rev. 2002, 130, 2929–2950. [Google Scholar] [CrossRef]
  9. Chiao, S.; Lin, Y.L. Numerical Modeling of an Orographically Enhanced Precipitation Event Associated with Tropical Storm Rachel over Taiwan. Weather. Forecast. 2003, 18, 325–344. [Google Scholar] [CrossRef]
  10. Chen, L.S.; Li, Y.; Cheng, Z.Q. An overview of research and forecasting on rainfall associated with landfalling tropical cyclones. Adv. Atmos. Sci. 2010, 27, 967–976. [Google Scholar] [CrossRef]
  11. Cramer, W.; Yohe, G.W.; Auffhammer, M.; Huggel, C.; Molau, U.; Faus da Silva Dias, M.A.; Solow, A.; Stone, D.A.; Tibig, L.; Bouwer, L.; et al. Detection and attribution of observed impacts. In Climate Change 2014 Impacts, Adaptation and Vulnerability: Part A: Global and Sectoral Aspects; Cambridge University Press: Cambridge, UK, 2014; pp. 979–1038. [Google Scholar] [CrossRef]
  12. Westra, S.; Fowler, H.J.; Evans, J.P.; Alexander, L.V.; Berg, P.; Johnson, F.; Kendon, E.J.; Lenderink, G.; Roberts, N.M. Future changes to the intensity and frequency of short-duration extreme rainfall. Rev. Geophys. 2014, 52, 522–555. [Google Scholar] [CrossRef]
  13. Alfieri, L.; Bisselink, B.; Dottori, F.; Naumann, G.; de Roo, A.; Salamon, P.; Wyser, K.; Feyen, L. Global projections of river flood risk in a warmer world. Earth’S Future 2017, 5, 171–182. [Google Scholar] [CrossRef]
  14. Skofronick-Jackson, G.; Petersen, W.A.; Berg, W.; Kidd, C.; Stocker, E.F.; Kirschbaum, D.B.; Kakar, R.; Braun, S.A.; Huffman, G.J.; Iguchi, T.; et al. The Global Precipitation Measurement (GPM) Mission for Science and Society. Bull. Am. Meteorol. Soc. 2017, 98, 1679–1695. [Google Scholar] [CrossRef]
  15. Kidd, C.; Becker, A.; Huffman, G.J.; Muller, C.L.; Joe, P.; Skofronick-Jackson, G.; Kirschbaum, D.B. So, How Much of the Earth’s Surface Is Covered by Rain Gauges? Bull. Am. Meteorol. Soc. 2017, 98, 69–78. [Google Scholar] [CrossRef] [PubMed]
  16. Bolvin, D.T.; Braithwaite, D.; Hsu, K.; Joyce, R.; Kidd, C.; Nelkin, E.J.; Sorooshian, S.; Tan, J.; Xie, P. NASA Global Precipitation Measurement (GPM) Integrated Multi-Satellite Retrievals for GPM (IMERG); Technical Report; National Aeronautics and Space Administration (NASA): Washington, DC, USA, 2020. [Google Scholar]
  17. Joyce, R.J.; Janowiak, J.E.; Arkin, P.A.; Xie, P. CMORPH: A Method that Produces Global Precipitation Estimates from Passive Microwave and Infrared Data at High Spatial and Temporal Resolution. J. Hydrometeorol. 2004, 5, 487–503. [Google Scholar] [CrossRef]
  18. Nguyen, P.; Ombadi, M.; Sorooshian, S.; Hsu, K.; AghaKouchak, A.; Braithwaite, D.; Ashouri, H.; Thorstensen, A.R. The PERSIANN family of global satellite precipitation data: A review and evaluation of products. Hydrol. Earth Syst. Sci. 2018, 22, 5801–5816. [Google Scholar] [CrossRef]
  19. Kubota, T.; Aonashi, K.; Ushio, T.; Shige, S.; Takayabu, Y.N.; Kachi, M.; Arai, Y.; Tashima, T.; Masaki, T.; Kawamoto, N.; et al. Global Satellite Mapping of Precipitation (GSMaP) Products in the GPM Era. In Satellite Precipitation Measurement; Springer: Cham, Switzerland, 2020; Volume 67, pp. 355–373. [Google Scholar] [CrossRef]
  20. Funk, C.; Verdin, A.; Michaelsen, J.; Peterson, P.; Pedreros, D.; Husak, G. A global satellite-assisted precipitation climatology. Earth Syst. Sci. Data 2015, 7, 275–287. [Google Scholar] [CrossRef]
  21. Ciabatta, L.; Massari, C.; Brocca, L.; Gruber, A.; Reimer, C.; Hahn, S.; Paulik, C.; Dorigo, W.; Kidd, R.; Wagner, W. SM2RAIN-CCI: A new global long-term rainfall data set derived from ESA CCI soil moisture. Earth Syst. Sci. Data 2018, 10, 267–280. [Google Scholar] [CrossRef]
  22. Japan Meteorological Agency. Japan Meteorological Agency: Meteorological Satellite Center. 2017. Available online: https://www.data.jma.go.jp/mscweb/en/general/himawari9.html (accessed on 5 April 2025).
  23. Arianespace. JCSAT-17 and GEO-KOMPSAT-2B Are Prepared for Their Ariane 5 Launch to Geostationary Transfer Orbit. 2020. Mission Update. Available online: https://www.arianespace.com/any-mission-to-any-orbit/ (accessed on 16 February 2025).
  24. National Satellite Meteorological Center. FengYun-4B Satellite User Guide; Technical Report; China Meteorological Administration: Beijing, China, 2021. [Google Scholar]
  25. Beck, H.E.; Wood, E.F.; Pan, M.; Fisher, C.K.; Miralles, D.G.; Van Dijk, A.I.J.M.; McVicar, T.R.; Adler, R.F. MSWEP V2 Global 3-hly 0.1 Precipitation: Methodology and Quantitative Assessment. Bull. Am. Meteorol. Soc. 2019, 100, 473–500. [Google Scholar] [CrossRef]
  26. Huang, Y.; Bao, Y.; Petropoulos, G.; Lu, Q.; Huo, Y.; Wang, F. Precipitation Estimation Using FY-4B/AGRI Satellite Data Based on Random Forest. Remote Sens. 2024, 16, 1267. [Google Scholar] [CrossRef]
  27. Yin, R.; Han, W.; Gao, Z.; Li, J. Impact of High Temporal Resolution FY-4A Geostationary Interferometric Infrared Sounder (GIIRS) Radiance Measurements on Typhoon Forecasts: Maria (2018) Case With GRAPES Global 4D-Var Assimilation System. Geophys. Res. Lett. 2021, 48, e2021GL093672. [Google Scholar] [CrossRef]
  28. Wang, S.; Toumi, R.; Czaja, A.; Van Kan, A. An analytic model of tropical cyclone wind profiles. Q. J. R. Meteorol. Soc. 2015, 141, 3018–3029. [Google Scholar] [CrossRef]
  29. Tan, J.; Petersen, W.A.; Kirstetter, P.E.; Tian, Y. Performance of IMERG as a Function of Spatiotemporal Scale. J. Hydrometeorol. 2017, 18, 307–319. [Google Scholar] [CrossRef]
  30. Chen, H.; Yong, B.; Gourley, J.J.; Liu, J.; Ren, L.; Wang, W.; Hong, Y.; Zhang, J. Impact of the crucial geographic and climatic factors on the input source errors of GPM-based global satellite precipitation estimates. J. Hydrol. 2019, 575, 1–16. [Google Scholar] [CrossRef]
  31. Matthews, T.; Perry, L.B.; Koch, I.; Aryal, D.; Khadka, A.; Shrestha, D.; Abernathy, K.; Elmore, A.C.; Seimon, A.; Tait, A.; et al. Going to extremes: Installing the world’s highest weather stations on mount everest. Bull. Am. Meteorol. Soc. 2020, 101, E1870–E1890. [Google Scholar] [CrossRef]
  32. Thao, T. Heartbreaking Images of Super Typhoon Yagi. Vietnamnet E-Newspaper, 30 April 2024. Available online: https://vietnamnet.vn/hinh-anh-nhoi-long-trong-sieu-bao-yagi-2319634.html (accessed on 10 January 2025).
  33. Minh, H. Floods Ravage Vietnam’s Northern Highlands in Wake of Typhoon Yagi. Vnexpress E-Newspaper, 9 September 2024. Available online: https://e.vnexpress.net/photo/environment/floods-ravage-vietnams-northern-highlands-in-wake-of-typhoon-yagi-4790916.html (accessed on 10 January 2025).
  34. Chen, H.; Chandrasekar, V.; Tan, H.; Cifelli, R. Rainfall estimation from ground radar and TRMM precipitation radar using hybrid deep neural networks. Geophys. Res. Lett. 2019, 46, 10669–10678. [Google Scholar] [CrossRef]
  35. Heinselman, P.L.; Priegnitz, D.L.; Manross, K.L.; Smith, T.M.; Adams, R.W. Rapid sampling of severe storms by the national weather radar testbed phased array radar. Weather. Forecast. 2008, 23, 808–824. [Google Scholar] [CrossRef]
  36. Yu, Z.; Lan-Qiang, B.; Zhi-Yong, M.; Bing-Hong, C.; Cong-Cong, T.; Pei-Ling, F. Rapid-scan and polarimetric phased-array radar observations of a tornado in the Pearl River Estuary. J. Trop. Meteorol. 2021, 27, 81–86. [Google Scholar] [CrossRef]
  37. Huffman, G.J.; Bolvin, D.T.; Braithwaite, D.; Hsu, K.L.; Joyce, R.J.; Kidd, C.; Nelkin, E.J.; Sorooshian, S.; Stocker, E.F.; Tan, J.; et al. Integrated Multi-satellite Retrievals for the Global Precipitation Measurement (GPM) Mission (IMERG). In Satellite Precipitation Measurement: Volume 1; Springer International Publishing: Cham, Switzerland, 2020; pp. 343–353. [Google Scholar] [CrossRef]
  38. Xie, P.; Joyce, R.; Wu, S.; Yoo, S.H.; Yarosh, Y.; Sun, F.; Lin, R. Reprocessed, bias-corrected CMORPH global high-resolution precipitation estimates from 1998. J. Hydrometeorol. 2017, 18, 1617–1641. [Google Scholar] [CrossRef]
  39. Nguyen, P.; Ombadi, M.; Gorooh, V.A.; Shearer, E.J.; Sadeghi, M.; Sorooshian, S.; Hsu, K.; Bolvin, D.; Ralph, M.F. PERSIANN dynamic infrared–rain rate (PDIR-now): A near-real-time, quasi-global satellite precipitation dataset. J. Hydrometeorol. 2020, 21, 2893–2906. [Google Scholar] [CrossRef]
  40. Moran, P.A.P. Notes on Continuous Stochastic Phenomena. Biometrika 1950, 37, 17. [Google Scholar] [CrossRef]
  41. Getis, A.; Ord, J.K. The Analysis of Spatial Association by Use of Distance Statistics. Geogr. Anal. 1992, 24, 189–206. [Google Scholar] [CrossRef]
  42. Wilks, D.S. Review of Probability. Int. Geophys. 2011, 100, 7–19. [Google Scholar] [CrossRef]
  43. Aghakouchak, A.; Mehran, A. Extended contingency table: Performance metrics for satellite observations and climate model simulations. Water Resour. Res. 2013, 49, 7144–7149. [Google Scholar] [CrossRef]
  44. Hapuarachchi, H.A.P.; Wang, Q.J.; Pagano, T.C. A review of advances in flash flood forecasting. Hydrol. Processes 2011, 25, 2771–2784. [Google Scholar] [CrossRef]
  45. Georgakakos, K.P. Analytical results for operational flash flood guidance. J. Hydrol. 2006, 317, 81–103. [Google Scholar] [CrossRef]
  46. Zhang, X.; Alexander, L.; Hegerl, G.C.; Jones, P.; Tank, A.K.; Peterson, T.C.; Trewin, B.; Zwiers, F.W. Indices for monitoring changes in extremes based on daily temperature and precipitation data. Wiley Interdiscip. Rev. Clim. Change 2011, 2, 851–870. [Google Scholar] [CrossRef]
  47. World Meteorological Organization. Guidelines on the Definition and Characterization of Extreme Weather and Climate Events; Technical report; World Meteorological Organization: Geneva, Switzerland, 2023. [Google Scholar]
Figure 1. Administrative boundaries delineating the 30 districts of Hanoi.
Remotesensing 17 01598 g001
Figure 2. Track of Super Typhoon Yagi during 6–8 September 2024 (Vietnam Disaster Management System, 2024).
Remotesensing 17 01598 g002
Figure 3. Impacts of Super Typhoon Yagi: (a) infrastructure damage in Quang Ninh province and (b) severe flooding in Thai Nguyen province. Sources: (a) Reprinted with permission from Ref. [32]. Copyright 2024, Vietnamnet E-newspaper; (b) Reprinted with permission from Ref. [33]. Copyright 2024, Vnexpress E-newspaper.
Remotesensing 17 01598 g003
Figure 4. Geographical coordinates of 25 automatic rain gauge stations in Hanoi.
Remotesensing 17 01598 g004
Figure 5. Spatial distribution of three extreme rainfall events corresponding to three extreme rainfall series during Super Typhoon Yagi: (a) 6 September 2024, peak rainfall intensity at 16:00; (b) 7 September 2024, 21:00; and (c) 9 September 2024, 22:00. (a1a4) Observations and individual satellite products during the first event, with (a5) showing a rainfall comparison (VRain, IMERG-Early, CMORPH-RT, and PDIR-Now). (b1b5) The same data sources during the second event. (c1c5) The same data sources during the third event.
Remotesensing 17 01598 g005
Figure 6. Spatial autocorrelation analysis of precipitation patterns during three extreme rainfall events: (a) 6 September 16:00; (b) 7 September 21:00; (c) 9 September 22:00. (a1a3) Scatter plots comparing Vrain against satellite products—IMERG-Early (a1), CMORPH-RT (a2), and PDIR-Now (a3) during the first event. (b1b3) Similar comparisons for the second event and (c1c3) third event. Linear regression (red dashed line, equation shown) and 1:1 reference line (black dashed) are displayed with key validation metrics (CC, MAE, RMSE, BIAS, and Moran’s I) in inset boxes.
Remotesensing 17 01598 g006
Figure 7. Temporal distributions of precipitation during Typhoon Yagi from 6 to 11 September 2024: (a) Vrain station observations, (b) IMERG-Early satellite-based precipitation estimates, (c) CMORPH-RT satellite-based precipitation estimates, (d) PDIR-Now satellite-based precipitation estimates.
Remotesensing 17 01598 g007
Figure 8. Time lag analysis of satellite products during Super Typhoon Yagi: (a) detection of 3 major extreme rainfall events during the Yagi typhoon’s active phases and (b) peak rainfall fluctuations during the extreme rainfall event of 9–10 September 2024 (ERNo.3).
Remotesensing 17 01598 g008
Figure 9. Total cumulative rainfall and comparison of rainfall intensity across different temporal accumulations (1 h, 3 h, 6 h, 12 h, and 24 h) between Vrain and IMERG-Early, CMORPH-RT, and PDIR-Now.
Remotesensing 17 01598 g009
Figure 10. Comparison of detection rates at different Vrain thresholds (R1p, R5p, R10p, R90p, R95p, R99p) for satellite precipitation products (IMERG-Early, CMORPH-RT, and PDIR-Now) across multiple time windows (1, 3, 6, 12, and 24 h) during Super Typhoon Yagi activity.
Remotesensing 17 01598 g010
Figure 11. Performance diagrams comparing three different precipitation datasets: (a) IMERG-Early, (b) CMORPH-RT, and (c) PDIR-Now for different time windows (1 h, 3 h, 6 h, 12 h, and 24 h). The diagrams show the relationship between POD, FAR, CSI, and CC (represented by curved lines).
Remotesensing 17 01598 g011
Figure 12. Track and initial impact area of Super Typhoon Yagi during its west–northwestward movement across Hanoi (typhoon eye on 7 September 2024, 20:00 at 21°N, 105.8°E). Source: National Centre for Hydro-Meteorological Forecasting, 2024; visualization: V.N., using JAXA Digital Surface Model (30 m resolution).
Remotesensing 17 01598 g012
Figure 13. Comparison of extreme rainfall parameters at R95p threshold among initial interaction rain gauge stations along Super Typhoon Yagi’s track in Hanoi: (a) total hours of extreme precipitation showing the absolute duration in hours for each station, (b) percentage change in extreme precipitation hours compared to the baseline, (c) percentage change in mean precipitation intensity relative to the baseline measurements, and (d) percentage difference in total rainfall amounts between interaction stations and other stations compared to the baseline period. Red bars show initial interaction stations with Typhoon Yagi, blue bars show other stations in the network.
Remotesensing 17 01598 g013
Table 1. Contingency table for extreme rainfall event detection.
ObservedObserved ThresholdObserved Threshold
Satellite
Satellite ≥ ThresholdHits (H)False Alarms (F)
Satellite < ThresholdMisses (M)Correct Negatives (N)
Disclaimer/Publisher’s Note: The statements, opinions and data contained in all publications are solely those of the individual author(s) and contributor(s) and not of MDPI and/or the editor(s). MDPI and/or the editor(s) disclaim responsibility for any injury to people or property resulting from any ideas, methods, instructions or products referred to in the content.

