4.5. Ablation Study
We conducted seven types of ablation studies to evaluate the effectiveness of our parameter design, focusing on the impact of input feature descriptors, the dual-branch network structure, and the number of feature clusters on network performance. Considering that an extremely small fine-tuning sample size may affect network performance, unless otherwise specified, all experiments in this section were fine-tuned using 10% of the ground truth labels.
(1) Network Input
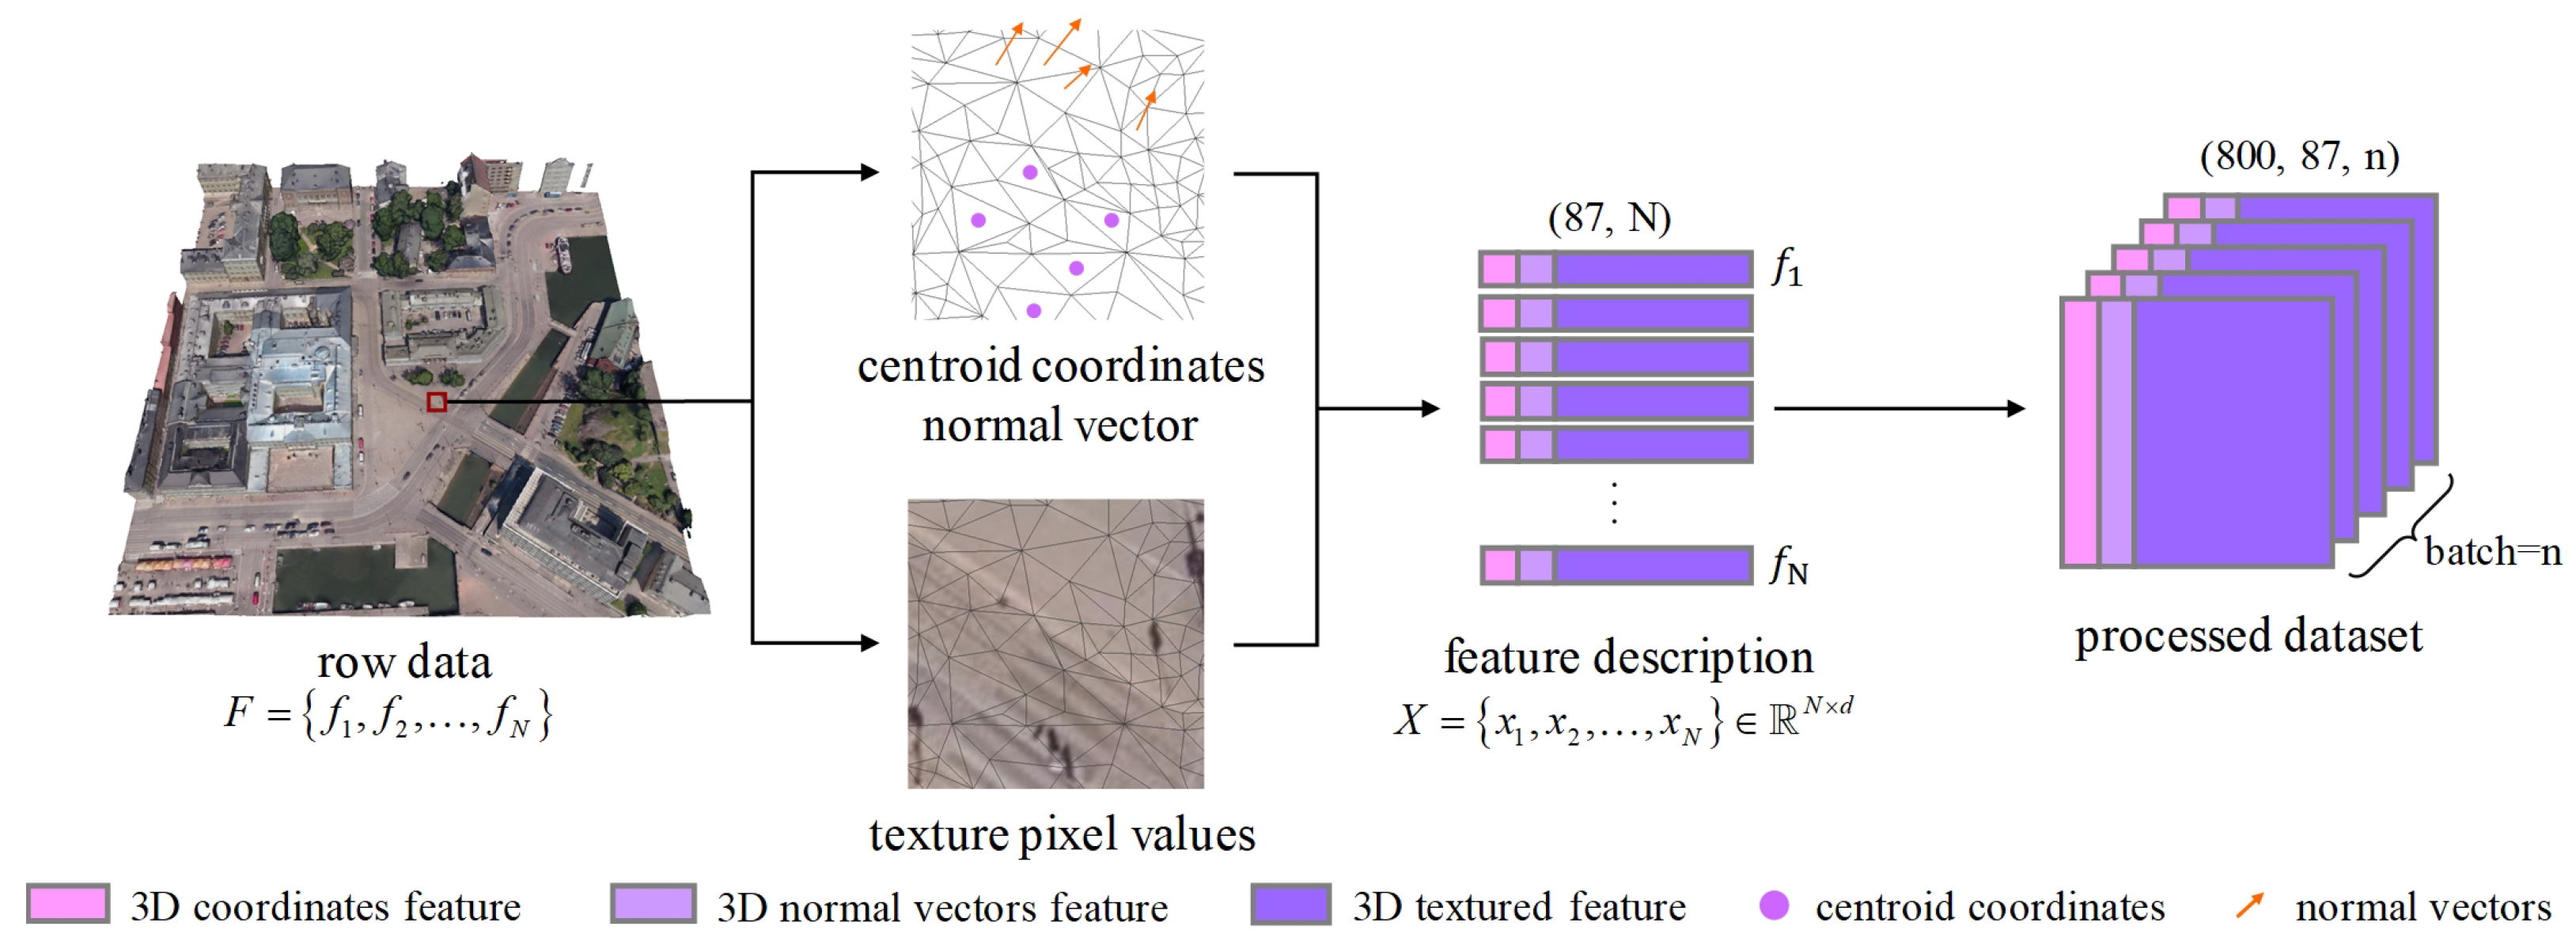
Feature Descriptors. Establishing a unified and comprehensive set of feature descriptors is crucial given the irregularity and complexity of 3D mesh scene data. Centroid coordinates capture the spatial position of each mesh, providing essential contextual information for understanding its location. Normal vectors offer crucial information about surface orientation, aiding in the understanding of geometric structure. Texture information provides rich appearance details, significantly enhancing the model’s ability to differentiate between different semantic categories. To effectively represent urban-scale environments, we combined normal vectors, centroid coordinates, and 27 texture pixel values to describe the spatial orientation and attributes of each sample. As analyzed in
Table 2, different feature combinations impact downstream semantic segmentation performance, with texture information playing a pivotal role due to its rich attribute details. Additionally, normal vectors and centroid coordinates are essential for capturing spatial position and orientation. While we explored other feature descriptors, our evaluation confirmed that this combination best balances geometric and appearance information, making it well suited for urban 3D mesh representation.
Additionally, we observed that 3D meshes have other potential feature descriptors, such as curvature features and area features. When computing curvature features, we extracted the following curvature descriptors: principal curvatures (
,
), mean curvature ((
+
)/2), Gaussian curvature (
,
), and principal curvature directions (
,
). Subsequently, we constructed a curvature feature vector (30 dimensions) by concatenating the curvature features of the three vertices of each face. Furthermore, we also computed the area features of the 3D mesh (1 dimension). The results of the corresponding ablation experiments are shown in
Table 3.
In 3D-mesh-based urban scene datasets, curvature and triangular face area features are less effective due to several factors. Urban structures are predominantly flat, resulting in near-zero curvature with limited discriminative power. Variations in mesh resolution introduce noise, making curvature and area calculations less reliable. Additionally, face area is influenced by tessellation rather than intrinsic object properties, reducing its usefulness. In contrast, normal vectors and RGB textures offer more informative features, while deep learning techniques can automatically learn more robust representations. These geometric features may be more suitable for object part segmentation rather than large-scale urban scene segmentation.
(2) Network Branches
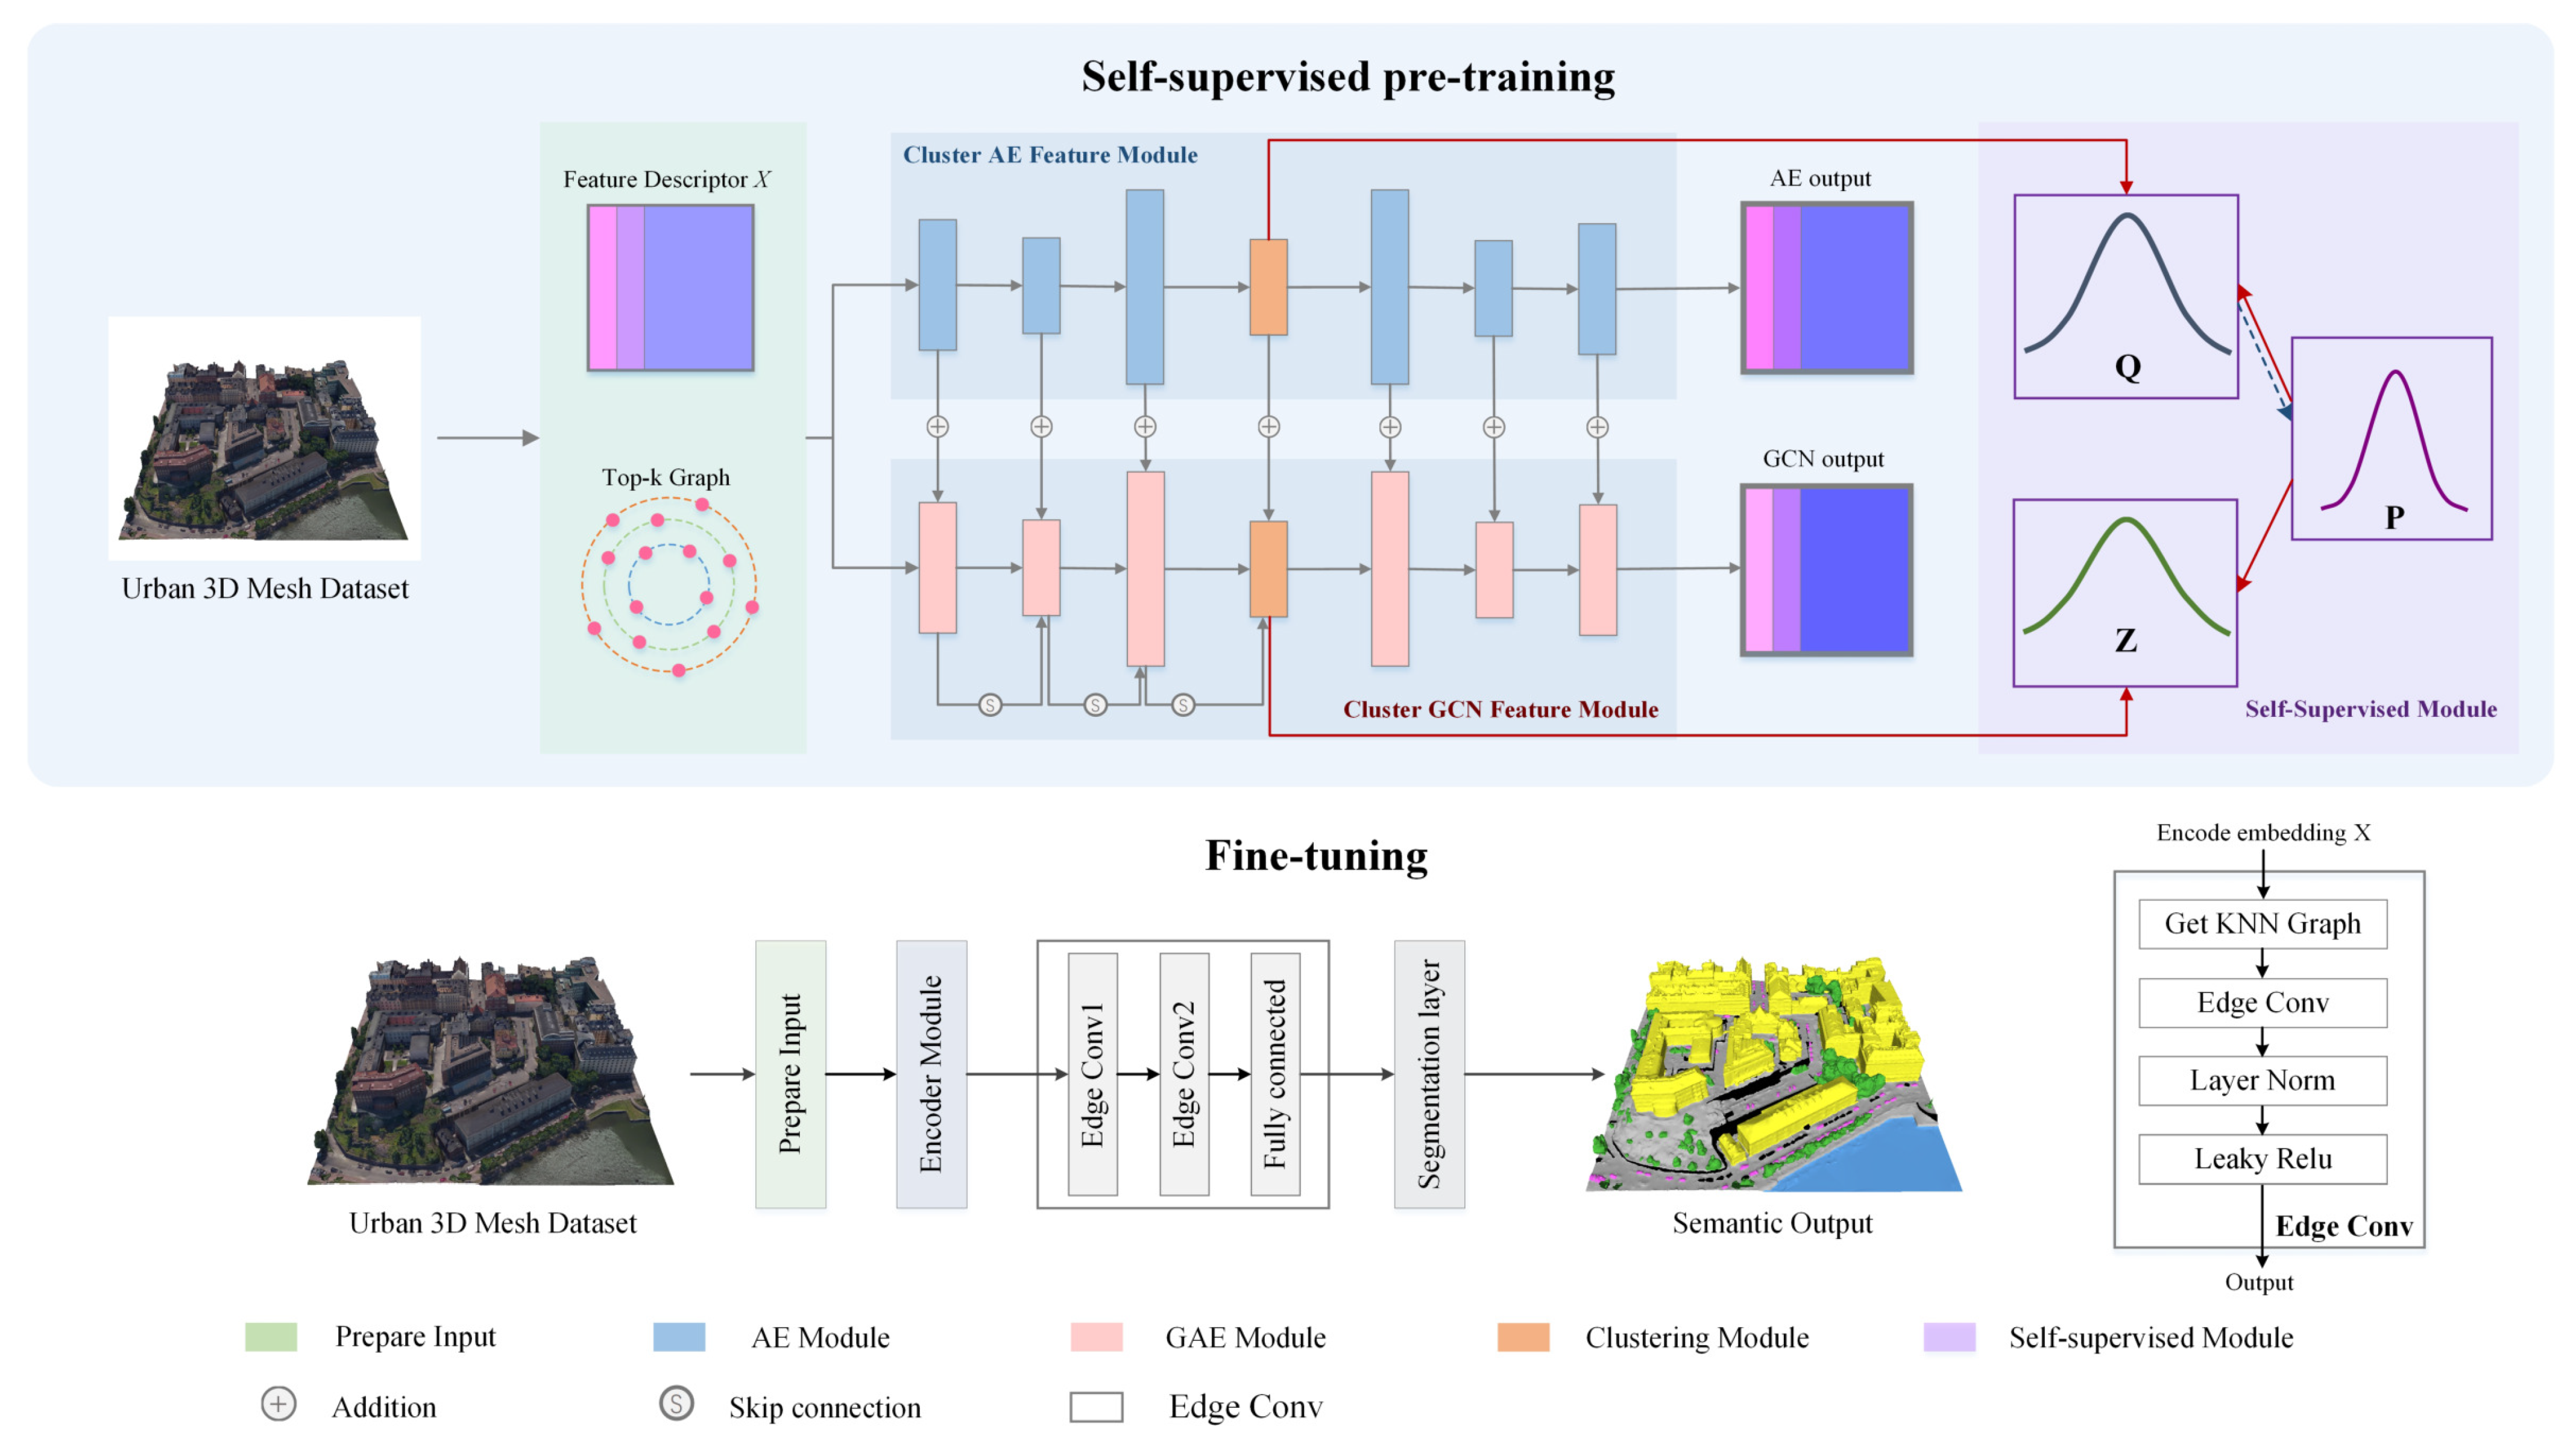
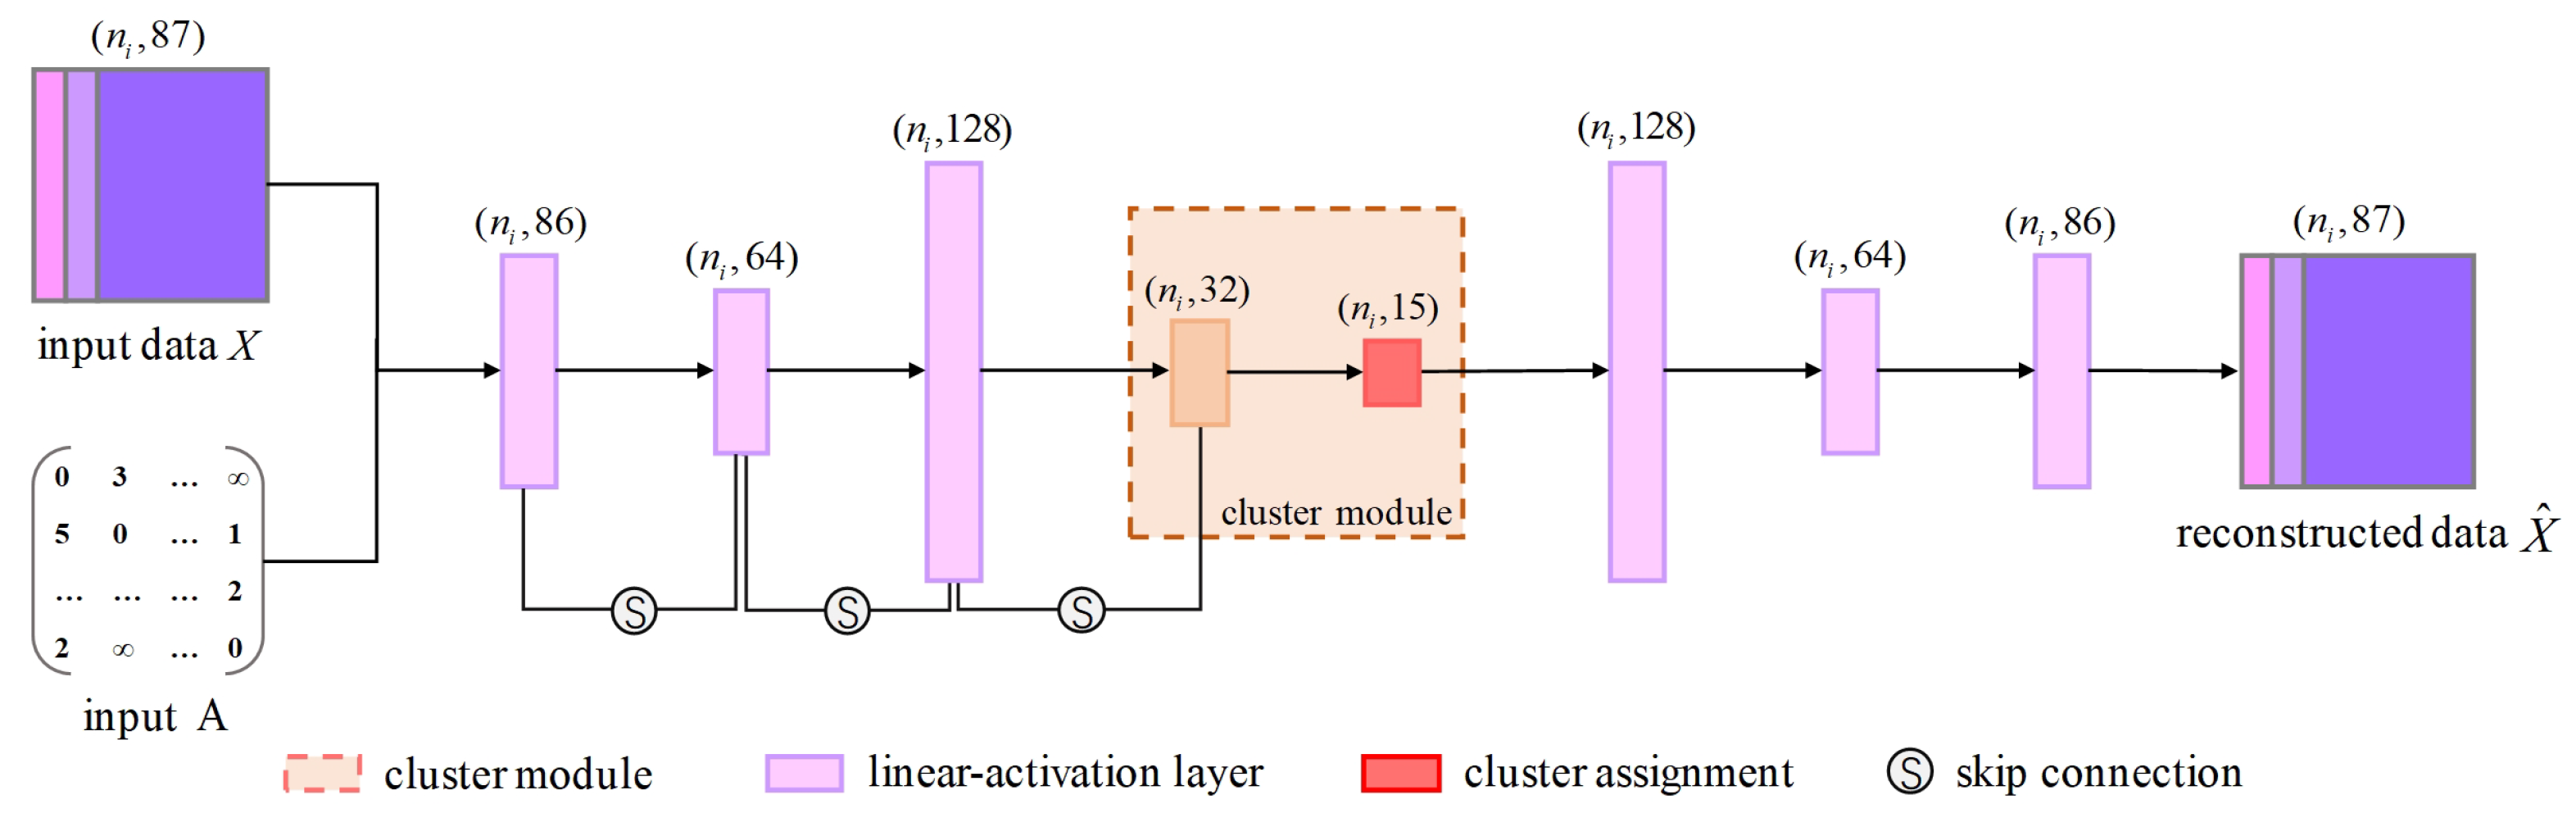
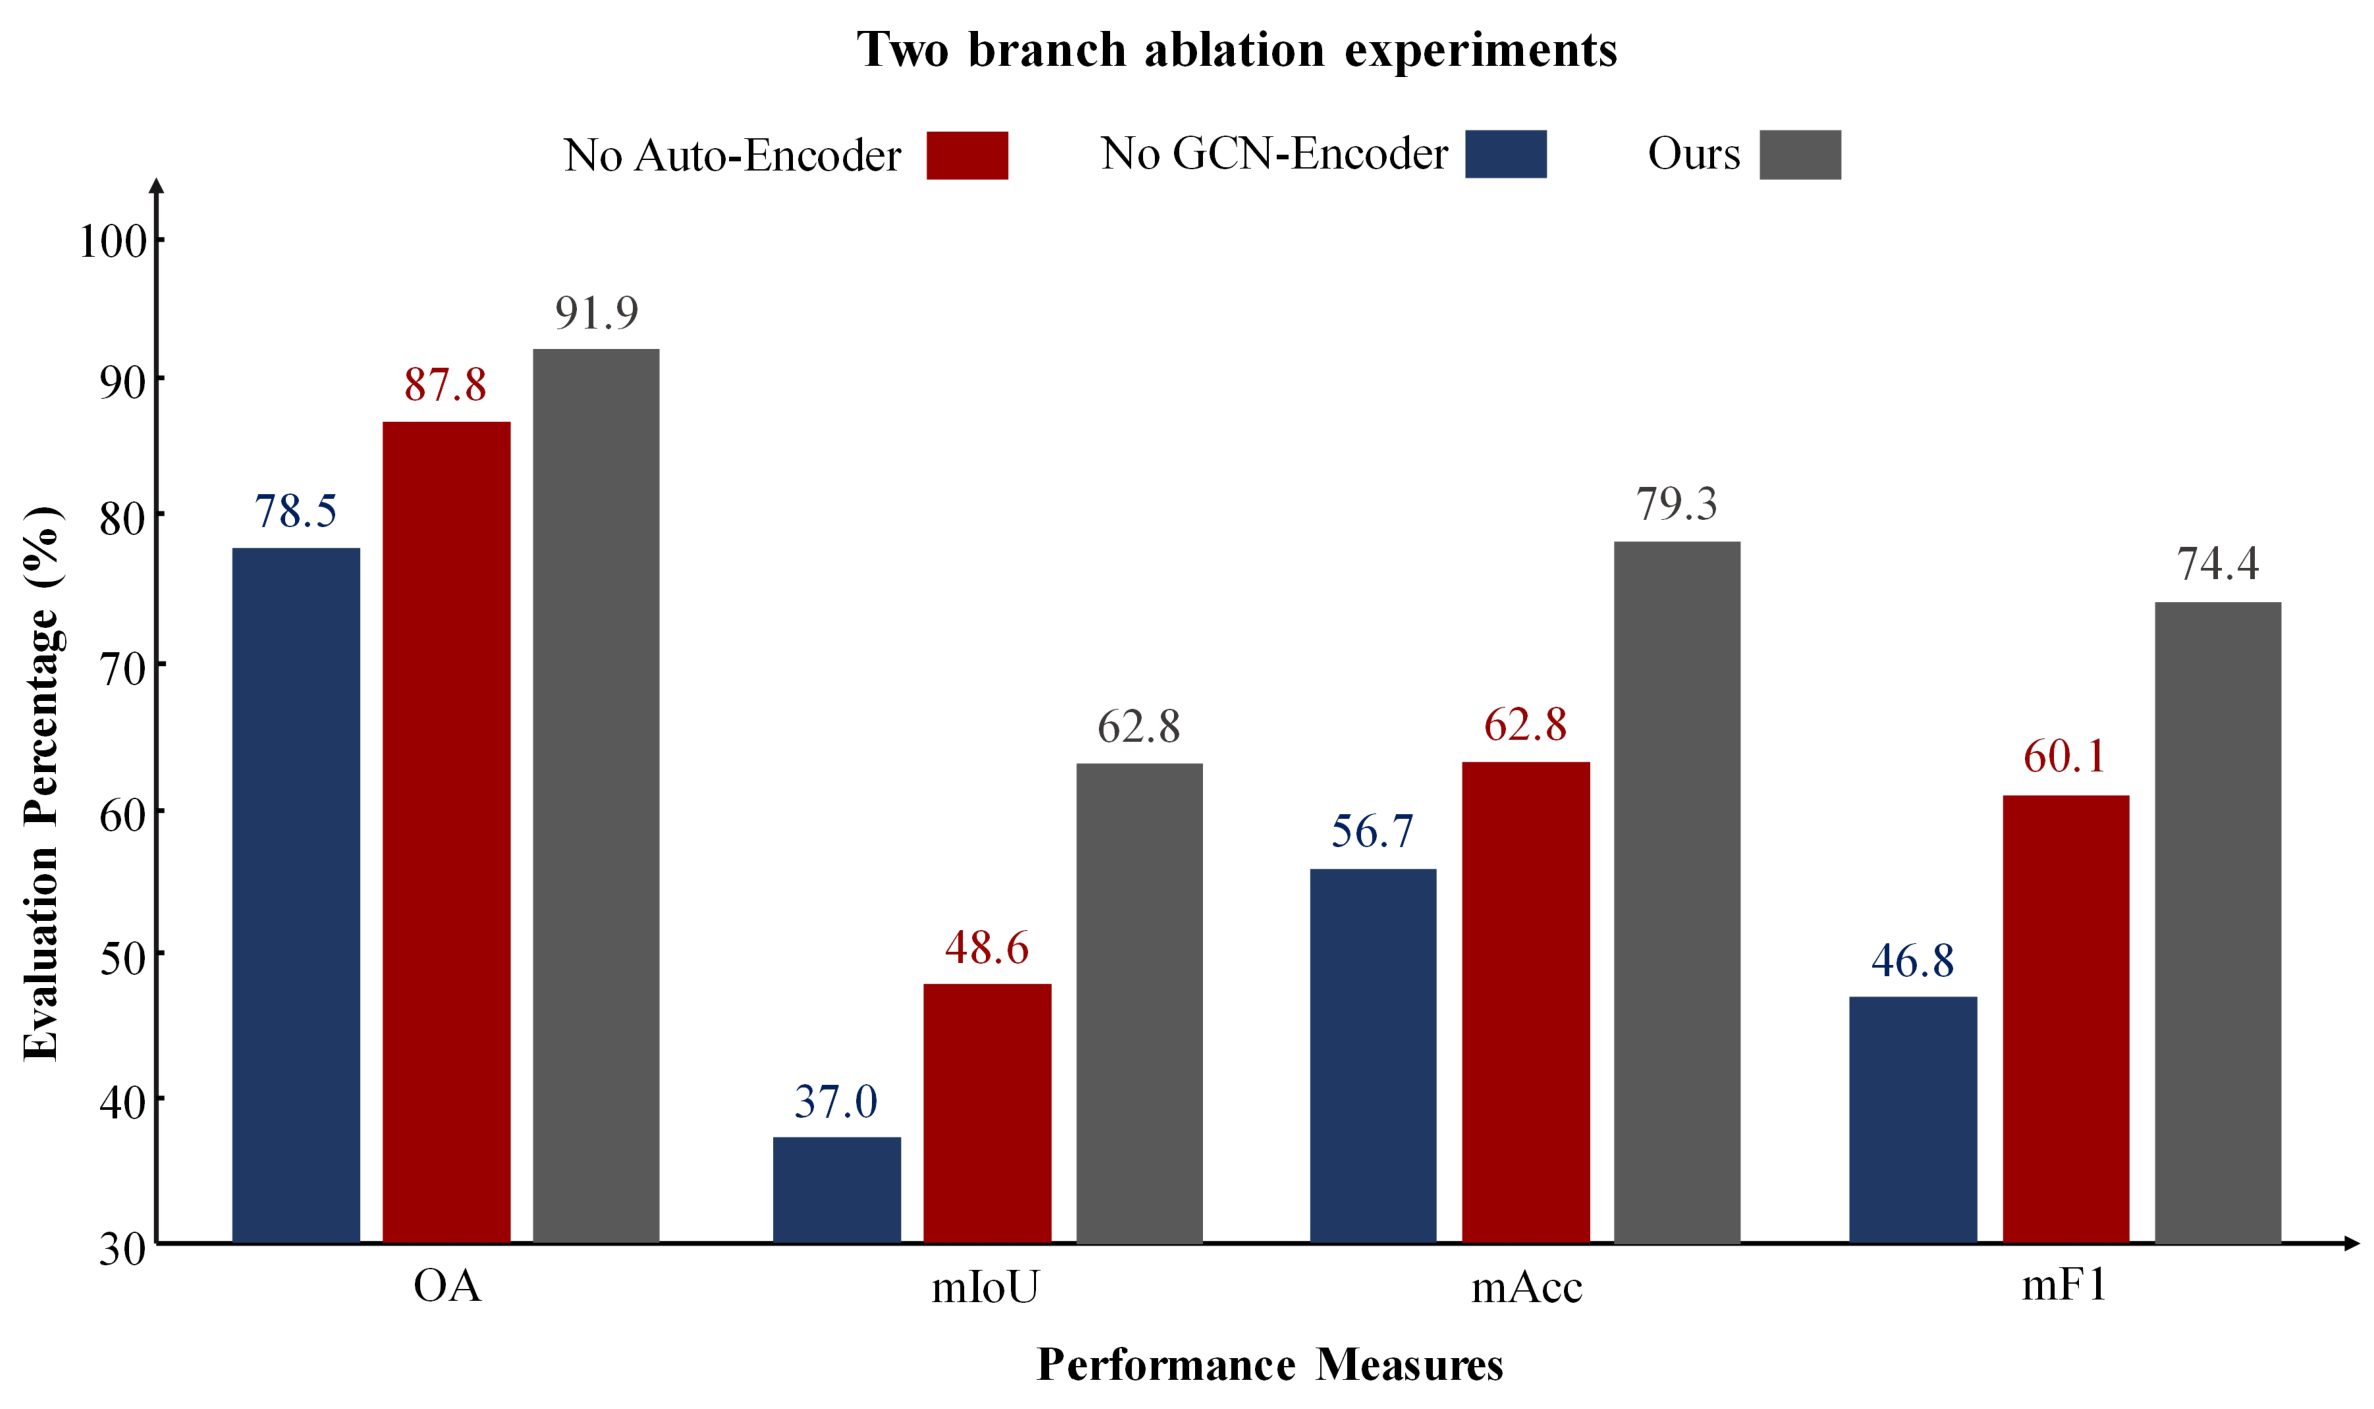
Dual-Branch Network. Our architecture combines an autoencoder and a graph encoder for representation learning. We conducted experiments to validate the effectiveness of each branch. We compared the performance of our dual-branch network with that of networks using only the autoencoder, only the graph encoder, and the fusion of both branches for feature representation in downstream semantic segmentation tasks. The results are shown in
Figure 10.
The experimental results indicate that using only an autoencoder for clustering 3D mesh sample points fails to capture the structural relationships between the samples, while relying solely on a GCN leads to a lack of understanding of the data’s inherent feature attributes. Our approach, which integrates the encoded features from the autoencoder with the structural features from the GCN, achieves superior segmentation performance.
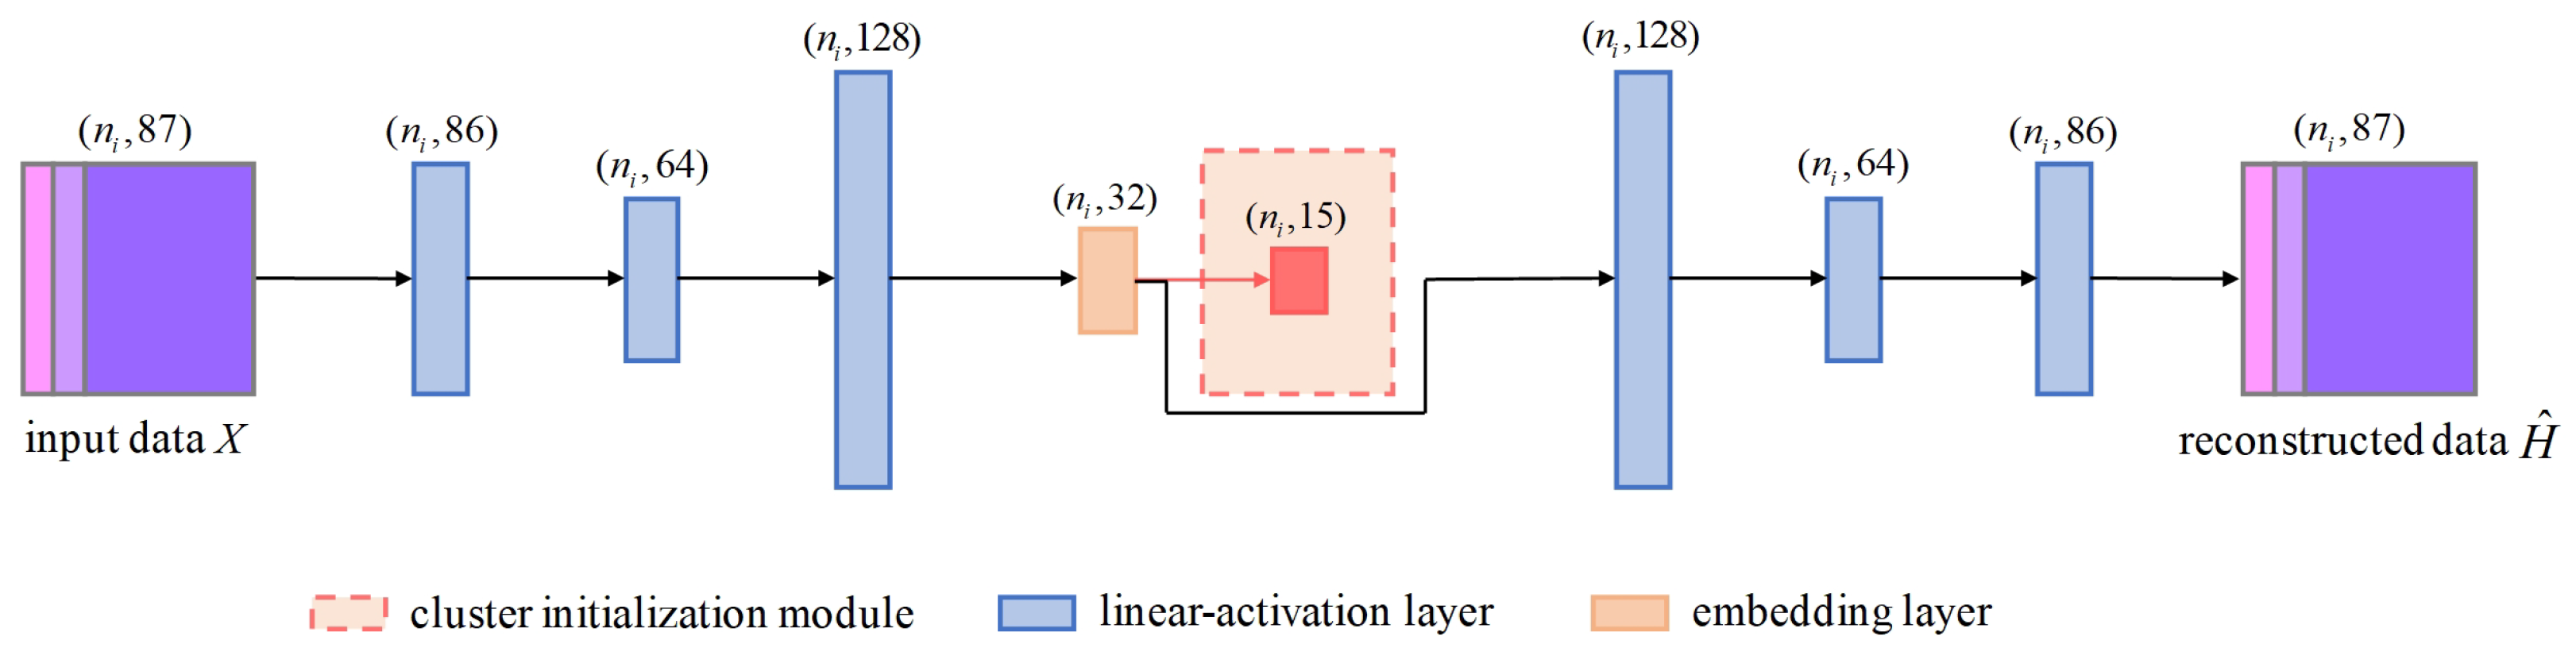
(3) Impact of Sample Size on Cluster Initialization
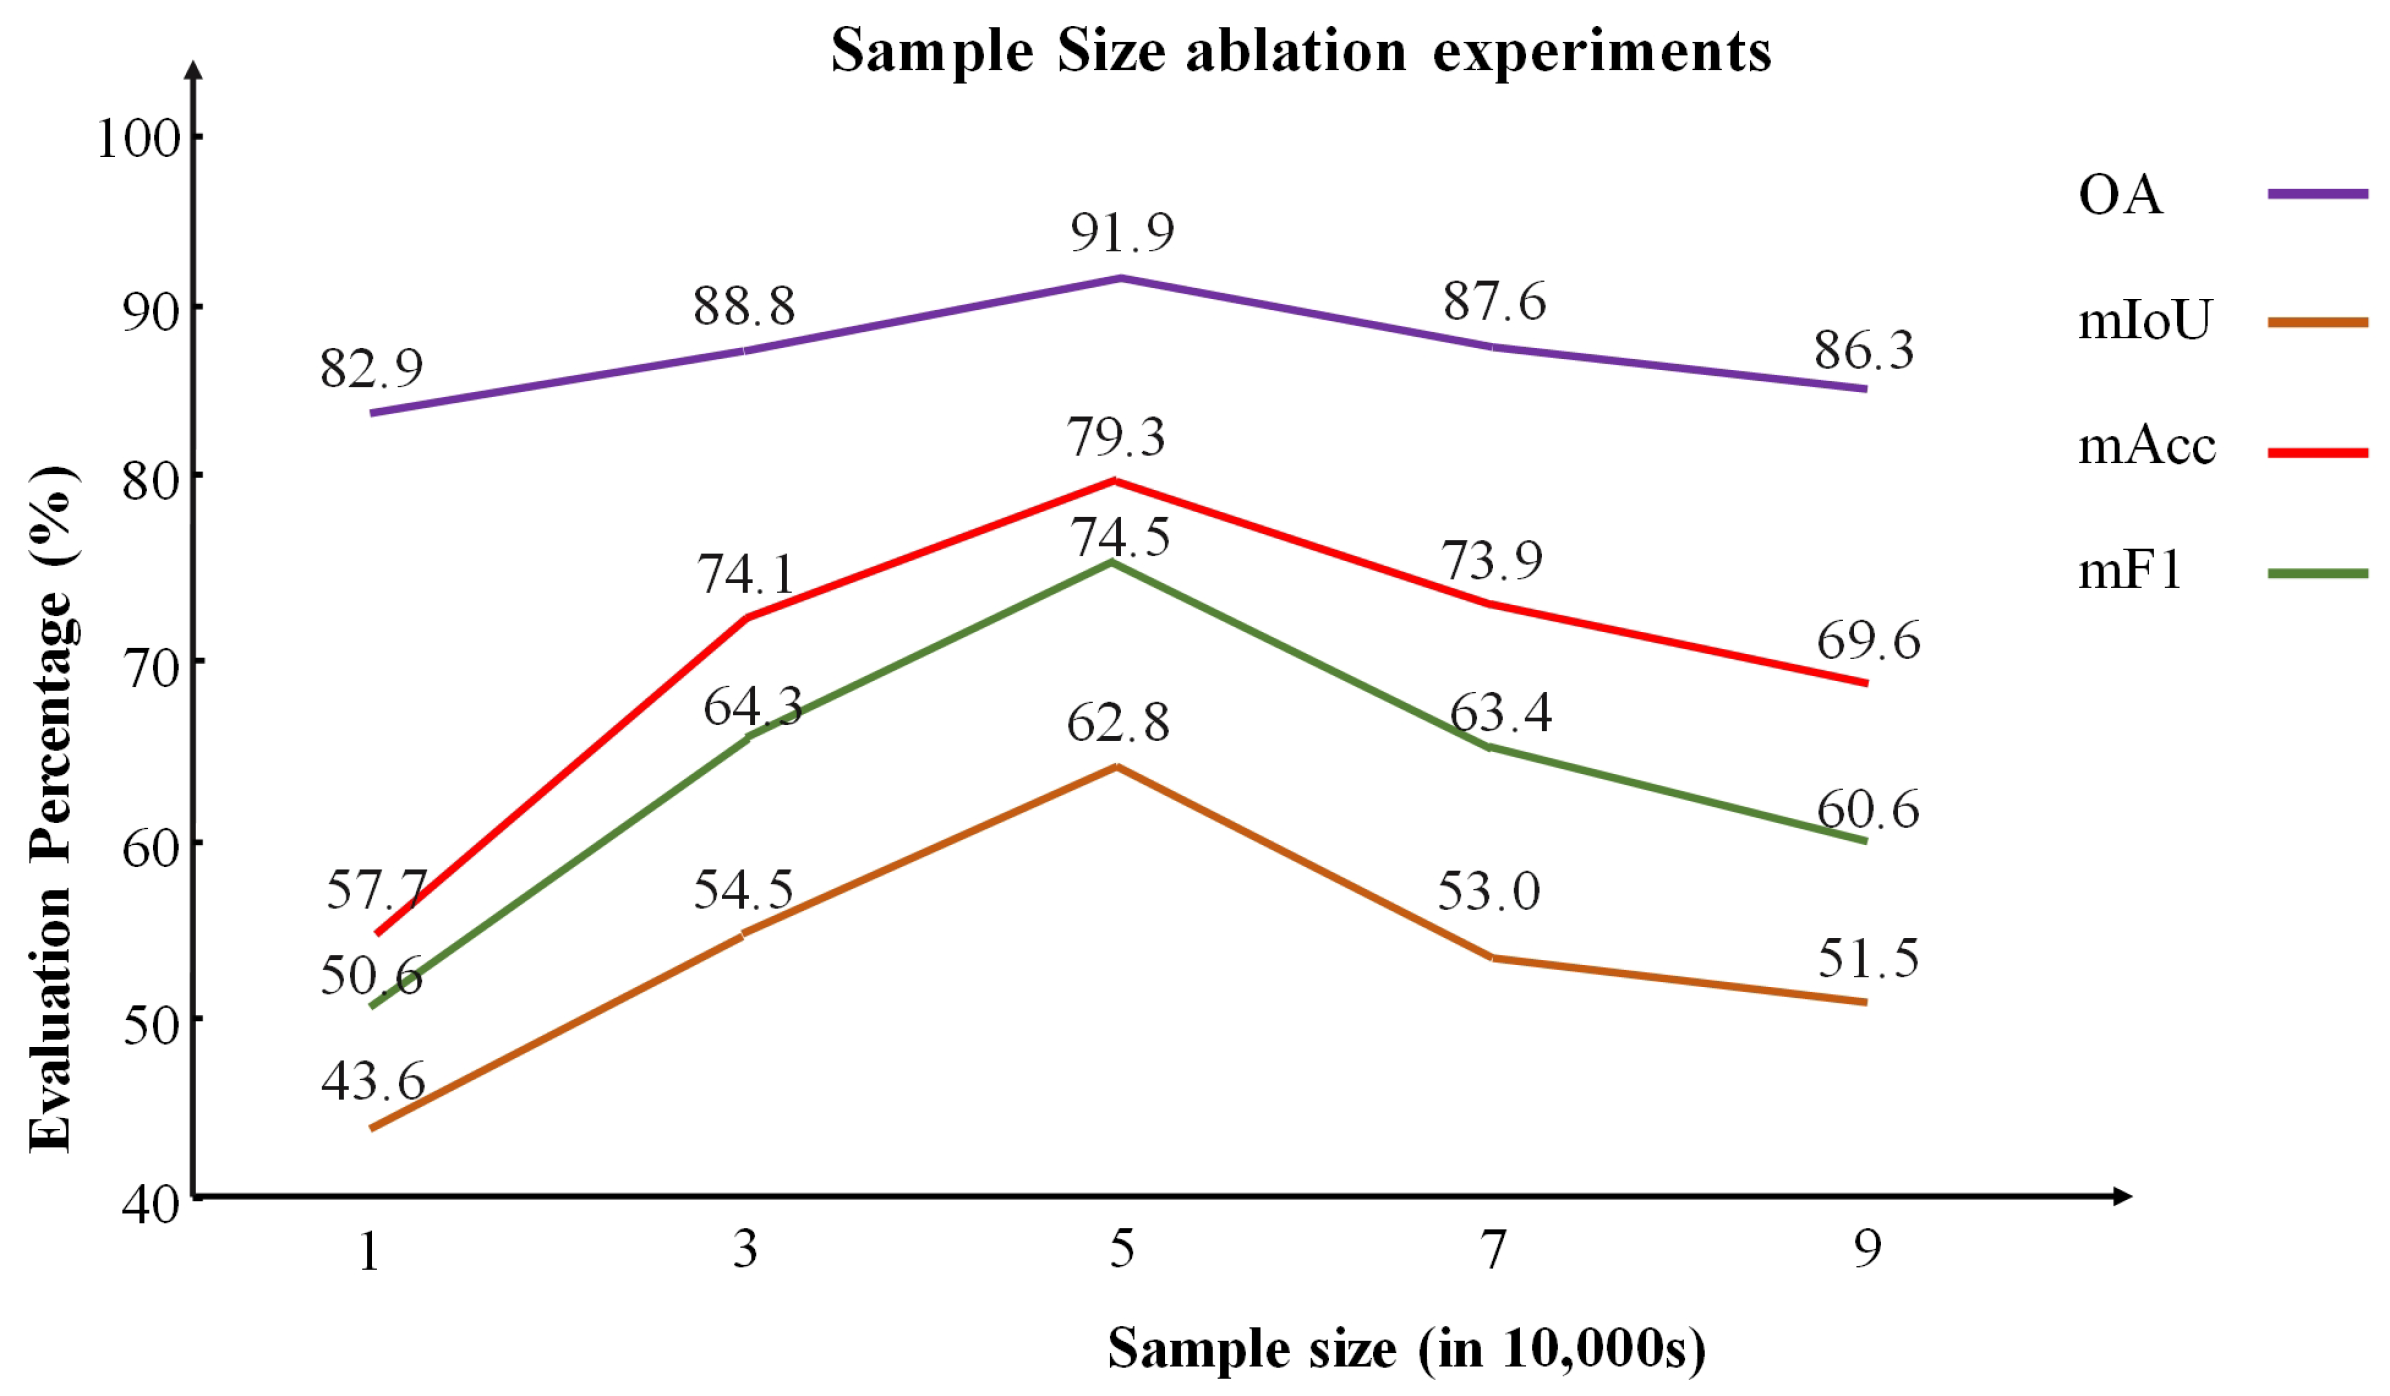
We validate the choice of selecting 50,000 points by analyzing how different numbers of initialized cluster center samples impact deep clustering and semantic segmentation performance (
Table 4). The sampled data have been preprocessed and stored in a specific file. As shown in
Figure 11, using more samples provides broader coverage but increases computational and preprocessing time and is more prone to class imbalance. Conversely, using too few points fails to capture global features, reducing feature learning, while too many points introduce redundancy and affect performance. Sampling 50,000 points achieves the best balance between representativeness and efficiency, significantly enhancing semantic segmentation performance. This underscores the importance of balancing coverage and efficiency in sampling strategies.
We also compared different sampling strategies for cluster center initialization, as shown in
Table 5. The results show that FPS ensures more uniform coverage and better feature representativeness, while RS and PGS tend to bias towards regions with more samples, reducing clustering performance.
(4) Impact of Cluster Number on Feature Learning
Due to the complexity and diversity of urban 3D mesh scene datasets, the number of clusters cannot be directly equated to ground truth label categories [
60]. To better capture the internal structure and details of 3D mesh data, we conducted experiments using different cluster numbers, as shown in
Table 6.
Although we did not exhaustively test all possible cluster numbers, our observations indicate that when , the number of clusters is insufficient to fully represent the semantic features of urban scenes, leading to a drop in model performance. Conversely, when , the cluster number becomes redundant relative to the semantic features of the scene, causing a gradual performance decline. These results validate our hypothesis: for complex urban 3D mesh scenes, the number of clusters should not simply match the number of ground truth categories. Too few clusters can limit the performance of self-supervised representation learning. Therefore, we recommend setting the cluster number to 2 to 3 times the number of label categories, with 2.5 times being optimal, in deep clustering for semantic segmentation.
(5) Analysis of K-Nearest Neighbors in GCN
In the graph encoder branch, selecting an appropriate K-nearest neighbor (KNN) count is crucial for effectively capturing both local and global features in 3D mesh scene data. Experimental results indicate that when the K value is less than 7, the neighborhood information in the KNN graph is insufficient, limiting the network’s ability to learn local structures. Conversely, when the K value exceeds 10, excessive overlap occurs in the KNN graph, leading to information redundancy and degrading model performance.
Through extensive experiments, as shown in
Table 7, we found that the model achieves optimal performance when the K value is set to 7, indicating that this value strikes the best balance between information aggregation and noise suppression within the local neighborhood. These findings highlight the sensitivity of graph convolutional networks to the choice of K-neighbors. Therefore, we recommend selecting a K value between 7 and 10 in practical applications to achieve optimal learning performance.
(6) Impact of Supervision Label Quantity
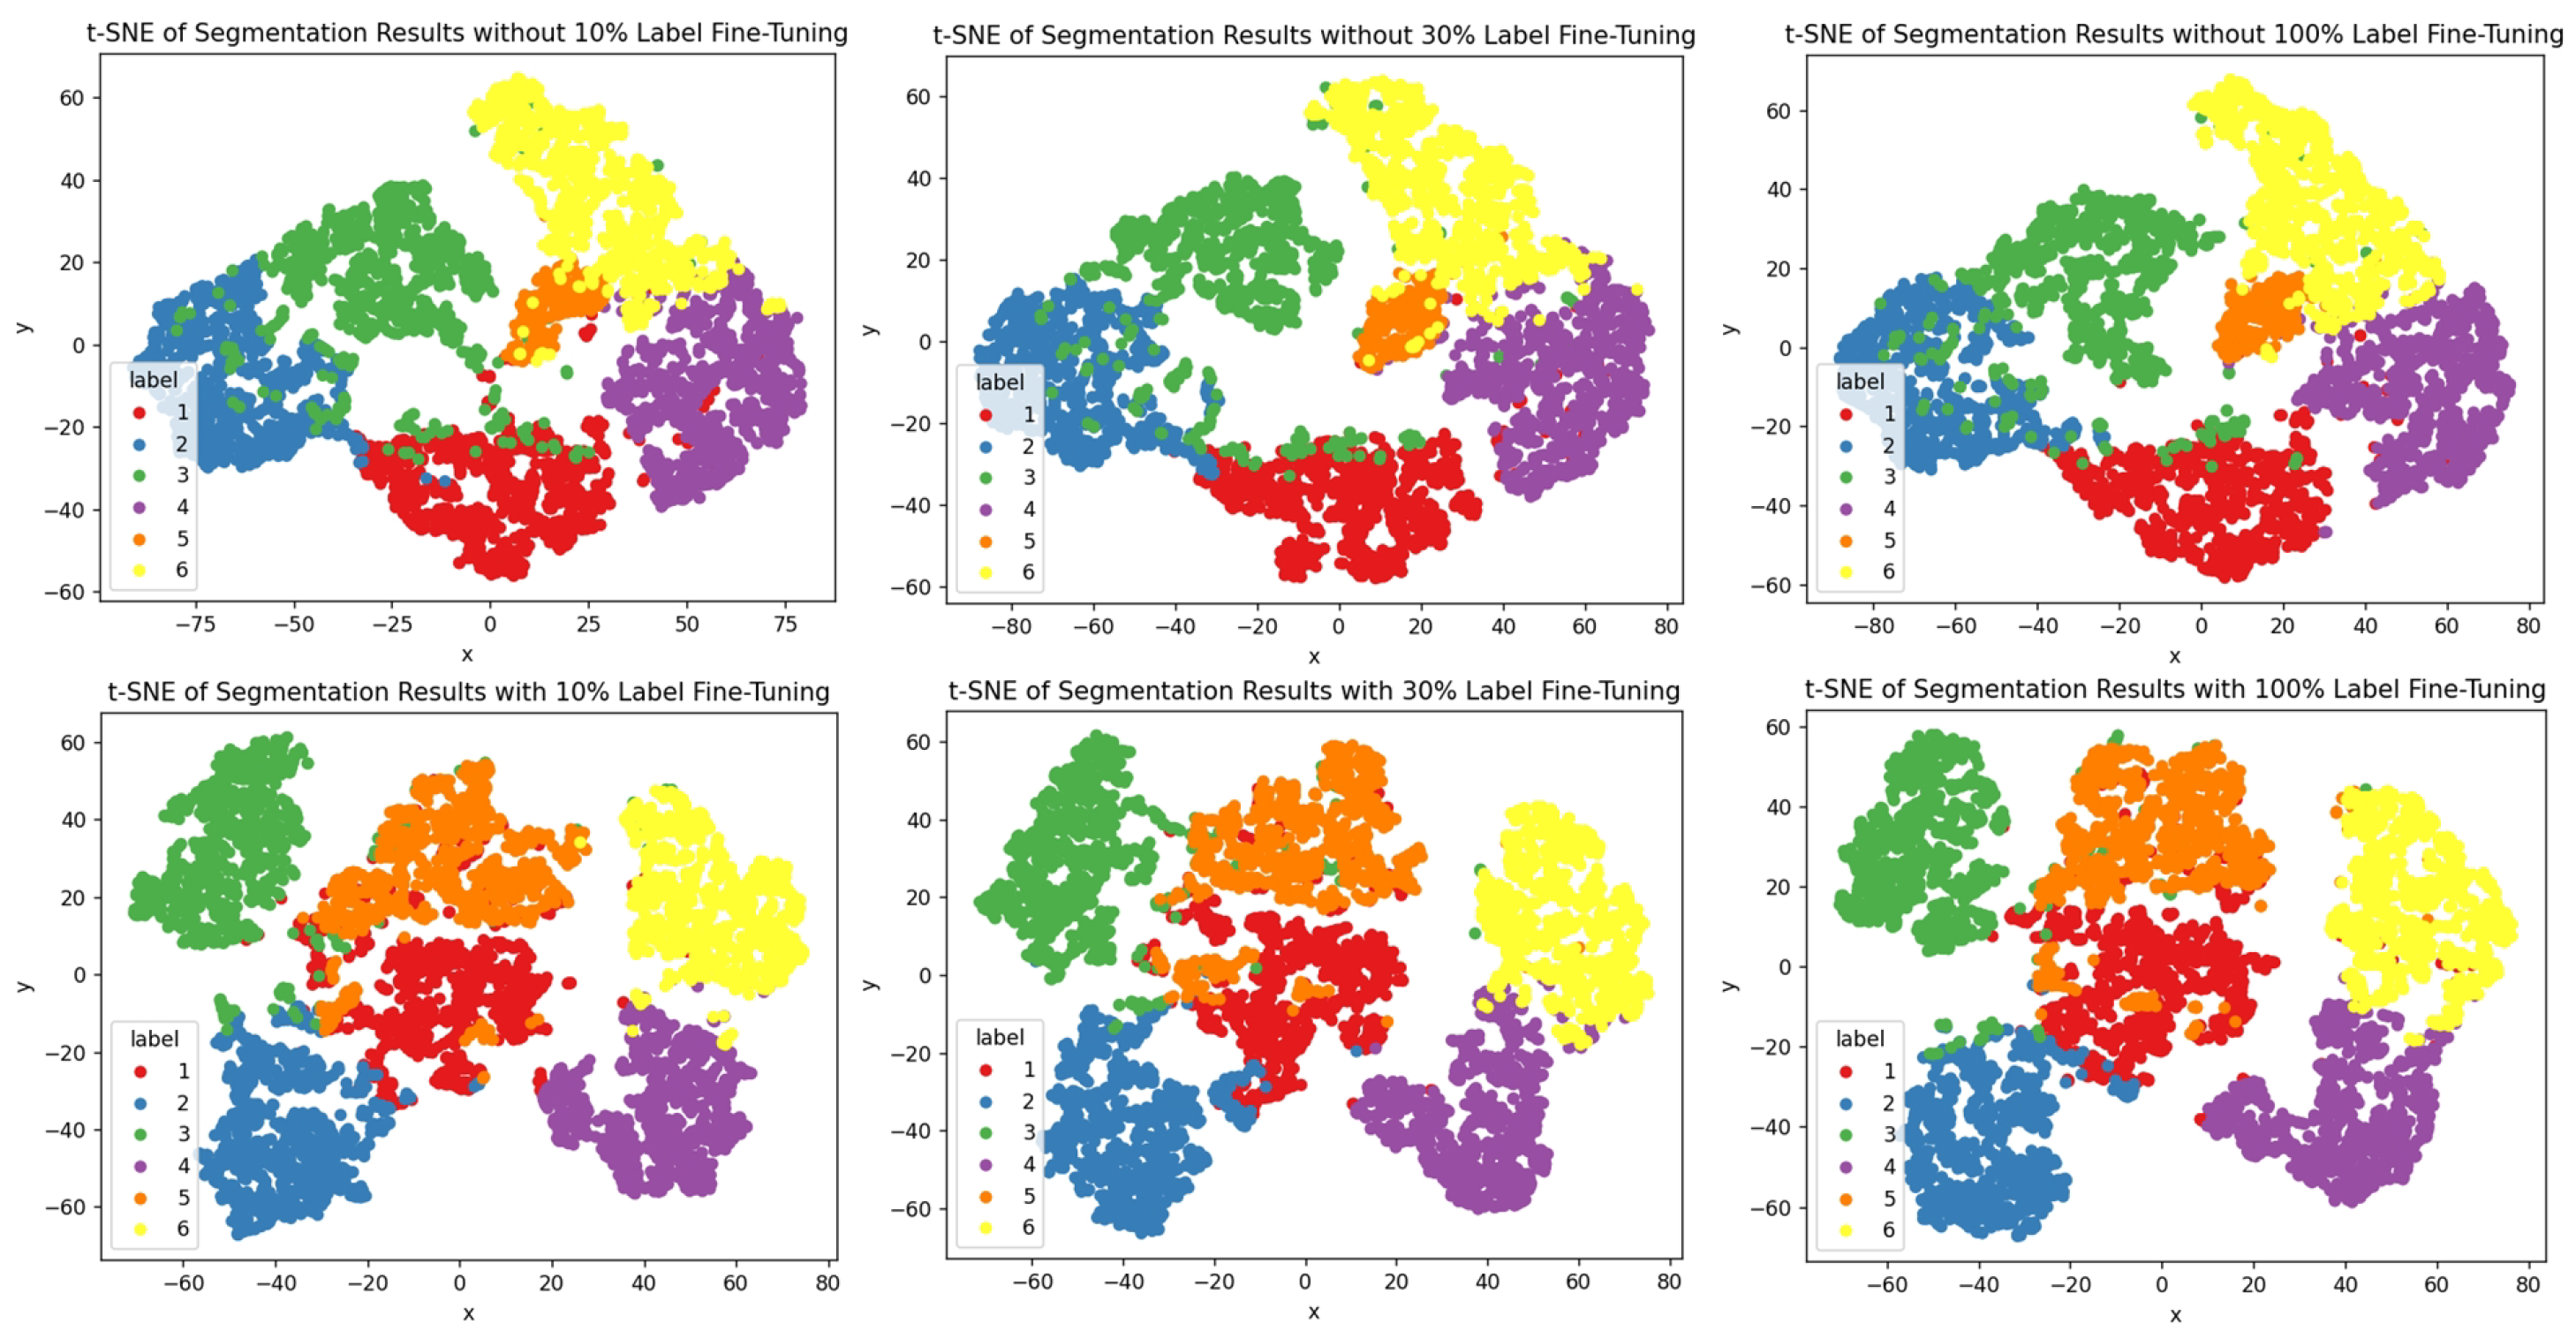
Under the self-supervised learning framework, we fine-tuned the network using 0.1%, 1%, 10%, 30%, and 100% of the labeled samples and compared their performance on downstream tasks. The experimental results shown in
Table 8 demonstrate that, even with only 10% of the labeled data, the network’s performance is nearly on par with that of using the full set of labeled data. This finding highlights the effectiveness and robustness of our self-supervised approach in feature learning, showing that it can achieve accuracy comparable to fully supervised models, even in scenarios with limited labels. Furthermore, when using only 0.1% and 1% of labeled samples, the accuracy slightly decreases due to sample imbalance; however, our method still outperforms existing approaches in comparative experiments. The specific details of the comparative experiments will be introduced in
Section 4.6.
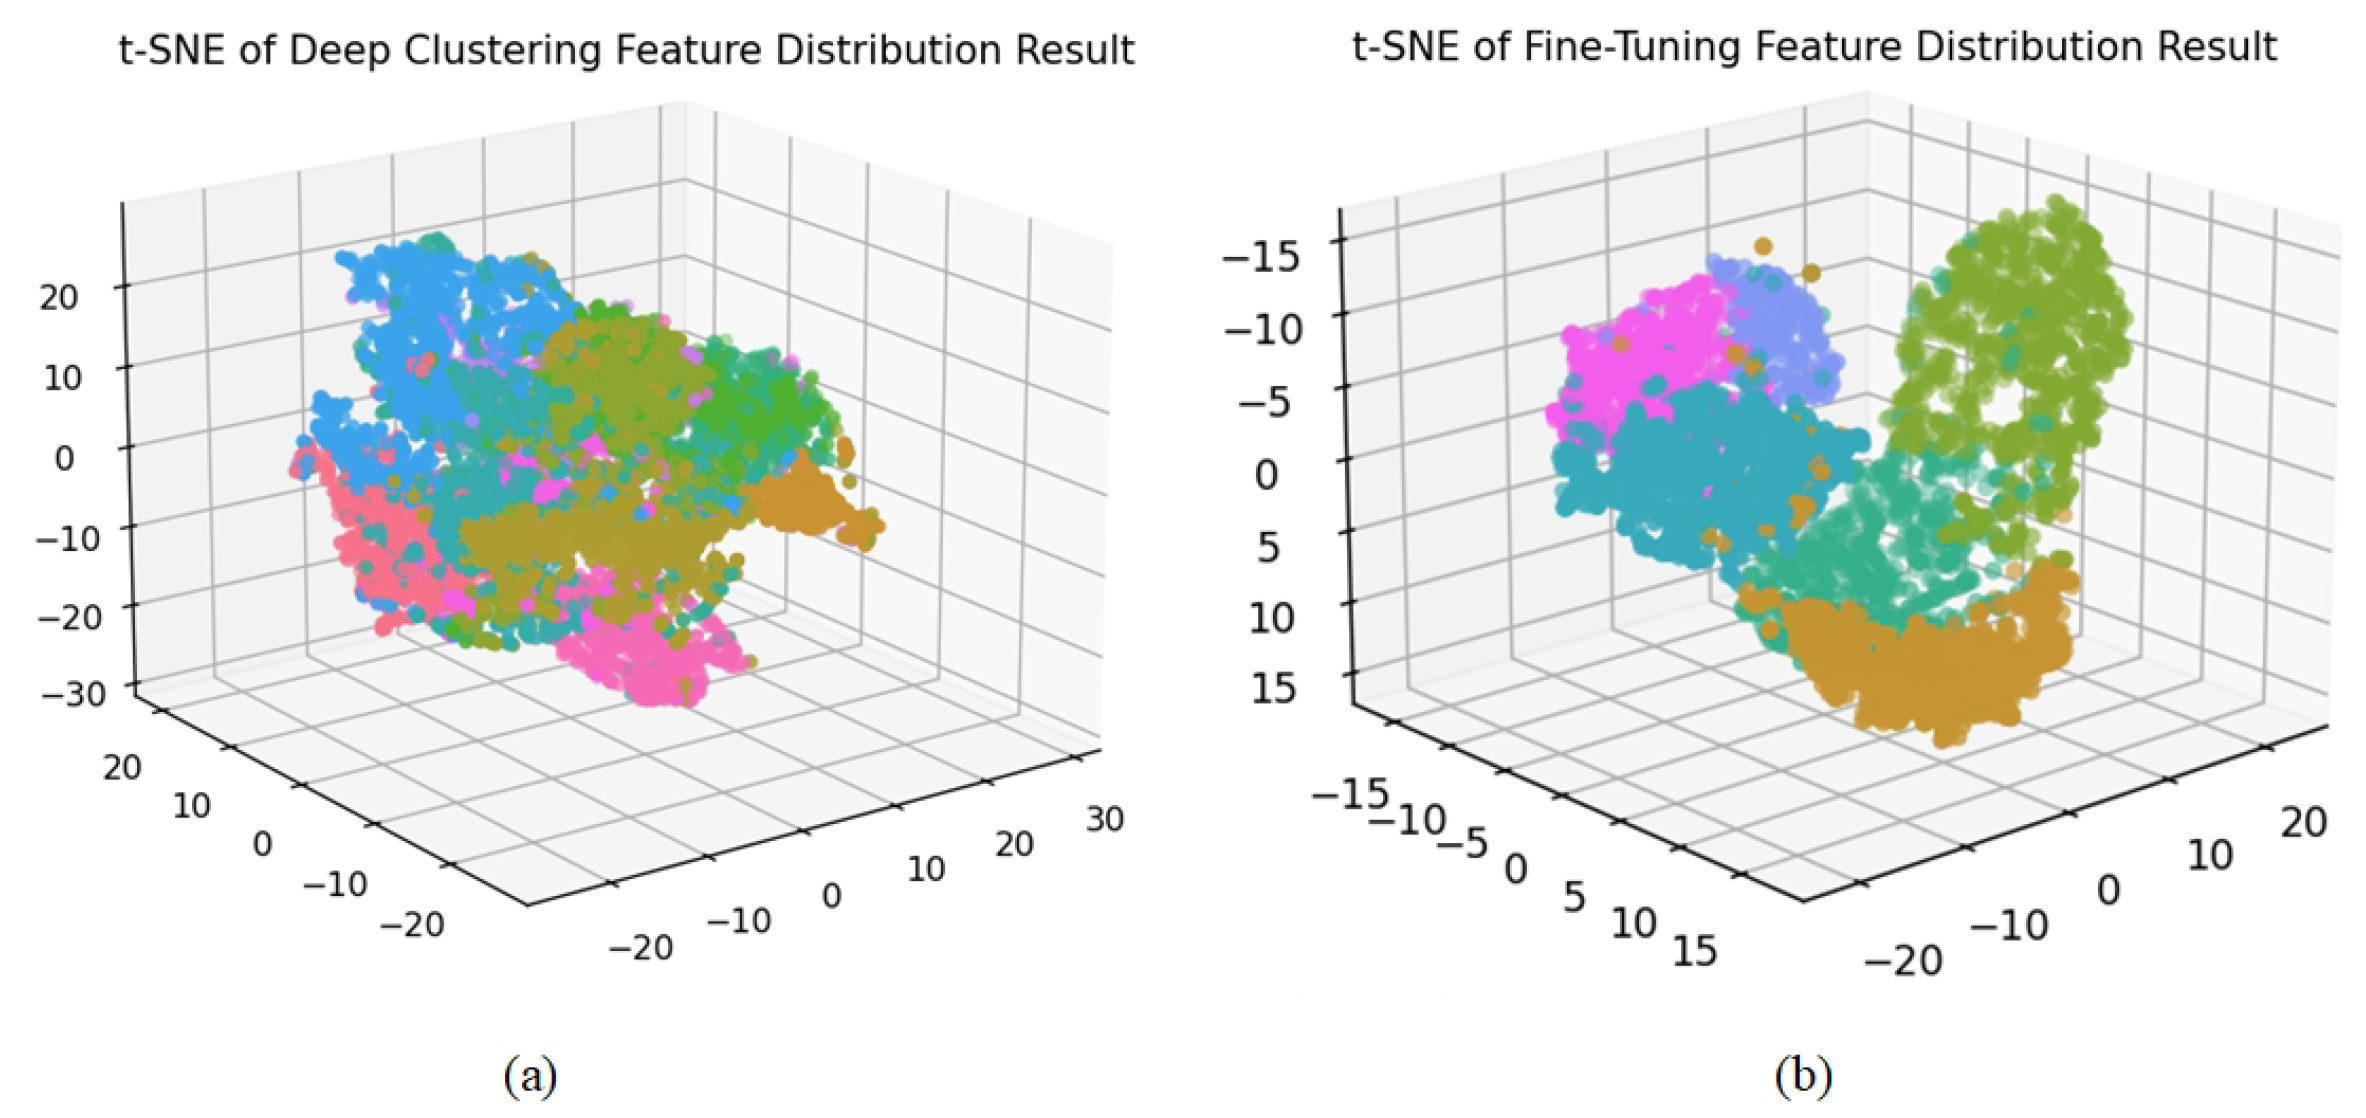
Figure 12 visualizes the cluster distribution [
61], where we observe similar patterns, further validating the effectiveness of our pre-trained network in feature representation.
(7) Impact of Sample Selection Strategy in Fine-Tuning
As shown in
Table 9, we explored two fine-tuning strategies, with our 10% label samples selected only once at the beginning and fixed for all subsequent training epochs.
Subset Fine-Tuning Strategy. In this approach, the urban 3D mesh is first divided into batches. Then, 10% of these batches are randomly selected for fine-tuning, while the remaining 90% of the batches are skipped. This method emphasizes focusing the fine-tuning process on a smaller, randomly selected subset of the data, thereby optimizing model performance. This subset selection strategy ensures effective training on a relatively limited amount of data while reducing computational resource consumption.
In-Batch Sample Fine-Tuning Strategy. In this strategy, 10% of the samples within each batch are randomly selected for loss calculation, while the remaining 90% of the samples in the batch are excluded from loss computation. This method allows the model to process the entire urban 3D mesh while learning from only a small subset of samples in each batch.
We conducted a comprehensive evaluation of two fine-tuning strategies. The experimental results indicate that there is no significant difference in test accuracy between the two strategies. However, the subset fine-tuning strategy significantly reduces time consumption, with training time approximately th that of the in-batch sample fine-tuning strategy. By randomly selecting batches of samples, the subset fine-tuning strategy minimizes training variability and human intervention, thereby enhancing robustness on large-scale scene datasets. We performed ten downstream task experiments, and the results showed that the distribution of labels in the subset fine-tuning remained consistent with the test set, and the test accuracy was relatively stable. However, it is important to note that the effectiveness of this strategy depends on the quality of feature representation learning in the pre-training task. If the pre-training task performs poorly, fine-tuning results may exhibit higher variance, leading to instability in test accuracy.
4.6. Evaluation of Competition Methods
Due to the lack of self-supervised models in urban 3D mesh segmentation, we mainly evaluated SCRM-Net by comparing it with competitive supervised models under the same training conditions to demonstrate its robustness in representation learning. We evaluated five strong baseline models for urban 3D mesh scene semantic segmentation on the SUM urban 3D mesh: PointNet [
62], PointNet++ [
42], dynamic graph convolutional network (DGCNN) [
5], kernel point convolution (KPConv) [
10], and SUM [
15]. To mitigate random factors, each model was tested in ten independent experiments, with the average results reported. Additionally, we analyzed model accuracy under both 10% and 100% labeled data settings for a comprehensive performance evaluation, as shown in
Table 10.
We further evaluated two representative self-supervised learning models: SQN [
63] and MeshMAE [
64]. Experimental results indicate that MeshMAE is suitable for small-scale, closed 3D mesh surface data. However, in large-scale urban scenarios, the dataset simplification during preprocessing leads to blurred boundaries for fine-grained semantic categories (e.g., water, cars, and boats), significantly degrading the segmentation performance. As the results were not meaningful, they are not presented. Simultaneously, we tested the SQN model on the SUM dataset, and the results revealed that traditional point-cloud-based semantic segmentation frameworks perform poorly on complex mesh structures. We attribute this performance degradation primarily to the inherent inconsistency between point cloud representations and mesh structures, with the former being unable to fully capture and leverage the rich topological and geometric information embedded in mesh surfaces. These comparative results further highlight the importance and necessity of developing specialized models tailored for mesh structures.
As shown in
Table 10, the results indicate that SCRM-Net achieves strong performance in self-supervised representation learning, even on complex urban 3D mesh datasets. Unlike supervised methods that require large amounts of labeled data, SCRM-Net only needs 10% of randomly selected labels for fine-tuning to achieve competitive segmentation accuracy. Furthermore, our method does not require careful selection of fine-tuning labels, reducing annotation costs and showing good adaptability. In contrast, supervised models suffer a significant drop in accuracy without large-scale labeled samples.
Although some of the supervised learning methods listed in the table outperform our model under fully supervised conditions, when using only 10% of the sample labels, SCRM-Net’s performance far exceeds that of the other supervised methods. Specifically, compared to the other five proposed methods, SCRM-Net achieves a range from 12.7 to 46.3% in mAcc, from 17.7 to 39.4% in mIoU, and from 19.0 to 44.1% in mF1. This demonstrates that our proposed model, with its simple yet effective network structure, can achieve competitive semantic segmentation results on textured 3D mesh.


