Article

Enhancing Crop Yield Estimation in Spinach Crops Using Synthetic Aperture Radar-Derived Normalized Difference Vegetation Index: A Sentinel-1 and Sentinel-2 Fusion Approach

by
Francisco-Javier Mesas-Carrascosa
*,
Juan Tomás Arosemena-Jované
,
Susana Cantón-Martínez
,
Fernando Pérez-Porras
and
Jorge Torres-Sánchez
Department of Graphic Engineering and Geomatics, Universidad de Córdoba, Campus de Rabanales, 14071 Córdoba, Spain
*
Author to whom correspondence should be addressed.
Remote Sens. 2025, 17(8), 1412; https://doi.org/10.3390/rs17081412
Submission received: 27 February 2025 / Revised: 3 April 2025 / Accepted: 14 April 2025 / Published: 16 April 2025

Abstract

:
Accurate crop yield estimation is crucial for food security and effective crop management in precision agriculture. Previous studies have shown the correlation between remotely sensed data and crop yield, emphasizing the need for continuous time series of radiometric indices from satellite imagery. However, passive sensors are limited by cloud cover, restricting valid image acquisition. This study explored the integration of Sentinel-1 Synthetic Aperture Radar (SAR) and Sentinel-2 optical data to enhance NDVI estimation and yield prediction of spinach. Random Forest Regression models were developed to predict NDVI from SAR data at two scales: (i) a general crop-scale model and (ii) specific plot-scale models. Both scales achieved R2 values above 0.9 for NDVI estimation, with better results at the plot scale. Integrating NDVI values derived from Sentinel-1 significantly improved yield estimation accuracy using NDVI time series compared to using NDVI from Sentinel-2 alone. The results indicated that plot-scale NDVI estimation had the lowest error rates (1.4%) and the highest R2 (0.89), outperforming the crop-scale model. The integration of SAR-based NDVI reduced data gaps caused by cloud cover and enabled earlier, more informed crop management decisions. These findings underscore the importance of SAR-based NDVI estimation for enhancing yield predictions in precision agriculture.

1. Introduction

Ensuring global food security increasingly depends on accurate, large-scale crop yield predictions [1,2], particularly in the context of climate change and the current international situation [3]. Early yield forecasting provides critical information for decision-making related to harvesting, processing, logistics, and storage, ultimately contributing to optimized agricultural management [4]. Crop yield prediction models generally fall into two categories: empirical models and process-based models [5,6]. Empirical models establish statistical relationships between predictor variables and yield, while process-based models simulate crop growth using calibration parameters that are often difficult to obtain [7]. Due to their reliance on readily available environmental and remote sensing data, empirical models are more commonly employed for yield estimation [8].
Remote sensing-based methods have proven to be reliable in forecasting agricultural production [9,10,11], but most of the scientific literature in this area is focused on field crops such as maize, wheat, or barley. Yield prediction with remote sensing on vegetable crops such as spinach (Spinacia oleracea L.) has not been studied as much. However, spinach is a valuable crop for both the fresh market and the processing industry, with a total of 943,672 ha harvested worldwide in 2023 [12]. Two recent publications have explored the use of remote sensing with uncrewed aerial vehicles (UAVs) for yield prediction in spinach and have shown promising results [13,14], but farmers and the processing industry may likely be more interested in using free imagery from earth observation programs using satellites such as Landsat or Copernicus. Marcone et al. [15] used Sentinel-2 images to estimate aboveground biomass, comparable to yield, to support the spinach supply chain. They generated indices from Sentinel-2 images to be used as variables and achieved a coefficient of determination of 0.87 for aboveground biomass prediction in small experimental parcels, but R2 values dropped to 0.21 when testing their approach with commercial crops using data from the processing industry. The major problem detected by the authors was the presence of clouds which were hampering the acquisition of images. This is an especially important problem in crops with a short cycle such as spinach.
The use of active sensors, like Synthetic Aperture Radar (SAR), overcome these limitations, enabling data acquisition during both day and night, regardless of weather conditions [16]. Previous research has demonstrated that the C-band SAR backscatter coefficient is highly sensitive to crop growth dynamics [17,18]. For example, C-band data from the Sentinel-1 satellite effectively captures spatiotemporal variations in crop growth, influenced by factors such as vertical structure, canopy roughness, and the dielectric properties of vegetation [19,20]. Additionally, SAR parameters—such as VV and VH backscatter—have shown strong correlations with optical vegetation indices like Normalized Difference Vegetation Index (NDVI) and the Enhanced Vegetation Index (EVI), further enhancing their applicability in vegetation monitoring [21,22]. Previous studies have highlighted the potential of estimating NDVI from Sentinel-1 data using the VV and VH polarization bands. This was achieved by correlating the SAR backscatter with NDVI [23,24] or by applying mathematical models to find the relationship between SAR indices and NDVI [25,26,27]. These include empirical relationships [28,29] and machine learning algorithms such as random forests [30,31], support vector machines [32], and artificial neural networks [33]. Consequently, the combined use of SAR and optical sensors have been widely applied to monitor agricultural field conditions and processes, including soil moisture estimations [34,35], crop classification [36,37], and vegetation phenology monitoring [38,39]. The ability of estimating NDVI from non-optical satellites is of paramount importance because it is the most widely used vegetation index for assessing crop vigor and productivity in response to agricultural practices and climatic variability [40,41,42]. Furthermore, the possibility of estimating NDVI values on cloudy days from SAR data opens the door to the creation of complete NDVI time series, which play a significant role in monitoring vegetation phenology and extracting metrics related to vegetation dynamics [43,44]. The dynamic behavior of vegetation canopies underscores the importance of approaches that leverage long-term, high-temporal-resolution image series.
In this context, the present study aimed to address gaps in NDVI time series by estimating the yield of vegetable crops using SAR data and machine learning. This main objective is addressed through two specific objectives: (1) assess the use of SAR-derived variables for NDVI estimation of vegetable crops, and (2) estimate yield using NDVI time series completed with NDVI values derived from SAR data. The proposed methodology was applied in a case study conducted in Andalucía, Spain, focusing on commercial spinach plots during the winter season—a period characterized by frequent cloud cover in satellite imagery. This approach aimed to enhance the accuracy of yield estimation under challenging weather conditions. As far as the authors are aware, this is the first instance of NDVI estimation from SAR data being applied to spinach cultivation.

2. Materials and Methods

2.1. Study Area

The study area consisted of 28 commercial plots located in the province of Córdoba Andalusia, Spain (central coordinates: latitude 37°30′26″, longitude 5°31′38″, WGS84) during the 2017–2018 growing season. The areas of the plots ranged from 3 ha to 19 ha and covered a total area of 250 ha (Figure 1). The plots were sown in October 2017 with Gorilla, Solomon, Coati, and Meerkat varieties. Spinach is harvested by cutting the plant at a certain height, allowing the plant to regrow for a subsequent second cut. In this study, data from the first cut, which took place in January 2018, were used.

2.2. Remote Sensing Data

This study utilized Sentinel-1 (S1) and Sentinel-2 (S2) imagery from the ESA Copernicus Program to derive various radiometric indices from October 2017 to January 2018. S1 provides Synthetic Aperture Radar (SAR) data with dual polarization (VV and VH) at a spatial resolution of 10 m and a temporal resolution of 6 days. In contrast, S2 is equipped with a Multispectral Instrument (MSI) consisting of 13 spectral bands, ranging from the visible to the shortwave infrared (SWIR) regions, with spatial resolutions of 10, 20, and 60 m depending on the wavelength. The Google Earth Engine Python API (version 0.1.391) was employed to generate a radiometric time series for each plot.

2.2.1. Sentinel-1 Dataset

The S1 images used in this study were those distributed in Interferometric Wide Swath (IW) mode, the main acquisition mode over land, with dual polarization (VV and VH) and processed as Ground Range Detected (GRD) products. These images were projected to ground range using the WGS84 Earth ellipsoid model, with a spatial resolution of 10 m. Additionally, each image was pre-processed using the Sentinel-1 Toolbox following these steps: (a) thermal noise removal, (b) radiometric calibration, and (c) terrain correction.
In this study, SAR images from the ascending orbit of Sentinel-1 were used to minimize variability in the radar signal and ensure the consistency of the generated time series. While combining images from ascending and descending orbits could increase data availability and improve temporal resolution, their integration introduces significant challenges. Differences in the incidence angle and observation direction generate variations in backscatter that affect signal stability if the data are not properly normalized [45]. Additionally, S1 images acquired from the descending orbit are captured at a time of day when the presence of dew and variations in surface moisture can alter the SAR response and introduce noise into the estimations [46,47,48]. Consequently, radiometric corrections and calibrations are necessary to mitigate these effects [49]. In this context, this study prioritized using only the ascending orbit to avoid these sources of error, ensuring greater coherence in the time series and optimizing the quality of the data used in the analysis [50,51].
After pre-processing the S1 images, several radiometric indices (Table 1) were calculated and subsequently used to assess their relationships with the NDVI index derived from S2 images.

2.2.2. Sentinel-2 Dataset

The NDVI time series for each plot were derived from data acquired by Sentinel-2 imagery processed at levels 1C and 2A. Cloud and shadow masks were generated for each scene using the Fmask algorithm [57], based on level 1C images. These masks were then applied to level 2A images to obtain bottom-of-atmosphere (BOA) reflectance values with cloud-masked areas [58]. Subsequently, red and near-infrared (NIR) bands at 10 m spatial resolution were used to calculate NDVI.
This study focused on NDVI estimation due to its extensive scientific validation and relevance in crop monitoring, as it maintains a strong correlation with biophysical parameters such as biomass, chlorophyll content, and vegetation cover [59,60]. Although there are other vegetation indices, they can be more sensitive to variations in soil reflectance, observation geometry, or require more complex atmospheric corrections, which may introduce uncertainties in the estimations [61,62]. Additionally, the integration of SAR data for estimating optical indices other than NDVI has shown less conclusive results [23,47]. Moreover, in operational applications and the field of agricultural remote sensing, NDVI is widely used by end-users and industry stakeholders, reinforcing its selection [63].
Each study plot was subdivided into fully contained 20 × 20 m units, and the median value of each previously calculated radiometric index was determined for those units. A total of 3030 units were used. This approach enabled the assessment of the temporal evolution of radiometric indices based on the satellite images, which were subsequently processed and analyzed in successive phases.

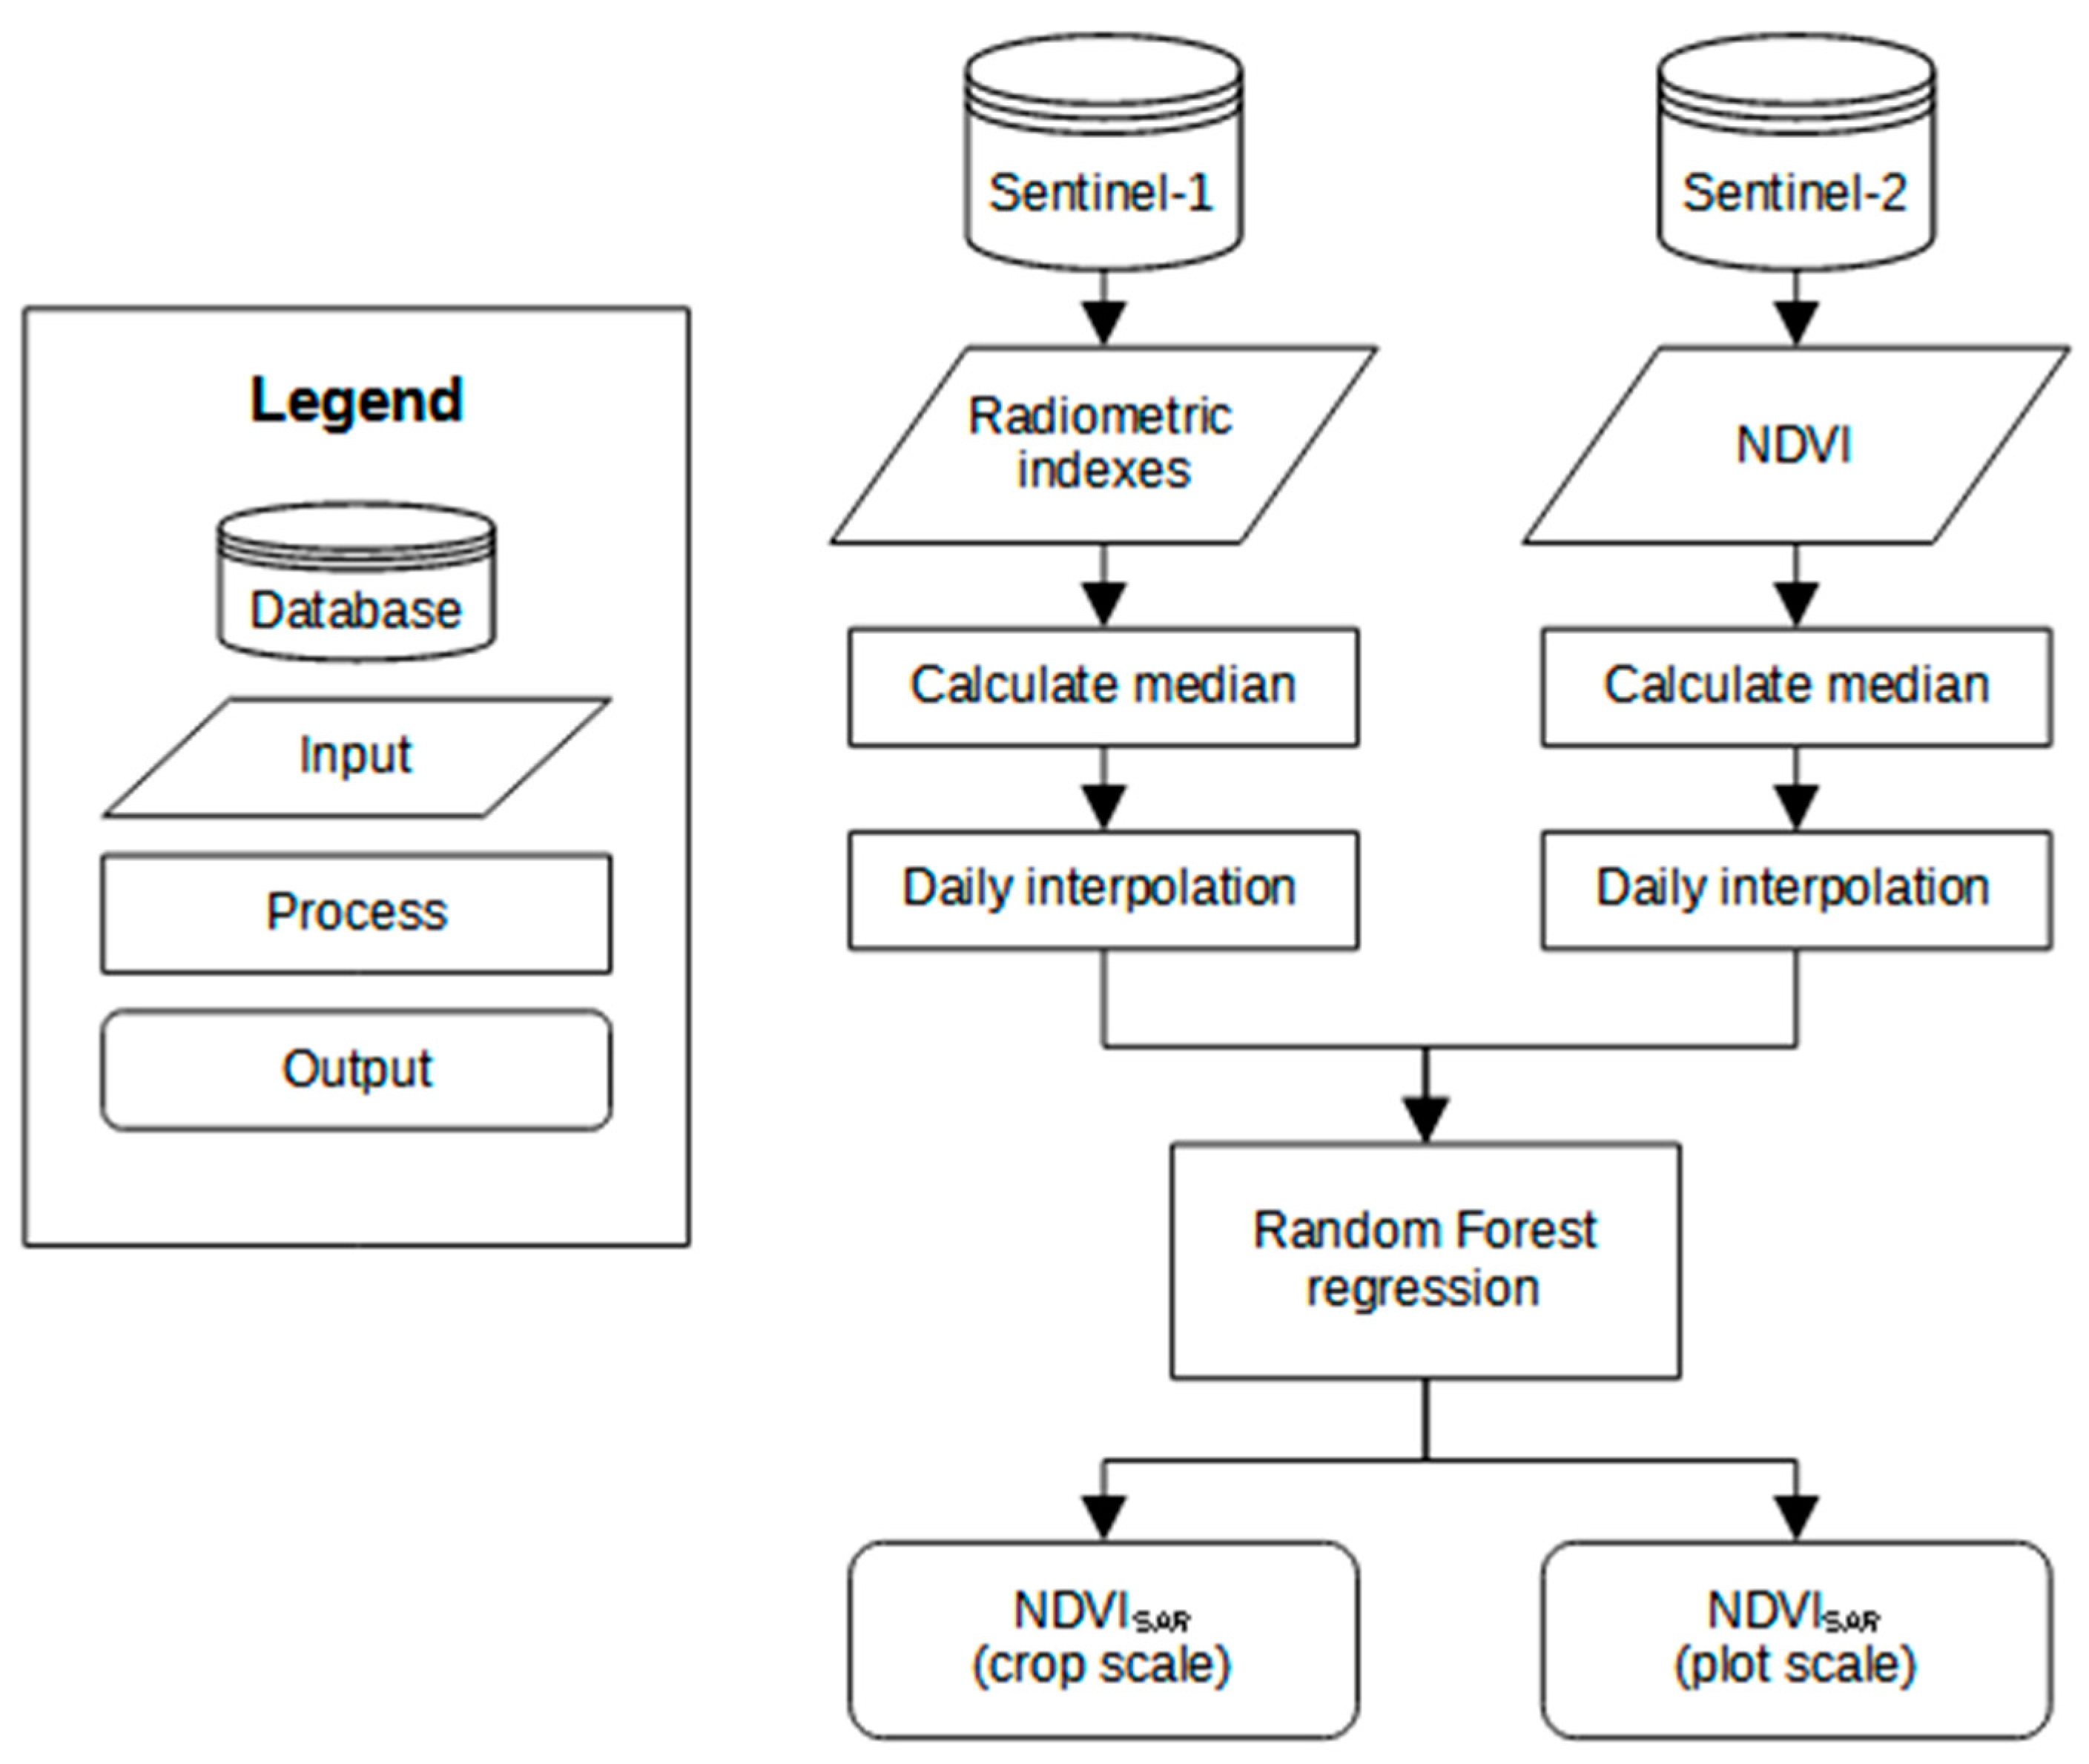
2.3. NDVI Estimation from SAR Indices

Figure 2 illustrates the workflow developed in this study for NDVI estimation using SAR data. Sentinel-1 (S1) and Sentinel-2 (S2) imagery was used during the crop growth period to calculate a set of SAR radiometric indices and NDVI, respectively. Each plot was divided into 20 × 20 m units, and the median value of each index was calculated for those units. Based on the assumption that the radiometric index changes during crop development progress gradually over short time intervals [64], a daily interpolation was applied to each radiometric index time series derived from the satellite imagery of each plot. Subsequently, the Saviztky–Golay filter [65] was applied to reduce residual noise in the Sentinel-1 and Sentinel-2 radiometric index time series caused by cloud detection errors [66,67,68].
Based on the index time series, a Random Forest Regression (RF-R) model was employed to estimate NDVI from Sentinel-1 radiometric indices. RF-R is a machine learning regression algorithm that generates predictions by aggregating outcomes from multiple regression trees, each trained on random subsets of samples and variables [69]. This approach effectively handles high-dimensional data and multicollinearity while remaining robust against overfitting. Additionally, two training strategies were considered for NDVI estimation: crop-scale and plot-scale. The crop-scale strategy involves developing a general NDVI estimation model using data from all analyzed plots, whereas the plot-scale strategy involves training the model with data specific to the individual plots.
The application of RF-R was divided into four phases: (i) development of an initial RF-R model to estimate NDVI using all Sentinel-1 radiometric indices, (ii) selection of the most relevant indices within the model, (iii) hyperparameter optimization, and finally, (iv) generation of the final RF-R model. The dataset with radiometric indices was split between 70%, for training, and 30%, for testing. From the initial RF-R model, the Sentinel-1 radiometric indices that contributed most significantly to NDVI estimation were identified in each case. This feature importance assessment is a critical step in machine learning, as it enables model simplification, improved accuracy, and enhances computational efficiency. Using the selected S1 indices, hyperparameter optimization was performed by systematically tuning the model parameters that control the learning process to enhance predictive performance. This approach improves model accuracy, prevents overfitting, and ensures computational efficiency.
To evaluate model performance, four statistical measures were calculated: mean absolute error (MAE) (Equation (1)), root mean square error (RMSE) (Equation (2)), coefficient of determination (R2) (Equation (3)), and the Willmott index (WI) (4). These accuracy metrics were calculated using only the dates where both optical NDVI and SAR data were available.
M A E = 1 n i = 1 n N D V I o b s , i N D V I p r e , i
R M S E = i = 1 n N D V I o b s , i N D V I p r e , i n
R 2 = 1 i = 1 n N D V I o b s , i N D V I p r e , i 2 i = 1 n N D V I o b s , i N D V I ¯ 2
W I = 1 i = 1 n N D V I p r e , i N D V I o b s , i 2 i = 1 n N D V I o b s , i N D V I ¯ + N D V I p r e , i N D V I ¯ 2
where N D V I p r e is the NDVI predicted by the model, N D V I o b s is the observed NDVI, N D V I ¯ means the mean value of NDVI, and n is the number of data pairs.

2.4. Crop Yield Estimation

Once the RF-R models for deriving NDVI from SAR data were validated, NDVI was estimated for the analyzed plots on dates when cloud cover prevented valid images from being obtained from Sentinel-2. As a result, three NDVI time series types were generated based on the source of satellite data: Sentinel-2, Sentinel-2 and Sentinel-1 at crop scale, and Sentinel-2 and Sentinel-1 at the plot scale. Each time series was transformed into a daily resolution and the maximum composite value was determined every five days. Finally, the relationship between NDVI values and crop yield at the end of the season was analyzed based on the coefficient of determination and the error rate every five days.

3. Results

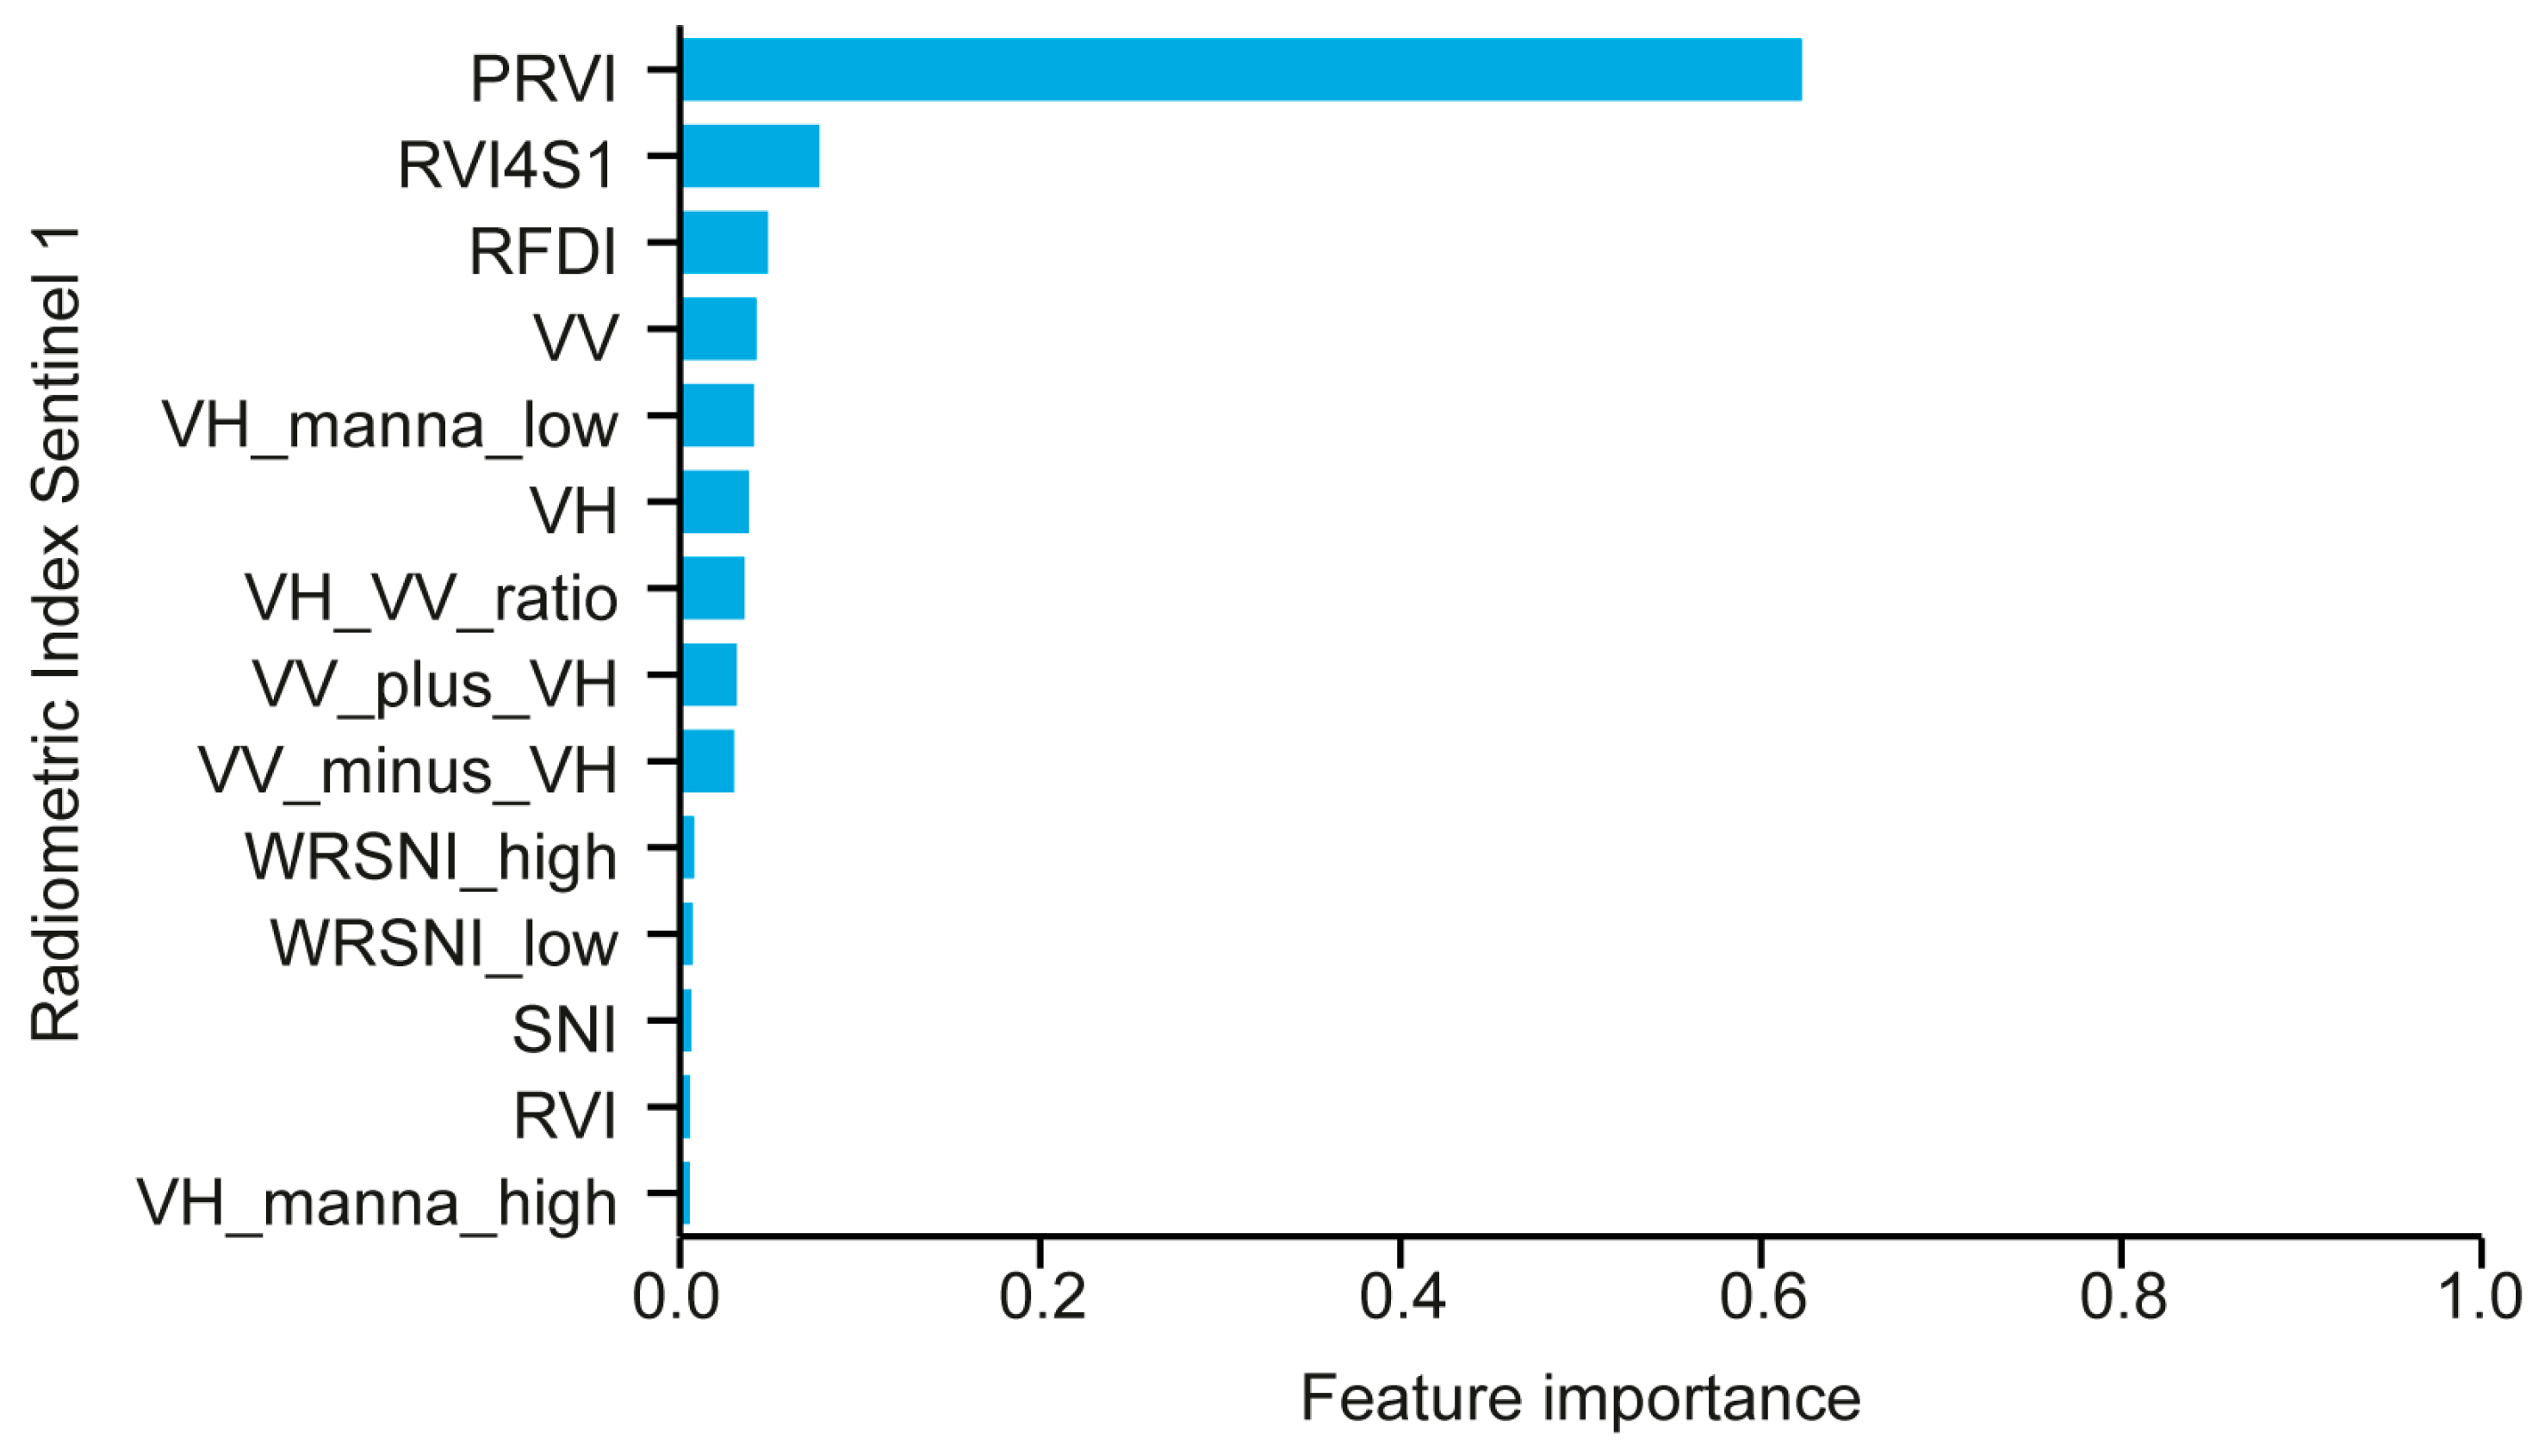
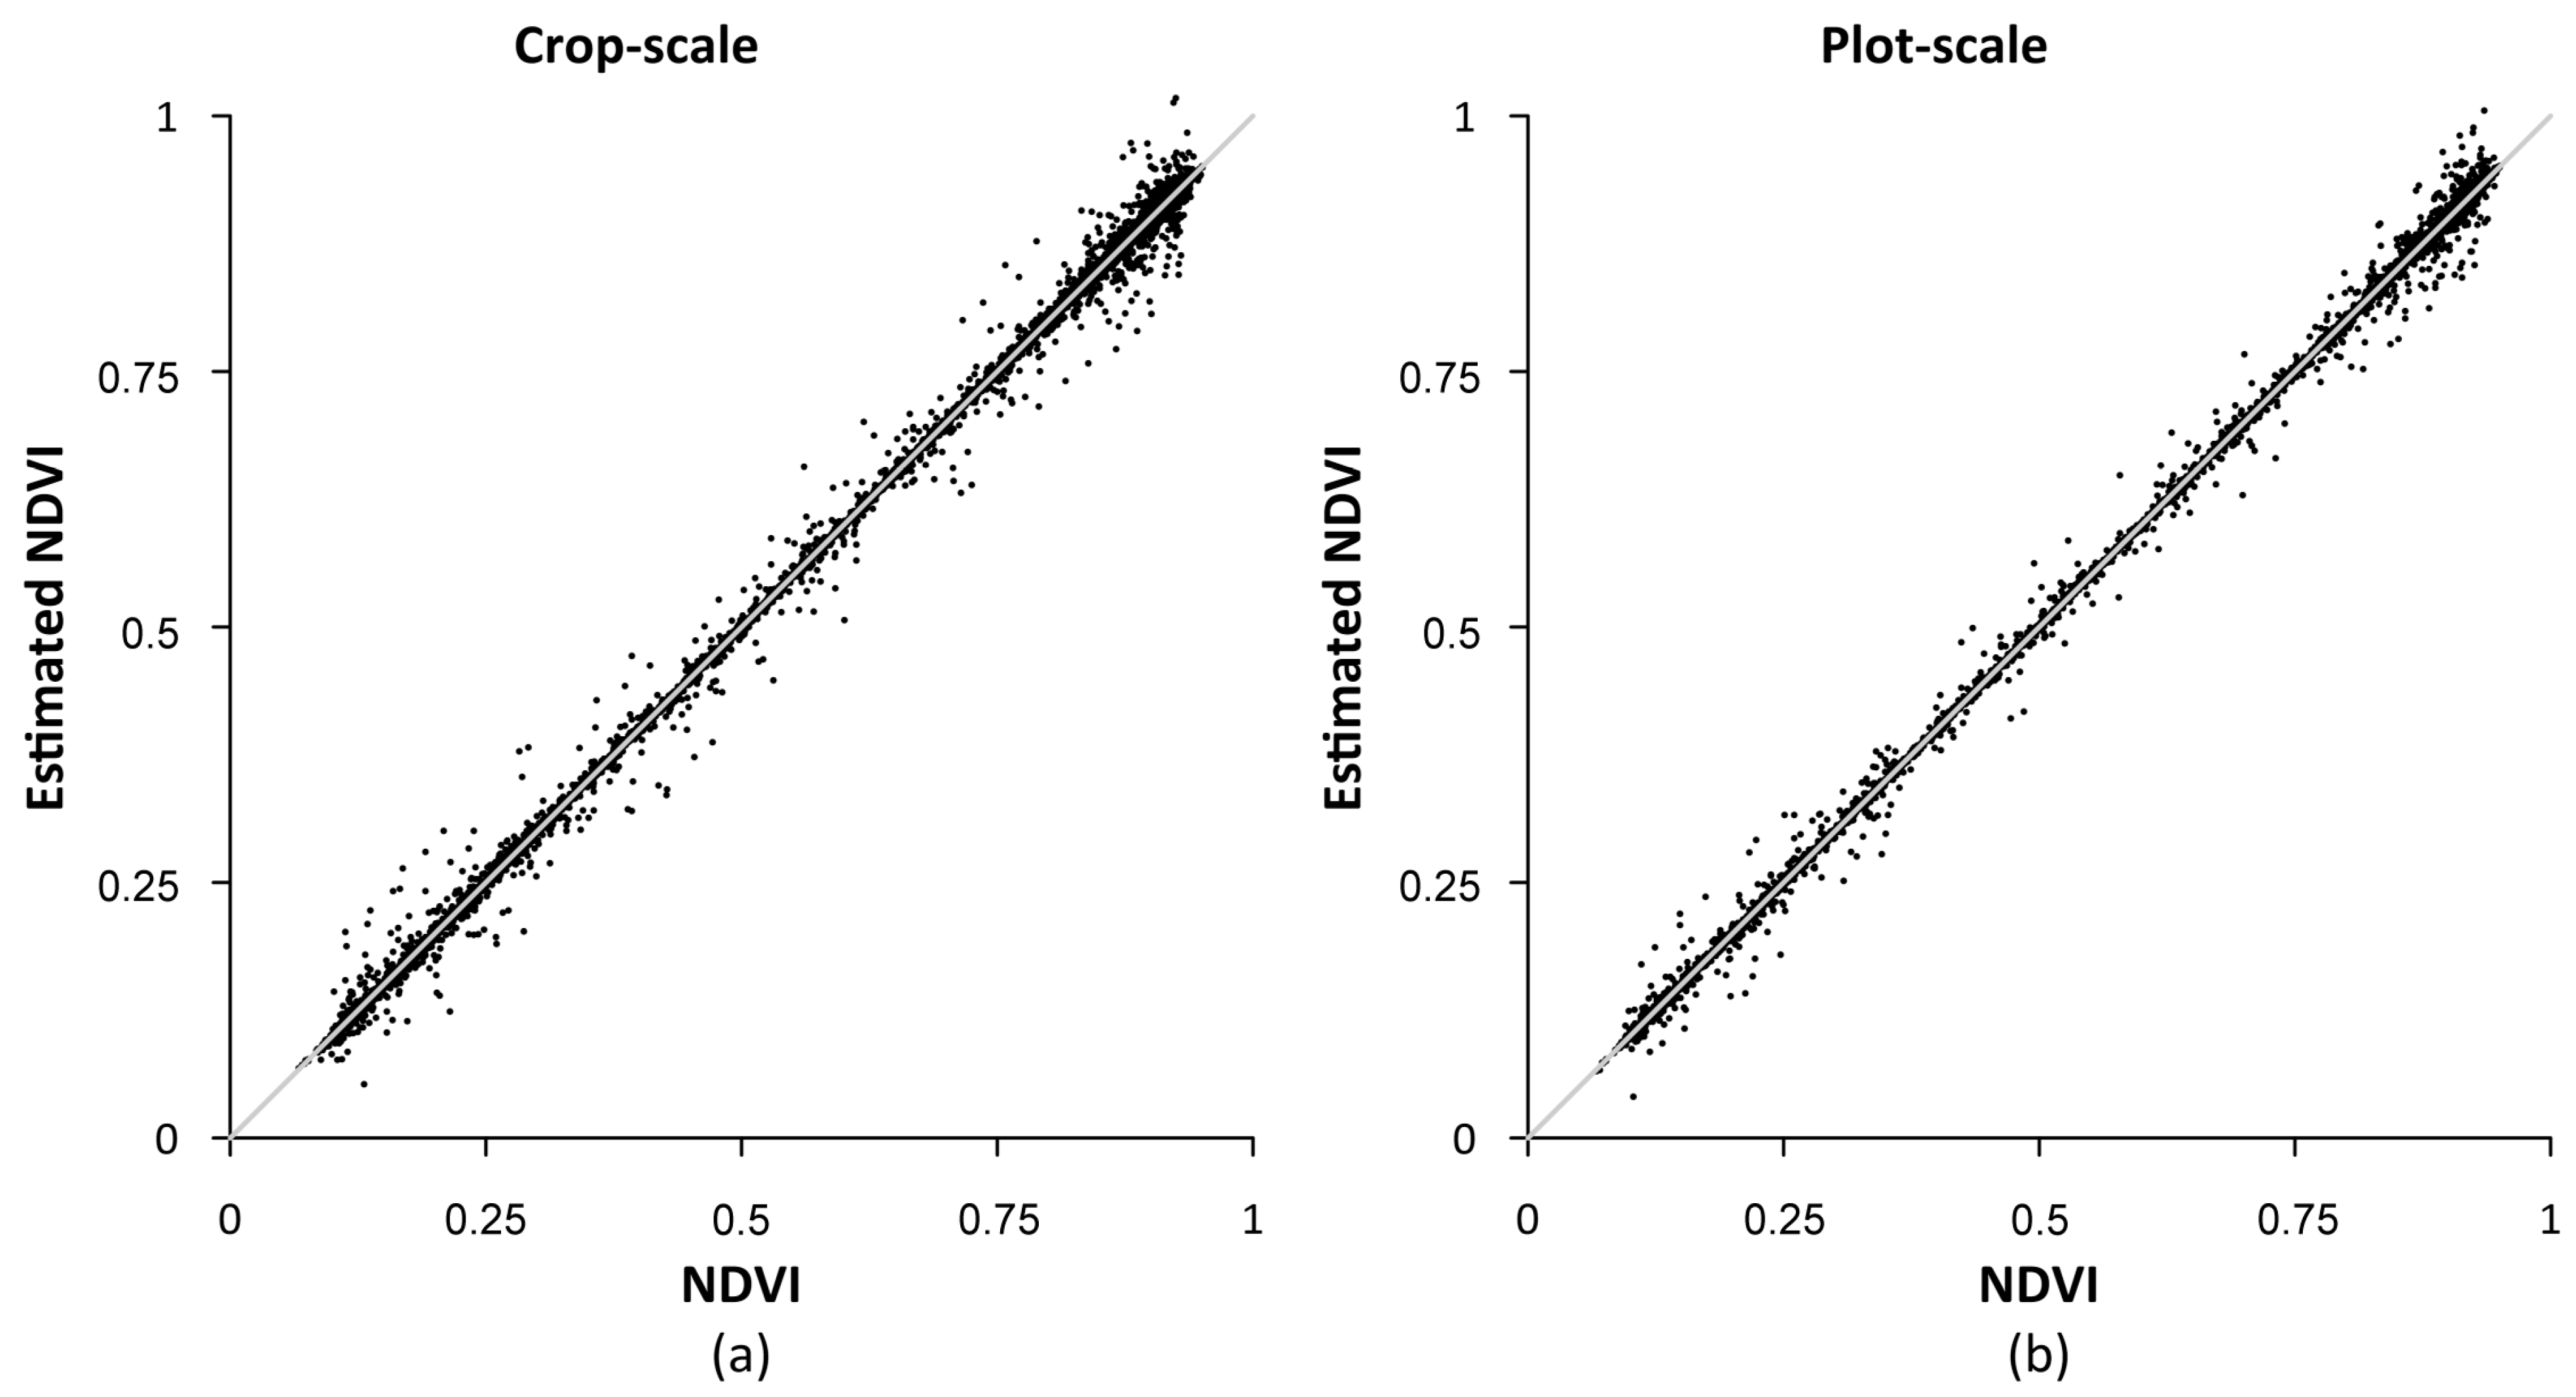
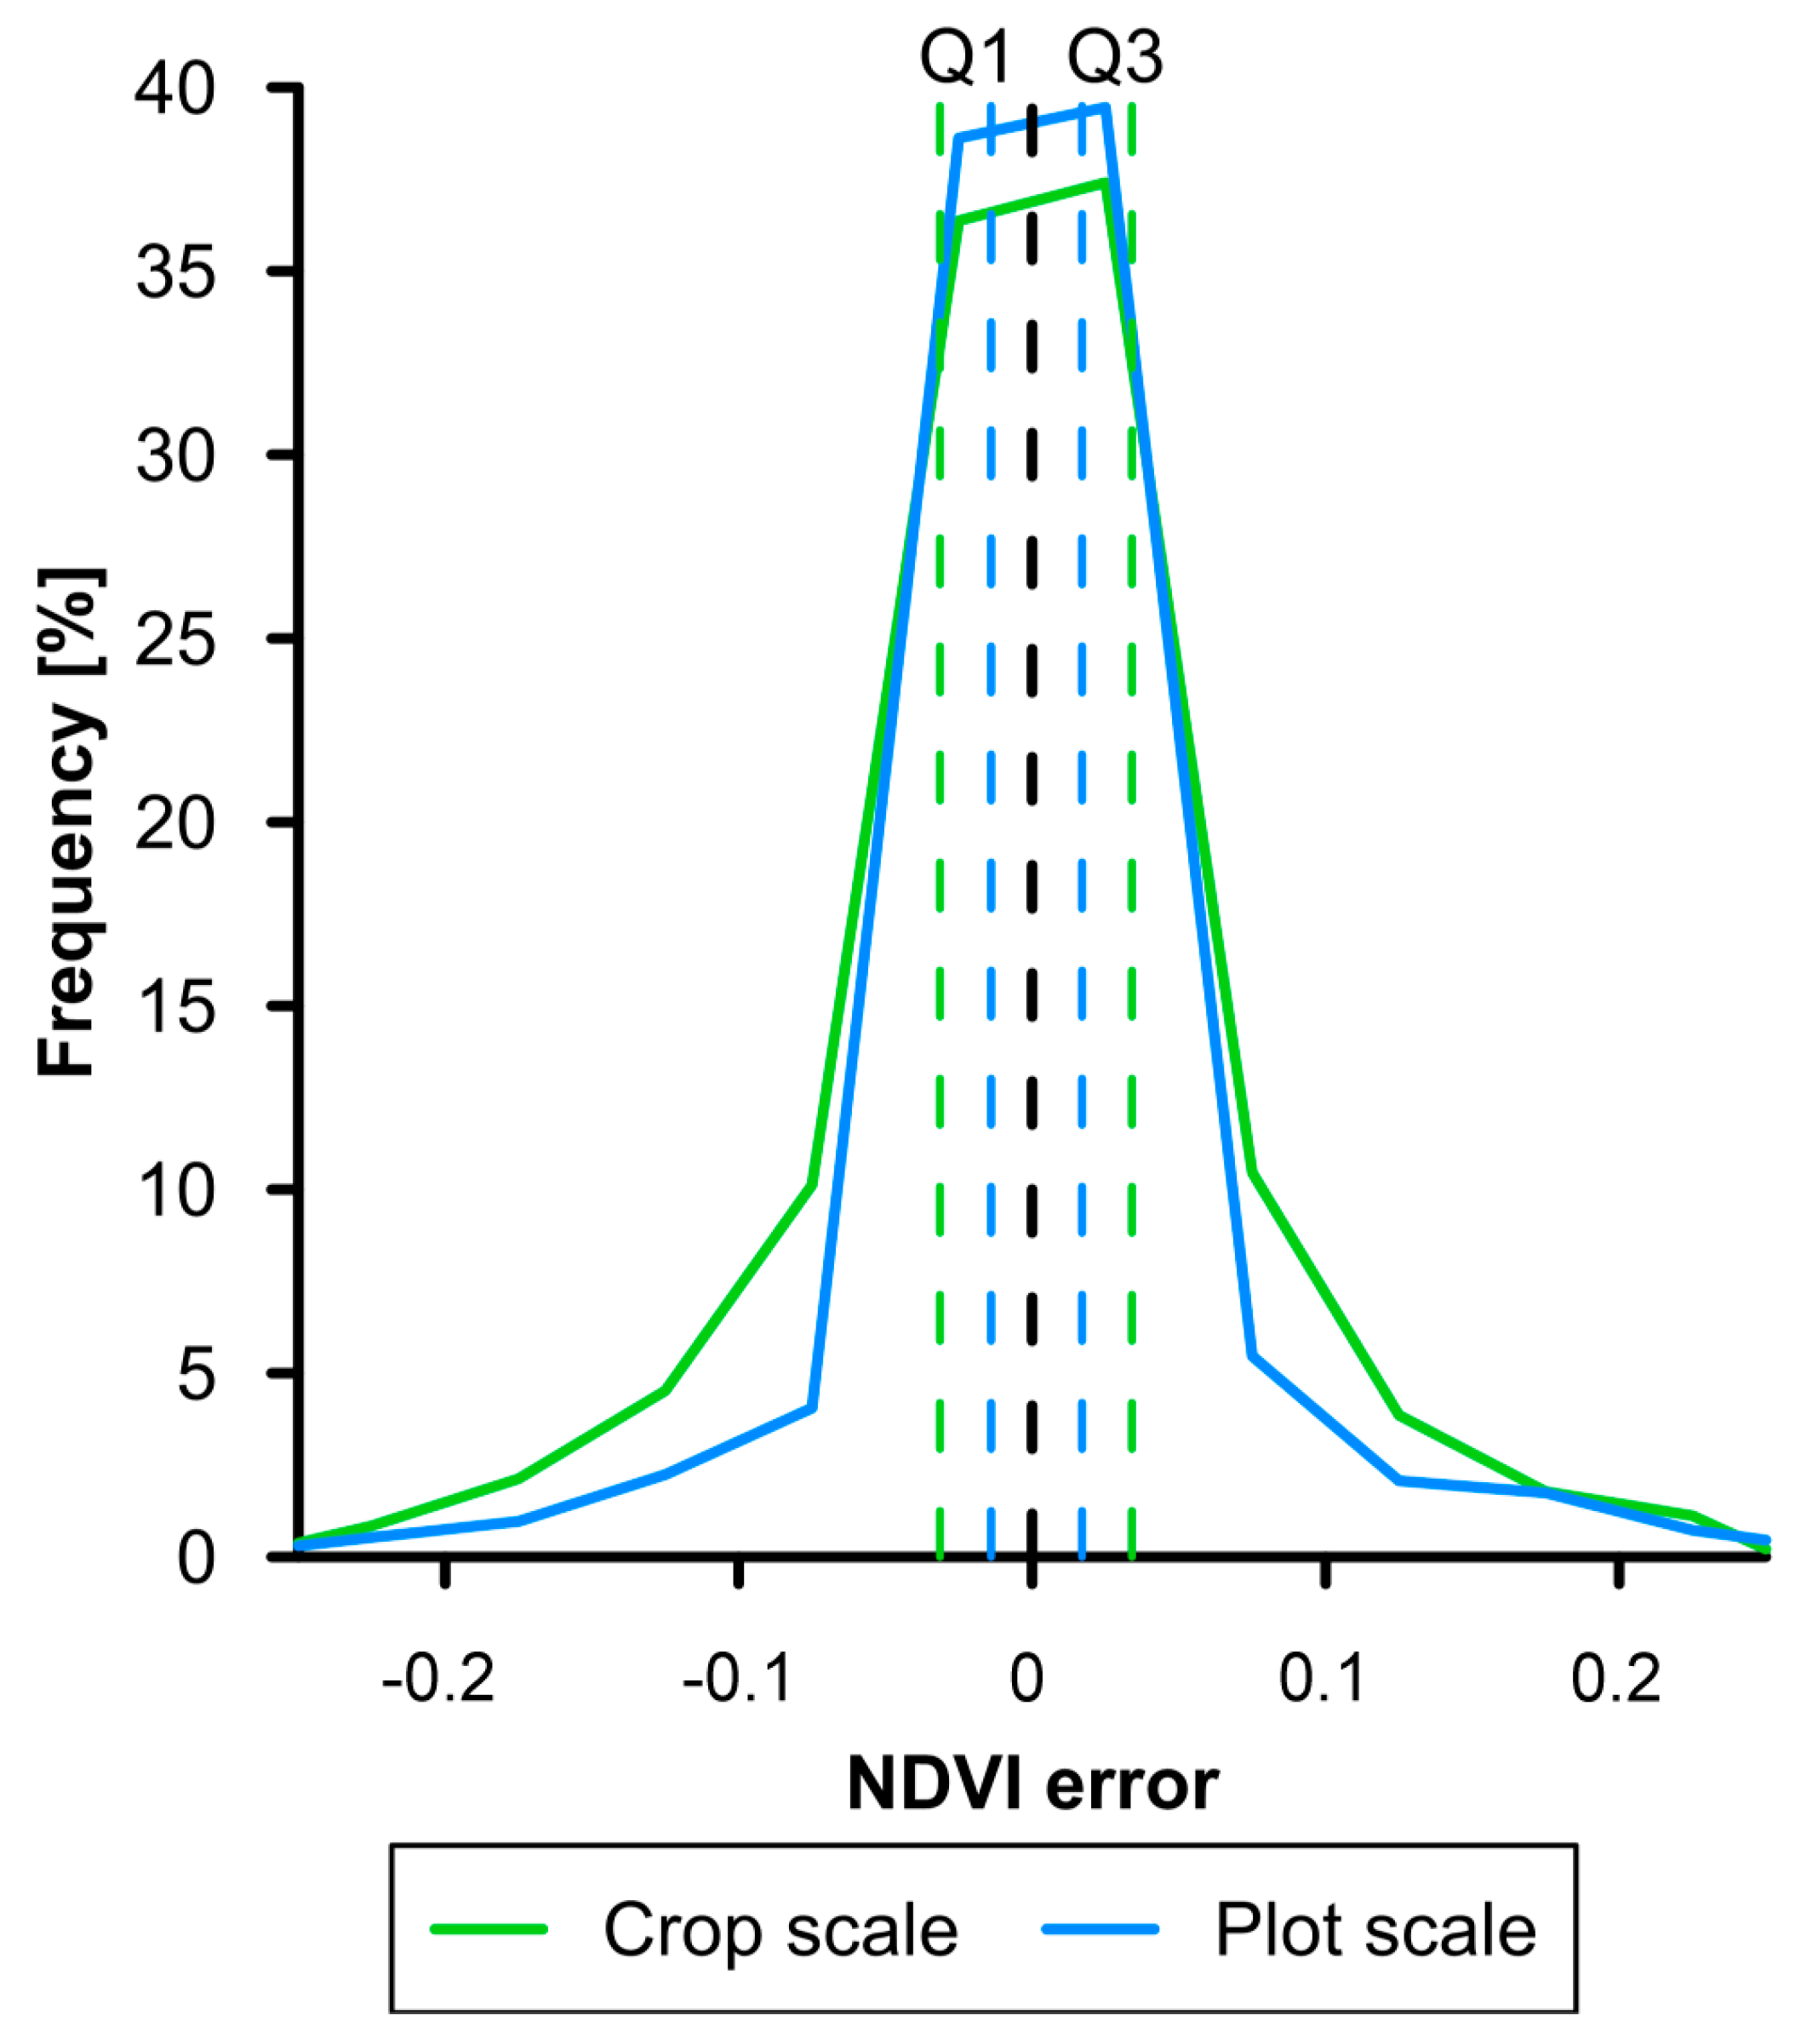
3.1. NDVI Estimation Based on Sentinel-1

First, a feature importance analysis was conducted to optimize model performance and reduce dimensionality in NDVI estimation using radiometric S1 indices. Figure 3 shows the feature importance scores of the model when all radiometric S1 indexes were used for NDVI estimation. PRVI and RVI4S1 were the most important variables, whereas RVI and VH Manna High made the lowest contributions. Moreover, the highest Out-of-Bag accuracy was achieved when four indices were used. Based on these results, PRVI, RVI4S1, RFDI and VV were the four selected as the optimal S1 indices for this study.
Once the S1 indices were selected, NDVI estimation was conducted using two different strategies: (i) training an RF model for each plot individually and (ii) compiling all plots together in a single model. Table 2 summarizes the NDVI estimation results for both approaches, while Figure 4 shows the relationship between observed and estimated NDVI. In the plot-scale model, results are presented as the mean value along its standard deviation. The findings show that the plot-scale model yielded lower errors compared to the general model. Specifically, the mean absolute difference between observed and estimated NDVI values was lower when in the plot-scale model (0.051 ± 0.01) than in the crop-scale model (0.062), suggesting a reduced average error. Additionally, the RMSE for NDVI estimation ranged between 0.055 and 0.090, which can be considered a low and acceptable NDVI error in both cases. However, the RMSE for the crop-scale model was 1.6 times higher than for the plot-scale model. Consequently, NDVI estimation at the plot-scale produced more accurate results. On the other hand, the coefficient of determination (R2) exceeded 0.9 in all cases and was consistently higher when using plot-scale models. Similarly, the Willmott index exceeded 0.9 in both strategies, indicating a strong agreement between the predicted and observed NDVI values, and was higher for plot-scale models. These results demonstrate that NDVI estimation was more precise and accurate when using plot-scale models.
Figure 5 shows the distribution of NDVI estimation errors. In both cases, errors were normally distributed and centered around zero, indicating the absence of systematic bias; the estimates neither consistently overestimated nor underestimated NDVI values. For the crop-scale model (green line), the interquartile range (IQR) was 0.06, with first (Q1) and third (Q3) quartiles of −0.03 and 0.03, respectively. In contrast, the plot-scale model (blue line) showed a narrower IQR of 0.02, with a Q1 value of −0.01 and a Q3 value of 0.01. This suggests that NDVI estimation errors in the plot-scale strategy were more tightly clustered around the median, reflecting a higher degree of homogeneity in error distribution.
As an example, Figure 6 shows the evolution of the NDVI index for one of the samples from the study plots. For the values derived from S2 imagery (red X’s), only seven observations are available throughout the crop cycle. This data gap is primarily due to cloud cover, especially during the early stages of crop development. Additionally, the figure illustrates NDVI estimations based on a crop-scale model (green circles) and a plot-scale model (blue squares) derived from S1 data. In both cases, the estimated NDVI values effectively capture the crop development dynamics and are consistent with the NDVI values obtained from S2. This approach enables the construction of a complete NDVI time series, overcoming the data gaps caused by cloud cover.

3.2. Crop Yield Estimation

For yield estimation based on NDVI, three time series were generated using either S2-derived indices alone or a combination of S2 and S1 data. S1-NDVI was estimated using models at both the crop and plot scale. In both approaches, for dates affected by cloud cover, the S2 NDVI value was replaced with an estimated NDVI value derived from S1 data from the nearest available date. Each time series was interpolated to daily resolution, and the maximum composite value was extracted every five days from the sowing date onward. The final analysis focused on assessing the relationship between NDVI and yield at the end of the season. Figure 7 illustrates, according to the type of time series considered, the progression of the coefficient of determination every five days throughout the season for yield estimation.
The evolution of the coefficient of determination across the three NDVI time series exhibited a similar behavioral pattern over time in relative terms. At the beginning of the time series, the relationship between NDVI and yield was negligible as expected, since the crop had not yet emerged or had yet to exhibit sufficient canopy cover to be detected by Sentinel-1 or Sentinel-2, given their spatial resolution. Between 15 and 70 days after sowing (depending on the data source), statistically significant relationships between NDVI and yield emerged. Finally, 20 days before harvest, yield estimation in all cases showed a low and non-significant coefficient of determination.
Using only Sentinel-2 data (red line), yield estimation resulted in R2 values below 0.5 throughout the time series. In contrast, the two NDVI time series integrating data from Sentinel-1 and Sentinel-2 showed a stronger and more stable relationship from 15 to 20 days post-sowing until 20 days before harvest. Estimating NDVI from a crop-scale model (green line) resulted in an R2 of 0.62 (p-value < 0.05) at 15 days post-sowing, with a slight increase that stabilized between 0.63 and 0.76 from 25 to 60 days post-sowing. Finally, the time series formed by combining NDVI values Sentinel-2 and Sentinel-1 estimated at the plot scale (blue line) exhibited the best R2 values, ranging from 0.68 to 0.89. As with the previous case, significant R2 values appeared from 15 days after sowing until 20 days before harvest. The use of the RF-R models fitted to plot-level not only resulted in higher R2 values, but it also presented higher significance than the use of the RF-R model at crop scale.
Figure 8 shows the prediction error rate for yield estimation every five days from sowing. In all cases, the error rate followed a consistent trend: high near the sowing date, decreasing as the crop developed, and increasing again approximately 20 days before harvest. The results highlight a 50-day window where the error rate significantly decreases in each case.
Using only Sentinel-2 data resulted in the highest error rate within the temporal window from 20 to 70 days after sowing (DAS). The lowest error was achieved at 35 DAS, with an error rate of 14,6%. In contrast, integrating NDVI values derived from Sentinel-2 with those estimated from Sentinel-1 significantly reduced the error rate, keeping the values below 5%. Among the two models employed, the best performance was observed with the model estimating NDVI at the plot scale, achieving the lowest error rate of 1.4% at 15 DAS. In contrast, the model estimating NDVI at the crop scale achieved its best result at 15 DAS, with an error rate of 2.7%. On average, the use of predictions at the plot scale led to an error reduction of 1.1% compared to the predictions made with data at crop scale.

4. Discussion

The need for consistent and frequent NDVI time series has been increasing over time as companies and end-users are integrating Earth Observation (EO) datasets into their applications, workflows, and decision-making processes. In this context, recent public and commercial EO programs have enabled improvements in temporal resolution through the massive and frequent generation of EO datasets. Even so, there are regions with very high cloud cover, which is the main factor hindering the constant generation of NDVI values over time. Additionally, there is always the risk of having short periods of cloud cover during critical moments of the crop cycle, such as crop emergence. Increasing temporal resolution by using optical sensors does not solve this problem. However, the use of SAR sensors could be an alternative means to ensure consistent and frequent NDVI values in these cases due to their ability to penetrate through clouds. In this study, we explored the integration of Sentinel-1 and Sentinel-2 data to enhance NDVI estimation and yield prediction of spinach. Below, we discussed key findings and their potential applications.

4.1. Predicion of NDVI with Sentinel-1 Data

Many regions of the world have cloud cover for long periods of time, which negatively impacts the ability of multispectral satellites to monitor crops. For example, much of eastern North America has cloud cover over 60% of the time; moreover, equatorial areas of South America, Africa, and Southeast Asia have cloud cover over 75% of the time [70]. Monitoring crops studies require dense time series observations, and even short data gaps can have a negative impact.
Previous studies have addressed data gaps in multispectral imagery and the resulting spectral indexes using various methods. A common approach is to composite multiple dates of imagery to replace pixels affected by cloud cover [71,72]. However, the resulting composite images may include pixels from widely different dates and seasonal conditions because of persistent cloud cover in certain areas. While these composite images can achieve high accuracy for some applications, they tend to be less reliable for agricultural purpose, particularly in regions with prolonged cloud cover [73].
A review of the literature provides insight into machine learning models [74,75,76,77] to predict vegetation indexes from SAR data by gap-filling. Machine learning regression methods such as RF or support vector machine have been used to predict NDVI using SAR, with differing results. While previous studies have reported predictions of R2 values ranging from 0.71 [75] to 0.92 [77], other studies have encountered difficulties in prediction, obtaining lower R2 values [78].
In this study, the RF-R models created for NDVI estimation from SAR data proved to be accurate, precise, and capable of predicting NDVI values throughout different stages of the crop cycle. The fact that the models developed at the plot scale presented better validation metrics could indicate the importance of considering the variety and specificities of the plot. Nevertheless, the model developed at the crop level also achieved a high R2 and low error levels, indicating that it is possible to establish a robust NDVI estimation model suitable for different varieties and cultivation conditions. This kind of robust model could be of interest to the processing industry.

4.2. Yield Prediction Using NDVI Time Series

In our study, the most prominent result was the improvement in the accuracy achieved by including the NDVI estimations from SAR-data for the cloudy days in the NDVI time series. The R2 values achieved when using S2 data alone were in accordance with the results reported by Marone et al. [15] when validating their methodology using field data. Closing the gaps caused by clouds in the NDVI time series using the estimations from S1 data led to R2 values for yield prediction in the range of 0.63 to 0.89 between 15 and 70 DAS. Such high accuracy in yield prediction for spinach has only been achieved using UAV remote sensing [13,14]. As such, farmers and the processing industry may find the workflow presented in this paper more appealing due to the free availability of the satellite images and the elimination of field visits to acquire UAV imagery. The presented methodology is also interesting for the processing industry because having good predictions of yield as early as 15 DAS is of paramount importance to organizing activities related to harvesting, processing, and storing spinach crops.
The use of NDVI estimations with the RF-R models developed at the plot scale led to more accurate results in yield prediction than the use of the RF-R model trained with the data at crop scale. This result highlights the importance of considering spinach variety and the local conditions of the plot.
Although good predictions were achieved between 15 and 70 DAS, the accuracy was lower at the beginning and end of the time series. The error rate at the beginning could be attributed to the crop being in its early phenological stages, with no significant canopy cover, leading the satellite imagery to predominantly capture soil data. Conversely, the increase in error rate 20 days before harvest is attributed, as in previous studies [79], to agronomic management aimed at optimizing conditions near harvest, such as fertilizer application, which result in minimal variability in NDVI values, thereby weakening their relationship to yield.
The results presented in this study are limited to the yield estimation for the first cut of spinach. To estimate the yield for the second cut, new models would need to be developed, as the relationships between SAR data and NDVI are likely to differ due to variation in spinach regrowth. Future research should address various aspects related to both the processing of remote sensing data and yield prediction. Regarding data processing, future studies should evaluate the integration of ascending and descending Sentinel-1 orbits and analyze the estimation of additional optical vegetation indices. In terms of yield estimation, research should focus on estimating yield for the second cut and incorporating data from different growing seasons to enhance the robustness and transferability of the developed models.

5. Conclusions

This study demonstrates the significant advantages of integrating Sentinel-1 SAR data with Sentinel-2 optical imagery for NDVI estimation and crop yield prediction. The results confirm that SAR-derived NDVI can effectively complement optical data, mitigating the limitations imposed by cloud cover and improving the temporal continuity of a NDVI time series. The integration of SAR-based NDVI significantly reduced yield estimation errors, particularly during critical phenological stages. The study highlights a 50-day window in which the error rate remained low, demonstrating the potential for early and reliable yield forecasts.
From an operational perspective, this study provides valuable insights for precision agriculture. The ability to estimate NDVI under cloud cover enables more robust yield predictions, facilitating earlier and more informed decision making. Furthermore, the methodological framework developed here can be adapted to other crops and regions, expanding its applicability in agricultural monitoring.

Author Contributions

F.-J.M.-C. and J.T.A.-J. conceived and designed the experiment; F.-J.M.-C., J.T.A.-J. and J.T.-S. performed the experiment; F.-J.M.-C., J.T.A.-J., S.C.-M. and F.P.-P. analyzed the data; F.-J.M.-C. wrote the draft; , F.-J.M.-C. and J.T.-S. wrote and edited the final version. All authors have read and agreed to the published version of the manuscript.

Funding

This research is part of the ENIA International Chair in Agriculture, University of Córdoba (TSI-100921-2023-3), funded by the Secretary of State for Digitalization and Artificial Intelligence and by the European Union—Next Generation EU. Recovery, Transformation, and Resilience Plan.

Data Availability Statement

Data are available on request from the authors. The data that support the findings of this study are available from the corresponding author, upon reasonable request.

Conflicts of Interest

The authors declare no conflicts of interest.

References

  1. Hoffman, L.A.; Etienne, X.L.; Irwin, S.H.; Colino, E.V.; Toasa, J.I. Forecast Performance of WASDE Price Projections for U.S. Corn. Agric. Econ. 2015, 46, 157–171. [Google Scholar] [CrossRef]
  2. Sherrick, B.J.; Lanoue, C.A.; Woodard, J.; Schnitkey, G.D.; Paulson, N.D. Crop Yield Distributions: Fit, Efficiency, and Performance. Agric. Financ. Rev. 2014, 74, 348–363. [Google Scholar] [CrossRef]
  3. Sun, J.; Di, L.; Sun, Z.; Shen, Y.; Lai, Z. County-Level Soybean Yield Prediction Using Deep CNN-LSTM Model. Sensors 2019, 19, 4363. [Google Scholar] [CrossRef]
  4. Liu, J.; Shang, J.; Qian, B.; Huffman, T.; Zhang, Y.; Dong, T.; Jing, Q.; Martin, T. Crop Yield Estimation Using Time-Series MODIS Data and the Effects of Cropland Masks in Ontario, Canada. Remote Sens. 2019, 11, 2419. [Google Scholar] [CrossRef]
  5. Li, Y.; Guan, K.; Yu, A.; Peng, B.; Zhao, L.; Li, B.; Peng, J. Toward Building a Transparent Statistical Model for Improving Crop Yield Prediction: Modeling Rainfed Corn in the U.S. Field Crops Res. 2019, 234, 55–65. [Google Scholar] [CrossRef]
  6. Bocca, F.F.; Rodrigues, L.H.A. The Effect of Tuning, Feature Engineering, and Feature Selection in Data Mining Applied to Rainfed Sugarcane Yield Modelling. Comput. Electron. Agric. 2016, 128, 67–76. [Google Scholar] [CrossRef]
  7. Ji, Z.; Pan, Y.; Zhu, X.; Wang, J.; Li, Q. Prediction of Crop Yield Using Phenological Information Extracted from Remote Sensing Vegetation Index. Sensors 2021, 21, 1406. [Google Scholar] [CrossRef]
  8. Kern, A.; Barcza, Z.; Marjanović, H.; Árendás, T.; Fodor, N.; Bónis, P.; Bognár, P.; Lichtenberger, J. Statistical Modelling of Crop Yield in Central Europe Using Climate Data and Remote Sensing Vegetation Indices. Agric. For. Meteorol. 2018, 260–261, 300–320. [Google Scholar] [CrossRef]
  9. Qiao, M.; He, X.; Cheng, X.; Li, P.; Luo, H.; Zhang, L.; Tian, Z. Crop Yield Prediction from Multi-Spectral, Multi-Temporal Remotely Sensed Imagery Using Recurrent 3D Convolutional Neural Networks. Int. J. Appl. Earth Obs. Geoinf. 2021, 102, 102436. [Google Scholar] [CrossRef]
  10. Shuai, G.; Basso, B. Subfield Maize Yield Prediction Improves When In-Season Crop Water Deficit Is Included in Remote Sensing Imagery-Based Models. Remote Sens. Environ. 2022, 272, 112938. [Google Scholar] [CrossRef]
  11. Sharifi, A. Yield Prediction with Machine Learning Algorithms and Satellite Images. J. Sci. Food Agric. 2021, 101, 891–896. [Google Scholar] [CrossRef]
  12. FAO (Food and Agriculture Organization of the United Nations). FAOSTAT. Available online: https://www.fao.org/statistics/en (accessed on 24 February 2025).
  13. Awika, H.O.; Solorzano, J.; Cholula, U.; Shi, A.; Enciso, J.; Avila, C.A. Prediction Modeling for Yield and Water-Use Efficiency in Spinach Using Remote Sensing via an Unmanned Aerial System. Smart Agric. Technol. 2021, 1, 100006. [Google Scholar] [CrossRef]
  14. Jiang, X.; Sun, S.; Adamchuk, V.; Weisman, G.; Ramsay, P.; Rincon, A.R. Spinach Yield Mapping Using Multispectral UAV Imagery. Smart Agric. Technol. 2024, 7, 100389. [Google Scholar] [CrossRef]
  15. Marcone, A.; Impollonia, G.; Croci, M.; Blandinières, H.; Amaducci, S. Estimation of above Ground Biomass, Biophysical and Quality Parameters of Spinach (Spinacia oleracea L.) Using Sentinel-2 to Support the Supply Chain. Sci. Hortic. 2024, 325, 112641. [Google Scholar] [CrossRef]
  16. Aobpaet, A. Monitoring of Crop Growth Stages Using Sentinel-1 Synthetic Aperture Radar Data. Agric. Nat. Resour. 2022, 56, 307–320. [Google Scholar]
  17. Mandal, D.; Kumar, V.; Ratha, D.; Dey, S.; Bhattacharya, A.; Lopez-Sanchez, J.M.; McNairn, H.; Rao, Y.S. Dual Polarimetric Radar Vegetation Index for Crop Growth Monitoring Using Sentinel-1 SAR Data. Remote Sens. Environ. 2020, 247, 111954. [Google Scholar] [CrossRef]
  18. Ouaadi, N.; Jarlan, L.; Khabba, S.; Le Page, M.; Chakir, A.; Er-Raki, S.; Frison, P.-L. Are the C-Band Backscattering Coefficient and Interferometric Coherence Suitable Substitutes of NDVI for the Monitoring of the FAO-56 Crop Coefficient? Agric. Water Manag. 2023, 282, 108276. [Google Scholar] [CrossRef]
  19. Khabbazan, S.; Vermunt, P.; Steele-Dunne, S.; Ratering Arntz, L.; Marinetti, C.; van der Valk, D.; Iannini, L.; Molijn, R.; Westerdijk, K.; van der Sande, C. Crop Monitoring Using Sentinel-1 Data: A Case Study from The Netherlands. Remote Sens. 2019, 11, 1887. [Google Scholar] [CrossRef]
  20. Monsalve-Tellez, J.M.; Torres-León, J.L.; Garcés-Gómez, Y.A. Evaluation of SAR and Optical Image Fusion Methods in Oil Palm Crop Cover Classification Using the Random Forest Algorithm. Agriculture 2022, 12, 955. [Google Scholar] [CrossRef]
  21. Saad El Imanni, H.; El Harti, A.; Panimboza, J. Investigating Sentinel-1 and Sentinel-2 Data Efficiency in Studying the Temporal Behavior of Wheat Phenological Stages Using Google Earth Engine. Agriculture 2022, 12, 1605. [Google Scholar] [CrossRef]
  22. Frison, P.-L.; Fruneau, B.; Kmiha, S.; Soudani, K.; Dufrêne, E.; Le Toan, T.; Koleck, T.; Villard, L.; Mougin, E.; Rudant, J.-P. Potential of Sentinel-1 Data for Monitoring Temperate Mixed Forest Phenology. Remote Sens. 2018, 10, 2049. [Google Scholar] [CrossRef]
  23. Veloso, A.; Mermoz, S.; Bouvet, A.; Le Toan, T.; Planells, M.; Dejoux, J.-F.; Ceschia, E. Understanding the Temporal Behavior of Crops Using Sentinel-1 and Sentinel-2-like Data for Agricultural Applications. Remote Sens. Environ. 2017, 199, 415–426. [Google Scholar] [CrossRef]
  24. Holtgrave, A.-K.; Röder, N.; Ackermann, A.; Erasmi, S.; Kleinschmit, B. Comparing Sentinel-1 and -2 Data and Indices for Agricultural Land Use Monitoring. Remote Sens. 2020, 12, 2919. [Google Scholar] [CrossRef]
  25. Filgueiras, R.; Mantovani, E.C.; Althoff, D.; Fernandes Filho, E.I.; Cunha, F.F. Crop NDVI Monitoring Based on Sentinel 1. Remote Sens. 2019, 11, 1441. [Google Scholar] [CrossRef]
  26. Mazza, A.; Gargiulo, M.; Scarpa, G.; Gaetano, R. Estimating the NDVI from SAR by Convolutional Neural Networks. In Proceedings of the IGARSS 2018—2018 IEEE International Geoscience and Remote Sensing Symposium, Valencia, Spain, 22–27 July 2018; pp. 1954–1957. [Google Scholar]
  27. Periasamy, S. Significance of Dual Polarimetric Synthetic Aperture Radar in Biomass Retrieval: An Attempt on Sentinel-1. Remote Sens. Environ. 2018, 217, 537–549. [Google Scholar] [CrossRef]
  28. Bai, Z.; Fang, S.; Gao, J.; Zhang, Y.; Jin, G.; Wang, S.; Zhu, Y.; Xu, J. Could Vegetation Index Be Derive from Synthetic Aperture Radar?—The Linear Relationship between Interferometric Coherence and NDVI. Sci. Rep. 2020, 10, 6749. [Google Scholar] [CrossRef]
  29. Jiao, X.; Heather, M.; and Dingle Robertson, L. Monitoring Crop Growth Using a Canopy Structure Dynamic Model and Time Series of Synthetic Aperture Radar (SAR) Data. Int. J. Remote Sens. 2021, 42, 6433–6460. [Google Scholar] [CrossRef]
  30. Izquierdo-Verdiguier, E.; Zurita-Milla, R. An Evaluation of Guided Regularized Random Forest for Classification and Regression Tasks in Remote Sensing. Int. J. Appl. Earth Obs. Geoinf. 2020, 88, 102051. [Google Scholar] [CrossRef]
  31. Wang, L.; Zhou, X.; Zhu, X.; Dong, Z.; Guo, W. Estimation of Biomass in Wheat Using Random Forest Regression Algorithm and Remote Sensing Data. Crop J. 2016, 4, 212–219. [Google Scholar] [CrossRef]
  32. Ezzahar, J.; Ouaadi, N.; Zribi, M.; Elfarkh, J.; Aouade, G.; Khabba, S.; Er-Raki, S.; Chehbouni, A.; Jarlan, L. Evaluation of Backscattering Models and Support Vector Machine for the Retrieval of Bare Soil Moisture from Sentinel-1 Data. Remote Sens. 2020, 12, 72. [Google Scholar] [CrossRef]
  33. Kumar, P.; Prasad, R.; Choudhary, A.; Gupta, D.K.; Mishra, V.N.; Vishwakarma, A.K.; Singh, A.K.; Srivastava, P.K. Comprehensive Evaluation of Soil Moisture Retrieval Models under Different Crop Cover Types Using C-Band Synthetic Aperture Radar Data. Geocarto Int. 2019, 34, 1022–1041. [Google Scholar] [CrossRef]
  34. El Hajj, M.; Baghdadi, N.; Zribi, M.; Bazzi, H. Synergic Use of Sentinel-1 and Sentinel-2 Images for Operational Soil Moisture Mapping at High Spatial Resolution over Agricultural Areas. Remote Sens. 2017, 9, 1292. [Google Scholar] [CrossRef]
  35. Paloscia, S.; Pettinato, S.; Santi, E.; Notarnicola, C.; Pasolli, L.; Reppucci, A. Soil Moisture Mapping Using Sentinel-1 Images: Algorithm and Preliminary Validation. Remote Sens. Environ. 2013, 134, 234–248. [Google Scholar] [CrossRef]
  36. Kolecka, N.; Ginzler, C.; Pazur, R.; Price, B.; Verburg, P.H. Regional Scale Mapping of Grassland Mowing Frequency with Sentinel-2 Time Series. Remote Sens. 2018, 10, 1221. [Google Scholar] [CrossRef]
  37. Belgiu, M.; Csillik, O. Sentinel-2 Cropland Mapping Using Pixel-Based and Object-Based Time-Weighted Dynamic Time Warping Analysis. Remote Sens. Environ. 2018, 204, 509–523. [Google Scholar] [CrossRef]
  38. Wang, Y.; Fang, S.; Zhao, L.; Huang, X.; Jiang, X. Parcel-Based Summer Maize Mapping and Phenology Estimation Combined Using Sentinel-2 and Time Series Sentinel-1 Data. Int. J. Appl. Earth Obs. Geoinf. 2022, 108, 102720. [Google Scholar] [CrossRef]
  39. Harfenmeister, K.; Itzerott, S.; Weltzien, C.; Spengler, D. Detecting Phenological Development of Winter Wheat and Winter Barley Using Time Series of Sentinel-1 and Sentinel-2. Remote Sens. 2021, 13, 5036. [Google Scholar] [CrossRef]
  40. Tsakmakis, I.D.; Gikas, G.D.; Sylaios, G.K. Integration of Sentinel-Derived NDVI to Reduce Uncertainties in the Operational Field Monitoring of Maize. Agric. Water Manag. 2021, 255, 106998. [Google Scholar] [CrossRef]
  41. Amiri, M.; Pourghasemi, H.R. Chapter 8—Mapping the NDVI and Monitoring of Its Changes Using Google Earth Engine and Sentinel-2 Images. In Computers in Earth and Environmental Sciences; Pourghasemi, H.R., Ed.; Elsevier: Amsterdam, The Netherlands, 2022; pp. 127–136. ISBN 978-0-323-89861-4. [Google Scholar]
  42. Tenreiro, T.R.; García-Vila, M.; Gómez, J.A.; Jiménez-Berni, J.A.; Fereres, E. Using NDVI for the Assessment of Canopy Cover in Agricultural Crops within Modelling Research. Comput. Electron. Agric. 2021, 182, 106038. [Google Scholar] [CrossRef]
  43. Hall-Beyer, M. Comparison of Single-Year and Multiyear NDVI Time Series Principal Components in Cold Temperate Biomes. IEEE Trans. Geosci. Remote Sens. 2003, 41, 2568–2574. [Google Scholar] [CrossRef]
  44. Nagy, A.; Szabó, A.; Adeniyi, O.D.; Tamás, J. Wheat Yield Forecasting for the Tisza River Catchment Using Landsat 8 NDVI and SAVI Time Series and Reported Crop Statistics. Agronomy 2021, 11, 652. [Google Scholar] [CrossRef]
  45. Vreugdenhil, M.; Wagner, W.; Bauer-Marschallinger, B.; Pfeil, I.; Teubner, I.; Rüdiger, C.; Strauss, P. Sensitivity of Sentinel-1 Backscatter to Vegetation Dynamics: An Austrian Case Study. Remote Sens. 2018, 10, 1396. [Google Scholar] [CrossRef]
  46. Inoue, Y.; Peñuelas, J.; Miyata, A.; Mano, M. Normalized Difference Spectral Indices for Estimating Photosynthetic Efficiency and Capacity at a Canopy Scale Derived from Hyperspectral and CO2 Flux Measurements in Rice. Remote Sens. Environ. 2008, 112, 156–172. [Google Scholar] [CrossRef]
  47. Steele-Dunne, S.C.; McNairn, H.; Monsivais-Huertero, A.; Judge, J.; Liu, P.-W.; Papathanassiou, K. Radar Remote Sensing of Agricultural Canopies: A Review. IEEE J. Sel. Top. Appl. Earth Obs. Remote Sens. 2017, 10, 2249–2273. [Google Scholar] [CrossRef]
  48. Auquière, É. SAR Temporal Series Interpretation and Backscattering Modelling for Maize Growth Monitoring; Presses Universitaires de Louvain: Louvain-la-Neuve, Belgium, 2001. [Google Scholar]
  49. Lievens, H.; Martens, B.; Verhoest, N.E.C.; Hahn, S.; Reichle, R.H.; Miralles, D.G. Assimilation of Global Radar Backscatter and Radiometer Brightness Temperature Observations to Improve Soil Moisture and Land Evaporation Estimates. Remote Sens. Environ. 2017, 189, 194–210. [Google Scholar] [CrossRef]
  50. Ferrentino, E.; Nunziata, F.; Bignami, C.; Graziani, L.; Maramai, A.; Migliaccio, M.; Stramondo, S. On the Combination of Dual-Polarization Sentinel-1 Ascending/Descending Orbiting Passes to Estimate Damage Due to the 2016 Central Italy Earthquake. IEEE J. Sel. Top. Appl. Earth Obs. Remote Sens. 2022, 15, 9509–9518. [Google Scholar] [CrossRef]
  51. Wu, R.; Liu, G.; Bao, X.; Lv, J.; Shama, A.; Zhang, B.; Mao, W.; Chen, J.; Yang, Z.; Zhang, R. Eliminating Geometric Distortion with Dual-Orbit Sentinel-1 SAR Fusion for Accurate Glacial Lake Extraction in Southeast Tibet Plateau. Int. J. Appl. Earth Obs. Geoinf. 2025, 136, 104329. [Google Scholar] [CrossRef]
  52. Chang, J.G.; Shoshany, M.; Oh, Y. Polarimetric Radar Vegetation Index for Biomass Estimation in Desert Fringe Ecosystems. IEEE Trans. Geosci. Remote Sens. 2018, 56, 7102–7108. [Google Scholar] [CrossRef]
  53. Kim, Y.; Zyl, J.J. van A Time-Series Approach to Estimate Soil Moisture Using Polarimetric Radar Data. IEEE Trans. Geosci. Remote Sens. 2009, 47, 2519–2527. [Google Scholar] [CrossRef]
  54. Mitchard, E.T.A.; Saatchi, S.S.; Lewis, S.L.; Feldpausch, T.R.; Woodhouse, I.H.; Sonké, B.; Rowland, C.; Meir, P. Measuring Biomass Changes Due to Woody Encroachment and Deforestation/Degradation in a Forest–Savanna Boundary Region of Central Africa Using Multi-Temporal L-Band Radar Backscatter. Remote Sens. Environ. 2011, 115, 2861–2873. [Google Scholar] [CrossRef]
  55. Stafford, J.V. Precision Agriculture ’19; Wageningen Academic: Leiden, The Netherlands, 2019; ISBN 978-90-8686-888-9. [Google Scholar]
  56. Gitelson, A.A. Wide Dynamic Range Vegetation Index for Remote Quantification of Biophysical Characteristics of Vegetation. J. Plant Physiol. 2004, 161, 165–173. [Google Scholar] [CrossRef] [PubMed]
  57. Zhu, Z.; Woodcock, C.E. Object-Based Cloud and Cloud Shadow Detection in Landsat Imagery. Remote Sens. Environ. 2012, 118, 83–94. [Google Scholar] [CrossRef]
  58. Drusch, M.; Del Bello, U.; Carlier, S.; Colin, O.; Fernandez, V.; Gascon, F.; Hoersch, B.; Isola, C.; Laberinti, P.; Martimort, P.; et al. Sentinel-2: ESA’s Optical High-Resolution Mission for GMES Operational Services. Remote Sens. Environ. 2012, 120, 25–36. [Google Scholar] [CrossRef]
  59. Tucker, C.J. Red and Photographic Infrared Linear Combinations for Monitoring Vegetation. Remote Sens. Environ. 1979, 8, 127–150. [Google Scholar] [CrossRef]
  60. Hatfield, J.L.; Gitelson, A.A.; Schepers, J.S.; Walthall, C.L. Application of Spectral Remote Sensing for Agronomic Decisions. Agron. J. 2008, 100, S-117–S-131. [Google Scholar] [CrossRef]
  61. Huete, A.R.; Liu, H.Q.; Batchily, K.; van Leeuwen, W. A Comparison of Vegetation Indices over a Global Set of TM Images for EOS-MODIS. Remote Sens. Environ. 1997, 59, 440–451. [Google Scholar] [CrossRef]
  62. Gao, X.; Huete, A.R.; Ni, W.; Miura, T. Optical–Biophysical Relationships of Vegetation Spectra without Background Contamination. Remote Sens. Environ. 2000, 74, 609–620. [Google Scholar] [CrossRef]
  63. Atzberger, C. Advances in Remote Sensing of Agriculture: Context Description, Existing Operational Monitoring Systems and Major Information Needs. Remote Sens. 2013, 5, 949–981. [Google Scholar] [CrossRef]
  64. Fieuzal, R.; Baup, F.; Marais-Sicre, C. Monitoring Wheat and Rapeseed by Using Synchronous Optical and Radar Satellite Data—From Temporal Signatures to Crop Parameters Estimation. Adv. Remote Sens. 2013, 2, 19. [Google Scholar] [CrossRef]
  65. Savitzky, A.; Golay, M.J.E. Smoothing and Differentiation of Data by Simplified Least Squares Procedures. Anal. Chem. 1964, 36, 1627–1639. [Google Scholar] [CrossRef]
  66. Chen, Y.; Cao, R.; Chen, J.; Liu, L.; Matsushita, B. A Practical Approach to Reconstruct High-Quality Landsat NDVI Time-Series Data by Gap Filling and the Savitzky–Golay Filter. ISPRS J. Photogramm. Remote Sens. 2021, 180, 174–190. [Google Scholar] [CrossRef]
  67. Sadeghi, M.; Behnia, F.; Amiri, R. Window Selection of the Savitzky–Golay Filters for Signal Recovery From Noisy Measurements. IEEE Trans. Instrum. Meas. 2020, 69, 5418–5427. [Google Scholar] [CrossRef]
  68. Liu, X.; Ji, L.; Zhang, C.; Liu, Y. A Method for Reconstructing NDVI Time-Series Based on Envelope Detection and the Savitzky-Golay Filter. Int. J. Digit. Earth 2022, 15, 553–584. [Google Scholar] [CrossRef]
  69. Belgiu, M.; Drăguţ, L. Random Forest in Remote Sensing: A Review of Applications and Future Directions. ISPRS J. Photogramm. Remote Sens. 2016, 114, 24–31. [Google Scholar] [CrossRef]
  70. Wilson, A.M.; Jetz, W. Remotely Sensed High-Resolution Global Cloud Dynamics for Predicting Ecosystem and Biodiversity Distributions. PLoS Biol. 2016, 14, e1002415. [Google Scholar] [CrossRef] [PubMed]
  71. Man, C.D.; Thuy Thanh, N.; Hung Quang, B.; Kristofer, L.; and Nguyen, T.N.T. Improvement of Land-Cover Classification over Frequently Cloud-Covered Areas Using Landsat 8 Time-Series Composites and an Ensemble of Supervised Classifiers. Int. J. Remote Sens. 2018, 39, 1243–1255. [Google Scholar] [CrossRef]
  72. Griffiths, P.; van der Linden, S.; Kuemmerle, T.; Hostert, P. A Pixel-Based Landsat Compositing Algorithm for Large Area Land Cover Mapping. IEEE J. Sel. Top. Appl. Earth Obs. Remote Sens. 2013, 6, 2088–2101. [Google Scholar] [CrossRef]
  73. Gong, Z.; Ge, W.; Guo, J.; Liu, J. Satellite Remote Sensing of Vegetation Phenology: Progress, Challenges, and Opportunities. ISPRS J. Photogramm. Remote Sens. 2024, 217, 149–164. [Google Scholar] [CrossRef]
  74. Lasko, K. Gap Filling Cloudy Sentinel-2 NDVI and NDWI Pixels with Multi-Frequency Denoised C-Band and L-Band Synthetic Aperture Radar (SAR), Texture, and Shallow Learning Techniques. Remote Sens. 2022, 14, 4221. [Google Scholar] [CrossRef]
  75. Agrawal, R.; Mohite, J.D.; Sawant, S.A.; Pandit, A.; Pappula, S. Estimation of NDVI for Cloudy Pixels Using Machine Learning. Int. Arch. Photogramm. Remote Sens. Spat. Inf. Sci. 2022, XLIII-B3-2, 813–818. [Google Scholar] [CrossRef]
  76. Chang, J.G.; Kraatz, S.; Anderson, M.; Gao, F. Enhanced Polarimetric Radar Vegetation Index and Integration with Optical Index for Biomass Estimation in Grazing Lands Across the Contiguous United States. Remote Sens. 2024, 16, 4476. [Google Scholar] [CrossRef]
  77. Pelta, R.; Beeri, O.; Tarshish, R.; Shilo, T. Sentinel-1 to NDVI for Agricultural Fields Using Hyperlocal Dynamic Machine Learning Approach. Remote Sensing 2022, 14, 2600. [Google Scholar] [CrossRef]
  78. Haupt, S.; Engelbrecht, J.; Kemp, J. Predicting Modis EVI from SAR Parameters Using Random Forests Algorithms. In Proceedings of the 2017 IEEE International Geoscience and Remote Sensing Symposium (IGARSS), Fort Worth, TX, USA, 23–28 July 2017; pp. 4382–4385. [Google Scholar]
  79. Marino, S. Assessing the Agronomic Subfield Variability by Sentinel-2 NDVI Time-Series and Landscape Position. Agronomy 2023, 13, 44. [Google Scholar] [CrossRef]
Figure 1. Location of the study area: (a) general overview and (b) detailed overview with the plot locations.
Remotesensing 17 01412 g001
Figure 2. Schematic representation of the methodology for NDVI estimation using SAR data.
Remotesensing 17 01412 g002
Figure 3. Feature importance scores for NDVI estimation based on Sentinel-1 data.
Remotesensing 17 01412 g003
Figure 4. Scatter-plot of NDVI versus estimated NDVI of test dataset: (a) crop-scale and (b) plot-scale. The gray line represents the 1:1 line.
Remotesensing 17 01412 g004
Figure 5. Distribution of NDVI estimation errors using a crop-scale model (green line) and a plot-scale model (blue line).
Remotesensing 17 01412 g005
Figure 6. Evolution of NDVI using Sentinel-2 (red X), NDVI estimation based on S1 and a crop model (green circle), and a plot-scale model (blue square).
Remotesensing 17 01412 g006
Figure 7. Evolution of the coefficient of determination every 5 days using NDVI derived from: Sentinel-2 (red line), Sentinel-2 and Sentinel-1 using a crop-scale model (green line), and Sentinel-2 and Sentinel-1 using a plot-scale model (blue line).
Remotesensing 17 01412 g007
Figure 8. Temporal evolution of the error rate for the yield prediction models.
Remotesensing 17 01412 g008
Table 1. S1 radiometric indices and their corresponding expressions used in this study.
NameAcronymExpressionSource
Polarimetric Radar Vegetation IndexPRVI 1 V V V H + V V · V H [52]
Radar Vegetation IndexRVI 4 · V H V H + V V [53]
Radar Vegetation Index for Sentinel-1RVI4S1 V V V H + V V · 4 · V H V H + V V [17]
Radar Forest Degradation IndexRFDI V V V H V H + V V [54]
VH manna highVH_manna_high V H + 30 20 [55]
VH manna lowVH_manna_low V H + 25 20 [55]
Sentinel Normalized IndexSNI V H V V V H + V V [40]
Wide Dynamic Range Vegetation Index highWRSNI_high 0.1 · V H V V 0.1 · V H + V V [56]
Wide Dynamic Range Vegetation Index lowWRSNI_high 0.2 · V H V V 0.2 · V H + V V [56]
VH to VV ratioVH_VV_ratio V H V V [23]
VH minus VVVH_minus_VV V H V V No source
VH plus VVVH_plus_VV V H + V V No source
VH bandVHVHNo source
VV bandVVVVNo source
Table 2. Validation metrics of the RF-R models developed for NDVI estimation considering two strategies: plot-scale estimation and crop-scale estimation.
Plot-Scale 1Crop-Scale
MAE0.051 ± 0.010.062
RMSE0.055 ± 0.0190.090
R20.930 ± 0.0280.902
WI0.972 ± 0.0150.942
1 Mean values and standard deviations considering all plots analyzed in this study.
Disclaimer/Publisher’s Note: The statements, opinions and data contained in all publications are solely those of the individual author(s) and contributor(s) and not of MDPI and/or the editor(s). MDPI and/or the editor(s) disclaim responsibility for any injury to people or property resulting from any ideas, methods, instructions or products referred to in the content.

