Article

Unveiling the Drivers of Unplanned Urbanization: A High-Resolution Night Light Development Index Approach for Assessing Regional Inequality and Urban Growth in Dhaka

by
Kh Shakibul Islam
1,2,*,
Qiusheng Wu
1,
Md. Raihanul Islam
2 and
Hasan Muhammad Abdullah
2
1
Department of Geography and Sustainability, University of Tennessee, Knoxville, TN 37996, USA
2
GIS and Proximal Sensing Lab, Department of Agroforestry and Environment, Gazipur Agricultural University, Gazipur 1706, Bangladesh
*
Author to whom correspondence should be addressed.
Remote Sens. 2025, 17(8), 1397; https://doi.org/10.3390/rs17081397
Submission received: 10 March 2025 / Revised: 5 April 2025 / Accepted: 8 April 2025 / Published: 14 April 2025

Abstract

:
Rapid unplanned urbanization is a common phenomenon in developing countries and the necessity for making an urban area sustainable and livable is one of the major challenges of today’s world. While the timely identification of the factors contributing to rapid unplanned urbanization is essential, uncovering the core reasons behind this phenomenon remains one of the most challenging tasks. The Night Light Development Index (NLDI) can track and monitor urbanization over time and can be used for understanding and optimizing the use of urban space at night due to its timely availability and accessibility. Previous research has only been conducted using VIIRS or DMP OLS satellite imagery to calculate the NLDI. However, the temporal and spatial resolution of these types of imagery are quite poor and require a lot of preprocessing. In this research, these complexities are addressed by introducing a modified NLDI, leveraging high-resolution nighttime imagery from NASA’s Black Marble product suite and population data from NASA’s Socioeconomic Data and Applications Center (SEDAC). This study examines the core drivers of unplanned urbanization in Dhaka by analyzing changes in regional inequality, electrification patterns, and GDP in relation to nighttime light, amidst the significant challenges posed by rapid urbanization in developing countries. The results indicate significant transformations in Dhaka’s urban land cover change (ULCC), with substantial increases in built-up areas correlating with heightened electrification and economic activity/GDP, as evidenced by NTL radiance patterns. Furthermore, the modified NLDI effectively captures the nuances of urban development and inequality, offering insights into regional disparities and urban planning challenges. We find that the income inequality or the NLDI value is the highest in the Biman Bandar area (0.910), followed by Pallabi (0.665), Turag (0.640), and Khilkhet (0.587). These values indicate significant income disparity between affluent and impoverished populations within these regions.

1. Introduction

As of today, more than 56% of the global population (~4.4 billion people) reside in urban areas, and this number is anticipated to rise to 68% by 2050, highlighting the rapid pace of urbanization [1]. The growing trend of migration to urban areas is driven by the pursuit of better living conditions, improved access to education and healthcare, and, above all, greater economic opportunities. The urbanization process, which involves increasing population size, spatially extended land cover, and enhanced economic activity, contributes significantly to anthropogenic environmental changes [2]. While urbanization has been a driving factor behind economic growth and progress for millennia, the recent surge in migration to urban areas has posed enormous challenges in the path to making urbanization sustainable. Unplanned urbanization is a severe threat to civilization, causing a slew of issues such as traffic congestion, housing shortages, environmental degradation, inequity and social segregation, crime, health issues, and so on, especially in developing countries like Bangladesh [3,4,5]. Rapid urban land cover change (ULCC) has become a serious issue for megacities all around the world and Dhaka is no exception to this. With a population that has risen from 3 million in the 1980s to over 24 million now, Dhaka has become one of the world’s most densely populated cities [6,7].
As the majority of the people in most countries live in cities or urban areas, the demand for making urban areas more livable and sustainable has been present for years. The remote sensing of urban areas has the potential to be a powerful tool for detecting urban growth and supporting planners in developing successful strategies for urban sustainability. From the 1960s to the present, remote sensing has been recognized as the most effective method for long-term and large-scale surface data monitoring [8]. Remote sensing data provides a wealth of information on the processes and patterns of ULCC, and GIS (Geographic Information System) is an effective tool for mapping and analyzing these patterns [9]. Unlike daytime remote sensing, which is extensively utilized in applications such as land cover mapping [10], climate change analysis [11,12], and disaster management [13], night light remote sensing is an emerging technique with the potential to offer spatially continuous socioeconomic indicators as human activities exhibit a strong correlation with nighttime illumination. Nighttime light remote sensing has found extensive applications across various domains, including the estimation of socioeconomic parameters [14,15,16], the assessment of urbanization [17,18], the mapping of fishing vessels [19], land cover classification [20,21,22,23], and the evaluation of humanitarian crises [16,24,25]. This technique offers a valuable means for mapping spatial distributions of gross domestic product (GDP) [26,27], energy consumption [28,29], and the provision of public services [30,31]. NASA’s Black Marble product is considered one of the most advanced NTL products for monitoring and tracking geographic activity due to its excellent timeliness (near-real-time release) and global data coverage capability [32]. It paves the way for numerous applications, including tracking urbanization and socioeconomic trends, assessing armed conflicts and disasters, examining fisheries, calculating greenhouse gas emissions and energy consumption, and measuring light pollution and health implications [33]. The new and improved sensors, algorithms, and products for NTL, especially merged with other observations of Earth and auxiliary data (e.g., geolocated big data), have enormous potential for gaining comprehensive knowledge of human activities and their environmental repercussions in a changing world.
Using both geographic and socioeconomic information from land cover data and NTL data, the assessment of urban development status, urban functions, and urban spatial organization at different scales can become feasible. Given the geographic characteristics of NPP-VIIRS NTL data, they have the potential to reveal more socioeconomic information about urban development status than census data [34,35]. Quantifying the regional inequality of urban areas is an arduous and challenging task that often requires individual income data, a difficult-to-acquire variable. Historically, Gini coefficients derived from Lorenz curves have been used for measuring the distribution of wealth and income at the national and regional scales. However, the Gini coefficient has many shortcomings, as data are not available for many countries and the results are generally limited to single values representing the entire country. Also, due to the constraint of statistical units, statistical data do not always reveal the underlying mechanism of spatial disparity. In contrast, remotely sensed data, such as NTL data, provide an effective solution [36]. NTL data can serve as a proxy variable for income distribution and foresee the constraints posed by the Gini coefficient [37]. The NLDI can be derived using the Gini coefficient approach, which is often used to quantify regional inequality [38]. The NLDI, which can be used as a proxy variable in emphasizing inter-regional differentials, was used in one study to quantify regional disparities in Dhaka City [39]. With the advent of new satellite and sensor technology, it is now possible to observe and analyze urban areas at night, providing valuable insights into a range of urban issues such as energy consumption, economic activity, and public safety. Additionally, by analyzing nighttime light data, urban planners and policymakers can better understand how cities function, identify areas of high activity and those in need of improvement, and develop more effective strategies to address urban challenges.
This research examines the NLDI, a straightforward, objective, geographically explicit, and globally accessible empirical measurement of human progress based exclusively on nighttime satellite data and population density [37]. The NLDI acts as a useful tool for measuring regional inequality over time, especially where income data are not available [40]. By analyzing variations in the NLDI across different regions, it is possible to identify areas of economic inequality and to track changes in economic development over time [41]. For example, comparing the NLDI across different regions within a country or across different countries can help identify areas of economic disparity and inform policy interventions aimed at promoting regional development. The use of the NLDI for regional inequality analysis can provide valuable insights into the distribution of economic development and the effectiveness of policies aimed at promoting more equitable economic growth.
Additionally, this paper examines the correlation between NTL and GDP because a considerable correlation exists between the intensity of NTL and the GDP of a certain location [42]. As GDP is one of the main indicators of socioeconomic development, it is essential to measure the correlation and the dependency of GDP on NTL. By using NTL data as a proxy for economic activity, it is possible to estimate GDP at the sub-national or regional level and to track changes in economic growth over time [40]. Additionally, urban areas and regions with high levels of industrial activity tend to have higher levels of NTL and higher GDP compared to rural areas [39]. Furthermore, by analyzing changes in NTL over time, it is possible to estimate changes in economic activity and to monitor economic growth and development. For example, periods of rapid economic growth may be associated with increases in NTL, while an economic recession may lead to decreases in NTL.
Another important aspect of NTL remote sensing is that it can be used to identify areas with high energy demand and develop targeted energy conservation policies [43]. It can also be used to monitor changes in consumption patterns over time and to evaluate the effectiveness of energy conservation initiatives [44].
In summary, very little research has been conducted in developing countries like Bangladesh for measuring their NLDI. Furthermore, almost all research that has been conducted for measuring the NLDI has used either the DMP-OLS satellite or poor-resolution VIIRS NTL data. Both datasets have their limitations as their resolution and calibration are quite poor. In addition, the timely availability of these datasets is scarce. This research tries to alleviate this situation by incorporating a new data source (Black Marble NTL data) and proposing a modified NLDI that can be applied anywhere in the world to measure regional inequality.

2. Materials and Methods
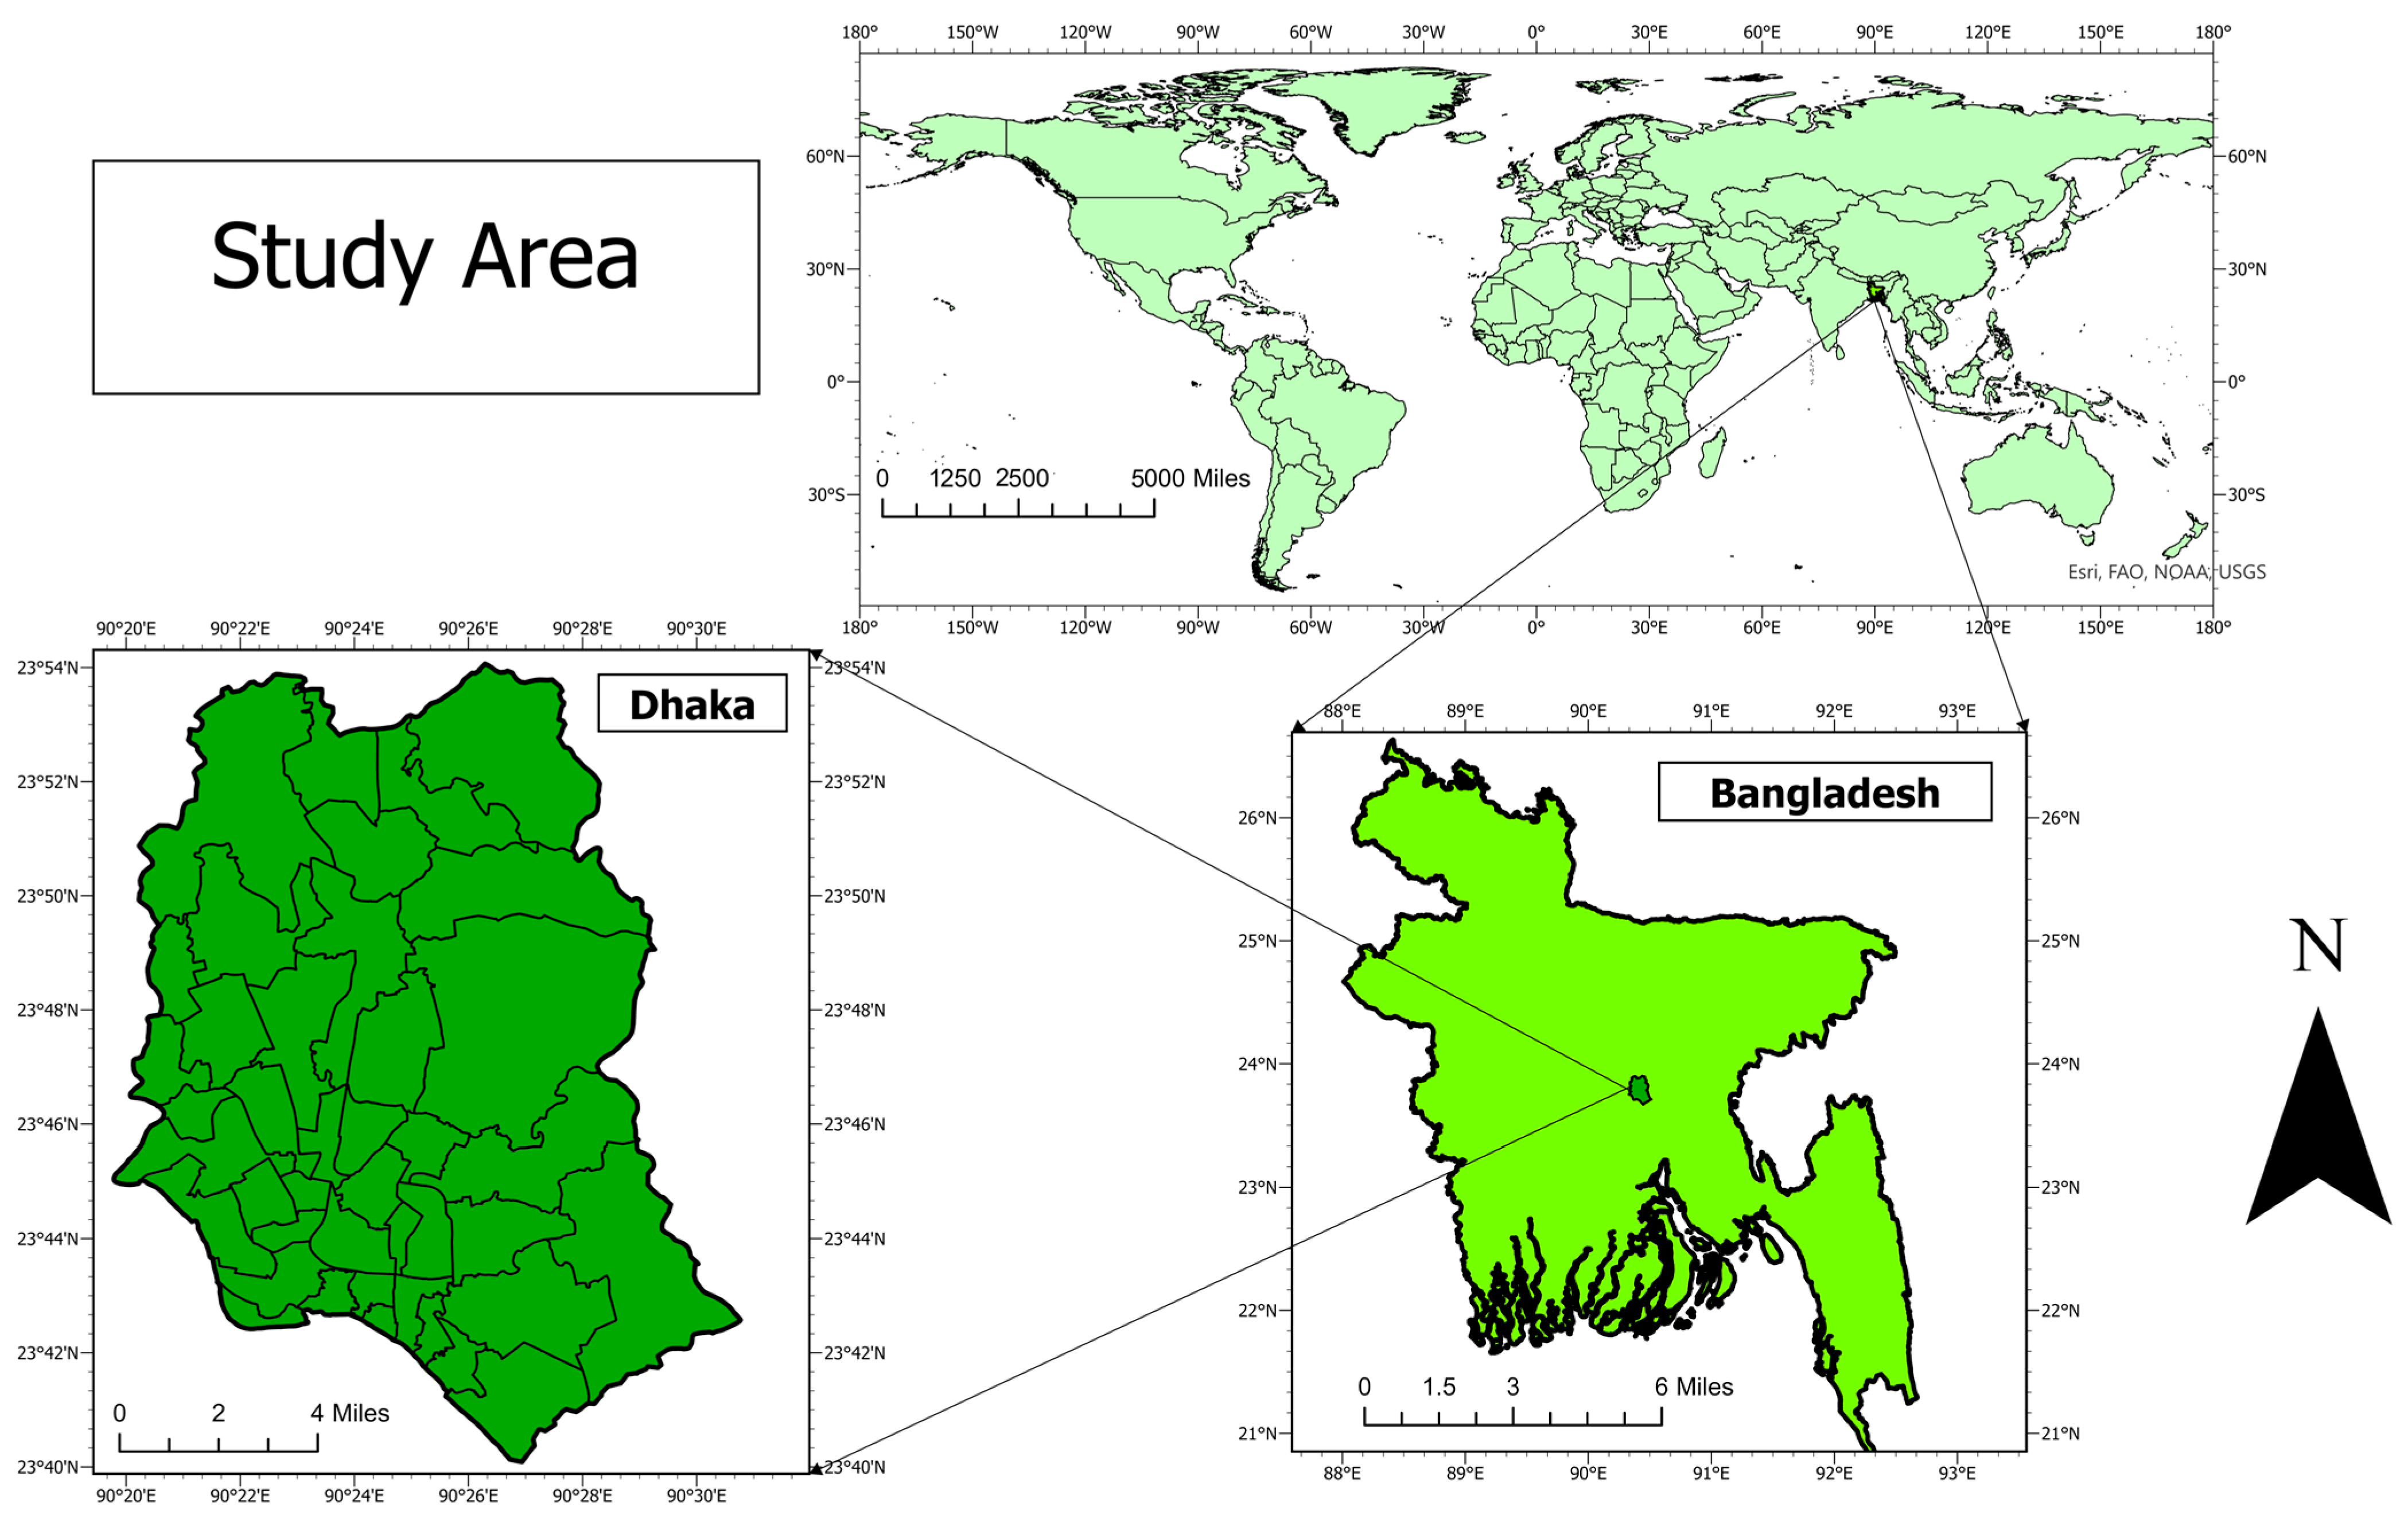
2.1. Study Area

Bangladesh is a South Asian country and is the world’s eighth most populated country, with a population of around 169 million people spread across an area of 148,460 square kilometers [45]. Dhaka is the capital of Bangladesh (Figure 1), as well as the world’s sixth largest and most densely populated metropolis in the world, with a population of 21.02 million as of 2022 [46]. It is considered one of the fastest-growing megacities in the world, with a population density of 23,234 people per square kilometer and a total area of approximately 306 square kilometers with severe challenges due to unplanned expansion, inadequate infrastructure, and environmental degradation [47].
Dhaka’s urbanization is characterized by unplanned horizontal expansion, resulting in the encroachment of wetlands and agricultural land, which exacerbates flooding and environmental degradation. The city also faces the proliferation of high-density informal settlements (slums), which house nearly 30% of its population, reflecting acute housing shortages and socioeconomic disparities [48]. Meanwhile, vertical growth dominates central business districts such as Motijheel, Gulshan, and Banani, driven by commercial and high-rise residential development. Additionally, peri-urban sprawl has intensified in surrounding areas like Gazipur and Narayanganj due to rapid industrialization and the relocation of manufacturing hubs, further straining infrastructure and services. These patterns highlight the challenges of managing rapid urbanization while ensuring sustainable and equitable development.
Dhaka serves as the economic powerhouse of Bangladesh, contributing approximately 35% of the nation’s GDP [49]. The city’s economy is anchored by the ready-made garment (RMG) sector, which accounts for nearly 80% of the country’s export earnings and employs millions of workers, predominantly women [50]. Alongside manufacturing, Dhaka has a rapidly expanding service sector, including banking, IT, and telecommunications, which is increasingly driving economic modernization. However, a significant portion of economic activity remains informal, with street vending, small-scale enterprises, and domestic work sustaining livelihoods for a large urban underclass. Additionally, the real estate and construction sectors are experiencing explosive growth due to rising urban demand, though often at the expense of planned development and environmental sustainability. This diverse yet uneven economic structure underscores both Dhaka’s dynamism and its challenges in achieving inclusive growth.

2.2. Data Sources

2.2.1. Daytime Remote Sensing Data

Two cloud-free time-series Landsat TM and OLI-TIRS images for the years 2010 and 2020 were collected from the United States Geological Survey website. We specifically filtered the data to include only November and December, as these months have the lowest probability of cloud cover. Furthermore, we excluded any imagery from Landsat 7 due to the malfunction of its Scan Line Corrector (SLC). The main characteristics of the remotely sensed images are given in Table 1.

2.2.2. Nighttime Remote Sensing Data

In this research, NASA’s Black Marble product suite’s nighttime data were used. The Black Marble data are useful for analyzing changes in night lighting over time, offering vital insights into human activity and development trends [51]. In this study, two types of data were collected: VNP46 A2 daily NTL data and VNP46 A4 yearly NTL data. The VNP46 A2 daily data were used to identify electricity coverage, while the VNP46 A4 annual data were utilized to calculate the NLDI and measure the association between NTL radiance data and Bangladesh’s GDP per capita. Daily data from 19 January 2012 to 31 December 2022 were gathered, and annual data from 2012 to 2022 for each year were collected. All the NTL data had a resolution of 500 m.

2.2.3. World Population Data

Gridded population data were collected from NASA’s Socioeconomic Data and Applications Center (SEDAC), which is a data center that specializes in the collection, management, and dissemination of data related to human interactions with the environment [52]. The population data from the SEDAC were available at 5-year intervals from the year 2000 at a 1 km resolution. For the NLDI calculation, 2010 as well as 2020 population data were extracted from SEDAC’s website.

2.3. Data Preprocessing

The NTL data, the Landsat data, and the SEDAC’s population data required some preprocessing before they could be used for the final analysis. All datasets were geometrically corrected by reprojecting them to Universal Transverse Mercator (UTM) coordinate system, zone 46N, and WGS 84 Datum and clipped to the city boundary. Additionally, NTL data were resampled using cubic convolution resampling via ArcGIS pro (version 3.2).

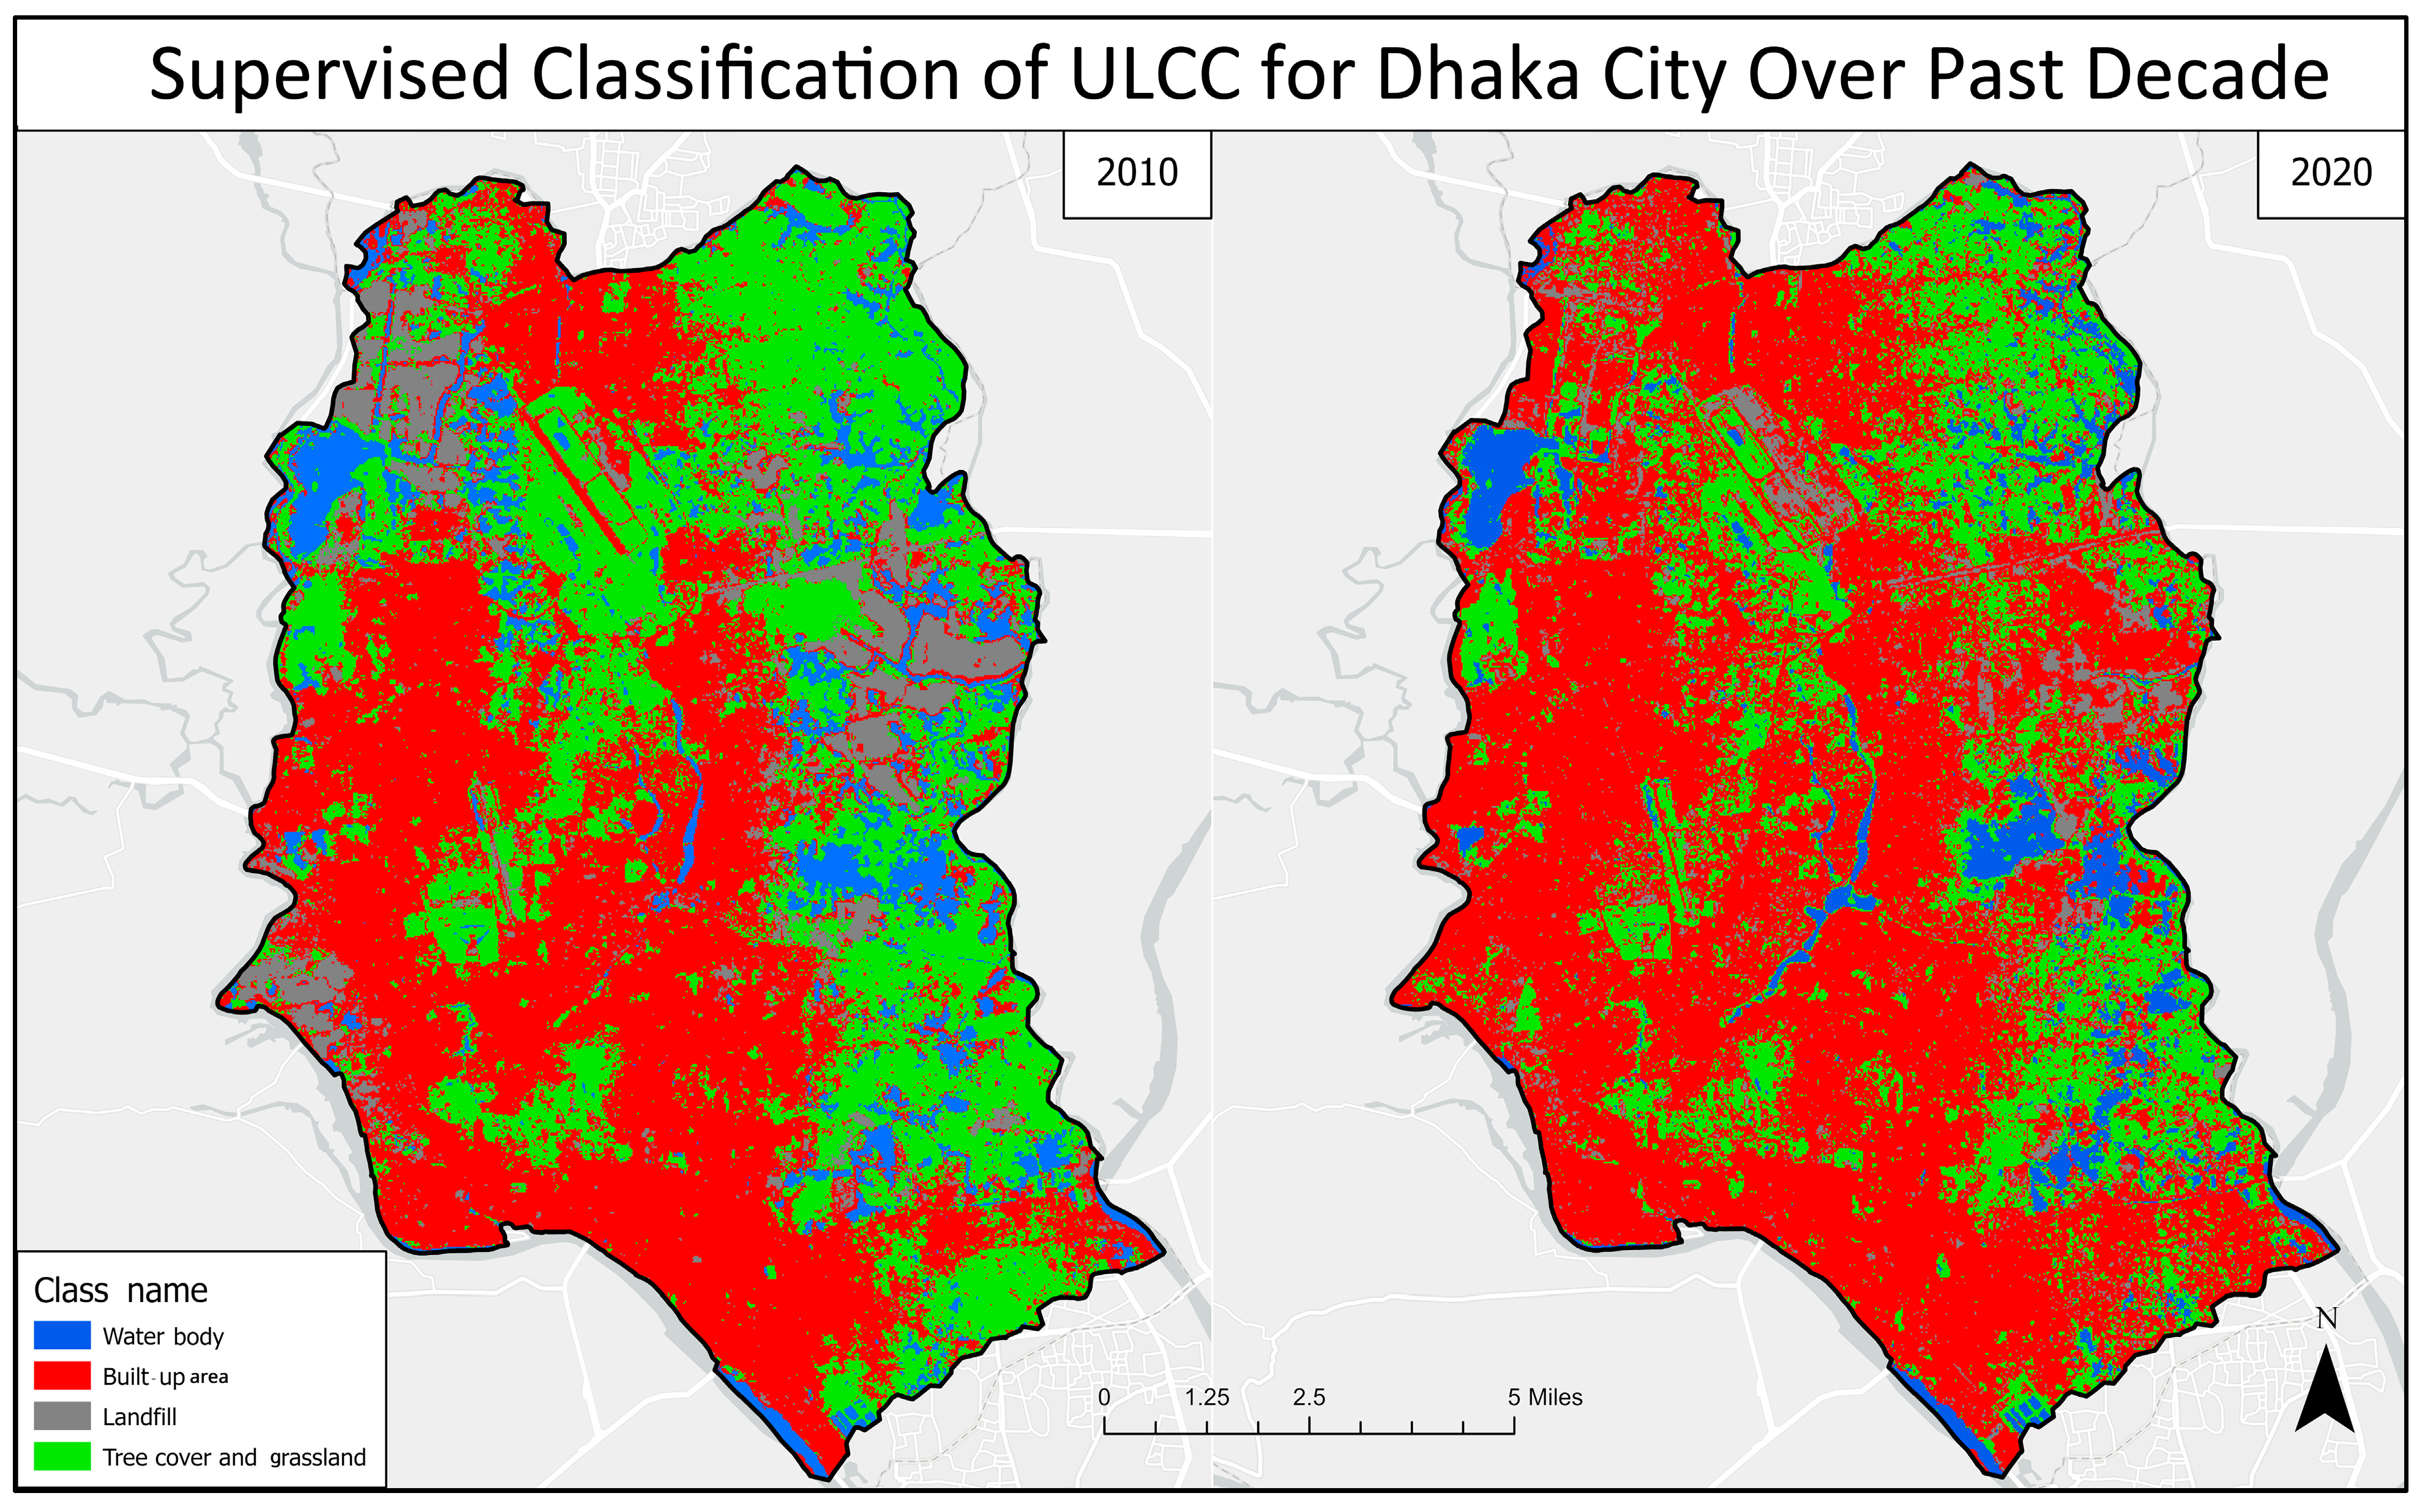
Changes in Land Cover for Dhaka City

This research used supervised pixel-based maximum-likelihood classification to detect ULCC over the past decade. After carefully reviewing satellite imagery, four land use/cover types were classified: water body, built-up area, landfill, and trees/grassland (Table 2).
After the data were downloaded, all the bands were joined together using the Composite Bands tool in ArcGIS Pro. For the supervised classification, a group of training samples were created from different places and different classes. Once the training samples were generated, the raster imagery was classified using the Classify tool in ArcGIS Pro.

2.4. Accuracy Assessment

The resulting classified imagery was subjected to accuracy validation using the error matrix and Kappa index [53] to evaluate the effectiveness and quality of the imagery by comparing it to actual field points and high-resolution Google Earth data. The following shows the formula by which the Kappa coefficient was calculated [54].
K a p p a   c o e f f i c i e n t = i = 1 k n i i i = 1 k n i i ( G i C i ) n 2 i = 1 k n i i ( G i C i )
where i is named class number, n is the total number of classified pixels which were compared to actual data, nii is the number of pixels linking to the actual data class i that were classified in class i, Ci is the total number of classified pixels associated with class i, and Gi is the total number of actual data pixels affiliated with class i.

2.5. Identification of Electricity Coverage Through NTL Radiance

By compiling a special algorithm, zonal statistics was used to measure the total amount of light emitted from Dhaka City every day over the past decade. The first available date for the Black Marble data was 19 January 2012; from that day, the data were collected for each day until 31 December 2022. The data were in Hierarchical Data Format (HDF), which is a complex data format for geoprocessing. For an easy geoprocessing operation, this HDF5 data format was converted into GeoTIFF, which has been widely used for storing and exchanging raster graphics images. For the conversion from HDF5 to GeoTIFF, a Python script was developed. VNP46A2 contains seven layers of datasets; among these, only the dataset called Gap-Filled DNB BRDF-Corrected NTL was used as the BRDF Gap-filled product does not require any cloud removal or noise correction. After the data were extracted into GeoTIFF format, another Python (version 3.12) script was utilized to calculate zonal statistics within the boundary of Dhaka City to calculate the amount of NTL radiance emanated over the past 10 years. After computing zonal statistics for each of the 3963 datasets, the results were plotted to find possible trends. A simple linear regression was performed between the average NTL radiance and power usage for each year over the previous decades to investigate if the NTL radiance could be used as a proxy for electricity use. Furthermore, another linear regression was conducted to investigate the correlation between the NTL radiance and GDP per capita over time.

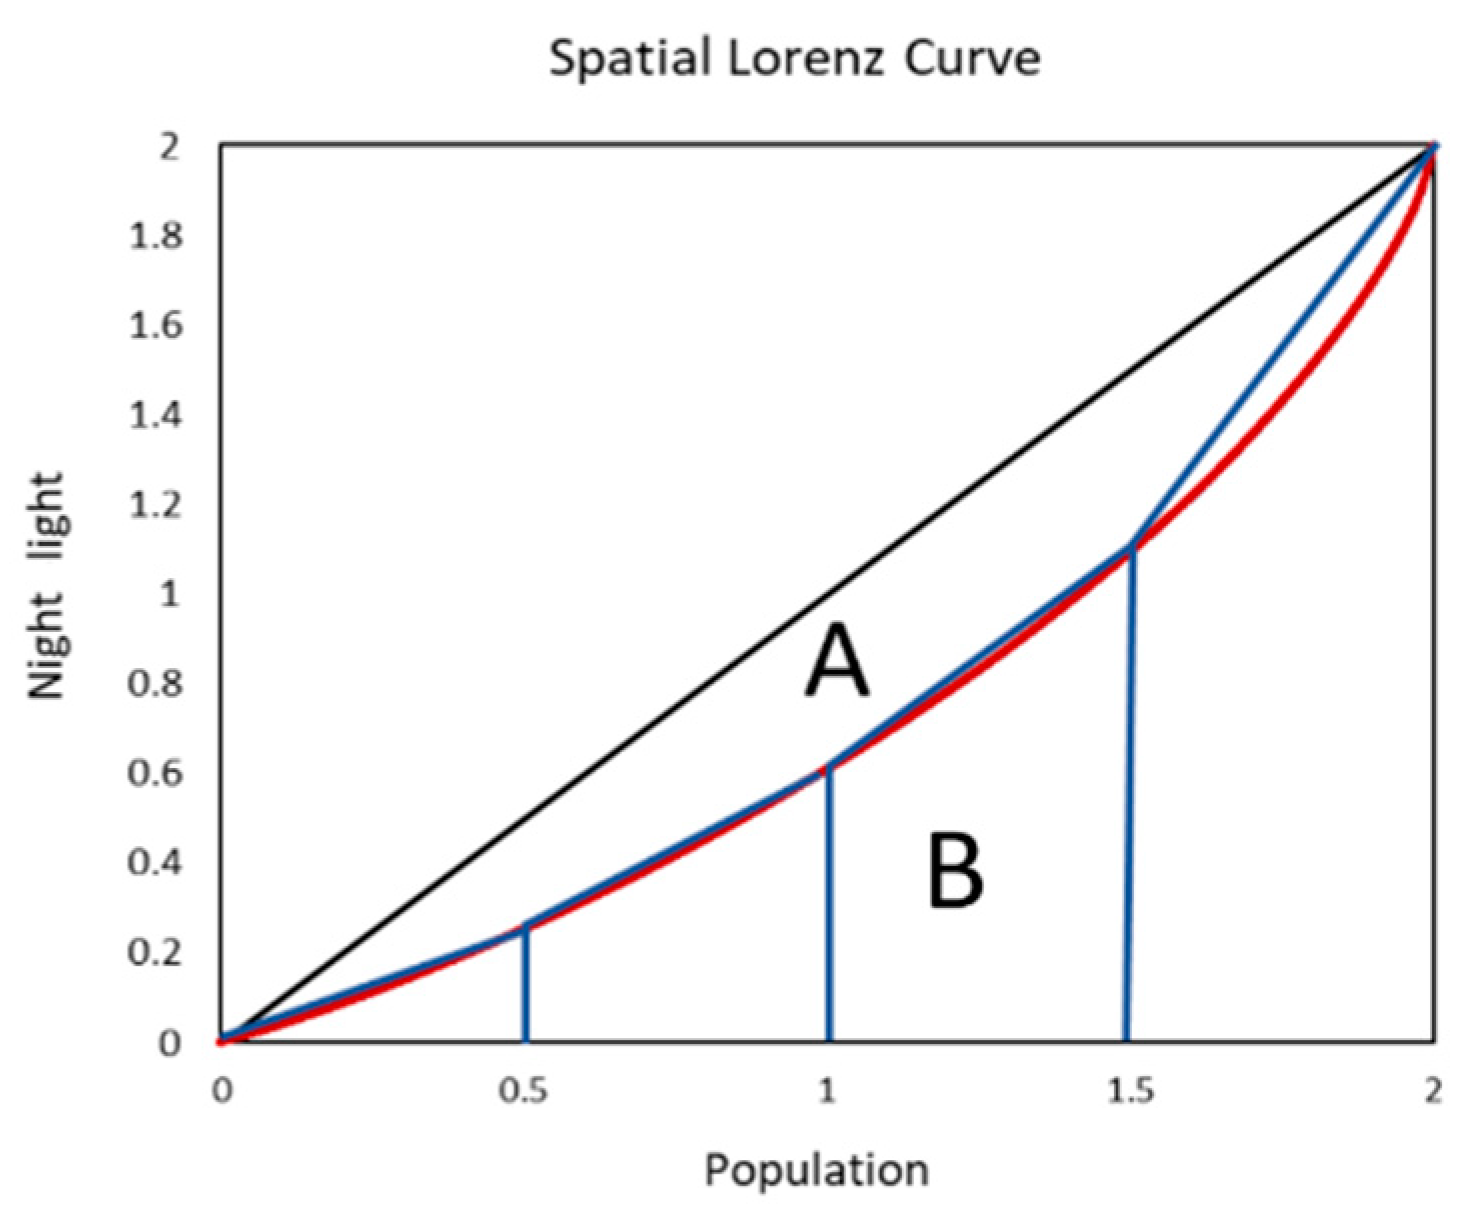
2.6. Calculation of the NLDI

The NLDI is an index for estimating economic activity and assessing regional disparity over a certain time period within a geographic area. It varies between 0 and 1, with 0 representing absolute equality and 1 denoting total inequality. Similarly to the Gini coefficient, an NLDI value of 1 reflects total income concentration within a single individual, while a value of 0 denotes perfect income equality across the entire population of the study area. Consequently, a lower NLDI value suggests a more equitable income distribution, indicating a more developed region [55].
The NLDI was calculated using the same procedure that is used to calculate the Gini coefficient by utilizing a Python algorithm. Using the Gini coefficient technique, the NLDI was estimated at the subdistrict level using data on the population’s spatial distribution and aggregate nighttime light at the grid level. The resolution of the gridded population data and the gridded NTL data were different as the gridded population data found from the SEDAC’s website had a 1 km resolution and the NTL radiance data had a 500 m resolution. ArcGIS Pro’s cubic convolution resampling tool was utilized to resample the NTL data to a 1 km resolution in order to have the population and NTL data at the same resolution. The large volume of data necessitated the automation of the NLDI calculation, for which an additional Python script was developed.
The Lorenz curve is a graphical depiction of a distribution, and in the event of complete equality, it is a straight line.
NLDI = A/(A + B)
because A + B = 0.5 (since the axes scale from 0 to 1).
NLDI = 1 − 2B
where NLDI is the Night Light Development Index; A is the area between the perfect-equality line and the Lorenz curve; and B is the area under the Lorenz curve.
The NLDI is derived by calculating the area between the Lorenz curve and the axis (B). The average of the left and right Riemann-like sums (trapezoidal rule) is used to compute this area. These are known as Riemann-like sums because they are computed at spots determined by population values rather than on a uniform grid (Figure 2). This method of calculating area is frequently used in mathematical analysis to approximate definite integrals. The average of the values at the left and right extremities is used to estimate the values of the f function throughout an interval. The trapezoidal area formula is used in a basic calculation:
A = ½ × h × (b1 + b2)
where h is the height of the trapezoid; b1 and b2 are parallel sides.
½ Δx [f(a) + 2f(a + Δx) + 2f(a + 2Δx) + 2f(a + 3Δx) + …… + f(b)]
where the interval [a, b] is divided into n subintervals, each of the following length: ∆x = (b − a)/n. The points in the partition are then a; a + ∆x; a + 2x, …, a + (n1)∆x; and b.
For the NLDI value’s calculation, the total study area was equally divided into 0.15 km by 0.15 km grid cells, and with the help of the zonal statistics tool, mean population and mean NTL radiance data were calculated for all the cells with each subdistrict. Then, the mean grid values for both the population data and the NTL data were used to calculate the NLDI coefficient. After the NLDI value was calculated for each subdistrict, a thematic graduated color map was created with the Join and relate tool in ArcGIS Pro. The complete procedure of this study is presented in Figure 3.

3. Results

3.1. Land Use/Land Cover Change in Dhaka City over the Past Decade

Pixel-based supervised maximum-likelihood classification was conducted for both the years 2010 and 2020 for Dhaka. The accuracy assessment of the classified imagery was conducted based on the Kappa coefficient, and the overall accuracy was 89% and 84%, respectively, for the years 2010 and 2020. From Figure 4, we can see that over the past decade, massive portions of water bodies, landfills, and trees and grasslands were turned into built-up areas. Water bodies, landfills, and tree cover/grassland all lost almost 889.83, 777.24, and 2935.35 hectares of land, which were converted into built-up areas as the built-up area increased by 4602.42 hectares of land (Figure 5). In terms of percentage, water bodies, landfills, and trees/grassland lost almost 31, 33, and 27 percent of their area to built-up areas, and on the contrary, the built-up area increased by 32 percent. The main reason for this huge transformation in the land use/land cover change is that over the past decade, Dhaka City’s population increased by 43 percent (6.3 million people) [7]. So, to accommodate this large population, Dhaka City had no other choice but to turn water bodies, landfills, and tree cover/grassland into built-up areas. Also, we can see that subdistricts that are situated near the periphery of the Dhaka City border such as Uttarkhan, Turag, Khelkhet, Khilgao, Demra, and Badda have seen huge transformations in their areas over the past decade. This is because most of the areas that are in the center of Dhaka City already consist of built-up areas and people are now turning the periphery zones into built-up areas for their accommodations. Even though the NLDI value decreases in these peripheral zones, suggesting a more equal income distribution, the biodiversity and greenery/vegetation in these areas have decreased tremendously. This indicates a sharp decline in ecosystem services and significant value loss, a finding consistent with the study by [56].

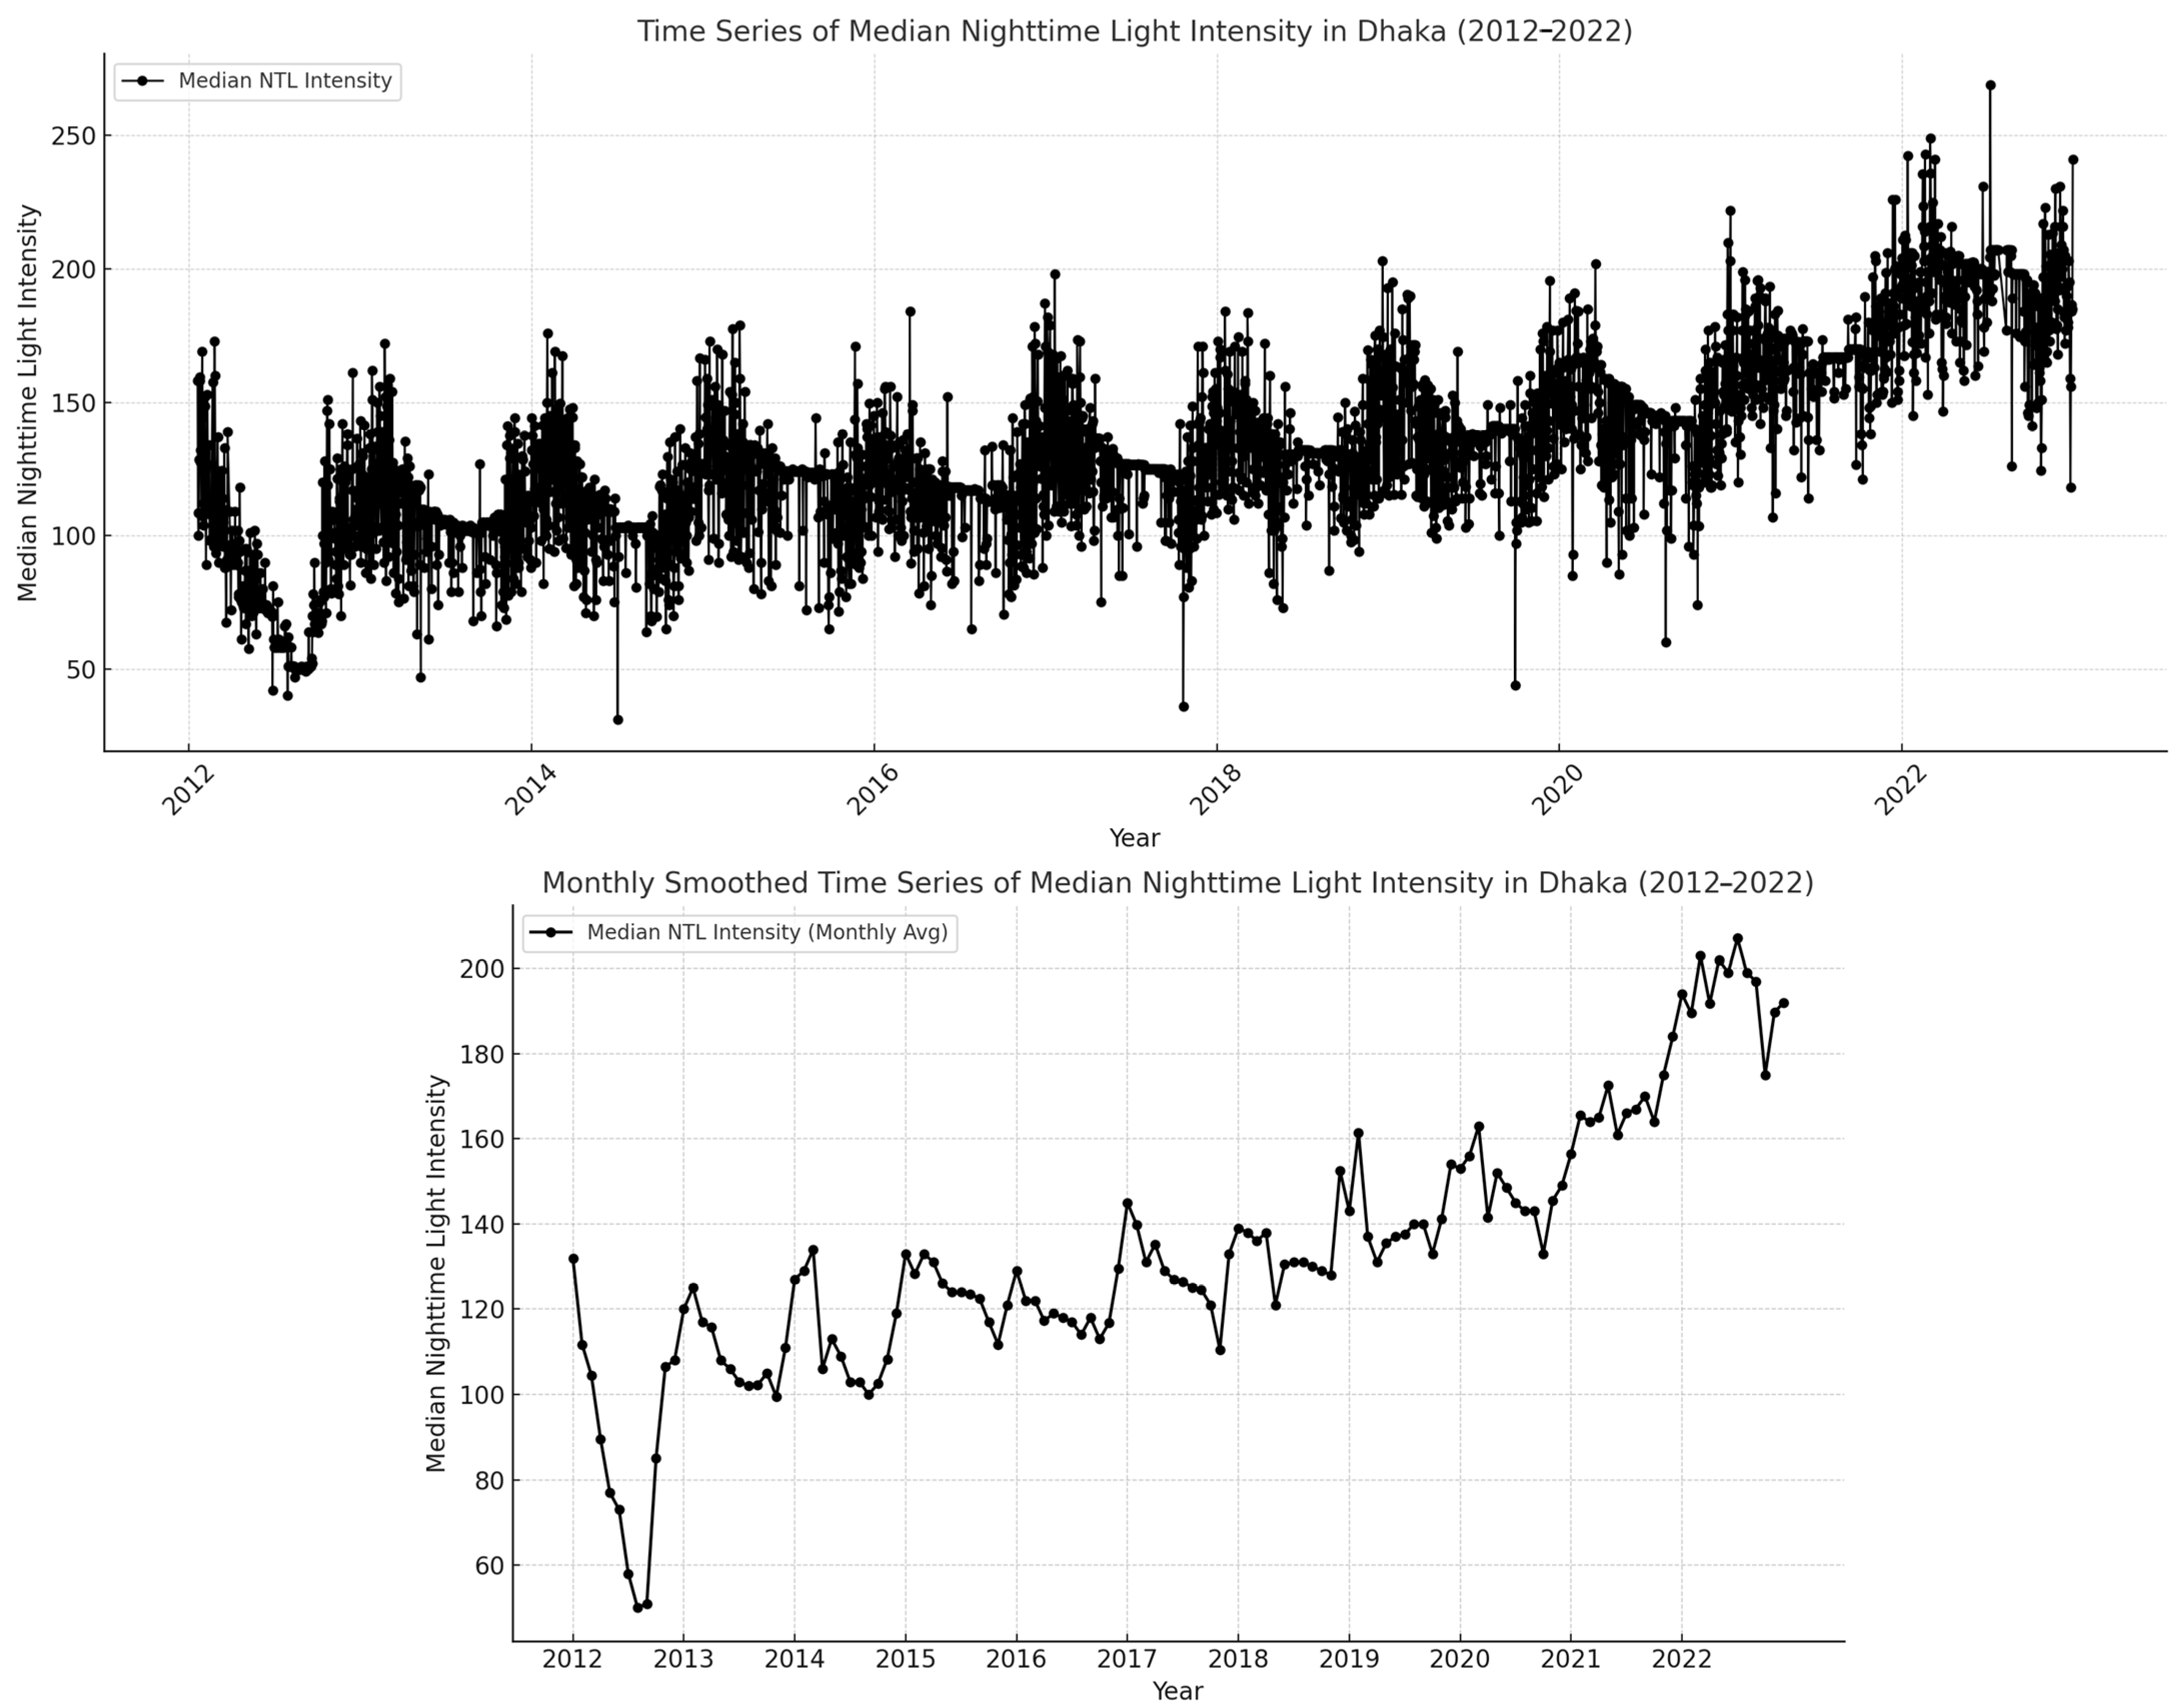
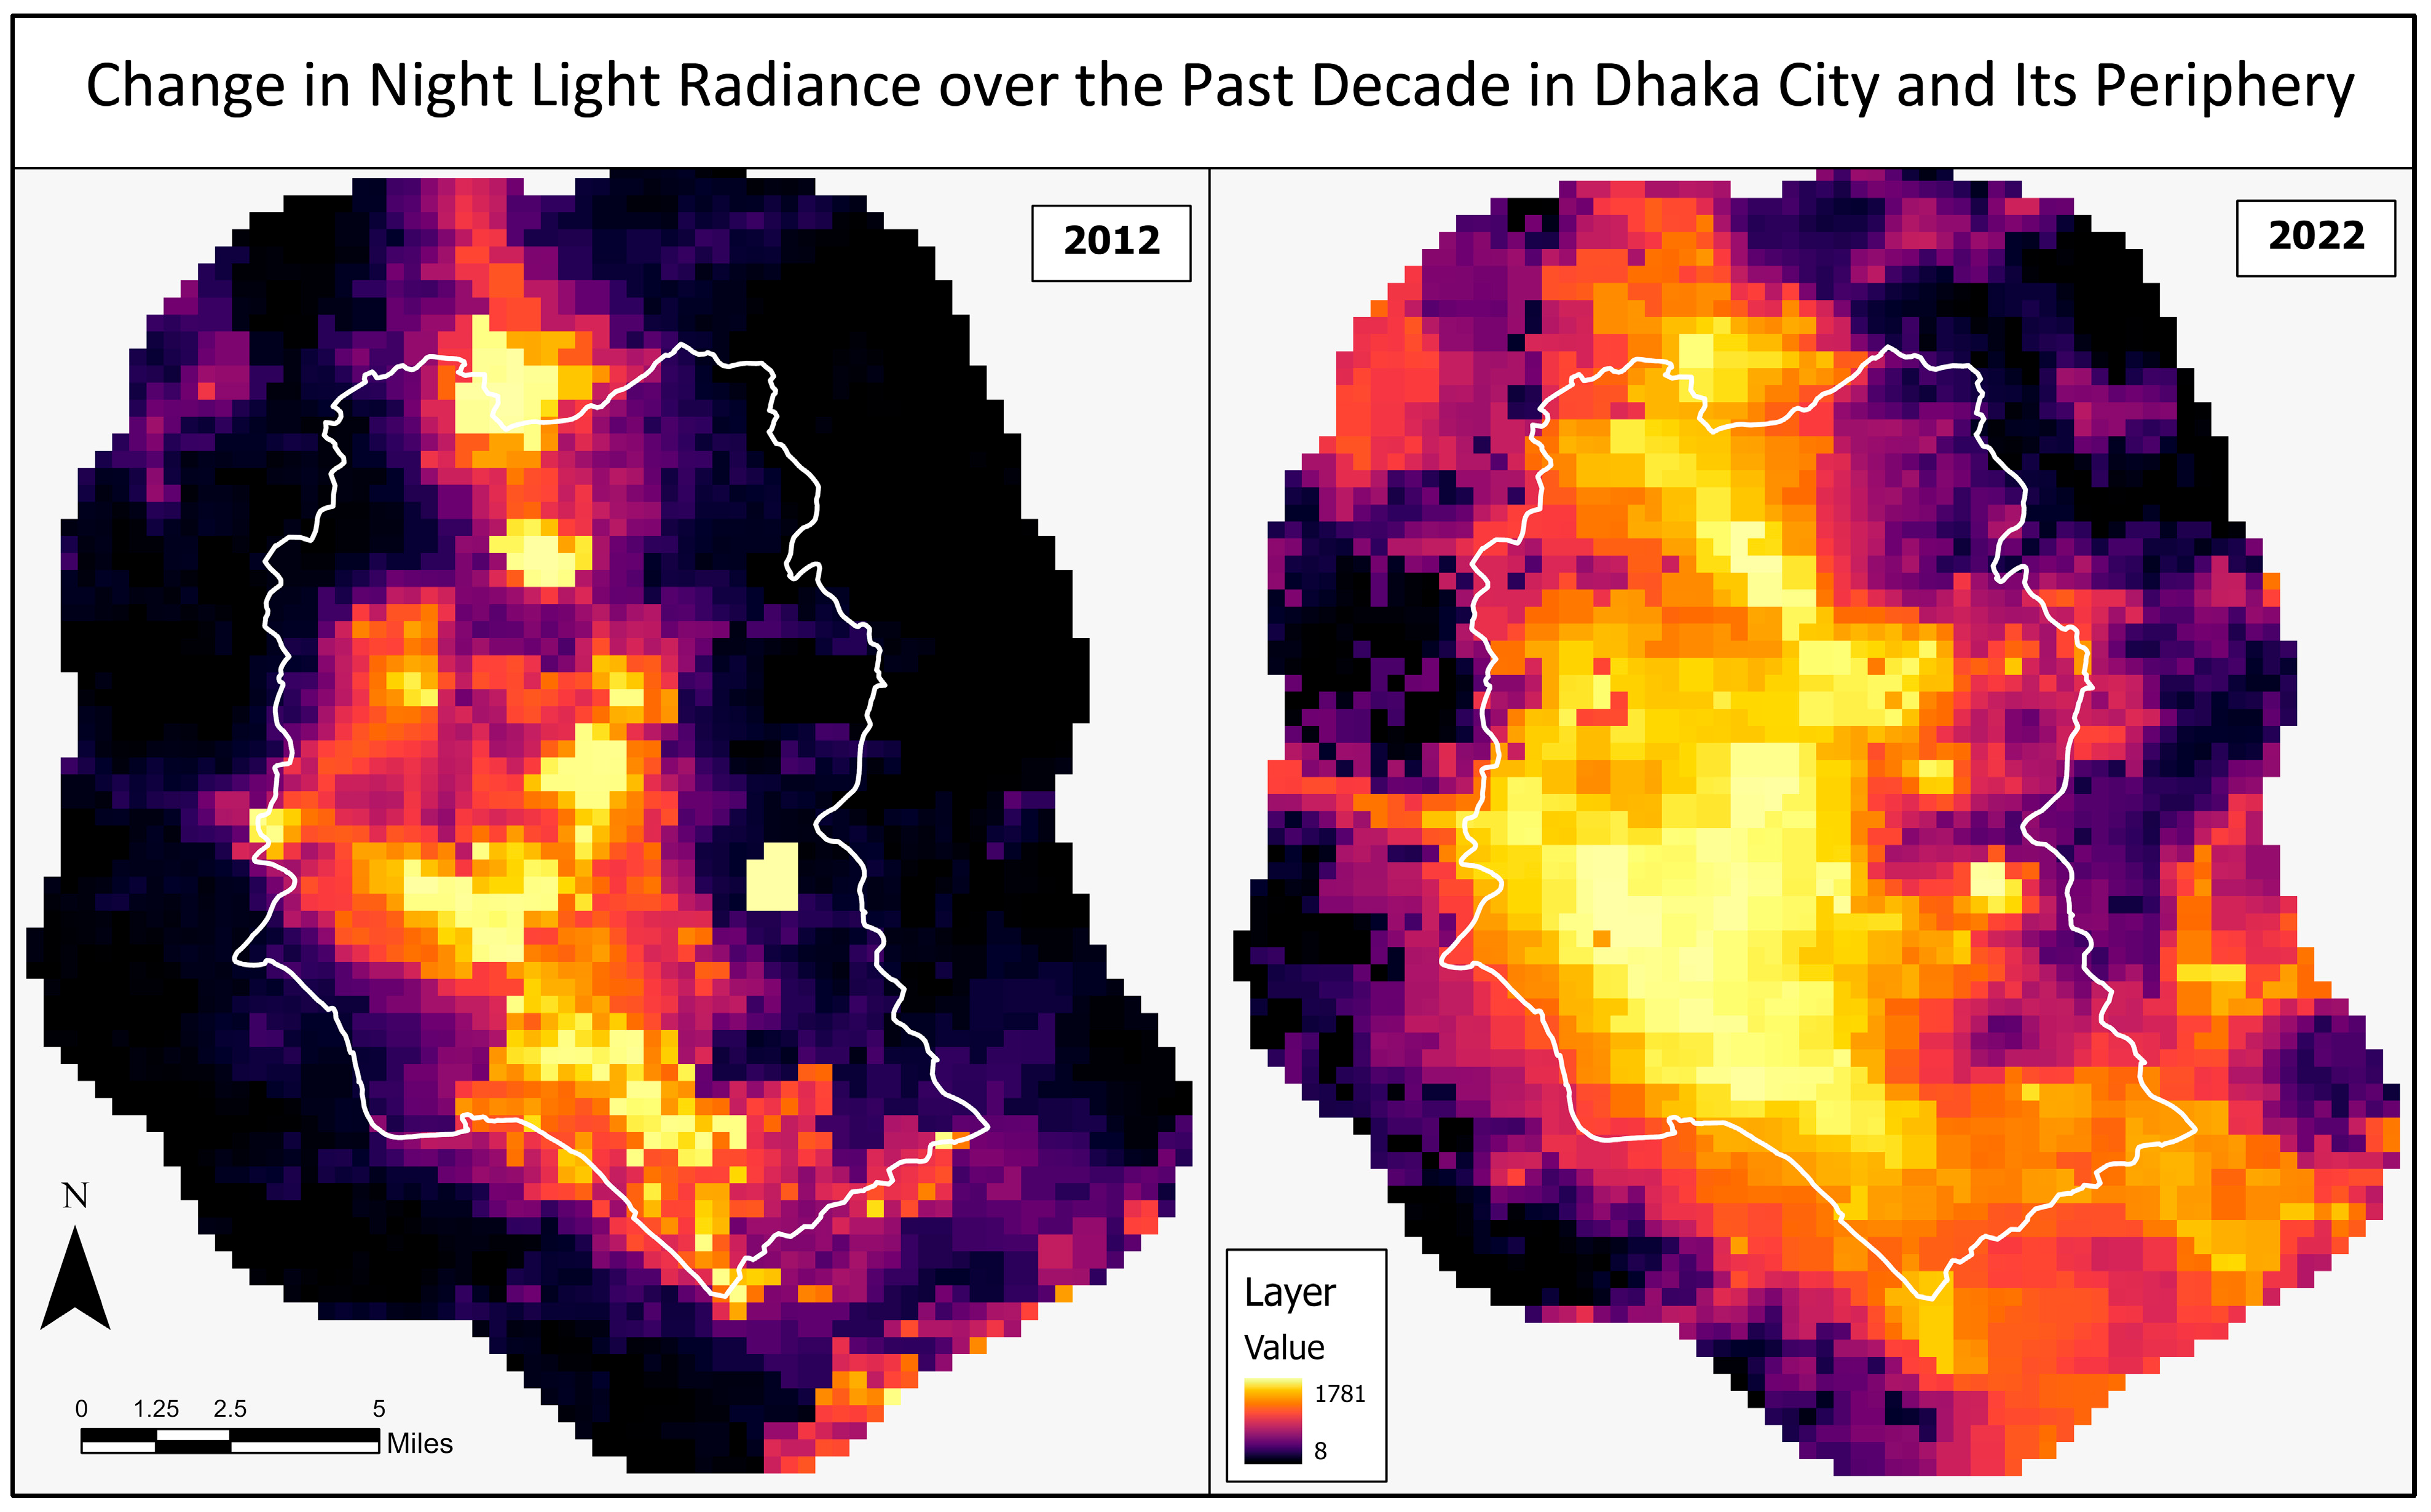
3.2. Changes in Electrification over the Past Decade

The linear regression between the NTL radiance and electricity consumption showed that the R2 value was 0.9312, suggesting that 93.12% of the variance in NTL radiance could be explained by electricity consumption. The F-statistic of 121.7722, with a corresponding p-value of 0.00000157, was highly significant, significantly below the conventional significance levels of 1%, 5%, and 10%, confirming the robustness of the regression model. Furthermore, the coefficient for electricity consumption was 0.004, and its p-value was also less than 0.05, making it statistically significant and validating its contribution to the model. Based on these statistical results, we conclude that NTL radiance could be used as a proxy for electrification coverage (a detailed statistical summary can be found in the Supplementary Table S4). Figure 6 illustrates that total radiance nearly doubled over the past decade, following a pattern that closely mirrors the trend observed in electricity consumption, as shown in Figure 7. We also found that there were some spikes or sudden drops in the NTL radiance because, over the past decade, Bangladesh has faced a couple of backouts in the entire Dhaka region; one of them includes the biggest blackout in Bangladesh on 1st of November [57].
Additionally, NTL radiance shows a positive correlation with the GDP per capita of Bangladesh. Simple linear regression analysis was conducted to model the relationship between NTL radiance and GDP per capita, yielding an R2 value of 0.8661. This indicates that approximately 86.61% of the variance in NTL radiance could be explained by GDP per capita. The F-statistic of 58.2239, with a corresponding p-value of 0.0000322, was highly significant, significantly below the conventional significance levels of 1%, 5%, and 10%. This confirms the robustness of the regression model. Furthermore, the coefficient for GDP per capita was 0.0104, and its p-value was highly significant, further validating its contribution to the model (a detailed statistical summary can be found in the (Table S4).
Additionally, from the side-by-side comparison of the yearly night light imagery (Figure 8), we can clearly see that the amount of NTL radiance substantially increased from 2012 to 2022. As there is little to no space in Dhaka City, infrastructure is built mostly toward the periphery and outer boundary of Dhaka City to accommodate this large population. In the 5 km buffer zone of Dhaka City, it can be seen from the nighttime imagery that the darker areas outside Dhaka City changed significantly to more illuminated areas over the past decade (Figure 8). Also, the 5 km buffer zone indicates that people were moving towards and outside of the periphery of Dhaka City, as also evidenced by the classified daytime imagery in Figure 4.

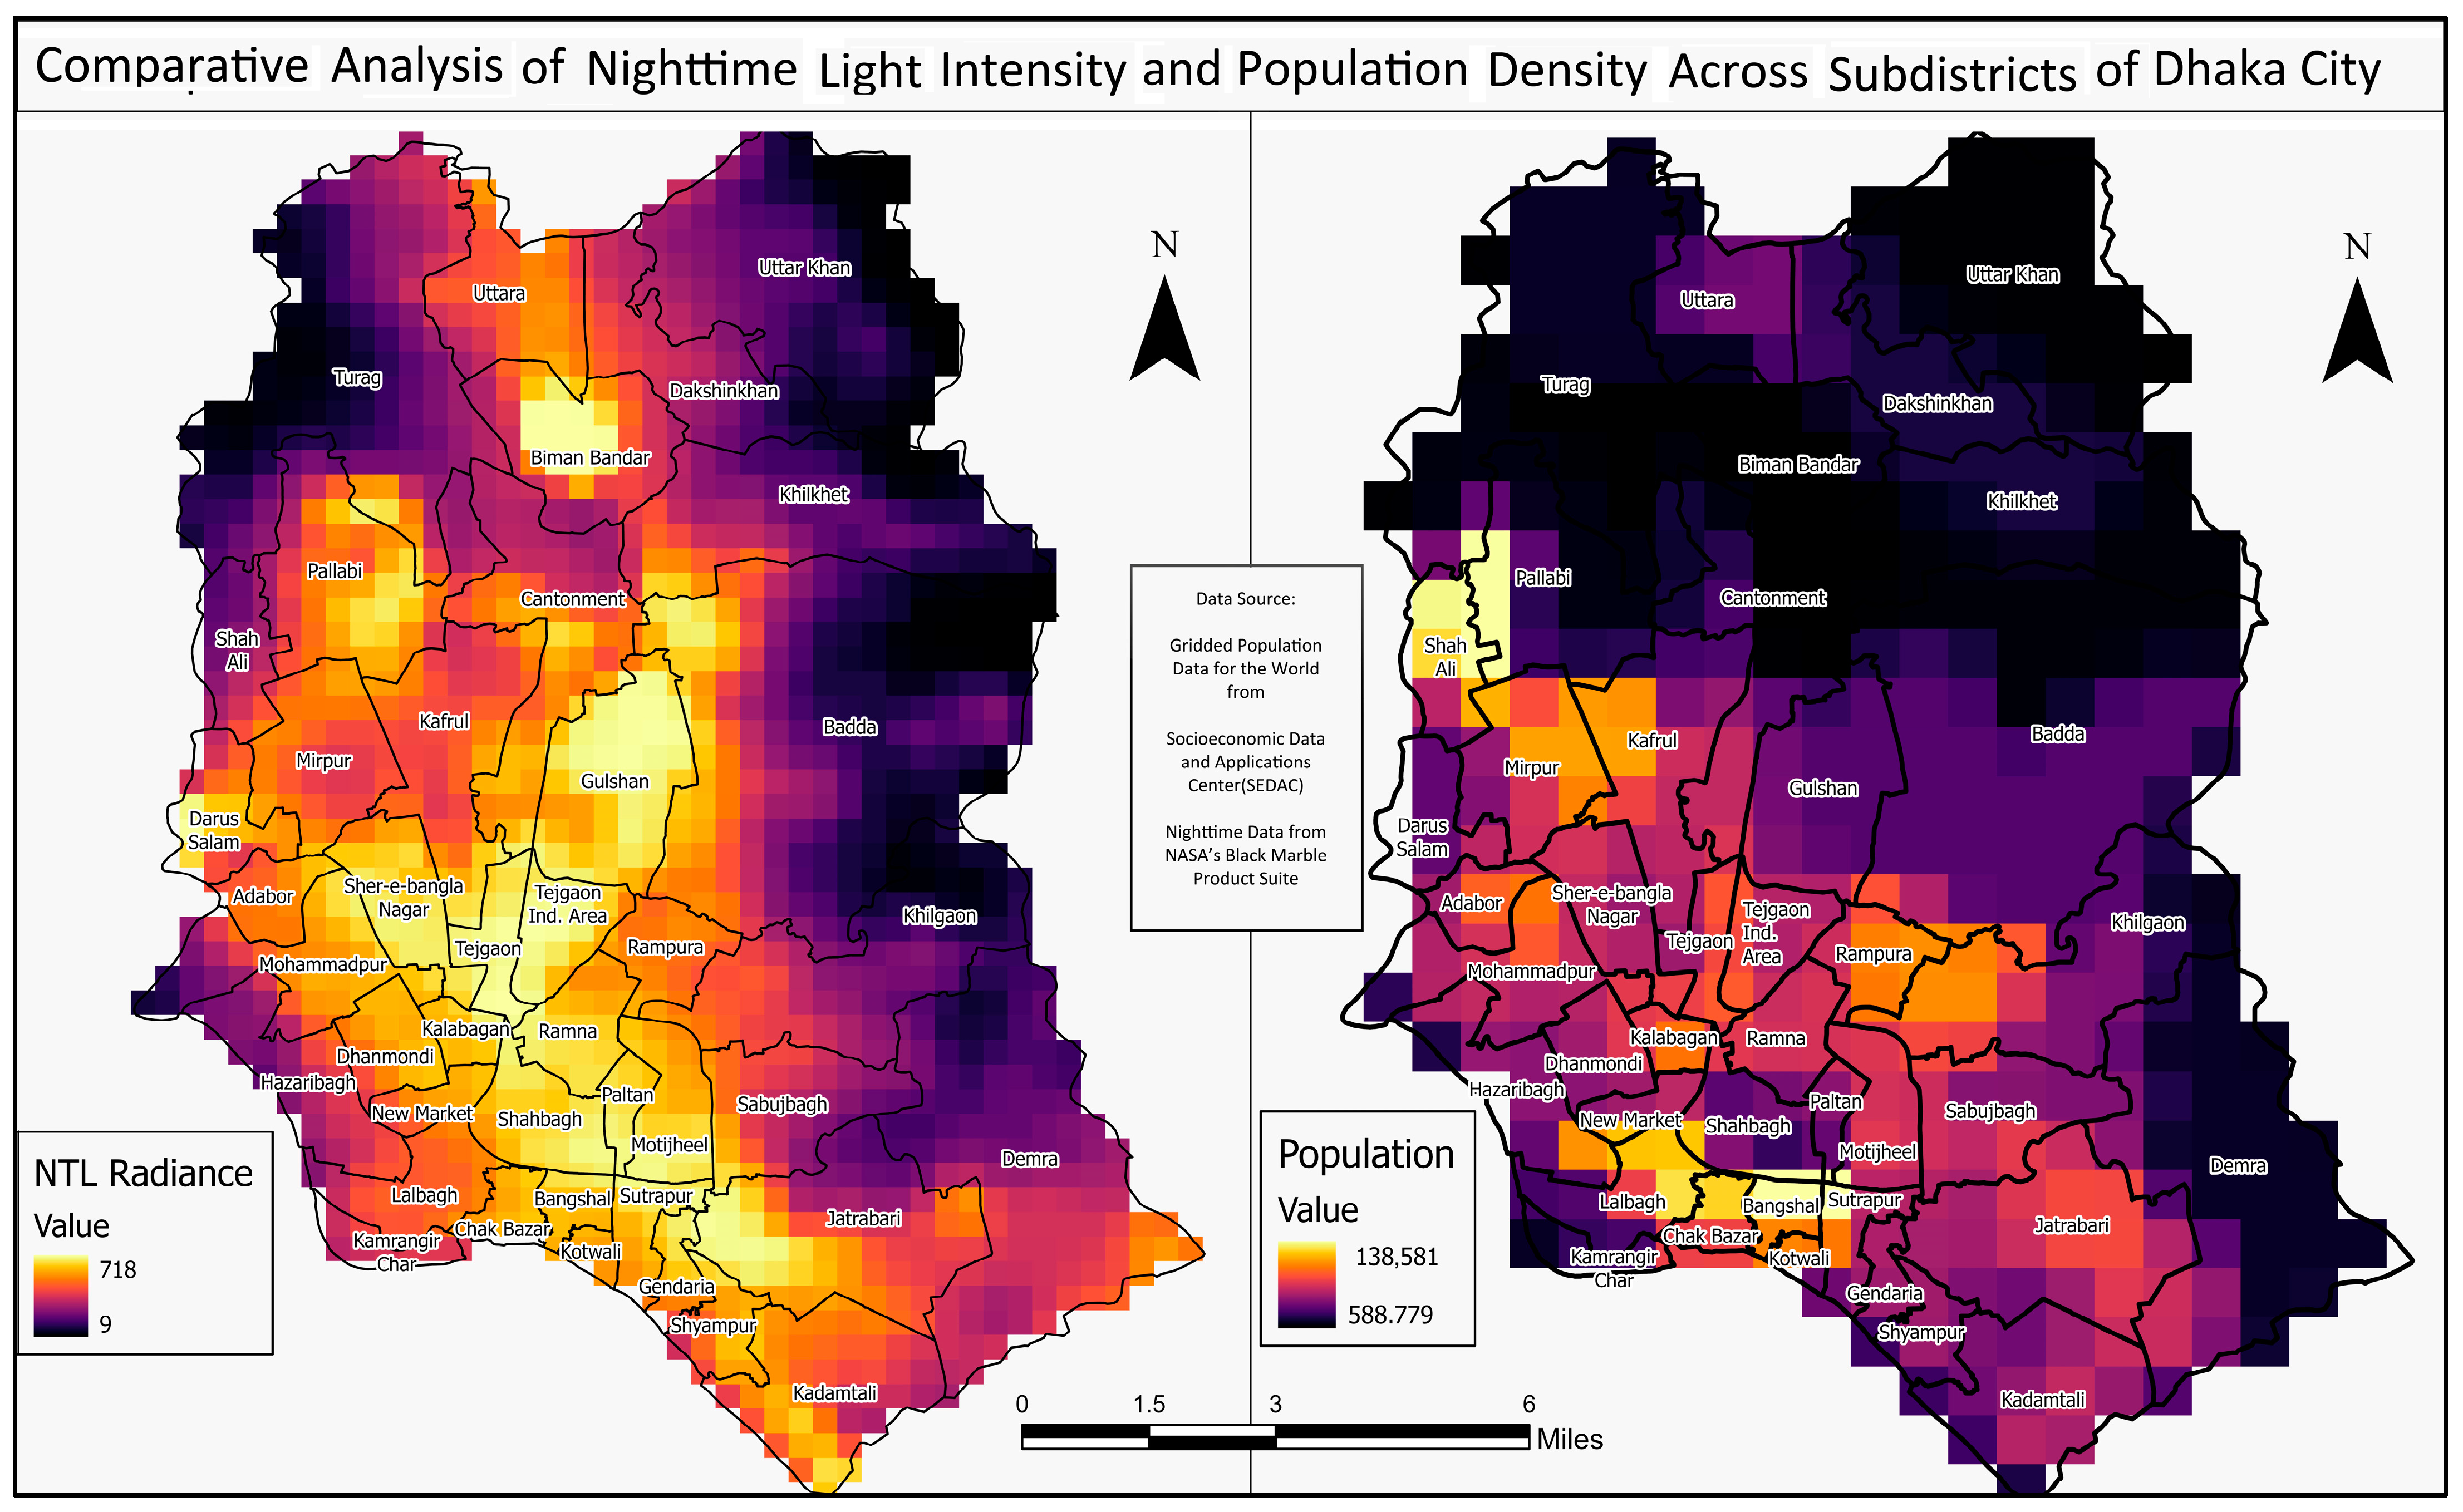
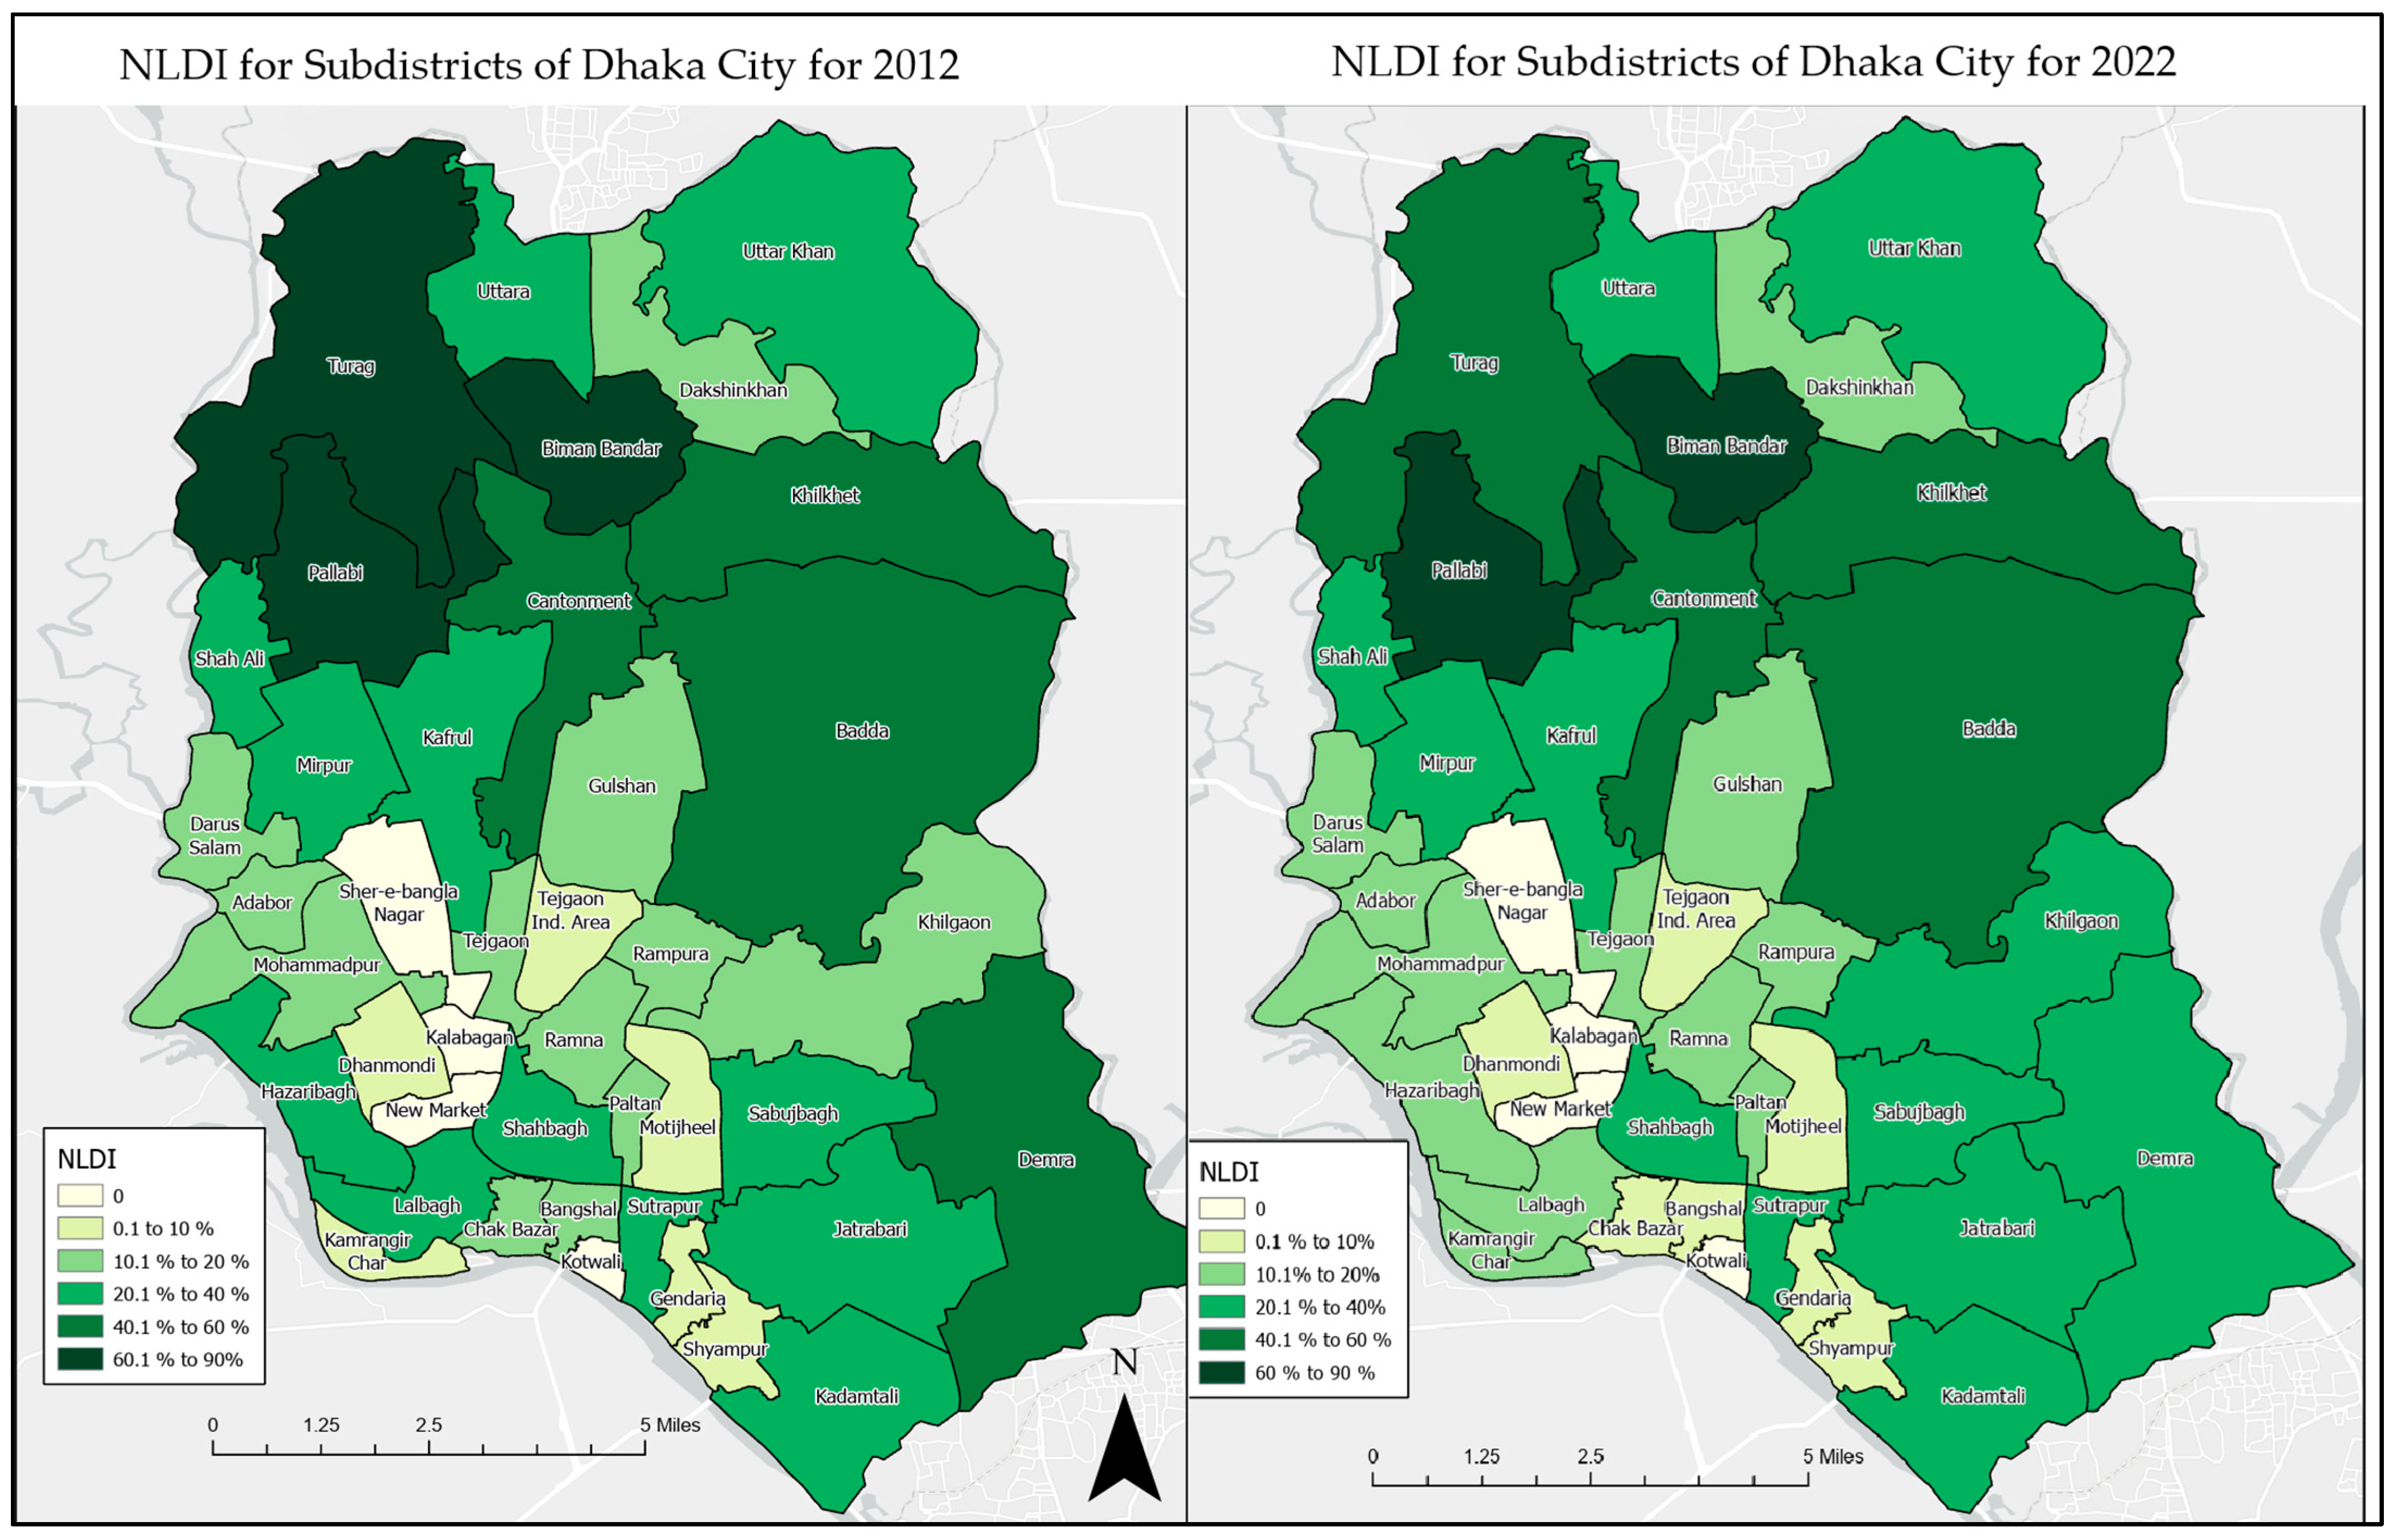
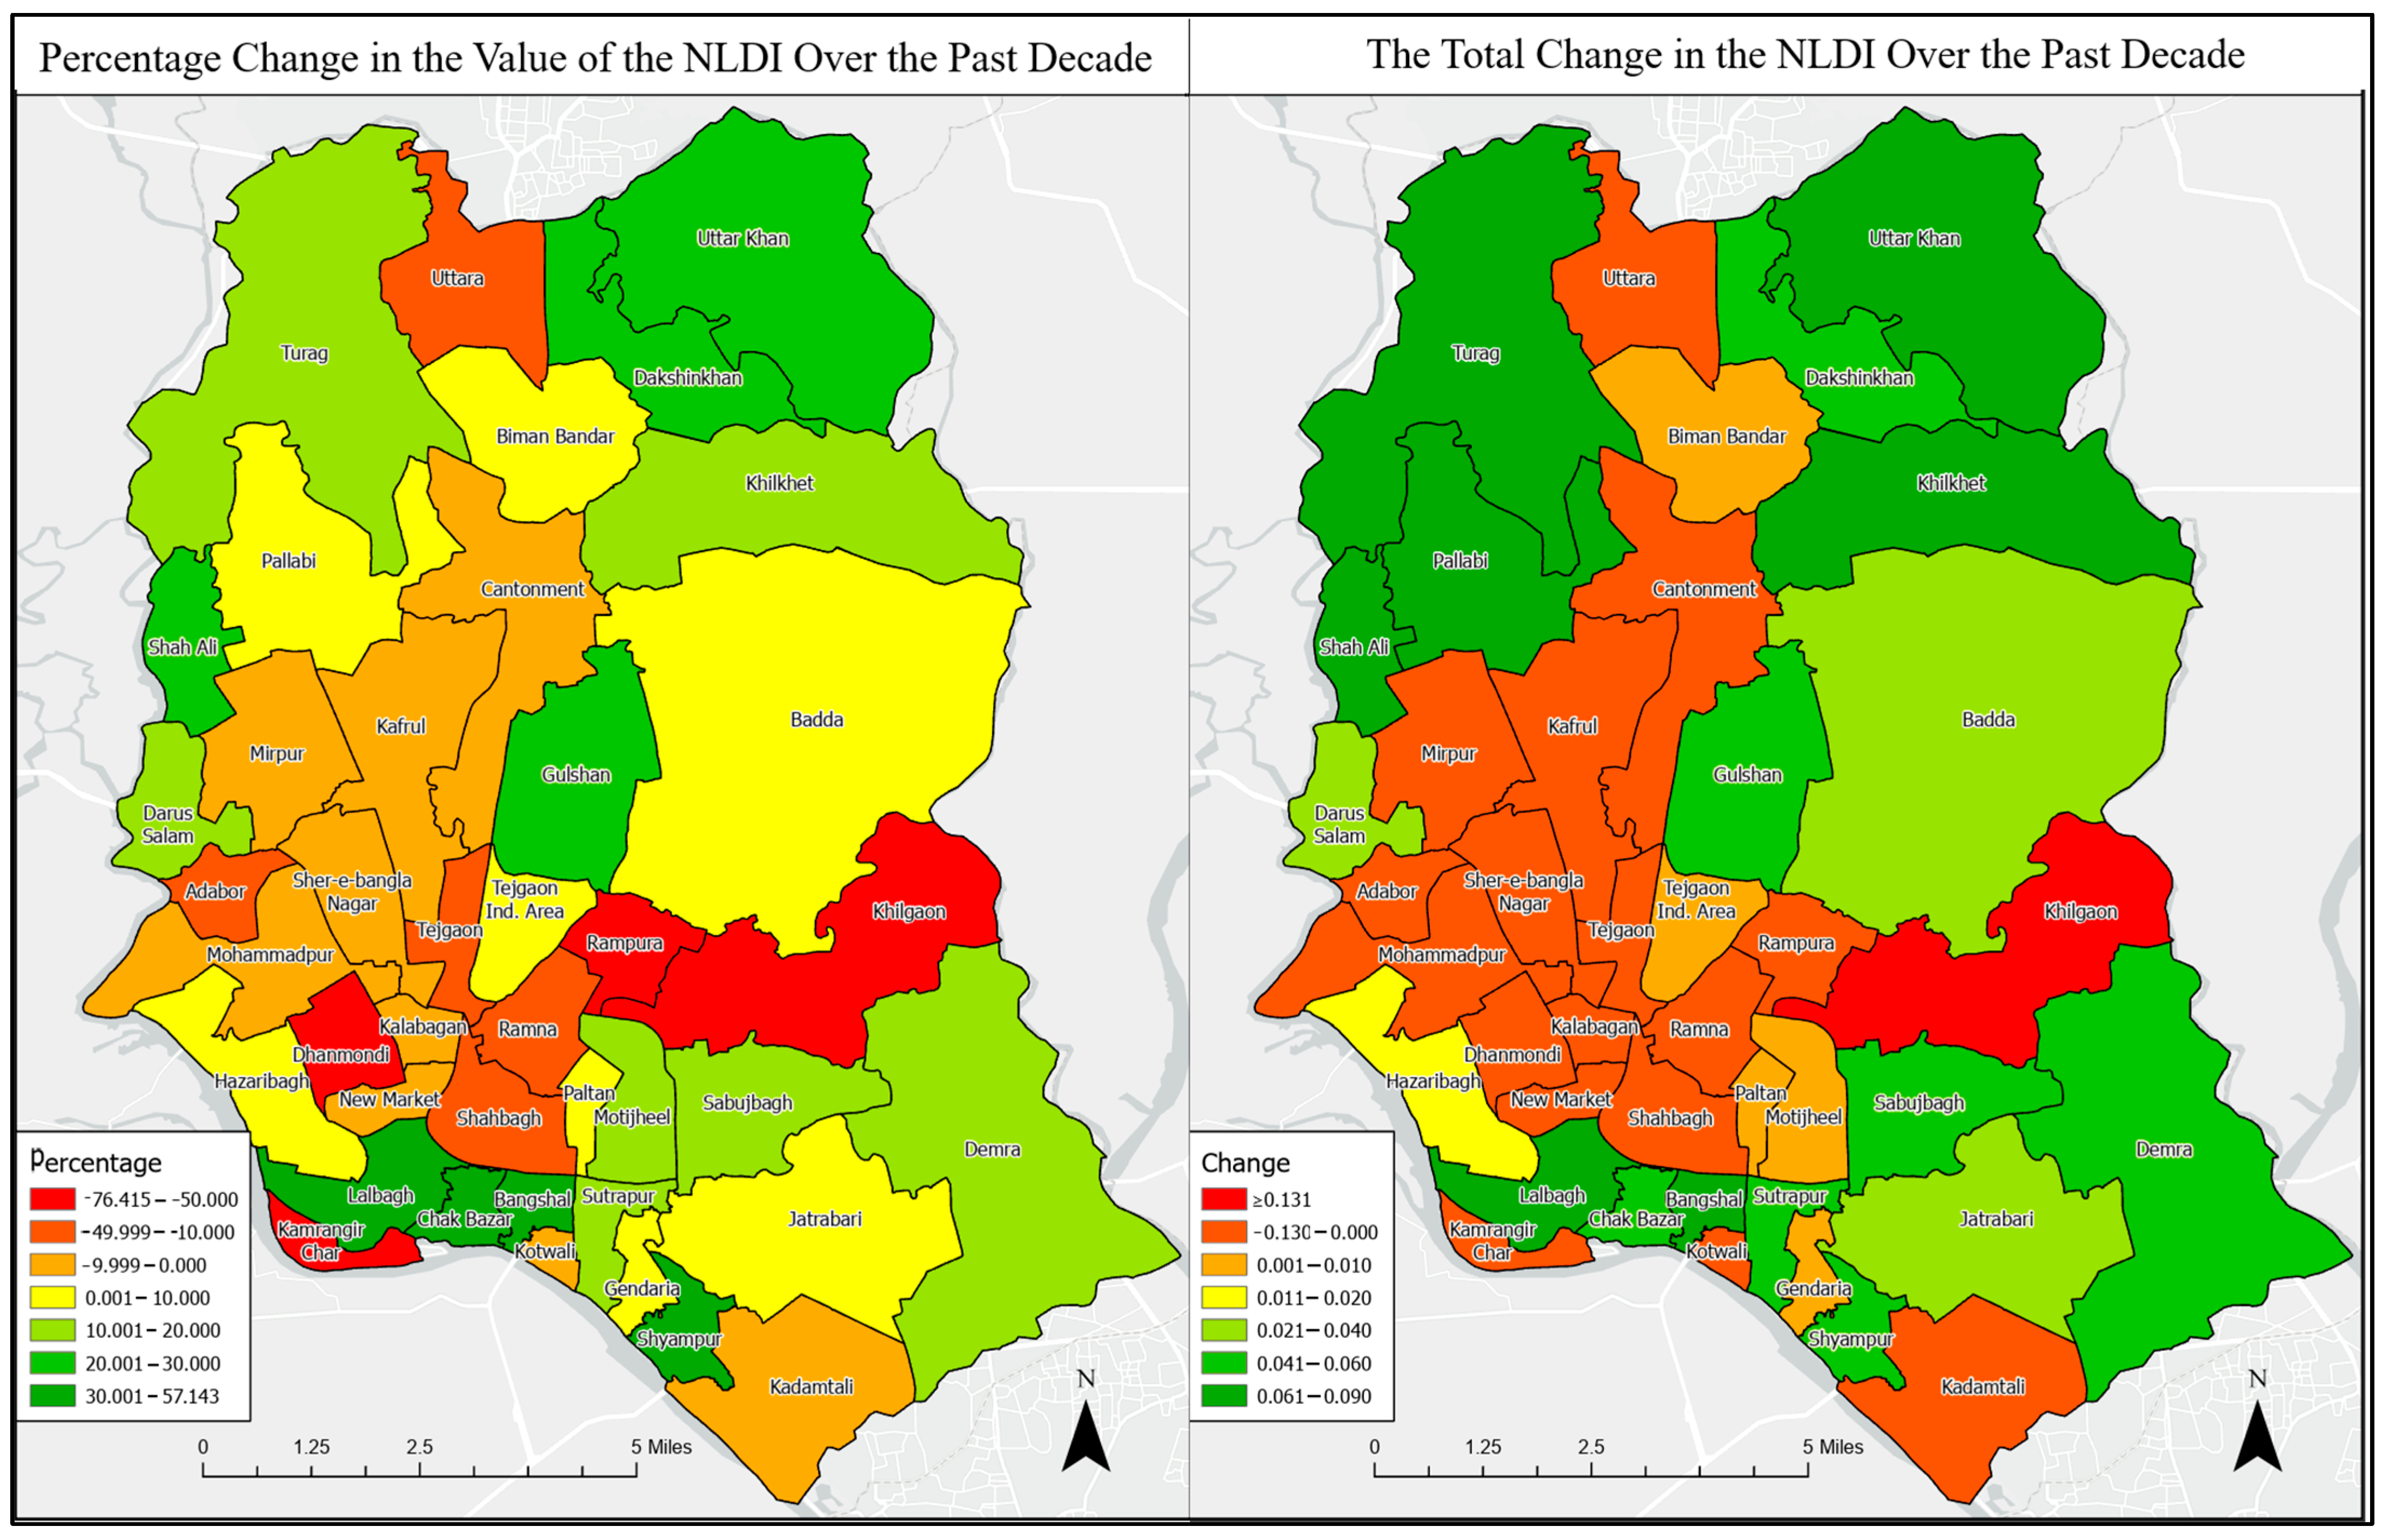
3.3. NLDI Values and Changes in the NLDI Values over the Past Decade

From Figure 9, we can see that, even though regions like Biman Bandar Uttara, Demra, and Pallabi have significantly lower populations, the NTL radiance of these areas is quite high, indicating that income is not evenly distributed among these areas. In general, we can see a lower intensity for both NTL radiance and population towards the periphery of Dhaka City.
From the 2012 NLDI map (Figure 10), we can see that the NLDI value was quite high in the northern part of Dhaka City, consisting of subdistricts such as Turag, Pallabi, Biman Bandar Cantonment Khelkhet, and Badda, as in 2012, these areas were still developing and not many people lived there at that time. In 2012, most of these areas had significantly fewer built-up areas. Although the population of the subdistricts Biman Bandar and Uttara was fairly low, the NTL radiance was extremely high, indicating that certain affluent individuals held all the money and revenue was not spread equitably among the residents of these places, which in turn produced a higher NLDI. On the contrary, Kolabangan, Tejgaon, Rampura, New Market, and Motijheel exhibited lower NLDI values due to relatively high levels of nighttime light (NTL) radiance in 2012. This suggests that income and other social factors were relatively uniform in these areas.
In 2022, many people moved towards the periphery of Dhaka City and subdistricts such as Turag, Demra, Khilgoan, Lalbagh, and Hazaribag, which caused the NLDI to drop to a low value. This indicates that the population density of these areas increased as people moved toward the periphery of Dhaka City, which in turn meant that income was disbursing more among the people of these regions.
Additionally, the change detection map is portrayed to detect the change in the NLDI values of the subdistricts of Dhaka City and to identify which areas’ NLDI values improved over the past decade. The green colors in Figure 11 indicate the NLDI value decreasing, which means that the greener the area is, the more the income is distributed among the people of that area. On the other hand, the red colors in Figure 11 indicate the NLDI value increasing, which means that the higher the NLDI value is, the less the income is dispersed among the people. From Figure 11, we can interpret that, apart from Uttra and Khilgaon, all of the subdistricts have seen a decrease in the NLDI values. Also, most of the subdistricts in the center of Dhaka City have seen an increase in the NLDI values, indicating that more and more rich people are moving towards the center of Dhaka City. Mohammadpur, Cantonment, Mirpur, Tejgaon, Kafrul, Kadamtali, Adabor, Uttara, Dhanmondi, Kamrangir, Char, Ramna, Rampura, Shahbagh, and Khilgaon have seen an increase in the NLDI values, suggesting a more unequal income distribution. This indicates that rich people are becoming richer, and poor people are becoming poorer. All the other regions have seen a decrease in the NLDI values, suggesting a more equal income distribution. Even though income inequality has declined, the classified daytime imagery suggests these areas have also seen an increase in built-up areas, suggesting that ecosystem service values have decreased in these areas.

4. Discussion

The government of Bangladesh has implemented several projects for intensifying electricity production over the past decade [60]. The Bangladesh government has stated that the country has now achieved complete electricity coverage and that energy output has more than doubled in the past decade [61]. This is a bold claim, considering that Bangladesh is one of the world’s developing countries. This research tried to find out the validity of this claim by considering and calculating the total amount of radiance that emanated from Dhaka City over the past decade. Apart from that, this research also calculated regional inequality by modifying a development index called the NLDI.
Another important finding of this research is that nighttime radiance can be used as a valuable measure for measuring electricity. As more electricity consumption means more nighttime radiance, we could identify whether there has been a change in the electricity consumption of Dhaka City over the past decade. Also, the main reason for conducting a linear regression analysis between NTL and both GDP and electricity consumption was that the data were crucial for validating NTL as a reliable proxy for socioeconomic development. Analyzing these relationships strengthened the NDLI’s credibility and enabled detailed spatial and temporal insights into economic activity and energy usage. This enhanced the index’s robustness and provides valuable policy implications, aiding in the efficient allocation of resources and energy development strategies.
After calculating the total NTL radiance and showing it on a graph, we could observe that NTL radiance is rising with time in the study region. The major reason for this is that the population increased by 42% in the past ten years, and in order to accommodate this enormous population, some land cover types were converted into built-up areas, resulting in massive amounts of energy demand and consumption. As the population increased, electricity consumption rose, leading to a corresponding spike in NTL radiance over the past decade. It is important to note that as the country’s capital and the income generation hub for all economic activities, over the past two decades, a large number of people flocked to this city. To accommodate this large population, the city had no other choice but to build houses and infrastructure for its people, which often led to converting wetlands, agricultural areas/grassland, and tree-covered areas to built-up areas and led to unplanned urbanization. The ULCC map also reveals significant changes across several subdistricts of Dhaka, particularly in the outer regions of the city. Dhaka has nearly reached its maximum capacity for built-up areas, and with limited space remaining for further urban development, people have been compelled to expand and develop the peripheral areas around the city’s boundaries. While this expansion has led to substantial infrastructural growth, it also poses a serious threat to biodiversity and the natural environment, as the pressures of urbanization extend into previously undeveloped areas. Today, Dhaka is considered the worst in all aspects, from air quality to minimum forest requirements [62]. Dhaka has persistently struggled to maintain the essential habitat quality expected of an ideal city, falling short in key areas such as air and water quality, waste management efficiency, renewable energy adoption, the availability of green spaces, sustainable transportation systems, affordable housing, and resilient infrastructure. Dhaka is ranked among the world’s top four worst cities to live in, according to the world air quality index [63].
The NLDI can provide several benefits in terms of monitoring and assessing economic development and urbanization. Firstly, the NLDI can provide a quantitative measure of economic development by using the intensity of NTL as a proxy for economic activity. This was helpful for tracking changes in economic development over time, as well as comparing economic development across subdistricts of Dhaka City. As we saw, the NLDI value decreased toward the periphery regions of Dhaka City. Secondly, the NLDI can be used to identify areas of economic inequality or disparities in development. This can help to inform policy interventions aimed at promoting more equitable economic growth and development. Thirdly, the NLDI can be used to monitor urbanization patterns and assess the impact of urbanization on the environment and human well-being.
Overall, the NLDI can provide valuable insights into the dynamics of economic development and urbanization and can help inform policy decisions and sustainable development strategies. The NLDI value was quite useful in determining the impoverished and wealthy neighborhoods of Dhaka. The NLDI value will be extremely useful to policymakers in identifying critical areas that demand greater attention, which will ultimately be beneficial in creating a sustainable city in the future. Moreover, the analysis of nighttime information enables urban planners and policymakers to gain a deeper understanding of the operations of cities, recognize zones with high levels of activity as well as those that require enhancement, and create more efficient approaches to tackle urban issues. Therefore, the NLDI can serve as a critical tool for monitoring urbanization patterns. By analyzing its temporal variations, policymakers and urban planners can gain valuable insights to guide effective land use planning. Furthermore, the NLDI provides a robust scientific basis for developing sectoral frameworks that promote sustainable urban expansion while maintaining ecological balance.

5. The Limitations of This Study

The main challenge of this research was to find appropriate and correct data. Because Bangladesh is a developing country, appropriate, timely data are difficult to acquire. Also, it is worth mentioning that NTL data were missing from nine dates, the 70th, 84th, 85th, and 86th days in 2012, the 35th day in 2014, the 21st day in 2019, and the 197th, 207th, and 22nd days in 2022. After a thorough search, no data were found regarding electricity consumption for the study area (Dhaka City) for the past ten years. Instead of using electricity consumption for Dhaka City, the electricity consumption for the entire country was used in the regression. This justification is supported by the fact that electricity consumption has increased across nearly all regions of Bangladesh over the past decade. Therefore, the total electricity consumption of the country can be used as a proxy for that of Dhaka City. Another issue with using NTL data is the saturation effect, where areas with high-intensity light emissions, such as central Dhaka, exceed sensors’ capacity, leading to inaccurate intensity measurements. This may impact on the precision of the NLDI in highly illuminated areas, and future studies could explore methods to adjust for this effect, especially when comparing NTL intensity in different regions. A further challenge of this study is that the SEDAC’s population data are only available in five-year intervals, which restricted the calculation of the NLDI to the same interval. In this research, we used SEDAC’s population data from 2010 as a proxy for the year 2012, since data were not available for the year 2012. Additionally, the resolution of NTL data (500 m) was not optimal, meaning that the NLDI may not have captured small settlements or variations within large settlements accurately. This might be the reason why we were not able to calculate values for the small subdistricts like Sher-e-Bangla Nagar, Kafrul, and Newmarket. Finally, Black Marble data were available only after the year 2012. Therefore, we cannot use Black Marble data before then for future research.

6. Conclusions

This study demonstrates the value of using NASA’s Black Marble dataset to monitor and analyze the changes in electrification patterns and regional inequality in Dhaka, Bangladesh. By leveraging a modified NLDI, we show that nighttime satellite imagery is an invaluable data source for assessing urbanization, infrastructure development, and disparities in access to essential services across different urban zones. This research enhances the understanding of spatial disparities in Dhaka, offering important insights for urban planners and policymakers. The reduction in inequality observed in recent years may be attributed to targeted development projects, but this study underscores that more work remains to be conducted, particularly in addressing the disparities between central and peripheral areas. It would be valuable to examine if the association between regional economic success and NTL satellite imagery persists in developed nations when light pollution is decreased by current technologies. Future research should compare the NLDI to other environmental and social indicators, such as air quality or health outcomes, so that potential risks and trade-offs associated with urbanization may be identified and sustainable urban planning and management practices can be established. Although this study yields meaningful results regarding the use of Black Marble NTL data in modeling Dhaka’s economic inequality status, future research should be conducted to create more robust analysis from various perspectives, and if a variety of data sources are used, more detailed information will become available.

Supplementary Materials

The following supporting information can be downloaded at https://www.mdpi.com/article/10.3390/rs17081397/s1. Table S1: NLDI value and change in NLDI value for years 2010 and 2020; Table S2: Mean NTL Radiance, Electricity consumption, and the GDP per Capita over the last decade; Table S3: Summary of Linear Regression Analysis between NTL Radiance and GDP per Capita; Table S4: Summary of Linear Regression Analysis between NTL Radiance and Electricity Consumption.

Author Contributions

Conceptualization, K.S.I. and H.M.A.; Methodology, M.R.I. and H.M.A.; Software, K.S.I.; Validation, K.S.I. and Q.W.; Formal analysis, K.S.I.; Investigation, K.S.I. and H.M.A.; Resources, Q.W.; Data curation, K.S.I.; Writing—original draft, K.S.I. and M.R.I.; Writing—review & editing, K.S.I., Q.W. and H.M.A.; Visualization, K.S.I.; Supervision, H.M.A.; Project administration, H.M.A. All authors have read and agreed to the published version of the manuscript.

Funding

This research received no external funding and APC was waived by MDPI.

Data Availability Statement

The original contributions presented in the study are included in the article/Supplementary Material, further inquiries can be directed to the corresponding author.

Conflicts of Interest

The authors declare no conflicts of interest.

References

  1. World Bank Open Data. 2023. Available online: https://data.worldbank.org/indicator/EG.ELC.ACCS.ZS?locations=BD (accessed on 1 December 2024).
  2. Ma, T.; Zhou, C.; Pei, T.; Haynie, S.; Fan, J. Quantitative estimation of urbanization dynamics using time series of DMSP/OLS nighttime light data: A comparative case study from China’s cities. Remote Sens. Environ. 2012, 124, 99–107. [Google Scholar] [CrossRef]
  3. Rahaman, M.A.; Kalam, A.; Al-Mamun, M. Unplanned urbanization and health risks of Dhaka City in Bangladesh: Uncovering the associations between urban environment and public health. Front. Public Health 2023, 11, 1269362. [Google Scholar] [CrossRef] [PubMed]
  4. Ahmed, N. The Costs and Risks Associated with Rapid, Unplanned Urbanisation. The Daily Star, 19 February 2022. Available online: https://www.thedailystar.net/recovering-covid-reinventing-our-future/developing-inclusive-and-democratic-bangladesh/news/the-costs-and-risks-associated-rapid-unplanned (accessed on 1 January 2025).
  5. Huq, N. Is urbanisation in Bangladesh Doomed? The Daily Star, 22 October 2023. Available online: https://www.thedailystar.net/opinion/views/news/urbanisation-bangladesh-doomed-3449636 (accessed on 13 February 2025).
  6. Fan, Q.; Rama, M. Seize the Opportunity to Make Dhaka a Great, Modern City. The Daily Star, 19 July 2017. Available online: https://www.thedailystar.net/opinion/society/seize-the-opportunity-make-dhaka-great-modern-city-1435108 (accessed on 11 January 2025).
  7. Macrotrends. Dhaka Population 1950–2024. Macrotrends. 2024. Available online: https://www.macrotrends.net/global-metrics/cities/20119/dhaka/population (accessed on 9 June 2024).
  8. Chang, Y.; Wang, S.; Zhou, Y.; Wang, L.; Wang, F. A novel method of evaluating highway traffic prosperity based on nighttime light remote sensing. Remote Sens. 2019, 12, 102. [Google Scholar] [CrossRef]
  9. Zhu, Y.; Geis, C.; So, E.; Jin, Y. Multitemporal Relearning with Convolutional LSTM Models for Land Use Classification. IEEE J. Sel. Top. Appl. Earth Obs. Remote Sens. 2021, 14, 3251–3265. [Google Scholar] [CrossRef]
  10. Islam, I.; Tonny, K.F.; Hoque, M.Z.; Abdullah, H.M.; Khan, B.M.; Islam, K.H.S.; Prodhan, F.A.; Ahmed, M.; Mohana, N.T.; Ferdush, J. Monitoring and prediction of land use land cover change of Chittagong Metropolitan City by CA-ANN model. Int. J. Environ. Sci. Technol. 2024, 21, 6275–6286. [Google Scholar] [CrossRef]
  11. Brown, M.E.; de Beurs, K.M.; Marshall, M. Global phenological response to climate change in crop areas using satellite remote sensing of vegetation, humidity and temperature over 26 years. Remote Sens. Environ. 2012, 126, 174–183. [Google Scholar] [CrossRef]
  12. Jiang, B.; Bamutaze, Y.; Pilesjö, P. Climate change and land degradation in Africa: A case study in the Mount Elgon region, Uganda. Geo-Spat. Inf. Sci. 2014, 17, 39–53. [Google Scholar] [CrossRef]
  13. Bello, O.M.; Aina, Y.A. Satellite Remote Sensing as a Tool in Disaster Management and Sustainable Development: Towards a Synergistic Approach. Procedia—Soc. Behav. Sci. 2014, 120, 365–373. [Google Scholar] [CrossRef]
  14. Amaral, S.; Câmara, G.; Monteiro, A.M.V.; Quintanilha, J.A.; Elvidge, C.D. Estimating population and energy consumption in Brazilian Amazonia using DMSP night-time satellite data. Comput. Environ. Urban Syst. 2005, 29, 179–195. [Google Scholar] [CrossRef]
  15. Henderson, J.V.; Storeygard, A.; Weil, D.N. Measuring economic growth from outer space. Am. Econ. Rev. 2012, 102, 994–1028. [Google Scholar] [CrossRef]
  16. Li, X.; Ge, L.; Chen, X. Detecting Zimbabwe’s decadal economic decline using nighttime light imagery. Remote Sens. 2013, 5, 4551–4570. [Google Scholar] [CrossRef]
  17. Gibson, J.; Li, C.; Boe-Gibson, G. Economic growth and expansion of China’s urban land area: Evidence from administrative data and night lights 1993–2012. Sustainability 2014, 6, 7850–7865. [Google Scholar] [CrossRef]
  18. Liu, Z.; He, C.; Zhang, Q.; Huang, Q.; Yang, Y. Extracting the dynamics of urban expansion in China using DMSP-OLS nighttime light data from 1992 to 2008. Landsc. Urban Plan. 2012, 106, 62–72. [Google Scholar] [CrossRef]
  19. Waluda, C.M.; Griffiths, H.J.; Rodhouse, P.G. Remotely sensed spatial dynamics of the Illex argentinus fishery, Southwest Atlantic. Fish. Res. 2008, 91, 196–202. [Google Scholar] [CrossRef]
  20. Huang, Q.; He, C.; Gao, B.; Yang, Y.; Liu, Z.; Zhao, Y.; Dou, Y. Detecting the 20 year city-size dynamics in China with a rank clock approach and DMSP/OLS nighttime data. Landsc. Urban Plan. 2015, 137, 138–148. [Google Scholar] [CrossRef]
  21. Shi, K.; Huang, C.; Yu, B.; Yin, B.; Huang, Y.; Wu, J. Evaluation of NPP-VIIRS night-time light composite data for extracting built-up urban areas. Remote Sens. Lett. 2014, 5, 358–366. [Google Scholar] [CrossRef]
  22. Shi, K.; Yu, B.; Huang, Y.; Hu, Y.; Yin, B.; Chen, Z.; Chen, L.; Wu, J. Evaluating the ability of NPP-VIIRS nighttime light data to estimate the gross domestic product and the electric power consumption of China at multiple scales: A comparison with DMSP-OLS data. Remote Sens. 2014, 6, 1705–1724. [Google Scholar] [CrossRef]
  23. Zhou, Y.; Smith, S.J.; Elvidge, C.D.; Zhao, K.; Thomson, A.; Imhoff, M. A cluster-based method to map urban area from DMSP/OLS nightlights. Remote Sens. Environ. 2014, 147, 173–185. [Google Scholar] [CrossRef]
  24. Li, X.; Zhang, R.; Huang, C.; Li, D. Detecting 2014 Northern Iraq Insurgency using night-time light imagery. Int. J. Remote Sens. 2015, 36, 3446–3458. [Google Scholar] [CrossRef]
  25. Li, X.; Li, D. Can night-time light images play a role in evaluating the Syrian Crisis? Int. J. Remote Sens. 2014, 35, 6648–6661. [Google Scholar] [CrossRef]
  26. Chen, X.; Nordhaus, W.D. Using luminosity data as a proxy for economic statistics. Proc. Natl. Acad. Sci. USA 2011, 108, 8589–8594. [Google Scholar] [CrossRef] [PubMed]
  27. Doll, C.N.H.; Muller, J.P.; Morley, J.G. Mapping regional economic activity from night-time light satellite imagery. Ecol. Econ. 2006, 57, 75–92. [Google Scholar] [CrossRef]
  28. Doll, C.N.H.; Muller, J.P.; Elvidge, C.D. Night-time imagery as a tool for global mapping of socioeconomic parameters and greenhouse gas emissions. Ambio 2000, 29, 157–162. [Google Scholar] [CrossRef]
  29. He, C.; Ma, Q.; Liu, Z.; Zhang, Q. Modeling the spatiotemporal dynamics of electric power consumption in mainland China using saturation-corrected DMSP/OLS nighttime stable light data. Int. J. Digit. Earth 2014, 7, 993–1014. [Google Scholar] [CrossRef]
  30. Kroth, V.; Larcinese, V.; Wehner, J. A better life for all? democratization and electrification in post-apartheid South Africa. J. Politics 2016, 78, 774–791. [Google Scholar] [CrossRef]
  31. Min, B. Democracy and light: Electoral accountability and the provision of public goods. In Proceedings of the Annual Meeting of the Midwest Political Science Association, Chicago, IL, USA, 3–6 April 2008. [Google Scholar]
  32. Zheng, Q.; Seto, K.C.; Zhou, Y.; You, S.; Weng, Q. Nighttime light remote sensing for urban applications: Progress, challenges, and prospects. ISPRS J. Photogramm. Remote Sens. 2023, 202, 125–141. [Google Scholar] [CrossRef]
  33. Zhao, M.; Zhou, Y.; Li, X.; Cao, W.; He, C.; Yu, B.; Li, X.; Elvidge, C.D.; Cheng, W.; Zhou, C. Applications of Satellite Remote Sensing of Nighttime Light Observations: Advances, Challenges, and Perspectives. Remote Sens. 2019, 11, 1971. [Google Scholar] [CrossRef]
  34. Yang, C.; Yu, B.; Chen, Z.; Song, W.; Zhou, Y.; Li, X.; Wu, J. A spatial-socioeconomic urban development status curve from NPP-VIIRS nighttime light data. Remote Sens. 2019, 11, 2398. [Google Scholar] [CrossRef]
  35. Chen, Z.; Yu, B.; Song, W.; Liu, H.; Wu, Q.; Shi, K.; Wu, J. A new approach for detecting urban centers and their spatial structure with nighttime light remote sensing. IEEE Trans. Geosci. Remote Sens. 2017, 55, 6305–6319. [Google Scholar] [CrossRef]
  36. Hu, Y.N.; Peng, J.; Liu, Y.; Du, Y.; Li, H.; Wu, J. Mapping development pattern in Beijing-Tianjin-Hebei urban agglomeration using DMSP/OLS nighttime light data. Remote Sens. 2017, 9, 760. [Google Scholar] [CrossRef]
  37. Elvidge, C.D.; Baugh, K.E.; Anderson, S.J.; Sutton, P.C.; Ghosh, T. The Night Light Development Index (NLDI): A spatially explicit measure of human development from satellite data. Soc. Geogr. 2012, 7, 23–35. [Google Scholar] [CrossRef]
  38. Sacchi, A.; Salotti, S. The Effects of Fiscal Decentralization on Household Income Inequality: Some Empirical Evidence. Spat. Econ. Anal. 2014, 9, 202–222. [Google Scholar] [CrossRef]
  39. Zhou, Y.; Ma, T.; Zhou, C.; Xu, T. Nighttime light derived assessment of regional inequality of socioeconomic development in China. Remote Sens. 2015, 7, 1242–1262. [Google Scholar] [CrossRef]
  40. Ivan, K.; Holobâcă, I.H.; Benedek, J.; Török, I. Potential of night-time lights to measure regional inequality. Remote Sens. 2020, 12, 33. [Google Scholar] [CrossRef]
  41. Mveyange, A. Night lights and regional income inequality in Africa. In WIDER Working Paper: Vol. No. 2015, 2015/0; UNU-WIDER: Helsinki, Finland, 2015. [Google Scholar]
  42. Deren, L.; Xi, L. An overview on data mining of nighttime light remote sensing. Acta Geod. Et Cartogr. Sin. 2015, 44, 591. [Google Scholar]
  43. Shi, K.; Chen, Y.; Yu, B.; Xu, T.; Yang, C.; Li, L.; Huang, C.; Chen, Z.; Liu, R.; Wu, J. Detecting spatiotemporal dynamics of global electric power consumption using DMSP-OLS nighttime stable light data. Appl. Energy 2016, 184, 450–463. [Google Scholar] [CrossRef]
  44. Pandey, B.; Joshi, P.K.; Seto, K.C. Monitoring urbanization dynamics in India using DMSP/OLS night time lights and SPOT-VGT data. Int. J. Appl. Earth Obs. Geoinf. 2013, 23, 49–61. [Google Scholar] [CrossRef]
  45. Yaqoob, N.; Ali, S.A.; Kannaiah, D.; Khan, N.; Shabbir, M.S.; Bilal, K.; Tabash, M.I. The effects of Agriculture Productivity, Land Intensification, on Sustainable Economic Growth: A panel analysis from Bangladesh, India, and Pakistan Economies. In Environmental Science and Pollution Research; Springer: Berlin/Heidelberg, Germany, 2022. [Google Scholar] [CrossRef]
  46. Opu Hossain, M. Dhaka Ranks World’s Sixth Most Populous City. Dhaka Tribune, 14 January 2022. Available online: https://www.dhakatribune.com/bangladesh/261898/dhaka-ranks-world%E2%80%99s-sixth-most-populous-city (accessed on 27 April 2024).
  47. World Population Review. Dhaka, Bangladesh Population 2024. Available online: https://worldpopulationreview.com/cities/bangladesh/dhaka (accessed on 15 August 2023).
  48. Soma, H.; Sukhwani, V.; Shaw, R. An approach to determining the linkage between livelihood assets and the housing conditions in urban slums of Dhaka. J. Urban Manag. 2022, 11, 23–36. [Google Scholar] [CrossRef]
  49. Daily Sun. Dhaka Contributes to 35% of GDP: DCCI. Daily Sun. 3 September 2023. Available online: https://www.daily-sun.com/post/709996/Dhaka-contributes-to-35pc-of-GDP:-DCCI (accessed on 5 January 2025).
  50. Uddin, M. We Must Stop the Infighting to Retain Buyers. The Daily Star, 11 September 2024. Available online: https://www.thedailystar.net/opinion/views/rmg-notes/news/we-must-stop-the-infighting-retain-buyers-3700081 (accessed on 10 February 2025).
  51. Zhang, Y.; Li, X.; Huang, J.; Guan, H.; Huang, H. A novel framework for urban land cover change detection with NASA’s black marble nighttime lights product. IEEE Trans. Geosci. Remote Sens. 2023, 61, 1–9. [Google Scholar] [CrossRef]
  52. NASA Earth Science Data Systems (ESDS). (2021, April 9). SEDAC|Socioeconomic Data and Applications Center. Earthdata. Available online: https://www.earthdata.nasa.gov/eosdis/daacs/sedac (accessed on 18 January 2025).
  53. Keshtkar, H.; Voigt, W.; Alizadeh, E. Land-cover classification and analysis of change using machine-learning classifiers and multi-temporal remote sensing imagery. Arab. J. Geosci. 2017, 10, 1–15. [Google Scholar] [CrossRef]
  54. Congalton, R.G.; Green, K. Assessing the Accuracy of Remotely Sensed Data: Principles and Practices; CRC press: Boca Raton, FL, USA, 2019. [Google Scholar]
  55. Onaran, Ö.; Galanis, G. Income distribution and growth: A global model. Environ. Plan. A 2014, 46, 2489–2513. [Google Scholar] [CrossRef]
  56. Tousif Tanzir, M.; Shakibul Islam, K.; Raihanul Islam, M.; Abdullah, H.M.; Kaium Tuhin, A.; Tousif, M.; Islam, S.; Raihanul, M.; Kaium, A. Vulnerability Assessment of Urban and Peri-Urban Areas in Dhaka: Exploring Ecosystem Service Loss. Cities Environ. (CATE) 2024, 2022, 17. [Google Scholar]
  57. BBC News. Bangladesh: Why Is the Economy Growing so Fast? BBC News, 22 October 2014. Available online: https://www.bbc.com/news/world-asia-29861485 (accessed on 14 April 2024).
  58. Dey, S.R.; Tareque, M. Electricity consumption and GDP nexus in Bangladesh: A time series investigation. J. Asian Bus. Econ. Stud. 2019, 27, 35–48. [Google Scholar] [CrossRef]
  59. Masuduzzaman, M. Electricity Consumption and Economic Growth in Bangladesh: Co-Integration and Causality Analysis. 2012, June. Available online: https://mof.portal.gov.bd/sites/default/files/files/mof.portal.gov.bd/page/17643e1a_542c_47c8_a833_91a90d156ac7/chapter2.pdf (accessed on 27 April 2024).
  60. Abdulrazak, L.F.; Islam, A.K.M.S.; Hossain, M.B. Towards energy sustainability: Bangladesh perspectives. Energy Strategy Rev. 2021, 38, 100738. [Google Scholar] [CrossRef]
  61. Dhaka Tribune. PM Hasina: 100% Electricity Coverage a Landmark. 2022. Available online: https://www.dhakatribune.com/bangladesh/288178/pm-hasina-100%25-electricity-coverage-a-landmark (accessed on 24 January 2025).
  62. Zarin, T.; Esraz-Ul-Zannat, M. Assessing the potential impacts of LULC change on urban air quality in Dhaka city. Ecol. Indic. 2023, 154, 110746. [Google Scholar] [CrossRef]
  63. IQAir. World’s Most Polluted Cities. Available online: https://www.iqair.com/us/world-most-polluted-cities (accessed on 31 January 2023).
Figure 1. A map of the study area of Dhaka City.
Remotesensing 17 01397 g001
Figure 2. A graphical representation of the Lorenz curve showing the relationship between population and night light. Here, A is the area between the perfect-equality line and the Lorenz curve; and B is the area under the Lorenz curve.
Remotesensing 17 01397 g002
Figure 3. The complete procedure of this study.
Remotesensing 17 01397 g003
Figure 4. Spatio-temporal urban land use and land cover in Dhaka City in 2010 and 2020.
Remotesensing 17 01397 g004
Figure 5. Total areas (in hectares) of ULCC types in 2010 and 2020.
Remotesensing 17 01397 g005
Figure 6. Time series NTL radiance in Dhaka City, 2012–2022.
Remotesensing 17 01397 g006
Figure 7. GDP per capita and electricity consumption over the past decade for Bangladesh [1,58,59].
Remotesensing 17 01397 g007
Figure 8. Comparison of NTL radiance in 2012 and 2022.
Remotesensing 17 01397 g008
Figure 9. The nighttime radiance and the population count (SEDAC) for the year 2012.
Remotesensing 17 01397 g009
Figure 10. The NLDI map of Dhaka City for the years 2012 and 2022.
Remotesensing 17 01397 g010
Figure 11. The percentage and change detection.
Remotesensing 17 01397 g011
Table 1. List of satellite images covering Dhaka City used in this study.
SatelliteDate of Image CollectionResolutionCoordinate System
Landsat 5 (TM)30 November 201030 mWGS 1984 UTM Zone 46N
Landsat 8 (OLI)25 November 202030 mWGS 1984 UTM Zone 46N
Table 2. The ULCC classification scheme.
Land Use/Cover TypeDescription
Built-up areaResidential, commercial and services, industrial, transportation, roads, mixed urban, other urban areas
LandfillExposed soils, landfill sites, areas of active excavation, bare land
Trees/GrasslandDeciduous forest, mixed forest, palms, scattered trees, scrub, crop fields, grassland, fallow lands
Water bodiesRiver, permanent open water, lakes, ponds, reservoirs
Disclaimer/Publisher’s Note: The statements, opinions and data contained in all publications are solely those of the individual author(s) and contributor(s) and not of MDPI and/or the editor(s). MDPI and/or the editor(s) disclaim responsibility for any injury to people or property resulting from any ideas, methods, instructions or products referred to in the content.

