Article

Spatiotemporal Dynamics and Future Projections of Carbon Use Efficiency on the Mongolian Plateau: A Remote Sensing and Machine Learning Approach

1
College of Forestry, Beijing Forestry University, Beijing 100083, China
2
State Key Laboratory of Efficient Production of Forest Resources, Beijing 100083, China
3
School of Agroecology, Mongolian University of Life Sciences, Ulaanbaatar 999097, Mongolia
*
Author to whom correspondence should be addressed.
Remote Sens. 2025, 17(8), 1392; https://doi.org/10.3390/rs17081392
Submission received: 3 March 2025 / Revised: 7 April 2025 / Accepted: 9 April 2025 / Published: 14 April 2025
(This article belongs to the Section Biogeosciences Remote Sensing)

Abstract

:
The Mongolian Plateau, a critical area for global climate change response, faces increasing vulnerability from climate change and human activities impacting its arid ecosystems. This study integrates GeoDetector and machine learning to predict vegetation Carbon Use Efficiency (CUE) dynamics. It utilizes multi-source remote sensing data (MODIS, ERA5-Land) from 2000 to 2020 and incorporates four Shared Socioeconomic Pathways (SSPs) from CMIP6. The results indicate the following: (1) significant spatial variation exists, with high-value CUE areas (≥0.7) in the northwest due to favorable climatic conditions, while low-value areas (<0.6) in the east are affected by decreasing precipitation and overgrazing; (2) CUE increased at an annual rate of 1.03%, with a 43% acceleration after the 2005 climate shift, highlighting the synergistic effects of ecological engineering; (3) our findings reveal that the interaction of evapotranspiration and temperature dominates CUE spatial differentiation, with the random forest model accurately predicting CUE dynamics (root mean square error (RMSE) = 0.0819); (4) scenario simulations show the SSP3-7.0 pathway will peak CUE at 0.6103 by 2050, while the SSP5-8.5 scenario will significantly reduce spatial heterogeneity. The study recommends enhancing water–heat regulation in the northwest and implementing vegetation restoration strategies in the east, alongside establishing a CUE warning system. This research offers valuable insights for improving carbon sequestration and climate resilience in arid ecosystems, with significant implications for carbon management under high-emission scenarios.

1. Introduction

The exponential increase in anthropogenic carbon emissions has emerged as a critical driver of contemporary climate change, driving a sustained increase in mean surface temperatures [1]. This climatic transformation and its associated extreme weather phenomena are exerting transformative pressures on the structural integrity, species composition, and functional dynamics of terrestrial ecosystems worldwide, with particularly pronounced impacts observed in ecologically vulnerable arid/semi-arid biomes [2].
Photosynthetic carbon sequestration is a key biogeochemical process linking ecosystems and climate [3]. It involves CO2 assimilation and biomass synthesis [4]. Simultaneously, vegetation mediates carbon–water flux partitioning through stomatal-regulated respiratory and transpirational processes [5]. Within the context of accelerating anthropogenic emissions and climatic perturbations, the systematic quantification of vegetation carbon use efficiency (CUE) dynamics and their spatiotemporal heterogeneity in ecologically sensitive zones has emerged as a critical scientific endeavor for informing ecosystem resilience management and low-carbon development policy formulation [6].
Vegetation CUE, defined as the biogeochemical metric quantifying carbon allocation efficiency through the NPP/GPP ratio [7], represents a critical ecosystem functional parameter characterizing the partitioning between carbon sequestration and metabolic expenditure [6]. Methodological approaches for CUE determination have evolved temporally, progressing from early ecophysiological estimations via intensive field campaigns measuring carbon fixation–respiration balances [8] to contemporary biometeorological techniques. Notable applications include the 5-year forest CUE monitoring in Michigan’s mixed hardwood ecosystems through biometric-GPP coupling [9].
Technological innovations like eddy covariance (EC) systems have revolutionized CUE quantification through continuous ecosystem-scale flux measurements. Representative implementations encompass the following: (1) integrated EC–bioassay protocols for Mediterranean apple orchard productivity assessments [10]; (2) hybrid biostatistical–EC frameworks analyzing boreal–temperate transition zone coniferous stands [11]; (3) high temporal resolution EC monitoring of short-rotation poplar plantation carbon dynamics [12]. Isotopic tracer techniques have further enhanced measurement precision, particularly in low-stature shrub ecosystems where direct tissue-specific carbon allocation tracking proves effective [13].
The advent of satellite remote sensing has enabled continental-scale CUE pattern analysis through the synergistic use of MODIS-derived productivity parameters (GPP and NPP) with climate datasets, exemplified by global CUE trend mapping under climatic forcing [14]. Advanced geospatial methodologies integrating MODIS products with forest inventory (FIA) data have successfully disentangled forest type-specific CUE responses to environmental gradients in eastern North America [15].
Climate change has a considerable impact on global vegetation CUE [16]. Studies have shown that after the doubling of CO2 concentration, China’s forest productivity increased by 12–35% [17]. However, the promotion effect of rising CO2 concentration on ecosystem carbon sinks is nonlinear and may weaken or even disappear over time. The reason is still unclear. Therefore, assessing the impact of climate change on ecosystem CUE is key to understanding global ecosystem adjustment and carbon emission reduction. A large number of studies have explored the response of ecosystem CUE to climate change. For example, using moderate resolution imaging spectrometer data and ecosystem productivity models, the temporal dynamics of global ecosystem CUE from 2000 to 2009 and its dependence on climate were analyzed. It was found that CUE showed a downward trend during this period and was significantly regulated by temperature and precipitation. Temperature was positively correlated with CUE, while precipitation was negatively correlated [14]. A study combined FLIXNET site observations, satellite and climate data, and used machine learning methods to estimate CUE in semi-arid regions around the world. The results showed that precipitation is the most important climate factor affecting vegetation CUE in semi-arid ecosystems [18]. Another study evaluated the carbon cycle status of global grassland ecosystems from 2000 to 2011 based on remote sensing drought intensity and grassland CUE, and found that drought is the main driving factor for the dynamic changes in grassland CUE [19]. In this study, we hypothesize that forest-steppe ecosystems exhibit stronger CUE persistence than desert steppes due to asymmetric climate adaptation capacities.
The Mongolian Plateau is a typical inland arid and semi-arid area with an uneven distribution of water resources and far from the ocean for water vapor replenishment, resulting in scarce precipitation and significant interannual climate fluctuations. Its widely distributed grassland, desert steppe, and meadow steppe ecosystems are highly sensitive to climate change [20]. While global studies highlight drought as the primary CUE driver [19], the Mongolian Plateau’s monsoon-precipitation coupling and overgrazing pressures [21] may create distinct CUE responses. However, this remains unexplored in predictive studies. Although previous studies have focused on the current status of vegetation CUE on the Mongolian Plateau, predictions of its future scenarios are still insufficient. Therefore, this study aims to analyze the spatiotemporal evolution pattern of vegetation CUE on the Mongolian Plateau from 2000 to 2020, quantify the role of climate, vegetation, and topographic driving factors, and predict vegetation CUE under different development scenarios based on machine learning algorithms and combined with future climate scenarios, so as to provide a scientific basis for the sustainable development of the Mongolian Plateau. This study addresses two key questions: (1) What climatic and anthropogenic factors drive spatial heterogeneity in CUE across the Mongolian Plateau? (2) How will CUE respond to divergent climate scenarios by 2050?

2. Materials and Methods
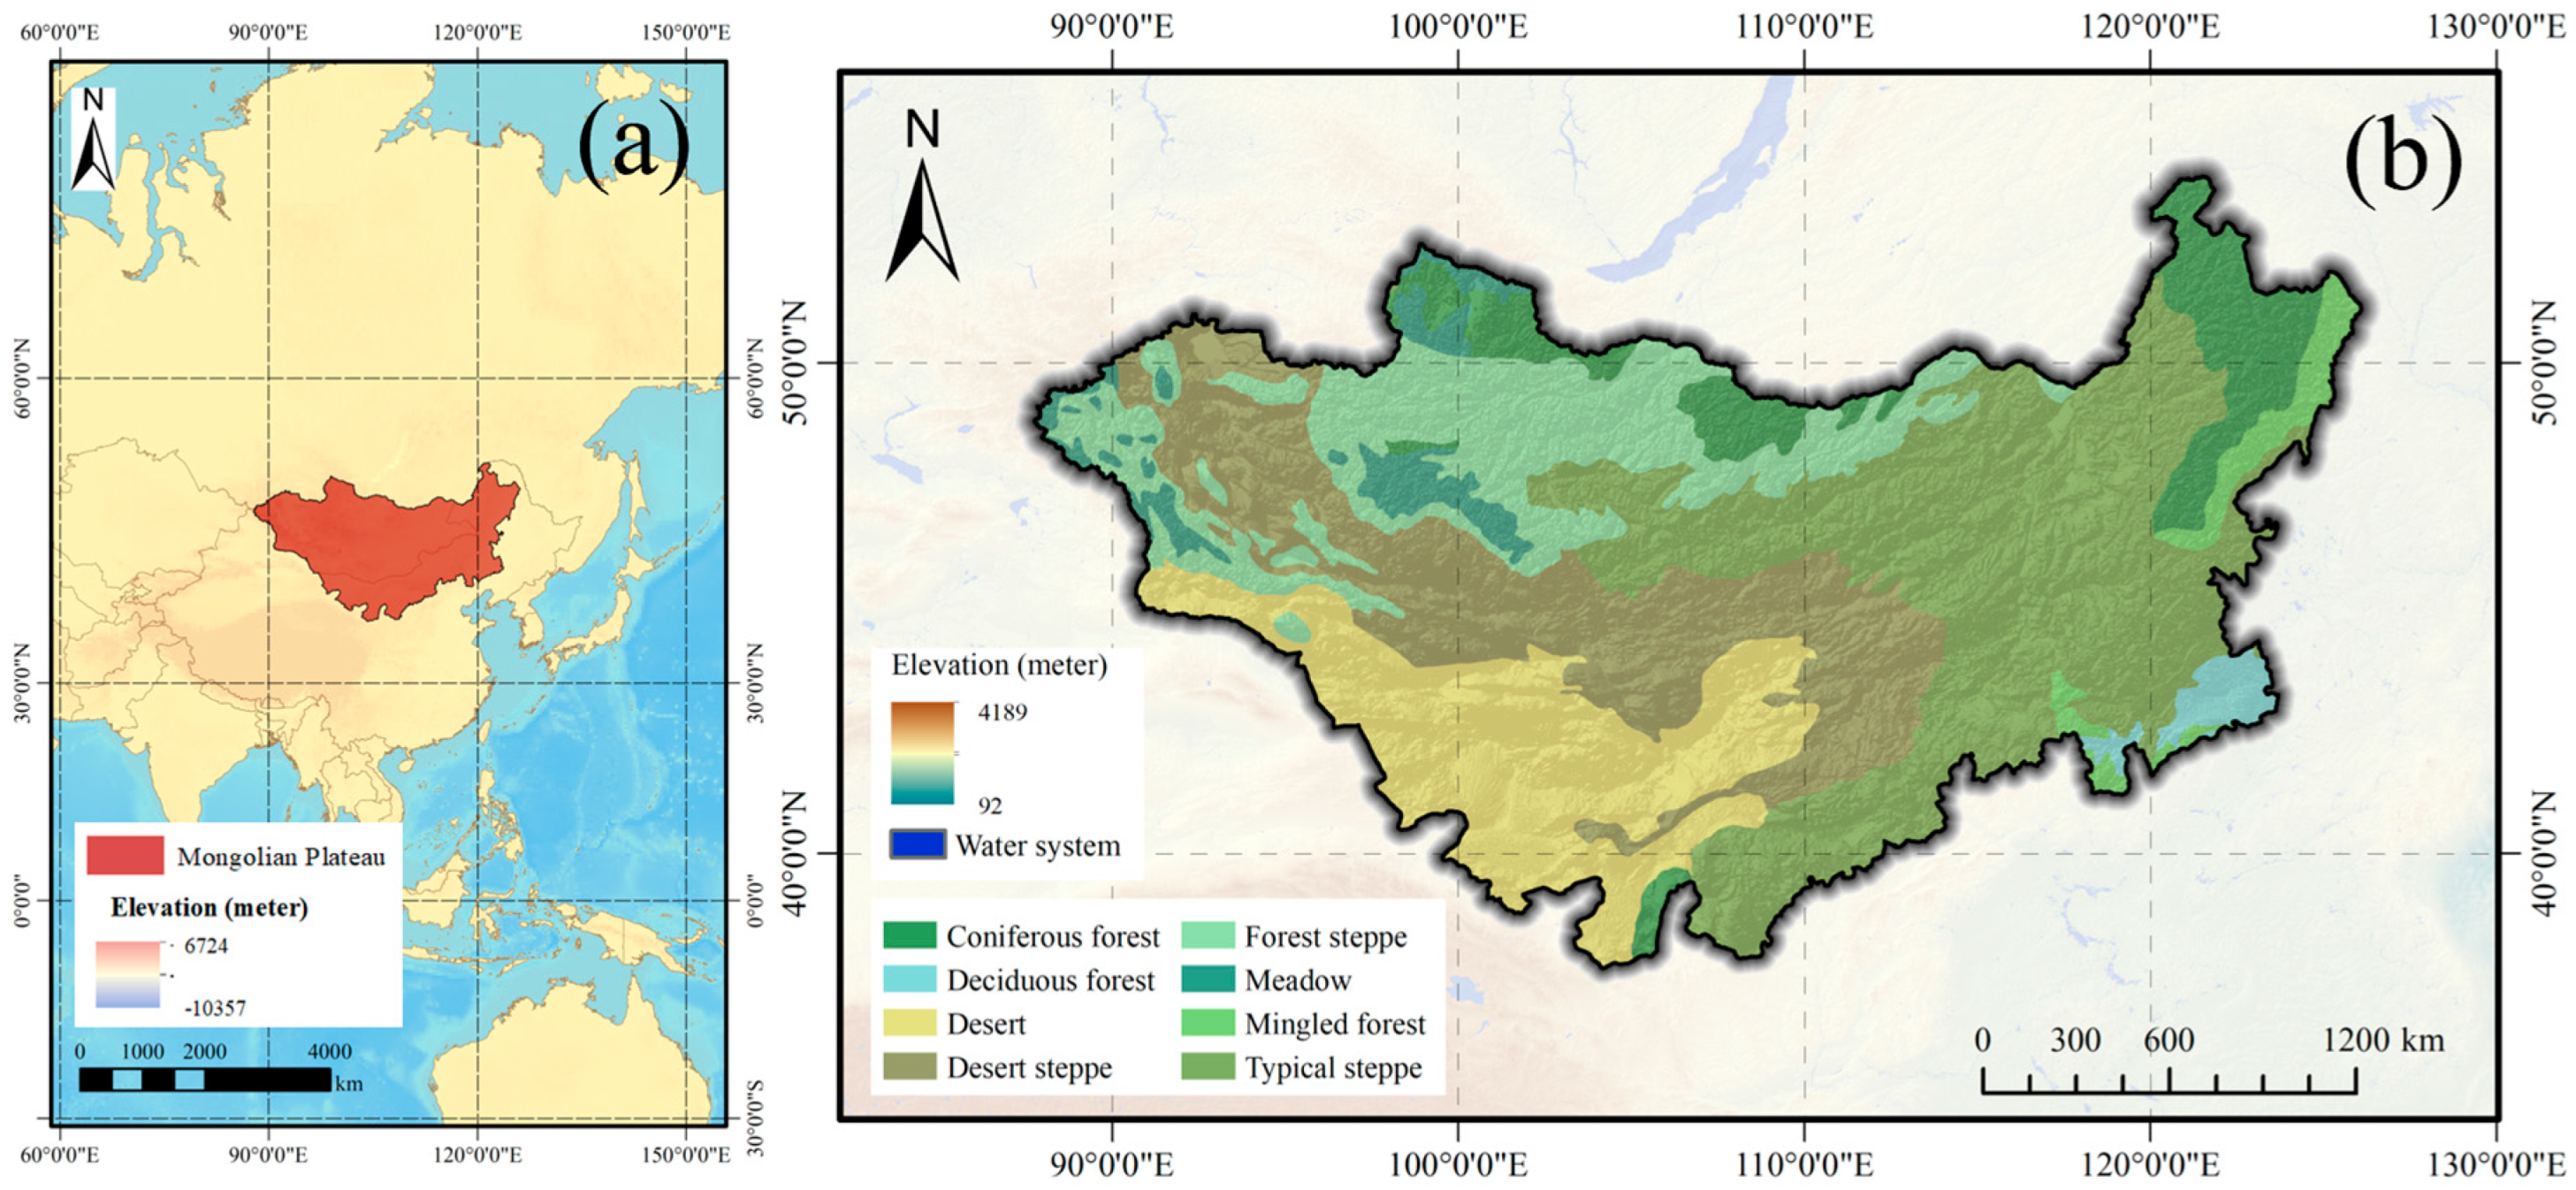
2.1. Study Area

The Mongolian Plateau (Figure 1), spanning approximately 2.7 million km2 across China and Mongolia, is a critical ecological transition zone bordered by the Gobi Desert to the south and the Siberian taiga to the north [22,23]. Inner Mongolia comprises about 43% and Mongolia about 57% of the plateau [24]. The region features diverse landscapes, including deserts such as Badain Jaran and Tengger, sandy areas like Mu Us and Horqin, as well as parts of the Gobi Desert [25].
Characterized by a temperate continental climate that is mainly arid and semi-arid, the plateau experiences greater climate change impacts, including significant temperature and precipitation fluctuations, compared to the global average [26]. The average temperatures range from −45 °C to 35 °C [27], and precipitation varies significantly, averaging between 80 mm and 433 mm annually, primarily concentrated in summer [28,29]. The vegetation types on the plateau include coniferous and deciduous forests, steppes, and deserts, gradually changing from desert to forest [30]. Grasslands, which encompass meadows and desert steppes, dominate the area, covering about 60% of the region and playing a vital role in ecosystem productivity [31].

2.2. Data Source

2.2.1. Climate Data

The climate data used in this study come from the ERA5-Land dataset, which is generated by replaying the land part of the ECMWF ERA5 climate reanalysis (https://cds.climate.copernicus.eu/ (accessed on 10 October 2024)). The dataset has a horizontal resolution of 0.1° × 0.1° and a temporal resolution of 1 h. The study used the Google Earth Engine (GEE, https://earthengine.google.com/ (accessed on 10 October 2024)) platform to extract the monthly temperature and precipitation data of the Mongolian Plateau from 2000 to 2020, and then projected, clipped, and unified the resolution to obtain the annual and monthly datasets of temperature and precipitation on the Mongolian Plateau. This dataset is used for the attribution analysis of CUE distribution and validation of regression models.

2.2.2. Remote Sensing Data

The remote sensing data used in this study mainly include the normalized difference vegetation index (NDVI), evapotranspiration, and GPP data of the Mongolian Plateau from 2000 to 2020. NDVI is used to calculate fractional vegetation cover (FVC) [32], and the data come from the MODIS/061/MOD09A1 dataset, which provides spectral reflectance estimates of bands 1–7 at a resolution of 500 m. The study uses the GEE platform to calculate, clip, and project NDVI data to generate annual and monthly NDVI datasets for the Mongolian Plateau. The evapotranspiration data select the MODIS product MOD16A2 dataset, which is an 8-day composite product with a resolution of 500 m. The evapotranspiration data are clipped, projected, and the resolution is unified through the GEE platform to obtain the annual evapotranspiration dataset of the Mongolian Plateau. The NPP data come from the MODIS NPP dataset (MODIS/006/MOD17A3HGF) (https://lpdaac.usgs.gov/products/mod17a3hgfv006/ (accessed on 13 October 2024)) on the GEE platform, which provides annual NPP estimates on a global scale with a resolution of 1000 m. The study performed temporal filtering on the annual NPP data, extracted the annual NPP, and calculated its annual average. The GPP data were selected from the MOD17A3HGFv061 dataset (https://catalog.data.gov/dataset/modis-terra-net-primary-production-gap-filled-yearly-l4-global-500m-sin-grid-v061-74c83 (accessed on 13 October 2024)), which was synthesized by synthesizing all 8-day GPP net photosynthesis products in a given year with a pixel resolution of 500 m × 500 m. The GEE platform was used to extract, clip, and project the GPP data to generate the Mongolian Plateau GPP dataset for calculating vegetation CUE.

2.2.3. Topographic Data

The terrain data used in the study include the digital elevation model (DEM) and slope data. The DEM represents the actual terrain model by describing the elevation matrix of finite points on the surface. The data come from the Shuttle Radar Topography Mission (SRTM) dataset with a spatial resolution of 90 m. Using the GEE platform, the DEM is clipped and projected in combination with the boundary vector data of the Mongolian Plateau, and the resolution is unified to 500 m to generate the DEM data of the Mongolian Plateau. The slope data are obtained by calculating the DEM data, and the terrain data are used to analyze the spatial distribution of CUE on the Mongolian Plateau.

2.2.4. CMIP6 Climate Data

The CMIP6 dataset, provided by the World Climate Research Program Working Group on Coupled Simulations (WGCM) (https://esgf-data.dkrz.de/search/cmip6-dkrz/ (accessed on 14 October 2024)), represents the most comprehensive phase of the CMIP project, incorporating the largest number of participating models and the most extensive experimental framework to date [33]. CMIP6 experiments are structured into three tiers: the core DECK experiments, designed for climate diagnosis and model evaluation; historical climate simulations, which reconstruct past climate conditions to assess model accuracy; and a suite of 23 Model Intercomparison Projects (MIPs) that explore specific scientific questions. This study utilizes both historical climate simulation data and Scenario Model Intercomparison Project (ScenarioMIP) projections [34]. The historical climate simulations reconstruct past climate conditions using observed external forcings, allowing for an assessment of model accuracy in reproducing climate variability and long-term trends. By comparing simulated and observed climate records, these experiments evaluate the models’ ability to represent radiative forcing, climate sensitivity, and large-scale climate dynamics.
ScenarioMIP provides future climate projections based on integrated Shared Socioeconomic Pathways (SSPs) and Representative Concentration Pathways (RCPs), offering insights into potential climate change impacts, mitigation strategies, and adaptation measures [35]. This study selects four future climate scenarios—SSP1-2.6, SSP2-4.5, SSP3-7.0, and SSP5-8.5—to simulate climate conditions in 2030, 2040, and 2050. These scenarios span a range of possible futures, from low-emission sustainable development (SSP1-2.6) to fossil-fuel-driven high-emission growth (SSP5-8.5). Their selection is based on the socio-economic and environmental characteristics of the Mongolian Plateau. SSP1-2.6 represents a sustainability-focused pathway with stringent emission reductions, serving as a benchmark for evaluating potential low-carbon development. SSP2-4.5 reflects a moderate trajectory balancing economic growth and environmental policies, aligning with Mongolia and Inner Mongolia’s evolving energy transitions. SSP3-7.0 accounts for Mongolia’s resource-dependent economy, where continued mining activities drive high emissions and limit climate mitigation efforts. SSP5-8.5 mirrors Inner Mongolia’s coal-intensive industrial expansion, depicting an extreme high-emission scenario.
To analyze CUE dynamics under varying climate conditions, this study utilizes three key climate variables—near-surface air temperature, precipitation, and evaporation including sublimation and transpiration—extracted from CMIP6 simulations (FGOALS-f3-L model, 100 km resolution, monthly scale). The model output follows the first ensemble member on its native grid. Given the coarse resolution of CMIP6 data, a machine learning-based downscaling approach is applied to enhance its regional applicability [36]. Details on the downscaling methodology are provided in Section 2.3.6.

2.3. Methodology

2.3.1. Carbon Use Efficiency

In this study, C U E is defined as the ratio of vegetation N P P to G P P , and the calculation formula is as follows:
C U E = N P P / G P P
wherein N P P is the net primary productivity of vegetation (gc·m−2) and G P P is the primary productivity of vegetation (gc·m−2).

2.3.2. Trend Analysis

In order to analyze the changing trend of C U E long time series, the trend analysis method is used for research. This method predicts the changing trend of C U E by performing linear regression analysis on time series data [6]. The calculation formula is as follows:
S l o p e = n i = 1 n i · E i i = 1 n i i = 1 n E i n i = 1 n i 2 i = 1 n i 2
wherein S l o p e is the changing trend rate of variable E i ; n is the time step; i is the time variable; and E i is the average value of the i -th time point. The positive or negative value of S l o p e indicates that variable E increases or decreases over time, and its absolute value reflects the rate of change.

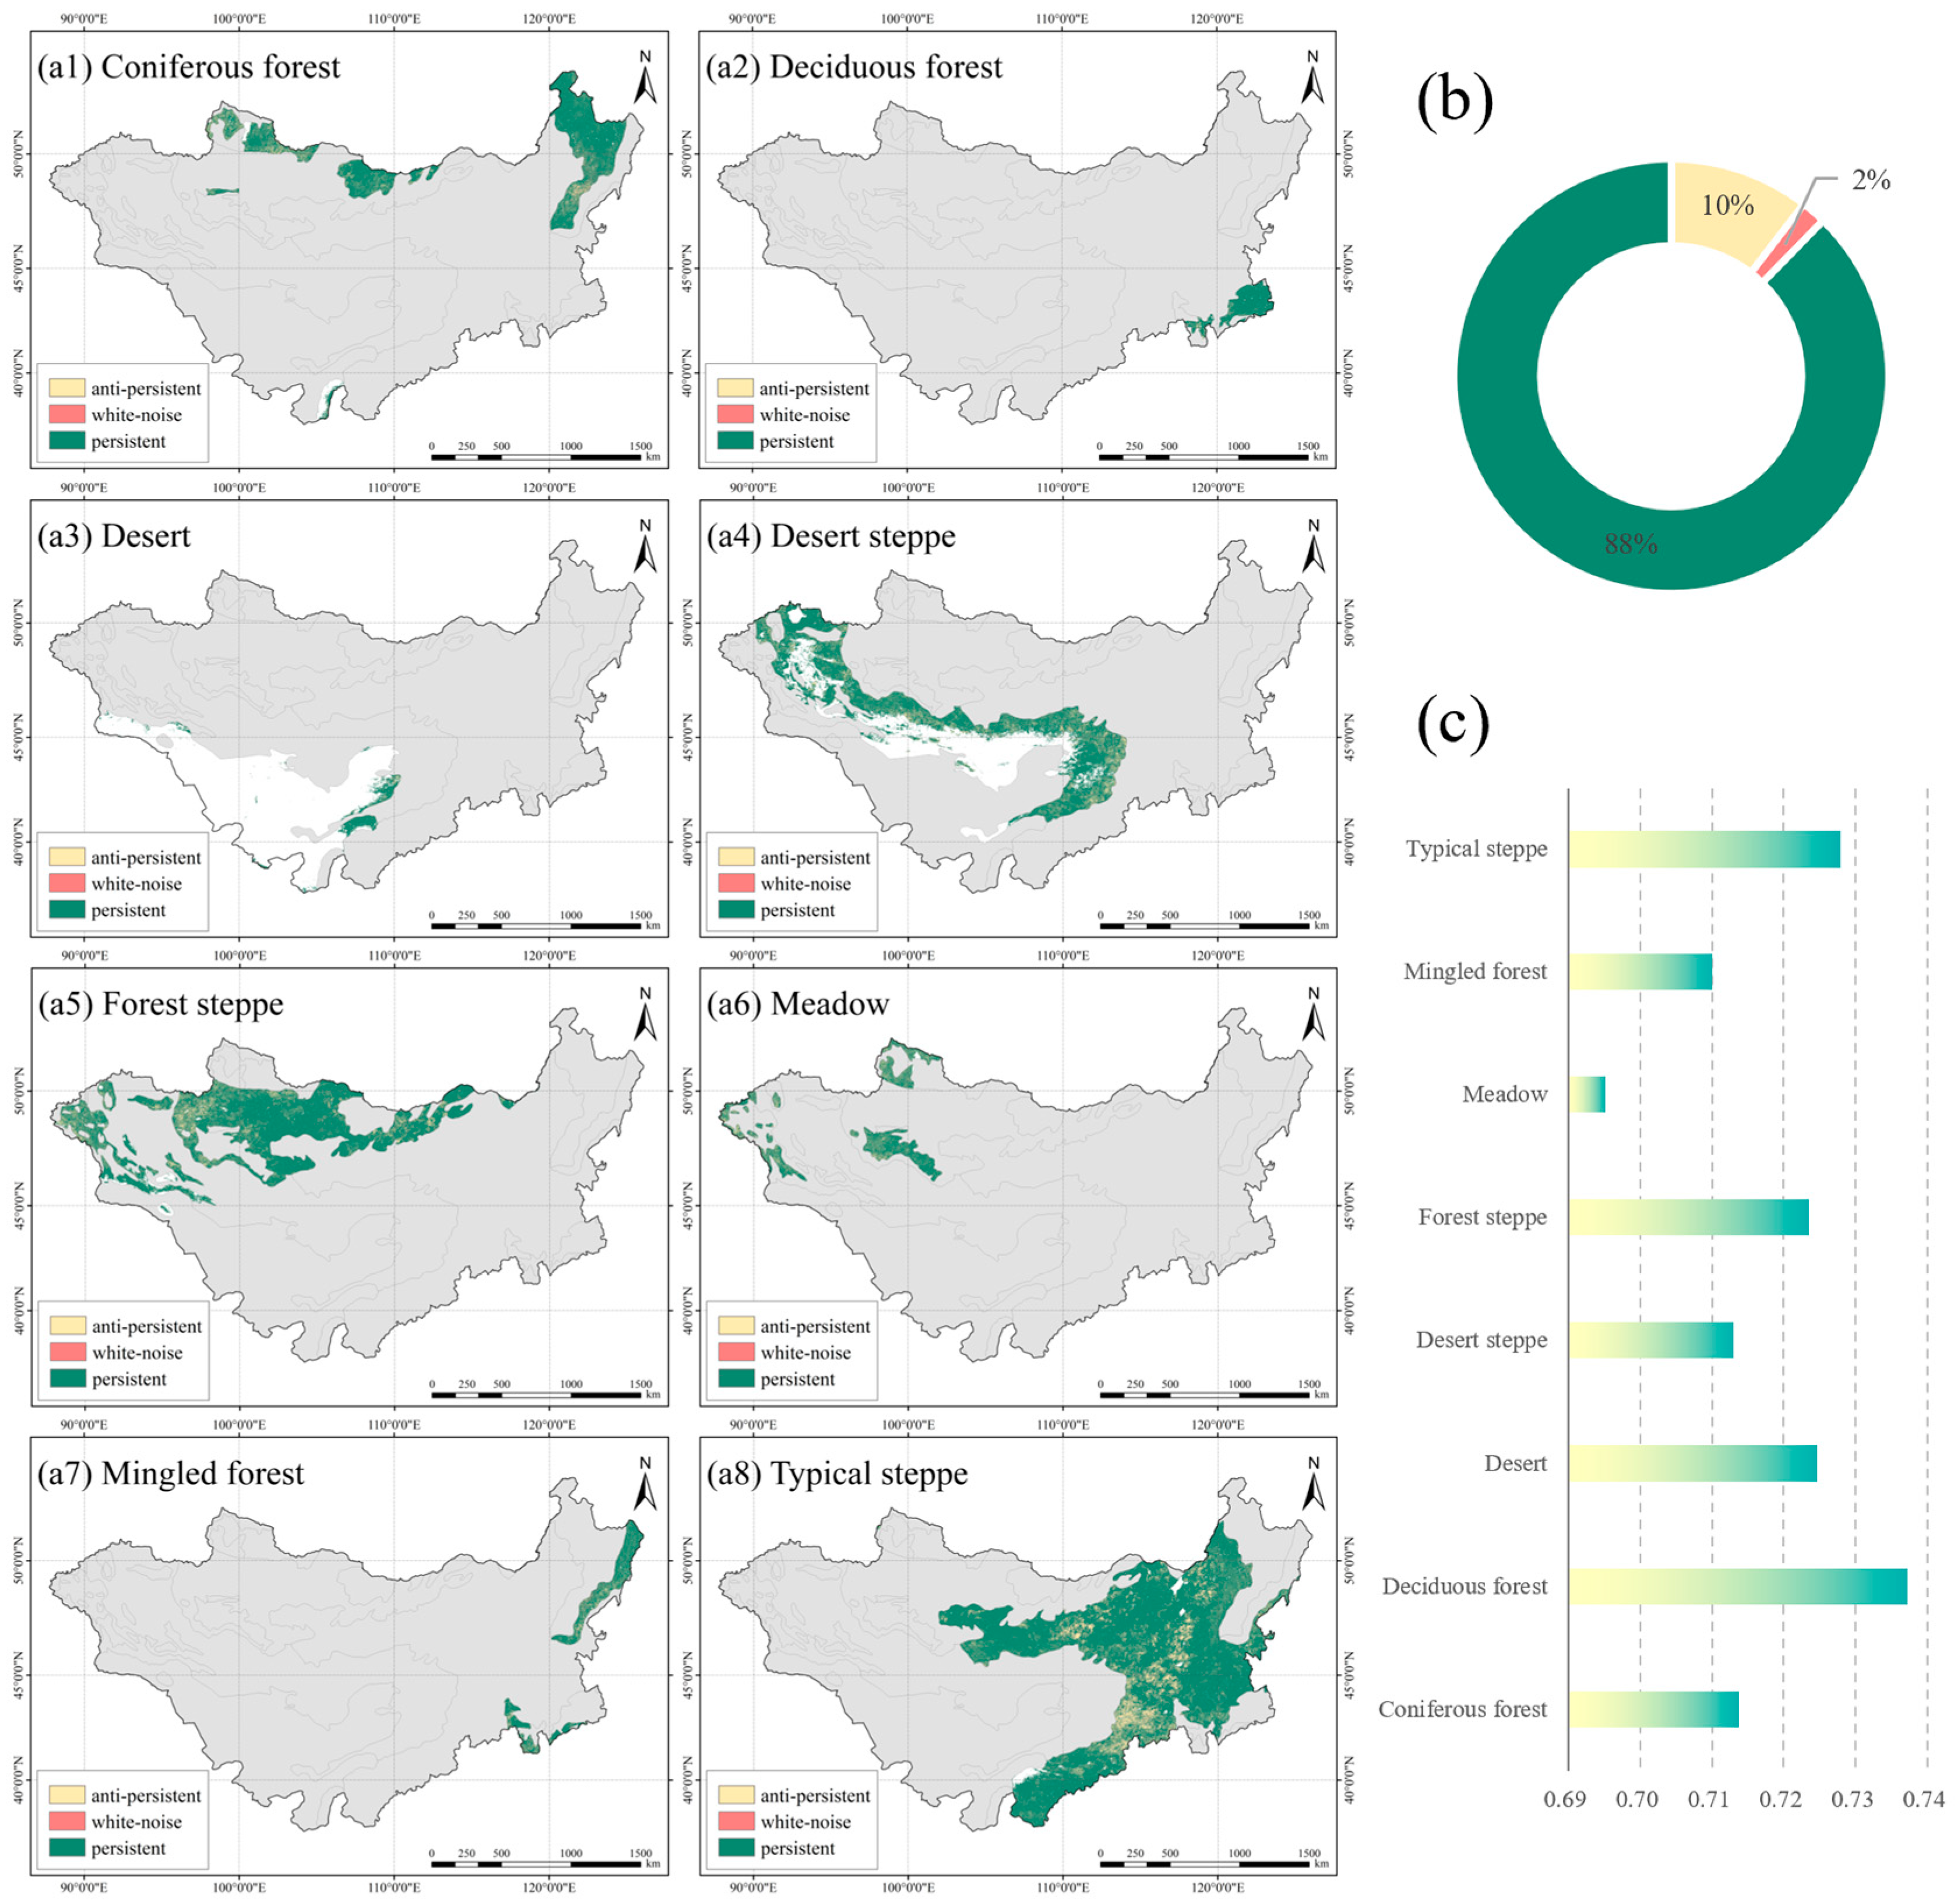
2.3.3. Hurst Exponent

The Hurst exponent ( H ) is used to evaluate the self-similarity and persistence of time series [37], and its value range is 0 to 1. H < 0.5 indicates that the time series has anti-persistence, H = 0.5 indicates no long-term correlation, and H > 0.5 indicates that the time series has persistence. The formula is as follows:
R n = max X t min X t
S n = 1 n t = 1 n ( X t X ¯ ) 2
where X t is the observation at time t , X ¯ is the mean of n observations, R ( n ) is the cumulative deviation within n time steps, and S ( n ) is the standard deviation of n observations. The formula for calculating the Hurst index is as follows:
H = log R n / S ( n ) l o g ( n )

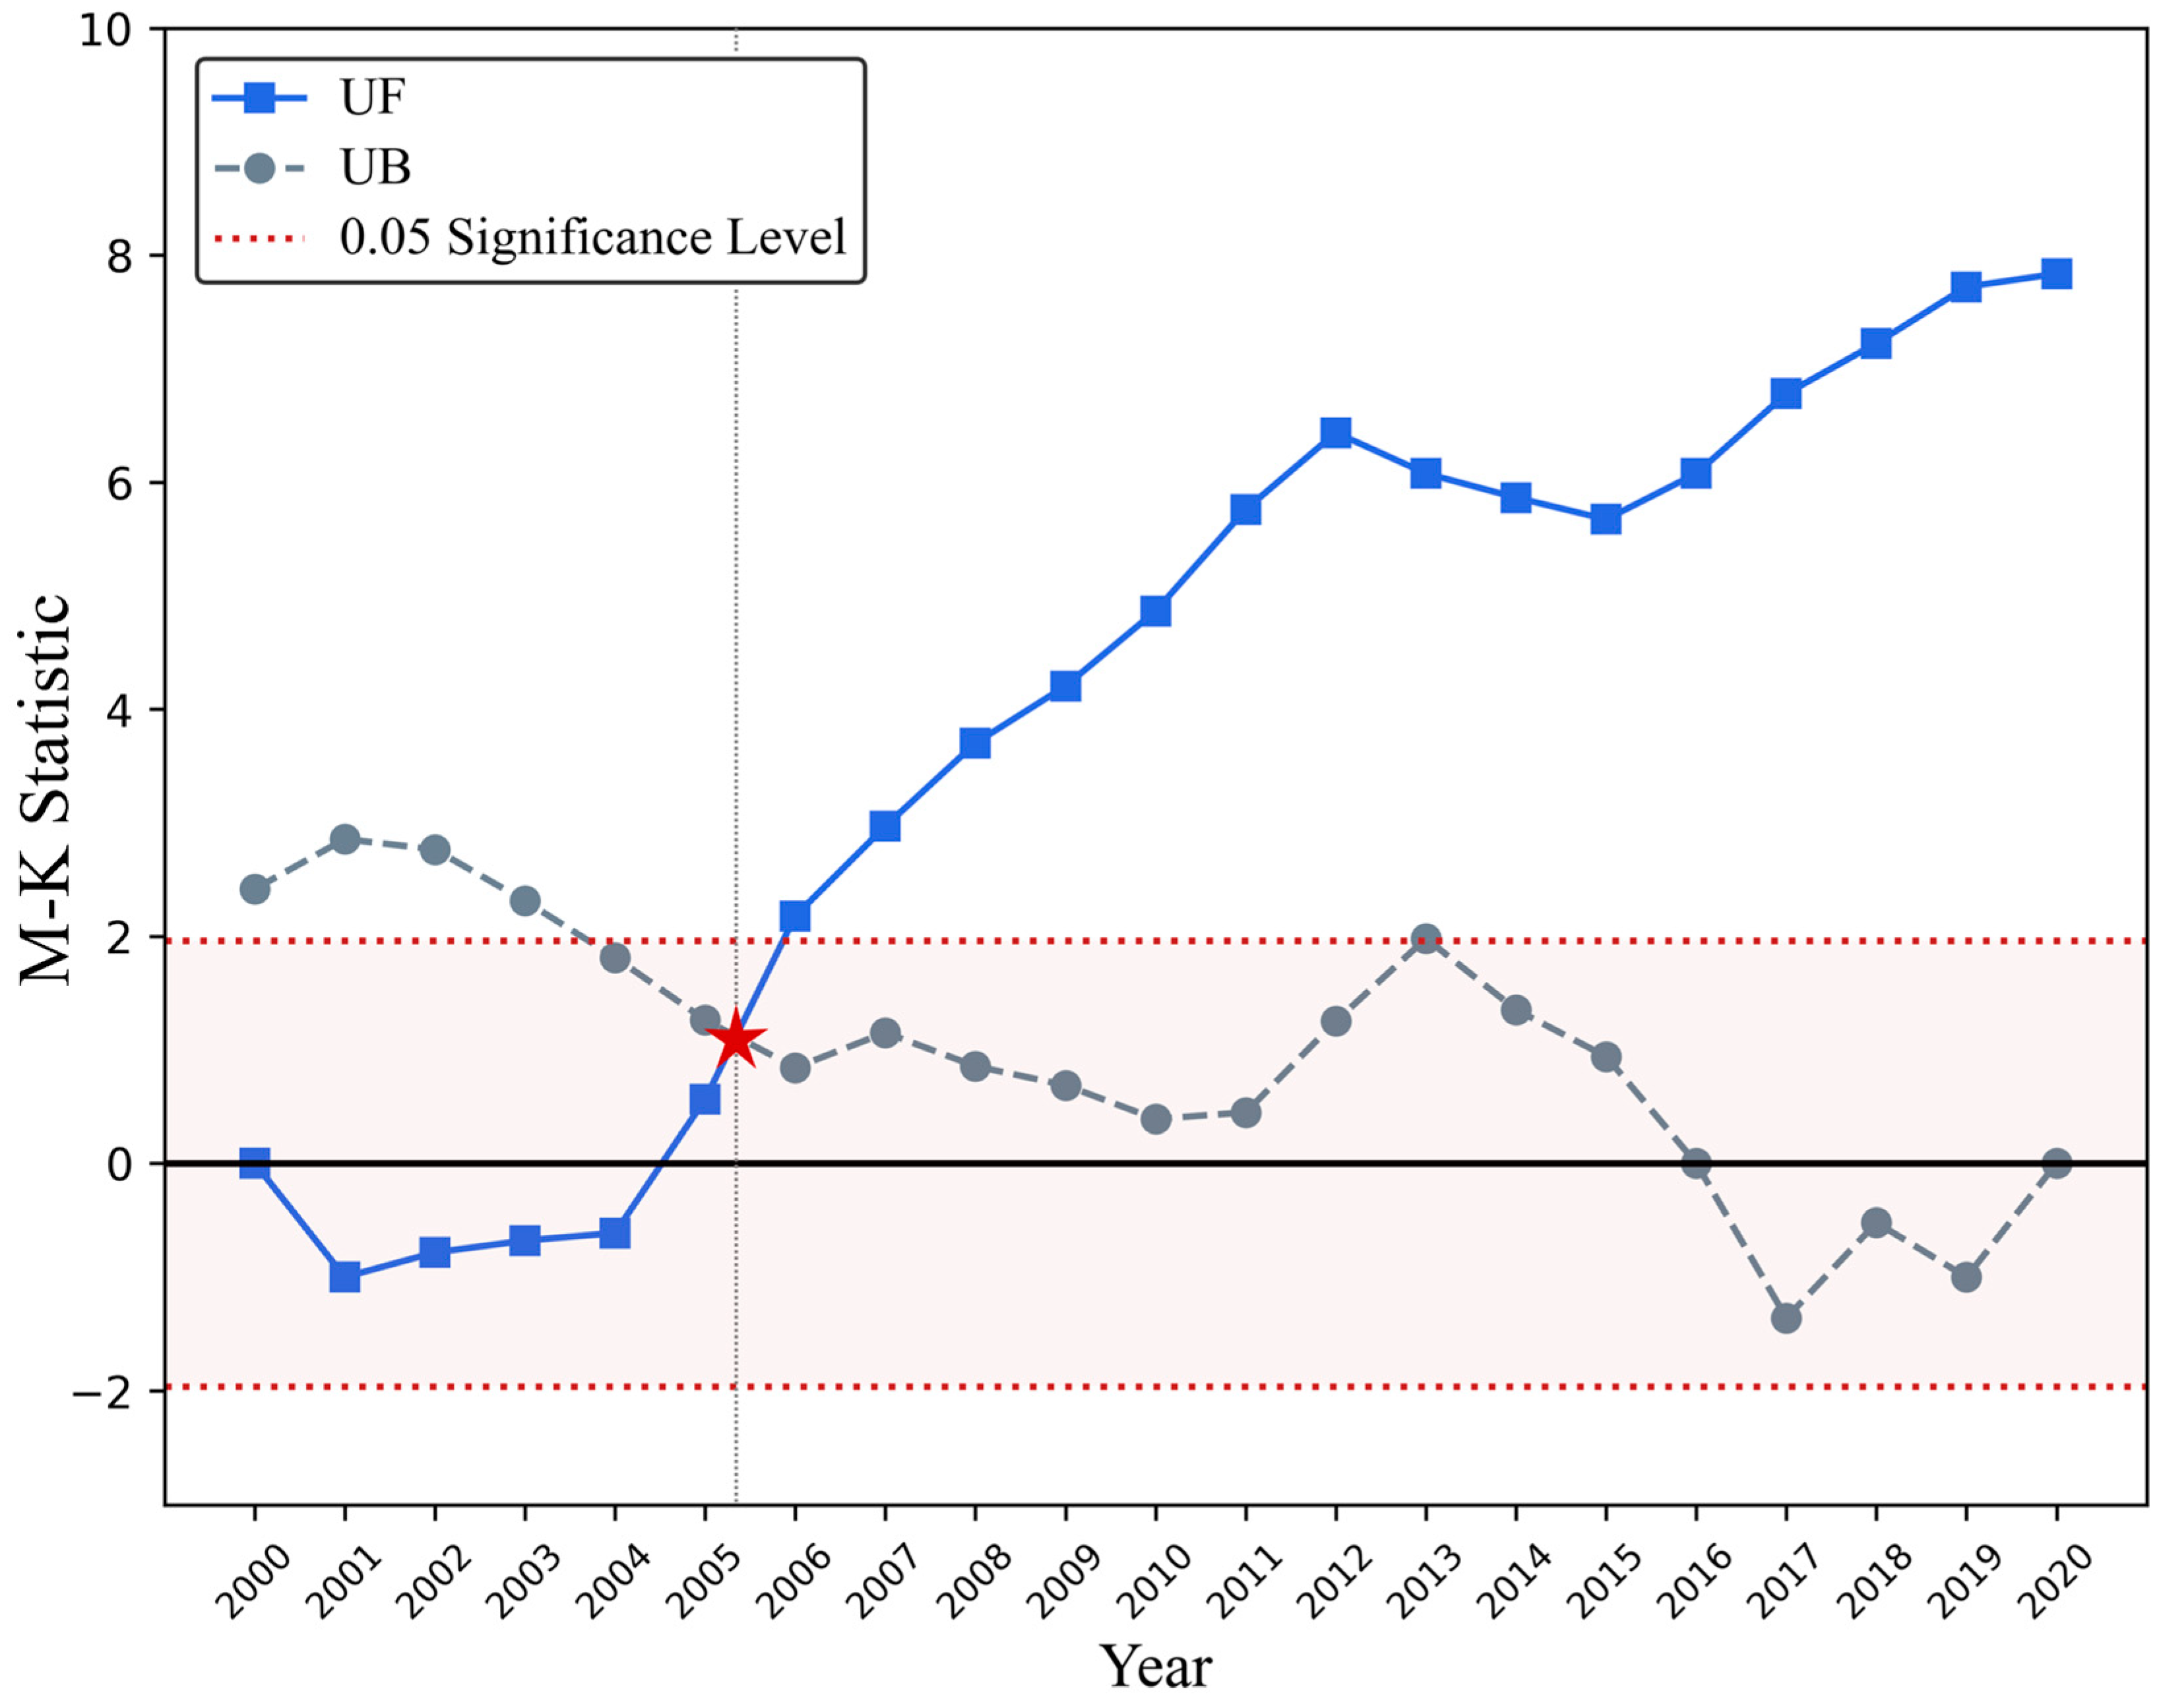
2.3.4. Mann–Kendall (M-K) Mutation Test

The M-K test is a nonparametric statistical method used to detect trends in time series [38]. This method does not rely on data distribution assumptions and is applicable to a variety of data types. The M-K test can effectively identify trend changes in time series by detecting mutation points in statistics and is widely used in time series analysis in fields such as climate, hydrology, and ecology [39].
In this study, the M-K test was selected due to its robustness in detecting monotonic trends in time series data without requiring assumptions of normality or homoscedasticity. While advanced methods such as the Bayesian Estimator of Abrupt Change, Seasonality, and Trend (BEAST) exist, they require more computational resources and prior assumptions about data structure. Given our dataset characteristics and research focus, the M-K test provides a simple yet effective method for trend analysis in CUE time series.

2.3.5. GeoDetector

GeoDetector is a statistical method based on spatial heterogeneity theory, which is used to analyze the spatial heterogeneity of geographical phenomena and their driving mechanisms. Its core indicator q value is used to measure the explanatory power of influencing factors [40]. GeoDetector can detect the interaction between variables, so it has been widely used in many fields such as ecology and medicine [41].
q = 1 h = 1 L N h σ h 2 N σ 2 = 1 S S W S S T
Among them, S S W and S S T are the sum of the internal variance of each layer and the total variance of the entire study area. h is a stratified variable, N h and N are the number of units in layer h and the whole area, respectively; and σ h 2 and σ 2 are the variances of layer h and the whole area, respectively. The larger the q value, the more significant the spatial heterogeneity of the dependent variable.
However, the traditional GeoDetector method requires the independent variables to be converted into categorical variables in advance, which will cause a certain degree of subjective influence on the research. Therefore, this study selected the DEM, surface slope, temperature, precipitation, evapotranspiration, and FVC as potential influencing factors of CUE in the Mongolian Plateau (Table 1) [42], and adopted the optimal parameter-based geographical detector model (OPGD) based on the “GD package” of R language (4.4.2), avoiding the prior classification limitations of traditional methods [43].

2.3.6. Machine Learning

In this study, multiple machine learning algorithms were used to construct a multivariate regression model of CUE to capture the complex relationships in the data and select the optimal model [44]. The dataset was partitioned temporally: data from 2000, 2005, 2010, and 2015 were used for model training, while 2020 data served as the independent validation set. To optimize hyperparameters and mitigate overfitting, a 10-fold cross-validation was conducted exclusively within the training subset. The final model was evaluated on the temporally independent validation set (2020) to assess generalizability. Model performance was quantified using RMSE and R2, with additional metrics (e.g., MAE) computed to ensure robustness.
Additionally, given the relatively coarse spatial resolution (100 km) of CMIP6 climate data, a machine learning-based downscaling approach was applied to refine the spatial resolution of key climate variables (temperature, precipitation, and evapotranspiration). By leveraging high-resolution observational climate datasets, this approach enhances the applicability of CMIP6 projections for regional-scale CUE modeling. Specifically, the model was trained using historical climate observations and CMIP6 outputs, allowing it to capture fine-scale climate variations and enhance the spatial resolution of climate projections over the Mongolian Plateau. Compared to traditional interpolation techniques, the machine learning-based downscaling approach provides improved accuracy in capturing spatial heterogeneity and complex climate dynamics.
(1)
Random forest regression
Random forest is an ensemble learning method based on decision trees [45]. It improves the accuracy and robustness of the model by building multiple decision trees and combining their prediction results. Its core steps include randomly extracting subsamples from the training dataset to build decision trees and randomly selecting some features when splitting nodes. For regression tasks, the final prediction result is the average of all trees. Random forest was chosen due to its ability to handle nonlinear interactions among variables, such as evapotranspiration–temperature synergy, and its robustness to overfitting.
(2)
Lasso regression (L1 regularization)
Lasso regression is a linear regression method that limits the model complexity through L1 regularization [46]. Its goal is to minimize the loss function to estimate the regression coefficients, and some coefficients can be compressed to zero to achieve feature selection. Rationale: Lasso regression was included to evaluate the effect of regularization on model performance and to determine whether feature selection could improve CUE prediction.
(3)
Elastic net regression
Elastic net regression combines the advantages of Lasso (L1) and ridge regression (L2) [47]. It is suitable for situations where the number of features is greater than the number of samples and can effectively handle multicollinearity problems. This method reduces the complexity of the model while maintaining high prediction accuracy, which is suitable for CUE modeling. Elastic net regression was selected to assess its ability to balance feature selection and multicollinearity handling, improving generalizability.
(4)
Support vector regression (SVR)
Support vector regression (SVR) is based on support vector machines (SVMs) and is suitable for dealing with nonlinear relationships [48]. Its goal is to capture complex nonlinear relationships by performing feature selection in high-dimensional space through kernel functions. Although SVR is well suited for complex nonlinear patterns, it demonstrated higher computational costs and slower performance in our dataset, making it less efficient for large-scale CUE modeling.

3. Results

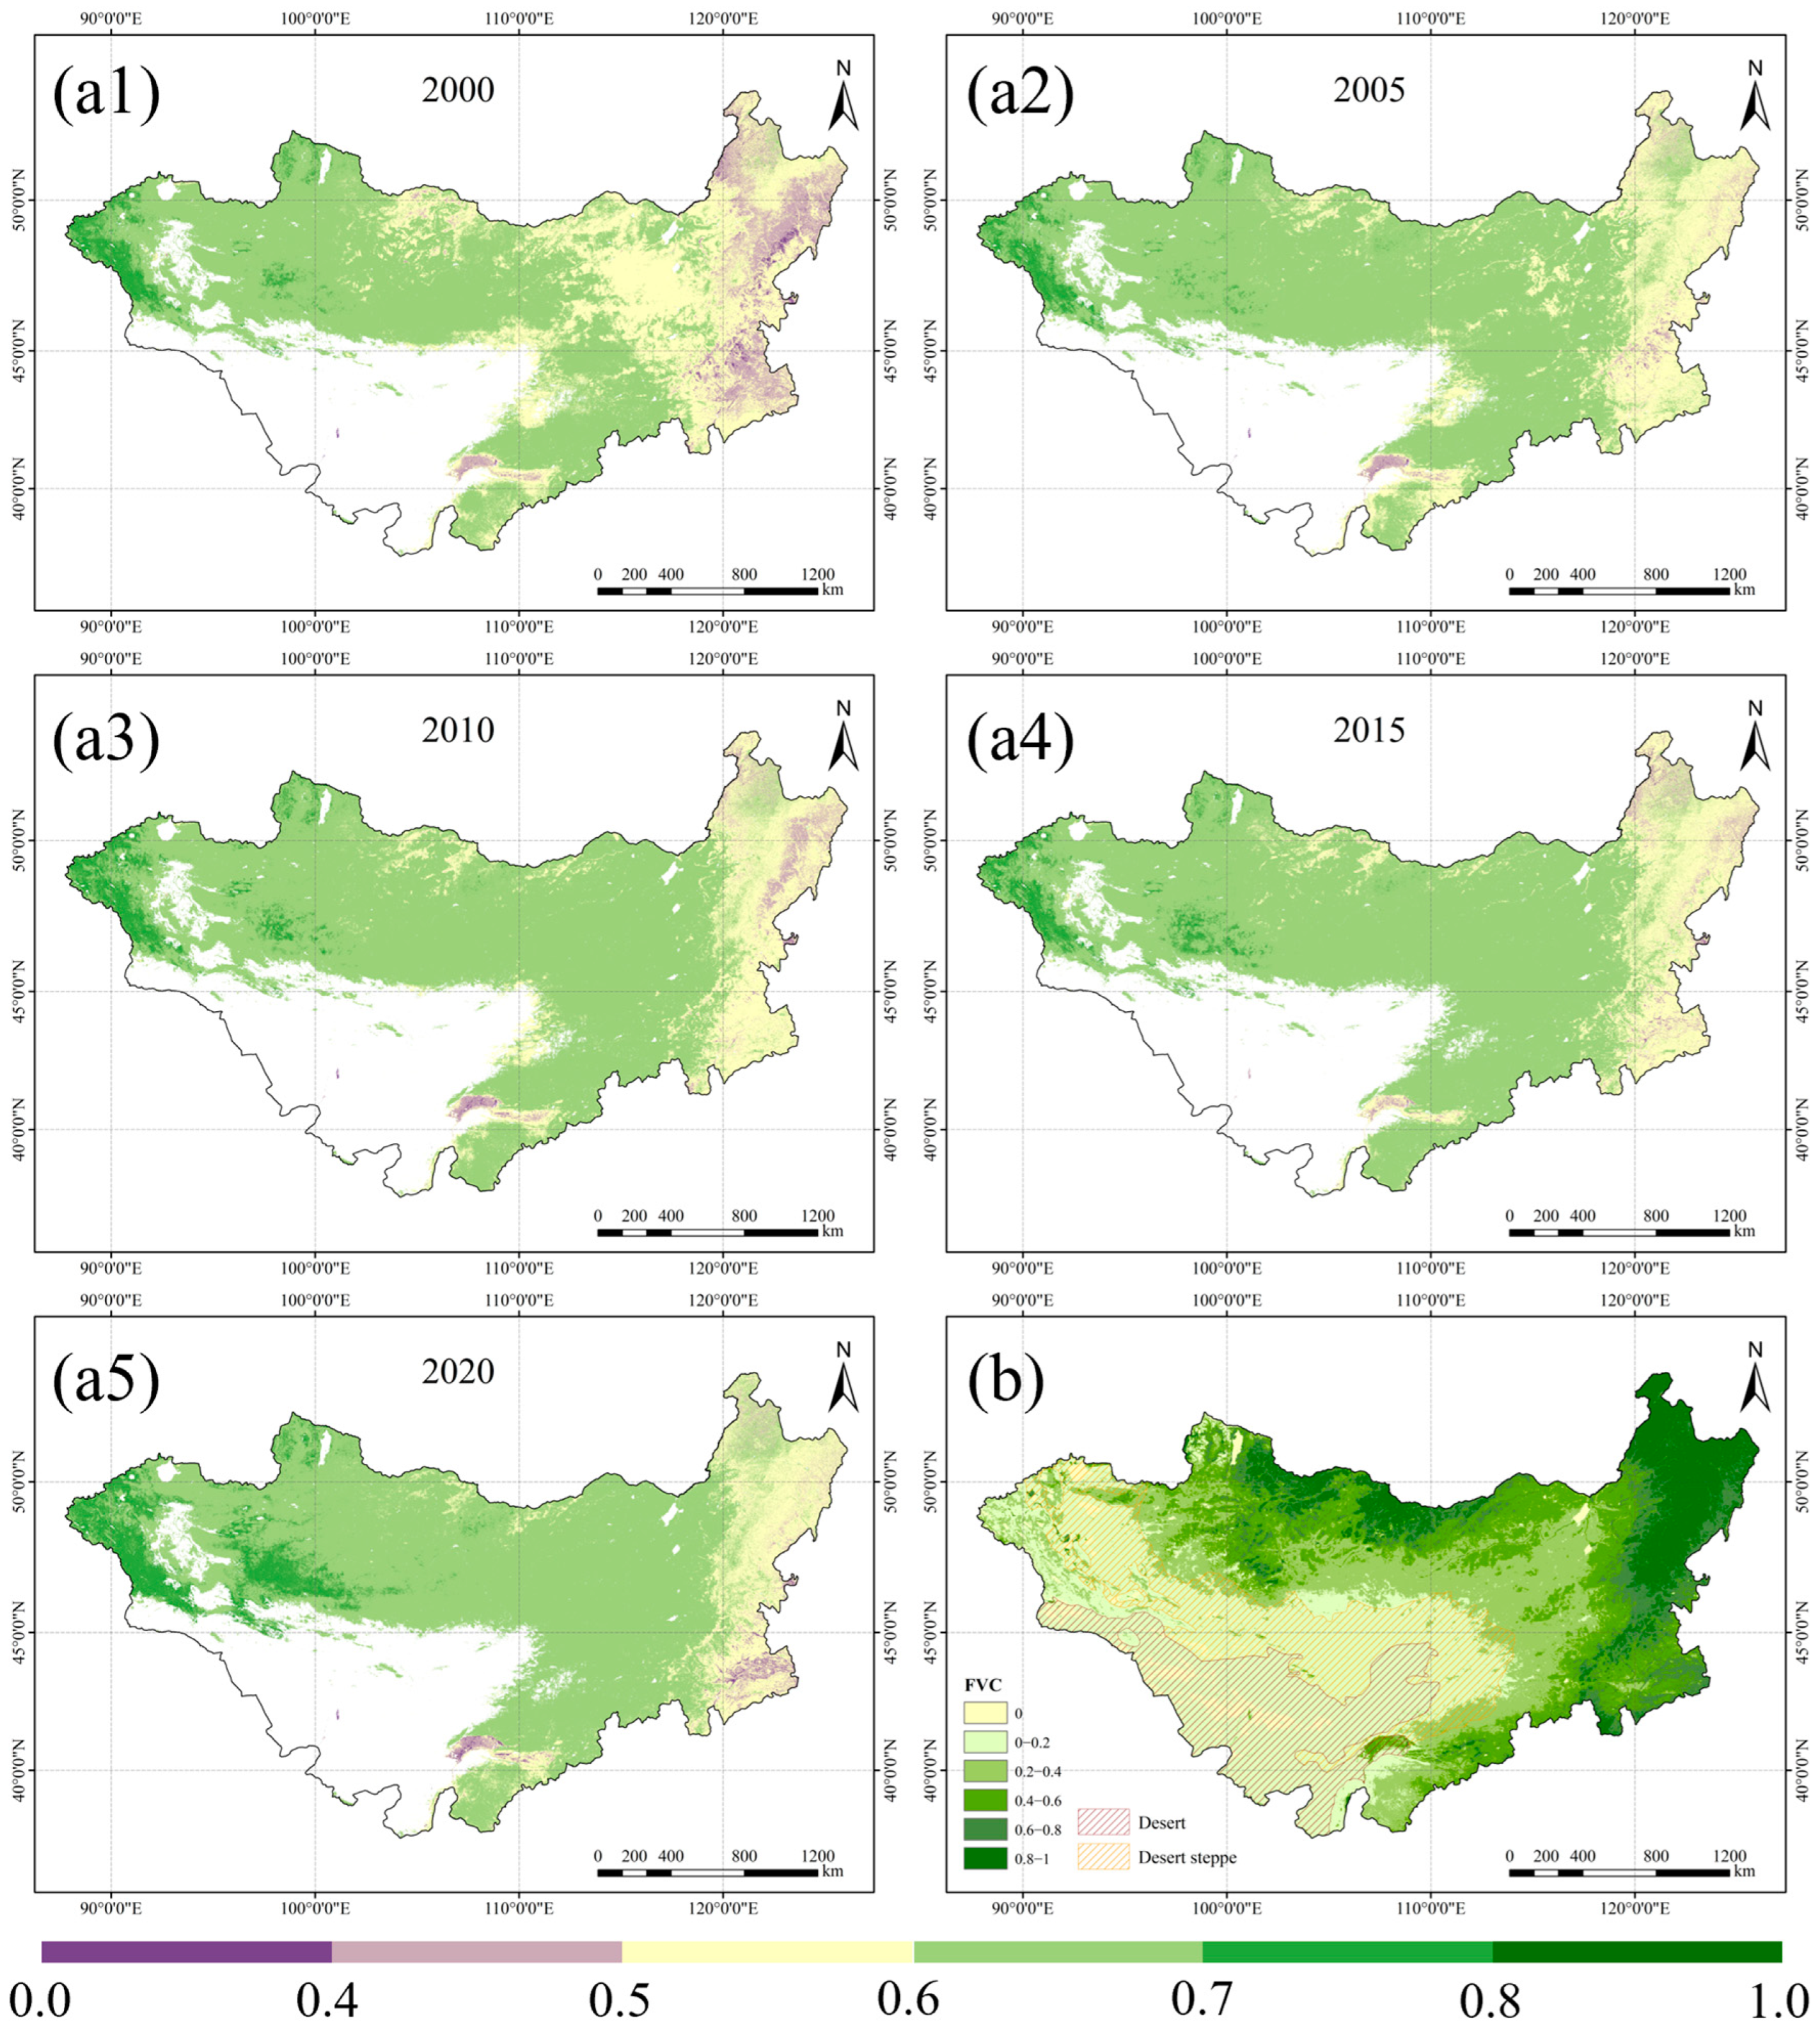
3.1. Spatiotemporal Distribution Characteristics of CUE

Based on the CUE calculation results from 2000 to 2020, this study drew a spatial distribution map of CUE on the Mongolian Plateau (Figure 2). The results show that CUE shows significant spatial differentiation characteristics, and the overall distribution pattern is a gradient distribution pattern that decreases from west to east. Specifically, the CUE value in the northwestern edge zone reaches the highest level (generally ≥0.7), which is mainly attributed to the strong carbon fixation capacity of vegetation under the cold and humid climate conditions of high latitudes; the CUE value in the central region, except for the north and south edge zones, is mainly distributed in the range of 0.6–0.7, and the spatial distribution is relatively uniform; the CUE value in the northeast region is generally low (<0.6), which may be caused by the reduction of regional precipitation and the increased interference of human activities; the southwestern region is not included in the scope of this analysis due to the large-scale desert distribution and extremely low vegetation coverage. From the perspective of temporal dynamic changes, the CUE of the Mongolian Plateau showed an overall upward trend from 2000 to 2020. Specifically, the area of high CUE value areas in the west continues to expand, indicating the improvement of the productivity of alpine meadow ecosystems under the background of climate warming; the area of low CUE value areas in the east is shrinking, and at the same time, the area with CUE values of 0.6–0.7 in the central part extends to the east, forming an obvious spatial diffusion zone. This phenomenon reflects, to a certain extent, the gradual impact of climate change on the ecological transition zone.
Table 2 shows the statistical indicators of CUE over the years during the study period, including the Minimum, Maximum, Mean, Median, Standard deviation (std), and IQR. The analysis shows that the mean of CUE increased from 0.6055 in 2000 to 0.6433 in 2020, and the median increased from 0.6134 to 0.6570, indicating that the overall carbon utilization efficiency of vegetation on the Mongolian Plateau showed a significant upward trend. The minimum value of CUE fluctuated from 0.0246 in 2000 to 0.0240 in 2020, and the maximum value stabilized at around 0.80, indicating that the low-value area improved significantly, while the high-value area remained stable. The standard deviation decreased from 0.0649 in 2000 to 0.0554 in 2020, and the IQR narrowed from 0.0728 to 0.0558, indicating that the spatial distribution of CUE tended to be concentrated and the regional differences gradually decreased, further confirming that the overall level of CUE has improved and the distribution has become more balanced.
The CUE distribution characteristics of different ecological zones on the Mongolian Plateau further verified the spatial differentiation law. The CUE of the forest steppe in the northwest is the highest, while the CUE values of coniferous forest and typical steppe in the east are relatively low. It is worth noting that the area with high CUE values (0.6–0.7) in the central part of the typical steppe has the most significant trend of spreading to the east, while the CUE values of different ecological types (such as meadow, mingled forest, etc.) in the central transition zone are relatively small.
In this study, the M-K test method was used to analyze the temporal trend and mutation characteristics of CUE in the Mongolian Plateau from 2000 to 2020 (Figure 3). The results showed that the UF statistic increased significantly over time, indicating that CUE showed an overall growth trend during the study period, and the growth rate accelerated after 2005. The UB statistic fluctuated greatly in the early stage, and the overall trend was opposite to the UF curve. Around 2005, the UF and UB curves crossed within the 0.05 significance level, indicating that CUE had a significant mutation at this time point. Before the mutation (2000–2005), CUE was generally low and had no significant changes; after the mutation (2005–2020), CUE showed a continuous upward trend, indicating that CUE in the Mongolian Plateau entered a significant growth stage after 2005. Before the mutation, the UF value fluctuated slightly and CUE did not change significantly, indicating that CUE was less affected by changes in the external environment during this stage. From 2005 to 2015, the UF value rose rapidly, indicating that CUE increased significantly during this period, which may be affected by factors such as climate change and vegetation recovery. From 2015 to 2020, the growth trend of the UF curve stabilized, indicating that the growth rate of CUE slowed down, but still maintained at a high level.
Figure 4(a1–a8) shows that the trend of CUE in the Mongolian Plateau from 2000 to 2020 showed significant spatial differentiation. As shown in Figure 4b, a significant downward trend (<−0.01) accounted for 1%, a moderate downward trend (−0.01~−0.005) accounted for 1%, a mild downward trend (−0.005~−0.001) accounted for 4%, a stable trend (−0.001~0.001) accounted for 26%, a mild upward trend (0.001 ~ 0.005) accounted for 19%, a moderate upward trend (0.005~0.01) accounted for 20%, and a significant upward trend (>0.01) accounted for 29%. Overall, the upward trend area (mild, moderate, and significant increase) accounted for 68%, indicating that the CUE in most areas of the Mongolian Plateau showed an increasing trend; the downward trend area (mild, moderate, and significant decrease) accounted for 6%, mainly concentrated in ecologically fragile areas; the stable trend area accounted for 26%, indicating that the CUE in some areas changed little. According to the median trend of CUE in different ecological zones, as seen in Figure 4c, the median trend of typical steppe is 0.0106, which is the ecological zone with the most significant upward trend, indicating that the CUE in this area has improved most significantly. The median trend of coniferous forest and mingled forest is 0.0064 and 0.0065, respectively, showing a strong upward trend, which may be related to the strong carbon fixation capacity of forest ecosystems. The median trend of forest steppe and meadow is 0.0046 and 0.0021, respectively, showing a slight upward trend. The median trend of deciduous forest is 0.0000, indicating that the CUE in this area remains basically stable. The median trend of desert steppe and desert is −0.0007 and −0.0005, respectively, showing a slight downward trend, indicating that the CUE in these areas has decreased, which may be related to climate aridification and ecological degradation. From the perspective of spatial distribution characteristics, the rising trend areas are mainly concentrated in ecological divisions such as typical steppes, coniferous forests, and mingled forests. The CUE in these areas has increased significantly, which may be related to the positive impact of vegetation restoration, climate change, or human activities. The declining trend areas are mainly concentrated in ecologically fragile areas such as desert steppes and deserts, indicating that the CUE in these areas is negatively affected by climate aridification and ecological degradation. The stable trend areas are mainly concentrated in ecological divisions such as deciduous forests, indicating that the CUE in these areas has changed little and the ecosystem is relatively stable.
The Hurst exponent distribution of CUE in the Mongolian Plateau (Figure 5(a1–a8),b) shows that persistence accounts for 88%, indicating that the CUE change trend in most areas is persistent, that is, the current change trend may continue in the future; anti-persistence accounts for 10%, indicating that the CUE change trend in a few areas is anti-persistent, that is, the current change trend may be reversed in the future; and white noise accounts for 2%, indicating that the CUE change trend in very few areas has no significant regularity and manifests as random fluctuations. According to the median Hurst exponent of different ecological zones (Figure 5c), the median Hurst exponent of deciduous forest is 0.7322, which is the most persistent ecological zone, indicating that the CUE change trend in this area may continue in the future; the median Hurst exponent of typical steppe is 0.7229, showing strong persistence, indicating that the upward trend of CUE in this area may continue; the median Hurst exponent of forest steppe and desert is 0.7185 and 0.7196, respectively, both showing strong persistence. Forest-steppe ecosystems showed persistent CUE trends (Hurst = 0.7185), supporting our hypothesis, while desert steppes exhibited anti-persistence (0.0007), signaling degradation risks. The median Hurst exponent of coniferous forest, desert steppe, and mingled forest is 0.7088, 0.7080, and 0.7050, respectively, indicating that the CUE change trend in these areas is also strong. The median Hurst exponent of meadow is 0.6902, which is lower than other ecological zones but still shows a certain degree of persistence. From the spatial distribution characteristics of the Hurst exponent, the persistent areas are mainly concentrated in ecological divisions such as deciduous forests, typical steppes, forest-steppes, and deserts. The CUE change trend in these areas may continue in the future, indicating that their ecosystems have strong stability. The anti-persistent areas, accounting for 10%, are mainly concentrated in ecologically fragile areas, indicating that the CUE change trend in these areas may be reversed in the future and need to be paid special attention to; the white noise area accounts for 2%, indicating that the CUE change trend in a very small number of areas has no significant regularity, which may be related to human activities or climate fluctuations.

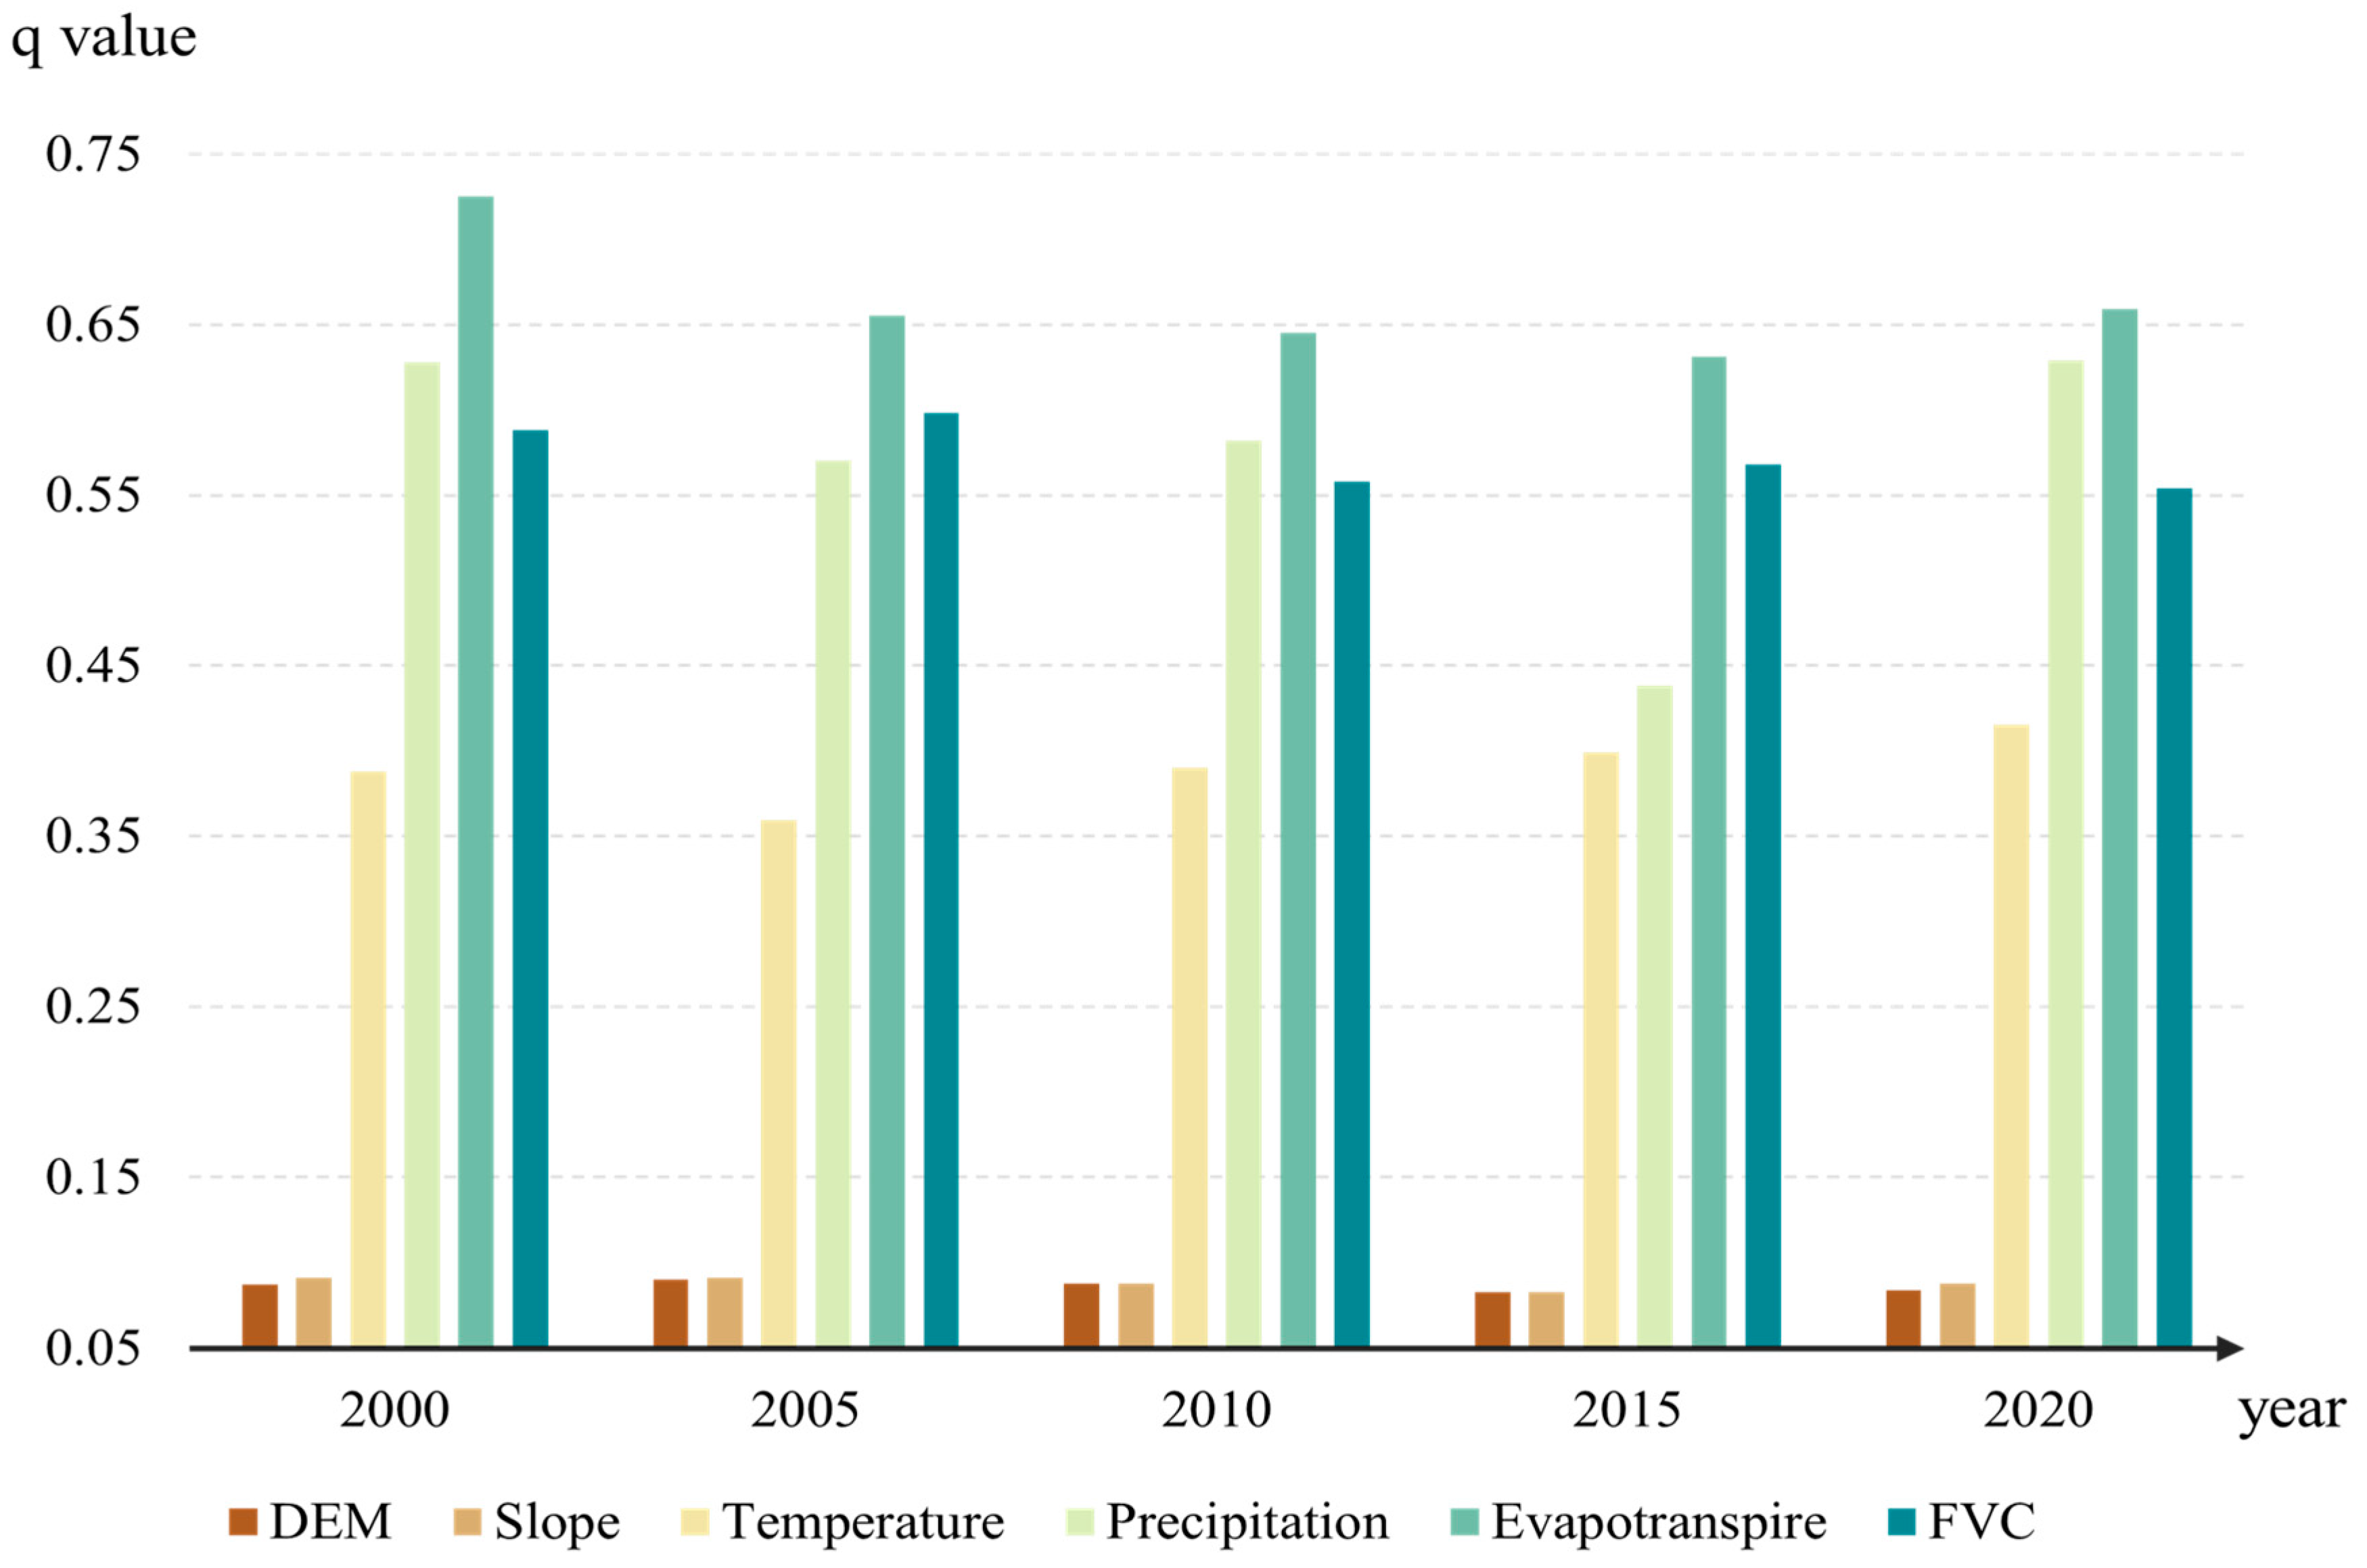
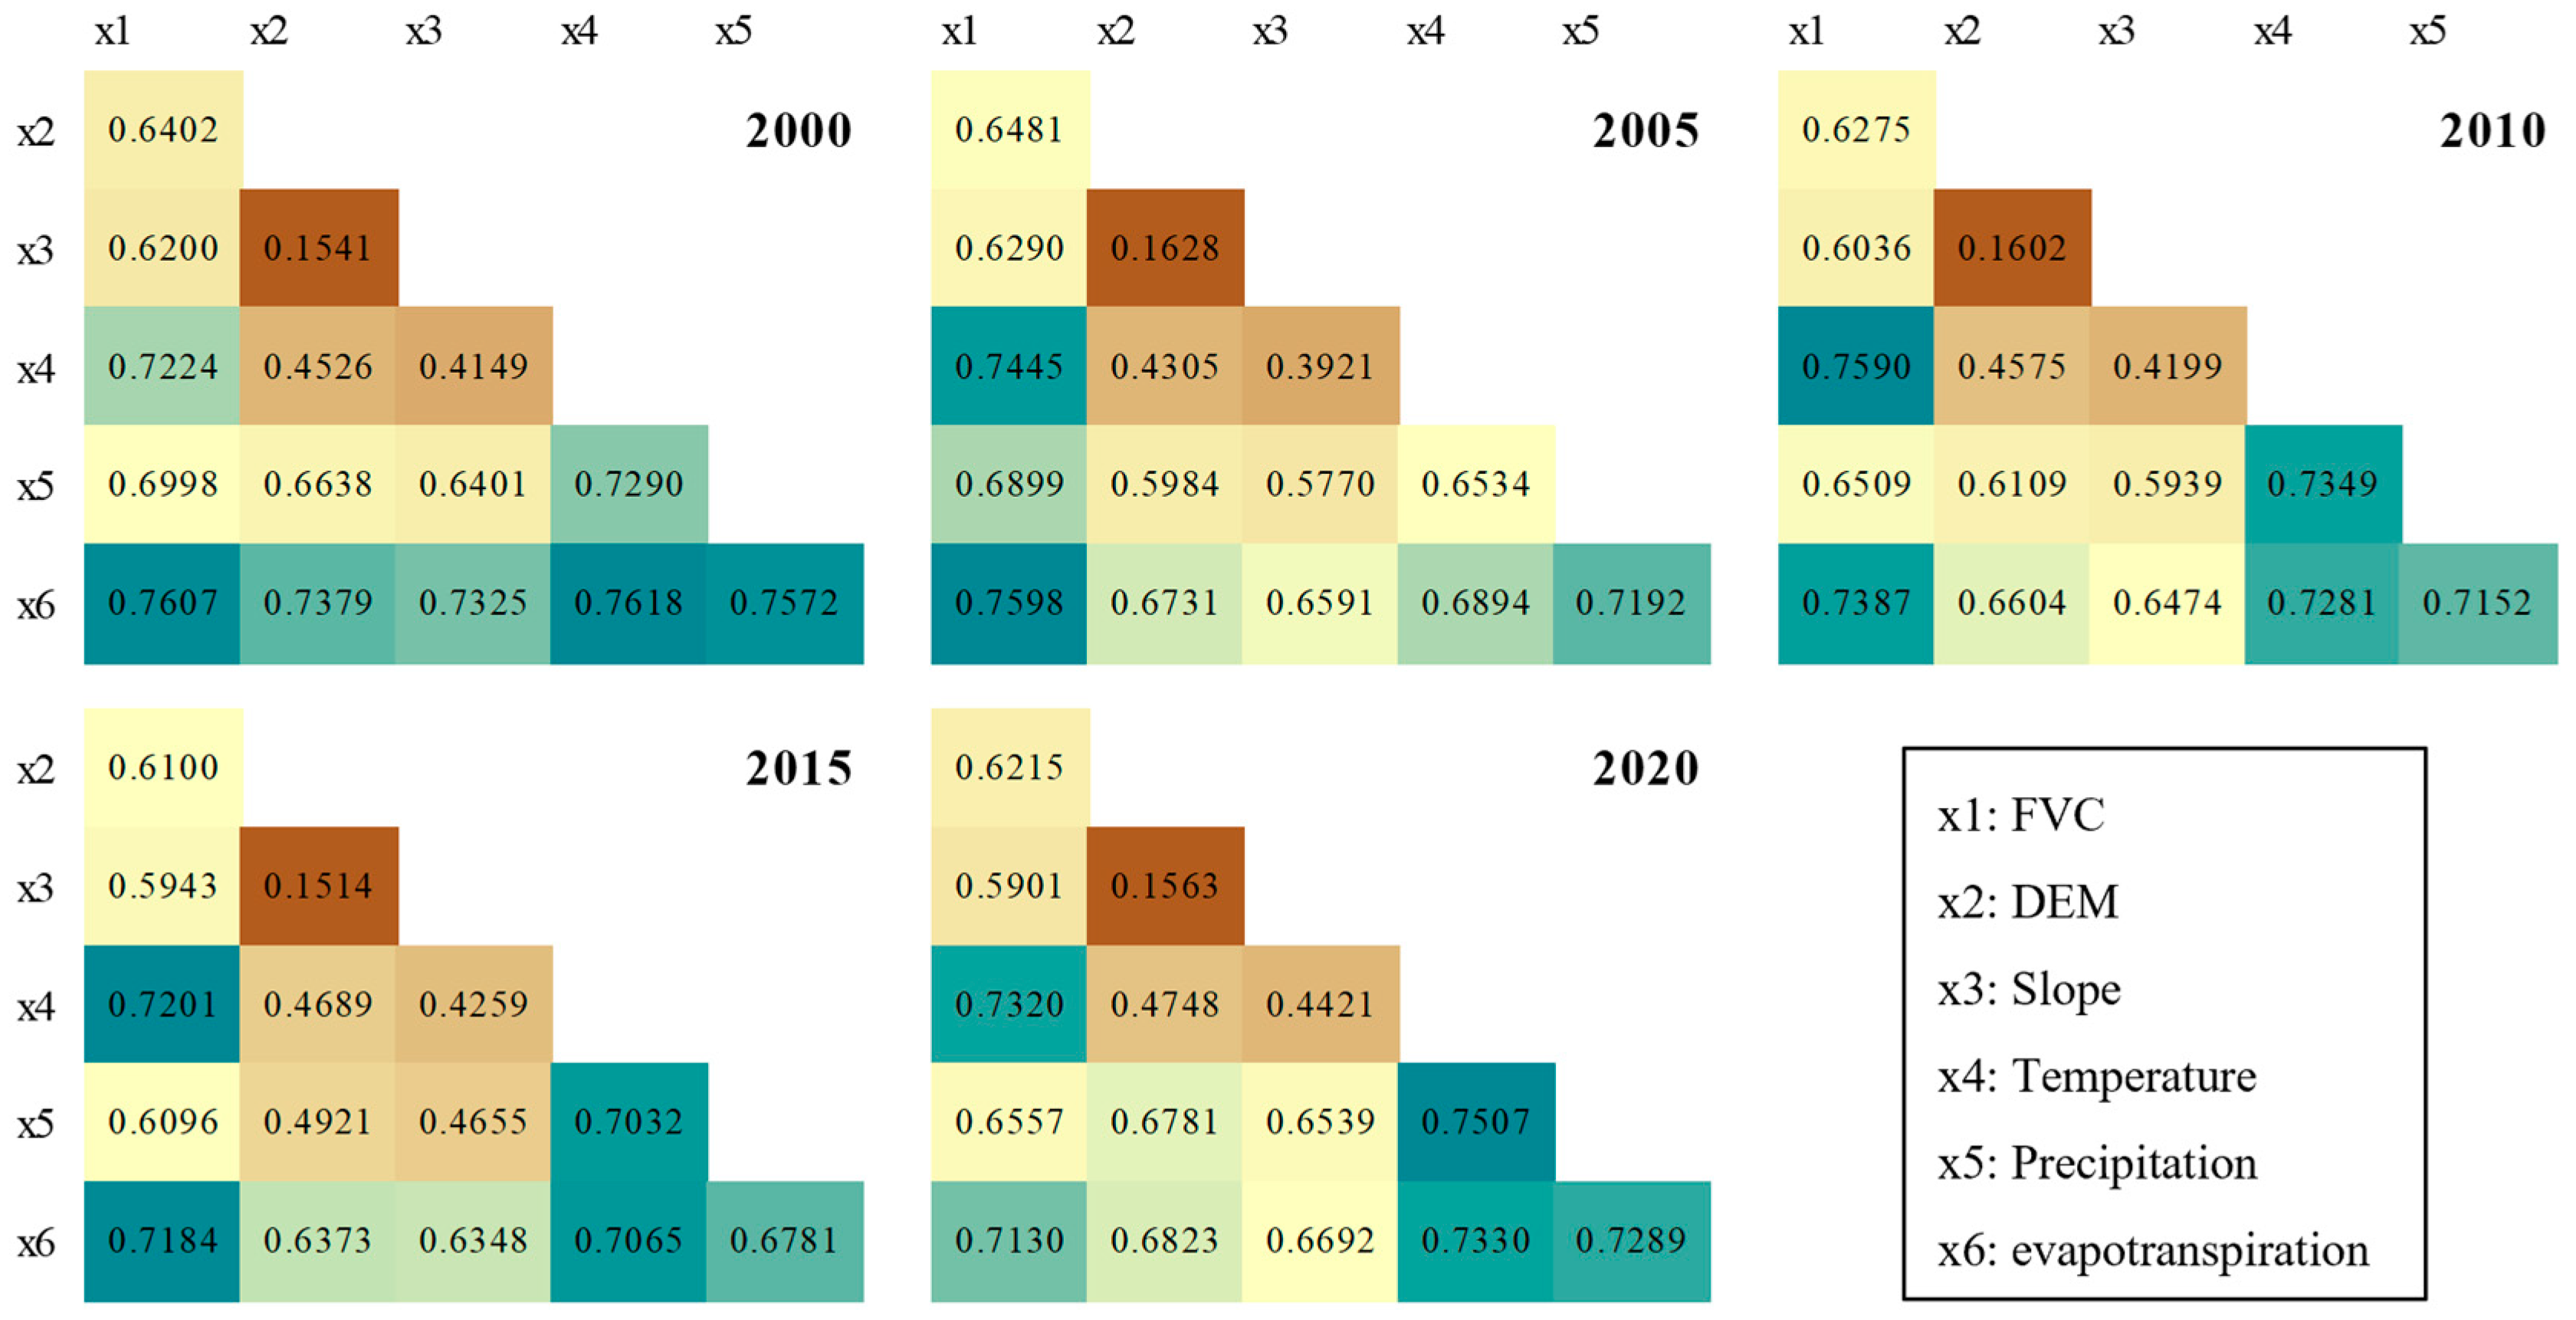
3.2. Analysis of CUE Driving Factors Based on GeoDetector

Figure 6 shows that the q value of evapotranspiration is between 0.631 and 0.725, which is the strongest factor affecting CUE, indicating that evapotranspiration has a decisive effect on the spatial distribution of CUE. The q value of precipitation is between 0.438 and 0.629, which is the second largest factor affecting CUE, especially in humid areas, indicating that precipitation has a significant effect on CUE. The q value of temperature is between 0.359 and 0.415. Although it is slightly lower than evapotranspiration and precipitation, its impact on CUE is still significant, especially in low temperature areas, where the positive effect of temperature on CUE is more prominent. The q value of FVC is between 0.554 and 0.598, indicating that it has a strong impact on CUE. The q values of the DEM and slope are between 0.083 and 0.090 and 0.083 and 0.091, respectively, indicating that the influence of terrain factors on CUE is weak, but still has certain spatial differentiation characteristics.
The results of the interaction detector (Figure 7) show that the interaction between the factors significantly enhances their explanatory power for CUE. The q-value of the evapotranspiration ∩ temperature is between 0.6894 and 0.7618, which is the strongest interaction affecting CUE, indicating that the synergistic effect of evapotranspiration and temperature has the most significant impact on CUE. The q-value of the precipitation ∩ temperature is between 0.6534 and 0.7507, indicating that the synergistic effect of precipitation and temperature is also very important for CUE, especially in the context of climate change. The q-value of evapotranspiration ∩ precipitation is between 0.7152 and 0.7572, further indicating that the synergistic effect of evapotranspiration and precipitation has a significant effect on improving CUE. The q-value of the FVC ∩ temperature is 0.6509, and the q-value of FVC ∩ precipitation is 0.7445, indicating that the synergistic effect of FVC and climate factors has a significant impact on CUE.
Combining the explanatory power of single factors and interaction factors, the main factors affecting CUE are selected, including evapotranspiration, precipitation, and temperature. Among them, the explanatory power of temperature is lower than that of FVC, but its interaction with evapotranspiration and precipitation is significant, while the interaction between FVC and climate factors is slightly weaker, indicating that temperature also plays an important role in the influencing mechanism of CUE.

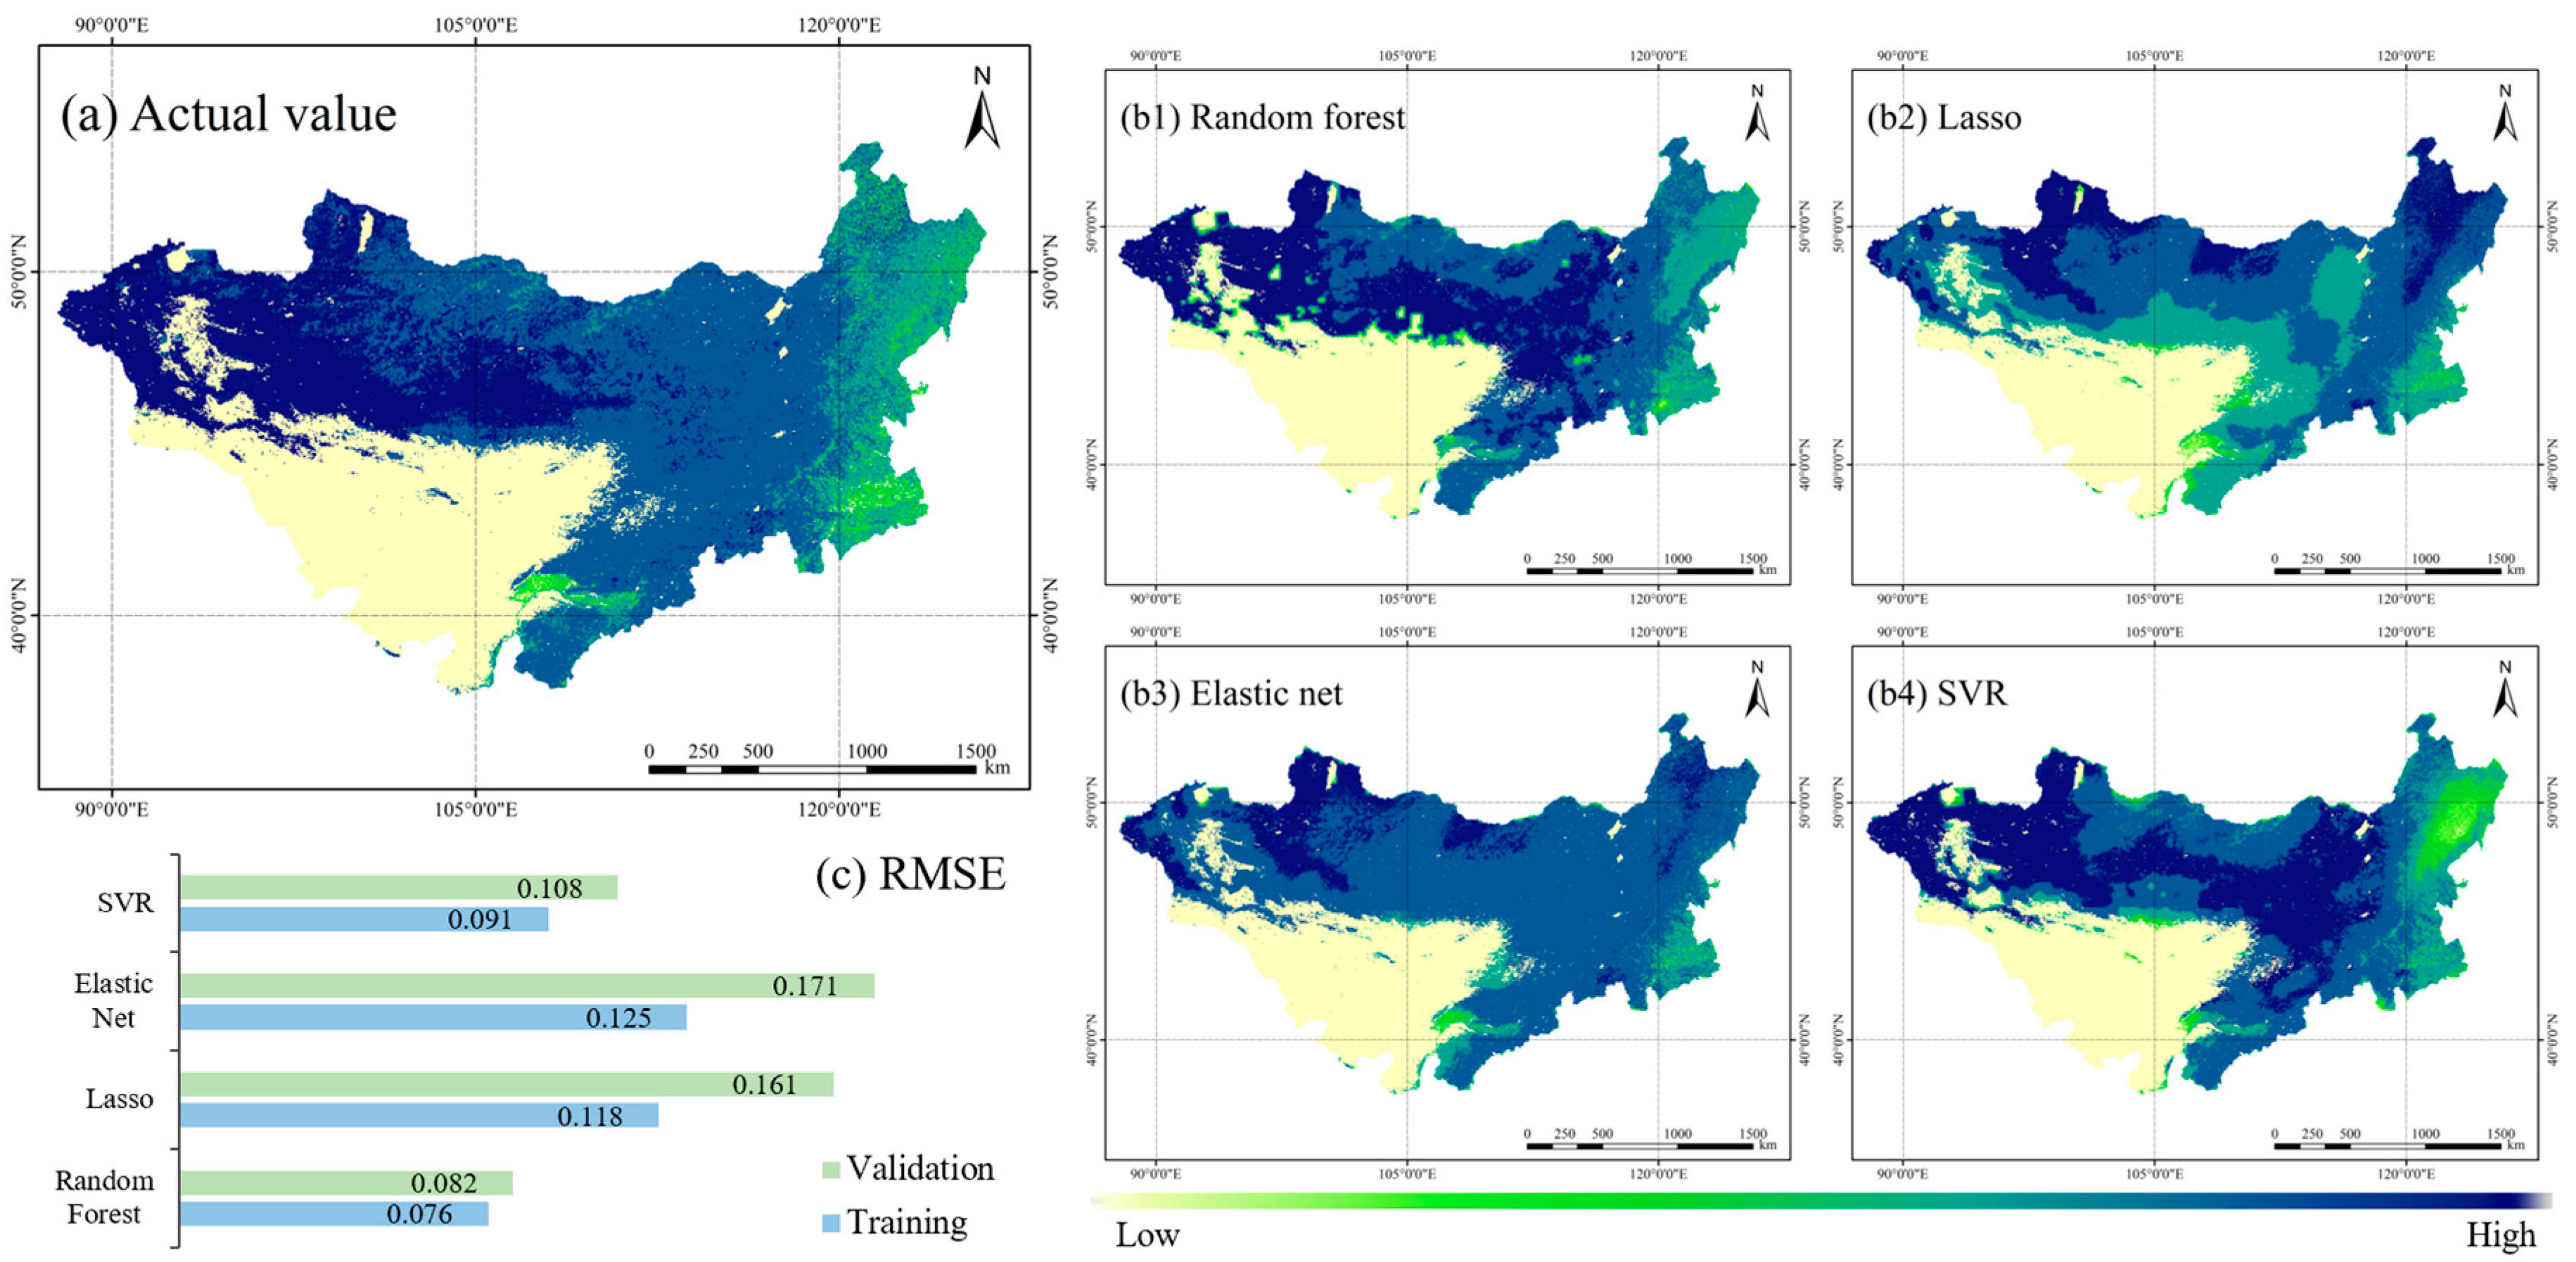
3.3. Future Trend Prediction of CUE Using Machine Learning

Based on the true value of CUE on the Mongolian Plateau in 2020 (Figure 8a), the prediction results of four models (random forest, Lasso, elastic net, SVR) were compared (Figure 8(b1–b4)). The mean of the random forest model is 0.6006, which is closest to the mean of the true value, indicating that the overall deviation between the prediction results of the random forest and the true value is the smallest. The standard deviation is 0.0765, which is lower than that of other models, indicating that the prediction results of the random forest have high stability; its IQR is 0.0769, which is closest to the IQR of the true value (0.0567), indicating that the prediction results of the random forest model are most consistent with the true value in distribution. The mean of the Lasso model is 0.4779, which is significantly lower than the true value, indicating that the prediction results of the Lasso model are systematically underestimated; the standard deviation is 0.1618, which is significantly higher than that of the random forest, indicating that the prediction results of the Lasso model fluctuate greatly. The mean of the elastic net model is 0.4614, which is also significantly lower than the true value, indicating that the prediction results of the elastic net model are also systematically underestimated; the standard deviation is 0.0705, which is low, but the distribution range of its prediction results is narrow, failing to fully capture the variability of the true value. The mean of the SVR model is 0.4973, which is lower than the true value, but better than the Lasso and elastic net models; its standard deviation is 0.2013, which is significantly higher than the random forest model, indicating that the prediction results of the SVR model fluctuate greatly.
As shown in Table 3, the random forest model exhibited the smallest discrepancy between training and validation RMSE (0.076 vs. 0.082), indicating strong generalization capability. In contrast, Lasso and elastic net showed larger gaps (e.g., Lasso: 0.118 vs. 0.161), suggesting potential overfitting due to their linear assumptions. SVR, while more accurate than Lasso, required higher computational costs without significant performance gains. These results confirm that random forest optimally balances accuracy and robustness for CUE prediction. Additional metrics, such as the Mean Absolute Error (MAE), were also computed and showed consistent results.
Based on the four SSPs of CMIP6 (SSP1-2.6, SSP2-4.5, SSP3-7.0, SSP5-8.5), the future changes in CUE in the Mongolian Plateau in 2030, 2040, and 2050 were predicted. The results (Figure 9) show that the spatial distribution pattern of CUE in the future is similar to that in 2020, and the overall characteristics of a gradient decrease from west to east are maintained. The distribution difference of the high-value area in the west (CUE ≥ 0.7) under different pathways is small, reflecting the strong stability of the carbon fixation capacity of vegetation in this region to future climate change; while the medium- and low-value areas in the northeast (CUE < 0.6) show significant spatial heterogeneity, and their distribution patterns show complex dynamics between different pathways and years. In 2030, except for SSP5-8.5, the low-value areas of CUE in the remaining pathways all showed significant clustering in the northeast. By 2040, the low-value areas under the SSP1-2.6 and SSP5-8.5 pathways continued to cluster, while the low-value areas under the SSP2-4.5 and SSP3-7.0 pathways dispersed to the central part. By 2050, there was no clustering of low-value areas under all pathways, indicating that regional differences gradually narrowed with the climate adaptation process. Comparison between the pathways shows that the low-value area in the northeast of SSP1-2.6 will gradually move northward and diffuse to the central part after gathering in 2030, which may be related to the vegetation restoration driven by the policy of returning farmland to forest; SSP2-4.5 presents an oscillation pattern of “aggregation-dispersion-weak aggregation”, reflecting the uncertainty of the ecosystem response under the medium emission scenario; the low-value area of SSP3-7.0 undergoes an evolutionary process of “aggregation-southward movement-diffusion”, reflecting the synergistic effect of human activities and climate coercion; and SSP5-8.5 shows a complex dynamic of “diffusion-aggregation-re-diffusion”, indicating that high carbon emissions may aggravate the spatial instability of ecosystems.
Figure 10 shows that the mean CUE values under the four pathways all show an upward trend, indicating that the CUE of vegetation on the Mongolian Plateau is expected to gradually increase in the future. The mean CUE of the Mongolian Plateau in 2020 was 0.6433, the median was 0.6570, the standard deviation was 0.0054, and the IQR was 0.0558. In comparison, the mean CUE of the SSP1-2.6 pathway in 2030 was 0.5658, significantly lower than the level in 2020, but it rose to 0.5922 in 2040 and slightly dropped to 0.5844 in 2050, showing an overall fluctuating upward trend; the IQR significantly decreased from 0.3210 in 2030 to 0.1072 in 2050, indicating that the distribution of CUE tended to be concentrated. The mean CUE of the SSP2-4.5 pathway is 0.5634 in 2030, rises to 0.5990 in 2040, and slightly decreases to 0.5910 in 2050. The overall trend is similar to that of SSP1-2.6. The IQR decreases from 0.3114 in 2030 to 0.0910 in 2050, indicating that regional differences are gradually decreasing. The mean CUE of the SSP3-7.0 pathway is 0.6000 in 2030, which is higher than that of SSP1-2.6 and SSP2-4.5. It further increases to 0.6103 in 2050, close to the level of 2020. The IQR decreases from 0.0835 in 2030 to 0.0686 in 2050, indicating that the distribution of CUE is more concentrated. The mean CUE of SSP5-8.5 in 2030 is 0.5674, and it rises to 0.6094 in 2050, which is close to SSP3-7.0. The IQR decreases from 0.2749 in 2030 to 0.0788 in 2050, indicating that the CUE distribution tends to be concentrated. The mean CUE under the four pathways shows an upward trend, and the IQR shows a decreasing trend, indicating that the CUE of vegetation on the Mongolian Plateau is expected to gradually increase in the future, and the spatial distribution will be more concentrated, and the regional differences will gradually decrease. However, there are significant differences among different pathways. The mean CUE of SSP3-7.0 in 2030 and 2050 is higher than that of other pathways, indicating that the CUE improvement is most significant under the regional competition pathway. Although the mean CUE of SSP5-8.5 is relatively high, its fossil fuel development characteristics may have a negative impact on the ecological environment, and its sustainability needs to be carefully evaluated. The mean CUE of SSP1-2.6 and SSP2-4.5 is slightly lower than that of SSP3-7.0 and SSP5-8.5, but their sustainable development characteristics and intermediate path characteristics make them the preferred pathways for improving CUE in the future.
Although CUE will generally increase in the future, there are some differences in the prediction results under different paths, indicating that the impact of climate change and socioeconomic development paths on CUE is uncertain. In addition, although the IQR is shrinking, there are still some differences in the spatial distribution of CUE, indicating that there may be an imbalance in the improvement of CUE among regions in the future, especially in ecologically fragile areas (such as desert steppes and deserts), which still need to be paid attention to.

4. Discussion

4.1. Spatiotemporal Patterns of CUE and Its Driving Mechanisms

The study revealed the spatiotemporal differentiation characteristics and driving mechanisms of CUE on the Mongolian Plateau. The spatial distribution of CUE showed a gradient decreasing pattern from west to east. The high-value area in the northwest was closely related to the strong carbon fixation capacity under the cold and humid climate of high latitudes, while the low-value area in the east may be subject to the dual constraints of reduced precipitation and human activities. This spatial differentiation feature is similar to the precipitation gradient distribution on the Mongolian Plateau; the western region is affected by the westerly belt and mountainous terrain, and the precipitation is relatively stable, while the eastern region is threatened by the decline of the East Asian monsoon and the expansion of desertification, and the vegetation productivity is limited.
From 2000 to 2020, the overall CUE of the Mongolian Plateau increased significantly, and the M-K mutation test identified 2005 as a breakpoint. After this point, the CUE growth rate accelerated, coinciding with intensified climate changes and the implementation of ecological restoration policies. Previous studies have indicated that the growing season in the Mongolian Plateau has extended in recent decades under global warming [49], and large-scale ecological projects (e.g., the Grain for Green Program) launched in northern China since 2000 have positively influenced regional vegetation productivity [50]. These factors may have collectively contributed to the phased improvement of CUE. However, as this study does not directly quantify changes in the growing season length or the specific impacts of ecological projects, we acknowledge this as a potential explanation rather than a definitive causal relationship. Future studies are encouraged to explore these mechanisms in more detail.
The results confirm our first research question: Evapotranspiration–temperature interactions dominate CUE heterogeneity, contrasting with precipitation-driven trends in the Sahel [51]. This divergence likely stems from the plateau’s unique humidity constraints, which amplify temperature’s role in carbon allocation. The spatial reconstruction characteristics of CUE further confirm the influence of the climate–vegetation synergy. The high-value area of CUE in the middle of the typical steppe has a tendency to spread eastward, possibly due to the adaptive adjustment of the grassland community under precipitation fluctuations. Meanwhile, the continuous increase in CUE of coniferous and mingled forests is related to the sensitivity of forest ecosystems to rising CO2 concentrations.
However, it is important to note that the slight downward trend of CUE in desert steppes and desert areas indicates a negative feedback mechanism in ecologically fragile regions responding to climate aridification. This trend aligns with the vegetation degradation patterns observed in arid Central Asia. Hurst exponent analysis shows that CUE changes in 88% of the Mongolian Plateau are persistent, particularly in deciduous forests and typical steppes, suggesting that the current CUE trends may be maintained in the long term. In contrast, the CUE in 10% of areas is anti-persistent, suggesting that these regions may require targeted human intervention to prevent ecosystem collapse. Forest-steppe ecosystems showed persistent CUE trends (Hurst = 0.7185), supporting our hypothesis, while desert steppes exhibited anti-persistence (0.0007), signaling degradation risks.
The GeoDetector analysis further highlights that evapotranspiration, precipitation, and temperature are the core driving factors affecting the spatial differentiation of CUE. The interaction between evapotranspiration and temperature has the highest explanatory power, indicating that hydrothermal synergy significantly influences the carbon allocation efficiency of ecosystems by regulating the balance between vegetation transpiration and photosynthesis. Specifically, in humid regions, precipitation and evapotranspiration together drive CUE improvement, whereas in low-temperature regions, the positive effect of temperature on CUE is primarily due to increased accumulated temperature during the growing season, which extends the vegetation photosynthesis cycle.
Although the single FVC has a strong explanatory power for CUE, its interactive effect with climate factors is relatively weak. This finding shows that the implementation effect of vegetation restoration measures depends on the matching degree of regional hydrothermal conditions, and simply improving FVC may not be enough to significantly promote the improvement of CUE. Therefore, in the northwestern high CUE value area, the focus should be on maintaining the existing water and heat balance to protect its efficient carbon fixation capacity, while in the eastern low CUE value area, measures such as artificial precipitation or the introduction of drought-tolerant species are needed to alleviate the inhibitory effect of water stress on vegetation carbon utilization efficiency. This research result has important guiding significance for optimizing the management of the Mongolian Plateau ecosystem and improving the regional carbon sink function.

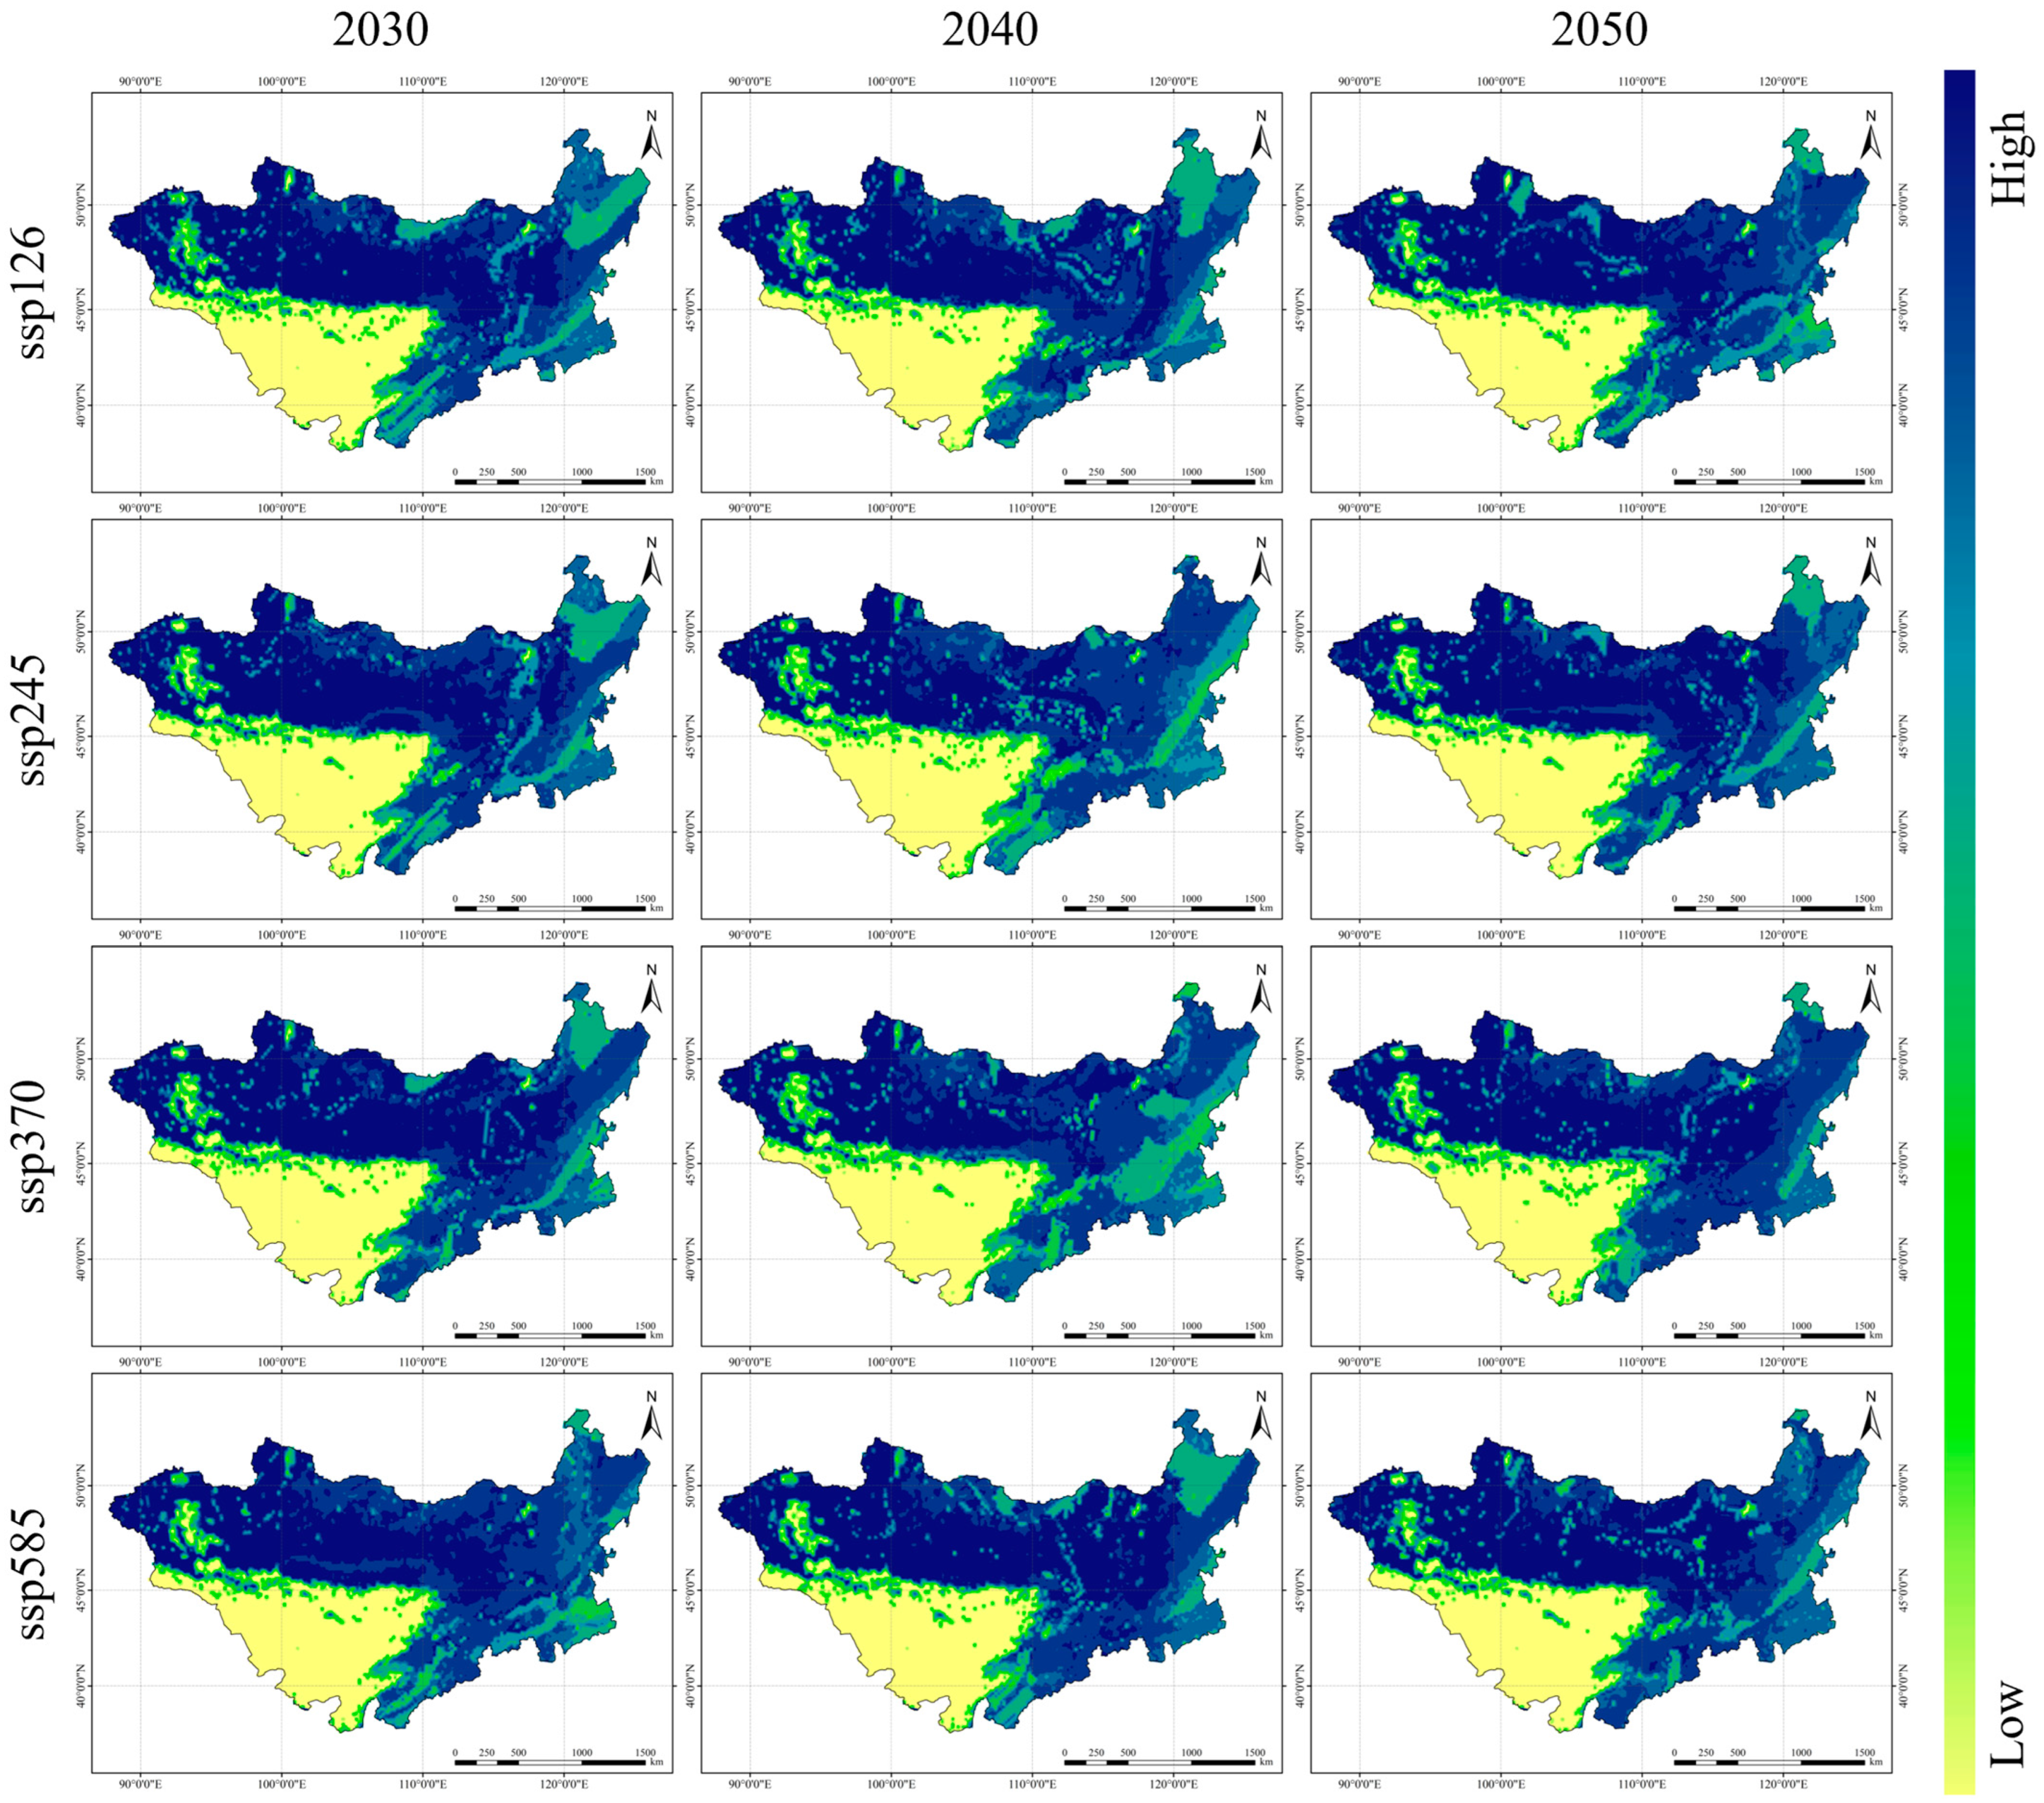
4.2. Future Evolution Trends of CUE Under Different Climate Scenarios

Based on machine learning models and CMIP6 multi-scenario simulations, this study systematically reveals the complexity and path dependency of the future evolution of CUE on the Mongolian Plateau. The random forest model showed the best predictive performance, mainly due to its ability to capture nonlinear relationships, highlighting the advantages of machine learning in ecological forecasting, particularly for modeling geographic heterogeneity and climate–vegetation interactions.
Under all four SSPs, CUE shows an upward trend, but the evolution patterns vary significantly. Under SSP5-8.5, desert-steppe CUE declines (−0.0005), highlighting vulnerabilities in low-vegetation ecosystems. This suggests that desert-steppe regions may experience further carbon efficiency losses due to intensified climate stress. Additionally, the Mongolian Plateau’s 1.03% annual CUE increase surpasses global averages [52] due to localized factors: (1) Post-2005 grazing bans significantly improved grassland recovery and ecosystem resilience. (2) Cold-limited forests benefited from warming, unlike temperature-saturated tropical ecosystems.
Comparing CUE persistence across regions, we find that anti-persistent CUE in desert steppes mirrors threshold responses in the Atacama Desert [53], suggesting a universal aridification tipping point. This highlights the risk of crossing irreversible ecological thresholds in arid and semi-arid environments. Despite the overall increasing trend in CUE, there are underlying stability concerns. Under SSP5-8.5, the spatial dynamics of CUE (“diffusion-aggregation-re-diffusion”) suggest that high carbon emissions could exacerbate ecosystem instability by intensifying water–heat imbalances. The re-aggregation of low-CUE areas in the northeast in 2040 suggests that extreme emissions scenarios may exceed ecological thresholds, reversing previous carbon sink gains in localized areas.
In summary, while SSP1-2.6 and SSP2-4.5 pathways result in slightly lower mean CUE values, they offer sustainable development trajectories that balance ecological benefits with system stability, making them optimal pathways with controllable risks. For desert-steppe regions, adaptation measures such as efficient water utilization technologies (e.g., rainwater harvesting irrigation) and drought-resistant species introduction are necessary to mitigate the negative feedback loop of “drought-low CUE”. Additionally, to address spatial CUE instability under SSP3-7.0 and SSP5-8.5, an early warning system should be established to monitor the migration of low-CUE regions dynamically.

4.3. Study Limitations and Future Directions

While this study provides valuable insights into CUE dynamics, it has some limitations that should be addressed in future research. The dependence on MODIS NPP data may lead to an underestimation of CUE in desert-steppe ecosystems, and the regression modeling was based on data from 2000, 2005, 2010, and 2015. Incorporating continuous annual datasets from 2000 to 2020 would better capture long-term trends. Additionally, while FVC significantly impacts CUE, it was not included in future projections due to data constraints. Future studies should incorporate time-series projections of FVC using remote sensing and vegetation growth models to address this limitation. The superior performance of random forest aligns with prior studies, demonstrating its effectiveness in capturing non-linear ecological interactions [54]. In contrast, linear models (Lasso, elastic net) exhibited higher validation errors, likely due to their inability to represent complex climate–vegetation dynamics. Further, while machine learning models provide robust predictions, their black-box nature may obscure mechanistic understandings of CUE dynamics. Integrating process-based ecosystem models could facilitate exploration of the underlying biophysical mechanisms driving CUE changes, along with incorporating UAV hyperspectral data to improve accuracy in CUE assessments. Lastly, region-specific carbon management strategies should be developed, particularly for ecologically fragile areas, by formulating targeted restoration and carbon utilization plans that account for regional climate characteristics.

5. Conclusions

This study systematically examined the spatiotemporal evolution of vegetation CUE across the Mongolian Plateau from 2000 to 2020, uncovering its key driving mechanisms and projecting future trends under different climate scenarios. The results highlight distinct spatial patterns, significant temporal growth, and varied responses under diverse climate trajectories, providing crucial insights for regional carbon management and ecological conservation.
(1) Spatial and temporal trends: CUE exhibits a west-to-east decreasing gradient, with high values (≥0.7) in the northwest due to favorable hydrothermal conditions and lower values (<0.6) in the east, where reduced precipitation and human activities constrain carbon efficiency. Over the past two decades, CUE increased by 6.2%, with a notable acceleration after 2005, likely driven by climate change and ecological restoration efforts. While forests and typical steppe ecosystems benefited from improved hydrothermal conditions, desert steppes and arid regions experienced a slight decline, indicating heightened vulnerability to increasing aridification.
(2) Driving factors: evapotranspiration, precipitation, and temperature emerged as the primary drivers of CUE variability. The interaction between evapotranspiration and temperature exerted the strongest influence, underscoring the pivotal role of hydrothermal synergy in regulating ecosystem carbon allocation. Although vegetation coverage (FVC) also shaped CUE dynamics, its impact was contingent on regional climate conditions, suggesting that vegetation restoration alone is insufficient without adequate water availability.
(3) Future projections and implications: CMIP6-based projections indicate a continued rise in CUE, but with substantial risks. While SSP1-2.6 and SSP2-4.5 offer stable and sustainable pathways, SSP3-7.0 and SSP5-8.5 may lead to CUE destabilization due to intensified drought and human-induced pressures. To enhance carbon sequestration and safeguard ecosystem stability, conservation strategies should prioritize expanding protected areas in northwestern high-CUE regions (≥0.7), implementing water-efficient grazing policies in eastern low-CUE zones (<0.6), and promoting drought-resistant vegetation. Additionally, establishing a CUE early warning system and incorporating CUE metrics into Mongolia’s NDCs to track carbon sequestration targets under SSP5-8.5 will be vital for mitigating risks and ensuring long-term ecological resilience.

Author Contributions

X.Y.: Conceptualization, Methodology, Software, Writing—original draft, Writing—review and editing. Q.Y.: Conceptualization, Methodology. B.A.: Conceptualization, Supervision. Y.W.: Resources, Data curation, Supervision. J.Z.: Supervision. W.S.: Supervision. H.C.: Supervision. B.C.: Supervision. J.L.: Supervision. All authors have read and agreed to the published version of the manuscript.

Funding

This work was supported by the National Natural Science Foundation of China [42261144747], and the 5·5 Engineering Research & Innovation Team Project of Beijing Forestry University [BLRC2023B06].

Data Availability Statement

The raw data supporting the conclusions of this article will be made available by the authors on request.

Acknowledgments

We would like to thank Buyanbaatar Avirmed, School of Agroecology, Mongolian University of Life Sciences. He provided much guidance and data support for the study. We believe that he and Qiang Yu, as the corresponding author, contributed equally to this manuscript.

Conflicts of Interest

The authors declare no conflict of interest.

References

  1. Kabir, M.; Habiba, U.E.; Khan, W.; Shah, A.; Rahim, S.; Rios-Escalante, P.R.D.l.; Farooqi, Z.-U.-R.; Ali, L.; Shafiq, M. Climate Change Due to Increasing Concentration of Carbon Dioxide and Its Impacts on Environment in 21st Century; a Mini Review. J. King Saud Univ. Sci. 2023, 35, 102693. [Google Scholar] [CrossRef]
  2. Holmgren, M.; Stapp, P.; Dickman, C.; Gracia, C.; Graham, S. Extreme Climatic Events Shape Arid and Semiarid Ecosystems. Front. Ecol. Environ. 2006, 4, 87–95. [Google Scholar] [CrossRef]
  3. Reichstein, M.; Bahn, M.; Ciais, P.; Frank, D.; Mahecha, M.D.; Seneviratne, S.I.; Zscheischler, J.; Beer, C.; Buchmann, N.; Frank, D.C.; et al. Climate Extremes and the Carbon Cycle. Nature 2013, 500, 287–295. [Google Scholar] [CrossRef]
  4. Farrelly, D.J.; Everard, C.D.; Fagan, C.C.; McDonnell, K.P. Carbon Sequestration and the Role of Biological Carbon Mitigation: A Review. Renew. Sustain. Energy Rev. 2013, 21, 712–727. [Google Scholar] [CrossRef]
  5. Govind, A.; Kumari, J. Understanding the Terrestrial Carbon Cycle: An Ecohydrological Perspective. Int. J. Ecol. 2014, 2014, 712537. [Google Scholar] [CrossRef]
  6. Liu, Y.; Yang, Y.; Wang, Q.; Du, X.; Li, J.; Gang, C.; Zhou, W.; Wang, Z. Evaluating the Responses of Net Primary Productivity and Carbon Use Efficiency of Global Grassland to Climate Variability along an Aridity Gradient. Sci. Total Environ. 2019, 652, 671–682. [Google Scholar] [CrossRef] [PubMed]
  7. Choudhury, B.J. Carbon Use Efficiency, and Net Primary Productivity of Terrestrial Vegetation. Adv. Space Res. 2000, 26, 1105–1108. [Google Scholar] [CrossRef]
  8. Babst, F.; Friend, A.D.; Karamihalaki, M.; Wei, J.; Arx, G.V.; Papale, D.; Peters, R.L. Modeling Ambitions Outpace Observations of Forest Carbon Allocation. Trends Plant Sci. 2021, 26, 210–219. [Google Scholar] [CrossRef]
  9. Curtis, P.S.; Vogel, C.S.; Gough, C.M.; Schmid, H.P.; Su, H.-B.; Bovard, B.D. Respiratory Carbon Losses and the Carbon-use Efficiency of a Northern Hardwood Forest, 1999–2003. New Phytol. 2005, 167, 437–456. [Google Scholar] [CrossRef]
  10. Zanotelli, D.; Montagnani, L.; Manca, G.; Tagliavini, M. Net Primary Productivity, Allocation Pattern and Carbon Use Efficiency in an Apple Orchard Assessed by Integrating Eddy Covariance, Biometric and Continuous Soil Chamber Measurements. Biogeosciences 2013, 10, 3089–3108. [Google Scholar] [CrossRef]
  11. Peichl, M.; Brodeur, J.J.; Khomik, M.; Arain, M.A. Biometric and Eddy-Covariance Based Estimates of Carbon Fluxes in an Age-Sequence of Temperate Pine Forests. Agric. For. Meteorol. 2010, 150, 952–965. [Google Scholar] [CrossRef]
  12. Verlinden, M.S.; Broeckx, L.S.; Zona, D.; Berhongaray, G.; De Groote, T.; Camino Serrano, M.; Janssens, I.A.; Ceulemans, R. Net Ecosystem Production and Carbon Balance of an SRC Poplar Plantation during Its First Rotation. Biomass Bioenergy 2013, 56, 412–422. [Google Scholar] [CrossRef]
  13. Street, L.E.; Subke, J.-A.; Sommerkorn, M.; Sloan, V.; Ducrotoy, H.; Phoenix, G.K.; Williams, M. The Role of Mosses in Carbon Uptake and Partitioning in Arctic Vegetation. New Phytol. 2013, 199, 163–175. [Google Scholar] [CrossRef]
  14. Zhang, Y.; Yu, G.; Yang, J.; Wimberly, M.C.; Zhang, X.; Tao, J.; Jiang, Y.; Zhu, J. Climate-driven Global Changes in Carbon Use Efficiency. Glob. Ecol. Biogeogr. 2014, 23, 144–155. [Google Scholar] [CrossRef]
  15. Kwon, Y.; Larsen, C.P.S. Effects of Forest Type and Environmental Factors on Forest Carbon Use Efficiency Assessed Using MODIS and FIA Data across the Eastern USA. Int. J. Remote Sens. 2013, 34, 8425–8448. [Google Scholar] [CrossRef]
  16. Zhang, Y.; Ye, A. The Response of Terrestrial Vegetation Carbon Use Efficiency to Global Environmental Changes. Glob. Planet. Change 2024, 240, 104537. [Google Scholar] [CrossRef]
  17. Fang, L.; Gao, R.; Wang, X.; Liu, T. Isotopes-Based Characterization of Precipitation Compositions and Atmospheric Water Vapor Sources over Typical Eurasian Steppes in South Mongolian Plateau. J. Hydrol. 2022, 615, 128724. [Google Scholar] [CrossRef]
  18. Zhang, L.; Xiao, J.; Zheng, Y.; Li, S.; Zhou, Y. Increased Carbon Uptake and Water Use Efficiency in Global Semi-Arid Ecosystems. Environ. Res. Lett. 2020, 15, 034022. [Google Scholar] [CrossRef]
  19. Gang, C.; Wang, Z.; Chen, Y.; Yang, Y.; Li, J.; Cheng, J.; Qi, J.; Odeh, I. Drought-Induced Dynamics of Carbon and Water Use Efficiency of Global Grasslands from 2000 to 2011. Ecol. Indic. 2016, 67, 788–797. [Google Scholar] [CrossRef]
  20. Zhao, J.; Yu, Q.; Avirmed, B.; Wang, Y.; Orgilbold, M.; Cui, H.; Liu, Y.; Lian, J. The Relationship between Structure and Ecosystem Services of Forest and Grassland Based on Pattern Analysis Method: A Case Study of the Mongolian Plateau. Sci. Total Environ. 2024, 948, 174700. [Google Scholar] [CrossRef]
  21. Cai, Q.; Chen, W.; Chen, S.; Xie, S.-P.; Piao, J.; Ma, T.; Lan, X. Recent Pronounced Warming on the Mongolian Plateau Boosted by Internal Climate Variability. Nat. Geosci. 2024, 17, 181–188. [Google Scholar] [CrossRef]
  22. Wang, J.; Li, K.; Hong, M.; Shao, Y.; Sun, Z.; Liu, M.; Li, F.; Su, Y.; Jia, Q.; Liu, Y.; et al. Long-Term Land Cover Dataset of the Mongolian Plateau Based on Multi-Source Data and Rich Sample Annotations. Earth Syst. Sci. Data Discuss. 2024. preprint. [Google Scholar] [CrossRef]
  23. Janz, L.; Odsuren, D.; Bukhchuluun, D. Transitions in Palaeoecology and Technology: Hunter-Gatherers and Early Herders in the Gobi Desert. J. World Prehistory 2017, 30, 1–80. [Google Scholar] [CrossRef]
  24. Ma, Q.; Wu, J.; He, C.; Fang, X. The Speed, Scale, and Environmental and Economic Impacts of Surface Coal Mining in the Mongolian Plateau. Resour. Conserv. Recycl. 2021, 173, 105730. [Google Scholar] [CrossRef]
  25. Lu, H.; Wang, X.; Wang, X.; Chang, X.; Zhang, H.; Xu, Z.; Zhang, W.; Wei, H.; Zhang, X.; Yi, S.; et al. Formation and Evolution of Gobi Desert in Central and Eastern Asia. Earthm Sci. Rev. 2019, 194, 251–263. [Google Scholar] [CrossRef]
  26. Dore, M.H.I. Climate Change and Changes in Global Precipitation Patterns: What Do We Know? Environ. Int. 2005, 31, 1167–1181. [Google Scholar] [CrossRef] [PubMed]
  27. Wang, Y.; Liu, X.; Herzschuh, U. Asynchronous Evolution of the Indian and East Asian Summer Monsoon Indicated by Holocene Moisture Patterns in Monsoonal Central Asia. Earth-Sci. Rev. 2010, 103, 135–153. [Google Scholar] [CrossRef]
  28. Tolika, K. On the Analysis of the Temporal Precipitation Distribution over Greece Using the Precipitation Concentration Index (PCI): Annual, Seasonal, Monthly Analysis and Association with the Atmospheric Circulation. Theor. Appl. Climatol. 2019, 137, 2303–2319. [Google Scholar] [CrossRef]
  29. Xia, Y.; Dan, D.; Liu, H.; Zhou, H.; Wan, Z. Spatiotemporal Distribution of Precipitation over the Mongolian Plateau during 1976–2017. Atmosphere 2022, 13, 2132. [Google Scholar] [CrossRef]
  30. Jia, Q.; Gao, X.; Jiang, Z.; Li, H.; Guo, J.; Lu, X.; Yonghong Li, F. Sensitivity of Temperate Vegetation to Precipitation Is Higher in Steppes than in Deserts and Forests. Ecol. Indic. 2024, 166, 112317. [Google Scholar] [CrossRef]
  31. Zhang, R.; Wang, Z.; Han, G.; Schellenberg, M.P.; Wu, Q.; Gu, C. Grazing Induced Changes in Plant Diversity Is a Critical Factor Controlling Grassland Productivity in the Desert Steppe, Northern China. Agric. Ecosyst. Environ. 2018, 265, 73–83. [Google Scholar] [CrossRef]
  32. Wu, D.; Wu, H.; Zhao, X.; Zhou, T.; Tang, B.; Zhao, W.; Jia, K. Evaluation of Spatiotemporal Variations of Global Fractional Vegetation Cover Based on GIMMS NDVI Data from 1982 to 2011. Remote Sens. 2014, 6, 4217–4239. [Google Scholar] [CrossRef]
  33. Eyring, V.; Bony, S.; Meehl, G.A.; Senior, C.A.; Stevens, B.; Stouffer, R.J.; Taylor, K.E. Overview of the Coupled Model Intercomparison Project Phase 6 (CMIP6) Experimental Design and Organization. Geosci. Model Dev. 2016, 9, 1937–1958. [Google Scholar] [CrossRef]
  34. O’Neill, B.C.; Tebaldi, C.; van Vuuren, D.P.; Eyring, V.; Friedlingstein, P.; Hurtt, G.; Knutti, R.; Kriegler, E.; Lamarque, J.-F.; Lowe, J.; et al. The Scenario Model Intercomparison Project (ScenarioMIP) for CMIP6. Geosci. Model Dev. 2016, 9, 3461–3482. [Google Scholar] [CrossRef]
  35. Tebaldi, C.; Debeire, K.; Eyring, V.; Fischer, E.; Fyfe, J.; Friedlingstein, P.; Knutti, R.; Lowe, J.; O’Neill, B.; Sanderson, B.; et al. Climate Model Projections from the Scenario Model Intercomparison Project (ScenarioMIP) of CMIP6. Earth Syst. Dyn. 2021, 12, 253–293. [Google Scholar] [CrossRef]
  36. Jimenez, D.A.; Menapace, A.; Zanfei, A.; Pinto, E.J.d.A.; Brentan, B. Assessing Downscaling Techniques for Frequency Analysis, Total Precipitation and Rainy Day Estimation in CMIP6 Simulations over Hydrological Years. Hydrol. Earth Syst. Sci. 2024, 28, 1981–1997. [Google Scholar] [CrossRef]
  37. Hurst, H.E. Long-Term Storage Capacity of Reservoirs. Trans. Am. Soc. Civ. Eng. 1951, 116, 770–799. [Google Scholar] [CrossRef]
  38. Guo, M.; Li, J.; He, H.; Xu, J.; Jin, Y. Detecting Global Vegetation Changes Using Mann-Kendal (MK) Trend Test for 1982–2015 Time Period. Chin. Geogr. Sci. 2018, 28, 907–919. [Google Scholar] [CrossRef]
  39. Yang, H.; Yu, J.; Xu, W.; Wu, Y.; Lei, X.; Ye, J.; Geng, J.; Ding, Z. Long-Time Series Ecological Environment Quality Monitoring and Cause Analysis in the Dianchi Lake Basin, China. Ecol. Indic. 2023, 148, 110084. [Google Scholar] [CrossRef]
  40. Xu, Y.; Liu, R.; Xue, C.; Xia, Z. Ecological Sensitivity Evaluation and Explanatory Power Analysis of the Giant Panda National Park in China. Ecol. Indic. 2023, 146, 109792. [Google Scholar] [CrossRef]
  41. Han, J.; Dalaibaatar, E. A Study on the Influencing Factors of China’s Ecological Footprint Based on EEMD–GeoDetector. Sustainability 2023, 15, 6680. [Google Scholar] [CrossRef]
  42. Liu, X.; Lai, Q.; Yin, S.; Bao, Y.; Tong, S.; Adiya, Z.; Sanjjav, A.; Gao, R. Spatio-Temporal Patterns and Control Mechanism of the Ecosystem Carbon Use Efficiency across the Mongolian Plateau. Sci. Total Environ. 2024, 907, 167883. [Google Scholar] [CrossRef] [PubMed]
  43. Song, Y.; Wang, J.; Ge, Y.; Xu, C. An Optimal Parameters-Based Geographical Detector Model Enhances Geographic Characteristics of Explanatory Variables for Spatial Heterogeneity Analysis: Cases with Different Types of Spatial Data. GISci. Remote Sens. 2020, 57, 593–610. [Google Scholar] [CrossRef]
  44. Tredennick, A.T.; Hooker, G.; Ellner, S.P.; Adler, P.B. A Practical Guide to Selecting Models for Exploration, Inference, and Prediction in Ecology. Ecology 2021, 102, e03336. [Google Scholar] [CrossRef]
  45. Breiman, L. Random Forests. Mach. Learn. 2001, 45, 5–32. [Google Scholar] [CrossRef]
  46. Tibshirani, R. Regression Shrinkage and Selection Via the Lasso. J. R. Stat. Soc. Ser. B Stat. Methodol. 1996, 58, 267–288. [Google Scholar] [CrossRef]
  47. Zou, H.; Hastie, T. Regularization and Variable Selection Via the Elastic Net. J. R. Stat. Soc. Ser. B Stat. Methodol. 2005, 67, 301–320. [Google Scholar] [CrossRef]
  48. Basak, D.; Pal, S.; Patranabis, D.C. Support Vector Regression. Neural Inf. Process. 2007, 11, 203–224. [Google Scholar]
  49. Wang, G.; Huang, Y.; Wei, Y.; Zhang, W.; Li, T.; Zhang, Q. Climate Warming Does Not Always Extend the Plant Growing Season in Inner Mongolian Grasslands: Evidence From a 30-Year In Situ Observations at Eight Experimental Sites. JGR Biogeosci. 2019, 124, 2364–2378. [Google Scholar] [CrossRef]
  50. Piao, S.; Fang, J.; Zhou, L.; Zhu, B.; Tan, K.; Tao, S. Changes in Vegetation Net Primary Productivity from 1982 to 1999 in China. Glob. Biogeochem. Cycles 2005, 19, 2004GB002274. [Google Scholar] [CrossRef]
  51. Khalifa, M.; Elagib, N.A.; Ribbe, L.; Schneider, K. Spatio-Temporal Variations in Climate, Primary Productivity and Efficiency of Water and Carbon Use of the Land Cover Types in Sudan and Ethiopia. Sci. Total Environ. 2018, 624, 790–806. [Google Scholar] [CrossRef] [PubMed]
  52. He, Y.; Piao, S.; Li, X.; Chen, A.; Qin, D. Global Patterns of Vegetation Carbon Use Efficiency and Their Climate Drivers Deduced from MODIS Satellite Data and Process-Based Models. Agric. Meteorol. 2018, 256–257, 150–158. [Google Scholar] [CrossRef]
  53. Ewing, S.A.; Sutter, B.; Owen, J.; Nishiizumi, K.; Sharp, W.; Cliff, S.S.; Perry, K.; Dietrich, W.; McKay, C.P.; Amundson, R. A Threshold in Soil Formation at Earth’s Arid Hyperarid Transition. Geochim. Cosmochim. Acta 2006, 70, 5293–5322. [Google Scholar] [CrossRef]
  54. Ryo, M.; Rillig, M.C. Statistically Reinforced Machine Learning for Nonlinear Patterns and Variable Interactions. Ecosphere 2017, 8, e01976. [Google Scholar] [CrossRef]
Figure 1. (a) Geographic location in the world; (b) distribution of altitude ecosystem types. The coordinate system used is WGS 1984 World Mercator (EPSG: 3395).
Remotesensing 17 01392 g001
Figure 2. (a1a5) CUE spatial distribution from 2000, 2005, 2010, 2015, and 2020; (b) distribution of deserts and desert steppe and the average distribution of FVC during the study period. (The CUE value in the southwestern part of the Mongolian Plateau is close to 0, due to the large-scale desert distribution and extremely low vegetation coverage).
Remotesensing 17 01392 g002
Figure 3. M-K mutation test results (curve UF in the figure represents the positive cumulative trend of the time series; curve UB represents the reverse cumulative trend of the time series; the asterisk is marked at the intersection of curves UF and UB, representing the mutation point).
Remotesensing 17 01392 g003
Figure 4. CUE trend analysis results ((a1a8) is the spatial distribution of trend values in different ecosystem types; (b) is the proportion of trend values in different ranges in the entire study area; (c) is the median trend value of different ecosystem types).
Remotesensing 17 01392 g004
Figure 5. CUE Hurst exponent calculation results ((a1a8) is the spatial distribution of the Hurst exponent in different ecosystem types; (b) is the proportion of Hurst exponents of different ranges in the entire study area; (c) is the median Hurst exponent of different ecosystem types).
Remotesensing 17 01392 g005
Figure 6. Summary of q-values for single factors.
Remotesensing 17 01392 g006
Figure 7. Summary of q-values for interaction factors.
Remotesensing 17 01392 g007
Figure 8. Comparison of four machine learning regression results ((a) is the actual value of CUE in 2020; (b1b4) is the estimated value in 2020 obtained by four regression models; (c) is the comparison of training and validation performance for machine learning models).
Remotesensing 17 01392 g008
Figure 9. Future distribution of CUE estimated by random forest regression.
Remotesensing 17 01392 g009
Figure 10. Box plot of CUE estimates for 2030, 2040, and 2050.
Remotesensing 17 01392 g010
Table 1. Potential influencing factors of CUE.
Variable NameUnit
Digital Elevation Model (DEM)Meter (m)
Surface SlopeDegree (°)
TemperatureKelvin (K)
PrecipitationMillimeter (mm)
EvapotranspirationMillimeter (mm)
Fractional vegetation cover (FVC)Percentage (%)
Table 2. Summary of CUE statistical indicators from 2000 to 2020.
YearMinimumMaximumMeanMedianStdIQR
20000.02460.80410.60550.61340.06490.0728
20050.00670.80600.62800.63390.05000.0613
20100.00860.80000.63050.63930.05290.0556
20150.00980.80430.63600.64870.05160.0483
20200.02400.80420.64330.65700.05540.0558
Table 3. Training and validation performance of machine learning models for CUE prediction.
ModelTraining RMSEValidation RMSETraining MAEValidation MAETraining R2Validation R2
Random Forest0.0760.0820.0520.0580.910.88
Lasso0.1180.1610.0850.1120.750.68
Elastic Net0.1250.1710.0900.1200.730.65
SVR0.0910.1080.0650.0750.850.80
Disclaimer/Publisher’s Note: The statements, opinions and data contained in all publications are solely those of the individual author(s) and contributor(s) and not of MDPI and/or the editor(s). MDPI and/or the editor(s) disclaim responsibility for any injury to people or property resulting from any ideas, methods, instructions or products referred to in the content.

