
Assessment of Integrated Multi-Satellite Retrievals for Global Precipitation Measurement (IMERG) Precipitation Products in Northwest China
 ,
,
Abstract

1. Introduction
2. Data and Methods
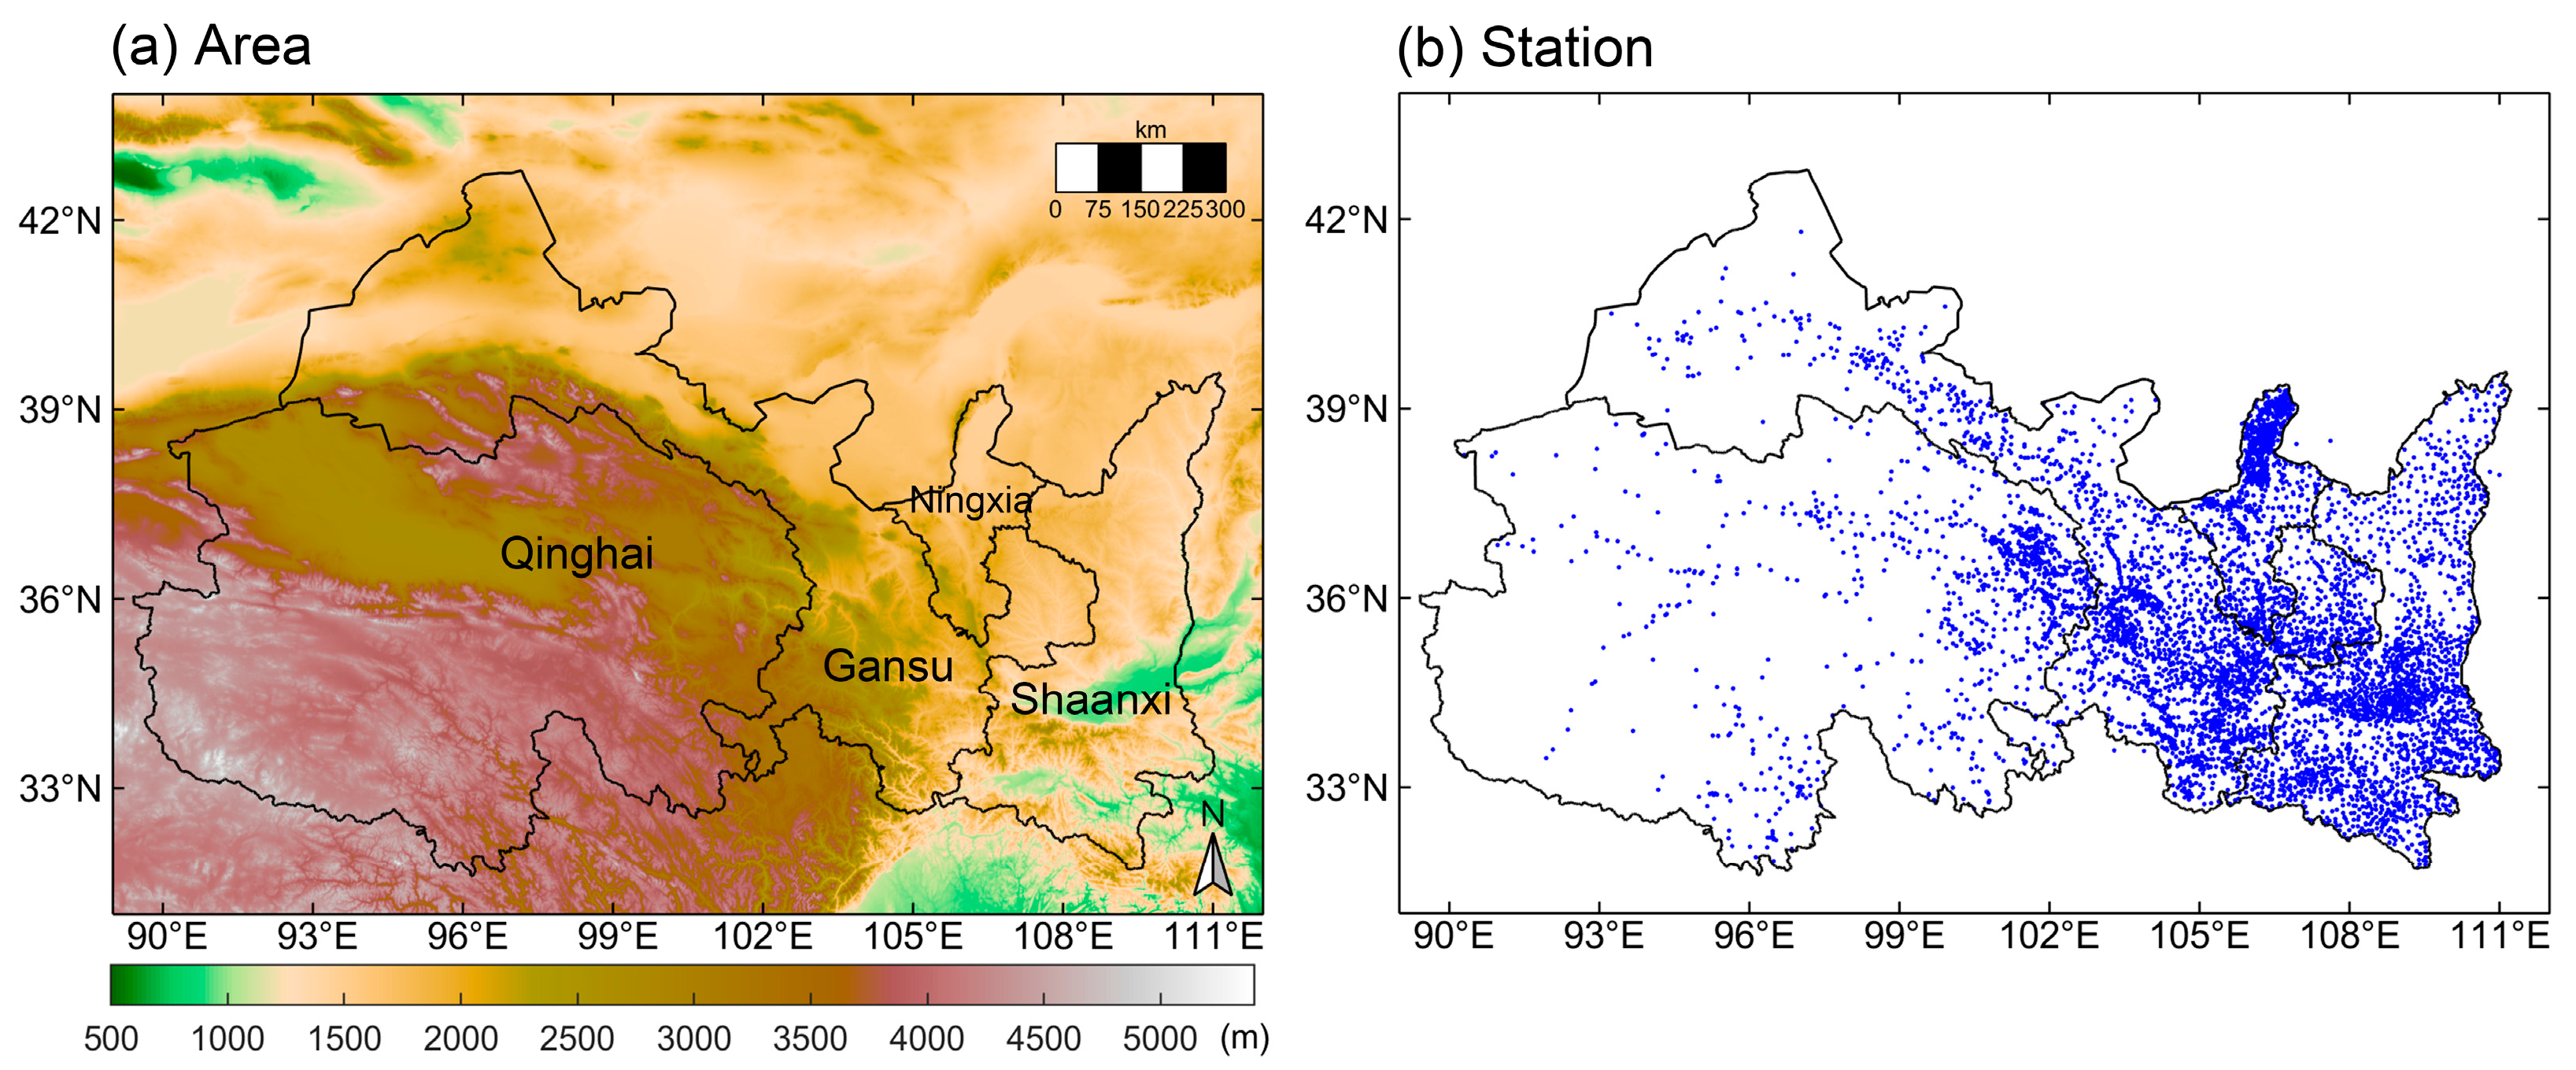
2.1. Study Area
2.2. Precipitation Data
2.3. Evaluation Methods
3. Results
3.1. Climatological Precipitation
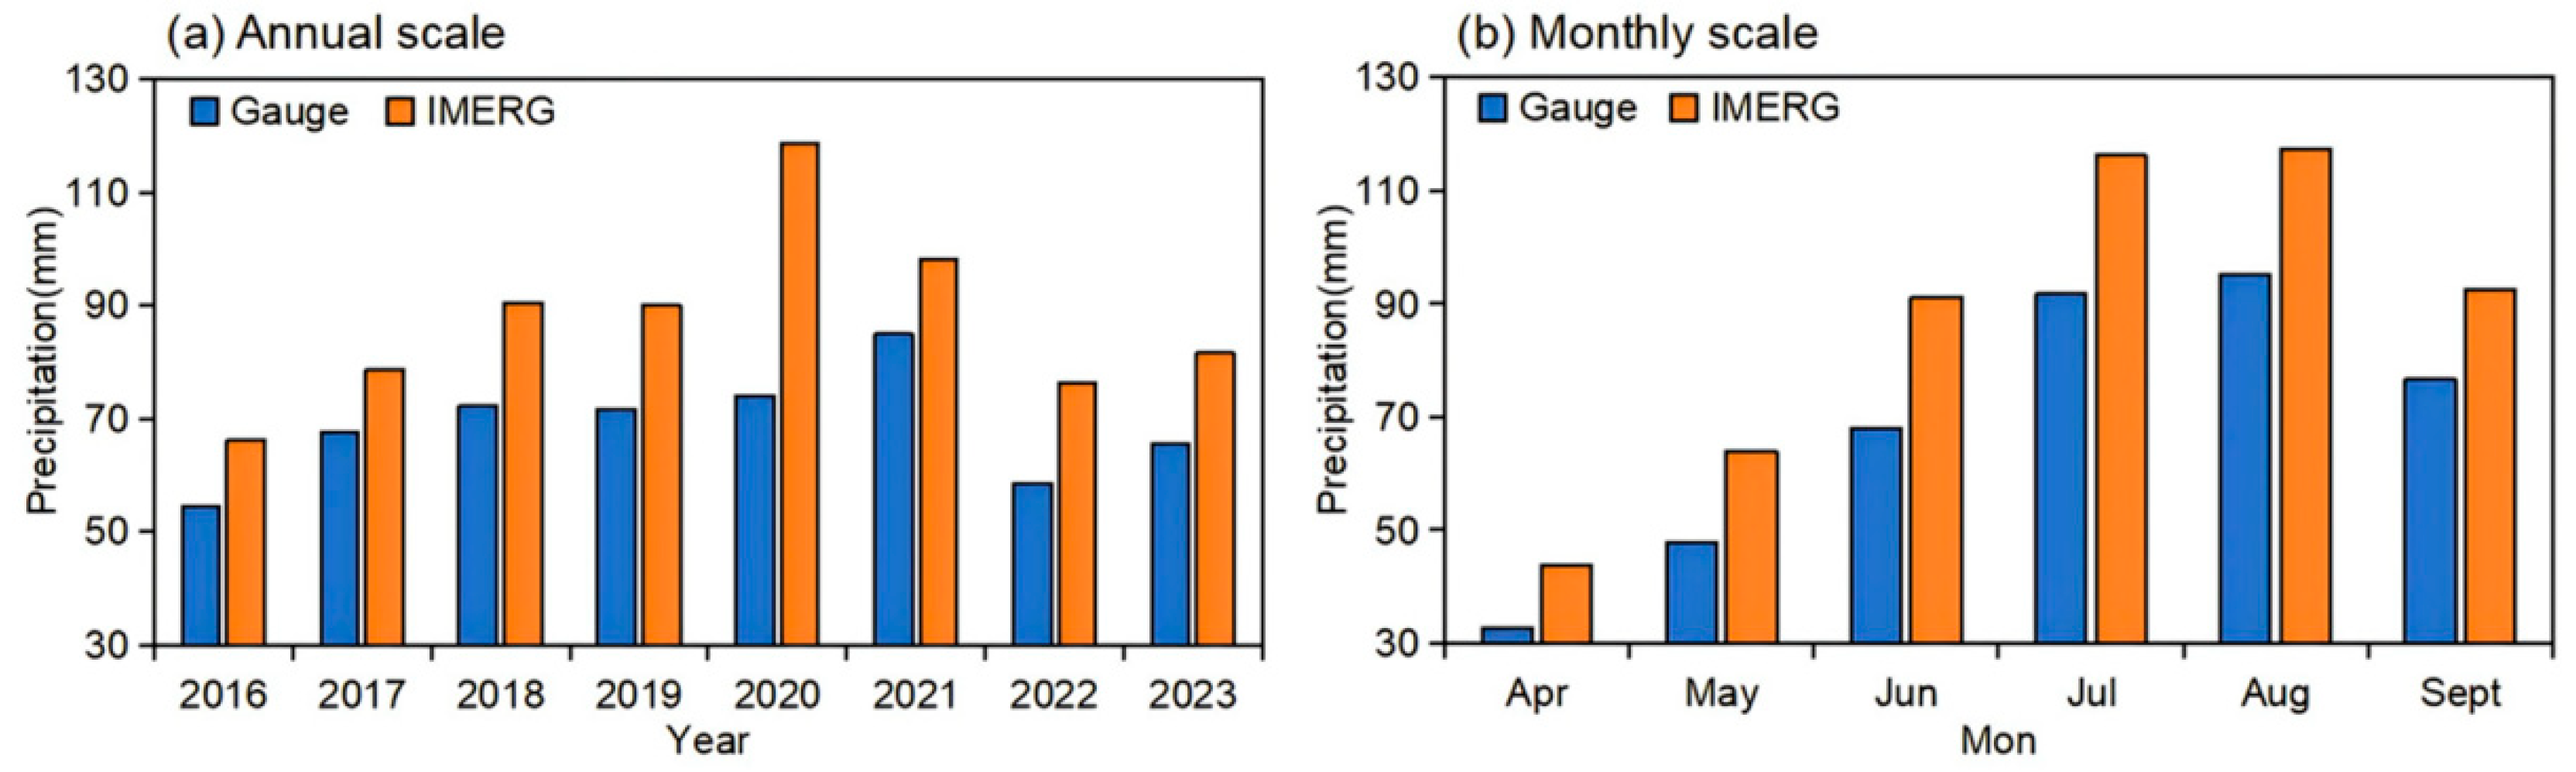
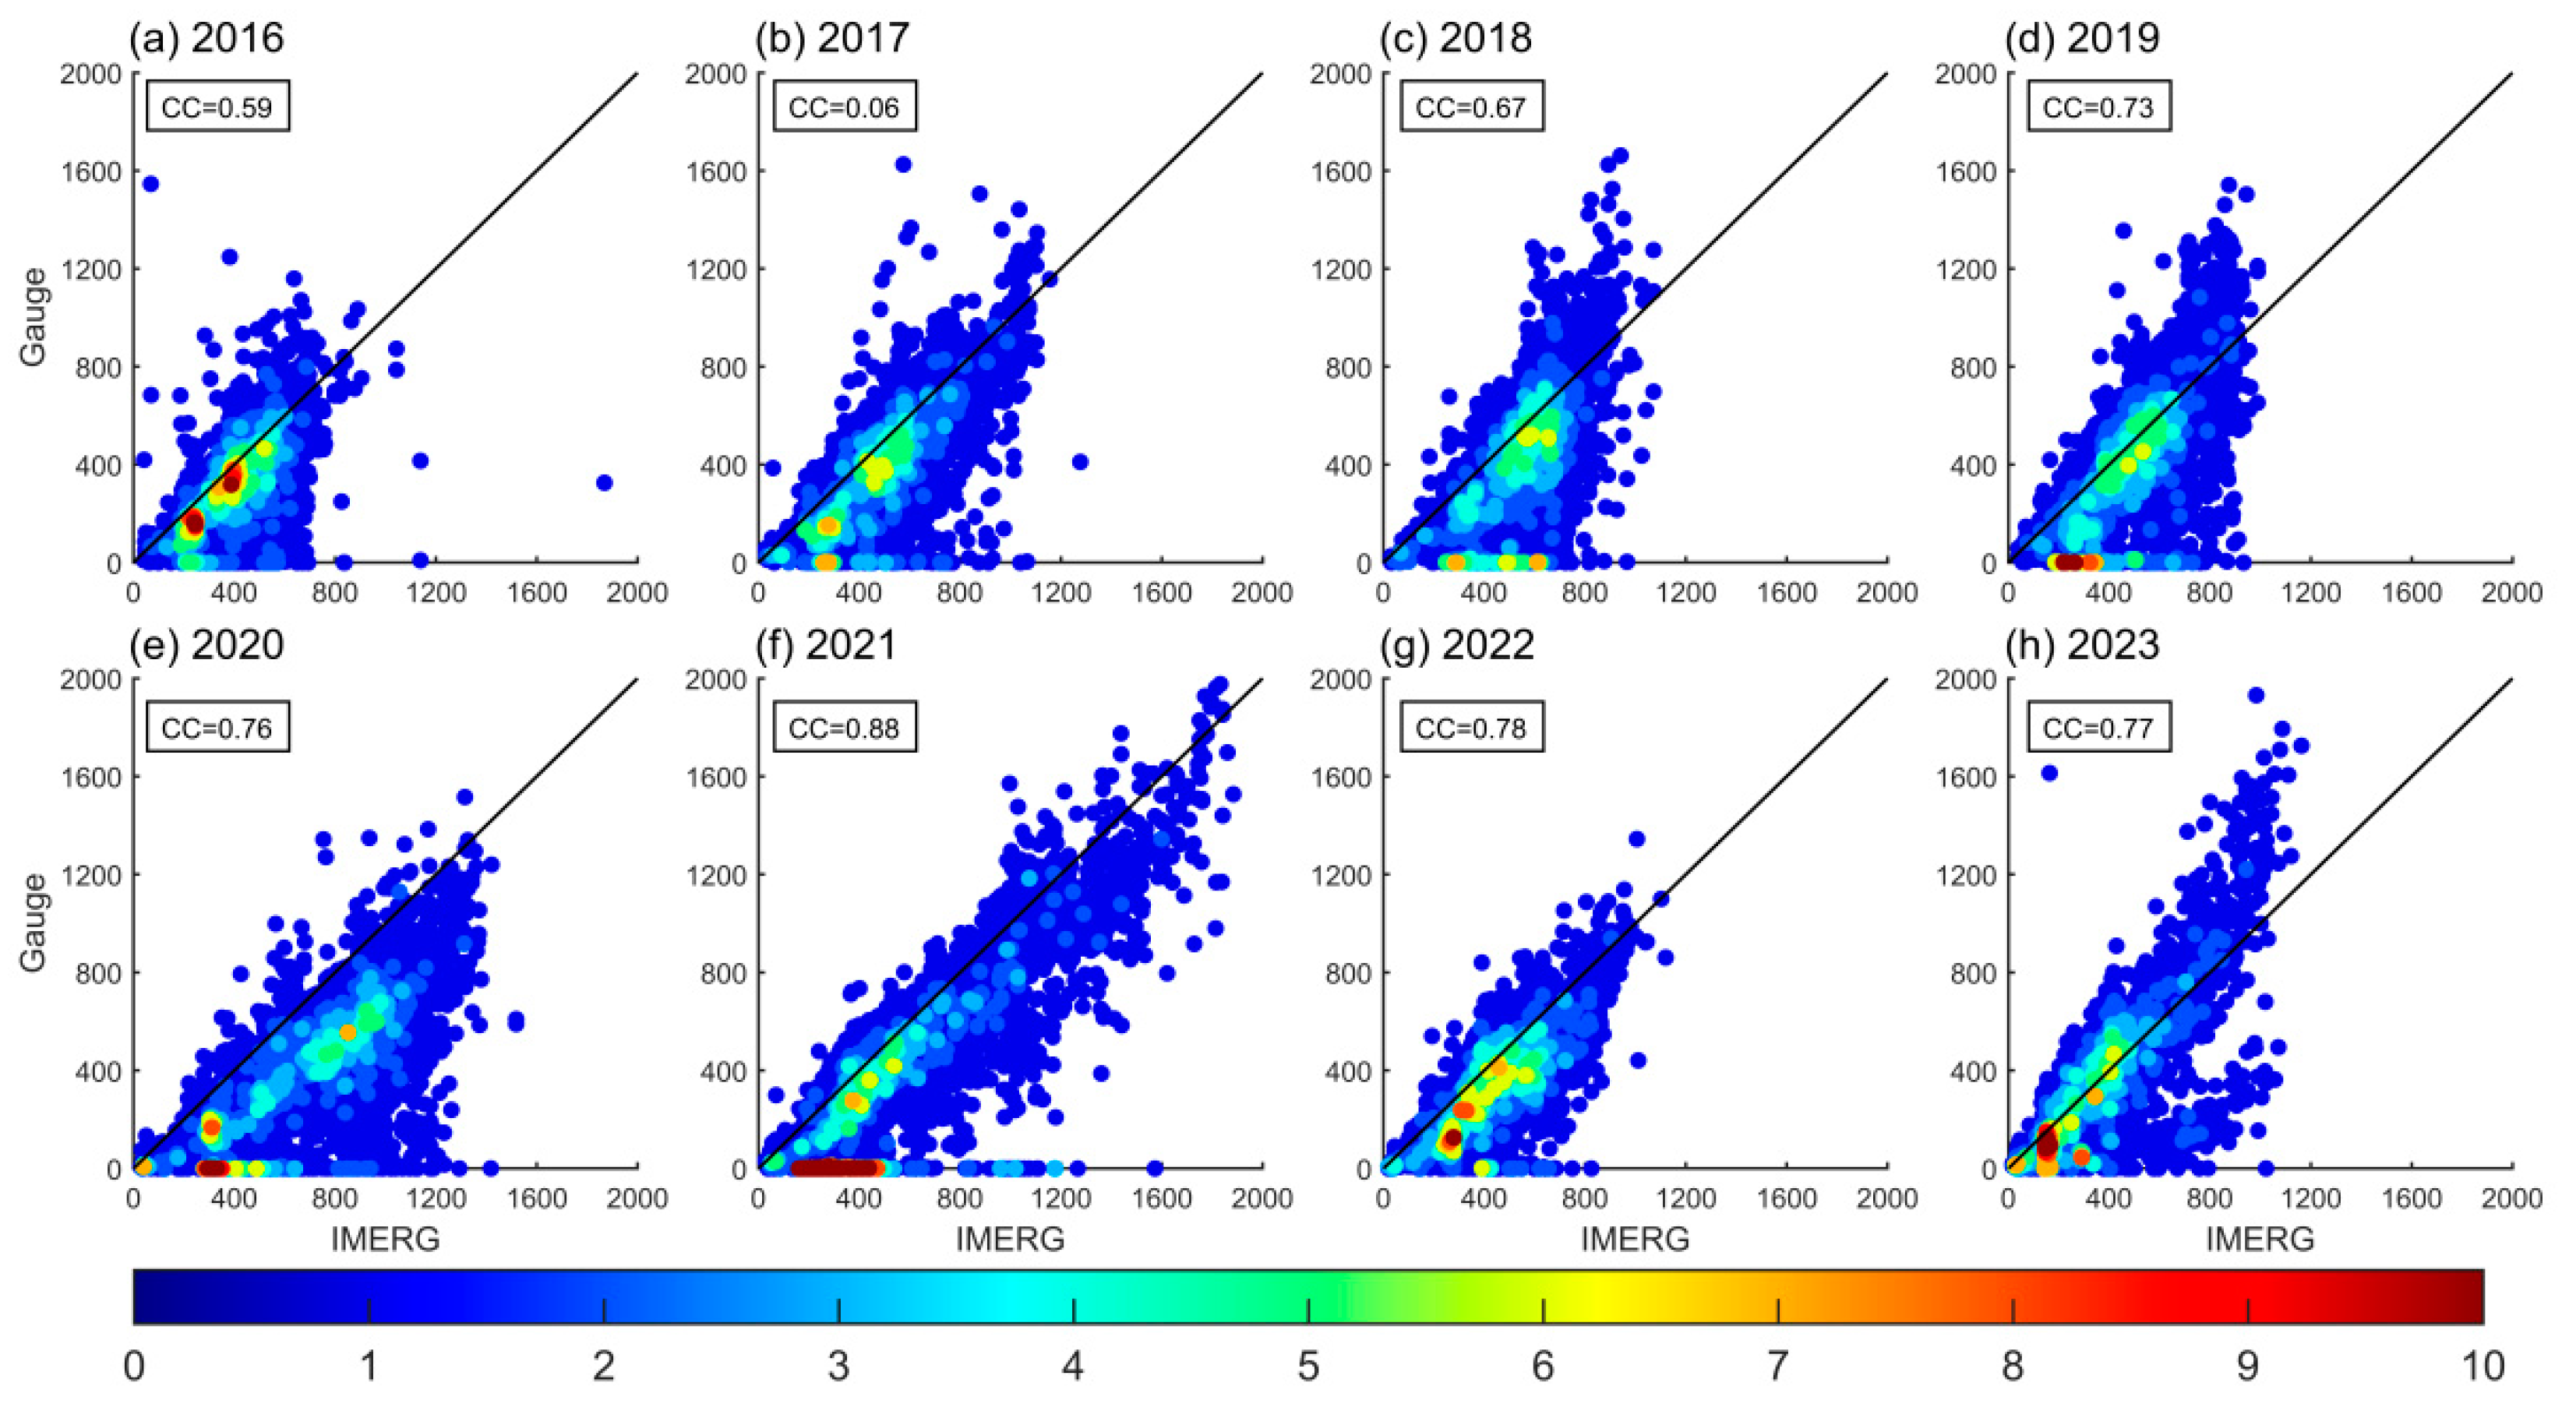
3.2. Annual Precipitation
3.3. Monthly Precipitation
3.4. Daily Precipitation
3.5. Precipitation at Different Intensities
4. Discussion
5. Conclusions
- (1)
- Precipitation in the Northwest region shows a spatial distribution pattern characterized by low precipitation in the northwest and high precipitation in the southeast. IMERG precipitation effectively captures this spatial distribution trend across different scales and can also generally reflect the climatological characteristic of precipitation in different years and months.
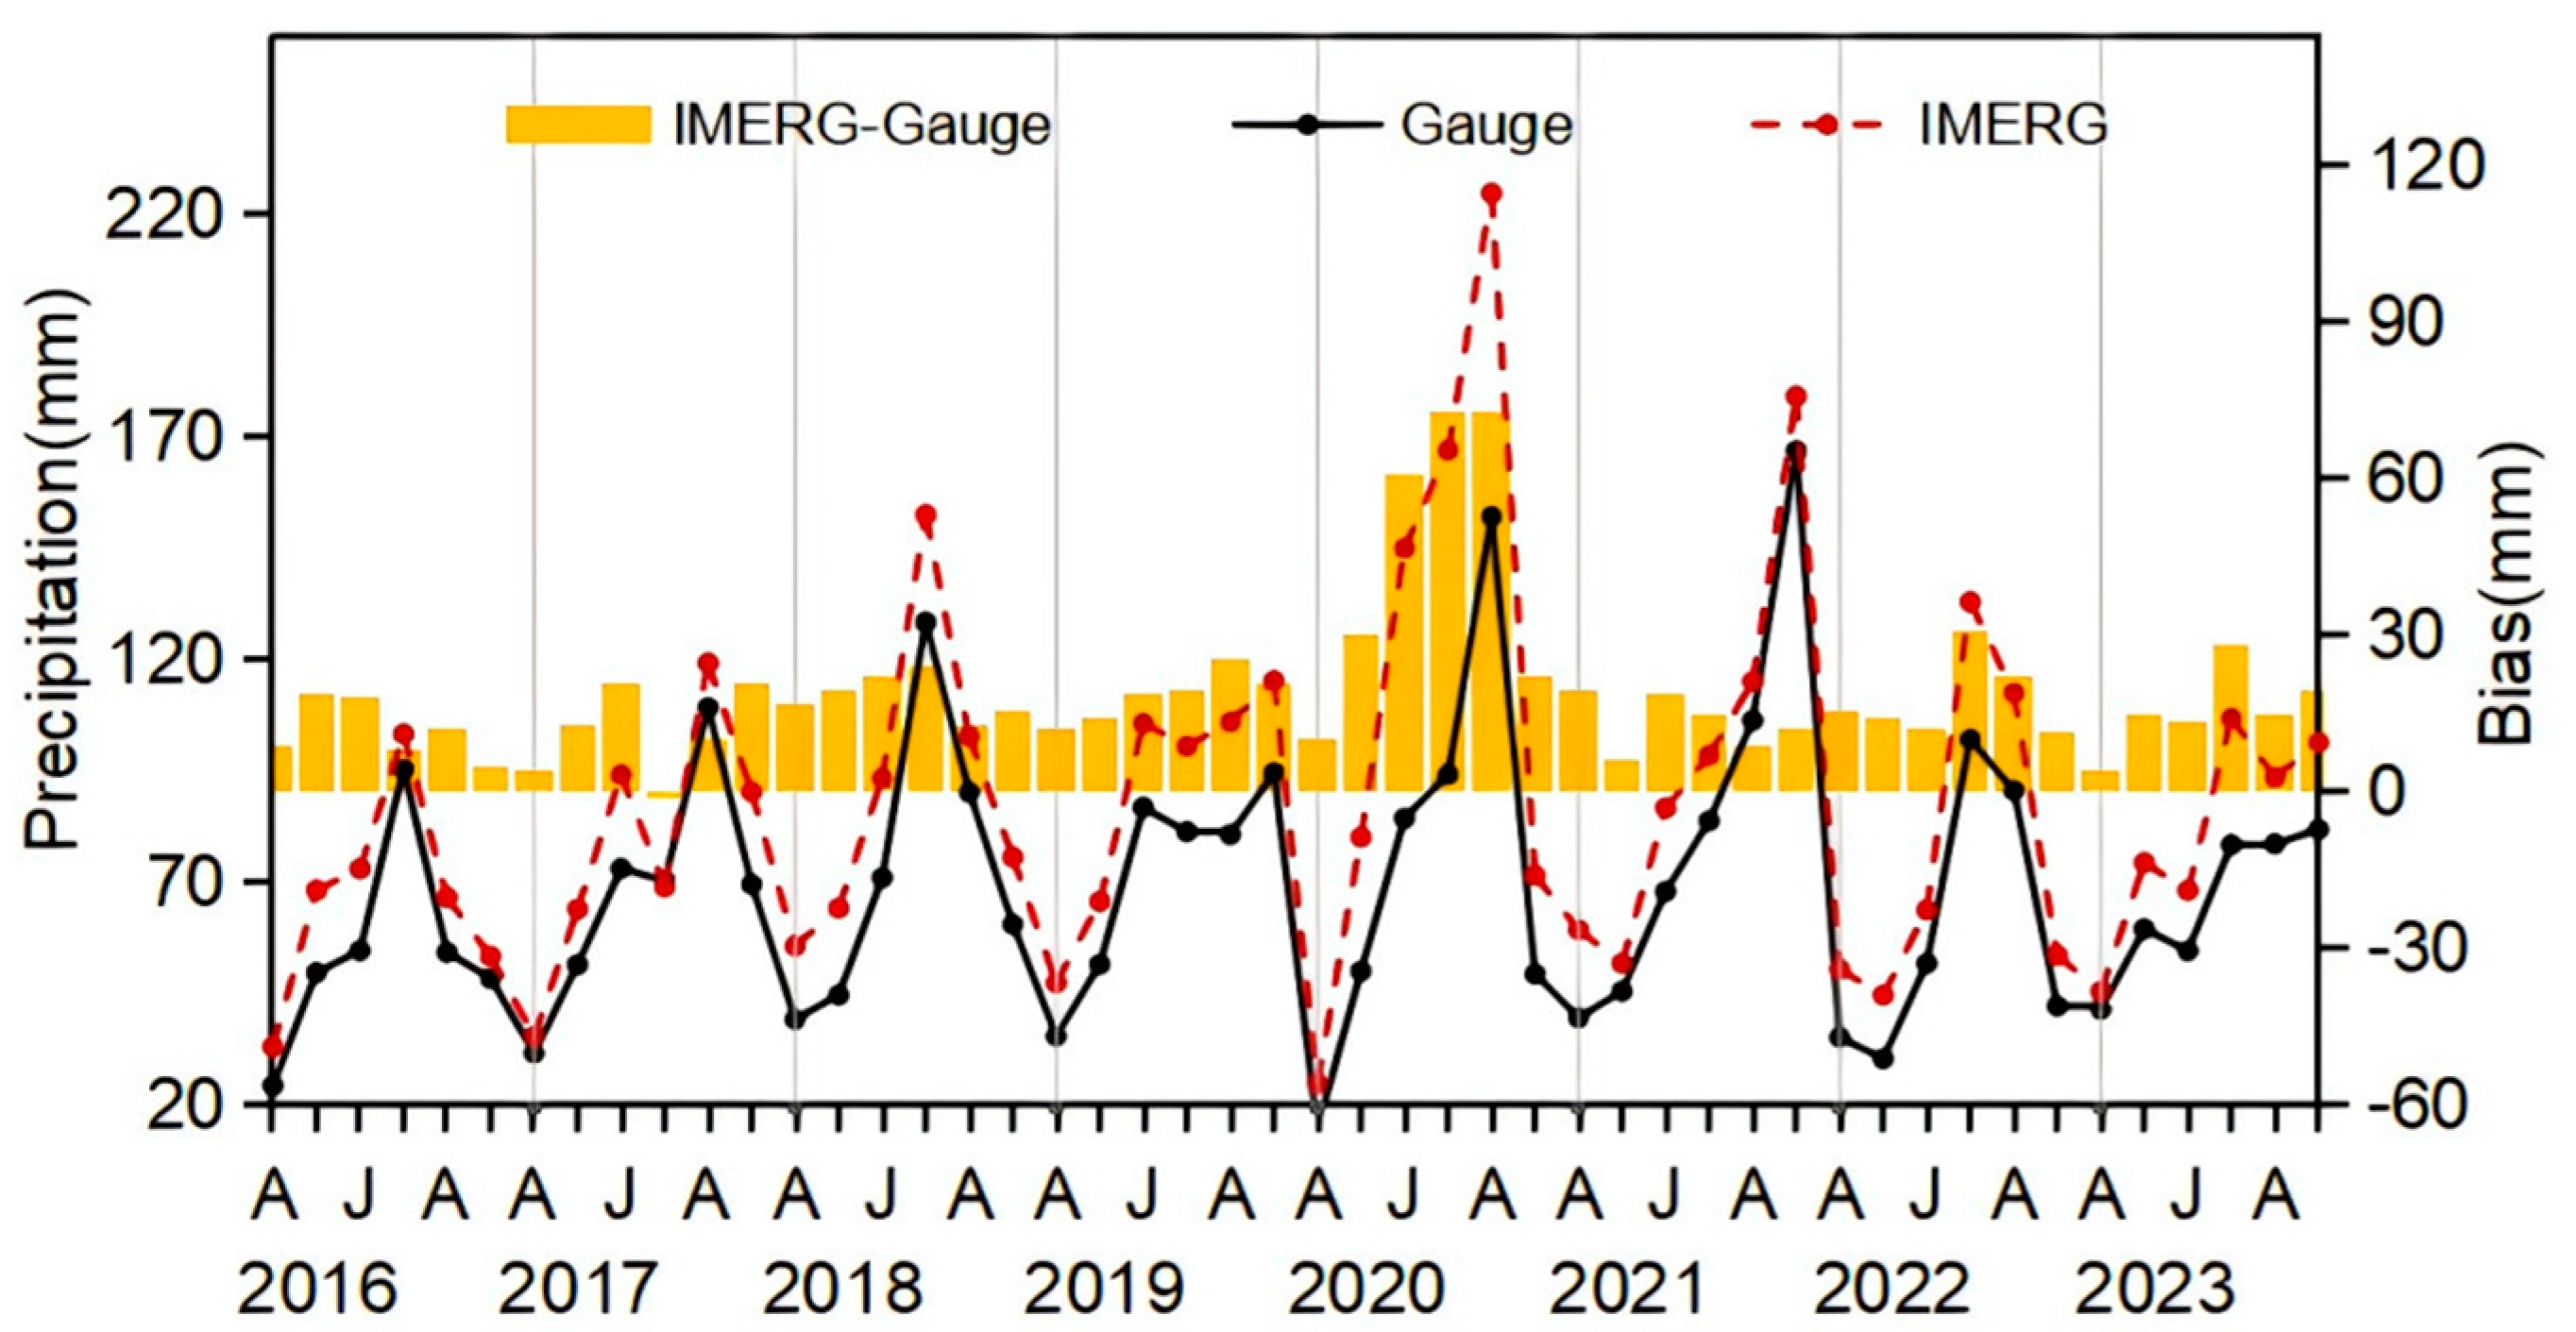
- (2)
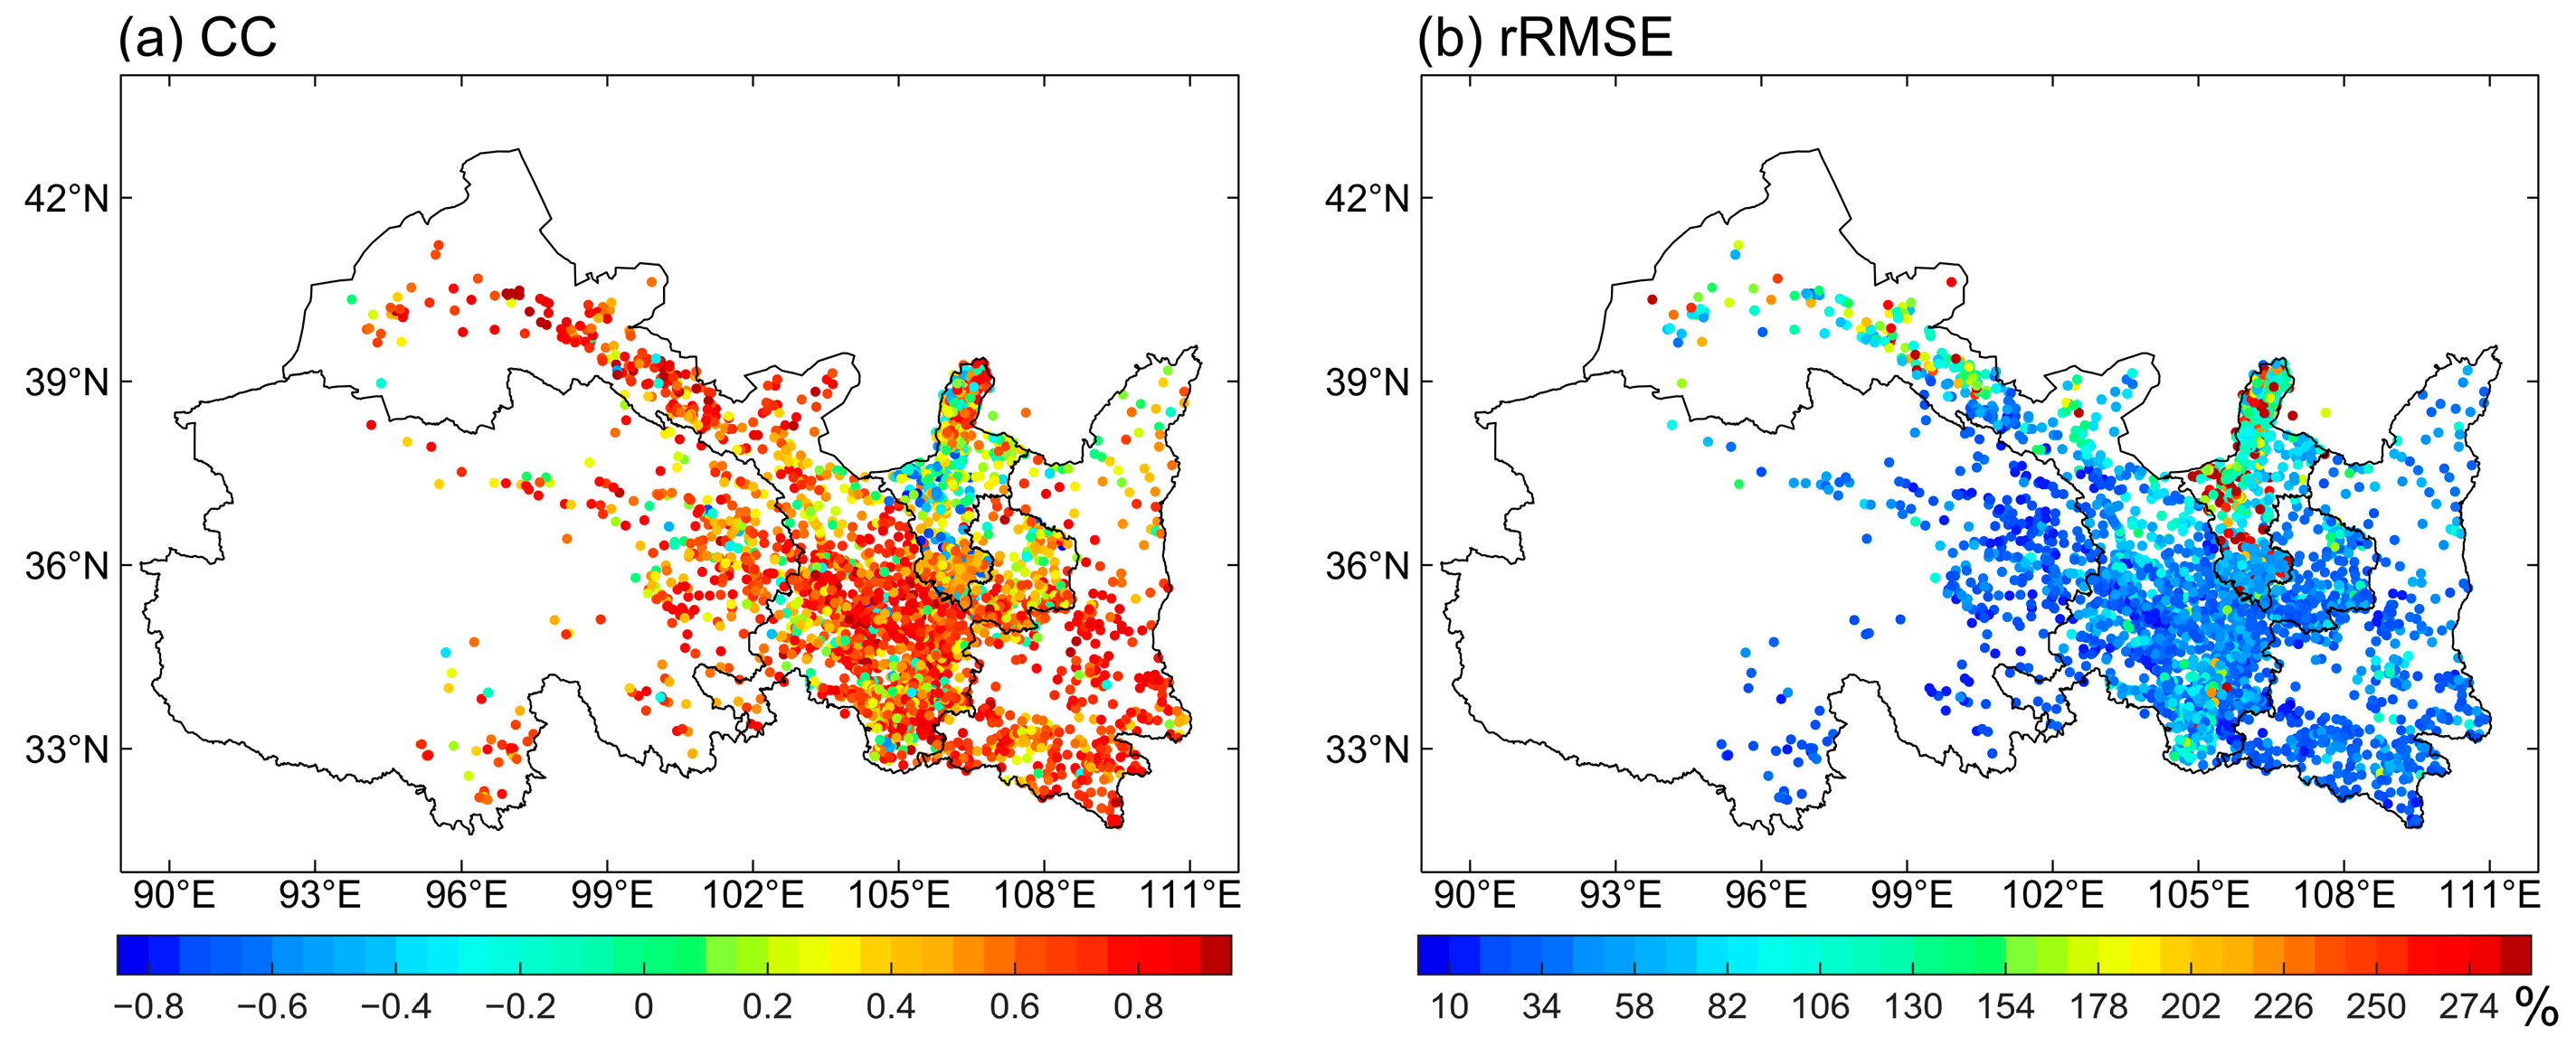
- The evaluation results at the climatological, annual, and monthly scales show a high correlation between IMERG precipitation and observed ground-based precipitation. However, there is a consistent overestimation of precipitation, with the largest bias occurring in July and August, and April being closest to the observed data. The areas with the largest bias are concentrated in southeastern regions. Furthermore, IMERG precipitation tends to overestimate light precipitation more significantly and underestimate heavy precipitation, with considerable instability in detecting high-intensity rainfall events. Given the significant errors in IMERG during July and August, empirical bias correction is necessary for operational applications. For example, regional correction models based on ground observations can be developed to enhance their monitoring capability for summer heavy precipitation. In areas with complex terrain, such as southeastern Gansu, southern Shaanxi, and eastern Qinghai, multi-source data fusion combining radar, automatic weather station data, and numerical model forecasts should be implemented to improve the reliability of heavy precipitation estimation.
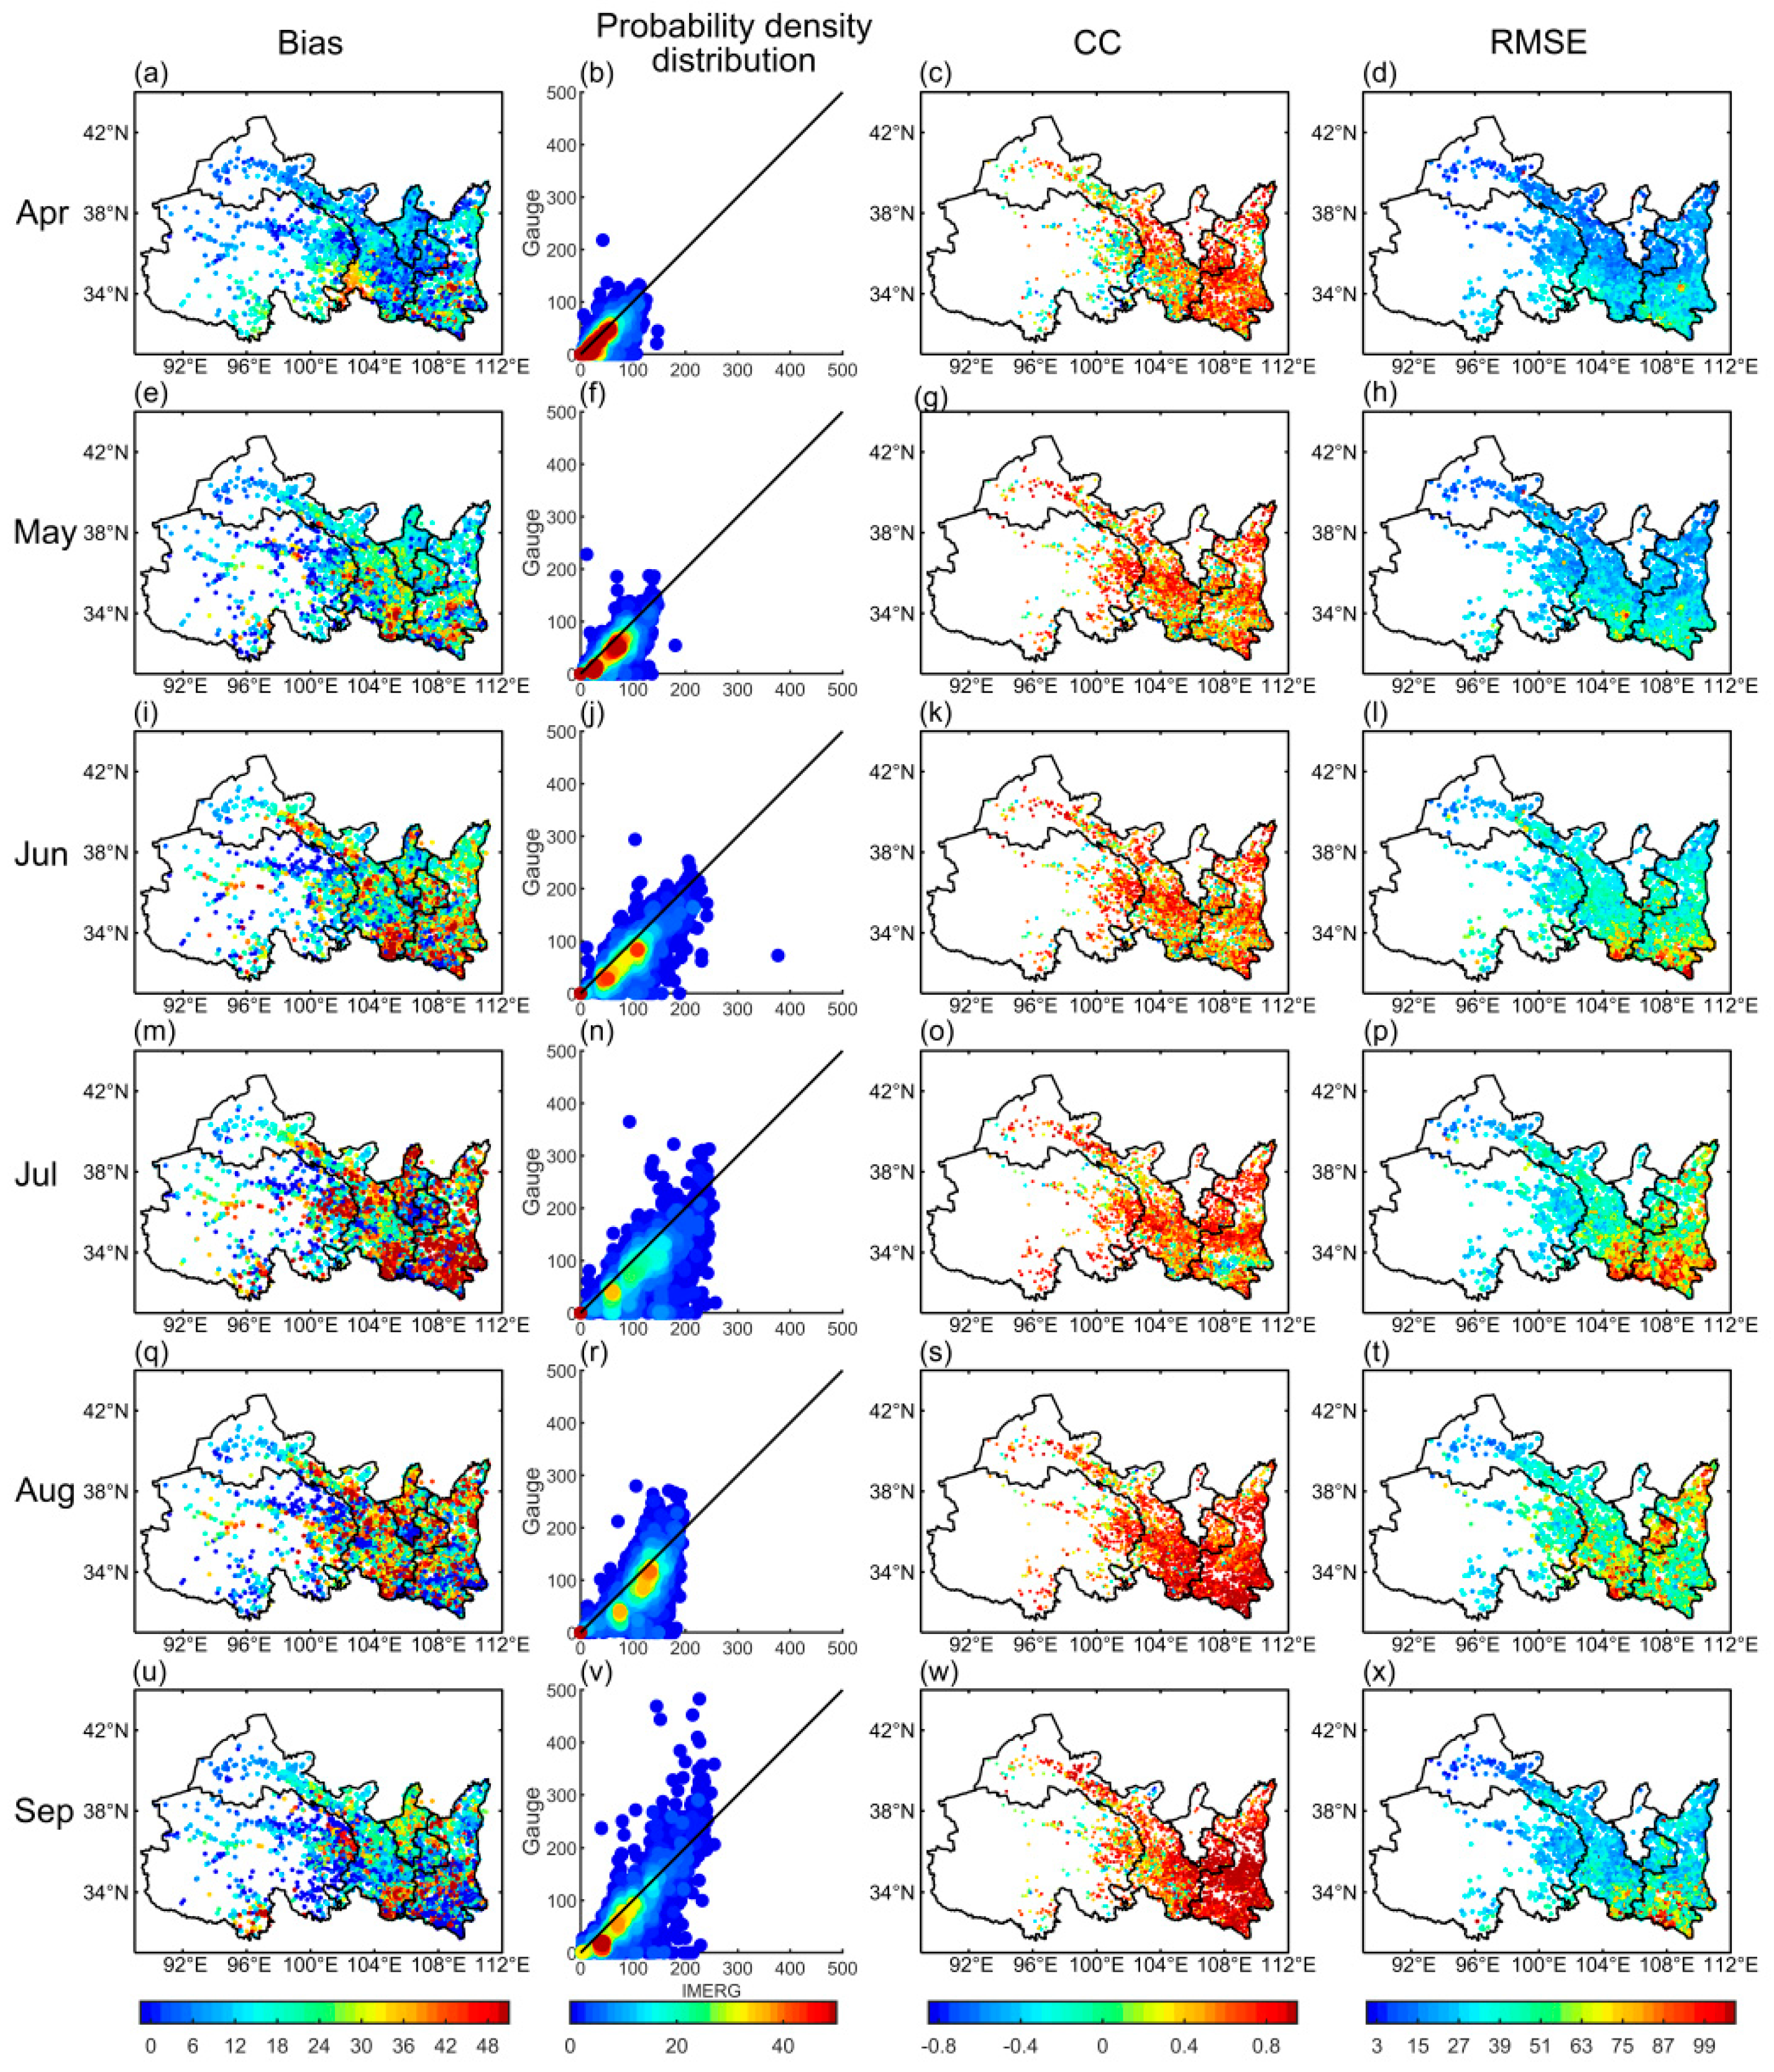
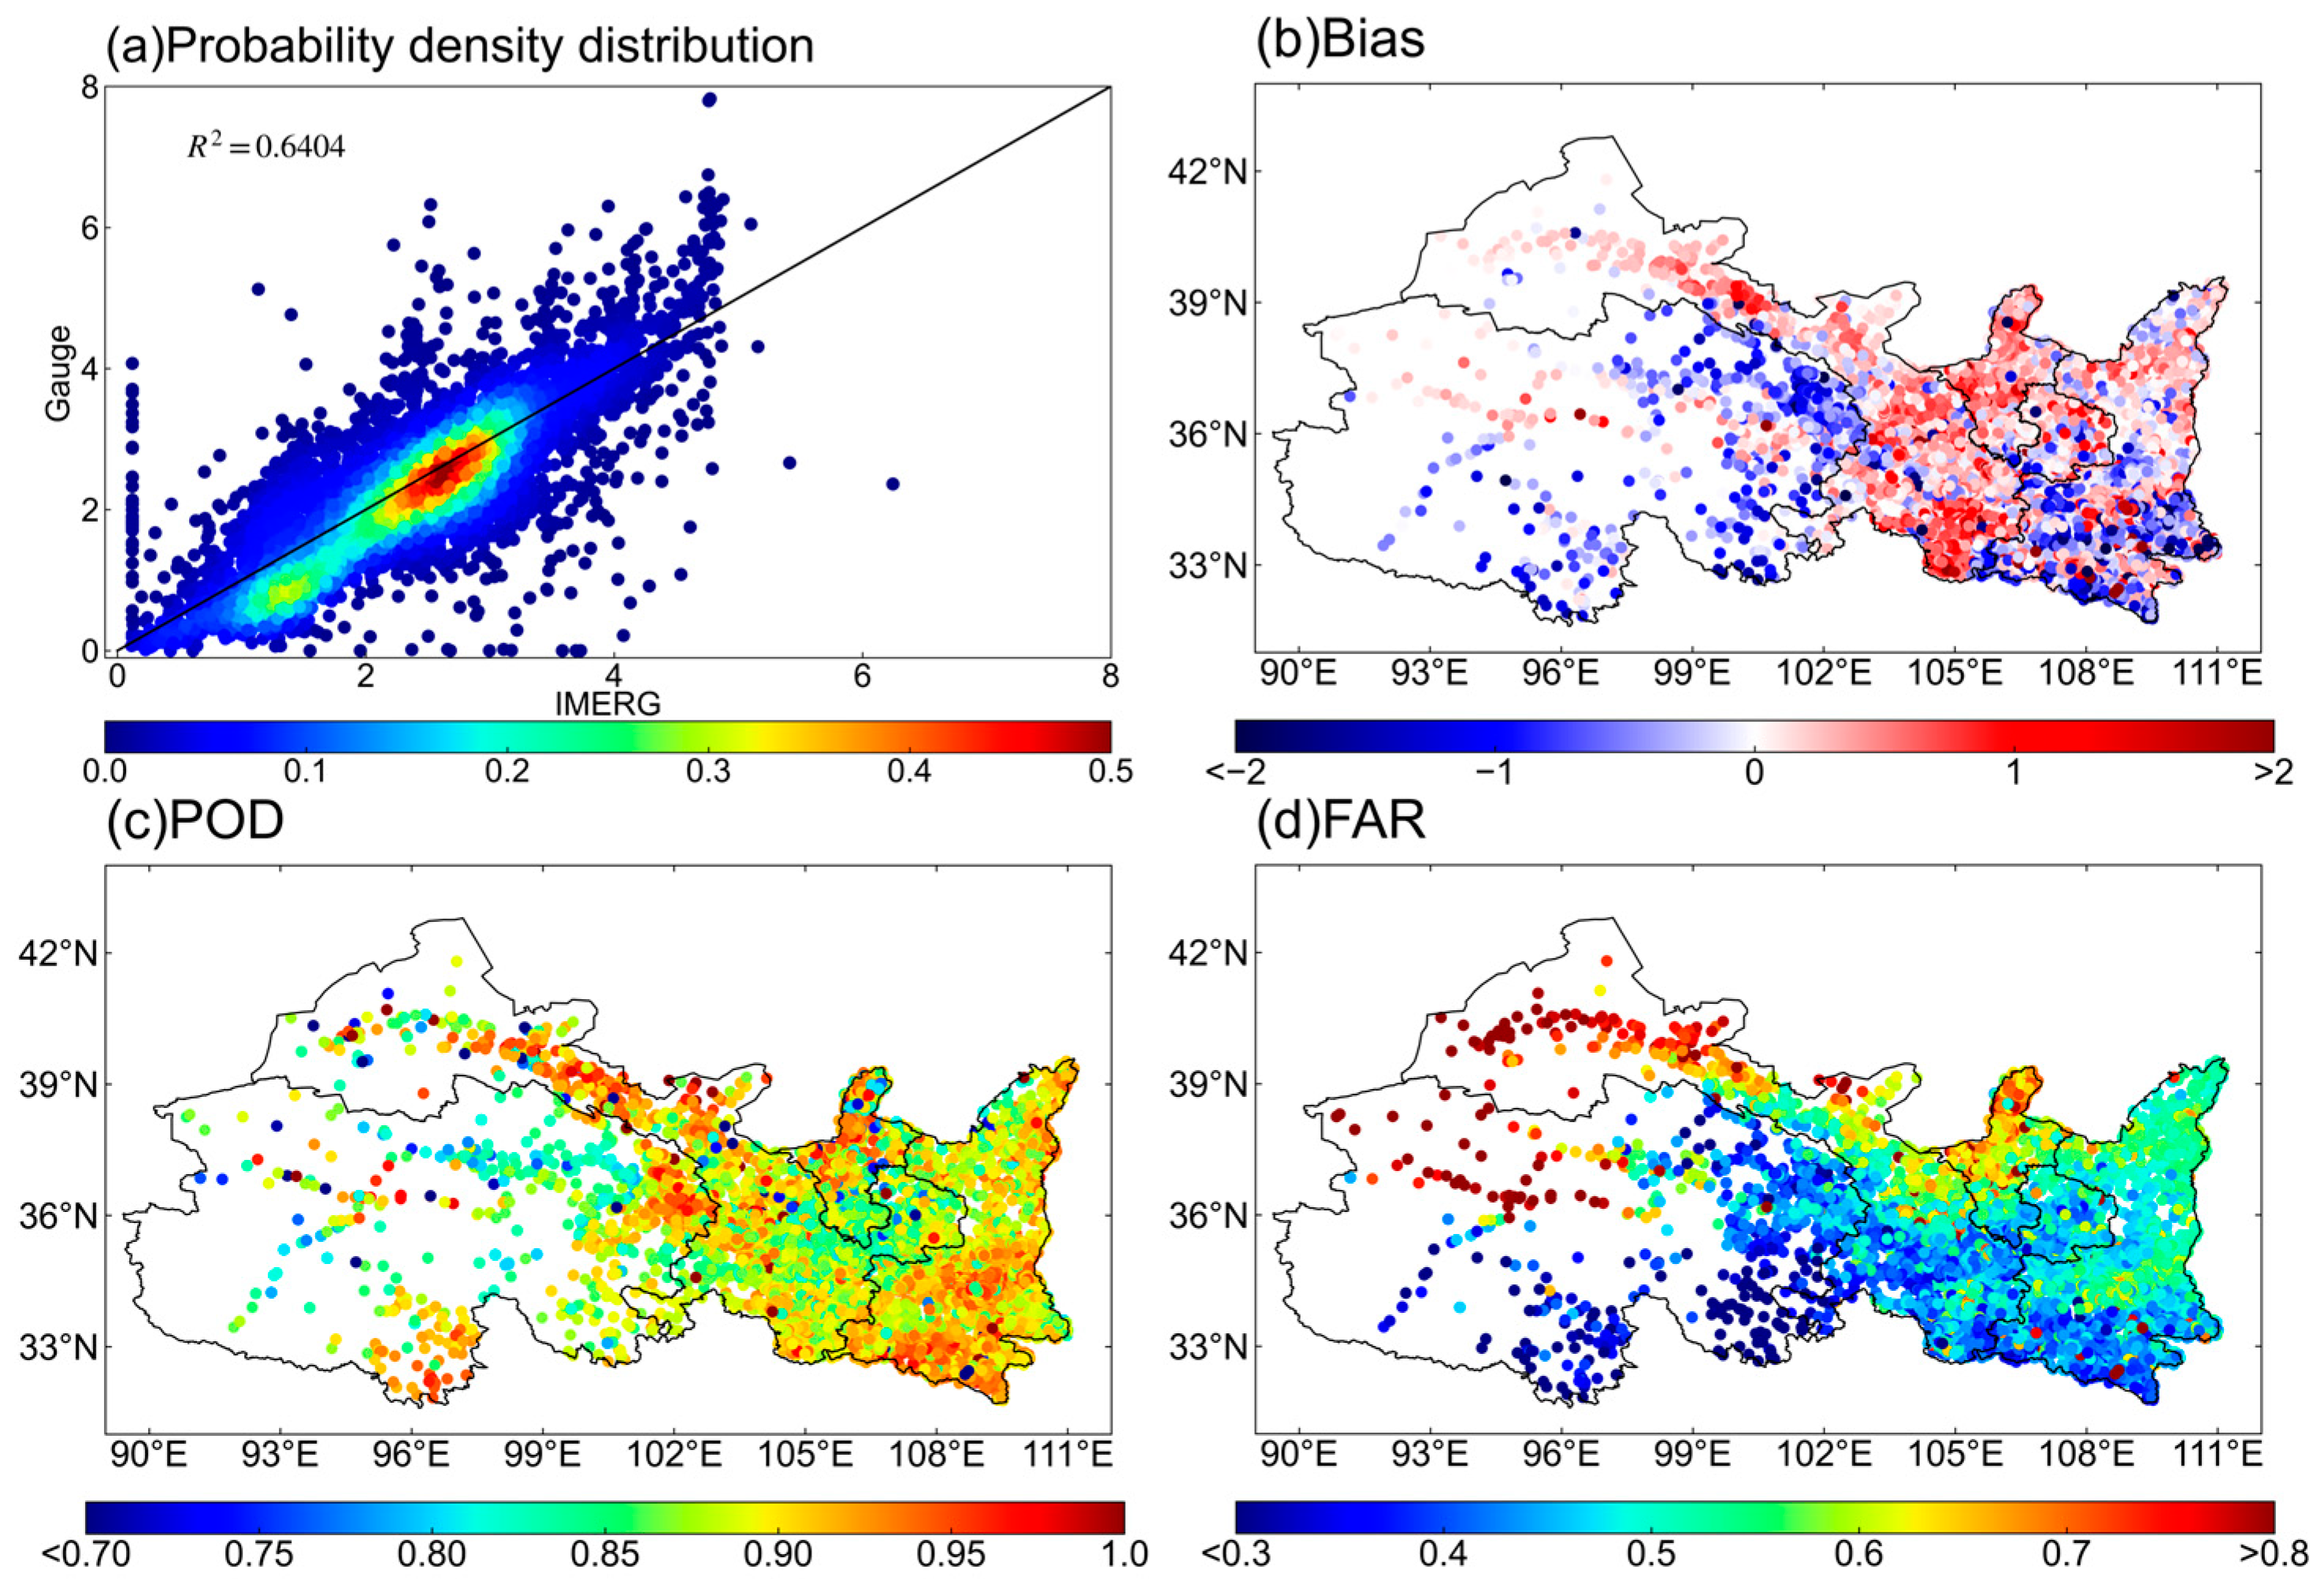
- (3)
- At the daily scale, IMERG precipitation significantly underestimates precipitation in most of Qinghai, southeastern Gansu, the plateau edge, southern Ningxia, and southern Shaanxi, while overestimating precipitation in western Gansu, central and southern Gansu, northern Ningxia, and the western Shaanxi. IMERG precipitation performs well in detecting daily precipitation events, showing high POD (>0.9) and low FAR (0.3–0.45) in eastern and southern Qinghai, central Gansu, southern Gansu, plateau edge regions, and southern Shaanxi. In April, the POD is the lowest (0.72), and FAR is the highest (0.7), while in June, the POD is the highest (0.87), and in August, the FAR is the lowest (0.47).
- (4)
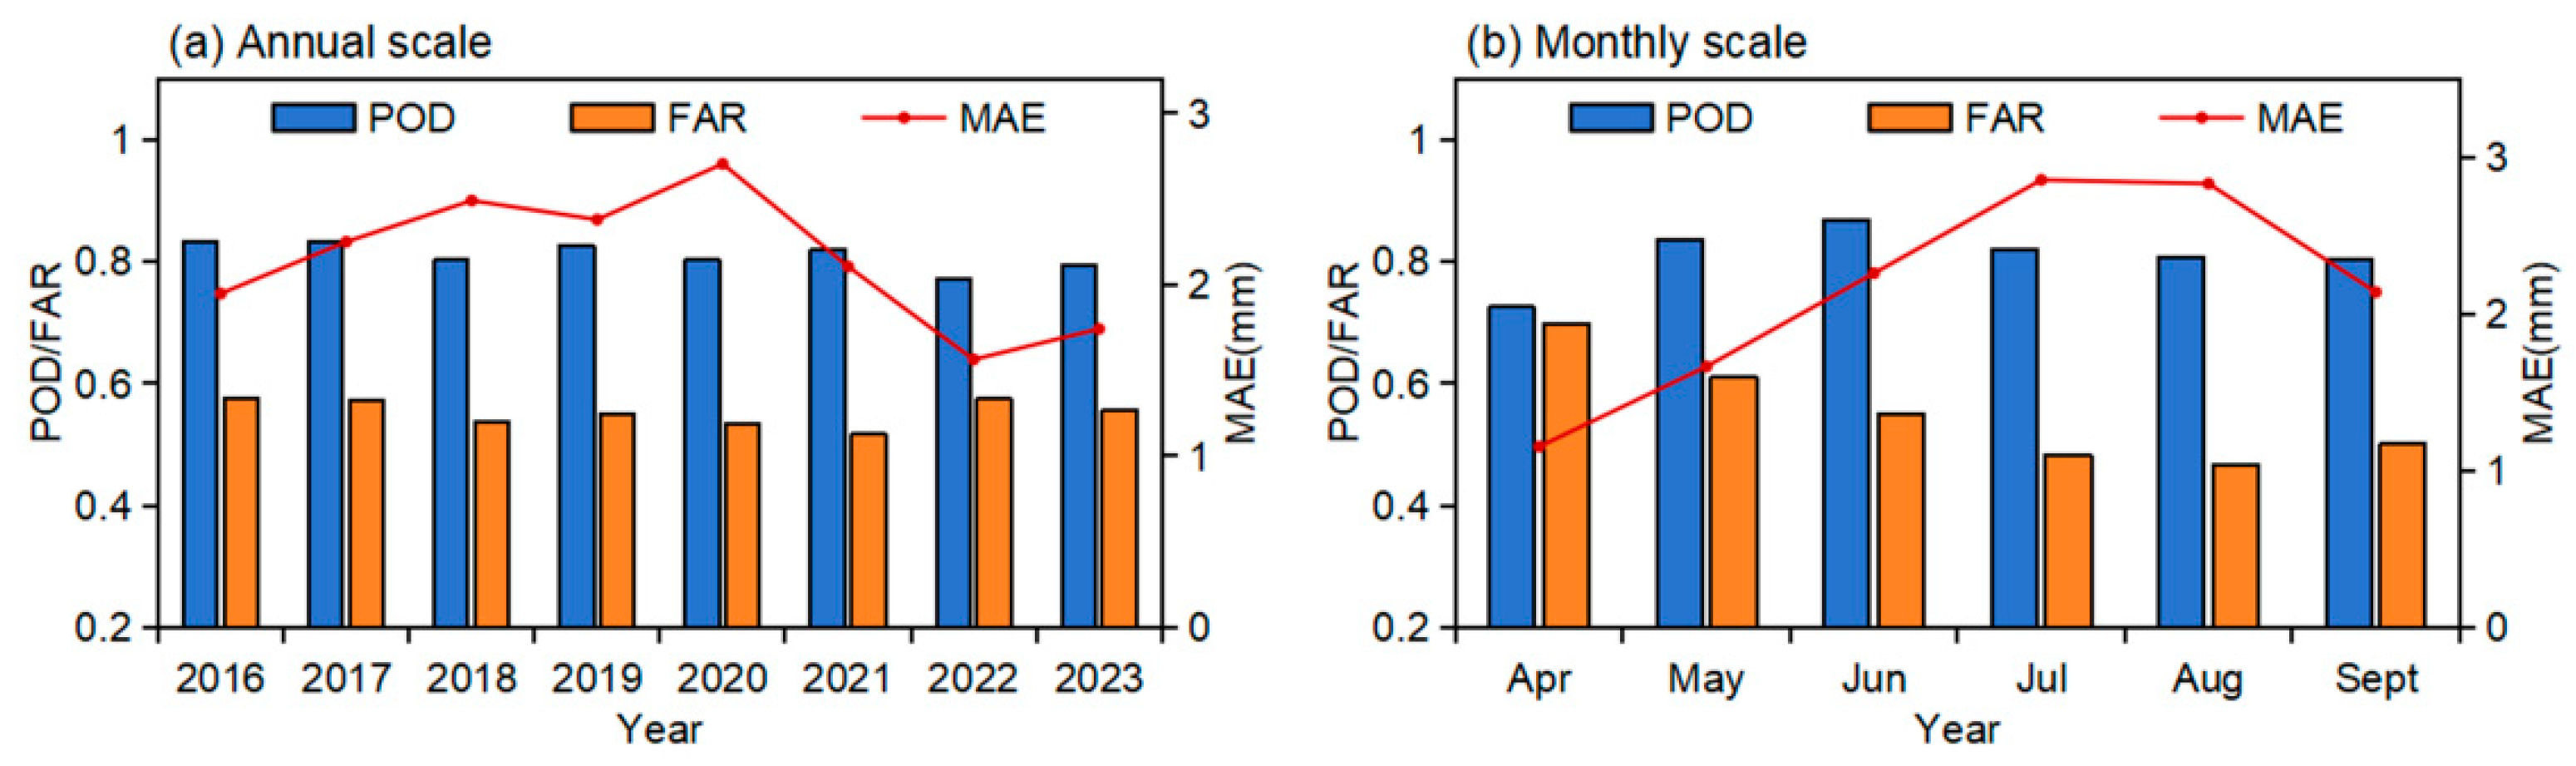
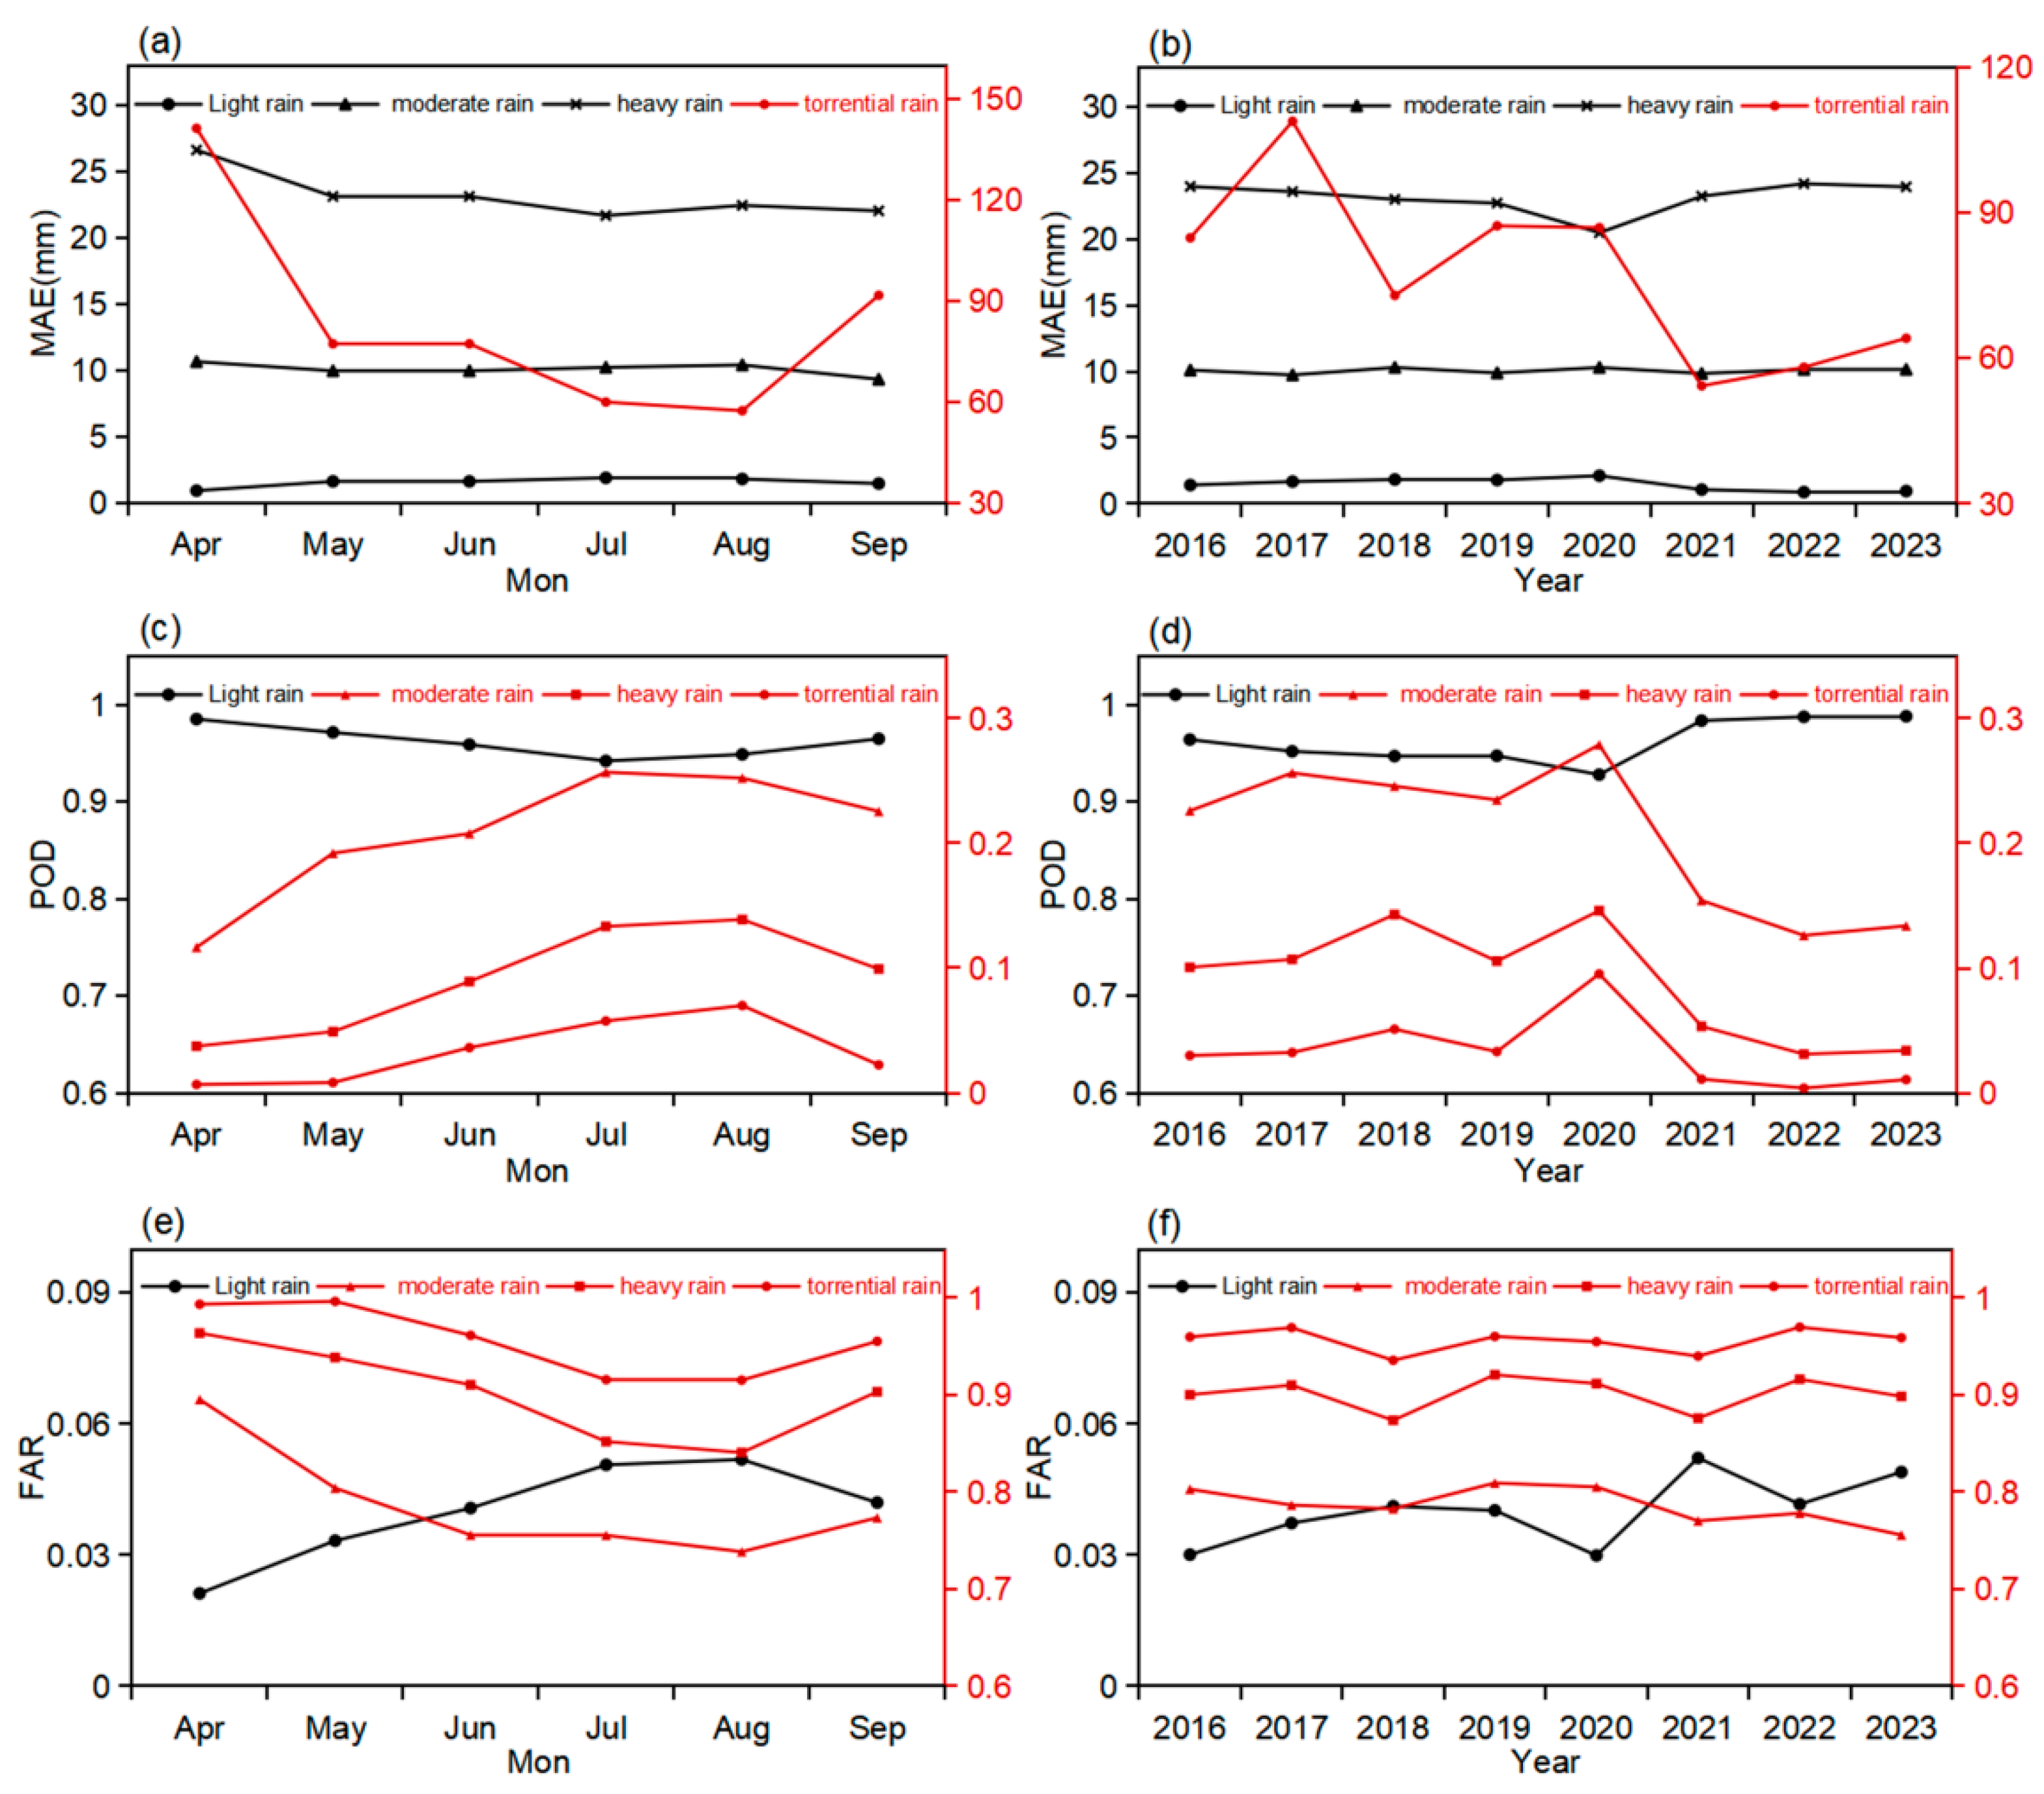
- The evaluation of the performance of IMERG precipitation at different precipitation intensities shows a clear overestimation of light precipitation and an underestimation of higher-intensity rainfalls. IMERG precipitation detected more light rain events and significantly overestimated the occurrence of weak precipitation while underestimating the number of heavy and torrential rain days. The MAE for light and moderate rain shows minimal variation over time, while for heavy and torrential rain, the MAE is highest in April and lowest in July and August. The POD and FAR for light rain are both high, and their biases are primarily due to a significant overestimation of weak precipitation intensity and frequency. As precipitation intensity increases, the POD decreases sharply, and the FAR increases significantly. IMERG precipitation shows the highest detection accuracy for light rain but exhibits considerable uncertainty in detecting torrential rain events. For different precipitation events, it is recommended to introduce machine learning methods to optimize the false alarm rate for light rain. For heavy rain and torrential rain, quantitative precipitation correction should be performed based on meteorological station data to enhance the accuracy of precipitation estimation.
Author Contributions
Funding
Data Availability Statement
Acknowledgments
Conflicts of Interest
References
- Allen, M.R.; Ingram, W.J. Constraints on Future Changes in Climate and the Hydrologic Cycle. Nature 2002, 419, 224–232. [Google Scholar] [CrossRef] [PubMed]
- Chen, S.; Hong, Y.; Cao, Q.; Gourley, J.J.; Kirstetter, P.-E.; Yong, B.; Tian, Y.; Zhang, Z.; Shen, Y.; Hu, J.; et al. Similarity and Difference of the Two Successive V6 and V7 TRMM Multisatellite Precipitation Analysis Performance over China. J. Geophys. Res. Atmos. 2013, 118, 13060–13074. [Google Scholar] [CrossRef]
- Sui, X.; Xu, Q.; Tao, H.; Zhu, B.; Li, G.; Zhang, Z. Vegetation Dynamics and Recovery Potential in Arid and Semi-Arid Northwest China. Plants 2024, 13, 3412. [Google Scholar] [CrossRef]
- Ren, X.; Hou, P.; Ma, Y.; Ma, R.; Wang, J.; Xie, L. Analysis of Vegetation Changes and Driving Factors on the Qinghai-Tibet Plateau from 2000 to 2022. Forests 2024, 15, 2188. [Google Scholar] [CrossRef]
- Wang, Y.; Zhang, W.; Zhang, P.; Tang, L.; Huang, Y.; Feng, N. Spatial and Temporal Variations of Precipitation in Northwest China during 1973-2019. Theor. Appl. Clim. 2024, 155, 4347–4356. [Google Scholar] [CrossRef]
- Ge, Q.; Zheng, J.; Hao, Z.; Liu, H. General Characteristics of Climate Changes during the Past 2000 Years in China. Sci. China Earth Sci. 2013, 56, 321–329. [Google Scholar] [CrossRef]
- Mehta, P. The Impact of Climate Change on the Environment, Water Resources, and Agriculture: A Comprehensive Review. In Climate, Environment and Agricultural Development: A Sustainable Approach Towards Society; Springer: Berlin/Heidelberg, Germany, 2024; pp. 189–201. [Google Scholar]
- Wang, Z.; Li, Z.; Zhan, H.; Yang, S. Effect of Long-Term Saline Mulched Drip Irrigation on Soil-Groundwater Environment in Arid Northwest China. Sci. Total Environ. 2022, 820, 153222. [Google Scholar] [CrossRef]
- Lee, J.; Kim, S.; Jun, H. A Study of the Influence of the Spatial Distribution of Rain Gauge Networks on Areal Average Rainfall Calculation. Water 2018, 10, 1635. [Google Scholar] [CrossRef]
- Kumari, M.; Singh, C.K.; Bakimchandra, O.; Basistha, A. Geographically Weighted Regression Based Quantification of Rainfall–Topography Relationship and Rainfall Gradient in Central Himalayas. Int. J. Climatol. 2017, 37, 1299–1309. [Google Scholar] [CrossRef]
- Ranhao, S.; Baiping, Z.; Jing, T. A Multivariate Regression Model for Predicting Precipitation in the Daqing Mountains. MRED 2008, 28, 318–325. [Google Scholar] [CrossRef]
- Kidd, C.; Takayabu, Y.N.; Skofronick-Jackson, G.M.; Huffman, G.J.; Braun, S.A.; Kubota, T.; Turk, F.J. The Global Precipitation Measurement (GPM) Mission. In Satellite Precipitation Measurement: Volume 1; Levizzani, V., Kidd, C., Kirschbaum, D.B., Kummerow, C.D., Nakamura, K., Turk, F.J., Eds.; Springer International Publishing: Cham, Switzerland, 2020; pp. 3–23. ISBN 978-3-030-24568-9. [Google Scholar]
- Ouatiki, H.; Boudhar, A.; Chehbouni, A. Accuracy Assessment and Bias Correction of Remote Sensing–Based Rainfall Products over Semiarid Watersheds. Theor. Appl. Clim. 2023, 154, 763–780. [Google Scholar] [CrossRef]
- Pan, X.; Wu, H.; Chen, S.; Nanding, N.; Huang, Z.; Chen, W.; Li, C.; Li, X. Evaluation and Applicability Analysis of GPM Satellite Precipitation over Mainland China. Remote Sens. 2023, 15, 2866. [Google Scholar] [CrossRef]
- Dubovik, O.; Schuster, G.L.; Xu, F.; Hu, Y.; Bösch, H.; Landgraf, J.; Li, Z. Grand Challenges in Satellite Remote Sensing. Front. Remote Sens. 2021, 2, 619818. [Google Scholar] [CrossRef]
- Kolster, M.E.; Wigh, M.D.; Lima Simões da Silva, E.; Bjerg Vilhelmsen, T.; Døssing, A. High-Speed Magnetic Surveying for Unexploded Ordnance Using UAV Systems. Remote Sens. 2022, 14, 1134. [Google Scholar] [CrossRef]
- Lasmono, F.; Risyanto; Nauval, F.; Saufina, E.; Trismidianto; Harjana, T. Satellite Rainfall Estimation from Himawari-8 Multi Channels Observation Based on AWS Data Trained Machine Learning Methods. In Proceedings of the International Conference on Radioscience, Equatorial Atmospheric Science and Environment and Humanosphere Science, 2021; Yulihastin, E., Abadi, P., Sitompul, P., Harjupa, W., Eds.; Springer Nature: Singapore, 2022; pp. 495–506. [Google Scholar]
- Lu, H.; Ding, L.; Ma, Z.; Li, H.; Lu, T.; Su, M.; Xu, J. Spatiotemporal Assessments on the Satellite-Based Precipitation Products From Fengyun and GPM Over the Yunnan-Kweichow Plateau, China. Earth Space Sci. 2020, 7, e2019EA000857. [Google Scholar] [CrossRef]
- Wu, H.; Yong, B.; Shen, Z. Spatial Reconstruction of Quantitative Precipitation Estimates Derived from Fengyun-2G Geostationary Satellite in Northeast China. Remote Sens. 2023, 15, 5251. [Google Scholar] [CrossRef]
- Prigent, C. Precipitation Retrieval from Space: An Overview. Comptes Rendus Geosci. 2010, 342, 380–389. [Google Scholar] [CrossRef]
- Liu, Z. Comparison of Integrated Multisatellite Retrievals for GPM (IMERG) and TRMM Multisatellite Precipitation Analysis (TMPA) Monthly Precipitation Products: Initial Results. J. Hydrometeorol. 2016, 17, 777–790. [Google Scholar] [CrossRef]
- Smith, E.A.; Asrar, G.; Furuhama, Y.; Ginati, A.; Mugnai, A.; Nakamura, K.; Adler, R.F.; Chou, M.-D.; Desbois, M.; Durning, J.F.; et al. International Global Precipitation Measurement (GPM) Program and Mission: An Overview. In Measuring Precipitation From Space: EURAINSAT and the Future; Levizzani, V., Bauer, P., Turk, F.J., Eds.; Springer: Dordrecht, The Netherlands, 2007; pp. 611–653. ISBN 978-1-4020-5835-6. [Google Scholar]
- Tang, G.; Clark, M.P.; Papalexiou, S.M.; Ma, Z.; Hong, Y. Have Satellite Precipitation Products Improved over Last Two Decades? A Comprehensive Comparison of GPM IMERG with Nine Satellite and Reanalysis Datasets. Remote Sens. Environ. 2020, 240, 111697. [Google Scholar] [CrossRef]
- Jiang, Q.; Li, W.; Fan, Z.; He, X.; Sun, W.; Chen, S.; Wen, J.; Gao, J.; Wang, J. Evaluation of the ERA5 reanalysis precipitation dataset over Chinese Mainland. J. Hydrol. 2021, 595, 125660. [Google Scholar] [CrossRef]
- Mahmoud, M.T.; Mohammed, S.A.; Hamouda, M.A.; Dal Maso, M.; Mohamed, M.M. Performance of the IMERG Precipitation Products over High-Latitudes Region of Finland. Remote Sens. 2021, 13, 2073. [Google Scholar] [CrossRef]
- Meng, C.; Mo, X.; Liu, S.; Hu, S. Extensive Evaluation of IMERG Precipitation for Both Liquid and Solid in Yellow River Source Region. Atmos. Res. 2021, 256, 105570. [Google Scholar] [CrossRef]
- Lv, P.; Wu, G. The Performance of GPM IMERG Product Validated on Hourly Observations over Land Areas of Northern Hemisphere. Remote Sens. 2024, 16, 4334. [Google Scholar] [CrossRef]
- Xiong, W.; Tang, G.; Wang, T.; Ma, Z.; Wan, W. Evaluation of IMERG and ERA5 Precipitation-Phase Partitioning on the Global Scale. Water 2022, 14, 1122. [Google Scholar] [CrossRef]
- Beck, H.E.; Pan, M.; Roy, T.; Weedon, G.P.; Pappenberger, F.; van Dijk, A.I.J.M.; Huffman, G.J.; Adler, R.F.; Wood, E.F. Daily Evaluation of 26 Precipitation Datasets Using Stage-IV Gauge-Radar Data for the CONUS. Hydrol. Earth Syst. Sci. 2019, 23, 207–224. [Google Scholar] [CrossRef]
- Rozante, J.R.; Rozante, G. IMERG V07B and V06B: A Comparative Study of Precipitation Estimates Across South America with a Detailed Evaluation of Brazilian Rainfall Patterns. Remote Sens. 2024, 16, 4722. [Google Scholar] [CrossRef]
- Li, Z.; Tang, G.; Kirstetter, P.; Gao, S.; Li, J.-L.F.; Wen, Y.; Hong, Y. Evaluation of GPM IMERG and Its Constellations in Extreme Events over the Conterminous United States. J. Hydrol. 2022, 606, 127357. [Google Scholar] [CrossRef]
- Prakash, S.; Mitra, A.K.; AghaKouchak, A.; Liu, Z.; Norouzi, H.; Pai, D.S. A Preliminary Assessment of GPM-Based Multi-Satellite Precipitation Estimates over a Monsoon Dominated Region. J. Hydrol. 2018, 556, 865–876. [Google Scholar] [CrossRef]
- Zhang, D.; Yang, M.; Ma, M.; Tang, G.; Wang, T.; Zhao, X.; Ma, S.; Wu, J.; Wang, W. Can GPM IMERG Capture Extreme Precipitation in North China Plain? Remote Sens. 2022, 14, 928. [Google Scholar] [CrossRef]
- Pradhan, R.K.; Markonis, Y.; Vargas Godoy, M.R.; Villalba-Pradas, A.; Andreadis, K.M.; Nikolopoulos, E.I.; Papalexiou, S.M.; Rahim, A.; Tapiador, F.J.; Hanel, M. Review of GPM IMERG Performance: A Global Perspective. Remote Sens. Environ. 2022, 268, 112754. [Google Scholar] [CrossRef]
- Xu, R.; Tian, F.; Yang, L.; Hu, H.; Lu, H.; Hou, A. Ground Validation of GPM IMERG and TRMM 3B42V7 Rainfall Products over Southern Tibetan Plateau Based on a High-Density Rain Gauge Network. J. Geophys. Res. Atmos. 2017, 122, 910–924. [Google Scholar] [CrossRef]
- Zhang, S.; Wang, D.; Qin, Z.; Zheng, Y.; Guo, J. Assessment of the GPM and TRMM Precipitation Products Using the Rain Gauge Network over the Tibetan Plateau. J. Meteorol. Res. 2018, 32, 324–336. [Google Scholar] [CrossRef]
- Xin, Y.; Yang, Y.; Chen, X.; Yue, X.; Liu, Y.; Yin, C. Evaluation of IMERG and ERA5 Precipitation Products over the Mongolian Plateau. Sci. Rep. 2022, 12, 21776. [Google Scholar] [CrossRef]
- Reichle, R.H.; Liu, Q.; Koster, R.D.; Draper, C.S.; Mahanama, S.P.P.; Partyka, G.S. Land Surface Precipitation in MERRA-2. J. Clim. 2017, 30, 1643–1664. [Google Scholar] [CrossRef]
- Zhang, Y.; Huang, Y.; Xu, H.; Wang, S.; Long, T.; Zhao, Q. Evaluation of Precipitation Frequency and Intensity as Estimated by the GPM IMERG Precipitation Product at Daily and Hourly Scales over the Tibetan Plateau. Atmosphere 2023, 14, 1653. [Google Scholar] [CrossRef]
- Li, L.; Chen, X.; Ma, Y.; Zhao, W.; Zuo, H.; Liu, Y.; Cao, D.; Xu, X. Implications for Validation of IMERG Satellite Precipitation in a Complex Mountainous Region. Remote Sens. 2023, 15, 4380. [Google Scholar] [CrossRef]
- Huang, J.; Yu, H.; Guan, X.; Wang, G.; Guo, R. Accelerated Dryland Expansion under Climate Change. Nat. Clim. Chang. 2016, 6, 166–171. [Google Scholar] [CrossRef]
- Huang, J.; Guan, X.; Ji, F. Enhanced Cold-Season Warming in Semi-Arid Regions. Atmos. Chem. Phys. 2012, 12, 5391–5398. [Google Scholar] [CrossRef]
- Huffman, G.; Bolvin, D.; Nelkin, E.; Kidd, C.; Park, C.; Park, C. Improving User Access to the Integrated Multi-Satellite Retrievals for GPM (IMERG) Products. In Proceedings of the EGU General Assembly, Vienna, Austria, 17–22 April 2016. [Google Scholar]
- Derin, Y.; Yilmaz, K.K. Evaluation of Multiple Satellite-Based Precipitation Products over Complex Topography. J. Hydrometeorol. 2014, 15, 1498–1516. [Google Scholar] [CrossRef]
- Bharti, V.; Singh, C. Evaluation of Error in TRMM 3B42V7 Precipitation Estimates over the Himalayan Region. J. Geophys. Res. Atmos. 2015, 120, 12458–12473. [Google Scholar] [CrossRef]
- Acosta-Reyes, M.-Á.; Hernández-Anguiano, J.-H.; Carrión-Viramontes, F.-J.; Li, Y.; Quintana-Rodríguez, J.-A.; Rojo-Hernández, J.-D.; Navarro-Céspedes, J.-M.; Piña-González, V.; Zha, X.; Liao, X. Analysis of IMERG Precipitation Product in Mexican States to Evaluate the Spatial and Temporal Variation in Precipitation. Sustain. Water Resour. Manag. 2024, 10, 190. [Google Scholar] [CrossRef]
- Skofronick-Jackson, G.; Kirschbaum, D.; Petersen, W.; Huffman, G.; Kidd, C.; Stocker, E.; Kakar, R. The Global Precipitation Measurement (GPM) Mission’s Scientific Achievements and Societal Contributions: Reviewing Four Years of Advanced Rain and Snow Observations. QJR Meteorol. Soc. 2018, 144, 27–48. [Google Scholar] [CrossRef]
- Li, Z.; Liang, H.; Chen, S.; Li, X.; Li, Y.; Wei, C. Performance Assessment of Satellite-Based Precipitation Products in the 2023 Summer Extreme Precipitation Events over North China. Atmosphere 2024, 15, 1315. [Google Scholar] [CrossRef]


Disclaimer/Publisher’s Note: The statements, opinions and data contained in all publications are solely those of the individual author(s) and contributor(s) and not of MDPI and/or the editor(s). MDPI and/or the editor(s) disclaim responsibility for any injury to people or property resulting from any ideas, methods, instructions or products referred to in the content. |
© 2025 by the authors. Licensee MDPI, Basel, Switzerland. This article is an open access article distributed under the terms and conditions of the Creative Commons Attribution (CC BY) license (https://creativecommons.org/licenses/by/4.0/).
Share and Cite
Wei, D.; Di, W.; Tian, W.; Cheng, S.; Xie, H.; Xie, L.; Jing, Z. Assessment of Integrated Multi-Satellite Retrievals for Global Precipitation Measurement (IMERG) Precipitation Products in Northwest China. Remote Sens. 2025, 17, 1364. https://doi.org/10.3390/rs17081364
Wei D, Di W, Tian W, Cheng S, Xie H, Xie L, Jing Z. Assessment of Integrated Multi-Satellite Retrievals for Global Precipitation Measurement (IMERG) Precipitation Products in Northwest China. Remote Sensing. 2025; 17(8):1364. https://doi.org/10.3390/rs17081364
Chicago/Turabian StyleWei, Dong, Wenjing Di, Wenshou Tian, Shanjun Cheng, Hongfei Xie, Lijun Xie, and Zhikun Jing. 2025. "Assessment of Integrated Multi-Satellite Retrievals for Global Precipitation Measurement (IMERG) Precipitation Products in Northwest China" Remote Sensing 17, no. 8: 1364. https://doi.org/10.3390/rs17081364
APA StyleWei, D., Di, W., Tian, W., Cheng, S., Xie, H., Xie, L., & Jing, Z. (2025). Assessment of Integrated Multi-Satellite Retrievals for Global Precipitation Measurement (IMERG) Precipitation Products in Northwest China. Remote Sensing, 17(8), 1364. https://doi.org/10.3390/rs17081364