Article

Evolution and Attribution of Flood Volume in the Source Region of the Yellow River

by
Jie Wang
1,
Donghui Shangguan
2,3,
Yongjian Ding
2,3 and
Yaping Chang
2,3,*
1
College of Earth and Environmental Sciences, Lanzhou University, Lanzhou 730000, China
2
Tanggula Mountain Cryosphere and Environment Observation and Research Station of Tibet Autonomous Region, State Key Laboratory of Cryospheric Science and Frozen Soil Engineering, Northwest Institute of Eco-Environment and Resources, Chinese Academy of Sciences, Lanzhou 730000, China
3
University of Chinese Academy of Sciences, Beijing 100049, China
*
Author to whom correspondence should be addressed.
Remote Sens. 2025, 17(8), 1342; https://doi.org/10.3390/rs17081342
Submission received: 10 March 2025 / Revised: 4 April 2025 / Accepted: 8 April 2025 / Published: 9 April 2025

Abstract

:
Accurately understanding flood evolution and its attribution is crucial for watershed water resource management as well as disaster prevention and mitigation. The source region of the Yellow River (SRYR) has experienced several severe floods over the past few decades, but the driving factor influencing flood volume variation in the SRYR remains unclear. In this study, the Budyko framework was used to quantify the effects of climate change, vegetation growth, and permafrost degradation on flood volume variation in six basins of the SRYR. The results showed that the flood volume decreased before 2000 and increased after 2000, but the average value after 2000 remained lower than that before 2000. Flood volume is most sensitive to changes in precipitation, followed by changes in landscape in all basins. The decrease in flood volume was primarily influenced by changes in active layer thickness in permafrost-dominated basins, while it was mainly controlled by other landscape changes in non-permafrost-dominated basins. Meanwhile, the contributions of changes in potential evapotranspiration and water storage changes to the reduced flood volume were negative in all basins. Furthermore, the impact of vegetation growth on flood volume variation cannot be neglected due to its regulating role in the hydrological cycle. These findings can provide new insights into the evolution mechanism of floods in cryospheric basins and contribute to the development of strategies for flood control, disaster mitigation, and water resource management under a changing climate.

1. Introduction

Flooding, as a natural hazard, displaces tens of millions of people and leads to direct losses of hundreds of billions of U.S. dollars each year [1,2,3]. In the context of global warming, flood events are becoming more frequent and their consequences more severe [4,5,6], sparking widespread concern about future flood risks [7]. Therefore, it is imperative to understand the evolution pattern of floods and identify their driving factors, which is a prerequisite for formulating effective disaster prevention and mitigation strategies [8].
Generally, climate change factors such as changes in extreme precipitation or temperature [9] and changes in snowmelt [10] are the primary causes of flooding. Anthropogenic changes have also increased the likelihood of flooding [4]. Many scholars have conducted research on floods using in situ observations [11,12], remote sensing inversion [13], and model simulation [14]. In situ observation is an important means to understand the dynamics and characteristics of floods [12]. Remote sensing inversion can monitor large-scale floods [13], although it may not be able to capture all the necessary detail at the local level, which may require additional ground-based or in situ observations for support. Model simulation can forecast flood risks and reconstruct historical floods, requiring in situ observations for calibration and validation [14]. Therefore, exploring the driving mechanism of floods based on observations provides an intuitive and effective method to improve our understanding of flood characteristics and formulate effective flood management strategies, thereby ensuring the safety and well-being of communities worldwide.
The source region of the Yellow River (SRYR), a typical cryospheric basin, has experienced significant permafrost degradation with climate warming [15,16]. Since 2000, the hydrological and climatic conditions in the SRYR have changed significantly [17,18]. The region has experienced a shift towards wetter and warmer climatic conditions [19,20], accompanied by frequent extreme weather events [14] and lake expansion [21]. In this context, the SRYR experienced several large floods in 2012, 2018, 2019, 2020, and 2024, with a slowdown in flood recession and a significant increase in the duration of the flooding process [22]. For example, the Tangnaihai station witnessed its largest flood since 1989 in 2012 [22], while the Dashui and Tangke stations experienced their first-ever recorded floods in 2018. Similarly, the Maqu and Jungong stations endured their highest flows since 1981 in 2018 [23]. Moreover, a catastrophic once-in-200-years flood occurred at the Tangnaihai station in 1981, which threatened the safety of the Longyangxia and Liujiaxia reservoirs located downstream of the SRYR and significantly affected the flood control safety of Lanzhou City further downstream. In addition, the first flood of the Yellow River in 2024 occurred at the Tangnaihai hydrological station at 9:36 am on 29 July, with a discharge of 2510 m3/s. Under climate warming, the potential for triggering severe floods and their risks remains, making it imperative to maintain vigilance against major flood risks in the SRYR. Therefore, there is an urgent need to conduct research on the evolution of floods and their causes in the SRYR, which can support the safety of flood protection in the source and downstream areas and the management of water resources in the Yellow River basin.
In recent years, extensive research has been conducted on runoff changes and future projections in the SRYR [17,24,25], but there is a notable research gap regarding floods in this area [26,27], with flood volume—a crucial component of annual runoff—receiving even less attention. Similarly to runoff changes, flood volume variation is influenced by climatic factors (e.g., precipitation, temperature, and potential evapotranspiration) and landscape factors (human activities, vegetation growth, land use, and permafrost freeze–thaw processes). Previous studies on the attribution analysis of runoff changes in the SRYR have employed hydrological modelling and Budyko-based methods [16,17,28], yet their suitability for flood volume variation analysis has remained unexplored. Hydrological models require abundant parameters, which are hard to obtain due to the harsh environment in complex cryospheric-dominated basins, thus limiting their application [29]. In contrast, the Budyko-based method offers a promising alternative. With its simple computational process and solid physical foundation, it provides a robust framework for understanding hydrological process dynamics. More importantly, its physical framework allows for the separation of the effects of climate and landscape factors on hydrological processes, which is particularly useful for flood volume attribution analysis as it helps to precisely identify the relative contributions of different factors to flood volume variation. Additionally, the method has been widely employed at multiple time scales in the SRYR [16,28,30], such as monthly and seasonal scales, demonstrating its versatility and reliability. Therefore, the Budyko-based method is a reasonable and valuable choice for analyzing flood volume variation in the SRYR.
In this context, this study aims to address two key questions: (a) How to elucidate flood volume variation in the SRYR? (b) How to quantify the response of flood volume variation to climate change, vegetation growth, and permafrost degradation in the SRYR? Therefore, the objectives are as follows: (i) to analyze the variation in flood volume based on long-time observations in the SRYR; (ii) to investigate the spatiotemporal variation in the corresponding climatic variables in the SRYR; (iii) to quantify the contribution of precipitation, potential evapotranspiration, vegetation growth, and permafrost degradation to flood volume variation.

2. Materials and Methods

2.1. Study Area

The SRYR, located in the northeastern part of the Tibetan Plateau (TP) (Figure 1), is an important source of runoff and a crucial water source conservation area of the Yellow River [31,32,33]. The drainage area of the SRYR is 12.2 × 10⁴ km2, accounting for 16.2% of the total area of the Yellow River basin. The climate is a typical continental alpine climate [28], mainly influenced by the Westerlies, the Indian monsoon, and the East Asian monsoon. The land cover mainly consists of grasslands, lakes, wetlands, and permafrost [24]. Elevation ranges from 2672 m to 6264 m, with an average elevation exceeding 4000 m above sea level (Figure 1). The mean annual temperature and precipitation are below 0 °C and 469.3 mm, respectively [34].

2.2. Data

2.2.1. Observation Data

Discharge data from four main hydrological stations (Jimai, Maqu, Jungong, and Tangnaihai) and two tributary hydrological stations (Ruoergai and Dashui) were obtained from the Hydrological Yearbook of the People’s Republic of China and used to calculate flood volume and evaluate the impact of climate change. Due to the inconsistent construction time of each hydrological station, the study period of the hydrological data obtained from each station is also different. We collected the most recent data to our best efforts and expanded the period of discharge data to 1956–2021 at Tangnaihai, 1958–2021 at Jimai, 1959–2021 at Maqu, 1980–2021 at Jungong and Ruoergai, and 1984–2021 at Dashui, respectively (Table 1). Detailed information on the hydrological stations is shown in Table 1. In this study, the basin controlled by the hydrological station is referred to as the corresponding basin. According to Yan et al. [35], these six basins were divided into permafrost-dominated basins (i.e., Jimai, Maqu, Jungong, and Tangnaihai basins) and non-permafrost-dominated basins (i.e., Dashui and Ruoergai basins).
Daily precipitation data from six rainfall stations were collected from the Hydrological Yearbook of the People’s Republic of China. These data were used to evaluate the accuracy of four gridded meteorological datasets. Detailed information on the rainfall stations is shown in Table 2. If data for the current month is missing, the corresponding monthly and annual values are discarded.

2.2.2. Gridded Data

Precipitation, potential evapotranspiration, water storage change, leaf area index, and active layer thickness data were collected to analyze the impacts of climate change, vegetation growth, and permafrost degradation on flood volume variation in the SRYR.
To select the most reasonable and appropriate precipitation dataset for the SRYR, four mainstream gridded meteorological datasets (CMFD, TPMFD, CN05.1, and ERA5-Land) were compared in this study. Among them, the CMFD, TPMFD, and CN05.1 have undergone ground-based calibration over China or the Third Pole [36,37]. The ERA5-Land dataset has been widely used in hydroclimate-related studies [38]. The CMFD, a long-term (1979–2018) near-surface atmospheric derive dataset of China, was created by the fusion of remote sensing products, reanalysis datasets, and observations, with a spatial resolution of 0.1° and a temporal resolution of 3 h [36]. The TPMFD, a long-term (1979–2020) high-resolution meteorological forcing dataset for the Third Pole region, was created by high-resolution atmospheric modelling and dense observations, with a spatial resolution of 1/30° and a daily temporal resolution [39,40]. The CN05.1 is a gridded meteorological dataset based on over 2400 observation stations in China (1961–2021), with a spatial resolution of 0.25° and a temporal resolution of daily [37]. ERA5-Land is a global reanalysis dataset (1950–present) produced by the European Centre for Medium-Range Weather Forecasts (ECMWF), with a spatial resolution of 0.1° and a temporal resolution of hourly [41]. A comparative analysis of the monthly precipitation estimated by the CMFD, TPMFD, CN05.1, and ERA5-Land datasets during the flood season against gauge observations showed that precipitation estimated by the CMFD was more comparable to the observations than those from the other three datasets (Figure S1). Therefore, precipitation estimated by the CMFD was used to investigate the impact of precipitation on flood volume variation.
The monthly potential evapotranspiration data were extracted from the ERA5-Land dataset, which has been validated to have high accuracy compared to other datasets [29,42,43]. The monthly water storage data were extracted from a global total water storage reconstruction dataset for the period 1979–2020, with a spatial resolution of 0.5° and a temporal resolution of monthly by Li et al. [44]. This reconstruction data reconstructed and extended the period of Gravity Recovery and Climate Experiment (GRACE) total water storage anomalies dataset by combining machine learning with time series decomposition and statistical decomposition techniques, and has been widely used in various studies [45,46]. The monthly water storage change was calculated as the difference in water storage between adjacent months. GIMMS Leaf Area Index (LAI) from 1982 to 2020 data were used to characterize the spatiotemporal variation in vegetation [47]. This product, generated by the back-propagation neural network and a data consolidation method with a spatial resolution of 1/12°, is a reliable long-term LAI dataset which has been widely used in ecological and hydrological studies [48,49]. The active layer thickness (ALT) was used to characterize permafrost degradation. The ALT data were calculated by the Stefan equation using remote sensing data and observational data [35]. This dataset provides the permafrost changes in the TP every 5 years from 1961 to 2020, with a spatial resolution of 1 km.
To reduce the uncertainties due to scale mismatch of the datasets, all datasets were resampled to a spatial resolution of 0.1° using a bilinear interpolation method. In the attribution analysis of flood volume variation, the study period was selected to be the overlapping period of all datasets from 1980 to 2018, given the different time periods covered by the different datasets.

2.3. Methods

2.3.1. Calculation of Flood Volume

Flood volume is defined as the total accumulation of water (i.e., total discharge) occurring during the flood season (June–October) and the formula is as follows:
Q = m = 6 10 Q m
where Q is the flood volume (m3), and Qm (m = 6., 7, …, 10) is the monthly streamflow of the mth month (m3). Meanwhile, in order to analyze the impact of climate change on flood volume, the flood volume was converted into runoff depth during the flood season. The runoff depth during the flood season (R; mm) can be calculated by dividing the flood volume by the catchment area.
R = Q 1000 A
where A is the catchment area (km2).

2.3.2. Linear Regression Analysis

The linear regression method was used to investigate the long-term changes in flood volume and its corresponding influencing factors. Significance levels of 0.05 and 0.01 were selected for all trend analyses conducted in this study. The formula is as follows:
s l o p e = n i = 1 n i × x i i = 1 n i × i = 1 n x i n × i = 1 n i 2 ( i = 1 n i ) 2
where i is the number of years; n is the length of the time series; xi (i = 1, 2, …, n) is the corresponding variable of the ith year. A positive slope indicates an increasing trend and a negative value indicates a decreasing trend. Further, the coefficient of variability (Cv), the ratio of mean value to standard deviance, was employed to examine the degree of variability in the dispersion of the data [50].

2.3.3. Water Balance and the Budyko Framework at Flood Seasonal Scale

The water balance equation in a basin can be expressed as follows:
R = P E T Δ S
where P is the precipitation (mm), ET is the actual evapotranspiration (mm), and ∆S is the water storage change, which cannot be ignored on finer timescales (i.e., monthly, seasonal) [51,52].
The Budyko framework hypothesises that the water balance of a basin can be expressed as a function of the available water and energy, and it suggests that the evaporation fraction (ET/P) is a function of the aridity index (ET0/P) [53]. The formula is as follows:
E T P e = f ( E T 0 P e )
where ET0 is the potential evapotranspiration (mm), and Pe is the available water (P−S). Among the mathematical forms of the Budyko framework, the Budyko equation derived by Fu [54], which has been relatively widely used in previous studies [29], was used in this study:
E T P e = 1 + E T 0 P e 1 + E T 0 P e n 1 n
where n is a parameter representing the catchment characteristics, relating to properties of topography, soil, vegetation, and other factors [28,55].
Coupled with the water balance equation, the runoff during the flood season (R) can be calculated as follows:
R = P Δ S n + E T 0 n 1 n E T 0

2.3.4. Establish the Relationship Between Vegetation Index, Active Layer Thickness, and Parameter n

The SRYR is less affected by human activities and exhibits insignificant land use changes, with vegetation growth and permafrost freeze–thaw processes being two primary factors influencing landscape change [28]. Given that LAI and ALT are independent of each other, a multiple linear regression method was employed to quantify the relationship between the parameter n and both LAI and ALT [56]:
n = a L A I + b A L T + c
where a and b are linear coefficients, and c is the error. For permafrost-dominated regions, to maintain consistency with ALT data, the sequential five-year mean values of n and LAI were used. For non-permafrost-dominated regions, the contribution of vegetation change can be calculated by the linear regression between n and LAI, ignoring ALT in Equation (8).

2.3.5. Attribution Analysis of Flood Volume

Assuming that P, ET0, ∆S, and n are independent of each other, the change in flood volume can be simplified using the total differentiation equation as follows:
d Q 1000 A = d R = R P d P + R E T 0 d E T 0 + R Δ S d Δ S + R n d n + δ
where R P , R E T 0 , R Δ S , and R n are the partial differential coefficients of R to P, ET0, ∆S, and n, respectively; δ is the system error. Further, the partial differential coefficients of Q to P, ET0, ∆S, and n can be calculated as follows:
Q P = 1000 A ( P Δ S ) n 1 P Δ S n + E T 0 n 1 n 1
Q E T 0 = 1000 A E T 0 n 1 P Δ S n + E T 0 n 1 n 1 1
Q Δ S = 1000 A P Δ S n 1 × P Δ S n + E T 0 n 1 n 1
Q n = 1000 A × P Δ S n ln P Δ S + E T 0 n ln E T 0 n × P Δ S n + E T 0 n ln P Δ S n + E T 0 n n 2 × P Δ S n + E T 0 n 1 n
The sensitivity coefficients of flood volume to each climatic element can be calculated as follows:
ε x = Q x x Q
where x represents each independent variable, and εx is the sensitivity coefficient of runoff for x.
Further, Equation (9) can be simplified as follows:
Δ Q = Q P Δ P + Q E T 0 Δ E T 0 + Q Δ S Δ Δ S + Q n Δ n
where ∆Q, ∆P, ∆ET0, ∆∆S, and ∆n are the deviations between the changing period and baseline period.
Considering the relationship between LAI, ALT, and n, Equation (12) can be expressed as follows:
Δ Q = Q P Δ P + Q E T 0 Δ E T 0 + Q Δ S Δ Δ S + Q L A I Δ L A I + Q A L T Δ A L T
where Q L A I and Q A L T are the partial differential coefficients of Q to LAI and ALT, respectively, and can be calculated as follows:
Q L A I = Q n n L A I = a Q n
Q A L T = Q n n A L T = b Q n
where n L A I and n A L T are the partial differential coefficients of n to LAI and ALT, respectively, and can be calculate by Equation (8).
Thus, the contribution and contribution rate of each variable to flood volume change can be estimated as follows:
Δ Q x = Q x Δ x
C x = Δ Q x Δ Q x × 100 %
where ∆Qx and Cx are the contribution and contribution rate of the corresponding variable, respectively. The larger absolute value of Cx, the larger impact of x on flood volume.
Due to the significant changes in the hydrological and climatic conditions of the SRYR around 2000 [17,18,19], the study period was divided into two periods for attribution analysis: the baseline period (1980–1999) and the changing period (2000–2018).

3. Results

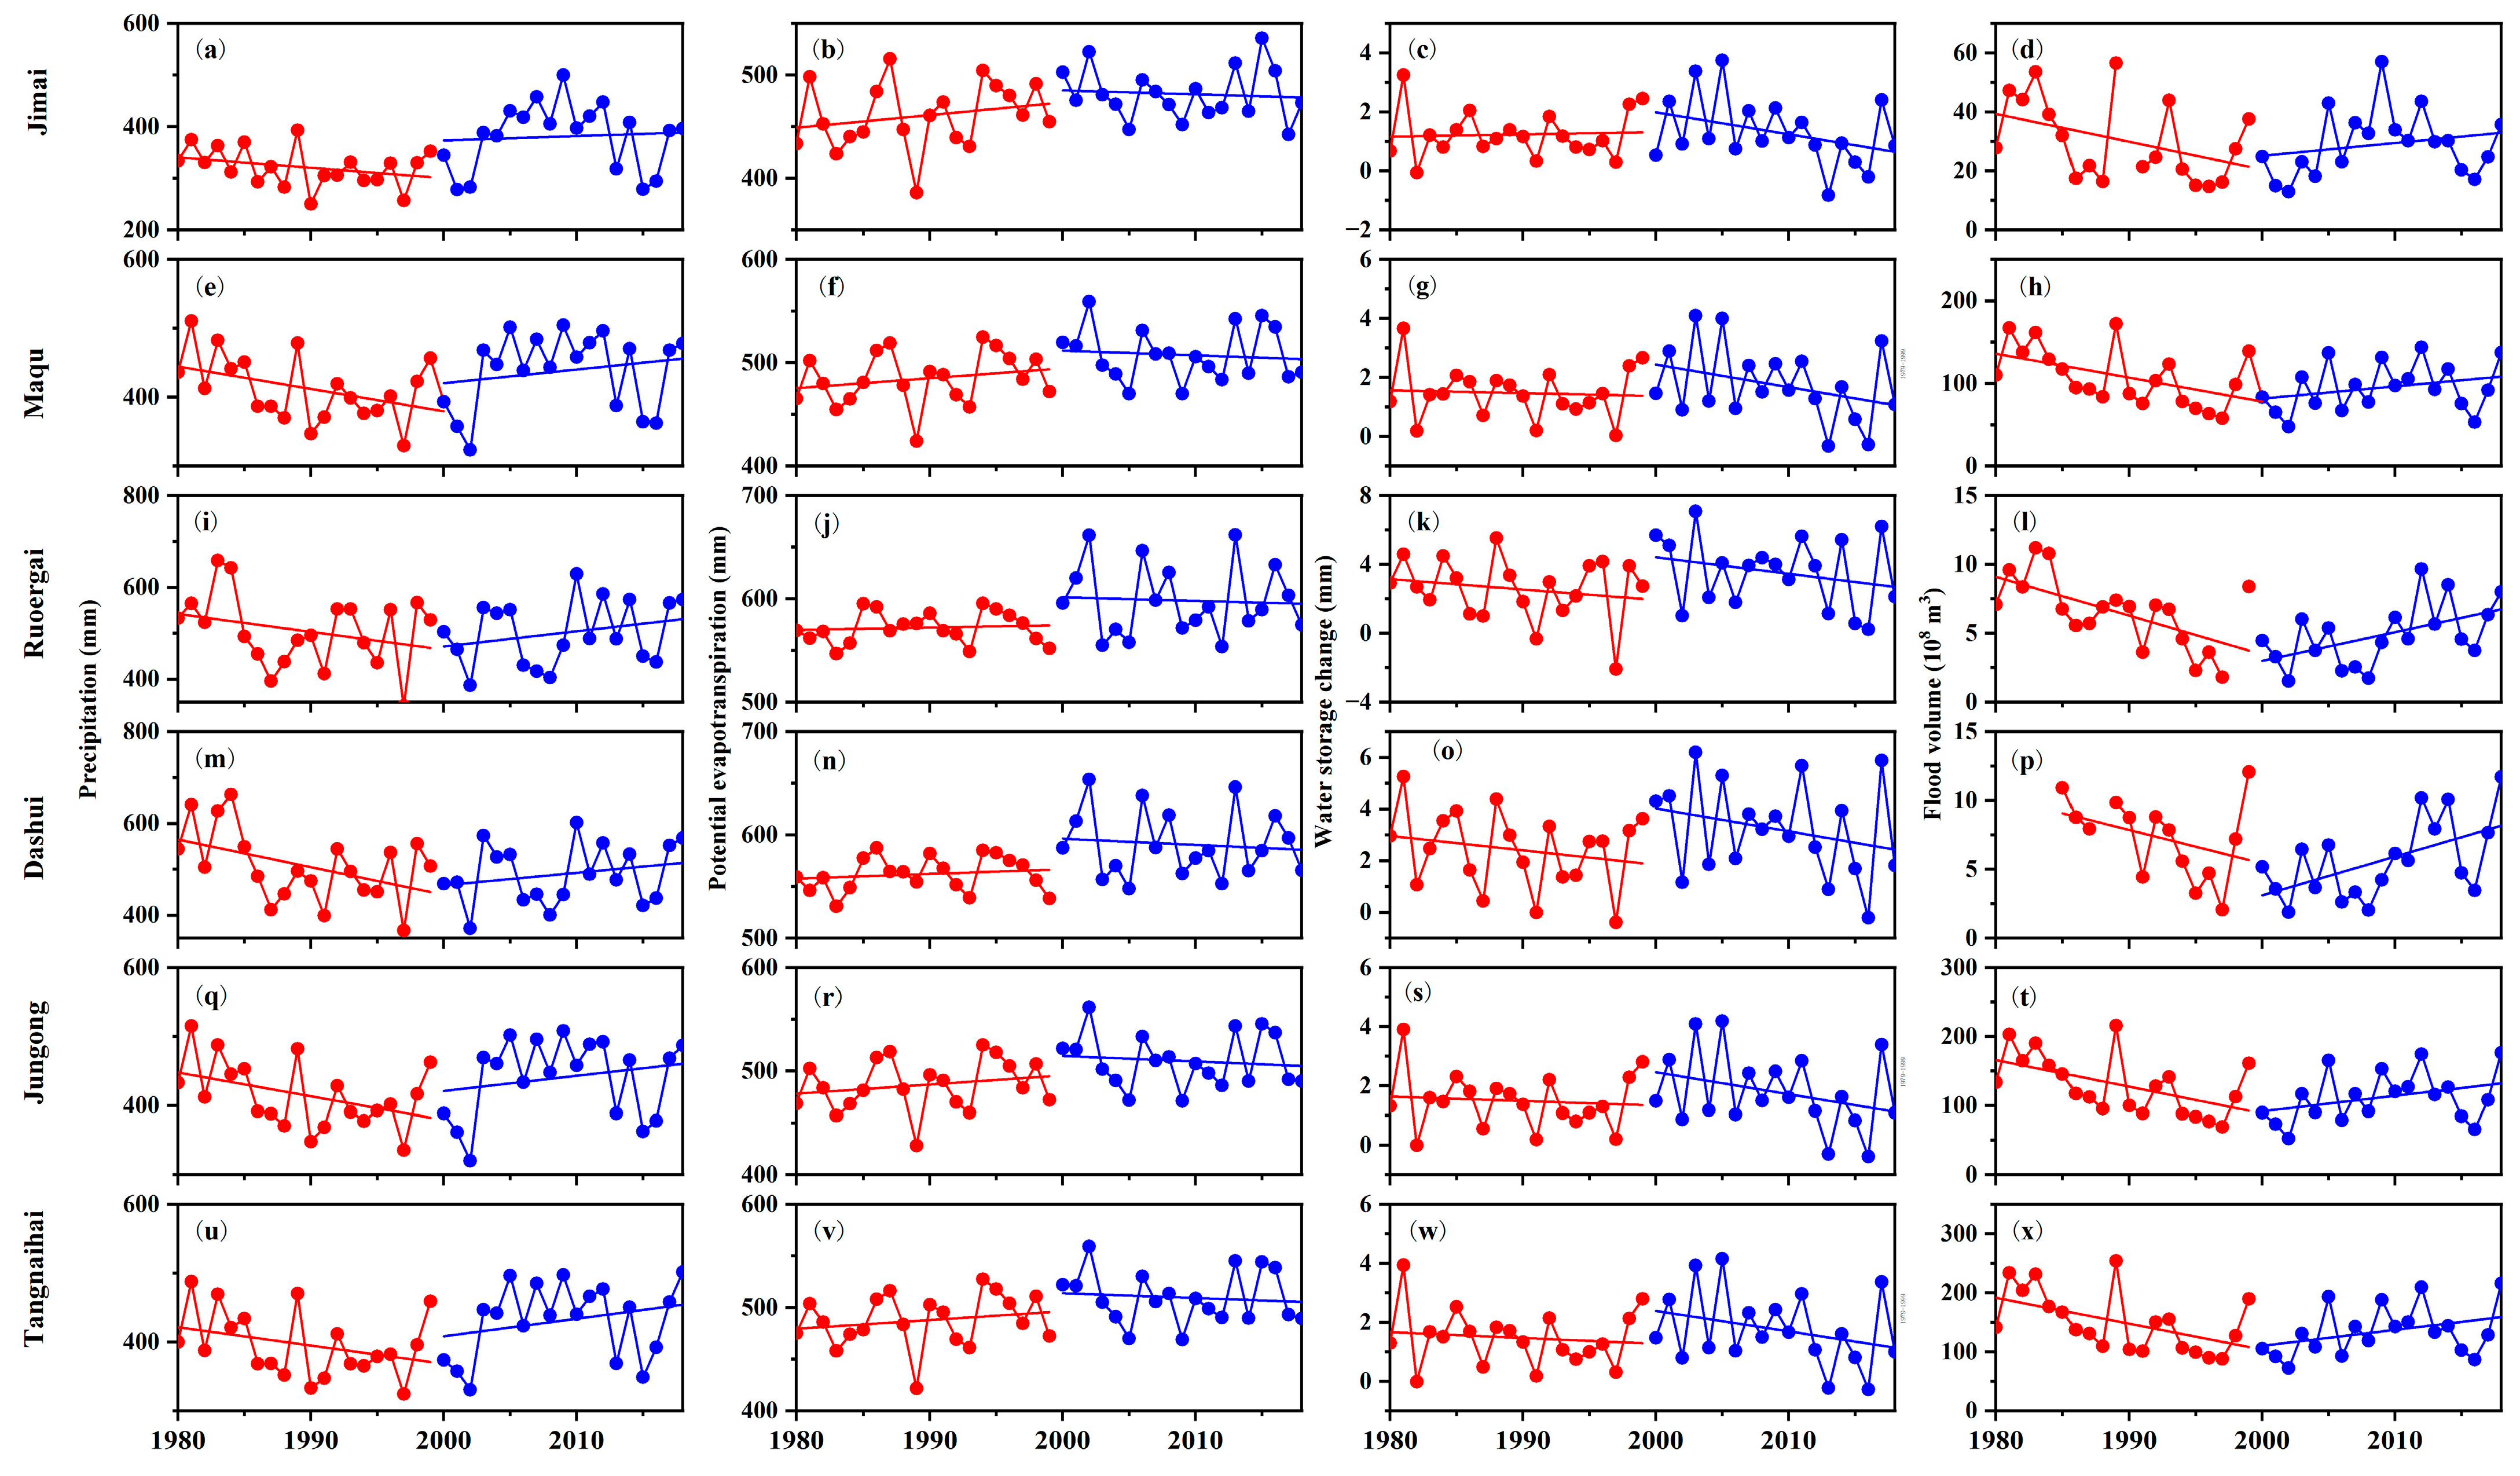
3.1. Variation in the Long-Time Flood Volume

The variation in flood volume at the six hydrological stations is shown in Figure 2. The flood volume accounted for 71.1–73.6% of the annual discharge at all stations (Figure S2). At the Jimai station, the multiyear (1958–2021) mean flood volume was 30.6 × 10⁸ m3 (Table 3). The maximum flood volume occurred in 1975, with a value of 65.1 × 10⁸ m3. The flood volume showed a downward trend during 1958–2000, followed by an upward trend during 2000–2021, while there was a marginal increase in flood volume during 1958–2021 (Figure 2a). At the Maqu station, the multiyear (1959–2021) mean flood volume was 105.2 × 10⁸ m3 (Table 3). The mean flood volume was 106.1 × 10⁸ m3 before 2000, whereas it decreased to 102.6 × 10⁸ m3 after 2000. The maximum flood volume at the Maqu station occurred in 2020 with a value of 177.1 × 10⁸ m3. The flood volume exhibited a decreasing trend before 2000 and a significant increasing trend after 2000 (Figure 2b). A slight downward trend was found over the whole period, which happened precisely because the significant increase in flood volume after 2000 was outweighed by the more prolonged decrease that occurred before 2000. At the Ruoergai station, the multiyear (1980–2021) mean flood volume was 6.0 × 10⁸ m3 (Table 3). The mean flood volume was 6.4 × 10⁸ m3 before 2000, while it decreased by 1.0 × 10⁸ m3 since 2000. The maximum flood volume at this station was 13.4 × 10⁸ m3, which occurred in 2020. Despite the downward trend before 2000 and the upward trend after 2000, there was still a slight decrease in flood volume over the whole period (1980–2021) (Figure 2c). At the Dashui station, the multiyear (1985–2021) mean flood volume was 6.8 × 10⁸ m3 (Table 3), with the maximum value reaching 18.3 × 10⁸ m3 and occurring in 2020. The flood volume showed a slight increasing trend during the whole period. Although the mean value after 2000 was lower than that before 2000, the increasing rate after 2000 was larger than the decreasing rate before 2000 (Figure 2d). At the Jungong station, the flood volume ranged from 52.5 to 215.7 × 10⁸ m3, with a multiyear (1980–2021) mean value of 124.7 × 10⁸ m3 (Table 3). This station experienced a maximum flood volume of 215.7 × 10⁸ m3 in the year 1989. The flood volume decreased significantly before 2000, and increased significantly after 2000 (Figure 2e). The flood volume exhibited a decreasing trend throughout the whole period, attributed to the fact that the rate of decrease before 2000 was more pronounced than the subsequent rate of increase after 2000. At the Tangnaihai station, the mean flood volume over the years (1956–2021) was 145.8 × 10⁸ m3 (Table 3), with a maximum value of 254.1 × 10⁸ m3 in 1989 (Figure 2f). Although the multiyear mean flood volume was similar for the two periods, the larger Cv and the significant increasing trend after 2000 indicate the higher flood risk at this station. The flood volume showed an oscillating gentle decreasing trend before 2000, while it increased significantly after 2000 (p < 0.05) (Figure 3f).
Overall, the flood volume before 2000 exhibited a decreasing trend throughout the whole SRYR. Since 2000, however, a significant increase in flood volume has been observed, suggesting that a significant increase in flood risk within the SRYR, and it is reasonable to use the year 2000 as the dividing time period.

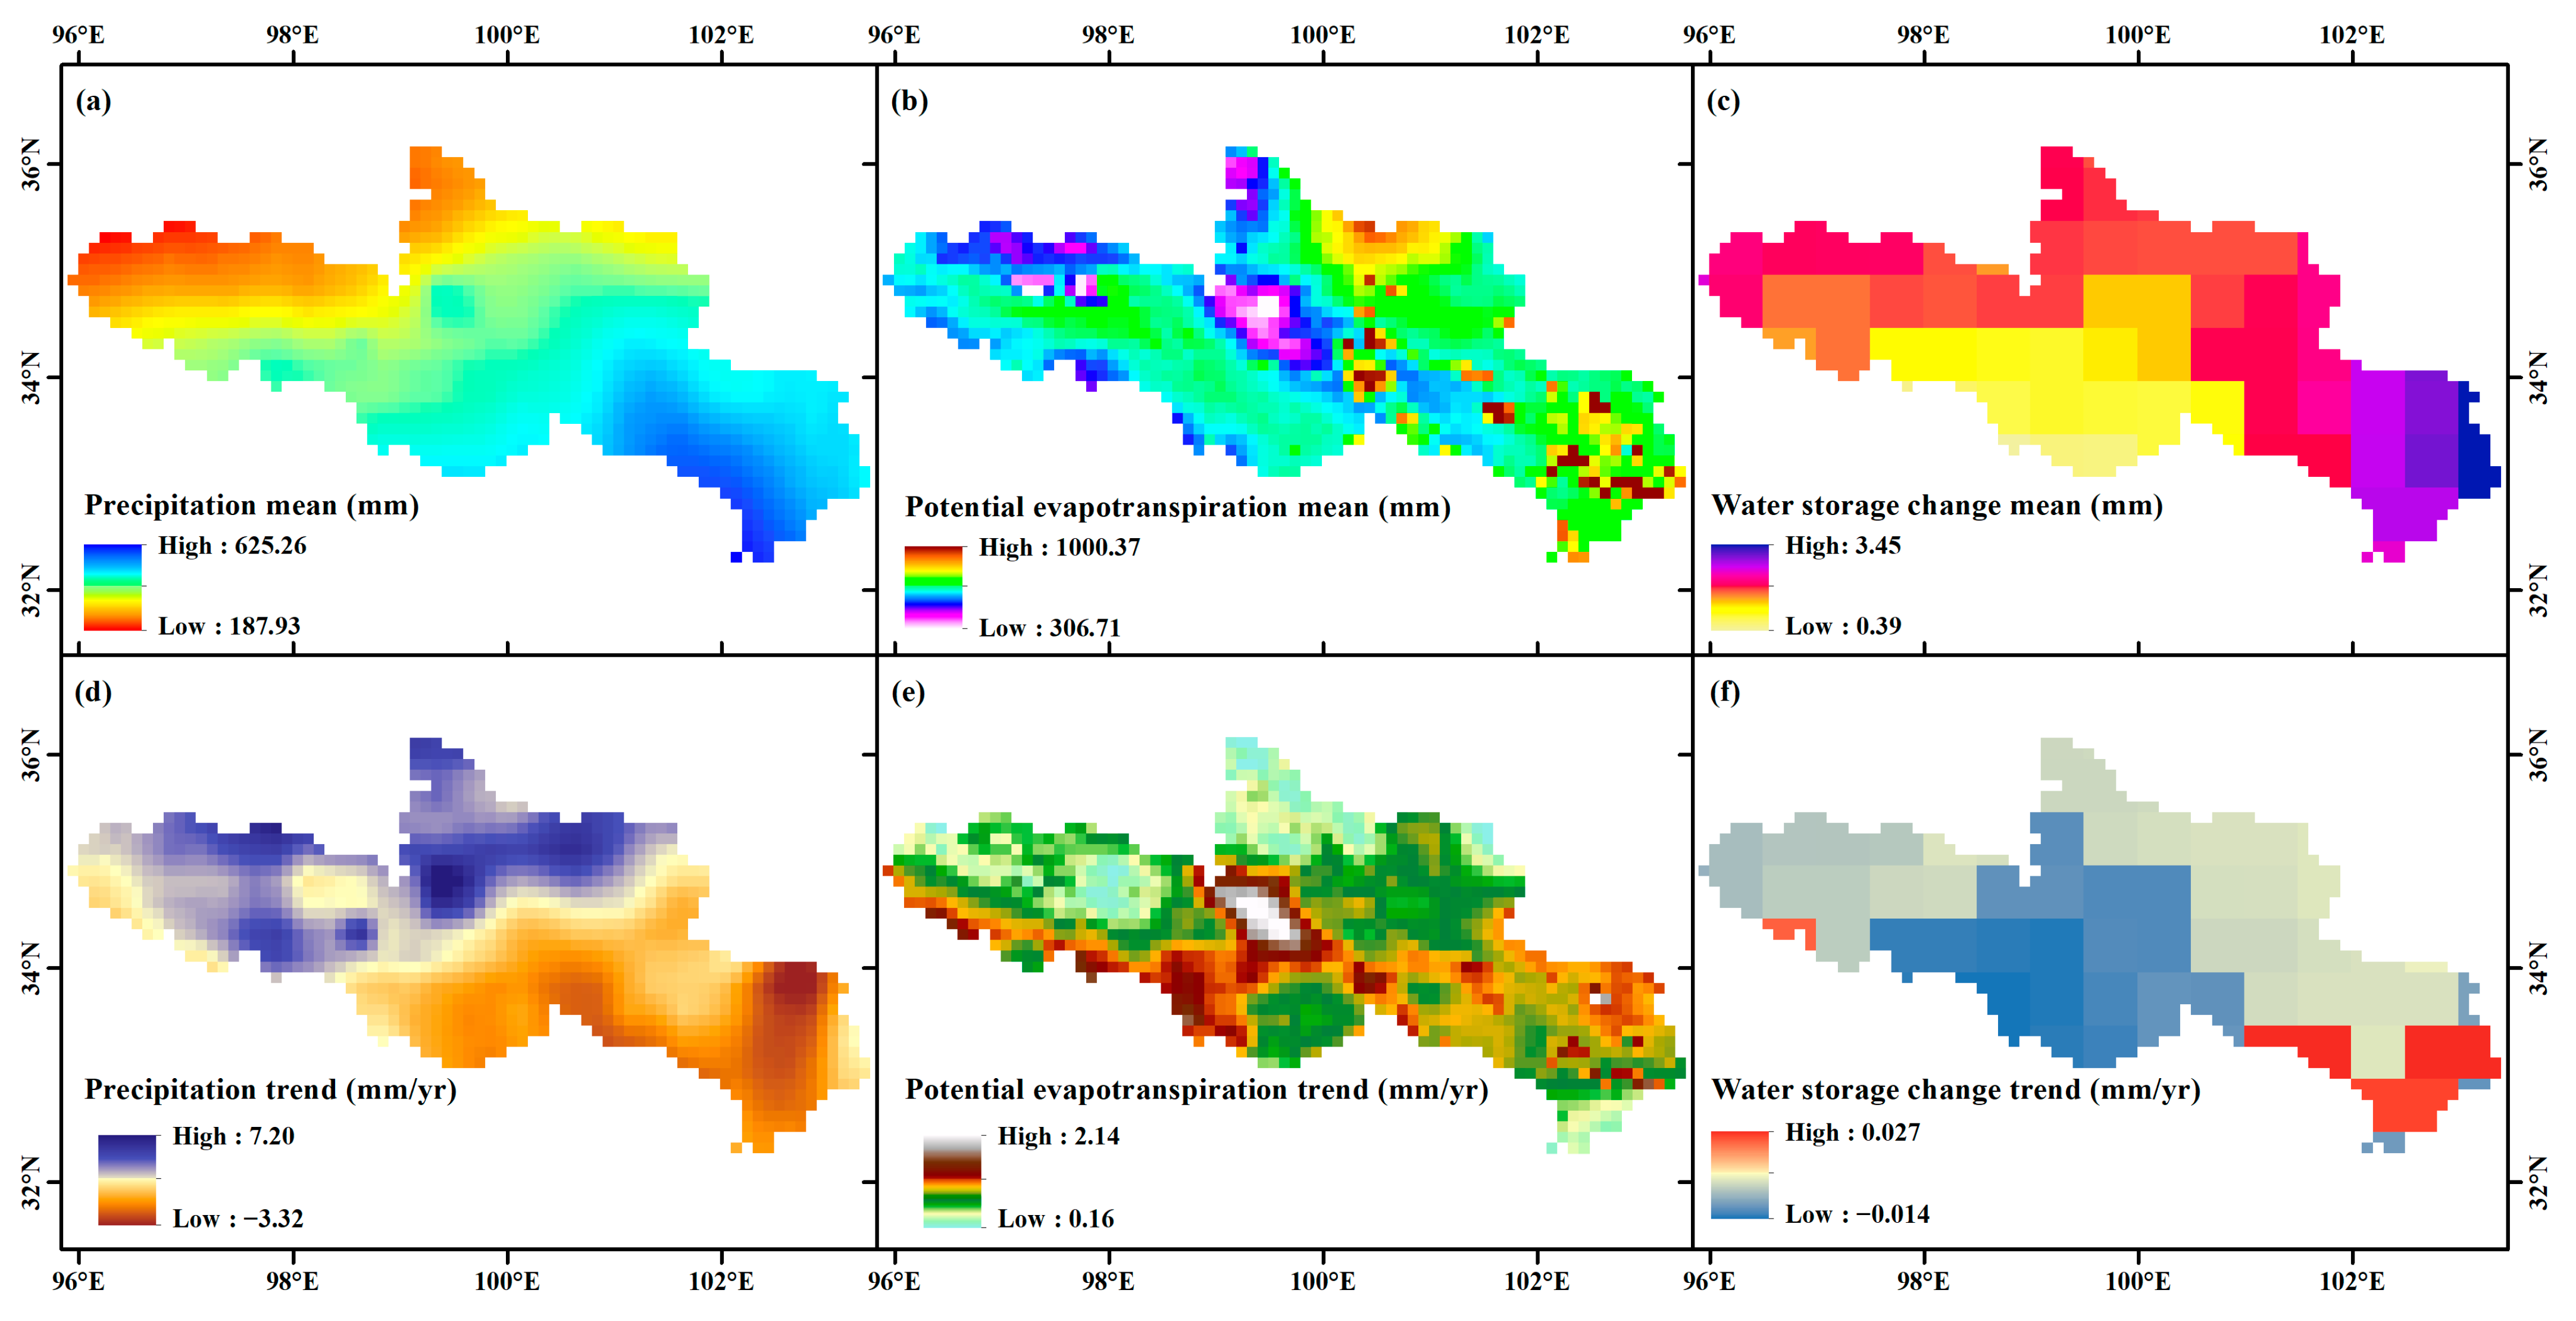
3.2. Spatiotemporal Variations in Precipitation, Potential Evapotranspiration, and Water Storage Change During the Flood Season

To better understand the impacts of environmental factors on flood volume change, the long-term spatiotemporal characteristics of hydroclimatic elements are shown in Figure 3. Spatially, the multiyear (1980–2018) mean precipitation during the flood season increased from northwest to southeast, with values ranging from 187.9 to 626.3 mm and a regional mean value of 411.3 mm (Figure 3a). The multiyear (1980–2018) mean potential evapotranspiration varied from 306.7 to 1000.37 mm, with a regionally mean value of 498.3 mm (Figure 3b). The multiyear (1980–2018) mean water storage change ranged from 0.39 to 3.45 mm. The minimum water storage change appeared in the southern SRYR and the maximum value appeared in the southeastern part (Figure 3c).
The spatial distribution of the trend analysis suggests that precipitation showed increasing trends in 69.5% of the SRYR, mainly concentrated in the northwestern part, while decreasing trends were observed in the southeastern part (Figure 3d). Potential evapotranspiration showed increasing trends, with 48.3% of the area experiencing a significant increase, and rates ranging from 0.16 to 2.14 mm/yr (Figure 3e), indicating that there is a notable shift towards higher rates of water loss from the land surface. Approximately 57.0% of the area showed positive trends in water storage change, while other regions showed negative trends and were primarily located in the southcentral part (Figure 3f).
The temporal variations in basin-averaged precipitation, potential evapotranspiration, water storage change, and corresponding flood volume during 1980–2018 across six basins were analyzed (Figure 4, Table 4). In the basin controlled by the Jimai station (Jimai basin), the maximum precipitation and flood volume were found in 2009, while the maximum potential evapotranspiration and water storage change occurred in 2015 and 2005, respectively (Figure 4a–d). In the basin controlled by the Maqu station (Maqu basin), the maximum precipitation and flood volume occurred in 1981 and 1989, respectively, while the maximum potential evapotranspiration and water storage change appeared in 2002 and 2003, respectively (Figure 4e–h). In the basin controlled by the Ruoergai station (Ruoergai basin), the maximum precipitation and flood volume appeared in 1983, while the maximum potential evapotranspiration and water storage change appeared in 2013 and 2003, respectively (Figure 4i–l). In the basin controlled by the Dashui station (Dashui basin), the maximum precipitation and flood volume appeared in 1984 and 1999, respectively, while the maximum potential evapotranspiration and water storage change were found in 2002 and 2003, respectively (Figure 4m–p). In the basin controlled by the Jungong station (Jungong basin), the maximum precipitation and flood volume were found in 1981 and 1989, respectively, while the maximum potential evapotranspiration and water storage change appeared in 2002 and 2005, respectively (Figure 4q–t). In the basin controlled by the Tangnaihai station (Tangnaihai basin), the maximum precipitation and flood volume were found in 2018 and 1989, respectively, while the maximum potential evapotranspiration and water storage change were found in 2002 and 2005, respectively (Figure 4u–x).
The flood volume decreased during 1980–1999 and increased during 2000–2018 across all basins. Although the flood volume has shown an upward trend since 2000, the average flood volume after 2000 was lower than before 2000. Similarly to changes in the flood volume, precipitation during the flood season also showed a decreasing trend during 1980–1999 and an increasing trend during 2000–2018 (Figure 4 and Table 4). Contrary to the changes in flood volume and precipitation, the potential evapotranspiration during the flood season exhibited increasing trends during 1980–1999 and decreasing trends during 2000–2018 across all basins. The water storage change exhibited decreasing trends in most basins during both the 1980–1999 (except Jimai basin) and 2000–2018 periods. Specifically, during the whole period (1980–2018), the water storage change in Jimai basin decreased at a rate of −0.004 mm/yr, while in other basins, it increased at varying rates ranging from 0.0003 to 0.018 mm/yr.

3.3. Sensitivity Analysis of Flood Volume to Influencing Factors

The mean values of the hydroclimatic variables changed around 2000 (Table 5). Compared with the baseline period (1980–1999), the flood volume and runoff during the flood season during the changing period (2000–2018) decreased by −17.31~−1.35 × 10⁸ m3 and −22.31~−2.99 mm in all basins, respectively. However, the mean precipitation during the flood season during the changing period increased by 10.69~59.6 mm in most basins, except in the Ruoergai basin, where it decreased by 0.78 mm, compared to the baseline period. Furthermore, the potential evapotranspiration and water storage change during the flood season during the changing period increased by 21.1~26.3 mm and 0.08~1.01 mm, respectively, compared to the baseline period. Additionally, the parameter n increased by 0.39~0.66 in all basins during the changing period.
The sensitivity coefficients of flood volume to each influencing factor can be obtained from Equation (11) (Table 5). The εP was positive and increased by 0.29~0.47, while εET0, εΔS, and εn were negative in all basins (Table 5). This indicates that flood volume is positively correlated with precipitation but negatively correlated with other factors. The εP during the changing period increased from 1.98~2.81 in all basins during the baseline period to 2.27~3.24 during the changing period, indicating that when precipitation increased by 10%, flood volume increased by 19.8%~28.1% before 2000 and 22.7%~32.4% after 2000. Conversely, when the potential evapotranspiration, water storage change, and parameter n increased by 10%, the flood volume decreased by 9.7%~17.3%, 0.07%~0.11%, and 14.5%~19.4% before 2000, and decreased by 12.6%~22.2%, 0.08%~0.21%, and 14.6%~19.4%, respectively, after 2000.
According to the absolute values of these four coefficients, εP was the largest value in all basins, indicating that flood volume was most sensitive to changes in precipitation. Furthermore, the sensitivities of runoff to changes in precipitation, potential evapotranspiration, and water storage change during the changing period increased compared to the baseline period in all basins. The impacts of parameter n increased in the Ruoergai and Dashui basins and decreased slightly in the other four basins.

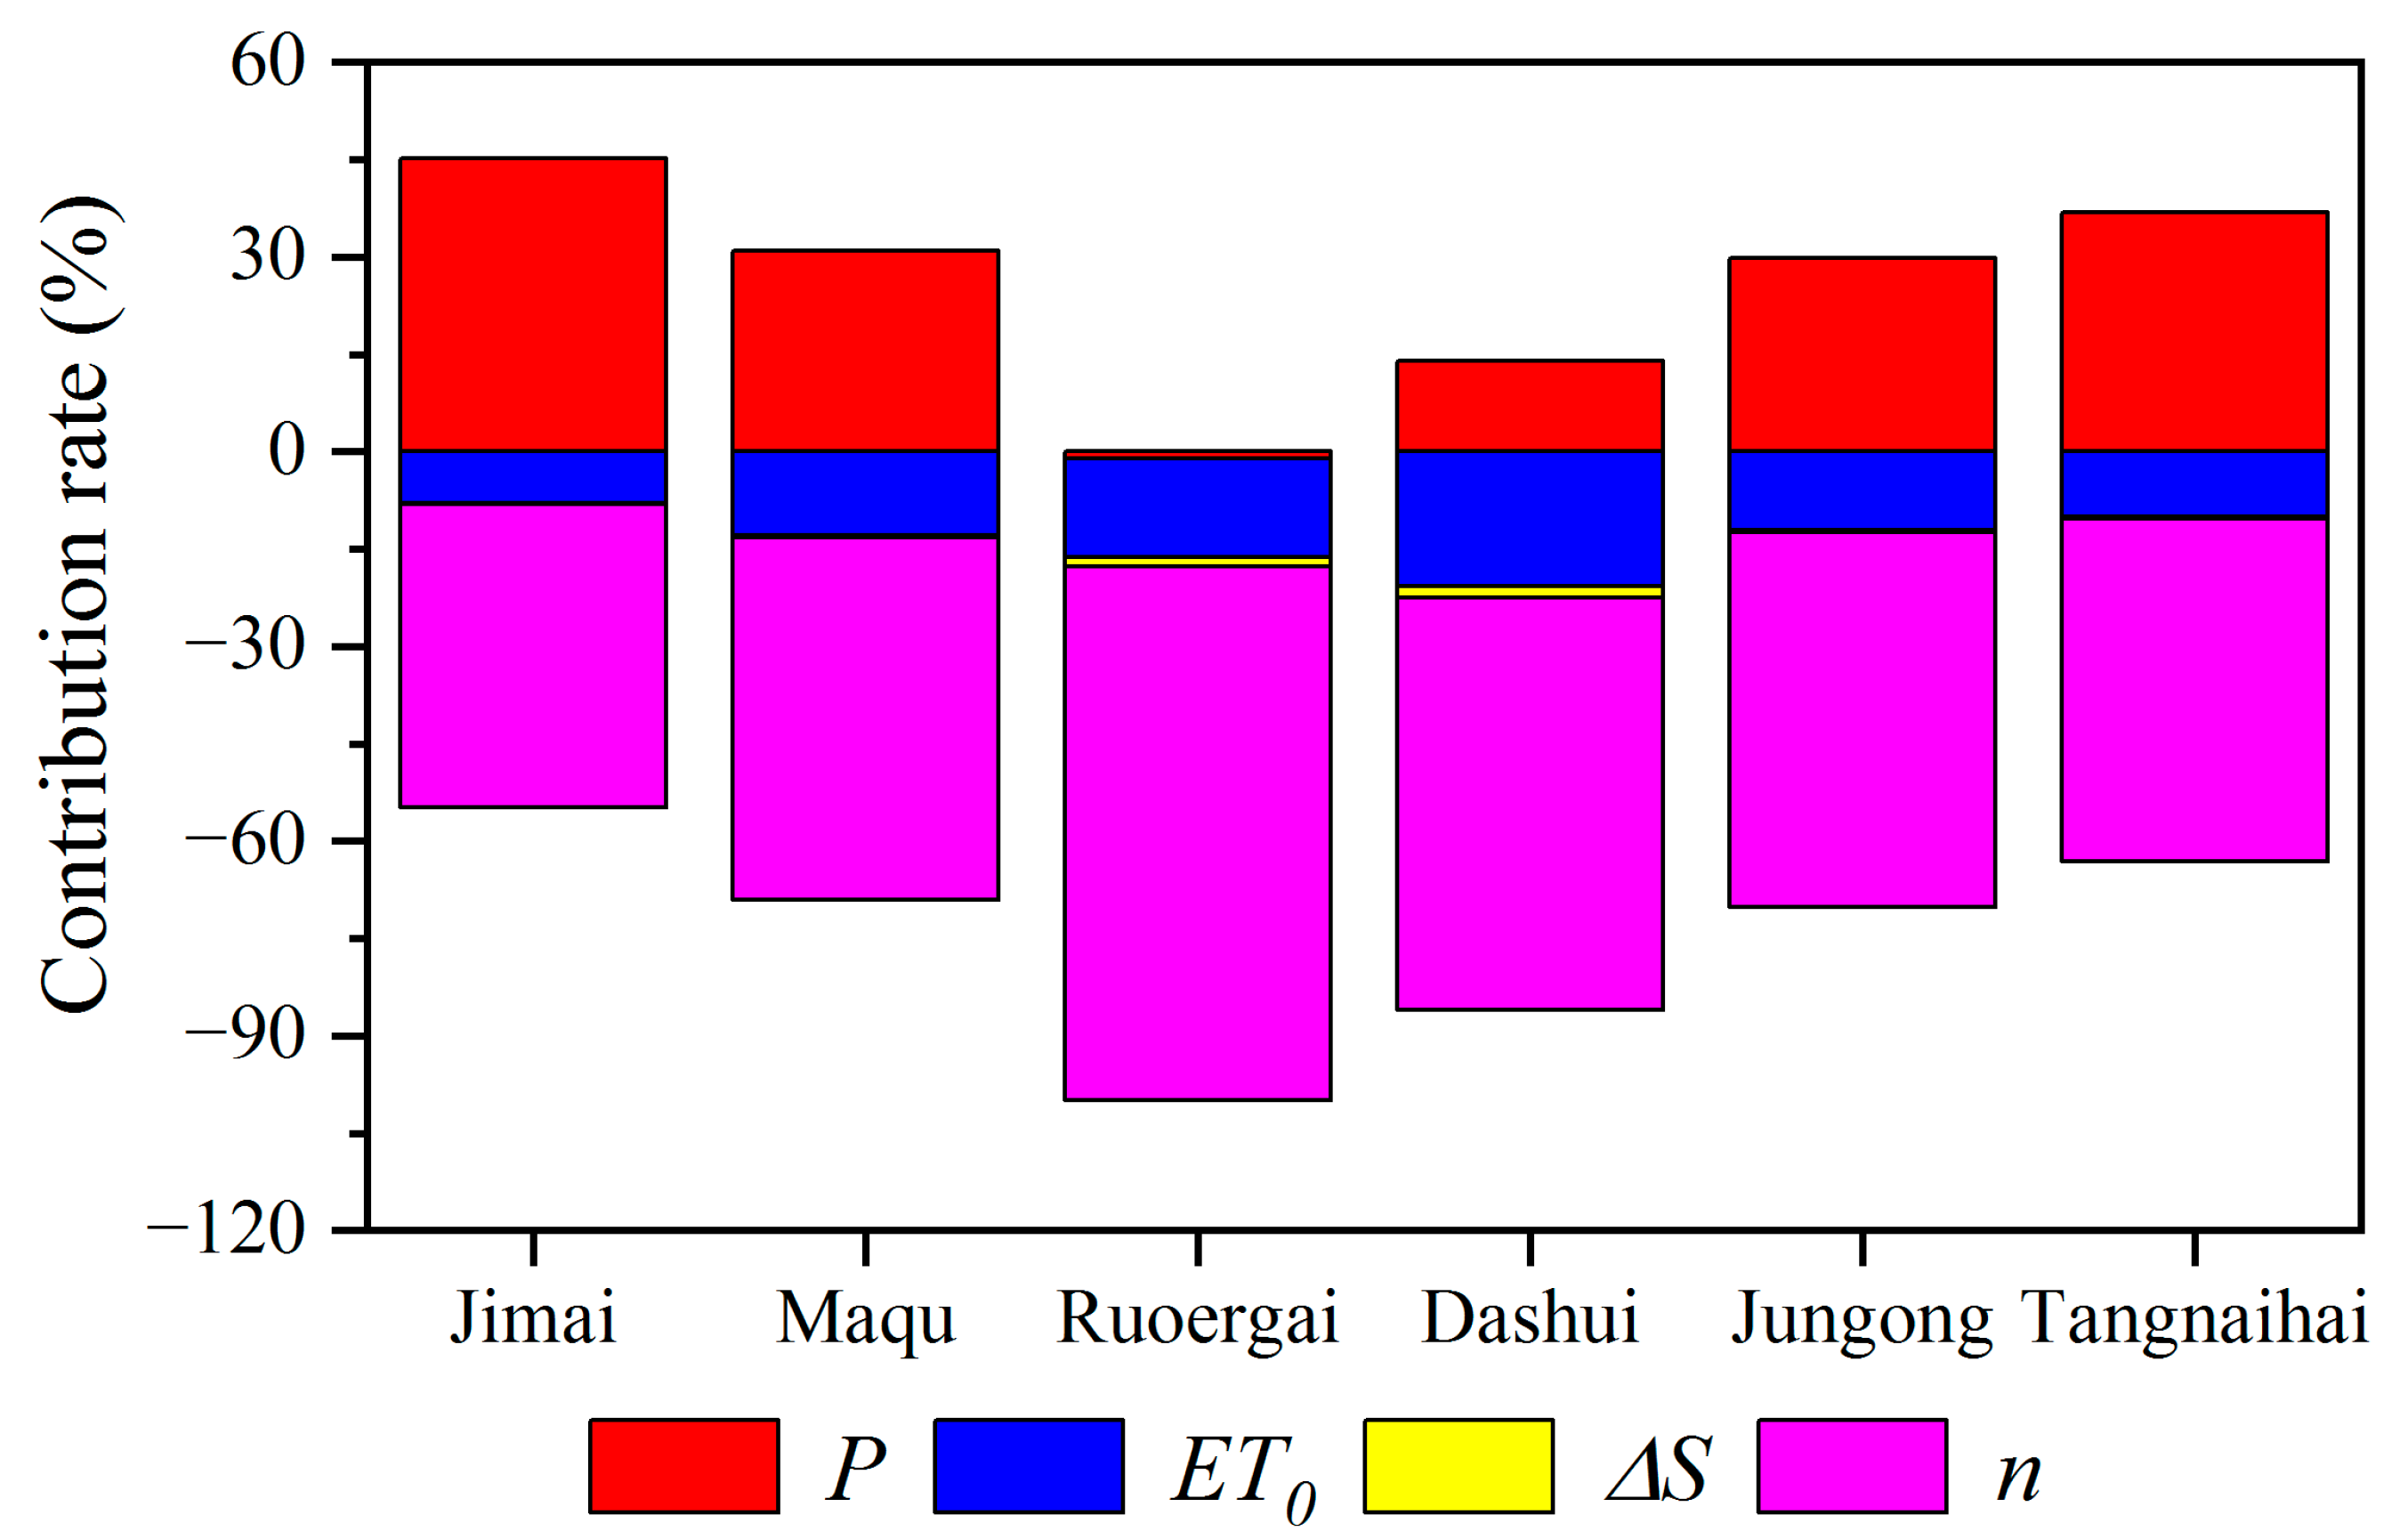
3.4. Contributions of Climatic and Landscape Factors to Flood Volume Variation

Compared with flood volume during the baseline period, the estimated flood volume during the changing period decreased by −20.04~−1.67 × 10⁸ m3 (Figure 5a). Moreover, the estimated flood volume change can explain 99% of the observed flood volume change at a significant level of 0.01 (Figure 5b), indicating that the method used was effective and robust in assessing the contributions of climatic and landscape factors to flood volume change.
Among the influencing factors, the contribution of changes in parameter n to flood volume variation was largest in all basins, with contribution rates ranging from −82.3% to −46.7% (Figure 6), followed by changes in precipitation in permafrost-dominated basins and changes in potential evapotranspiration in non-permafrost-dominated basins, respectively. The contribution rates of changes in precipitation to flood volume variation were positive in most basins, ranging from 13.9% to 45.2%, except in Ruoergai basin. In these basins, although precipitation increased during the changing period compared to the baseline period, the contribution of precipitation to flood volume reduction was less than that of landscape changes. In Ruoergai basin, the contribution of precipitation to the flood volume variation was −1.03%. The contribution rates of changes in potential evapotranspiration to flood volume variation ranged from −20.7% to −8.0%, whereas the contribution of water storage change ranged from −1.8% to −0.1%. In addition, the negative values of the contribution rates of potential evapotranspiration, water storage change, and landscape indicate that these factors contributed negatively to flood volume decrease. It is worth noting that while the impact of water storage change was relatively limited in permafrost-dominated basins, its significance in non-permafrost-dominated basins cannot be overlooked.
Overall, the contribution of precipitation was less than that of landscape change, while landscape change was the primary factor in flood volume reduction in all basins. This implies that the landscape factors such as soil moisture, vegetation growth, and permafrost degradation have a significant impact on flood volume variation in the SRYR and require further analysis.

4. Discussion

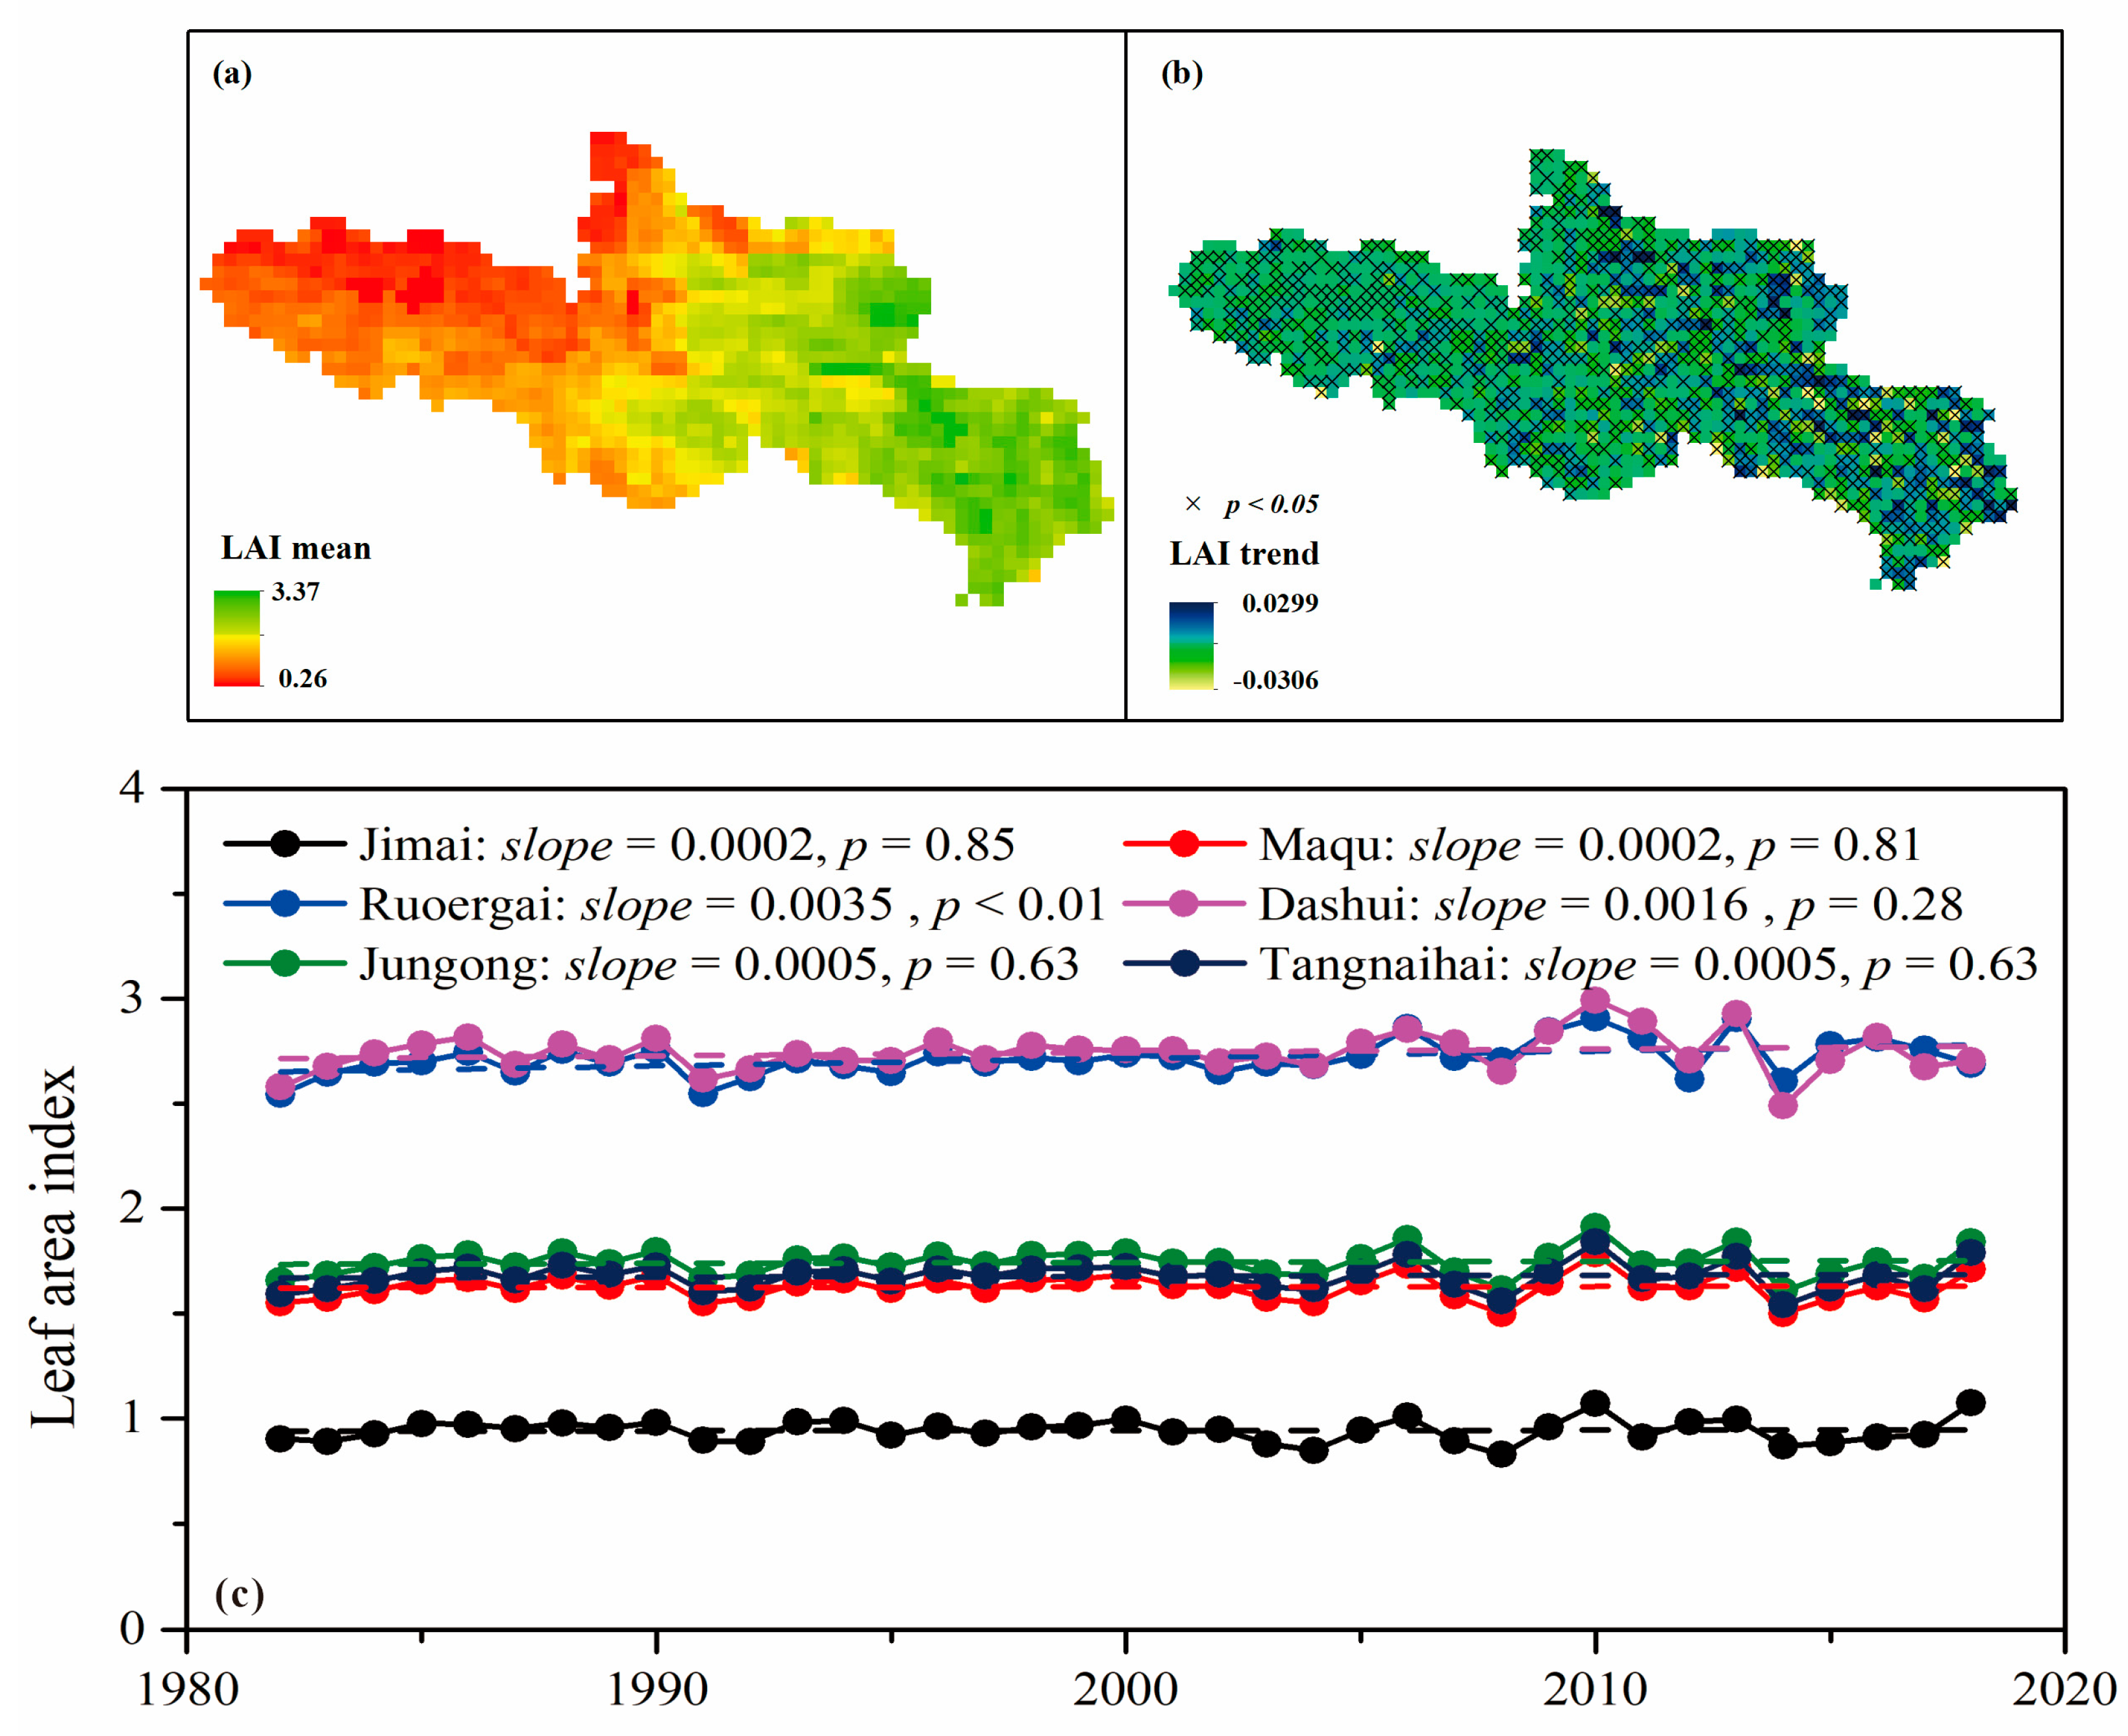
4.1. Impact of Vegetation Change on Flood Volume Variation

Previous studies have primarily focused on the attribution analysis of runoff change in the SRYR [10,20,42,43,44], while ignoring the effects of climate and landscape changes on flood volume variation within the basin. The impacts and hazards of floods on human society and the ecological environment are extremely profound and widespread. Therefore, it is imperative to study flood volume variation and its influencing factors in the SRYR. Besides climatic factors, such as precipitation and potential evapotranspiration, as well as their combined effect [28,57], landscape factors, such as vegetation change and permafrost degradation, are the main influencing factors in the SRYR [16,58]. By establishing the relationship between LAI, ALT, and parameter n based on Equation (8), the contribution of LAI and ALT to flood volume variation were calculated based on Equations (13)–(17). In the permafrost-dominated basins, LAI and ALT together can account for 73.2%~82.6% of the variation in parameter n. This finding underscores the significant role of these two factors in influencing flood volume variation.
In the SRYR, the multiyear (1982–2018) mean LAI showed an increase from northwest to southeast, ranging from 0.26 to 3.37 (Figure 7a). Furthermore, the multiyear mean LAI ranged from 0.94 (Jimai basin) to 2.75 (Dashui basin) at the basin scale. The LAI trends ranged from −0.0306 to 0.0299, while LAI in approximately 52.1% of the SRYR showed increasing trends (Figure 7b). The negative trends in LAI suggest that vegetation degradation has occurred in these areas. LAI showed increasing trends in all basins, while only the increasing trend in Ruoergai basin was significant (Figure 7c). This is an indication that the vegetation growth has improved to some extent and that ecological restoration measures are beginning to bear fruit.
In the basins with relatively high vegetation cover (i.e., Ruoergai and Dashui basins), the absolute contributions of LAI to flood volume variation were relatively high, with contributions of −19.7% and −6.7%, respectively (Figure 8a). The negative contribution of LAI means that an increase in LAI causes a decrease in flood volume. It is reasonable that the increased vegetation consumes more water through transpiration, reducing the surface runoff and thus flood volume [59]. Consequently, vegetation plays a crucial role in modulating water flow and storage, which in turn affects flood dynamics. In other basins with low vegetation cover (i.e., permafrost-dominated basins), the contribution of LAI to flood volume variation was limited, ranging from −0.87% to 0.18% (Figure 8a).

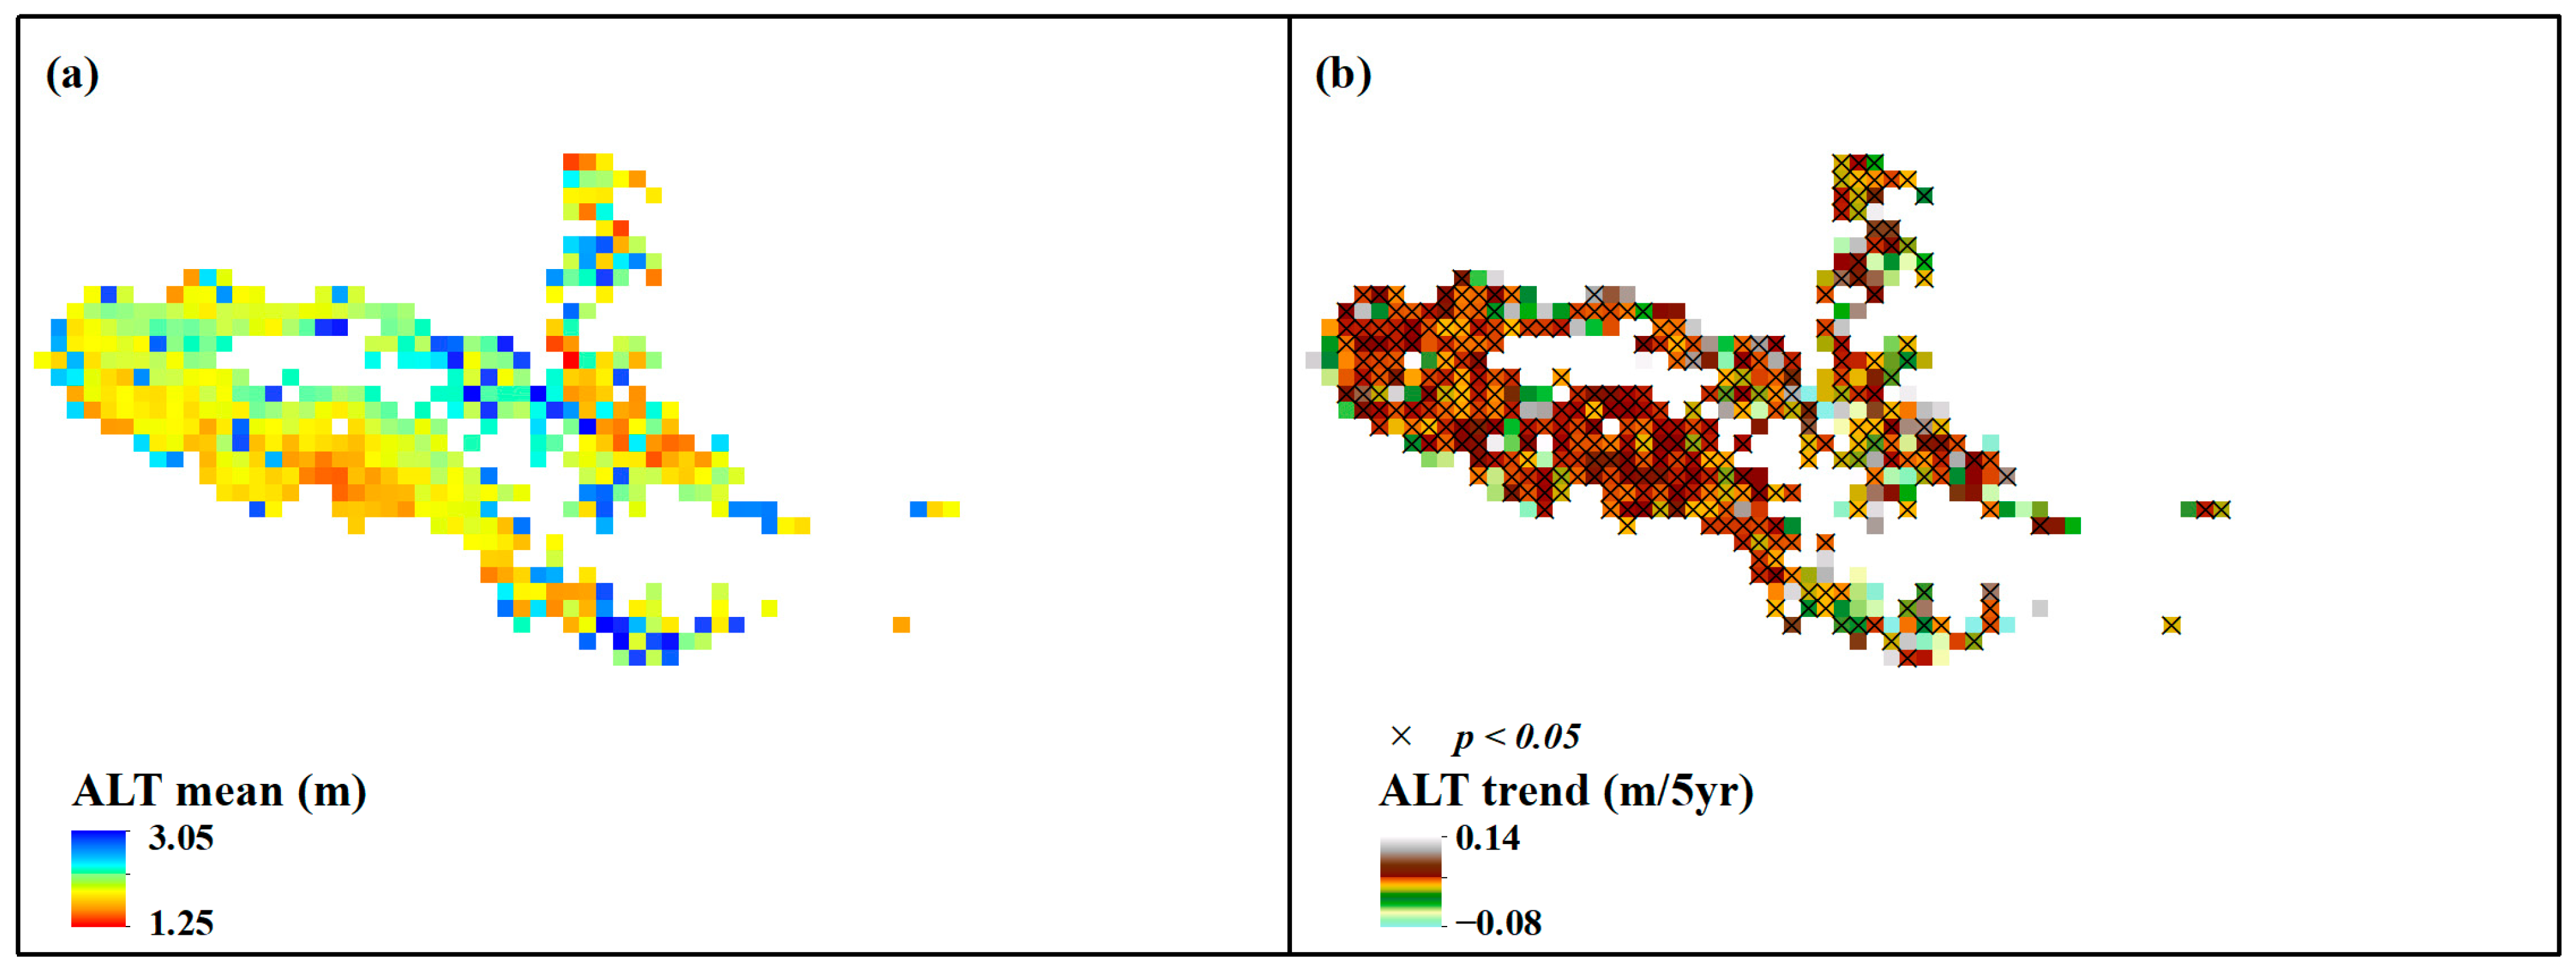
4.2. Impact of Permafrost Degradation on Flood Volume

The SRYR, a typical permafrost-dominated area, has experienced undeniable increases in active layer thickness and permafrost degradation due to climate warming [31,60]. The multiyear (1981–2020) mean active layer thickness ranged from 1.25 to 3.05 m, with a regional mean of 1.94 m (Figure 9a). Approximately 86.5% of the SRYR showed increasing trends in ALT, with 77.7% of the area being significant (Figure 9b). The deepening of the active layer thickness is an important and direct indicator of permafrost degradation. Therefore, the active layer thickness was used to quantify the impact of permafrost degradation on flood volume variation.
The relative contributions of active layer thickness change to flood volume variation ranged from −56.2% to −42% in permafrost-dominated basins (Figure 8b). That is, an increase in active layer thickness caused a decrease in flood volume. This finding is consistent with the results of Wang et al. [20,61], who stated that frozen ground degradation decreased streamflow in the SRYR. Permafrost degradation leads to more water infiltrating into deep aquifers and enlarges the capacity of groundwater, resulting in an increase in groundwater storage. This process is accompanied by a cascade of effects, such as an increase in soil temperature, a deepening of the active layer thickness, and the melting of ground ice [19,62,63]. While rising temperature contributes to permafrost thawing and potentially replenishes discharge, the permafrost thawing process enhances the soil infiltration capacity, which in turn causes a decrease in runoff and flood volume. However, there are still some contrary conclusions regarding the contribution of permafrost degradation to runoff change. For example, Chang et al. [29] demonstrated that permafrost degradation leads to an increase in runoff, with a contribution of 24.8% in the Upper Shule River Basin. Duan et al. [64] suggested that permafrost thawing caused an increase in annual streamflow in the upper Tahe river of northeastern China.
One plausible explanation for these different results could be the variability in permafrost characteristics, climatic conditions, and hydrological regimes in different basins. The impact of permafrost degradation on flood volume is not uniform and can vary significantly depending on specific basin characteristics. For example, in some basins, permafrost degradation may enhance the groundwater storage capacity or alter surface-subsurface water interactions, potentially leading to an increase in flood volume. Conversely, in basins like the SRYR, permafrost degradation may alter soil infiltration rates, vegetation cover, and active layer thickness, which together contribute to a decrease in flood volume. These contrasting results highlight the necessity for a nuanced understanding of the local and regional factors that govern permafrost–hydrology interactions.
This study emphasizes the importance of considering basin-specific characteristics when assessing the impact of permafrost degradation on flood volume. Future research should focus on disentangling these complex interactions by incorporating more influencing variables (i.e., catchment morphology, climate regimes, and soil properties) and conducting comparative analyses across different permafrost regions. Futhermore, in addition to assessing the contributions of permafrost degradation and vegetation growth to flood volume variation, future research should prioritize the development and implementation of long-term monitoring strategies, which are crucial for the accurate forecasting of flood risks in the SRYR. Given the detected changes in flood volume and climatic variables, such strategies will be essential for adapting water resource management practises to the changing conditions in the region.

4.3. Uncertainties

This study provides valuable insights into the evolution and attribution of flood volume. There are still several uncertainties which need to be focused on in future study. Firstly, the Budyko hypothesis states that each influencing factor is independent, yet in reality, theses variables are not always independent. The interaction between human activity and climate change can significantly affect flood volume, thereby exacerbating the flood hazards [65]. Therefore, future research will focus on understanding the intricate interplay between climate change and the anthropogenic factors that influence flood dynamics within each basin, which is paramount for devising effective strategies to mitigate flood risks and manage water resources sustainably in the SRYR. Secondly, the vegetation condition and active layer thickness were considered in analyzing the impact of parameter n on flood volume variation. Other related factors, such as terrain [55], land use change [28], and climate seasonality [66], were ignored to characterize parameter n, which could contribute to the uncertainty in attribution analysis. Thirdly, this study primarily considered the impact of climate change, vegetation growth, and permafrost degradation on flood volume variation, but some climate-related circulation indices were not considered. Climate can significantly influence regional precipitation and temperature through ocean–atmosphere circulation and atmospheric circulation [67,68,69,70]. Regional precipitation and temperature can further influence evapotranspiration, frozen soil thawing and freezing, and snowmelt, which in turn affect runoff and flood volume. For instance, the annual runoff at the Tangnaihai station was positively correlated with the Southern Oscillation Index (SOI), while it was significantly negatively correlated with the El Niño-Southern Oscillation (ENSO)-like index NINO3.4 [71]. An enhancement of the plateau summer monsoon contributed to increased precipitation in the SRYR, which in turn led to an increase in runoff [72]. Furthermore, an increase in the Westerly Circulation Index maybe the main driver for the flood peak decreasing in September in the SRYR [26]. Therefore, future study needs to focus on the impact of circulation on flood volume.

5. Conclusions

This study analyzed the flood volume patterns in the source region of the Yellow River based on long-term recorded observational data. The impacts of climate change, vegetation change, and permafrost degradation on flood volume variation were further investigated. The conclusions were drawn as follows:
(1)
Flood volume exhibited a downward trend before 2000, followed by a significant upward trend after 2000 in all basins. Compared to the average flood volume before 2000, the average flood volume since 2000 was reduced.
(2)
Flood volume was more sensitive to changes in precipitation, followed by landscape change.
(3)
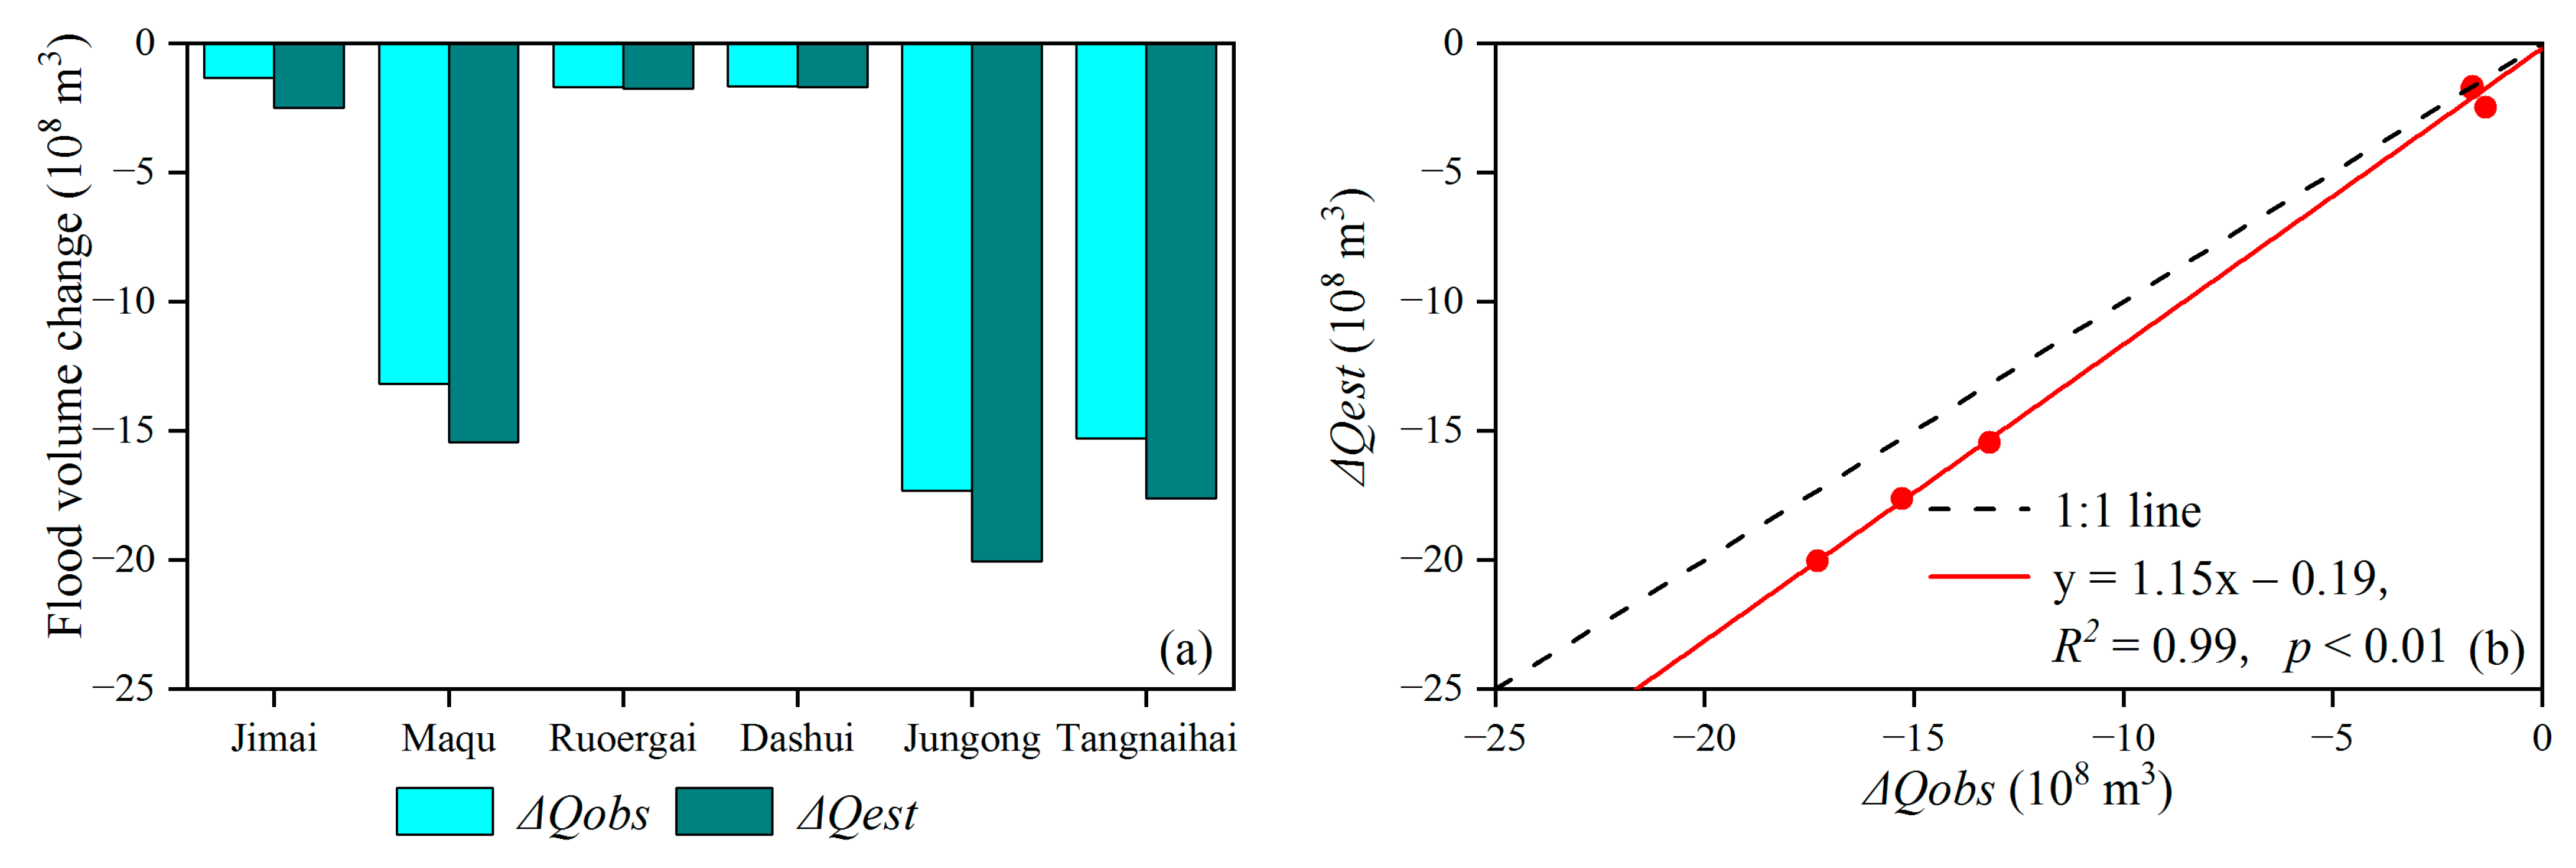
The estimated flood volume variation based on the Budyko framework can explain 99% of the observed flood volume variation, further indicating the robustness of the method used in this study.
(4)
In permafrost-dominated basins, flood volume variation was primarily affected by changes in active layer thickness, with relative contributions ranging from −56.2% to −42%, followed by changes in precipitation. In non-permafrost-dominated basins, the decrease in flood volume was primarily attributed to changes in landscape. The regulating effect of vegetation was greater in non-permafrost-dominated basins than in permafrost-dominated basins.
This study contributes to the understanding of the impacts of climate change, vegetation growth, and permafrost degradation on flood volume variation in the SRYR, which will have significant implications for water resource management and planning, necessitating adaptive strategies to promote sustainable and high-quality development throughout the Yellow River basin.

Supplementary Materials

The following supporting information can be downloaded at https://www.mdpi.com/article/10.3390/rs17081342/s1, Figure S1. Comparisons of monthly precipitation estimated by the four datasets against the observed monthly precipitation during the flood season at the (a) Huanghe, (b) Tangnaihai, (c) Jungong, (d) Mentang, (e) Tangke, and (f) Longriba rainfall stations, respectively; Figure S2: Ratio of flood volume to annual discharge in all stations.

Author Contributions

Conceptualization, J.W. and Y.D.; methodology, J.W.; software, J.W.; validation, D.S., Y.D. and Y.C.; formal analysis, D.S.; investigation, Y.D.; resources, Y.C.; data curation, J.W.; writing—original draft preparation, J.W.; writing—review and editing, D.S., Y.D. and Y.C.; visualization, J.W.; supervision, Y.C.; funding acquisition, J.W. and Y.C. All authors have read and agreed to the published version of the manuscript.

Funding

This research was funded by National Natural Science Foundation of China (Grant Nos. 42301013, 42371152, and 42330512), Natural Science Foundation of Gansu Province (Grant No. 23JRRA597), and 9th Young Elite Scientist Sponsorship Program by CAST (2023—2025).

Data Availability Statement

The original contributions presented in the study are included in the article, further inquiries can be directed to the corresponding author.

Acknowledgments

The authors greatly appreciate the National Tibetan Plateau Data Center for providing CMFD (http://data.tpdc.ac.cn/zh-hans/data/8028b944-daaa-4511-8769-965612652c49/, accessed on 18 June 2020), TPMFD (https://data.tpdc.ac.cn/zh-hans/data/44a449ce-e660-44c3-bbf2-31ef7d716ec7/, accessed on 10 March 2024), and active layer thickness (https://data.tpdc.ac.cn/zh-hans/data/e03ae441-0af2-4f57-b5b0-0a4f368f4015, accessed on 10 March 2024) datasets, the Climate Change Research Center, Chinese Academy of Sciences (https://ccrc.iap.ac.cn/, accessed on 10 March 2024) for providing the CN05.1 dataset, the European Centre for Medium Range Weather Forecasts (https://cds.climate.copernicus.eu/, accessed on 10 March 2024) for providing the ERA5-Land dataset, and Peking University for providing the GIMMS LAI4g dataset (https://zenodo.org/records/8281930, accessed on 10 March 2024). The authors would also thank the editors and the anonymous reviewers for all their helpful comments and advice.

Conflicts of Interest

The authors declare no conflicts of interest.

References

  1. Hallegatte, S.; Vogt-Schilb, A.; Bangalore, M.; Rozenberg, J. Unbreakable: Building the Resilience of the Poor in the Face of Natural Disasters (English); World Bank Group: Washington, DC, USA, 2017. [Google Scholar]
  2. McDermott, T.K.J. Global exposure to flood risk and poverty. Nat. Commun. 2022, 13, 3529. [Google Scholar] [CrossRef] [PubMed]
  3. Wahlstrom, M.; Guha-Sapir, D. The Human Cost of Weather-Related Disasters 1995–2015; UNISDR: Geneva, Switzerland, 2015; pp. 7–11. [Google Scholar]
  4. Intergovernmental Panel on Climate Change (IPCC). Climate Change 2021—The Physical Science Basis: Working Group I Contribution to the Sixth Assessment Report of the Intergovernmental Panel on Climate Change, 1st ed.; Cambridge University Press: Cambridge, UK, 2023; ISBN 978-1-00-915789-6. [Google Scholar]
  5. Hu, P.; Zhang, Q.; Shi, P.; Chen, B.; Fang, J. Flood-induced mortality across the globe: Spatiotemporal pattern and influencing factors. Sci. Total Environ. 2018, 643, 171–182. [Google Scholar] [CrossRef] [PubMed]
  6. Wang, Y.; Wang, S.; Wang, L.; Guo, X.; Zhou, J.; Chai, C.; Xu, J.; Li, X.; Fan, M.; Wang, S.; et al. Temporal and spatial changes in hydrological wet extremes of the largest river basin on the Tibetan Plateau. Environ. Res. Lett. 2023, 18, 104006. [Google Scholar] [CrossRef]
  7. Lan, H.; Zhao, Z.; Li, L.; Li, J.; Fu, B.; Tian, N.; Lai, R.; Zhou, S.; Zhu, Y.; Zhang, F.; et al. Climate change drives flooding risk increases in the Yellow River Basin. Geogr. Sustain. 2024, 5, 193–199. [Google Scholar] [CrossRef]
  8. Tellman, B.; Sullivan, J.A.; Kuhn, C.; Kettner, A.J.; Doyle, C.S.; Brakenridge, G.R.; Erickson, T.A.; Slayback, D.A. Satellite imaging reveals increased proportion of population exposed to floods. Nature 2021, 596, 80–86. [Google Scholar] [CrossRef]
  9. Alifu, H.; Hirabayashi, Y.; Imada, Y.; Shiogama, H. Enhancement of river flooding due to global warming. Sci. Rep. 2022, 12, 20687. [Google Scholar] [CrossRef]
  10. Blöschl, G.; Hall, J.; Parajka, J.; Perdigão, R.A.P.; Merz, B.; Arheimer, B.; Aronica, G.; Bilibashi, A.; Bonacci, O.; Borga, M.; et al. Changing climate shifts timing of European floods. Science 2017, 357, 588–590. [Google Scholar] [CrossRef]
  11. Blöschl, G.; Hall, J.; Viglione, A.; Perdigão, R.A.; Parajka, J.; Merz, B.; Lun, D.; Arheimer, B.; Aronica, G.; Bilibashi, A.; et al. Changing climate both increases and decreases European river floods. Nature 2019, 573, 108–111. [Google Scholar] [CrossRef]
  12. Do, H.X.; Westra, S.; Leonard, M.A. A global-scale investigation of trends in annual maximum streamflow. J. Hydrol. 2017, 552, 28–43. [Google Scholar] [CrossRef]
  13. Shin, S.; Pokhrel, Y.; Yamazaki, D.; Huang, X.; Torbick, N.; Qi, J.; Pattanakiat, S.; Ngo-Duc, T.; Nguyen, T.D. High resolution modeling of River-floodplain-reservoir inundation dynamics in the Mekong River Basin. Water Resour. Res. 2020, 56, e2019WR026449. [Google Scholar] [CrossRef]
  14. Wang, X.; Chen, D.; Pang, G.; Gou, X.; Yang, M. Historical and Future Climates over the Upper and Middle Reaches of the Yellow River Basin Simulated by a Regional Climate Model in CORDEX. Clim. Dyn. 2021, 56, 2749–2771. [Google Scholar] [CrossRef]
  15. Luo, D.; Jin, H.; Bense, V.F.; Jin, X.; Li, X. Hydrothermal processes of near-surface warm permafrost in response to strong precipitation events in the Headwater Area of the Yellow River, Tibetan Plateau. Geoderma 2020, 376, 114531. [Google Scholar] [CrossRef]
  16. Wang, T.; Yang, H.; Yang, D.; Qin, Y.; Wang, Y. Quantifying the streamflow response to frozen ground degradation in the source region of the Yellow River within the Budyko framework. J. Hydrol. 2018, 558, 301–313. [Google Scholar] [CrossRef]
  17. Zhang, T.; Li, D.; Lu, X. Response of runoff components to climate change in the source-region of the Yellow River on the Tibetan plateau. Hydrol. Process. 2022, 36, e14633. [Google Scholar] [CrossRef]
  18. Li, Z.; Lyu, S.; Chen, H.; Ao, Y.; Zhao, L.; Wang, S.; Zhang, S.; Meng, X. Changes in climate and snow cover and their synergistic influence on spring runoff in the source region of the Yellow River. Sci. Total Environ. 2021, 799, 149503. [Google Scholar] [CrossRef]
  19. Qin, Y.; Yang, D.; Gao, B.; Wang, T.; Chen, J.; Chen, Y.; Wang, Y.; Zheng, G. Impacts of climate warming on the frozen ground and eco-hydrology in the Yellow River source region, China. Sci. Total Environ. 2017, 605–606, 830–841. [Google Scholar] [CrossRef]
  20. Wang, W.; Zhang, Y.; Geng, X.; Tang, Q. Impact classification of future land use and climate changes on flow regimes in the Yellow River Source Region, China. J. Geophys. Res. Atmos. 2021, 126, e2020JD034064. [Google Scholar] [CrossRef]
  21. Meng, F.; Su, F.; Yang, D.; Tong, K.; Hao, Z. Impacts of recent climate change on the hydrology in the source region of the Yellow River basin. J. Hydrol. Reg. Stud. 2016, 6, 66–81. [Google Scholar] [CrossRef]
  22. Song, W.; Liu, H.; Cui, P.; Xu, M. Analysis of the characteristics of medium and small floods and reservoir operation in the Upper reaches of the Yellow River in recent years. Yellow River 2020, 42, 34–39. (In Chinese) [Google Scholar]
  23. Chu, C.; Ren, L. Analysis of the characteristics of floods in 2018 in the Source region of the Yellow River. Yellow River 2020, 42 (Suppl. S2), 14–16. (In Chinese) [Google Scholar]
  24. Yang, J.; Wang, T.; Yang, D.; Yang, Y. Insights into runoff changes in the source region of Yellow River under frozen ground degradation. J. Hydrol. 2023, 617, 128892. [Google Scholar] [CrossRef]
  25. Iqbal, M.; Wen, J.; Masood, M.; Masood, M.U.; Adnan, M. Impacts of Climate and Land-Use Changes on Hydrological Processes of the Source Region of Yellow River, China. Sustainability 2022, 14, 14908. [Google Scholar] [CrossRef]
  26. Sun, L.; Li, T.; Li, Q.; Wu, Y. Responses of autumn flood peak in the Yellow River source regions to westerly circulation index. J. Glaciol. Geocryol. 2019, 41, 1475–1482. (In Chinese) [Google Scholar]
  27. Yuan, F.; Wang, B.; Shi, C.; Cui, W.; Zhao, C.; Liu, Y.; Ren, L.; Zhang, L.; Zhu, Y.; Chen, T.; et al. Evaluation of hydrological utility of IMERG Final run V05 and TMPA 3B42V7 satellite precipitation products in the Yellow River source region, China. J. Hydrol. 2018, 567, 696–711. [Google Scholar] [CrossRef]
  28. Ni, Y.; Lv, X.; Yu, Z.; Wang, J.; Ma, L.; Zhang, Q. Intra-annual variation in the attribution of runoff evolution in the Yellow River source area. Catena 2023, 225, 107032. [Google Scholar] [CrossRef]
  29. Chang, Y.; Ding, Y.; Zhang, S.; Zhao, Q.; Jin, Z.; Qin, J.; Shangguan, D. Quantifying the response of runoff to glacier shrinkage and permafrost degradation in a typical cryospheric basin on the Tibetan Plateau. Catena 2024, 242, 108124. [Google Scholar] [CrossRef]
  30. Ji, G.; Wu, L.; Wang, L.; Yan, D.; Lai, Z. Attribution Analysis of Seasonal Runoff in the Source Region of the Yellow River Using Seasonal Budyko Hypothesis. Land 2021, 10, 542. [Google Scholar] [CrossRef]
  31. Jin, X.; Jin, H.; Luo, D.; Sheng, Y.; Wu, Q.; Wu, J.; Wang, W.; Huang, S.; Li, X.; Liang, S.; et al. Impacts of Permafrost Degradation on Hydrology and Vegetation in the Source Area of the Yellow River on Northeastern Qinghai-Tibet Plateau, Southwest China. Front. Earth Sci. 2022, 10, 845824. [Google Scholar] [CrossRef]
  32. Ma, L.; Liu, Z.; Zhao, B.; Lyu, J.; Zheng, F.; Xu, W.; Gan, X. Variations of runoff and sediment and their response to human activities in the source region of the Yellow River, China. Environ. Earth Sci. 2021, 80, 552. [Google Scholar] [CrossRef]
  33. Zeng, B.; Zhang, F.; Zeng, W.; Yan, K.; Cui, C. Spatiotemporal heterogeneity in runoff dynamics and its drivers in a water conservation area of the upper Yellow River Basin over the past 35 years. Remote Sens. 2022, 14, 3628. [Google Scholar] [CrossRef]
  34. Zhang, Y.; Ye, A. Quantitatively distinguishing the impact of climate change and human activities on vegetation in mainland China with the improved residual method. Gisci. Remote Sens. 2021, 58, 235–260. [Google Scholar] [CrossRef]
  35. Yan, D.; Zheng, X.; Feng, M.; Liang, S.; Hu, Z.; Kuang, X.; Feng, Y. Frozen Ground Change Data Set in the Tibetan Plateau (1961–2020); National Tibetan Plateau/Third Pole Environment Data Center. 2023. Available online: https://data.tpdc.ac.cn/en/data/e03ae441-0af2-4f57-b5b0-0a4f368f4015 (accessed on 10 March 2024).
  36. He, J.; Yang, K.; Tang, W.; Lu, H.; Qin, J.; Chen, Y.; Li, X. The first high-resolution meteorological forcing dataset for land process studies over China. Sci. Data 2020, 7, 25. [Google Scholar] [CrossRef] [PubMed]
  37. Wu, J.; Gao, X. A gridded daily observation dataset over China region and comparison with the other datasets. Chin. J. Geophys. 2013, 56, 1102–1111. (In Chinese) [Google Scholar]
  38. Wu, X.; Su, J.; Ren, W.; Lü, H.; Yuan, F. Statistical comparison and hydrological utility evaluation of ERA5-Land and IMERG precipitation products on the Tibetan Plateau. J. Hydrol. 2023, 620, 129384. [Google Scholar] [CrossRef]
  39. Yang, K.; Jiang, Y.; Tang, W.; He, J.; Shao, C.; Zhou, X.; Lu, H.; Chen, Y.; Li, X.; Shi, J. A high-resolution near-surface meteorological forcing dataset for the Third Pole region (TPMFD, 1979–2022); National Tibetan Plateau/Third Pole Environment Data Center. 2023. Available online: https://data.tpdc.ac.cn/en/data/44a449ce-e660-44c3-bbf2-31ef7d716ec7 (accessed on 10 March 2024).
  40. Jiang, Y.; Yang, K.; Qi, Y.; Zhou, X.; He, J.; Lu, H.; Li, X.; Chen, Y.; Li, X.; Zhou, B.; et al. TPHiPr: A long-term (1979–2020) high-accuracy precipitation dataset (1/30°, daily) for the Third Pole region based on high-resolution atmospheric modeling and dense observations. Earth Syst. Sci. Data 2023, 15, 621–638. [Google Scholar] [CrossRef]
  41. Muñoz, J. ERA5-Land Hourly Data from 1981 to Present—Copernicus Climate Change Service (C3S) Climate Data Store (CDS). 2019. Available online: https://cds.climate.copernicus.eu/datasets/reanalysis-era5-land?tab=download (accessed on 10 March 2024).
  42. Pelosi, A.; Terribile, F.; Urso, G.D. Comparison of ERA5-Land and UERRA MESCAN-SURFEX Reanalysis Data with Spatially Interpolated Weather Observations for the Regional Assessment of Reference Evapotranspiration. Water 2020, 12, 1669. [Google Scholar] [CrossRef]
  43. Gourgouletis, N.; Gkavrou, M.; Baltas, E. Comparison of Empirical ET0 Relationships with ERA5-Land and In Situ Data in Greece. Geographies 2023, 3, 499–521. [Google Scholar] [CrossRef]
  44. Li, F.; Kusche, J.; Chao, N.; Wang, Z.; Löcher, A. Long-term (1979-present) Total Water Storage Anomalies Over the Global Land Derived by Reconstructing GRACE data. Geophys. Res. Lett. 2021, 48, e2021GL093492. [Google Scholar] [CrossRef]
  45. Zhou, X.; Sheng, Z.; Manevksi, K.; Zhao, R.; Zhang, Q.; Yang, Y.; Han, S.; Liu, J.; Yang, Y. Can system dynamics explain long-term hydrological behaviors? The role of endogenous linking structure. Hydrol. Earth Syst. Sci. 2025, 29, 159–177. [Google Scholar] [CrossRef]
  46. Wei, L.; Zhao, W.; Wu, C.; Feng, X.; Song, D. Identification of dominant drivers of streamflow spatiotemporal variations in typical mountainous areas in the Hexi Corridor, China. J. Hydrol. Reg. Stud. 2024, 56, 102024. [Google Scholar] [CrossRef]
  47. Cao, S.; Li, M.; Zhu, Z.; Wang, Z.; Zha, J.; Zhao, W.; Duanmu, Z.; Chen, J.; Zheng, Y.; Chen, Y.; et al. Spatiotemporally consistent global dataset of the GIMMS Leaf Area Index (GIMMS LAI4g) from 1982 to 2020. Earth Syst. Sci. Data 2023, 15, 4877–4899. [Google Scholar] [CrossRef]
  48. Sun, S.; Bi, Z.; Mu, M.; Liu, Y.; Zhang, Y.; Li, J.; Liu, Y.; Zhou, Y.; Zhou, B.; Chen, H. Quantifying impacts of vegetation greenness change on drought over global vegetation zones. Geophys. Res. Lett. 2025, 52, e2024GL111634. [Google Scholar] [CrossRef]
  49. Wu, C.; Yeh, P.J.-F.; Yao, T.; Gong, Z.; Niu, J.; Yuan, S. Controls of climate seasonality and vegetation dynamics on the seasonal variability of terrestrial water storage under diverse climate regimes. Water Resour. Res. 2025, 61, e2024WR038065. [Google Scholar] [CrossRef]
  50. Chang, Y.; Ding, Y.; Zhang, S.; Shangguan, D.; Qin, J.; Zhao, Q. Contribution of climatic variables and their interactions to reference evapotranspiration changes considering freeze-thaw cycles in the Tibetan Plateau during 1960–2022. Atmos. Res. 2024, 305, 107425. [Google Scholar] [CrossRef]
  51. Ning, T.; Li, Z.; Feng, Q.; Li, Z.; Qin, Y. Attribution of growing season evapotranspiration variability considering snowmelt and vegetation changes in the arid alpine basins. Hydrol. Earth Syst. Sci. 2021, 25, 3455–3469. [Google Scholar] [CrossRef]
  52. Liu, J.; Zhang, Q.; Feng, S.; Gu, X.; Singh, V.P.; Sun, P. Global Attribution of Runoff Variance Across Multiple Timescales. J. Geophys. Res. Atmos. 2019, 124, 13962–13974. [Google Scholar] [CrossRef]
  53. Budyko, M.I. Climate and Life; Academic Press: New York, NY, USA, 1974. [Google Scholar]
  54. Fu, B.P. On the calculation of the evaporation from land surface. Chin. J. Atmos. Sci. 1981, 5, 23–31. (In Chinese) [Google Scholar]
  55. Zhou, G.; Wei, X.; Chen, X.; Zhou, P.; Liu, X.; Xiao, Y.; Sun, G.; Scott, D.F.; Zhou, S.; Han, L.; et al. Global pattern for the effect of climate and land cover on water yield. Nat. Commun. 2015, 6, 5918. [Google Scholar] [CrossRef]
  56. Yang, L.; Feng, Q.; Ning, T.; Lu, X.; Zhu, M.; Yin, X.; Wang, J. Attributing the streamflow variation by incorporating glacier mass balance and frozen ground into the Budyko framework in alpine rivers. J. Hydrol. 2024, 628, 130438. [Google Scholar] [CrossRef]
  57. Iqbal, M.; Wen, J.; Wang, X.; Lan, Y.; Tian, H.; Anjum, M.N.; Adnan, M. Assessment of air temperature trends in the source region of yellow river and its sub-basins, China. Asia-Pac. J. Atmos. Sci. 2018, 54, 111–123. [Google Scholar] [CrossRef]
  58. Zheng, Z.; Lv, M.; Ma, Z. Climate, hydrology, and vegetation coverage changes in source region of yellow river and countermeasures for challenges. Bull. Chin. Acad. Sci. 2020, 35, 61–72. [Google Scholar]
  59. Wang, Y.; Wang, L.; Zhou, J.; Chai, C.; Hu, Z.; Zhao, L.; Wang, S.; Fan, M. Impacts of frozen ground degradation and vegetation greening on upper Brahmaputra runoff during 1981–2019. Int. J. Climatol. 2023, 43, 3768–3781. [Google Scholar] [CrossRef]
  60. Cao, H.; Gao, B.; Gong, T.; Wang, B. Analyzing Changes in Frozen Soil in the Source Region of the Yellow River Using the MODIS Land Surface Temperature Products. Remote Sens. 2021, 13, 180. [Google Scholar] [CrossRef]
  61. Wang, T.; Yang, D.; Yang, Y.; Zheng, G.; Jin, H.; Li, X.; Yao, T.; Cheng, G. Pervasive permafrost thaw exacerbates future risk of water shortage across the Tibetan Plateau. Earth’s Future 2023, 11, e2022EF003463. [Google Scholar] [CrossRef]
  62. Wang, T.; Yang, D.; Yang, Y.; Zheng, G.; Jin, H.; Li, X.; Yao, T.; Cheng, G. Unsustainable water supply from thawing permafrost on the Tibetan Plateau in a changing climate. Sci. Bull. 2023, 68, 1105–1108. [Google Scholar] [CrossRef]
  63. Zhao, Y.; Yao, Y.; Jin, H.; Cao, B.; Hu, Y.; Ran, Y.; Zhang, Y. Characterizing the changes in permafrost thickness across Tibetan Plateau. Remote Sens. 2023, 15, 206. [Google Scholar] [CrossRef]
  64. Duan, L.; Man, X.; Kurylyk, B.L.; Cai, T.; Li, Q. Distinguishing streamflow trends caused by changes in climate, forest cover, and permafrost in a large watershed in northeastern China. Hydrol. Process. 2017, 31, 1938–1951. [Google Scholar] [CrossRef]
  65. Munoz, S.E.; Giosan, L.; Therrell, M.D.; Remo, J.W.; Shen, Z.; Sullivan, R.M.; Wiman, C.; O’Donnell, M.; Donnelly, J.P. Climatic control of Mississippi River flood hazard amplified by river engineering. Nature 2018, 556, 95–98. [Google Scholar] [CrossRef]
  66. Ning, T.; Li, Z.; Liu, W. Vegetation dynamics and climate seasonality jointly control the interannual catchment water balance in the Loess Plateau under the Budyko framework. Hydrol. Earth Syst. Sci. 2017, 21, 1515–1526. [Google Scholar] [CrossRef]
  67. Lü, A.; Jia, S.; Zhu, W.; Yan, H.; Duan, S.; Yao, Z. El Niño-Southern Oscillation and water resources in the headwaters region of the Yellow River: Links and potential for forecasting. Hydrol. Earth Syst. Sci. 2011, 15, 1273–1281. [Google Scholar] [CrossRef]
  68. Nalley, D.; Adamowski, J.; Biswas, A.; Gharabaghi, B.; Hu, W. A multiscale and multivariate analysis of precipitation and streamflow variability in relation to ENSO, NAO and PDO. J. Hydrol. 2019, 574, 288–307. [Google Scholar] [CrossRef]
  69. Xu, R.; Qiu, D.; Gao, P.; Wu, C.; Mu, X.; Ismail, M. Prediction of streamflow based on the long-term response of streamflow to climatic factors in the source region of the Yellow River. J. Hydrol. Reg. Stud. 2024, 52, 101681. [Google Scholar] [CrossRef]
  70. Yang, T.; Asanjan, A.A.; Welles, E.; Gao, X.; Sorooshian, S.; Liu, X. Developing reservoir monthly inflow forecasts using artificial intelligence and climate phenomenon in formation. Water Resour. Res. 2017, 53, 2786–2812. [Google Scholar] [CrossRef]
  71. Lü, A.; Jia, S.; Wang, S.; Yan, H.; Yang, G. Relationship between streamflow and the indices of ENSO and PDO. South-North Transf. Water Sci. Technol. 2010, 8, 49–52. (In Chinese) [Google Scholar]
  72. Wang, H.; Li, D.; Jiang, Y. Characteristics and reasons of the runoff variation in source regions of the Yellow River during 1956–2012. J. Glaciol. Geocryol. 2014, 36, 403–412. (In Chinese) [Google Scholar]
Figure 1. Geographical location of the source region of the Yellow River.
Remotesensing 17 01342 g001
Figure 2. Variation in flood volume at the (a) Jimai, (b) Maqu, (c) Ruoergai, (d) Dashui, (e) Jungong, and (f) Tangnaihai hydrological stations during their longest observation periods. The red and blue lines are the fitted lines of annual flood volume before and after 2000, respectively. The black line is the fitted line of annual flood volume during the long-time period.
Remotesensing 17 01342 g002
Figure 3. Spatial variation in the multiyear (1980–2018) mean precipitation (a), potential evapotranspiration (b), and water storage change (c) during the flood season and their corresponding trends (df) from 1980 to 2018, respectively.
Remotesensing 17 01342 g003
Figure 4. Temporal variation in basin-averaged precipitation, potential evapotranspiration, water storage change during the flood season, and corresponding flood volume at the (ad) Jimai, (eh) Maqu, (il) Ruoergai, (mp) Dashui, (qt) Jungong, and (ux) Tangnaihai basins from 1980 to 2018, respectively. The red and blue dots represent values before and after 2000, respectively. The red and blue lines represent the linear fitted lines of the corresponding variable before and after 2000, respectively.
Remotesensing 17 01342 g004
Figure 5. (a) Bar chart of observed (ΔQobs) and estimated flood volume change by Budyko Equation (ΔQest) at the six basins; (b) comparison of ΔQobs and ΔQest.
Remotesensing 17 01342 g005
Figure 6. Relative contributions of climatic and landscape factors to flood volume variation.
Remotesensing 17 01342 g006
Figure 7. Spatial distribution of (a) the multiyear mean LAI and (b) LAI trends from 1982 to 2018, and (c) temporal variations in LAI from 1982 to 2018.
Remotesensing 17 01342 g007
Figure 8. Relative contributions of (a) LAI and (b) ALT to flood volume variation at different basins.
Remotesensing 17 01342 g008
Figure 9. Spatial distribution of (a) the multiyear mean ALT and (b) ALT trends from 1981 to 2020.
Remotesensing 17 01342 g009
Table 1. Information on hydrological stations.
StationLongitude (°E)Latitude (°N)Catchment Area (km2)Timespan
Jimai99.6533.7745,0191958–2021
Maqu102.0833.9786,0481959–2021
Jungong100.6534.7098,4141980–2021
Tangnaihai100.1535.50121,9721956–2021
Dashui102.2733.9874211984–2021
Ruoergai102.9333.6040011980–2021
Table 2. Information of rainfall stations.
StationLongitude (°E)Latitude (°N)Timespan
Huanghe98.2734.602006–2018
Tangnaihai100.1535.502006–2018
Jungong100.6534.702006–2018
Mentang101.0533.772006–2018
Tangke102.4733.422006–2018
Longriba102.3732.452008–2018
Table 3. Characteristics of flood volume variation at the six hydrological stations.
StationAverage (108 m3)CvSlope
2000 b2000 aWhole2000 b2000 aWhole2000 b2000 aWhole
Jimai29.831.730.60.410.400.40−0.0360.901 *0.069
Maqu106.1102.6105.20.290.340.31−0.2722.702 *−0.031
Ruoergai6.45.46.00.400.520.46−0.2670.266 **−0.028
Dashui7.26.56.80.400.590.51−0.2480.381 **0.038
Jungong127.3120.7124.70.330.350.34−3.841 **3.45 *−0.222
Tangnaihai145.7145.8145.80.310.330.31−0.1263.873 *0.087
Note: the superscripts “b” and “a” of 2000 mean “before” and “after”, respectively. “Whole” represents the longest observational period for each station. * and ** represent statistical significances at 0.05 and 0.01 levels, respectively.
Table 4. Trends in flood season precipitation, potential evapotranspiration, water storage change, and flood volume during 1980–1999 and 2000–2018.
Variable PeriodJimaiMaquRuoergaiDashuiJungongTangnaihai
Precipitation
(mm/yr)
1980–1999−1.96−3.25 *−3.89−6.01 *a−3.43−2.65
2000–20180.851.983.322.722.192.55
Potential evapotranspiration (mm/yr)1980–19991.220.960.230.45 a0.880.84
2000–2018−0.38−0.46−0.34−0.59−0.54−0.47
Water storage change (mm/yr)1980–19990.008−0.010−0.060−0.056 a−0.015−0.020
2000–2018−0.074−0.076−0.096−0.089−0.074−0.069
Flood volume
(108 m3/yr)
1980–1999−0.94−2.89−0.28 **−0.24 a−3.85 *−4.39 *
2000–20180.431.48 *0.21 *0.28 *2.242.70
Note: The superscript “a” indicates the study period in the Dashui basin from 1985 to 1999. * and ** represent statistical significances.
Table 5. Hydroclimatic characteristics and sensitivity coefficients in different periods.
BasinPeriodQ (108 m3)R (mm)P (mm)ET0 (mm)ΔS (mm)nεPεET0εΔSεn
Jimai1980–199930.3967.5321.42460.621.242.632.39−1.38−0.009−1.94
2000–201829.0464.51381.02481.721.323.292.86−1.85−0.010−1.74
Δ−1.35−2.9959.621.10.080.660.47−0.47−0.0010.20
Maqu1980–1999108.13125.66412.90484.541.472.322.03−1.02−0.007−1.49
2000–201894.94110.34438.13507.631.752.712.32−1.31−0.008−1.48
Δ−13.18−15.3225.2323.090.280.390.29−0.29−0.0020.01
Ruoergai1980–19996.54163.55501.72572.022.52.342.04−1.03−0.009−1.45
2000–20184.87121.67500.94598.333.552.772.41−1.40−0.017−1.59
Δ−1.68−41.89−0.7826.301.050.430.37−0.36−0.007−0.13
Dashui1985–19997.3098.31480.47566.522.063.262.81−1.8−0.011−1.59
2000–20185.6476.00489.59590.913.223.773.24−2.22−0.021−1.71
Δ−1.66−22.3110.6924.381.160.510.43−0.42−0.011−0.11
Jungong1980–1999129.17131.25415.10486.491.492.271.99−0.98−0.007−1.47
2000–2018111.86113.66440.81509.731.792.672.29−1.28−0.009−1.46
Δ−17.31−17.5925.7123.240.300.410.30−0.30−0.0020.01
Tangnaihai1980–1999149.86122.86396.19487.531.482.231.98−0.97−0.007−1.56
2000–2018134.58110.34431.25509.721.762.632.27−1.26−0.009−1.50
Δ−15.28−12.5335.0622.190.280.400.29−0.29−0.0020.06
Note: Δ means the difference between the values during 2000–2018 and 1980–1999.
Disclaimer/Publisher’s Note: The statements, opinions and data contained in all publications are solely those of the individual author(s) and contributor(s) and not of MDPI and/or the editor(s). MDPI and/or the editor(s) disclaim responsibility for any injury to people or property resulting from any ideas, methods, instructions or products referred to in the content.

