Article

A Multi-Directional Pyranometer (CUBE-i) for Real-Time Direct and Diffuse Solar Irradiance Decomposition

Department of Architectural Engineering, Keimyung University, Daegu 42601, Republic of Korea
Remote Sens. 2025, 17(8), 1336; https://doi.org/10.3390/rs17081336
Submission received: 27 February 2025 / Revised: 5 April 2025 / Accepted: 7 April 2025 / Published: 9 April 2025

Abstract

:
Conventional decomposition models (empirical and numerical decomposition models) estimate direct normal irradiance (DNI) and diffuse horizontal irradiance (DHI) from global horizontal irradiance (GHI) based on empirical correlations or physical equations. These models are designed for long-term averaged data, typically at an hourly or longer timescale, making them less suitable for real-time estimations with shorter time intervals. To address this limitation, this study applies a data-driven approach utilizing multi-directional irradiance measurements and develops a DNI estimation model based on a Deep Neural Network (DNN). The proposed CUBE-i system estimates DNI using irradiance measurements from five directional pyranometers. The measurement data were obtained from the NREL site in Golden, Colorado, USA. The proposed method demonstrates high estimation accuracy at a 1 min resolution, achieving R2 = 0.997 and RMSE = 20.2 W/m2. Furthermore, in estimating both direct and diffuse irradiance on a horizontal plane, the model outperforms conventional empirical decomposition models (Erbs, Reindl, Watanabe), achieving up to five times lower RMSE and higher R2 values. While further considerations regarding sensor accuracy, applicability to different regions, and installation requirements are necessary, this study validates the feasibility of real-time DNI estimation using a compact and cost-effective pyranometer system. This advancement enhances its potential for widespread applications in solar energy systems, building energy management, meteorology, and environmental research.

1. Introduction

The climate and energy crises have led to urgent interest in the widespread adoption of renewable energy and energy conservation [1]. Solar energy is a representative clean resource that has been widely utilized in various fields, including climate and environmental research, agriculture and ecology, photovoltaic (PV) and solar thermal energy, as well as building and industrial applications. Solar irradiance information is typically obtained as global horizontal irradiance (GHI), which is either directly measured using commercially available pyranometers or provided through regional weather stations (public meteorological data).
The rapid advancement in geometric modeling and analysis techniques has enabled the distinction between the effects of direct and diffuse irradiance, allowing for a more detailed analysis of various systems. Studies utilizing detailed solar irradiance data have been conducted across various fields, including the evaluation and monitoring of indoor thermal environments considering direct and diffuse solar irradiance entering through building windows [2,3,4,5,6]—prediction of indoor solar radiation distribution [2], estimation of mean radiant temperature (MRT) considering human geometry [3], implementation of MRT sensors in buildings [4], effects of solar radiation on indoor comfort [5], derivation of representative MRT values considering solar effects [6]; shading device control [7,8,9]—automation of shading systems [7], optimized control of shading and lighting systems [8], energy performance of building with adaptive shading [9]; photovoltaic (PV) power generation [10,11,12]—irradiance-based PV output prediction [10], aerosol and cloud impact on PV efficiency [11], performance monitoring of PV systems under dynamic shading [12]; control of PV-integrated shading devices [13,14]—PVSD design and control [13], PVSD multi-objective optimization [14]; assessment of driver thermal comfort in vehicles [15], urban thermal environment analysis [16,17]—MRT prediction in urban contexts [16], MRT prediction in street canyons considering urban surroundings [17]; and research on forest ecological environments [18]. The results of these studies have demonstrated that detailed analytical methods utilizing direct and diffuse irradiance enable more precise system design, control, and evaluation, thereby providing diverse alternatives for optimization. In order for these analysis results and methodologies to be effectively applied in the field, accurate information on direct and diffuse radiation is essential.
The most accurate measuring instrument for solar irradiance is the pyrheliometer, which is combined with a sun-tracking device to measure direct normal irradiance (DNI). Additionally, a diffusometer, in which a pyranometer is installed with a shadow ring, is used to measure diffuse horizontal irradiance. The devices can measure direct and diffuse solar irradiance by excluding either the direct or diffuse component, thereby determining direct and diffuse irradiance by calculating the difference from the global irradiance measurement. However, the installation of pyrheliometers and diffusometers may pose challenges in terms of space allocation, maintenance, and cost.
As an alternative, methods based on traditional empirical models can be adopted, even though they may have relatively lower accuracy. The decomposition model enables the differentiation of the total solar irradiance measured using a single pyranometer into direct and diffuse components. Extraterrestrial solar irradiance entering the Earth is affected by atmospheric conditions, which influence both the amount and composition of solar radiation reaching the surface. In particular, cloud cover [19] and air pollution [20] conditions have been reported to closely influence the reduction in transmitted direct irradiance. These effects are characterized as an index reflecting atmospheric conditions, defined as the clearness index ( K t ). Empirical models have primarily been developed based on K t as the key variable, with various correction factors—such as the diffuse fraction ( K d ) and solar altitude (β)—incorporated to estimate direct normal irradiance (DNI). Orgill et al. [21] used the correlation between K t and K d , while Erbs et al. [22] extended this approach to the Northern Hemisphere by proposing a K d formulation for broader applicability. Watanabe et al. [23] developed a DNI estimation model using K t and a K d model based on measurement data from the Fukuoka region. Reindl et al. [24] considered K t and solar altitude (β), whereas Louche et al. [25] accounted for K t and beam transmittance ( K b ). Perez et al. [26,27] further improved the model by incorporating K t , K d , and an insolation-dependent factor derived from the modified Maxwell DISC model [28]. These empirical models have been widely utilized not only in building energy and photovoltaic system design simulations but also in various industrial field monitoring applications over an extended period. Such empirical models provide explicit equations based on measured data, allowing for clear physical interpretation. Generally, these models exhibit characteristics of a “white-box model” as the relationships between inputs and outputs are defined.
By using multiple pyranometers, studies incorporating physical equations alongside optimization methods have been conducted. These studies aim to determine the optimal solutions for unknown variables in physical equations. This approach can be considered as a gray-box modeling technique due to its combination of physical equations and optimization techniques. The concept of this method is not widely known but was first introduced by B. Steinmuller [29] in 1980, who proposed the two-solarimeter method using two pyranometers installed on a horizontal and tilted surface. This approach was based on the assumption that if global irradiance values were given for pyranometers mounted on different tilted surfaces, a mathematically explainable relationship could be established between the measured values and the direct and diffuse irradiance components reaching the surface. In 1987, L. O. Lamm et al. [30] further refined Steinmuller’s concept by proposing an optimal tilt angle of −80° (80° north facing) for the vertical sensor modules. In the same year, Faiman et al. [31] expanded on this approach by increasing the number of sensors to four pyranometers, defining a multi-pyranometer (MP) system positioned at 90° northward tilt, 30° southward tilt, 60° eastward tilt, and 60° westward tilt. In this study, the concept of effective beam irradiance was introduced, and a simulation-based sensitivity analysis was conducted to evaluate the optimal sensor configuration. The concept of the MP was later implemented and validated in practice by Faiman et al. [32] in 1992. The least squares method was applied to determine optimal correction coefficients (A, B) for unknowns in the DNI calculation process. Through this model, 10 min interval global irradiance and DNI for tilted surfaces were estimated where no pyranometers were installed and the results were compared with those from the Perez model [33]. In the subsequent study, Faiman et al. [34] developed a site-independent MP algorithm through the incorporation of the Perez algorithm [33]. More recently, in 2022, Brito et al. [35] advanced the concept of multi-directional pyranometers by introducing a six-pyranometer array, named the cubic multi-directional pyranometer array (cMPA), with sensors facing all cubic directions (i.e., top, bottom, east, south, north, and west). The direct, sky diffuse, and ground-reflected diffuse irradiance were estimated using the linear least squares method. The performance evaluation of cMPA using 1 min interval measurements showed RMSE values of 45.2 W/m2 for BHI, 41.2 W/m2 for DHI, and 19.0 W/m2 for tilted surface global irradiance. While the multi-directional pyranometer array (MPA) method requires an increased number of sensors, it provides a clear mathematical distinction of directional irradiance components based on solar position. As a result, numerical models utilizing MPA improve decomposition accuracy even for short measurement intervals.
This study aims to develop a compact and cost-effective pyranometer system with a DNI estimation method that enhances estimation accuracy. To achieve this, the study proposes an improved DNI estimation approach based on multi-directional irradiance data by applying the multi-pyranometer array (MPA) concept discussed in previous research. The study reviews existing empirical and numerical decomposition models and introduces the CUBE-i sensor system, which measures irradiance from five different directions. A Deep Neural Network (DNN)-based estimation model is designed to estimate real-time DNI using multi-directional irradiance as input. Additionally, the study explores key factors influencing the accuracy of DNI estimation, including sensor configuration and input parameter selection. The proposed approach aims to improve the applicability of DNI estimation for real-time monitoring and various solar energy applications.

2. DNI Estimation Model Using Five-Directional Global Irradiance

2.1. Review on Decomposition Methods

2.1.1. K t -Based Empirical Models

Empirical models for DNI estimation have been widely utilized as tools for monitoring systems in various industrial applications, as well as in building energy and photovoltaic system design. These models are primarily based on the clearness index ( K t ), with additional considerations for diffuse fraction ( K t ), regional characteristics, solar position, and weather conditions. Over the past six decades, more than 140 models have been developed by various researchers [36,37]. The basic calculation of the clearness index ( K t ) is given in Equations (1) and (2).
K t = I g I o sin β
I o = I o , s c 1 + 0.033 cos 360 d 3 365
where I o , s c is the solar constant which is defined as the intensity of solar radiation on a surface normal to the sun’s rays. This value is frequently used as 1367 W/m2 [38]. The extraterrestrial radiant flux ( I o ) can be calculated from the solar constant and Julian day. These models primarily quantify the state of the sky using the clearness index ( K t ), which is derived from global horizontal irradiance ( I g ) and extraterrestrial irradiance ( I o ). This calculation is based on a fixed solar constant value and requires specific solar geometry parameters—such as latitude, longitude, and time zone—along with local time information for the target region.
Users can measure global irradiance data using small, low-cost solar radiation measurement devices and apply empirical models to decompose the direct normal irradiance (DNI) component. They select the model that best fits the characteristics of the target region or provides the highest accuracy.
As well summarized by C. Bertrand et al. [39], ground-based decomposition models were primarily developed based on hourly measured radiation data. As a result, their estimation accuracy may decrease when applied to shorter time intervals. While some models still maintain an acceptable level of accuracy (e.g., RMSE 41.6 W/m2), their overall accuracy tends to decline in minute-scale estimations, which are essential for real-time monitoring and control applications—for instance, 10 min intervals for building operations [40].

2.1.2. Multi-Directional Irradiance-Based Numerical Model

This approach is based on existing physical models that calculate the global irradiance incident on surfaces tilted in different directions by decomposing it into its respective components: direct, sky diffuse, and ground-reflected diffuse irradiance. The global irradiance incident on a specific surface i can be defined by Equation (3) [29]. The sensor system, initially developed as a two-pyranometer set [29,30], was expanded to a four-pyranometer module [32,34,41] to enhance estimation accuracy. More recently, a method incorporating a six-pyranometer module has been proposed [35].
G i = B i + D i + R i
where G i , B i , D i , and R i represent the global, direct, sky diffuse, and ground-reflected solar radiation components, respectively, reaching a tilted surface. The solar geometry characteristics of each directional surface and the solar radiation components reaching the target surface can more distinctly reflect the sun’s position over time. For example, when the sun is positioned in the east, the direct normal irradiance reaching the west-facing surface becomes 0 W/m2. In a recent study by Brito et al. [35], a decomposition method incorporating a six-directional pyranometer module was applied, and its estimation performance was analyzed using 1 min interval irradiance measurements. The results demonstrated relatively higher estimation accuracy compared to traditional empirical models. The proposed model considers the tilt and azimuth angles determined by the pyranometer’s placement, as well as the solar altitude and azimuth angles, which vary with time, for incident angle calculations.
The studies on multi-directional pyranometers have been progressed to avoid expensive sun-tracking pyranometers and achieve higher accuracy than traditional decomposition models. This assembly can be similar size as a normal pyranometer but no moving parts. Additionally, more measured input values in the DNI estimation process can probably lead to more accurate DNI results for shorter time intervals than the empirical models. Both empirical and numerical models require additional computational processing after irradiance measurement during the monitoring phase, necessitating the setup of dedicated computational equipment. However, this setup is typically required only once during the initial sensor installation.

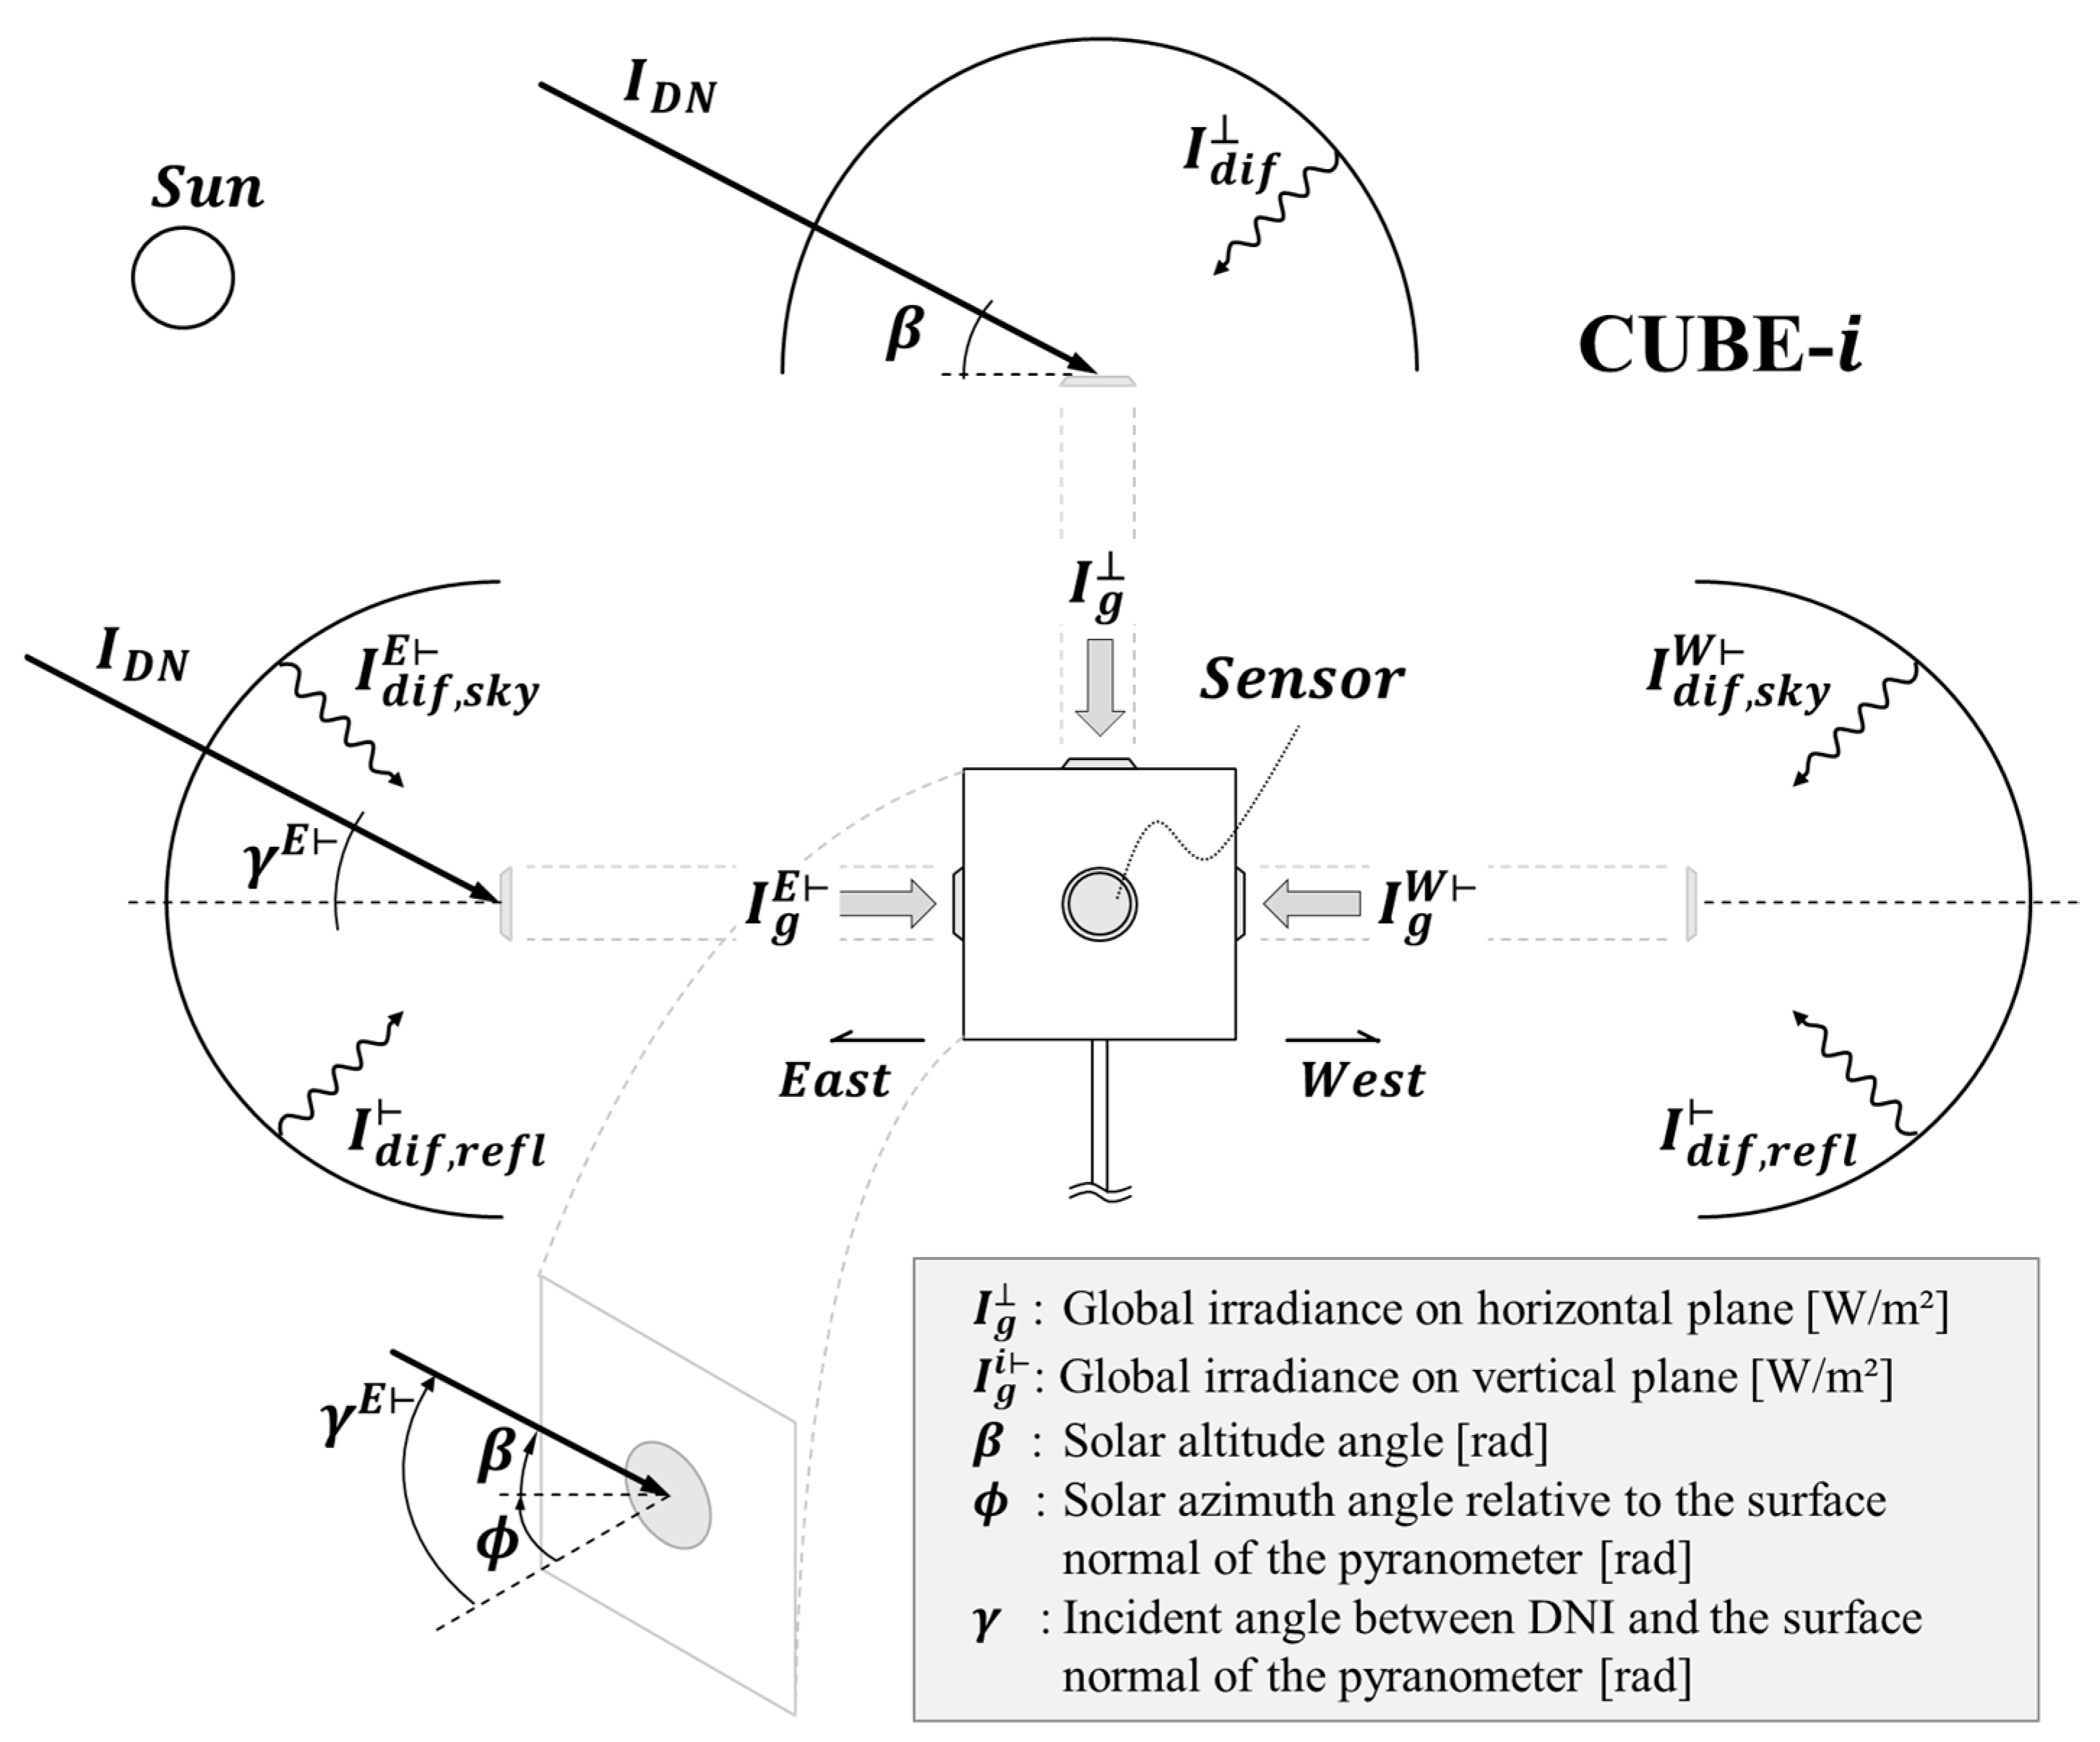
2.2. Development Pyranometer Model

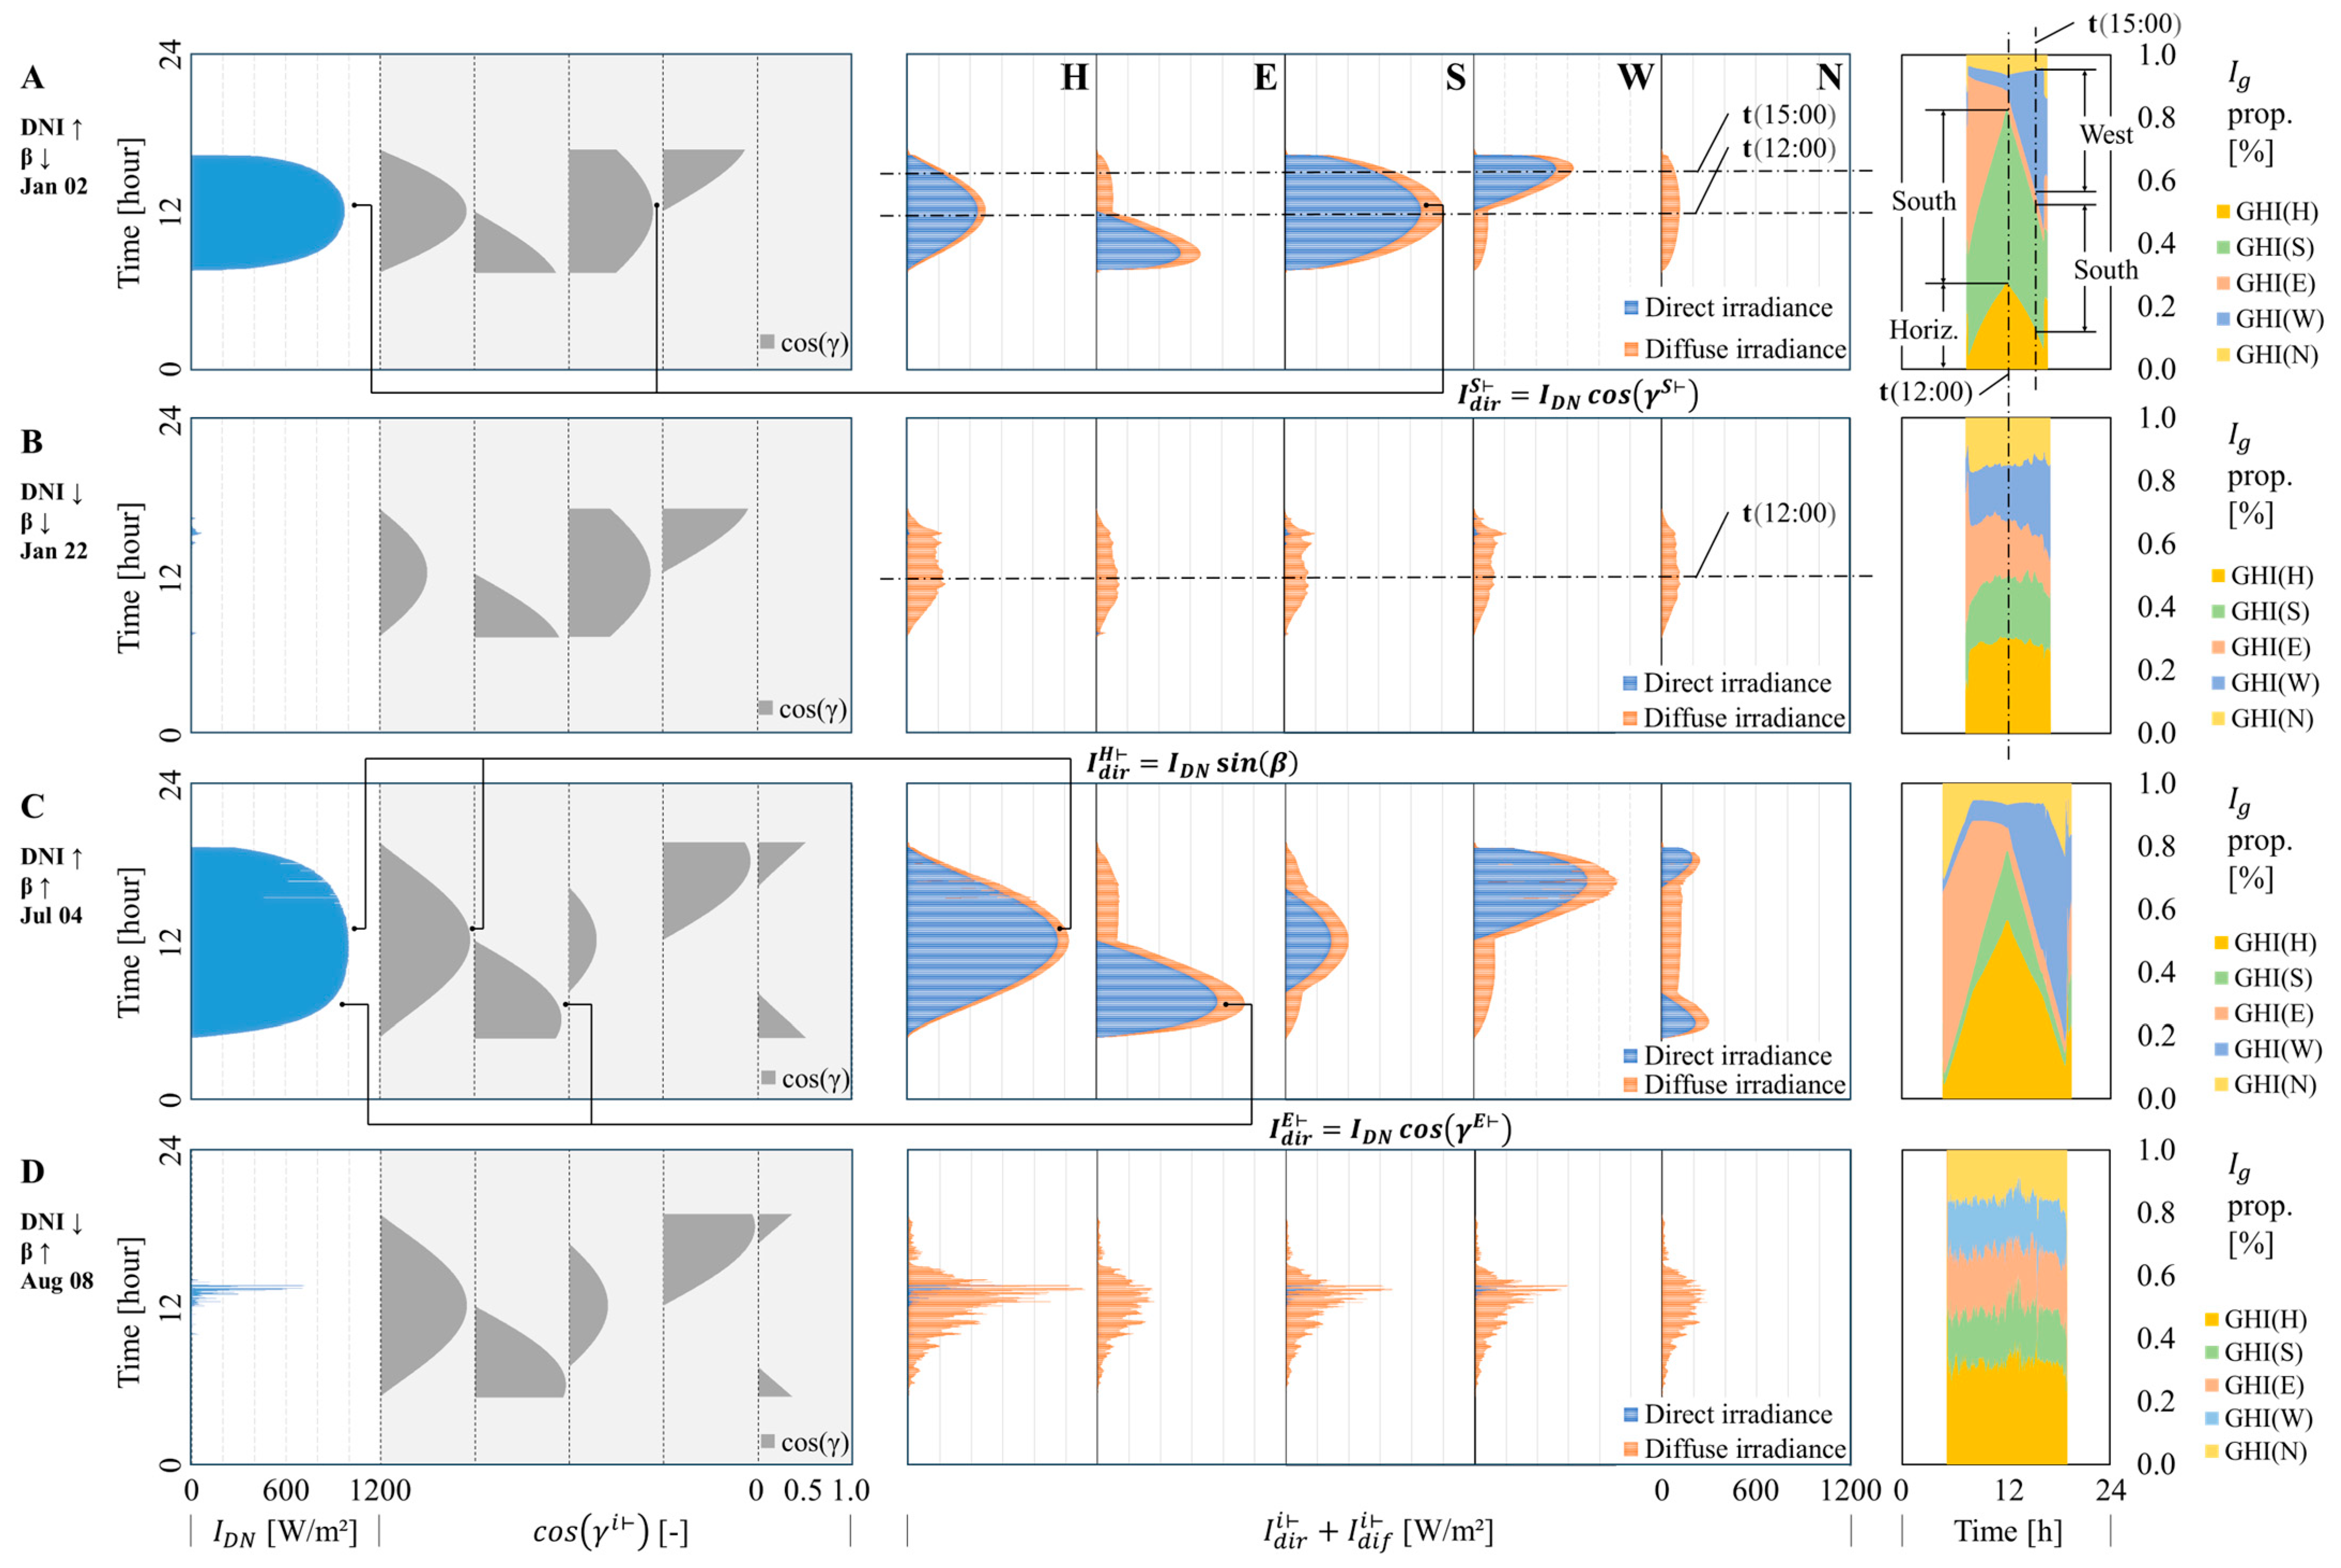
2.2.1. Analysis of Cubic Directional Irradiance

The multi-directional pyranometer array (MPA) approach incorporating a numerical model increases the number of required sensors. However, it enhances the accuracy of decomposition by explicitly distinguishing the irradiance reaching each direction based on the solar position through mathematical equations. This study adopts the sensor arrangement used in previous research to establish the basic design of the sensor system. The proposed system, referred to as CUBE-i in this study, consists of a five-directional pyranometer configuration, including eastward (E), southward (S), westward (W), and northward (N). The name “CUBE-i” reflects the cube-shaped geometric configuration of the five-directional pyranometer system, where “-i” denotes the directional irradiance measured on each face. Figure 1 shows the proposed multi-directional pyranometer model, CUBE-i, along with a schematic representation of the solar irradiance components incident on each sensor surface according to the solar position at a specific time.
Direct irradiance ( I d i r ) and diffuse irradiance ( I d i f ) vary in intensity depending on the tilt angle and azimuth angle of the receiving surface. The most commonly measured global horizontal irradiance (GHI; I g ) is influenced by the solar altitude angle ( β ), which determines the amount of direct irradiance incident on the horizontal plane. This relationship can be expressed using the following Equation (4) [2,38].
I g = I d i r + I d i f = I D N s in β + I d i f
where I D N is direct normal irradiance (DNI). The superscript ‘⊥’ denotes the vertical direction on the horizontal plane. As the sun rises higher, the GHI value increases. Regarding pyranometers installed from Eastward to Northward directions, the measured global irradiance for each direction ( I g i ) is influenced by the sun’s position and the orientation vector of each directional pyranometer as represented in Equations (5) to (6).
I g i = I d i r i + I d i f i         i = E ,   S ,   W ,   N = I D N cos γ i + I d i f , s k y i + I d i f , r e f l
I d i f , s k y i = I d i f , d o m e + I d i f , r i b n + I d i f , c i r c i
where i is an identifier for the four given directional pyranometers: east, south, west, and north. The superscript ‘⊢’ denotes the horizontal direction on a vertical plane. γ i represents the incident angle between direct normal irradiance and the surface normal of the pyranometer. The i -directional sensor measures global irradiance at a tilt angle of 90°. When direct normal irradiance is incident on one side of the pyranometer, the opposite side receives only diffuse irradiance. For example, when the sun is positioned in the southeast, the west- and north-directional pyranometers receive 0 W/m2 of direct irradiance. For diffuse irradiance, the actual amount received by a pyranometer varies by direction due to atmospheric effects such as clouds and aerosols. Under an ideal sky assumption, diffuse irradiance can be categorized into three components as defined by Perez et al. [33]: the circumsolar zone ( I d i f , c i r c i ), the isotropic sky dome ( I d i f , d o m e ), and the horizontal ribbon ( I d i f , r i b n ) models. The isotropic sky dome and horizontal ribbon components are assumed to be uniform across all directions, except for the circumsolar zone component. For reflected irradiance, it is assumed to be the same across all directions, calculated based on the global horizontal irradiance and surface albedo. Albedo is commonly assumed to be 0.15 [39] or 0.2 [35]; however, regardless of the specific albedo value, it does not influence the directional differences in global irradiance measurements.
Considering Equations (4) to (6), the global irradiance measured by each sensor exhibits significant variations due to the intensity of direct irradiance, which is influenced by the clearness of the sky and the incident angle. Figure 2 shows the cosine of the incident angle for each direction, as well as the composition of direct, diffuse, and global irradiance according to the DNI intensity and solar altitude. The measurement data were obtained from the NREL Solar Radiation Research Laboratory (SRRL) in Golden, Colorado, USA [42]. Figure 2A,B represent data from January, when the solar altitude is relatively low, whereas Figure 2C,D correspond to July and August, when the solar altitude is higher. Additionally, Figure 2A,C depict days with high DNI, while Figure 2B,D illustrate days with low DNI.
Directional pyranometers exhibit increased deviations due to DNI at the same time of day under clear sky conditions, depending on the sun’s position (see Figure 2A,C), whereas these deviations are reduced on cloudy days (see Figure 2B,D). Additionally, when the solar altitude is high, global horizontal irradiance increases (see Figure 2C), whereas at lower solar altitudes, vertical surface irradiance becomes relatively larger (see Figure 2A). A comparison of five sensor measurements under four characteristic conditions—based on solar altitude and DNI magnitude—demonstrates that DNI significantly influences the irradiance measured at each sensor position. The intensity and variation in directional irradiance at a given time, as well as global horizontal irradiance, depend on the DNI level.

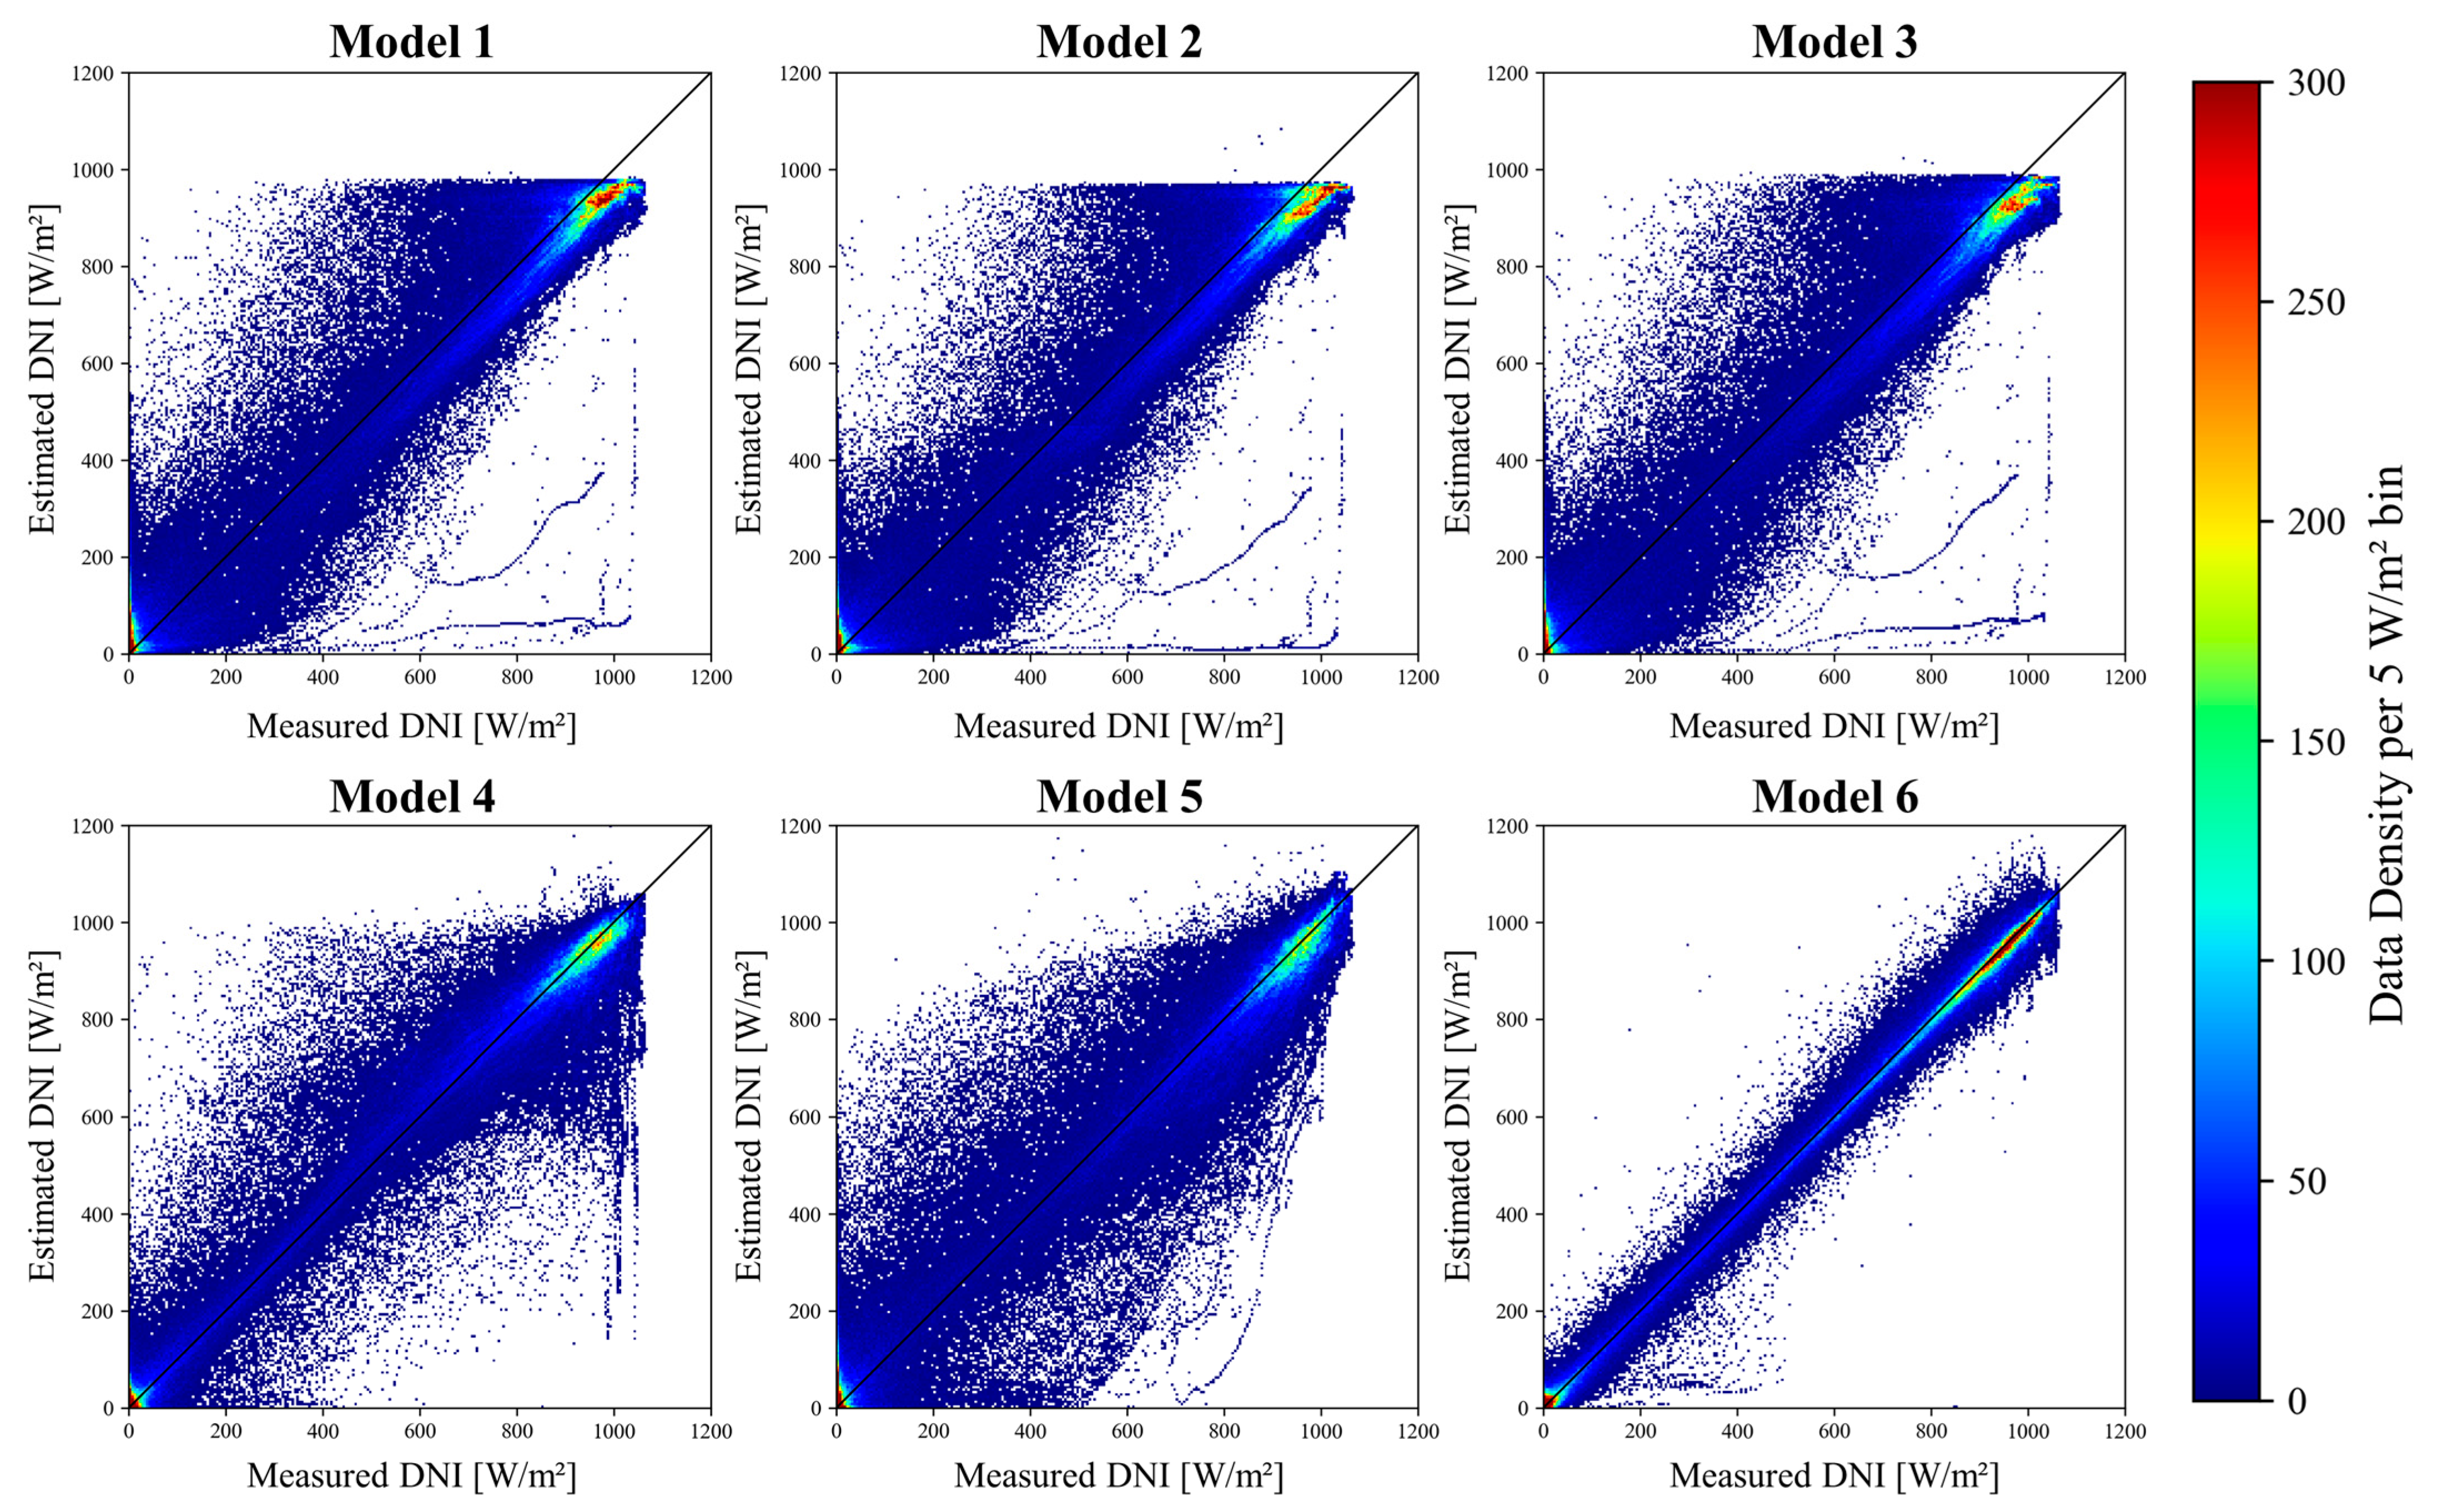
2.2.2. DNI Estimation Model Derivation with DNN Application

In this section, a DNI estimation model was developed using real-time global irradiance data measured from a five-directional pyranometer system. The global irradiance values measured by each pyranometer vary depending on the solar position and sky clearness; therefore, a black-box approach was applied to estimate DNI. While long short-term memory (LSTM) network models are effective for time-series irradiance forecasting [43,44,45,46], including daily estimation based on past meteorological data [43] and radiation data [44], and hourly forecasting based on past meteorological data [45] and radiation data [46], the DNI estimation model developed in this study does not rely on temporal dependencies between input irradiance data. Instead, Deep Neural Networks (DNNs) were adopted to estimate DNI from global irradiance measurements at independent time instances. The DNN model effectively learns the complex nonlinear relationships between multi-directional irradiance and DNI.
The proposed DNN model consists of three hidden layers (128-128-64 neurons) with ReLU activation. The output layer directly estimates DNI without an activation function. The model is trained using the mean squared error (MSE) loss function and optimized with the Adam optimizer (learning rate = 0.001), with 150 training epochs, a batch size of 32, and a validation split of 20%. The measurement data used in this study were obtained from the NREL Solar Radiation Research Laboratory (SRRL) [42], comprising 1 min interval measurements recorded over a one-year period (2024). The dataset includes global horizontal irradiance (GHI), four-directional irradiance, and direct normal irradiance (DNI), as summarized in Table 1.
The input parameters of the proposed multi-directional pyranometer (CUBE-i) in this study include GHI ( I g ) and four-directional irradiance ( I g E , I g S , I g W , I g N ). However, the multi-directional pyranometer model may not necessarily yield the highest estimation accuracy. Since empirical models use the clearness index ( K t ) and primarily consider solar altitude ( β ) along with global horizontal irradiance, it is necessary to verify whether the DNN model can achieve sufficient estimation performance using only these input variables. Additionally, in the case of directional pyranometers, the two sensors positioned on opposite sides receive DNI influence on only one sensor depending on the solar position. Thus, the DNI intensity can be distinguished using a simplified two-sensor configuration. Therefore, in addition to the input variables of the proposed multi-directional pyranometer module (Model 6), an alternative set of input variables incorporating β , K t , and two groups of directional irradiance—(E, W) and (S, N)—was considered. Table 2 shows the input variable combinations used in DNI estimation models. Models 1 to 3 are trained using input variables typically employed in empirical models (GHI, β , and K t ), whereas Models 4 to 6 incorporate multi-directional pyranometers.
The deep learning model was trained and tested on a system equipped with an Intel® CoreTM i9-12900K CPU (24 logical cores, 3.2 GHz), running on Windows 11 (64-bit). The average prediction time per data instance was approximately 0.018 milliseconds.
Figure 3 illustrates the scatter plots of DNI estimation performance for different input variable combinations (Models 1 to 6). The analysis results showed that all models exhibited high accuracy in high irradiance ranges (>1000 W/m2), with estimated values closely distributed along the y = x axis (ideal estimation line). However, in medium-to-low irradiance ranges, all models except Model 6 tended to deviate significantly from the ideal estimation line. In particular, Models 1 to 3 demonstrated an overestimation pattern in low DNI regions, while Models 4 to 5, which incorporated partial directional irradiance data, still exhibited irregular errors. In contrast, Model 6, which utilized all directional irradiance data (E, W, S, N), showed the closest distribution of estimated values to measured values across the entire DNI range, demonstrating stable estimation performance.
To evaluate the performance of the proposed model, several statistical error metrics were used, including mean squared error (MSE), root mean squared error (RMSE), normalized RMSE (nRMSE), mean bias error (MBE), and mean absolute error (MAE). These metrics, which are selectively presented in Tables 3–6, are defined in Equations (7) to (11).
M S E = 1 N t = 1 N y ^ t y t 2
R M S E = 1 N t = 1 N y ^ t y t 2
n R M S E = R M S E y ¯
M B E = 1 N t = 1 N y ^ t y t
M A E = 1 N t = 1 N y ^ t y t
where y ^ t and y t are the predicted and measured values at time t , respectively, N is the total number of data points, and y ¯ is the mean of the measured values.
Table 3 presents the error metrics for DNI estimation performance-RMSE, nRMSE, MBE, and R2 (coefficient of determination). The analysis result showed that all models exhibit high explanatory power, with R2 values exceeding 0.96. The proposed Model 6 achieved the highest explanatory power with an R2 of 0.997. Regarding RMSE and nRMSE, Model 6 demonstrated the most accurate DNI estimation, showing the lowest RMSE (20.2 W/m2) and nRMSE (8.2%). In contrast, Models 1–3 exhibited relatively high errors, with RMSE values ranging from 67 to 69 W/m2. Although Model 4 showed reduced errors compared to Models 1–3, it still recorded a higher RMSE than Model 6. Model 5, which considers only south- and north-facing pyranometers, exhibited the lowest estimation performance. For MBE, Model 1 showed the most similar mean estimation to actual values, with a bias of +0.24 W/m2. Meanwhile, Model 6 slightly underestimated DNI, with an MBE of −1.30 W/m2. Overall, based on the error metrics, Model 6 was identified as the most reliable DNI estimation model.
Table 3. Result of the DNI estimation performance according to various input sets.
ModelError Metrics
RMSE [W/m2] nRMSE [%]MBE [W/m2]R2 [-]
Model 169.210.30.240.967
Model 267.510.0−1.150.968
Model 369.010.3−1.410.967
Model 465.79.8−0.280.970
Model 574.511.1−0.280.961
Model 620.28.2−1.300.997
For real-time monitoring of direct and diffuse irradiance, developing a highly reliable estimation model is essential, particularly at the minimum measurement intervals commonly used in applications. For example, 10 min intervals [40] are generally required for building operations. The analysis in this study, based on 1 min measurement data, confirmed that the proposed Model 6, which utilizes multi-directional irradiance (E, W, S, N) as input variables, achieved the highest estimation accuracy for DNI monitoring.

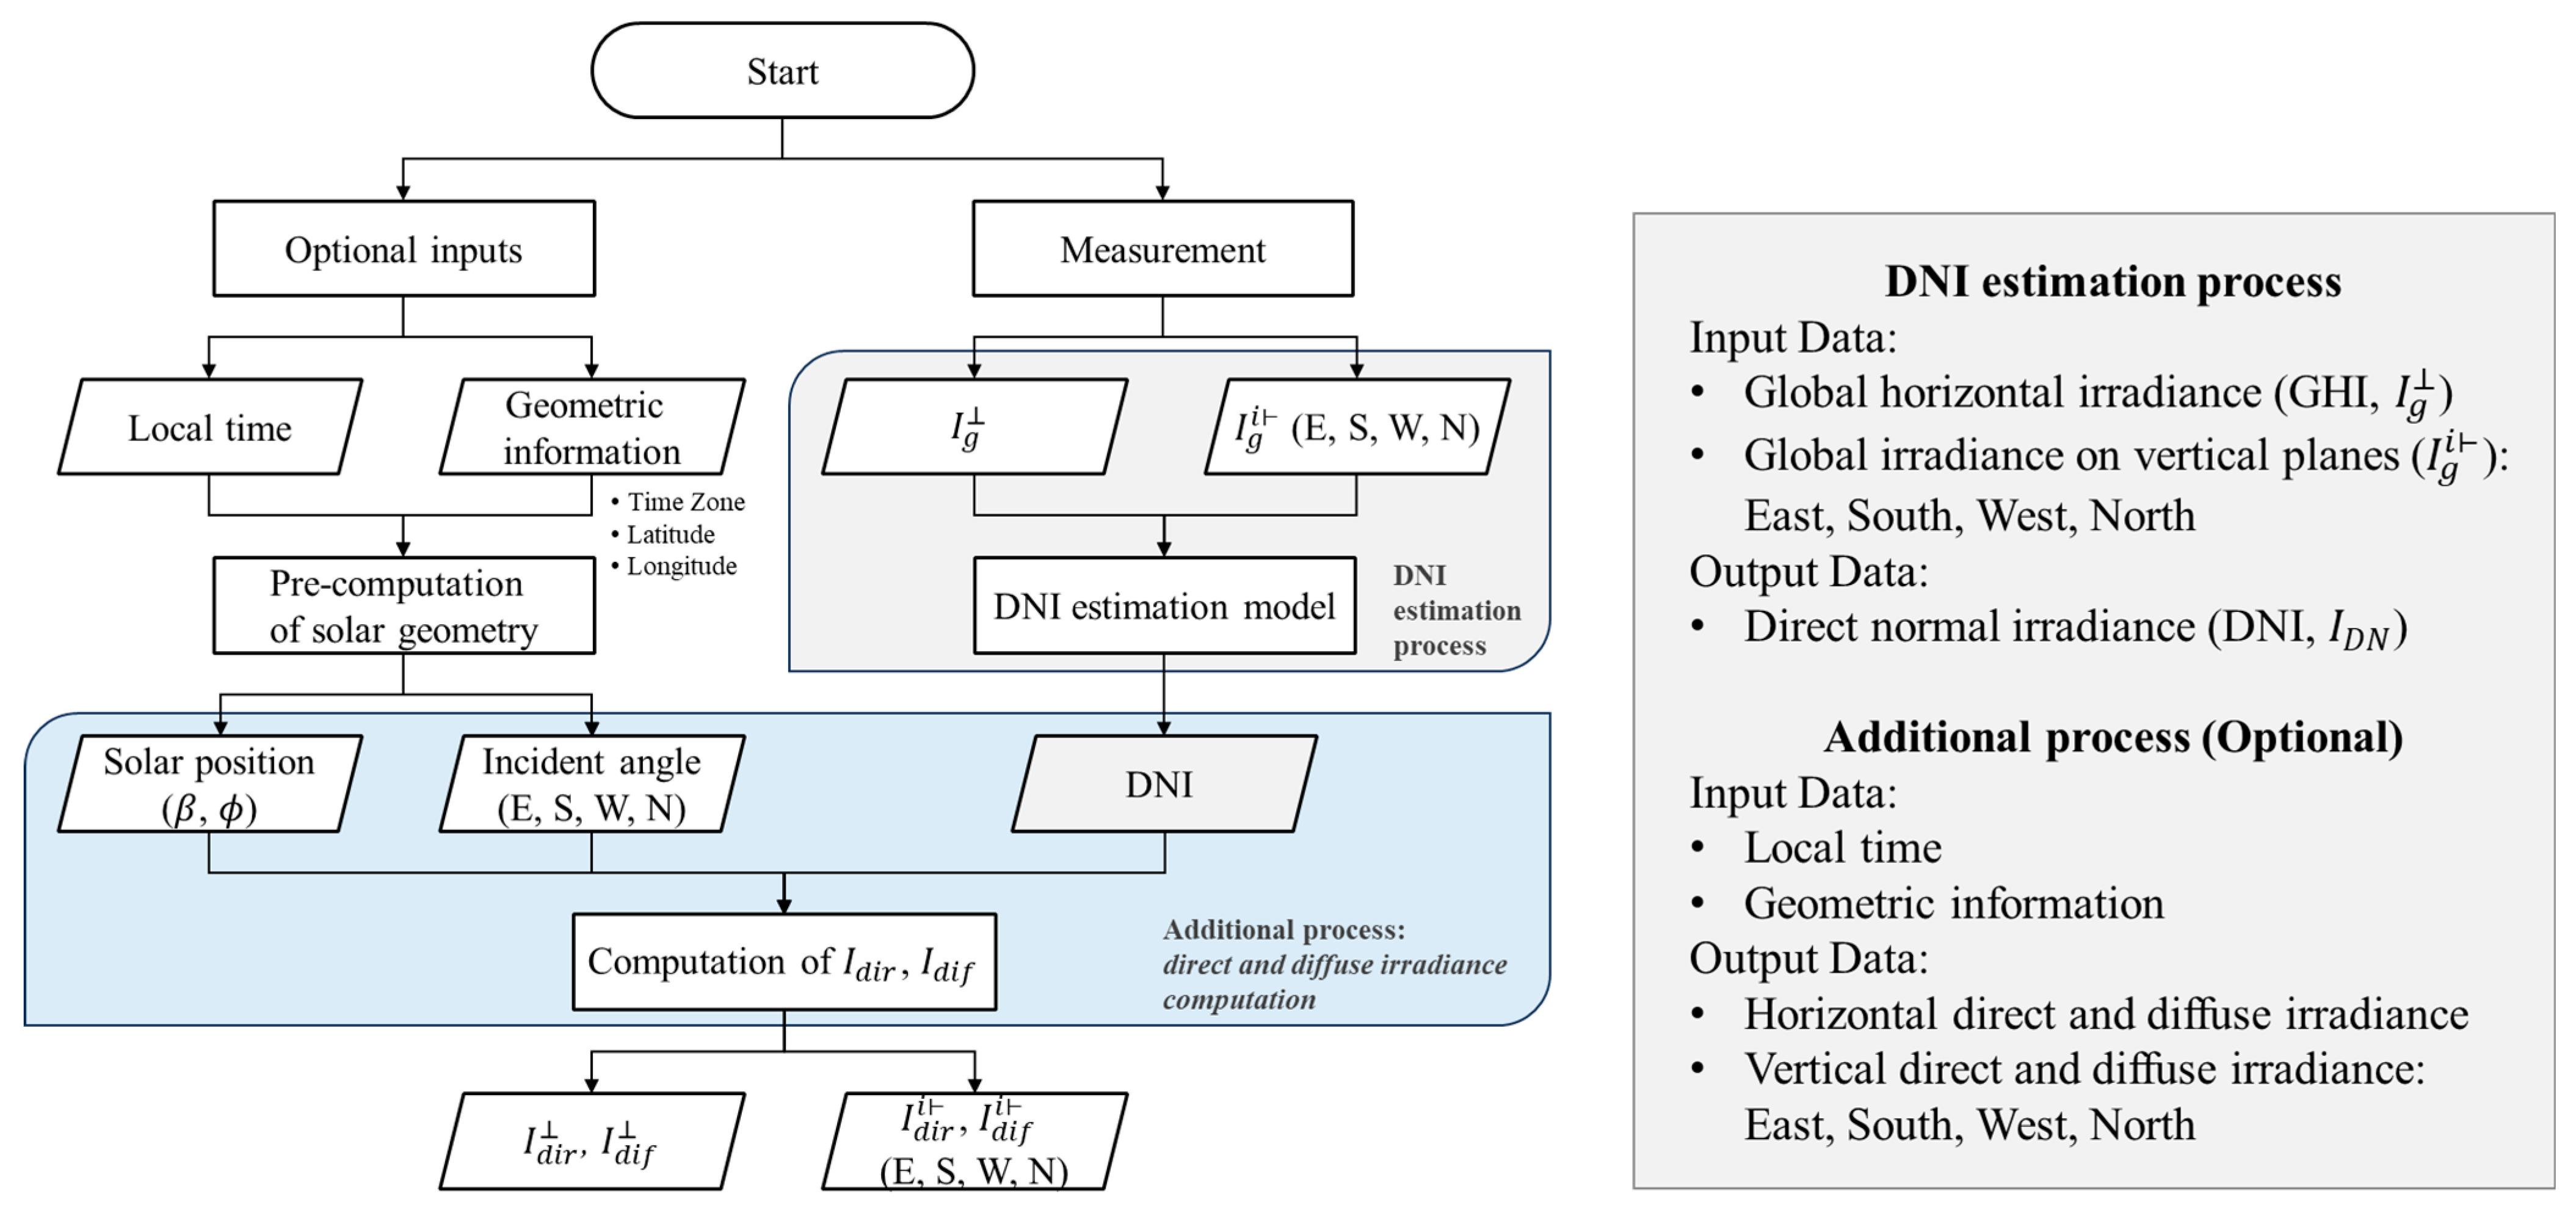
3. Development of CUBE-i Method

3.1. Development of DNI Estimation Process of CUBE-i

The DNI estimation model (Model 6) derived in Section 2.2.2 estimates DNI using only the global irradiance measured from five directional pyranometers. The estimated DNI can be directly utilized in various fields or calculated as the surface incident irradiance based on facade orientation. However, incorporating an additional solar geometry computation process allows the derivation of irradiance values for both horizontal and vertical surfaces, providing more detailed information. To enhance the scalability of CUBE-i, this study introduces an additional process that computes direct and diffuse irradiance for horizontal and cubic-directional surfaces using geometric information, complementing the core DNI estimation process. Figure 4 illustrates the input and output processes of the proposed CUBE-i system.
The CUBE-i process is broadly divided into the core DNI estimation process and an optional additional process for computing directional direct and diffuse irradiance. Users can configure optional input parameters, including geometric information and local time, which are utilized in the pre-computation of solar geometry, involving the calculation of solar position and incident angles in advance. In the measurement phase, GHI and global irradiance on vertical planes (E, S, W, N) serve as input data, based on which the DNN model estimates DNI. In the optional additional process, direct and diffuse irradiance components are computed separately to determine surface irradiance for both horizontal and four-directional vertical planes. This stepwise approach enables CUBE-i to provide real-time DNI and multi-directional direct and diffuse irradiance, making it applicable across various fields.

3.2. Computation of Direct and Diffuse Irradiance

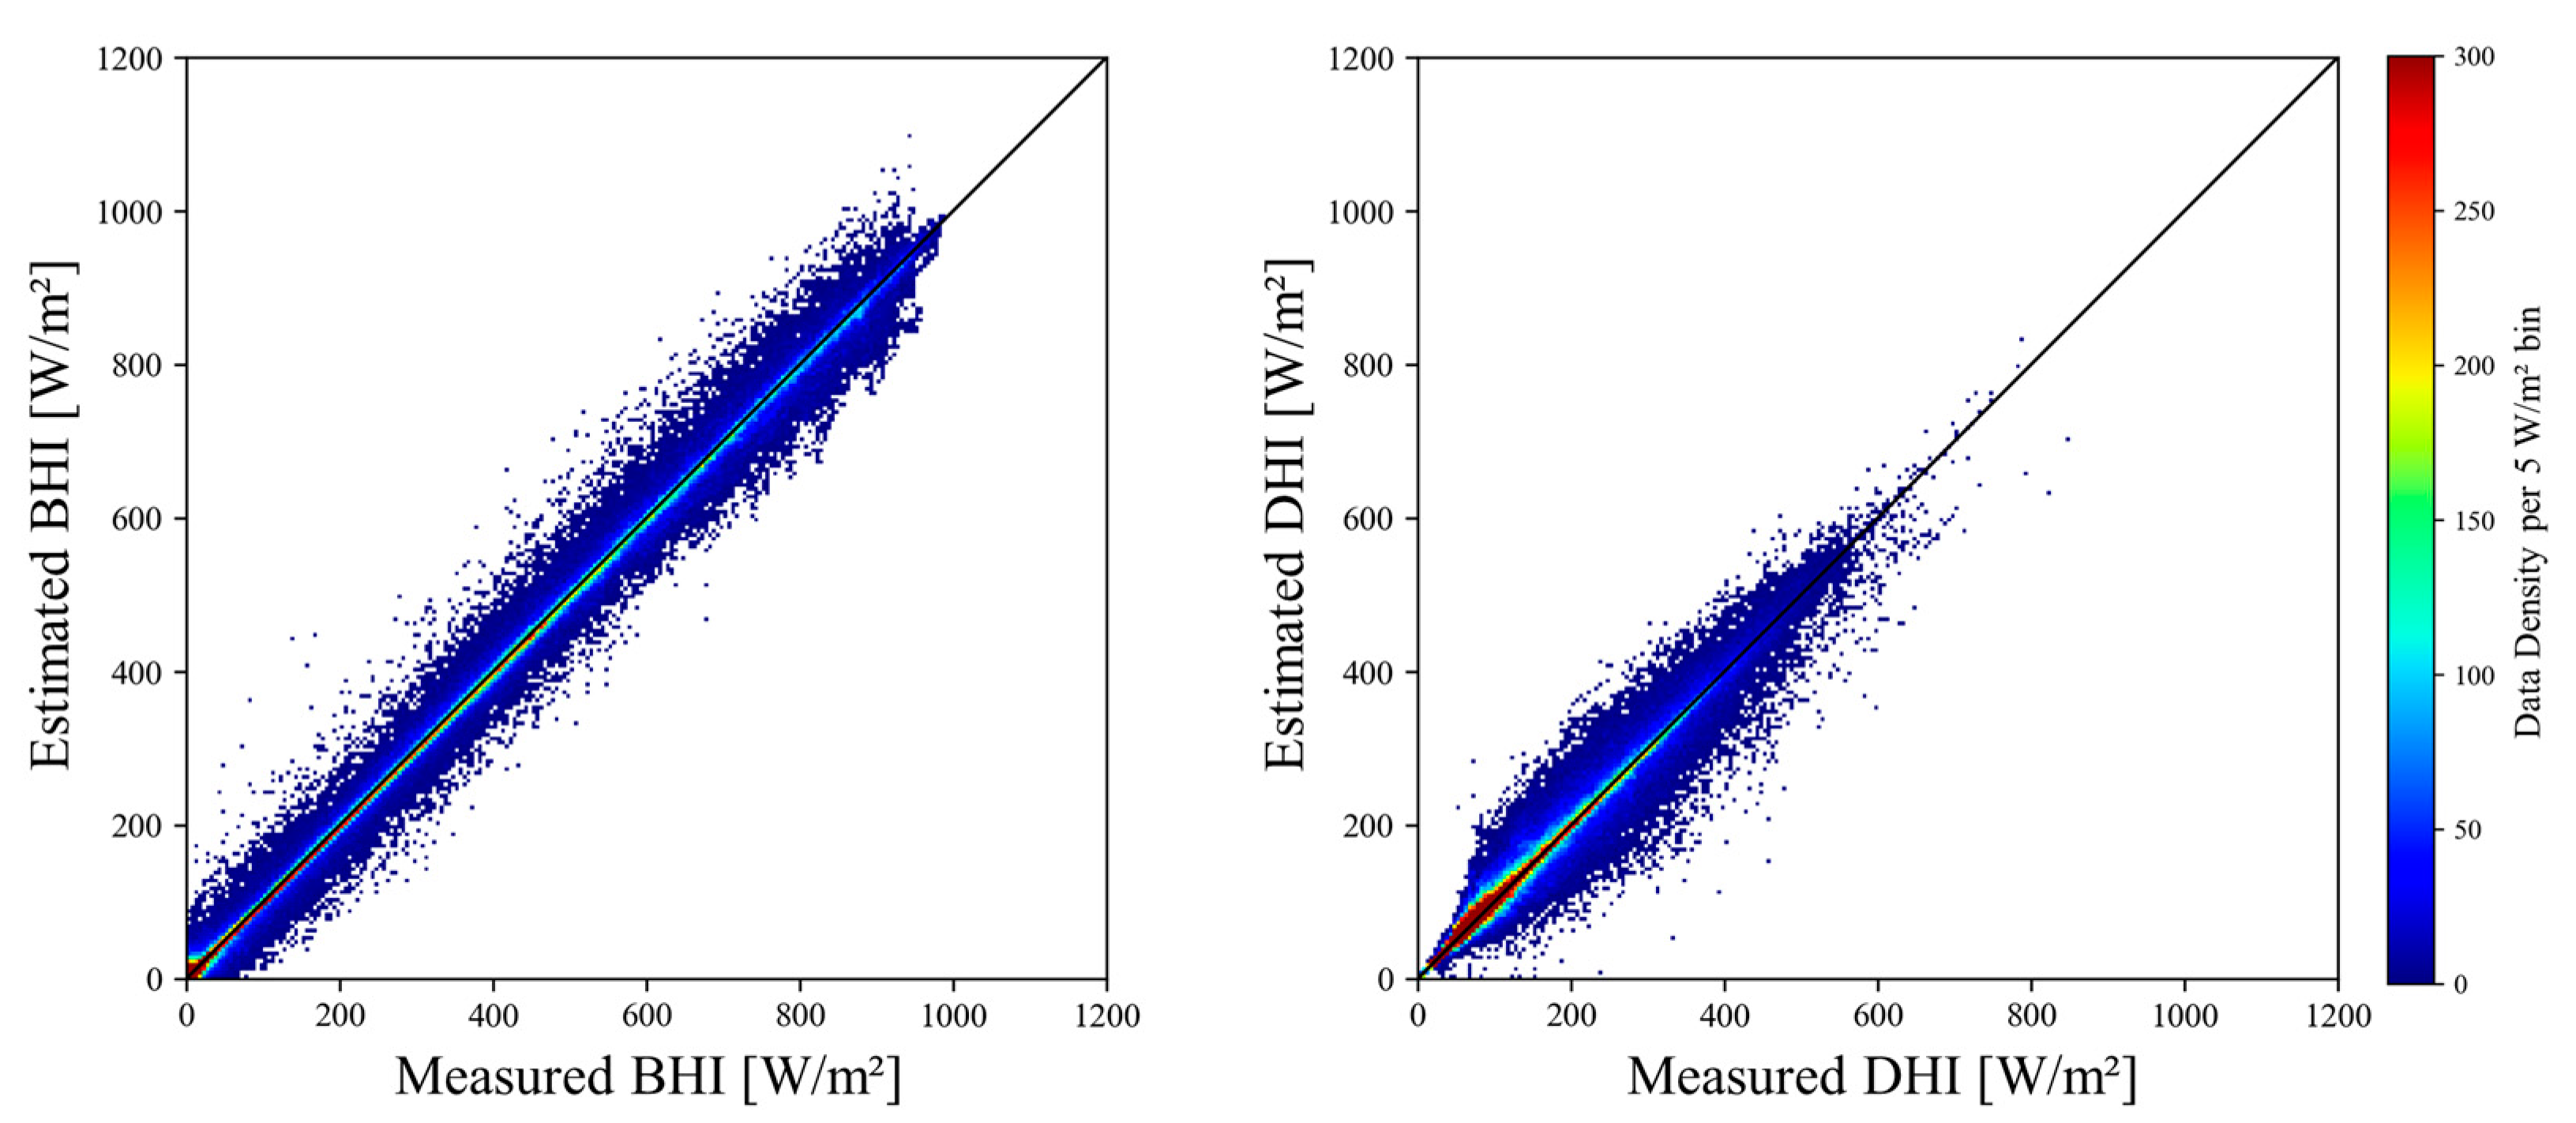
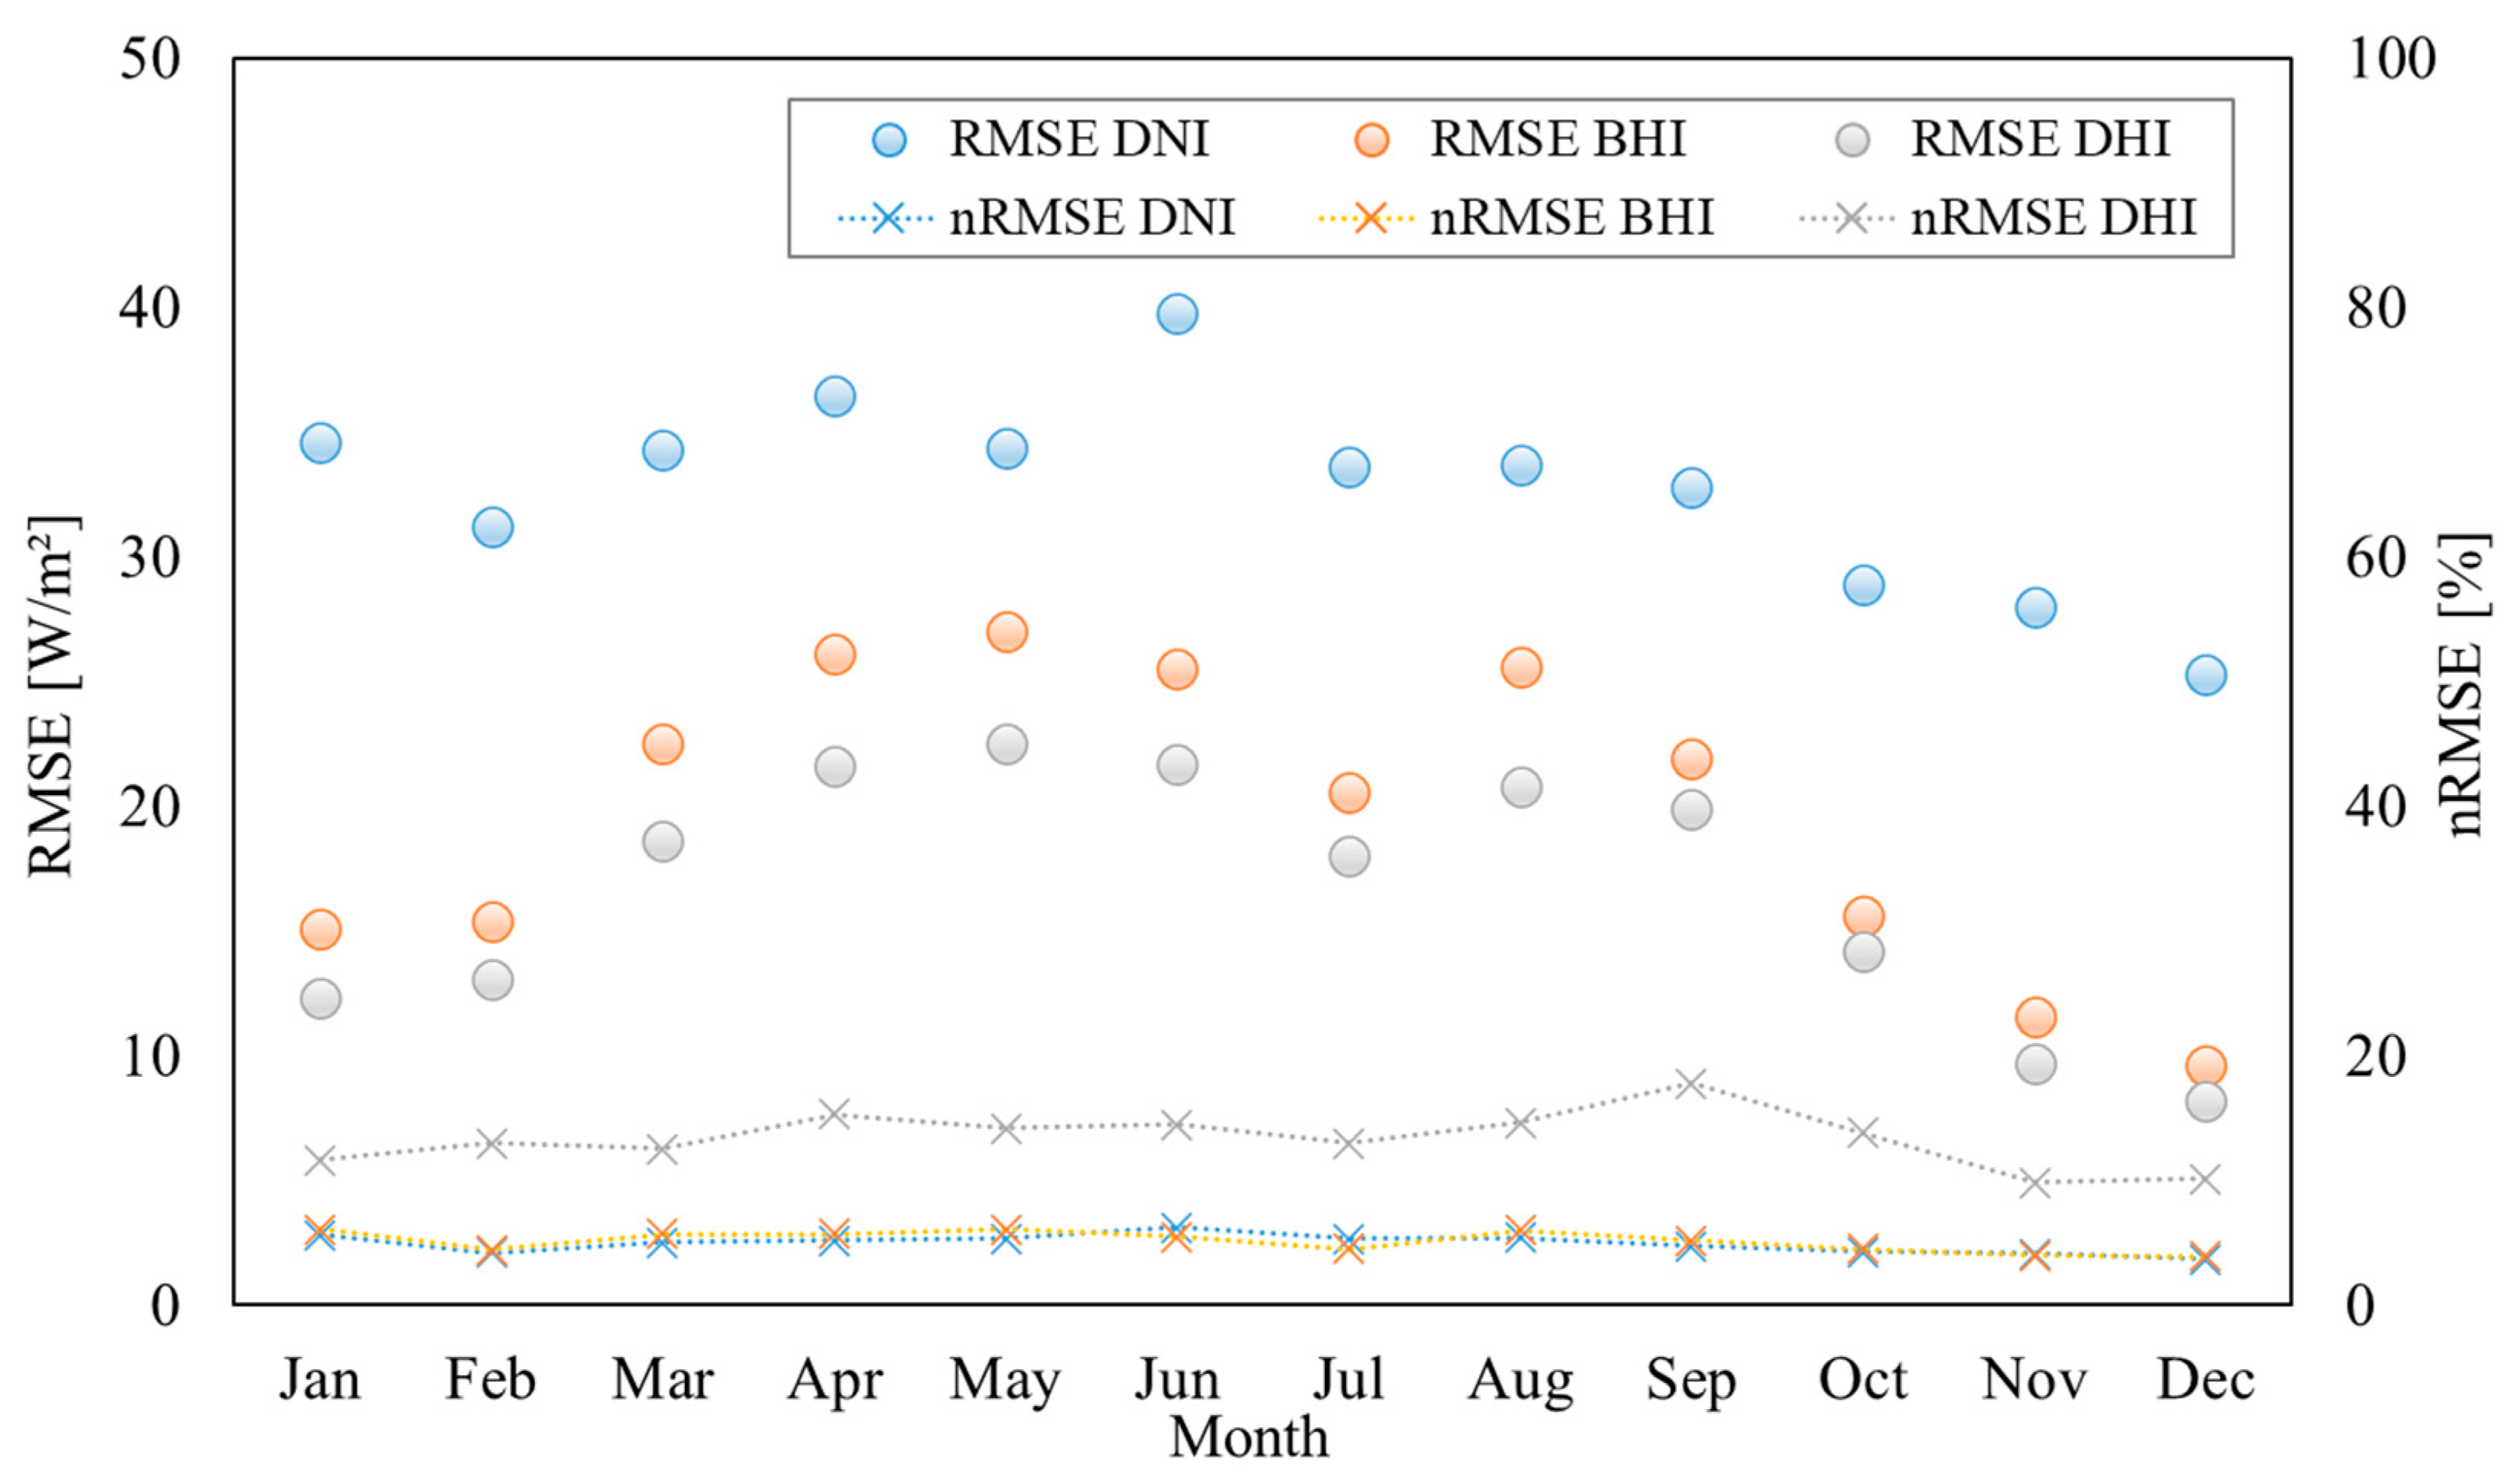
3.2.1. Estimation Results for Multi-Directional Irradiance

Through the CUBE-i process, direct and diffuse irradiance for five directions were computed. The global irradiance measurement data for each of the five directions are identical to the dataset used in Table 1. Figure 5 presents the computed beam horizontal irradiance (BHI) and diffuse horizontal irradiance (DHI). The estimated BHI results were found to be slightly closer to the y = x line (ideal estimation line) compared to the DNI estimation results (see Figure 3, Model 6). For DHI, the irradiance values were generally lower than those of BHI, and the distribution was slightly more scattered from the y = x line relative to BHI. However, both graphs showed a relatively even distribution near the ideal estimation line, confirming that the CUBE-i model effectively separates direct and diffuse components on the horizontal plane using multi-directional global irradiance data.
Table 4 and Figure 6 present the monthly estimation performance analysis results for DNI, BHI, and DHI based on 1 min measurement data. When evaluating estimation performance over an annual or specific period, commonly used error metrics typically include nighttime data with an irradiance of 0 W/m2 unless specific filtering is applied. Since these data points do not represent actual estimations, this study conducted an additional evaluation based solely on data points with irradiance above 10 W/m2. When considering all data, R2 for DNI, BHI, and DHI ranged from 0.973 to 0.999, indicating very high explanatory power. When the analysis was restricted to data points with irradiance above 10 W/m2, the R2 values ranged from 0.953 to 0.996, still demonstrating strong estimation performance.
When considering all data (24 h), RMSE values for total irradiance components ranged from 5.0 to 26.8 W/m2. Since nighttime irradiance data (0 W/m2) are not actually estimated, the high number of zero-deviation data points causes RMSE values to decrease. For RMSE recalculated with data above 10 W/m2, this led to an increase across all variables, ranging from 8.2 to 39.8 W/m2. This confirms that when errors were assessed based on daylight hours data, RMSE values became higher due to fewer data points used for division. On the other hand, since nRMSE (normalized RMSE) is normalized based on the average solar irradiance value, it increases when all data (24 h) are used but tends to decrease when only data above 10 W/m2 are considered. RMSE values were lower in winter than in summer, as the lower solar altitude during winter resulted in greater variation in directional irradiance, which positively contributed to DNI estimation accuracy. Additionally, RMSE values for BHI and DHI were lower than those for DNI. Due to the lower irradiance intensity, DHI exhibited lower RMSE values compared to DNI and BHI; however, its nRMSE was the highest among the three. The MAE (mean absolute error) showed a similar trend to RMSE. The overall MBE (mean bias error) values were negative, indicating a tendency for the model to underestimate actual values. Specifically, for DNI, when considering data above 10 W/m2, the MBE decreased to −7.03 W/m2, further confirming the model’s slight underestimation tendency.
Table 4. Monthly estimation performance of DNI, BHI, and DHI by CUBE-i.
Data
Range
Error Metrics DNI   ( I D N )
JanFebMarAprMayJunJulAugSepOctNovDec
All dataR2 [-]0.997 0.998 0.997 0.997 0.997 0.995 0.996 0.997 0.997 0.998 0.998 0.998
RMSE [W/m2]18.3 17.8 20.0 22.3 22.3 26.8 23.1 20.8 21.5 18.0 15.2 13.7
nRMSE [%]10.7 7.4 8.7 8.7 8.3 9.3 7.7 8.9 7.2 7.0 7.5 6.9
MAE [W/m2]6.6 6.8 8.6 9.0 9.9 10.9 9.8 9.1 8.9 7.6 5.7 5.1
MBE [W/m2]−0.03 −0.64 −1.75 −1.30 −2.03 −2.63 −3.08 −1.27 −1.71 −2.20 −0.14 0.86
Above
10 W/m2
R2 [-]0.990 0.990 0.990 0.988 0.990 0.985 0.988 0.989 0.988 0.991 0.993 0.993
RMSE [W/m2]34.6 31.2 34.3 36.5 34.4 39.8 33.6 33.7 32.8 28.9 28.0 25.3
nRMSE [%]5.6 4.2 5.0 5.2 5.3 6.2 5.3 5.4 4.7 4.3 4.1 3.7
MAE [W/m2]23.2 20.5 24.6 23.1 22.6 23.3 20.2 22.9 20.2 19.4 18.7 16.8
MBE [W/m2]−0.63 −2.66 −6.16 −4.72 −5.84 −6.58 −7.03 −4.50 −4.70 −6.16 −1.08 2.58
Data
range
Error MetricsBHI ( I d i r )
JanFebMarAprMayJunJulAugSepOctNovDec
All dataR2 [-]0.997 0.998 0.997 0.997 0.997 0.997 0.998 0.997 0.997 0.998 0.999 0.999
RMSE [W/m2]7.7 8.6 12.8 15.6 17.1 16.8 13.8 15.3 14.0 9.5 6.1 5.0
nRMSE [%]12.2 7.9 10.2 9.7 9.7 8.4 6.7 10.1 8.2 7.5 7.8 7.6
MAE [W/m2]2.5 2.9 4.9 5.7 6.7 7.0 5.9 5.9 5.2 3.5 2.0 1.6
MBE [W/m2]0.01 −0.33 −1.14 −0.91 −1.38 −0.76 −1.01 −0.37 −0.75 −0.81 0.05 0.37
Above
10 W/m2
R2 [-]0.991 0.995 0.992 0.992 0.993 0.993 0.995 0.992 0.993 0.995 0.996 0.996
RMSE [W/m2]15.1 15.4 22.5 26.1 27.0 25.5 20.6 25.6 21.9 15.6 11.6 9.6
nRMSE [%]6.1 4.4 5.7 5.7 6.1 5.5 4.5 6.0 5.2 4.5 4.0 3.9
MAE [W/m2]9.4 9.2 14.6 15.3 16.1 15.5 12.6 15.8 12.4 9.4 7.1 5.7
MBE [W/m2]−0.18 −1.31 −4.11 −3.36 −4.15 −2.26 −2.57 −1.80 −2.27 −2.42 −0.12 1.29
Data
range
Error MetricsDHI ( I d i f )
JanFebMarAprMayJunJulAugSepOctNovDec
All dataR2 [-]0.988 0.986 0.987 0.979 0.980 0.978 0.980 0.979 0.973 0.982 0.993 0.991
RMSE [W/m2]7.7 8.6 12.8 15.6 17.1 16.8 13.8 15.3 14.0 9.5 6.1 5.0
nRMSE [%]18.6 19.8 18.2 21.0 18.8 18.8 16.9 19.8 25.2 20.6 15.5 16.4
MAE [W/m2]2.5 2.9 4.9 5.7 6.7 7.0 5.9 5.9 5.2 3.5 2.0 1.6
MBE [W/m2]−0.01 0.33 1.14 0.91 1.38 0.76 1.01 0.37 0.75 0.81 −0.05 −0.37
Above
10 W/m2
R2 [-]0.975 0.973 0.978 0.965 0.966 0.963 0.963 0.964 0.953 0.964 0.986 0.979
RMSE [W/m2]12.3 13.1 18.6 21.6 22.5 21.7 18.0 20.8 19.9 14.2 9.7 8.2
nRMSE [%]11.6 13.0 12.5 15.3 14.2 14.5 13.0 14.6 17.8 13.8 9.8 10.1
MAE [W/m2]6.5 6.8 10.3 10.9 11.7 11.6 10.0 10.9 10.5 7.9 5.2 4.3
MBE [W/m2]−0.02 0.77 2.41 1.73 2.40 1.26 1.71 0.68 1.50 1.80 −0.12 −0.99
The direct and diffuse components of horizontal and directional irradiance are primarily separated by calculating the surface incident direct irradiance using DNI. Since the incident irradiance on a surface is determined by multiplying DNI by the cosine of the incident angle, which ranges between 0 and 1, any estimation error in DNI tends to be scaled down proportionally. As a result, the accuracy of directional irradiance estimations was generally higher than that of DNI estimations. The error metrics are summarized in Table 5, which presents the estimation performance for one year of measured directional irradiance data. Overall, for the filtered dataset (above 10 W/m2), RMSE values were higher than those computed with all data, whereas nRMSE values were lower. Regarding MBE, due to the model’s tendency to underestimate DNI, the directional direct irradiance also exhibited an underestimation trend, whereas diffuse irradiance tended to be overestimated. The estimation results demonstrated high explanatory power (R2 > 0.95) and strong accuracy, with RMSE values below 23.3 W/m2.
Table 5. Four-directional direct and diffuse irradiance estimation performance by CUBE-i.
Data
Range
Error Metrics Direct   Irradiance   ( I d i r i ) Diffuse   Irradiance   ( I d i f i )
ESWNESWN
All dataR2 [-]0.998 0.998 0.996 0.985 0.993 0.989 0.987 0.998
RMSE [W/m2]7.69.89.42.97.69.89.42.9
nRMSE [%]9.79.317.164.911.014.214.85.3
MAE [W/m2]2.23.32.30.22.23.32.30.2
MBE [W/m2]−0.52−0.28−0.47−0.130.520.280.470.13
Above
10 W/m2
R2 [-]0.995 0.995 0.990 0.952 0.981 0.976 0.975 1.000
RMSE [W/m2]17.017.923.313.010.814.011.71.3
nRMSE [%]4.25.06.814.47.69.88.91.2
MAE [W/m2]10.710.613.24.44.56.84.40.3
MBE [W/m2]−3.06−1.28−3.53−2.811.050.560.740.1

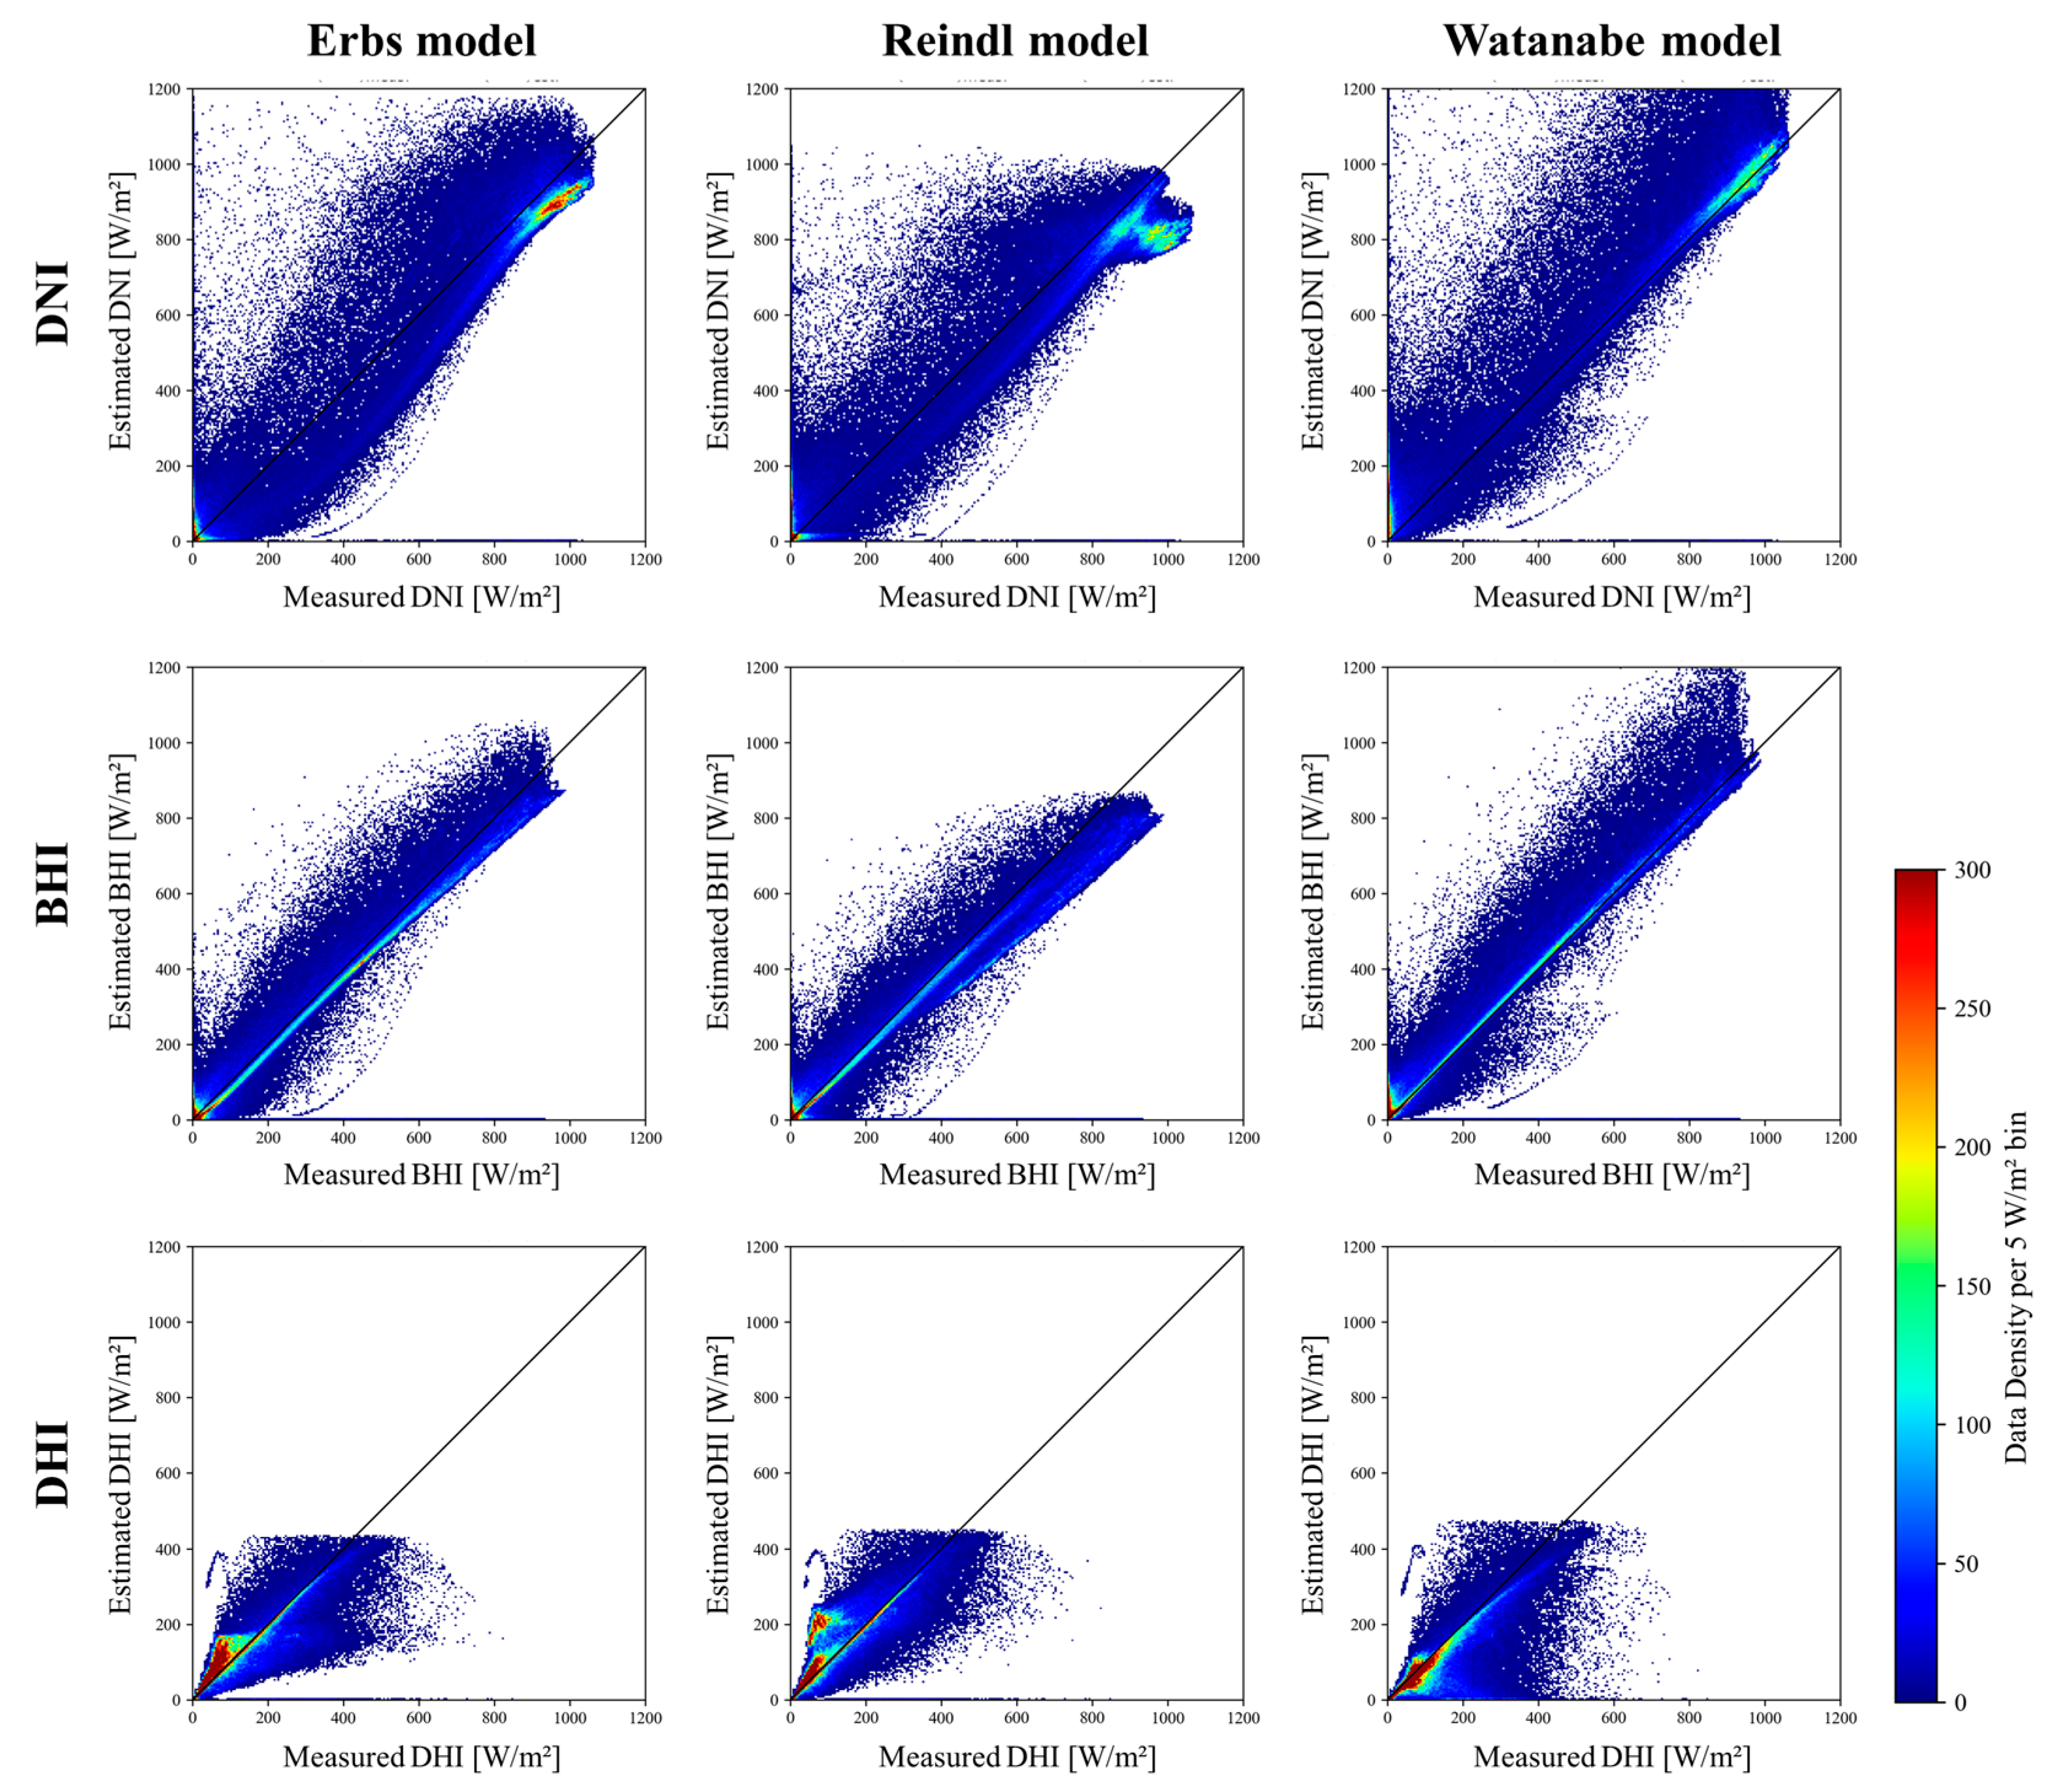
3.2.2. Comparison with Existing Decomposition Models

The DNI estimation model proposed in this study was developed for application in solar irradiance monitoring and system control across various building and industrial sectors. As previous studies have shown, the estimation accuracy of traditional decomposition models tends to decrease as the measurement time interval shortens [39,47]. While traditional decomposition models are derived based on hourly irradiance data, the proposed model maintains high estimation accuracy even at shorter time intervals required for real-time applications. In addition, unlike traditional models that rely on the clearness index ( K t ) derived from extraterrestrial irradiance, the proposed model directly utilizes the directional distribution of surface irradiance. This approach eliminates the need of modeling the effect of atmospheric conditions, thereby reducing uncertainty in estimating DNI.
Figure 7 and Table 6 present a comparison of DNI, BHI, and DHI estimation performance between the conventional decomposition models and the proposed CUBE-i model. The selected reference models include those by Erbs et al. [22], Reindl et al. [24], and Watanabe et al. [23]. In the study by Rajagukguk et al. [47], the Erbs and Reindl models were analyzed to exhibit relatively high accuracy in DNI estimation at a 1 min interval. In Figure 7, all three models showed higher data density near the y = x axis, suggesting a relatively strong correlation with measured values. However, the Erbs and Reindl models tended to slightly overestimate in low irradiance ranges and underestimate in high irradiance ranges. In contrast, the Watanabe model demonstrated a consistent overestimation trend across all irradiance levels.
Table 6 presents the error metrics of four DNI estimation models, including the proposed CUBE-i model. All three empirical models achieved high accuracy in DNI estimation, with R2 values exceeding 0.9 when considering all data (24 h). When considering only data above 10 W/m2, R2 values remained above 0.8 for all models except the Watanabe model. The proposed CUBE-i model achieved the highest explanatory power, with an R2 exceeding 0.99. For nRMSE, the Erbs and Reindl models recorded 36.7 W/m2 and 38.4 W/m2, respectively, broadly similar to previous studies [47] (e.g., Erbs: 35.4, Reindl: 33.1 in Seoul, South Korea, 2021), indicating stable estimation performance across different regions. Overall, the proposed CUBE-i model demonstrated the lowest RMSE and nRMSE values, outperforming traditional empirical decomposition models. Notably, for DNI data above 10 W/m2, the RMSE of the CUBE-i model was 33.1 W/m2, significantly lower than those of the empirical models (ranging from 137.6 to 166.1 W/m2), confirming its superior estimation accuracy. A comprehensive evaluation of the error metrics indicates that the CUBE-i model, utilizing multi-directional pyranometer data, provides significantly improved DNI, BHI, and DHI estimation performance compared to traditional empirical decomposition models.
Table 6. Comparison of error metrics between decomposition models and the proposed model.
Data
Range
Error Metrics DNI   ( I D N )
ErbsReindlWatanabeCUBE-i
All dataR2 [-]0.943 0.937 0.913 0.997
RMSE [W/m2]90.895.0111.920.2
nRMSE [%]36.738.445.28.2
MAE [W/m2]38.743.944.68.1
MBE [W/m2]−1.55−12.3335.36−1.3
Above
10 W/m2
R2 [-]0.820 0.800 0.738 0.990
RMSE [W/m2]137.6145.0166.133.1
nRMSE [%]20.521.624.74.9
MAE [W/m2]94.9106.798.421.2
MBE [W/m2]−14.7−45.9773.24−4.25
Data
range
Error Metrics BHI   ( I d i r )
ErbsReindlWatanabeCUBE-i
All dataR2 [-]0.967 0.956 0.950 0.997
RMSE [W/m2]44.851.654.812.5
nRMSE [%]32.637.539.99.1
MAE [W/m2]17.622.020.14.5
MBE [W/m2]−0.84−10.3614.78−0.56
Above
10 W/m2
R2 [-]0.924 0.898 0.887 0.994
RMSE [W/m2]74.485.990.421.0
nRMSE [%]18.921.822.95.3
MAE [W/m2]46.959.249.812.2
MBE [W/m2]−5.8−33.634.64−2.05
Data
range
Error Metrics DHI   ( I d i f )
ErbsReindlWatanabeCUBE-i
All dataR2 [-]0.816 0.743 0.705 0.983
RMSE [W/m2]40.648.051.512.5
nRMSE [%]66.378.384.020.4
MAE [W/m2]17.221.719.74.5
MBE [W/m2]−0.688.84−16.30.56
Above
10 W/m2
R2 [-]0.673 0.543 0.475 0.969
RMSE [W/m2]58.268.873.817.9
nRMSE [%]46.354.758.714.2
MAE [W/m2]35.444.540.59.2
MBE [W/m2]−1.3618.21−33.431.16

4. Discussions and Limitations

4.1. Impact of Multi-Sensor Errors

The proposed DNI estimation model differs from traditional empirical and numerical models in that it learns the correlation between irradiance values obtained from multiple sensors. As a result, the accuracy and measurement bias of individual sensors can influence estimation performance. Therefore, assuming that the model will achieve the same accuracy for all sensors not used in this study has inherent limitations. The primary objective of this study was to evaluate the suitability and applicability of the model using the provided data. Through DNI estimation using deep learning with silicon-type pyranometer data, the proposed method demonstrated high estimation performance. The trained DNN model is expected to provide reliable DNI estimation if the measurement errors of pyranometers in practical applications are uniformly calibrated. For instance, if errors in directional pyranometers vary in opposite directions (e.g., positive and negative biases), the resulting deviations in directional irradiance measurements may affect DNI estimation accuracy. Such issues are less likely to occur in traditional empirical models, which estimate DNI using a single sensor. Future research will focus on developing sensor modules with uniform performance across all directions and evaluating the estimation accuracy and applicability of the proposed model in different regions.

4.2. Regional Adaptability and Validation

Additionally, the DNN model developed in this study was trained using 527,040 data points (=366 days × 24 h × 60 min) collected from a specific location. Consequently, the training data are limited to the range of solar irradiance observed at the latitude of that particular region, which may lead to potential overfitting to local conditions. However, as discussed in Section 2.2.1, the CUBE-i system estimates DNI based on the intensity and variation in irradiance measured by each sensor. Therefore, a model trained on a sufficiently diverse range of irradiance values may still demonstrate reliable predictive performance in different regions. Nevertheless, additional validation through field experiments in low- and high-latitude regions, which were not included in the training data, as well as extending the validation to a broader range of years, including those with varying solar activity periods, is required to further evaluate the model’s generalization ability.
The empirical models proposed in previous studies derive fixed regression equations based on statistical correlations between locally acquired data. These models are typically developed using hourly irradiance data, which tends to decrease their estimation accuracy when applied to minute-level measurements. Nevertheless, a comparison of the estimation performance obtained in this study with results from similar studies in different regions showed similar error values (i.e., RMSE < ±5 W/m2). This indicates that empirical models exhibit relatively low regional variations in estimation accuracy, suggesting their robustness across different locations.

4.3. Installation Requirements

For conventional pyranometers, precise horizontal installation using a leveling device is strongly recommended to ensure accurate irradiance measurements. Unlike standard pyranometers, the proposed CUBE-i model is designed to ensure both proper horizontal leveling and accurate directional alignment during installation. In other words, accurate DNI estimation is achievable only when each pyranometer array is precisely aligned in the intended direction.
A notable limitation arises when considering its application beyond the current test site. Since the proposed model was trained using data from a specific location in the Northern Hemisphere, further validation is required for its application to other regions, including both other parts of the Northern Hemisphere and the Southern Hemisphere. In particular, alternative installation strategies—such as reversing the north–south sensor orientation—may need to be considered during site-specific validation and deployment studies.

5. Conclusions

In this study, a DNN-based pyranometer model, CUBE-i, was developed for real-time DNI estimation using multi-directional irradiance, and its performance was evaluated by comparing it with conventional empirical decomposition models. The trained DNN model, using measured data from SRRL, demonstrated high DNI estimation accuracy (R2 = 0.997, RMSE = 20.2 W/m2). Based on this, the CUBE-i process was introduced for estimating DNI, BHI, and DHI. CUBE-i significantly outperformed existing empirical models (Erbs, Reindl, Watanabe) in 1 min interval estimations, achieving up to five times lower RMSE and higher R2, demonstrating its advantages as a real-time decomposition model. The findings of this study demonstrate that compact irradiance monitoring systems can effectively enable real-time monitoring of direct and diffuse irradiance.
The DNN model proposed in this study, based on the variation in irradiance magnitude measured by the directional pyranometer array, demonstrated excellent performance in minute-level prediction. Based on this, CUBE-i system provides detailed irradiance information, including directional direct and diffuse irradiance components. Building upon this, multi-sensor irradiance data can be integrated with physical and transposition models to improve the estimation of tilted surface irradiance and albedo, enhancing applications in PV system optimization, building energy analysis, and climate research. Future studies will focus on developing a prototype of the CUBE-i system and validating its generalization performance through experiments conducted across various climates and locations.

Funding

This research was funded by a National Research Foundation of Korea (NRF); grant (RS-2022-NR072332) funded by the government of the Republic of Korea (MSIP).

Data Availability Statement

The original contributions presented in the study are included in the article; further inquiries can be directed to the corresponding author.

Conflicts of Interest

The author declares no conflicts of interest.

Abbreviations

The following abbreviations are used in this manuscript:
GHIGlobal horizontal irradiance, W/m2
BHIBeam horizontal irradiance, W/m2
DHIDiffuse horizontal irradiance, W/m2
DNIDirect normal irradiance, W/m2
MSEMean squared error
RMSERoot mean squared error
nRMSENormalized root mean squared error
MBEMean bias error
MAEMean absolute error

Nomenclature

The following nomenclatures are used in this manuscript:
Symbols
d Julian day
I Solar irradiance, W/m2
I o Extraterrestrial radiant flux, W/m2
I o , s c Solar constant, W/m2
K t Clearness index
Greek letters
β Solar altitude angle, rad
ϕ Solar azimuth angle relative to the surface normal of the pyranometer, rad
γ Incident angle between solar beam and the surface normal of the pyranometer, rad
Subscripts
circCircumsolar zone
d i f Diffuse components
d i r Direct components
DNDirect normal
domeIsotropic sky dome
gGlobal
i Directional identifier of the pyranometer (E, S, W, N)
reflReflected
ribnHorizontal ribbon
Etc.
Vertical direction on horizontal plane
Vertical direction on tilted plane

References

  1. Sakti, A.D.; Ihsan, K.T.N.; Anggraini, T.S.; Shabrina, Z.; Sasongko, N.A.; Fachrizal, R.; Aziz, M.; Aryal, J.; Yuliarto, B.; Hadi, P.O.; et al. Multi-Criteria Assessment for City-Wide Rooftop Solar PV Deployment: A Case Study of Bandung, Indonesia. Remote Sens. 2022, 14, 2796. [Google Scholar] [CrossRef]
  2. Lee, D.S.; Jo, J.H. Application of Simple Sky and Building Models for the Evaluation of Solar Irradiance Distribution at Indoor Locations in Buildings. Build. Environ. 2021, 197, 107840. [Google Scholar] [CrossRef]
  3. Hou, M.; Aviv, D.; Chatterjee, A.; Teitelbaum, E.; Rida, M.; Meggers, F.; Khovalyg, D. Resolving Indoor Shortwave and Longwave Human Body Irradiance Variations for Mean Radiant Temperature and Local Thermal Comfort. Energy Build. 2023, 301, 113581. [Google Scholar] [CrossRef]
  4. Lee, D.S.; Jo, J.H. Measuring and Implementing Mean Radiant Temperature in Buildings: Technical Review. Renew. Sustain. Energy Rev. 2025, 207, 114908. [Google Scholar] [CrossRef]
  5. Arens, E.; Hoyt, T.; Zhou, X.; Huang, L.; Zhang, H.; Schiavon, S. Modeling the Comfort Effects of Short-Wave Solar Radiation Indoors. Build. Environ. 2015, 88, 3–9. [Google Scholar] [CrossRef]
  6. Kwon, S.J.; Jo, J.H.; Lee, D.S. Proposal of Three Methods for Deriving Representative Mean Radiant Temperatures Considering Zone Spatial Distributions. Energies 2024, 17, 5221. [Google Scholar] [CrossRef]
  7. Lee, D.; Cho, Y.H.; Jo, J.H. Assessment of Control Strategy of Adaptive Façades for Heating, Cooling, Lighting Energy Conservation and Glare Prevention. Energy Build. 2021, 235, 110739. [Google Scholar] [CrossRef]
  8. Xiong, J.; Tzempelikos, A. Model-Based Shading and Lighting Controls Considering Visual Comfort and Energy Use. Sol. Energy 2016, 134, 416–428. [Google Scholar] [CrossRef]
  9. Lee, D.S.; Koo, S.H.; Seong, Y.B.; Jo, J.H. Evaluating Thermal and Lighting Energy Performance of Shading Devices on Kinetic Façades. Sustainability 2016, 8, 883. [Google Scholar] [CrossRef]
  10. Huang, X.; Hayashi, K.; Matsumoto, T.; Tao, L.; Huang, Y.; Tomino, Y. Estimation of Rooftop Solar Power Potential by Comparing Solar Radiation Data and Remote Sensing Data—A Case Study in Aichi, Japan. Remote Sens. 2022, 14, 1742. [Google Scholar] [CrossRef]
  11. Dumka, U.C.; Kosmopoulos, P.G.; Ningombam, S.S.; Masoom, A. Impact of Aerosol and Cloud on the Solar Energy Potential over the Central Gangetic Himalayan Region. Remote Sens. 2021, 13, 3248. [Google Scholar] [CrossRef]
  12. López, G.; Gueymard, C.A.; Polo, J.; Alonso-Montesinos, J.; Marzo, A.; Martín-Chivelet, N.; Ferrada, P.; Escalona-Llaguno, M.I.; Batlles, F.J. Increasing the Resolution and Spectral Range of Measured Direct Irradiance Spectra for PV Applications. Remote Sens. 2023, 15, 1675. [Google Scholar] [CrossRef]
  13. Kirimtat, A.; Tasgetiren, M.F.; Brida, P.; Krejcar, O. Control of PV Integrated Shading Devices in Buildings: A Review. Build. Environ. 2022, 214, 108961. [Google Scholar] [CrossRef]
  14. Ito, R.; Lee, S. Performance Enhancement of Photovoltaic Integrated Shading Devices with Flexible Solar Panel Using Multi-Objective Optimization. Appl. Energy 2024, 373, 123866. [Google Scholar] [CrossRef]
  15. Suhaimi, M.F.B.; Kim, W.G.; Cho, C.W.; Lee, H. Impact of Solar Radiation on Human Comfort in a Vehicle Cabin: An Analysis of Body Segment Mean Radiant Temperature. Build. Environ. 2023, 245, 110849. [Google Scholar] [CrossRef]
  16. Kim, E.S.; Yun, S.H.; Park, C.Y.; Heo, H.K.; Lee, D.K. Estimation of Mean Radiant Temperature in Urban Canyons Using Google Street View: A Case Study on Seoul. Remote Sens. 2022, 14, 260. [Google Scholar] [CrossRef]
  17. Park, C.Y.; Lee, D.K.; Krayenhoff, E.S.; Heo, H.K.; Ahn, S.; Asawa, T.; Murakami, A.; Kim, H.G. A Multilayer Mean Radiant Temperature Model for Pedestrians in a Street Canyon with Trees. Build. Environ. 2018, 141, 298–309. [Google Scholar] [CrossRef]
  18. Olpenda, A.S.; Stereńczak, K.; Bȩdkowski, K. Modeling Solar Radiation in the Forest Using Remote Sensing Data: A Review of Approaches and Opportunities. Remote Sens. 2018, 10, 694. [Google Scholar] [CrossRef]
  19. Prasad, A.A.; Taylor, R.A.; Kay, M. Assessment of Direct Normal Irradiance and Cloud Connections Using Satellite Data over Australia. Appl. Energy 2015, 143, 301–311. [Google Scholar] [CrossRef]
  20. Luo, H.; Han, Y.; Lu, C.; Yang, J.; Wu, Y. Characteristics of Surface Solar Radiation under Different Air Pollution Conditions over Nanjing, China: Observation and Simulation. Adv. Atmos. Sci. 2019, 36, 1047–1059. [Google Scholar] [CrossRef]
  21. Orgill, J.F.; Hollands, K.G.T. Correlation Equation for Hourly Diffuse Radiation on a Horizontal Surface. Sol. Energy 1977, 19, 357–359. [Google Scholar] [CrossRef]
  22. Erbs, D.G.; Klein, S.A.; Duffie, J.A. Estimation of the Diffuse Radiation Fraction for Hourly, Daily and Monthly-Average Global Radiation. Sol. Energy 1982, 28, 293–302. [Google Scholar] [CrossRef]
  23. Watanabe, T.; Urano, Y.; Hayashi, T. Procedures for Separating Direct and Diffuse Insolation on a Horizontal Surface and Prediction of Insolation on Tilted Surfaces. Trans. Archit. Inst. Japan 1983, 330, 96–108. [Google Scholar] [CrossRef]
  24. Reindl, D.T.; Beckman, W.A.; Duffle, J.A. Diffuse Fraction Correlations. Sol. Energy 1991, 47, 311–312. [Google Scholar] [CrossRef]
  25. Louche, A.; Notton, G.; Poggi, P.; Simonnot, G. Correlations for Direct Normal and Global Horizontal Irradiation on a French Mediterranean Site. Sol. Energy 1991, 46, 261–266. [Google Scholar] [CrossRef]
  26. Perez, R.; Ineichen, P.; Seals, R.; Zelenka, A. Making Full Use of The Clearness Index for Parameterizing Hourly Insolation Conditions. Sol. Energy 1990, 45, 111–114. [Google Scholar] [CrossRef]
  27. Perez, R.R.; Ineichen, P.; Maxwell, E.L.; Seals, R.D.; Zelenka, A. Dynamic Global-to-Direct Irradiance Conversion Models. ASHRAE Trans. 1992, 98, 354–369. [Google Scholar]
  28. Maxwell, E.L. A Quasi-Physical Model for Converting Hourly Global Horizontal to Direct Normal Insolation. Sol. Energy Res. Inst. 1987, 1–55. Available online: https://www.nrel.gov/docs/legosti/old/3087.pdf (accessed on 6 April 2025).
  29. Steinmuller, B. The Two-Solarimeter Method for Insolation on Inclined Surface. Sol. Energy 1980, 25, 449–460. [Google Scholar] [CrossRef]
  30. Lamm, L.O.; Adler, C.G. A New Method for the Determination of Direct Insolation. Sol. Energy 1987, 39, 109–112. [Google Scholar] [CrossRef]
  31. Faiman, D.; Zemel, A. A Method for Monitoring Insolation in Remote Regions. Sol. Energy 1987, 38, 327–333. [Google Scholar] [CrossRef]
  32. Faiman, D.; Feuermann, D.; Ibbetson, P.; Zemel, A. A Multipyranometer Instrument for Obtaining the Solar Beam and Diffuse Components, and the Irradiance on Inclined Planes. Sol. Energy 1992, 48, 253–259. [Google Scholar] [CrossRef]
  33. Perez, R.; Ineichen, P.; Seals, R.; Michalsky, J.; Stewart, R. Modeling Daylight Availability and Irradiance Components from Direct and Global Irradiance. Sol. Energy 1990, 44, 271–289. [Google Scholar] [CrossRef]
  34. Faiman, D.; Feuermann, D.; Zemel, A. Site-Independent Algorithm for Obtaining the Direct Beam Insolation from a Multipyranometer Instrument. Sol. Energy 1993, 50, 53–57. [Google Scholar] [CrossRef]
  35. Brito, M.C.; e Silva, R.A.; Elsayed, A.M.; Pó, M. Estimating Global Irradiance on Tilted Surfaces Using a Cubic Multi-Directional Pyranometer Array. J. Renew. Sustain. Energy 2022, 14, 013704. [Google Scholar] [CrossRef]
  36. Gueymard, C.A.; Ruiz-Arias, J.A. Extensive Worldwide Validation and Climate Sensitivity Analysis of Direct Irradiance Predictions from 1-Min Global Irradiance. Sol. Energy 2016, 128, 1–30. [Google Scholar] [CrossRef]
  37. Yang, D. Estimating 1-Min Beam and Diffuse Irradiance from the Global Irradiance: A Review and an Extensive Worldwide Comparison of Latest Separation Models at 126 Stations. Renew. Sustain. Energy Rev. 2022, 159, 112195. [Google Scholar] [CrossRef]
  38. ASHRAE. ASHRAE Handbook-Fundamentals (SI); American Society of Heating, Refrigerating and Air-Conditioning Engineers: Peachtree Corners, GA, USA, 2017. [Google Scholar]
  39. Bertrand, C.; Vanderveken, G.; Journée, M. Evaluation of Decomposition Models of Various Complexity to Estimate the Direct Solar Irradiance over Belgium. Renew. Energy 2015, 74, 618–626. [Google Scholar] [CrossRef]
  40. Wang, Z. How Frequent Should We Measure the Indoor Thermal Environment. Build. Environ. 2022, 222, 109464. [Google Scholar] [CrossRef]
  41. Baltazar, J.C.; Sun, Y.; Haberl, J. Improved Methodology to Evaluate Clear-Sky Direct Normal Irradiance with a Multi-Pyranometer Array. Sol. Energy 2015, 121, 123–130. [Google Scholar] [CrossRef]
  42. NREL Measurement and Instrumentation Data Center (MIDC). Available online: https://midcdmz.nrel.gov/apps/sitehome.pl?site=BMS (accessed on 15 January 2025).
  43. Alizamir, M.; Shiri, J.; Fard, A.F.; Kim, S.; Gorgij, A.R.D.; Heddam, S.; Singh, V.P. Improving the Accuracy of Daily Solar Radiation Prediction by Climatic Data Using an Efficient Hybrid Deep Learning Model: Long Short-Term Memory (LSTM) Network Coupled with Wavelet Transform. Eng. Appl. Artif. Intell. 2023, 123, 106199. [Google Scholar] [CrossRef]
  44. Wang, F.; Yu, Y.; Zhang, Z.; Li, J.; Zhen, Z.; Li, K. Wavelet Decomposition and Convolutional LSTM Networks Based Improved Deep Learning Model for Solar Irradiance Forecasting. Appl. Sci. 2018, 8, 1286. [Google Scholar] [CrossRef]
  45. Huang, X.; Li, Q.; Tai, Y.; Chen, Z.; Zhang, J.; Shi, J.; Gao, B.; Liu, W. Hybrid Deep Neural Model for Hourly Solar Irradiance Forecasting. Renew. Energy 2021, 171, 1041–1060. [Google Scholar] [CrossRef]
  46. Alkahtani, H.; Aldhyani, T.H.H.; Alsubari, S.N. Application of Artificial Intelligence Model Solar Radiation Prediction for Renewable Energy Systems. Sustainability 2023, 15, 6973. [Google Scholar] [CrossRef]
  47. Rajagukguk, R.A.; Lee, H. Enhancing the Performance of Solar Radiation Decomposition Models Using Deep Learning. J. Korean Sol. Energy Soc. 2023, 43, 73–86. [Google Scholar] [CrossRef]
Figure 1. Schematic diagram of multi-directional pyranometer model (CUBE-i) and the distribution of direct and diffuse irradiance components reaching each sensor.
Remotesensing 17 01336 g001
Figure 2. Comparison of five-directional solar irradiance based on direct irradiance intensity and solar altitude. (A,C) High DNI with low and high solar altitude, respectively; (B,D) Low DNI with low and high solar altitude, respectively.
Remotesensing 17 01336 g002
Figure 3. Scatter plots of estimated and measured DNI for different input variable combinations.
Remotesensing 17 01336 g003
Figure 4. DNI estimation and irradiance computation process.
Remotesensing 17 01336 g004
Figure 5. Scatter plots of estimated and measured BHI and DHI by CUBE-i.
Remotesensing 17 01336 g005
Figure 6. Monthly estimation performance of DNI, BHI, and DHI by CUBE-i for irradiance above 10 W/m2.
Remotesensing 17 01336 g006
Figure 7. Scatter plots comparing measured and estimated data from existing decomposition models (for CUBE-i results, refer to Model 6 in Figure 3 for DNI and Figure 5 for BHI and DHI).
Remotesensing 17 01336 g007
Table 1. Summary of the irradiance measurement site and instruments.
CategorySpecification
Site informationLocationColorado (USA)
Latitude39.742
Longitude−105.18
Time zone−7
MeasurementMeasurement period1 year (2024)
GHI   ( I g ) CMP 22
Directional   irradiance   ( I g i ) LI-200
DNI   ( I D N ) CHP 1-1
Table 2. Input variable combinations used in each model for DNI estimation.
ModelInput Variables
Model 1 GHI   ( I g ) ,   Solar   Altitude   ( β )
Model 2 GHI   ( I g ) ,   Clearness   Index   ( K t )
Model 3 GHI   ( I g ) ,   Solar   Altitude   ( β ) ,   Clearness   Index   ( K t )
Model 4 GHI   ( I g ) ,   Directional   Irradiance   ( I g i ) —E, W
Model 5 GHI   ( I g ) ,   Directional   Irradiance   ( I g i ) —S, N
Model 6 GHI   ( I g ) ,   Directional   Irradiance   ( I g i ) —E, W, S, N
Disclaimer/Publisher’s Note: The statements, opinions and data contained in all publications are solely those of the individual author(s) and contributor(s) and not of MDPI and/or the editor(s). MDPI and/or the editor(s) disclaim responsibility for any injury to people or property resulting from any ideas, methods, instructions or products referred to in the content.

