Abstract
With the rapid pace of urbanization, light pollution has emerged as a critical environmental issue. Evaluating and managing light pollution effectively is challenging, as traditional monitoring methods often fail to capture its spatial distribution and driving factors comprehensively. To address this limitation, this study integrates Sky Quality Meter (SQM) observational data from three diverse locations—Chaozhou (China), Urumqi (China), and Ghent (Belgium)—with multi-source remote sensing data to construct predictive models of night sky brightness (NSB) using machine learning approaches. Among the tested models, the voting ensemble model demonstrated superior performance, achieving high predictive accuracy and robust generalization across diverse regional datasets. The generated local-scale NSB distribution maps reveal substantial regional variations in light pollution, highlighting the critical influence of local environmental and anthropogenic factors. By combining remote sensing and machine learning, this study offers a scalable and efficient method for evaluating and monitoring light pollution levels at regional scales. The findings underscore the value of these methods in providing actionable insights for light pollution mitigation and management strategies, supporting efforts to reduce its adverse impacts on the environment and society.
1. Introduction
Since the invention of electric lighting, artificial light sources have progressively altered the natural nighttime environment, and light pollution has increasingly become a focus of attention as a new form of environmental pollution. Light pollution refers to the alteration of natural nighttime illumination levels caused by artificial light sources [1], which directly disrupts the Earth’s natural nocturnal light environment and exerts profound impacts on landscapes [2], ecosystems [3,4,5,6,7,8,9,10,11,12], and human health [13,14,15,16]. In practice, many countries and regions have introduced policies and regulations centered on lighting control standards and monitoring metrics, such as environmental brightness zoning, limiting upward light, color temperature restrictions, curfews, and glare control. These approaches help mitigate light pollution by reducing its intensity at the source; however, they mainly focus on direct control of artificial lighting rather than revealing the full impact range and spatial distribution. Consequently, most countries and regions worldwide still face significant challenges in effectively managing and controlling light pollution, primarily due to the lack of standardized quantitative metrics and assessment methods [17]. As a result, how to scientifically and comprehensively quantify the impacts of light pollution has become a prominent research focus.
Skyglow, caused by artificial light sources, is the most direct manifestation of light pollution. This phenomenon results from the scattering of upward-emitted artificial light by atmospheric aerosols, dust, clouds, and other media, significantly increasing night sky brightness. In urban areas, artificial light sources amplify the effects of light pollution through scattering, extending its impact to suburban and even remote regions, where it significantly affects the natural environment and human activities. This study uses Night Sky Brightness (NSB) as the primary indicator of light pollution, aiming to construct predictive models by integrating nighttime light remote sensing data and other environmental variables. The goal is to uncover the mechanisms driving skyglow formation and explore its potential impacts on the nocturnal light environment.
Existing research on light pollution primarily focuses on its mechanisms, quantitative indicators, and monitoring methods. From a policy and management perspective, measures for monitoring and controlling light pollution mainly revolve around lighting control standards and monitoring metrics, such as environmental brightness zoning, upward light ratio limitations, and illuminance levels. While these approaches effectively reduce light pollution intensity, they fall short of fully reflecting the actual impact range and spatial distribution characteristics of light pollution [18]. To address this gap, some scholars have proposed using NSB as a unified evaluation metric, as it not only directly reflects the actual impacts of light pollution but also reveals the combined effects of natural and artificial factors on the nocturnal light environment [19,20].
The primary factors influencing NSB include artificial light sources, atmospheric and meteorological conditions, surface reflectance, moonlight, and elevation. Among these, upward radiation from artificial light sources is the primary contributor to light pollution. Different types of lighting systems vary significantly in their contributions to light pollution. For instance, low-pressure sodium lamps are often considered relatively less harmful in certain aspects due to their narrow emission spectrum, which limits their impact on nocturnal environment. However, they can still pose ecological risks, particularly for species sensitive to the orange/yellow portion of the spectrum and processes like photosynthesis. In contrast, white LED lights tend to contribute more significantly to light pollution due to their strong blue light scattering effect [21]. Additionally, the presence of clouds and aerosols substantially enhances NSB. In highly polluted areas, the scattering effect of clouds extends light pollution to even more distant regions. Recent studies have shown that different cloud types, such as Altocumulus, Cirrocumulus, and Cumulonimbus, are particularly effective in amplifying NSB due to their strong scattering properties, especially when situated at lower altitudes. Meanwhile, aerosols, including anthropogenic particulate matter from fuel combustion, volcanic dust, and sand dust, have also been found to significantly increase NSB, particularly in winter when aerosols accumulate in atmospheric boundary layers. Fog and mist can further enhance light pollution by scattering artificial light from nearby sources, while reducing the impact of distant sources [22,23,24,25]. Surface reflectance and moonlight also affect NSB. For example, areas with high reflectance, such as those with dense buildings or snow, can significantly amplify light pollution. While the influence of moonlight is generally weaker in regions with severe light pollution due to the dominance of artificial light sources, it is important to note that in heavily urbanized areas, atmospheric dust and particulates can enhance moonlight scattering, potentially increasing its impact on NSB in such environments [26,27]. Changes in elevation impact NSB by altering atmospheric density and scattering mechanisms; higher-altitude regions generally exhibit lower and more stable sky brightness levels [28,29,30].
In terms of monitoring and quantification, existing methods can be categorized into field monitoring and remote sensing-based simulations. Field monitoring involves single-channel devices (e.g., Sky Quality Meter, SQM) and multi-channel devices (e.g., CCD cameras) to capture NSB data. While these methods offer high precision, they are time-consuming and labor-intensive because they only measure NSB at a single observation point at a time. To assess the entire area of a city or region, thousands of individual measurements are required, which is impractical for large-scale studies [31,32,33,34,35,36,37,38]. In contrast, remote sensing data-based modeling and simulation methods, which integrate satellite imagery and geospatial information technologies, enable more efficient large-scale evaluations of light pollution. For instance, utilizing DMSP/OLS and VIIRS nighttime light remote sensing data to construct nighttime brightness models has become a significant focus in recent years [39,40,41,42,43]. However, most existing models excel at quantifying the impact of artificial light sources but inadequately account for natural factors such as meteorological and atmospheric conditions. This limitation results in predictive inaccuracies in certain regions [44].
Overall, as light pollution intensifies, there is an urgent need for scientific approaches to quantify its impacts at local scales. By incorporating multi-source remote sensing data and various environmental variables, this study aims to construct predictive models specifically tailored for local-scale NSB assessments, addressing gaps in existing research. The study seeks to deepen the understanding of the causes and spatial characteristics of local-scale light pollution and provide a scientific basis for its effective prevention and management at the regional level.
2. Materials and Methods
2.1. Sky Quality Meter Data
This study utilized a dataset comprising 632 records collected from 1 August 2024, to 18 January 2025, covering 112 distinct dates. While this period does not span an entire year, it includes observations from summer, autumn, and part of winter, which we believe sufficiently captures varying meteorological and astronomical conditions.
NSB data were collected using the portable Sky Quality Meter-L (SQM-L) device, developed by Unihedron, Grimsby, Canada. This device offers high accuracy (±10%) and portability, measuring brightness in mag/arcsec2, a logarithmic and inverse unit representing stellar and sky brightness. To ensure data accuracy, the portable device was cross-calibrated with a fixed SQM device at the Nanshan Observatory of the Xinjiang Astronomical Observatory, Chinese Academy of Sciences. The comparison between the two devices showed high consistency, with an R-squared value greater than 0.95 and a measurement error of less than 0.4 mag/arcsec2.
A total of 632 data points were primarily collected in three locations: Chaozhou, Urumqi, and Ghent (Figure 1). The collected data had a mean NSB value of 17.96 mag/arcsec2, ranging from 14.01 to 24.10 mag/arcsec2, indicating a moderate dynamic range.
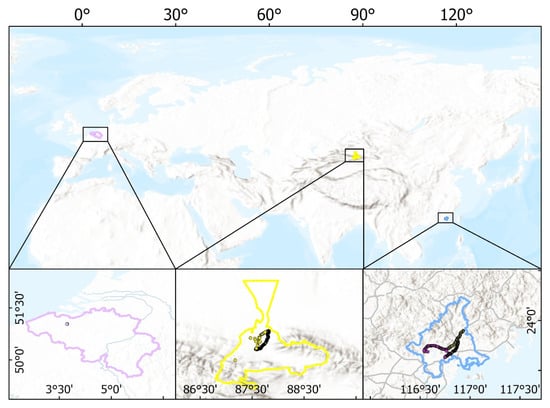
Figure 1.
Location of Measurement Points for NSB Data.
The collection followed strict protocols, including avoiding direct light sources, ensuring unobstructed fields of view, sampling under stable weather conditions, maintaining a minimum distance of 500 m between measurement points, and aligning measurements with satellite imaging times when possible.
The data collection process was subject to several constraints that influenced both sample size and seasonal coverage. Since NPP-VIIRS nighttime light remote sensing data are recorded only once per day at approximately 1:00 a.m.–1:30 a.m., our SQM measurements had to be conducted during this specific timeframe to ensure data alignment. Collecting multiple observations within this limited window required rapid movement between observation points, posing challenges related to transportation, personnel availability, and logistical feasibility. Additionally, SQM measurements were only conducted under stable atmospheric conditions to minimize variability caused by sudden changes in weather, further reducing the number of viable observation days.
Finding suitable measurement locations that adhered to established guidelines—such as avoiding direct light sources, ensuring unobstructed fields of view, and maintaining a minimum distance of 500 m between points—was particularly challenging in urban environments, further limiting the number of data points collected on any given night.
Despite these constraints, we ensured that our data collection spanned different meteorological and astronomical conditions. The combined dataset captures a range of environmental influences on NSB, which we believe adequately reflects the variability required for this study.
2.2. Remote Sensing Data
Remote sensing data were sourced from multiple datasets, covering environmental factors such as nighttime lighting, cloud cover, surface reflectance, aerosol absorption index, and moonlight illumination.
Nighttime lighting data were obtained from the NPP-VIIRS nighttime light remote sensing dataset, provided by the Earth Observation Group (EOG), with a resolution of 15 arcseconds (approximately 500 × 500 m) and radiance units of nW/cm2/sr, accurately capturing artificial light source radiative intensity [45,46].
Cloud cover data were derived from VIIRS Bitmask data, enabling the assessment of cloud-induced light reflection and absorption effects.
Aerosol data were sourced from the European Space Agency (ESA) Sentinel-5P UV Aerosol Index dataset, which quantifies the concentration of absorbing aerosols using the UVAI index, particularly suitable for observations under cloudy conditions. The mean aerosol absorption index is −0.55, suggesting the widespread presence of absorbing aerosols in the atmosphere [47].
Surface reflectance data came from the NPP-VIIRS surface reflectance dataset, quantifying the influence of surface characteristics on light reflection intensity. Surface reflectance values range from 0.42 to 0.62, indicating minimal variation in reflectance across the study areas [48].
Moonlight illumination data were obtained from NASA’s VNP46A1 Black Marble dataset, measuring the Moon Illumination Fraction (100% for a full moon, 0% for a new moon) to assess the impact of moonlight on NSB. The mean moon illumination fraction is 29.20, ranging from 0 to 100, reflecting diverse lunar phase conditions [49,50].
Elevation data were derived from the European Space Agency’s 30-m resolution Digital Elevation Model (DEM) to analyze the potential influence of altitude on NSB [51].
2.3. Methodology
This study considers the target variable—NSB (SQM measurements)—as the dependent variable, with other features serving as independent variables. Various statistical and machine learning methods were used for data modeling and fitting (as shown in Figure 2). Cloud cover data in this study are derived from the VIIRS Bitmask dataset and are inherently ordinal, representing increasing levels of cloudiness. Because these data naturally follow an ordered scale, it is reasonable to incorporate them directly into linear regression models by treating them as continuous predictors, assuming that the intervals between categories are approximately equal. This approach is supported by established literature on ordinal data analysis, which demonstrates that under such assumptions, ordinal variables can effectively capture trends in the response variable [52,53]. The dataset was split into 70% for training and 30% for testing. To ensure the representativeness of the test set, the target variable distribution was balanced using the decile method.
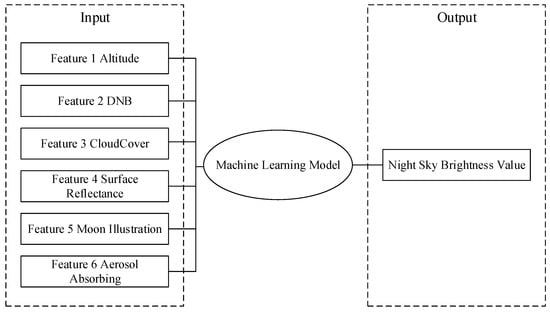
Figure 2.
Conceptual Diagram for Model Building.
A variety of modeling methods were employed, including tree-based models (Gradient Boosting, Random Forest, XGBoost, LightGBM, CatBoost), Support Vector Machines (SVM), linear models (Linear Regression, Ridge Regression, Lasso Regression, Bayesian Ridge), and second- and third-order polynomial regression models. Model performance was comprehensively evaluated using metrics such as Mean Squared Error (MSE), Root Mean Squared Error (RMSE), Mean Absolute Error (MAE), Mean Relative Error (MRE), R-squared (R2), and 10-fold cross-validation results (CV MSE, CV RMSE, CV MAE, CV R2).
A flowchart (Figure 3) outlines each step of our approach:
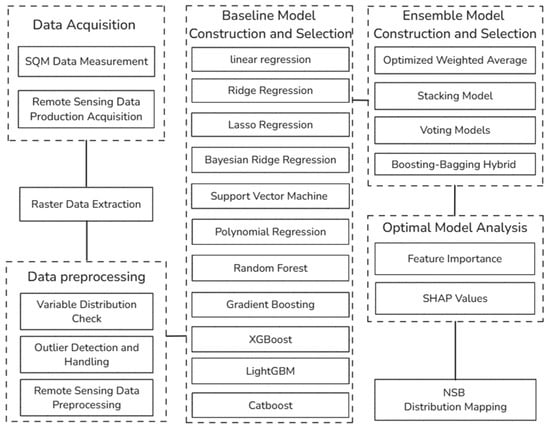
Figure 3.
Flowchart.
2.3.1. Baseline Models
Several modeling approaches were used in this study, including tree-based models, Support Vector Machines (SVM), linear models, and polynomial regression. Below is a brief overview of each method:
- Tree-based models
These models, including Gradient Boosting (GB), Random Forest (RF), XGBoost, LightGBM, and CatBoost, are methods that build multiple decision trees and combine their predictions to improve model accuracy and robustness. These methods are well-suited for capturing complex, non-linear relationships between the dependent and independent variables. Tree-based models are known for their flexibility, ability to handle large datasets, and robustness to overfitting [54,55].
- Support Vector Machines (SVM)
SVM is a supervised learning model primarily used for classification but can also be applied to regression tasks. SVM aims to find a hyperplane that best fits the data while minimizing errors. In regression, this is used to predict continuous values. SVM is particularly effective in higher-dimensional spaces and is capable of modeling complex, non-linear relationships through the use of kernel functions [56,57].
- Linear models
Linear models, such as Linear Regression, Ridge Regression, Lasso Regression, and Bayesian Ridge, are used to model linear relationships between the dependent and independent variables. These models are straightforward and computationally efficient. Ridge and Lasso regression introduce regularization to prevent overfitting, while Bayesian Ridge regression provides a probabilistic approach that can account for uncertainties in the model parameters [58].
- Polynomial regression
Polynomial regression is a natural extension of linear regression that incorporates higher-order terms (e.g., squared or cubic terms) of the independent variables. This enables the model to capture non-linear relationships while retaining a degree of interpretability and relatively low computational complexity. Although polynomial regression may not match the performance of more sophisticated non-linear methods in all cases, it serves as a useful baseline and provides insight into the non-linear dynamics present in the data [58].
2.3.2. Ensemble Methods
To further improve the accuracy and robustness of our predictions, we employed ensemble learning methods. Ensemble learning combines multiple base learners so that their diverse strengths can complement each other, often leading to better overall performance and reduced overfitting compared to using a single model. In our study, the final goal was to capture the complex relationships between NSB and various environmental variables more effectively. Specifically, we implemented four ensemble strategies:
- Optimized Weighted Averaging:
We combined the predictions of five tree-based models (RF, GB, XGBoost, LightGBM, and CatBoost) by assigning an optimal weight to each. The optimal weights were found by minimizing the mean squared error (MSE) on the test set under the constraint that all weights sum to 1 and lie between 0 and 1.
By weighting each model according to its accuracy, the final prediction capitalizes on the strengths of each base model while reducing the impact of their individual weaknesses.
- Stacking Model:
In stacking, we used four tree-based models (RF, GB, XGBoost, and LightGBM) as base learners, and a Support Vector Regression (SVR) model as the meta-learner. Training and prediction were performed using 10-fold cross-validation to capture complex nonlinear relationships.
The meta-learner (SVR) can learn how best to combine the outputs of diverse base models, often yielding more robust predictions than any single model alone.
- Voting Ensemble:
We combined the same five tree-based models in a voting regression setup, where each base model’s prediction was aggregated via a simple voting strategy. Our results showed consistency with the Optimized Weighted Averaging method, indicating that a straightforward voting scheme can also align with more refined weighting approaches.
A simple or average vote of multiple strong learners can smooth out errors and yield stable results without requiring a separate training phase for combining predictions.
- Boosting-Bagging Hybrid Model:
We combined three models (RF, XGBoost, and LightGBM) using equal weights of 1/3. This approach leverages both Bagging (e.g., RF) to reduce variance and Boosting (e.g., XGBoost, LightGBM) to reduce bias, effectively merging their complementary strengths.
Bagging-based models are well-known for low variance, while boosting-based models generally achieve high accuracy. Merging them can lead to a balanced predictive performance that benefits from both paradigms.
Through these ensemble strategies, our goal was to integrate the strengths of multiple learning algorithms and thus achieve higher predictive accuracy and more robust generalization than any single model could provide.
3. Results
3.1. Model Evaluation Results
As shown in Figure 4 and Table A1, Tree-based models (GB, RF, XGBoost, LightGBM, and CatBoost) demonstrated the best overall performance, with test set R2 values approaching or exceeding 0.84, indicating strong generalization capabilities. Among them, RF exhibited the most stable performance, achieving a test set R2 of 0.873, an MSE of 0.228, an RMSE of 0.478, and an MAE of 0.313, highlighting its significant advantages in error control and stability. XGBoost achieved a test set R2 of 0.846, slightly lower than RF, but its training error was extremely low (R2 = 0.992), reflecting its strong fitting ability. Additionally, XGBoost achieved a cross-validation R2 of 0.866, demonstrating stable generalization performance on new data. GB achieved a test set R2 of 0.841, slightly inferior to XGBoost and RF, but still maintained good error control and a simple model structure. LightGBM achieved a test set R2 of 0.861, an MSE of 0.249, and an RMSE of 0.499, providing high accuracy while maintaining excellent training efficiency. CatBoost achieved an R2 of 0.848, with overall performance close to LightGBM, and is particularly suitable for handling large-scale datasets requiring fast modeling.
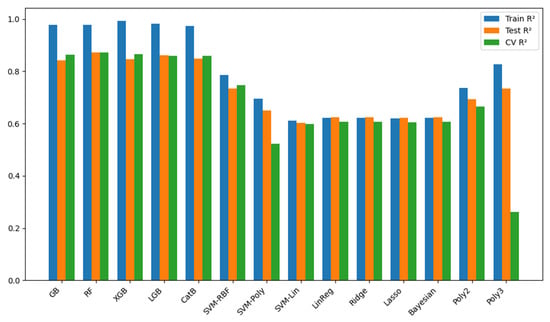
Figure 4.
R2 of Baseline Models.
SVM models with RBF, linear, and polynomial kernels showed certain advantages in nonlinear data modeling. The SVM (RBF Kernel) achieved a test set R2 of 0.735, an MSE of 0.475, and an RMSE of 0.689, outperforming linear kernel SVM (test set R2 = 0.602) but still lagging behind tree-based models in overall performance and generalization. SVM (Polynomial Kernel) achieved a test set R2 of 0.649, an MSE of 0.629, and an RMSE of 0.793, indicating improved capability to capture complex relationships but with higher error rates and lower stability.
Linear models, including Linear Regression, Ridge Regression, Lasso Regression, and Bayesian Ridge, exhibited similar performances, with test set R2 values around 0.623 and MSE values close to 0.676. These results indicate that linear models struggle with capturing complex nonlinear features. Their MAE and MRE were also significantly higher than those of tree-based models, further underscoring their limitations in fitting the target variable.
Polynomial regression exhibited certain advantages in nonlinear modeling. Second-order polynomial regression achieved a test set R2 of 0.692, an MSE of 0.552, and an RMSE of 0.743, showing significant improvement over linear models but still falling short of tree-based models. Third-order polynomial regression achieved a test set R2 of 0.735 and an MSE of 0.474, comparable to SVM (RBF Kernel). However, its cross-validation error (CV MSE = 1.257) was relatively high, indicating reduced generalization performance due to model complexity and a potential risk of overfitting.
Figure 5 and Figure 6 and Table A2 show the results of ensemble models building. The optimized weighted averaging and voting ensemble models showed the best performance, achieving a test set R2 of 0.877, an MSE of 0.221, an RMSE of 0.470, and an MAE of 0.304, with an MRE of only 0.018, demonstrating excellent error control and generalization performance. The Boosting-Bagging hybrid model achieved slightly lower performance but remained highly reliable, making it a suitable alternative. In practical applications, these ensemble methods offer robust tools for modeling relationships between NSB and multidimensional environmental features, with significant potential for broader application.
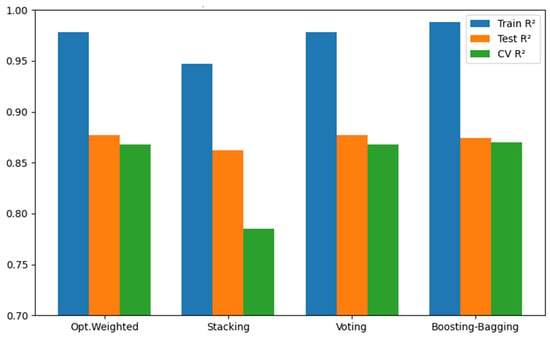
Figure 5.
R2 of Ensemble Methods.
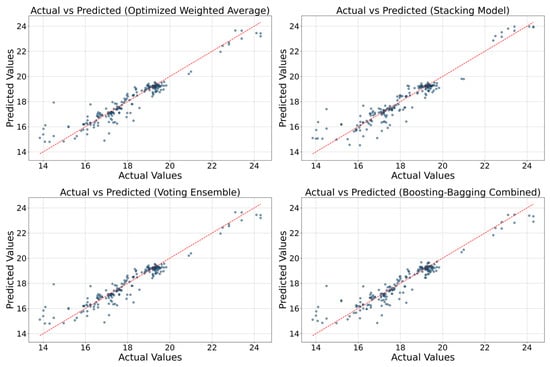
Figure 6.
Scatter Plot of Predictions by Ensemble Methods.
In the model performance evaluation, the optimized weighted averaging and voting ensemble models demonstrated the best performance on the test set, achieving an R2 of 0.877, a Mean Squared Error (MSE) of 0.221, a Root Mean Squared Error (RMSE) of 0.470, and a Mean Absolute Error (MAE) of 0.304. The Mean Relative Error (MRE) was as low as 0.018, indicating exceptional predictive accuracy and error control. Additionally, 10-fold cross-validation results confirmed the stability and robustness of the models, with both models achieving an R2 of 0.868 and a cross-validation MSE (CV MSE) of 0.239. The optimized weighted averaging model dynamically adjusted the weights of five tree-based base models by minimizing the MSE objective function, resulting in a final weight configuration of (0.267, 0.018, 0.315, 0.329, 0.071), effectively integrating the strengths of the base models. The voting ensemble model, using the same weight configuration, exhibited predictive performance consistent with the optimized weighted averaging model, further validating the robustness of the weighting strategy. These results demonstrate that both models can serve as the final models for this study, providing robust support for high-precision modeling of NSB.
3.2. Model Application Results
Using the best-performing models, an NSB Distribution Map was generated. Due to limitations in sample size and geographic coverage, the global NSB map presented in this study serves primarily as an exploratory attempt at model generalization. Consequently, inaccuracies may exist in regions lacking sufficient training data, and the global map should therefore be considered as a general reference rather than a precise representation of actual NSB conditions. The subsequent analyses presented in this study are focused mainly on the detailed NSB distribution maps of the specific regions (Guangdong, Urumqi, and Western Europe), where sufficient observational data have been collected and validated. These regional maps clearly illustrate the spatial distribution of light pollution and effectively capture the combined effects of nighttime lighting intensity and atmospheric conditions on sky brightness.
The resulting NSB Distribution Map not only provides a clear and intuitive visualization of the spatiotemporal characteristics of light pollution but also serves as a critical data foundation for subsequent analysis of the primary drivers of light pollution and its mitigation. This outcome validates the application potential of the optimized weighted averaging and voting ensemble models in light pollution modeling while laying a theoretical and practical foundation for applying similar methods at larger scales.
4. Discussion
4.1. SHAP Analysis
SHAP (SHapley Additive exPlanations) analysis provides a quantitative basis for understanding the contributions of variables to the outputs of the predictive model [59]. As shown in the SHAP summary plot (Figure 7), altitude, DNB, and cloud cover have the most significant impacts on model outputs. Specifically, the SHAP values for DNB increase with brightness, indicating that in areas with severe artificial light pollution, higher nighttime light intensity makes a substantial positive contribution to the predictions. However, this effect plateaus beyond a certain brightness threshold, suggesting a marginal saturation effect of nighttime lighting. The impact of the aerosol absorption index follows a nonlinear pattern: its contribution to predictions is minimal at low concentrations but becomes significantly negative at higher concentrations, highlighting the critical role of atmospheric particles in attenuating light propagation. The influence of surface reflectance is most pronounced in the range of 0.45 to 0.55, where it contributes positively to predictions, while its impact diminishes outside this range.
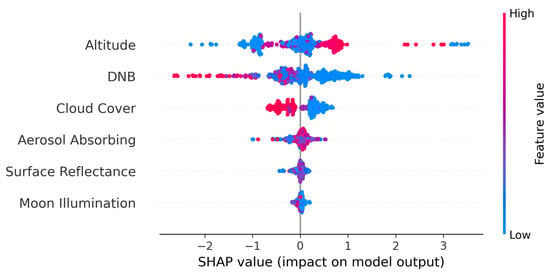
Figure 7.
SHAP Summary.
SHAP dependency analysis further reveals complex interactions among variables (Figure 8). For instance, the relationship between aerosol absorption index and moon illumination indicates that at low aerosol concentrations, the SHAP values for moon illumination have a minimal impact on predictions. However, when both aerosol concentration and moon illumination are high, their combined positive contribution to the model becomes significant, suggesting a potential synergistic effect under certain conditions. The interactions between cloud cover and other variables appear less distinct, implying that its influence on model outputs is driven more by nonlinear interactions. This is particularly evident when cloud cover is high, as its positive or negative contributions fluctuate depending on specific conditions, likely reflecting the dual role of clouds in blocking and scattering light. The scatter pattern between surface reflectance and cloud cover suggests that surface reflectance has a more pronounced impact on SHAP values at certain levels of cloud cover, possibly due to the scattering effect of clouds on surface-reflected light.
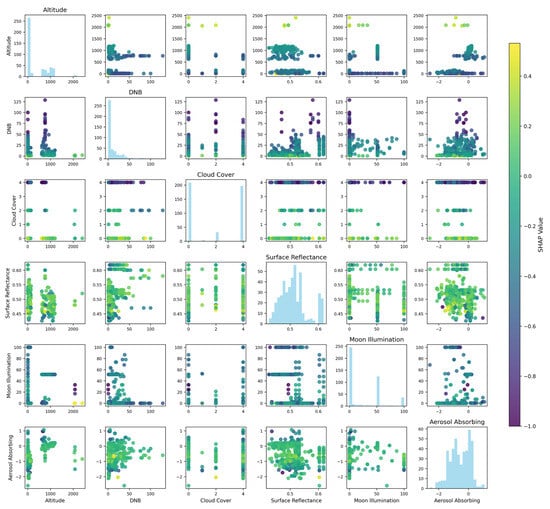
Figure 8.
SHAP Variable Dependency.
Overall, SHAP analysis quantitatively illustrates the contributions of individual variables to model predictions, particularly emphasizing the pivotal roles of nighttime light intensity and aerosol absorption index in the predictive model. However, the nonlinear effects of surface reflectance and cloud cover require further investigation to elucidate their complex interaction mechanisms. These findings provide a more comprehensive perspective on variable contributions, enhancing the understanding of light pollution assessments.
4.2. Characteristics of NSB Distribution Maps
4.2.1. Comparison with Remote Sensing Imagery
Compared to nighttime light remote sensing imagery (e.g., NPP-VIIRS DNB images, Figure 9), the NSB distribution map (Figure 10) produced in this research reveals a more comprehensive picture of the breadth and depth of light pollution impacts, as well as its interactions with other environmental factors. The map exhibits the following notable characteristics:
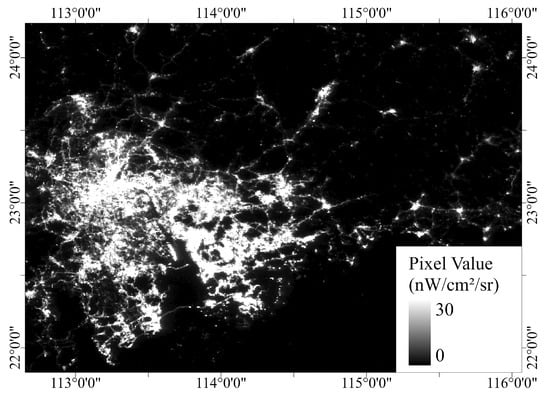
Figure 9.
NPP-VIIRS Image, Guangdong Area, August 2024.
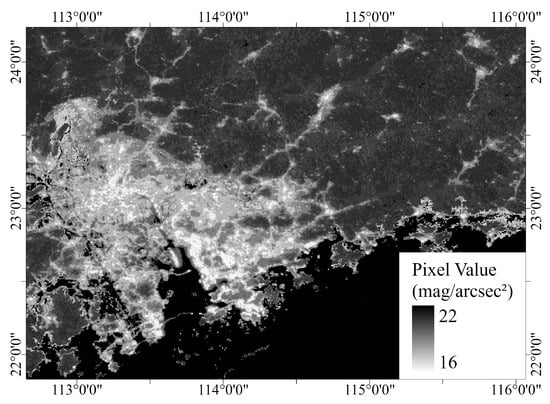
Figure 10.
NSB Distribution Map, Guangdong Area, August 2024.
- Broader influence range of light sources:
The histogram of NSB pixel values exhibits a bi-modal to trimodal pattern, with one prominent cluster around 19 mag/arcsec2 and another around 24 mag/arcsec2. A smaller group of pixels appears between 16–17 mag/arcsec2, in-dicating the brightest regions (i.e., heavily light-polluted urban cores). In contrast, values near 24 mag/arcsec2 signify exceptionally dark skies, often found in areas with minimal artificial lighting such as remote rural regions, deserts, or open seas. The mid-range cluster (~19 mag/arcsec2) represents moderately bright skies, where scattered suburban lights or partial cloud/aerosol contributions lead to intermediate NSB levels. This bimodal phe-nomenon can be explained by two major factors: first, even on a local scale, heavily illuminat-ed areas remain relatively small compared to vast regions with minimal or no artificial lighting, thus generating a clear high-value peak. Second, many rural or suburban areas experience moderate nighttime brightness (often influenced by cloud reflection and diffuse illumination), forming the second peak around 19 mag/arcsec2. These distinct peaks are further reinforced by the dynamic interplay of atmospheric aerosols, cloud coverage, and surface reflectance, which collectively shape the broad range of observed NSB values.
The NSB distribution map captures the long-distance impacts of artificial light sources on surrounding areas. In comparative analysis, while NPP-VIIRS imagery effectively identifies regions with dense light sources, it underrepresents the enhancement in sky brightness caused by long-distance light scattering (e.g., atmospheric scattering and aerosol reflection). In contrast, the NSB distribution map demonstrates a significantly larger extent of light pollution, highlighting its superior sensitivity in depicting the long-distance effects of light sources.
- Higher completeness of affected sky regions:
Unlike nighttime light imagery, which primarily focuses on ground-level luminous areas, the NSB distribution map integrates various factors such as artificial light sources, atmospheric conditions, and surface reflectance to provide a more holistic representation of sky brightness variations. Particularly in regions farther from strong light sources, the NSB distribution map effectively captures subtle light pollution effects, offering more comprehensive spatial distribution information.
- Enhanced depiction of secondary effects of artificial light sources:
NPP-VIIRS imagery primarily records direct light radiation, whereas the NSB distribution map captures secondary optical effects such as atmospheric scattering and cloud reflection. This makes the NSB distribution map a more suitable tool for studying the extent of light pollution impacts. For example, the phenomenon of skyglow near urban core areas is more clearly represented in the NSB distribution map.
- Broad dynamic range and distinct peaks in distribution:
This wide dynamic range highlights the NSB map’s ability to capture both extremely bright urban areas and vast dark-sky regions on the same scale. Traditional nighttime light satellites often saturate over brightly lit cities or fail to discern low-intensity scattered light in remote zones. In contrast, the NSB-based approach provides finer granularity and accommodates variations introduced by cloud reflection, aerosol scattering, and surface reflectance. Consequently, the distribution underscores how the method can better distinguish subtle gradients of sky brightness while also encompassing intensely illuminated locations.
4.2.2. Comparison with Existing NSB Map
To clarify the differences between the NSB map produced in this study and the existing global NSB map, “World Map of Artificial Sky Brightness” [43], the following aspects were examined:
- Measurement Units:
This study utilizes mag/arcsec2, directly adopting the SQM measurement unit as the modeling target. In contrast, the existing global map employs the linear SI unit (μcd/m2), obtained through unit conversion. The differences in measurement units reflect distinct analytical objectives and methodological approaches.
- Modeling Methodology:
World Map of Artificial Sky Brightness is based on an idealized, clear atmospheric model with fixed aerosol extinction parameters, resulting in a static representation of night sky brightness. Conversely, this study integrates dynamic environmental factors—including meteorological conditions, surface reflectance, and aerosol variability—into machine learning models, generating dynamic NSB maps capable of capturing temporal and spatial variations.
- Spatial Resolution and Detail:
Regional comparisons (Figure 11 and Figure 12) reveal differences in spatial resolution. World Map of Artificial Sky Brightness due to its coarser resolution, appears blurred at intermediate to small scales, reducing its utility for detailed regional analysis.
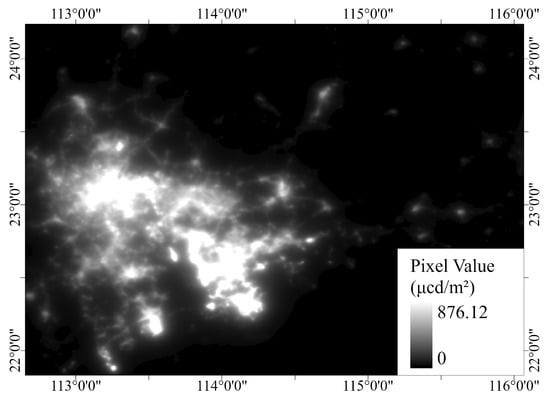
Figure 11.
World Map of Artificial Sky Brightness, Guangdong Area, 2015.
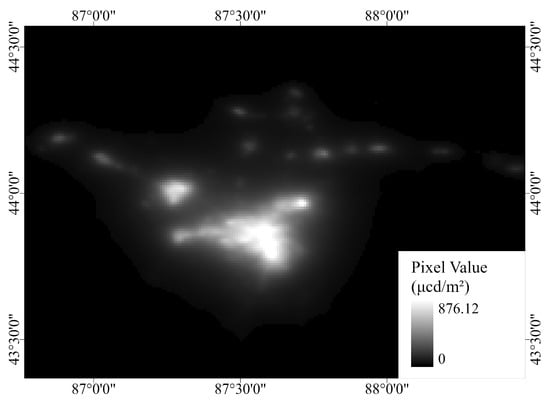
Figure 12.
World Map of Artificial Sky Brightness, Urumqi Area, 2015.
- Data Currency:
The existing global map utilizes data collected before 2016, which may not accurately represent current conditions, especially in rapidly urbanizing areas such as Guangdong and Urumqi. Comparisons indicate that regions with rapid urban development show significantly smaller areas of artificial lighting coverage in the older map compared to recent observations presented here.
Overall, these comparisons suggest that while existing global NSB maps provide a valuable broad-scale reference, the approach outlined in this study enhances spatial resolution, incorporates recent environmental variability, and better reflects the current distribution of artificial lighting in rapidly developing regions.
4.2.3. Advantages of the NSB Distribution Map
- Accurate depiction of the actual extent of light pollution:
By combining remote sensing data with model predictions, the NSB distribution map more precisely delineates the spatial extent of light pollution, going beyond the direct radiation areas of ground-based light sources. This comprehensive depiction is particularly important for studying the long-distance ecological impacts of light pollution.
- Effective reflection of the integrated effects of environmental factors:
The generation of the NSB distribution map accounts for key environmental factors such as artificial light sources, aerosol concentrations, cloud cover, and surface reflectance. As a result, the map not only illustrates the intensity of light pollution but also reveals variations in its propagation characteristics under different environmental conditions. This provides valuable scientific support for environmental protection and policy-making.
4.3. Spatial and Temporal Distribution of NSB
Analysis of the NSB distribution map reveals distinct spatial heterogeneity shaped by both anthropogenic lighting patterns and natural environmental factors. From the final NSB distribution map, several key observations emerge:
- Highly urbanized regions with intense light pollution
Areas encompassing large metropolitan centers—such as parts of East Asia, Western Europe—exhibit the lowest NSB readings (i.e., the brightest nighttime skies). In these zones, the combination of dense artificial lighting and frequent atmospheric aerosol accumulation enhances skyglow, leading to broad contiguous regions of low NSB (roughly in the 16–18 mag/arcsec2 range). These values correspond to heavily illuminated skies with significant scattering and reflection of urban light sources.
- Transitional belts of moderate NSB
Moving away from major urban cores, NSB values gradually increase into a mid-range cluster, commonly around 19–20 mag/arcsec2. This moderate category is often found in suburban peripheries or semi-rural landscapes near industrial corridors. Cloud cover and local variations in surface reflectance can momentarily shift these readings, yet overall, these “in-between” areas exhibit moderate sky brightness levels indicative of partial light pollution influence.
- Extensive dark-sky regions
The highest NSB values (above 23–24 mag/arcsec2) concentrate in remote or sparsely populated areas, including oceans and mountain ranges. These regions have minimal artificial lighting and lower atmospheric scattering, resulting in some of the darkest skies on earth. Such high-NSB zones coincide with places of strong astronomical interest and conservation initiatives aimed at preserving pristine night environments.
- Latitudinal and climatic influences
The NSB distribution also reflects climatic and latitudinal differences. Areas closer to the poles can exhibit pronounced seasonal variation, with extended daylight or darkness periods influencing observed NSB in certain months. Meanwhile, tropical and subtropical zones with high humidity or frequent cloud cover tend to have somewhat elevated sky brightness, even in rural contexts, due to enhanced scattering and reflection processes.
- Temporal variability
Although the NSB distribution maps provides a snapshot of average or representative conditions, temporal fluctuations remain significant—particularly due to seasonal changes in cloudiness, aerosol loads, and human activities (e.g., holiday lighting surges). In regions with monsoonal climates or strong seasonality, local NSB can shift considerably between dry and wet seasons. These temporal trends, if assessed on a monthly or weekly basis, would reveal dynamic expansions or contractions of moderately polluted zones.
4.4. Comparison of Differences in Spatial and Temporal Distribution of NSB
4.4.1. Comparison Across Different Months in Guangdong Area
An analysis of NSB distribution maps and pixel statistics for the Pearl River Delta region of Guangdong in August 2024 (wet season) and December 2024 (dry season) reveals significant seasonal differences in NSB (Figure 13).
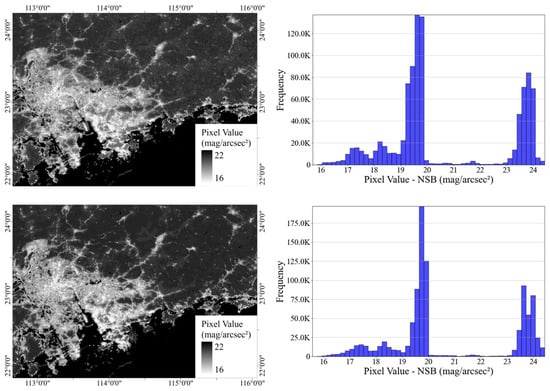
Figure 13.
NSB Distribution Maps and Histograms, Guangdong Area, August (Top) and December (Bottom) 2024.
From the statistical data, the mean NSB in the wet season is 20.62, with pixel values concentrated between 15.69 and 24.4 and a standard deviation of 2.26, indicating overall brighter skies with a concentrated distribution. In the dry season, the mean NSB increases to 20.74, with pixel values ranging from 15.57 to 24.43 and a standard deviation of 2.27, reflecting darker skies with a wider brightness distribution.
The histograms show that during the wet season, the frequency of pixel values in the lower range (16–19) is significantly higher compared to the dry season. This indicates that in areas with artificial lighting, a larger portion of the sky is affected during the wet season. In contrast, during the dry season, the distribution shifts to higher pixel values, primarily concentrating at 19.5. Additionally, the proportion of high-value pixels in the tail increases significantly, suggesting an overall increase in sky darkness and a notable enhancement in darkness in some areas.
This phenomenon can be attributed to the following factors:
- Differences in meteorological conditions:
Guangdong, located in a subtropical monsoon climate zone, experiences higher humidity and more frequent cloud cover during the wet season (August). These conditions significantly enhance the scattering and reflection of light, causing more artificial light to be reflected back to the ground, resulting in brighter nighttime skies. In the dry season (December), lower humidity and clearer skies reduce scattering effects, leading to significantly darker skies.
- Aerosol concentrations:
High humidity during the wet season may increase aerosol concentrations in the atmosphere, further enhancing light scattering effects. Conversely, the clearer atmosphere in the dry season facilitates upward light escape, reducing the impact of light pollution on the night sky.
- Human activities:
The wet season coincides with the peak of annual production activities, with more frequent nighttime economic activities in urban and suburban areas, resulting in higher artificial light output and more intense light pollution. In the dry season, although some festive activities may contribute to light pollution, the overall output of artificial light sources in suburban areas may decrease, particularly in non-core regions, potentially further reducing the overall brightness of the night sky.
4.4.2. Comparison Across Different Months in Urumqi Area
An analysis of NSB distribution maps and pixel statistics for Urumqi in August 2024 (summer) and December 2024 (winter) reveals significant seasonal differences in NSB (Figure 14).
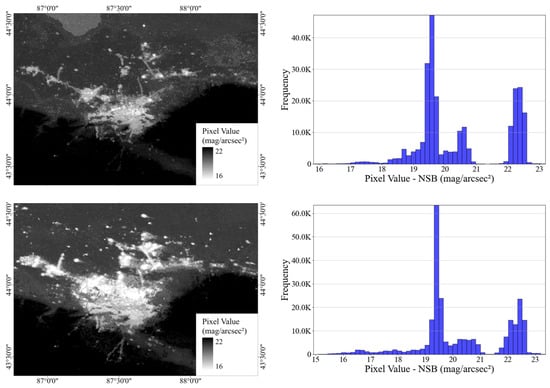
Figure 14.
NSB Distribution Maps and Histograms, Urumqi Area, August (Top) and December (Bottom) 2024.
According to the statistical data, the mean NSB in summer is 20.44, with pixel values ranging from 15.82 to 23.19 and a standard deviation of 1.37, indicating relatively dark skies with a concentrated distribution. In winter, the mean NSB slightly decreases to 20.27, but the pixel value range expands to 14.92–23.37, with an increased standard deviation of 1.58. This suggests greater variability in sky brightness during winter, with some localized areas experiencing significantly darker skies.
The histograms clearly show that in summer, pixel values are primarily concentrated between 19.0 and 20.0, exhibiting a symmetrical single-peak distribution. In contrast, winter pixel values shift slightly to the left, predominantly between 15.0 and 19.0, with a broader range and a higher frequency of tail-end high values. This indicates that while overall changes in sky brightness between summer and winter are minimal, winter is characterized by increased variability in brightness distribution.
One of the key drivers of this seasonal variation is the high reflectance effect of snow-covered ground. In winter, snow significantly increases surface reflectance. When artificial light illuminates the snow, a large portion of the light is reflected back into the atmosphere, where it undergoes further scattering. This enhanced reflection and propagation effect allows artificial light sources to impact more distant areas, expanding the coverage of light pollution and exacerbating differences in sky brightness between regions.
In addition, winter meteorological conditions may amplify this effect. Under higher humidity and more frequent cloud cover, atmospheric scattering and absorption of light become more pronounced, causing the reflected light to disperse further. Considering the population distribution and geographical characteristics of Urumqi, light pollution from urban core areas, enhanced by the combined effects of snow and atmospheric conditions, extends its influence to larger suburban and rural areas. This phenomenon is reflected in the distribution map as an expansion of regions with reduced brightness.
Overall, Urumqi’s winter NSB distribution shows significantly higher variability compared to summer. This is primarily attributed to the high reflectance effect of snow cover and winter meteorological conditions. This finding highlights the critical influence of surface characteristics on NSB and suggests that snow cover may serve as a key driver of winter light pollution in temperate continental climate zones. Future studies could further explore the effects of different surface characteristics and atmospheric conditions on the spread of light pollution, providing scientific support for region-specific and seasonally adjusted light pollution management strategies.
4.4.3. Comparison Across Different Regions in the Same Month
A comparison of NSB distribution maps and statistics for Guangdong, Urumqi, and Western Europe in August 2024 reveals significant regional differences in NSB (Figure 13, Figure 14 and Figure 15).
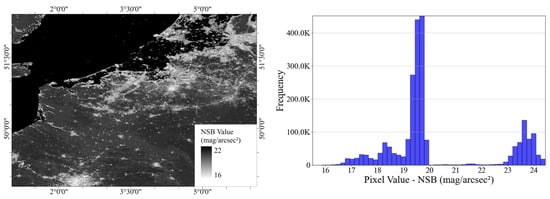
Figure 15.
NSB Distribution Map and Histogram, Western Europe Area, August 2024.
In Guangdong, the mean NSB is 20.63, with values ranging from 15.68 to 24.44 and a standard deviation of 2.26. The overall low pixel values indicate relatively bright skies. The histogram shows a concentration at low values range, reflecting the widespread and uniform coverage of artificial light sources in the region. As a densely populated coastal province, Guangdong is significantly affected by light pollution from urban agglomerations. The scattering and reflection of urban light sources through the region’s humid atmosphere contribute to the extensive reach of skyglow. It is important to note, however, that although Guangdong’s mean NSB is the highest among the three regions, this does not imply that the area is less affected by light pollution. The study area for Guangdong includes large maritime regions where higher NSB values elevate the mean. In fact, when comparing the medians, Guangdong has a median NSB of 19.70, which is comparable to Urumqi (20.71) and slightly higher than Western Europe (20.58), suggesting that the urban impact on NSB remains significant.
In Urumqi, the mean NSB is 20.44, with values ranging from 15.82 to 23.19 and a standard deviation of 1.37. Compared to Guangdong, the higher pixel values suggest darker skies. As part of an inland arid and semi-arid zone, Urumqi’s artificial light sources are primarily concentrated in urban cores. The region’s topographical variability and dry atmosphere limit the spread of light pollution.
In Western Europe, the mean NSB is 20.23, with values ranging from 15.51 to 24.44 and a standard deviation of 2.01. The pixel values fall between those of Guangdong and Urumqi, demonstrating significant diversity. The histogram shows a wide range of values, which may be attributed to the region’s complex geographic features (e.g., a mix of coastal, mountainous, and plain terrains) and the low aerosol concentrations typical of high-latitude regions. With high and evenly distributed urban density, artificial light sources impact various areas differently, resulting in greater heterogeneity in NSB.
The comparison highlights that Guangdong is the most affected by light pollution, with the highest brightness levels, while Urumqi experiences the lowest light pollution intensity. Western Europe, on the other hand, exhibits a complex brightness distribution due to diverse geographical and meteorological characteristics. These regional differences are closely tied to human activities, atmospheric conditions, and topographical features.
5. Conclusions
This study utilized optimized weighted averaging and voting ensemble models, combined with multi-source remote sensing data, to model and predict NSB. It successfully revealed the spatial distribution characteristics of NSB and its key influencing factors within selected study regions, producing high-resolution regional light pollution distribution maps. The results demonstrate significant spatial heterogeneity in NSB at the local scale, showing severe light pollution in areas densely populated with artificial light sources, such as urban cores and industrial parks, while suburban and rural areas exhibit relatively lower sky brightness. Feature importance analysis revealed that nighttime light intensity (VIIRS DNB pixel values) is the most critical determinant of NSB. Additionally, cloud cover, aerosol index, and surface reflectance also significantly impact NSB. In urban areas, the reflective effects of cloud cover and the scattering effects of aerosols further amplify the impact of light pollution.
The significance of this study lies in its integration of remote sensing data and machine learning models, providing an efficient solution for predicting light pollution levels at local scales. This approach addresses the limitations of traditional monitoring methods, such as high resource costs and limited spatiotemporal coverage, while offering comprehensive insights into the spatial patterns and trends of light pollution through distribution maps. These findings can provide valuable references for formulating policies for light pollution mitigation. Moreover, the dynamic predictive capabilities of the models offer technical support for real-time monitoring and management of light pollution.
Despite its achievements, this study has certain limitations. First, discrepancies between the data collection times and satellite imaging times may lead to temporal mismatches between model inputs and remote sensing imagery, potentially affecting prediction accuracy. Second, NSB observations may be influenced by external factors such as vehicle headlights and transient atmospheric conditions, increasing data uncertainty. Additionally, due to practical constraints, the data collection was limited to specific seasons and geographic locations, which may restrict the model’s broader applicability and seasonal robustness beyond the study regions.
Future research could improve and expand in the following directions:
- (1)
- Optimize data collection strategies to select observation windows that align more closely with satellite imaging times and include data from multiple time periods and seasons to better capture the spatiotemporal dynamics of NSB.
- (2)
- Enhance observational accuracy and consistency by using higher-precision equipment and refined measurement protocols to reduce external interferences.
- (3)
- Expand geographical coverage to include diverse geographical conditions, climate types, and levels of human activity, thereby improving the model’s generalization and applicability.
- (4)
- Refine methods by incorporating high-resolution remote sensing imagery, multi-source data fusion techniques, and advanced big data analysis and dynamic modeling methods to further enhance model performance and scalability.
- (5)
- Explore more complex interaction mechanisms between NSB and environmental factors, investigating the combined effects of surface characteristics, climatic conditions, and human activities on light pollution, thereby providing a more comprehensive scientific basis for precise monitoring and management.
Overall, this study confirms the feasibility and effectiveness of remote sensing technology and ensemble learning methods for NSB modeling at local and regional scales, demonstrating substantial potential for detailed local-scale analysis and dynamic prediction. Expanding this method to larger or global scales in future studies would require overcoming the current data limitations and further refining models and observational methods. Such expansion represents a promising direction, potentially enabling more extensive, accurate, and globally applicable monitoring of light pollution.
Author Contributions
Conceptualization, S.Z., A.E. and A.K.; methodology, S.Z. and A.K.; software, S.Z. and Y.C.; validation, S.Z.; formal analysis, S.Z.; investigation, S.Z. and Y.C.; resources, S.Z. and A.K.; data curation, S.Z. and Y.C.; writing—original draft preparation, S.Z.; writing—review and editing, A.E., A.K., T.V.d.V. and P.D.M.; visualization, S.Z. and Y.C.; supervision, A.E., A.K. and T.V.d.V.; project administration, A.K., T.V.d.V. and P.D.M.; funding acquisition, A.K., T.V.d.V. and P.D.M. All authors have read and agreed to the published version of the manuscript.
Funding
This research was jointly funded by the National Natural Science Foundation of China (NSFC, Grant No. 32071655) and Chinese Academy of Sciences President’s International Fellowship Initiative (PIFI, Grant No. 2024PVB0064; 2017VCA0002).
Data Availability Statement
The field measurement data collected in this study are not publicly available due to potential confidentiality concerns and national policy restrictions. However, third-party datasets used in this research can be accessed through the following websites: NPP-VIIRS Data: Available from EOG [https://payneinstitute.mines.edu/eog/]. ESA Data: Available from ESA [https://dataspace.copernicus.eu/]. NASA Data: Available from NASA [https://ladsweb.modaps.eosdis.nasa.gov/search/]. All third-party data are also available from Google Earth Engine [https://earthengine.google.com/]. The results generated by the research, including the processed model data and related findings, can be shared upon reasonable request from the corresponding author.
Acknowledgments
The authors would like to express their sincere gratitude to Sun Jiantao from the Xinjiang Astronomical Observatory, Chinese Academy of Sciences for providing them with the opportunity to conduct data measurements at the observatory in Xinjiang. They also wish to thank Chen Yang and Lu Rongqian from the Xinjiang Institute of Ecology and Geography, Chinese Academy of Sciences for their valuable assistance during data collection in Urumqi. In addition, they extend their thanks to Lin Xuan from the Guangzhou College of Software Engineering, who offered great support during data collection in Chaozhou. The authors are further indebted to Xiao Wanghao from Ghent University for his help during data measurement in Ghent, Belgium, as well as for his support with living arrangements. Finally, the authors acknowledge all other members of the research institute and team who provided additional assistance throughout this research.
Conflicts of Interest
The authors declare no conflicts of interest.
Abbreviations
| SQM | Sky Quality Meters |
| NSB | Night Sky Brightness |
| LED | Light-emitting Diode |
| VIIRS | Visible Infrared Imaging Radiometer Suit |
| DNB | Day and Night Band |
| EOG | Earth Observation Group |
| ESA | European Space Agency |
| UV | Ultraviolet |
| NASA | National Aeronautics and Space Administration |
| DEM | Digital Elevation Model |
| RF | Random Forest |
| GB | Gradient Boost |
| SVM | Support Vector Machine |
| SVR | Support Vector Regression |
| RBF | Radial Basis Function |
| MSE | Mean Squared Error |
| RMSE | Root Mean Squared Error |
| MAE | Mean Absolute Error |
| MRE | Mean Relative Error |
| CV | Cross-validation |
| SHAP | SHapley Additive exPlanations |
Appendix A

Table A1.
Performance of Baseline Models.
Table A1.
Performance of Baseline Models.
| Model | Train MSE | Test MSE | Train RMSE | Test RMSE | Train MAE | Test MAE | Train MRE | Test MRE | Train R2 | Test R2 | CV MSE | CV RMSE | CV MAE | CV R2 |
|---|---|---|---|---|---|---|---|---|---|---|---|---|---|---|
| Gradient Boosting | 0.039 | 0.285 | 0.198 | 0.534 | 0.142 | 0.358 | 0.008 | 0.021 | 0.977 | 0.841 | 0.231 | 0.481 | 0.329 | 0.864 |
| Random Forest | 0.038 | 0.228 | 0.196 | 0.478 | 0.123 | 0.313 | 0.007 | 0.018 | 0.978 | 0.873 | 0.223 | 0.472 | 0.319 | 0.872 |
| XGBoost | 0.013 | 0.276 | 0.116 | 0.525 | 0.084 | 0.349 | 0.005 | 0.020 | 0.992 | 0.846 | 0.225 | 0.475 | 0.323 | 0.866 |
| LightGBM | 0.033 | 0.249 | 0.181 | 0.499 | 0.135 | 0.337 | 0.008 | 0.019 | 0.981 | 0.861 | 0.240 | 0.490 | 0.340 | 0.860 |
| CatBoost | 0.047 | 0.273 | 0.217 | 0.523 | 0.164 | 0.351 | 0.009 | 0.020 | 0.973 | 0.848 | 0.239 | 0.489 | 0.335 | 0.859 |
| SVM (RBF) | 0.369 | 0.475 | 0.607 | 0.689 | 0.383 | 0.425 | 0.022 | 0.025 | 0.786 | 0.735 | 0.438 | 0.662 | 0.436 | 0.746 |
| SVM (Poly) | 0.525 | 0.629 | 0.725 | 0.793 | 0.493 | 0.531 | 0.028 | 0.031 | 0.695 | 0.649 | 0.825 | 0.908 | 0.573 | 0.523 |
| SVM (Linear) | 0.671 | 0.713 | 0.819 | 0.845 | 0.577 | 0.544 | 0.033 | 0.032 | 0.610 | 0.602 | 0.689 | 0.830 | 0.589 | 0.599 |
| Linear Regression | 0.651 | 0.676 | 0.807 | 0.822 | 0.593 | 0.559 | 0.034 | 0.033 | 0.621 | 0.623 | 0.676 | 0.822 | 0.603 | 0.606 |
| Ridge Regression | 0.652 | 0.676 | 0.807 | 0.822 | 0.593 | 0.559 | 0.034 | 0.033 | 0.621 | 0.623 | 0.675 | 0.822 | 0.603 | 0.606 |
| Lasso Regression | 0.654 | 0.678 | 0.809 | 0.823 | 0.593 | 0.560 | 0.034 | 0.033 | 0.620 | 0.622 | 0.679 | 0.824 | 0.603 | 0.605 |
| Bayesian Ridge | 0.652 | 0.676 | 0.807 | 0.822 | 0.593 | 0.559 | 0.034 | 0.033 | 0.621 | 0.623 | 0.675 | 0.822 | 0.603 | 0.606 |
| Polynomial (degree 2) | 0.454 | 0.552 | 0.674 | 0.743 | 0.479 | 0.502 | 0.027 | 0.029 | 0.736 | 0.692 | 0.580 | 0.762 | 0.525 | 0.666 |
| Polynomial (degree 3) | 0.299 | 0.474 | 0.547 | 0.689 | 0.388 | 0.429 | 0.022 | 0.025 | 0.826 | 0.735 | 1.257 | 1.121 | 0.580 | 0.261 |

Table A2.
Performance of Ensemble Models.
Table A2.
Performance of Ensemble Models.
| Model | Train MSE | Test MSE | Train RMSE | Test RMSE | Train MAE | Test MAE | Train MRE | Test MRE | Train R2 | Test R2 | CV MSE | CV RMSE | CV MAE | CV R2 |
|---|---|---|---|---|---|---|---|---|---|---|---|---|---|---|
| Optimized Weighted Average | 0.038 | 0.221 | 0.196 | 0.470 | 0.139 | 0.304 | 0.008 | 0.018 | 0.978 | 0.877 | 0.239 | 0.489 | 0.306 | 0.868 |
| Stacking Model | 0.091 | 0.247 | 0.302 | 0.497 | 0.146 | 0.319 | 0.009 | 0.019 | 0.947 | 0.862 | 0.389 | 0.624 | 0.384 | 0.785 |
| Voting Ensemble | 0.038 | 0.221 | 0.196 | 0.470 | 0.139 | 0.304 | 0.008 | 0.018 | 0.978 | 0.877 | 0.239 | 0.489 | 0.306 | 0.868 |
| Boosting-Bagging Combined | 0.021 | 0.226 | 0.143 | 0.475 | 0.103 | 0.306 | 0.006 | 0.018 | 0.988 | 0.874 | 0.237 | 0.486 | 0.301 | 0.870 |
References
- Cinzano, P.; Falchi, F.; Elvidge, C.D.; Baugh, K.E. The artificial night sky brightness mapped from DMSP satellite Operational Linescan System measurements. Mon. Not. R. Astron. Soc. 2000, 318, 641–657. [Google Scholar] [CrossRef]
- Caraveo, P. Saving the Starry Night: Light Pollution and Its Effects on Science, Culture and Nature; Springer: Berlin/Heidelberg, Germany, 2021; ISBN 3-030-85064-1. [Google Scholar]
- Malakoff, D. Faulty Towers Each Year, Millions of Birds Die by Flying into Cell-Phone and TV Towers; Audubon: New York, NY, USA, 2001; Volume 103, pp. 78–83. [Google Scholar]
- Salmon, M. Artificial night lighting and sea turtles. Biologist 2003, 50, 163–168. [Google Scholar]
- Frank, K.D. Impact of Outdoor Lighting on Moths. Int. Astron. Union Colloq. 1991, 112, 51. [Google Scholar] [CrossRef]
- Macgregor, C.J.; Pocock, M.J.O.; Fox, R.; Evans, D.M. Pollination by nocturnal Lepidoptera, and the effects of light pollution: A review. Ecol. Entomol. 2015, 40, 187–198. [Google Scholar] [CrossRef]
- Meravi, N.; Kumar Prajapati, S. Effect street light pollution on the photosynthetic efficiency of different plants. Biol. Rhythm Res. 2020, 51, 67–75. [Google Scholar] [CrossRef]
- Liu, Z.; Lv, Y.; Ding, R.; Chen, X.; Pu, G. Light Pollution Changes the Toxicological Effects of Cadmium on Microbial Community Structure and Function Associated with Leaf Litter Decomposition. Int. J. Mol. Sci. 2020, 21, 422. [Google Scholar] [CrossRef]
- Sarmiento, J.; Pulgar, R.; Mandakovic, D.; Porras, O.; Flores, C.A.; Luco, D.; Trujillo, C.A.; Díaz-Esquivel, B.; Alvarez, C.; Acevedo, A.; et al. Nocturnal Light Pollution Induces Weight Gain in Mice and Reshapes the Structure, Functions, and Interactions of Their Colonic Microbiota. Int. J. Mol. Sci. 2022, 23, 1673. [Google Scholar] [CrossRef]
- Moore, M.V.; Pierce, S.M.; Walsh, H.M.; Kvalvik, S.K.; Lim, J.D. Urban light pollution alters the diel vertical migration of Daphnia. Int. Ver. Theor. Angew. Limnol. Verhandlungen 2000, 27, 779–782. [Google Scholar] [CrossRef]
- Hölker, F.; Wolter, C.; Perkin, E.K.; Tockner, K. Light pollution as a biodiversity threat. Trends Ecol. Evol. 2010, 25, 681–682. [Google Scholar] [CrossRef]
- Gaston, K.J.; Davies, T.W.; Bennie, J.; Hopkins, J. REVIEW: Reducing the ecological consequences of night-time light pollution: Options and developments. J. Appl. Ecol. 2012, 49, 1256–1266. [Google Scholar] [CrossRef]
- Contin, M.A.; Benedetto, M.M.; Quinteros-Quintana, M.L.; Guido, M.E. Light pollution: The possible consequences of excessive illumination on retina. Eye 2016, 30, 255–263. [Google Scholar] [PubMed]
- Davis, S.; Mirick, D.K.; Stevens, R.G. Night shift work, light at night, and risk of breast cancer. J. Natl. Cancer Inst. 2001, 93, 1557–1562. [Google Scholar] [PubMed]
- Burks, S.L. Managing Your Migraine: A Migraine Sufferer’s Practical Guide; Springer Science & Business Media: Berlin/Heidelberg, Germany, 1994; ISBN 0-89603-277-9. [Google Scholar]
- Menculini, G.; Cirimbilli, F.; Raspa, V.; Scopetta, F.; Cinesi, G.; Chieppa, A.G.; Cuzzucoli, L.; Moretti, P.; Balducci, P.M.; Attademo, L. Insights into the Effect of Light Pollution on Mental Health: Focus on Affective Disorders—A Narrative Review. Brain Sci. 2024, 14, 802. [Google Scholar] [CrossRef]
- Rodrigo-Comino, J.; Seeling, S.; Seeger, M.K.; Ries, J.B. Light pollution: A review of the scientific literature. Anthr. Rev. 2021, 10, 367–392. [Google Scholar] [CrossRef]
- Mander, S.; Alam, F.; Lovreglio, R.; Ooi, M. How to measure light pollution—A systematic review of methods and applications. Sustain. Cities Soc. 2023, 92, 104465. [Google Scholar] [CrossRef]
- Deverchère, P.; Vauclair, S.; Bosch, G.; Moulherat, S.; Cornuau, J.H. Towards an absolute light pollution indicator. Sci. Rep. 2022, 12, 17050. [Google Scholar] [CrossRef]
- Cinzano, P.; Falchi, F. Quantifying light pollution. J. Quant. Spectrosc. Radiat. Transf. 2014, 139, 13–20. [Google Scholar] [CrossRef]
- Falchi, F.; Cinzano, P.; Elvidge, C.D.; Keith, D.M.; Haim, A. Limiting the impact of light pollution on human health, environment and stellar visibility. J. Environ. Manag. 2011, 92, 2714–2722. [Google Scholar] [CrossRef]
- Jechow, A.; Kolláth, Z.; Ribas, S.J.; Spoelstra, H.; Hölker, F.; Kyba, C.C.M. Imaging and mapping the impact of clouds on skyglow with all-sky photometry. Sci. Rep. 2017, 7, 6741. [Google Scholar] [CrossRef]
- Kyba, C.C.M.; Ruhtz, T.; Fischer, J.; Hölker, F. Cloud Coverage Acts as an Amplifier for Ecological Light Pollution in Urban Ecosystems. PLoS ONE 2011, 6, e17307. [Google Scholar] [CrossRef]
- Ściężor, T. The impact of clouds on the brightness of the night sky. J. Quant. Spectrosc. Radiat. Transf. 2020, 247, 106962. [Google Scholar] [CrossRef]
- Ściężor, T.; Czaplicka, A. The impact of atmospheric aerosol particles on the brightness of the night sky. J. Quant. Spectrosc. Radiat. Transf. 2020, 254, 107168. [Google Scholar] [CrossRef]
- Jechow, A.; Hölker, F. Snowglow—The Amplification of Skyglow by Snow and Clouds Can Exceed Full Moon Illuminance in Suburban Areas. J. Imaging 2019, 5, 69. [Google Scholar] [CrossRef]
- Krieg, J. Influence of moon and clouds on night illumination in two different spectral ranges. Sci. Rep. 2021, 11, 20642. [Google Scholar] [CrossRef]
- Hughes, J.V. Sky Brightness as a Function of Altitude. Appl. Opt. 1964, 3, 1135. [Google Scholar] [CrossRef]
- Benn, C.R.; Ellison, S.L. Brightness of the night sky over La Palma. New Astron. Rev. 1998, 42, 503–507. [Google Scholar] [CrossRef]
- Gill, A.; Benton, S.J.; Brown, A.M.; Clark, P.; Damaren, C.J.; Eifler, T.; Fraisse, A.A.; Galloway, M.N.; Hartley, J.W.; Holder, B.; et al. Optical Night Sky Brightness Measurements from the Stratosphere. Astron. J. 2020, 160, 266. [Google Scholar] [CrossRef]
- Pun, C.S.J.; So, C.W.; Leung, W.Y.; Wong, C.F. Contributions of artificial lighting sources on light pollution in Hong Kong measured through a night sky brightness monitoring network. J. Quant. Spectrosc. Radiat. Transf. 2014, 139, 90–108. [Google Scholar] [CrossRef]
- Biggs, J.D.; Fouché, T.; Bilki, F.; Zadnik, M.G. Measuring and mapping the night sky brightness of Perth, Western Australia: Night sky brightness of Perth. Mon. Not. R. Astron. Soc. 2012, 421, 1450–1464. [Google Scholar] [CrossRef]
- Puschnig, J.; Schwope, A.; Posch, T.; Schwarz, R. The night sky brightness at Potsdam-Babelsberg including overcast and moonlit conditions. J. Quant. Spectrosc. Radiat. Transf. 2014, 139, 76–81. [Google Scholar] [CrossRef]
- Katz, Y.; Levin, N. Quantifying urban light pollution—A comparison between field measurements and EROS-B imagery. Remote Sens. Environ. 2016, 177, 65–77. [Google Scholar] [CrossRef]
- Kolláth, Z. Measuring and modelling light pollution at the Zselic Starry Sky Park. J. Phys. Conf. Ser. 2010, 218, 012001. [Google Scholar] [CrossRef]
- Duriscoe, D.M.; Luginbuhl, C.B.; Moore, C.A. Measuring Night-Sky Brightness with a Wide-Field CCD Camera. Publ. Astron. Soc. Pac. 2007, 119, 192–213. [Google Scholar] [CrossRef]
- Zotti, G. Measuring Light Pollution with a Calibrated High Dynamic Range All-Sky Image Acquisition System; Vienna University of Technology: Vienna, Austria, 2007. [Google Scholar]
- Rabaza, O.; Galadí-Enríquez, D.; Estrella, A.E.; Dols, F.A. All-Sky brightness monitoring of light pollution with astronomical methods. J. Environ. Manag. 2010, 91, 1278–1287. [Google Scholar] [CrossRef]
- Chalkias, C.; Petrakis, M.; Psiloglou, B.; Lianou, M. Modelling of light pollution in suburban areas using remotely sensed imagery and GIS. J. Environ. Manag. 2006, 79, 57–63. [Google Scholar] [CrossRef]
- Kuechly, H.U.; Kyba, C.C.M.; Ruhtz, T.; Lindemann, C.; Wolter, C.; Fischer, J.; Hölker, F. Aerial survey and spatial analysis of sources of light pollution in Berlin, Germany. Remote Sens. Environ. 2012, 126, 39–50. [Google Scholar] [CrossRef]
- Jiang, W.; He, G.; Long, T.; Wang, C.; Ni, Y.; Ma, R. Assessing Light Pollution in China Based on Nighttime Light Imagery. Remote Sens. 2017, 9, 135. [Google Scholar] [CrossRef]
- Caruana, J.; Vella, R.; Spiteri, D.; Nolle, M.; Fenech, S.; Aquilina, N.J. A photometric mapping of the night sky brightness of the Maltese islands. J. Environ. Manag. 2020, 261, 110196. [Google Scholar] [CrossRef]
- Falchi, F.; Cinzano, P.; Duriscoe, D.; Kyba, C.C.M.; Elvidge, C.D.; Baugh, K.; Portnov, B.A.; Rybnikova, N.A.; Furgoni, R. The new world atlas of artificial night sky brightness. Sci. Adv. 2016, 2, e1600377. [Google Scholar] [CrossRef]
- Kolláth, Z.; Száz, D.; Kolláth, K. Measurements and Modelling of Aritificial Sky Brightness: Combining Remote Sensing from Satellites and Ground-Based Observations. Remote Sens. 2021, 13, 3653. [Google Scholar] [CrossRef]
- Elvidge, C.D.; Baugh, K.; Zhizhin, M.; Hsu, F.C.; Ghosh, T. VIIRS night-time lights. Int. J. Remote Sens. 2017, 38, 5860–5879. [Google Scholar] [CrossRef]
- Elvidge, C.; Baugh, K.; Zhizhin, M.; Hsu, F.-C. Why VIIRS data are superior to DMSP for mapping nighttime lights. Proc. Asia-Pac. Adv. Netw. 2013, 35, 62–69. [Google Scholar] [CrossRef]
- Copernicus Sentinel Data Sentinel-5P OFFL AER AI: Offline UV Aerosol Index. Available online: https://developers.google.com/earth-engine/datasets/catalog/COPERNICUS_S5P_OFFL_L3_AER_AI?hl=zh-cn (accessed on 21 March 2025).
- Vermote, E.; Franch, B.; Claverie, M. VIIRS/NPP Surface Reflectance Daily L2G Global 1 km and 500 m SIN Grid V002; NASA EOSDIS Land Processes Distributed Active Archive Center: Sioux Falls, SD, USA, 2023. [CrossRef]
- Román, M.O.; Wang, Z.; Sun, Q.; Kalb, V.; Miller, S.D.; Molthan, A.; Schultz, L.; Bell, J.; Stokes, E.C.; Pandey, B.; et al. NASA’s black marble nighttime lights product suite. Remote Sens. Environ. 2018, 210, 113–143. [Google Scholar] [CrossRef]
- NASA VIIRS Land Science Investigator-Led Processing System. VIIRS/NPP Daily Gridded Day Night Band 500 m Linear Lat Lon Grid Night; NASA Level 1 and Atmosphere Archive and Distribution System Distributed Active Archive Center: Greenbelt, MD, USA, 2019. [CrossRef]
- Copernicus Data Space Copernicus DEM–Global and European Digital Elevation Model. Available online: https://dataspace.copernicus.eu/explore-data/data-collections/copernicus-contributing-missions/collections-description/COP-DEM (accessed on 8 January 2025).
- Baum, C.F. An Introduction to Modern Econometrics Using Stata; Stata Press: College Station, TX, USA, 2006; ISBN 978-1-59718-013-9. [Google Scholar]
- Agresti, A. Categorical Data Analysis; John Wiley & Sons: Hoboken, NJ, USA, 2013; ISBN 978-1-118-71094-4. [Google Scholar]
- Von Winterfeldt, D.; Edwards, W. Decision Analysis and Behavioral Research; Cambridge University Press: Cambridge, UK, 1993. [Google Scholar]
- Ho, T.K. The random subspace method for constructing decision forests. IEEE Trans. Pattern Anal. Mach. Intell. 1998, 20, 832–844. [Google Scholar] [CrossRef]
- Awad, M.; Khanna, R. Support Vector Machines for Classification. In Efficient Learning Machines: Theories, Concepts, and Applications for Engineers and System Designers; Awad, M., Khanna, R., Eds.; Apress: Berkeley, CA, USA, 2015; pp. 39–66. ISBN 978-1-4302-5990-9. [Google Scholar]
- Cortes, C.; Vapnik, V. Support-vector networks. Mach. Learn. 1995, 20, 273–297. [Google Scholar] [CrossRef]
- Freedman, D. Statistical Models: Theory and Practice; Cambridge University Press: Cambridge, UK, 2009; ISBN 978-0-521-74385-3. [Google Scholar]
- Roth, A.E. (Ed.) The Shapley Value: Essays in Honor of Lloyd S. Shapley; Cambridge University Press: Cambridge, UK, 1988; ISBN 978-0-521-36177-4. [Google Scholar] [CrossRef]
Disclaimer/Publisher’s Note: The statements, opinions and data contained in all publications are solely those of the individual author(s) and contributor(s) and not of MDPI and/or the editor(s). MDPI and/or the editor(s) disclaim responsibility for any injury to people or property resulting from any ideas, methods, instructions or products referred to in the content. |
© 2025 by the authors. Licensee MDPI, Basel, Switzerland. This article is an open access article distributed under the terms and conditions of the Creative Commons Attribution (CC BY) license (https://creativecommons.org/licenses/by/4.0/).