
Towards Operational Dam Monitoring with PS-InSAR and Electronic Corner Reflectors †

 , ,
, ,
Abstract
1. Introduction
2. Materials and Methods
2.1. Background and State of the Art
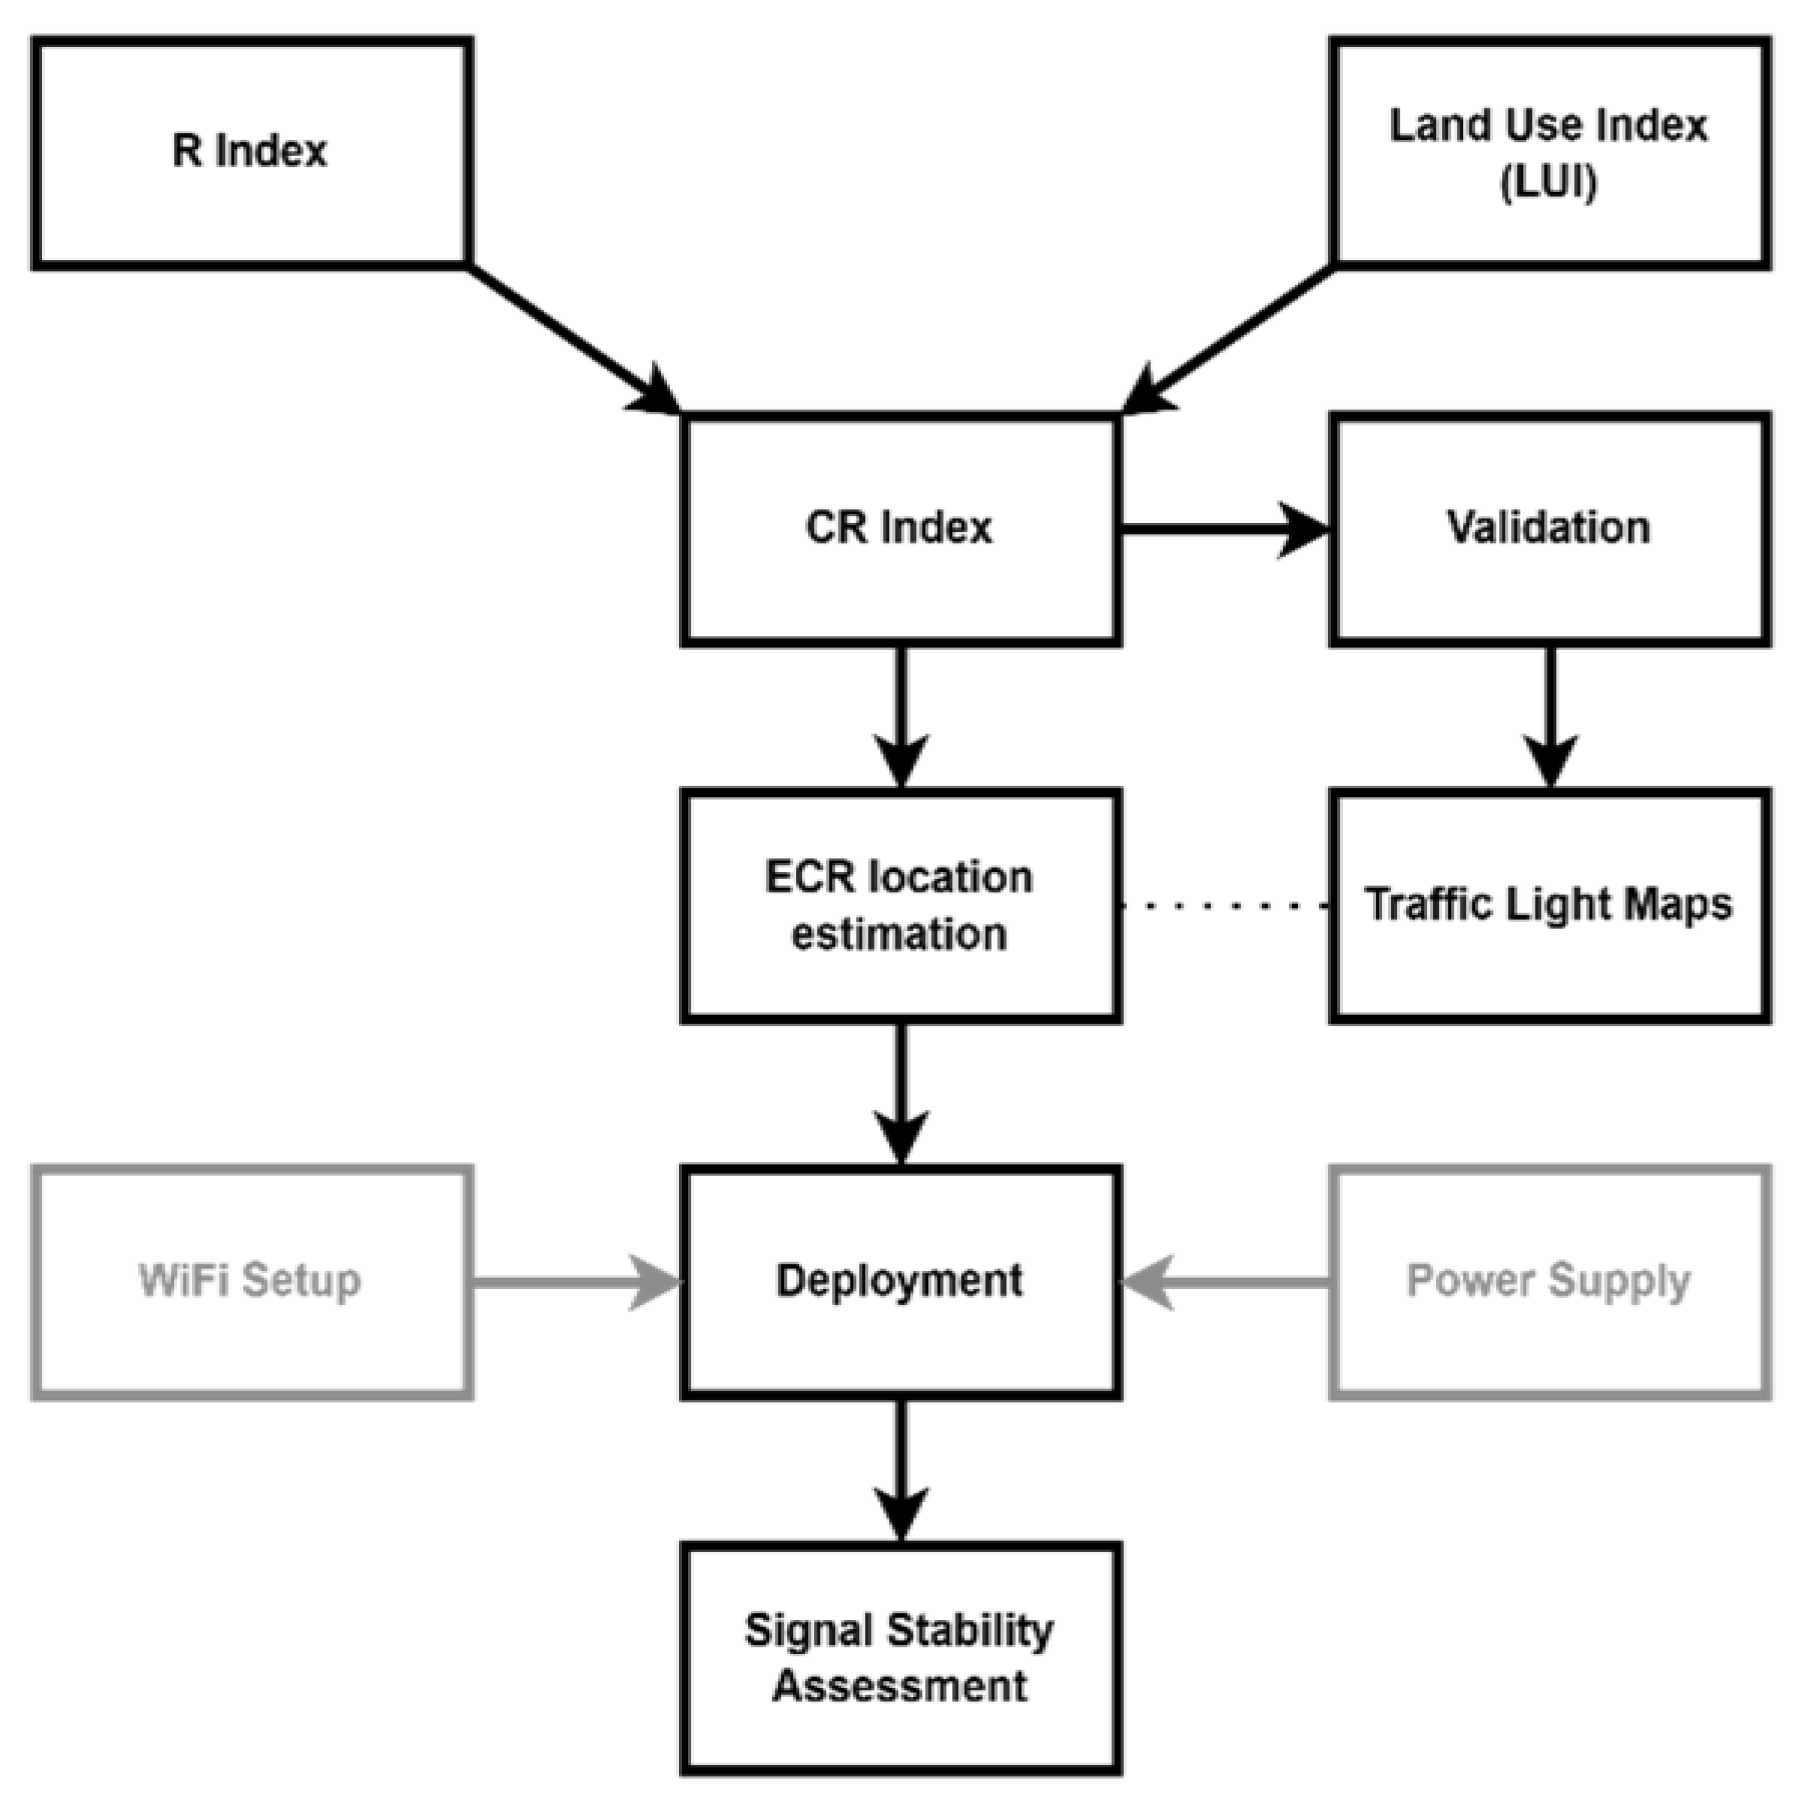
2.2. Methods
2.2.1. Study Area and Data

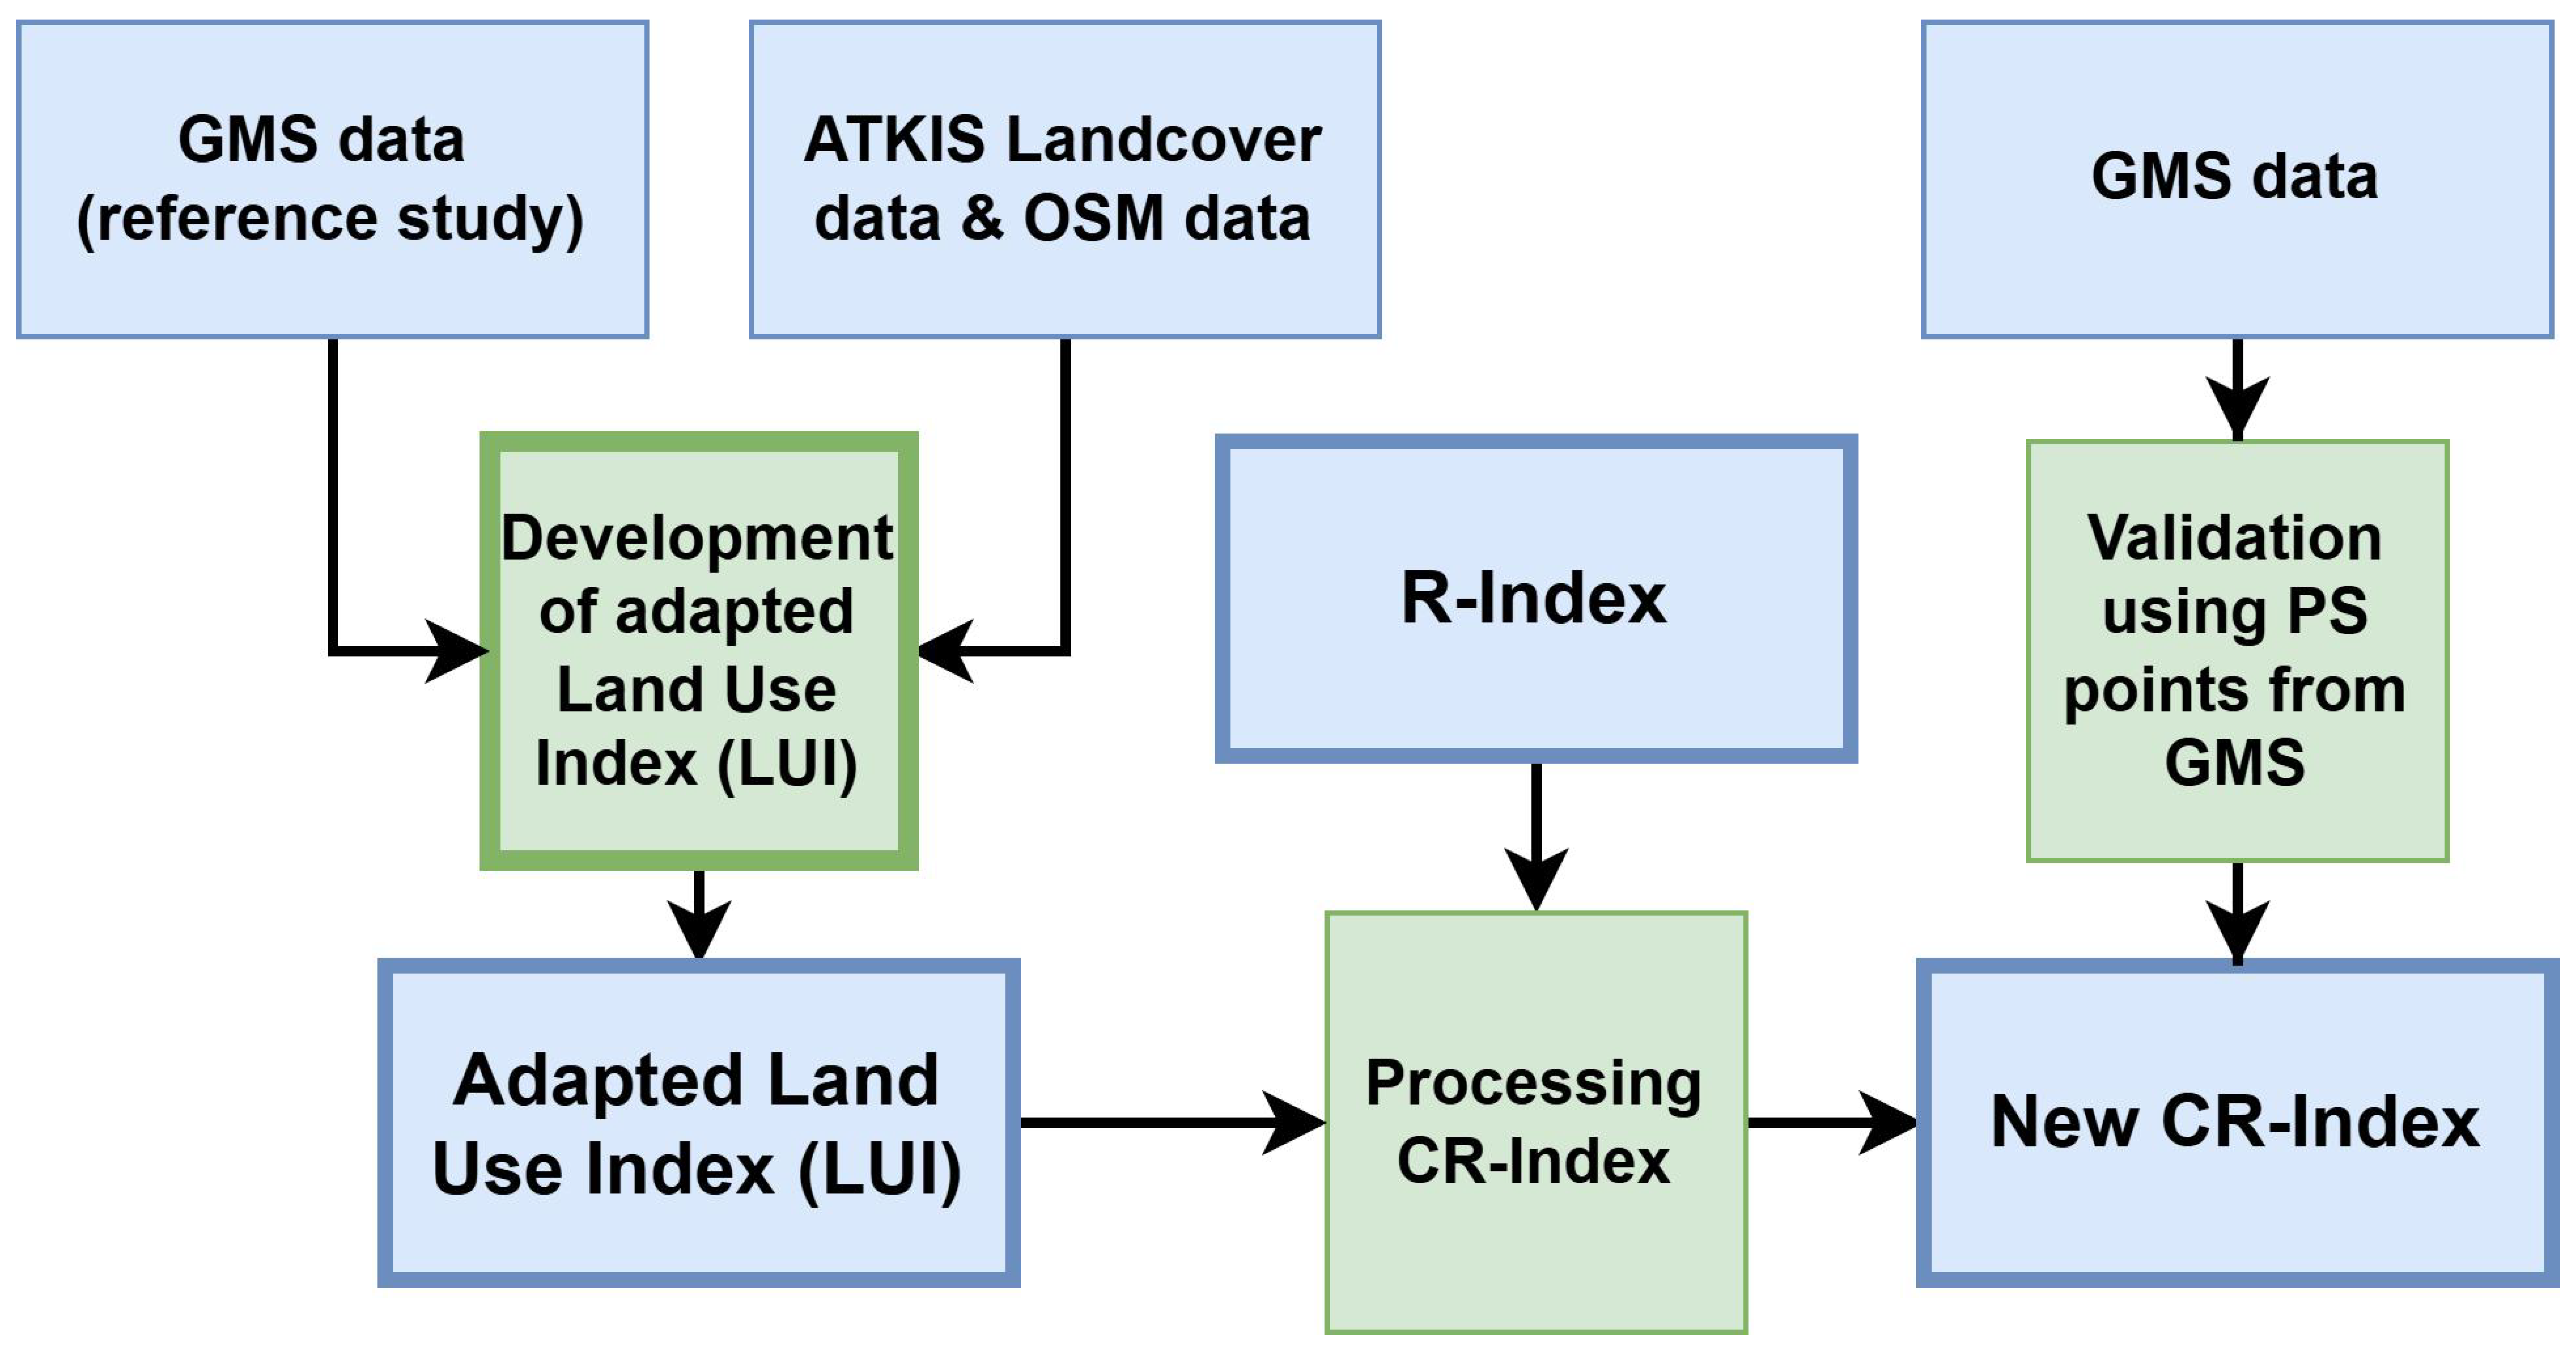
2.2.2. CR Index Calculation and Modification
2.2.3. Site Selection and ECR Deployment
3. Results
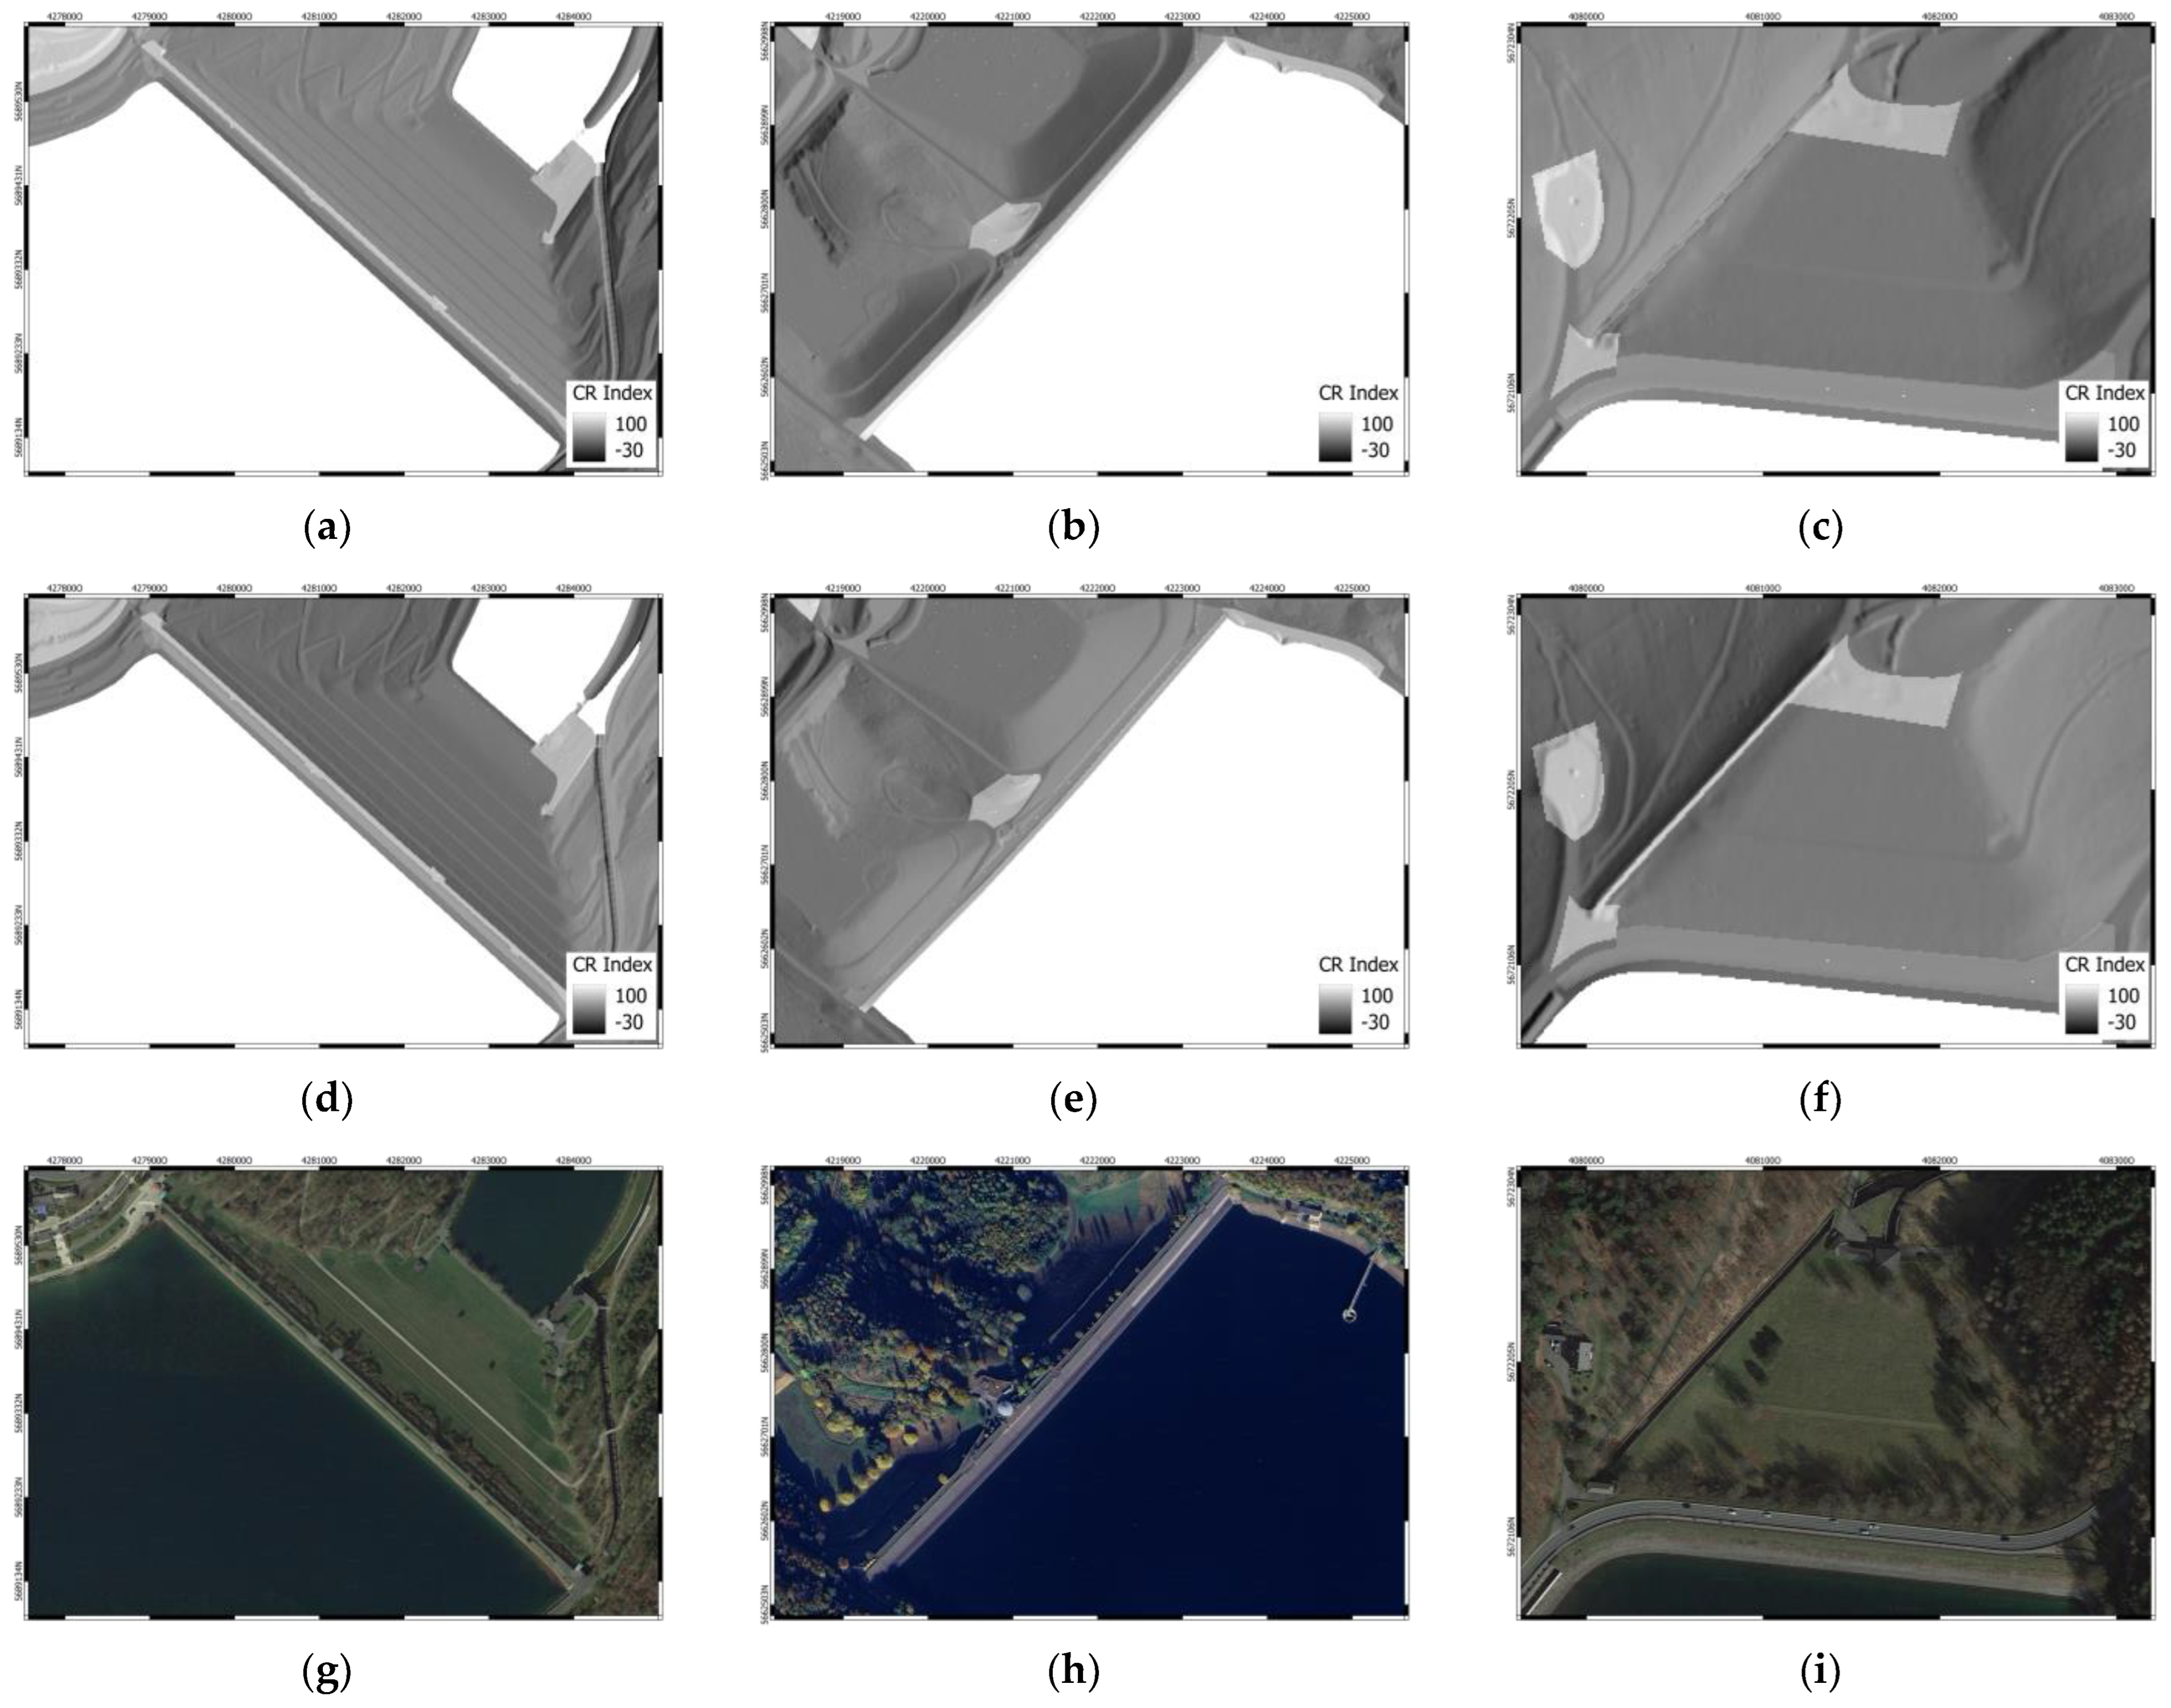
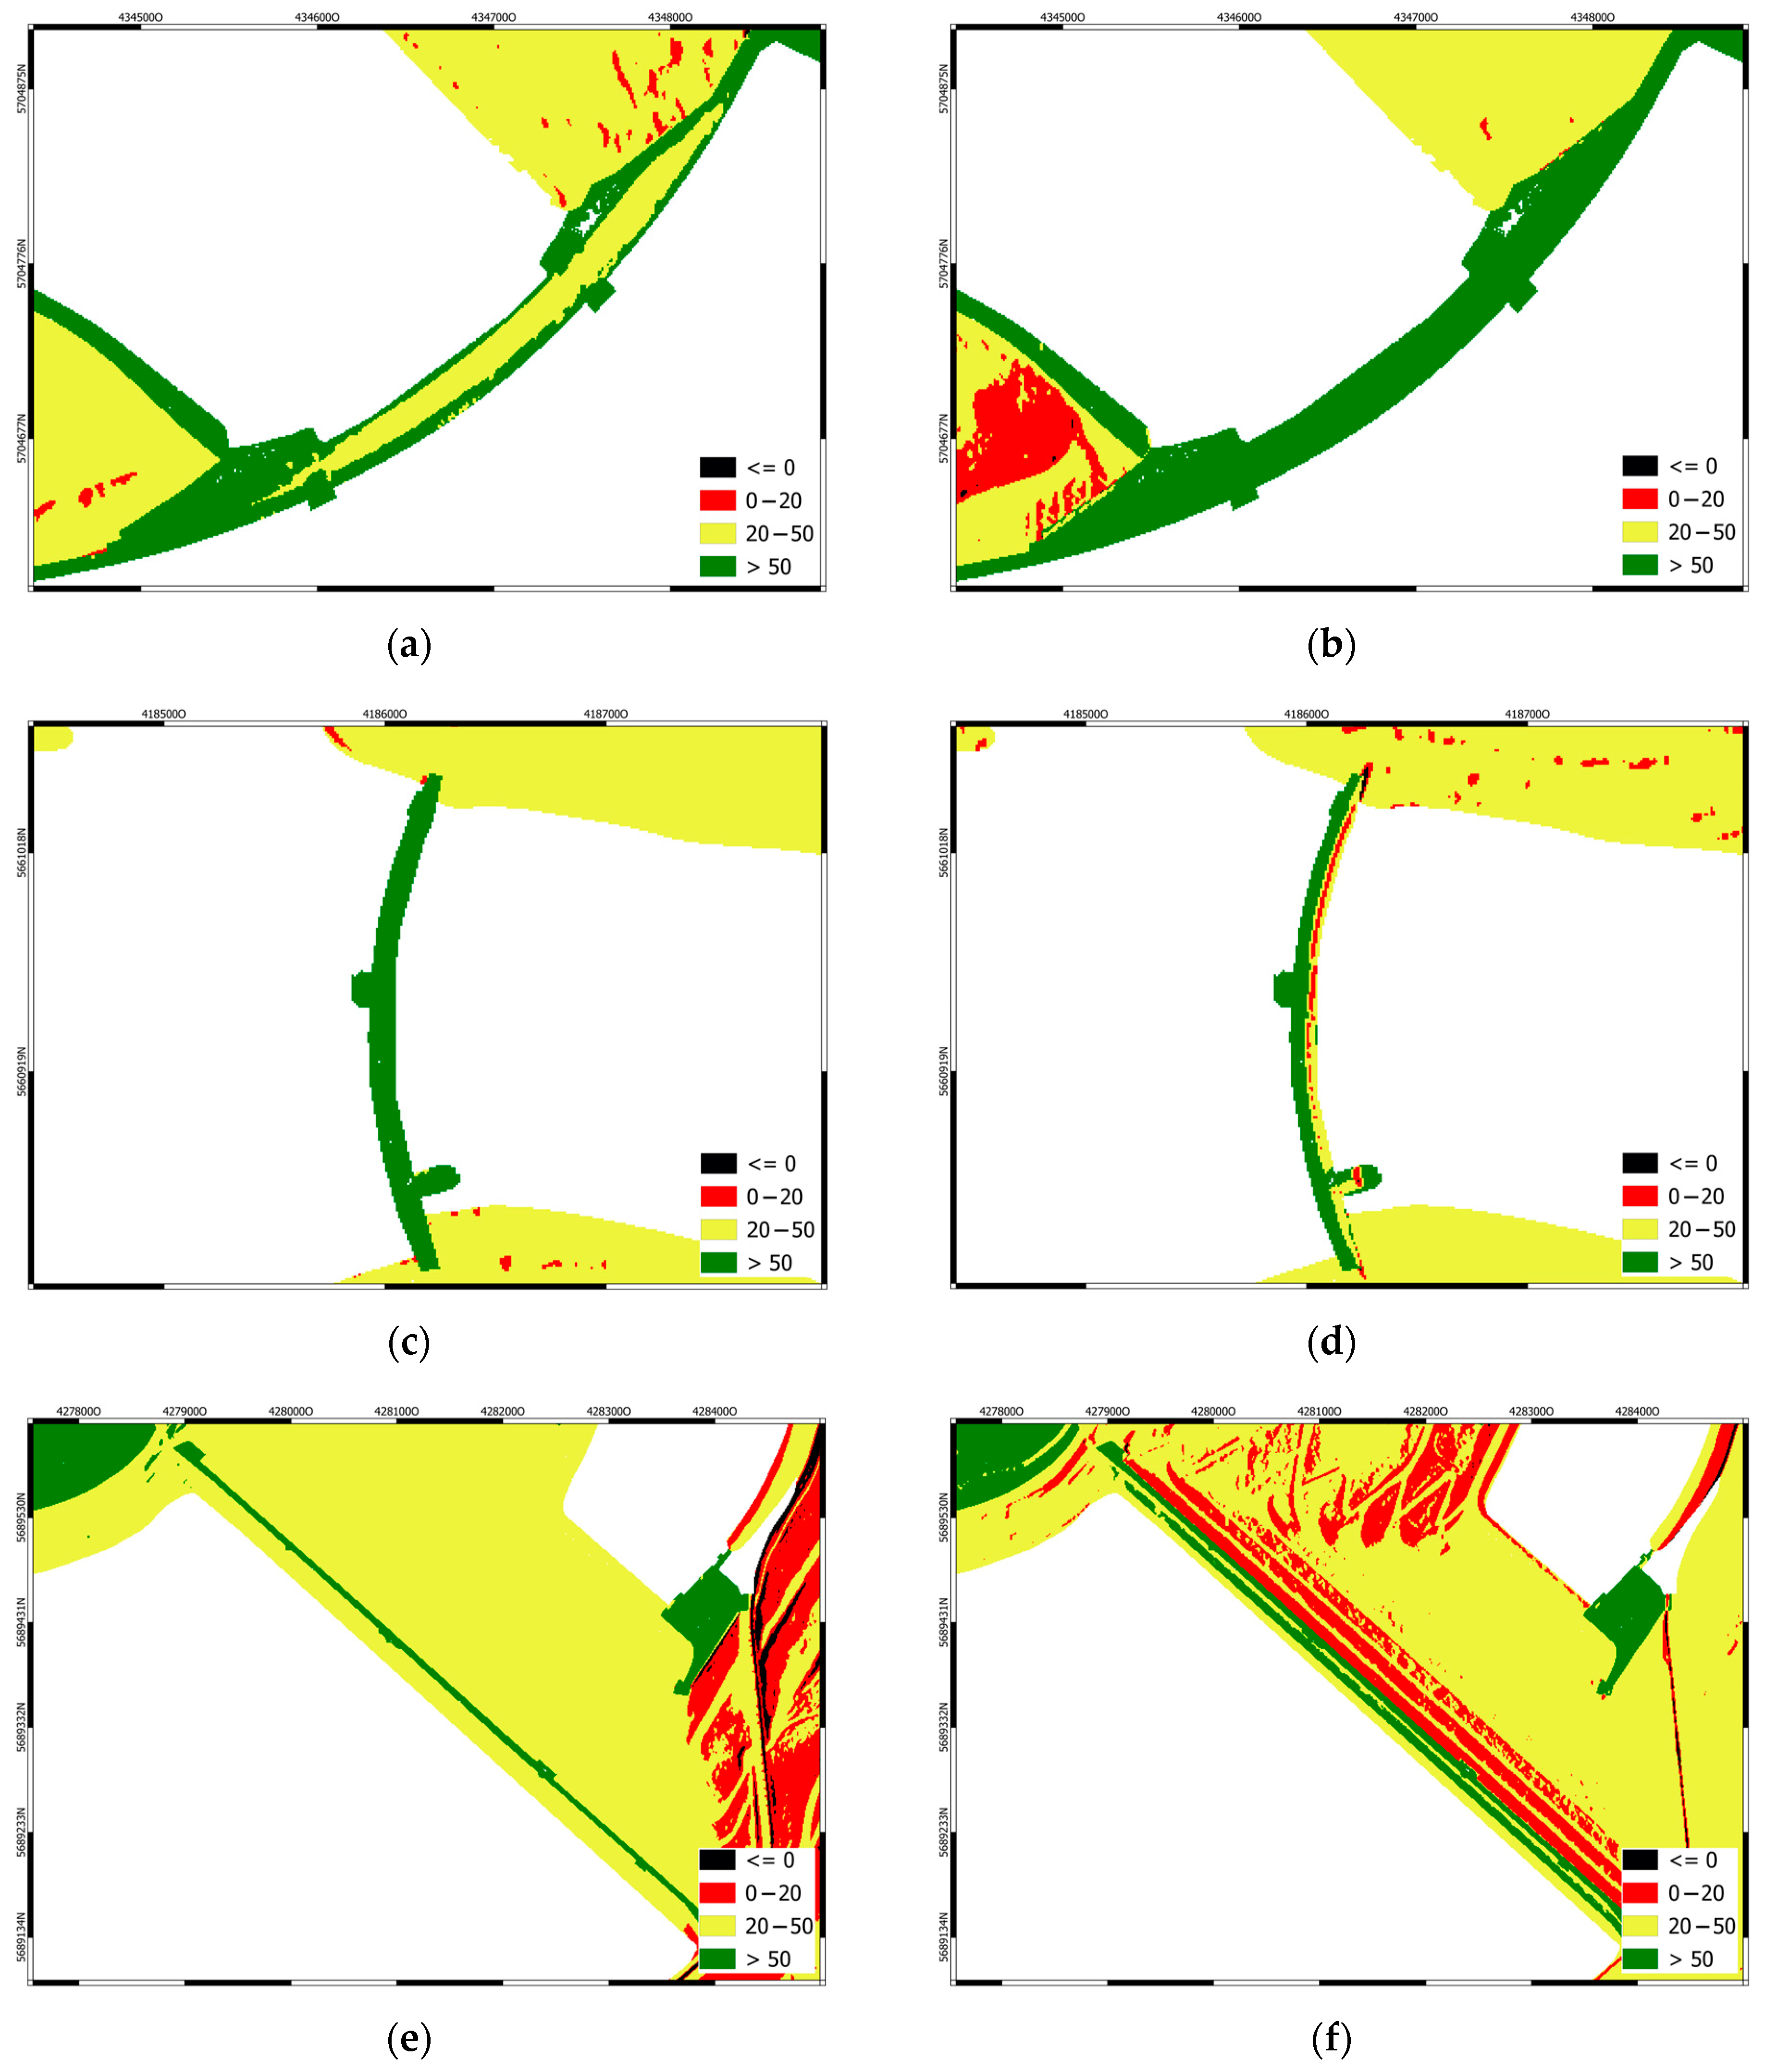
3.1. CR Index
3.2. ECR Operation
4. Discussion
4.1. CR Index Validation
4.2. ECR Operation
5. Conclusions
Author Contributions
Funding
Data Availability Statement
Acknowledgments
Conflicts of Interest
References
- Baxter, R.M. Environmental effects of dams and impoundments. Annu. Rev. Ecol. Syst. 1977, 8, 255–283. [Google Scholar] [CrossRef]
- de Paiva, C.A.; da Fonseca Santiago, A.; do Prado Filho, J.F. Content analysis of dam break studies for tailings dams with high damage potential in the Quadrilátero Ferrífero, Minas Gerais: Technical weaknesses and proposals for improvements. Nat. Hazards 2020, 104, 1141–1156. [Google Scholar] [CrossRef]
- German Institute for Standardization-19700-10: 2004-07; Stauanlagen—Teil 11: Talsperren; Beuth Verlag GmbH: Berlin, Germany, 2004.
- Jänichen, J.; Schmullius, C.; Baade, J.; Last, K.; Bettzieche, V.; Dubois, C. Monitoring of radial deformations of a gravity dam using Sentinel-1 persistent scatterer interferometry. Remote Sens. 2022, 14, 1112. [Google Scholar] [CrossRef]
- Ferretti, A.; Prati, C.; Rocca, F. Analysis of permanent scatterers in SAR interferometry. In Proceedings of the IGARSS 2000 IEEE 2000 International Geoscience and Remote Sensing Symposium—Taking the Pulse of the Planet: The Role of Remote Sensing in Managing the Environment Proceedings (Cat. No. 00CH37120), Honolulu, HI, USA, 24–28 July 2000; Volume 2, pp. 761–763. [Google Scholar] [CrossRef]
- Kalia, A.C.; Frei, M.; Lege, T. BodenBewegungsdienst Deutschland (BBD): Konzept, Umsetzung und Service-Plattform. ZfV-Z. Geod. Geoinf. Landmanag. 2021, 4, 273–279. [Google Scholar]
- Bundesanstalt für Geowissenschaften und Rohstoffe (BGR). BodenBewegungsdienst Deutschland (BBD). Available online: https://bodenbewegungsdienst.bgr.de/mapapps/resources/apps/bbd/index.html?lang=de (accessed on 5 January 2025).
- EGMS. European Ground Motion Service (EGMS). Available online: https://egms.land.copernicus.eu/ (accessed on 5 January 2025).
- Notti, D.; Meisina, C.; Zucca, F.; Colombo, A. Models to Predict Persistent Scatterers Data Distribution and Their Capacity to Register Movement Along the Slope. In Proceedings of the Fringe 2011 Workshop, Frascati, Italy, 19–23 September 2011; p. 90. Available online: https://earth.esa.int/eogateway/documents/20142/37627/Models_predict_persistent_scatterers_data_distribution.pdf (accessed on 21 April 2024).
- Notti, D.; Davalillo, J.C.; Herrera, G.; Mora, O. Assessment of the performance of X-band satellite radar data for landslide mapping and monitoring: Upper Tena Valley case study. Nat. Hazards Earth Syst. Sci. 2010, 10, 1865–1875. [Google Scholar] [CrossRef]
- Cigna, F.; Bateson, L.B.; Jordan, C.J.; Dashwood, C. Simulating SAR geometric distortions and predicting persistent scatterer densities for ERS-1/2 and ENVISAT C-band SAR and InSAR applications. Remote Sens. Environ. 2014, 152, 441–446. [Google Scholar] [CrossRef]
- Ferretti, A.; Prati, C.; Rocca, F. Permanent scatterers in SAR interferometry. IEEE Trans. Geosci. Remote Sens. 2001, 39, 8–20. [Google Scholar] [CrossRef]
- Ferretti, A.; Prati, C.; Rocca, F. Nonlinear subsidence rate estimation using permanent scatterers in differential SAR interferometry. IEEE Trans. Geosci. Remote Sens. 2000, 38, 2202–2212. [Google Scholar] [CrossRef]
- Abo, H.; Osawa, T.; Ge, P.; Takahashi, A.; Yamagishi, K. Deformation Monitoring of Large-Scale Rockfill Dam Applying Persistent Scatterer Interferometry (PSI) Using Sentinel-1 SAR Data. In Proceedings of the 2021 7th Asia-Pacific Conference on Synthetic Aperture Radar (APSAR), Bail, Indonesia, 1–3 November 2021; pp. 1–6. [Google Scholar]
- Milillo, P.; Porcu, M.C.; Londgren, P.; Soccodato, F.; Alzer, J.; Fielding, E.; Bürgmann, R.; Milillo, G.; Perissin, D.; Biondi, F. The ongoing destabilization of the Mosul Dam as observed by synthetic aperture radar interferometry. In Proceedings of the IEEE International Geoscience and Remote Sensing Symposium (IGARSS), Fort Worth, TX, USA, 23–28 July 2017; pp. 6279–6282. [Google Scholar] [CrossRef]
- Emadali, L.; Motagh, M. Long-term deformation analysis of Masjed-Soleyman rockfill dam (Iran): Results based on terrestrial geodetic data. Earth Obs. Geomat. Eng. 2020, 4, 26–43. [Google Scholar] [CrossRef]
- Mura, J.C.; Gama, F.F.; Paradella, W.R.; Negrão, P.; Carneiro, S.; De Oliveira, C.G.; Brandão, W.S. Monitoring the Vulnerability of the Dam and Dikes in Germano Iron Mining Area after the Collapse of the Tailings Dam of Fundão (Mariana-MG, Brazil) Using DInSAR Techniques with TerraSAR-X Data. Remote Sens. 2018, 10, 1507. [Google Scholar] [CrossRef]
- Othman, A.A.; Al-Maamar, A.F.; Al-Manmi, D.A.M.; Liesenberg, V.; Hasan, S.E.; Al-Saady, Y.I.; Shihab, A.T.; Khwedim, K. Application of DInSAR-PSI Technology for Deformation Monitoring of the Mosul Dam, Iraq. Remote Sens. 2019, 11, 2632. [Google Scholar] [CrossRef]
- Ruiz-Armenteros, A.M.; Marchamalo-Sacristán, M.; Bakoň, M.; Lamas-Fernández, F.; Delgado, J.M.; Sánchez-Ballesteros, V.; Papco, J.; González-Rodrigo, B.; Lazecky, M.; Perissin, D.; et al. Monitoring of an Embankment Dam in Southern Spain Based on Sentinel-1 Time-Series InSAR. Procedia Comput. Sci. 2021, 181, 353–359. [Google Scholar] [CrossRef]
- Mazzanti, P.; Perissin, D.; Rocca, A. Structural health monitoring of dams by advanced satellite SAR interferometry: Investigation of past processes and future monitoring perspectives. In Proceedings of the 7th International Conference on Structural Health Monitoring of Intelligent Infrastructure 2015, Torino, Italy, 1–3 July 2015. [Google Scholar]
- Lazecký, M.; Perissin, D.; Zhiying, W.; Ling, L.; Yuxiao, Q. Observing dam’s movements with spaceborne SAR interferometry. In Engineering Geology for Society and Territory; Lollino, G., Manconi, A., Guzzetti, F., Culshaw, M., Bobrowsky, P., Luino, F., Eds.; Springer: Cham, Switzerland; Heidelberg, Germany; New York, NY, USA; Dordrecht, The Netherlands; London, UK; Basel, Switzerland, 2015; Volume 5, pp. 131–136. [Google Scholar]
- Wang, T.; Perissin, D.; Rocca, F.; Liao, M.-S. Three Gorges Dam stability monitoring with time-series InSAR image analysis. Sci. China Earth Sci. 2011, 54, 720–732. [Google Scholar] [CrossRef]
- Ruiz-Armenteros, A.M.; Lazecky, M.; Hlaváčová, I.; Bakoň, M.; Delgado, J.M.; Sousa, J.J.; Lamas-Fernandez, F.; Marchamalo, M.; Caro-Cuenca, M.; Papco, J. Deformation monitoring of dam infrastructures via spaceborne MT-InSAR. Procedia Comput. Sci. 2018, 138, 346–353. [Google Scholar] [CrossRef]
- Milillo, P.; Bürgmann, R.; Lundgren, P.; Salzer, J.; Perissin, D.; Fielding, E.; Biondi, F.; Milillo, G. Space geodetic monitoring of engineered structures: The ongoing destabilization of the Mosul Dam, Iraq. Sci. Rep. 2016, 6, 37408. [Google Scholar] [CrossRef]
- Evers, M.; Kyriou, A.; Thiele, A.; Hammer, H.; Nikolakopoulus, K.; Schulz, K. How to set up a dam monitoring system with PSInSAR and GPS. SPIE Remote Sens. 2020, 11534, 115340L. [Google Scholar] [CrossRef]
- Schneider, P.; Soergel, U. Monitoring einer Schleuse mittels Persistent-Scatterer-Interferometrie. In 40. Wissenschaftlich-Technische Jahrestagung der DGPF in Stuttgart—Publikationen der DGPF 2020; Band 29; pp. 448–456. Available online: https://www.dgpf.de/src/tagung/jt2020/proceedings/proceedings/papers/64_DGPF2020_Schneider_Soergel.pdf (accessed on 10 January 2022).
- Tomás, R.; Cano, M.; García-Barba, J.; Vicente, F.; Herrera, G.; Lopez-Sanchez, J.M.; Mallorquí, J.J. Monitoring an Earthfill Dam Using Differential SAR Interferometry: La Pedrera Dam, Alicante, Spain. Eng. Geol. 2013, 157, 21–32. [Google Scholar] [CrossRef]
- Antonielli, B.; Sciortino, A.; Scancella, S.; Bozzano, F.; Mazzanti, P. Tracking Deformation Processes at the Legnica Glogow Copper District (Poland) by Satellite InSAR—I: Room and Pillar Mine District. Land 2021, 10, 653. [Google Scholar] [CrossRef]
- Ouyang, Y.; Feng, T.; Feng, H.; Wang, X.; Zhang, H.; Zhou, X. Deformation Monitoring and Potential Risk Detection of In-Construction Dams Utilizing SBAS-InSAR Technology—A Case Study on the Datengxia Water Conservancy Hub. Water 2024, 16, 1025. [Google Scholar] [CrossRef]
- Pang, Z.; Jin, Q.; Fan, P.; Jiang, W.; Lv, J.; Zhang, P.; Cui, X.; Zhao, C.; Zhang, Z. Deformation Monitoring and Analysis of Reservoir Dams Based on SBAS-InSAR Technology—Banqiao Reservoir. Remote Sens. 2023, 15, 3062. [Google Scholar] [CrossRef]
- Wang, Q.; Gao, Y.; Gong, T.; Liu, T.; Sui, Z.; Fan, J.; Wang, Z. Dam Surface Deformation Monitoring and Analysis Based on PS-InSAR Technology: A Case Study of Xiaolangdi Reservoir Dam in China. Water 2023, 15, 3298. [Google Scholar] [CrossRef]
- Hassan, M.; Ahmed, A. Dam deformation monitoring using cloud-based P-SBAS algorithm: The Kramis Dam case (Algeria). Eng. Technol. Appl. Sci. Res. 2023, 13, 10759–10764. Available online: https://etasr.com/index.php/ETASR/article/view/5857 (accessed on 4 April 2022).
- Xie, W.; Wu, J.; Gao, H.; Chen, J.; He, Y. SBAS-InSAR Based Deformation Monitoring of Tailings Dam: The Case Study of the Dexing Copper Mine No.4 Tailings Dam. Sensors 2023, 23, 9707. [Google Scholar] [CrossRef]
- Rana, N.M.; Delaney, K.B.; Evans, S.G. Application of Sentinel-1 InSAR to monitor tailings dams and predict geotechnical instability: Practical considerations based on case study insights. Bull. Eng. Geol. Environ. 2024, 83, 204. [Google Scholar] [CrossRef]
- Duan, H.; Li, Y.; Jiang, H.; Li, Q.; Jiang, W.; Tian, Y.; Zhang, J. Retrospective monitoring of slope failure event of tailings dam using InSAR time-series observations. Nat. Hazards 2023, 117, 2375–2391. [Google Scholar] [CrossRef]
- Thomas, R.; Li, W.; Fazli, S.; Todorov, N.G.; El-Askary, H. Monitoring Dam Stability Using PSI and SBAS Analysis. In Proceedings of the IGARSS 2023—2023 IEEE International Geoscience and Remote Sensing Symposium, Pasadena, CA, USA, 16–21 July 2023; pp. 7997–8000. [Google Scholar] [CrossRef]
- Garthwaite, M.C. On the Design of Radar Corner Reflectors for Deformation Monitoring in Multi-Frequency InSAR. Remote Sens. 2017, 9, 648. [Google Scholar] [CrossRef]
- Bovenga, F.; Refice, A.; Pasquariello, G.; Nitti, D.O.; Nutricato, R. Corner reflectors and multi-temporal SAR interferometry for landslide monitoring. Remote Sens. Environ. 2014, 148, 77–91. [Google Scholar] [CrossRef]
- Fotiou, K.; Danezis, C. An overview of electronic corner reflectors and their use in ground deformation monitoring applications. Proc. SPIE 2020, 11524, 115240N. [Google Scholar] [CrossRef]
- Meister, A.; Balasis-Levinsen, J.; Keller, K.; Pedersen, M.R.V.; Merryman Boncori, J.P.; Jensen, M. A Field Test of Compact Active Transponders for InSAR Geodesy. Available online: https://orbit.dtu.dk/en/publications/a-field-test-of-compact-active-transponders-for-insar-geodesy (accessed on 4 April 2022).
- Oikonomidou, X.; Eineder, M.; Gisinger, C.; Gruber, T.; Heinze, M.; Sdralia, V. SAR Imaging Geodesy with Electronic Corner Reflectors (ECR) and Sentinel-1—First Experiences. In Proceedings of the EGU General Assembly 2020, Online, 4–8 May 2020. EGU2020-5608. [Google Scholar] [CrossRef]
- Ruhrverband. Management of Water Resources in North Rhine-Westphalia. Available online: https://www.ruhrverband.de/ (accessed on 27 November 2024).
- European Space Agency (ESA). Sentinel-1 Data Products. Available online: https://sentinel.esa.int/web/sentinel/missions/sentinel-1 (accessed on 26 November 2024).
- Geodata Infrastructure North Rhine-Westphalia (GDI-NRW). 3D-Messdaten Laserscanning—Paketierung: Einzelkacheln. Available online: https://www.opengeodata.nrw.de/produkte/geobasis/hm/3dm_l_las/3dm_l_las/ (accessed on 10 January 2024).
- OpenStreetMap Contributors. Geometrische Daten der Bundesländer Deutschlands. Available online: https://openstreetmap.org (accessed on 20 April 2022).
- Geodata Infrastructure North Rhine-Westphalia (GDI-NRW). Landcover NRW, Landbedeckung NRW. Available online: https://www.bezreg-koeln.nrw.de/geobasis-nrw/produkte-und-dienste/luftbild-und-satellitenbildinformationen/aktuelle-luftbild-und-3 (accessed on 10 January 2024).
- OpenStreetMap Contributors (n.D.). Landbedeckungsinformationen Deutschland. Available online: https://openstreetmap.org (accessed on 20 April 2022).
- Federal Institute for Geosciences and Natural Resources—Bundesanstalt für Geowissenschaften und Rohstoffe (BGR). Übersicht über den BodenBewegungsdienst Deutschland (BBD). Available online: https://www.bgr.bund.de/DE/Themen/GG_Fernerkundung/BodenBewegungsdienst_Deutschland/bodenbewegungsdienst_deutschland_node.html (accessed on 26 November 2024).
- European Space Agency (ESA). Sentinel-2 Data Products. Available online: https://sentinel.esa.int/web/sentinel/missions/sentinel-2 (accessed on 26 November 2024).
- Colombo, A.; Mallen, L.; Pispico, R.; Giannico, C.; Bianchi, M.; Savio, G. Mappatura Regionale delle Aree Monitorabili Mediante l’uso della Tecnica PS. InSAR Papers, TRE ALTAMIRA. 2006. Available online: https://site.tre-altamira.com/wp-content/uploads/2006_Mappatura_regionale_delle_aree_monitorabili_mediante_uso_della_Tecnica_PS.pdf (accessed on 3 January 2024).
- Jänichen, J.; Wolsza, M.; Dubois, C.; Schmullius, C. Monitoring Ground Movements in Thuringia Using Radar Remote Sensing Data (SAR Interferometry): Development of PS-InSAR Suitability Maps for Thuringia; Research Report for the Thuringian State Office for Environment, Mining, and Nature Conservation; Friedrich Schiller University Jena, Remote Sensing Department: Jena, Germany, 30 June 2021. [Google Scholar]
- Jänichen, J.; Ziemer, J.; Wicker, C.; Klöpper, D.; Last, K.; Wolsza, M.; Schmullius, C.; Dubois, C. Enahncing Dam Monitoring: Utilizing the CR-Index for Electronic Corner Reflector (ECR) Site Selection and PSI Analysis. In Proceedings of the IGARSS 2024—2024 IEEE International Geoscience and Remote Sensing Symposium, Athens, Greece, 7–12 July 2024. [Google Scholar] [CrossRef]
- Esmaeili, M.; Motagh, M. PSInSAR improvement using amplitude dispersion index optimization of dual polarimetry data. ISPRS Arch. 2015, XL-1/W5, 175–177. [Google Scholar] [CrossRef]
- Luo, X.; Wang, C.; Shen, P. Polarimetric Stationarity Omnibus Test (PSOT) for Selecting Persistent Scatterer Candidates with Quad-Polarimetric SAR Datasets. Sensors 2020, 20, 1555. [Google Scholar] [CrossRef]


| Data | Data Source | Use |
|---|---|---|
| Sentinel-1 SLC | [43] | Processing R Index (single scene), backscatter analysis |
| LiDAR elevation data (1 m) | [44] | DEM generation, processing R Index |
| ATKIS landcover data | [46] | Processing CR Index |
| OSM landcover data | [47] | Processing CR Index |
| BBD data | [7,48] | Validation CR Index |
| Sentinel-2 imagery | [49] | Validation CR Index |
| Data | Sentinel-1 Ascending | Sentinel-1 Descending |
|---|---|---|
| Number of scenes | 20 | 21 |
| Temporal resolution | 12 | 12 |
| Acquisition mode | Interferometric Wideswath (IW) | Interferometric Wideswath (IW) |
| Polarization | VV | VV |
| Wavelength | C-Band | C-Band |
| Relative orbit number | 15 | 139 |
| Frame | 164 | 421 |
| Class | LUI | Class | LUI |
|---|---|---|---|
| Rail traffic | 50 | Historic building or facility | 100 |
| Railway facility | 75 | Industrial and commercial area | 65 |
| Waterbody structure | 100 | Agriculture | 0 |
| Transportation structure | 80 | Moor | 0 |
| Industrial and commercial building or facility | 30 | Square | 30 |
| Sports, recreation, and leisure building facility | 10 | Maritime traffic (structures) | 100 |
| Mining operation | 40 | Other buildings or facilities | 100 |
| Rock, boulder, rock needle | 0 | Sports, recreation, and leisure area | 10 |
| Area of special functional character | 100 | Standing water (masked) | 0 |
| Mixed-use area | 80 | Road traffic | 25 |
| Stream (masked) | 0 | Swamp | 0 |
| Air traffic | 20 | Open pit, mine quarry | 10 |
| Aviation facility | 10 | Wasteland, vegetation-free area | 10 |
| Cemetery | 10 | Storage tank, storage structure | 100 |
| Copse | 0 | Forest | 0 |
| Harbor basin | 0 | Residential area | 100 |
| Spoil tip | 0 | OSM Power | 100 |
| Heath | 0 |
| Direction | Dam | Count | Mean [dB] | Std [dB] | Min [dB] | Max [dB] | ADI |
|---|---|---|---|---|---|---|---|
| Ascending | Bigge 1 | 20 | 5.16 | 0.62 | 3.86 | 6.18 | 0.12 |
| Bigge 2 | 16 | 5.32 | 0.42 | 4.71 | 6.24 | 0.07 | |
| Lister | 14 | 10.95 | 0.74 | 9.7 | 12.15 | 0.06 | |
| Sorpe | 13 | 2.48 | 1.3 | -0.1 | 4.62 | 0.52 | |
| Descending | Bigge 1 | 19 | 7.04 | 2.38 | 3.12 | 11.76 | 0.34 |
| Bigge 2 | 15 | 8.42 | 3.09 | 3.74 | 13.97 | 0.36 | |
| Lister | 15 | 3.11 | 2.87 | -0.95 | 8.02 | 0.92 | |
| Sorpe | 14 | 13.16 | 1.67 | 8.53 | 15.24 | 0.12 |
Disclaimer/Publisher’s Note: The statements, opinions and data contained in all publications are solely those of the individual author(s) and contributor(s) and not of MDPI and/or the editor(s). MDPI and/or the editor(s) disclaim responsibility for any injury to people or property resulting from any ideas, methods, instructions or products referred to in the content. |
© 2025 by the authors. Licensee MDPI, Basel, Switzerland. This article is an open access article distributed under the terms and conditions of the Creative Commons Attribution (CC BY) license (https://creativecommons.org/licenses/by/4.0/).
Share and Cite
Jänichen, J.; Ziemer, J.; Wolsza, M.; Klöpper, D.; Weltmann, S.; Wicker, C.; Last, K.; Schmullius, C.; Dubois, C. Towards Operational Dam Monitoring with PS-InSAR and Electronic Corner Reflectors. Remote Sens. 2025, 17, 1318. https://doi.org/10.3390/rs17071318
Jänichen J, Ziemer J, Wolsza M, Klöpper D, Weltmann S, Wicker C, Last K, Schmullius C, Dubois C. Towards Operational Dam Monitoring with PS-InSAR and Electronic Corner Reflectors. Remote Sensing. 2025; 17(7):1318. https://doi.org/10.3390/rs17071318
Chicago/Turabian StyleJänichen, Jannik, Jonas Ziemer, Marco Wolsza, Daniel Klöpper, Sebastian Weltmann, Carolin Wicker, Katja Last, Christiane Schmullius, and Clémence Dubois. 2025. "Towards Operational Dam Monitoring with PS-InSAR and Electronic Corner Reflectors" Remote Sensing 17, no. 7: 1318. https://doi.org/10.3390/rs17071318
APA StyleJänichen, J., Ziemer, J., Wolsza, M., Klöpper, D., Weltmann, S., Wicker, C., Last, K., Schmullius, C., & Dubois, C. (2025). Towards Operational Dam Monitoring with PS-InSAR and Electronic Corner Reflectors. Remote Sensing, 17(7), 1318. https://doi.org/10.3390/rs17071318